systematic evaluation of rna-seq preparation protocol
TRANSCRIPT
METHODOLOGY ARTICLE Open Access
Systematic evaluation of RNA-Seqpreparation protocol performanceHsueh-Ping Chao1,2, Yueping Chen1, Yoko Takata1, Mary W. Tomida1, Kevin Lin1, Jason S. Kirk3, Melissa S. Simper1,Carol D. Mikulec1, Joyce E. Rundhaug1, Susan M. Fischer1, Taiping Chen1,2, Dean G. Tang1,2,3, Yue Lu1* andJianjun Shen1,2*
Abstract
Background: RNA-Seq is currently the most widely used tool to analyze whole-transcriptome profiles. There arenumerous commercial kits available to facilitate preparing RNA-Seq libraries; however, it is still not clear how someof these kits perform in terms of: 1) ribosomal RNA removal; 2) read coverage or recovery of exonic vs. intronicsequences; 3) identification of differentially expressed genes (DEGs); and 4) detection of long non-coding RNA(lncRNA). In RNA-Seq analysis, understanding the strengths and limitations of commonly used RNA-Seq librarypreparation protocols is important, as this technology remains costly and time-consuming.
Results: In this study, we present a comprehensive evaluation of four RNA-Seq kits. We used three standard inputprotocols: Illumina TruSeq Stranded Total RNA and mRNA kits, a modified NuGEN Ovation v2 kit, and the TaKaRaSMARTer Ultra Low RNA Kit v3. Our evaluation of these kits included quality control measures such as overallreproducibility, 5′ and 3′ end-bias, and the identification of DEGs, lncRNAs, and alternatively spliced transcripts.Overall, we found that the two Illumina kits were most similar in terms of recovering DEGs, and the Illumina,modified NuGEN, and TaKaRa kits allowed identification of a similar set of DEGs. However, we also discovered thatthe Illumina, NuGEN and TaKaRa kits each enriched for different sets of genes.
Conclusions: At the manufacturers’ recommended input RNA levels, all the RNA-Seq library preparation protocolsevaluated were suitable for distinguishing between experimental groups, and the TruSeq Stranded mRNA kit wasuniversally applicable to studies focusing on protein-coding gene profiles. The TruSeq protocols tended to capturegenes with higher expression and GC content, whereas the modified NuGEN protocol tended to capture longergenes. The SMARTer Ultra Low RNA Kit may be a good choice at the low RNA input level, although it was inferiorto the TruSeq mRNA kit at standard input level in terms of rRNA removal, exonic mapping rates and recoveredDEGs. Therefore, the choice of RNA-Seq library preparation kit can profoundly affect data outcomes. Consequently,it is a pivotal parameter to consider when designing an RNA-Seq experiment.
Keywords: Next generation sequencing, RNA-Seq, Quality control
BackgroundOmics technology, driven by next-generation sequencing(NGS) coupled with new and increasingly robust bio-informatics pipelines, has triggered exponential growthin the accumulation of large biological datasets. The firstNGS study, published in 2005 [1], reported the highlyaccurate sequencing of 25 million DNA bases in less
than a day, representing a vast improvement in cost andthroughput over traditional Sanger sequencing methods.Shortly thereafter, NGS technology was applied to RNAsequencing (RNA-Seq) [2–5], and since then, the sensi-tivity, accuracy, reproducibility, and flexibility of RNA-Seq have made it the gold standard in transcriptomic re-search. Over the last ten years, approximately 53,700RNA-Seq datasets have been deposited in the Gene Ex-pression Omnibus (GEO) database [6]. These RNA-Seqdatasets provide information about the whole transcrip-tome, including gene fusions, differential expression of
© The Author(s). 2019 Open Access This article is distributed under the terms of the Creative Commons Attribution 4.0International License (http://creativecommons.org/licenses/by/4.0/), which permits unrestricted use, distribution, andreproduction in any medium, provided you give appropriate credit to the original author(s) and the source, provide a link tothe Creative Commons license, and indicate if changes were made. The Creative Commons Public Domain Dedication waiver(http://creativecommons.org/publicdomain/zero/1.0/) applies to the data made available in this article, unless otherwise stated.
* Correspondence: [email protected]; [email protected] of Epigenetics and Molecular Carcinogenesis, The University ofTexas MD Anderson Cancer Center, Science Park, Smithville, TX 78957, USAFull list of author information is available at the end of the article
Chao et al. BMC Genomics (2019) 20:571 https://doi.org/10.1186/s12864-019-5953-1
coding and non-coding genes, and splice variants in dif-ferent experimental conditions. Increasing evidence con-firms that changes in the transcriptome are a result ofbiological alterations, making RNA-Seq a driving forcebehind the exploration of global regulatory networks incells, tissues, organisms, and diseases.RNA-Seq is used primarily to identify differentially
expressed genes (DEGs) in different biological condi-tions, but it is also used to discover non-coding RNAssuch as microRNAs and long non-coding RNAs(lncRNAs) [7]. RNA-Seq studies have already shownthat differences in RNA preparation and enrichmentduring library preparation can cause fundamentalvariations in experimental outcomes. Hence, compre-hensive evaluation of RNA-Seq library preparationmethods by using different kits has provided a baselinefrom which to compare their overall capabilities and toguide future research applications. Several earlier stud-ies have already identified potential confoundingfactors affecting RNA-Seq performance and analysis[8–15]. These include two large-scale projects--theSequencing Quality Control project of the SEQC/MAQC-III (MicroArray Quality Control) Consortium,led by US Food and Drug Administration [8] and theAssociation of Biomolecular Resource Facilities (ABRF)next-generation sequencing (NGS) study [9], and otherstudies including the evaluation of three IlluminaRNA-Seq protocols for degraded and low quantitysamples [10], a study of gene qualification on clinicalsamples using Illumina TruSeq Stranded Total RNAand mRNA RNA-Seq protocols [11] and additionalinvestigations focused on low-input or single-cell se-quencing [12–15].The SEQC project evaluated the sensitivity, specificity,
reproducibility, and complexity of gene expression,DEGs, and splice junction detection from RNA-Seq per-formed at multiple sites, using the same commercial ref-erence library and External RNA Controls Consortium(ERCC) RNA spike-in controls as well as experimentalsamples, but using different sequencing platforms andbioinformatics pipelines [8]. Overall, the SEQC projectfound that RNA-Seq data generated from vendor-prepared libraries were stable across sites but variableacross protocols, implying that data variability likelyoriginated from differences in library preparation and/orsequencing platforms. Parameters affecting library prep-aration include fragmentation time, ribosomal RNA(rRNA) depletion methods, cDNA synthesis procedures,library purification methods, ligation efficiency, andRNA quality. This study [8] also illustrated that for themost highly expressed genes, DEGs were consistentlyidentified across sites and platforms and that de novosplice junction discovery was robust but sensitive to se-quencing depth.
The ABRF-NGS study evaluated not only the sensitiv-ity, specificity, reproducibility, and complexity of geneexpression, but also differential gene expression andsplice junction detection among different combinationsof sequencing platforms and library preparationmethods, taking into account size-specific fractionationand RNA integrity [9]. In general, the results across plat-forms and library preparation methods were highly cor-related, but greater read depth was necessary to recoverrare transcripts and splice site junctions present at lowfrequency, especially those resulting from putative noveland complex splicing events. Library preparation influ-enced the detection of non-polyA tail transcripts, 3′UTRs, and introns, primarily due to inherent differencesbetween rRNA reduction methods, i.e., rRNA depletionand polyA enrichment, with the former method captur-ing more structural and non-coding RNAs, and the lat-ter method capturing more full-length mRNAs [9].More importantly, although gene quantification was ro-bust, transcriptome coverage was sensitive to the pipe-lines applied during the analyses; however, surrogatevariable analysis proved useful in making direct compar-isons across platforms.Schuierer S. et al. [10] evaluated three Illumina library
preparation kits, representing polyA selection, ribosomalRNA depletion and exon capture methods, respectively,on RNA-Seq samples in a wide range of input quantityand quality. They found ribosomal RNA depletionmethod had generally good performance whereas exoncapture method performed the best for highly degradedRNA samples. Zhao S. et al. [11] evaluated polyA selec-tion vs. rRNA depletion using clinical samples and rec-ommended the former over the latter in most caseswhere the interest is protein-coding gene quantification.More recently, increasing interest in investigating rare
cell populations and detailed biological mechanisms hasled to a demand for protocols generating high quality li-braries from nanogram quantities of total RNA [12, 13]and even single cells [14, 15]. Dissecting the characteris-tics of RNA-Seq protocols designed to obtain data fromlow-input or degraded samples will benefit studies in-volving both rare cell populations and fixed clinical sam-ples. For low-quantity RNA analysis, it has beenestablished that the NuGEN protocol yields data withbetter transcriptome complexity but has less effectiverRNA depletion, while the SMARTer Ultra Low RNAKit has better performance on transcriptome annotationbut demonstrates bias with respect to underrepresentingtranscripts with high GC content [12]. cDNA amplifica-tion can help compensate for extremely small amountsof starting materials in low quantity RNA-Seq, butamplification itself may introduce problems, such as du-plication, that affect library performance [12]. ABRFevaluated several low-input RNA amplification kits and
Chao et al. BMC Genomics (2019) 20:571 Page 2 of 20

identified certain underlying differences, such as two dis-tinct categories of genes recovered in the libraries pre-pared with two distinct rRNA-reduction techniques,polyA enrichment and rRNA-depletion [13]. The sensi-tivity of gene detection and accuracy of gene expressionlevel assessments were consistent across approaches butdivergent across RNA input amounts. The SMARTerprotocol provided a near perfect correlation between ob-tained values and the actual amount of ERCC standardincluded as a spike-in control [13]. Although this priorstudy provides insight into the effects of RNA amplifica-tion, it employed an artificial system using commercialRNA from TaKaRa mixed with the ERCC control RNAs,which likely oversimplifies the transcriptome complexityof real cells, thus necessitating similar work in whole-cell systems.The source of data variation among different library
preparation methods remains unclear. Therefore, in thepresent study, we carefully compared the results we ob-tained from several commercial RNA-Seq library prepar-ation kits with different rRNA depletion and cDNAsynthesis methods to understand the strength of eachprotocol. The first goal of our study was to investigateconfounding factors in RNA-Seq library preparation pro-tocols using three standard input kits: the TruSeqStranded Total RNA and mRNA Library Prep Kits fromIllumina, and a modified NuGEN Ovation® RNA-SeqSystem. Defining the properties of the data generatedusing these protocols may aid users in designing theirfuture RNA-Seq strategies. The second part of our studywas to thoroughly evaluate the SMARTer Ultra LowRNA Kit using mouse embryonic stem cells (mESCs).Our results demonstrated that the TruSeq StrandedmRNA protocol was the best for transcriptome profilingand that the TruSeq Stranded Total RNA and mRNAprotocols were comparable, whereas the modifiedNuGEN protocol performed less well for whole tran-scriptome analysis, but might be a better choice forstudies focused on non-coding RNAs. Lastly, althoughthe results obtained with the SMARTer Ultra Low RNAKit were comparable to those of the TruSeq StrandedmRNA kit for most metrics and for identification ofDEGs, the absolute expression levels were only moder-ately correlated. We conclude that each RNA-Seq proto-col has individual strengths for particular individualapplications that need to be considered for a successfulRNA-Seq experiment.
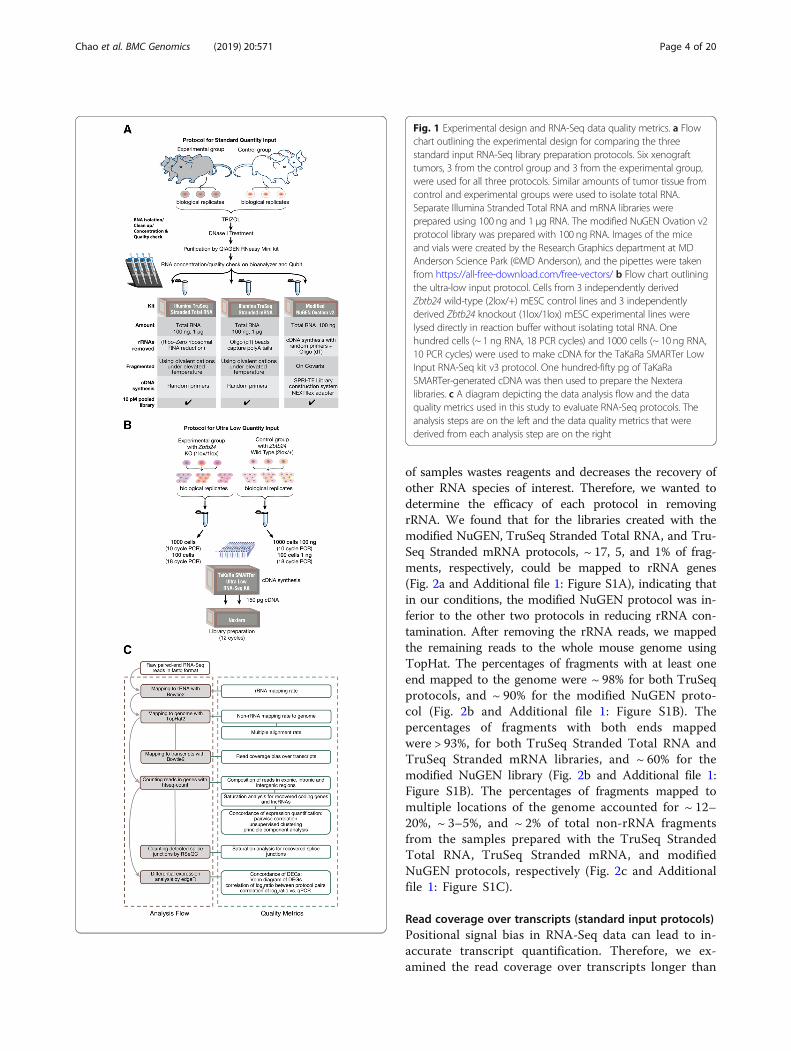
ResultsExperimental design and RNA-Seq data quality metricsFigure 1 outlines the experimental design we used fortesting the three standard input protocols (Illumina Tru-Seq Stranded Total RNA, Illumina TruSeq StrandedmRNA, and modified NuGEN Ovation v2) (Fig. 1a), the
ultra-low input protocol (TaKaRa SMARTer Ultra LowRNA Kit) (Fig. 1b), the data analysis flow, and data qual-ity evaluation metrics (Fig. 1c). The RNA-Seq datasetsused in the current study were generated during tworesearch-based projects. The first study assessed sixxenograft tumors, three from the control group (bio-logical replicates) and three from the experimental group(biological replicates) to test all three standard inputprotocols (Fig. 1a). Because one of the xenograft tumorsfrom the control group was used up, a different tumor(from a different mouse) had to be used for the librariesprepared with the TruSeq Total RNA protocol (100 ng)and the TruSeq mRNA protocol (100 ng). The secondstudy assessed three mESC cell lines (biological repli-cates) from Zbtb24 knockout (1lox/1lox) clones com-pared with three wild-type (2lox/+) clones (biologicalreplicates) using the TaKaRa SMARTer Ultra Low RNAprotocol directly on cells with no RNA preparation step.When RNA was isolated, all total RNA samples hadRNA integrity (RIN) numbers > 8.90.We used the manufacturer-recommended optimal in-
put amounts (1 μg for both the Illumina TruSeqStranded Total RNA and the Illumina TruSeq StrandedmRNA protocols; and 100 ng for the modified NuGENOvation v2; hereafter, “standard protocol”) (Fig. 1a). Inaddition, we also compared all three of these protocolswith 100 ng input RNA (Fig. 1a and in the Additional fileFigures). As described in a recent study, and as shown inFig. 1a, the Illumina TruSeq Stranded Total RNA proto-col uses Ribo-Zero to remove rRNA, whereas the Tru-Seq Stranded mRNA protocol enriches mRNA throughpolyA selection [11]. In contrast, as shown in Fig. 1a,the modified NuGEN Ovation v2 protocol synthesizescDNA directly from total RNA with a combination ofrandom primers and oligo [15], and followed by cDNAfragmentation on Covaris. On the other hand, both Tru-Seq protocols use divalent cations under elevatedtemperature to fragment purified RNAs. For the TaKaRaSMARTer Ultra Low RNA Kit, we used total RNA from100 mESCs cells and 1000 mESCs cells or approximately1 and 10 ng RNA, respectively. To check whether thismodified ultra-low input protocol was capable of gener-ating quality data, we compared the mESC dataset de-rived from the TaKaRa SMARTer cDNA synthesis stepcombined with Nextera library preparation, to the high-quality datasets obtained using the TruSeq StrandedmRNA protocol with 2 μg total RNA as the input level.The data analysis flow and the data quality metrics
used in this study to evaluate RNA-Seq protocols arediagrammed in Fig. 1c and detailed below.
Mapping statistics (standard input protocols)The high abundance of rRNA in cells creates an importantproblem in RNA-Seq experiments. rRNA contamination
Chao et al. BMC Genomics (2019) 20:571 Page 3 of 20
of samples wastes reagents and decreases the recovery ofother RNA species of interest. Therefore, we wanted todetermine the efficacy of each protocol in removingrRNA. We found that for the libraries created with themodified NuGEN, TruSeq Stranded Total RNA, and Tru-Seq Stranded mRNA protocols, ~ 17, 5, and 1% of frag-ments, respectively, could be mapped to rRNA genes(Fig. 2a and Additional file 1: Figure S1A), indicating thatin our conditions, the modified NuGEN protocol was in-ferior to the other two protocols in reducing rRNA con-tamination. After removing the rRNA reads, we mappedthe remaining reads to the whole mouse genome usingTopHat. The percentages of fragments with at least oneend mapped to the genome were ~ 98% for both TruSeqprotocols, and ~ 90% for the modified NuGEN proto-col (Fig. 2b and Additional file 1: Figure S1B). Thepercentages of fragments with both ends mappedwere > 93%, for both TruSeq Stranded Total RNA andTruSeq Stranded mRNA libraries, and ~ 60% for themodified NuGEN library (Fig. 2b and Additional file 1:Figure S1B). The percentages of fragments mapped tomultiple locations of the genome accounted for ~ 12–20%, ~ 3–5%, and ~ 2% of total non-rRNA fragmentsfrom the samples prepared with the TruSeq StrandedTotal RNA, TruSeq Stranded mRNA, and modifiedNuGEN protocols, respectively (Fig. 2c and Additionalfile 1: Figure S1C).
Read coverage over transcripts (standard input protocols)Positional signal bias in RNA-Seq data can lead to in-accurate transcript quantification. Therefore, we ex-amined the read coverage over transcripts longer than
Fig. 1 Experimental design and RNA-Seq data quality metrics. a Flowchart outlining the experimental design for comparing the threestandard input RNA-Seq library preparation protocols. Six xenografttumors, 3 from the control group and 3 from the experimental group,were used for all three protocols. Similar amounts of tumor tissue fromcontrol and experimental groups were used to isolate total RNA.Separate Illumina Stranded Total RNA and mRNA libraries wereprepared using 100 ng and 1 μg RNA. The modified NuGEN Ovation v2protocol library was prepared with 100 ng RNA. Images of the miceand vials were created by the Research Graphics department at MDAnderson Science Park (©MD Anderson), and the pipettes were takenfrom https://all-free-download.com/free-vectors/ b Flow chart outliningthe ultra-low input protocol. Cells from 3 independently derivedZbtb24 wild-type (2lox/+) mESC control lines and 3 independentlyderived Zbtb24 knockout (1lox/1lox) mESC experimental lines werelysed directly in reaction buffer without isolating total RNA. Onehundred cells (~ 1 ng RNA, 18 PCR cycles) and 1000 cells (~ 10 ng RNA,10 PCR cycles) were used to make cDNA for the TaKaRa SMARTer LowInput RNA-Seq kit v3 protocol. One hundred-fifty pg of TaKaRaSMARTer-generated cDNA was then used to prepare the Nexteralibraries. c A diagram depicting the data analysis flow and the dataquality metrics used in this study to evaluate RNA-Seq protocols. Theanalysis steps are on the left and the data quality metrics that werederived from each analysis step are on the right
Chao et al. BMC Genomics (2019) 20:571 Page 4 of 20

1000 bps and found excessive enrichment of fragments atthe 3′-end and depletion of signal at the 5′-end forsamples prepared with the modified NuGEN protocol(Fig. 2d and Additional file 1: Figure S1D). Reads fromthe TruSeq Stranded Total RNA and TruSeq StrandedmRNA protocols were more evenly distributed alongthe entire length of the transcript (Fig. 2d andAdditional file 1: Figure S1D). Closer examination ofeach nucleotide within 1000 bps of the 5′- and 3′-ends confirmed that the modified NuGEN protocolfailed to capture the RNA signal towards the 5′-end(Additional file 2: Figure S2A, C), and also suggestedthat the TruSeq Stranded mRNA protocol missed thesignal within 200 bp of the 3′-end, compared to theTruSeq Stranded Total RNA protocol (Additional file 2:Figure S2B, D).
Representation of the transcriptome (standard inputprotocols)To assess how well the entire transcriptome was repre-sented within the libraries generated by the three RNA-Seq protocols, we first investigated the composition ofuniquely mapped fragments in exonic, intronic, and inter-genic regions (Fig. 3a and Additional file 3: Figure S3A).We found that for the TruSeq Stranded Total RNA andmRNA protocols, respectively, approximately 67–84% and88–91% of the fragments were from exonic regions; 14–28 and < 10% were from intronic regions; and theremaining 3–5% were from intergenic regions. For themodified NuGEN protocol, only 35–45% of the fragmentswere from exonic regions; 47–56% were from intronic re-gions; and less than 10% were from intergenic regions.Since only the TruSeq protocols are strand-specific, as
Fig. 2 Mapping statistics and read coverage over transcripts for all the libraries prepared with standard input protocols. a The rRNA mapping ratewas calculated as the percentage of fragments that were mappable to rRNA sequences. b The non-rRNA mapping rate was calculated from allthe non-rRNA fragments as the percentage of fragments with both ends or one end mapped to the genome. c Multiple alignment rates weredetermined from non-rRNA fragments that were mapped to multiple locations of the genome. d Read-bias was assessed using the readcoverage over transcripts. Each transcript was subdivided evenly into 1000 bins and the read coverage was averaged over all the transcripts
Chao et al. BMC Genomics (2019) 20:571 Page 5 of 20

Fig. 3 (See legend on next page.)
Chao et al. BMC Genomics (2019) 20:571 Page 6 of 20

expected, the majority of the fragments in exonic and in-tronic regions were from the sense strand of the genes,whereas for the NuGEN libraries about half of the frag-ments were from the sense strand and the other half werefrom the antisense strand of the genes.To evaluate the capability of the RNA-Seq protocols
for detecting coding genes and lncRNAs, we performedsaturation analysis to count the number of coding genesand lncRNAs detected at increasing sequencing depth.For coding genes, the saturation curves from the TruSeqStranded Total RNA and mRNA libraries looked verysimilar and were superior to those from the NuGEN li-braries (Fig. 3b and Additional file 3: Figure S3B). ForlncRNAs, the modified NuGEN protocol outperformedboth the TruSeq Stranded Total RNA and mRNA proto-cols, yielding more lncRNAs at the same sequencingdepth (Fig. 3c Additional file 3: Figure S3C). However, forlncRNAs, none of the libraries were close to saturation atthe sequencing depth used for our experiments. Toexamine the sequencing depth required to reach sat-uration for lncRNA detection, we repeated our satur-ation analysis after pooling samples from the sameRNA-Seq protocol together. Our analysis showed thatthe modified NuGEN protocol still exceeded the othertwo protocols in lncRNA recovery, even when se-quencing depth approached saturation (Fig. 3d andAdditional file 3: Figure S3D).Another important application of RNA-Seq is to iden-
tify alternatively spliced variants, which frequently occurin mammalian genes [16]. In this regard, we conductedsaturation analysis comparing the number of reads tothe number of detected splice sites (Fig. 3e and Add-itional file 3: Figure S3E). We recovered the lowest num-ber of splice junctions using the modified NuGENprotocol and the highest number with the TruSeqStranded mRNA protocol.
Concordance of expression quantification (standard inputprotocols)Spearman’s rank correlation coefficients between sam-ples based on count per million (cpm) fragmentsmapped to exons values were calculated to assess theconcordance of the three standard RNA-Seq protocolson expression quantification. The correlation coeffi-cients were greater than 0.97 between samples
prepared using the same protocol, regardless ofwhether the samples were biological replicates of thesame condition or from different conditions. The cor-relation coefficients between samples prepared usingdifferent protocols were lower: 0.93–0.97 between theTruSeq Stranded Total RNA and mRNA protocols,0.80–0.87 between the TruSeq Stranded Total RNAand modified NuGEN protocols, and 0.77–0.82between the TruSeq Stranded mRNA and modifiedNuGEN protocols (Fig. 4a and Additional file 4:Figure S4A). Unsupervised clustering demonstratedthat the whole transcriptome expression profiles ob-tained from TruSeq Stranded Total RNA and mRNAlibraries were more similar to each other than eitherwas to the NuGEN libraries (Fig. 4b and Additionalfile 4: Figure S4B). Principal component analysis(PCA) recapitulated the clustering analysis: theNuGEN libraries were separated from the TruSeq li-braries in the first component, whereas the TruSeqStranded Total RNA and mRNA libraries were separatedin the second component (Fig. 4c and Additional file 4:Figure S4C). Further investigation revealed the TruSeqprotocols tended to capture genes with higher expressionand GC content, whereas the modified NuGEN protocoltended to capture longer genes (Additional file 7: FigureS7B-C). Comparing the TruSeq mRNA protocol to theTruSeq Total RNA protocol, showed that the TruSeqmRNA protocol preferentially recovered genes withhigher GC content and shorter length (Additional file 7:Figure S7A). To exclude the possibility that these differ-ences stemmed from batch effects, such as different set oflibraries being prepared at different times, we in-cluded additional technical replicates, prepared at dif-ferent times, for the TruSeq Stranded Total RNA andmRNA protocols (1 μg). Unsupervised clustering sug-gested that the distance between technical replicatesof the same protocol was closer than the distance be-tween samples prepared with different protocols(Additional file 5: Figure S5A). The technical replicatelibraries generated using the same protocol clusteredtogether and were separated from those of differentprotocols in PCA (Additional file 5: Figure S5B).Taken together, these results demonstrate that thevariability among these library preparation protocolswas not primarily due to batch effects.
(See figure on previous page.)Fig. 3 Representation of the transcriptome for all the libraries prepared with standard protocols. a Composition of the uniquely mappedfragments, shown as the percentage of fragments in exonic, intronic, and intergenic regions. According to the direction of transcription, exonicand intronic regions were further divided into sense and antisense. b Saturation analysis showing the percentage of coding genes recovered(calculated as the genes with more than 10 fragments) at increasing sequencing depth. c-d Saturation analysis showing the percentage oflncRNAs recovered (calculated as the lncRNAs with more than 10 fragments) at increasing sequencing depth. In C, the six libraries created usingeach of three protocols (18 libraries total) are plotted individually. In D, the six libraries from the same protocol were pooled. e Saturation analysisshowing the number of splice junctions recovered at increasing sequencing depth
Chao et al. BMC Genomics (2019) 20:571 Page 7 of 20
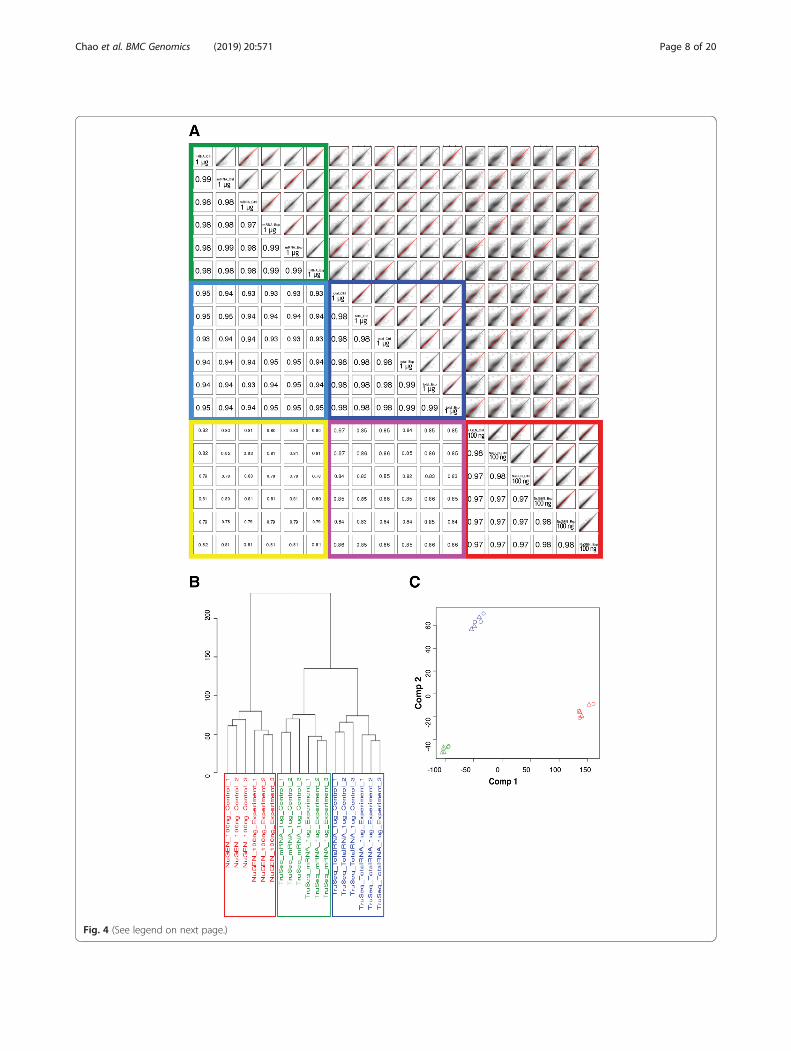
Fig. 4 (See legend on next page.)
Chao et al. BMC Genomics (2019) 20:571 Page 8 of 20

Concordance of DEGs recovered with standard inputprotocolsPCA demonstrated that all protocols could distinguishbetween samples representing different biological condi-tions (Fig. 5a and Additional file 6: Figure S6A). Threehundred ninety-four DEGs were detected across all threeRNA-Seq library preparation protocols, accounting for41, 38, and 28% of the total DEGs detected when usingthe TruSeq Stranded Total RNA, TruSeq StrandedmRNA, and modified NuGEN protocols, respectively(Fig. 5b). The pairwise scatter plots of log2 ratio valuesbetween DEGs from control and experimental mousetumor tissues showed that the TruSeq Stranded TotalRNA and mRNA results were more highly correlatedwith each other (Spearman’s correlation coefficient =0.99) than either was with the modified NuGEN proto-col (Spearman’s correlation coefficient = 0.80 and 0.79,respectively) (Fig. 5c and Additional file 6: Figure S6B).That is, the TruSeq Total RNA and mRNA protocolsyielded more shared DEGs than either did with themodified NuGEN protocol (Fig. 5c and Additional file 6:Figure S6B). To evaluate how accurate the DEG callswere, we performed qPCR for 288 genes that RNA-Seqdata indicated were differentially expressed, and com-pared the log2 ratio values for these genes as derivedfrom the various RNA-Seq library preparation protocolsand qPCR (manuscript in preparation). The DEGs re-covered with the TruSeq Total RNA and mRNA proto-cols had correlation coefficients of 0.78 and 0.76 vs.qPCR, whereas the modified NuGEN protocol had acorrelation coefficient of 0.62 (Fig. 5d). In short, the li-braries produced by all three standard protocols weresufficient to detect DEGs. However, independent valid-ation of DEGs by qPCR indicated that the differentialexpression results from the TruSeq Stranded Total RNAand mRNA protocols might be more accurate than thosefrom the modified NuGEN protocol.
Mapping statistics, read coverage bias and transcriptomerepresentation (ultra-low protocol)Increasing numbers of omics studies are being designedto investigate minor cell subpopulations, rare cell types,and even single cells. Effectively executing low-inputRNA-Seq is essential to achieve these goals. To deter-mine the applicability of the TaKaRa SMARTer Ultra
Low RNA Kit v3 with low-level RNA input--100 or 1000mESCs from each of three Zbtb24 knockout (1lox/1lox)clones (biological replicates) and three wild-type (2lox/+) clones (biological replicates), we evaluated its per-formance by comparing it to that of the TruSeqStranded mRNA protocol using 2 μg of total RNA, as a“gold standard” that represents overall robustness withregard to rRNA contamination, mRNA species represen-tation, identification of DEGs, and overall reproducibil-ity. The SMARTer kit protocol resulted in libraries withhigher levels of rRNA contamination at both the 100 (~1 ng RNA) and 1000 cell (~ 10 ng RNA) levels than didthe TruSeq Stranded mRNA protocol using standard in-put RNA amounts (Fig. 6a). The percentage of fragmentswith both ends mapped to the genome was 91–92% forthe TruSeq Stranded mRNA protocol and 60–65% forthe SMARTer protocol using either 100 or 1000 cells(Fig. 6b). The coverage of fragments over transcriptssuggested the SMARTer protocol libraries were biasedtoward the 3′-end of transcripts compared to the Tru-Seq Stranded mRNA protocol libraries (Fig. 6c). For li-braries from the SMARTer protocol with 100 and 1000cells, around 90% of the fragments were from exonic re-gions, ~ 6% were from intronic regions, and ~ 4% werefrom intergenic regions, which was comparable to librar-ies from the TruSeq Stranded mRNA protocol (Fig. 6d).Since the SMARTer protocol is not strand-specific, halfof the fragments were from the sense strand and theother half were from the antisense strand of the genes(Fig. 6d). For coding genes, the saturation curves forlibraries from the SMARTer protocol with 100 and1000 cells were very similar and were slightly less ro-bust than those from the TruSeq Stranded mRNAprotocol (Fig. 6e). The SMARTer protocol outper-formed the TruSeq Stranded mRNA protocol inrecovering more lncRNAs at the same sequencingdepth (Fig. 6f ). However, at the same sequencingdepth, the number of splice junctions detected in li-braries from the SMARTer protocol was lower thanin libraries from the TruSeq Stranded mRNA protocol(Fig. 6g). Overall, low-input RNA samples subjectedto the SMARTer protocol, when compared to theTruSeq Stranded mRNA protocol, produced data withgreater rRNA contamination but similar rates of exondetection. Furthermore, we recovered fewer coding
(See figure on previous page.)Fig. 4 Concordance of expression quantification between the libraries prepared with standard input protocols. a Scatter plots in a smoothedcolor density representation (top-right panel) and Spearman’s rank correlation coefficients (bottom-left panel) for all pairs of libraries usinglog2(cpm + 1) values. b Unsupervised clustering of all the libraries using log2(cpm + 1) values. Euclidean distance with complete linkage was usedto cluster the libraries. c Principal component analysis (PCA) of all the libraries, using log2(cpm + 1) values. The values for each gene across all thelibraries were centered to zero and scaled to have unit variance before being analyzed. Circles and triangles represent control and experimentallibraries, respectively (NuGEN, red; TruSeq mRNA, green; TrueSeq Total RNA, blue). For all analyses in Fig. 4, genes represented by fewer than 10fragments in all the libraries were excluded
Chao et al. BMC Genomics (2019) 20:571 Page 9 of 20
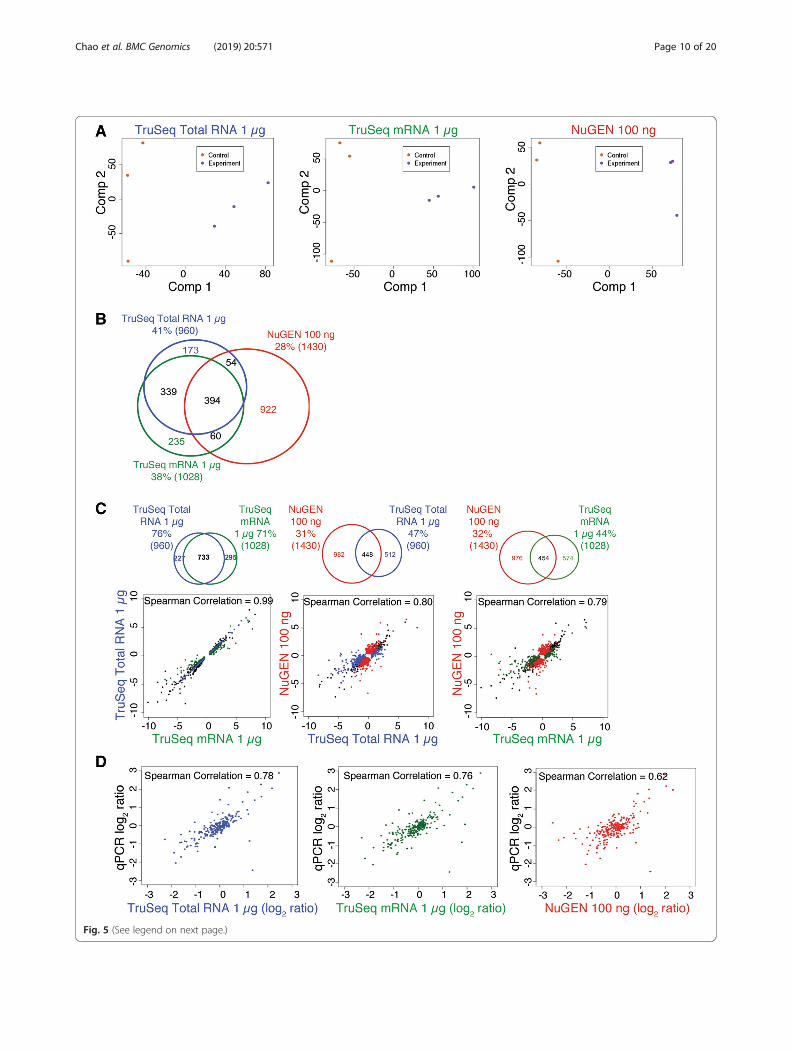
Fig. 5 (See legend on next page.)
Chao et al. BMC Genomics (2019) 20:571 Page 10 of 20
genes and splice junctions but more lncRNAs from li-braries generated with the SMARTer Ultra Low RNAKit. Overall, the kit performed well on these low-input samples, but as anticipated, did not capture therange of expression recovered with a kit using moreinput RNA.
Concordance of expression quantification and DEdetection (ultra-low protocol)Spearman’s rank correlation coefficients between thelow-input samples prepared from the same or differentinput quantities were very good (0.94–0.99), indicatinghigh reproducibility with the SMARTer Ultra Low RNAKit protocol. However, the coefficients between samplesprepared using the SMARTer and standard TruSeqStranded mRNA protocols were lower (0.87–0.91)(Fig. 7a). PCA showed that the variability among sam-ples was largely due to differences between the SMAR-Ter and TruSeq Stranded mRNA libraries, as describedin the first component (Fig. 7b). The transcriptomeprofile changes from biological conditions within eachprotocol could be explained by the second component(Fig. 7b). Further investigation showed the SMARTerprotocol tended to allow recovery of genes with higherexpression, lower GC content, and shorter length, com-pared to the TruSeq mRNA protocol (Additional file 7:Figure S7D-F). There were 2623 DEGs shared betweenthe SMARTer libraries generated from either 100 or1000 cells and the TruSeq Stranded mRNA libraries, ac-counting for 40, 37, and 23% of the total DEGs detectedin each, respectively, but the majority of DEGs recoveredfrom the TruSeq Stranded mRNA libraries (4376 genes)were excluded from the SMARTer libraries (Fig. 7c).The pairwise scatter plots of log2 ratios betweenbiological interventions using DEGs showed that theconcordance of DEG detection between the SMARTerlibraries prepared with 100 cells vs. 1000 cells, or be-tween SMARTer vs. TruSeq Stranded mRNA, was muchlower than that between the standard protocols at nor-mal input level (Fig. 7d vs. Figure 5c). In summary, theSMARTer Ultra Low RNA Kit is capable of capturingthe effect of biological conditions, but is not as robust asthe standard input protocol at a normal input level of2 μg for the TruSeq Stranded mRNA-Seq protocol.
DiscussionComparing global gene expression in differing biologicalcontexts is a cornerstone of contemporary biology. Asmicroarray technology is being supplanted by RNA-Seqmethods for many applications, it is imperative to deter-mine which library preparation protocols are best suitedfor specific needs, for example the recovery of coding vs.non-coding RNAs and reliable discernment of DEGs.Here, we have examined three different standard RNA-Seq library preparation protocols, and one low-inputprotocol in terms of overall reproducibility, rRNA con-tamination, read coverage, 5′- and 3′-end bias, and re-covery of exonic vs. intronic sequences, lncRNAs, andDEGs. These protocols were the standard input IlluminaTruSeq Stranded Total RNA, Illumina TruSeq StrandedmRNA, and modified NuGEN Ovation v2 kits; and thelow input TaKaRa SMARTer Low Input RNA-Seq kit v3,tested at two different input levels, 100 (~ 1 ng RNA)and 1000 (~ 10 ng RNA) cells. Although all protocolsyielded reproducible data, overall, the Illumina kits gen-erally outperformed the modified NuGEN Ovation v2 kitat standard RNA input levels. The modified NuGENprotocol was useful for the recovery of lncRNAs and in-tronic sequences, but also had higher levels of rRNAcontamination.
Undesirable recovery of rRNAOne impediment to the efficient recovery of meaningfulRNA-Seq data is repetitive rRNA. Nearly 80% of RNA ina cell is rRNA, making it preferable to remove this classof RNA prior to library construction [17]. RNA-Seq li-brary preparation protocols depend on one of twomeans of reducing rRNA contamination: rRNA deple-tion and polyA enrichment. For the three standardprotocols and the one ultra-low input protocol we evalu-ated, the TruSeq Stranded Total RNA and the modifiedNuGEN Ovation RNA-Seq System V2 protocols employrRNA depletion methods, whereas the TruSeq StrandedmRNA protocol and SMARTer Ultra-low protocol usepolyA enrichment methods to reduce rRNA contamin-ation in sequencing libraries. In our present study, themodified NuGEN protocol libraries averaged 15–20% oftheir reads mapping to rRNA, as compared to 1–5% forthe TruSeq protocols (Fig. 2a and Additional file 1:
(See figure on previous page.)Fig. 5 Concordance of differentially expressed genes (DEGs) recovered from libraries prepared with standard protocols. a Principle componentanalysis (PCA) was performed on the libraries prepared with each standard protocol. b Venn diagram showing the number of DEGs recoveredwith the three standard protocols. c Pairwise scatter plots of log2 ratio values comparing the DEGs identified in the tumor tissues of control andexperimental mice. The black dots represent genes that were called as differentially expressed in libraries from both protocols, colored dotsrepresent genes that were called as differentially expressed in the libraries from only one protocol. The Spearman’s rank correlation coefficient isshown at the top of each plot. The Venn diagram above each plot shows the number of DEGs recovered with the specified protocols. d Scatterplots of log2 ratio values calculated between tumor tissues of control and experimental mice for each protocol vs. qPCR. Spearman’s rankcorrelation coefficient is shown at the top of each plot
Chao et al. BMC Genomics (2019) 20:571 Page 11 of 20
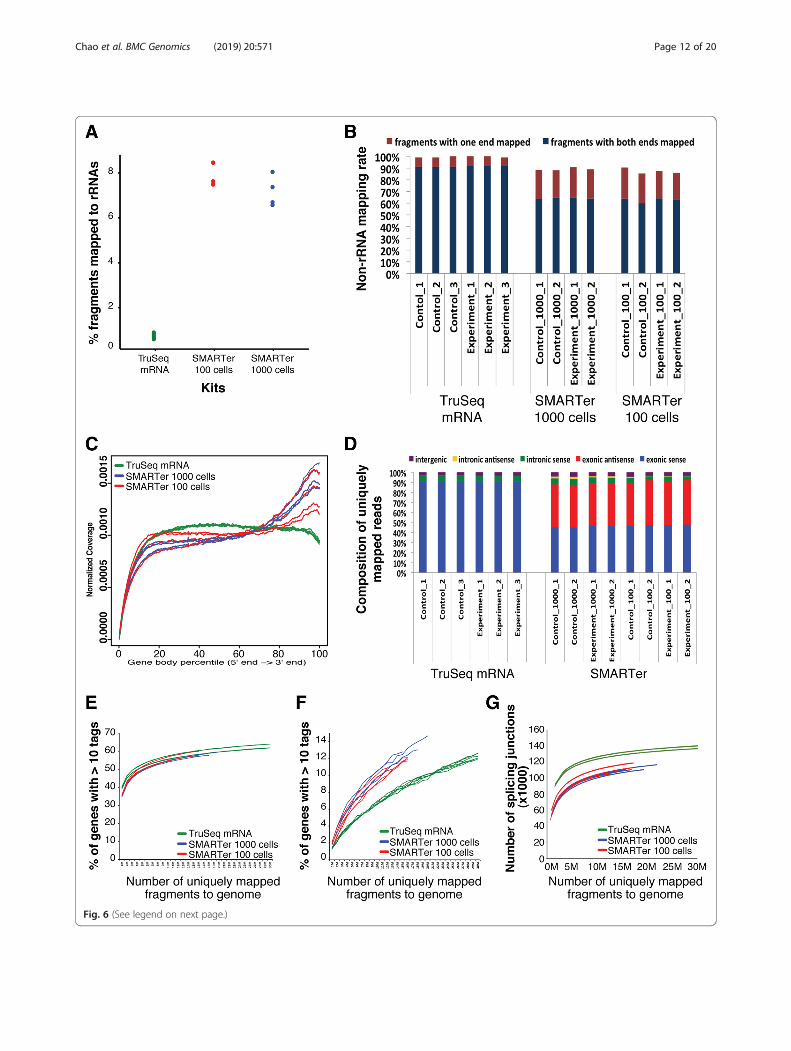
Fig. 6 (See legend on next page.)
Chao et al. BMC Genomics (2019) 20:571 Page 12 of 20

Figure S1A). These results are consistent with those re-ported by Adiconis et al. (23.2%) [12], but lower thanthose reported by Shanker et al. (35%) [13]. However,our NuGEN rRNA mapping rates were much higherthan those reported by both Sun et al. [18] and Albertiet al. [19] who had only a 1% rRNA mapping rate forboth their Illumina- and NuGEN-created libraries. Whilewe cannot explain the differences in rRNA mappingrates for the NuGEN libraries in these studies, in ourcore facility, the NuGEN Ovation v2 kit libraries consist-ently resulted in a 15–20% rRNA mapping rate, not onlyin this study, but also in prior sequencing libraries con-structed in our facility (data not shown), thus providingpart of the impetus for the current study. We also exam-ined the rRNA mapping rate in libraries prepared fromtwo polyA-enrichment protocols, the Illumina TruSeqStranded mRNA protocol and the TaKaRa SMARTerUltra Low RNA protocol. The SMARTer protocolyielded a 7–9% rRNA mapping rate, which was inferiorto the TruSeq protocol at standard RNA input levels(1%) (Fig. 6a). The 7–9% mapping rate yielded by theSMARTer protocol in our facility was consistent withthat reported by Adiconis et al. [12] and Alberti et al.[19]. Overall, the protocols we tested were able to re-move the majority of rRNA. Although the modifiedNuGen protocol showed relatively higher rRNA content,since the existence of rRNA is not expected to introducea bias for expression quantification, an increase in se-quencing depth would be able to compensate.
Overall mapping, end bias and exonic coverageThe TruSeq protocols yielded a ≥ 90% overall mappingrate for fragments with both ends mapped to the gen-ome, compared to 60% for the modified NuGENprotocol (Fig. 2b and Additional file 1: Figure S1B).This is on par with a prior study showing NuGENrRNA-depleted libraries had a 75% alignment rateand TruSeq PolyA-enrichment mRNA libraries had a90% alignment rate [18].To assess whether complete transcripts were evenly
captured by the three standard library preparation proto-cols, we examined read coverage over the length of thefull transcript. Our results, like those of Acondis [12], in-dicated that NuGEN libraries displayed augmented 3′-
end signal and depleted 5′-end signal, perhaps due tousing a combination of both oligo[dT] and randomprimers during cDNA synthesis [12]. The TruSeqStranded mRNA libraries were also somewhat biased, asreflected by a lack of reads within 200 bps of the 3′-end,relative to the TruSeq Total RNA libraries (Additionalfile 2: Figure S2B, 2D). This may be because of the dif-ference between the rRNA depletion approaches used bythe TruSeq mRNA and TruSeq total RNA protocols,resulting in more unmappable reads near the 3′-end inTruSeq mRNA libraries due to the presence of polyAtails in these reads.To determine how well each protocol performed in re-
covering the transcriptome, we examined the compos-ition of the uniquely mapped fragments from the twoIllumina and the modified NuGEN protocols. Ninetypercent of our reads were mapped to exons using theTruSeq Stranded mRNA kit, 67–84% using the TotalRNA kit, and 35–46% using the NuGEN kit (Fig. 3a andAdditional file 3: Figure S3A), which is consistent withsimilar studies using these kits [9, 11, 13, 18], suggestingthat polyA-enrichment protocols may be superior torRNA depletion protocols for studies focusing on exonicRNA [11, 13, 18]. This is further supported by our find-ing that, compared to the three standard input proto-cols, the polyA-based TaKaRa SMARTer Ultra LowRNA Kit had almost the same exonic coverage as theTruSeq Stranded mRNA protocol (Fig. 6d). The inversewas true for the recovery of intronic sequences, withrRNA-depleted libraries outperforming the polyA-enrichment libraries. For example, the modified NuGENprotocol yielded ~ 50% intronic sequences, which wason par with the results of Shanker et al. (after removingPCR duplicates) [13], whereas our TruSeq StrandedTotal RNA libraries consisted of 14–28% intronic se-quences. In contrast, the TruSeq Stranded mRNA librar-ies contained only 6–8% intronic sequences (Fig. 3a andAdditional file 3: Figure S3A). We also found that themodified NuGEN kit yielded better lncRNA recovery. Inthis case, better lncRNA recovery may be due to differ-ences in the cDNA synthesis step rather than in therRNA depletion step: whereas the TruSeq StrandedTotal RNA protocol uses only random primers forcDNA synthesis, the modified NuGEN protocol uses a
(See figure on previous page.)Fig. 6 Mapping statistics, read coverage bias, and transcriptome representation for libraries prepared using the SMARTer Ultra Low RNA Kit. a Thepercentage of fragments mapped to rRNA sequences. b Of all the non-rRNA fragments, the percentage of fragments with both ends or one endmapped to the genome. c The read coverage over transcripts. Each transcript was subdivided evenly into 1000 bins and the read coverage wasaveraged over all the transcripts. d Composition of the uniquely mapped fragments, shown as the percentage of fragments in exonic, intronic,and intergenic regions. According to the direction of transcription, exonic and intronic regions were further divided to sense and antisense. eSaturation analysis showing the percentage of coding genes recovered at increasing sequencing depth. f Saturation analysis showing thepercentage of lncRNAs recovered at increasing sequencing depth. g Saturation analysis showing the number of splice junctions recovered atincreasing sequencing depth. For the purpose of evaluation, the above analyses also include the libraries prepared with the TruSeq StrandedmRNA protocol using the same biological conditions
Chao et al. BMC Genomics (2019) 20:571 Page 13 of 20
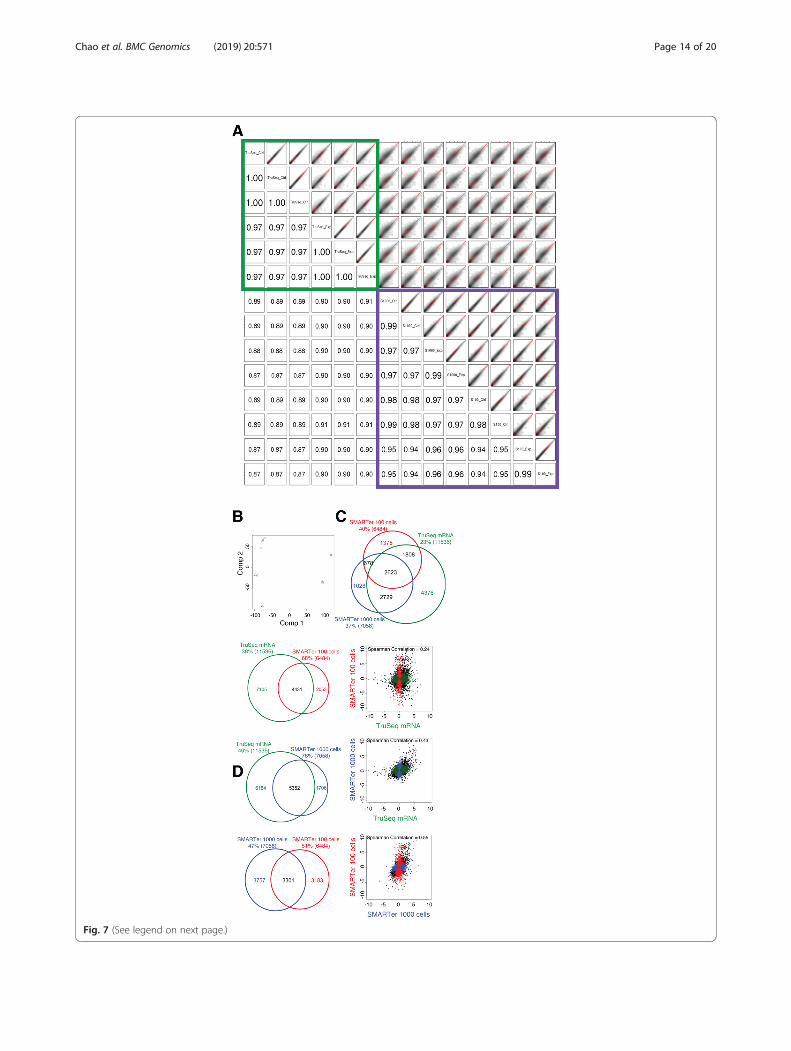
Fig. 7 (See legend on next page.)
Chao et al. BMC Genomics (2019) 20:571 Page 14 of 20

combination of random and oligo [15] primers, thusallowing more efficient capture of both coding and non-coding RNAs with and without polyA-tails [11]. However,it is also possible that some of the lncRNAs identified inthe rRNA-depleted libraries are merely false signals origin-ating from intronic reads from other coding genes ratherthan lncRNAs [11]. Additionally, it is worth noting that inour saturation analysis (Fig. 3b, c Additional file 3: FigureS3B, 3C), the curves reached saturation at ~ 60% codinggenes or ~ 30% lncRNAs, suggesting that achieving in-creased coverage of coding genes or lncRNAs beyondthese levels by deeper sequencing would be very difficult.
Gene quantification and identification of DEGsGene expression quantification in and identification ofDEGs between samples from different biological con-ditions are two of the primary goals for most RNA-Seq experiments. In the current study, we identified960 and 1028 DEGs between experimental andcontrol tumor tissues using the TruSeq Total RNAand mRNA protocols (manuscript in preparation), re-spectively, which was slightly fewer than the 1430DEGs identified using the modified NuGEN protocol(Fig. 5b). This contrasts with the work of Sun et al.who recovered fewer DEGs from NuGEN librariesthan TruSeq PolyA-enrichement libraries [18]. To ex-plore this difference, we validated our RNA-Seq-identified DEGs using qRT-PCR. We found that agreater proportion of DEGs identified using the Tru-Seq Stranded Total RNA and mRNA libraries weresupported by our qRT-PCR results compared to DEGsidentified using the modified NuGEN protocol librar-ies. That is, the modified NuGEN protocol may haveresulted in more false-positive DEGs than did theTruSeq protocols. The comparable performance ofthe TruSeq Total and mRNA protocols in our studycontrasts with the results of Zhao, et al., who directlycompared the TruSeq Stranded Total and mRNA pro-tocols using clinical samples. They found the TruSeqStranded mRNA libraries more accurately predictedgene expression levels than the TruSeq StrandedTotal RNA libraries [11].
Although the SMARTer Ultra Low RNA Kit-generatedlibraries were able to capture the effect of biological dif-ferences between experimental and control samples,overall, its performance was inferior to that of the Tru-Seq Stranded mRNA protocol, given both the higheramount of rRNA recovered and the lower number ofDEGs recovered (Figs. 6 and 7). This may be due to thevery different levels of input RNA used in these twoprotocols.
Limitations and future workThere are still some limitations in this study that couldbe addressed in future work. For example, this studydidn’t include spike-in RNAs, which could serve as asample independent benchmark to further evaluate theaccuracy of DEG detection in libraries prepared by dif-ferent protocols. Future work could also consider inves-tigating additional ultralow RNA-Seq protocols andusing standard RNA samples such as Universal HumanReference RNA (UHRR) for an easier comparison toother studies. [20]
ConclusionsIn summary, all the RNA-Seq library preparation proto-cols evaluated in this study were suitable for distinguish-ing between experimental groups when using themanufacturers’ recommended amount of input RNA.However, we made some discoveries that might havebeen previously overlooked. First, we found that theTruSeq Stranded mRNA protocol is universally applic-able to studies focusing on dissecting protein-codinggene profiles when the amount of input RNA is suffi-cient, whereas the modified NuGEN protocol might pro-vide more information in studies designed to understandlncRNA profiles. Therefore, choosing the appropriateRNA-Seq library preparation protocol for recoveringspecific classes of RNA should be a part of the overallstudy design [18]. Second, when dealing with smallamounts of input RNA, the SMARTer Ultra Low RNAKit may be a good choice in terms of rRNA removal, ex-onic mapping rates and recovered DEGs. Third, our sat-uration analysis indicated that the required sequencing
(See figure on previous page.)Fig. 7 Concordance of expression quantification and DEG detection using the SMARTer Ultra Low RNA Kit. For the purpose of evaluation, thelibraries prepared from the same biological conditions with the TruSeq Stranded mRNA protocol are also included. a Smoothed color densityrepresentation scatter plots (top, right) and Spearman’s rank correlation coefficients (bottom left) for all library pairs using log2(cpm + 1) values.100 and 1000 represent the SMARTer Ultra Low RNA Kit using 100 and 1000 cells. b Principal component analysis (PCA) of all libraries usinglog2(cpm + 1) values. Red, blue, and green represent libraries prepared with the ultra-low protocol 100 cells, ultra-low protocol 1000 cells, andTruSeq Stranded mRNA protocol, respectively. Circles and triangles represent control and experimental libraries, respectively. c Venn diagramshowing the number of DEGs recovered with the SMARTer Ultra Low RNA (100 cells and 1000 cells) and the TruSeq Stranded mRNA kits. dPairwise scatter plots of log2 ratio values between the biological conditions using the DEGs. The black dots represent genes called as differentiallyexpressed in libraries prepared with both kits, and the colored dots represent genes called as differentially expressed in libraries from only one kit.The Spearman’s rank correlation coefficient is shown at the top of each plot. The Venn diagram to the left of each scatter plot shows the numberof DEGs called for the data produced using both or only one of the protocols
Chao et al. BMC Genomics (2019) 20:571 Page 15 of 20
depth depends on the biological question being ad-dressed by each individual study. Roughly, a minimumof 20M aligned reads/mate-pairs are required for a pro-ject designed to detect coding genes and increasing thesequencing depth to ≥130M reads may be necessary tothoroughly investigate lncRNAs [21] (note: the neededsequencing depth may also vary depending on differentbiological samples and study designs). Omics technologyand big data will facilitate the development of personal-ized medicine, but we should understand the outcomesof the experimental parameters and control for those asthoroughly as possible.
MethodsBiological samples and RNA isolationThe use of mice in this project has been reviewed and ap-proved by The University of Texas MD Anderson CancerCenter (MD Anderson) IACUC committee (ACUF 04–89-07138, S. Fischer) and (ACUF MODIFICATION00001124-RN01, T. Chen). C57BL/6 mice were purchasedfrom The Jackson Laboratory (Bar Harbor, ME). For thethree standard input RNA-Seq library preparation proto-cols (Illumina TruSeq Stranded Total RNA, TruSeqStranded mRNA kit, and the modified NuGEN OvationRNA-Seq kits), total RNA was isolated from three xeno-graft tumors (biological replicates) from control [30% cal-orie restricted diet [19]] and experimental [(diet-inducedobese (OB)) xenograft mouse models in the C57BL/6 gen-etic background, respectively. C57BL/6 mice were chosen,in part, because they are susceptible to obesity when fed ahigh-fat diet [22]. We fed the mice with two commercialdiets following previously established guidelines (ResearchDiets, Inc., New Brunswick, NJ): a CR diet (D03020702)for lean C57BL/6 mice (30% CR), and a diet-induced obes-ity (DIO) diet (D12492; consumed ad libitum) for OBC57BL/6 mice, 10 mice per group [23]. Mice were hu-manely euthanized using carbon dioxide and followed bycervical dislocation, per IACUC approved procedures. Amanuscript describing the details of the mouse obesity/tumor xenograft study, including transcriptomic profilingresults, is in preparation. For the SMARTer Ultra LowRNA Kit, designed to evaluate both rare cell populationsand fixed clinical samples, three mESCs cell lines (bio-logical replicates) from Zbtb24 knockout (1lox/1lox)clones and three Zbtb24 wild-type (2lox/+) clones wereused as experimental and control samples, respectively.The mice used for this part of the study were generatedin-house at MD Anderson Science Park. A manuscript de-scribing the Zbtb24 KO mESCs, including transcriptomicprofiling results, is also in preparation.Total RNA from mouse xenograft tumor tissues was
isolated using TRIZOL following the manufacturer’sprotocol. Isolated RNA samples were treated with DNaseI followed by purification with a QIAGEN RNeasy Mini
kit (Madison, WI). Total RNA from mESCs was extractedusing the QIAGEN RNeasy Mini kit with on-columnDNase treatment following the manufacturer’s protocol.Both concentration and quality of all the isolated RNAsamples were measured and checked with an AgilentBioanalyzer 2100 and Qubit. All RNA samples hadRNA integrity numbers > 8.90. For the low-cell-inputexperiments, 100 cells and 1000 cells (~ 1 and 10 ngRNA, respectively, according to the SMARTer UltraLow RNA kit user manual) were used directly withoutisolating total RNA in accordance with manufacturerrecommendations.
TruSeq stranded total RNA and mRNA librarypreparationsLibraries were prepared using the Illumina TruSeqStranded Total RNA (Cat. # RS-122-2301) or mRNA(Cat. # RS-122-2101) kit according to the manufacturer’sprotocol starting with 1 μg total RNA. Briefly, rRNA-depleted RNAs (Total RNA kit) or purified mRNAs(mRNA kit) were fragmented and converted to cDNAwith reverse transcriptase. The resulting cDNAs wereconverted to double stranded cDNAs and subjected toend-repair, A-tailing, and adapter ligation. The con-structed libraries were amplified using 8 cycles of PCR.
NuGEN ovation RNA-Seq system v2 modified with SPRI-TElibrary construction systemTotal RNA (100 ng) was converted to cDNA using theNuGEN Ovation RNA-Seq System v2 (Cat. # 7102–32)(NuGEN) following the manufacturer’s protocol(NuGEN, San Carlos, CA). NuGEN-amplified double-stranded cDNAs were broken into ~ 180 base pair (bp)fragments by sonication with a Covaris S220 instrument(Covaris, Woburn, MA). Fragmented cDNAs wereprocessed on a SPRI-TE library construction system(Beckman Coulter, Fullerton, CA). Uniquely indexedNEXTflex adapters (Bioo Scientific, Austin, TX) were li-gated onto each sample to allow for multiplexing.Adapter-ligated libraries were amplified [1 cycle at 98 °Cfor 45 s; 15 cycles at 98 °C for 15 s, 65 °C for 30 s, and72 °C for 30 s; 1 cycle at 72 °C for 1 min; and a hold at4 °C] using a KAPA library amplification kit (KAPA Bio-systems, Wilmington, MA) and purified with AMPureXP beads (Beckman Coulter).
Modified protocol for the SMARTer ultra low RNA andNextera DNA library preparation kitsmESC were lysed in the reaction buffer included in theSMARTer Ultra Low RNA Kit v3 (Cat. # 634849)(TaKaRa, Japan). cDNA was then synthesized using theSMARTer Ultra Low RNA Kit followed by library con-struction using the Nextera DNA Sample PreparationKit (Cat. # FC-131-1024) (Illumina, San Diego, CA),
Chao et al. BMC Genomics (2019) 20:571 Page 16 of 20
according to the manufacturers’ protocols. We per-formed 10 cycles of PCR for 1000 cells (~ 10 ng RNA)(SMARTer 1000), and 18 cycles of PCR for 100 cells(~ 1 ng RNA) (SMARTer 100).
Next-generation sequencingTen pM of pooled libraries were processed using a cBot(Illumina) for cluster generation before sequencing onan Illumina HiSeq 2500 (2 × 76 bp run).
RNA-Seq data analysisMappingReads were mapped to rRNA sequences (GI numbers:262231778, 120444901, 120444900, 328447215, 38176281 and Ensembl IDs: ENSMUST00000082388,ENSMUST00000082390, ENSMUST00000083988, ENSMUST00000157970) using Bowtie2 (version 2.1.0)[24]. Reads that were not mapped to rRNAs werethen mapped to the mouse genome (mm10) usingTopHat (version 2.0.10) [25].
Read coverage over transcriptsThe longest transcript from each gene was chosen torepresent the gene. The reads were then mapped to allthe transcript sequences using Bowtie2. Transcripts withfewer than 200 total fragment counts or shorter than1000 bps were filtered out leaving at least 12 k tran-scripts for each sample. Each full-length transcript wassubdivided evenly into 1000 bins. The mean coverage offragments over each bin was normalized to the totalcoverage over the whole transcript and then averagedover all the transcripts. Alternatively, the coverage offragments over each position of the 1000 bps down-stream of the 5′-end or upstream of the 3′-end was nor-malized by the mean coverage of the whole transcript,and then averaged over all the transcripts.
Discovery of splicing junctionsThe number of known splicing junctions (defined as junc-tions with both 5′- and 3′- splice sites annotated in thereference gene set) supported by at least one read in eachsample was counted using RSeQC (version 2.6.4) [26].
Saturation plotsEach point in a saturation curve was generated byrandomly selecting the desired number of fragmentsand calculating the percentage of genes with morethan 10 fragments over all the genes. For each sam-ple, this procedure was repeated three times and thecurve represents the average percentage of genes ateach corresponding number of fragments.
Sample clusteringHierarchical clustering of samples was performed usingthe log2(cpm + 1) values of all the genes using the distfunction and Euclidean method in R, as well as the hier-archical clustering (hclust) function and completemethod in R.
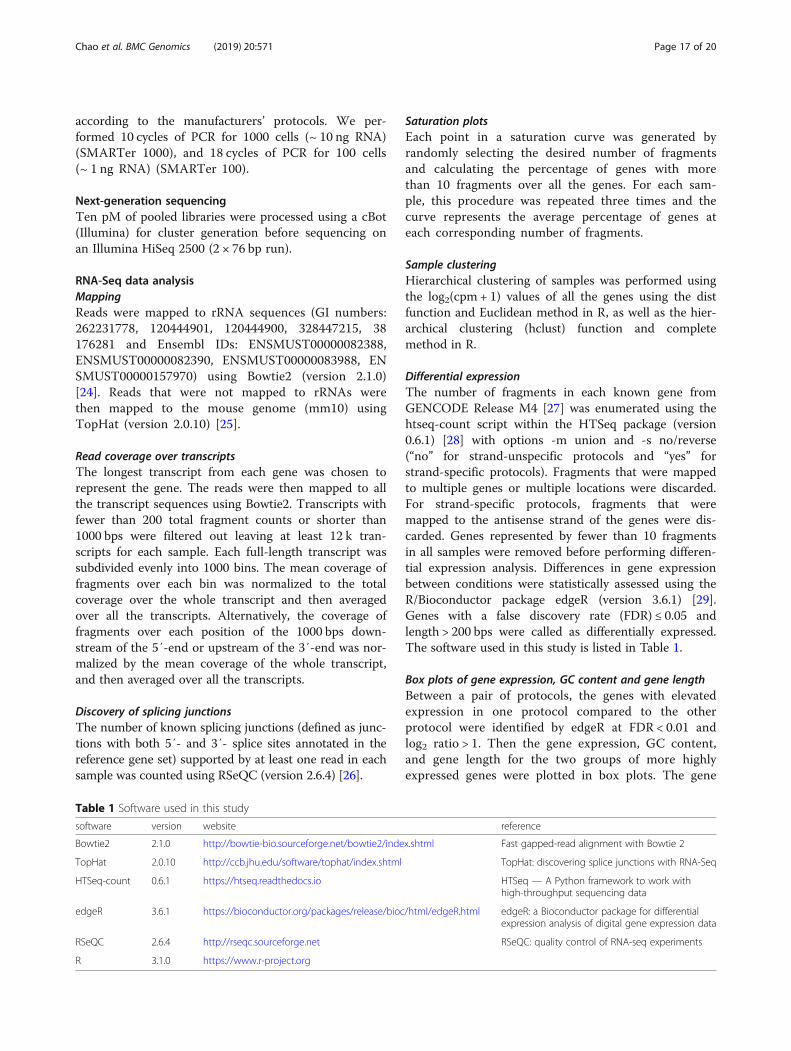
Differential expressionThe number of fragments in each known gene fromGENCODE Release M4 [27] was enumerated using thehtseq-count script within the HTSeq package (version0.6.1) [28] with options -m union and -s no/reverse(“no” for strand-unspecific protocols and “yes” forstrand-specific protocols). Fragments that were mappedto multiple genes or multiple locations were discarded.For strand-specific protocols, fragments that weremapped to the antisense strand of the genes were dis-carded. Genes represented by fewer than 10 fragmentsin all samples were removed before performing differen-tial expression analysis. Differences in gene expressionbetween conditions were statistically assessed using theR/Bioconductor package edgeR (version 3.6.1) [29].Genes with a false discovery rate (FDR) ≤ 0.05 andlength > 200 bps were called as differentially expressed.The software used in this study is listed in Table 1.
Box plots of gene expression, GC content and gene lengthBetween a pair of protocols, the genes with elevatedexpression in one protocol compared to the otherprotocol were identified by edgeR at FDR < 0.01 andlog2 ratio > 1. Then the gene expression, GC content,and gene length for the two groups of more highlyexpressed genes were plotted in box plots. The gene
Table 1 Software used in this study
software version website reference
Bowtie2 2.1.0 http://bowtie-bio.sourceforge.net/bowtie2/index.shtml Fast gapped-read alignment with Bowtie 2
TopHat 2.0.10 http://ccb.jhu.edu/software/tophat/index.shtml TopHat: discovering splice junctions with RNA-Seq
HTSeq-count 0.6.1 https://htseq.readthedocs.io HTSeq — A Python framework to work withhigh-throughput sequencing data
edgeR 3.6.1 https://bioconductor.org/packages/release/bioc/html/edgeR.html edgeR: a Bioconductor package for differentialexpression analysis of digital gene expression data
RSeQC 2.6.4 http://rseqc.sourceforge.net RSeQC: quality control of RNA-seq experiments
R 3.1.0 https://www.r-project.org
Chao et al. BMC Genomics (2019) 20:571 Page 17 of 20
expression is the average FPKM (number of fragmentsper kilobase per million mapped fragments) value ofall the samples used in the evaluation of the standardinput or ultralow input protocols. The longest tran-script representing each gene was used to calculateboth gene GC content and length.
Additional files
Additional file 1: Figure S1. Mapping statistics and read coverage overtranscripts for all the libraries prepared from 100 ng RNA with standardinput protocols prepared. A. The rRNA mapping rate was calculated asthe percentage of fragments that were mappable to rRNA sequences. B.The non-rRNA mapping rate was calculated from all the non-rRNAfragments as the percentage of fragments with both ends or one endmapped to the genome. C. Multiple alignment rates were determinedfrom non-rRNA fragments that were mapped to multiple locations of thegenome. D. Read-bias was assessed using the read coverage overtranscripts. Each transcript was subdivided evenly into 1000 bins and theread coverage was averaged over all the transcripts. (TIF 2856 kb)
Additional file 2: Figure S2. Read coverage near the 5′- (A and C) and3′-end (B and D) of the transcripts. The TruSeq Total RNA and mRNAlibraries shown in A and B were prepared from 1 μg RNA and in C and Dwere prepared from 100 ng RNA. The read coverage over each positionof the 1000 bps downstream of the 5′-end or upstream of the 3′-end wasnormalized to the mean coverage over the whole transcript, and thenaveraged over all the transcripts. (TIF 2833 kb)
Additional file 3: Figure S3. Representation of the transcriptome for allthe libraries prepared from 100 ng RNA with standard input protocols. A.Composition of the uniquely mapped fragments, shown as thepercentage of fragments in exonic, intronic, and intergenic regions.According to the direction of transcription, exonic and intronic regionswere further divided into sense and antisense. B. Saturation analysisshowing the percentage of coding genes recovered (calculated as thegenes with more than 10 fragments) at increasing sequencing depth.C-D. Saturation analysis showing the percentage of lncRNAs recovered(calculated as the lncRNAs with more than 10 fragments) at increasingsequencing depth. In C, the six libraries created using each of threeprotocols (18 libraries total) are plotted individually. In D, the six librariesfrom the same protocol were pooled. E. Saturation analysis showing thenumber of splice junctions recovered at increasing sequencing depth.(TIF 3724 kb)
Additional file 4: Figure S4. Concordance of expression quantificationbetween the libraries prepared from 100 ng RNA with standard inputprotocols. A. Scatter plots in a smoothed color density representation(top-right panel) and Spearman’s rank correlation coefficients (bottom-leftpanel) for all pairs of libraries using log2(cpm + 1) values. B. Unsupervisedclustering of all the libraries using log2(cpm + 1) values. Euclideandistance with complete linkage was used to cluster the libraries. C.Principal component analysis (PCA) of all the libraries, using log2(cpm + 1)values. The values for each gene across all the libraries were centered tozero and scaled to have unit variance before being analyzed. Circles andtriangles represent control and experimental libraries, respectively(NuGEN, red; TruSeq mRNA, green; TrueSeq Total RNA, blue). For allanalyses in Fig. 4, genes represented by fewer than 10 fragments in allthe libraries were excluded. (TIF 7558 kb)
Additional file 5: Figre S5. Concordance of expression quantificationusing standard protocols with additional technical replicates prepared bythe TruSeq Stranded Total RNA and mRNA protocols. A. Unsupervisedclustering of all the libraries using log2(cpm + 1) values. Euclideandistance with complete linkage was used to cluster the libraries. B.Principal component analysis (PCA) for all libraries using log2(cpm + 1)values. Blue, green and red dots represent libraries prepared using theTruSeq Stranded Total RNA, TruSeq Stranded mRNA, and NuGenprotocols, respectively. The darker colors represent the original librariespresented in this study, and the lighter colors are technical replicates
prepared at different times. Circles and triangles represent control andexperimental libraries, respectively. (TIF 2607 kb)
Additional file 6: Figure S6. Supplementary to Fig. 5. A. Principlecomponent analysis (PCA) for the libraries prepared with the TruSeq TotalRNA (100 ng) and the TruSeq mRNA (100 ng) protocols. B. (Left) Venndiagram showing the number of DEGs recovered using the specifiedprotocols. The modified NuGEN protocol is not included for thecomparison, because one of the libraries prepared with the TruSeq TotalRNA protocol (100 ng) and the TruSeq mRNA protocol (100 ng) used adifferent xenograft tumor from a different mouse. [9] Pairwise scatterplots of log2 ratios between tumor tissues of control and experimentalmice based on DEGs. The black dots represent genes that were called asdifferentially expressed regardless of library preparation method, andcolored dots represent genes that were called as differentially expressedwith only one library preparation method. The Spearman’s rankcorrelation coefficient is shown at the top of the plot. (TIF 1431 kb)
Additional file 7: Figure S7. Box plots of gene expression, GC contentand gene length for the genes with elevated expression estimation inone protocol compared to the other protocol. Top figures are box plotsof gene expression in log2(FPKM+ 1). Middle figures are box plots of GCcontent. Bottom figures are box plots of gene length. Panels A-C are forthe standard input methods. Panels D-F are for the SMARTer Ultra LowRNA Kit. Panel A shows TruSeq mRNA protocol vs. the TruSeq Total RNAprotocol. Panel B shows the TruSeq mRNA protocol vs. the modifiedNuGEN protocol. Panel C shows the NuGEN protocol vs. the TruSeq TotalRNA protocol. Panel D shows the SMARTer Ultra Low RNA Kit 100 cells vs.1000 cells. Panel E shows the TruSeq mRNA protocol vs. the SMARTerultra-low protocol (100 cells). Panel F shows the TruSeq mRNA protocolvs. the SMARTer protocol (1000 cells). (TIF 2445 kb)
AbbreviationsABRF: Association of Biomolecular Resource Facilities; cpm: Count per millionfragments mapped to exons; DEGs: Differentially expressed genes;ERCC: External RNA Controls Consortium; FDR: False discovery rate;FPKM: Fragments per kilobase per million; GEO: Gene Expression Omnibus;hclust: Hierarchical clustering; hts: High-throughput sequencing;lncRNAs: Long non-coding RNAs; MD Anderson: The University of Texas MDAnderson Cancer Center; mESCs: Mouse embryonic stem cells; NGS: Next-generation sequencing; PCA: Principal component analysis;qPCR: Quantitative PCR; RNA-Seq: Ribonucleic acid sequencing;rRNA: Ribosomal RNA
AcknowledgementsWe thank Dr. Briana Dennehey for editorial assistance, Dr. Sharon Dent andSara Gaddis for their critical reading of the manuscript, and Joi Holcomb forher help with the preparation of the figures. For the work conducted at TheUniversity of Texas MD Anderson Cancer Center (MD Anderson) - SciencePark, we thank the Research Animal Support Facility for animal maintenanceand care (NIH P30 CA16672).
Authors’ contributionsH-PC, YL, and JS conceived the project, designed experiments, interpreteddata and wrote the manuscript; H-PC and YL conducted most bioinformaticsanalyses; KL helped with bioinformatics analyses; YPC, YT, MW, and MSS per-formedsequencing experiments; JER and CDM performed animal experiments; SMF,TC, and DGT helped with data interpretation; YT, JSK, MSS, and DGT helpedwith writing the manuscript. All authors read and approved the manuscript.
FundingThis project was supported by Cancer Prevention and Research Institute ofTexas (CPRIT) Core Facility Support Awards (RP120348 and RP170002) to J.S.and NIH (1R01AI1214030A1) to T.C. The funding agency had no role in thedesign, collection, analysis, interpretation and the writing of the manuscript.
Availability of data and materialsThe raw dataset for the ultralow protocol has been deposited in GEO andcan be accessed by the accession number GSE131398. The other datasets forthe standard input protocols are still being analyzed for a manuscript inpreparation. They will be deposited and made available at GEO after the
Chao et al. BMC Genomics (2019) 20:571 Page 18 of 20

manuscript is submitted. Until then, the datasets are available from thecorresponding author on reasonable request.
Ethics approval and consent to participateThe use of mice in this project has been reviewed and approved by the MDAnderson IACUC committee (ACUF 04–89-07138, S. Fischer) and (ACUFMODIFICATION 00001124-RN01, T. Chen).
Consent for publicationNot applicable.
Competing interestsThe authors declare that they have no competing interests.
Author details1Department of Epigenetics and Molecular Carcinogenesis, The University ofTexas MD Anderson Cancer Center, Science Park, Smithville, TX 78957, USA.2Program in Genetics and Epigenetics, The University of Texas MD AndersonCancer Center UTHealth Graduate School of Biomedical Sciences, TheUniversity of Texas MD Anderson Cancer Center, Smithville, TX 78957, USA.3Department of Pharmacology and Therapeutics, Roswell Park CancerInstitute, Buffalo, NY 14263, USA.
Received: 14 September 2018 Accepted: 2 July 2019
References1. Margulies M, Egholm M, Altman WE, Attiya S, Bader JS, Bemben LA, et al.
Genome sequencing in microfabricated high-density picolitre reactors.Nature. 2005;437(7057):376–80. https://doi.org/10.1038/nature03959 PubMedPMID: 16056220; PubMed Central PMCID: PMC1464427.
2. Mardis ER. Next-generation DNA sequencing methods. Annu Rev GenomicsHum Genet. 2008;9:387–402. https://doi.org/10.1146/annurev.genom.9.081307.164359 PubMed PMID: 18576944.
3. Mortazavi A, Williams BA, McCue K, Schaeffer L, Wold B. Mapping andquantifying mammalian transcriptomes by RNA-Seq. Nat Methods. 2008;5(7):621–8. https://doi.org/10.1038/nmeth.1226 PubMed PMID: 18516045.
4. Nagalakshmi U, Wang Z, Waern K, Shou C, Raha D, Gerstein M, et al. Thetranscriptional landscape of the yeast genome defined by RNA sequencing.Science. 2008;320(5881):1344–9. https://doi.org/10.1126/science.1158441PubMed PMID: 18451266; PubMed Central PMCID: PMC2951732.
5. Lister R, O'Malley RC, Tonti-Filippini J, Gregory BD, Berry CC, Millar AH, et al.Highly integrated single-base resolution maps of the epigenome inArabidopsis. Cell. 2008;133(3):523–36. https://doi.org/10.1016/j.cell.2008.03.029PubMed PMID: 18423832; PubMed Central PMCID: PMC2723732.
6. Barrett T, Wilhite SE, Ledoux P, Evangelista C, Kim IF, Tomashevsky M, et al.NCBI GEO: archive for functional genomics data sets--update. Nucleic acidsresearch. 2013;41(Database issue):D991–D995. https://doi.org/10.1093/nar/gks1193. PubMed PMID: 23193258; PubMed Central PMCID: PMC3531084.
7. Oliver HF, Orsi RH, Ponnala L, Keich U, Wang W, Sun Q, et al. DeepRNA sequencing of L. monocytogenes reveals overlapping andextensive stationary phase and sigma B-dependent transcriptomes,including multiple highly transcribed noncoding RNAs. BMC Genomics.2009;10:641. https://doi.org/10.1186/1471-2164-10-641 PubMed PMID:20042087; PubMed Central PMCID: PMC2813243.
8. Consortium SM-I. A comprehensive assessment of RNA-seq accuracy,reproducibility and information content by the sequencing quality controlconsortium. Nat Biotechnol. 2014;32(9):903–14. https://doi.org/10.1038/nbt.2957PubMed PMID: 25150838; PubMed Central PMCID: PMC4321899.
9. Li S, Tighe SW, Nicolet CM, Grove D, Levy S, Farmerie W, et al. Multi-platform assessment of transcriptome profiling using RNA-seq in the ABRFnext-generation sequencing study. Nat Biotechnol. 2014;32(9):915–25.https://doi.org/10.1038/nbt.2972 PubMed PMID: 25150835; PubMed CentralPMCID: PMC4167418.
10. Schuierer S, Carbone W, Knehr J, Petitjean V, Fernandez A, Sultan M, et al. Acomprehensive assessment of RNA-seq protocols for degraded and low-quantity samples. BMC Genomics. 2017;18(1):442. https://doi.org/10.1186/s12864-017-3827-y PubMed PMID: 28583074; PubMed Central PMCID:PMCPMC5460543.
11. Zhao S, Zhang Y, Gamini R, Zhang B, von Schack D. Evaluation of two mainRNA-seq approaches for gene quantification in clinical RNA sequencing:
polyA+ selection versus rRNA depletion. Sci Rep. 2018;8(1):4781. https://doi.org/10.1038/s41598-018-23226-4 PubMed PMID: 29556074; PubMed CentralPMCID: PMC5859127.
12. Adiconis X, Borges-Rivera D, Satija R, DeLuca DS, Busby MA, Berlin AM, et al.Comparative analysis of RNA sequencing methods for degraded or low-inputsamples. Nat Methods. 2013;10(7):623–9. https://doi.org/10.1038/nmeth.2483PubMed PMID: 23685885; PubMed Central PMCID: PMC3821180.
13. Shanker S, Paulson A, Edenberg HJ, Peak A, Perera A, Alekseyev YO, et al.Evaluation of commercially available RNA amplification kits for RNAsequencing using very low input amounts of total RNA. J Biomol Tech.2015;26(1):4–18. https://doi.org/10.7171/jbt.15-2601-001 PubMed PMID:25649271; PubMed Central PMCID: PMC4310221.
14. Wu AR, Neff NF, Kalisky T, Dalerba P, Treutlein B, Rothenberg ME, et al.Quantitative assessment of single-cell RNA-sequencing methods. NatMethods. 2014;11(1):41–6. https://doi.org/10.1038/nmeth.2694 PubMedPMID: 24141493; PubMed Central PMCID: PMC4022966.
15. Ziegenhain C, Vieth B, Parekh S, Reinius B, Guillaumet-Adkins A, Smets M, etal. Comparative analysis of single-cell RNA sequencing methods. Mol Cell.2017;65(4):631–43 e4. https://doi.org/10.1016/j.molcel.2017.01.023 PubMedPMID: 28212749.
16. Roy B, Haupt LM, Griffiths LR. Review: alternative splicing (AS) of genes asan approach for generating protein complexity. Current genomics. 2013;14(3):182–94. https://doi.org/10.2174/1389202911314030004 PubMed PMID:24179441; PubMed Central PMCID: PMC3664468.
17. O'Neil D, Glowatz H, Schlumpberger M. Ribosomal RNA depletion forefficient use of RNA-seq capacity. Current protocols in molecular biology.2013;Chapter 4:Unit 4 19. https://doi.org/10.1002/0471142727.mb0419s103.PubMed PMID: 23821444.
18. Sun Z, Asmann YW, Nair A, Zhang Y, Wang L, Kalari KR, et al. Impact oflibrary preparation on downstream analysis and interpretation of RNA-Seqdata: comparison between Illumina PolyA and NuGEN ovation protocol.PLoS One. 2013;8(8):e71745. https://doi.org/10.1371/journal.pone.0071745PubMed PMID: 23977132; PubMed Central PMCID: PMCPMC3747248.
19. Alberti A, Belser C, Engelen S, Bertrand L, Orvain C, Brinas L, et al.Comparison of library preparation methods reveals their impact oninterpretation of metatranscriptomic data. BMC Genomics. 2014;15:912.https://doi.org/10.1186/1471-2164-15-912 PubMed PMID: 25331572;PubMed Central PMCID: PMC4213505.
20. Munro SA, Lund SP, Pine PS, Binder H, Clevert DA, Conesa A, et al. Assessingtechnical performance in differential gene expression experiments withexternal spike-in RNA control ratio mixtures. Nat Commun. 2014;5:5125.https://doi.org/10.1038/ncomms6125 PubMed PMID: 25254650.
21. Sims D, Sudbery I, Ilott NE, Heger A, Ponting CP. Sequencing depth andcoverage: key considerations in genomic analyses. Nat Rev Genet. 2014;15(2):121–32. https://doi.org/10.1038/nrg3642 PubMed PMID: 24434847.
22. Corbett TH, Roberts BJ, Leopold WR, Peckham JC, Wilkoff LJ, Griswold DP Jr,et al. Induction and chemotherapeutic response of two transplantableductal adenocarcinomas of the pancreas in C57BL/6 mice. Cancer Res. 1984;44(2):717–26 Epub 1984/02/01. PubMed PMID: 6692374.
23. Lashinger LM, Malone LM, McArthur MJ, Goldberg JA, Daniels EA, Pavone A,et al. Genetic reduction of insulin-like growth factor-1 mimics the anticancereffects of calorie restriction on cyclooxygenase-2-driven pancreaticneoplasia. Cancer Prev Res (Phila) 2011;4(7):1030–40. Epub 2011/05/20.https://doi.org/10.1158/1940-6207.CAPR-11-0027. PubMed PMID: 21593196;PubMed Central PMCID: PMC3131443.
24. Langmead B, Salzberg SL. Fast gapped-read alignment with bowtie 2. NatMethods. 2012;9(4):357–9. https://doi.org/10.1038/nmeth.1923 PubMedPMID: 22388286; PubMed Central PMCID: PMC3322381.
25. Trapnell C, Pachter L, Salzberg SL. TopHat: discovering splice junctions withRNA-Seq. Bioinformatics. 2009;25(9):1105–11. https://doi.org/10.1093/bioinformatics/btp120 PubMed PMID: 19289445; PubMed Central PMCID:PMC2672628.
26. Wang L, Wang S, Li W. RSeQC: quality control of RNA-seq experiments.Bioinformatics. 2012;28(16):2184–5. https://doi.org/10.1093/bioinformatics/bts356 PubMed PMID: 22743226.
27. Harrow J, Denoeud F, Frankish A, Reymond A, Chen CK, Chrast J, et al.GENCODE: producing a reference annotation for ENCODE. Genome Biol.2006;7(Suppl 1):S4 1–9. https://doi.org/10.1186/gb-2006-7-s1-s4 PubMedPMID: 16925838; PubMed Central PMCID: PMC1810553.
28. Anders S, Pyl PT, Huber W. HTSeq--a Python framework to work withhigh-throughput sequencing data. Bioinformatics. 2015;31(2):166–9.
Chao et al. BMC Genomics (2019) 20:571 Page 19 of 20
https://doi.org/10.1093/bioinformatics/btu638 PubMed PMID: 25260700;PubMed Central PMCID: PMC4287950.
29. Robinson MD, McCarthy DJ, Smyth GK. edgeR: a Bioconductor package fordifferential expression analysis of digital gene expression data. Bioinformatics.2010;26(1):139–40. https://doi.org/10.1093/bioinformatics/btp616 PubMedPMID: 19910308; PubMed Central PMCID: PMC2796818.
Publisher’s NoteSpringer Nature remains neutral with regard to jurisdictional claims inpublished maps and institutional affiliations.
Chao et al. BMC Genomics (2019) 20:571 Page 20 of 20