system sciences radar analysis of the life cycle of ... · radar analysis of the life cycle of...
TRANSCRIPT

Natural Hazards and Earth System Sciences, 5, 959–970, 2005SRef-ID: 1684-9981/nhess/2005-5-959European Geosciences Union© 2005 Author(s). This work is licensedunder a Creative Commons License.
Natural Hazardsand Earth
System Sciences
Radar analysis of the life cycle of Mesoscale Convective Systemsduring the 10 June 2000 event
T. Rigo and M. C. Llasat
GAMA Team, Dept. of Astronomy and Meteorology, University of Barcelona, Avda. Diagonal, 647, 08028 Barcelona, Spain
Received: 1 April 2005 – Revised: 1 August 2005 – Accepted: 1 September 2005 – Published: 1 December 2005
Part of Special Issue “HYDROPTIMET”
Abstract. The 10 June 2000 event was the largest flash floodevent that occurred in the Northeast of Spain in the late 20thcentury, both as regards its meteorological features and itsconsiderable social impact. This paper focuses on analysisof the structures that produced the heavy rainfalls, especiallyfrom the point of view of meteorological radar. Due to thefact that this case is a good example of a Mediterranean flashflood event, a final objective of this paper is to undertakea description of the evolution of the rainfall structure thatwould be sufficiently clear to be understood at an interdisci-plinary forum. Then, it could be useful not only to improveconceptual meteorological models, but also for application indownscaling models. The main precipitation structure was aMesoscale Convective System (MCS) that crossed the regionand that developed as a consequence of the merging of twoprevious squall lines. The paper analyses the main meteo-rological features that led to the development and triggeringof the heavy rainfalls, with special emphasis on the featuresof this MCS, its life cycle and its dynamic features. To thisend, 2-D and 3-D algorithms were applied to the imageryrecorded over the complete life cycle of the structures, whichlasted approximately 18 h. Mesoscale and synoptic infor-mation were also considered. Results show that it was anNS-MCS, quasi-stationary during its stage of maturity as aconsequence of the formation of a convective train, the dif-ferent displacement directions of the 2-D structures and the3-D structures, including the propagation of new cells, andthe slow movement of the convergence line associated withthe Mediterranean mesoscale low.
1 Introduction
During the dawn of 10 June 2000 there occurred a heavyrainfall over Catalonia (NE Spain, Fig. 1) that caused se-rious damage due to rainfall, floods, landslides and debris
Correspondence to:T. Rigo([email protected])
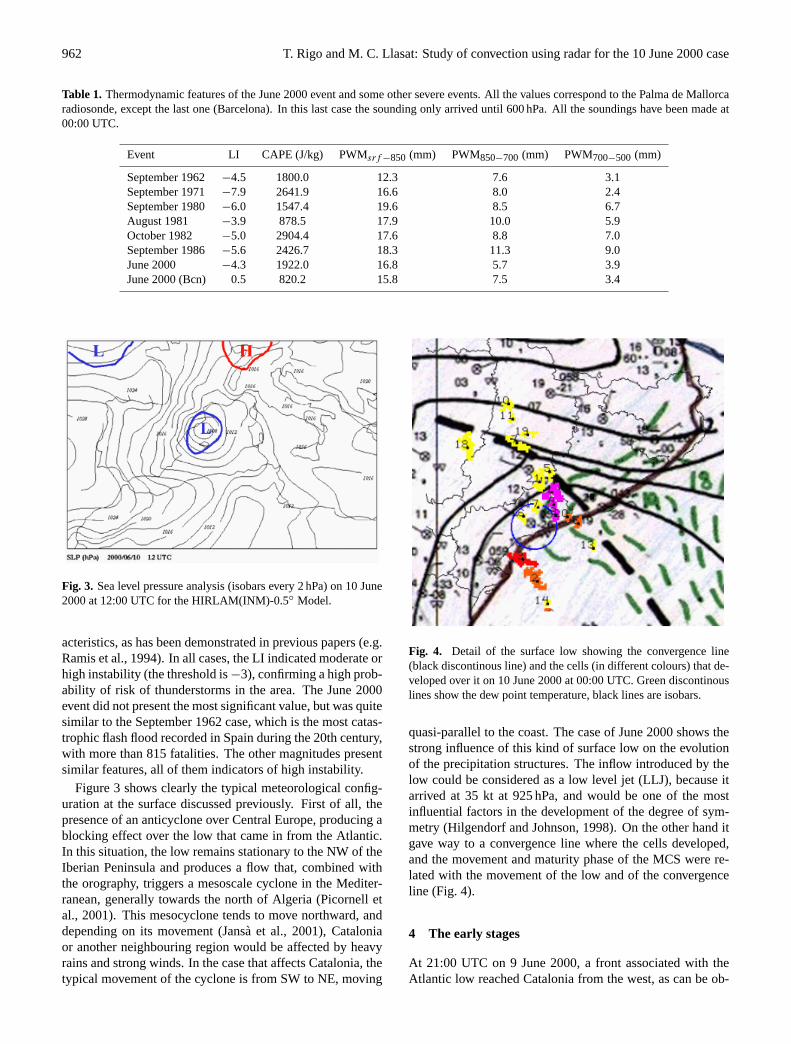
flows. The episode caused material damage estimated atover 65 000 000 EUR, and there were five fatalities. Tak-ing into account the accumulated rainfall, the affected areaand the damage produced, it can be classified as a catas-trophic flood episode (Llasat and Puigcerver, 1994). Themost marked hydrometeorological feature was the consider-able intensity of sustained precipitation, with accumulatedhourly quantities of over 100 mm. The maximum accumu-lated rainfall between 21:00 UTC 9 June and 21:00 UTC 10June was 224 mm (Fig. 2), of which more than 200 mm wererecorded in less than 6 h. A more detailed evolution of therainfall at surface is shown in Llasat et al. (2003). This caseis considered to be the most important heavy rainfall eventarising in spring in the region during the 20th century, al-though other such spring events have been recorded in theprevious centuries (Llasat et al., 2003). It is a good exam-ple of a Mediterranean flash flood, and for this reason it hasbeen proposed as a case for study within the framework ofvarious national and international projects, as is the case ofthe European project HYDROPTIMET. Although some pa-pers devoted to this case have already been published (Sem-pere Torres et al., 2000; Llasat et al., 2001, 2003; Lopez andAran, 2005), this is the only one devoted to analysis of thedynamic of the rainfall structures, with special emphasis ontheir internal structure and life cycle. Knowledge of it couldhelp to improve both the nowcasting of future events and thedownscaling process applied to the hydrological models.
With this aim, the observations made by the meteorologi-cal radar located in the affected region were used. The radarimagery allows identification of the main precipitation struc-tures, such as mesoscale convective systems, MCS. Fromthe meteorological radar point of view, Houze’s definitionof MCS (1993) is generally accepted, describing an MCS asa precipitation structure that contains convective and strati-form precipitation regions at some stage of its life and hasa major axis with a length equal to or exceeding 100 km for3 h or more. Rigo and Llasat (2004) proposed that a mini-mum of 30% of the area covered by the MCS in each imageshould be associated with convective rainfall. This condition
960 T. Rigo and M. C. Llasat: Study of convection using radar for the 10 June 2000 case
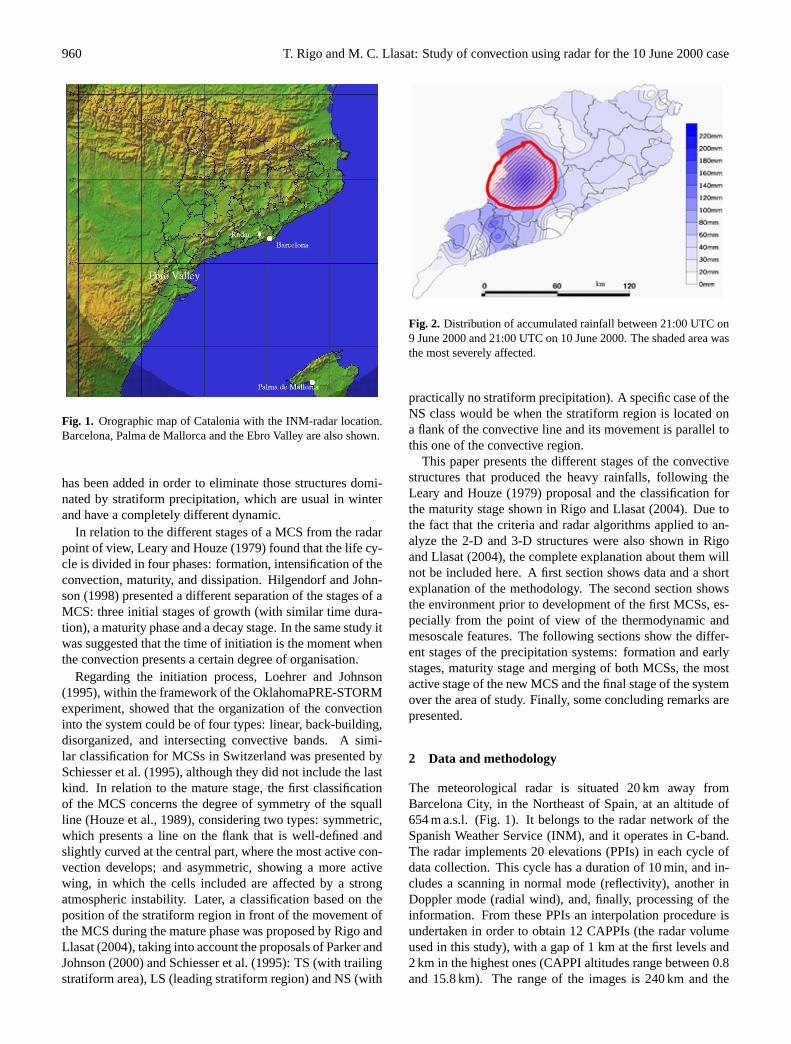
Fig. 1. Orographic map of Catalonia with the INM-radar location.Barcelona, Palma de Mallorca and the Ebro Valley are also shown.
has been added in order to eliminate those structures domi-nated by stratiform precipitation, which are usual in winterand have a completely different dynamic.
In relation to the different stages of a MCS from the radarpoint of view, Leary and Houze (1979) found that the life cy-cle is divided in four phases: formation, intensification of theconvection, maturity, and dissipation. Hilgendorf and John-son (1998) presented a different separation of the stages of aMCS: three initial stages of growth (with similar time dura-tion), a maturity phase and a decay stage. In the same study itwas suggested that the time of initiation is the moment whenthe convection presents a certain degree of organisation.
Regarding the initiation process, Loehrer and Johnson(1995), within the framework of the OklahomaPRE-STORMexperiment, showed that the organization of the convectioninto the system could be of four types: linear, back-building,disorganized, and intersecting convective bands. A simi-lar classification for MCSs in Switzerland was presented bySchiesser et al. (1995), although they did not include the lastkind. In relation to the mature stage, the first classificationof the MCS concerns the degree of symmetry of the squallline (Houze et al., 1989), considering two types: symmetric,which presents a line on the flank that is well-defined andslightly curved at the central part, where the most active con-vection develops; and asymmetric, showing a more activewing, in which the cells included are affected by a strongatmospheric instability. Later, a classification based on theposition of the stratiform region in front of the movement ofthe MCS during the mature phase was proposed by Rigo andLlasat (2004), taking into account the proposals of Parker andJohnson (2000) and Schiesser et al. (1995): TS (with trailingstratiform area), LS (leading stratiform region) and NS (with
Fig. 2. Distribution of accumulated rainfall between 21:00 UTC on9 June 2000 and 21:00 UTC on 10 June 2000. The shaded area wasthe most severely affected.
practically no stratiform precipitation). A specific case of theNS class would be when the stratiform region is located ona flank of the convective line and its movement is parallel tothis one of the convective region.
This paper presents the different stages of the convectivestructures that produced the heavy rainfalls, following theLeary and Houze (1979) proposal and the classification forthe maturity stage shown in Rigo and Llasat (2004). Due tothe fact that the criteria and radar algorithms applied to an-alyze the 2-D and 3-D structures were also shown in Rigoand Llasat (2004), the complete explanation about them willnot be included here. A first section shows data and a shortexplanation of the methodology. The second section showsthe environment prior to development of the first MCSs, es-pecially from the point of view of the thermodynamic andmesoscale features. The following sections show the differ-ent stages of the precipitation systems: formation and earlystages, maturity stage and merging of both MCSs, the mostactive stage of the new MCS and the final stage of the systemover the area of study. Finally, some concluding remarks arepresented.
2 Data and methodology
The meteorological radar is situated 20 km away fromBarcelona City, in the Northeast of Spain, at an altitude of654 m a.s.l. (Fig. 1). It belongs to the radar network of theSpanish Weather Service (INM), and it operates in C-band.The radar implements 20 elevations (PPIs) in each cycle ofdata collection. This cycle has a duration of 10 min, and in-cludes a scanning in normal mode (reflectivity), another inDoppler mode (radial wind), and, finally, processing of theinformation. From these PPIs an interpolation procedure isundertaken in order to obtain 12 CAPPIs (the radar volumeused in this study), with a gap of 1 km at the first levels and2 km in the highest ones (CAPPI altitudes range between 0.8and 15.8 km). The range of the images is 240 km and the

T. Rigo and M. C. Llasat: Study of convection using radar for the 10 June 2000 case 961
pixel size is 2×2 km2. The procedure applied to deal withthe present study is based on application of specific algo-rithms that allow a distinction to be made between pixels as-sociated with convective or stratiform precipitation. Imageswere slightly corrected previously by the INM and the mainground echoes were eliminated using a ground clutter maskcreated previously (Sanchez-Diezma, 2001). Next, a proce-dure was applied in order to convert the polar coordinates ofthe raw images to Cartesian coordinates. Once this conver-sion had been made, a 2-D procedure was applied to the low-est PPI to distinguish between pixels associated with convec-tive or stratiform precipitation. The 2-D process (Rigo, 2004;Rigo and Llasat, 2004) is an adaptation of the SHY algorithm(Steiner et al., 1995) to identify convective pixels. It takesaccount of three requirements, and one pixel is considered“convective” if it verifies at least one of them. Firstly, the43 dBZ reflectivity threshold should be surpassed by somecontiguous pixels in order to have a minimum size for the“convective” pixel, with a radius of 10 km. Secondly, a pixelthat does not exceed the “convective” threshold is labelled as“convective” if the difference between its value and a meanvalue of its background exceeds a considered function, whichdepends on the background reflectivity and the radar charac-teristics. The third requirement considers that if there aresome “convective” pixels adjacent to the analysed pixel, thelatter could be considered as “convective”. Once the threerequirements had been applied to all the pixels, those thatdid not verify any of them but that had a reflectivity above18 dBZ were classified as “stratiform”. Those pixels with re-flectivity below 18 dBZ had been considered as “drizzle” or“no-precipitation”. The last feature to validate the appropri-ateness of the selected convective region uses the entire radarvolume and considers the vertical gradient of the reflectivity,following the proposal of Biggerstaff and Listemaa (2000).The objective is to re-classify those pixels associated withthe bright band as stratiform ones. Only precipitation struc-tures of more than 32 km2 are considered.
The 3-D procedure was applied taking account of the fol-lowing aspects (Johnson et al., 1998; Rigo, 2004). Firstly,it aims to select in each level those pixels (labelled as “con-vective”) that exceed one of the various reflectivity thresh-olds (30, 35, 40, 45, 50, 55 and 60 dBZ), in order to find thecell’s core. Then, for each region with “convective cores”,the method selects the zones that have the same reflectivityvalue as the core for 6 pixels or more, that is 24 km2. Ifthere are fewer than 6 pixels for a reflectivity threshold, themethod automatically selects the next reflectivity value. Thepixels that do not reach the core threshold cannot be consid-ered as a part of the “convective core”. Finally, if the cell hasbeen detected in more than one level, the algorithm takes it asa valid convective cell. If a gap of one level exists, the algo-rithm considers the two nearest cells in the vertical as beingthe same.
The pluviometric data were obtained from the AutomaticSystem of Hydrologic Information (SAIH) of the CatalanWater Agency (Agencia Catalana de l’Aigua). Besides otherhydrological sensors, this network comprises 126 tipping-
bucket automatic raingauges for rainfall exceeding 0.1 mm.The precipitation is accumulated and registered every 5 min.The information is stored in hourly files, which include thecode of the station, the date, a validation code, and the 5-minutal rain rate registered. Charts for each 10-min periodwere obtained using a krigging method.
3 Meteorological environment and pre-storm stage
As the complete synoptic description of the event is shownin Llasat et al. (2003), and in other contributions to this is-sue connected with the EU Project Hydroptimet, only themost significant features for understanding the evolution ofthe MCS will be commented upon here. Before the devel-opment of the two MCSs, which occurred at 22:00 UTC on9 June 2000, the synoptic and mesoscale environments werethe ones common to the heavy rainfall events that usually af-fect Catalonia (Ramis et al., 1994; Llasat et al., 1996). Ofthose characteristics, the following may be noted: the exis-tence of an anticyclone over Central Europe that affected theMediterranean region, and the presence of a trough over thecentre of the Iberian Peninsula; very wet and warm advectionat low levels from the Southeast with high values of Con-vective Available Potential Energy (CAPE) and PrecipitableWater Mass (PWM) at all levels; considerable instability re-vealed by the Lifted Index (LI); and, finally, the usual pres-ence of a Mediterranean mesoscale cyclone to the Southeastof Catalonia (Jansa et al., 1996; Rigo and Llasat, 2003).
The best-known events have been registered in late sum-mer or, especially, in autumn, when the atmospheric condi-tions are more favourable to the occurrence of heavy rains inCatalonia (Llasat et al., 2000; Jansa, 1997). The case anal-ysed here occurred in spring and differed from the autumncases mainly by the presence of cold air in the middle tro-posphere, which is not necessary for the autumn events. Al-though spring is not the usual season for extreme heavy rain-falls in Catalonia, some results obtained from the historicalclimatology records show that at least one spring catastrophicevent has been recorded every century, as was the case of thecatastrophic event of May 1853 (Llasat et al., 2003).
Besides this June case, the most important floods recordedin Catalonia in the last 60 years were the events of 25September 1962, 20–23 September 1971, 6–8 November1982 and 2–5 October 1987 (Llasat, 1987, 1990, 1991;Ramis et al., 1994). Table 1 shows a comparison of the ther-modynamic features of the June 2000 event and some othersevere events. In particular, it shows the minimum value ofthe LI, the maximum value of the CAPE, and the Precip-itable Water Mass (PWM) between different levels: surface-850 hPa, 850 hPa–700 hPa and 700 hPa–500 hPa. The ob-tained values are for the Palma de Mallorca sounding (sit-uated 200 km to the Southeast of Catalonia), due to the factthat the Barcelona sounding started in 1997 and during the9 and 10 June 2000 the strong winds over Barcelona pre-vented radiosounding launching. In spite of the distance, themagnitudes are quite representative of the atmospheric char-
962 T. Rigo and M. C. Llasat: Study of convection using radar for the 10 June 2000 case
Table 1. Thermodynamic features of the June 2000 event and some other severe events. All the values correspond to the Palma de Mallorcaradiosonde, except the last one (Barcelona). In this last case the sounding only arrived until 600 hPa. All the soundings have been made at00:00 UTC.
Event LI CAPE (J/kg) PWMsrf −850 (mm) PWM850−700 (mm) PWM700−500 (mm)
September 1962 −4.5 1800.0 12.3 7.6 3.1September 1971 −7.9 2641.9 16.6 8.0 2.4September 1980 −6.0 1547.4 19.6 8.5 6.7August 1981 −3.9 878.5 17.9 10.0 5.9October 1982 −5.0 2904.4 17.6 8.8 7.0September 1986 −5.6 2426.7 18.3 11.3 9.0June 2000 −4.3 1922.0 16.8 5.7 3.9June 2000 (Bcn) 0.5 820.2 15.8 7.5 3.4
Fig. 3. Sea level pressure analysis (isobars every 2 hPa) on 10 June2000 at 12:00 UTC for the HIRLAM(INM)-0.5◦ Model.
acteristics, as has been demonstrated in previous papers (e.g.Ramis et al., 1994). In all cases, the LI indicated moderate orhigh instability (the threshold is−3), confirming a high prob-ability of risk of thunderstorms in the area. The June 2000event did not present the most significant value, but was quitesimilar to the September 1962 case, which is the most catas-trophic flash flood recorded in Spain during the 20th century,with more than 815 fatalities. The other magnitudes presentsimilar features, all of them indicators of high instability.
Figure 3 shows clearly the typical meteorological config-uration at the surface discussed previously. First of all, thepresence of an anticyclone over Central Europe, producing ablocking effect over the low that came in from the Atlantic.In this situation, the low remains stationary to the NW of theIberian Peninsula and produces a flow that, combined withthe orography, triggers a mesoscale cyclone in the Mediter-ranean, generally towards the north of Algeria (Picornell etal., 2001). This mesocyclone tends to move northward, anddepending on its movement (Jansa et al., 2001), Cataloniaor another neighbouring region would be affected by heavyrains and strong winds. In the case that affects Catalonia, thetypical movement of the cyclone is from SW to NE, moving
Fig. 4. Detail of the surface low showing the convergence line(black discontinous line) and the cells (in different colours) that de-veloped over it on 10 June 2000 at 00:00 UTC. Green discontinouslines show the dew point temperature, black lines are isobars.
quasi-parallel to the coast. The case of June 2000 shows thestrong influence of this kind of surface low on the evolutionof the precipitation structures. The inflow introduced by thelow could be considered as a low level jet (LLJ), because itarrived at 35 kt at 925 hPa, and would be one of the mostinfluential factors in the development of the degree of sym-metry (Hilgendorf and Johnson, 1998). On the other hand itgave way to a convergence line where the cells developed,and the movement and maturity phase of the MCS were re-lated with the movement of the low and of the convergenceline (Fig. 4).
4 The early stages
At 21:00 UTC on 9 June 2000, a front associated with theAtlantic low reached Catalonia from the west, as can be ob-

T. Rigo and M. C. Llasat: Study of convection using radar for the 10 June 2000 case 963
Fig. 5. Echotop20 at 21:00 UTC on 9 June 2000.
Fig. 6. Zmax at 22:00 UTC on 9 June 2000. The rectangle showsthe area presented in Fig. 7.
served in the Echotop20 (the maximum altitude where the20 dBZ threshold is exceeded) image (Fig. 5). In this fig-ure it is possible to appreciate the moderate vertical devel-opments (close to 11 km) of the reflectivity echoes includedin the frontal band. The adjective “moderate” has been usedin comparison with the high Echotop20 values achieved overthe mature phases leading to the event, but it would be anextraordinary value compared with the typical ones achievedin a frontal band (Echotop20 normal values do not exceedusually 6 or 7 km). The maximum values of the Echotop20(11.3 km), and also of the reflectivity (50 dBZ), were regis-tered at the Southern part of Catalonia. In this area, the warmand moist flow coming from the Mediterranean reached in-land through the Ebro Valley (Fig. 1). By 22:00 UTC twoMCS had already developed. One MCS (MCS-2 in Fig. 6)formed over the frontal region. At the same time, another
(a)
(b)
Fig. 7. Vertical section at 22:00 UTC on 9 June 2000(b) of the linemarked in the CAPPI image at 1 km(a).
MCS (MCS-1 in Fig. 6) had developed over a convergenceline formed approximately 30 km to the NE of the MCS-2.This line was due to the convergence of two different airmasses: the first one (moist and warm) was advected by themesoscalar depression (meso-α) at the surface, and the sec-ond one, colder than the first, arrived from the North and wasassociated with the anticyclone situated in Central Europe(Fig. 3).
Using the criteria of Hilgendorf and Johnson (1998), itseems reasonable to fix the initial time of these MCS at22:00 UTC. At that moment, the degree of organisation ofboth squall lines was considerable (Fig. 6). The analysis ofsurface data (not shown) confirmed the presence of a pool ofprecipitation-cooled air behind both MCS, where new up-drafts developed. This fact confirmed that the two MCScould be considered as squall lines (Doswell et al., 1996).This development stage presented a predominant and in-creasing convective area and a rear, little-developed strati-form precipitation region (Figs. 6 and 7), related with thedisappearance of the frontal structure. The most active con-vective cells were situated over or near the MediterraneanSea, which fed them with warm, moist air. This fact alsohelped to increase the life cycle of the cells, which attained2 h in many cases, a feature that is very unusual in this region(Rigo and Llasat, 2004). In spite of the increased number ofconvective cells and the maximum value of the reflectivity(55 dBZ), the vertical development did not show any growth,maintaining the maximum at 9 km for the Echotop20.

964 T. Rigo and M. C. Llasat: Study of convection using radar for the 10 June 2000 case
Fig. 8. Zmax at 23:00 UTC on 9 June 2000.
In the vertical cross section (perpendicular to the con-vective lines) shown in Fig. 7 it can be observed how themesoscale system presents practically no stratiform area andits vertical development does not exhibit any tilt. These twofacts indicate that the cells are in their development stageand that there scarcely existed vertical shear in the environ-ment in this line direction. However, the vertical cross paral-lel to the MCS-1 (not shown here) shows how the strongestupdrafts had produced small outflow anvils associated witheach cell independently of each other and oriented towardsthe left side of the system. These facts are the result of thestrong wind at upper levels, as well as the moderate verticalshear (Rotunno et al., 1988).
The development stage can be summarised by the presenceof a strong, warm and moist inflow at low levels (LLJ) com-ing from the right hand side of the MCSs (observed from theHIRLAM data model and thermodynamic analysis, not pre-sented here), and favoured by the cyclone and the proximityto the Mediterranean Sea, by the small tilt of the convectivecells, produced by the strong updrafts, and, finally, by thenon-existence of vertical shear in the direction perpendicu-lar to the convective lines, and moderate shear in the paralleldirection, mainly due to the high wind speed at upper levels.
5 Maturity stages of MCS-1 and MCS-2
Both MCSs evolved in a similar way in the hours followingtheir formation. However, by comparing Figs. 6 and 8 it ispossible to observe a clear difference between their move-ments. In the case of MCS-1, the system remained prac-tically anchored in the same position (the distance coveredwas less than 10 km in 1 h), and only its internal organisa-tion evolved towards a more linear one. On the other hand,MCS-2 moved fast and changed its orientation (the squallline passed from the initial N-S to a NNW-SSE direction).This difference between the two MCSs’ movements allowedtheir approach. Beside this, the orientation of the squall lines,
perpendicular to the coast, and the inflow coming from thesea assisted the cells formed into the MCS and developedover the sea to move over land and, in their maturity stage,discharge precipitation in the coastal areas. The repetition ofthis process produced high amounts of rainfall and the firstfloods.
During the time interval between 22:00 UTC and23:00 UTC the vertical development was similar, taking intoaccount the maximum values of Echotop20 (∼11 km). How-ever, if the value considered is the Echotop40 (defined asEchotop20 but for the 40 dBZ threshold, and more closelyrelated to the active convection), the most active cells hadreached the maximum top at 23:00 UTC (approximately8 km, compared with the 7 km recorded 1 h earlier). Besidesthis, the number of echoes with high values of reflectivityincreased, affecting a major region. As noted previously,the organization of the convection of the MCS-1 was prac-tically linear from 23:00 UTC, and it is possible to observein Fig. 9 (00:00 UTC) that it was formed by different cells,which were in different stages of their life cycle. Further-more, due to the intense winds at upper levels, it began toform an anvil outflow at the left of the squall line. At thesame time, the stratiform precipitation had practically disap-peared from the rear part of the most active section of theMCS-1 (Fig. 10). The maturity stages of MCS-1 and MCS-2were achieved by approximately 00:00 UTC on 10 June.
6 Formation of MCS-12 and maximum of convective ac-tivity stage
At 01:00 UTC (Fig. 11), MCS-1 and MCS-2 had al-ready merged into a single structure (hereafter called MCS-12). Then, convective activity growths arose, as the val-ues of reflectivity echoes (58 dBZ) and the vertical devel-opment altitudes (13 km for the Echotop20 and 11 km forthe Echotop40) show. This re-activation of the convectionwas probably due to two factors: the connection betweenthe gust fronts of the previous MCSs, and also the feed-ing of the MCS-12 by the Mediterranean air mass. Besidesthis, the considerable slope between the coast and the Prelit-toral range, 25 km away and with altitudes reaching 1000 m,favoured the development of the convection (Fig. 12). At thatmoment there were many convective cells that were practi-cally aligned over an area nearly 200 km long and orientedfrom NNW to SSE. The development of the convective cellswas practically vertical, without any tilt. Only a small anvilcould be appreciated in the left part of the MCS, practicallyundeveloped in comparison with the image from 1 h earlier.
Once the two systems merged, the new MCS-12 had a veryslow movement. This quasi-stationarity was one of the mostimportant factors favouring the heavy rainfalls responsiblefor the flash-floods, as other authors have proposed (Fritschet al., 1986; Doswell et al., 1996). This effect is associatedwith the movement of the cells drawn into the system. Themovement of an MCS can be divided in two parts (Doswell etal., 1996): displacement (generally associated with the gen-

T. Rigo and M. C. Llasat: Study of convection using radar for the 10 June 2000 case 965
(a)
(b)
Fig. 9. Vertical section parallel to the MCS-1 at 00:00 UTC on 10June 2000(b) of the long line marked in the CAPPI image at 1 km(a).
eral flow at mid or high levels), and propagation (due espe-cially to the movement of the convective cells, more closelylinked with low-level flow). In this stage of the event, theflow at mid levels (south-westerly) and low levels (easterly)
(a)
(b)
Fig. 10. Vertical section perpendicular to the MCS-1 squall line at00:30 UTC on 10 June 2000(b) of the line marked in the CAPPIimage at 1 km(a).
Fig. 11. Echotop20 at 01:00 UTC of 10 June 2000.
was practically perpendicular, and the propagation factor wassizeable enough to suppress the displacement vector of allMCSs. The systems then remained over the same positionfor long periods, and the movement of the cells helped tomaintain high rain rates over those regions for time inter-vals longer than the usual duration. Following the definitionof Doswell (Doswell et al., 1996; Doswell, 1997), this be-haviour was identified as a “convective train” The combina-
966 T. Rigo and M. C. Llasat: Study of convection using radar for the 10 June 2000 case
Fig. 12. Orography of the area (shaded regions), contour of theMCS-12 at 01:00 UTC (lined area) and inflow over the region (blackarrow).
tion of large-scale and mesoscale factors, but also the orog-raphy (which also contributed to the cell movement) was de-cisive.
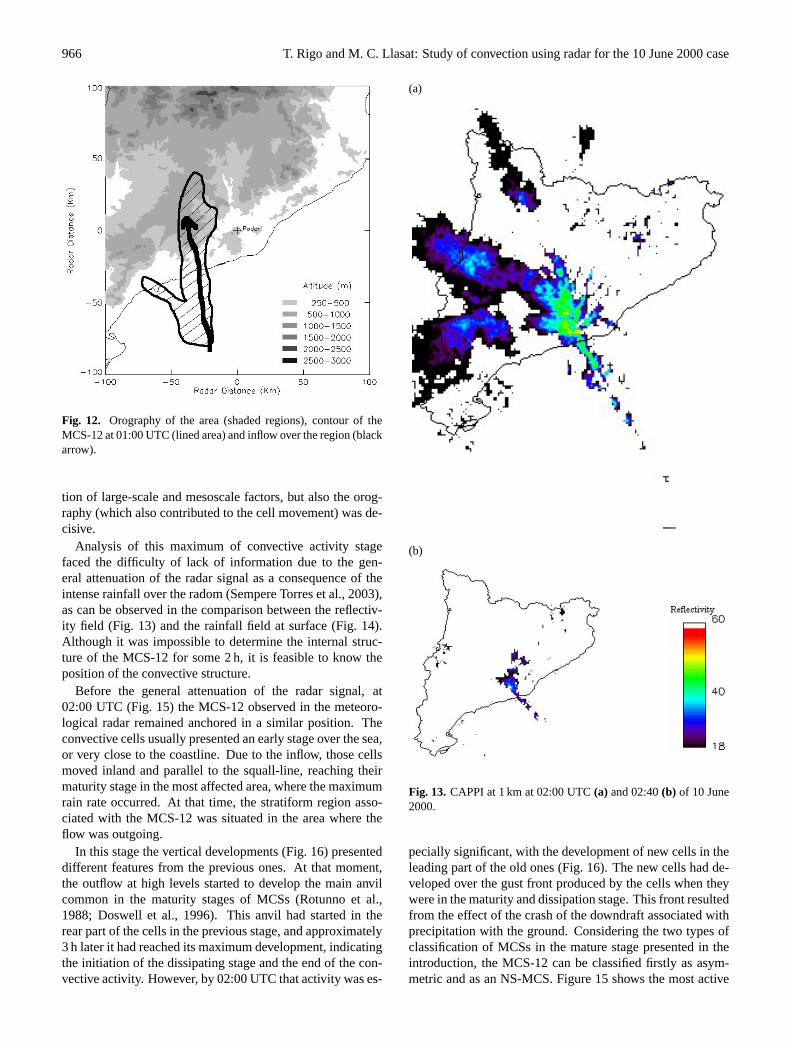
Analysis of this maximum of convective activity stagefaced the difficulty of lack of information due to the gen-eral attenuation of the radar signal as a consequence of theintense rainfall over the radom (Sempere Torres et al., 2003),as can be observed in the comparison between the reflectiv-ity field (Fig. 13) and the rainfall field at surface (Fig. 14).Although it was impossible to determine the internal struc-ture of the MCS-12 for some 2 h, it is feasible to know theposition of the convective structure.
Before the general attenuation of the radar signal, at02:00 UTC (Fig. 15) the MCS-12 observed in the meteoro-logical radar remained anchored in a similar position. Theconvective cells usually presented an early stage over the sea,or very close to the coastline. Due to the inflow, those cellsmoved inland and parallel to the squall-line, reaching theirmaturity stage in the most affected area, where the maximumrain rate occurred. At that time, the stratiform region asso-ciated with the MCS-12 was situated in the area where theflow was outgoing.
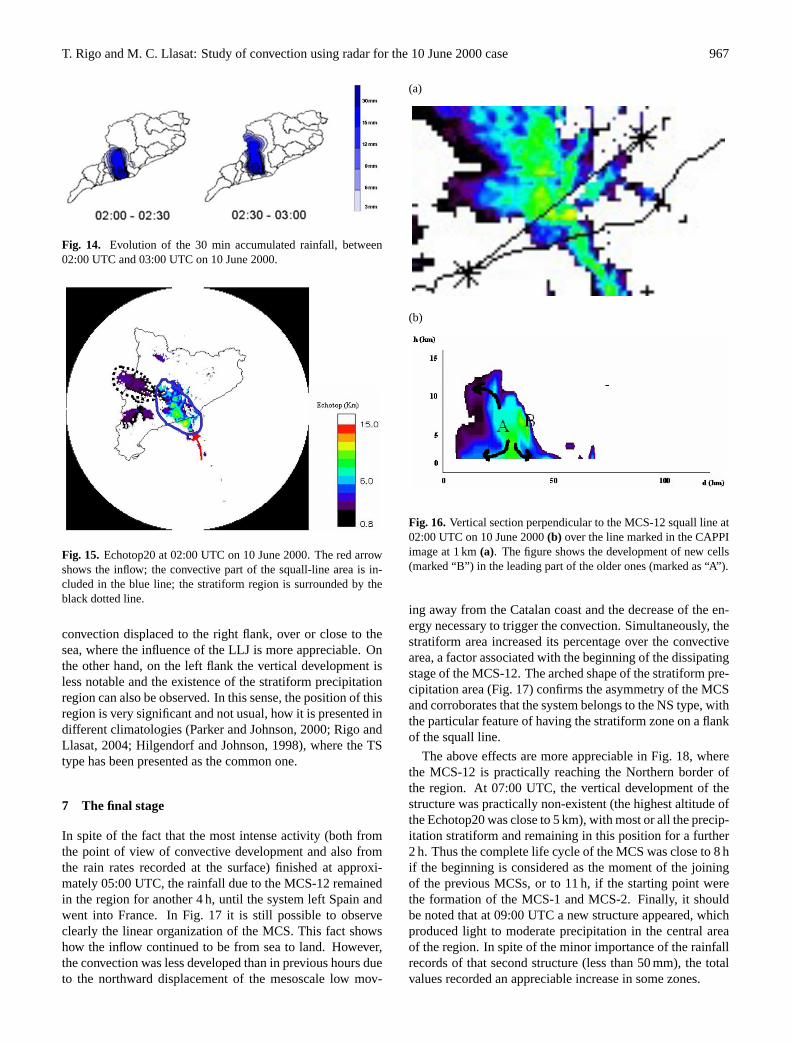
In this stage the vertical developments (Fig. 16) presenteddifferent features from the previous ones. At that moment,the outflow at high levels started to develop the main anvilcommon in the maturity stages of MCSs (Rotunno et al.,1988; Doswell et al., 1996). This anvil had started in therear part of the cells in the previous stage, and approximately3 h later it had reached its maximum development, indicatingthe initiation of the dissipating stage and the end of the con-vective activity. However, by 02:00 UTC that activity was es-
(a)
(b)
Fig. 13. CAPPI at 1 km at 02:00 UTC(a) and 02:40(b) of 10 June2000.
pecially significant, with the development of new cells in theleading part of the old ones (Fig. 16). The new cells had de-veloped over the gust front produced by the cells when theywere in the maturity and dissipation stage. This front resultedfrom the effect of the crash of the downdraft associated withprecipitation with the ground. Considering the two types ofclassification of MCSs in the mature stage presented in theintroduction, the MCS-12 can be classified firstly as asym-metric and as an NS-MCS. Figure 15 shows the most active
T. Rigo and M. C. Llasat: Study of convection using radar for the 10 June 2000 case 967
Fig. 14. Evolution of the 30 min accumulated rainfall, between02:00 UTC and 03:00 UTC on 10 June 2000.
Fig. 15. Echotop20 at 02:00 UTC on 10 June 2000. The red arrowshows the inflow; the convective part of the squall-line area is in-cluded in the blue line; the stratiform region is surrounded by theblack dotted line.
convection displaced to the right flank, over or close to thesea, where the influence of the LLJ is more appreciable. Onthe other hand, on the left flank the vertical development isless notable and the existence of the stratiform precipitationregion can also be observed. In this sense, the position of thisregion is very significant and not usual, how it is presented indifferent climatologies (Parker and Johnson, 2000; Rigo andLlasat, 2004; Hilgendorf and Johnson, 1998), where the TStype has been presented as the common one.
7 The final stage
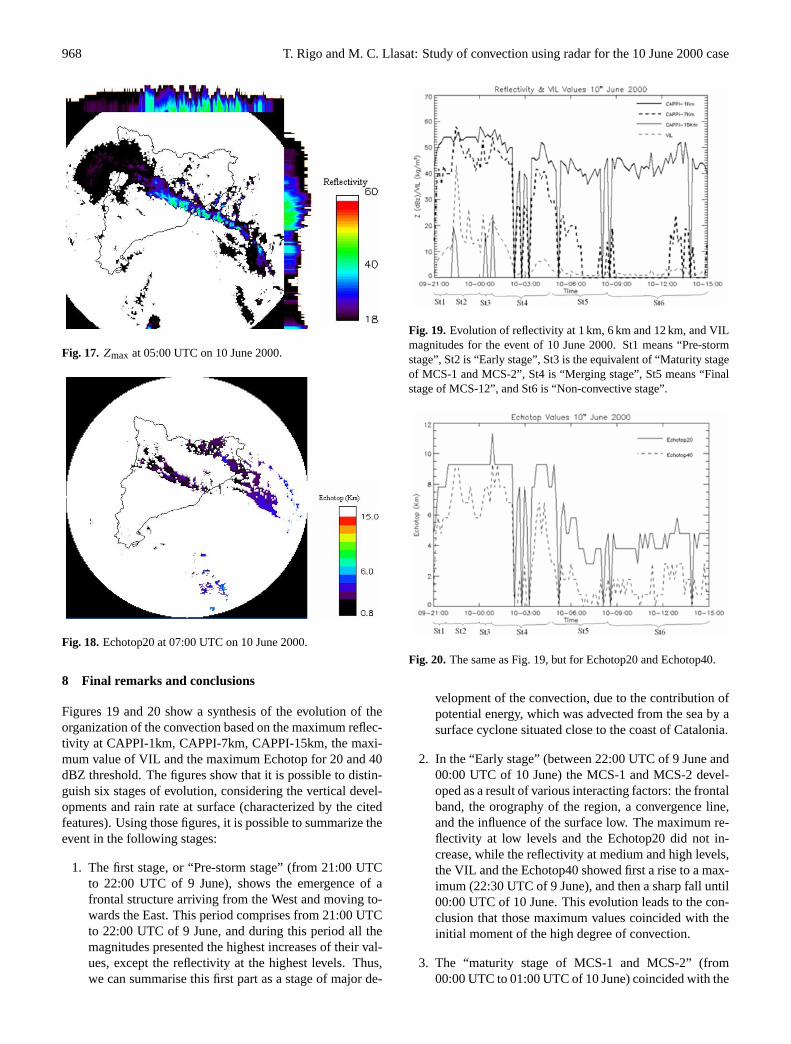
In spite of the fact that the most intense activity (both fromthe point of view of convective development and also fromthe rain rates recorded at the surface) finished at approxi-mately 05:00 UTC, the rainfall due to the MCS-12 remainedin the region for another 4 h, until the system left Spain andwent into France. In Fig. 17 it is still possible to observeclearly the linear organization of the MCS. This fact showshow the inflow continued to be from sea to land. However,the convection was less developed than in previous hours dueto the northward displacement of the mesoscale low mov-
(a)
(b)
Fig. 16. Vertical section perpendicular to the MCS-12 squall line at02:00 UTC on 10 June 2000(b) over the line marked in the CAPPIimage at 1 km(a). The figure shows the development of new cells(marked “B”) in the leading part of the older ones (marked as “A”).
ing away from the Catalan coast and the decrease of the en-ergy necessary to trigger the convection. Simultaneously, thestratiform area increased its percentage over the convectivearea, a factor associated with the beginning of the dissipatingstage of the MCS-12. The arched shape of the stratiform pre-cipitation area (Fig. 17) confirms the asymmetry of the MCSand corroborates that the system belongs to the NS type, withthe particular feature of having the stratiform zone on a flankof the squall line.
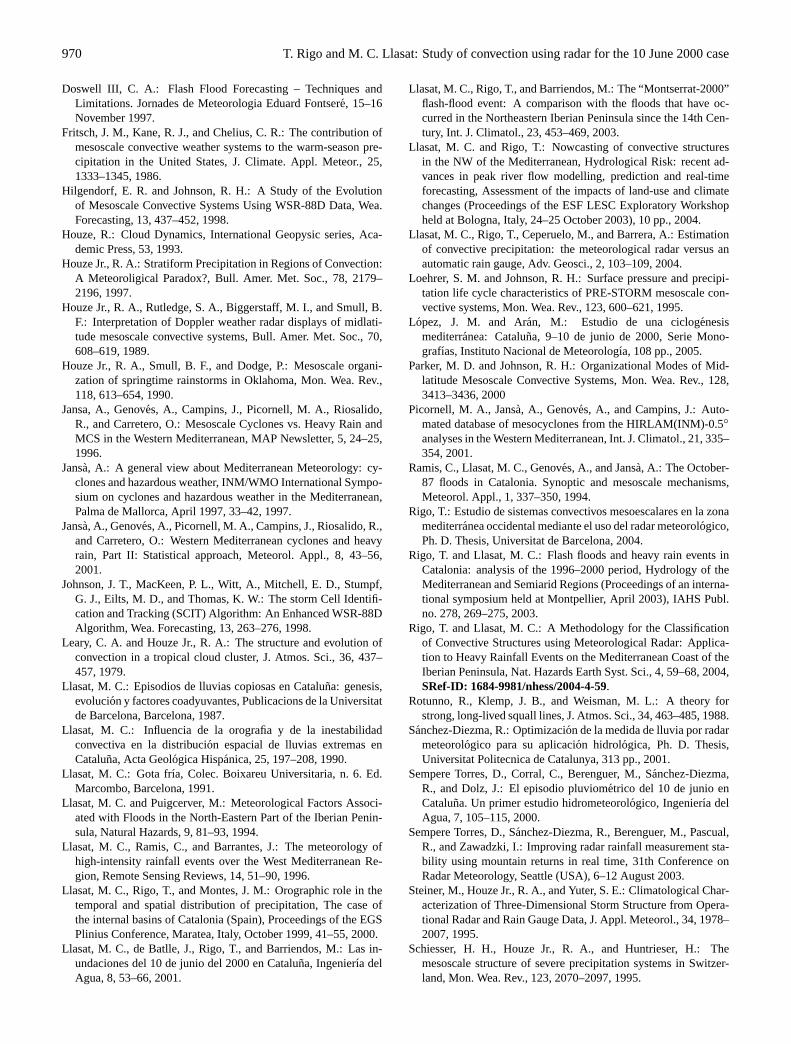
The above effects are more appreciable in Fig. 18, wherethe MCS-12 is practically reaching the Northern border ofthe region. At 07:00 UTC, the vertical development of thestructure was practically non-existent (the highest altitude ofthe Echotop20 was close to 5 km), with most or all the precip-itation stratiform and remaining in this position for a further2 h. Thus the complete life cycle of the MCS was close to 8 hif the beginning is considered as the moment of the joiningof the previous MCSs, or to 11 h, if the starting point werethe formation of the MCS-1 and MCS-2. Finally, it shouldbe noted that at 09:00 UTC a new structure appeared, whichproduced light to moderate precipitation in the central areaof the region. In spite of the minor importance of the rainfallrecords of that second structure (less than 50 mm), the totalvalues recorded an appreciable increase in some zones.
968 T. Rigo and M. C. Llasat: Study of convection using radar for the 10 June 2000 case
Fig. 17.Zmax at 05:00 UTC on 10 June 2000.
Fig. 18. Echotop20 at 07:00 UTC on 10 June 2000.
8 Final remarks and conclusions
Figures 19 and 20 show a synthesis of the evolution of theorganization of the convection based on the maximum reflec-tivity at CAPPI-1km, CAPPI-7km, CAPPI-15km, the maxi-mum value of VIL and the maximum Echotop for 20 and 40dBZ threshold. The figures show that it is possible to distin-guish six stages of evolution, considering the vertical devel-opments and rain rate at surface (characterized by the citedfeatures). Using those figures, it is possible to summarize theevent in the following stages:
1. The first stage, or “Pre-storm stage” (from 21:00 UTCto 22:00 UTC of 9 June), shows the emergence of afrontal structure arriving from the West and moving to-wards the East. This period comprises from 21:00 UTCto 22:00 UTC of 9 June, and during this period all themagnitudes presented the highest increases of their val-ues, except the reflectivity at the highest levels. Thus,we can summarise this first part as a stage of major de-
Figure 19. Evolution of reflectivity at 1 km, 6 km and 12 km, and VIL magnitudes for the
event of 10 June 2000. St1 means “Pre-storm stage”, St2 is “Early stage”, St3 is the
equivalent of “Maturity stage of MCS-1 and MCS-2”, St4 is “Merging stage”, St5 means
“Final stage of MCS-12”, and St6 is “Non-convective stage”.
Figure 20. The same as figure 19, but for Echotop20 and Echotop40
29
Fig. 19. Evolution of reflectivity at 1 km, 6 km and 12 km, and VILmagnitudes for the event of 10 June 2000. St1 means “Pre-stormstage”, St2 is “Early stage”, St3 is the equivalent of “Maturity stageof MCS-1 and MCS-2”, St4 is “Merging stage”, St5 means “Finalstage of MCS-12”, and St6 is “Non-convective stage”.
Figure 19. Evolution of reflectivity at 1 km, 6 km and 12 km, and VIL magnitudes for the
event of 10 June 2000. St1 means “Pre-storm stage”, St2 is “Early stage”, St3 is the
equivalent of “Maturity stage of MCS-1 and MCS-2”, St4 is “Merging stage”, St5 means
“Final stage of MCS-12”, and St6 is “Non-convective stage”.
Figure 20. The same as figure 19, but for Echotop20 and Echotop40
29
Fig. 20. The same as Fig. 19, but for Echotop20 and Echotop40.
velopment of the convection, due to the contribution ofpotential energy, which was advected from the sea by asurface cyclone situated close to the coast of Catalonia.
2. In the “Early stage” (between 22:00 UTC of 9 June and00:00 UTC of 10 June) the MCS-1 and MCS-2 devel-oped as a result of various interacting factors: the frontalband, the orography of the region, a convergence line,and the influence of the surface low. The maximum re-flectivity at low levels and the Echotop20 did not in-crease, while the reflectivity at medium and high levels,the VIL and the Echotop40 showed first a rise to a max-imum (22:30 UTC of 9 June), and then a sharp fall until00:00 UTC of 10 June. This evolution leads to the con-clusion that those maximum values coincided with theinitial moment of the high degree of convection.
3. The “maturity stage of MCS-1 and MCS-2” (from00:00 UTC to 01:00 UTC of 10 June) coincided with the

T. Rigo and M. C. Llasat: Study of convection using radar for the 10 June 2000 case 969
quasi-stationarity of the MCS-1, which led to it mergingwith MCS-2. All the magnitudes, except the Echotop20,presented two relative maxima, due to the developmentof new strong updrafts, associated with the interactionbetween the gust fronts and the inflow coming from thesea. Those factors were also associated with the con-vective train that arose in both MCSs.
4. During the “Merging and maturity stage of MCS-12”(between 01:00 UTC and 05:00 UTC of 10 June) threeimportant phenomena were discerned: firstly, the merg-ing of the two MCSs into a single structure (MCS-12),maintaining initially the maximum values of the magni-tudes for a brief time period; next, the progressive de-crease of all the magnitudes (with a small rise at the finalpart), the updrafts becoming gradually less important (afact associated with the maturity of the convection, andalso with the decrease of the contribution of potentialenergy); finally, the quasi-stationarity of the MCS andthe high values of reflectivity at lower levels, combinedwith the orography, were the contributing factors thatled to the maximum values of precipitation and the mostsevere floods.
5. In the “Final stage of MCS-12” (between 05:00 UTCand 09:00 UTC), it is possible to observe how therewas practically no vertical development until the end ofthe period. During this period the dissipating phase ofthe MCS-12 is appreciated, with predominance of strat-iform precipitation in front of the convective. This isthe result of the movement of the low, and then the ex-haustion of the source of the instability, because of thechanges in the low levels wind regime.
6. Finally, during the “Non-convective stage” (from09:00 UTC to 15:00 UTC of 10 June) the convectionwas residual and only slightly present over Catalonia.After 09:00 UTC a new structure appeared in the cen-tral part of Catalonia, though less sizeable that the pre-vious ones. Most of the precipitation was the result ofthe preceding convection, quite similar to that presentedby Houze (1997).
From the previous description, the duration including thenon-convective stage, the formation of the MCS-12 by merg-ing of two previous squall lines, the presence of the convec-tive train effect, the quasi-stationarity of the MCSs and, fi-nally, the intense values of precipitation, make the case pre-sented one of the most interesting observed in the regionsince the presence of the meteorological radar began. Com-parison with other stages of the life cycle presented by thebibliography in the introduction is quite difficult, however,due to the fact that the MCS-12 was the result of the merg-ing of two previous MCSs with a marked individual identity.Thus, this case is quite different from the typical MCS lifecycle. If we compare it with the phases proposed by Learyand Houze (1979) it would be possible to identify our phase2 as the “formation”, the “intensification of the convection”
would be our stage 3, the phase of “maturity” would coin-cide with our stage 4, and, lastly, our stages 5 and 6 could beidentified as the “dissipation” proposed. Our stage 1, rela-tive to the pre-storm stage, does not in fact belong to the lifecycle of the MCS. With this last consideration in mind, com-parison with the stages presented by Hilgendorf and Johnson(1998) shows the same number, but the distribution is differ-ent: the three initial “stages of growth” proposed by thoseauthors would be our phase 2 and part of the phase 3, the“maturity phase” would be the rest of stage 3 and the greaterpart of our stage 4, and, finally the “decay phase” could beidentified with the final part of our stage 4 and stages 5 and6. However, the coincidences in time duration are scarce, be-cause in our case the maturity stage is equal to the sum ofthe three growth stages. In that study the mean duration ofthe complete growth stage was approximately 8 h, while inour case it was only 3 h. The early merging of both MCS-1and MCS-2 is a probable explanation for this difference. Fol-lowing this argument, the duration of the mature phase wasgreater in the 10 June 2000 event than in the compared study.The same explanation can be provided in this case: the merg-ing of both MCSs into a single one re-activated the updraftsand the gust front of the MCS-12.
In conclusion, the heavy rainfalls during the 10 June 2000event in Catalonia were due to the passing of two mesoscaleconvective systems (MCS-1 and MCS-2) that crossed the re-gion from Southwest to Northeast and merged to give wayto a quasi-stationary MCS (MCS-12). The structures devel-oped over a convergence line formed over the southern coastof Catalonia. The line was formed by the convergence oftwo air masses. The first one, dry and cold, came in fromthe North and was associated with a low situated over Francethat advected the air mass over the Iberian Peninsula. Onthe other hand, a Mediterranean cyclone advected warm andmoist air over the south-eastern part of the cold mass. Thefront associated with the Atlantic low also helped to triggerthe convection over the region.
Acknowledgements.The authors thank the Agencia Catalana del’Aigua (ACA) of the Generalitat de Catalunya and the RegionalMeteorological Center of the INM in Catalonia for the dataprovided. Our thanks to the STAP of the INM and to E. Velasco ofACA for their kind collaboration. This work has been sponsored bythe MONEGRO (REN 2003-09617-C02-02) Spanish project, andthe HYDROPTIMET (Interreg IIIB Medocc) European project.Our thanks to T. Molloy for reviewing the English language.
Edited by: R. RomeroReviewed by: R. Pascual and another referee
References
Biggerstaff, M. I. and Listemaa, S.: An Improved Scheme for Con-vective/Stratiform Echo Classification using Radar Reflectivity,J. Appl. Meteorol., 39, 2129–2150, 2000.
Doswell III, C. A., Brooks, H. E., and Maddox, R. A.: Flash FloodForecasting: An Ingredients-Based Methodology, Wea. Forecast-ing, 11, 560–581, 1996.
970 T. Rigo and M. C. Llasat: Study of convection using radar for the 10 June 2000 case
Doswell III, C. A.: Flash Flood Forecasting – Techniques andLimitations. Jornades de Meteorologia Eduard Fontsere, 15–16November 1997.
Fritsch, J. M., Kane, R. J., and Chelius, C. R.: The contribution ofmesoscale convective weather systems to the warm-season pre-cipitation in the United States, J. Climate. Appl. Meteor., 25,1333–1345, 1986.
Hilgendorf, E. R. and Johnson, R. H.: A Study of the Evolutionof Mesoscale Convective Systems Using WSR-88D Data, Wea.Forecasting, 13, 437–452, 1998.
Houze, R.: Cloud Dynamics, International Geopysic series, Aca-demic Press, 53, 1993.
Houze Jr., R. A.: Stratiform Precipitation in Regions of Convection:A Meteoroligical Paradox?, Bull. Amer. Met. Soc., 78, 2179–2196, 1997.
Houze Jr., R. A., Rutledge, S. A., Biggerstaff, M. I., and Smull, B.F.: Interpretation of Doppler weather radar displays of midlati-tude mesoscale convective systems, Bull. Amer. Met. Soc., 70,608–619, 1989.
Houze Jr., R. A., Smull, B. F., and Dodge, P.: Mesoscale organi-zation of springtime rainstorms in Oklahoma, Mon. Wea. Rev.,118, 613–654, 1990.
Jansa, A., Genoves, A., Campins, J., Picornell, M. A., Riosalido,R., and Carretero, O.: Mesoscale Cyclones vs. Heavy Rain andMCS in the Western Mediterranean, MAP Newsletter, 5, 24–25,1996.
Jansa, A.: A general view about Mediterranean Meteorology: cy-clones and hazardous weather, INM/WMO International Sympo-sium on cyclones and hazardous weather in the Mediterranean,Palma de Mallorca, April 1997, 33–42, 1997.
Jansa, A., Genoves, A., Picornell, M. A., Campins, J., Riosalido, R.,and Carretero, O.: Western Mediterranean cyclones and heavyrain, Part II: Statistical approach, Meteorol. Appl., 8, 43–56,2001.
Johnson, J. T., MacKeen, P. L., Witt, A., Mitchell, E. D., Stumpf,G. J., Eilts, M. D., and Thomas, K. W.: The storm Cell Identifi-cation and Tracking (SCIT) Algorithm: An Enhanced WSR-88DAlgorithm, Wea. Forecasting, 13, 263–276, 1998.
Leary, C. A. and Houze Jr., R. A.: The structure and evolution ofconvection in a tropical cloud cluster, J. Atmos. Sci., 36, 437–457, 1979.
Llasat, M. C.: Episodios de lluvias copiosas en Cataluna: genesis,evolucion y factores coadyuvantes, Publicacions de la Universitatde Barcelona, Barcelona, 1987.
Llasat, M. C.: Influencia de la orografia y de la inestabilidadconvectiva en la distribucion espacial de lluvias extremas enCataluna, Acta Geologica Hispanica, 25, 197–208, 1990.
Llasat, M. C.: Gota frıa, Colec. Boixareu Universitaria, n. 6. Ed.Marcombo, Barcelona, 1991.
Llasat, M. C. and Puigcerver, M.: Meteorological Factors Associ-ated with Floods in the North-Eastern Part of the Iberian Penin-sula, Natural Hazards, 9, 81–93, 1994.
Llasat, M. C., Ramis, C., and Barrantes, J.: The meteorology ofhigh-intensity rainfall events over the West Mediterranean Re-gion, Remote Sensing Reviews, 14, 51–90, 1996.
Llasat, M. C., Rigo, T., and Montes, J. M.: Orographic role in thetemporal and spatial distribution of precipitation, The case ofthe internal basins of Catalonia (Spain), Proceedings of the EGSPlinius Conference, Maratea, Italy, October 1999, 41–55, 2000.
Llasat, M. C., de Batlle, J., Rigo, T., and Barriendos, M.: Las in-undaciones del 10 de junio del 2000 en Cataluna, Ingenierıa delAgua, 8, 53–66, 2001.
Llasat, M. C., Rigo, T., and Barriendos, M.: The “Montserrat-2000”flash-flood event: A comparison with the floods that have oc-curred in the Northeastern Iberian Peninsula since the 14th Cen-tury, Int. J. Climatol., 23, 453–469, 2003.
Llasat, M. C. and Rigo, T.: Nowcasting of convective structuresin the NW of the Mediterranean, Hydrological Risk: recent ad-vances in peak river flow modelling, prediction and real-timeforecasting, Assessment of the impacts of land-use and climatechanges (Proceedings of the ESF LESC Exploratory Workshopheld at Bologna, Italy, 24–25 October 2003), 10 pp., 2004.
Llasat, M. C., Rigo, T., Ceperuelo, M., and Barrera, A.: Estimationof convective precipitation: the meteorological radar versus anautomatic rain gauge, Adv. Geosci., 2, 103–109, 2004.
Loehrer, S. M. and Johnson, R. H.: Surface pressure and precipi-tation life cycle characteristics of PRE-STORM mesoscale con-vective systems, Mon. Wea. Rev., 123, 600–621, 1995.
Lopez, J. M. and Aran, M.: Estudio de una ciclogenesismediterranea: Cataluna, 9–10 de junio de 2000, Serie Mono-grafıas, Instituto Nacional de Meteorologıa, 108 pp., 2005.
Parker, M. D. and Johnson, R. H.: Organizational Modes of Mid-latitude Mesoscale Convective Systems, Mon. Wea. Rev., 128,3413–3436, 2000
Picornell, M. A., Jansa, A., Genoves, A., and Campins, J.: Auto-mated database of mesocyclones from the HIRLAM(INM)-0.5◦
analyses in the Western Mediterranean, Int. J. Climatol., 21, 335–354, 2001.
Ramis, C., Llasat, M. C., Genoves, A., and Jansa, A.: The October-87 floods in Catalonia. Synoptic and mesoscale mechanisms,Meteorol. Appl., 1, 337–350, 1994.
Rigo, T.: Estudio de sistemas convectivos mesoescalares en la zonamediterranea occidental mediante el uso del radar meteorologico,Ph. D. Thesis, Universitat de Barcelona, 2004.
Rigo, T. and Llasat, M. C.: Flash floods and heavy rain events inCatalonia: analysis of the 1996–2000 period, Hydrology of theMediterranean and Semiarid Regions (Proceedings of an interna-tional symposium held at Montpellier, April 2003), IAHS Publ.no. 278, 269–275, 2003.
Rigo, T. and Llasat, M. C.: A Methodology for the Classificationof Convective Structures using Meteorological Radar: Applica-tion to Heavy Rainfall Events on the Mediterranean Coast of theIberian Peninsula, Nat. Hazards Earth Syst. Sci., 4, 59–68, 2004,SRef-ID: 1684-9981/nhess/2004-4-59.
Rotunno, R., Klemp, J. B., and Weisman, M. L.: A theory forstrong, long-lived squall lines, J. Atmos. Sci., 34, 463–485, 1988.
Sanchez-Diezma, R.: Optimizacion de la medida de lluvia por radarmeteorologico para su aplicacion hidrologica, Ph. D. Thesis,Universitat Politecnica de Catalunya, 313 pp., 2001.
Sempere Torres, D., Corral, C., Berenguer, M., Sanchez-Diezma,R., and Dolz, J.: El episodio pluviometrico del 10 de junio enCataluna. Un primer estudio hidrometeorologico, Ingenierıa delAgua, 7, 105–115, 2000.
Sempere Torres, D., Sanchez-Diezma, R., Berenguer, M., Pascual,R., and Zawadzki, I.: Improving radar rainfall measurement sta-bility using mountain returns in real time, 31th Conference onRadar Meteorology, Seattle (USA), 6–12 August 2003.
Steiner, M., Houze Jr., R. A., and Yuter, S. E.: Climatological Char-acterization of Three-Dimensional Storm Structure from Opera-tional Radar and Rain Gauge Data, J. Appl. Meteorol., 34, 1978–2007, 1995.
Schiesser, H. H., Houze Jr., R. A., and Huntrieser, H.: Themesoscale structure of severe precipitation systems in Switzer-land, Mon. Wea. Rev., 123, 2070–2097, 1995.