system maturity metrics for decision support in defense...
TRANSCRIPT

© 2007, Stevens Institute of Technology
System Maturity Metrics for Decision Support in Defense Acquisition
Users Guide: Version 1.0
Prepared By
Brian J. Sauser, Ph.D. Stevens Institute of Technology School of Systems and Enterprises
Castle Point on Hudson Hoboken, NJ 07030
[email protected] 201-216-8589
For
U.S. Army Armament Research Development Engineering Center (ARDEC) Picatinny Arsenal, NJ
September 2007
© 2007, Stevens Institute of Technology
Table of Contents 1. Introduction ............................................................................................................................................ 1
1.1 Statement of Problem ..................................................................................................................... 1
1.2 Purpose of Guide ............................................................................................................................ 1
1.3 Scope of Guide ............................................................................................................................... 2
2. Metrics Descriptions ............................................................................................................................... 3
2.1 Metrics for Technologies, Integrations and Systems ...................................................................... 3
2.2 Technology Readiness Level (TRL) ............................................................................................... 4
2.3 Integration Maturity Level (IML) ...................................................................................................... 6
2.4 System Readiness Level (SRL) ...................................................................................................... 8
2.4.1 SRL Formulation ....................................................................................................................... 8
2.4.2 SRL Application ......................................................................................................................... 9
2.5 Technology Life-Cycle Level (TLL) ............................................................................................... 11
3. Systems Readiness Potential (SRP) ................................................................................................... 13
3.1 SRP Formulation .......................................................................................................................... 14
3.2 SRP Application ............................................................................................................................ 15
4. Summary .............................................................................................................................................. 17
5. Appendix (Case Studies) ..................................................................................................................... 18
6. References ........................................................................................................................................... 19

© 2007, Stevens Institute of Technology 1
1. Introduction 1.1 Statement of Problem In theory, technology and system development follow similar evolution (or maturation) paths; a technology is inserted into a system (e.g. spiral development) based on its maturity, functionality and environmental readiness, and ability to interoperate with the intended system. In the 1990’s the National Aeronautics and Space Administration (NASA) instituted a nine level metric called Technology Readiness Level as a systematic metric/measurement system to assess the maturity of a particular technology and to allow consistent comparison of maturity between different types of technologies [3]. Given the pragmatic utility of this concept, in 1999, the Department of Defense (DoD) embraced a similar TRL concept. While the use of TRL is similar in both NASA and the DoD, DoD states that a technology should reach a TRL 7 before they are inserted into a weapons system program [4]. Based on these fundamental conjectures, a more comprehensive set of concerns becomes relevant when TRL is abstracted from the level of an individual technology to a system context which may involve interplay between multiple technologies and more relevant when these technologies are integrated through acquisition development. Considerations relating to integration, interoperability, and sustainment become equally important from a systems perspective in an operational environment. While it is not impossible to subjectively assess what stage of development a simple system should be in, the difficulty increases with the size and complexity of the system. So the questions become:
How does one assess the current readiness level of a given system during acquisition development;
How can the acquisition-maturity of any technology be assessed,
How can technology roadmaps be used to plan for future acquisition insertion; and
How can a system-level readiness for system assessment be kept consistent and reproducible no
matter the person or organization performing the assessment? Technology insertion as part of a acquisition development program needs a quantitative assessment tool that can determine whether a group of separate technology components with their associated (and demonstrated) TRL ratings can be integrated into a larger complex system at a reasonably low risk to perform a required function or mission at some performance level. In order to address the concerns relevant for acquisition development at the operational systems level, the concept of decisions support metrics for acquisition development are described herein. While some studies have suggested TRLs as a method to make this decision, TRLs do not address risk, integration, or life cycle maturity at the system level; which determines if the technology will result in successful development of the system. To address this deficiency, this guide will describe the background and application of decision support metrics for acquisition development that will allow for lead systems engineers and program managers to effectively assess and report the risk trade space that they will encounter in spiraling technologies into their intended system application. These metrics incorporate the current concept of the TRL scale, while also including the notion of Integration Maturity Level (IML), System Readiness Level (SRL), System Readiness Potential (SRP), and Technology Life-Cycle Level (TLL). 1.2 Purpose of Guide The purpose of this guide is to provide system designers and developers as well as program and project management a common metric methodology, process, framework, and format for managing technology insertion activities and decision-making during acquisition development. This guide will not only describe how these metrics are determined, but how they integrate with the acquisition development process itself.

© 2007, Stevens Institute of Technology 2
In addition, the metrics and their methodology can be used as a tool to develop maturation plans for future acquisition development strategies. In summary, these metrics can provide:
Stakeholders the ability to collectively evaluate component readiness Fast, iterative assessment that can be repeated and traced during development
Maturity assessment at the system-level
Integration as a separate, specific metric
Reduced uncertainty involved in integrating a technology into a system
Other factors in addition to technology readiness as a measure of maturity
The ability to consider obsolescing, by comparative analysis of multiple technologies to acquisition
into the system environment and meet requirements
A common platform for system development and technology insertion evaluation
A hierarchal view of technology insertion and system development 1.3 Scope of Guide This guide assumes the reader has practical working knowledge of U.S. Department of Defense’s acquisition development. The guide is intended as a reference and support guide only and not as a comprehensive acquisition development manual. This guide applies acquisition development and systems engineering principles based on leading systems engineering standards and practice, as well as the application of advanced research efforts. This guide is intended to be a living documents that will be updated within six months of its first publication and periodically thereof to reflect advances in acquisition development theory and practice. Ultimately it is within scope of this guide to:
Enhance Capability Alignment
Provide Common Ontology to Measure and Describe Acquisition Development
Facilitate Transition from Technology Development
Optimize Technology Maturation Investment
Common Processes & Standards
Help Manage R&D and Transition Funding
Improve Customer Credibility & Mission Capability
The guide has been divided into the following section:
Metrics Descriptions: This section will give a definition and introductory description of the foundational decision support metrics for acquisition development (TRL, IML, and SRL).
Metrics Application: This section becomes the true “guide” part of the document. It will describe
how the previous metrics can be used in the acquisition development process for making decisions in acquisition development. This section will make use of a standard acquisition development process and step the reader through the sections of the process that make use of the metrics.
© 2007, Stevens Institute of Technology 3
Decision Support Tools: This section will introduce the decision support metrics of SRP and TLL for making informed and strategic planning decisions about a technology’s or system’s acquisition development potential.
Summary: This section will summarize the guide and how it should be used, as well as mention
what future developments are planned for the guide as knowledge, research, application, and experience progress.
Appendix (Case Examples): Case examples will be presented with read systems to show the
implication of using the decision support metrics.
2. Metrics Descriptions
2.1 Metrics for Technologies, Integrations and Systems The use of metrics in project management and system engineering has been a proven and successful practice in most organizations. As a benchmark in decision making, they can perform an integral part of management activities for indicating performance or effectiveness of risk, quality, and maturity. More specifically metrics can:
identify critical parameters
establish milestones to assess progress
provide direction for risk management/mitigation
sustain entry and exit criteria for major milestones
Despite the wide use of metrics, they must follow some simple rules, as defined by Dowling and Pardoe [5], so they can be effective and efficient in an organization:
1) The way the value is used should be clear
2) The data to be collected for the metric should be easily understood and easy to collect
3) The way of deriving the value from the data should be clear and as simple as possible
4) Those for whom the use of the metric implies additional cost should see as much direct benefit as possible (i.e. collecting the data should not cost more than its value to the decision process)
With these simple, yet critical, rules to develop metrics, the next step is to determine exactly what kind of metrics will be used. There are fundamentally two kinds of metrics, hard metrics which are measured objectively through data analysis, and soft metrics which are measured through a subjective judgment. Hard metrics are generally more difficult to derive due to the need for data, while soft metrics are relatively easy to derive, but require a complementing rational that explains the assessment [5]. For the developments of a systems readiness level and its associated metrics, we considered the rules defined by Dowling and Pardoe for the development of a soft metric which could be universally understood and used. The following sections will explain the systems readiness level index and its associated metrics. The following sections will give a general introductory description and definition of the foundational decision support metrics for acquisition development:
Technology Readiness Level (TRL)
Integration Maturity Level (IML)
© 2007, Stevens Institute of Technology 4
System Readiness Level (SRL)
Technology Life-Cycle Level (TLL)
2.2 Technology Readiness Level (TRL) TRL is a measure used by some U.S. government agencies and many government contractors to assess the maturity of evolving technologies (materials, components, devices, etc.) prior to incorporating that technology into a system or subsystem. In summary, when a new technology is first invented or conceptualized, it is not suitable for immediate application. Instead, new technologies are usually subjected to experimentation, refinement, and increasingly realistic testing. Once the technology is sufficiently proven, it can be incorporated into a system or subsystem. TRL is a systematic metric/measurement system that supports assessment of the maturity of a particular technology and the consistent comparison of maturity between different types of technologies (see Table 1 for a definition and description of the nine levels of TRL). TRL’s strength are:
Accurately and effectively provides component technology readiness assessment Stakeholders coming together to evaluate component TRLs initiates the considerations of other
important factors Assessment using TRL is a fast, iterative process that can be easily repeated during development
Even with the successful use of the TRL metric to evaluate the maturity of technology development, it has been stated that TRL:
does not provide a complete representation of the (difficulty of) integration of the subject technology or subsystems into an operational system [3, 5-8],
includes no guidance into the uncertainty that may be expected in moving through the maturation
of TRL [3, 5, 7, 9-11], and assimilates no comparative analysis technique for alternative TRLs [3, 5, 7-9].

© 2007, Stevens Institute of Technology
Table 1 Technology Readiness Levels TRL Definition Description [1]
9 Actual System Proven Through Successful Mission Operations
Actual application of the technology in its final form and under mission conditions, such as those encountered in operational test and evaluation. In almost all cases, this is the end of the last "bug fixing" aspects of true system development. Examples include using the system under operational mission conditions.
8 Actual System Completed and Qualified Through Test and Demonstration
Technology has been proven to work in its final form and under expected conditions. In almost all cases, this TRL represents the end of true system development. Examples include developmental test and evaluation of the system in its intended weapon system to determine if it meets design specifications.
7 System Prototype Demonstration in Relevant Environment
Prototype near or at planned operational system. Represents a major step up from TRL 6, requiring the demonstration of an actual system prototype in an operational environment, such as in an aircraft, vehicle or space. Examples include testing the prototype in a test bed aircraft
6 System/Subsystem Model or Prototype Demonstration in Relevant Environment
Representative model or prototype system, which is well beyond the breadboard tested for TRL 5, is tested in a relevant environment. Represents a major step up in a technology's demonstrated readiness. Examples include testing a prototype in a high fidelity laboratory environment or in simulated operational environment.
5 Component and/or Breadboard Validation in Relevant Environment
Fidelity of breadboard technology increases significantly. The basic technological components are integrated with reasonably realistic supporting elements so that the technology can be tested in a simulated environment. Examples include 'high fidelity' laboratory integration of components.
4 Component and/or Breadboard Validation in Laboratory Environment
Basic technological components are integrated to establish that the pieces will work together. This is relatively "low fidelity" compared to the eventual system. Examples include integration of 'ad hoc' hardware in a laboratory.
3 Analytical and Experimental Critical Function and/or Characteristic Proof-of-Concept
Active research and development is initiated. This includes analytical studies and laboratory studies to physically validate analytical predictions of separate elements of the technology. Examples include components that are not yet integrated or representative.
2 Technology Concept and/or Application Formulated
Invention begins. Once basic principles are observed, practical applications can be invented. The application is speculative and there is no proof or detailed analysis to support the assumption. Examples are still limited to paper studies.
1 Basic Principals Observed and Reported
Lowest level of technology readiness. Scientific research begins to be translated into applied research and development. Example might include paper studies of a technology's basic properties.

© 2007, Stevens Institute of Technology 6
2.3 Integration Maturity Level (IML) Integration is the process of assembling the system from its components, which must be assembled from their specified requirements [12]. It seems to be a simplistic process of “putting together” a system from its components, which in-turn are built from requirements which are readably identifiable to any systems engineer. Integration can be a complex process containing multiple overlapping and iterative tasks meant to not only “put together” the system but create a successful system built to user requirements that can function in the environment it was intended. This definition of integration implies a structure to system integration. This structure is often described in the systems engineering process as being the “upward slope” of the traditional V-model. It starts with implementation and ends with verification and validation of the complete system in the operational environment. Moving from simply integrating components to integrating the system into its relevant environment is a considerable effort that requires not only disciplined engineering, but also good management of the entire systems engineering process. TRL does not accurately capture the risk involved in the adopting of a technology, and any technology can have an architectural inequality related to integration [7, 8]. As system’s complexity increases (e.g. a large interconnected network) there must be a reliable method and ontology for integration that allows TRLs to collectively combine for developing potentially complex systems. In order to measure integration, this guide will describe an index (i.e. Integration Maturity Level) that can indicate how integration occurs. This index considers not only the physical properties of integration, such as interfaces or standards, but also interaction, compatibility, reliability, quality, performance and consistent ontology when two technologies are being integrated. IML is a systematic measurement of the interfacing of compatible interactions for various technologies and the consistent comparison of the maturity between integration points (i.e. TRLs). IMLs describe the integration maturity of a developing technology with another technology, developing or mature. The addition of IMLs not only provides a check to where the technology is on an integration readiness scale, but also a direction for improving integration with other technologies. As TRL has been used to assess the risk associated with developing technologies, IML is designed to assess the risk of integration. Table 2 shows the nine levels of IML, give a definition and description of each level, and a statement on the risk of not considering this level of integration in systems design.

© 2007, Stevens Institute of Technology
Table 2 Integration Maturity Level IML Definition [2] Description Risk of Not Attaining
9 Integration is Mission Proven through successful mission operations.
IML 9 represents the integrated technologies being used in the system environment successfully. In order for a technology to move to TRL 9 it must first be integrated in to the system, and then proven in the relevant environment, so attempting to move to IML 9 also implies maturing the component technology to TRL 9.
The development stage was never completed; this is more of a programmatic risk. However, if the IML model was used up to this point there should be no (technical) setbacks to stop the integrated system from moving to operational use.
8 Actual integration completed and Mission Qualified through test and demonstration, in the system environment.
IML 8 represents not only the integration meeting requirements, but also a system-level demonstration in the relevant environment. This will reveal any unknown bugs/defect that could not be discovered until the interaction of the two integrating technologies was observed in the system environment.
The system is still only “Laboratory Proven” and has yet to see real-world use. This can allow unforeseen integration issues to go unattended.
7 The integration of technologies has been Verified and Validated with sufficient detail to be actionable.
IML 7 represents a significant step beyond IML 6; the integration has to work from a technical perspective, but also from a requirements perspective. IML 7 represents the integration meeting requirements such as performance, throughput, and reliability.
If the integration does not meet requirements then it is possible that something must be changed at a lower level, which may result in the IML actually going down, however, in most cases the work done to achieve higher levels can be re-implemented.
6 The integrating technologies can Accept, Translate, and Structure Information for its intended application.
IML 6 is the highest technical level to be achieved, it includes the ability to not only control integration, but specify what information to exchange, unit labels to specify what the information is, and the ability to translate from a foreign data structure to a local one.
The risk of not providing this level of integration could be a misunderstanding of translated data.
5 There is sufficient Control between technologies necessary to establish, manage, and terminate the integration.
IML 5 simply denotes the ability of one or more of the integrating technologies to control the integration itself; this includes establishing, maintaining, and terminating.
The risk of not having integration control, even in the case of technologies that only integrate with each other, is that one technology can dominate the integration or worse, neither technology can establish integration with the other.
4 There is sufficient detail in the Quality and Assurance of the integration between technologies.
Many technology integration failures never progress past IML 3, due to the assumption that if two technologies can exchange information successfully, then they are fully integrated. IML 4 goes beyond simple data exchange and requires that the data sent is the data received and there exists a mechanism for checking it.
Vulnerability to interference, and security concerns that the data could be changed if part of its path is along an unsecured medium
3 There is Compatibility (i.e. common language) between technologies to orderly and efficiently integrate and interact.
IML 3 represents the minimum required level to provide successful integration. This means that the two technologies are able to not only influence each other, but also communicate interpretable data. IML 3 represents the first tangible step in the maturity process.
If two integrating technologies do not use the same data constructs, then they cannot exchange information at all.
2 There is some level of specificity to characterize the Interaction (i.e. ability to influence) between technologies through their interface.
Once a medium has been defined, a “signaling” method must be selected such that two integrating technologies are able to influence each other over that medium. Since IML 2 represents the ability of two technologies to influence each other over a given medium, this represents integration proof-of-concept.
The risks of not attaining, or attempting to skip, this level can be data collisions, poor bandwidth utilization, and reduced reliability of the integration
1 An Interface between technologies has been identified with sufficient detail to allow characterization of the relationship.
This is the lowest level of integration readiness and describes the selection of a medium for integration.
It is impossible to have integration without defining a medium, so there are no real risks here, however, the selection of a poor medium may impact performance requirements later on.
© 2007, Stevens Institute of Technology
2.4 System Readiness Level (SRL) Although component TRLs are necessary for evaluating system risk and potential, they are generally insufficient. To address this insufficiency, a new composite metric, called a System Readiness Level (SRL) has been defined as a quantifier to assess maturity for a potential system as a function of the current TRL for individual technology components and the complexity of integration or compatibility between those components (i.e. IML) [13]. From this point, if every technology is assessed using TRL and the system architecture is used to build an integrated representation of the system (e.g. physical architecture, context diagram) in which integrations are assessed using IML, a metric that provides an assessment of a systems maturity can be considered.
2.4.1 SRL Formulation The computation of the SRL is a function of two matrices:
1. Matrix TRL provides a blueprint of the state of the system with respect to the readiness of its technologies. That is, TRL is defined as a vector with n entries for which the ith entry defines the TRL of the ith technology.
2. Matrix IML illustrates how the different technologies are integrated with each other from a system perspective. IML defined as an n×n matrix for which the element IMLij represents the maturity of integration between the ith and jth technologies.
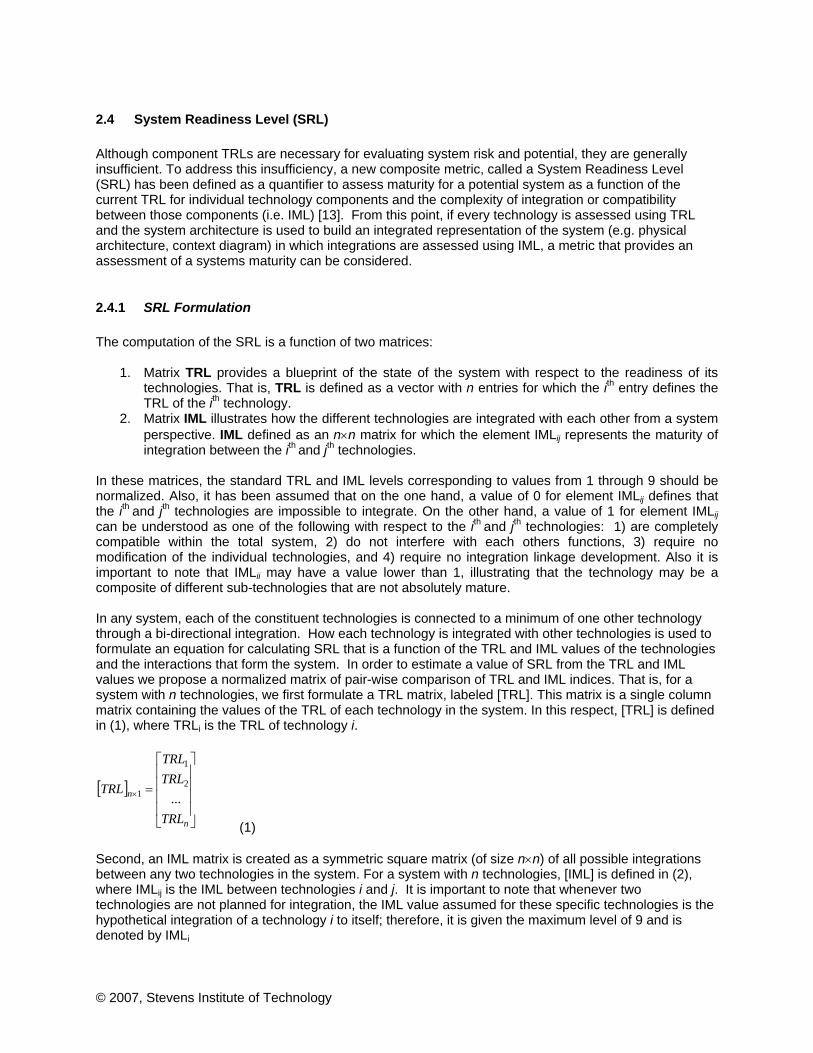
In these matrices, the standard TRL and IML levels corresponding to values from 1 through 9 should be normalized. Also, it has been assumed that on the one hand, a value of 0 for element IMLij defines that the ith and jth technologies are impossible to integrate. On the other hand, a value of 1 for element IMLij can be understood as one of the following with respect to the ith and jth technologies: 1) are completely compatible within the total system, 2) do not interfere with each others functions, 3) require no modification of the individual technologies, and 4) require no integration linkage development. Also it is important to note that IMLii may have a value lower than 1, illustrating that the technology may be a composite of different sub-technologies that are not absolutely mature. In any system, each of the constituent technologies is connected to a minimum of one other technology through a bi-directional integration. How each technology is integrated with other technologies is used to formulate an equation for calculating SRL that is a function of the TRL and IML values of the technologies and the interactions that form the system. In order to estimate a value of SRL from the TRL and IML values we propose a normalized matrix of pair-wise comparison of TRL and IML indices. That is, for a system with n technologies, we first formulate a TRL matrix, labeled [TRL]. This matrix is a single column matrix containing the values of the TRL of each technology in the system. In this respect, [TRL] is defined in (1), where TRLi is the TRL of technology i.
[ ]⎥⎥⎥⎥
⎦
⎤
⎢⎢⎢⎢
⎣
⎡
=×
n
n
TRL
TRLTRL
TRL...
2
1
1
(1) Second, an IML matrix is created as a symmetric square matrix (of size n×n) of all possible integrations between any two technologies in the system. For a system with n technologies, [IML] is defined in (2), where IMLij is the IML between technologies i and j. It is important to note that whenever two technologies are not planned for integration, the IML value assumed for these specific technologies is the hypothetical integration of a technology i to itself; therefore, it is given the maximum level of 9 and is denoted by IMLi
© 2007, Stevens Institute of Technology 9
[ ]⎥⎥⎥⎥
⎦
⎤
⎢⎢⎢⎢
⎣
⎡
=×
nnnn
n
n
nn
IMLIMLIML
IMLIRLIRLIMLIMLIML
IML
...............
...
...
21
22221
11211
(2)
Although the original values for both TRL and IML can be used, the use of normalized values allows a more accurate comparison when comparing the use of competing technologies. Thus, the values used in [TRL] and [IML] are normalized (0,1) from the original (1,9) levels. Based on these two matrices, an SRL matrix is obtained by obtaining the product of the TRL and IML matrices, as shown in (3). [ ] [ ] [ ] 11 ××× ×= nnnn TRLIMLSRL (3) The SRL matrix consists of one element for each of the constituent technologies and from an integration perspective, quantifies the readiness level of a specific technology with respect to every other technology in the system while also accounting for the development state of each technology through TRL. Mathematically, for a system with n technologies, [SRL] is as shown in (4).
[ ]⎥⎥⎥⎥
⎦
⎤
⎢⎢⎢⎢
⎣
⎡
+++
++++++
=
⎥⎥⎥⎥
⎦
⎤
⎢⎢⎢⎢
⎣
⎡
=
nnnnn
nn
nn
n TRLIMLTRLIMLTRLIML
TRLIMLTRLIMLTRLIMLTRLIMLTRLIMLTRLIML
SRL
SRLSRL
SRL
......
...
...
...
2211
2222121
1212111
2
1
(4)
Each of the SRL values obtained in (4) would fall within the interval (0,n). For consistency, these values of SRL should be divided by n to obtain the normalized value between (0,1). Notice that [SRL] itself can be used as a decision-making tool since its elements provide a prioritization guide of the system’s technologies and integrations. Thus, [SRL] can point out deficiencies in the maturation process. The SRL for the complete system is the average of all such normalized SRL values, as shown in (5). Equal weights are given to each technology and hence a simple average is estimated. A standard deviation can also be calculated to indicate the variation in the system maturity and parity in subsystem development.
nn
SRLn
SRLn
SRL
SRL
n ⎟⎠⎞
⎜⎝⎛ +++
=...21
(5)
In the following section we present a sample SRL calculation and how this calculation is correlated to two developmental life cycles (i.e. DoD Acquisition and Spiral Development).
2.4.2 SRL Application The following example will use a simple system of three technologies and two integrations (see Figure 2) to show the steps involved in calculating the SRL value. This system example will be referred to as System X.

© 2007, Stevens Institute of Technology 10
Figure 1 System X with three technologies (1, 2 & 3) with TRLs and IMLs For System X the following matrices can be created for TRL and IML as per definitions presented earlier:
[ ]⎥⎥⎥
⎦
⎤
⎢⎢⎢
⎣
⎡=
⎥⎥⎥
⎦
⎤
⎢⎢⎢
⎣
⎡=
667.0667.0000.1
669
TRL
[ ]⎥⎥⎥
⎦
⎤
⎢⎢⎢
⎣
⎡=
⎥⎥⎥
⎦
⎤
⎢⎢⎢
⎣
⎡=
000.1778.0000.1778.0000.1111.0000.1111.0000.1
979791919
IML
Note that there is no integration between technologies 1 and 3 in System X and hence the integration IML1,3=9 as per definition.
The [SRL] would be:
[ ] 1852.22963.17407.1
⎥⎥⎥
⎦
⎤
⎢⎢⎢
⎣
⎡=SRL
and finally,
( ) 58.03
7284.04321.05802.03
31852.2
32963.1
37407.1
,, 321 =++
=++
== SRLSRLSRLSRL
and SRL1 = 0.58; SRL2 = 0.43; SRL3 = 0.73 Despite the utility of calculating a SRL, the SRL still has to have some correlation to quantitative systems engineering practices to provided added value in understanding its implication on the development life cycle. The SRL is then mapped against two acquisition development cycles as depicted in Figure 2 (a) and (b) to give an indication of its stage of development.

© 2007, Stevens Institute of Technology 11
(a)
0.1 1.00.2 0.3 0.4 0.5 0.6 0.7 0.8 0.9
Pre‐Systems Acquisition
Concept and Technology Development
System Acquisition
System Development & Demonstration
Production and Deployment
Sustainment
Operations and Support(including Disposal)
US Department of Defense
(DoD) 5000.2
System Readiness Level
SRL 2
SRL 1
SRL 3
SRL System X
(b)
SRL System X
0.10.2
0.3
0.4
0.5
0.6
0.7
0.8
0.9
1.0
Planning Development Release Post Release
2 Years
SRL 2
SRL 1
SRL 3
Figure 2 (a) System Readiness Level versus DoD Acquisition Life Cycle for System X; (b) System Readiness Level versus Spiral Development Life Cycle for System X
2.5 Technology Life-Cycle Level (TLL) Any system under consideration will have a life cycle that is governed by its state of development (i.e. State of the Art, State of the Practice, and State of the Obsolescence). Figure 3 and Table 3 give a general description of these states of development which will be referred to as Technology Life-Cycle Levels (TLL). Any level can be defined by these fundamental factors which are summarized for each TLL in Table 3:

© 2007, Stevens Institute of Technology 12
1. Unit Cost: In certain markets, such as consumer electronics, unit cost is very indicative of the level of technology. Lower unit cost in these cases would dictate that there either is a surplus in supply or a steady lack of demand.
2. Product Life: This addresses the time a given technology or product has been available. The longer the product is present in the marketplace, the chances are higher that a disruptive technology may be in the horizon. In addition, product life can define the availability of legacy information on the technology (special note: a long life does not always mean a technology is close to obsolescence).
3. Customer Base (or Market Share): Products that hold the majority of the customer base are typically seen as state of the practice. It is more difficu lt to differentiate state of the art and obsolete products because both have much less of the customer base than the current state of the practice.
4. Availability: The availability of a product or technology is how easy they are to acquire. State of the practice technologies are the easiest to acquire because their manufacturing and support facilities
are most likely still in place. Both obsolete and state of the art technologies may both have a lower availability.
5. Producibility: This is defined as technology’s manufacturability due to decisions to produce new products or diminishing manufacturing sources. This addresses the ease at which a company can produce an item and distribute to its customers. Losing a manufacturing process to new technology is indicative of obsolescence
6. Operations and Support: this includes the cost of operations, support, training, and maintenance, as well as the availability of the resources to support these factors.
Table 3 Technology Life-Cycle Levels (TLL)
TLL Description TLL Factors
Unit Cost Product Life Customer Base Availability Producability Operations
and Support
State of the Art
The highest level of development a system or technology can achieve at a particular time.
High purchase costs
Knowledge is tech specific Limited Limited Production
inefficient High training cost; Lack of support
State of the Practice
The level at which the system or technology exists is at its lowest risk for operational use.
Reasonable purchase costs
Widely used and understood
Optimal Readily available; multiple vendors
Production efficient
Training and support readily available
State of the Obsolescence
The system or technology is no longer technically superior to other similar systems or technologies.
Reduced purchase cost
Readily accessible; extensive legacy
Declining Declining; Replacement
Production efficient yet declining
High cost of maintenance; Increased training cost
Cos
t
Time
State of the Art
State of the Practice
State of the Obsolescence
Technology Life Cycle
TLL
SpD Tech Insertion Time
Max TLL
Insertion Point
Notional TLL Curve
Cos
t
Time
State of the Art
State of the Practice
State of the Obsolescence
Technology Life Cycle
TLL
SpD Tech Insertion Time
Max TLL
Insertion Point
Notional TLL Curve
TLL
SpD Tech Insertion Time
Max TLL
Insertion Point
Notional TLL Curve
Figure 3 TLL Relationships

© 2007, Stevens Institute of Technology 13
It is key to note that none of these TLL factors should be considered in isolation, thus all should be used to make acquisition insertion decisions in relation to:
• Will a new, more functional system or technology supersedes the old? • Has the system or technology become inadequate due to changes in other systems or
technologies? • Is it more effective to invest in the development of new technology or system? • Has the system or technology lifetime been shortened by recent developments?
3. Systems Readiness Potential (SRP) In the defense acquisition process there are factors that may strategically alter the decision to: develop one system over another; supersede a new, more functional system over another; determine if a system or technology has become inadequate due to changes in other systems or technologies; invest in the development of a new system or maintain existing systems; and classify a systems obsolescence and longevity. To address these challenges, the SRL can be used as a method for determining current and future readiness of a system to determine its position in the defense acquisition process. While identifying the current SRL of a system can provide managerial insight, optimizing the future value of this index based on constrained resources will enhance managerial capabilities. This is defined as the Systems Readiness Potential (SRP). The optimization of SRL (i.e. SRP) based on resource allocation can allow for decisions to be made regarding the trade-offs among: 1) system attributes such as availability, performance, efficiency, and total ownership cost and 2) the components necessary for producing affordable system operational effectiveness [14, 15]. These attributes have objectives and ranges for components such as capability, reliability, maintainability, supportability, and producibility and it is the interplay among them that drives the different levels for both IML and TRL of the elements in a system. Thus, the optimal selection of which components to enhance to improve the system SRL becomes an optimal system design development problem. The optimal design of systems is a classical optimization problem in the area of systems engineering [16, 17]. In general, the objective of these problems is to optimize a function-of-merit of the system design (reliability, cost, mean time to failure, supportability, etc…) subject to known constraints on resources (cost, weight, volume, etc…) and/or system performance requirements (reliability, availability, mean time to failure, etc…). To optimize this specific function, it is generally assumed that the system can be decomposed into a system that contains a known number of subsystems or elements (as in Figure 2) and, for each of these elements a known set of functionally equivalent components types (with different performance specifications) can be used in the design. From a system engineering design perspective, an optimization approach that balances needs (i.e. the enhancement of the SRL) with resources (i.e. cost of technologies, cost of technology development, schedule, etc…), can be an effective and efficient method for reducing risk. That is, the development of a SRL index correlated with the defense acquisition process can be used as a an optimization framework for the systems engineer or program manager to design-in enhanced system reliability, maintainability, and supportability to achieve the desired reductions in the necessary logistics footprint and the associated life cycle cost. SRP becomes crucial when trying to decide between competing system design alternatives or when trying to decide which individual TRL or IML to improve. To make the best decision, two optimization models are proposed that will assist management to choose SRL improvement opportunities. It is reasonable to assume that improvements will result in costs associated with the purchase of new technology, rework of existing equipment, training of employees, hiring new employees, and enhancements to information technology infrastructure. Similarly, these improvements consume a reasonable amount of time and under tight schedules it is imperative to allocate this resources efficiently.

© 2007, Stevens Institute of Technology 14
3.1 SRP Formulation The first of the two models proposed is to maximize the SRL (a function of TRL and IML) under constraints associated with resources while the second model considers minimizing the cost associated to increasing SRL to some predefined user level, λ. Both of these models recognize that the technologies compete for resources and that benefits can result in either improved SRL or reduction in costs. The general mathematical form of these models follows: SRP Model 1
( )
( )
( ) nn rR
rRts
SRL
≤
≤
IRLTRL
IRLTRL
IRLTRL
,
,..
,Max
11
M
SRP Model 2
Min Cost TRL ,IRL( )s.t .SRL TRL ,IRL( ) ≥ λ
R1 TRL ,IRL( ) ≤ r1
M
R n TRL ,IRL( ) ≤ rn In these models the matrix IML contains the decision-variables. Each of these variables are integer valued and bounded by (IMLi,9). That is, in each of the models, the IML for the ith component cannot be below its current level nor above perfect integration. Thus, this models belong to the set of integer valued linear and non linear problems depending on the behavior of the cost function and the remaining constraints. As described earlier the IML matrix is created as a symmetric square matrix (of size n×n) of all possible integrations between any two technologies in the system. On the other hand, the vector TRL defines the readiness level of each of the technologies in the system. Although in the present models this TRL represents a vector of parameters, future research could be focused on including the improvement of each technology readiness. Finally, the SRL of the system is computed as:
nn
SRLn
SRLn
SRL
SRL
n ⎟⎠⎞
⎜⎝⎛ +++
=...21
where,
[ ]⎥⎥⎥⎥
⎦
⎤
⎢⎢⎢⎢
⎣
⎡
+++
++++++
=
⎥⎥⎥⎥
⎦
⎤
⎢⎢⎢⎢
⎣
⎡
=
nnnnn
nn
nn
n TRLIMLTRLIMLTRLIML
TRLIMLTRLIMLTRLIMLTRLIMLTRLIMLTRLIML
SRL
SRLSRL
SRL
......
...
...
...
2211
2222121
1212111
2
1
, where IMLij=IMLji.
It is important to note that for the optimization models, defining how the resources are consumed is one of the most important tasks to be done by the Program Manager. Failure to obtain accurate estimates of resource consumption will lead to sub-optimal allocation of resources. Future research efforts will address the mathematical description of resource consumption and will investigate this issue of uncertainty associated with the values obtained.

© 2007, Stevens Institute of Technology 15
3.2 SRP Application The following example using System X (Figure 1) illustrates the application of these two models. By evaluating the SRL of this system, an estimate of its actual readiness can be obtained before it is deployed. When reviewing the SRL for this system in its current state, an SRL of 0.58 indicates this system should be in a phase at which in development is a system of increment of capability, system requirements are being refined and there should be an effort to reduce integration and manufacturing risk as well as ensure operational supportability with demonstrated system integration, interoperability, safety, and utility. For this example, it is assumed that the system developer has no control over the technology development; therefore, the optimization of the SRL is based on the optimization of the IMLs (see Table 4). Table 4 Consumption of Resources for Each Integration Effort
Technologies 1,2 2,3 IML Level Cost Time Cost Time
1 $0 0 $0 0 2 $123 80 $0 0 3 $219 380 $0 0 4 $595 532 $0 0 5 $700 621 $0 0 6 $808 862 $0 0 7 $1,003 997 $0 0 8 $1,110 1145 $400 165 9 $1,452 1623 $650 389
Available Resources Cost $1,400 Time 1200
Under this setting, SRP Model 1 is given as:
3333:
321 ⎟⎠⎞
⎜⎝⎛ ++
=
SRLSRLSRL
SRLMax
s.t. C(IML)≤1400 T(IML) ≤1200 IMLi ∈ Z+, IMLi ∈ (1,9)
Where
⎥⎥⎥
⎦
⎤
⎢⎢⎢
⎣
⎡
++++++
=⎥⎥⎥
⎦
⎤
⎢⎢⎢
⎣
⎡
333232131
323222121
313212111
3
2
1
TRLIMLTRLIMLTRLIMLTRLIMLTRLIMLTRLIMLTRLIMLTRLIMLTRLIML
SRLSRLSRL
To completely characterize the optimization model it is necessary to introduce a set of binary
variables. Let:⎩⎨⎧
=otherwise0
= If1 kIMLx ijk
ij with k=1,…,9. Notice that based on this binary variable, each of
the possible IML in the system can be obtained as: ∑=
=9
1k
kijij kxIML . Based on these binary variables the
SRP Model 1 has the following transformations:

© 2007, Stevens Institute of Technology 16
SRL1
SRL2
SRL3
⎡
⎣
⎢ ⎢ ⎢
⎤
⎦
⎥ ⎥ ⎥
=
81+ 6 kx12k
k=1
9
∑ + 54
9 kx21k
k=1
9
∑ + 54 + 6 kx23k
k=1
9
∑
81+ 6 kx32k
k=1
9
∑ + 54
⎡
⎣
⎢ ⎢ ⎢ ⎢ ⎢ ⎢ ⎢
⎤
⎦
⎥ ⎥ ⎥ ⎥ ⎥ ⎥ ⎥
C IML( )=123x122 + 219x12
3 + 595x124 + 700x12
5 + 808x126 +1003x12
7 +1110x128 +1452x12
9
costs of improvents on IRL12
+
400x238 + 650x23
9
costs of improvents on IRL23
≤1400
T IML( )= 80x122 + 380x12
3 + 532x124 + 621x12
5 + +862x126 + 997x12
7 +1145x128 +1623x12
9
time consumed by improvents on IRL12
+
165x238 + 389x23
9
time consumed by improvents on IRL23
≤1200
The following constraints should be added to the original model to guarantee that only one of the possible alternatives for improvement for each IMLij be chosen: xij
k =1k
∑ for every i, j.
xijk ∈ Bin(0,1)
The solution of this model provides the results presented in Table 5. The recommendation following these results is to: Increase IML (1,2) from its current value to 8 and, not increase IML (2,3). These actions would yield an SRL=0.76 within the constraints for cost and time. Table 5 Results from Model 1
Objective Function (SRP) 0.76 Cost Constraint $1,110 Time constraint 1145 IML(1,2) Constraint 1 IML(2,3) Constraint 1
Figure 4 (a) and (b) indicate how this would map upon the standard life cycle acquisition and spiral development processes.
(a)
0.1 1.00.2 0.3 0.4 0.5 0.6 0.7 0.8 0.9
Pre‐Systems Acquisition
Concept and Technology Development
System Acquisition
System Development & Demonstration
Production and Deployment
Sustainment
Operations and Support(including Disposal)
US Department of Defense
(DoD) 5000.2
System Readiness Level vs. System Readiness Potential
System X (SRP)System X (SRL)

© 2007, Stevens Institute of Technology 17
(b) System X (SRL)
0.10.2
0.3
0.4
0.5
0.6
0.7
0.8
0.9
1.0
Planning Development Release Post Release
2 Years
System X (SRP)
Figure 4 (a) SRL and SRP versus DoD Acquisition Life Cycle for System X; (b) SRL and SRP versus Spiral Development Life Cycle for System X
4. Summary This guide should be used as a tool to help make knowledgeable decisions about reducing technology maturity and acquisition insertion risks. The results of the metrics described in this guide should not only be used to make acquisition and development decisions but strategic technology roadmap planning that will illustrate the timely implementation of capability increments. Fundamentally, this guide provides management of technology insertion activities and decision-making by providing a common process, framework, and format. As the knowledge, research, application, and experience of the metrics described in this guide progress they will be used to:
Achieve strategic alignment of all mission areas, technical activities, and partnership with laboratories and NGC
Unify all executed projects into a single technology insertion plan
Provide linkage of technology projects to capability needs
Improves synergy across a large, complex, dispersed organization (e.g. Navy Labs, PARMS,
Industry, etc.)
Improve cost, speed, and accuracy of the technology insertion planning process
Capture technology assessment/maturity throughout project’s life cycle development
© 2007, Stevens Institute of Technology 18
5. Appendix (Case Studies)

Over the next 5 years, many of the programs in our assessment plan to hold design reviews or make a production decisions without demonstrating the level of technology maturity that should have been there before the start of development.Government Accountability Office on the Department of Defense, 1999
A System Maturity Index for Decision Support in Life Cycle Acquisition
Dr. Brian [email protected] @ste e s.edu
Dr. Jose Emmanuel Ramirez‐[email protected]
Stevens Institute of TechnologySchool of Systems and Enterprises
Castle Point on HudsonHoboken, NJ 07030,
© 2007 Stevens Institute of Technology1

AbstractAbstract
In the National Aeronautics and Space Administration (NASA) and the Department of Defense (DoD) the Technology Readiness Level (TRL) scale is a measure of maturity of an individual technology, with a view towards operational use in a system context. A comprehensive set of concerns b l h hi i i b d f i di id lbecomes relevant when this metric is abstracted from an individual technology to a system context, which may involve interplay among multiple technologies that are integrated through a systems engineering process This research proposes the development of a system focusedprocess. This research proposes the development of a system‐focused approach for managing system development and making effective and efficient decisions during a systems engineering process. This research will present a System Readiness Level (SRL) index that incorporates both thepresent a System Readiness Level (SRL) index that incorporates both the current TRL scale and the concept of an Integration Readiness Level (IRL) and provide a method for determining current and future readiness of a system to determine its potential position in the systems engineering
© 2007 Stevens Institute of Technology
y p p y g gprocess.

What’s Missing in TRL?What s Missing in TRL?
• A complete representation of the (difficulty of) integration p p ( y ) gof the subject technology or subsystems into an operational system (Dowling and Pardoe, 2005, Mankins, 2002, Meystel et al 2003 Smith 2005 Valerdi and Kohl 2004)al., 2003, Smith, 2005, Valerdi and Kohl, 2004),
• The uncertainty that may be expected in moving through the maturation of TRL (Shishko et al., 2003, Cundiff, 2003, Dowling and Pardoe, 2005, Mankins, 2002, Smith, 2005, Moorehouse, 2001), and
• Comparative analysis techniques for alternative TRLs• Comparative analysis techniques for alternative TRLs (Cundiff, 2003, Dowling and Pardoe, 2005, Mankins, 2002, Smith, 2005, Valerdi and Kohl, 2004).
© 2007 Stevens Institute of Technology
“In order to succeed over the longer term, additional methodologies are needed, including those which allow the identification of anticipated uncertainty in planned R&T programs…” (Mankins, 2002)

Other TheoriesOther Theories
• Manufacturing Readiness Level (DoD)– Used to assess the SE/design process and maturity of a technology’s
associated manufacturing processes to enable rapid, affordable transition to acquisition programs.
• Integrated Technology Analysis Methodology (ITAM) (Mankins, 2002)– Discipline‐neutral, quantitative measure of the relative technological
challenge inherent in various candidate/competing advanced systems concepts.
• Systems Integration Readiness Level (MoD)– System Readiness Levels (SRLs) were developed as a tool for projects
to assess System Maturity, and to communicate this in a consistent manner.
© 2007 Stevens Institute of Technology

Ministry of Defence SRLMinistry of Defence SRL
Project at SRL 3
UserUserRequirementsRequirements
S tS t
System ValidationSystem Validation
S tS t
Project at SRL 3
SystemSystemRequirementsRequirements
ArchitecturalArchitecturalDesignDesign
SystemSystemVerificationVerification
Integration, Verification,Integration, Verification,& Testing& TestingDesignDesign
SubSub--System andSystem andComponent DesignComponent Design
& Testing& Testing
Integration, Verification,Integration, Verification,& Testing& Testing Delivery into ServiceDelivery into ServiceProject CommencesProject Commences
1 1 2 2 3 3 4 4 5 5 6 6 7 7 8 8 99Progression against SRLProgression against SRL
© 2007 Stevens Institute of Technology

P ll l ( t i t t d) D l tParallel (not integrated) DevelopmentPhasePhase
98Le
vel
Production Development (4.3.4)
Operations & Support (4.3.5)TRL 9
TRL 898Le
vel
Production Development (4.3.4)
Operations & Support (4.3.5)TRL 9
TRL 8
5
6
7
eadi
ness
T h l D l t (4 3 2)
( )
System Development & Demonstration (4.3.3)
TRL 7
TRL 6TRL 6
Point of Transition or Integration *
B
C
5
6
7
eadi
ness
T h l D l t (4 3 2)
( )
System Development & Demonstration (4.3.3)
TRL 7
TRL 6TRL 6
Point of Transition or Integration *
BB
CC
2
345
hnol
ogy
R
Concept Refinement (4.3.1)
Technology Development (4.3.2)TRL 5TRL 5
TRL 3
A
2
345
hnol
ogy
R
Concept Refinement (4.3.1)
Technology Development (4.3.2)TRL 5TRL 5
TRL 3
AA
Phase and TRL scales on
1
2
Tech Basic Technology Research TRL 3
TRL 2TRL 1
1
2
Tech Basic Technology Research TRL 3
TRL 2TRL 1
parallel paths still do not consider integration.
© 2007 Stevens Institute of Technology
Sauser, B.J., D. Verma, J. Ramirez-Marquez, and R. Gove. (2006). “From TRL to SRL: The Concept of Systems Readiness Levels.” Conference on Systems Engineering Research, April 7-8. Los Angles, CA

Why do we need a Systems Readiness l ( )?Level (SRL)?
Development of metrics, tool, and methodologies for Technology Readiness
The SystemThe System
8 Development of metrics, tool, and methodologies for determining a systems readiness level (SRL) and potential for making efficient and effective life-cycle acquisition and operational decisions. The SRL Model is a function of the individual Technology Readiness L l (TRL) d th i b t i t ti i t
Level (TRL)
Integration Readiness Level (IRL) 7
5
4
8
7
1
Levels (TRL) and their subsequent integration points with other technologies, the Integration Readiness Level (IRL).
Value Proposition:SRL f (TRL IRL)
7 4 7
– Value Proposition:• Currently TRL is only a measure of an individual
technology
• There is no method for integrating TRLs
Th i t ti f t di
SRL = f (TRL, IRL)
• There is no systematic measure of a systems readiness
• Cost and schedule reduction in strategic technology development planning
– Deliverable: Integration of methodologies for
© 2007 Stevens Institute of Technology7
strategic roadmap planning that illustrate the timely implementation of capability increments.

Integration Readiness LevelIntegration Readiness LevelA systematic measurement of the interfacing of compatible interactions for various technologies and the consistent comparison of the maturity between integration points.
Integration – the combining and coordinating of separate components into a seamless unit –
IRL Definition
9 Integration isMission Proven through successful mission operations
Integration the combining and coordinating of separate components into a seamless unit interfacing the compatible interactions of various technologies together
atic
9 Integration is Mission Proven through successful mission operations.
8 Actual integration completed and Mission Qualified through test and demonstration, in the system environment.
7 The integration of technologies has been Verified and Validated with sufficient detail to be actionable.
cPr
agm
a
6 The integrating technologies can Accept, Translate, and Structure Information for its intended application.
5 There is sufficient Control between technologies necessary to establish, manage, and terminate the integration.
4 There is sufficient detail in the Quality and Assurance of the integration between technologies.
Synt
acti
4 y g g
3 There is Compatibility (i.e. common language) between technologies to orderly and efficiently integrate and interact.
2 There is some level of specificity to characterize the Interaction (i.e. ability to influence) between technologies through their interface.An Interface between technologies has been identified with sufficient detail to allow characterization of theSe
man
tic
© 2007 Stevens Institute of Technology8
1 An Interface between technologies has been identified with sufficient detail to allow characterization of the relationship.
Gove, R. (2007) Development of an Integration Ontology for Systems Operational Effectiveness. M.S. Thesis. Stevens Institute of Technology. Hoboken, NJGove, R., B. Sauser, J. Ramirez-Marquez. (2007). “Integration Maturity Metrics: Development of an Integration Readiness Level.” Acta Astronautica (under review)
S

Calculating
d lSystem Readiness Level
System Alpha*‐ System Alpha* ‐

System AlphaStep 1: Determining the TRL and IRL
TRL1 = 91
Technology1
IRL1,2 = 1
Technology2
Technology3
TRL2 = 6
2
IRL2,3 = 7 TRL3 = 6
3
Sauser, B., J. Ramirez-Marquez, D. Henry and D. Dimarzio. (2007). “A System Maturity Index for the Systems Engineering Life Cycle.” International Journal of Industrial and Systems Engineering. 3(6). (forthcoming)
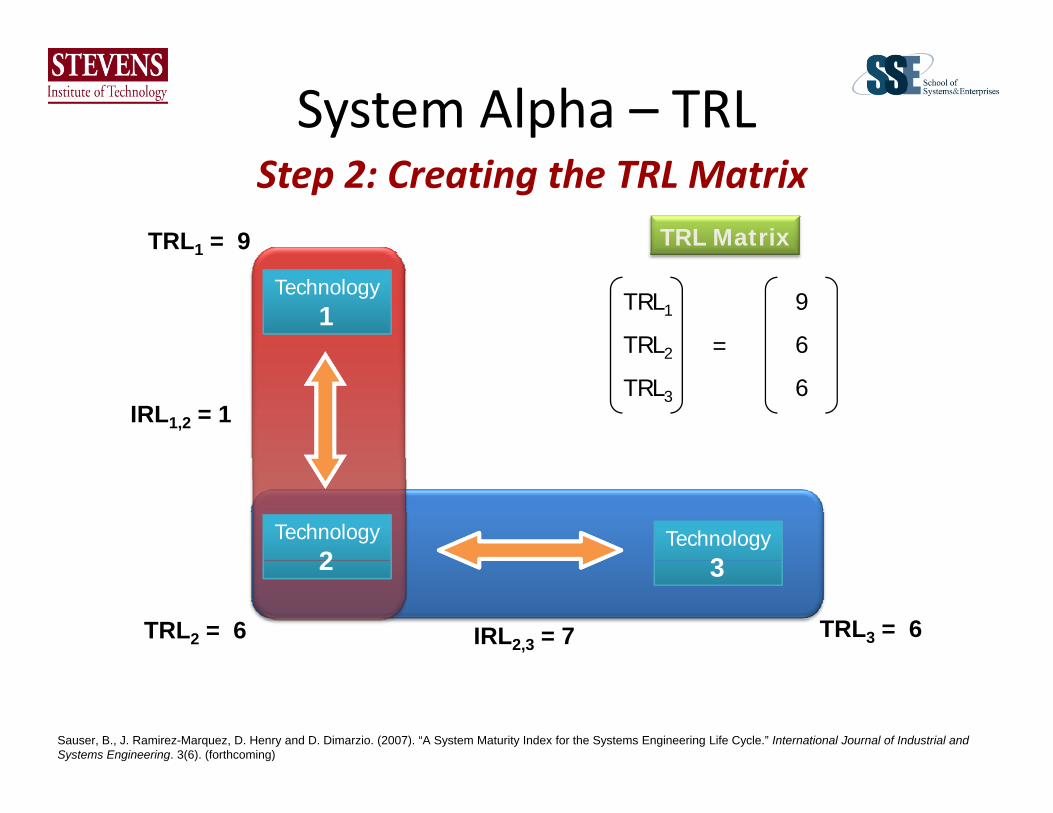
System Alpha – TRLStep 2: Creating the TRL Matrix
TRL MatrixTRL1 = 9
9
6
TRL1
TRL2 =
1
Technology1
62
TRL3IRL1,2 = 1
Technology2
Technology3
TRL2 = 6
2
IRL2,3 = 7 TRL3 = 6
3
Sauser, B., J. Ramirez-Marquez, D. Henry and D. Dimarzio. (2007). “A System Maturity Index for the Systems Engineering Life Cycle.” International Journal of Industrial and Systems Engineering. 3(6). (forthcoming)
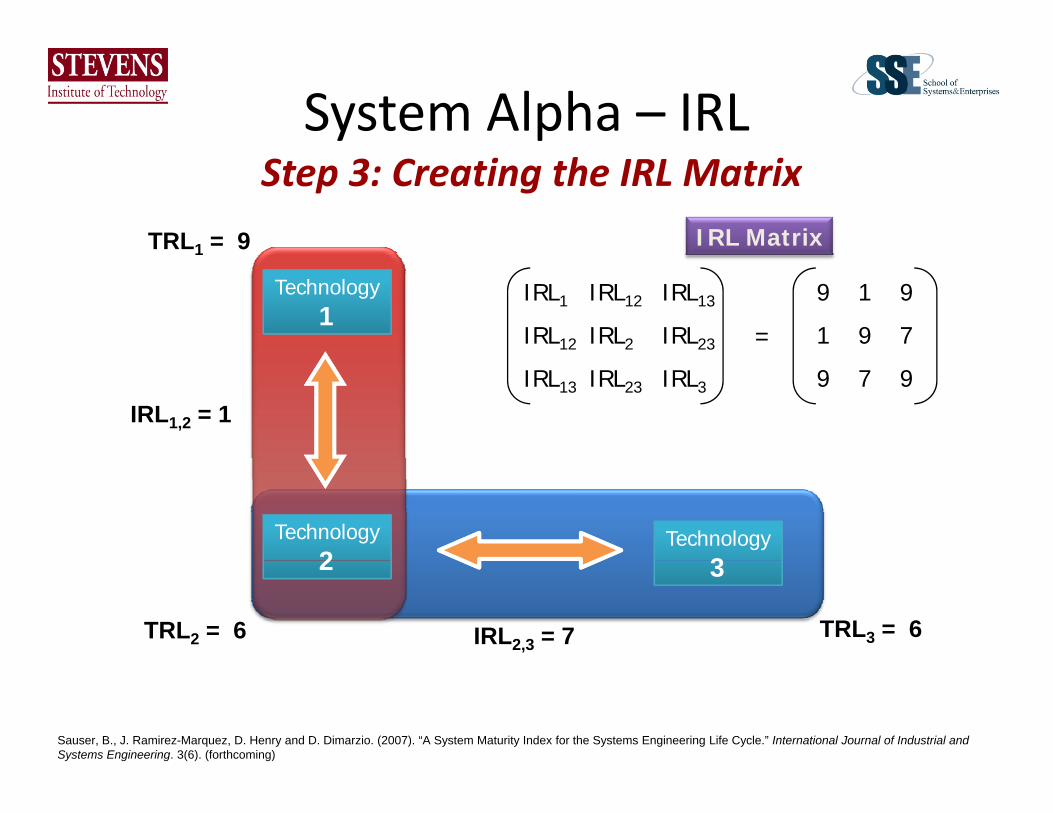
System Alpha – IRLStep 3: Creating the IRL Matrix
IRL MatrixTRL1 = 9
9 1 9
1 9 7
IRL1 IRL12 IRL13
IRL12 IRL2 IRL23 =
1
Technology1
9 7 9IRL13 IRL23 IRL3
IRL1,2 = 1
Technology2
Technology3
TRL2 = 6
2
IRL2,3 = 7 TRL3 = 6
3
Sauser, B., J. Ramirez-Marquez, D. Henry and D. Dimarzio. (2007). “A System Maturity Index for the Systems Engineering Life Cycle.” International Journal of Industrial and Systems Engineering. 3(6). (forthcoming)

SRL for System AlphaStep 4: Normalizing the TRLs and IRLs
TRL1IRL1 IRL12 IRL13
N N li d [(1 9) l ]
TRL2
TRL3
IRL12 IRL2 IRL23
IRL13 IRL23 IRL3
9
6
9 1 9
9
Non-Normalized [(1,9) scale]
6
6
1 9 7
9 7 9
Normalized [(0,1) scale]
1.0
0.67
1.0 0.11 1.0
0.11 1.0 .78
[( , ) ]
0.67
0.11 1.0 .78
1.0 .78 1.0Sauser, B., J. Ramirez-Marquez, D. Henry and D. Dimarzio. (2007). “A System Maturity Index for the Systems Engineering Life Cycle.” International Journal of Industrial and Systems Engineering. 3(6). (forthcoming)

SRL Calculation of System AlphaStep 5: Calculating the SRLx
SRL = IRL x TRL
TRLIRL IRL IRL TRL1
TRL2
TRL3
IRL1 IRL12 IRL13
IRL12 IRL2 IRL23
IRL13 IRL23 IRL3
SRL1 SRL2 SRL3 =
13 23 3
(0,n) scaleSRL1 SRL2 SRL3 = 1.74 1.30 2.19
S h l d i
Sauser, B., J. Ramirez-Marquez, D. Henry and D. Dimarzio. (2007). “A System Maturity Index for the Systems Engineering Life Cycle.” International Journal of Industrial and Systems Engineering. 3(6). (forthcoming)
Note: SRLx represents Technology X and its IRLs

SRL for System AlphaStep 6: Calculating the Composite SRL
(0,n) scaleSRL1 SRL2 SRL3 = 1.74 1.30 2.19
(0,1) scaleSRL1 SRL2 SRL3 = 0.58 0.43 0.73
Composite SRL = 1/3 ( 0.58 + 0.43 + 0.73 )
0 58= 0.58
Sauser, B., J. Ramirez-Marquez, D. Henry and D. Dimarzio. (2007). “A System Maturity Index for the Systems Engineering Life Cycle.” International Journal of Industrial and Systems Engineering. 3(6). (forthcoming)

System Life Cycle of System AlphaSystem Life Cycle of System Alpha
0.1 1.00.2 0.3 0.4 0.5 0.6 0.7 0.8 0.9
S A i i i
System Readiness LevelSystem Readiness Level
Pre‐Systems Acquisition
Concept and Technology Development
System Acquisition
System Development & Demonstration
Production and Deployment
Sustainment
Operations and Support(including Disposal)
US Department of Defense
(DoD) 5000.2
SRL 2
SRL 1
SRL System Alpha
SRL 3
© 2007 Stevens Institute of Technology

Spiral Development of System Alpha
0.10.10.20.2
0 30 3
0.40.4
0 50 5
0.60.6
0 70 7
0.80.8
0 90 9
1.01.0
Planning Development Release Post Release
0.30.3 0.50.5 0.70.7 0.90.9
2 Years
SRL System AlphaSRL 2
SRL 1SRL Spiral Development Activity
≤ 0.3 Planning
0.31 – 0.69 Development
0 70 0 89 R l
SRL 1
SRL 3
0.70 – 0.89 Release
0.90 – 1.00 Post Release
© 2007 Stevens Institute of Technology

Other Case ExamplesOther Case Examples
Hubble Space Telescope-Mars Climate Orbiter (MCO):
Sauser, B., J. Ramirez-Marquez, D. Henry and D. Dimarzio. (2007). “A System Maturity Index for the Systems Engineering Life Cycle.” International Journal of Industrial and Systems Engineering. 3(6). (forthcoming)
p pSM-1: Servicing Mission (SM) to Hubble to correct the spherical aberration present on the primary mirror, and provide
( )Robotic spacecraft sent to orbit Mars and collect data on Martian atmospheric conditions, and act as a communications relay for future missions. MCO failed due t i l bit d t d necessary support
maintenance. SM-1 resulted in successful servicing of Hubble, a return to successful science operations and a safe return
to impulse-bit data was assumed to be produced by the “Small Forces” files in Newton-Seconds (N-s), whereas “Small Forces” actually output in Pound-Seconds (lbs-s)
SRL = 0.74SRL = 0 84
Hubble Space Telescope-RSM: Service Hubble and other spacecraft using a
operations, and a safe return of shuttle crew.
ARIANE 5: Launch platform for delivering payloads into Earth Orbit ARIANE 5 failed when an
Seconds (lbs-s). SRL = 0.84
other spacecraft using a robotic servicing craft thereby reducing cost, and the risk to human life. A problem arose when the technology and concepts for RSM were
Orbit. ARIANE 5 failed when an inertial Reference System failed 36.7 seconds after launch due to a software exception caused by the rocket’s horizontal velocity, which was within thresholds,
unproven in space and a RSM seemed not to be feasible in time.
,exceeding the limit of what the onboard-software could handle.
SRL = 0.67 SRL = 0.65

0.1 1.00.2 0.3 0.4 0.5 0.6 0.7 0.8 0.9
System Readiness Level
User Requirements Definition Phase
Concept Definition Phase
System Specification
Phase
AcqPrep Phase
Source Select. Phase
Development Phase
Verification Phase
Deployment Phase
Study Period Implementation Period Operations Period
Operations and Maintenance Phase
Deactivation Phase
Typical High‐Tech Commercial System
Integrator
Concept Stage Development StageProduction
Stage
Utilization Stage
Retirement Stage
ISO 15288Stage
Support Stage
Stage
Pre‐Systems Acquisition System Acquisition SustainmentUS Department
Concept and Technology Development
System Development & Demonstration
Production and Deployment
Operations and Support(including Disposal)
Ph B Ph D
of Defense (DoD) 5000.2
NationalPre‐Phase AConcept Studies
Phase BPreliminary Design &
Technology Completion
Phase AConcept & Technology Development
Phase CFinal Design & Fabrication
Phase DSystem
Assembly, Int.& Test, Launch
Phase EOperations & Sustainment
Phase FCloseout
National Aeronautics and
Space Administration
HST‐RM
© 2007 Stevens Institute of Technology
MCOSRL 0.74
ARIANE 5SRL 0.67
SRL 0.65
HST‐SMSRL 0.84
Sauser, B., J. Ramirez-Marquez, D. Henry and D. Dimarzio. (2007). “A System Maturity Index for the Systems Engineering Life Cycle.” International Journal of Industrial and Systems Engineering. 3(6). (forthcoming)

System Readiness Potential (SRP)System Readiness Potential (SRP)
Optimization Example of System Alpha

SRL Optimization of System Alpha*SRL Optimization of System Alpha
© 2007 Stevens Institute of Technology
* This example assumes TRLs are held constant

System Readiness Potential (SRP)System Readiness Potential (SRP)
TechnologiesIRL Level Cost Time Cost Time
1,2 2,3
Table 1: Cost and Time Consumption by IRLTable 2: Optimization Results
Objective Function (SRL) 0 7243
System Readiness Potential (SIP)
based on resource allocation
1 $0 0 $0 02 $123 80 $0 03 $219 380 $0 04 $595 532 $0 05 $700 621 $0 0
Objective Function (SRL) 0.7243Cost Constraint $1,110Time constraint 1145IRL(1,2) Constraint 1IRL(2 3) Constraint 16 $808 862 $0 0
7 $1,003 997 $0 08 $1,110 1145 $400 1659 $1,452 1623 $650 389
Available Resources Cost $1,400 Time 1200 Recommendation:
IRL(2,3) Constraint 1
Increase IRL (1,2) from its current value to 8
Increase IRL (2,3) stays at current value of 7
© 2007 Stevens Institute of Technology
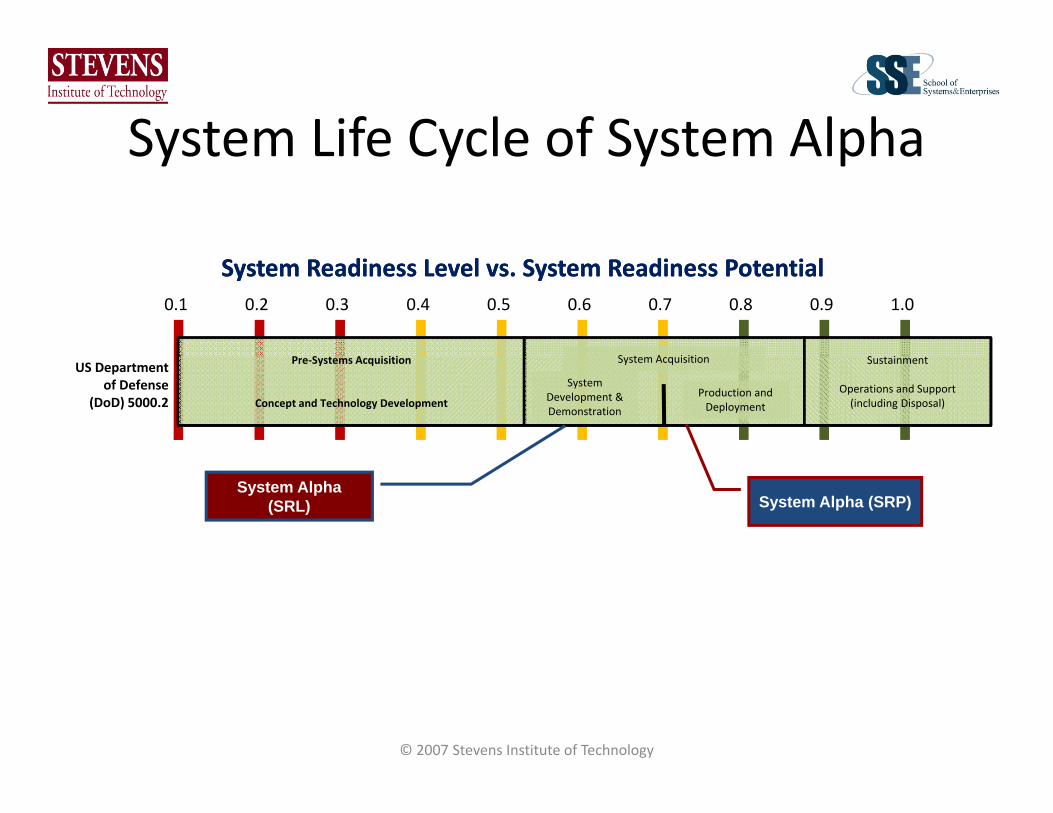
System Life Cycle of System AlphaSystem Life Cycle of System Alpha
0.1 1.00.2 0.3 0.4 0.5 0.6 0.7 0.8 0.9
S A i i i
System Readiness Level vs. System Readiness PotentialSystem Readiness Level vs. System Readiness Potential
Pre‐Systems Acquisition
Concept and Technology Development
System Acquisition
System Development & Demonstration
Production and Deployment
Sustainment
Operations and Support(including Disposal)
US Department of Defense
(DoD) 5000.2
System Alpha (SRP)System Alpha
(SRL)
© 2007 Stevens Institute of Technology

Spiral Development of System Alpha
0.10.10.20.2
0 30 3
0.40.4
0 50 5
0.60.6
0 70 7
0.80.8
0 90 9
1.01.0
Planning Development Release Post Release
0.30.3 0.50.5 0.70.7 0.90.9
2 Years
System Alpha (SRL)
System Alpha (SRP)
SRL Spiral Development Activity
≤ 0.3 Planning
0.31 – 0.69 Development
0.70 – 0.89 Release
0.90 – 1.00 Post Release
© 2007 Stevens Institute of Technology

System Architecture Models
SRL C l l i
SRLi =1n
IMLij ×TRL jj=1
n
∑
SRL Calculation
System Optimization
Life Cycle Impacts
Acquisition Life‐cycle Planning
© 2007 Stevens Institute of Technology25

PublicationsPublicationsSauser, B., J. Ramirez-Marquez, D. Henry and D. Dimarzio. (2008). “A System Maturity Index for the Systems Engineering Life Cycle.” International Journal of I d t i l d S t E i i 3(6) (f th i )Industrial and Systems Engineering. 3(6). (forthcoming)
Gove, R., B. Sauser, J. Ramirez-Marquez. (2007). “Integration Maturity Metrics: Development of an Integration Readiness Level.” Acta Astronautica (under review)
Ramirez-Marquez, J. and B. Sauser. (2007). “Optimization of a System Maturity Index for the Systems Engineering Life Cycle.” Stevens Institute of Technology. (working paper)
Sauser, B.J., D. Verma, J. Ramirez-Marquez, and R. Gove. (2006). “From TRL to SRL: The Concept of Systems Readiness Levels.” Conference on Systems Engineering Research, April 7-8. Los Angles, CA
26© 2007 Stevens Institute of Technology

More Case ExamplesMore Case ExamplesDr. Brian Sauser
[email protected] @ste e s.edu
Dr. Jose Emmanuel Ramirez‐[email protected]
Stevens Institute of TechnologySchool of Systems and Enterprises
Castle Point on HudsonHoboken, NJ 07030,
© 2007 Stevens Institute of Technology27

System Readiness Level
‐ System Beta* ‐
* System Beta is based on data collected from a real system.
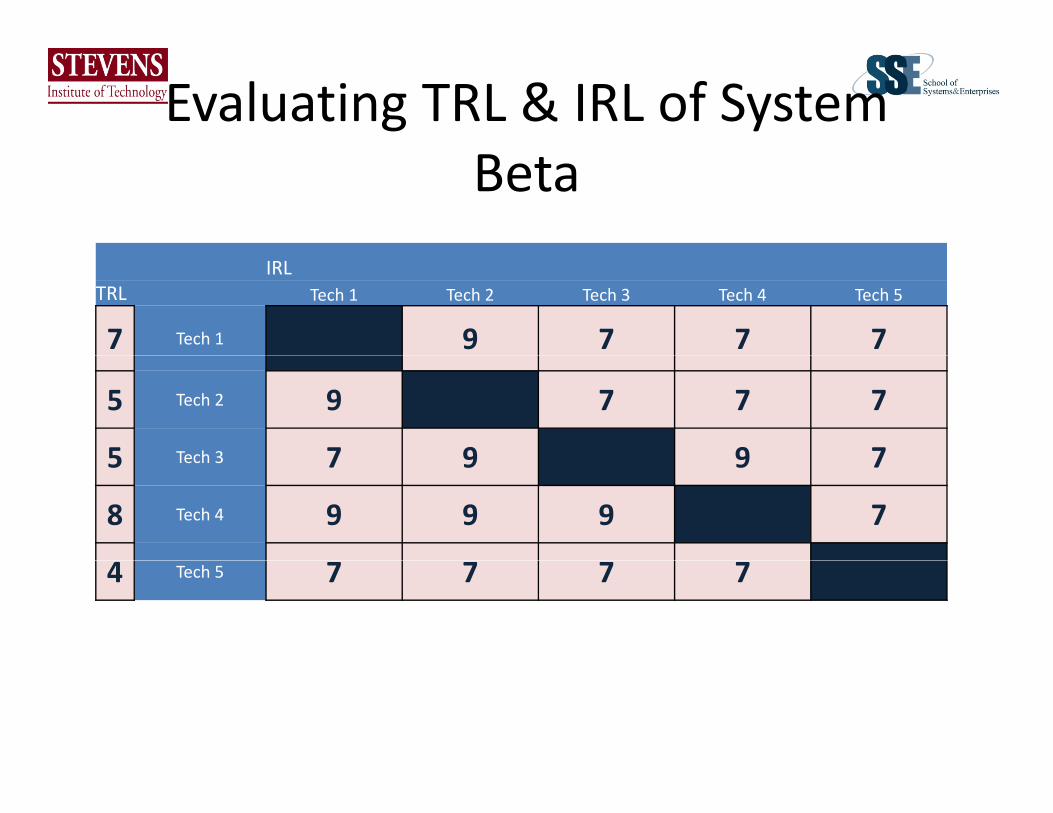
Evaluating TRL & IRL of System Beta
IRLTRL Tech 1 Tech 2 Tech 3 Tech 4 Tech 5
7 Tech 1 9 9 7 7 7
5 Tech 2 9 9 7 7 7
5 Tech 3 7 9 9 9 75 Tech 3 7 9 9 9 7
8 Tech 4 9 9 9 9 7
4 Tech 5 7 7 7 7 9

SRL Calculation of System BetaSRL Calculation of System BetaSub‐Sys SRL Comp SRL
Tech 1 0.67 0.58
Tech 2 0.48h ld b l d h h
Tech 3 0.51
Tech 4 0.85
System Beta should be early to mid‐way through a life cycle phase at which it is:
Developing a system or increment of capability;
Tech 5 0.37
e e op g a syste o c e e t o capab ty;Reducing integration and manufacturing risk;Ensuring operational supportability; reducing
logistics footprint;I l ti h t i t tiImplementing any human systems integration;Designing for producibility;Ensuring affordability and protection of critical
program information; and Demonstrating system p g g yintegration, interoperability, safety, and utility.

System Life Cycle of System BetaSystem Life Cycle of System Beta
0.1 1.00.2 0.3 0.4 0.5 0.6 0.7 0.8 0.9
S A i i i
System Readiness LevelSystem Readiness Level
Pre‐Systems Acquisition
Concept and Technology Development
System Acquisition
System Development & Demonstration
Production and Deployment
Sustainment
Operations and Support(including Disposal)
US Department of Defense
(DoD) 5000.2
Tech 2System Beta
Tech 5
Tech 1
Tech 3
Tech 4
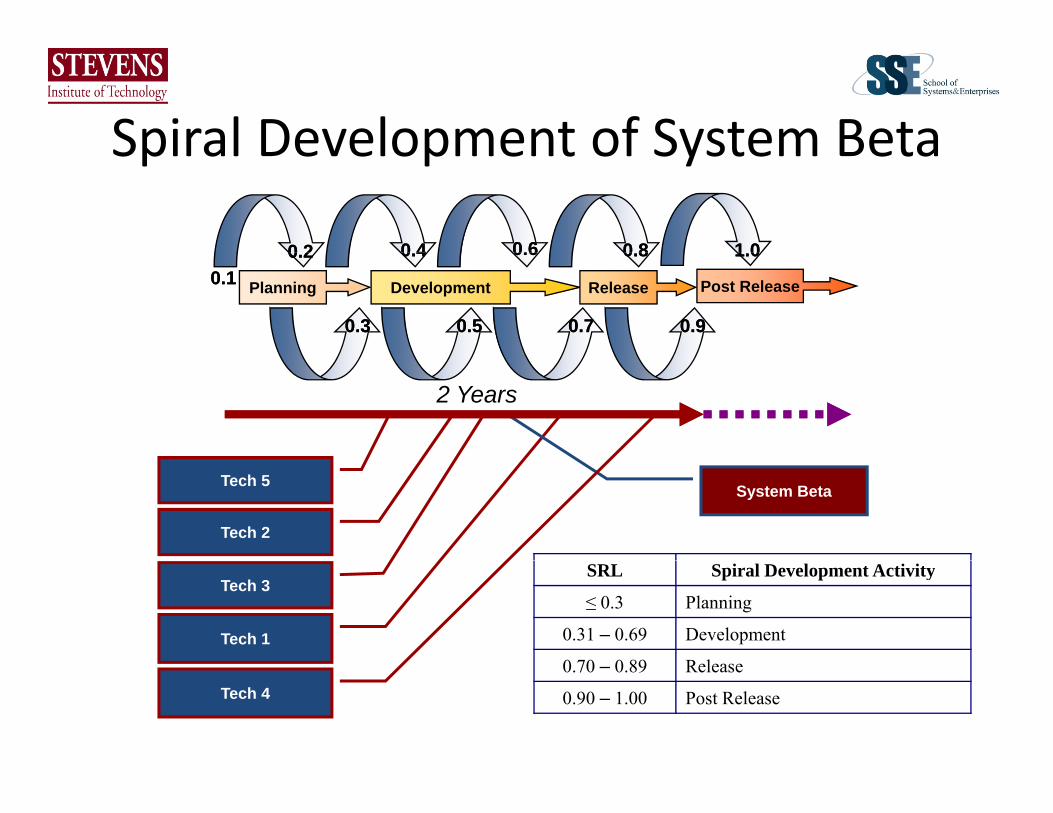
Spiral Development of System BetaSpiral Development of System Beta
0 20 2 0 40 4 0.60.6 0 80 8 1 01 00.10.1
0.20.2
0.30.3
0.40.4
0.50.5
0.60.6
0.70.7
0.80.8
0.90.9
1.01.0
Planning Development Release Post Release
2 Years
Tech 2
System BetaTech 5
SRL Spiral Development Activity
≤ 0.3 Planning
0.31 – 0.69 Development
0 70 0 89 R lTech 1
Tech 3
0.70 – 0.89 Release
0.90 – 1.00 Post ReleaseTech 4

0.1 1.00.2 0.3 0.4 0.5 0.6 0.7 0.8 0.9
System Readiness Level
User Requirements Definition Phase
Concept Definition Phase
System Specification
Phase
AcqPrep Phase
Source Select. Phase
Development Phase
Verification Phase
Deployment Phase
Study Period Implementation Period Operations Period
Operations and Maintenance Phase
Deactivation Phase
Typical High‐Tech Commercial System
Integrator
Concept Stage Development StageProduction
Stage
Utilization Stage
Retirement Stage
ISO 15288Stage
Support Stage
Stage
Pre‐Systems Acquisition System Acquisition SustainmentUS Department
Concept and Technology Development
System Development & Demonstration
Production and Deployment
Operations and Support(including Disposal)
Ph B Ph D
of Defense (DoD) 5000.2
NationalPre‐Phase AConcept Studies
Phase BPreliminary Design &
Technology Completion
Phase AConcept & Technology Development
Phase CFinal Design & Fabrication
Phase DSystem
Assembly, Int.& Test, Launch
Phase EOperations & Sustainment
Phase FCloseout
National Aeronautics and
Space Administration
System BetaSRL 0.58

Calculating
d lSystem Readiness Level
System Delta*‐ System Delta* ‐
* System Beta is based on data collected from a real system.

Preliminary Design Review (PDR)Preliminary Design Review (PDR)IRL
TRL Sub‐System Tech 1 Tech 2 Tech 3TRL Sub System Tech 1 Tech 2 Tech 32 Tech 1 9 2 32 Tech 2 2 9 39 Tech 3 3 3 9
0.1 1.00.2 0.3 0.4 0.5 0.6 0.7 0.8 0.9
System Readiness LevelSystem Readiness Level
Pre‐Systems Acquisition
Concept and Technology Development
System Acquisition
System Development & Demonstration
Production and Deployment
Sustainment
Operations and Support(including Disposal)
US Department of Defense
(DoD) 5000.2
Sub‐Sys SRL Comp SRLTech 1 0 12 0 26Tech 1 0.12 0.26Tech 2 0.12Tech 3 0.56

Critical Design Review (CDR)Critical Design Review (CDR)
TRL Sub‐System Tech 1 Tech 2 Tech 33 T h 1 9 3 33 Tech 1 9 3 33 Tech 2 3 9 39 Tech 3 3 3 9
0.1 1.00.2 0.3 0.4 0.5 0.6 0.7 0.8 0.9
System Readiness LevelSystem Readiness Level
Pre‐Systems Acquisition
Concept and Technology Development
System Acquisition
System Development & Demonstration
Production and Deployment
Sustainment
Operations and Support(including Disposal)
US Department of Defense
(DoD) 5000.2
Sub‐Sys SRL Comp SRLTech 1 0.19 0.31Tech 2 0.19Tech 3 0.56

CDR with Modeling & SimulationCDR with Modeling & SimulationIRL
TRL Sub‐System Tech 1 Tech 2 Tech 3y3 Tech 1 9 6 63 Tech 2 6 9 69 Tech 3 6 6 9
0.1 1.00.2 0.3 0.4 0.5 0.6 0.7 0.8 0.9
System Readiness LevelSystem Readiness Level
Pre‐Systems Acquisition
Concept and Technology Development
System Acquisition
System Development & Demonstration
Production and Deployment
Sustainment
Operations and Support(including Disposal)
US Department of Defense
(DoD) 5000.2
Sub‐Sys SRL Comp SRLTech 1 0 26 0 43Tech 1 0.26 0.43Tech 2 0.26Tech 3 0.78

Pre‐IntegrationPre IntegrationIRL
TRL Sub‐System Tech 1 Tech 2 Tech 3y6 Tech 1 9 7 66 Tech 2 7 9 49 Tech 3 6 4 9
0.1 1.00.2 0.3 0.4 0.5 0.6 0.7 0.8 0.9
System Readiness LevelSystem Readiness Level
Pre‐Systems Acquisition
Concept and Technology Development
System Acquisition
System Development & Demonstration
Production and Deployment
Sustainment
Operations and Support(including Disposal)
US Department of Defense
(DoD) 5000.2
Sub‐Sys SRL Comp SRLT h 1 0 54 0 58Tech 1 0.54 0.58Tech 2 0.49Tech 3 0.70

Post‐IntegrationPost IntegrationIRL
TRL Sub‐System Tech 1 Tech 2 Tech 36 Tech 1 9 7 66 Tech 2 7 9 69 Tech 3 6 6 9
0.1 1.00.2 0.3 0.4 0.5 0.6 0.7 0.8 0.9
System Readiness LevelSystem Readiness Level
Pre‐Systems Acquisition
Concept and Technology Development
System Acquisition
System Development & Demonstration
Production and Deployment
Sustainment
Operations and Support(including Disposal)
US Department of Defense
(DoD) 5000.2
Sub‐Sys SRL Comp SRLhTech 1 0.54 0.62
Tech 2 0.54Tech 3 0.78
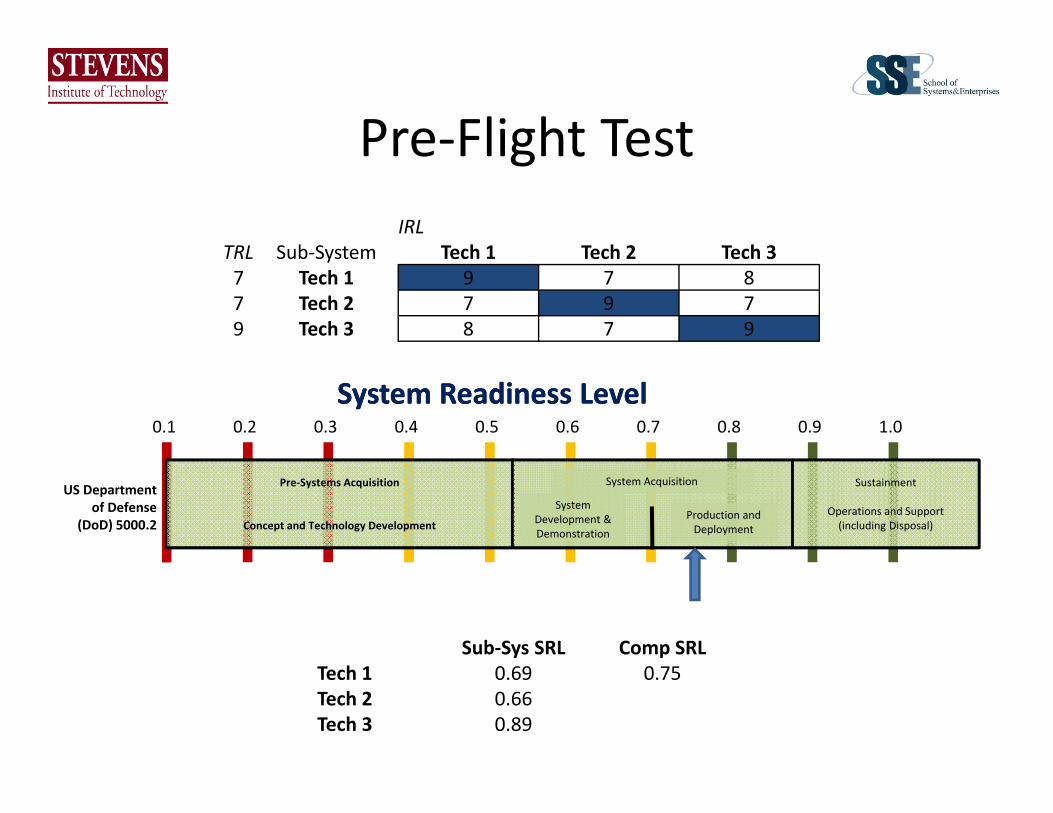
Pre‐Flight TestPre Flight TestIRL
TRL Sub‐System Tech 1 Tech 2 Tech 3TRL Sub‐System Tech 1 Tech 2 Tech 37 Tech 1 9 7 87 Tech 2 7 9 79 Tech 3 8 7 9
0.1 1.00.2 0.3 0.4 0.5 0.6 0.7 0.8 0.9
System Readiness LevelSystem Readiness Level
Pre‐Systems Acquisition
Concept and Technology Development
System Acquisition
System Development & Demonstration
Production and Deployment
Sustainment
Operations and Support(including Disposal)
US Department of Defense
(DoD) 5000.2
Sub‐Sys SRL Comp SRLTech 1 0.69 0.75Tech 2 0.66Tech 3 0.89

Post‐Flight TestPost Flight TestIRL
TRL Sub System Tech 1 Tech 2 Tech 3TRL Sub‐System Tech 1 Tech 2 Tech 38 Tech 1 9 8 88 Tech 2 8 9 89 Tech 3 8 8 9
0.1 1.00.2 0.3 0.4 0.5 0.6 0.7 0.8 0.9
System Readiness LevelSystem Readiness Level
Pre‐Systems Acquisition
Concept and Technology Development
System Acquisition
System Development & Demonstration
Production and Deployment
Sustainment
Operations and Support(including Disposal)
US Department of Defense
(DoD) 5000.2
Sub‐Sys SRL Comp SRLTech 1 0.82 0.86Tech 1 0.82 0.86Tech 2 0.82Tech 3 0.93
© 2007, Stevens Institute of Technology 19
6. References [1] DoD, "DoD Directive 5000.1," D. o. Defense, Ed., 2005. [2] B. Sauser, D. Verma, J. Ramirez-Marquez, and R. Gove, "From TRL to SRL: The Concept of
Systems Readiness Levels," in Conference on Systems Engineering Research, Los Angeles, CA, 2006.
[3] J. C. Mankins, "Approaches to Strategic Research and Technology (R&T) Analysis and Road Mapping," Acta Astronautica, vol. 51, pp. 3-21, 2002.
[4] GAO, "Better Management of Technology Development Can Improve Weapon System Outcomes." vol. GAO/NSIAD-99-162, U. S. G. A. Office, Ed.: Government Accounting Office, July 30, 1999.
[5] T. Dowling and T. Pardoe, "TIMPA - Technology Insertion Metrics Volume 1," M. o. Defence, Ed.: QinetiQ, 2005.
[6] A. Meystel, J. Albus, E. Messina, and D. Leedom, "Performance Measures for Intelligent Systems: Measures of Technology Readiness," PERMIS '03 White Paper, 2003.
[7] J. D. Smith, "An Alternative to Technology Readiness Levels for Non-Developmental Item (NDI) Software," in 38th Hawaii International Conference on System Sciences, Hawaii, 2005.
[8] R. Valerdi and R. J. Kohl, "An Approach to Technology Risk Management," in Engineering Systems Division Symposium, Cambridge, MA, 2004.
[9] D. Cundiff, "Manufacturing Readiness Levels (MRL)," Unpublished white paper, 2003. [10] D. J. Moorehouse, "Detailed Definitions and Guidance for Application of Technology Readiness
Levels," Journal of Aircraft, vol. 39, pp. 190-192, 2001. [11] R. Shishkio, D. H. Ebbeler, and G. Fox, "NASA Technology Assessment Using Real Options
Valuation," Systems Engineering, vol. 7, pp. 1-12, 2003. [12] D. M. Buede, The Engineering Design of Systems. New York: John Wiley & Sons, 2000. [13] B. Sauser, J. Ramirez-Marquez, D. Henry, D. Dimarzio, and J. Rosen, "Methods for Estimating
System Readiness Levels," School of Systems and Enterprises White Paper, 2007. [14] D. Verma, J. Beck, and T. Parry, "Designing and Assessing Supportability in DoD Weapon
Systems: A Guide to Increased Reliability and Reduced Logistics Footprint," OSD, Ed.: DoD, 2003.
[15] D. Verma, J. Farr, and L. H. Johannesen, "System Training Metrics and Measures: A Key Operational Effectiveness Imperative," Systems Engineering, vol. 6, pp. 238-248, 2003.
[16] J. E. Ramirez-Marquez and D. Coit, "A Heuristic for Solving the Redundancy Allocation Problem for Multistate Series-Parallel Systems," Reliability Engineering and System Safety, vol. 83, pp. 341-349, 2004.
[17] J. E. Ramirez-Marquez, D. Coit, and A. Konak, "Reliability Optimization of Series-Parallel Systems Using a Max-Min Approach," IIE Transactions, vol. 36, p. 891, 2004.