system complexity and the challenge of too much medicine - neel shah.pdfsystem complexity and the...
TRANSCRIPT

@neel_shah
System Complexity and the Challenge of Too Much Medicine
Neel Shah, MD, MPP
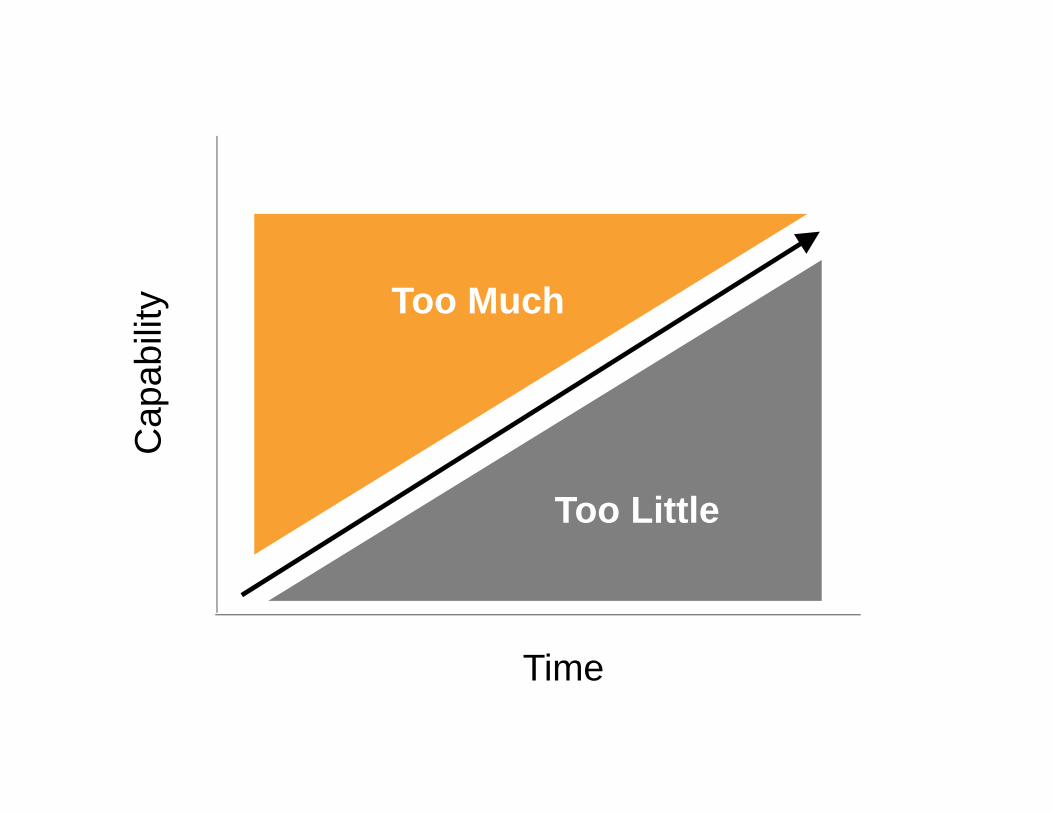
Cap
abili
ty
Too Little
Too Much
Time

United States Cesarean Deliveries, 1970-2010

United States Cesarean Delivery Rate (%)
0
5
10
15
20
25
30
35
1965 1970 1975 1980 1985 1990 1995 2000 2005 2010
Healthy People 2000: 15% CD Rate
Electronic fetal monitoring saturates market
Trial of labor after cesarean promoted

United States Cesarean Delivery Rate (%)
0
5
10
15
20
25
30
35
1965 1970 1975 1980 1985 1990 1995 2000 2005 2010
Healthy People 2000: 15% CD Rate
Electronic fetal monitoring saturates market
Trial of labor after cesarean promoted


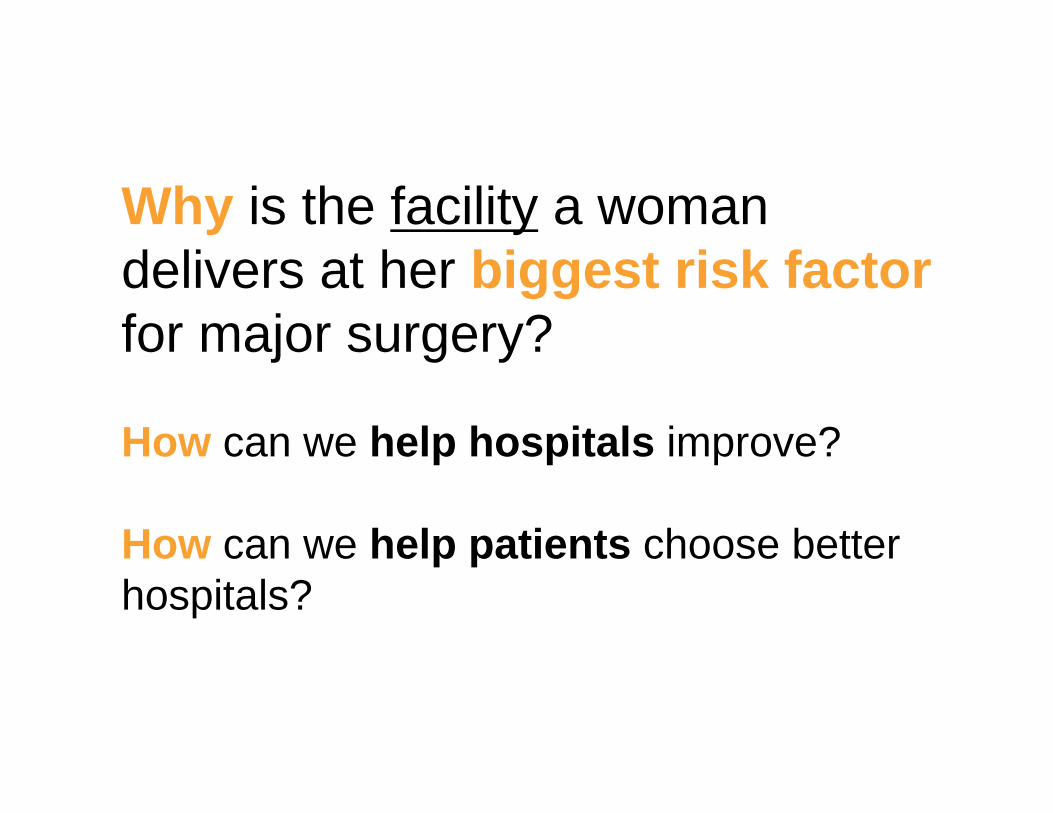
Why is the facility a woman delivers at her biggest risk factor for major surgery?
How can we help hospitals improve?
How can we help patients choose better hospitals?


73.2% emphasize their choice of OB/midwife over hospital
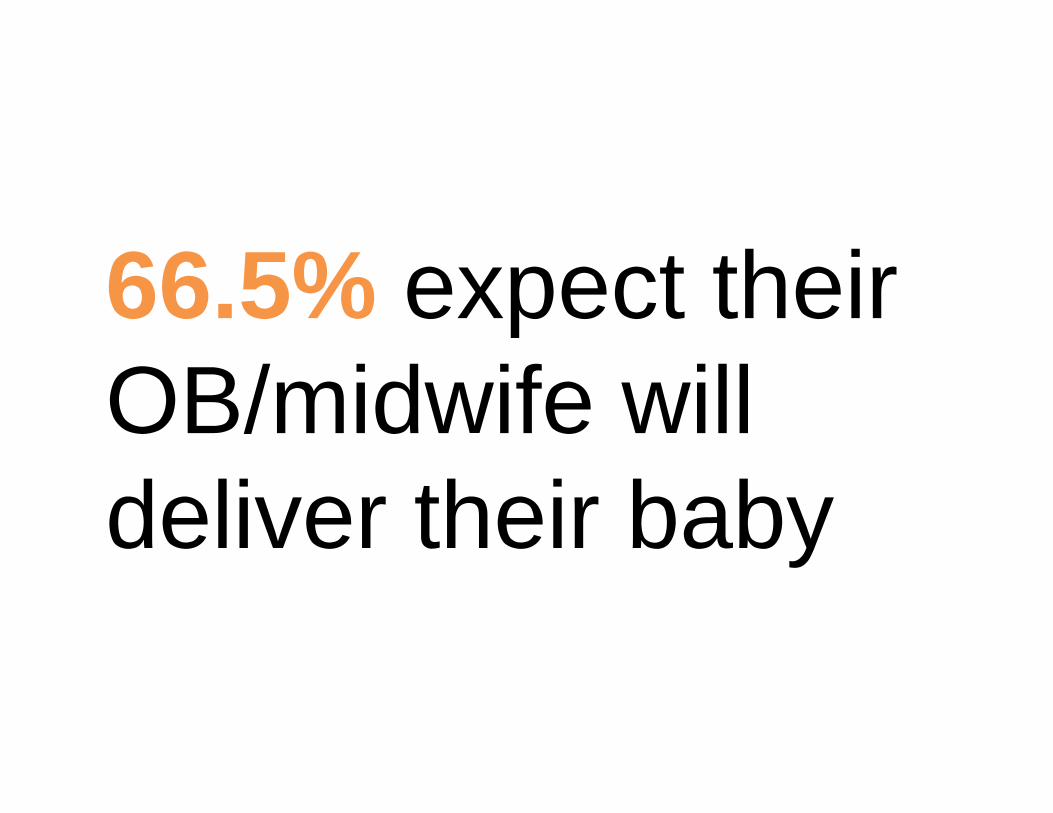
66.5% expect their OB/midwife will deliver their baby

55.1% do not believe their choice of hospital will impact their chance of CD

74.9% understand that quality of care varies across hospitals—few value existing metrics

0.00%
20.00%
40.00%
60.00%
80.00%
100.00%
C‐sectionRate
MaternalBirth
TraumaRate
NeonatalBirth
TraumaRate
ObstetricInfectionRate
GeneralHospitalQuality
Somewhat/VeryImportant
Notimportant/Don'tKnow
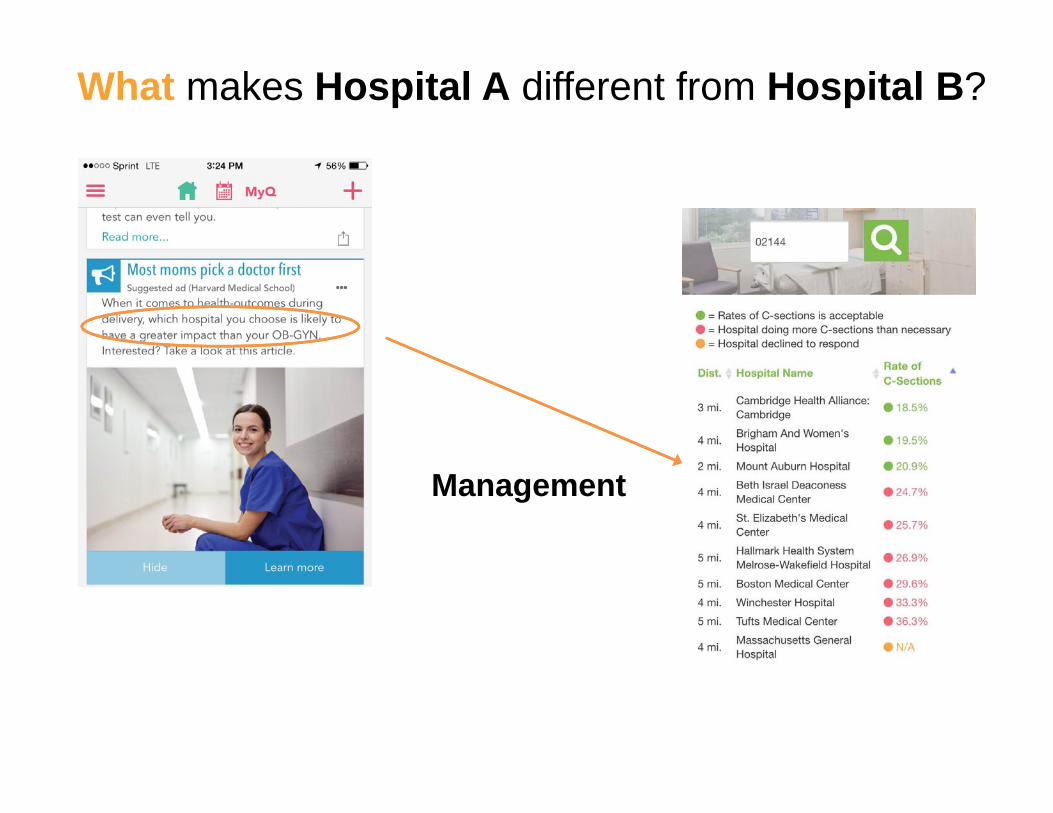
What makes Hospital A different from Hospital B?
Management


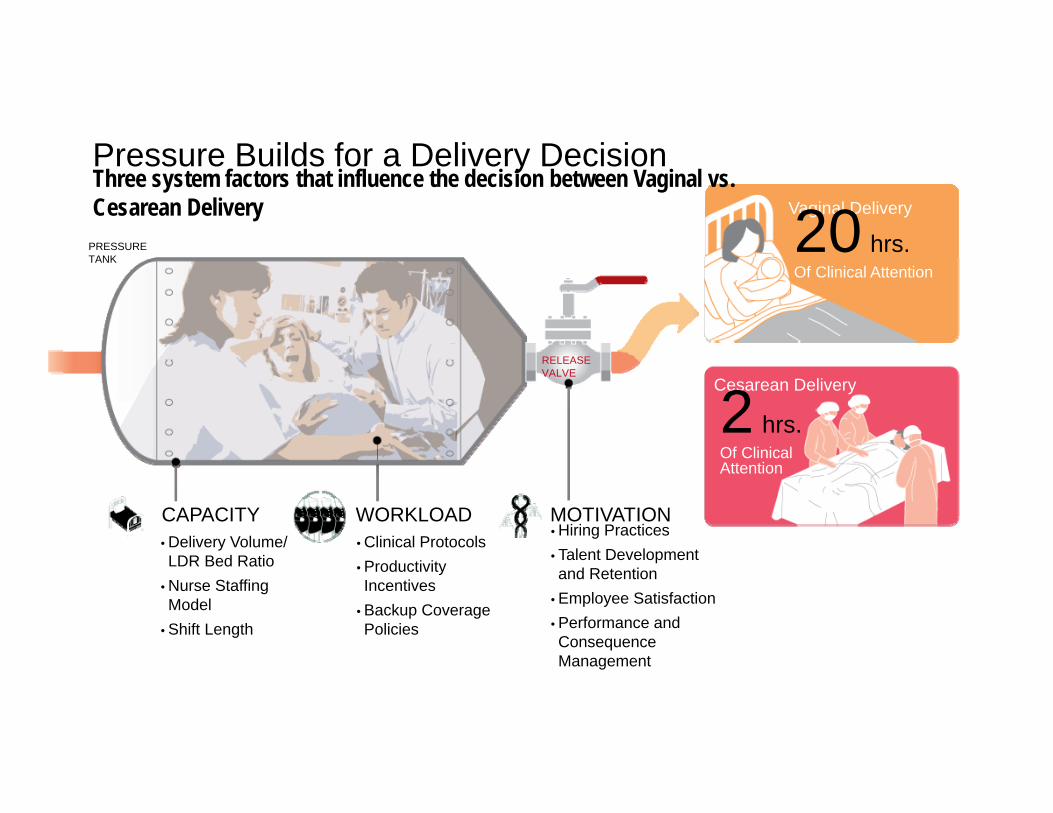
• Clinical Protocols• Productivity Incentives
• Backup Coverage Policies
WORKLOAD
Pressure Builds for a Delivery DecisionThree system factors that influence the decision between Vaginal vs. Cesarean Delivery
PRESSURETANK
CAPACITY
Cesarean Delivery
• Delivery Volume/LDR Bed Ratio
• Nurse Staffing Model
• Shift Length
• Hiring Practices• Talent Developmentand Retention
• Employee Satisfaction• Performance and Consequence Management
Vaginal Delivery
MOTIVATION
2 hrs.Of Clinical Attention
RELEASEVALVE
20 hrs.Of Clinical Attention
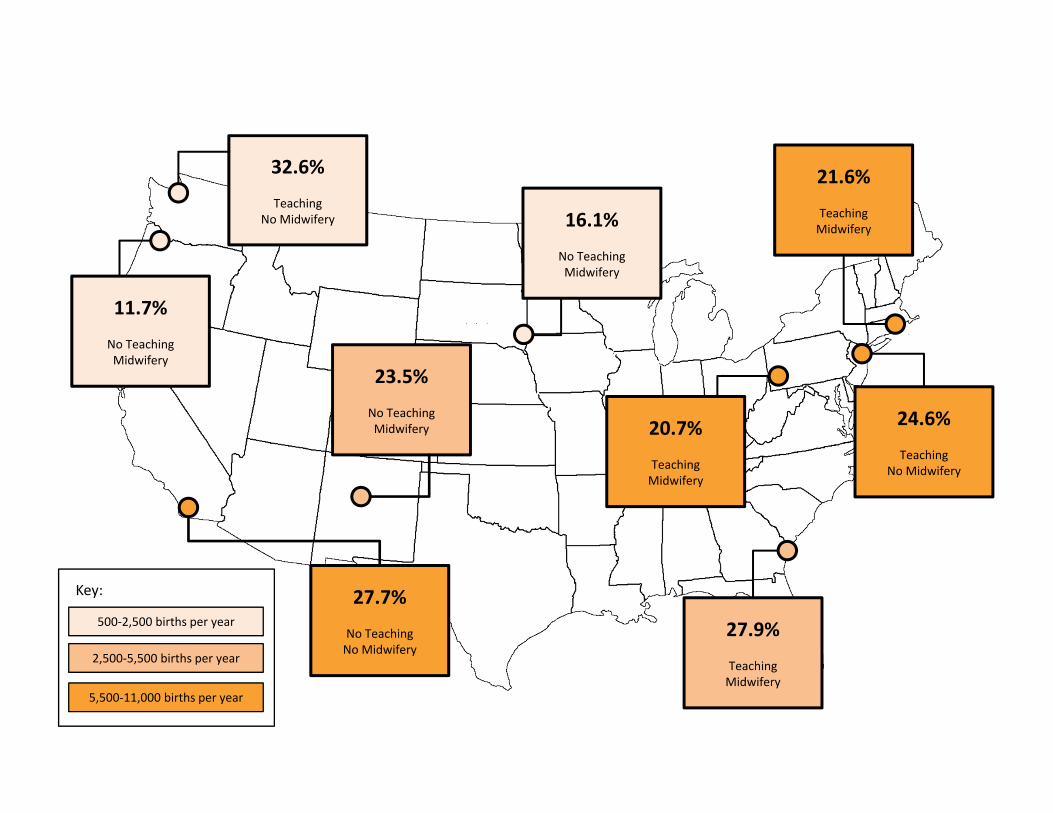
Key:
24.6%
TeachingNo Midwifery
27.7%
No TeachingNo Midwifery
23.5%
No TeachingMidwifery
11.7%
No TeachingMidwifery
32.6%
TeachingNo Midwifery 16.1%
No TeachingMidwifery
20.7%
TeachingMidwifery
27.9%
TeachingMidwifery
500‐2,500 births per year
2,500‐5,500 births per year
5,500‐11,000 births per year
21.6%
TeachingMidwifery

Patient Level ModelINPUTSINPUTS
Patient Covariates:• Age at admission• Age squared• Race (16.4% missing)• Interaction of age & race• Payer (3.3% missing)• MS-DRG
Hospital Covariates:• Teaching Status• Total Deliveries (2013-
2014)• NICU Level
Hospital Management:• Capacity• Workload• Motivation
OUTPUTSC-section Rates / Length of Stay / Adverse Outcomes
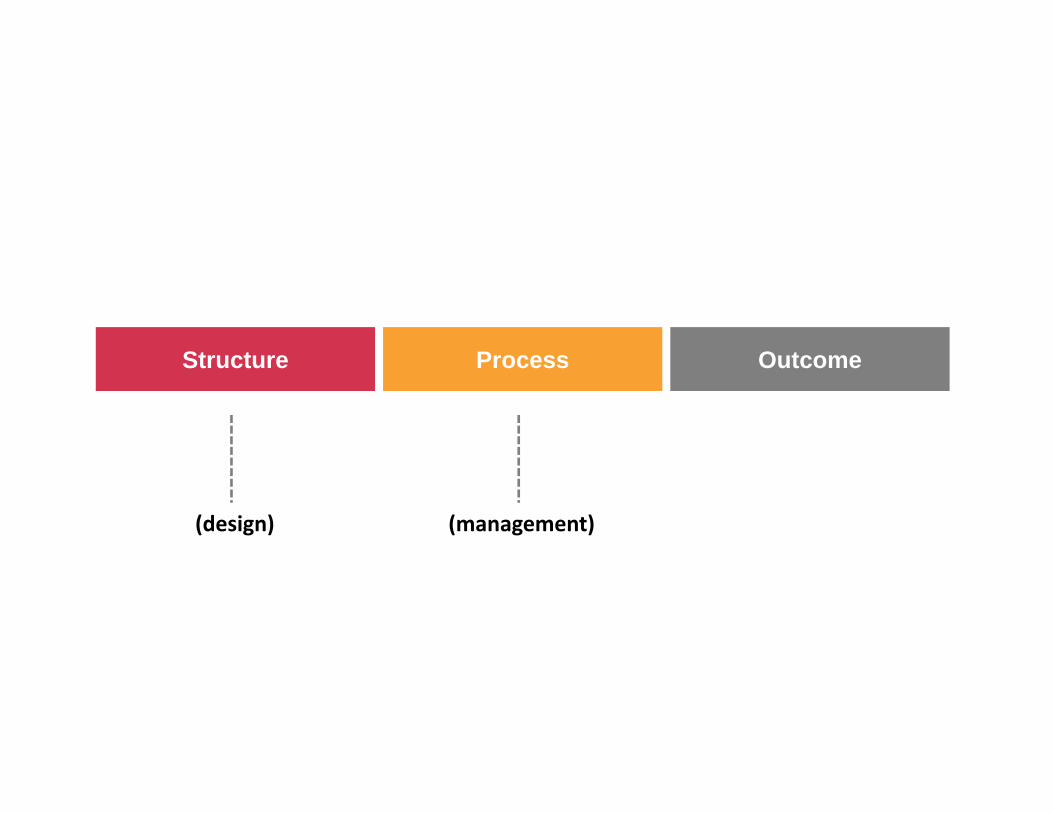
Structure Process Outcome
(management)(design)


Room Demand vs. Cesarean Rate
10%
20%
30%
40%
Ces
area
n R
ate
300 450150
Annual Deliveries per Labor & Delivery Room

What improved knowledge, skills, and/or toolsto managers need to run better labor and delivery units?
Case scheduling strategies
Nurse workload measurement
Dynamic bed management
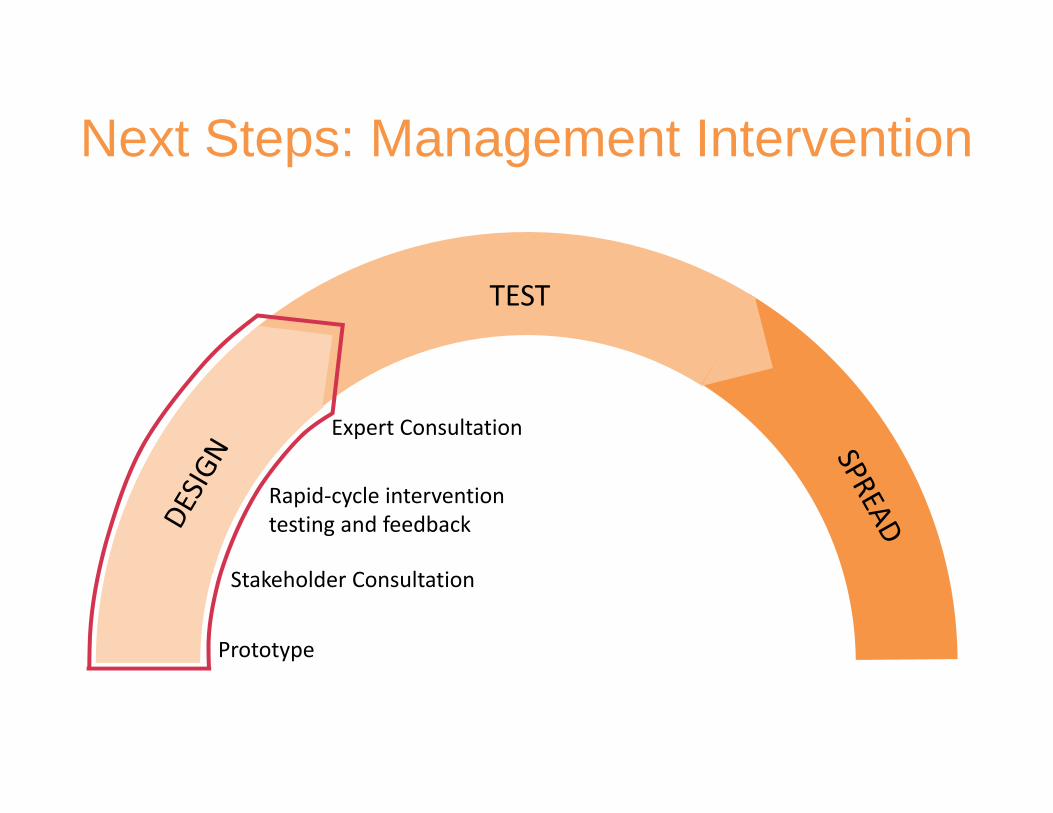
Next Steps: Management Intervention
Stakeholder Consultation
Rapid‐cycle intervention testing and feedback
TEST
Prototype
Expert Consultation