synthesis, structural and morphological characterization ... · 59 volume 30, número 1, 2005 ecl....
TRANSCRIPT

59
Volume 30, número 1, 2005www.scielo.br/eq
Ecl. Quím., São Paulo, 30(1): 59-64, 2005
Synthesis, structural and morphological characterization of CeO2 – ZnO nanosized powder systems from Pechini´s method
C. Peverari*, A. M. Pires, R. R. Gonçalves, O. A. Serra.Dept. Química, FFCLRP, USP, Av. Bandeirantes 3900, 14040-901, Ribeirão Preto, SP, Brazil.
Abstract: This work reports on the investigation of nanosized CeO2-ZnO systems prepared by Pechini´smethod. The structural and morphological characterization of CeO2-ZnO systems as well as thecharacterization of CeO2 and ZnO separately, showed that the employed method result in powders withspheroidal particles whose size are in the range 30 - 200 nm, which is appropriate to provide homogeneoussuspensions. The ZnO present in the prepared mixed oxides seems to increase particle size distribution andto influence the arrangement of the particles after powder dispersion.
Keywords: cerium oxide; zinc oxide; nanopowder; Pechini´s method.
Introduction
Ultrafine nm-sized particles have attractedmuch attention since they often exhibit physicaland chemical properties that are significantlydifferent from those of bulk materials [1]. In parti-cular, materials with high surface area haveimportance in two major fields: ceramic science andcatalysis [2]. In recent years, nanotechnology hascreated excitement in a wide array of sectors in boththe scientific and financial communities. Cosmeticchemists may not have realized that their industryhas been leading the way in nanotechnology forthe last 10 years with the use of one of the firstnanotechnological products, nanoscaled (<100 nm)inorganic UV absorbers or “nanopowders”.
Cerium oxide is a major compound in theuseful rare earth family and has been applied as auseful glass-polishing material, ultraviolet absorbentand automotive exhaust promoter [3]. Fine particlesof cerium oxide of very small size can becomepotential new materials that maybe useful for fineUV absorbent and high-activity catalysts. Manystudies have reported the synthesis of nanosizedparticles of ceria with various purposes. However,because of its high catalytic activity for the
oxidation of organic material, CeO2 has seldom beenused commercially as a sunscreen material. So, theintroduction of ZnO should reduce the oxidationcatalytic activity of cerium oxide.
Zinc oxide, for instance, is a versatile materi-al with many applications, including antireflectioncoating, transparent electrodes in solar cells [4],gas sensor [5], varistor [6,7], surface acoustic wavedevices, electro-luminescence and photo-luminescence devices [8-11] and UV blockingmaterials [12-14].
Therefore, this work reports on the synthesis,by Pechini´s method, and the structural,morphological and spectroscopic characterizationof CeO2-ZnO systems in order to better understandhow ZnO modifies the nanostructured CeO2, in thesearch for a new UV filter material.
Material and Methods
CeO2-ZnO mixture preparation from Pechini´smethod
Rare earth (Ce3+) and zinc nitrates solutionswere mixed with citric acid in an appropriatestoichiometry, Ce3+: Zn2+. The mixture was heated

60 Ecl. Quím., São Paulo, 30(1): 59-64, 2005
and stirred in a hot plate at 60oC, and then ethyleneglycol was added and heated at 90oC, resulting ina polymeric resin (polyester). The yellowish resinwas fired at 500oC, and the obtained powder mixedoxides was heated at 900oC, in air, for 4h [15].CeO2 and ZnO powder samples were preparedseparately by using the same Pechini´s method anda mixture of 1CeO2:1ZnO was also obtainedgrinding both oxides in an agate mortar in order tocompare with the mixed oxide samples.
Samples Characterization
The crystalline phase identification wasperformed by X-ray diffraction, XRD (SIEMENSD5005 X-ray diffractometer). The size distributionand powder shapes were observed usingtransmission electron microscopy, TEM, (PhilipsCM200 microscope equipped with DigitalSpectrometer – Prism PGT – Princeton GammaTech) and scanning electron microscopy, SEM(Scanning Electron Microscope Zeiss DSM 940A).For TEM measurements, powder samples weresuspended in ethanol and supported in a coppergrid. For SEM images acquirement the powderswere dispersed in isopropanol, supported inaluminum stubs and after drying, coated by a goldthin layer using sputtering system. For diffusereflectance spectroscopic (DRS) measurements thepowders were ground in agate mortar andcompacted in a black holder. SpectrofluorimeterSPEX–FLUOROLOG II with excitation and emissiondouble monochromators was used to record DRSspectra by synchronously monitoring of bothmonochromators at the same wavelengths [16].
Results and discussion
The XRD patterns of the synthesizedpowders are shown in Fig. 1. For all samples,reflection planes that perfectly match to bothindexed CeO2 cubic structure, space group Fm3m(225) and ZnO hexagonal structure, space groupP63mc (186) [17] are detected. No peak of anyother phase, such as zinc cerate or cerium zincate,is observed indicating that the employed methodleads to a mixture of CeO2 and ZnO phases in allsystems. The X-ray pattern of the mechanicalmixture 1CeO2:1ZnO containing the nanosized oxi-des included in the Fig. 1 shows that the relative
intensity of CeO2 reflection peaks are higher thenthe ZnO one, although both oxides are present inthe same ratio. This difference in intensity due tothe different oxide X-ray absortivity explains whyin the 2CeO2:3ZnO, 3CeO2:2ZnO and 4CeO2:1ZnOsystems the reflection planes characteristic for CeO2are more evident than the ZnO ones.
Figure 1. X-ray powder diffraction patterns of CeO2,ZnO, and the mixed oxides 1CeO2:4ZnO;4CeO2:1ZnO; 2CeO2:3ZnO and 3CeO2:2ZnO,where refers to CeO2 pattern and to ZnO one.1CeO2:1ZnO (*) sample refers to the X-ray patternof a mechanical mixture.
TEM analysis was performed in order toevaluate particle shape and size distribution, Fig. 2.It is possible to observe that cerium and zinc oxides,as well as their mixtures, have spheroidal particleswhose sizes were estimated and listed in Table 1.TEM images also reveal the nanocrystal planes ofthe particles, with their superposition in some cases.

61Ecl. Quím., São Paulo, 30(1): 59-64, 2005
Figure 2. TEM images of the pure oxides (a) CeO2 and (b) ZnO and prepared systems (c) 1CeO2:4ZnO, (d)4CeO2:1ZnO, (e) 2CeO2:3ZnO and (f) 3CeO2:2ZnO.
Table 1. Particle size estimate for the oxide particles from TEM image analysis (Fig. 2).

62 Ecl. Quím., São Paulo, 30(1): 59-64, 2005
In the case of the 1CeO2:4ZnO system, Fig.2c, as it is difficult to well define the border of thebiggest particles, only the small ones wereestimated. Analyzing Table 1, it is possible to verifythat the oxide mixtures present a wide particle sizedistribution, whereas the pure oxides separatelyshow extreme values, i.e., CeO2 displays the smallestparticles and ZnO the biggest ones. Therefore,during TEM analysis, EDS (energy-dispersivespectroscopy) was performed in order to investigateindividual particles in an attempt to establish somerelationship between particle size and composition.As the pure oxides present extreme values, one wouldexpect that in the mixtures CeO2 could form the smallparticles and ZnO the big ones. However, noconclusive relationship was observed, because bothbig and small particles in some cases presented both
metals, Ce and Zn, in their composition. Therefore,the inclusion of ZnO in the CeO2 system increasesthe final particle size distribution even when ZnO ispresent in a lower proportion (4CeO2:1ZnO).
The morphological general aspect of thepowder particles can be observed by the SEMimages, shown in Fig. 3. They reveal how the indivi-dual particles observed by TEM agglomerate afterdispersion in a solvent and drying. For the CeO2sample, Fig. 3a, and the mixtures where this oxide ispresent in higher proportion, Fig. 3d and Fig. 3f, theagglomerates of spheroidal particles show similaraspect. However, ZnO particles, Fig. 3b, as well asthe ones observed in the 2CeO2:3ZnO, Fig. 3c and1CeO2:4ZnO, Fig. 3e systems, seem to be arrangedin layers that form plates. So, ZnO must also beinfluencing the particles arrangement in the mixtures.
Figure 3. SEM images of (a) CeO2, (b) ZnO, (c) 1CeO2:4ZnO, (d) 4CeO2:1ZnO,(e) 2CeO2:3ZnO and (f) 3CeO2:2ZnO nanoparticles.
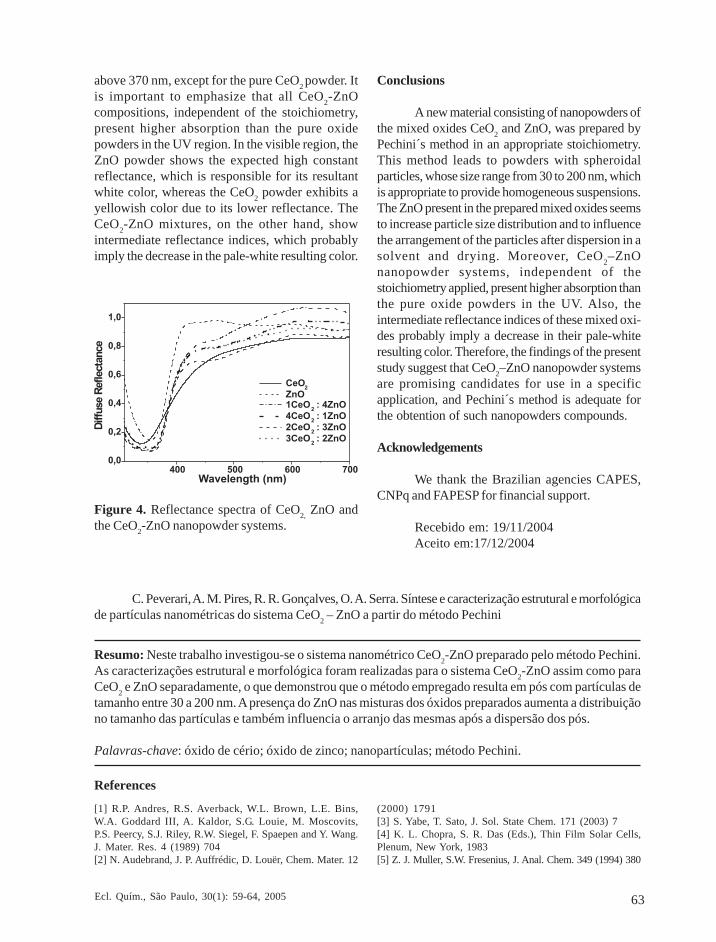
In the powder reflection spectra, lowreflectance values indicate high absorption in thecorresponding wavelength region. Fig. 4 shows thereflection spectra of pressed powders of CeO2-ZnOsystems, compared to those of the pure CeO2 andZnO powders. CeO2, ZnO and CeO2-ZnO systems(1:4, 2:3, 3:2 and 4:1) have the same low reflectancebehavior in the UV region, and a reflectance rate of
almost one in the visible. The reflectance rate ofpure CeO2 is lower than that of the other samples.The most significant region in the UV-B (290-320nm) is above 300 nm, where all samples, except forZnO, present reflectance rate below 0.5, which meanshigh absorption power. All systems show highabsorption over the whole UV-A region (from 320to 400 nm), and their reflectance increases sharply
63Ecl. Quím., São Paulo, 30(1): 59-64, 2005
above 370 nm, except for the pure CeO2 powder. Itis important to emphasize that all CeO2-ZnOcompositions, independent of the stoichiometry,present higher absorption than the pure oxidepowders in the UV region. In the visible region, theZnO powder shows the expected high constantreflectance, which is responsible for its resultantwhite color, whereas the CeO2 powder exhibits ayellowish color due to its lower reflectance. TheCeO2-ZnO mixtures, on the other hand, showintermediate reflectance indices, which probablyimply the decrease in the pale-white resulting color.
Conclusions
A new material consisting of nanopowders ofthe mixed oxides CeO2 and ZnO, was prepared byPechini´s method in an appropriate stoichiometry.This method leads to powders with spheroidalparticles, whose size range from 30 to 200 nm, whichis appropriate to provide homogeneous suspensions.The ZnO present in the prepared mixed oxides seemsto increase particle size distribution and to influencethe arrangement of the particles after dispersion in asolvent and drying. Moreover, CeO2–ZnOnanopowder systems, independent of thestoichiometry applied, present higher absorption thanthe pure oxide powders in the UV. Also, theintermediate reflectance indices of these mixed oxi-des probably imply a decrease in their pale-whiteresulting color. Therefore, the findings of the presentstudy suggest that CeO2–ZnO nanopowder systemsare promising candidates for use in a specificapplication, and Pechini´s method is adequate forthe obtention of such nanopowders compounds.
Acknowledgements
We thank the Brazilian agencies CAPES,CNPq and FAPESP for financial support.
Recebido em: 19/11/2004Aceito em:17/12/2004
Figure 4. Reflectance spectra of CeO2, ZnO andthe CeO2-ZnO nanopowder systems.
C. Peverari, A. M. Pires, R. R. Gonçalves, O. A. Serra. Síntese e caracterização estrutural e morfológicade partículas nanométricas do sistema CeO2 – ZnO a partir do método Pechini
Resumo: Neste trabalho investigou-se o sistema nanométrico CeO2-ZnO preparado pelo método Pechini.As caracterizações estrutural e morfológica foram realizadas para o sistema CeO2-ZnO assim como paraCeO2 e ZnO separadamente, o que demonstrou que o método empregado resulta em pós com partículas detamanho entre 30 a 200 nm. A presença do ZnO nas misturas dos óxidos preparados aumenta a distribuiçãono tamanho das partículas e também influencia o arranjo das mesmas após a dispersão dos pós.
Palavras-chave: óxido de cério; óxido de zinco; nanopartículas; método Pechini.
References
[1] R.P. Andres, R.S. Averback, W.L. Brown, L.E. Bins,W.A. Goddard III, A. Kaldor, S.G. Louie, M. Moscovits,P.S. Peercy, S.J. Riley, R.W. Siegel, F. Spaepen and Y. Wang.J. Mater. Res. 4 (1989) 704[2] N. Audebrand, J. P. Auffrédic, D. Louër, Chem. Mater. 12
(2000) 1791[3] S. Yabe, T. Sato, J. Sol. State Chem. 171 (2003) 7[4] K. L. Chopra, S. R. Das (Eds.), Thin Film Solar Cells,Plenum, New York, 1983[5] Z. J. Muller, S.W. Fresenius, J. Anal. Chem. 349 (1994) 380

64 Ecl. Quím., São Paulo, 30(1): 59-64, 2005
[6] S. Hingorani, V. Pillai, P. Kumar, M.S. Multani, D.O. Shah,Mater. Res. Bull. 28 (1993) 1303[7] Z . L.B. Kong, F. Li, L.Y. Zhang, X. Yao, J. Mater. Sci.Lett. 17 (1998) 769[8] Z .W.C. Shih, M.S. Wu, J. Cryst. Growth 137 (1994) 319[9] C.T. Troy, Photonics Spectra 31 (1997) 56[10] K. Vanheusden, C.H. Seager, W.L. Warren, D.R. Tallant,J. Caruso, M.J. Hampden-Smith, T.T. Kodas, J. Lumin. 75(1997) 11[11] C.M. Mo, Y.H. Li, Y.S. Lin, Y. Zhang, L.P. Zhang, J.Appl. Phys. 83 (1998) 4389[12] M. A. Mitchnick, D. Fairhurst, S. R. Pinnell, J. Am. Acad.Derm. 40 (1999) 85
[13] S. Yabe, M. Yamashita, S. Momose, K. Tahira, S. Yoshida,R. Li, S. Yin, T. Sato, Int. J. Inorg. Mater. 3 (2001) 1003[14] R. Li, S. Yabe, M. Yamashita, S. Momose, S. Yoshida, S.Yin, T. Sato, Mater. Chem and Phys 9343 (2002) 1[15] S. Cicillini, A. M. Pires, O. A. Serra, J. All. Comp. 374(2004) 169[16] D. Moyal, J. L. Refrégier, A. Chardon, Photodermatol.Phatoimmunol. Photomed. 18 (2002) 22[17] Powder Diffraction File PDF-2 database sets 1-44.Pensylvannia: Joint Committee on Powder Diffraction Stan-dards – International Center for Diffraction Data, c 1988.PDF numbers 75-0390 (CeO2), 80-0074 (ZnO). CD – ROM.