synthesis of ptm/graphene (m = w, mo, mn, co, ru
TRANSCRIPT

VILNIUS UNIVERSITY
CENTER FOR PHYSICAL SCIENCES AND TECHNOLOGY
Teofilius
KILMONIS
Synthesis of PtM/graphene (M = W,
Mo, Mn, Co, Ru) nanocomposites,
their characterization and
application in fuel cells
SUMMARY OF DOCTORAL DISSERTATION
Natural sciences,
Chemistry N 003
VILNIUS 2019
This dissertation was written between 2014 and 2018 at the Center for
Physical Sciences and Technology. The research was supported by
Research Council of Lithuania.
Academic supervisor:
Dr. Loreta Tamašauskaitė (Center for Physical Sciences and
Technology, Natural Sciences, Chemistry, N 003)
This doctoral dissertation will be defended in a public meeting of the
Dissertation Defence Panel:
Chairman – Prof. Dr. Aldona Beganskienė (Vilnius University,
Natural Sciences, Chemistry, N 003).
Members:
Prof. Dr. Ingrida Ancutienė (Kaunas University of Technology,
Natural Sciences, Chemistry, N 003).
Prof. Habil. Dr. Albertas Malinauskas (Center for Physical
Sciences and Technology, Natural sciences, Chemistry, N 003).
Dr. Jolanta Rousseau (Artois University (France), Natural Sciences,
Chemistry, N 003).
Dr. Zita Sukackienė (Center for Physical Sciences and Technology,
Natural sciences, Chemistry, N 003).
The dissertation will be defended at a public meeting of the
Dissertation Defence Panel at 2 p.m. on 29th November 2019 in
Auditorium of the Center for Physical Sciences and Technology.
Address: Saulėtekio ave. 3, LT-10257 Vilnius, Lithuania
The text of this dissertation can be accessed at the libraries of Center
for Physical Sciences and Technology and Vilnius University, as well
as on the website of Vilnius University:
www.vu.lt/lt/naujienos/ivykiu-kalendorius

VILNIAUS UNIVERSITETAS
FIZINIŲ IR TECHNOLOGIJOS MOKSLŲ CENTRAS
Teofilius
KILMONIS
PtM/grafeno (M = W, Mo, Mn, Co,
Ru) nanokompozitų sintezė,
apibūdinimas ir taikymas kuro
elementams
DAKTARO DISERTACIJOS SANTRAUKA
Gamtos mokslai,
Chemija N 003
VILNIUS 2019
Disertacija rengta 2014–2018 metais Fizinių ir technologijos mokslų
centre. Mokslinius tyrimus rėmė Lietuvos mokslo taryba.
Mokslinis vadovas:
Dr. Loreta Tamašauskaitė Tamašiūnaitė (Fizinių ir technologijos
mokslų centras, gamtos mokslai, chemija, N 003)
Gynimo taryba:
Pirmininkas – prof. dr. Aldona Beganskienė (Vilniaus universitetas,
gamtos mokslai, chemija, N 003)
Nariai:
prof. dr. Ingrida Ancutienė (Kauno technologijos universitetas,
gamtos mokslai, chemija, N 003)
prof. habil. dr. Albertas Malinauskas (Fizinių ir technologijos
mokslų centras, gamtos mokslai, chemija, N 003)
dr. Jolanta Rousseau (Artois universitetas (Prancūzija), gamtos
mokslai, chemija, N 003)
dr. Zita Sukackienė (Fizinių ir technologijos mokslų centras, gamtos
mokslai, chemija, N 003)
Disertacija bus ginama viešame Gynimo tarybos posėdyje 2019 m.
lapkričio mėn. 29 d. 14 val. Fizinių ir technologijos mokslų centro
salėje. Adresas: Saulėtekio al. 3, LT–10257 Vilnius, Lietuva
Disertaciją galima peržiūrėti Fizinių ir technologijos mokslų centro ir
Vilniaus universiteto bibliotekose ir VU interneto svetainėje adresu:
https://www.vu.lt/naujienos/ivykiu-kalendoriu

5
1. INTRODUCTION
Today energy production and conversion are vital to nations
economy: these processes are strongly connected with nature and
society. Big portion of energy is made from fossil fuel which usage
induce pollution and greenhouse effect. Also polluted air causes local
and global problems. One of problems solution is produced carbon
dioxide reduction. This can be achieved using fuel cells (FC) which
does not produce carbon dioxide and chemical energy is converted
directly to electric energy. FC are effective, low emissions and does
not produce waste products. Also, FC can use various fuels (e.g.
sodium borohydride, hydrazine), can achieve high power, produce
energy locally and globally, they are easily configured. Working FC
prototypes are used from small electronic devices (e.g. mobile phones)
to vehicles and even small power plants. As time passes FC price is
getting lower but it is not low enough to compete with internal
combustion engines. One part of FC price is platinum (used as
catalyst) price. In laboratories new catalysts are created without
platinum or some part of platinum is replaced with other cheaper
metal.
This study is related to the preparation of efficient catalysts,
their characterization and application as the anode materials for direct
borohydride (DBFC) and methanol (DMFC) fuel cells with the aim to
replace expensive noble metal – platinum. Simple and low-cost
method has been used for preparation of catalysts. The graphene
supported platinum, tungsten, molybdenum, cobalt, manganese and
ruthenium nanoparticles have been synthesized using the microwave-
assisted synthesis.
The aim of the work was:
Preparation of efficient catalysts, their characterization and
application as the anode materials for direct borohydride and methanol
fuel cells.

6
The main tasks of the work were as follows:
1. Preparation of PtW/GR, PtMo/GR, PtCoMn/GR,
PtCoMo/GR and PtCoRu/GR catalysts using the microwave
synthesis method.
2. Characterization of the surface morphology and composition
of the fabricated PtW/GR, PtMo/GR, PtCoMn/GR,
PtCoMo/GR and PtCoRu/GR catalysts using transmission
electron microscopy and inductively coupled plasma optical
emission spectroscopy.
3. Evaluation of the electrocatalytic activity of the fabricated
PtW/GR, PtMo/GR, PtCoMn/GR, PtCoMo/GR and
PtCoRu/GR catalysts for the oxidation reactions of sodium
borohydride and methanol using cyclic voltamperometry and
chronoamperometry.
Defensive statements:
1. PtM/graphene (M = W, Mo, Mn, Co, Ru) nanocomposites
usable as anode materials in fuel cells can be synthesized
using microwave synthesis method.
2. The prepared PtM/graphene (M = W, Mo, Mn, Co, Ru)
nanocomposites have electrocatalytic activity for the
electrooxidation reactions of sodium borohydride and
methanol.
3. The electrocatalytic activity of the PtM/graphene (M = W,
Mo, Mn, Co, Ru) nanocomposites for the oxidation of sodium
borohydride and methanol is significantly higher than that of
the bare graphene supported Pt, W and Mo catalysts.
Novelty and actuality of the work
European union’s aim for 2030 is to reduce greenhouse gas
emissions 40% (compared to 1990s data), produce 32% more energy
from renewable sources and improve by 32,5% energy usage
effectiveness. Fuel cells are one of the ways to achieve these aims.

7
Fuel cells are more effective than internal combustion engines, they
operate more silently, doesn’t produce carbon dioxide and have long
life-span. In order to achieve wide fuel cells commercialization
scientist must solve few fuel cells problems: lower production,
maintenance and repair costs. Fuel cell price could be lowered if
expensive platinum catalysts are replaced by other metals or lower
amount of platinum is used.
In this work the graphene supported PtM (M = W, Mo, Mn, Co,
Ru) catalysts were synthesized using microwave synthesis. The
synthesized PtM/graphene (M = W, Mo, Mn, Co, Ru) nanocomposites
catalysts show higher electrocatalytic activity for the oxidation of
sodium borohydride and methanol as compared with that of the bare
graphene supported Pt and M nanoparticles. Moreover, these catalysts
could be successfully used as anode materials for direct sodium
borohydride and methanol fuel cells.
2. EXPERIMENTAL
Chemicals. H2PtCl6 (99.95%), Na2WO4 2H2O (99.95%),
CoSO4∙7H2O (99.5%), MnCl2 4H2O (99.95%), Na2MoO4 2H2O
(99.5%), RuCl3 (99.95%), C2H5OH (96%), HCl (35-38%), HNO3
(65%), NaBH4 (99%), acetone (99.8%), citric acid (99.99%), ethylene
glycol (EG) (99.95%), Nafion (5%), graphene powder (97%) and
NaOH (99%) were used. All chemicals were of analytical grade.
Deionized water with the resistivity of 18.2 M cm–1 was used to
prepare all the solutions.
Fabrication of catalysts. The graphene supported PtW catalysts
that have different Pt:W molar ratios were prepared by means of
microwave heating of H2PtCl6 and Na2WO4 · 2H2O in an EG solution.
Briefly, 0.25 ml of 0.0974 M H2PtCl6, required amounts of Na2WO4 ·
2H2O (dissolved in a minimal amount of a 10 mM citric acid solution)
and 0.3 g graphene powder were mixed with 18.5 ml of EG and
sonicated for 30 min. The synthesis was carried out in a microwave
reactor Monowave 300 (Anton Paar) at a temperature of 150°C for 5

8
min. For comparison, the bare Pt/GR and W/GR were prepared in the
same manner. After the preparation, the synthesized catalysts were
washed with acetone and ultra-pure water, then filtered and dried in a
vacuum oven at 80°C temperature for 2 h.
The graphene supported PtMo catalysts that have Pt:Mo molar
ratios were prepared by means of microwave heating of H2PtCl6 and
Na2MoO4 2H2O in an EG solution. All other procedures were followed
exactly the same as mentioned in paragraph above.
The graphene supported PtCoM catalysts that have different
Pt:Co:M (M = Mn, Mo, Ru) molar ratios were prepared by means of
microwave heating of H2PtCl6, CoSO4∙7H2O and according salt,
MnCl24H2O, Na2MoO42H2O or RuCl3, in an EG solution. All other
procedures were followed exactly the same as mentioned in paragraph
above.
Characterization of catalysts. The prepared catalysts were
examined using a transmission electron microscope Tecnai G2 F20 X-
TWIN equipped with an EDAX spectrometer with an r-TEM detector.
For microscopic examinations, 10 mg of sample were first sonicated
in 1 ml of ethanol for 1 h and then deposited on a Ni grid covered with
a continuous carbon film. The composition of the PtW/GR, PtMo/GR,
PtCoMo/GR, PtCoMn/GR and PtCoRu/GR catalysts was estimated
using an ICP optical emission spectrometer Optima 7000 DV (Perkin
Elmer).
Electrochemical measurements. Borohydride and methanol
oxidation measurements were performed with a Zennium
electrochemical workstation (ZAHNER-Elektrik GmbH & Co. KG)
and three-electrode cell. The working electrode was a glassy carbon
electrode with a geometric area of 0.07 cm2 and with a thin layer of
Nafion-impregnated catalyst cast, the Pt sheet was used as a counter
electrode and Ag/AgCl as a reference electrode. The catalyst layer was
obtained by mixing the required amounts of PtW/GR, PtMo/GR,
W/GR, Mo/GR, Pt/GR, PtCoMo/GR, PtCoMn/GR and PtCoRu/GR
catalysts ultrasonically for 1 hour in a solution containing 0.25 μl of

9
Nafion and 0.75 μl of deionized H2O to produce a homogenous slurry.
The 5 μl of the prepared suspension mixture was pipetted onto the
polished surface of a glassy carbon electrode and dried in air for 12 h.
The electrocatalytic activity of catalysts towards sodium
borohydride oxidation was carried out by recording cyclic
voltammograms (CVs) in a 0.05 M NaBH4 + 1 M NaOH solution at a
scan rate of 10 mV s–1 from –1.1 to 0.6 V at a temperature of 25 °C.
The electrocatalytic activity of catalysts towards methanol oxidation
was carried out by recording CVs in a 1 M CH3OH + 1 M NaOH
solution at a scan rate of 50 mV s–1 from –0.7 to 0.5 V at a temperature
of 25 °C. The presented current densities are normalized with respect
to the geometric area of catalysts. The electrochemically active surface
areas (ESAs) of Pt in the prepared catalysts were determined from the
CVs of the PtW/GR, PtMo/GR, Pt/GR, PtCoMo/GR, PtCoMn/GR and
PtCoRu/GR catalysts recorded in a deaerated 0.5 M H2SO4 solution at
a scan rate of 50 mV s–1 by calculating the charge associated with
hydrogen adsorption (220 μC cm–2). All solutions were deaerated by
argon for 15 min prior to measurements. The chronoamperometric
curves for the investigated PtW/GR, PtMo/GR, W/GR, Mo/GR,
Pt/GR, PtCoMo/GR, PtCoMn/GR and PtCoRu/GR catalysts were
recorded at a constant potential value of –0.9 and 0.1 V vs Ag/AgCl,
respectively, for 30 min in a 0.05 M NaBH4 + 1 M NaOH solution and
0.2 V vs Ag/AgCl for 30 min in a 1 M CH3OH + 1 M NaOH solution.
Chronopotentiometric curves were recorded at a current density of 2
mA cm−2 vs the geometric area of the investigated catalysts for 30 min
in the same solutions.

10
3. RESULTS AND DISCUSSIONS
3.1 Characterization of catalysts
The graphene supported PtW and PtMo catalysts were prepared
by microwave assisted heating of Pt(IV), W(VI) and Mo(VI) salts in
ethylene glycol solutions. It should be noted that the reaction mixtures
contain the constant amounts of Pt, whereas the amounts of W and Mo
were different. In this case, the graphene supported PtW and PtMo
catalysts that have with different Pt:W and Pt:Mo molar ratios were
prepared. The ICP-OES was used for determination of the Pt, W and
Mo loadings in the synthesized catalysts. The data obtained are given
in the Table 1 and Table 2.
Table 1. Composition of Pt/GR and PtW/GR by ICP-OES and ESA
values of Pt in the catalysts determined from CVs recorded in 0.5 M
H2SO4.
Catalyst
M loading, µg
cm-2 Pt:W molar
ration
ESA,
cm2
ESA,
m2 g–1 Pt W
PtW/GR 24.7 14.4 1.6:1 2.3 134.0
PtW/GR 54.6 21.9 2.3:1 3.2 84.5
PtW/GR 41.4 5.5 7.1:1 3.6 125.7
Pt/GR 73.0 - 1.0:0 5.2 102.5
Table 2. Composition of PtMo/GR by ICP-OES and ESA values of Pt
in the catalysts determined from CVs recorded in 0.5 M H2SO4.
Catalyst
M loading, µg
cm–2 Pt:Mo molar
ration
ESA,
cm2
ESA,
m2 g–1 Pt Mo
PtMo/GR 69.4 0.80 43:1 1.2 24.9
PtMo/GR 34.7 2.40 7:1 1.5 60.9
PtMo/GR 41.3 7.01 3:1 4.0 140.0
Pt/GR 73.0 - 1:0 5.2 102.5

11
After the microwave heating of the reaction mixture at 150 °C
for 5 min, the graphene supported PtW catalysts were prepared that
have the Pt:W molar ratios equal to 1.6:1, 2.3:1 and 7.1:1 (Table 1).
The catalysts were denoted as PtW(1.6:1)/GR, PtW(2.3:1)/GR and
PtW(7.1:1)/GR. The Pt loadings determined by means of ICP-OES
analysis were 73 μgPt cm−2 in the Pt/GR, 24.7, 54.6, and 41.4 μgPt cm−2
in the synthesized PtW (1.6:1)/GR, PtW(2.3:1)/GR and
PtW(7.1:1)/GR catalysts, respectively.
As seen from the data in Table 2, PtMo/GR catalysts that have
Pt:Mo molar ratios equal to 43:1, 7:1 and 3:1 were synthesized. The
Pt loadings determined by means of ICP-OES analysis were 69.4, 34.7
and 41.3 μgPt cm−2 in the synthesized PtMo (43:1)/GR, PtMo(7:1)/GR
and PtMo(3:1)/GR catalysts, respectively.
Figure 1. TEM views of Pt/GR (a), PtW(1.6:1)/GR (b),
PtW(2.3:1)/GR (c), and PtW(7.1:1)/GR (d) prepared by microwave
synthesis.
a b
c d

12
As evident from the data in Fig. 1a, the Pt/GR catalyst with an
average Pt nanoparticle size of ca. 3 nm was synthesized. In the case
of the PtW/GR catalysts, the Pt nanoparticles were found to be ca. 5–
20 nm (Fig. 1b–d). Pt nanoparticles were uniform and well dispersed
on the surfaces of graphene. Figure 2 shows the TEM views of the
synthesized PtMo/GR catalysts.
Figure 2. TEM views of PtMo(43:1)/GR (a), PtMo(7:1)/GR (b) and
PtMo(3:1)/GR (c) prepared by microwave synthesis.
a
b
c
13
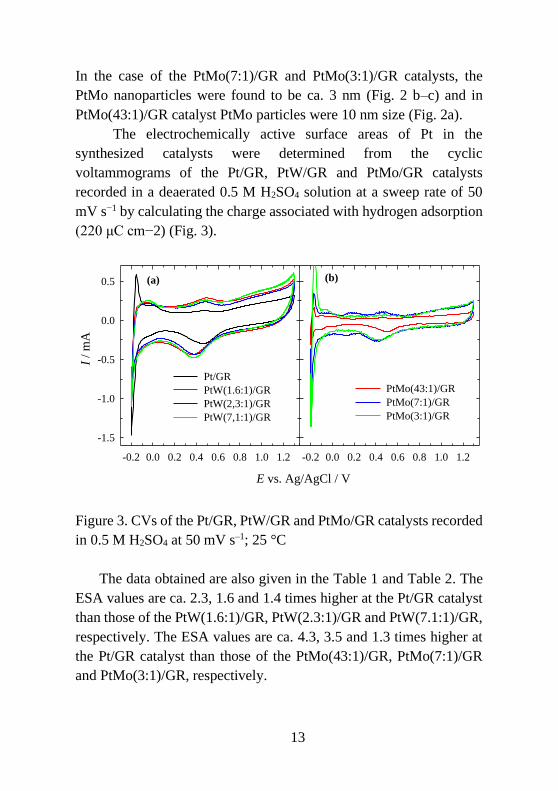
In the case of the PtMo(7:1)/GR and PtMo(3:1)/GR catalysts, the
PtMo nanoparticles were found to be ca. 3 nm (Fig. 2 b–c) and in
PtMo(43:1)/GR catalyst PtMo particles were 10 nm size (Fig. 2a).
The electrochemically active surface areas of Pt in the
synthesized catalysts were determined from the cyclic
voltammograms of the Pt/GR, PtW/GR and PtMo/GR catalysts
recorded in a deaerated 0.5 M H2SO4 solution at a sweep rate of 50
mV s−1 by calculating the charge associated with hydrogen adsorption
(220 μC cm−2) (Fig. 3).
E vs. Ag/AgCl / V
-0.2 0.0 0.2 0.4 0.6 0.8 1.0 1.2
I /
mA
-1.5
-1.0
-0.5
0.0
0.5
Pt/GR
PtW(1.6:1)/GR
PtW(2,3:1)/GR
PtW(7,1:1)/GR
(a)
-0.2 0.0 0.2 0.4 0.6 0.8 1.0 1.2
PtMo(43:1)/GR
PtMo(7:1)/GR
PtMo(3:1)/GR
(b)
Figure 3. CVs of the Pt/GR, PtW/GR and PtMo/GR catalysts recorded
in 0.5 M H2SO4 at 50 mV s–1; 25 °C
The data obtained are also given in the Table 1 and Table 2. The
ESA values are ca. 2.3, 1.6 and 1.4 times higher at the Pt/GR catalyst
than those of the PtW(1.6:1)/GR, PtW(2.3:1)/GR and PtW(7.1:1)/GR,
respectively. The ESA values are ca. 4.3, 3.5 and 1.3 times higher at
the Pt/GR catalyst than those of the PtMo(43:1)/GR, PtMo(7:1)/GR
and PtMo(3:1)/GR, respectively.

14
3.2. Sodium borohydride oxidation on PtW/GR and PtMo/GR
catalysts
The activity of the graphene supported PtW and PtMo catalysts
that have different Pt:W and Pt:Mo molar ratios with respect to the
oxidation of sodium borohydride was investigated by cyclic
voltammetry. Figure 4 presents CVs for the PtW/GR catalysts that
have Pt:W molar ratios equal to 1.6:1 (a), 2.3:1 (b), and 7.1:1 (c)
recorded in 0.05 M NaBH4 + 1 M NaOH at a scan rate of 10 mV s–1
For comparison purposes, CVs of W/GR catalyst are also presented.
During long-term cycling, two anodic peaks A0 and A are seen in the
CVs plots for different PtW/GR and PtMo/GR catalysts (Figs. 4, 5).
The mentioned catalysts show a typical electrochemical behaviour
towards sodium borohydride oxidation as on a pure Pt electrode. The
anodic peak A0 at lower potential values may be related with the
oxidation of H2 generated by catalytic hydrolysis of BH4–, and the peak
A at more positive potential values may be corresponded to the direct
oxidation of BH4– ions. In the reverse potential sweep, the peak B
observed at about –0.3 V can be assigned to the oxidation of absorbed
intermediate oxidation products of BH3OH– on the partially oxidized
Pt surface.

15
0
10
20
30
40
j /
mA
cm
-2
0
10
20
30
40
(a)
(b)
E vs. Ag/AgCl / V
-1.2 -0.8 -0.4 0.0 0.4
0
10
20
30
40(c)
PtW(1.6:1)/GR
A0
B
PtW(7,1:1)/GR
PtW(2,3:1)/GR
A0
B
A0 B
W/GR
W/GR
W/GR
A
A
A
B1
B1
A1
A1
B1
A1
Figure 4. CVs for PtW(1.6:1)/GR (a), PtW(2.3:1)/GR (b) and
PtW(7:1)/GR (c) recorded in 0.05 M NaBH4 + 1 M NaOH at 10 mV
s–1; 25 °C.

16
-10
0
10
20
30
40 1
2
3
4
5
A0A
A1
B
(a) PtMo(43:1)/GR
j /
mA
cm
-2
-10
0
10
20
30
40
A0A
A1
B
(b) PtMo(7:1)/GR
E vs. Ag/AgCl / V
-1.2 -0.8 -0.4 0.0 0.4
-10
0
10
20
30
40(c) PtMo(3:1)/GR
A0 A
A1
Mo/GR
Mo/GR
Mo/GR
B1
B
B1
B1
Figure 5. CVs for PtMo(43:1)/GR (a), PtMo(7:1)/GR (b) and
PtMo(3:1)/GR (c) recorded in 0.05 M NaBH4 + 1 M NaOH at 10 mV
s–1; 25 °C.

17
E vs. Ag/AgCl / V
-1.2 -0.8 -0.4 0.0 0.4
j /
mA
cm
-2
0
10
20
30
Pt/GR
PtW(1,6:1)/GR
PtW(2,3:1)/GR
PtW(7,1:1)/GR
W/GR A0
A
(a)
-1.2 -0.8 -0.4 0.0 0.4
Pt/GR
PtMo(43:1)/GR
PtMo(7:1)/GR
PtMo(3:1)/GR
Mo/GR
A0
(b)
A
Figure 6. Positive-potential going scans of Pt/GR, W/GR, PtW/GR (a)
and Pt/GR, Mo/GR, PtMo/GR (b) catalysts recorded in 0.05 M
NaBH4 + 1 M NaOH at 10 mV s–1; 25 °C.
Figure 6 presents the comparison of positive-potential going
scans of oxidation of BH4– ions recorded on Pt/GR, W/GR, Mo/GR,
PtW/GR and PtMo/GR catalysts that have different Pt:W and Pt:Mo
molar ratios in a 0.05 M NaBH4 + 1 M NaOH solution at a potential
scan rate of 10 mV s–1. The potential values of the anodic peak A0 are
shifted to the negative potential values at the PtW/GR catalysts that
has the Pt:W molar ratios equal to 2.3:1 and 7.1:1 as compared with
those at Pt/GR and PtW/GR that has the Pt:W molar ratio equal to
1.6:1, indicating a higher activity of those catalysts. The PtMo/GR
catalyst that has the Pt:Mo molar ratio 3:1 outperformed Pt/GR
catalyst. The current densities of the peak A0 recorded on the
PtW(1.6:1)/GR, PtW(2.3:1)/GR and PtW(7.1:1)/GR catalysts are ca.
1.3, 1.1 and 1.2 times higher than those on Pt/GR. The current
densities under the peak A are also ca. 1.2–1.4 times higher as
compared to those of Pt/GR. It should be noted that the prepared
PtW/GR catalysts that have different Pt:W molar ratios and bare
Pt/GR significantly outperformed the bare W/GR catalyst. Since the

18
borohydride oxidation current densities recorded at the W/GR catalyst
(Fig. 6) are negligible as compared to those of different PtW/GR and
Pt/GR catalysts, the enhanced electrocatalytic activity of the
synthesized PtW/GR catalysts may be ascribed to the Pt electronic
structure change due to the presence of W. In order to evaluate the
specific and mass activities of the prepared catalysts, the sodium
borohydride oxidation current densities were normalized by the
electrochemically active surface areas of Pt and Pt loadings for each
catalyst. The data obtained are given in Figs. 7 and 8. As seen from
the data in Fig. 7, the PtW/GR catalysts outperformed the bare Pt/GR
catalyst. Assuming ca. 2.3, 1.6 and 1.4 times higher active surface
areas of Pt/GR compared to those of the PtW(1.6:1)/GR,
PtW(2.3:1)/GR and PtW(7.1:1)/GR catalysts, respectively, surface
area normalized borohydride oxidation current densities under the
peaks A0 and A are ca. 3.0, 1.8, 1.8 and 2.7, 2.0, 2.1, respectively,
times higher on the latter catalysts (Fig. 7a, b). Mass activity of the
different PtW/GR catalysts is ca. 3.9, 1.5 and 2.2 (peak A0), and 3.5,
1.6 and 2.5 (peak A) times higher than that at Pt/GR (Fig. 7c, d).
As seen from the data in Fig. 8, the PtMo/GR catalysts
outperformed the bare Pt/GR catalyst. Assuming ca. 4.3, 3.5 and 1.3
times higher active surface areas of Pt/GR compared to those of the
PtMo(43:1)/GR, PtMo(7:1)/GR and PtMo(3:1)/GR catalysts,
respectively, surface area normalized borohydride oxidation current
densities under the peaks A0 and A are ca. 4.6, 3.2, 1.6 and 4.4, 3.7,
1.8, respectively, times higher on the latter catalysts (Fig. 8a, b). Mass
activity of different PtMo/GR catalysts is ca. 1.1, 1.9 and 2.8 (peak
A0), and 1.1, 2.2 and 2.5 (peak A) times higher than that at Pt/GR (Fig.
8c, d).

19
j /
mA
cm
-2 (
vs.
SE
AP)
0.0
0.2
0.4
0.6
0.8
PtW(1.6:1)/G
R
PtW(2.3:1)/G
R
PtW(7.1:1)/G
RPt/G
R
j /
mA
mg
-1
Pt
0
400
800
1200
PtW(1.6:1)/G
R
PtW(2.3:1)/G
R
PtW(7.1:1)/G
RPt/G
R
(b)(a)
(d)(c)
Catalysts Figure 7. Comparison of specific activity (a, b) and mass activity (c,
d) of different PtW/GR catalysts under values of peak A0 (a, c) and
peak A (b, d).

20
j /
mA
cm
-2 (
vs.
SE
AP)
0.0
0.4
0.8
1.2
PtMo(43:1)/G
R
PtMo(7:1)/G
R
PtMo(3:1)/G
RPt/G
R
j /
mA
mg
-1
Pt
0
200
400
600
PtMo(43:1)/G
R
PtMo(7:1)/G
R
PtMo(3:1)/G
RPt/G
R
(b) peak A(a) peak A0
(d) peak A(c) peak A0
Catalysts Figure 8. Comparison of specific activity (a, b) and mass activity (c,
d) of different PtMo/GR catalysts under values of peak A0 (a, c) and
peak A (b, d).
Stability of catalysts for the oxidation of H2 generated by
catalytic hydrolysis of BH4– (peak A0) and oxidation of BH4
– ions
(peak A) was investigated under chronoamperometric conditions.
Figure 9 presents the chronoamperometric curves obtained at the
Pt/GR, W/GR and PtW/GR catalysts in 0.05 M NaBH4 + 1 M NaOH
at constant potential values of –0.9 (a) and 0.1 (b) V, respectively, for
1800 s.

21
0 300 600 900 1200 1500
j /
mA
cm
-2
0
10
20
30
40 PtW(1.6:1)/GR
PtW(2.3:1)/GR
PtW(7.1:1)/GR
W/GR
Pt/GR
(a) -0.9 V
t / s
0 300 600 900 1200 1500
(b) 0.1 V
Figure 9. Chronoamperometric data of the Pt/GR and PtW/GR
catalysts recorded in 0.05 M NaBH4 + 1 M NaOH at –0.9 (a) and 0.1
(b) V, respectively, for 1800 s.
t / s
0 300 600 900 1200 1500
j /
mA
cm
-2
0
10
20
30
40
PtMo(43:1)/GR
PtMo(7:1)/GR
PtMo(3:1)/GR
Pt/GR
(a) -0.9 V
0 300 600 900 1200 1500
(b) 0.1 V
Figure 10. Chronoamperometric data of the Pt/GR and PtMo/GR
catalysts recorded in 0.05 M NaBH4 + 1 M NaOH at –0.9 (a) and 0.1
(b) V, respectively, for 1800 s.
All the catalysts show a current decay for both reactions. It is
worth to note that at –0.9 V, the current densities obtained for all

22
synthesized PtW/GR catalysts are much higher than those for Pt/GR
and W/GR. The current densities of the peak A0 recorded at the
PtW(1.6:1)/GR, PtW(2.3:1)/GR and PtW(7.1:1)/GR catalysts are ca.
51, 65 and 62 times higher as compared to those at Pt/GR (Fig. 9a).
The current densities of the peak A recorded at the PtW(1.6:1)/GR,
PtW(2.3:1)/GR and PtW(7.1:1)/GR catalysts at 0.1 V are ca. 1.3, 1.2
and 1.4 times greater than those at Pt/GR (Fig. 9b). PtMo/GR catalysts
shows similar tendencies (Fig. 10a, b).
t / s
0 300 600 900 1200 1500
E v
s. A
g/A
gC
l /
V
-1.0
-0.5
0.0
0.5
PtW(1.6:1)/GR
PtW(2.3:1)/GR
PtW(7.1:1)/GR
Pt/GR
W/GR
Figure 11. Chronopotentiometric data of the Pt/GR, W/GR and
PtW/GR catalysts recorded in 0.05 M NaBH4 + 1 M NaOH at 2 mA
cm–2 for 1800 s.
Chronopotentiometry measurements were carried out to screen
the catalyst performance under the conditions of constant current
operation of the fuel cell anode. Following a rest period of 10 s at open
circuit, a current density step of 2 mA cm–2 was applied to the
investigated catalysts for 1800 s. Figure 11 shows the anode potentials
(including the open circuit values between –0.612, –0.920, –0.996, –
1.028 and –1.027 V vs Ag/AgCl) for the catalysts operating at 2 mA

23
cm–2. Notably, the open-circuit potential values are by ca. 0.3–0.4 V
more negative than those of W/GR. After 1800 s, the operating
potentials for Pt/Gr and PtW/GR are by approximately 1.4–1.6 V more
negative than those for W/GR, which demonstrates that the
overpotentials for the oxidation of BH4– ions on the Pt/GR and
PtW/GR catalysts are lower than those for W/GR. The difference
between the steady-state operating anode potential and the one at open
circuit was the smallest one on the PtW(1.6:1)/GR and was equal to
ca. 0.007 V, followed by the PtW(2.3:1)/GR, Pt/GR and
PtW(7.1:1)/GR catalyst, where they reached ca. 0.044, 0.126 and
0.164 V, respectively, and finally, W/GR where it reached ca. 1.245
V.
t / s
0 300 600 900 1200 1500
E v
s. A
g/A
gC
l /
V
-1.0
-0.9
-0.8
-0.7PtMo(43:1)/GR
PtMo(7:1)/GR
PtMo(3:1)/GR
Pt/GR
Figure 12. Chronopotentiometric data of the Pt/GR and PtMo/GR
catalysts recorded in 0.05 M NaBH4 + 1 M NaOH at 2 mA cm–2 for
1800 s.
Figure 12 shows the anode potentials for the PtMo/GR catalysts
operating at 2 mA cm–2. The difference between the steady-state

24
operating anode potential and the one at open circuit was the smallest
one on the PtMo(3:1)/GR and was equal to ca. 0.0017 V, followed by
the PtMo(7:1)/GR, Pt/GR and PtMo(43:1)/GR catalyst, where they
reached ca. 0.0421, 0.1263 and 0.1691 V, respectively.
3.3. Methanol oxidation on PtW/GR catalyst
The electrochemical properties of the GR supported PtW
catalysts that have different Pt:W molar ratios were investigated with
respect to the oxidation of methanol in an alkaline media by means of
cyclic voltammetry. Figure 13 shows CVs for the W/GR (a), Pt/GR
(b) and PtW/GR catalysts that have Pt:W molar ratios equal to 1.6:1
(c), 2.3:1 (d), and 7.1:1 (e) recorded in 1 M CH3OH + 1 M NaOH at a
scan rate of 50 mV s–1. For the sake of simplicity, in Fig. 13f only
positive potential going scans of stabilized CVs of all the catalysts are
presented. As evident from the obtained data in Fig. 13, all CV plots
exhibit two typical anodic peaks in the forward and reverse scans
(labelled as A and B), which are well-known to reflect the
electrooxidation of alcohols and the intermediate carbonaceous
species, respectively. The first anodic current peak A in the forward
scan is related to the oxidation of methanol on the catalyst, whereas
the second anodic peak B on the reverse scan may be related to the
oxidation of intermediate products generated during the forward scan.
During the long-term cycling, the current density values on the W/GR
catalyst (Fig. 13a) significantly decrease, immediately after the first
potential scan, to a rather low current value of ca. 7.8 mA cm−2.
Meanwhile, the methanol oxidation current values recorded on
the Pt/GR (Fig. 13b) or PtW/GR (Fig. 13c–e) catalysts increase with
the scan number and depend on the Pt:W molar ratio in the catalyst.

25
0
20
40
60
1
10 1
10
j /
mA
cm
-2
0
20
40
60
1
10
1
10
E vs. Ag/AgCl / V
-0.6 -0.4 -0.2 0.0 0.2 0.4
0
20
40
60
1
10
-0.6 -0.4 -0.2 0.0 0.2 0.4
PtW(1.6:1)/GR
PtW(2.3:1)/GR
PtW(7.1:1)/GR
Pt/GR
W/GR
(f)
(a) W/GR (b) Pt/GR
(c) PtW(1.6:1)/GR (d) PtW(2.3:1)/GR
(e) PtW(7.1:1)/GR
W/GR
A
A
B
A
A
B B
A
B
A
Figure 13. CVs recorded at W/GR (a), Pt/GR (b), PtW(1.6:1)/GR (c),
PtW(2.3:1)/GR (d), PtW(7.1:1)/GR (e) and stabilized positive
potential-going scans (f) for the same catalysts in 1 M CH3OH + 1 M
NaOH at 50 mV s–1.
Moreover, the onset potential of methanol oxidation at the
W/GR catalyst is obtained in a rather positive potential region at a

26
potential value of ca. 0.057 V that is almost ca. 0.5 V more positive
than those observed for Pt/GR or PtW/GR (ca. –0.45 V) (Fig. 13f).
A lower onset potential suggests that the overpotential for
methanol oxidation is lower and the electrocatalytic methanol
oxidation occurs more easily on Pt/GR or PtW/GR. Therefore, the
Pt/GR or PtW/GR catalysts that have different Pt:W molar ratios are
considered to be of a higher activity towards methanol oxidation
compared to that of W/GR.
The stabilized CVs of the investigated catalysts presented in
Fig. 13f show that the highest current density is obtained at the
PtW/GR catalyst that has the lowest Pt loading of 24.7 μg Pt cm−2 and
containing the Pt:W molar ratio equal to 1.6:1. The current densities
of peak A recorded on the PtW(1.6:1)/GR, PtW(2.3:1)/GR and
PtW(7.1:1)/GR catalysts are ca. 2.1, 1.6 and 1.4 times higher than
those on Pt/GR and, considerably more, i.e. ca. 7.8, 6.0 and 5.2 times
higher compared to those obtained on the W/GR catalyst. The
enhanced electrocatalytic activity of the synthesized PtW/GR catalysts
may be attributed to the Pt electronic structure change due to the
presence of W.
In addition, it is well known that the ratio of forward anodic
peak current (jF) to the backward anodic peak (jB), jF/jB, is an index
of the catalysts tolerance to the poisoning species accumulated on the
surface of the electrode. The ratios jF/jB were 8.7, 10.9, 9.8 and 4.1
for the PtW(1.6:1)/GR, PtW(2.3:1)/GR, PtW(7.1:1)/GR and Pt/GR
catalysts, respectively. A higher jF/jB ratio indicates an efficient
oxidation of methanol during the forward scan, with a little
accumulation of carbonaceous residues. Notably, the ratio jF/jB was
ca. 2 times higher for the all PtW/GR catalysts as compared with that
for the pure Pt/GR catalysts, indicating a greater efficiency of the
PtW/GR catalysts towards the electro-oxidation of methanol in an
alkaline medium.
In order to evaluate the electrocatalytic activity of the catalysts,
the methanol oxidation current density values under the potential

27
region of peak A were normalized by the electrochemically active
surface areas of Pt and the Pt loadings for each catalyst to represent
the specific and mass activity of the catalysts. Figure 14 presents the
calculated specific (a) and mass (b) activity values of the prepared
catalysts. As seen from the data in Fig. 14, all the PtW/GR catalysts
that have different Pt:W molar ratios outperformed the bare Pt/GR
catalyst in respect to both specific activity and mass activity.
j /
mA
cm
-2 (
vs.
SE
AP)
0.0
0.4
0.8
1.2
1.6
PtW(1.6:1)/G
R
PtW(2.3:1)/G
R
PtW(7.1:1)/G
RPt/G
R
j /
mA
mg
-1
Pt
0
500
1000
1500
2000
2500 (b)
(a)
Catalysts

28
Figure 14. Current densities normalized by ESA (a) and Pt loadings
(b) for Pt/GR, PtW(1.6:1)/GR, PtW(2.3:1)/GR and PtW(7:1)/GR
catalysts in 1 M CH3OH + 1 M NaOH at 50 mV s–1.
Assuming ca. 2.3, 1.6 and 1.4 times higher active surface area
of the Pt/GR catalyst compared to those of the PtW(1.6:1)/GR,
PtW(2.3:1)/GR and PtW(7.1:1)/GR catalysts, respectively, the surface
area normalized methanol oxidation current densities under peak A,
on the contrary, are ca. 4.6, 2.6 and 2.0 times higher on the latter
catalysts (Fig. 14a). Similarly, the mass activities of the same
PtW(1.6:1)/GR, PtW(2.3:1)/GR and PtW(7.1:1)/GR catalysts are ca.
6.1, 2.1 and 2.4 times higher than that at Pt/GR (Fig. 14b).
The catalytic stability of the synthesized catalysts for the
oxidation of methanol was further investigated under
chronoamperometric conditions. Figure 15 presents the
chronoamperometric curves obtained at the Pt/GR, W/GR and
PtW/GR catalysts in a 1 M CH3OH + 1 M NaOH solution at a fixed
potential value of –0.2 V for 1800 s. All the catalysts show a current
decay for the methanol oxidation reaction. Such behaviour might be
explained by the formation of intermediate species, such as COads,
CHOads, etc., during the methanol oxidation reaction. The current
densities obtained at a fixed potential value of –0.2 V for all
synthesized PtW/GR catalysts are higher than those for the bare Pt/GR
and W/GR. After exposing the catalysts at the mentioned potential for
a time period equal to 1800 s, the current density values of methanol
oxidation at the PtW/GR catalysts that have Pt:W molar ratios of 1.6:1,
2.3:1 and 7.1:1 were found to be ca. 2.0, 2.4 and 1.3 times,
respectively, higher than those at Pt/GR. This indicates a higher
electrocatalytic activity and stability of the prepared PtW/GR catalysts
towards the oxidation of methanol (Fig. 15).

29
t / s
0 400 800 1200 1600
j /
mA
cm
-2
0
2
4
6
8
PtW(1.6:1)/GR
PtW(2.3:1)/GR
PtW(7.1:1)/GR
Pt/GR
W/GR
Figure 15. Chronoamperometric data recorded for W/GR, Pt/GR
PtW(1.6:1)/GR, PtW(2.3:1)/GR and PtW(7:1)/GR catalysts in 1 M
CH3OH + 1 M NaOH at E = –0.2 V for 1800 s.
The voltammetric and chronoamperometric measurements
confirm that the PtW(1.6:1)/GR, PtW(2.3:1)/GR and PtW(7.1:1)
catalysts, which were prepared via a simple and rapid microwave
heating method, exhibit a higher electrocatalytic activity and a better
stability towards the oxidation of methanol in an alkaline medium than
that of Pt/GR and W/GR catalysts.
3.4 Methanol oxidation on PtCoMn/GR, PtCoRu/GR and
PtCoMo/GR catalysts
The graphene supported PtCoM (M = Mn, Ru, Mo) catalysts
were prepared by microwave assisted heating of Pt(IV), Co(II),
Mn(II), Ru(III) and Mo(VI) salts in ethylene glycol solutions. It should
be noted that the reaction mixtures contain the constant amounts of Pt

30
and Co, whereas the amounts of Mn, Ru and Mo were different. In this
case, the graphene supported catalysts that have different Pt:Co:Mn,
Pt:Co:Ru and Pt:Co:Mo molar ratios were prepared. The ICP-OES
was used for the determination of the Pt, Co, Mn, Ru and Mo loadings
in the synthesized catalysts. The data obtained are given in the Table
3.
Table 3. The composition of PtCoMn/GR, PtCoRu/GR and
PtCoMo/GR catalysts by ICP-OES and ESA values of Pt in the
catalysts determined from CVs recorded in 0.5 M H2SO4 solution.
Catalyst
Pt:Co:M
molar
ratio
Pt
loading,
µg cm-2
ESA,
cm2
ESA,
m2 g-1
PtCoMn/GR 1:3:1 103.8 11.6 160.0
PtCoRu/GR 1:2:2 183.2 3.9 31.9
PtCoMo/GR 7:2:1 83.8 3.8 64.5
Pt/GR 1:0:0 73.0 5.2 102.5
It was found that Pt:Co:Mn, Pt:Co:Ru and Pt:Co:Mo molar
ratios in the prepared PtCoMn/GR, PtCoRu/GR and PtCoMo/GR
catalysts are 1:3:1, 1:2:2 and 7:2:1 respectively. Figure 1 presents
TEM views of the graphene supported PtCoMn (a), PtCoRu (b) and
PtCoMo (c) catalysts. All the catalysts are well dispersed on the
surface of graphene (Fig. 1). The Pt nanoparticle size in the catalysts
was found to be 1-3 nm. It was determined that Pt loadings in the
PtCoMn/GR, PtCoRu/GR and PtCoMo/GR catalysts were 103.8,
183.2 and 83.8 µg cm–2 respectively.

31
Figure. 16. TEM views of PtCoMn/GR (a), PtCoRu/GR (b) and
PtCoMo/GR (c) prepared by microwave synthesis.
The electrochemically active surface areas of Pt in the
synthesized catalysts were determined from the cyclic
voltammograms of the PtCoMn/GR, PtCoRu/GR and PtCoMo/GR
catalysts recorded in a deaerated 0.5 M H2SO4 solution at a sweep rate
of 50 mV s−1 and by calculating the charge associated with hydrogen
a
b
c
32
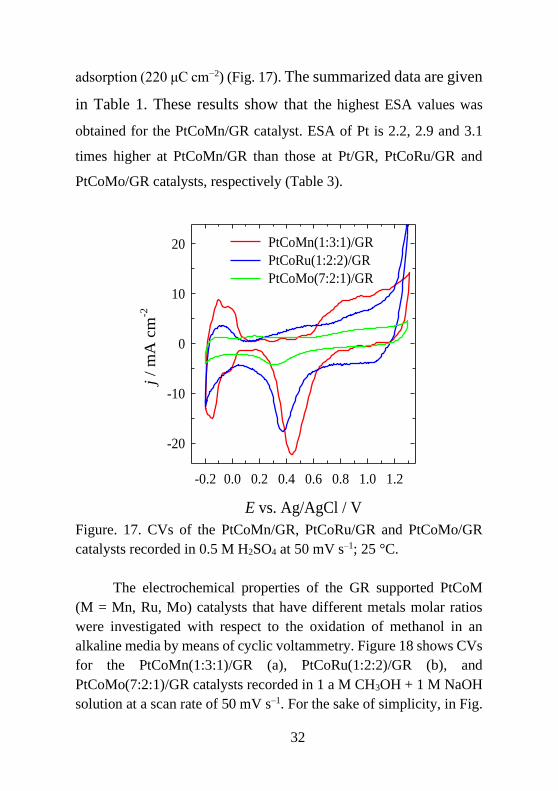
adsorption (220 μC cm−2) (Fig. 17). The summarized data are given
in Table 1. These results show that the highest ESA values was
obtained for the PtCoMn/GR catalyst. ESA of Pt is 2.2, 2.9 and 3.1
times higher at PtCoMn/GR than those at Pt/GR, PtCoRu/GR and
PtCoMo/GR catalysts, respectively (Table 3).
E vs. Ag/AgCl / V
-0.2 0.0 0.2 0.4 0.6 0.8 1.0 1.2
j /
mA
cm
-2
-20
-10
0
10
20 PtCoMn(1:3:1)/GR
PtCoRu(1:2:2)/GR
PtCoMo(7:2:1)/GR
Figure. 17. CVs of the PtCoMn/GR, PtCoRu/GR and PtCoMo/GR
catalysts recorded in 0.5 M H2SO4 at 50 mV s–1; 25 °C.
The electrochemical properties of the GR supported PtCoM
(M = Mn, Ru, Mo) catalysts that have different metals molar ratios
were investigated with respect to the oxidation of methanol in an
alkaline media by means of cyclic voltammetry. Figure 18 shows CVs
for the PtCoMn(1:3:1)/GR (a), PtCoRu(1:2:2)/GR (b), and
PtCoMo(7:2:1)/GR catalysts recorded in 1 a M CH3OH + 1 M NaOH
solution at a scan rate of 50 mV s–1. For the sake of simplicity, in Fig.

33
18d only positive potential going scans of stabilized CVs of all the
catalysts are presented.
0
50
100
150
(a) PtCoMn(1:3:1)/GR 1
10
A
1
10
(b) PtCoRu(1:2:2)/GR
A
E vs. Ag/AgCl / V
-0.8 -0.6 -0.4 -0.2 0.0 0.2 0.4
j /
mA
cm
-2
0
50
100
150
1
10
(c) PtCoMo(7:2:1)/GR
-0.8 -0.6 -0.4 -0.2 0.0 0.2 0.4
(d)
PtCoMn/GR
PtCoRu/GR
PtCoMo/GR
Pt
A
A
BB
B
Figure 18. CVs recorded at PtCoMn(1:3:1)/GR (a),
PtCoRu(1:2:2)/GR (b), PtCoMo(7:2:1)/GR. (d) Stabilized positive
potential-going scans for the same catalysts in 1 M CH3OH + 1 M
NaOH at 50 mV s–1.
As evident from the obtained data in Fig. 18, all CV plots
exhibit two typical anodic peaks in the forward and reverse scans

34
(labelled as A and B), which are well-known to reflect the
electrooxidation of alcohols and the intermediate carbonaceous
species, respectively. The first anodic current peak A in the forward
scan is related to the oxidation of methanol on the catalyst, whereas
the second anodic peak B on the reverse scan may be related to the
oxidation of intermediate products generated during the forward scan.
During long-term cycling, the methanol electro-oxidation
current density values (anodic peak A) recorded at the investigated
PtCoMn(1:3:1)/GR catalyst at first slightly are decreased and then
stabilized (Fig. 18a). The other way is for PtCoRu(1:2:2)/GR and
PtCoMo(7:2:1)/GR catalysts (Fig. 18b, c). During long-term cycling,
current density values are rising and then stabilized. The highest
electrocatalytic activity for methanol oxidation reaction is noted for
PtCoMn(1:3:1)/GR catalyst (Fig. 18d). Furthermore, methanol
oxidation current densities are ca. 4.8, 1.5 and 2.8 times higher at
ternary PtCoMn(1:3:1)/GR, PtCoRu(1:2:2)/GR and
PtCoMo(7:2:1)/GR catalysts than those at the bare Pt/GR catalyst.
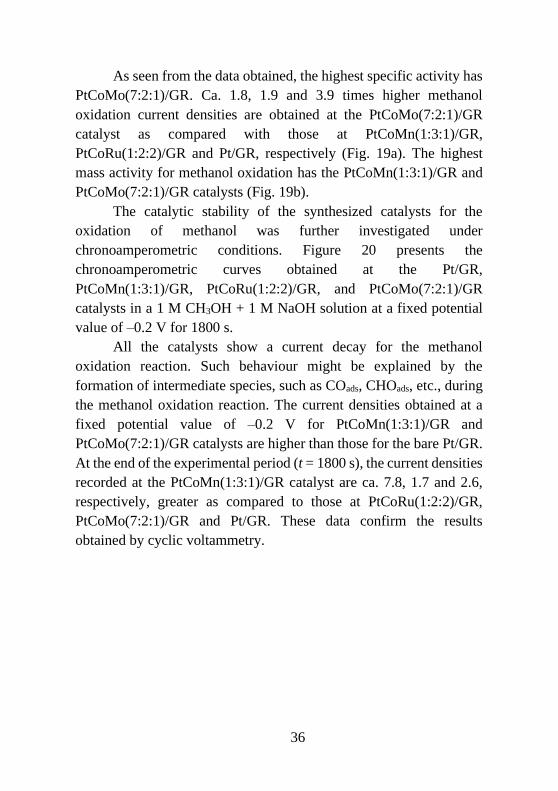
Figure 19 shows the calculated methanol oxidation current
density values normalized by the ESAs of Pt in the catalysts (a) and Pt
loadings (b) for each catalyst.

35
j /
mA
cm
-2 (
vs.
SE
AP)
0.0
0.5
1.0
1.5
PtCoMn(1:3:1)/G
R
PtCoRu(1:2:2)/G
R
PtCoMo(7:2:1)/G
RPt/G
R
j /
mA
mg
-1
Pt
0
500
1000
1500
(a)
(b)
Catalyst
Figure 19. Columns of Pt/GR, PtCoMn/GR, PtCoRu/GR and
PtCoMo/GR catalysts recorded in 1 M CH3OH + 1 NaOH and
normalized by the Pt loadings (a) and electrochemically surface areas
(b).
36
As seen from the data obtained, the highest specific activity has
PtCoMo(7:2:1)/GR. Ca. 1.8, 1.9 and 3.9 times higher methanol
oxidation current densities are obtained at the PtCoMo(7:2:1)/GR
catalyst as compared with those at PtCoMn(1:3:1)/GR,
PtCoRu(1:2:2)/GR and Pt/GR, respectively (Fig. 19a). The highest
mass activity for methanol oxidation has the PtCoMn(1:3:1)/GR and
PtCoMo(7:2:1)/GR catalysts (Fig. 19b).
The catalytic stability of the synthesized catalysts for the
oxidation of methanol was further investigated under
chronoamperometric conditions. Figure 20 presents the
chronoamperometric curves obtained at the Pt/GR,
PtCoMn(1:3:1)/GR, PtCoRu(1:2:2)/GR, and PtCoMo(7:2:1)/GR
catalysts in a 1 M CH3OH + 1 M NaOH solution at a fixed potential
value of –0.2 V for 1800 s.
All the catalysts show a current decay for the methanol
oxidation reaction. Such behaviour might be explained by the
formation of intermediate species, such as COads, CHOads, etc., during
the methanol oxidation reaction. The current densities obtained at a
fixed potential value of –0.2 V for PtCoMn(1:3:1)/GR and
PtCoMo(7:2:1)/GR catalysts are higher than those for the bare Pt/GR.
At the end of the experimental period (t = 1800 s), the current densities
recorded at the PtCoMn(1:3:1)/GR catalyst are ca. 7.8, 1.7 and 2.6,
respectively, greater as compared to those at PtCoRu(1:2:2)/GR,
PtCoMo(7:2:1)/GR and Pt/GR. These data confirm the results
obtained by cyclic voltammetry.

37
t / s
0 300 600 900 1200 1500
j /
mA
cm
-2
0
20
40
60
80
Pt/GR
PtCoMn(1:3:1)/GR
PtCoRu(1:2:2)/GR
PtCoMo(7:2:1)/GR
E = -0.2 V(a)
Figure 20. Chronoamperometric data recorded for Pt/GR,
PtCoMn(1:3:1)/GR, PtCoRu(1:2:2)/GR, PtCoMo(7:2:1)/GR catalysts
in 1 M CH3OH + 1 M NaOH at E = –0.2 V for 1800 s.
The specific and mass activities for methanol oxidation on the
investigated Pt/GR, PtCoMn(1:3:1)/GR, PtCoRu(1:2:2)/GR and
PtCoMo(7:2:1)/GR catalysts at the end of experimental period (t =
1800 s) are given in Fig. 21. It is clearly seen that the highest specific
activity towards methanol oxidation (Fig. 21a) has the
PtCoMo(7:2:1)/GR catalyst, whereas, the highest mass activity for the
oxidation of methanol has PtCoMn(1:3:1)/GR catalyst (Fig. 21b).
Specific activity values are ca. 1.8, 2.1 and 4.6 times higher on the
PtCoMo(7:2:1)/GR catalyst than those on the PtCoMn(1:3:1)/GR,
Pt/GR and PtCoRu(1:2:2)/GR catalysts, respectively (Fig. 21a). The
mass current density values are ca. 1.4, 1.8 and 13.7 times higher at
PtCoMn(1:3:1)/GR than those at PtCoMo(7:2:1)/GR, Pt/GR and
PtCoRu(1:2:2)/GR catalysts, respectively (Fig. 21b).

38
j /
mA
mg
-1
Pt
0.00
0.05
0.10
0.15
PtCoMn(1:3:1)/G
R
PtCoRu(1:2:2)/G
R
PtCoMo(7:2:1)/G
RPt/G
R
j /
mA
cm
-2 (
vs.
SE
AP)
0
50
100
150
(a)
(b)
Figure 21. Bar columns represent PtCoMn/GR, PtCoRu/GR ir
PtCoMo/GR catalysts specific (a) and mass (b) activity values
in 1 M CH3OH + 1 M NaOH solution, at E = -0,2 V, t = 1800 s.

39
CONCLUSIONS
1. In this study, the graphene supported PtW catalysts that have
Pt:W molar ratios equal to 1.6:1, 2.3:1 and 7.1:1 and graphene
supported PtMo catalysts that have Pt:Mo molar ratios equal
to 43:1, 7:1 and 3:1 have been prepared by microwave-
assisted heating. The ternary PtCoMn/graphene,
PtCoRu/graphene and PtCoMo/graphene catalysts that have
Pt:Co:Mn, Pt:Co:Ru and Pt:Co:Mo molar ratios equal to
1:3:1, 1:2:2 and 7:2:1, respectively, have also been fabricated.
The catalysts were synthesized with nanoparticles in size of
ca. 1-3 nm.
2. Synthesized PtW/graphene catalysts that have the Pt:W molar
ratio equal to 1.6:1, 2.3:1 and 7.1:1, and PtMo/graphene
catalysts that have the Pt:Mo molar ratio equal to 43:1, 7:1 and
3:1 show higher electrocatalytic activity for sodium
borohydride and methanol oxidation reactions than pure
W/graphene and Mo/graphene catalysts. Moreover, sodium
borohydride oxidation current density values are 1.2-1.5 and
~81.2-101.1 times higher on different PtW/graphene catalysts
compared with those on the Pt/graphene and W/graphene
catalysts, respectively. In the case of PtMo/graphene catalysts,
sodium borohydride oxidation current density values are 22.7-
31.9 times higher at PtMo/graphene than those on the
Mo/graphene catalyst. Highest mass activity for sodium
borohydride oxidation reaction has been found on
PtW/graphene and PtMo/graphene catalysts that have the
Pt:W and Pt:Mo molar ratio equal to 1.6:1 and 3:1,
respectively.
3. Highest electrocatalytic activity for methanol oxidation
reaction showed the PtW/graphene catalyst that has the Pt:W
molar ratio equal to 1.6:1. Methanol oxidation current density
values recorded on the PtW(1.6:1)/graphene,
40
PtW(2.3:1)/graphene and PtW(7.1:1)/graphene catalysts are
ca. 2.1, 1.6 and 1.4 times higher compared with those on the
Pt/graphene catalyst and much higher e.g. 7.8, 6.0 and 5.2
times compared with those on the W/graphene catalyst.
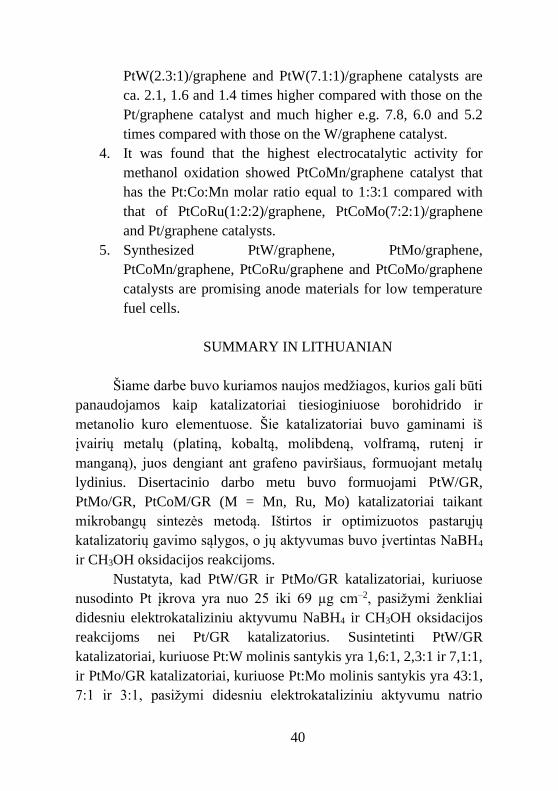
4. It was found that the highest electrocatalytic activity for
methanol oxidation showed PtCoMn/graphene catalyst that
has the Pt:Co:Mn molar ratio equal to 1:3:1 compared with
that of PtCoRu(1:2:2)/graphene, PtCoMo(7:2:1)/graphene
and Pt/graphene catalysts.
5. Synthesized PtW/graphene, PtMo/graphene,
PtCoMn/graphene, PtCoRu/graphene and PtCoMo/graphene
catalysts are promising anode materials for low temperature
fuel cells.
SUMMARY IN LITHUANIAN
Šiame darbe buvo kuriamos naujos medžiagos, kurios gali būti
panaudojamos kaip katalizatoriai tiesioginiuose borohidrido ir
metanolio kuro elementuose. Šie katalizatoriai buvo gaminami iš
įvairių metalų (platiną, kobaltą, molibdeną, volframą, rutenį ir
manganą), juos dengiant ant grafeno paviršiaus, formuojant metalų
lydinius. Disertacinio darbo metu buvo formuojami PtW/GR,
PtMo/GR, PtCoM/GR (M = Mn, Ru, Mo) katalizatoriai taikant
mikrobangų sintezės metodą. Ištirtos ir optimizuotos pastarųjų
katalizatorių gavimo sąlygos, o jų aktyvumas buvo įvertintas NaBH4
ir CH3OH oksidacijos reakcijoms.
Nustatyta, kad PtW/GR ir PtMo/GR katalizatoriai, kuriuose
nusodinto Pt įkrova yra nuo 25 iki 69 µg cm–2, pasižymi ženkliai
didesniu elektrokataliziniu aktyvumu NaBH4 ir CH3OH oksidacijos
reakcijoms nei Pt/GR katalizatorius. Susintetinti PtW/GR
katalizatoriai, kuriuose Pt:W molinis santykis yra 1,6:1, 2,3:1 ir 7,1:1,
ir PtMo/GR katalizatoriai, kuriuose Pt:Mo molinis santykis yra 43:1,
7:1 ir 3:1, pasižymi didesniu elektrokataliziniu aktyvumu natrio

41
borohidrido oksidacijos reakcijai, lyginant su W/GR ir Mo/GR
katalizatoriais. Išmatuotos natrio borohidrido oksidacijos srovės
tankio vertės yra 1,2-1,5 karto didesnės ant PtW/GR katalizatorių
lyginant su Pt/GR katalizatoriumi ir žymiai didesnės, t.y. apie 81,2-
101,1 karto už natrio borohidrido oksidacijos srovės tankio vertes ant
W/GR katalizatoriaus. PtMo/GR katalizatorių atveju, išmatuotos
natrio borohidrido oksidacijos srovės tankio vertės yra 22,7-31,9 kartų
didesnės nei jos yra ant Mo/GR katalizatoriaus. Didžiausiu masės
aktyvumu natrio borohidrido oksidacijos reakcijai pasižymėjo
PtW/GR ir PtMo/GR katalizatoriai kuriuose Pt:W ir Pt:Mo molinis
santykis yra atitinkamai 1,6:1 ir 3:1.
Didžiausiu elektrokataliziniu aktyvumu metanolio oksidacijai
pasižymėjo PtW/GR katalizatorius, kuriame Pt:W molinis santykis yra
lygus 1,6:1. Išmatuotos metanolio oksidacijos srovės tankio vertės ant
PtW(1,6:1)/GR, PtW(2,3:1)/GR ir PtW(7,1:1)/GR katalizatorių yra
atitinkamai apie 2,1, 1,6 ir 1,4 kartus didesnės negu jos yra ant Pt/GR
katalizatoriaus ir žymiai didesnės, t.y. apie 7,8, 6,0 ir 5,2 kartus, už
metanolio oksidacijos srovės tankio vertes ant W/GR katalizatoriaus.
Nustatyta, kad didžiausiu elektrokataliziniu aktyvumu
metanolio oksidacijos reakcijai pasižymėjo PtCoMn/GR
katalizatorius, kuriame Pt:Co:Mn molinis santykis yra lygus 1:3:1
lyginant su PtCoRu(1:2:2)/GR, PtCoMo(7:2:1) ir Pt/GR
katalizatoriais. Susintetinti PtW/GR, PtMo/GR, PtCoMn/GR,
PtCoRu/GR ir PtCoMo/GR katalizatoriai yra perspektyvios
medžiagos ir gali būti naudojamos žemos temperatūros kuro
elementuose.

42
LIST OF PUBLICATIONS
In Clarivate Analytics Web of Science
1. T. Kilmonis, L. Tamašauskaitė-Tamašiūnaitė, A. Balčiūnaitė, J.
Vaičiūnienė, M. Skapas, E. Norkus. “Microwave-assisted
synthesis of platinum-tungsten/graphene catalysts”. Chemija 27
(2016) 143-149.
2. T. Kilmonis, A. Nacys, D. Šimkūnaitė, L. Tamašauskaitė-
Tamašiūnaitė, A. Balčiūnaitė, E. Norkus. “Investigation of
methanol electro-oxidation on graphene supported platinum-
tungsten catalyst”. Chemija 30(3) (2019) 146-153.
3. T. Kilmonis, A. Nacys, A. Balčiūnaitė, V. Kepenienė, J.
Jablonskienė, J. Vaičiūnienė, M. Skapas, L. Tamašauskaitė-
Tamašiūnaitė, E. Norkus. “One-pot microwave-assisted synthesis
of graphene supported PtCoM (M = Mn, Ru, Mo) catalysts for low
temperature fuel cells”. J. Electrochem. Soc. (2019) (submitted).
In Other Referred International Journals
1. T. Kilmonis, L. Tamašauskaitė-Tamašiūnaitė, A. Balčiūnaitė, J.
Vaičiūnienė, E. Norkus. “Investigation of the graphene supported
platinum-tungsten catalysts prepared by microwave synthesis as
electrocatalysts for borohydride oxidation”. ECS Transactions
68(3) (2015) 45-53.
Publications in International Conferences
1. T. Kilmonis, L. Tamašauskaitė-Tamašiūnaitė, A. Balčiūnaitė, J.
Vaičiūnienė, E. Norkus. “Investigation of the graphene supported
platinum-tungsten catalysts prepared by microwave synthesis as
electrocatalysts for borohydride oxidation”. ECS Conference on
Electrochemical Energy Conversion Storage with SOFC-XIV:
Glasgow, Scotland (2015) C-0632.

43
2. L. Tamašauskaitė-Tamašiūnaitė, G. Kisielius, T. Kilmonis, A.
Balčiūnaitė, I. Stankevičienė, A. Jagminienė, A. Matusevičiūtė, E.
Norkus. “Preparation of graphene supported PtCoMo by
electroless deposition”. 66th Annual Meeting of the International
Society of Electrochemistry: Taipei, Taiwan (2015) ise151207.
3. T. Kilmonis, K. Semėnaitė, J. Vaičiūnienė, L. Tamašauskaitė-
Tamašiūnaitė, E. Norkus. “Graphene supported PtM (Mo, W)
catalysts for borohydride oxidation”. International Conference of
Lithuanian Society of Chemistry “Chemistry & Chemical
Technology 2016”: Vilnius, Lithuania (2016) p. 104.
4. A. Nacys, T. Kilmonis, L. Tamašauskaitė-Tamašiūnaitė, E.
Norkus. “Microwave-assisted synthesis of platinum-cobalt-
molybdenum/graphene”. International Conference of Lithuanian
Society of Chemistry “Chemistry & Chemical Technology 2016”:
Vilnius, Lithuania (2016) p. 63.
5. T. Kilmonis, K. Semėnaitė, J. Vaičiūnienė, L. Tamašauskaitė-
Tamašiūnaitė, E. Norkus. “Platinum-molybdenum/graphene as
catalysts for sodium borohydride oxidation”. Gordon Research
Conference “The Next Generation of Durable, High-Performance
Components and Fuel Cells, Including Modeling, Diagnostics,
and Materials Development Advancements”: Easton, USA
(2016).
6. L. Tamašauskaitė-Tamašiūnaitė, V. Kepenienė, A. Nacys, T.
Kilmonis, D. Žurauskaitė, V. Pakštas, E. Norkus. “Non-noble
metal alloys prepared by microwave synthesis for oxygen
reduction“. 19th International Conference: Materials, Methods &
Technologies: Elenite, Bulgaria (2017) 6.
7. E. Norkus, D. Ramaška, A. Balčiūnaitė, Z. Sukackienė, T.
Kilmonis, J. Vaičiūnienė, L. Tamašauskaitė-Tamašiūnaitė.
“Cobalt-boron-molybdenum deposited on nickel foam for
enhanced hydrogen generation”. 2nd International Conference on
Chemical and Biochemical Engineering (ICCBE2): Canary
Islands, Spain (2017) 1033.

44
8. T. Kilmonis, L. Tamašauskaitė-Tamašiūnaitė, E. Norkus.
“Synthesis of graphene based platinum-tungsten nanoparticles for
methanol and ethanol oxidation“. 4th International Conference on
Computational and Experimental Science and Engineering
(ICCESEN 2017) 135.
9. L. Tamašauskaitė-Tamašiūnaitė, T. Kilmonis, A. Balčiūnaitė, J.
Jablonskienė, J. Vaičiūnienė, E. Norkus. “Microwave-assisted
synthesis of graphene supported PtCoM (M = Mn, Ru, Mo)
catalysts for low temperature fuel cells”. In: Proceedings of 256th
ACS National MeetingExposition: 19-23 August, Boston, MA,
USA (2018), ID 2951423, ENFL-528 (oral presentation).
45
CURRICULUM VITAE
Personal information
Name, surname Teofilius Kilmonis
Address S. Kerbedžio g. 9, Vilnius
Telephone +370 67888011
E-mail [email protected]
Nationality Lithuanian
Date of birth 1987-01-08
Education
2006/09/01 – 2010/06/23 Bachelor degree of Biochemistry,
Vilnius university
2011/09/01 – 2014/06/20 Master degree of Chemistry, Vilnius
university
2014-2018 PhD studies at the Department of
Catalysis, Center for Physical Sciences
and Technology
Work experience
2017-09-30 till now Junior Research Associate, Department
of Catalysis, Center for Physical
Sciences and Technology
2015-09-01 – 2017-09-
29
Engineer, Department of Catalysis,
Center for Physical Sciences and
Technology
Participation in
scientific projects
2016-09-01 – 2018-08-31 “Wood-
based Carbon Catalysts for Low-
temperature Fuel Cells (WoBaCat)“
(PI. dr. L. Tamašauskaitė Tamašiūnaitė,
reg. No. project3213)

46
NOTES

47
NOTES

Vilniaus universiteto leidykla
Saulėtekio al. 9, LT-10222 Vilnius
El. p. [email protected],
www.leidykla.vu.lt
Tiražas 22 egz.