synthesis of nanoporous carbohydrate metal-organic ... · synthesis of nanoporous carbohydrate...
TRANSCRIPT

SYNTHESIS OF NANOPOROUS CARBOHYDRATE METAL-ORGANIC
FRAMEWORK AND ENCAPSULATION OF SELECTED ORGANIC COMPOUNDS
By
Saleh Al-Ghamdi
A THESIS
Submitted to Michigan State University
in partial fulfillment of the requirements
for the degree of
Packaging-Master of Science
2014

ABSTRACT
SYNTHESIS OF NANOPOROUS CARBOHYDRATE METAL-ORGANIC
FRAMEWORK AND ENCAPSULATION OF SELECTED ORGANIC COMPOUNDS
By
Saleh Al-Ghamdi
Cyclodextrin metal organic frameworks (CDMOFs) with different types of cyclodextrins
(CDs) (i.e., α, β and γ-CD) and coordination potassium ion sources (KOH) CDMOF-a and
(C7H5KO2) CDMOF-b were synthesized and fully characterized. The physical and thermal
properties of the successfully produced CDMOFs were evaluated using N2 gas sorption, thermal
gravimetric analysis (TGA), X-ray diffraction (XRD), and scanning electron microscopy (SEM).
The N2 gas sorption isotherm revealed high uptake into the micropores (330 cm3.g-1 for γ-
CDMOF-a) to macropore (125 cm3.g-1 for γ-CDMOF-b) structures with isotherm types I and II
for γ-CDMOFs and α-CDMOFs, respectively. The Langmuir specific surface area (SSA) of γ-
CDMOF-a (1376 m2.g-1) was significantly higher than the SSA of α-CDMOF-a (289 m2.g-1) and
β-CDMOF-a (54 m2.g-1). The TGA of dehydrated CDMOF crystals showed the structures were
thermally stable up to 300 oC. The XRD of the γ-CDMOFs and α-CDMOFs showed a highly
face-centered-cubic symmetrical structure. An Aldol condensation reaction occurred during the
encapsulation of acetaldehyde, hexanal, trans-2-hexenal, and ethanol into γ-CDMOF-a, with a
SSA of 1416 m2.g-1. However, γ-CDMOF-b with a SSA of 499 m2.g-1 was successfully used to
encapsulate acetaldehyde. The maximum release of acetaldehyde from CDMOF-b was 53 μg of
acetaldehyde per g of CDMOF, which is greater than previously reported acetaldehyde
encapsulation on β-CD inclusion complexes.

iii
ACKNOWLEDGEMENTS
First of all, I would like to start this work in the name of God; the most gracious, and
most merciful. I am thankful for all the guidance, inspiration, knowledge and everything that
people aware and not aware of.
Here, I would like to express my sincere thanks to my father and mother for their
guidance and support throughout this stage of my life. Thanks to my father for the first trip to the
library and thanks to my mother for building my first books collection as a valuable library.
Also, I would like to thank all my brothers and sisters for their help in every detail of my life. I
enjoy the time being with them and having a wonderful and meaningful life together. At this
point, I will never ever underestimate the powerful support from all my brothers and sisters as
they are growing up.
For my wife and my daughter, thank you for your assistance, motivation and
encouragement through this time. Note to my lovely daughter; you will grow up soon enough
and read this one day. Remember that I love you and I am proud of you…. and I always will be.
A special thanks to all the current and future professors in the college of Food and
Agricultural Sciences. Thanks to the Department of Agricultural Engineering’s Faculty and
Staff. To all my professors whom supported and believed in me, I would say thank you from the
heart for the greatest opportunity that you gave me.
To my guidance committee; Dr. Auras; thanks for standing for me and thanks for your
mentor throughout this work. I appreciate the time and the effort you spent during the last two
years. Dr. Selke; I would always be grateful and thankful for giving me the time and opportunity.

iv
Thank you for having me in the packaging program first and under your supervision second. Dr.
Abiad; I always appreciate your enthusiasm, sharing knowledge and your sincere insistence on
learning. Thank you again to you and your research group. Also, I am thankful for Dr. Liu and
her time.
In the School of Packaging I would like to thank Dr. Auras’s research group, all my
friends there and former Lab manager Dr. Kathuria and current manager Mr. Aaron Walworth. I
express my thanks to all the professors in the School of Packaging and staff. Special thanks to
Dr. Hotchkiss the former Director of the School of Packaging, and Dr. Selke the current
Director.
I would not forget all the friends, classmates and officemate at Michigan State
University, East Lansing, Lansing and the entire United States. For cheering up and
encouragement through my research and study time. I will be always grateful and thankful to
them for my whole life…
I thank Dr. Norma my advisor in the Saudi Arabian Culture Mission. Thanks to King
Saud University and Ministry of Higher Education in Saudi Arabia for facilitating this study and
the full support.
Finally, in general, all sincere thanks to whom those I have not state their names here
such as relatives, co-workers, and whom positively impacted my life. To who is reading this now
I’d say “We read to know that we are not alone” C.S. Lewis.
Saleh Al-Ghamdi
East Lansing, MI. 2014

v
TABLE OF CONTENTS
LIST OF TABLES ....................................................................................................................... vii
LIST OF FIGURES .................................................................................................................... viii
KEY TO ABBREVIATIONS AND SYMBOLS .........................................................................x
Chapter 1. Introduction and motivation..................................................................................... 1
1.1 Introduction ...................................................................................................................... 2
1.2 Metal-Organic Frameworks (MOF) ................................................................................. 2
1.3 Cyclodextrins (CD) .......................................................................................................... 7
1.4 Cyclodextrin Metal-Organic Framework (CDMOF) ....................................................... 9
1.5 Motivation ...................................................................................................................... 12
Chapter 2. Literature Review .................................................................................................... 13
2.1 Sorption isotherm ........................................................................................................... 14
2.2 Metal-Organic Frameworks (MOF) ............................................................................... 17
2.2.1 Structure .................................................................................................................. 19
2.2.2 Physical Properties .................................................................................................. 20
2.2.3 Chemical Makeup ................................................................................................... 20
2.2.4 Synthesis ................................................................................................................. 22
2.2.5 Applications ............................................................................................................ 22
2.3 Cyclodextrin (CD) .......................................................................................................... 23
2.3.1 Structure .................................................................................................................. 24
2.3.2 Physical Properties .................................................................................................. 27
2.3.3 Chemical Properties ................................................................................................ 27
2.3.4 Applications ............................................................................................................ 29
2.4 Cyclodextrin Metal-Organic Frameworks (CDMOF).................................................... 31
2.4.1 Structure .................................................................................................................. 32
2.4.2 CDMOF Properties ................................................................................................. 32
2.5 Potential Organic Compounds for CDMOF Encapsulation ........................................... 33
2.5.1 Acetaldehyde........................................................................................................... 33
2.5.2 Trans-2-hexenal ...................................................................................................... 33
2.5.3 Ethanol .................................................................................................................... 34
2.5.4 Hexanal ................................................................................................................... 34
2.6 Encapsulation of organic compounds ............................................................................ 35
Chapter 3. Synthesis and characterization of α, β and γ-CDMOF and Encapsulation and
release of acetaldehyde from CDMOF...................................................................................... 37
3.1 Introduction .................................................................................................................... 38
3.2 Materials and Methods ................................................................................................... 40
3.2.1 Materials.................................................................................................................. 40

vi
3.2.2 Synthesis and Activation of CDMOF ..................................................................... 40
3.2.3 Surface area and pore size....................................................................................... 42
3.2.4 Thermogravimetric Analysis (TGA)....................................................................... 43
3.2.5 X-Ray Diffraction (XRD) ....................................................................................... 43
3.2.6 Fourier Transform Infrared (FTIR)......................................................................... 44
3.2.7 Scanning Electron Microscopy (SEM) ................................................................... 44
3.2.8 Encapsulation and Release Method ........................................................................ 44
3.2.9 Color Measurements ............................................................................................... 46
3.2.10 Data Analysis .......................................................................................................... 46
3.3 Results and Discussions ................................................................................................. 47
3.3.1 Synthesis and Activation of CDMOF ..................................................................... 47
3.3.2 Surface Area and Pore Size..................................................................................... 50
3.3.3 Thermogravimetric Analysis (TGA)....................................................................... 53
3.3.4 X-Ray Diffraction (XRD) ....................................................................................... 55
3.3.5 Scanning Electron Microscopy (SEM) ................................................................... 59
3.3.6 Encapsulation and Release...................................................................................... 62
3.3.7 Color Measurements ............................................................................................... 67
3.3.8 TGA of encapsulated CDMOF ............................................................................... 68
Chapter 4. Conclusions and recommendation for future work .............................................. 70
4.1 Conclusion...................................................................................................................... 71
4.2 Recommendation for Future Studies.............................................................................. 73
APPENDIX .................................................................................................................................. 75
REFERENCES ............................................................................................................................ 81

vii
LIST OF TABLES
Table 1. Developed MOF and their SSA and pore volume. ....................................................... 19
Table 2. Structural properties of α, β and γ-CD. ......................................................................... 26
Table 3. Common properties of the organic compounds used for encapsulation. ...................... 35
Table 4. Quantity of KOH, C7H5KO2 and CD use to produce α, β or γ-CDMOF-a & b. ............ 47
Table 5. Time of crystallization of various CDMOFs using KOH and C7H5KO2. ...................... 49
Table 6. Specific surface area and pore volume and size. ........................................................... 53
Table 7. Theta angle and d-spacing for the first three planes of each CDMOF........................... 58
Table 8. Reaction strength of KOH with selected organic compounds. ..................................... 63
Table 9. Color measurements of reacted and unreacted γ-CDMOF exposed to acetaldehyde. ... 68
Table 10. Presents the surface area and pore volume. ................................................................. 77
Table 11. Release value in concentration and maximum system capacity. ................................. 78

viii
LIST OF FIGURES
Figure 1. Number of publications citing “Metal organic frameworks” in the manuscript as
recorded by Web of Science core collection and retrieved on November, 10 th 2014. ............ 3
Figure 2. Two dimensional structure of both Cu based MOFs, a) HKUST-1 (Copper benzene-
1,3,5-tricarboxylate), b) MOF-101 Cu2[O-Br-C6H3(CO2)2]2(H2O)2‚(DMF)8-(H2O)2. .......... 4
Figure 3. Zeolite structure, (red; oxygen and purple; silicone). ..................................................... 6
Figure 4. Three dimensional structure of CD a) 30o wired frame structure, b) side-view of β-CD
illustration (gray; carbon, red; oxygen and white; hydrogen). ................................................ 8
Figure 5. Two partial structures of the CDMOF, where seven K+ are attached to β-CD, a) ball
and stick, b) space filling (light gray; carbon, dark gray; potassium, red; oxygen and white;
hydrogen). Additional CDs are attached to this K+ ions........................................................ 10
Figure 6. The coordination of K+ with d-glucose units in γ-CD in both primary and secondary
faces plus one attached functional group (i.e., a) OH-, b) C7H5O2). ..................................... 11
Figure 7. Modern IUPAC classification of adsorption isotherms [22]. ....................................... 16
Figure 8. Schematic illustration of γ-CD. .................................................................................... 26
Figure 9. CD and functional groups of a) α-CD, b) β-CD, and c) γ-CD, respectively. Circles
around the structure present 3D spheres and dimensions. ..................................................... 28
Figure 10. Research fields reported on 39,738 CDs peer-review publications reported by Web of
Science since 1999 (retrieved November, 15th 2014). .......................................................... 31
Figure 11. Reaction pathway for the biosynthesis of trans-2-hexenal. ........................................ 33
Figure 12. γ-CDMOF-a growth and activation procedure. .......................................................... 41
Figure 13. Acetaldehyde a) encapsulation and b) release method. .............................................. 45
Figure 14. γ-CDMOF-a crystals with different sizes (graded from small up to large size at
bottom of the beaker). ............................................................................................................ 48
Figure 15. CDMOFs N2 sorption isotherm. ................................................................................. 51
Figure 16. Thermal analysis of activated α, β and γ CDMOFs crystals. ..................................... 55
Figure 17. X-Ray diffraction of different CDMOFs type. ........................................................... 57

ix
Figure 18. γ-CD SEM crystals picture. ........................................................................................ 60
Figure 19. SEM images of different CDMOFs. ........................................................................... 61
Figure 20. Aldol side reaction with γ-CDMOF-a when acetaldehyde was added to the jar........ 63
Figure 21. Reaction pathway of acetaldehyde and hydroxide group. .......................................... 64
Figure 22. Acetaldehyde released from γ-CDMOF-b.................................................................. 66
Figure 23. Thermal analysis of as-synthesized, activated, and encapsulated γ-CDMOF-b......... 69
Figure 24. Adsorption-desorption isotherm for γ-CDMOF-a and γ-CDMOF-b. ........................ 76
Figure 25. γ-CD pure starch SEM picture.................................................................................... 79
Figure 26. Calibration curve of the acetaldehyde. ....................................................................... 80

x
KEY TO ABBREVIATIONS AND SYMBOLS
Symbols key
MOF Metal organic framework
CD Cyclodextrin
CDMOF Cyclodextrin metal organic framework
SSA Specific Surface Area
BET Brunauer, Emmett and Teller
FHH Frenkel-Halsey-Hill
SBU Secondary building units
St Total surface area
P/Po Relative pressure

1
Chapter 1. Introduction and motivation

2
1.1 Introduction
The development of novel metal-organic frameworks (MOFs) has increasingly gained
attention in the scientific community because of their unique functionality and high surface area.
MOFs are crystal materials that consist of metallic ions linked to basic organic compounds and
forming one, two, and three-dimensional structures, which can be highly porous resulting in high
specific surface area (SSA). Throughout this work the term linker/s will be used interchangeably
for either metal or organic sites in the MOF structure, but bridging ligands will be used only for
the organic compounds as is the convention. MOFs were initially developed from the basic
understanding and research conducted from zeolites, and gained momentum as highly tailored
surface area structures. Following, a short introduction to MOFs is provided to give insight about
these novel structures.
1.2 Metal-Organic Frameworks (MOF)
MOF, on a fundamental level, are new crystal class materials that consist of inorganic
molecules linked to basic organic repeated units. MOFs can be highly porous materials and have
an ultra-high surface area that can cover a football field with only a few grams of MOF. In the
last decade, the development and production of MOF have exponentially increased, and a
massive number of patents and publications have been reported. Figure 1 provides an indication
of the increasing importance of the topic “metal organic framework” as evaluated by the number
of publications reported by Web of Science from 1999 to 2014.

3
Figure 1. Number of publications citing “Metal organic frameworks” in the manuscript as
recorded by Web of Science core collection and retrieved on November, 10 th 2014.
The crystallization or synthesis process of MOF combines both organic and inorganic
components. A simple chemistry technique can be used such as vapor diffusion or liquid-liquid
diffusion crystallization to create these complex structures. When the surrounding environment is
suitable, the inorganic ions start to create the linkages between the organic compounds.
Predominantly, the complex does not lose any of its functional groups. For example, the
hydroxide group attached to a potassium ion, forming a complex structure like in CD-MOF
structure, does not separate from the complex. This is the usual situation when there is no
4
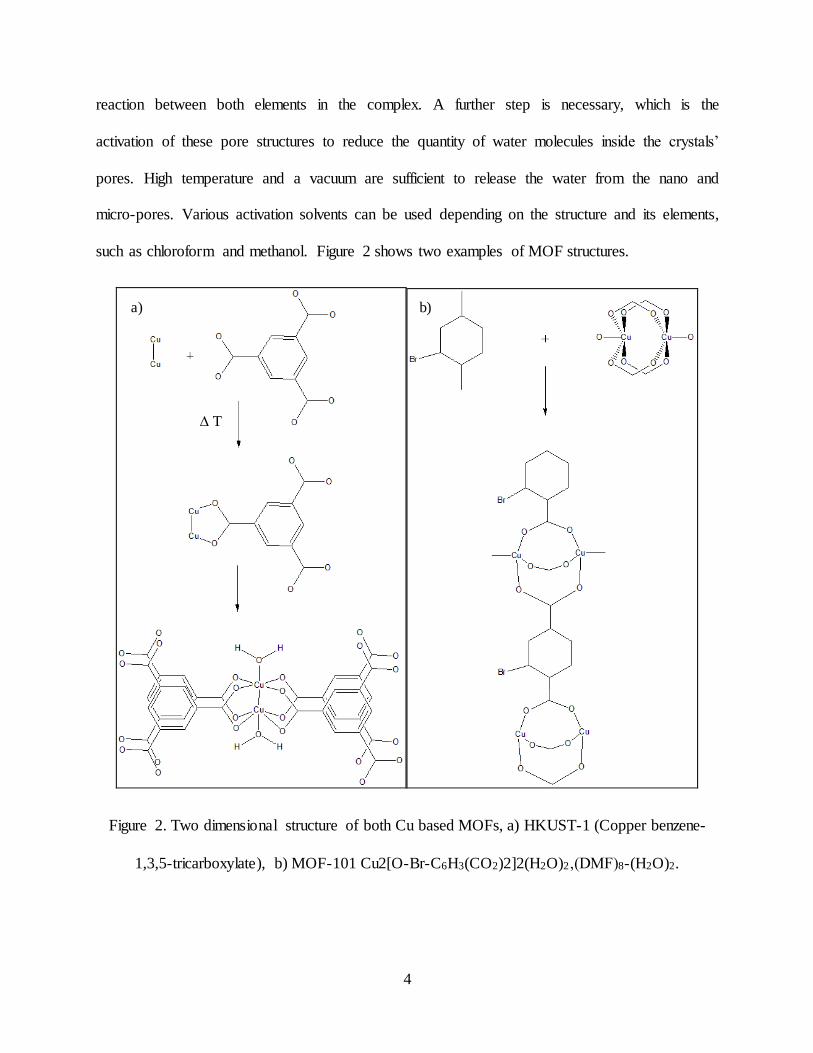
reaction between both elements in the complex. A further step is necessary, which is the
activation of these pore structures to reduce the quantity of water molecules inside the crystals’
pores. High temperature and a vacuum are sufficient to release the water from the nano and
micro-pores. Various activation solvents can be used depending on the structure and its elements,
such as chloroform and methanol. Figure 2 shows two examples of MOF structures.
Figure 2. Two dimensional structure of both Cu based MOFs, a) HKUST-1 (Copper benzene-
1,3,5-tricarboxylate), b) MOF-101 Cu2[O-Br-C6H3(CO2)2]2(H2O)2‚(DMF)8-(H2O)2.
a) b)
∆ T

5
MOF consists of inorganic-organic hybrid nano-to-micro-porous material similar to the
zeolite structure as shown in Figure 3. MOF clusters are built of metal ions, for example, but not
limited to Ag+, Zn2+, Co2+, Cu+, K, etc., joined by organic structures to form a two-or-three-
dimensional complex structure. The structural properties of MOF are determined by the metal-
organic combination. If the organic linker is flexible, as a result the MOF will experience some
flexibility. The geometry of the organic side will also affect the topography of the produced
MOF [1]. The idea of obtaining a stable structure is the core of MOFs innovations throughout the
past two decades to expand the range of potential applications. The most important features in
the MOF’s structure are the specific surface area (SSA), porosity and cohesion. The structural
unity provides advanced performance and a sustainable structure that does not collapse during a
variety of applications.

6
Figure 3. Zeolite structure, (red; oxygen and purple; silicone).
Applications of MOF are mainly based on their great storage capacity as one of its many
features that can be used. For example, in the automotive industry for specialized cars, MOF has
been tested for improving fuel storage capacity. In the chemical industry, MOF has been used for
improving catalysis function [2]. Separation and selectivity of air emission gases (e.g., CO2 and
CH4) are promising fields for MOF applications [3]. MOF has also been used in medical research
for making complex structures for pharmaceutical-delivery purposes [4]. Most of these
applications are still in the development phase. Hundreds of research groups around the world

7
are trying to produce new MOF structures and innovations that can be used for unique
applications [5]. Currently, one of the main innovations of MOF is based on creating MOF that
can be used in food, polymer, and packaging applications. This development is mainly based on
the use of cyclodextrins (CD).
1.3 Cyclodextrins (CD)
CDs are sugar-based compounds where the molecules are bonded together in a ring or
cyclic shape. CDs are made from starch using enzymatic fermentation. There are three main
types of commercial CDs: alpha (α)-CD has a 6-membered sugar ring molecule, beta (β)-CD has
a 7-membered sugar ring molecule and gamma (γ)-CD an 8-membered sugar ring molecule. CDs
are extensively used in drug delivery, pharmaceuticals, chemical industry, environmental
engineering, and agriculture [6].
CDs are synthetized by using enzymes like CD glycosyltransferase (CGTase) [7]. The
starch is liquefied by heat or by using the α-amylase treatment. After the CGTase is added in the
conversion process of α, β or γ-CD, CDs α: β: γ are produced on specific production ratio for
each specific CGTase enzyme. The separation process of α, β, or γ CD depends on the water
solubility where β CD is the least soluble. Chromatography based techniques or the use of
solvents such as acetone or ethanol can be used to separate produced CDs based on the number
of glucose units. Specific enzymes that can produce only one type of α, β, or γ CD have been
used by Wacker Chemie AG in the food industry [8].
The structures of the different type of CDs are well defined. Unlike the α, β or γ-CD other
CDs with large rings have been reported and are mostly used in laboratory research. CD rings as
large as 39 α -D-glucopyranose units linked 1→4 as in amylose have been developed. The

8
structure of CD has a hydrophobic interior cavity as a doughnut-shape consisted of a ring of C-H
chains and a hydrophilic exterior. This structure provides the ability of CD to host hydrophobic
molecules. However, the primary opening is smaller than the secondary face as shown in Figure
4. The primary hydroxyl side has the ability to rotate closing the primary side, but the secondary
side is relatively rigid (further explanation is given in the literature review).
Figure 4. Three dimensional structure of CD a) 30o wired frame structure, b) side-view of β-CD
illustration (gray; carbon, red; oxygen and white; hydrogen).
CDs have a wide variety of applications in the food, pharmaceutical and other industries.
The ability of hosting other guest molecules in its hydrophobic interior and the hydrophilic
exterior gives CD the ability to deliver an array of chemical compounds. α, β, and γ CD are all
classified as generally recognized as safe by the USA FDA [9]. Additionally, CDs can be used to
stabilize volatile compounds, and get rid of off-flavors and smells of food, and increase the
stability of colorants [10, 11]. In the pharmaceutical field, CDs are being used to host small drug

9
molecules that fit inside the CD cavity [12, 13]. There has been a very large use of CDs and
many more applications are expected for CDs [14]. CDs have been used to create novel nano-
and-micro CDMOF structures.
1.4 Cyclodextrin Metal-Organic Framework (CDMOF)
CDMOFs are a combination of starch γ-CD and earth metal ions such as potassium,
rubidium or cesium [15, 16]. The main advantages of these coordination structures are the high
SSA, new class of porosity, and being edible crystals. This innovation was initially reported in,
2010 [17], and it is gaining popularity among scientists and research groups (see additional
information in the literature review section). The potential applications and environmental
impact of these innovative structures are promising for several industry sectors, which are
focusing on nano-material building blocks and green chemistry as alternative environmentally
friendly substances.
To synthesize CDMOF, in general, one must have a carbohydrate source of CD and the
supporting metal ions. Until now, it has been shown that three plausible ions can be conjugated
with CD (e.g., K, Rb and Cs) as described by reference [17]. A basic chemistry technique to
produce CDMOF is vapor diffusion. Crystallization of the structure is the first process to occur
where the solution contained in a beaker is placed in larger closed beaker containing a volatile
solvent, which allows to evaporate and to create a vapor pressure upon the solution surface. This
pressure is responsible for nucleating the crystalline material within the solution. The vapor
diffusion technique is also used to produce other MOF crystal structures like PIZA-4 nonpolar
Zn4O framework with zinc-(II) trans-biscarboxylatetetraarylporphyrin bridges [18]. The final
step of producing CDMOF is the dehydration process just like for other porous materials.
CDMOF crystals need to be degassed to remove the water residue inside the pores.

10
CDMOFs have very distinguishable and unique structures that vary from other MOFs.
The doughnut-shape CDs are connected with at least four potassium, cesium or rubidium ions in
each face and on the sides. No ions are inside or blocking the CD cavity with this reticular
structure. As a result, the cavity and the pattern of CDMOF expand in a symmetrical manner to
form a reticulate structure. Figures 5 and 6 show a drawing of the formed structure.
Figure 5. Two partial structures of the CDMOF, where seven K+ are attached to β-CD, a) ball
and stick, b) space filling (light gray; carbon, dark gray; potassium, red; oxygen and white;
hydrogen). Additional CDs are attached to this K+ ions.

11
Figure 6. The coordination of K+ with d-glucose units in γ-CD in both primary and secondary
faces plus one attached functional group (i.e., a) OH-, b) C7H5O2.

12
Potential applications of these novel structures can be envisioned in the pharmaceutical,
medical, food and packaging industries. However, chemists might use this novel materials as a
catalyst to obtain other substances. In the case of the food and packaging industry, CDMOF may
be used for carrying or delivering chemical compounds in different systems. Bio-based
multifunctional membranes can be developed using this CDMOF as carrier devices [19].
1.5 Motivation
Due to the high SSA and pore volume of these new CDMOF structures compared with
CD, the objective of this thesis is to synthesize CDMOF and to explore the use of delivering
organic chemical compounds such as antimicrobials and antioxidants from these structures for
different industrial applications. The idea of the MOFs containing heavy metal next to food
hinders the application of MOF in the food and pharmaceutical industries. So, CDMOF may
create a venue for using these structures in these industries. Specifically, the objectives of this
thesis are:
1- Synthetize CDMOF structures based on α, β, and γ CD
2- Characterize and determine the properties of α, β, and γ CDMOF
3- Encapsulate selected chemical compounds such as trans-2-hexenal, acetaldedyde and
hexanal in CDMOF.
This document is structured in four chapters. Chapter one describes the introduction and
motivation of this work. Chapter two provides a literature review of CD, MOF, CDMOF, and the
properties and characterization of these structures. Chapter three presents synthesis and
characterization of α, β and γ cyclodextrin metal–organic frameworks, encapsulation, and
releasing of aroma compounds from nanoporous CDMOF. Chapter four draws conclusions and
discusses possible future work.

13
Chapter 2. Literature Review

14
In this chapter, both CD and MOF are discussed in detail. First, sorption isotherms of
different MOFs and similar materials are described. Then, MOFs’ physical, chemical and
structural properties are addressed as well as the synthesis and application of MOFs. Afterward
CDs’ chemical and physical properties are considered. CDMOF will be brought into
consideration to give a sense of this new developed material. Selected organic compounds such
as acetaldehyde, hexanal and both methods of encapsulation and release are briefly discussed.
2.1 Sorption isotherm
The physical and chemical adsorption isotherm is an intrinsic property of any macro-meso
and micropore solid type of material. Porosity in these structures is the reason for the high
specific surface area (SSA). Thus, surface area and pore density can be calculated depending on
how much gases and/or vapors is a material able to uptake into its pore volume. For example,
simple gaseous elements such as N2 and Ar are used to determine non-porous and mesoporous
hydroxylated silica [20]. Physisorption often does not involve reaction, but it occurs between
both adsorbent surfaces and the gas element. Chemisorption usually involve reaction with
substances that at least alter the properties of one of the materials involved [21].
There are several sorption isotherm types described by the International Union of Pure and
Applied Chemistry (IUPAC) [22]. The vast majority of the isotherms give an indication of the
material’s interior topography at constant temperature, for example, sorption isotherm at 77 K
for N2 gas. A theoretical model such as Brunauer, Emmett and Teller (BET) or Frenkel-Halsey-
Hill (FHH) could be used to obtain additional information of a material such as surface area and
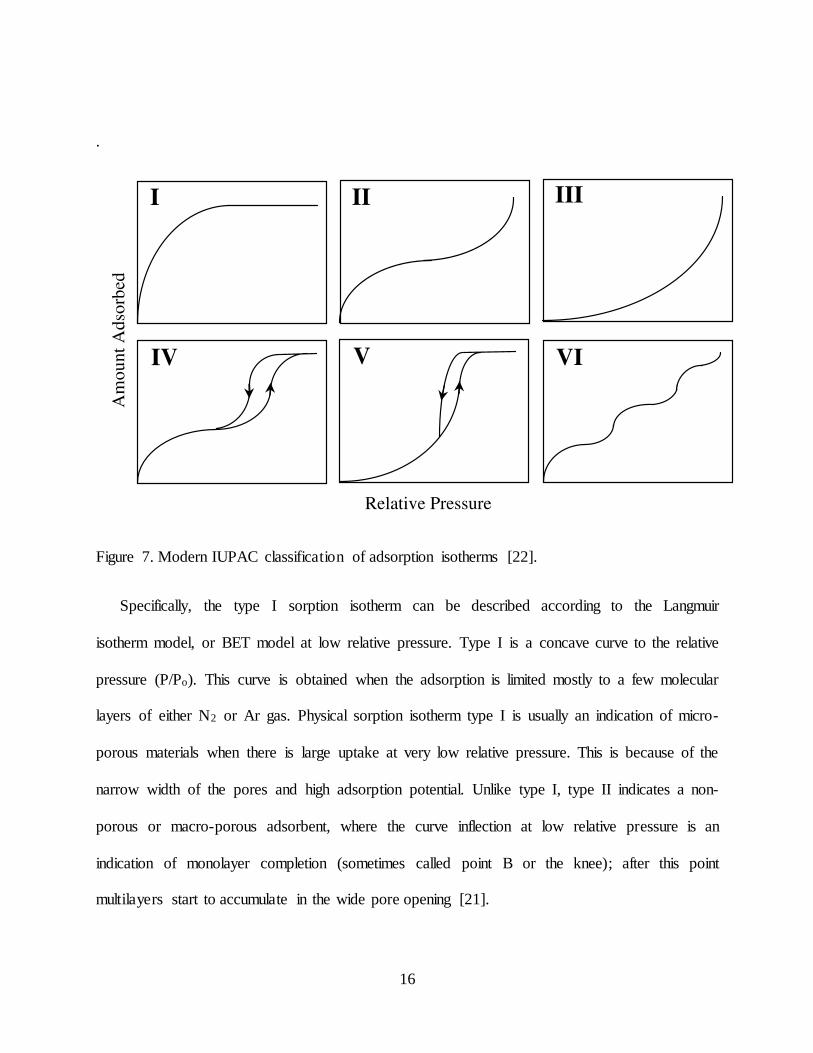
pore volume based on the adsorption and desorption behavior of gases. Figure 7 provides a list of
the modern IUPAC classification of adsorption isotherms.

15
• “Type I: characterize microporous adsorbent (monolayer adsorption only) with relatively
small external surfaces.
• Type II: describe adsorption on non-porous or macroporous adsorbent with strong
adsorbate–adsorbent interactions (unrestricted monolayer–multilayer adsorption).
• Type III: describe adsorption on non-porous or macro-porous adsorbent with weak
adsorbate–adsorbent interactions (rarely encountered).
• Type IV: represent adsorption isotherm with hysteresis (associated with capillary
condensation in mesopores).
• Type V: represent adsorption isotherm with hysteresis (pores present in the mesopore
range).
• Type VI: stepped isotherm (theoretically important, but rarely encountered).” [22]
16
.
Figure 7. Modern IUPAC classification of adsorption isotherms [22].
Specifically, the type I sorption isotherm can be described according to the Langmuir
isotherm model, or BET model at low relative pressure. Type I is a concave curve to the relative
pressure (P/Po). This curve is obtained when the adsorption is limited mostly to a few molecular
layers of either N2 or Ar gas. Physical sorption isotherm type I is usually an indication of micro-
porous materials when there is large uptake at very low relative pressure. This is because of the
narrow width of the pores and high adsorption potential. Unlike type I, type II indicates a non-
porous or macro-porous adsorbent, where the curve inflection at low relative pressure is an
indication of monolayer completion (sometimes called point B or the knee); after this point
multilayers start to accumulate in the wide pore opening [21].

17
SSA calculations use the low relative pressure section of the sorption isotherm to create a
linear relationship between the relative pressure and amount absorbed. Pore size and volume can
be taken either at low or high relative pressure depending on the porosity needing to be measured
(e.g., macro, meso and micropore range). Pore size or SSA can be estimated from the sorption
isotherm profile for each material.
2.2 Metal-Organic Frameworks (MOF)
One of the significant discoveries and great innovations, in the last two to three decades, was
the creation of MOF structures that integrate both organic and inorganic chemistry. Keskin et al.
reported that the number of publications indicating the term “Metal-Organic Frameworks” in the
topic are about 1,000 ISI papers in 2009 and 2010 [23]. However, the first reported building
block structure, in 1959, was a two-dimensional structure copper I adiponitrilo [24]. This
structure was a diamond-like framework. Still the structure of the two-dimensional MOFs being
produced resulted in a limited SSA of 270 m2.g-1; an example of that is MOF-2 [25]. A structure
of a three-dimensional building block, for instance, MOF-5 was published in 1999 by Li et al.
with a SSA of 2,900 m2.g-1. It was made from organic struts of terephthalic acid and zinc oxide
joints [26].
Since 1999 innovations of MOFs attracted scientists’ attention. A timeline of the most
remarkable MOFs’ structures, and their SSA is provided in Table 1. Until now, a complete
system to name MOF structures has not be produced. So, MOF’s names can depended of the
group that produced them. An extended structure of MOF-5 was reported [27]. Chae et al.
showed that the MOF-177 Zn4O(1,3,5-benzenetribenzoate)2 has the second highest surface area
of around 5,000 m2.g-1 [28] after the discovery of MOF-5 and new type of MOF named (MIL-
100) consists of 1,3,5-Benzoltricarboxylate [29]. A chromium terephthalate-based structure MIL-

18
101 was reported in 2005 by Férey et al. that has a SSA around 5,900 m2.g-1 [30]. Furukawa et
al. reported a MOF-201 consist of BTE/biphenyl-4,4′-dicarboxylate (BPDC) that has a surface
area of 6,240 m2.g-1 higher than the previous MIL-101 [31]. The last reported surface area, and
probably the highest among all new MOF crystals, was for the NU-100 almost 7,000 m2.g-1 this
was named after the location of the group that produced these MOFs, Northwestern University
[32]. All the SSA were reported using the Brunauer–Emmett–Teller (BET) model as shown in
Table 1.

19
Table 1. Developed MOF and their SSA and pore volume.
Year MOF name BET surface area
(m2.g-1)
Pore volume
(cm3.g-1)
Reference
2005 MIL-101 4,230 2.15 [30]
2007 MOF-177 4,750 1.59 [33]
2009 UMCM-2 5,200 2.32 [34]
2010 MOF-210 6,240 3.6 [31, 35]
2011 DUT-23-Co 4,850 2.03 [32, 36]
2012 NU-110E 7,140 4.40 [32]
2.2.1 Structure
MOF, as the name indicates, is a chemical structure that depends on organic substance
bridges and metal ion linkers [37]. However, these porous materials have open interior sides, and
as result small molecules can penetrate in and out without any difficulties. The larger molecules,
in contrast, would not have a chance to diffuse across the structure because of the small pore
opening that does not exceed a few nanometers. For instance, protein molecules are somewhat
larger than the opening pore size dimensions of early-developed MOFs, and it is hard for large
molecules to penetrate and to diffuse through the pores. Bigger pore sizes are possible at the
right conditions, for example, Mg-MOF-74 [38].

20
2.2.2 Physical Properties
Physisorption is one of the remarkable features of the MOFs, which depends on the SSA and
pore sizes. For example, separation of methane (CH4) from a carbon dioxide (CO2) mixture was
reported by Britt et al. using Mg-MOF-74 [39]. Gas capture and storage is also one of the
utilities that the MOF can provide CH4 and CO2 emision captured by MOFs have been
extensively studied. Most MOFs follow a type I adsorption isotherm, sometimes named
Langmuir isotherm [40], unlike other materials such as activated carbon or zeolite which follow
a type II sorption isotherm. MOFs provide full functionality when they are activated and the
pores are free of guess compounds like water molecules. Most MOFs are thermally stable up to
300 oC [41].
Optical properties of the MOFs have been investigated by several researchers. Ferroelectric
MOF like (L)-N-(4‘-cyanobenzy)-(S)-proline with CdCl2 was developed by Ye et al. and they
reported a high dielectric constant [42]. Allendorf et al. claimed that MOFs have luminosity from
their building blocks, structure and metal ions [43]. Color changes sometimes are an indication
of sensory properties such as CO2 adsorption. For example, MOF-505 with linker biphenyl-
3,3',5,5'-tetracarboxylic acid and metal Cu2(CO2)4 change from blue-green to light blue after
dehydration [44].
2.2.3 Chemical Makeup
From a simple chemistry point of view, crystallization techniques are used to build or link
molecules by strong bonds or what is so called reticular chemistry. This crystallization
methodology depends on the functional groups being crystallized or the basic materials of the
MOF. Vapor diffusion is one of the main techniques being applied to create pure crystals. A

21
study reported by Li and co-workers in 1998 used slow vapor diffusion at room temperature to
grow Zn(BDC) (BDC= 1,4-Benzenedicarboxylate) MOF [25].
The MOFs development process is unlike other chemical process since all functional groups
within the primary materials remain in the MOF structure. The structure backbone would still
hold each functional group in the right position within the structure. This is the ideal situation,
but not in reality. The real distribution for functional groups can be heterogeneous or
homogeneous depending on the functional groups attached to the structure. Kong and colleagues
provided a solution for the small, random, and alternating heterogeneous cluster functional
groups within the multivariate MOF (MTV-MOF-5) using solid-state nuclear magnetic
resonance (SSNMR) [45]. They showed a 400% improvement in selectivity of CO2 by mapping
the arrangement of the functional groups within the MOFs’ pores.
Tranchemontagne et al. showed a wide variety of transition-metal carboxylate clusters that
could be secondary building units (SBU) for MOFs, for example, Cr, Mg, Cu, Zr, Ag, and Fe
[46]. There are various possible combinations described depending on the bonds’ points of these
metal from three up to sixty six points. For example, Zn, C and O make a triangular SBU
structure [47]. CO2, C, O, and Cl create an octahedron structure [48], last but not least Fe, C, and
O create a hexagonal structure [49].
The chemistry of the MOF has improved beyond the humankind expectation knowing other
similar porous materials such as carbon black and zeolites due to their unique high SSA. Since
MOFs have an open-wall structure, they could facilitate the release of medication; however,
MOFs’ matrix degradation and the presence of the coordination of heavy metals might represent
a concern for human consumption or, in general, the field of drug delivery [50].Literature

22
information regarding the use of MOF in food chemistry and other human related applications is
very limited.
2.2.4 Synthesis
MOFs can be synthesized using slow crystallization technique. Crystallization starts
whenever there is saturation of the material in the solution. After that nucleation occurs very
slowly. There are several crystallization techniques such as liquid-liquid diffusion, slow cooling,
slow evaporation, and vapor diffusion. Vapor diffusion, which has been used intensively in MOF
synthesis, depends on the solubility of the raw materials in the solution, their boiling point and
the surrounding temperature. The solution must be placed into a higher vapor pressure solution
and allowed to create pressure on the solution to start nucleating [26]. Yaghi et al. synthesized a
number of MOFs (IRMOFs) using a method called solvothermal when a source of metal cations
and the organic linker dissolved together. In closed vessel the solvent is heated to a
predetermined temperature [51]; this method takes between one and seven days. A two-
dimensional MOF structure was produced by hydrothermal synthesis in several days [52]. Also,
a solvothermal method can produce MOF crystals in only 12 h [2, 53]. Liquid diffusion was used
to produce homochiral MOF in two days [2], rather than using solvothermal method to produce
homochiral MOF [54]. For rapid production, a special microwave solvothermal method can
produce MOFs such as IRMOF-1, 2 and 3 in a few minutes [55].
2.2.5 Applications
Gas separation, selectivity, sensitivity, and purification have been the main focus of some
researchers for developing MOFs [56, 57]. Capturing air emissions is one of the trending topics
tackled by MOF. Emissions such as CO2 and CH4 have been controlled by MOF [26, 58]. Due to
the large SSA of the MOFs, much larger than activated carbons, silica gels, and zeolites, MOFs

23
are promising candidates for gas storage and separation. A review done by Li et al. showed that
gas storage, selectivity (adsorption and separation), catalysis, magnetic properties, luminescence
and electronic properties are about half of the researchers’ interests in MOF. Harbuzaru et al.
showed the sensitivity and magnetic properties of lanthanide-based porous MOF (Ln-MOFs),
which are considered to have photoluminescence properties [59]. On the other hand, Corma and
co-workers showed the potential catalytic properties of MOF such as
hydrogenation/isomerization [60], cyanosilylation of aldehydes [61], oxidation of alcohols [62]
and Knoevenagel condensation [63-66].
Inclusion and uptake in the pores of the MOF take different approaches. Alkordi et al.
reported that the (In-imidazoledicarboxylate)-based RHO-ZMOF is suitable to uptake cationic
free-based porphyrin to function as a catalytic material [67]. In drug delivery, there is potential
use of MOFs such as MIL-53, MIL-88, MIL-101 and MIL101 that are suitable for carrying drugs
such as busulfan, azidothymidine triphosphate, doxorubicin, or cidofovir as reported by
Horcajada et al. The study showed a fair amount of release during the first 5 d for
azidothymidine triphosphate AZT-TP in MIL-100 [68]. Another study reported by Horcajada et
al. showed an interesting delivery system for ibuprofen around 20 % inside MIL-53 iron and
chromium based MOF [69].
2.3 Cyclodextrin (CD)
CD is a starch based substance. The history of CD started in early 1891 when three grams
were isolated from a large batch of starch. Twelve years later Schardinger reported the first
fermentation of β and γ-dextrin as they were called then. The authors claimed that the bacteria
would produce 25 – 30 % of crystalline materials, and they looked alike. Szejtli reported in his
book that there were four periods of the CD development [70]. The first period started from

24
1891, when the first publications were reported until the 1930s. The second period was from the
1930s to the 1970s when some structural development, enzyme modeling and properties
development were studied. The third period was from the 1970 to 1988 when there were at least
up to this point 750 patents for different applications of CDs. Finally, the fourth period started
right after 1988 when new development of CD was conducted [71].
In 1989, Schmid reported large-scale production of the enzyme cyclodextrin
glycosyltransferase (CGTase). The author expected a worldwide increased demand for CD
because of the affordable production cost and high acceptability in society [8]. Szejtli also
reported that by 1998 more than 15,000 peer-reviewed papers were published [70]. As the
number of publications increased, the number of applications rose [72]. Saenger explained that
plausible applications for CDs are in food processing, pesticides and pharmaceuticals [73]. In
1996, Szejtli reported that the market of CDs is distributed at 73 % for food and cosmetic
products, 15 % for pharmaceutical industry, 10 % for chemical industry, and 2 % for pesticides
and analytical chemistry components [74, 75]. Russell suggested that new research should be
conducted to develop new applications for CD and its derivatives [76].
2.3.1 Structure
The structure of the CD starts from the carbon-to-carbon atomic bonds in a glucose unit. The
primary hydroxyl groups are located on the first face of the CD’s structure. The secondary
hydroxyl groups are located on the secondary torus. The interior cavity of the CD’s ring contains
C-H groups, glucosidic oxygen and also C-H groups. Thus, the interior torus has high polarity
compared to water. The primary hydroxyl groups have the capability to rotate, but the secondary
face has somewhat rigid chains that cannot move [77].

25
The molecular weights for the α, β and γ-CDs are 972, 1135 and 1297 g.mol-1,
respectively, where the cavity diameters for α, β and γ-CDs are 0.47-0.53, 0.6-6.5 and 7.5-8.3
nm; numbers are for the primary-secondary faces, respectively. The height of the torus is the
same for all three CDs 0.79 nm. CDs do not have a well-defined melting temperature, but they
all decompose after approximately 300 oC. The solubility in water at 25 °C (%, w/v) differs; the
β CD is 1.85, α CD is 14.5 and γ CD is 23.2 (%, w/v) as shown in Table 2 [6]. Also, Figure 8
shows the γ CD interior and exterior dimensions.
The type of alignment differs in bulk CD molecules and there are at least three clear
positions that the CD can be found in. One of the main and first positions is the stacked CD when
the molecules of CD are packed on top of each other and form a channel along the CD cavity.
This channel can be head-to-head (primary to primary face) or tail-to-head (secondary to primary
face). The other position is herringbone; that is when molecules are not in order, and this is the
most common situation. The brick alignment is also another shape of the bulk molecules in CD
[78].

26
Table 2. Structural properties of α, β and γ-CD.
Figure 8. Schematic illustration of γ-CD.
Property α-CD β-CD γ-CD
Number of glucopyranose units 6 7 8
Molecular weight (g/mol) 972 1135 1297
Solubility in water at 25 °C (%, w/v) 14.5 1.85 23.2
Outer diameter (Å) 14.6 15.4 17.5
Cavity diameter (Å) 4.7–5.3 6.0–6.5 7.5–8.3
Height of torus (Å) 7.9 7.9 7.9
Cavity volume (Å3) 174 262 427

27
2.3.2 Physical Properties
The physical properties, as indicated in the structure section, are known for the four types of
CDs, α-CD, β-CD, γ-CD, and δ-CD. First, regarding the thermal properties of CD, the β-CD is
the most thermally stable CD with a thermal decomposition above 300 oC. The γ-CD is the
second stable CD before the α-CD, which starts to deteriorate at almost 300 oC, and the second
about 280 oC, respectively. The melting points for the α-CD, β-CD, and γ-CD are 57.2, 74.6 and
67.1 oC, respectively [79]. α-CD, β-CD, and γ-CD easily dissolve in water in large quantities as
indicated in Table 2, but the β-CD has the lowest solubility in water as shown Table 2. Solubility
at high temperatures is more likely to happen than at low temperatures for almost all CD types
[71].
In general, the CD inclusion needs prior activation to decrease the amount of H2O molecules
in the inner cavity. The crystal formation in water for the α-CD is hexagonal, β-CD is
monoclinic, and γ-CD is quadratic as described by Szejtli [71]. It should be noted that the
thermal properties differ in the β-CD and the γ-CD depending on the drug included in the
complex [80]. Thus, physical changes to the CD and encapsulation of certain chemical
compounds change the chemical properties either when the complex is bonded or being mixed
together.
2.3.3 Chemical Properties
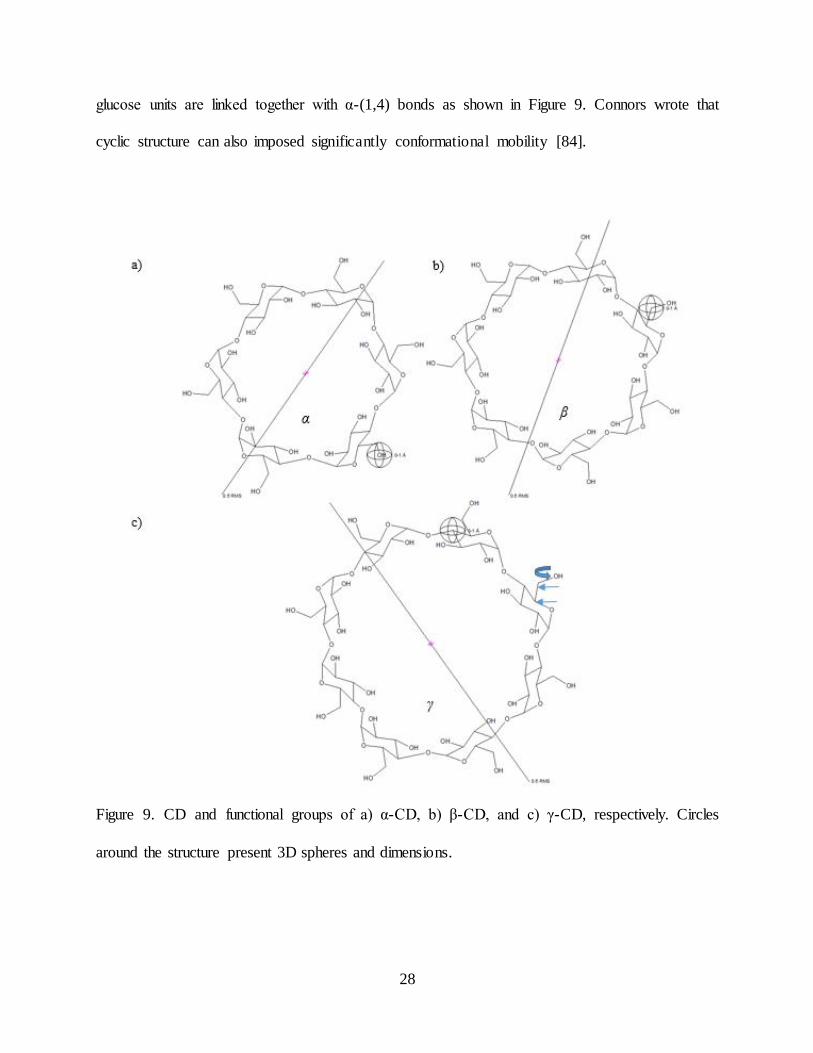
CD is a cyclic oligosaccharide consisting of α-(1,4) linked glucopyranose [6]. Figure 9
represents the CD structure of α, β, and γ-CD and the functional groups. α-CD consists of 6
glucose units, β-CD has 7 glucopyranose units, γ-CD has 8 glucopyranose units, and δ-CD has 9
units of sugar ring molecules [81]. Guest molecules in the interior cavity of CD can be included
by non-covalent interaction forces (e.g., hydrogen bonds or Van der Waals forces) [82, 83]. The
28
glucose units are linked together with α-(1,4) bonds as shown in Figure 9. Connors wrote that
cyclic structure can also imposed significantly conformational mobility [84].
Figure 9. CD and functional groups of a) α-CD, b) β-CD, and c) γ-CD, respectively. Circles
around the structure present 3D spheres and dimensions.

29
Van Etten et al. in 1996 showed that the polarity of the γ-CD cavity is very similar to
dioxane [85]. The composition of the CD chemical structure is 44.45 % C, 6.22% H and 49.34%
O atoms calculation is in the appendix. All CDs share this number because the nature of this
composition.
CD has very limited rotational movement around the glucosidic links. The glucose is a
very rigid bridge, but the hydroxyl group can rotate around the direction of the two carbon bonds
as illustrated with blue arrows in Figure 9 (c) [86]. Manor et al. reported that conformational
alternation in the CD complex must be considered in the inclusion process [87], for example,
alternation could be done by elevated heating.
Tanaka et al. studied CD involved in a reaction process of a gas-solid halogenation and
hydrohalogenation for the production of ethyl trans-cinnamate [88]. β-CD was also used in the
liquid-solid system reaction in Br2/CCI4 solution for the reduction of ketones [89]. Takahashi in
1998 described the organic reaction of the CD as two types; one involves an effect in a covalent
bond and the other one happens in the hydrophobic cavity. The first type is called a Michaelis-
Menten reaction. The second type does not involve the CD in the reaction, but the CD helps the
reactant to undergo another step in the reaction [90].
2.3.4 Applications
The first application reported using CD was drug delivery through inclusion complexation
[91]. Pharmaceutical and biomedical uses of delivering the guest molecules is referred to as
inclusion complex of CD. Manakker et al. described CD as a component with unique
physicochemical properties [92]. Mabuchi et al. reported the use of CD in the food and flavor
industry [93]. Since CD is a starch based substance, it can be used as a food ingredient [94]. CD
30
was also used as a catalyst changing the anisole with HOCl reaction [95]. Baudin et al. proved
that the CD can eliminate environmental emissions using inclusion of both (−)-geosmin and (+)-
2-methyl-isoborneol [96]. Lemon oil flavors were also encapsulated in inclusion complex in β-
CD using a paste method as reported by Bhandari et al. [97]. Marques suggested that all those
volatile compounds were encapsulated through non-covalent bonds in the cyclodextrin cavity
[98]. A natural anti-microbial volatile compound hexanal was encapsulated in β-CD by Almenar
et al. to prevent post-harvest microbial growth. Finally, β-CD was used as a nucleating agent
with poly(lactic acid) (PLA) in polymeric materials [99].

31
Figure 10. Research fields reported on 39,738 CDs peer-review publications reported by Web of
Science since 1999 (retrieved November, 15th 2014).
2.4 Cyclodextrin Metal-Organic Frameworks (CDMOF)
CDMOFs are a new class of crystals, developed from natural based components earth metal
cations potassium linked γ-CD [15]. This coordinated structures were named CDMOF where the
first two letters is the abbreviation for cyclodextrins, and the last three is the abbreviation for
metal organic frameworks [16]. CDMOFs can be obtained from food-grade substances
accomplishing safe material, unlike coordination with heavy metal substances such as Cu2+,
Zn2+, etc [17]. CDMOF’s properties are very unique among other MOFs, hence, they may
32
specifically be used in the food or drug related applications. One of the main components in
CDMOF is CD, which has some advantages of potential utilization, in pharmaceuticals, post-
harvest and advanced materials application [71, 100], as previously described.
2.4.1 Structure
The structure of the CDMOF consists of γ-CDs rings linked by potassium ions either from
the KOH or C7H5KO2 source. The organic source of this MOF is the eight-member glucose units
of the CD. This CDMOF has open walls and a large cavity compared to CD alone. The CD
primary face is connected by K+ ions to the secondary face of other CD molecules. Repetitive
units are formed in a long reticular manner that extends the SSA and affects the pore volume.
The K+ links are stable and still linked to their functional groups without any change in both CD
and potassium source structure. Small functional groups like hydroxyl and large ones like
benzene ring can be attached to the structure in the vapor diffusion technique.
2.4.2 CDMOF Properties
CDMOFs have been reported to have small cubic crystals that are thermally stable up to 275
oC. Nitrogen uptake in the CDMOFs has been reported, which indicates that these crystals have
high microporosities. The theoretical calculated pore density was 0.56 g.cm-3. The reported
surface area was about 1,220 m2.g-1 [17]. These new types of CDMOF have the ability for
information storage and working as resistive random-access memory RRAM where the elements
can be stored, read and erased [101]. CDMOF also has electrochemical sensitivity for CO2 and
the capability of sensing the CO2 concentration [102]. A safe use of this CDMOFs in a high
school chemistry laboratory experiment has recently been claimed [103].

33
2.5 Potential Organic Compounds for CDMOF Encapsulation
2.5.1 Acetaldehyde
Acetaldehyde is a complex compound naturally occurring in fruits, and it has several
pathways of reactions to be formed from ethanol or other chemical compounds [104]. Studies
have been reported in post-harvest applications for fruits using acetaldehyde as a defense
mechanism against diseases [100]. However, acetaldehyde in various concentrations has been
tested to reduce the rot of fresh fruits. Most of the time and because of its nature, acetaldehyde
showed significant impact on black and grey molds resulting from R. stolonifer and B. cinerea ,
respectively [105].
2.5.2 Trans-2-hexenal
Trans-2-hexenal has a green leafy odor and a molecular weight of 98 g mol-1 [106]. It can
have different acidity levels depending on the formation process. Also, trans-2-hexenal can be
produced as follows:
Figure 11. Reaction pathway for the biosynthesis of trans-2-hexenal.
Biosynthesis of trans-2-hexenal happened in chloroplasts from Thea sinensis [107]. This is
showing that the trans-2-hexanal can be produced using bio-based process and different natural
reaction pathway. There are some applications for trans-2-hexenal where it can be used as
antimicrobial compound incorporated in polymers. A recent study reported that the trans-2-

34
hexenal can be encapsulated into β-CD and incorporated into a poly(lactic acid) matrix by
extrusion and casting [108]. Other studies showed that the inclusion complexes of trans-2-
hexenal in β-CD were effective in reducing the activity of fungi A. solani, B. cinerea, C.
acutatum, Penicillium sp., and A. niger [109].
2.5.3 Ethanol
Ethanol is used in many applications like alcohol-based hand gels [110]. Also, it is
commercially available as an anti-mold product using ethanol release “microencapsulating food-
grade ethanol” for bakery products with high water activity to avoid mold growth and extend
product shelf life. Freund Industrial Co Ltd, designed packet that contains 55% silica gel and 35
% ethanol by weight under the trademark Ethicap® used for active packaging [111].
2.5.4 Hexanal
Measurement of the hexanal concentration can be an indication of meat quality as reported in
several studies [112-114]. On the other hand, hexanal at a concentration of 2 ppm showed an
excellent reduction of fungal growth, while at 4 ppm hexanal concentration totally prevented the
fungal activity of B. cinerea at 23 °C. Also, there were special effects on the colony lengths by
the hexanal encapsulated into the β-CD [115]. Hexanal (C6H12O) boils at 130 oC and has a
molecular weight of 100 g.mol-1. It has been shown that hexanal can be used to significantly
extend the shelf life of apple slices at low temperature in modified atmosphere packaging (MAP)
[116].

35
Table 3. Common properties of the organic compounds used for encapsulation.
Properties/compound Acetaldehyde Trans-2-
hexenal
Ethanol Hexanal
Boiling point oC 20.2 47 78 130
2-D Structure
Formula C2H4O C6H10O C2H6O C6H12O
Molecular weight g
mol-1
44 98 46 100
Density g cm-3 0.784 0.846 0.789 0.814
2.6 Encapsulation of organic compounds
For food science professionals, flavor and sustainable natural components are the main focus
to enhance food safety and quality [117]. For the chemical industry, catalysis are used to
improve the reaction rate or lower the activation energy of chemical reactions [118]. For the
pharmaceutical industry, drug delivery of non-stable chemical drugs is a large challenge [119].
So, the development of inclusion complexes where volatile and non-stable organic compounds
are encapsulated for further release is of paramount interest for all these industries.
Development of β-CD inclusion complexes has been a large area of development for
chemical’ compounds delivery. For example, Veiga et al. prepared a blend of Tolbutamide (1-
butyl-3-(p-tolysulfonyl) urea (TBM) (1:1) with β-CD for improving TMB bioavailability. The

36
process first started with kneading the mixture to ethanol:water solution (3:1) and drying at 40
oC. The solution then was frozen for 24 h. The solid quantity was washed and dried. Three
methods were used in this study; kneading, freeze-draying, and coprecipitation methods [120].
Almenar et al. prepared an inclusion complex of hexanal and β-CD in distilled water with
different concentration. The hexanal and β-CD paste was dried for 24 h at 40 oC. The authors
claimed that the maximum amount of hexanal encapsulated in β-CD complex was 1.40 ppb, and
the release was effective against the growth of fungi [100].

37
Chapter 3. Synthesis and characterization of α, β and γ-CDMOF and Encapsulation and
release of acetaldehyde from CDMOF
38
3.1 Introduction
Cyclodextrins (CD) are enzymatically made from a starch base, synthesized using CD
glycosyltransferase enzymes, which can produce α, β, γ, and δ CD forms [77]. α, β, and γ are
commercially available, but not δ-CD. The numbers of glucopyranose units are well defined for
α = 6, β = 7, γ = 8 and δ = 9 units. As results, the molecular weight of CDs will vary from 972
for α to 1459 g.mol-1 for δ, and the solubility in water of 14.5 g/100 mL for α to dissolve for δ
CD. The cavity diameter is the largest for the δ and smallest for the α CD. The hydrophilic
exterior and hydrophobic interior of the CD facilitate all types of CD usage in a number of
commercial applications in the food, pharmaceutical and chemical industries [121]. CDs are used
for a variety of applications such as preventing or stabilizing oxygen or light-sensitive
substances, improving the solubility of chemical substances, protecting different substances from
being consumed by living microorganism as a protection shell, and as a carrier for
pharmaceutical compounds [6, 94, 108, 115, 122, 123].
Metal-organic frameworks (MOF) are a new class of coordination polymer of metal ions
linked by organic molecules [37]. MOFs are well known for their gas sorption, separation,
selectivity and sensitivity due to their large specific surface area (SSA) [25, 26, 28, 53]. The SSA
is one of the main properties of the MOF structure, for example, MOF-210 has a Langmuir
surface area of 10,400 m2.g-1 [31]. Porosity in MOFs may vary within the same materials ranging
from meso/macroporous to nanoporous [27, 124].
The structural properties of MOFs are unique among other chemical organic and inorganic
structures such as zeolite and activated carbon [125]. With a three-dimensional solid structure,
MOFs are capable of hosting guest molecules such as H2, CO2, N2 and CH4 [126]. The MOFs
symmetric structure allows the guest molecules to penetrate in and out of their cavities [127].

39
CD has been recently used in coordination with earth metal ions (e.g., K+, Rb+, Na+, and Cs+)
to produce CDMOF [15]. Two practical applications were made possible by γ-CD and RbOH
coordination, called CDMOF-2. The first application was the electrochemical sensitivity for CO2
and the capability of sensing CO2 concentration [102]. The second application of CDMOF-2 was
information storage and working as resistive random-access memory (RRAM) where the
elements can be stored, read and erased [101]. CDMOF has a suitable structure for a number of
applications such as organic compound and drug delivery [128]. Understanding the CDMOF
crystal structure is the first priority before using CDMOF in new applications. To the best of the
authors’ knowledge, no extensive characterization and understanding of producing CDMOF
coordinated with different CDs and potassium hydroxide KOH or potassium benzoate C7H5KO2
have been carried out.
The main objectives of this study were to synthesize CDMOF from α, β and γ-CD with the
coordination of both potassium hydroxide (KOH) and potassium benzoate (C7H5KO2), and to
characterize the surface area, pore volume and size, thermal stability, and crystal structures of
these CDMOF structures. Also, study was to encapsulate organic compound like acetaldehyde in
the CDMOF nanostructure, and examine the release kinetic from CDMOFs’ pores. Aldol
condensation also was studied due to the functional group side reaction with other organic
compounds.
40
3.2 Materials and Methods
3.2.1 Materials
α, β and γ-CD (purity > 99%, food grade) were obtained from Wacker Chemical Corporation
(Adrian, MI, USA). KOH pellets (ACS reagent, purity ≥85%), and C7H5KO2 were purchased
from Columbus Chemical Industries, Inc. (Phoenix, AZ, USA). Anhydrous methanol (purity >
99.8%) was purchased from Sigma-Aldrich Corp. (Saint Louis, MO, USA). Distilled and
deionized water was purchased from Avantor Performance Materials (Center Valley, PA, USA).
Acetaldehyde (purity ≥99%, FCC), trans-2-hexanal (purity≥95%, FCC, FG), ethanol absolute
(200 proof) molecular biology grade and Hexanal (purity > 98%) were purchased from Sigma-
Aldrich Corp. (Saint Louis, MO, USA). All the materials were used as received unless otherwise
indicated.
3.2.2 Synthesis and Activation of CDMOF
A main method to synthesize CDMOFs is described1 by Smaldone et al., 2010 [17]. A ratio
of metal ion source and organic compound of 8 mmol:1 mmol was used. α, β and γ-CD 1.30 g
and 0.45 g of KOH were dissolved in 20 mL of deionized water and labeled in this work as α, β
or γ-CDMOF-a. When C7H5KO2 was the coordinating ion source, the amount of α, β or γ-CD
was 0.25 g and 0.26 g of C7H5KO2 and labeled as α, β or γ-CDMOF-b, and diluted in 5 mL of
deionized water. The solution was stirred for 6 to 8 h at 500 rpm. A slow vapor diffusion method
was used to produce the CDMOF crystals. The α, β or γ-CD and KOH or C7H5KO2 solution was
placed in a small 80 mL beaker, which was then placed in a bigger 500 mL beaker containing 50
mL of methanol. The 500 mL beaker was sealed with Parafilm to allow the methanol vapor
diffusion to take place for three to seven days. After the CDMOF crystals were produced in the
solution with average yield of 1.25 g for the CD and KOH and 0.30 g for the CD and C7H5KO2,

41
they were activated. The crystals were washed with methanol and filtered before activation. The
methanol-washing step was to remove additional potassium ions unlinked to the structure. The
crystals were placed in a vacuum oven at 4 kPa (30 mmHg) at room temperature for 10 h and
then the temperature was increased to 45 oC for an additional 12 h under the same vacuum
pressure 4 kPa. Figure 12 illustrates the production and activation processes.
Figure 12. γ-CDMOF-a growth and activation procedure.

42
3.2.3 Surface area and pore size
The gas sorption experiment was conducted using an iQMicropore-XR (Quantachrome
Instruments, Boynton Beach, FL, USA). The surface area, pore sizes and diameter were
calculated using the Brunauer-Emmett-Teller (BET) [129], and Langmuir methods. A 5 mg
weight sample of each synthesized α-CDMOF-a, β-CDMOF-a, γ-CDMOF-a, α-CDMOF-b, β-
CDMOF-b, and γ-CDMOF-b were dehydrated at the following conditions; 10 h of vacuum
pressure at 0.133 kPa (1 Torr) at 25 0.1 oC, and followed by heating at 45 oC for 12 h under
the same pressure. The specimens were then transferred to the sorption station where the N2
adsorption took place at 77.3 K and N2 gas sorption at a relative pressure varies from 10-5 to 0.99
[21].
The BET SSA for CDMOFs was calculated using the following equation;
where C is the BET constant, W is the adsorbed weight, is the weight adsorbed in a
completed monolayer and P/Po is the relative pressure. The Langmuir surface area was
calculated using the Langmuir theory for the concave isotherm toward relative pressure P/Po:
where K is the Langmuir equilibrium constant. The SSA was calculated as shown in equation
3.3.

43
where are the total surface area, number of molecules and cross section area of
adsorbate, respectively, and M is N2 molecular weight.
Micropore volumes were calculated at a radius of 2 nm and relative pressure 0.5 P/Po,
whereas total pore volumes were obtained at the relative pressure P/Po =0.99. Because the
sorption isotherm is not truly horizontal at high relative pressures (Figure 7) type I microporosity
and mesoporosity were reported and calculated by equation 3.4 and 3.5;
The total pore volume was calculated as the sum of the micropore and mesopore volume
where Vp is the total pore volume, Wa is the adsorbed amount (grams of fluid to specimen
amount in grams), and is the fluid density.
3.2.4 Thermogravimetric Analysis (TGA)
Evaluation of the thermal stability of α, β and γ-CDMOF-a and b crystals was conducted
using a TGA model 2950, from TA Instruments, New Castle, DE, USA. A sample weight of 5
mg activated α, β and γ-CDMOF-a and b was used. Samples were heated at 10 oC.min-1 from 25
0.1 to 450 oC. The data were collected and analyzed using Universal Analysis software version
2000 from TA Instruments.
3.2.5 X-Ray Diffraction (XRD)
The α, β and γ-CDMOF-a and b activated sample crystals were examined using a Bruker D8
advance X-ray diffractometer (Bruker AXS GmbH, Karlsruhe, Germany) radiation of Cu Kα
(λ=0.154 nm) at 40 kV, 40 mA, and 1.2 mm beam incision, and 2.0 mm detector slit [130], over

44
the range 3 to 40 o with increments of 0.02o. Very short wavelengths from 0.005 to 10 nm and
high energy x-ray diffraction were used to identify the d-spacing between structure layers at a
specified angle as specified by Bragg's law (3.5);
3.2.6 Fourier Transform Infrared (FTIR)
CDMOFs samples were examined using an FTIR spectrophotometer model Prestige-21 from
Shimadzu Scientific Instruments, Columbia, MD, USA. The surface reflection technique or
Attenuated Total Reflectance (ATR) mode was used with an ATR MIRacleTM Single Reflection
(PIKE Technologies, Inc., Madison, WI, USA) accessory. The wavenumber range was 600 to
4000 cm-1 for 60 scans.
3.2.7 Scanning Electron Microscopy (SEM)
Activated α, β and γ-CDMOF-a and b crystals were, first, mounted on aluminum stubs (SPI
supplies, West Chester, PA, USA). CDMOF samples were coated with platinum approximate
thickness 8 nm on the surface. Specimens were examined using a JEOL JSM 6410LV SEM
instrument (tungsten hairpin electron emitter) scanning electron microscope (JEOL Ltd., Tokyo,
Japan).
3.2.8 Encapsulation and Release Method
Encapsulation was carried out after the activation process of γ-CDMOF-a and b. First, 1 g of
activated γ-CDMOF-a or γ-CDMOF-b was placed in a small aluminum pan that was placed in a
1,960 mL glass jar. Acetaldehyde (1 mL) was injected to the jar and placed into a PTC-1
Temperature Cabinet at 25 ±0.1 oC with a controller device from (Sable System International,
NA, USA). Acetaldehyde was stored in a conventional refrigerator at 5 oC prior to injections.

45
The injections were carried out using a microsyringe that was purchased from Sigma-Aldrich (St.
Louis, MO, USA). The glass jar was sealed with a metal screw cap for an incubation time of 24 h
in the chamber to insure the acetaldehyde penetration in the γ-CDMOFs voids (Figure 13).
Figure 13. Acetaldehyde a) encapsulation and b) release method.
Determination of release amount of acetaldehyde from encapsulated γ-CDMOFs was
conducted by transferring the crystals to a new 1960 mL glass jar. The acetaldehyde
concentration in the headspace was measured at 25 ±0.1 oC. A gas chromatographer (GC), from
Hewlett Packard GC 6890, CA, USA, with a flame ionization detector (FID) and a HP-5 column
dimension 30 m × 0.32 mm × 0.25 μm, was used to determine the headspace concentration for
acetaldehyde release in the glass jar. An airtight gas micro-syringe was used to extract 0.25 uL
from the jar headspace through a rubber septum and injected into the GC. Figure 13 shows a
schematic of this experiment. 25 uL samples from headspace were injected to the GC in 1, 2, 3,

46
4, 5, 6, and 24 h. The GC setting conditions were as follows; oven temperature initially 80 °C for
2 min, and increased to 200 °C at 10 °C.min-1. The detector and the inlet temperatures were at
240 °C. A calibration curve between 50 to 500 uL/L of acetaldehyde concentration was
constructed at temperature of 25 ± 0.1 °C with adjusted R-square= 0. 990. Samples were tested
in triplicate.
3.2.9 Color Measurements
Encapsulated γ-CDMOF-a and b specimens were examined using a Mold U-4100 HunterLab
LabScan XE (Reston, VA, USA) colorimeter. After 24 h of incubation time, the encapsulated γ-
CDMOF-a and b, and activated γ-CDMOF-a and b were examined. Lightness L*, a* from red
positive to green negative, b* from yellow positive to blue negative were obtained. ∆E total color
change was calculated using the equation (3.6);
ΔE = [(ΔL*) 2 + (Δa*)2 + (Δb*)2]1/2…(3.6)
3.2.10 Data Analysis
The data were analyzed using Tukey's HSD (Honestly Significant Differences) for the means
comparisons with α = 0.05 at 95% confidence interval using SAS 9.4 Software (SAS Institute
Inc., Cary, NC, USA).

47
3.3 Results and Discussions
3.3.1 Synthesis and Activation of CDMOF
All CDMOF samples, formed from different CDs and potassium ion sources, were
successfully produced with KOH yielding about 1.20 to 1.30 g (70% yield) α, β or γ-CDMOF-a,
and C7H5KO2 yielding around 0.25 to 0.30 g (50% yield) α, β or γ-CDMOF-b. All the CDMOFs
samples were able to crystallize during the methanol vapor diffusion process. Table 4 shows the
average amount of CDMOF crystals produced using α, β or γ-CD. The lack of solubility of the β-
CD was solved effectively by adding an additional 5 mL of deionized water to the solution.
Figure 14 shows γ-CDMOF-a crystals.
Table 4. Quantity of KOH, C7H5KO2 and CD use to produce α, β or γ-CDMOF-a & b.
KOH (g) C7H5KO2
(g)
CD (g) H2O (mL) Yield (g
crystals)
α-CDMOF -a 0.45 -- 1.30 20 1.25
α-CDMOF -b -- 0.26 0.25 5 0.30
β-CDMOF-a 0.45 -- 1.30 20 1.25
β-CDMOF-b -- 0.26 0.25 10 0.30
γ-CDMOF-a 0.45 -- 1.30 20 1.25
γ-CDMOF-b -- 0.26 0.25 5 0.30

48
Figure 14. γ-CDMOF-a crystals with different sizes (graded from small up to large size at bottom
of the beaker).
Table 5 shows the crystallization time of all α, β and γ-CDMOFs with either KOH or
C7H5KO2. High methanol pressure accelerates the crystallization and coordination between
different CDs and potassium ions present in the solution. The delay of growth in the α-CD with
KOH can be attributed to the small size of the functional groups (OH) with K+ and α-CD. When
α, β and γ-CDs were diluted in H2O with C7H5KO2, crystallization occurs in 2 to 3 d, whereas γ,

49
β and α-CDs with KOH solutions took 1.3, 10 and 30 d, respectively. The d-glucose number 6, 7
and 8 for α, β and γ-CDs influenced the time of crystallization with KOH, but not with C7H5KO2.
The presence of the functional groups with K+ greatly affected the growth time because of the
energy state and size of the CD molecules. These small, functional groups (e.g., OH) can be
excited by the surrounding visible light more than the benzene ring in the C7H5KO2 structure.
Thus, this movement caused by, for example, but not limited to, surrounding visible light caused
the ion coordination with CD to be difficult and/or taken time as illustrated in Table 5. However,
a sufficient amount of either KOH or C7H5KO2 added into the solution eventually will coordinate
with CDs to form crystals. A recommended rapid crystallization technique should be used, for
instance, microwave-assisted solvothermal to assess how fast this crystallization can be formed
[131].
Table 5. Time of crystallization of various CDMOFs using KOH and C7H5KO2.
Time, day
CD Type \ Ion Source KOH C7H5KO2
γ -CDMOF 1.3 * 2
β-CDMOF 10 3
α -CDMOF 30 (20%)** 3
* Similar times were reported in reference [132].
**indicate that from 10 jars used for ethanol diffusion only 20% crystallized.

50
3.3.2 Surface Area and Pore Size
Surface area and pore volume are important features for CDMOFs crystals. The selection of
organic structure and ion linker determines the theoretical pore volume and expected surface
area, for example, the γ-CDMOF-a has a theoretical pore density of 0.56 g.cm−3 as reported by
Smaldone et al. [17] and calculated by space simulation or advance chemical drawing software.
CDMOF samples were examined using N2 gas physisorption. All the CDMOFs were dehydrated
prior to the experiment. Figure 15 shows the adsorption-desorption isotherms. The highest
adsorption was obtained for the γ-CDMOF-a. The γ-CDMOF-a and γ-CDMOF-b showed type I
isotherm behavior (Langmuir). The γ-CDMOF-a adsorption was about 300 cm3.g-1. At high
relative pressures, γ-CDMOF-b showed about 150 cm3.g-1 N2 uptake. In general, β-CDMOFs
showed the lowest adsorption-desorption, and both did not exceed 20 cm3.g-1 at any relative
pressures. However, α-CDMOFs were surprisingly different; α-CDMOF-a had higher adsorption
compared to both β-CDMOFs. The highest point was about 30 cm3.g-1 N2 adsorption at 0.99
relative pressure for α-CDMOF-a. The behavior of α-CDMOF-b was similar to behavior of
zeolite-like materials [133] and macroporous adsorbents [21]. This could be attributed to small
α-CD and different structural arrangement compared to the γ-CDMOF. Different ion sources
seemed to influence the N2 adsorption where coordination with C7H5KO2 gave highest
adsorption than KOH. The γ-CDMOFs were opposite with the highest adsorption for the γ-CD
with coordination of KOH. It is possible that the functional group with potassium benzoate ion
creates larger macro-voids and greater uptake at high relative pressure. That was almost
comparable to the γ-CDMOF-b.

51
Figure 15. CDMOFs N2 sorption isotherm.
Table 6 provides the surface area and the total pore volume in addition to the microporous
and mesoporous volumes of the synthesized CDMOFs. The average radius for the crystal pores
of each of the CDMOFs is also provided. The surface area of the γ-CDMOF-a was the highest of
all the produced CDMOFs due to the large CD molecules and small attached functional groups
to the K+. The total pore volume of the γ-CDMOF-a was 0.50 cm3.g-1, and was not significantly
different from the theoretical value of 0.56 cm3.g-1. The micro and mesopore volumes indicated
that γ-CDMOF-a and γ-CDMOF-b have micropores, which conforms work done by Smaldone et
al. [17]. The γ-CDMOF-b had a surface area significantly different from γ-CDMOF-a. The total
pore volume of the γ-CDMOF-b was 0.22 cm3.g-1, which is smaller than the pore volume of γ-

52
CDMOF-a and comparable to the MOF-200 pore volume [31]. The low surface area could be
attributed to the large functional groups (benzene ring) attached to the potassium benzoate. The
average pore radius was not significantly different in both γ-CDMOF-a (0.79 nm) and γ-
CDMOF-b 0.40 nm due to the large variation of radius. β-CDMOFs showed the lowest surface
area of all CDMOFs with BET SSA of 32 m2.g-1 and Langmuir SSA of 54 m2.g-1 for β-CDMOF-
a , which are lower than the Langmuir SSA values for zeolite 300 to 800 m2.g−1 [57]. The total
pore volume for both β-CDMOFs was 0.02 cm3.g-1, smaller than the MOF-3 which was 0.03
cm3.g-1 and a similar N2 uptake [41]. The average pore radius was not significantly different
from all the other produced CDMOFs due to the great variation in the determinations. α-
CDMOFs had significantly higher surface area compared to β-CDMOFs. The highest BET
surface area of all α-CDMOFs and β-CDMOFs was for the α-CDMOF-b with a SSA=74 m2.g-1
and Langmuir SSA of 289 m2.g-1, which is higher than the values reported for the flowerlike
iron oxide nanostructures [134]. Both α-CDMOFs showed noticeable mesoporous behaviors; for
the α-CDMOF-a the mesoporous volume equaled microporous volume; and both were 0.02
cm3.g-1. This is shown by potential physical absorbance in either low or high relative pressure.
For the α-CDMOF-b the mesoporous volume was double the microporous volume, 0.12 and 0.06
cm3.g-1, respectively. This can be attributed to the highest absorption in the high relative pressure
region for the type II isotherm. The total pore volume of the α-CDMOF-b of 0.18 cm3.g-1 was
higher than the γ-CDMOF-a 0.05 cm3.g-1. Both α-CDMOFs did not reveal any significant
differences in the average pore radius than the rest of the CDMOFs samples due to the variation
in the pore radius average.

53
Table 6. Specific surface area and pore volume and size.
CDMOFs BET SA
(m2/g)
Langmui
r SA
(m2/g)
Microporous
volume
(cm3/g)
Mesoporous
volume
(cm3/g)
Total
Pore
volume
(cm3/g)
Average
Pore
Radius
(nm)
γ-CDMOF-a* 1229±6a
1376±18a
0.49±0.02a
0.01±0.00b
0.50±0.02a
0.79±0.01a
γ-CDMOF-b 417±110b
607
±102b
0.18±0.03b
0.03±0.00b
0.22
±0.03b
0.40±0.40a
β-CDMOF-a 32±10c
54
±12d
0.01±0.00c
0.00±0.00b
0.02
±0.00c
0.15±0.02a
β-CDMOF-b 19±15c
51±22d
0.01±0.00c
0.01±0.00b
0.02
±0.00c
0.43±0.20a
α-CDMOF-a 40±17c
106±52cd
0.02±0.01c
0.02±0.01b
0.05±0.02c
0.26±0.04a
α-CDMOF-b 74±41c
289±86c
0.06±0.01c
0.12±0.02a
0.18 0.04b
0.58±0.18a
Note: Values in the same column with the same superscript letters are not significantly different at α =
0.05. Micropore volumes were calculated at a radius of 2 nm, whereas total pore volumes were obtained
at the relative pressure P/Po =0.99.*denote the K+ source a) KOH b) C7H5KO2.
3.3.3 Thermogravimetric Analysis (TGA)
Figure 16 shows the thermal analysis conducted for all activated CDMOF crystals. At around
100 °C all CDMOFs lost from 5 to 10% of the CDMOF weight mostly due to the evaporation of
the H2O molecules and residual methanol. These H2O molecules could be remained after the
methanol activation, which has a low boiling point of 64.7 °C. Almost all the CDMOF crystals
started to degrade at temperatures around 250 to above 300 °C. The remaining residuals vary, at
high temperature 450 °C, from 18 to 30% of the total sample weight residuals were observed.
The powdery residue left after the thermal decomposition of the crystals can be interpreted as the
remaining metallic elements in the structure (K+) obtained either from KOH or C7H5KO2 and CD
ash.

54
Activated γ-CDMOF-a and γ-CDMOF-b in Figure 16 started to degrade at a similar
temperature between 250 and 300 °C. This was also comparable to the γ-CDMOF-a and cubic
gel γ-CDMOF-a reported by Furukawa et al., 2012 [132]. The remaining residue for the γ-
CDMOF-a was around 20% of the sample weight at 450 °C while the residue of the γ-CDMOF-b
sample was almost 30% due to the difference in the functional groups attached. A similar loss of
weight of around 5-10% at low temperature for both γ-CDMOFs was observed. β-CDMOFs
showed similar initial weight lost at low temperature, but not at the decomposition point. Both β-
CDMOFs showed a weight decrease of 10% at 100 °C. The degradation of the β-CDMOF-a was
faster at lower temperatures compared to β-CDMOF-b that degraded at almost 300 °C. Both α-
CDMOFs showed similar thermal behavior and slight difference in final weight. The two
samples lost initially 10% of the weight, and the remaining residues were around 20% at 450 °C.
α-CDMOFs showed thermal degradation behavior around 250-260 °C for α-CDMOF-a and 260-
270 °C for α-CDMOF-b.
A small variation in the degradation point for each CDMOF was observed at 270-300 °C due
to the difference in the potassium ion source since the KOH degraded faster than the C7H5KO2.
The type of functional group attached to both ion sources was not the same, and therefore
variations are expected. The higher molecular mass for the C7H5KO2 160 g.mol-1 resulted in
higher degradation compared to the KOH with a molar mass of 56 g.mol-1 in CDMOF. The
degradation point of CDs was also part of the difference attributed to this variation. For example,
the highest thermal stability was reported for the β-CD 314 °C, γ-CD 297 °C, and the lowest was
α-CD 293 °C [135]. The large surface area and pore volume also may play a role in exposing the
CDMOF structure to degradation at lower temperature. For instance, the lowest surface area was
for the β-CDMOF-b, which was 19 m2.g-1, and it showed the highest degradation temperature.

55
For catalysis purposes requiring a higher degradation temperature β-CDMOF-b may be suitable
for such application.
Figure 16. Thermal analysis of activated α, β and γ CDMOFs crystals.
3.3.4 X-Ray Diffraction (XRD)
Figure 17 shows the x-ray diffraction results for all six CDMOF structures. All CDMOFs
were activated before conducting the XRD tests. γ-CDMOF-a showed a similar XRD pattern as
the work simulated and examined by Smaldone et al. [17]. All produced CDMOFs crystals had a
Face-Centered Cubic (FCC) structure according to the XRD plane diffraction matching the

56
values reported so far [17]. Table 7 shows the planes with d-spacing and 2θ angles for the first
three peaks of each XRD graph. The d-spacing for the CDMOFs with
C7H5KO2 CDMOF-b were generally larger than the samples prepared by the KOH CDMOF-a by
at least 0.1 nm. This may be due to the fact that the functional groups differed in size and space
that they took within the structure. β-CDMOFs were showing lower intensity compared to γ-
CDMOFs, but both β-CDMOFs had a large number of peaks. Conversely, α-CDMOFs had the
fewest peaks and high-diffracted intensity. Therefore, we can speculate γ-CDMOFs and α-
CDMOFs have considerably highly symmetrical structure compared to β-CDMOFs. This is due
to the surface roughness and the geometry of the crystals [136, 137]. Possibly the odd number of
d-glucose units in the β-CD which allowed CD to coordinate with seven potassium ions resulted
in an asymmetrical structure. The coordination of each CD with the other neighboring CDs
through the ions coincided with at least four peaks as reported by Smaldone et al. [17]. In
general, the 2θ angle increased as the d-glucose unit number in the CD increased due to the
structure pattern.

57
Figure 17. X-Ray diffraction of different CDMOFs type.

58
Table 7. Theta angle and d-spacing for the first three peaks of each CDMOF.
CDMOFs Plane 2θ (o) d-spacing (nm)
γ-CDMOF-a 110
200
211
4.0
5.7
6.9
2.1
1.5
1.2
γ-CDMOF-b 110
200
211
3.8
5.5
6.9
2.2
1.6
1.2
β-CDMOF-a 110
200
211
4.6
6.5
9.2
1.8
1.2
0.9
β-CDMOF-b 110
200
211
4.3
6.0
8.7
2.0
1.4
1.0
α-CDMOF-a 110
200
211
5.3
5.6
7.5
1.6
1.5
1.1
α-CDMOF-b 110
200
211
5.5
6.6
7.3
1.6
1.3
1.1
59
3.3.5 Scanning Electron Microscopy (SEM)
Figure 18 shows a γ-CD image and shows that the γ-CD has multiple size particles shown in
in the background. The crystals of γ-CD did not show any symmetrical structure at the micron
scale unlike the CDMOF in Figure 19. First, Figure 19 shows a SEM image of the activated
CDMOFs. γ-CDMOFs both showed a cubic structure in these SEM images. In general, the
differences between the two γ-CDMOFs is that the γ-CDMOF-a has more defined cubic shaped
structure than the γ-CDMOF-b. The cubic size of both γ-CDMOFs was not significantly
different. β-CDMOFs were different than both γ-CDMOFs. The size of the cubic crystals in
both β-CDMOFs was considerably larger than both γ-CDMOFs. The difference between β-
CDMOF-a and β-CDMOF-b was the surface roughness. The surface of β-CDMOF-a was much
smoother than the β-CDMOF-b as shown in the SEM pictures. That could be perhaps due to the
difference in nucleating pattern in both β-CDMOFs. A limitation of the crystallization was clear
in β-CDMOF-b when the surface did not have a chance to be part of the smooth crystals. Figure
19 shows α-CDMOF-a which presents a structure of a pack of laminae packed together as well
as α-CDMOF-b with some CD residues. Both laminae dimensions vary where α-CDMOF-a has
considerably smaller laminae compared to α-CDMOF-b. α-CDMOFs showed a different class of
crystals that still (FCC) according to the XRD results. Laminae were built from very small cubic
structures. The variation in α-CDMOF geometry could be due to the extension of the structure
only in one direction more than the other. Alignment of the α-CDMOFs can be an advantage
when such structure is needed with nanocomposites, for example. Finally, CDMOF SEM images
showed a class of crystals unlike the pure γ-CD alone Figure 18 and 26. The different metal
coordination was capable of producing different FCC shapes of crystals. α, β, and γ-CDs stack in
a different symmetrical structure with the same or different ion sources.

60
Figure 18. γ-CD SEM crystals picture.
γ-CD

61
α-CDMOF-a
γ-CDMOF-b
α-CDMOF-b
Figure 19. SEM images of different CDMOFs.
β-CDMOF-b
α-CDMOF-a α-CDMOF-b
α-CDMOF-a
γ-CDMOF-b
β-CDMOF-b
α-CDMOF-b
β-CDMOF-a
β-CDMOF-b
α-CDMOF-a
α-CDMOF-b
β-CDMOF-a
α-CDMOF-a
γ-CDMOF-b γ-CDMOF-a

62
3.3.6 Encapsulation and Release
There were some attempts to encapsulate more than one organic compound inside the cavity
of CD as a medium capable of hosting antimicrobial agents. β-cyclodextrin (β-CD) was loaded
successfully with at least three selected organic compounds as antimicrobial materials ready to
be released [100]. Acetaldehyde, trans-2-hexenal and hexenal were examined on several living
microorganisms while they were being encapsulated in β-CD. Those antimicrobial compounds
showed great influence at different encapsulation concentrations.
During the encapsulation of γ-CDMOF-a, which has the highest SSA, an unexpected side
reaction occurred. The reaction took place right after the injection of 1 mL of acetaldehyde,
trans-2-hexanal, hexanal, and ethanol. The white crystals changed to yellow and then brown to
red in a matter of minutes. An identification of the reactive site was necessary. Table 8 shows the
reaction of KOH with various organic compounds. Figure 20 shows crystals placed in the
aluminum pan. Encapsulated γ-CDMOF-a as shown below a) before injecting acetaldehyde and
b) after injection. The main reaction producing the change in color of the crystal was Aldol
condensation. Aldol condensation occurred between the carbonyl group and hydroxyl group
when the acetaldehyde was added to the jar. The reaction continues when the aldehyde enolate
reacts with another aldehyde molecule. The reaction pathway is presented in Figure 21 as
described by Anderson and Peters [138]. In this reaction water could be consumed or generated
as a reversible first pathway. It should be mentioned that there were some gases being produced
as a by-product of this reaction. Aldol condensation kinetics can be studied through the change
of acidity (pH) level.

63
Table 8. Reaction strength of KOH with selected organic compounds.
Substance Acetaldehyde Trans-2-hexanal Ethanol Hexanal
Reaction Strength Very Srong Strong Medium Slow *
*Very slow reaction needs to be accelerated.
Figure 20. Aldol side reaction with γ-CDMOF-a when acetaldehyde was added to the jar.

64
Figure 21. Reaction pathway of acetaldehyde and hydroxide group.
In the case of γ-CDMOF-a, it was not possible to add acetaldehyde without the
occurrences of the Aldol condensation reaction. In the case of γ-CDMOF-b, no Aldol
condensation reaction occurred. So, successful encapsulation without any side reaction was
achieved. The main reason for successful encapsulation on γ-CDMOF-b is because of the
presence of the benzene ring on the C7H5KO2 as the functional group instead of the hydroxide
group. Figure 22 shows the release of acetaldehyde from the encapsulated γ-CDMOF-b and an
empty with γ-CDMOF-b crystals jar used as control. The release of acetaldehyde from 1 g of γ-
CDMOF-b increased during the first 6 h of release. The variations of the measurement were the
greatest at 4 to 6 h of release. This was due to the crystals inability to release the same amount.
At 24 h of release, the concentration of acetaldehyde on the headspace decreased to almost 30 μg
acetaldehyde per 1 g of CDMOF. Further work is needed to understand if re-sorption of
acetaldehyde into γ-CDMOF-b crystals or degradation of the acetaldehyde in the headspace was

65
responsible for this reduction. The overall trend in this release is similar to the β-CD release of
acetaldehyde reported by Almenar et al., 2007 [115]. However, the maximum release in this
study was 53 μg acetaldehyde/ 1 g of CDMOF, which is greater than the release reported in the
β-CD inclusion complexes [115, 139]. Thus, γ-CDMOF-b was suitable for hosting a larger
amount of acetaldehyde than the β-CD alone [115]. The N2 sorption isotherm and the surface
area is reported in Figure 24 and Table 10 in the appendix. Also, the concentration and the
system maximum capacity is reported in Table 11. The calibration curve is reported in Figure 26
in the appendix.

66
Figure 22. Acetaldehyde released from γ-CDMOF-b.

67
3.3.7 Color Measurements
Encapsulated γ-CDMOF-a and γ-CDMOF-b and activated γ-CDMOF-a and γ-CDMOF-b
were examined using the colorimeter to verify the Aldol condensation that occurred with γ-
CDMOF-a and acetaldehyde. Table 9 shows the color parameter of γ-CDMOF exposed to
acetaldehyde. The distinguishing change was in the encapsulated γ-CDMOF-a where the value of
b* yellowness was very high compare to the negative values of the encapsulated γ-CDMOF-b
toward the blue region. In general, the brightness of the crystal was decreased in the
encapsulated samples. The yellowness in the reacted or encapsulated γ-CDMOF-a could be due
to the carbon dioxide capture and sensitivity as reported to CDMOF-2 [140]. γ-CDMOF-b did
not change color throughout the inclusion time and release. Thus, γ-CDMOF-b may be suitable
to build inclusion complexes for various organic compounds. The reaction kinetics can be
studied during a design period of time and temperature with a colorimeter or a pH meter for
various solvents such as acetaldehyde, hexanal, trans-2hexanal, and ethanol. This would
determine the reaction acceleration and strength in the presence of CD in the γ-CDMOF-b
structure.

68
Table 9. Color measurements of reacted and unreacted γ-CDMOF exposed to acetaldehyde.
CDMOF L* a* b* ΔE
γ-CDMOF-a 80.77±2.12a -0.05±0.13b -0.23±0.15c 80.77±2.12a
γ-CDMOF-b 72.40±2.61b -0.50±0.10b -0.30±0.35c 72.41±2.60b
γ-CDMOF-a
Encapsulated
46.88±0.59c 15.94±0.45a 39.44±0.61a 63.30±0.40c
γ-CDMOF-b
Encapsulated
48.21±0.83c -1.42±0.02c 0.87±0.17b 48.24±0.82d
Values in the same column with the same superscript letters are not significantly different at α =
0.05.
3.3.8 TGA of encapsulated CDMOF
The goal of performing the thermal analysis was to confirm the presence of the encapsulated
acetaldehyde inside the pore volume of γ-CDMOF-b. Figure 23 shows the as-synthesized,
activated and encapsulated sample TGAs. At low temperature there was a slight different
between encapsulated and activated γ-CDMOF-b. This should be due to the presence of
acetaldehyde in the γ-CDMOF-b pore volume. As-synthesized sample showed a great difference
compared to the activated samples indicating the of water molecules presence in the γ-CDMOF-
b voids. The decomposition temperature matched previous studies for the activated and as-
synthesized γ-CDMOF-b [17, 132]. An earlier thermal degradation and weight loss for the
encapsulated γ-CDMOF-b was observed. This was probably due to the fact that the acetaldehyde
structure was attached to γ-CDMOF-b. Figure 23 provides additional information about the
capability of γ-CDMOF-b to fully encapsulate and release acetaldehyde.

69
Figure 23. Thermal analysis of as-synthesized, activated, and encapsulated γ-CDMOF-b.

70
Chapter 4. Conclusions and recommendation for future work

71
4.1 Conclusion
The aim of this study was to produce different cyclodextrin metal organic framework
(CDMOF) structures using α, β, and γ CDs and two K+ ion sources. All combinations of α, β,
and γ-CDMOF with KOH (CDMOF-a) and C7H5KO2 (CDMOF-b) were successfully produced
using a vapor diffusion technique utilizing methanol as the activation solvent. The BET surface
areas were 1229 m2.g-1 for the γ-CDMOF-a, 417 m2.g-1 for the γ-CDMOF-b, 74 m2.g-1 for the α-
CDMOF-a, 40 m2.g-1 for the α-CDMOF-b, 32 m2.g-1 for the β-CDMOF-a, and 19 m2.g-1 for the
β-CDMOF-b. The N2 sorption isotherm assessments and the pore volume calculations showed
that α-CDMOF-a and α-CDMOF-b had micro, meso, and macropore material behaviors. α-
CDMOF-b adsorption-desorption isotherm showed a similar sorption isotherm to zeolite. The N2
uptake at a high relative pressure 0.99 was 125 cm3.g-1 for α-CDMOF-b, whereas the γ-CDMOF-
b at a high relative pressure was below 150 cm3.g-1. γ-CDMOF-b and α-CDMOF-b were capable
of adsorbing almost the same amount of a simple nitrogen molecule in the gas phase. However,
γ-CDMOF-b and α-CDMOF-b had different adsorption isotherms, type I (Langmuir) and type II
(BET), respectively. Thermal gravimetric analyses showed that CDMOF weight lost around 10%
of H2O at low temperatures. The degradation temperature of CDMOFs varied from 250 to above
300 °C. XRD results revealed a FCC crystal structure for all synthesized CDMOFs, but these
crystals were different in symmetry. The intensity of γ-CDMOFs and α-CDMOFs diffracted
plane was higher than β-CDMOFs, which indicated a high symmetrical structure for both γ-
CDMOFs and α-CDMOF and decreasing symmetrical pattern of the β-CDMOFs structure. SEM
images brought to light different crystal structures; cubic and laminae symmetry of the different
CDMOFs. In addition, γ-CD image was captured to compare it to the residues appeared on some
of the CDMOFs images.

72
Regarding the encapsulation of organic compounds into the nano-porous of CDMOF, the
most suitable structure was γ-CDMOF-a, which showed the largest surface area of 1257 m2.g-1
among all other CDMOFs. The process of encapsulation was carried out using inclusion
complex. However, the γ-CDMOF-a showed a side Aldol condensation reaction between
hydroxyl and carboxyl groups, and further the aldehyde enolate reacted with another aldehyde
molecules. Similar Aldol condensation reactions were observed with trans-2-hexanal, hexanal,
and ethanol. The reactions varied in speed and strength depending on the chemical compounds.
The reaction was followed by using a colorimeter, which revealed strong yellowness compared
to another encapsulated γ-CDMOF-b. As an alternative, γ-CDMOF-b synthesized with C7H5KO2
was used to encapsulate acetaldehyde. γ-CDMOF-b had a BET surface area of 327 m2.g-1.
Acetaldehyde was successfully encapsulated into the γ-CDMOF-b pores at a maximum amount
of 53 ug of acetaldehyde per one gram of γ-CDMOF-b, which is greater than the release reported
in the β-CD inclusion complexes. The headspace analysis was carried out using gas
chromatography (GC). The release system was verified using a control sample. To insure the
acetaldehyde presence in the γ-CDMOF-b thermal analysis of the activated, as-synthesized, and
encapsulated γ-CDMOF-b was carried out. A slight decrease of the thermal degradation was
observed in the encapsulated sample because of the presence of acetaldehyde. The thermal
decomposition around 290 oC, was different only for the encapsulated γ-CDMOF-b which can be
attributed to the residue sorbed acetaldehyde remaining within the structure.

73
4.2 Recommendation for Future Studies
In order to obtain high surface area and micro-pore size, δ-CD is the best candidate with
coordination of KOH. This is due to the large molecules cavity of δ-CD, since it has 9 glucose
units.
X-ray diffraction of single CDMOF crystals will help to understand these novel structures.
Research on the effect of other coordination ions such as Na+, Rb+, and Cs+ on the surface area,
selectivity and sensitivity of the CDMOF should be performed. The reason is that other ion
coordination seems to have a different sensitivity and selectivity [102]. Also, different
coordination ions produce different surface areas as shown earlier in this study. On the other
hand, a different crystallization technique like microwave-solvothermal can reduce the crystal
production time.
Additional work should be conducted to produce mixed matrix membranes using either γ-
CDMOFs α-CDMOFs. γ-CDMOFs showed the highest surface area, which might facilitate
sorption, permeability and selectivity to create novel functional membranes. Active polymeric
packaging materials can be produced using encapsulated γ-CDMOFs because of their surface
area and selectivity. Polymer nanocomposites can be produced also using α-CDMOFs which
have a unique topography. If the purpose is advanced polymer properties α-CDMOFs can be
used. The advantage of α-CDMOFs is the macro-and-meso pore size that can fully open to large
polymer molecules. α-CDMOFs laminae can be aligned along the polymer film, which might
produce new thermal and mechanical properties. Unlike organo-modified montmorillonite (O-
MMT), CDMOFs do not contain Al or Si which could provide a benefit to create future
nanocomposites [141].

74
The encapsulation of chemical compounds, research evaluating the release of acetaldehyde
from γ-CDMOF-b at different temperatures such as 25, 35, and 45 oC should be conducted.
Different concentrations in the encapsulation part of other organic antimicrobial compounds such
as acetaldehyde, hexanal, trans-2-hexanal, and ethanol worth to study. Also, further
understanding of the Aldol condensation reaction between γ-CDMOF-a and acetaldehyde,
hexanal, trans-2-hexanal, and ethanol may help to elucidate the encapsulation mechanism.
The FTIR transmittance technique could be used to assess the presence of all the organic
compounds within the structure. Surface area analysis might disclose the remaining volume of
encapsulated γ-CDMOF-b at the right condition compared to the activated sample. Surface area
analysis condition can be performed without degassing to estimate the remaining pore volume.
Encapsulated CDMOF should be used in nanocomposite in different polymeric packaging
materials. Previous research showing inhibition by β-CD inclusion complex with different
antimicrobial compounds such as hexanal and acetaldehyde of various microorganisms is
encouraging to produce encapsulated γ-CDMOF-b, which can release much larger quantities of
these compounds, so that antimicrobial packaging membranes can be produced.

75
APPENDIX

76
APPENDIX
Figure 24. Adsorption-desorption isotherm for γ-CDMOF-a and γ-CDMOF-b.

77
Table 10. Presents the surface area and pore volume.
CDMOF with different K+
SOURCE BET SA
(m2/g) Langmuir SA (m2/g)
Total Pore volume
(cm3/g)
Average Pore Radius (nm)
KOH 1257 a 1416 a 0.51 0.02 a 0.81 a
C7H5KO2 327 b 499 b 0.18 0.02 b 0.11 b

78
Table 11. Release value in concentration and maximum system capacity.
Release time (hours) Concentration ppm Acetaldehyde /g CDMOF
1 0.0096 ± 0.0036 c
2 0.0133 ± 0.0049 c
3 0.0210 ± 0.0094 c,b
4 0.0954 ± 0.0430 a,b
5 0.1053 ± 0.0559 a
6 0.0950 ± 0.0229 a,b
24 0.0596 ± 0.0132 a,b,c
Max system capacity
1 ml acetaldehyde
1 mL = 0.7880 mg /1.96 L= 0.4020 ppm
Values in the same column with different superscript letters are significantly different at alpha =
0.05.

79
Figure 25. γ-CD pure starch SEM picture.
Calculation of the atomic percentage in CD;
and the composition percentage is calculated as below

80
Figure 26. Calibration curve of the acetaldehyde.

81
REFERENCES

82
REFERENCES
1. Kitagawa, S., Metal–Organic Frameworks (MOFs). Chemical Society Reviews, 2014. 43(16): p. 5415-5418.
2. Seo, J.S., et al., A Homochiral Metal–Organic Porous Material for Enantioselective
Separation and Catalysis. Nature, 2000. 404(6781): p. 982-986. 3. Finsy, V., et al., Separation of CO2/CH4 Mixtures with the MIL-53(Al) Metal–Organic
Framework. Microporous and Mesoporous Materials, 2009. 120(3): p. 221-227.
4. Horcajada, P., et al., Metal–Organic Frameworks in Biomedicine. Chemical reviews, 2011. 112(2): p. 1232-1268.
5. Meek, S.T., J.A. Greathouse, and M.D. Allendorf, Metal‐Organic Frameworks: A
Rapidly Growing Class of Versatile Nanoporous Materials. Advanced Materials, 2011. 23(2): p. 249-267.
6. Del Valle, E.M., Cyclodextrins and Their Uses: A Review. Process Biochemistry, 2004. 39(9): p. 1033-1046.
7. Kim, T.J., Y.D. Lee, and H.S. Kim, Enzymatic Production of Cyclodextrins from Milled
Corn Starch in an Ultrafiltration Membrane Bioreactor. Biotechnology and
Bioengineering, 1993. 41(1): p. 88-94.
8. Schmid, G., Cyclodextrin Glycosyltransferase Production: Yield Enhancement by Overexpression of Cloned Genes. Trends in Biotechnology, 1989. 7(9): p. 244-248.
9. Schmid, G., Notice of a GRAS exemption for beta-cyclodextrin. 2001.
10. Marcolino, V.A., et al., Interaction of Curcumin and Bixin with β-Cyclodextrin: Complexation Methods, Stability, and Applications in Food. Journal of agricultural and food chemistry, 2011. 59(7): p. 3348-3357.
11. de Oliveira, V.E., et al., Carotenoids and β-Cyclodextrin Inclusion Complexes: Raman
Spectroscopy and Theoretical Investigation. The Journal of Physical Chemistry A, 2011.
115(30): p. 8511-8519.
12. Menuel, S., et al., Synthesis and Inclusion Ability of a Bis-β-Cyclodextrin Pseudo-Cryptand towards Busulfan Anticancer Agent. Tetrahedron, 2007. 63(7): p. 1706-1714.
13. Barreto, L. and M. Cunha Filho, Ciclodextrina: Importante Excipiente Farmacêutico Funcional. Latin American Journal of Pharmacy, 2008. 27.

83
14. Artiss, J.D., et al., The Effects of a New Soluble Dietary Fiber on Weight Gain and Selected Blood Parameters in Rats. Metabolism, 2006. 55(2): p. 195-202.
15. Stoddart, J.F., et al., Nanoporous Carbohydrate Frameworks and the Sequestration and
Detection of Molecules Using the Same. 2011. 16. Forgan, R.S., et al., Nanoporous Carbohydrate Metal–Organic Frameworks. Journal of
the American Chemical Society, 2011. 134(1): p. 406-417.
17. Smaldone, R.A., et al., Metal–Organic Frameworks from Edible Natural Products. Angewandte Chemie International Edition, 2010. 49(46): p. 8630-8634.
18. Smithenry, D.W., S.R. Wilson, and K.S. Suslick, A robust Microporous Zinc Porphyrin Framework Solid. Inorganic chemistry, 2003. 42(24): p. 7719-7721.
19. Elangovan, D., et al., Poly (L‐Lactic Acid) Metal Organic Framework Composites:
Optical, Thermal and Mechanical Properties. Polymer International, 2012. 61(1): p. 30-37.
20. Payne, D., K. Sing, and D. Turk, Comparison of Argon and Nitrogen Adsorption
Isotherms on Porous and Nonporous Hydroxylated Silica. Journal of Colloid and
Interface Science, 1973. 43(2): p. 287-293.
21. Lowell, S., Characterization of Porous Solids and Powders: Surface Area, Pore Size and Density. 2004.
22. Sing, K.S.W., Everett, D.H., Haul, R.A.W., Moscou, L., Pierotti, R.A., Rouquerol, J., Siemieniewska, T., Pure Appl. Chem., 1985. 57: p. 603.
23. Keskin, S. and S. Kızılel, Biomedical Applications of Metal Organic Frameworks.
Industrial & Engineering Chemistry Research, 2011. 50(4): p. 1799-1812.
24. Kinoshita, Y., et al., The Crystal Structure of Bis (Adiponitrilo) Copper (I) Nitrate.
Bulletin of the Chemical Society of Japan, 1959. 32(11): p. 1221-1226. 25. Li, H., et al., Establishing Microporosity in Open Metal-Organic Frameworks: Gas
Sorption Isotherms for Zn (BDC)(BDC= 1, 4-Benzenedicarboxylate)s. Journal of the American Chemical Society, 1998. 120(33): p. 8571-8572.
26. Li, H., et al., Design and Synthesis of an Exceptionally Stable and Highly Porous Metal-
Organic Framework. Nature, 1999. 402(6759): p. 276-279.
27. Eddaoudi, M., et al., Systematic Design of Pore Size and Functionality in Isoreticular
MOFs and Their Application in Methane Storage. Science, 2002. 295(5554): p. 469-472.
84
28. Chae, H.K., et al., A Route to High Surface Area, Porosity and Inclusion of Large Molecules in Crystals. Nature, 2004. 427(6974): p. 523-527.
29. Férey, G., et al., A Hybrid Solid with Giant Pores Prepared by a Combination of
Targeted Chemistry, Simulation, and Powder Diffraction. Angewandte Chemie, 2004. 116(46): p. 6456-6461.
30. Férey, G., et al., A Chromium Terephthalate-Based Solid with Unusually Large Pore Volumes and Surface Area. Science, 2005. 309(5743): p. 2040-2042.
31. Furukawa, H., et al., Ultrahigh Porosity in Metal-Organic Frameworks. Science, 2010.
329(5990): p. 424-428.
32. Farha, O.K., et al., Metal–Organic Framework Materials with Ultrahigh Surface Areas:
Is the Sky the Limit? Journal of the American Chemical Society, 2012. 134(36): p. 15016-15021.
33. Furukawa, H., M.A. Miller, and O.M. Yaghi, Independent Verification of the Saturation Hydrogen Uptake in MOF-177 and Establishment of a Benchmark for Hydrogen
Adsorption in Metal–Organic Frameworks. Journal of Materials Chemistry, 2007. 17(30): p. 3197-3204.
34. Koh, K., A.G. Wong-Foy, and A.J. Matzger, A Porous Coordination Copolymer with over 5000 m2/g BET Surface Area. Journal of the American chemical society, 2009.
131(12): p. 4184-4185. 35. Zhao, D., et al., Stabilization of Metal− Organic Frameworks with High Surface Areas
by the Incorporation of Mesocavities with Microwindows. Journal of the American Chemical Society, 2009. 131(26): p. 9186-9188.
36. Klein, N., et al., Route to a Family of Robust, Non‐interpenetrated Metal–Organic
Frameworks with pto‐like Topology. Chemistry-A European Journal, 2011. 17(46): p. 13007-13016.
37. James, S.L., Metal-Organic Frameworks. Chemical Society Reviews, 2003. 32(5): p.
276-288. 38. Millward, A.R. and O.M. Yaghi, Metal-organic frameworks with exceptionally high
capacity for storage of carbon dioxide at room temperature. Journal of the American Chemical Society, 2005. 127(51): p. 17998-17999.
39. Britt, D., et al., Highly Efficient Separation of Carbon Dioxide by a Metal-Organic
Framework Replete with Open Metal Sites. Proceedings of the National Academy of
Sciences, 2009. 106(49): p. 20637-20640.

85
40. Rowsell, J.L. and O.M. Yaghi, Effects of Functionalization, Catenation, and Variation of the Metal Oxide and Organic Linking Units on the Low-Pressure Hydrogen Adsorption
Properties of Metal-Organic Frameworks. Journal of the American Chemical Society, 2006. 128(4): p. 1304-1315.
41. Eddaoudi, M., H. Li, and O. Yaghi, Highly Porous and Stable Metal-Organic
Frameworks: Structure Design and Sorption Properties. Journal of the American
Chemical Society, 2000. 122(7): p. 1391-1397.
42. Ye, Q., et al., Ferroelectric Metal-Organic Framework with a High Dielectric Constant. Journal of the American Chemical Society, 2006. 128(20): p. 6554-6555.
43. Allendorf, M., et al., Luminescent Metal–Organic Frameworks. Chemical Society Reviews, 2009. 38(5): p. 1330-1352.
44. Chen, B., et al., High H2 Adsorption in a Microporous Metal–Organic Framework with
Open Metal Sites. Angewandte Chemie, 2005. 117(30): p. 4823-4827.
45. Kong, X., et al., Mapping of Functional Groups in Metal-Organic Frameworks. Science,
2013. 341(6148): p. 882-885. 46. Tranchemontagne, D.J., et al., Secondary Building Units, Nets and Bonding in the
Chemistry of Metal–Organic Frameworks. Chemical Society Reviews, 2009. 38(5): p. 1257-1283.
47. Darensbourg, D.J., J.R. Wildeson, and J.C. Yarbrough, Solid-State Structures of Zinc (II)
Benzoate Complexes. Catalyst Precursors for the Coupling of Carbon Dioxide and
Epoxides. Inorganic chemistry, 2002. 41(4): p. 973-980.
48. Beattie, J.K., et al., The Chemistry of Cobalt Acetate—III. The Isolation and Crystal Structure Characterisation of the Mixed Valence Octacobalt Oligomer, [Co8(O)4(Ch3co2)6(Ome)4]Cl4(Ohn)4 · 6h2o (N = 1 Or 2), Derived From the Preparation
of Cobalt(III) Acetate. Polyhedron, 1997. 16(12): p. 2109-2112.
49. Abu-Nawwas, A.-A.H., et al., An Fe(III) Wheel with a Zwitterionic Ligand: The Structure and Magnetic Properties of [Fe(OMe)2(Proline)]12[ClO4]12. Chemical communications, 2004(3): p. 314-315.
50. Freiberg, S. and X. Zhu, Polymer Microspheres for Controlled Drug Release.
International Journal of Pharmaceutics, 2004. 282(1): p. 1-18. 51. Yaghi, O.M., et al., Isoreticular Metal-Organic Frameworks, Process for Forming the
Same, and Systematic Design of Pore Size and Functionality Therein, with Application for Gas Storage. 2005, US6930193 B2.
86
52. Lin, W., Z. Wang, and L. Ma, A Novel Octupolar Metal-Organic NLO Material Based on a Chiral 2D Coordination Network. Journal of the American Chemical Society, 1999.
121(48): p. 11249-11250.
53. Chui, S.S.-Y., et al., A Chemically Functionalizable Nanoporous Material [Cu3 (TMA) 2 (H2O) 3] n. Science, 1999. 283(5405): p. 1148-1150.
54. Dybtsev, D.N., et al., A Homochiral Metal–Organic Material with Permanent Porosity, Enantioselective Sorption Properties, and Catalytic Activity. Angewandte Chemie
International Edition, 2006. 45(6): p. 916-920. 55. Ni, Z. and R.I. Masel, Rapid Production of Metal-Organic Frameworks via Microwave-
Assisted Solvothermal Synthesis. Journal of the American Chemical Society, 2006. 128(38): p. 12394-12395.
56. McDonald, T.M., et al., Capture of Carbon Dioxide from Air and Flue Gas in the
Alkylamine-Appended Metal–Organic Framework Mmen-Mg2 (Dobpdc). Journal of the
American Chemical Society, 2012. 134(16): p. 7056-7065.
57. Czaja, A.U., N. Trukhan, and U. Müller, Industrial Applications of Metal–Organic Frameworks. Chemical Society Reviews, 2009. 38(5): p. 1284-1293.
58. Sumida, K., et al., Carbon Dioxide Capture in Metal–Organic Frameworks. Chemical Reviews, 2011. 112(2): p. 724-781.
59. Harbuzaru, B.V., et al., Metal–Organic Nanoporous Structures with Anisotropic
Photoluminescence and Magnetic Properties and Their Use as Sensors. Angewandte
Chemie International Edition, 2008. 47(6): p. 1080-1083.
60. Gomez-Lor, B., et al., In2(OH)3(BDC)1.5 (BDC = 1,4-Benzendicarboxylate): An In(III) Supramolecular 3D Framework with Catalytic Activity. Inorganic chemistry, 2002. 41(9): p. 2429-2432.
61. Schlichte, K., T. Kratzke, and S. Kaskel, Improved Synthesis,Thermal Stability and
Catalytic Properties of the Metal-Organic Framework Compound Cu3(BTC)2. Microporous and Mesoporous Materials, 2004. 73(1): p. 81-88.
62. Sabater, M.J., et al., Chiral Salen Manganese Complex Encapsulated within Zeolite Y: A Heterogeneous Enantioselective Catalyst for the Epoxidation of Alkenes. Chemical
Communications, 1997(14): p. 1285-1286. 63. Corma, A., H. Garcia, and F. Llabrés i Xamena, Engineering Metal Organic Frameworks
for Heterogeneous Catalysis. Chemical Reviews, 2010. 110(8): p. 4606-4655.

87
64. Hasegawa, S., et al., Three-Dimensional Porous Coordination Polymer Functionalized with Amide Groups Based on Tridentate Ligand: Selective Sorption and Catalysis.
Journal of the American Chemical Society, 2007. 129(9): p. 2607-2614.
65. Gascon, J., et al., Amino-Based Metal-Organic Frameworks as Stable, Highly Active Basic Catalysts. Journal of Catalysis, 2009. 261(1): p. 75-87.
66. Hwang, Y.K., et al., Amine Grafting on Coordinatively Unsaturated Metal Centers of MOFs: Consequences for Catalysis and Metal Encapsulation. Angewandte Chemie
International Edition, 2008. 47(22): p. 4144-4148. 67. Alkordi, M.H., et al., Zeolite-like Metal−Organic Frameworks as Platforms for
Applications: On Metalloporphyrin-Based Catalysts. Journal of the American Chemical Society, 2008. 130(38): p. 12639-12641.
68. Horcajada, P., et al., Porous Metal-Organic-Framework Nanoscale Carriers as a Potential Platform for Drug Delivery and Imaging. Nature materials, 2010. 9(2): p. 172-178.
69. Horcajada, P., et al., Flexible Porous Metal-Organic Frameworks for a Controlled Drug
Delivery. Journal of the American Chemical Society, 2008. 130(21): p. 6774-6780. 70. Szejtli, J., Introduction and general overview of cyclodextrin chemistry. Chemical
Reviews, 1998. 98(5): p. 1743-1754.
71. Szejtli, J., Cyclodextrin Technology. 1988. 72. Dodziuk, H., Cyclodextrins and their complexes: chemistry, analytical methods,
applications. 2006: John Wiley & Sons.
73. Saenger, W., Cyclodextrin Inclusion Compounds in Research and Industry. Angewandte
Chemie International Edition in English, 1980. 19(5): p. 344-362. 74. Szejtli, J., Utilization of Cyclodextrins in Industrial Products and Processes. Journal of
Materials Chemistry, 1997. 7(4): p. 575-587.
75. Easton, C.J. and S.F. Lincoln, Modified Cyclodextrins. 1999: World Scientific Publishing Company.
76. Russell, N.R., New Trends in Cyclodextrins and Derivatives. Journal of Inclusion Phenomena and Macrocyclic Chemistry, 1993. 15(4): p. 399-400.
77. Bender, M.L. and M. Komiyama, Cyclodextrin Chemistry. 1978.
78. Szejtli, J., Cyclodextrin Technology. Vol. 1. 1988: Springer.
79. Giordano, F., C. Novak, and J.R. Moyano, Thermal Analysis of Cyclodextrins and Their Inclusion Compounds. Thermochimica Acta, 2001. 380(2): p. 123-151.

88
80. Loftsson, T. and M.E. Brewster, Pharmaceutical Applications of Cyclodextrins. 1. Drug Solubilization and Stabilization. Journal of Pharmaceutical Sciences, 1996. 85(10): p.
1017-1025.
81. Davis, F. and S. Higson, Macrocycles: Construction, Chemistry and Nanotechnology Applications. 2011: John Wiley & Sons.
82. Stella, V.J. and R.A. Rajewski, Cyclodextrins: Their Future in Drug Formulation and Delivery. Pharmaceutical research, 1997. 14(5): p. 556-567.
83. Sauceau, M., E. Rodier, and J. Fages, Preparation of Inclusion Complex of Piroxicam
with Cyclodextrin by Using Supercritical Carbon Dioxide. The Journal of Supercritical
Fluids, 2008. 47(2): p. 326-332.
84. Connors, K.A., The Stability of Cyclodextrin Complexes in Solution. Chemical Reviews, 1997. 97(5): p. 1325-1358.
85. VanEtten, R.L., et al., Acceleration of Phenyl Ester Cleavage by Cycloamyloses. A Model for Enzymic Specificity. Journal of the American Chemical Society, 1967. 89(13): p.
3242-3253. 86. Saenger, W., et al., Structures of the Common Cyclodextrins and Their Larger Analogues
beyond the Doughnut. Chemical reviews, 1998. 98(5): p. 1787-1802.
87. Manor, P.C. and W. Saenger, Topography of Cyclodextrin Inclusion Complexes. III. Crystal and Molecular Structure of Cyclohexaamylose Hexahydrate, the Water Dimer Inclusion Complex. Journal of the American Chemical Society, 1974. 96(11): p. 3630-
3639.
88. Tanaka, Y., et al., Asymmetric halogenation and hydrohalogenation of ethyltrans-cinnamate in crystalline cyclodextrin complexes. Journal of Inclusion Phenomena, 1984. 2(3-4): p. 841-850.
89. Pitchumani, K., et al., Modification of Chemical Reactivity upon Cyclodextrin
Encapsulation:: Asymmetric Bromination of Chalcone and Benzylideneacetone. Tetrahedron, 1994. 50(26): p. 7903-7912.
90. Takahashi, K., Organic Reactions Mediated by Cyclodextrins. Chemical Reviews, 1998. 98(5): p. 2013-2034.
91. Li, J. and X.J. Loh, Cyclodextrin-Based Supramolecular Architectures: Syntheses,
Structures, and Applications for Drug and Gene Delivery. Advanced drug delivery
reviews, 2008. 60(9): p. 1000-1017.

89
92. van de Manakker, F., et al., Cyclodextrin-Based Polymeric Materials: Synthesis, Properties, and Pharmaceutical/Biomedical Applications. Biomacromolecules, 2009.
10(12): p. 3157-3175.
93. Mabuchi, N. and M. Ngoa, Controlled Release Powdered Flavour Preparations and Confectioneries Containing Preparations. Japanese Patent JP, 2001. 128: p. 638.
94. Astray, G., et al., A Review on the Use of Cyclodextrins in Foods. Food Hydrocolloids, 2009. 23(7): p. 1631-1640.
95. Breslow, R. and P. Campbell, Selective Aromatic Substitution by Hydrophobic Binding of
a Substrate to a Simple Cyclodextrin Catalyst. Bioorganic Chemistry, 1971. 1(1): p. 140-
156.
96. Baudin, C., et al., Inclusion of Organic Pollutants in Cyclodextrins and Derivatives. International Journal of Environmental Analytical Chemistry, 2000. 77(3): p. 233-242.
97. Bhandari, B.R., B.R. D'Arc, and I. Padukka, Encapsulation of Lemon Oil by Paste Method Using β-Cyclodextrin: Encapsulation Efficiency and Profile of Oil Volatiles.
Journal of Agricultural and Food Chemistry, 1999. 47(12): p. 5194-5197. 98. Marques, H.M.C., A Review on Cyclodextrin Encapsulation of Essential Oils and
Volatiles. Flavour and fragrance journal, 2010. 25(5): p. 313-326.
99. Almenar, E., et al., Beta-Cyclodextrins as Nucleating Agents for Poly (Lactic Acid). 2008, US20090060860 A1.
100. Almenar, E., et al., A New Technique to Prevent the Main Post Harvest Diseases in Berries during Storage: Inclusion Complexes β-Cyclodextrin-Hexanal. International
journal of food microbiology, 2007. 118(2): p. 164-172. 101. Yoon, S.M., S.C. Warren, and B.A. Grzybowski, Storage of Electrical Information in
Metal–Organic‐Framework Memristors. Angewandte Chemie International Edition,
2014. 53(17): p. 4437-4441. 102. Gassensmith, J.J., et al., A Metal-Organic Framework-Based Material for
Electrochemical Sensing of Carbon Dioxide. Journal of the American Chemical Society, 2014.
103. Smith, M.K., S.R. Angle, and B.H. Northrop, Preparation and Analysis of Cyclodextrin-
Based Metal–Organic Frameworks: Laboratory Experiments Adaptable for High School
through Advanced Undergraduate Students. Journal of Chemical Education, 2014. 104. Bühler, W., et al., Ionic Reactions and Pyrolysis of Glycerol as Competing Reaction
Pathways in near-and Supercritical Water. The Journal of supercritical fluids, 2002. 22(1): p. 37-53.

90
105. AVISSAR, I., S. Droby, and E. PESIS, Characterisation of Acetaldehyde Effects on
Rhizopus Stolonifer and Botrytis Cinerea. Annals of applied biology, 1990. 116(2): p. 213-220.
106. Seuvre, A.-M., et al., Retention of Aroma Compounds in Food Matrices of Similar
Rheological Behaviour and Different Compositions. Food Chemistry, 2006. 96(1): p.
104-114.
107. Hatanaka, A. and T. Harada, Formation of Cis-3-Hexenal, Trans-2-Hexenal and Cis-3-Hexenol in Macerated Thea Sinensis Leaves. Phytochemistry, 1973. 12(10): p. 2341-2346.
108. Joo, M.J., et al., Development and Characterization of Antimicrobial Poly (L-Lactic
Acid) Containing Trans-2-Hexenal Trapped in Cyclodextrins. International Journal of Food Microbiology, 2012. 153(3): p. 297-305.
109. Auras, A.a., New Alternatives to Avoid Fungal Growth in Food Products. 2006.
110. Kampf, G., et al., Spectrum of Antimicrobial Activity and User Acceptability of the Hand Disinfectant Agent Sterillium® Gel. Journal of Hospital Infection, 2002. 52(2): p. 141-147.
111. Rooney, M.L., Overview of Active Food Packaging. Active food packaging, 1995: p. 1-
37. 112. Fritsch, C. and J. Gale, Hexanal as a Measure of Rancidity in Low Fat Foods. Journal of
the American Oil Chemists Society, 1977. 54(6): p. 225-228.
113. SHAHIDI, F. and R.B. PEGG, Hexanal as an Indicator of Meat Flavor Deterioration. Journal of Food Lipids, 1994. 1(3): p. 177-186.
114. Shahidi, F., et al., The Hexanal Content as an Indicator of Oxidative Stability and Flavour Acceptability in Cooked Ground Pork. Canadian Institute of Food Science and
Technology Journal, 1987. 20(2): p. 104-106. 115. Almenar, E., et al., Micro-Encapsulation of Volatile Compounds into Cyclodextrins: A
New Technology to Reduce Post Harvest Losses. 2007, US20070207981 A1.
116. Lanciotti, R., et al., Effect of Hexanal on the Shelf Life of Fresh Apple Slices. Journal of Agricultural and Food Chemistry, 1999. 47(11): p. 4769-4776.
117. Druaux, C. and A. Voilley, Effect of Food Composition and Microstructure on Volatile Flavour Release. Trends in Food Science & Technology, 1997. 8(11): p. 364-368.

91
118. Cramer, F. and W. Kampe, Inclusion Compounds. XVII. 1 Catalysis of Decarboxylation by Cyclodextrins. A Model Reaction for the Mechanism of Enzymes. Journal of the
American Chemical Society, 1965. 87(5): p. 1115-1120.
119. Shan-Yang, L. and K. Yuh-Horng, Solid Particulates of Drug-β-Cyclodextrin Inclusion Complexes Directly Prepared by a Spray-Drying Technique. International journal of pharmaceutics, 1989. 56(3): p. 249-259.
120. Veiga, F., et al., Inclusion complexation of tolbutamide with β-cyclodextrin and
hydroxypropyl-β-cyclodextrin. International journal of pharmaceutics, 1996. 129(1): p. 63-71.
121. Hu, Q.-D., G.-P. Tang, and P.K. Chu, Cyclodextrin-Based Host–Guest Supramolecular Nanoparticles for Delivery: From Design to Applications. Accounts of Chemical
Research, 2014. 122. Singh, M., R. Sharma, and U. Banerjee, Biotechnological Applications of Cyclodextrins.
Biotechnology Advances, 2002. 20(5): p. 341-359.
123. Szejtli, J., The Cyclodextrins and Their Applications in Biotechnology. Carbohydrate Polymers, 1990. 12(4): p. 375-392.
124. Zhao, X., et al., Hysteretic Adsorption and Desorption Of Hydrogen by Nanoporous Metal-Organic Frameworks. Science, 2004. 306(5698): p. 1012-1015.
125. Chue, K., et al., Comparison of Activated Carbon and Zeolite 13X for CO2 Recovery from
Flue Gas by Pressure Swing Adsorption. Industrial & Engineering Chemistry Research,
1995. 34(2): p. 591-598.
126. Moellmer, J., et al., High pressure adsorption of hydrogen, nitrogen, carbon dioxide and methane on the metal–organic framework HKUST-1. Microporous and Mesoporous Materials, 2011. 138(1): p. 140-148.
127. Rosi, N.L., et al., Advances in the Chemistry of Metal-Organic Frameworks.
CrystEngComm, 2002. 4(68): p. 401-404. 128. Bernini, M.C., et al., Encapsulation of Lemon Oil by Paste Method Using β-Cyclodextrin:
Encapsulation Efficiency and Profile of Oil Volatiles. Journal of Materials Chemistry B, 2014. 2(7): p. 766-774.
129. Brunauer, S., P.H. Emmett, and E. Teller, Adsorption of Gases in Multimolecular Layers.
Journal of the American Chemical Society, 1938. 60(2): p. 309-319.
130. Kathuria, A., M.G. Abiad, and R. Auras, Toughening of Poly (L-Lactic Acid) With Cu3
BTC2 Metal Organic Framework Crystals. Polymer, 2013. 54(26): p. 6979-6986.

92
131. Yoo, Y., Z. Lai, and H.-K. Jeong, Fabrication of MOF-5 Membranes Using Microwave-Induced Rapid Seeding and Solvothermal Secondary Growth. Microporous and
Mesoporous Materials, 2009. 123(1): p. 100-106.
132. Furukawa, Y., et al., Nano‐and Microsized Cubic Gel Particles from Cyclodextrin Metal–Organic Frameworks. Angewandte Chemie International Edition, 2012. 51(42): p.
10566-10569.
133. Corma, A., et al., Delaminated Zeolite Precursors as Selective Acidic Catalysts. Nature, 1998. 396(6709): p. 353-356.
134. Zhong, L.S., et al., Self‐Assembled 3D Flowerlike Iron Oxide Nanostructures and Their
Application in Water Treatment. Advanced Materials, 2006. 18(18): p. 2426-2431. 135. Trotta, F., M. Zanetti, and G. Camino, Thermal Degradation of Cyclodextrins. Polymer
degradation and Stability, 2000. 69(3): p. 373-379. 136. Engler, O. and V. Randle, Introduction to Texture Analysis: Macrotexture, Microtexture,
and Orientation Mapping. 2009: CRC press.
137. De Graef, M. and M.E. McHenry, Structure of Materials: An Introduction to Crystallography, Diffraction and Symmetry. 2007: Cambridge University Press.
138. Anderson, J.B. and M. Peters, Acetaldehyde Aldol Condensation Kinetics. Journal of Chemical and Engineering Data, 1960. 5(3): p. 359-364.
139. Almenar, E., et al., Release of acetaldehyde from β-cyclodextrins inhibits postharvest
decay fungi in vitro. Journal of agricultural and food chemistry, 2007. 55(17): p. 7205-
7212.
140. Gassensmith, J.J., et al., Strong and reversible binding of carbon dioxide in a green metal–organic framework. Journal of the American Chemical Society, 2011. 133(39): p. 15312-15315.
141. Xia, Y., M. Rubino, and R. Auras, Release of Nanoclay and Surfactant from Polymer-
Clay Nanocomposites into a Food Simulant. Environmental Science & Technology, 2014.