synthesis of lipid based polyols from 1-butene ...343... · oil for use in polyurethane foam...
TRANSCRIPT

Synthesis of Lipid Based Polyols from 1-butene Metathesized
Palm Oil for Use in Polyurethane Foam Applications
A Thesis Submitted to the Committee on Graduate Studies
in Partial Fulfillment of the Requirements for the Doctor of Philosophy in the Faculty
of Arts and Science
TRENT UNIVERSITY
Peterborough, Ontario, Canada
© Copyright by Prasanth Kumar Sasidharan Pillai 2015
Materials Science PhD. Graduate Program
January 2016

ii
Abstract
Synthesis of Lipid Based Polyols from 1-Butene Metathesized Palm
Oil for Use in Polyurethane Foam Applications
Prasanth Kumar Sasidharan Pillai
This thesis explores the use of 1-butene cross metathesized palm oil (PMTAG) as a
feedstock for preparation of polyols which can be used to prepare rigid and flexible
polyurethane foams. PMTAG is advantageous over its precursor feedstock, palm oil, for
synthesizing polyols, especially for the preparation of rigid foams, because of the reduction
of dangling chain effects associated with the omega unsaturated fatty acids. 1-butene cross
metathesis results in shortening of the unsaturated fatty acid moieties, with approximately
half of the unsaturated fatty acids assuming terminal double bonds. It was shown that the
associated terminal OH groups introduced through epoxidation and hydroxylation result in
rigid foams with a compressive strength approximately 2.5 times higher than that of rigid
foams from palm and soybean oil polyols. Up to 1.5 times improvement in the compressive
strength value of the rigid foams from the PMTAG polyol was further obtained following dry
and/or solvent assisted fractionation of PMTAG in order to reduce the dangling chain effects
associated with the saturated components of the PMTAG. Flexible foams with excellent
recovery was achieved from the polyols of PMTAG and the high olein fraction of PMTAG
indicating that these bio-derived polyurethane foams may be suitable for flexible foam
applications. PMTAG polyols with controlled OH values prepared via an optimized green
solvent free synthetic strategy provided flexible foams with lower compressive strength and

iii
higher recovery; i.e., better flexible foam potential compared to the PMTAG derived foams
with non-controlled OH values. Overall, this study has revealed that the dangling chain issues
of vegetable oils can be addressed in part using appropriate chemical and physical
modification techniques such as cross metathesis and fractionation, respectively. In fact, the
rigidity and the compressive strength of the polyurethane foams were in very close agreement
with the percentage of terminal hydroxyl and OH value of the polyol. The results obtained
from the study can be used to convert PMTAG like materials into industrially valuable
materials.
Keywords
Cross Metathesis; Metathesized Triacylglycerol (MTAG); Fractionation; Polyols;
Hexol; Tetrol; Diol; Olein; Stearin; Glycerol Composition; Polyurethane Foams;
Compressive Strength; Recovery.

iv
Acknowledgements
Its extreme pleasure to thank all the good hearted people who showered immense
support and help in achieving this milestone. I would never be able to finish this Ph.D without
the kind contributions from many of the wonderful people. In this pleasant occasion I would
like to thank all these wonderful people from my heart.
I would like to express my sincere thanks and respect to my supervisor, Prof. Suresh S.
Narine for giving me this wonderful opportunity. At this time I thank him for his magnificent
guidance and immense support throughout the program. He is a brilliant mentor as well as a
good friend who cares a lot about the welfare of the people who depended on him. Without
the priceless learning and incalculable experience obtained from him, I would not be able to
finish this work. I would like to thank Dr. Laziz Bouzidi and Dr. Shaojun Li for their kind
advices and valuable suggestions during my Ph.D. Also I take this opportunity to thank my
supervisory committee members Dr. Andrew Vreugdenhil and Dr. Ghaus Rizvi for their kind
advices and motivations.
I would like to thank Professor Sabu Thomas for their immense and generous help
showered one me on all my difficult times. I am also Thankful to Dr. Laly A. Pothen and
Abraham Mathew for their immense support and motivation all the time.
I have a million thanks for Ms. Athira Mohanan for her incredible and selfless support
throughout the Ph.D. Without her unconditional support and valuable advices, I would not be
able to finish my Ph.D.
I am thanking all my colleagues Ms. Latchmi Regunanan, Ms. Shegufa Merchant, Mr.
Michael Floros, Mr. Avinaash Persaud and Dr. Jesmy Jose for their kind help and valuable

v
suggestions throughout my Ph.D. Also I am grateful to our Lab managers and technicians Ali
Mahdevari, Carolyn Payne, John Breukelar, Peter Andreas for their valuable supervision and
support during this period. I would like to thank Rekha Singh, the administrative secretary of
our group for her kind support on all difficult times during my Ph.D.
I would like to thank the Grain Farmers of Ontario, Elevance Renewable Sciences, Trent
University, the GPA-EDC, Ontario Ministry of Agriculture, Food and Rural Affairs, Industry
Canada and NSERC for their financial support
I thank all my friends for their valuable suggestions throughout my life. A special thanks
to Mr. Tino Justin, Hassan Damji, Mohammed Jawad Nathoo and Mike Harrison Charles,
who were always there with me on all my difficulties. I am also grateful to Dr. Swaroop
Sasidharan Pillai, Dr. Dinesh T. Sreedharan for their precious support.
Finally my appreciation goes to my family for their selfless support. Exclusively, I am
always grateful to my parents, Sasidharan Pillai and Prasanna Kumari. I would like to thank
my sister Sree Lekshmi. P and brother in law Sarath S. Kurup for their unconditional support
and taking care my parents Sasidharan Pillai and Prasanna Kumari while I am miles away
from home. Also I am so thankful to my uncle B. Sivan Pillai for his support and advices
throughout my life.
vi
Table of Contents
Abstract ........................................................................................................................... ii
Keywords ...................................................................................................................... iii
Acknowledgements ....................................................................................................... iv
Table of Contents .......................................................................................................... vi
List of Figures ............................................................................................................... xii
List of Schemes ........................................................................................................... xvi
List of Tables ............................................................................................................... xix
List of Abbreviations ................................................................................................ xxiii
1 Introduction............................................................................................................ 1
1.1 Motivation and Objectives .................................................................................... 1
1.2 Background ........................................................................................................... 4
1.2.1 Polyurethanes ............................................................................................... 4
1.2.2 Polyurethane foams ..................................................................................... 5
1.2.3 Polyols ......................................................................................................... 6
1.2.4 Petroleum Polyols ........................................................................................ 6
1.2.5 Vegetable Oil Based Polyols ....................................................................... 8
1.3 Factors Determining the Properties of PU Foams............................................... 14
1.3.1 Effect of Polyol Structure .......................................................................... 14
1.3.2 Effect of Isocyanate ................................................................................... 15
1.3.3 Effect of Catalyst ....................................................................................... 16
1.3.4 Effect of Blowing Agent ............................................................................ 17
1.3.5 Effect of Surfactant .................................................................................... 18
1.4 Problems of Vegetable oil Derived PU Foams ................................................... 19

vii
1.5 Rectification of Dangling Chain Issue ................................................................ 19
1.5.1 Olefin Metathesis ....................................................................................... 19
1.5.2 Fractionation by Crystallization ................................................................ 22
1.6 Hypotheses .......................................................................................................... 23
1.7 Thesis Outline ..................................................................................................... 26
1.8 References ........................................................................................................... 27
2 1-Butene Metathesized Palm Oil & Polyol Derivatives: Structure, Chemical
Composition and Physical Properties.................................................................. 43
2.1 Introduction ......................................................................................................... 43
2.2 Materials and Methods ........................................................................................ 49
2.2.1 Materials .................................................................................................... 49
2.2.2 Chemistry characterization techniques ...................................................... 49
2.2.3 Physical characterization techniques ......................................................... 52
2.3 Results and Discussion ........................................................................................ 54
2.3.1 Chemical Characterization of PMTAG ..................................................... 54
2.3.2 Compositional Analysis of PMTAG ......................................................... 55
2.3.3 Physical Properties of PMTAG ................................................................. 62
2.3.4 Synthesis of PMTAG Polyol ..................................................................... 68
2.3.5 Compositional analysis of PMTAG Polyol ............................................... 75
2.3.6 Composition of PMTAG Polyol ................................................................ 81
2.3.7 Physical Properties of PMTAG Polyol ...................................................... 82
2.4 Conclusions ......................................................................................................... 88
2.5 References ........................................................................................................... 90
viii
3 Water-Blown Bio-Based Rigid and Flexible Polyurethane Foams from 1-Butene
Metathesized Palm oil Polyol ............................................................................. 96
3.1 Introduction ......................................................................................................... 96
3.2 Materials and Methods ...................................................................................... 100
3.2.1 Materials .................................................................................................. 100
3.2.2 Polymerization Method ........................................................................... 101
3.2.3 Chemistry and Physical characterization techniques ............................... 101
3.2.4 Preparation of PU rigid and flexible foams ............................................. 103
3.3 Results and discussion ...................................................................................... 106
3.3.1 FTIR Characterization of Foams ............................................................. 106
3.3.2 SEM analysis of PMTAG Polyol Foams ................................................. 107
3.3.3 Thermal Stability of Foams ..................................................................... 109
3.3.4 DSC of Rigid and Flexible Foams ........................................................... 110
3.3.5 Compressive Strength of PMTAG Polyol Foams ................................... 112
3.3.6 Recovery of Flexible Foams .................................................................... 115
3.4 Conclusions ....................................................................................................... 117
3.5 References ......................................................................................................... 118
4 Fractionation Strategies for Improving Functional Properties of Polyols and
derived Polyurethane Foams from 1-butene Metathesized Palm Oil................ 122
4.1 Introduction ....................................................................................................... 122
4.2 Materials and Methods ...................................................................................... 125
4.2.1 Materials .................................................................................................. 125
4.3 Chemistry Characterization Techniques ........................................................... 126
4.3.1 Titrimetric Methods (OH value, Acid value, Iodine value) .................... 126

ix
4.3.2 Proton Nuclear Magnetic Resonance Spectroscopy (1HNMR) ............... 126
4.3.3 Fourier Transform Infrared Spectroscopy (FTIR) ................................... 126
4.4 Physical Characterization Techniques .............................................................. 126
4.4.1 Thermogravimetric Analysis (TGA) ....................................................... 126
4.4.2 Differential Scanning Calorimetry (DSC) ............................................... 127
4.4.3 Rheology .................................................................................................. 128
4.4.4 Scanning Electron Microscopy (SEM) .................................................... 129
4.4.5 Compressive Strength .............................................................................. 129
4.5 Fractionation of PMTAG by dry and solvent mediated crystallization ............ 129
4.5.1 Dry crystallization experiments ............................................................... 131
4.5.2 Solvent Mediated Crystallization Experiment ......................................... 132
4.6 Synthesis of the Polyols .................................................................................... 133
4.6.1 Epoxidation .............................................................................................. 134
4.6.2 Hydroxylation .......................................................................................... 134
4.7 Polymerization Method ..................................................................................... 135
4.8 Results and Discussion ...................................................................................... 136
4.8.1 Results of the fractionation of PMTAG .................................................. 136
4.8.2 1H-NMR Characterization of the PMTAG fractions ............................... 138
4.8.3 Characterization of the polyols synthesized from LF- and SF-PMTAG . 140
4.8.4 Crystallization and Melting Behavior of LF- and SF- Polyols ................ 142
4.8.5 Flow Behavior and Viscosity of LF- and SF-PMTAG Polyols ............... 144

x
4.9 Polyurethane Rigid and Flexible Foams ........................................................... 145
4.9.1 FTIR of LF-PMTAG Polyol Foams ........................................................ 146
4.9.2 SEM Analysis of LF-Polyol Foams ......................................................... 147
4.9.3 Thermal degradation Properties of LF-Polyol Foams ............................. 148
4.9.1 Thermal transition Properties of LF-Polyol Foams ................................. 150
4.9.2 Compressive Strength of LF-Polyol Foams ............................................ 150
4.10 Conclusions ....................................................................................................... 153
4.11 References ......................................................................................................... 155
5 Solvent Free Synthesis of Polyols From 1- Butene Metathesized Palm Oil for
Use in Polyurethane foams ............................................................................... 158
5.1 Introduction ....................................................................................................... 158
5.2 Materials and Methods ...................................................................................... 161
5.2.1 Materials .................................................................................................. 161
5.2.2 Chemistry Characterization ..................................................................... 161
5.2.3 Physical Characterization Techniques ..................................................... 163
5.2.4 Synthesis Methods ................................................................................... 165
5.3 Results and Discussion ...................................................................................... 169
5.3.1 Solvent Free Synthesis of Polyol from PMTAG ..................................... 169
5.3.2 Chemical Characterization and Compositional Analysis of PMTAG Green
Polyols ..................................................................................................... 170
5.3.3 Physical Properties of PMTAG Green Polyols ....................................... 175
5.3.4 Polyurethane Foams ................................................................................ 180

xi
5.4 Conclusions ....................................................................................................... 191
5.5 References ......................................................................................................... 193
6 Conclusion ......................................................................................................... 197
6.1 General Conclusion ........................................................................................... 197
6.2 Rigid foams from PMTAG ............................................................................... 197
6.3 Flexible foams from PMTAG ........................................................................... 198
6.4 Foams from fractionated PMTAG .................................................................... 199
6.5 Green Polyols and Foams ................................................................................. 200
6.6 Summary ........................................................................................................... 200
6.7 Implications of this study .................................................................................. 201
6.8 Future Prospects ................................................................................................ 201
Appendix .................................................................................................................... 204
A1 Butene Cross metathesized Palm oil and Polyol Derivatives: Structure and
Physical properties ............................................................................................ 204
A2 Fractionation Strategies for Improving Functional Properties of Polyols and
derived Polyurethane Foams from 1-butene Metathesized Palm Oil................ 213
A3 Solvent Free Synthesis of Polyols from 1-Butene Metathesized Palm Oil for Use
of Polyurethane Foams ...................................................................................... 224

xii
List of Figures
Figure 2.1. 1H-NMR of PMTAG. (a) Chemical shift range between δ 2.5 and 0.7 ppm, (b)
Chemical shift range between δ 6.0 and 4.0 ppm .................................................................. 58
Figure 2.2. HPLC of PMTAG (solid line) superimposed with the HPLC of DDD, DDS and
DSS. The standard TAGs are indicated at the side of their HPLC trace (dashed lines) ........ 60
Figure 2.3: TGA and DTG profiles of the PMTAG.............................................................. 63
Figure 2.4: (a) Crystallization thermograms of PMTAG obtained (b) corresponding heating
profiles (both at 5 °C/min) ..................................................................................................... 64
Figure 2.5: Shear rate versus shear stress of the PMTAG .................................................... 67
Figure 2.6: Viscosity versus temperature of PMTAG. Dotted lines are fit to the generalized
van Velzen equation (eq.2). The lower panel represents the residuals in % (RD%) versus
temperature. ........................................................................................................................... 68
Figure 2.7. 1H-NMR spectrum of epoxy PMTAG ................................................................ 71
Figure 2.8. 1H-NMR of (a) PMTAG Polyol H1and (b) PMTAG Polyol H2 and H3 ........... 73
Figure 2.9. HPLC of PMTAG Polyol. .................................................................................. 79
Figure 2.10: TGA and DTG profiles of PMTAG Polyol. ..................................................... 83
Figure 2.11: (a) Crystallization of PMTAG polyol (b) heating profile of PMTAG polyol. . 84
Figure 2.12: Shear rate versus shear stress of PMTAG Polyol ............................................. 86
Figure 2.13: Viscosity versus temperature measured while cooling PMTAG Polyol at () 1
°C/min. Dotted lines represent the calculated viscosity using the generalized van Velzen
equation (Eq.2.2). Lower panel represent the residuals in % (RD%) versus temperature. The
cut-off is indicated with a vertical dashed line. ..................................................................... 87

xiii
Figure 3.1: Pictures of (a) Rigid PMTAG Polyol Foam, and (b) Flexible PMTAG Polyol
Foam .................................................................................................................................... 106
Figure 3.2. Typical FTIR spectra of the PMTAG Polyol foams. (1) PMTAG Polyol Rigid
Foam and (2) PMTAG Polyol Flexible Foam ..................................................................... 107
Figure 3.3. Typical SEM micrographs of (a) Rigid PMTAG Polyol foams and (b) Flexible
PMTAG Polyol Foam .......................................................................................................... 108
Figure 3.4: TGA and DTG profiles of (a) PMTAG rigid foam and (b) PMTAG flexible foam.
.............................................................................................................................................. 109
Figure 3.5. Typical DSC curves of (a) Rigid PMTAG Polyol Foam and (b) Flexible PMTAG
Polyol Foam. ........................................................................................................................ 111
Figure 3.6. (a) Compressive strength versus strain curves of PMTAG Polyol foams (a) rigid
foam (b) flexible foams. ....................................................................................................... 113
Figure 3.7. Density (kg/m3) versus compressive strength (MPa) of PMTAG Polyol foams at
6% and 10% deformations (a) rigid foam (b) flexible foam. ............................................... 114
Figure 3.8. (a) Recovery of PMTAG Flexible Foam as a function of time (min); (b) Recovery
of PMTAG Flexible Foam after 48 h as a function of density. ........................................... 116
Figure 4.1. Crystallization thermograms of PMTAG obtained at 0.1 °C/min, 1 °C/min and 5
°C/min. ................................................................................................................................. 130
Figure 4.2. Typical DSC thermograms of the liquid (LF) and solid fractions (SF) of PMTAG.
(a) cooling and (b) heating (both at 5 C/min) ..................................................................... 136
Figure 4.3. DTG of LF- and SF-Polyols ............................................................................. 142

xiv
Figure 4.4. DSC thermograms of LF- and SF-Polyols obtained from the liquid fractions and
solid fractions of PMTAG during (a) Cooling (5.0 C/min), and (b) subsequent heating (5
°C/min). ................................................................................................................................ 144
Figure 4.5. (a) Shear rate- shear stress of LF-Polyol), (b) viscosity versus temperature of LF-
and SF-Polyols. Solid lines in (a) are fits to the Herschel-Bulkley model (Eq. 4.1). .......... 145
Figure 4.6. Typical FTIR spectra of the rigid (RF) and flexible foams (FF) prepared from LF-
Polyol. .................................................................................................................................. 147
Figure 4.7. SEM images of rigid and flexible LF-Polyol foams: (a) rigid foam, (b) flexibe
foam ..................................................................................................................................... 148
Figure 4.8. (a) DTG of rigid (RF) and flexible (FF) LF-Polyol foams ............................... 149
Figure 4.9. DSC thermogram of rigid (RF) and flexible (FF) LF-Polyol foams ................ 150
Figure 4.10. Compressive strength versus strain curves of (a) Rigid LF-Polyol foam of
density 163 kg/m3 (RF) and (b) Flexible LF-Polyol Foam of density 161 kg/m3 (FF). ...... 151
Figure 4.11. Recovery of LF-Polyol Flexible Foam (FF) as a function of time (min) ....... 152
Figure 5.1. DTG profiles of B3- and B4-Green Polyols ..................................................... 176
Figure 5.2. DSC thermograms of B3-, and B4-Green Polyols obtained during (a) Cooling,
and (b) subsequent heating (5 °C/min). ............................................................................... 177
Figure 5.3. Shear rate- shear stress of PMTAG Green Polyols. (a) B3-Green Polyol (b) B4-
Green Polyol, respectively. .................................................................................................. 179
Figure 5.4. Viscosity versus temperature curves obtained during cooling (1 °C/min) of B3-
Green Polyol (empty circles) and B4-Green Polyol (empty triangles). Dashed lines are guides
for the eye. ........................................................................................................................... 179

xv
Figure 5.5: Pictures of rigid and flexible foams from B3-and B4-Green PMTAG Polyols. (a)
B3-Green Polyol rigid foam of density 145 kgm-3 (B3-RF145), (b) B3-Green Polyol flexible
foam of density 162 kgm-3 (B3-FF162), (c) B4-Green Polyol rigid foam of density 166 kgm-
3 (B4-RF166).and (d) B4-Green Polyol flexible foam of density 156 kgm-3 (B4-FF156) .. 180
Figure 5.6. Typical FTIR spectra of rigid (RF) and flexible (FF) B4-Green Polyol foam. 181
Figure 5.7. SEM micrographs of (a) B4-Green Polyol rigid foam and (b) B4-Green Polyol
flexible foam ........................................................................................................................ 183
Figure 5.8. DTG curves of B4-Green Polyol rigid foam (B4-RF) and B4-Green Polyol
Flexible Foam (B4-FF). ....................................................................................................... 185
Figure 5.9. DSC heating thermogram (2nd cycle) of the B4-Green Polyol rigid (B4-RF) and
flexible foams (B4-FF): arrow 1 indicates lowTg , arrow 2 indicates intTg and arrow 3
indicates highTg . ..................................................................................................................... 186
Figure 5.10. Compressive strength versus strain curves of (a) Rigid foams: B3-RF145 (B3-
Green Polyol rigid foam of density 145 kgm-3), B4-RF166 (B4-Green Polyol rigid foam of
density 166 kgm-3) (b) Flexible foams. B3-FF162 (B3-Green Polyol flexible foam of density
162 kgm-3), B4-FF156 (B4-Green Polyol flexible foam of density 156 kgm-3). ................. 187
Figure 5.11: Recovery (%) in thickness of B4-FF156 (B4-Green Polyol flexible foam of
density 156 kgm-3) versus time. ........................................................................................... 190
Figure A 1: 1H-NMR of Epoxidation of PMTAG in Ethyl Acetate. Terminal double bond
left : >60% ............................................................................................................................ 205
Figure A 2: 1H-NMR of Epoxidation of without solvent. No double bond detected. Formic
ester polyol formed. Terminal double bond left : >60% ...................................................... 205

xvi
Figure A 3: 1H-NMR of Epoxidation of with reduced ratio of H2O2 and HCOOH. Terminal
double bond >40% and Internal double bond >5% ............................................................. 206
Figure A 4. HPLC of PMTAG Polyol Fractions (F1-F8) .................................................. 212
Figure A 5: Crystallization thermograms of (a) LF(D)-PMTAG , (b)SF(D)-PMTAG obtained
at 5 °C/min and heating profiles of (c) LF(D)-PMTAG , (d) SF(D)-PMTAG at 5 °C/min..
.............................................................................................................................................. 214
Figure A 6: Crystallization thermograms of (a) LF(S)-PMTAG , (b)SF(S)-PMTAG obtained
at 5 °C/min and heating profiles of (c) LF(S)-PMTAG , (d) SF(S)-PMTAG at 5 °C/min. . 215
Figure A7. 1H-NMR spectra of SF-PMTAG ...................................................................... 217
Figure A 8. 1H-NMR spectra of LF-PMTAG ..................................................................... 218
Figure A 9. 1H-NMR spectra of LF-Polyol ......................................................................... 220
Figure A 10. 1H-NMR spectra of SF-Polyol ....................................................................... 221
Figure A 11: 1HNMR of Selected Polyols ......................................................................... 226
Figure A 12. GPC chromatogram of B3-Green Polyol (B3), B4-Green Polyol (B4) and
standard PMTAG polyol (S). ............................................................................................... 230
List of Schemes
Scheme 1.1: Reaction of isocyanate and alcohol to form urethane linkage ............................ 4
Scheme 1.2: Possible reactions during polyurethane foam preparation .................................. 5
Scheme 1.3: General formula of polyalkylene oxide (polyether) polyol ................................ 7
Scheme 1.4: General formula of polyester polyol ................................................................... 7
Scheme 1.5: General structure of a triacylglycerol (TAG); R1, R2 and R3 are fatty acids, and
may or may not be the same..................................................................................................... 8

xvii
Scheme 1.6: Ozonolysis of vegetable oil TAGs to produce polyols[47]. ............................. 11
Scheme 1.7: Hydroformylation of vegetable oil TAGs to produce polyols. ......................... 12
Scheme 1.8: Transesterification of vegetable oil TAGs using glycerol to produce polyols . 13
Scheme 1.9. Epoxidation reaction of TAG to yield polyol ................................................... 14
Scheme 1.10. Representation of olefin metathesis reaction [100]. Forward reaction (from left
to right) shows the self -metathesis reaction; reverse reaction (from right to left) gives the
cross metathesis reaction. ....................................................................................................... 20
Scheme 2.1. Representation of olefin metathesis reaction. ................................................... 46
Scheme 2.2. Metathesis reaction of triolein with 1-butene. n=0, the fatty acid is 9-denenoic
acid (D), n= 2, the fatty acid is 9-dodecenoic acid (Dd), and n= 8, the fatty acid is oleic acid
(O). ......................................................................................................................................... 55
Scheme 2.3. Possible TAG structures composing PMTAG. n=0, 2, 8; m= 11 to 20. .......... 56
Scheme 2.4. Synthesis of PMTAG Polyol (n=0, 2, 8; m=11 to 20) ...................................... 69
Scheme 2.5. Diol structures produced from oleic acid, 9-dodecenoic acid and 9-decenoic acid
present in the PMTAG as a result of epoxidation followed by hydroxylation. ..................... 76
Scheme 2.6. General structures present in PMTAG Polyol (n= 0, 2, 8; m=11 to 20) ........... 82
Scheme 3.1. Cross linked polyurethane foam from MDI and PMTAG Polyols. Hexol is used
as a model polyol structure. ................................................................................................... 99
Scheme 4.1. Synthesis route of polyols from the liquid and solid fraction of PMTAG (n=0, 2,
8; m=11 to 20). ..................................................................................................................... 133
Scheme 4.2. Possible TAG structures in LF-and SF-PMTAG. n=0, 2, 8; m= 11 to 20. .... 139
Scheme 4.3. Possible structures of LF- and SF-Polyols (n= 0, 2, 8; m=11 to 20) .............. 141
Scheme 5.1. Solvent-free synthesis of polyols from PMTAG. n= 0, 2, 8; m= 11 to 20. ... 170
Scheme 5.2. General structures in PMTAG Green Polyol (n= 0, 2, 8; m= 11 to 20) ......... 174

xviii
Scheme A 1. Possible structure of the formic ester polyol .................................................. 206
Scheme A 2. Structures of PMTAG Polyol determined by MS and 1H-NMR .................. 210
Scheme A3. Fatty acid (FA1, FA2 and FA3) structures from the B4-Polyol. .................... 232

xix
List of Tables
Table 1.1: Some common fatty acids in vegetable oils [8]. The first number in brackets gives
is the number of carbon atoms in the fatty acid chain and the second number indicates the
number of double bonds. .......................................................................................................... 8
Table 1.2: Fatty Acid Composition (%) of some typical vegetable oils (Modified from [10,
58, 59]). .................................................................................................................................. 10
Table 2.1. TAG profile of palm oil and corresponding modified TAG in PMTAG. ............ 56
Table 2.2. GC results of methylated PMTAG. ...................................................................... 57
Table 2.3. Relative amounts of saturated and unsaturated structures in PMTAG as determined
by 1H-NMR. ........................................................................................................................... 59
Table 2.4. HPLC analysis data of PMTAG. .......................................................................... 62
Table 2.5. Optimization data for the synthesis of PMTAG Polyola ...................................... 72
Table 2.6. Characterization of PMTAG Polyol fractions ...................................................... 76
Table 2.7. HPLC retention time (RT, min) and relative area (A%) of column chromatography
fraction of PMTAG polyol (F1-F8) obtained from the analysis of the HPLC of PMTAG
Polyol ..................................................................................................................................... 80
Table 2.8. Thermal data of the PMTAG and PMTAG Polyol obtained on cooling and heating
(5 °C/min). onT , offT , and pT , p= 1-6: onset, offset, and peak temperatures, ,C MH : Enthalpy,
C: crystallization and M: melting. ......................................................................................... 85
Table 3.1. Formulation Recipe for Rigid and Flexible PMTAG Polyol Foam ................... 104
Table 3.2. Composition and properties of PMTAG Polyol and diphenylmethane diisocyanate
(MDI) ................................................................................................................................... 105

xx
Table 3.3. Reactivity profile for the processing of PMTAG Polyol rigid and flexible foams
.............................................................................................................................................. 105
Table 3.4. Compressive strength of vegetable polyol based rigid foams from the literature[7,
43]. ....................................................................................................................................... 115
Table 4.1. Fractionation data of PMTAG. a CT : Crystallization temperature; bCt : isothermal
crystallization time ............................................................................................................... 132
Table 4.2. Formulation Recipes for Rigid and Flexible Foams .......................................... 135
Table 4.3. Fatty acid profile of SF-PMTAG and LF-PMTAG calculated based on the relative
area under the characteristic 1H-NMR peaks assuming TAG structures only. The PMTAG
data are provided for comparison purposes. TDB: Terminal double bonds; IDB: Internal
double bonds; FA: Fatty acid; SFA: Saturated fatty acid .................................................... 139
Table 4.4. Compressive strength of LF-PMTAG Polyol Foams at different strain (%): Rigid
LF-Polyol Foam (RF), Flexible LF-Polyol Foam (FF); Rigid PMTAG Polyol Foam (RF-
PMTAG Polyol); and Flexible PMTAG Polyol Foam (FF-PMTAG Polyol) ..................... 151
Table 5.1. Epoxidation reaction temperature and time data for the synthesis of green polyols.
Epx
iniT : Initial temperature of the epoxidation reaction; max
EpxT : highest temperature reached during
the epoxidation reaction; Epx
RT : reaction temperature for epoxidation; Epx
Rt : reaction time 166
Table 5.2. Formulation Recipes for Rigid and Flexible Foams. Amounts are based on 100
parts by weight of total polyol ............................................................................................. 168
Table 5.3. Amount of remaining terminal double bonds (RTDB)1, number of formic acid
units per TAG polyol and terminal OH groups as estimated by 1H-NMR. Iodine value, Acid
value and OH number of PMTAG Green Polyols. .............................................................. 172

xxi
Table 5.4. Compressive strength of rigid foams: B4-RF166 (B4-Green Polyol rigid foam of
density 166 kgm-3) versus RF-165 (PMTAG Polyol rigid foam of density 165 kgm-3)at 6%
and 10 % deformation. Flexible Foams: B3-FF162 (B3-Green Polyol flexible foam of density
162 kgm-3), B4-FF156 (B4-Green Polyol flexible foam of density 156 kgm-3) and FF-156
(PMTAG Polyol flexible foam of density 156 kgm-3) at 10% and 25% deformation. ........ 189
Table A 1. Table showing the characteristic chemical shift values of PMTAG ................. 204
Table A 2. Thermal data of the PMTAG obtained on cooling and heating (at 0.1, 1.0, 5
°C/min). onT , offT and pT , p= 1-6: Onset, offset, and peak temperatures, ,C MH : Enthalpy, C:
crystallization and M: melting. ............................................................................................ 213
Table A 3. Fractionation of PMTAG by crystallization. OnT : onset of crystallization ...... 213
Table A 4. Thermal data of SF- and LF-PMTAG. onT , offT , 1 3T : onset, offset and peak
temperatures (C), SH , OH , and H (J/g): Enthalpy of the stearin and olein portions, and
total enthalpy, respectively. ................................................................................................. 216
Table A 5. 1H-NMR chemical shifts of SF-PMTAG and LF- PMTAG ............................. 219
Table A 6: Chemical shifts (δ) and their integration values from 1HNMR......................... 222
Table A 7. Temperature of degradation at 1, 5 and 10% weight loss (1%
dT ,5%
dT , 10%
dT ,
respectively), DTG peak temperatures ( DT ), and extrapolated onset ( onT ) and offset (offT )
temperatures of degradation of LF- and SF- Polyols ........................................................... 222
xxii
Table A 8. Thermal data of LF- and SF-Polyols obtained on cooling and heating (both at 5
°C/min). Onset ( onT ), offset (offT ), and peak temperatures ( 1 3T ), Enthalpy of crystallization
( CH ), and Enthalpy of melting ( MH ). aShoulder peak ................................................. 223
Table A 9. Temperature of degradation at 1, 5 and 10% weight loss ( 1%
dT , 5%
dT , 10%
dT ,
respectively), DTG peak temperatures ( DT ), and extrapolated onset ( onT ) and offset ( offT )
temperatures of degradation of LF(D)-Polyol Foams .......................................................... 223
Table A 10: Properties of diphenylmethane diisocyanate (MDI) ....................................... 224
Table A 11. 1H-NMR chemical shifts, δ, of B1-, B2-, B3- and B4-epoxy PMTAG. ......... 224
Table A 12. 1H-NMR chemical shifts, δ, of B1-, B2-, B3- and B4-PMTAG Green Polyols
.............................................................................................................................................. 225
Table A 13. Area% of peaks P1 and P2 from GPC ............................................................. 230
Table A 14. Column chromatography, HPLC and 1H NMR data of the fractions of B4-Polyol.
EA: Hx: ratio of ethyl acetate and hexanes, the solvents used for column chromatography.
RT: HPLC Retention time (min); FA1: Fatty acids with terminal double bond (9-decenoic
acid), FA2: Fatty acid with internal double bond (9-dodecenoic acid); FA3: Fatty acid with
internal double bond (oleic acid). The structure FA1, FA2 and FA3 are presented in Scheme
A3. ........................................................................................................................................ 231
Table A15. Thermal data of Green PMTAG Polyols obtained on cooling and heating (both
at 5 °C/min). Onset ( onT ), offset ( offT ), and peak temperatures ( 1 3T ), enthalpy of
crystallization ( CH ), and enthalpy of melting ( MH ). aShoulder peak ......................... 232

xxiii
List of Abbreviations
Acronym Name
B1-Green Polyol Polyol from PMTAG from Batch 1-solvent free method
B2-Green Polyol Polyol from PMTAG from Batch 2-solvent free method
B3-Green Polyol Polyol from PMTAG from Batch 3-solvent free method
B4-Green Polyol Polyol from PMTAG from Batch 4-solvent free method
B3-FF162 B3-Green Polyol Flexible Foam: Density 162 kgm-3
B4-FF156 B4-Green Polyol Flexible Foam: Density 156 kgm-3
B3-RF145 B3-Green Polyol Rigid Foam: Density 145 kgm-3
B4-RF166 B4-Green Polyol Flexible Foam: Density 166 kgm-3
CFC Chlorofluorocarbon
DBTDL Dibutyltindilaurate
DDD 1,2,3-triyl tris(dec-9-enoate)
DDS 3-(dec-9-enoyloxy) propane-1, 2-diyl distearate
DMBNA N,N-dimethylbenzylamine
DMEA N,N-Dimethylethanolamine
DSS 3-(stearoyloxy) propane-1, 2-diyl bis(dec-9-enoate)
DDO 3-(dec-9-enoyloxy) propane-1, 2-diyl oleate
DDP 3-(dec-9-enoyloxy) propane-1, 2-diyl palmitate
DDS 3-(dec-9-enoyloxy) propane-1, 2-diyl distearate
DSS 3-(stearoyloxy) propane-1, 2-diyl bis(dec-9-enoate)
DDdDd 3-(dodec-9-enoyloxy) propane-1, 2-diyl dec-9-enoate
DOO 3-(oleoyloxy) propane-1, 2-diyl bis(dec-9-enoate)
DLO 1-dec-9-oyl-2-linoleoyl-3-oleoyl-sn-glycerol
DOP 1-decenoyl-2-oleoyl-3-palmitoyl-sn-glycerol
DdDdDd 1,2,3-triyl tris(dodec-9-enoate
DdDdS 3-(dodec-9-enoyloxy) propane-1, 2-diyl distearate
DdDL 1-dodecenoyl-2-decenoyl-3-linoleoyl-sn-glycerol
DdDdL 3-(dodec-9-enoyloxy) propane-1, 2-diyl linoleate
DdDdO 3-(dodec-9-enoyloxy) propane-1, 2-diyl oleate
DdDdP 3-(dodec-9-enoyloxy) propane-1, 2-diyl palmitate
DdDP 1-dodecenoyl-2-decenoyl-9-palmitoyl-sn-glycerol
DdLO 1-dodecnoyl-2-linoleoyl-3-oleoyl-sn-glycerol
DdOP 1-dodecenoyl-2-oleoyl-3-palmitoyl-sn-glycerol
Epoxy B1-PMTAG Epoxy of PMTAG from Batch 1-solvent free method
Epoxy B2-PMTAG Epoxy of PMTAG from Batch 2 -solvent free method
Epoxy B3-PMTAG Epoxy of PMTAG from Batch 3-solvent free method
Epoxy B4-PMTAG Epoxy of PMTAG from Batch 4-solvent free method
FF Flexible Foam
HDI Hexamethylene diisocyanate
HFC Hydrofluorocarbon
HCFC Hydrochlorofluorocarbon
IPDI Isophorone diisocyanate
LF Liquid Fraction

xxiv
IV Iodine Value
LF-Polyol Liquid Fraction from PMTAG Polyol
LF-PMTAG Liquid Fraction of PMTAG
MAG Monoacylglycerols
MDI Diphenylmethane diisocyanate
MTAG Metathesized Triacylglycerol
MLP 1-myristoyl-2-linoleoyl-3-palmitoyl-sn-glycerol
MMM trimyristoylglycerol
MMP 1,2-dimyristoyl-3-palmitoyl-sn-glycerol
OOO Triolein
OOL 1,2-dioleoyl-3-linoleyol-sn- glycerol
OOP 1,2-dioleoyl-3-palmitoyl-sn- glycerol
OLO 1,3-dioleoyl-2-linoleoyl-sn-glycerol
PMTAG MTAG of Palm Oil
PU Polyurethane
PMTAG Polyol Polyol synthesized from PMTAG by solvent method
PMTAG-FF Flexible Foam prepared from PMTAG Polyol
PMTAG-RF Rigid Foam prepared from PMTAG Polyol
PLL 1,2-dilinoleyol-3-palmitoyl-sn- glycerol
PLP 1,3-palmitoyl-2-linoleoyl-sn-glycerol
POL 1-palmitoyl-2-oleoyl-3-linoleoyl-sn-glycerol
POO 1,2-dioleoyl-3-palmitoyl-sn- glycerol
POP 1,3-dipalmitoyl-2-oleoyl-sn-glycerol
POS 1-palmitoy-l,2-oleoyl,3-stearoyl-sn-glycerol
PPM 1,2-dipalmitoyl-3- myristoyl -sn-glycerol
PPO 1,2-dipalmitoyl-3- oleoyl -sn-glycerol
PPP tripalmitoylglycerol
PPS 1,2-dipalmitoyl-3-steroyl-sn-glycerol
TAG Triacylglycerol
RF Rigid Foam
SF Solid Fraction
SF-PMTAG Solid Fraction of PMTAG
SF-Polyol Solid Fraction from PMTAG Polyol
SFA Saturated Fatty Acid
SOO 1,2-dioleoyl-3-stearoyl-sn- glycerol
SOS 1,3-distearoyl-2-oleoyl-sn-glycerol
TAG Triacylglycerol
TDI Toluene diisocyanate
UFA Unsaturated Fatty Acid

xxv
To
My Parents & My Teacher, Dr. Laly A. Pothen

1
1 Introduction
1.1 Motivation and Objectives
Polyurethane (PU) foams are one of the most versatile polymeric materials with
regards to both processing methods and mechanical properties [1, 2]. They are widely used
because of their physical properties such as light weight, good insulation properties,
excellent strength to weight ratio, and impressive sound absorbing properties [1, 2]. The
PU foam market is very large and growing due to high demand across a wide range of
industries such as automotive, building and construction, and packaging [3, 4]; the worth
of the global polymer foams market was $82.6 billion in 2012 and is estimated to reach
$131.1 billion by 2018 [5]. The specific polyurethane foams market value which was 46.8
billion in 2014 is expected to reach $72.2 billion by 2020 [6].
Traditionally, PU foams are prepared by the reaction of diisocyanates or
polyisocyanates with petroleum-derived polyols [1, 7]. Growing concerns surrounding
sustainability, biodegradability, control of carbon dioxide emission and other
environmental problems are driving a strong demand for alternatives to petroleum as a
feedstock for fuels and materials [8]. Vegetable oils are advantageous in this regard because
of their availability in large quantities, renewability and relatively low cost [9-11]. Studies
on the preparation of rigid and flexible PU foams from vegetable oils (VO) were already
reported; for example PU foams from soybean oil [12-15], castor oil [16], safflower oil,
corn oil, sunflower seed oil, linseed oil [17, 18], rapeseed oil [19-21] and cotton seed oil
[22]. However, the dangling chains which remain in the PU foams from the saturated fatty
acids as well as from the omega chains of the unsaturated fatty acid of VOs negatively

2
affect the rigidity of the foams [23]. The regions where dangling chains are present do not
support stress when the sample is loaded. Furthermore, they act as plasticizers, resulting in
reduction of polymer rigidity [24, 25]. This can be addressed by modifying vegetable oils
using more appropriate methods such as olefin cross-metathesis, ozonolysis, fractionation
etc., such that dangling chains are removed.
Palm oil is one of the cheapest, most produced TAG oils, making it an ideal feedstock
replacement at an industrial scale. It is primarily used in foods [26, 27] and is increasingly
sought for the production of industrial materials. Palm oil is typically composed of 95%
triacylglycerols (TAGs), 5% diacylglycerols (DAGs), and other minor components such as
monoacylglycerols (MAGs) with a fatty acid profile ranging typically from C12 to C20
[28, 29]. It has a balanced saturation (~50/50 % of saturates / unsaturates) [30, 31]. Palmitic
acid (P, C16:0) and oleic acid (O, C18:1) with ~43% and ~41%, respectively, are the main
components of palm oil. Palm oil includes ~10% linoleic acid (Li, C18:2), and trace
amounts of linolenic acid (Ln, C18:3) and palmitoleic acid (C16:1). Other representative
saturated fatty acids, which are present in non-significant amounts (< 5 %), in palm oil are
lauric acid (L, C12:0), myristic acid (M, C14:0), stearic acid (S, C18:0) and arachidic acid
(A, C20:0). The TAG profile of palm oil shows a carbon distribution of C46 to C52
consisting of tri-unsaturated (4.8-9.8%), di-unsaturated (31.8-44.4%), mono unsaturated
(38.5-50.3%) and saturated TAGs.
Despite the high saturation, palm oil has been successfully transformed into a variety
of industrial materials [32]. It is increasingly used to make value added products such as
soaps and detergents [33], lubricants [34, 35], biodiesel [30, 36] and surfactant [37]. Palm
oil and its derivatives are also actively investigated as a feedstock for the synthesis of

3
polyols to prepare polyurethanes [32, 38, 39]. However, its larger use in the production of
polyurethanes is affected by its relatively higher levels of saturation (50% fatty acids)
which limits the hydroxyl values of its polyols as compared to the polyols of highly
unsaturated vegetable oil [40]. This restricts the applicability of palm oil-based polyols in
polymer formulations, particularly in rigid polyurethane foams [40].
Cross metathesis [41] is a widely used chemical technique to convert the internal
double bonds of unsaturated fatty acids into terminal double bonds, thereby removing the
dangling chains associated with the unsaturated fatty acids. 1-butene metathesized palm
oil, called PMTAG, is a by-product of the industrial biorefinery that produces 1-decene
and 3,4-dodecene linear aliphatic olefins for the fine chemicals sector. Our industrial
collaborator, Elevence Renewable Sciences (ERS, Bolingbrook, Ill., USA), owns the
intellectual property right to convert palm oil into PMTAG [42]. ERS currently operates a
biorefinery plant in Indonesia which processes 400 million lbs of palm oil, and plans to
build other biorefinery processing plants in North America that will use cross-metathesis
on native plant oils such as soybean oil and canola oil. This will increase the amount of
these types of byproducts; i.e., metathesized vegetable oils. Conversion of these byproducts
into value added products is, therefore, desirable in order to increase the profitability of the
industry.
The present study investigated whether PMTAG can be used to produce rigid and
flexible PU foams. The objective of the study was not only to convert a byproduct into
useful material, but also to contribute to the fundamental understanding necessary to
address the dangling chain issues of vegetable oil derived PU foams. The potential for cross
metathesis of palm oil followed by fractionation of saturated components to address the

4
dangling chain issues of palm oil was investigated. For this purpose, PMTAG was used to
synthesize several polyols with variable hydroxyl value and terminal hydroxyls for the
preparation of rigid and flexible polyurethane foams. The possibility to remove the
saturated components of PMTAG using crystallization fractionation was also investigated
and the fractionated PMTAG was used for the preparation of polyols and polyurethane
foams.
1.2 Background
1.2.1 Polyurethanes
Polyurethanes are macromolecules containing urethane linkages (-NH-CO-O-) that
are formed either based on the reaction of isocyanate (-NCO) groups and hydroxyl groups
[1], or via non-isocyanate pathways, such as the reaction of cyclic carbonates with amines
[43], self-polycondensation of hydroxyl-acyl azides or melt transurethane methods [44].
The most common method to form the backbone urethane group is the reaction of a polyol
and an isocyanate with suitable cross-linking agents, chain extenders, blowing agents and
other additives [45].
Scheme 1.1: Reaction of isocyanate and alcohol to form urethane linkage
Scheme 1.1 shows the formation of a urethane linkage from the reaction of a
hydroxyl group and an isocyanate. The appropriate selection of reactants enables the

5
formation of a wide range of polyurethane products such as polyurethane elastomers [46],
sheets [47], adhesives [48], coatings [49] and foams [23].
1.2.2 Polyurethane foams
As discussed above, polyurethane foams are obtained by the reaction between
polyols and diisocyanates or polyisocyanates in the presence of physical or chemical
blowing agents [1, 7]. Polyurethane foam preparation involves two major simultaneous
reactions: the cross linking reaction (see Scheme1.2a) and the blowing reaction (gas
producing) (scheme 1.2b & 1.2c). The cross linking reaction leads to the formation of the
urethane linkage [50, 51]. The subsequent reaction between isocyanate and water produces
unstable carbamic acid which decomposes further into amine and carbon dioxide (see
Scheme 1.2c). The carbon dioxide gas diffuses into the trapped air bubbles in the reaction
mixture, causing the foam to rise. Scheme 1.2d shows the formation of a urea linkage by
the reaction of excess of isocyanate with amine (see Scheme 1.2c). .
Scheme 1.2: Possible reactions during polyurethane foam preparation
The progress of the polyurethane foaming process can be monitored by the cream
time, gel time and rise time. Cream time is defined as the time at which the polymerization
mixture becomes creamy and brightened. Gel time is the time at which the increasing cross-

6
linking results in a gel-like or syrup-like polymer consistency. Rise time is the time period
between the gel time and end of rise of the foams [1].
Furthermore, the physical properties of foams can be tailored to a large extent by
varying the structure and composition of the reacting monomers, amount of catalyst and
other additives (such as glycerin and water), as well as the reaction conditions used in the
foam preparation [52]. PU foams may be classified as rigid or flexible according to the
compressive strength value, cross link density, and OH value of the starting polyol [1].
Polyols having high molecular weight and low functionality yield flexible polyurethane
foams [53] whilst polyols with low molecular weight and high functionality give rigid
polyurethane foams [54].
1.2.3 Polyols
Polyols are a class of organic compounds with more than one hydroxyl functional
groups. They can be used as monomers for making polyurethanes. The properties of the
polyols such as hydroxyl value, molecular weight and functionality have important effects
on the polyurethane properties [1, 7, 55]. The hydroxyl value of the polyol represents the
reactive hydroxyl functionality in the molecule and is defined as the number of milligrams
of potassium hydroxide (KOH) required to neutralize one gram of acetylated chemicals
containing free hydroxyls [56].
1.2.4 Petroleum Polyols
Traditionally, polyurethane foams are prepared from petroleum derived polyols such
as polyether and polyester polyols [1, 56]. Polyether polyols are widely used for the

7
preparation of polyurethane foams and elastomers [1, 7]. Polyether polyols are obtained by
the polymerization of alkylene oxide initiated by different hydroxyl containing molecules
such as ethylene glycol, propylene glycol or other polyols [7]. Scheme 1.3 represents the
general structure of polyether polyols. The grafting of polymers on the polyether polyol
backbone results in polymer polyols that are widely used for flexible foam applications.
Polyester polyols are molecules with ester linkages used for the preparation of segmented
polyurethane thermoplastics with good mechanical properties [7]. Polyesters are
synthesized by the polycondensation reaction of a diacid, such as adipic or phthalic acid,
with a diol, such as ethylene glycol or propylene glycol [7]. Scheme 1.4 presents general
formula of a polyester polyol.
Scheme 1.3: General formula of polyalkylene oxide (polyether) polyol
Scheme 1.4: General formula of polyester polyol

8
1.2.5 Vegetable Oil Based Polyols
Vegetable oil based polyols are synthesized by the modification of vegetable oil TAGs
at their double bonds or ester linkages by the appropriate chemical reactions [2, 10, 57].
Vegetable oils consist of ~ 95 % triacylglycerols (TAG), which are the triesters of fatty
acids and glycerol.
Scheme 1.5: General structure of a triacylglycerol (TAG); R1, R2 and R3 are fatty
acids, and may or may not be the same.
Scheme 1.5 shows the general structure of a TAG. R1, R2 and R3 are aliphatic long
chain fatty acids usually containing 16-18 carbon atoms in their linear back bone. The fatty
acid profiles of TAGs are not unique; they vary from vegetable oil to vegetable oil. The
properties of vegetable oils, therefore, are highly dependent on their fatty acid composition.
The major saturated and unsaturated fatty acids present in vegetable oils are listed on the
Table 1.1, and the typical profiles of some of the more common vegetable oils are
presented in Table 1.2.

9
Table 1.1: Some common fatty acids in vegetable oils [8]. The first number in
brackets gives is the number of carbon atoms in the fatty acid chain and the second number
indicates the number of double bonds.
(C16:0)
(C16:1)
(C18:0)
(C18:1)
(C18:2)
(C18:3)
(C18:1 OH)
10
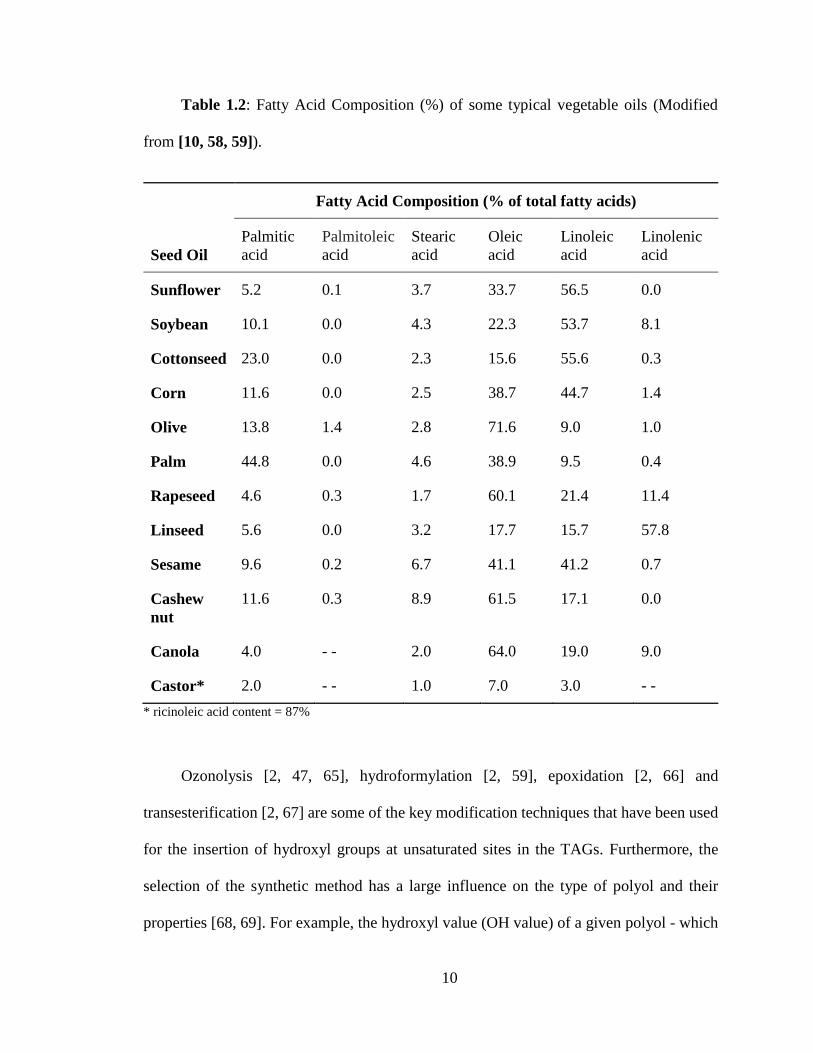
Table 1.2: Fatty Acid Composition (%) of some typical vegetable oils (Modified
from [10, 58, 59]).
Seed Oil
Fatty Acid Composition (% of total fatty acids)
Palmitic
acid
Palmitoleic
acid
Stearic
acid
Oleic
acid
Linoleic
acid
Linolenic
acid
Sunflower 5.2 0.1 3.7 33.7 56.5 0.0
Soybean 10.1 0.0 4.3 22.3 53.7 8.1
Cottonseed 23.0 0.0 2.3 15.6 55.6 0.3
Corn 11.6 0.0 2.5 38.7 44.7 1.4
Olive 13.8 1.4 2.8 71.6 9.0 1.0
Palm 44.8 0.0 4.6 38.9 9.5 0.4
Rapeseed 4.6 0.3 1.7 60.1 21.4 11.4
Linseed 5.6 0.0 3.2 17.7 15.7 57.8
Sesame 9.6 0.2 6.7 41.1 41.2 0.7
Cashew
nut
11.6 0.3 8.9 61.5 17.1 0.0
Canola 4.0 - - 2.0 64.0 19.0 9.0
Castor* 2.0 - - 1.0 7.0 3.0 - -
* ricinoleic acid content = 87%
Ozonolysis [2, 47, 65], hydroformylation [2, 59], epoxidation [2, 66] and
transesterification [2, 67] are some of the key modification techniques that have been used
for the insertion of hydroxyl groups at unsaturated sites in the TAGs. Furthermore, the
selection of the synthetic method has a large influence on the type of polyol and their
properties [68, 69]. For example, the hydroxyl value (OH value) of a given polyol - which
11
has huge impact on the physical properties of the resulting foam- varies with the different
modification techniques adopted for the synthesis of polyol [70].
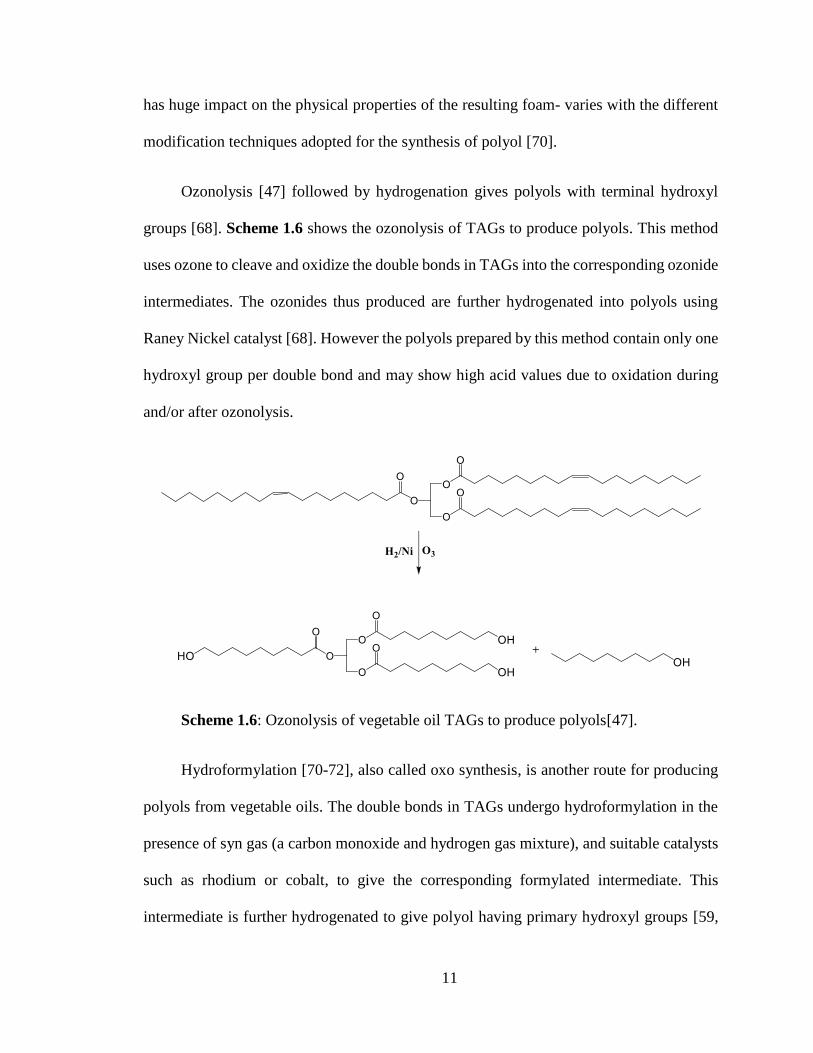
Ozonolysis [47] followed by hydrogenation gives polyols with terminal hydroxyl
groups [68]. Scheme 1.6 shows the ozonolysis of TAGs to produce polyols. This method
uses ozone to cleave and oxidize the double bonds in TAGs into the corresponding ozonide
intermediates. The ozonides thus produced are further hydrogenated into polyols using
Raney Nickel catalyst [68]. However the polyols prepared by this method contain only one
hydroxyl group per double bond and may show high acid values due to oxidation during
and/or after ozonolysis.
Scheme 1.6: Ozonolysis of vegetable oil TAGs to produce polyols[47].
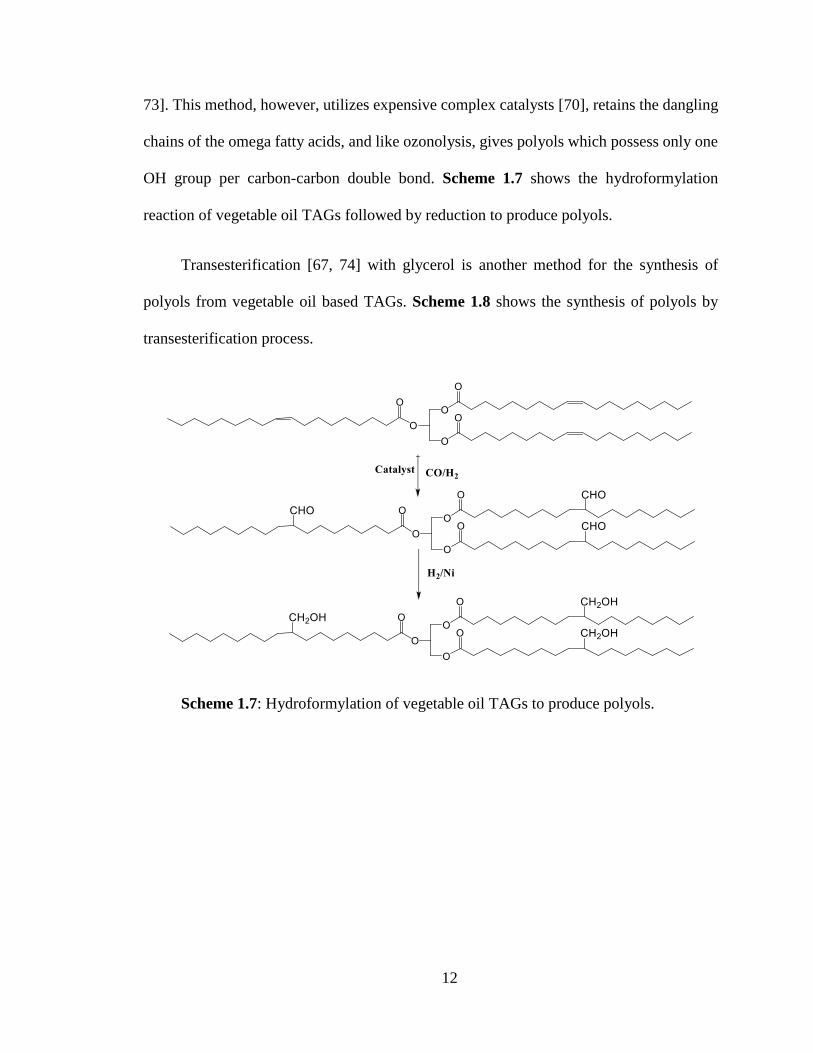
Hydroformylation [70-72], also called oxo synthesis, is another route for producing
polyols from vegetable oils. The double bonds in TAGs undergo hydroformylation in the
presence of syn gas (a carbon monoxide and hydrogen gas mixture), and suitable catalysts
such as rhodium or cobalt, to give the corresponding formylated intermediate. This
intermediate is further hydrogenated to give polyol having primary hydroxyl groups [59,
12
73]. This method, however, utilizes expensive complex catalysts [70], retains the dangling
chains of the omega fatty acids, and like ozonolysis, gives polyols which possess only one
OH group per carbon-carbon double bond. Scheme 1.7 shows the hydroformylation
reaction of vegetable oil TAGs followed by reduction to produce polyols.
Transesterification [67, 74] with glycerol is another method for the synthesis of
polyols from vegetable oil based TAGs. Scheme 1.8 shows the synthesis of polyols by
transesterification process.
Scheme 1.7: Hydroformylation of vegetable oil TAGs to produce polyols.

13
Scheme 1.8: Transesterification of vegetable oil TAGs using glycerol to produce polyols
Epoxidation [75, 76] of vegetable oils followed by ring opening is a well-established
route for the preparation of vegetable oil based polyols. Scheme 1.9 shows the epoxidation
of vegetable oil TAGs into the corresponding epoxide and its subsequent ring opening to
yield TAG derived polyols. In this method the double bonds are converted into oxirane
moieties by treating with peracetic or performic acid formed in situ by the reaction of
hydrogen peroxide (H2O2) and acetic acid or formic acid, respectively [75]. Epoxidation
followed by acid-catalyzed ring opening using reagents such as HClO4/water allows the
conversion of double bonds into two hydroxyl groups per double bond. This is not possible
by the synthesis of polyols by ozonolysis or hydroformylation methods. Also, the epoxide
groups can be opened using different nucleophilic reagents such as alcohols (R-OH),
hydrogen halides (R-X) and thiols (R-SH) to produce differently functionalized polyols
having variable OH values [77, 78].

14
Scheme 1.9. Epoxidation reaction of TAG to yield polyol
1.3 Factors Determining the Properties of PU Foams
1.3.1 Effect of Polyol Structure
The structure and functionality of polyols are very important factors which determine
the physical properties of polyurethane foam properties such as compressive strength,
thermal stability and glass transition temperature [70]. For example, the molecular weight,
hydroxyl value, position of hydroxyl groups and presence of dangling chains of polyols
have significant effects on the final properties of the polyurethanes derived from them [56,
59].
It was reported that the glass transition temperatures of the polyurethanes increased
to higher temperatures with increasing OH values and, therefore, cross-link density of the
polyol [79, 80]. This suggests that the rigidity of the polyurethane foams can be enhanced
by increasing the OH value of the polyols. Also, terminal or primary hydroxyl groups

15
present in the polyol structure display higher reactivity during polymerization reactions
and produce higher crosslinking polymer networks compared to polyols having only non-
terminal hydroxyl groups [81]. Polyols having terminal hydroxyls and, therefore, no
dangling chains, synthesized from cross metathesized triolein and canola oil, imparted
excellent mechanical properties such as higher tensile strength and modulus in
polyurethanes compared to soybean oil polyol which possessed dangling chains and only
internal hydroxyls [65, 82, 83]. The polyurethane prepared from terminal hydroxyl polyols
with no dangling chains behave as rigid plastics having glass transition temperature at 55
ºC [83]. In case of the preparation of rigid polyurethane foams, the addition of primary
hydroxyl cross linkers such as glycerine, starch etc. increases the rigidity of the material
with more uniform sized cells [52, 69]. Thus, the selection of the synthetic strategies is
highly important in order to achieve the necessary architecture in the polyol structure,
which imparts essential rigidity to the resulting polyurethanes produced.
1.3.2 Effect of Isocyanate
Like polyols, diisocyanates also contribute significantly to the crosslinking density
of PUs. Commercially available aromatic diisocyanates such as MDI (Diphenylmethane
diisocyanate) and TDI (Toluenediisocyanate), and aliphatic diisocyanates such as IPDI
(Isophorone diisocyanate) and HDI (Hexamethylene diisocyanate), are widely used in the
preparation of polyurethane foams [13]. Bio-based lipid diisocyanates synthesized from
lipids (oleic acid) have also been used for the preparation of polyurethane thermoplastics
with fairly good properties [84, 85].

16
MDI and TDI are the most common diisocyanates that are employed for the
preparation of rigid polyurethane foams. It has been shown that polyurethane foams
prepared with MDI possess compact and uniformly distributed cells with higher rigidity
compared to those prepared with TDI [81]. The high rigidity of MDI based polyurethanes
is due to its two aromatic rings and the high molecular weight compared with TDI [52, 81].
Also, the reaction rate with MDI is slower than with TDI [13, 86]. Thus, it allows sufficient
time for the formation of a stable three dimensional network that can withstand the pressure
of the blowing reaction without the breakage of the foam cells.
1.3.3 Effect of Catalyst
The catalysts used for the polyurethane foaming process play an important role in
balancing the blowing and gelling reaction in order to produce desired foams [1]. Without
the proper catalyst, competition of the gelling and the blowing reactions occur during
foaming, leading to the collapse of the cells in the foams [81].
Polyurethane foaming catalysts are generally amine compounds or organometallic
complexes [1, 7]. The catalyst concentration controls the rate of the two competing
reactions and by changing the ratio of the catalyst the resulting properties of the polymer
foams can be varied. The catalyst amounts should be balanced for the desired gel time,
cream time and tack-free time, and significantly affects the cell morphology and the density
of the foams [87]. N,N-dimethylbenzylamine (DMBNA) is one of the catalysts widely used
for the preparation of polyurethane foams. Tin II caprylate, which is an organo tin catalyst,
has been used for rigid polyurethane preparation [52]; increasing the amount of tin II

17
caprylate during polymerization enhanced the number of closed cells with decreased
gelation time.
Dibutyltindilaurate (DBTDL) and N, N-Dimethylethanolamine (DMEA) are the two
most common catalysts which are very cheap and widely used in polyurethane foam
preparation. DBTDL is a cross linking catalyst which favours the gelling reaction, and
DMEA is a co-catalyst which functions as a blowing catalyst during the polymerization
process [1, 7]. The appropriate ratios of DBTDL and DMEA is necessary, therefore, to
control the foaming process. In most cases both the catalyst and co-catalyst are fixed to the
same ratio. Narine et.al, for example, determined that a fixed ratio (1 part by weight) of
both DBTDL and DMEA was optimal for the preparation of rigid polyurethane foams of
fairly good compressive strength from terminal hydroxyl polyols [68].
1.3.4 Effect of Blowing Agent
Polyurethane foam production may be aided by the inclusion of a blowing agent in
the polymer formulation. The blowing agent promotes the release of a blowing gas which
is responsible for the formation of cell voids in the foam. The blowing agent may be a
physical blowing agent or a chemical blowing agent.
The physical blowing agent is a gas or liquid that does not chemically react with the
polyisocyanate composition [7]. A liquid physical blowing agent typically evaporates into
a gas when heated, and returns to a liquid when cooled. Such blowing agents are generally
inert or they have low reactivity and, therefore, it is likely that they will not decompose or
react during the polymerization reaction. The physical blowing agent typically reduces the
thermal conductivity of the polyurethane foam [1]. Examples of physical blowing agents

18
include carbon dioxide, nitrogen gas, acetone, and low-boiling hydrocarbons such as
cyclopentane, isopentane, n-pentane, and their mixtures. Note that the most typical physical
blowing agents have a zero ozone depletion potential; blowing agents such as
chlorofluorocarbons (CFCs), hydrofluorocarbons (HFCs), and hydrochlorofluorocarbons
(HCFCs) have been used in the past, but these were completely abandoned due to
environmental issues [1].
Chemical blowing agents refer to blowing agents which chemically react with the
polyisocyanates. Water is the commonly used chemical blowing agent for reaction with
polyisocyanates. Increased amount of water content in the polymerization mixture causes
expansion of the foam cells and the associated reduction in the thickness of the cell wall
[81]. It was observed that with a water content beyond six (6) parts percent by weight, for
example, the foaming reaction becomes too rapid and the corresponding foams exhibit poor
compressive properties [52], whilst a water content of two (2) parts percent by weight gives
optimal compressive strength properties for rigid foams [86].
1.3.5 Effect of Surfactant
Surfactants are added into the polymer formulation in order to reduce the interfacial
tension between the monomers and the aqueous phase [88]. The surfactant controls the size
of the foam cells and prevents the collapse of the cells [81]. Silicone based surfactants have
been found very effective in producing uniform sized foam cells by creating good air
permeability. Polyether-modified polysiloxane (TEGOSTAB B-8404) is one of the widely
used silicone surfactant in PU rigid foam formulations [68].

19
1.4 Problems of Vegetable oil Derived PU Foams
The unsaturated fatty acids present in vegetable oils possess internal double bonds.
Except when ozonolization is used, functionalization of internal double bonds to give
polyols retain the omega dangling chains which, upon polymerization, result in incomplete
crosslinking and imperfections in the polymer network [23, 89]. This, added to the non-
reactive saturated fatty acid already present in the vegetable oil, result in an elevated
dangling chain effect which further reduces the polymer rigidity. The regions where
dangling chains are present do not support stress when the sample is loaded, and act as
plasticizers to reduce polymer rigidity [24, 25]. In fact, the presence of dangling chains and
the position of the hydroxyl groups in the fatty acid chain along with the hydroxyl value
and molecular weight of the polyol have been cited as the most important structural features
which affect the properties of polyurethanes derived from vegetable oils [24, 25, 70, 90].
These issues are generally mitigated through the chemical transformation of the natural oil
into a more functional feedstock and judicious choice of methods for synthesizing the
polyols [89].
1.5 Rectification of Dangling Chain Issue
1.5.1 Olefin Metathesis
Olefin metathesis has been used commercially in the Philips Process for decades now
for the conversion of propylene into ethylene and butene [91]. It has been used in the Shell
Higher Olefin Process for the production of neohexene for the application of synthetic
masks [92, 93]. It has been used since 1972 on TAG oils and unsaturated fatty acid
derivatives to produce fine chemicals, substrates and materials, many of which serve as or
20
are potential petrochemical replacements [94, 95]. In fact, olefin metathesis holds
exceptional promise in oleochemistry for many industries which produce value added
monomers from vegetable oils [96-100]; it can be used to increase the molecular diversity
and reactivity of natural oils, and, therefore, their potential for transformation into
functional materials [101, 102].
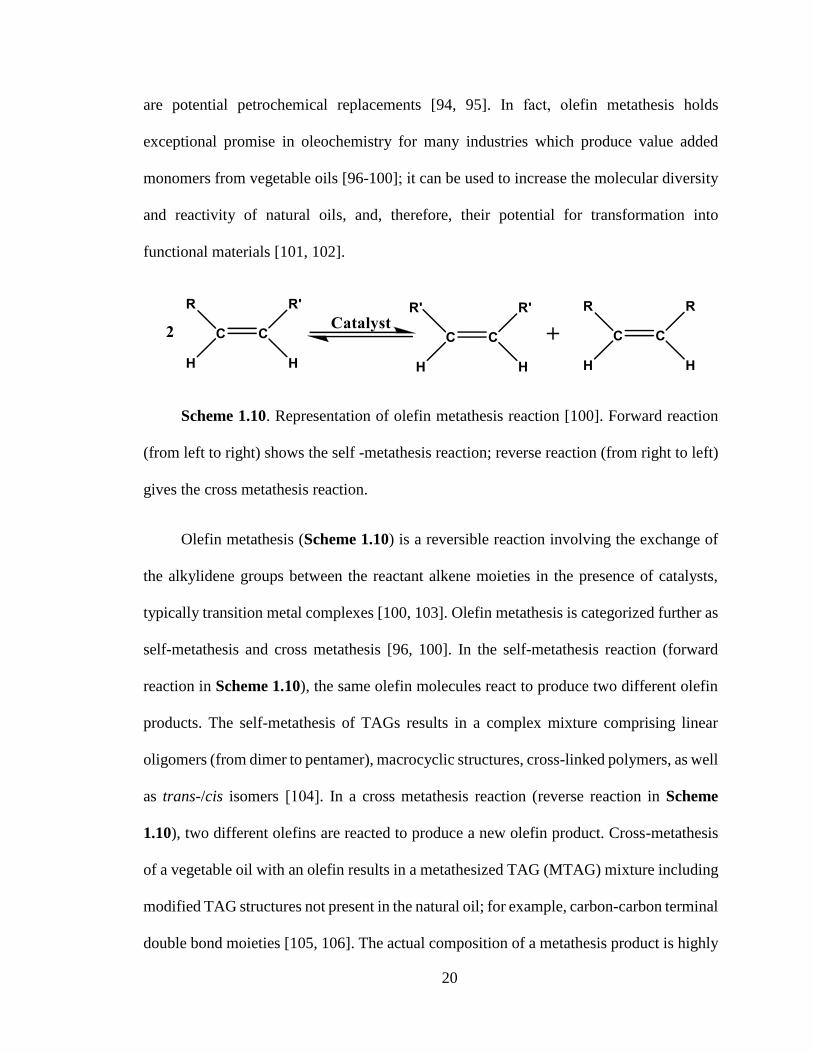
Scheme 1.10. Representation of olefin metathesis reaction [100]. Forward reaction
(from left to right) shows the self -metathesis reaction; reverse reaction (from right to left)
gives the cross metathesis reaction.
Olefin metathesis (Scheme 1.10) is a reversible reaction involving the exchange of
the alkylidene groups between the reactant alkene moieties in the presence of catalysts,
typically transition metal complexes [100, 103]. Olefin metathesis is categorized further as
self-metathesis and cross metathesis [96, 100]. In the self-metathesis reaction (forward
reaction in Scheme 1.10), the same olefin molecules react to produce two different olefin
products. The self-metathesis of TAGs results in a complex mixture comprising linear
oligomers (from dimer to pentamer), macrocyclic structures, cross-linked polymers, as well
as trans-/cis isomers [104]. In a cross metathesis reaction (reverse reaction in Scheme
1.10), two different olefins are reacted to produce a new olefin product. Cross-metathesis
of a vegetable oil with an olefin results in a metathesized TAG (MTAG) mixture including
modified TAG structures not present in the natural oil; for example, carbon-carbon terminal
double bond moieties [105, 106]. The actual composition of a metathesis product is highly

21
dependent on the reaction conditions, such as starting materials, temperature and type of
catalyst. Thus, the product composition of a given metathesis reaction can be controlled by
a judicious selection of the reaction conditions [107-109].
Cross-metathesis of TAG oils can be used to produce feedstock with increased
molecular diversity and reactivity suitable for the production of more functional polyols
and, therefore, polyurethanes, as has been demonstrated with triolein [89]. Cross-
metathesis, among other modifications, results in low molecular weight metathesized
products with terminal double bonds and shortened unsaturated fatty acid moieties [103,
110]. The resulting polyols, therefore, possess terminal hydroxyl groups, facilitating the
formation of polyurethane networks with significantly reduced dangling chains compared
to natural oil polyols [89].
Ethylene cross-metathesis is one of the cheapest and industrially viable techniques
for selective transformation of vegetable oils, but it still has problems related to low yield,
poor selectivity and low catalyst turnover due to complicated reaction pathways [99, 100].
For example, the cross-metathesis reaction of crude palm oil with ethylene produces
terminal alkene moieties such as 1-decene and 1-heptene, but in low yields [111]. Cross-
metathesis with 2-butene, on the other hand, gives high conversions and catalyst turnovers
[112, 113]. However, cross-metathesis with the internally unsaturated 2-butene does not
give TAG products with terminal carbon-carbon double bonds.
Alternately, cross-metathesis with 1-butene will result in a mixture of terminal
double bonds and fatty acid moieties with shortened dangling chains (C3) in high yields.
In fact, Elevence Renewable Science (ERS) presently uses a protected 1-butene metathesis

22
reaction of vegetable oil TAGs to produce 1-decene and 3,4-dodecene [42], whereby the
metathesized vegetable oil is a by-product of the biorefinery. This by-product is, therefore,
a suitable starting material for the production of bio-based polyols with terminal hydroxyl
groups and reduced dangling chain content for use in polyurethane foam production. No
such work has been reported so far regarding the study of structure and composition of 1-
butene cross metathesized palm oil (PMTAG) and its application for polyols and
polyurethane foams.
1.5.2 Fractionation by Crystallization
Since the 1-butene cross-metathesis reaction only modifies the unsaturated fatty
acids present in palm oil, the composition of the saturated fatty acids remain unaffected.
The non-reactive saturated fatty acids present in the 1-butene metathesized palm oil,
however, sterically hinder and lessen the reactivity of the unsaturated fatty acids present in
it. The dangling chain action and the steric hindrance of the saturated stearin fraction can
be a problem, therefore, in the commercialization of 1-butene metathesized palm oil for the
preparation of polyol for the polyurethane industry.
In multicomponent systems, the difference in the solubility and solidification of the
different components can be exploited for their separation by fractional crystallization [27].
This approach is widely used by the oleochemical industries for the fractionation of edible
oils for food and other advanced applications [114]. It is employed to separate the high-
and low- melting components of edible oils based on their crystallization temperatures
[115], which depend on their molecular weight and the degree of the unsaturation. The
separated fractions display unique chemical and physical properties.

23
Fractionation by crystallization can be further subdivided into dry (neat
fractionation) and solvent assisted fractionation (fractionation procedure using solvent)
[116]. Solvent assisted fractionation is highly dependent on the solubility of the
components in the selected solvent. Solvent assisted crystallization of oils is a fast process
and gives good yield while the dry fractionation may require multiple steps for the
completion.
A large body of literature already exists on the successful fractionation of palm oil
to into its high melting (stearin) and low melting (olein) fractions for various food and
industrial feedstock applications[117-119]. Fractionation by crystallization is, therefore, an
established means of reducing the saturated content in the 1-butene metathesized palm oil
so as to produce a highly reactive feedstock for polyurethane production.
1.6 Hypotheses
The purpose of this study was to convert PMTAG into a useful material for the
preparation of the rigid and flexible PU foams and to contribute to the fundamental
understanding necessary to address the dangling chain issues of TAGs comprised of omega
unsaturated fatty acids. It is expected that the reduction of the dangling chain limitations
of palm oil by 1-butene cross metathesis, and the removal of the highly saturated stearin
fraction by fractional crystallization will, together, allow for the use of palm oil in rigid
polymer applications. The same approach can also be applied to other vegetable oils rich
in omega unsaturated fatty acids and saturated fatty acids such as canola and soybean oils,
allowing for the preparation of viable bio-based alternatives to petroleum based
polyurethanes. The following hypotheses were investigated in this work:

24
Hypothesis 1: The terminal hydroxyl PMTAG polyols will produce more rigid
polyurethane foams compared to those obtained from palm oil, soybean oil and canola oil.
In order to address Hypothesis 1, the following objectives were identified:
Establish the structure, chemical composition and physical properties of 1-butene cross
metathesized palm oil (PMTAG)
Synthesize terminal hydroxyl polyols of maximum OH value from PMTAG by
epoxidation followed by hydroxylation procedure.
Establish the structure, chemical composition and physical properties of PMTAG
polyol.
Prepare rigid foams from PMTAG polyols and test their physical properties and
compare with palm oil, soybean oil and canola oil derived foams from literature.
Hypothesis 2: Flexible foams can be prepared from PMTAG polyol by suitable alteration
in the formulation recipe of the rigid foams.
In order to address Hypothesis 2, the following objectives were identified:
Prepare PU foams from the PMTAG polyol using low catalyst ratio and no glycerine
cross linker and test their recovery and compressive strength to check its suitability for
flexible foam applications.
Hypothesis 3: Fractionation of PMTAG by dry and solvent assisted crystallization will
remove the highly saturated stearin fraction (solid fraction) of PMTAG, leaving behind a
highly reactive olein fraction (liquid fraction). Polyols derived from the olein fraction of

25
PMTAG will possess higher OH values compared to the PMTAG polyol and will make
highly rigid foams compared to rigid PMTAG polyol foams.
In order to address Hypothesis 3, the following objectives were identified:
Fractionate PMTAG using dry and solvent mediated crystallization to separate olein
rich and stearin rich fractions.
Synthesize polyols from different fractions of PMTAG.
Prepare rigid foams from liquid/olein fraction of PMTAG and test their compressive
properties, and compare with PMTAG polyol rigid foams.
Hypothesis 4: Flexible foams can be prepared from olein fraction (liquid fraction) of
PMTAG by varying the formulation recipe.
In order to address Hypothesis 4, the following objectives were identified:
Prepare PU foams from the liquid fraction PMTAG polyol using low catalyst ratio and
no glycerine cross linker and test their recovery and compressive strength to check its
suitability for flexible foam applications.
Hypothesis 5: Green PMTAG polyols can be prepared by solvent free epoxidation
followed by hydroxylation of PMTAG, and their OH values can be controlled by tuning
the degree of epoxidation based on the reaction conditions. The rigidity of the Green
PMTAG polyol foams will increase with increasing OH value and terminal hydroxyls in
the polyol.
In order to address Hypothesis 5, the following objectives were identified:

26
Synthesize polyols from PMTAG using solvent free pathway of epoxidation and
hydroxylation reaction.
Control the reaction parameters of epoxidation process to produce polyols with
controlled hydroxyl values
Prepare flexible foams from Green PMTAG polyols using low catalyst ratio and no
glycerine cross linker and test their recovery and compressive strength with flexible
PMTAG polyol foams.
Prepare rigid foams from Green PMTAG Polyol and compare the rigidity with rigid
PMTAG polyol foam.
1.7 Thesis Outline
The rest of this thesis is organized into six (6) chapters. Chapter 2 will describe the
structure, chemical composition and physical properties of PMTAG and PMTAG polyol.
Chapter 3 will describe the preparation and physical characterization of rigid and flexible
polyurethane foams prepared from PMTAG polyol (i.e., Hypotheses 1 and 2). Chapter 4
will address the use of dry and solvent mediated fractionation of PMTAG for the effective
removal of the highly saturated stearin fraction and the preparation of polyols and
polyurethane foams from the fractionated PMTAG (i.e., Hypotheses 3 and 4). Chapter 5
will report on the preparation of green polyols with controlled OH values and their
corresponding rigid and flexible foams (i.e., Hypothesis 5). Finally, Chapter 6 will give
the conclusion and implications of this work.
27
1.8 References
[1] Szycher M. Szycher's handbook of polyurethanes: CRC press, 1999.
[2] Gama NV, Soares B, Freire CS, Silva R, Neto CP, Barros-Timmons A, et al. Bio-based
polyurethane foams toward applications beyond thermal insulation. Materials & Design.
2015;76:77-85.
[3] Babb DA. Polyurethanes from Renewable Resources. In: Rieger B, Kunkel A, Coates
GW, Reichardt R, Dinjus E, Zevaco TA, editors. Synthetic Biodegradable Polymers2012.
p. 315-60.
[4] David J, Vojtová L, Bednařík K, Kučerík J, Vávrová M, Jančář J. Development of novel
environmental friendly polyurethane foams. Environmental Chemistry Letters.
2010;8(4):381-5.
[5]Firm MRCaC. Polymer Foam Market By Types (Polyurethane, Polystyrene, Polyvinyl
Chloride, Polyolefin, Phenolic, Melamine and Others), Applications (Packaging, Building
& Construction, Furniture & Bedding, Automotive, Wind Energy and Others) &
Geography - Global Trends & Forecasts to 2018. marketsandmarkets. 2013;CH 1465.
[6] Firm MRCaC. Polyurethane Foam Market by Type (Flexible Foam, Rigid Foam), by
End-User Industry (Bedding & Furniture, Building & Construction, Electronics,
Automotive, Footwear, Packaging, Others), by Geography - Global Trends & Forecasts to
2020.marketsandmarkets.2015(http://www.marketsandmarkets.com/PressReleases/polyur
ethane-foams.asp.).
28
[7] Ashida K. Polyurethane and related foams: chemistry and technology: CRC press,
2006.
[8] Desroches M, Escouvois M, Auvergne R, Caillol S, Boutevin B. From vegetable oils
to polyurethanes: synthetic routes to polyols and main industrial products. Polymer
Review. 2012;52(1):38-79.
[9] Zhang C, Madbouly SA, Kessler MR. Biobased polyurethanes prepared from different
vegetable oils. ACS applied materials & interfaces. 2015;7(2):1226-33.
[10] Lligadas G, Ronda JC, Galia M, Cádiz V. Plant oils as platform chemicals for
polyurethane synthesis: current state-of-the-art. Biomacromolecules. 2010;11(11):2825-
35.
[11] Samarth NB, Mahanwar PA. Modified Vegetable Oil Based Additives as a Future
Polymeric Material—Review. Open Journal of Organic Polymer Materials. 2015;5(01):1.
[12] Zhang L, Jeon HK, Malsam J, Herrington R, Macosko CW. Substituting soybean oil-
based polyol into polyurethane flexible foams. Polymer. 2007;48(22):6656-67.
[13] Tan S, Abraham T, Ference D, Macosko CW. Rigid polyurethane foams from a
soybean oil-based polyol. Polymer. 2011;52(13):2840-6.
[14] Ji D, Fang Z, He W, Luo Z, Jiang X, Wang T, et al. Polyurethane rigid foams formed
from different soy-based polyols by the ring opening of epoxidised soybean oil with
methanol, phenol, and cyclohexanol. Industrial Crops and Products. 2015;74:76-82.

29
[15] Ji D, Fang Z, He W, Zhang K, Luo Z, Wang T, et al. Synthesis of soy-polyols using a
continuous micro-flow system and preparation of soy-based polyurethane rigid foams.
ACS Sustainable Chemistry & Engineering. 2015.
[16] Zhang L, Zhang M, Hu L, Zhou Y. Synthesis of rigid polyurethane foams with castor
oil-based flame retardant polyols. Industrial Crops and Products. 2014;52:380-8.
[17] Khoe TH, Otey FH, Frankel EN. Rigid urethane foams from hydroxymethylated
linseed oil and polyol esters. Journal of the American Oil Chemists' Society.
1972;49(11):615-8.
[18] Calvo-Correas T, Mosiewicki MA, Corcuera MA, Eceiza A, Aranguren MI. Linseed
Oil-Based Polyurethane Rigid Foams: Synthesis and Characterization. Journal of
Renewable Materials. 2015;3(1):3-13.
[19] Hu YH, Gao Y, Wang DN, Hu CP, Zu S, Vanoverloop L, et al. Rigid polyurethane
foam prepared from a rape seed oil based polyol. Journal of Applied Polymer Science.
2002;84(3):591-7.
[20] Mosiewicki MA, Rojek P, Michałowski S, Aranguren MI, Prociak A. Rapeseed oil‐
based polyurethane foams modified with glycerol and cellulose micro/nanocrystals.
Journal of Applied Polymer Science. 2015;132(10).
[21] Michałowski S, Prociak A. Flexible Polyurethane Foams Modified with New Bio-
Polyol Based on Rapeseed Oil. Journal of Renewable Materials. 2015;3(1):14-8.

30
[22] Babb DA. Polyurethanes from renewable resources. Synthetic Biodegradable
Polymers: Springer; 2012. p. 315-60.
[23] Narine SS, Kong X, Bouzidi L, Sporns P. Physical properties of polyurethanes
produced from polyols from seed oils: II. Foams. Journal of the American Oil Chemists'
Society. 2007;84(1):65-72.
[24] Narine SS, Yue J, Kong X. Production of polyols from canola oil and their chemical
identification and physical properties. Journal of the American Oil Chemists' Society.
2007;84(2):173-9.
[25] Zlatanic A, Petrovic ZS, Dusek K. Structure and properties of triolein-based
polyurethane networks. Biomacromolecules. 2002;3(5):1048-56.
[26] Nagendran B, Unnithan U, Choo Y, Sundram K. Characteristics of red palm oil, a
carotene-and vitamin E–rich refined oil for food uses. Food & Nutrition Bulletin.
2000;21(2):189-94.
[27] Gunstone F. Vegetable oils in food technology: composition, properties and uses: John
Wiley & Sons, 2011.
[28] Lida H, Sundram K, Siew WL, Aminah A, Mamot S. TAG composition and solid fat
content of palm oil, sunflower oil, and palm kernel olein blends before and after chemical
interesterification. Journal of the American Oil Chemists’ Society. 2002;79(11):1137-44.
[29] Edem D. Palm oil: Biochemical, physiological, nutritional, hematological and
toxicological aspects: A review. Plant Foods for Human Nutrition. 2002;57(3-4):319-41.

31
[30] Santosa SJ. Palm oil boom in Indonesia: from plantation to downstream products and
biodiesel. CLEAN–Soil, Air, Water. 2008;36(5‐6):453-65.
[31] Ong A, Goh S. Palm oil: a healthful and cost-effective dietary component. Food &
Nutrition Bulletin. 2002;23(1):11-22.
[32] Tanaka R, Hirose S, Hatakeyama H. Preparation and characterization of polyurethane
foams using a palm oil-based polyol. Bioresource Technology. 2008;99(9):3810-6.
[33] Ogoshi T, Miyawaki Y. Soap and related products: Palm and lauric oil. Journal of the
American Oil Chemists’ Society. 1985;62(2):331-5.
[34] Chang T-S, Yunus R, Rashid U, Choong TS, Awang Biak DR, Syam AM. Palm Oil
Derived Trimethylolpropane Triesters Synthetic Lubricants and Usage in Industrial
Metalworking Fluid. Journal of oleo science. 2015(0).
[35] Shomchoam B, Yoosuk B. Eco-friendly lubricant by partial hydrogenation of palm oil
over Pd/γ-Al 2 O 3 catalyst. Industrial Crops and Products. 2014;62:395-9.
[36] Abu-Hamdeh NH, Alnefaie KA. A comparative study of almond and palm oils as two
bio-diesel fuels for diesel engine in terms of emissions and performance. Fuel.
2015;150:318-24.
[37] Tulathammakit H, Kitiyanan B. Synthesis of Methyl Ester Sulphonate Surfactant from
Palm Oil Methyl Ester by Using UV or Ozone as an Initiator. CHEMICAL
ENGINEERING. 2014;39.

32
[38] Chuayjuljit S, Sangpakdee T, Saravari O. Processing and properties of palm oil-based
rigid polyurethane foam. Journal of The Minerals, Metals & Materials Society. 2007;17:7-
23.
[39] Lee C, Ooi T, Chuah C, Ahmad S. Rigid polyurethane foam production from palm
oil-based epoxidized diethanolamides. Journal of the American Oil Chemists’ Society.
2007;84(12):1161-7.
[40] Pawlik H, Prociak A. Influence of palm oil-based polyol on the properties of flexible
polyurethane foams. Journal of Polymers and the Environment. 2012;20(2):438-45.
[41] Grubbs RH, O'Leary DJ. Handbook of metathesis: Applications in organic synthesis:
John Wiley & Sons, 2015.
[42] Schrodi Y, Pederson RL, Kaido H, Tupy MJ. Synthesis of terminal alkenes from
internal alkenes via olefin metathesis. Google Patents; 2013.
[43] Guan J, Song Y, Lin Y, Yin X, Zuo M, Zhao Y, et al. Progress in study of non-
isocyanate polyurethane. Industrial & Engineering Chemistry Research.
2011;50(11):6517-27.
[44] More AS, Gadenne B, Alfos C, Cramail H. AB type polyaddition route to
thermoplastic polyurethanes from fatty acid derivatives. Polymer Chemistry.
2012;3(6):1594-605.
[45] Oertel G. Polyurethane Handbook,(1993), Hanser. Gardner Publications, Inc.,
Cincinnati, OH.

33
[46] Narine SS, Kong X, Bouzidi L, Sporns P. Physical properties of polyurethanes
produced from polyols from seed oils: I. Elastomers. Journal of the American Oil
Chemists’ Society. 2007;84(1):55-63.
[47] Kong X, Narine SS. Physical properties of polyurethane plastic sheets produced from
polyols from canola oil. Biomacromolecules. 2007;8(7):2203-9.
[48] Somani KP, Kansara SS, Patel NK, Rakshit AK. Castor oil based polyurethane
adhesives for wood-to-wood bonding. International Journal of Adhesion and Adhesives.
2003;23(4):269-75.
[49] Velayutham TS, Majid WHA, Ahmad AB, Kang GY, Gan SN. Synthesis and
characterization of polyurethane coatings derived from polyols synthesized with glycerol,
phthalic anhydride and oleic acid. Progress in Organic Coatings. 2009;66(4):367-71.
[50] Bernal MM, Lopez-Manchado MA, Verdejo R. In situ Foaming Evolution of Flexible
Polyurethane Foam Nanocomposites. Macromolecular Chemistry and Physics.
2011;212(9):971-9.
[51] Harikrishnan G, Khakhar DV. Effect of monomer temperature on foaming and
properties of flexible polyurethane foams. Journal of Applied Polymer Science.
2007;105(6):3439-43.
[52] John J, Bhattacharya M, Turner RB. Characterization of polyurethane foams from
soybean oil. Journal of Applied Polymer Science. 2002;86(12):3097-107.
34
[53] Ugarte L, Saralegi A, Fernández R, Martín L, Corcuera M, Eceiza A. Flexible
polyurethane foams based on 100% renewably sourced polyols. Industrial Crops and
Products. 2014;62:545-51.
[54] Piszczyk Ł, Strankowski M, Danowska M, Hejna A, Haponiuk JT. Rigid polyurethane
foams from a polyglycerol-based polyol. European Polymer Journal. 2014;57:143-50.
[55] Malewska E, Bąk S, Prociak A. Effect of different concentration of rapeseed‐oil‐based
polyol and water on structure and mechanical properties of flexible polyurethane foams.
Journal of Applied Polymer Science. 2015;132(35).
[56] Ionescu M. Chemistry and technology of polyols for polyurethanes: iSmithers Rapra
Publishing, 2005.
[57] Gunstone F. The chemistry of oils and fats: sources, composition, properties and uses:
John Wiley & Sons, 2009.
[58] Kamal-Eldin A, Andersson R. A multivariate study of the correlation between
tocopherol content and fatty acid composition in vegetable oils. Journal of the American
Oil Chemists’ Society. 1997;74(4):375-80.
[59] Petrovic ZS, Guo A, Javni I, Cvetkovic I, Hong DP. Polyurethane networks from
polyols obtained by hydroformylation of soybean oil. Polymer International.
2008;57(2):275-81.

35
[60] Biermann U, Friedt W, Lang S, Lühs W, Machmüller G, Metzger JO, et al. New
syntheses with oils and fats as renewable raw materials for the chemical industry.
Angewandte Chemie International Edition. 2000;39(13):2206-24.
[61] Veronese VB, Menger RK, Forte MMdC, Petzhold CL. Rigid polyurethane foam
based on modified vegetable oil. Journal of Applied Polymer Science. 2011;120(1):530-7.
[62] Narine SS, Yue J, Kong XH. Production of polyols from canola oil and their chemical
identification and physical properties. Journal of the American Oil Chemists’ Society.
2007;84(2):173-9.
[63] Barrett L, Sperling L, Murphy C. Naturally functionalized triglyceride oils in
interpenetrating polymer networks. Journal of the American Oil Chemists’ Society.
1993;70(5):523-34.
[64] Guner FS, Yagci Y, Erciyes AT. Polymers from triglyceride oils. Progress in Polymer
Science. 2006;31(7):633-70.
[65] Petrović ZS, Zhang W, Javni I. Structure and Properties of Polyurethanes Prepared
from Triglyceride Polyols by Ozonolysis. Biomacromolecules. 2005;6(2):713-9.
[66] Wan Nik W, Ani FN, Masjuki H. Thermal stability evaluation of palm oil as energy
transport media. Energy Conversion and Management. 2005;46(13):2198-215.
[67] Arniza M, Hoong S, Idris Z, Yeong S, Hassan H, Din A, et al. Synthesis of
Transesterified Palm Olein-Based Polyol and Rigid Polyurethanes from this Polyol.
Journal of the American Oil Chemists’ Society. 2015;92(2):243-55.

36
[68] Narine S, Kong X, Bouzidi L, Sporns P. Physical Properties of Polyurethanes
Produced from Polyols from Seed Oils: II. Foams. Journal of the American Oil Chemists’
Society. 2007;84(1):65-72.
[69] Guo A, Zhang W, Petrovic ZS. Structure-property relationships in polyurethanes
derived from soybean oil. Journal of Materials Science. 2006;41(15):4914-20.
[70] Guo A, Demydov D, Zhang W, Petrovic ZS. Polyols and Polyurethanes from
Hydroformylation of Soybean Oil. Journal of Polymers and the Environment.
2002;10(1):49-52.
[71] Kandanarachchi P, Guo A, Petrovic Z. The hydroformylation of vegetable oils and
model compounds by ligand modified rhodium catalysis. Journal of Molecular Catalysis
A: Chemical. 2002;184(1–2):65-71.
[72] Petrovic ZS. Polyurethanes from vegetable oils. Polymer Review. 2008;48(1):109-55.
[73] Khoe T, Otey F, Frankel E. Rigid urethane foams from hydroxymethylated linseed oil
and polyol esters. Journal of the American Oil Chemists’ Society. 1972;49(11):615-8.
[74] Zlatanić A, Javni I, Ionescu M, Bilić N, Petrović ZS. Polyurethane molded foams with
high content of hyperbranched polyols from soybean oil. Journal of Cellular Plastics.
2014:0021955X14537660.
[75] Tan SG, Chow WS. Biobased Epoxidized Vegetable Oils and Its Greener Epoxy
Blends: A Review. Polymer-Plastics Technology and Engineering. 2010;49(15):1581-90.

37
[76] Chen R, Zhang C, Kessler MR. Polyols and polyurethanes prepared from epoxidized
soybean oil ring‐opened by polyhydroxy fatty acids with varying OH numbers. Journal of
Applied Polymer Science. 2015;132(1).
[77] Adhvaryu A, Liu Z, Erhan S. Synthesis of novel alkoxylated triacylglycerols and their
lubricant base oil properties. Industrial Crops and Products. 2005;21(1):113-9.
[78] Pawlik H, Prociak A, Pielichowski J. Synteza polioli z oleju palmowego
przeznaczonych do otrzymywania elastycznych pianek poliuretanowych. Czasopismo
Techniczne Chemia. 2009;106:111-7.
[79] Wang C-S, Yang L-T, Ni B-L, Shi G. Polyurethane networks from different soy-based
polyols by the ring opening of epoxidized soybean oil with methanol, glycol, and 1,2-
propanediol. Journal of Applied Polymer Science. 2009;114(1):125-31.
[80] Pechar TW, Sohn S, Wilkes GL, Ghosh S, Frazier CE, Fornof A, et al.
Characterization and comparison of polyurethane networks prepared using soybean-based
polyols with varying hydroxyl content and their blends with petroleum-based polyols.
Journal of Applied Polymer Science. 2006;101(3):1432-43.
[81] Campanella A, Bonnaillie LM, Wool RP. Polyurethane Foams from Soyoil-Based
Polyols. Journal of Applied Polymer Science. 2009;112(4):2567-78.
[82] Dumont MJ, Narine SS. Physical Properties of New Polyurethanes Foams from
Benzene Polyols Synthesized from Erucic Acid. Journal of Applied Polymer Science.
2010;118(6):3211-7.

38
[83] Petrovic ZS, Zhang W, Javni I. Structure and properties of polyurethanes prepared
from triglyceride polyols by ozonolysis. Biomacromolecules. 2005;6(2):713-9.
[84] Hojabri L, Kong XH, Narine SS. Novel Long Chain Unsaturated Diisocyanate from
Fatty Acid: Synthesis, Characterization, and Application in Bio-Based Polyurethane.
Journal of Polymer Science Part a-Polymer Chemistry. 2010;48(15):3302-10.
[85] Hojabri L, Kong XH, Narine SS. Fatty Acid-Derived Dilsocyanate and Biobased
Polyurethane Produced from Vegetable Oil: Synthesis, Polymerization, and
Characterization. Biomacromolecules. 2009;10(4):884-91.
[86] Guo A, Javni I, Petrovic Z. Rigid polyurethane foams based on soybean oil. Journal
of Applied Polymer Science. 2000;77(2):467-73.
[87] Choe KH, Lee DS, Seo WJ, Kim WN. Properties of rigid polyurethane foams with
blowing agents and catalysts. Polymer journal. 2004;36(5):368-73.
[88] Zhang XD, Macosko CW, Davis HT, Nikolov AD, Wasan DT. Role of silicone
surfactant in flexible polyurethane foam. Journal of Colloid and Interface Science.
1999;215(2):270-9.
[89] Zlatanić A, Petrović ZS, Dušek K. Structure and Properties of Triolein-Based
Polyurethane Networks. Biomacromolecules. 2002;3(5):1048-56.
[90] BUDINSKI-SIMENDIC J, SPIRKOVA M, PAVLICEVIC J, SOMVARSKY J,
MESZAROS SZECSENYI K, DUSEK K. Structure and Properties of Dangling Chain Poly
(urethane-isocyanurate) Model Network. Conference Structure and Properties of Dangling

39
Chain Poly (urethane-isocyanurate) Model Network, vol. 1061. Oxford University Press,
p. 149-66.
[91] Mol J. Industrial applications of olefin metathesis. Journal of Molecular Catalysis A:
Chemical. 2004;213(1):39-45.
[92] Keim W. Oligomerization of Ethylene to α‐Olefins: Discovery and Development of
the Shell Higher Olefin Process (SHOP). Angewandte Chemie International Edition.
2013;52(48):12492-6.
[93] Lutz E. Shell higher olefins process. Journal of Chemical Education. 1986;63(3):202.
[94] Van Dam P, Mittelmeijer M, Boelhouwer C. Metathesis of unsaturated fatty acid esters
by a homogeneous tungsten hexachloride–tetramethyltin catalyst. Journal of the Chemical
Society, Chemical Communications. 1972(22):1221-2.
[95] Nickel A, Ung T, Mkrtumyan G, Uy J, Lee C, Stoianova D, et al. A Highly Efficient
Olefin Metathesis Process for the Synthesis of Terminal Alkenes from Fatty Acid Esters.
Top Catal. 2012;55(7-10):518-23.
[96] Mol JC, Buffon R. Metathesis in oleochemistry. Journal of the Brazilian Chemical
Society. 1998;9(1):1-11.
[97] Patel J, Elaridi J, Jackson WR, Robinson AJ, Serelis AK, Such C. Cross-metathesis of
unsaturated natural oils with 2-butene. High conversion and productive catalyst turnovers.
Chemical Communications. 2005(44):5546-7.
40
[98] Rybak A, Fokou PA, Meier MAR. Metathesis as a versatile tool in oleochemistry.
European Journal of Lipid Science and Technology. 2008;110(9):797-804.
[99] Thomas RM, Keitz BK, Champagne TM, Grubbs RH. Highly selective ruthenium
metathesis catalysts for ethenolysis. Journal of the American Chemical Society.
2011;133(19):7490-6.
[100] Malacea R, Dixneuf PH. Alkene Metathesis and Renewable Materials: Selective
Transformations of Plant Oils. Green Metathesis Chemistry: Springer; 2010. p. 185-206.
[101] Peng G. Novel biosurfactants by ring-opening cross-metathesis. European Journal of
Lipid Science and Technology. 2015;117:217-28.
[102] Chikkali S, Mecking S. Refining of plant oils to chemicals by olefin metathesis.
Angewandte Chemie International Edition. 2012;51(24):5802-8.
[103] Connon SJ, Blechert S. Recent developments in olefin cross‐metathesis. Angewandte
Chemie International Edition. 2003;42(17):1900-23.
[104] Refvik M, Larock R. The chemistry of metathesized soybean oil. Journal of Applied
Polymer Science. 1999;76(1):99-102.
[105] Zlatanic A, Petrovic ZS, Dušek K. Structure and properties of triolein-based
polyurethane networks. Biomacromolecules. 2002;3(5):1048-56.
[106] Rosenburg DW. To produce reduced chain length esters and alpha-olefins. Google
Patents; 1985.

41
[107] Li SJ, Hojabri L, Narine SS. Controlling Product Composition of Metathesized
Triolein by Reaction Concentrations. Journal of Applied Polymer Science
2012;89(11):2077-89.
[108] Tian QP, Larock RC. Model studies and the ADMET polymerization of soybean oil.
Journal of Applied Polymer Science. 2002;79(5):479-88.
[109] Biermann U, Metzger JO, Meier MAR. Acyclic Triene Metathesis Oligo- and
Polymerization of High Oleic Sun Flower Oil. Macromolecular Chemistry and Physics.
2010;211(8):854-62.
[110] Mol J. Catalytic metathesis of unsaturated fatty acid esters and oils. Top Catal.
2004;27(1-4):97-104.
[111] Ahmad F, Hamdan S, Yarmo M, Alimunir A. Co-metathesis reaction of crude palm
oil and ethene. Journal of the American Oil Chemists’ Society. 1995;72(6):757-8.
[112] Patel J, Mujcinovic S, Jackson WR, Robinson AJ, Serelis AK, Such C. High
conversion and productive catalyst turnovers in cross-metathesis reactions of natural oils
with 2-butene. Green Chemistry. 2006;8(5):450-4.
[113] RoyáJackson W. Cross-metathesis of unsaturated natural oils with 2-butene. High
conversion and productive catalyst turnovers. Chemical communications. 2005(44):5546-
7.
[114] Hamm W. Trends in edible oil fractionation. Trends in Food Science & Technology.
1995;6(4):121-6.

42
[115] Gibon V. Palm oil and palm kernel oil refining and fractionation technology. Palm
oil: production, processing, characterization, and uses AOCS Press, Urbana. 2012:329-76.
[116] Kellens M, Gibon V, Hendrix M, De Greyt W. Palm oil fractionation. European
Journal of Lipid Science and Technology. 2007;109(4):336-49.
[117] Koay GF, Chuah T-G, Choong TS. Economic feasibility assessment of one and two
stages dry fractionation of palm kernel oil. Industrial Crops and Products. 2013;49:437-44.
[118] Deffense E. Fractionation of palm oil. Journal of the American Oil Chemists’
Society. 1985;62(2):376-85.
[119] Hasmadi M, AINI I, Mamot S, Yusof M. The effect of different types of stirrer and
fractionation temperatures during fractionation on the yield, characteristics and quality of
oleins. Journal of Food Lipids. 2002;9(4):295-307.

43
2 1-Butene Metathesized Palm Oil & Polyol Derivatives:
Structure, Chemical Composition and Physical Properties
2.1 Introduction
Growing concerns surrounding sustainability, biodegradability, control of CO2
emission and other environmental problems are driving a strong demand for alternatives to
petroleum as a feedstock for fuels and materials. Vegetable oils are advantageous in this
regard because of their availability in large quantities, renewability and relative low cost
[1]. Furthermore, their triacylglycerol (TAG) structure is attractive for the chemical
industry as it offers ready sites, such as the double bond and the ester, for chemical
transformation [2]. There currently exists an important oleochemical industry that uses a
large array of standard as well as novel chemical reactions on TAG oils to make a variety
of fine chemicals and materials such as fuels, polymers, lubricants, waxes and cosmetics
[3-5].
The development of polyurethanes from renewable and environment-friendly
feedstock is of particular importance as the market is very large and growing due to high
demand across industries such as automotive, building and construction, and packaging.
The worth of the global polymer foams market was $82.6 billion in 2012 and is estimated
to reach $131.1 billion by 2018 [6]. A relatively large body of literature reporting on the
synthesis of polyols and polyurethanes from natural oils is available (see for example PU
foams from soybean oil [7, 8], safflower oil, corn oil, sunflower seed oil, linseed oil [9],
rapeseed oil [10], palm oil [11], cotton seed oil [12]).

44
However, the development of polyol substrates and PU foams from natural oils is
challenging. The introduction of hydroxyl groups at the positions of double bonds can be
achieved by various methods [3]. Some of the methods are ozonolysis followed by
hydrogenation [13, 14], hydroformylation followed by hydrogenation [4, 15], epoxidation
followed by ring opening [16, 17] or bioconversion directly to polyols [18]. These synthesis
methods produce polyols of distinctive hydroxyl value, distribution and position of the
hydroxyl groups which result in polyurethane networks with vastly different properties [14,
15, 19]. In many instances however, the functionalization of the double bonds leaves
significant amounts of dangling chains because of their internal location on the fatty acids.
The presence of relatively large amounts of non-reactive moieties further reduce the
suitability of the polyols, especially to make rigid polyurethane foams because the regions
where dangling chains are present do not support stress when the sample is loaded, and act
as plasticizers that reduce polymer rigidity. These issues are generally mitigated through
the chemical transformation of the natural oil and judicious choice of methods of
synthesizing the polyols [20].
Palm oil is a particularly important TAG oil. It is the most produced and one of the
cheapest renewable commodity oils in the world, making it an ideal feedstock replacement
at an industrial scale. It is primarily used in foods [5, 21] and increasingly sought for the
production of industrial materials. Palm oil is typically composed of 95% TAGs and 5%
diacylglycerols (DAGs) and other minor components such as monoacylglycerols (MAGs)
with a fatty acid profile ranging typically from C12 to C20 [22, 23]. It has a balanced
saturation (~50/50 % of saturates / unsaturates) [24, 25]. Palmitic acid (P, C16:0) and oleic
acid (O, C18:1) with ~43% and ~41%, respectively, are the main components of palm oil.

45
Palm oil includes ~10% linoleic acid (Li, C18:2), and trace amounts of linolenic acid (Ln,
C18:3) and palmitoleic acid (C16:1). Other representative saturated fatty acids in palm oil
are lauric acid (L, C12:0), myristic acid (M, C14:0), stearic acid (S, C18:0) and arachidic
acid (A, C20:0). The TAG profile of palm oil shows a carbon distribution of C46 to C52
consisting of tri-unsaturated (4.8-9.8%), di-unsaturated (31.8-44.4%), mono unsaturated
(38.5-50.3%) and saturated TAGs [5].
Despite high saturation, palm oil has been successfully transformed into a variety of
industrial materials [26]. It is increasingly used to make value added products such as soaps
and detergents [27], lubricants [28, 29], biodiesel [24, 30] and surfactant [31], etc. Palm oil
and its derivatives are also actively investigated as a feedstock for the synthesis of polyols
to prepare polyurethanes [11, 26, 32]. However, its larger use for the production of
polyurethanes is hindered because of its relatively higher saturation level (50% fatty acids)
which cap the hydroxyl value of its polyols, which adds to the structural limitations
inherent to TAG oils [22]. Typical palm oil-based polyols produced so far usually have
hydroxyl values of less than 200 mg KOH g−1 [33] limiting their applicability in some
polymer formulations, particularly in rigid polyurethane foams. Although some successful
examples through chemical transformation of the natural oil are reported in the literature,
such as for example, the transformation of the TAGs of the natural palm oil into
monoacylglycerols (MAG) before functionalization and polymerization [26, 34], no
significant breakthroughs have been made with palm oil in this area.
More research around the transformation of the natural oil such as targeted chemistry
and proper processing techniques, is needed to increase the potential of palm oil as a viable
source for polyols and polyurethane formulations. Olefin metathesis is a very powerful

46
transformation technology adopted by our research group that promises to be one of the
platforms that can be used on palm oil and other vegetable oils to achieve this goal. It is an
important organic synthesis technique that holds exceptional promise in oleochemistry for
many industries. It is already used on TAG oils and fats to produce fine chemicals,
substrates and materials, many of which serve as or are potential petrochemical
replacements [35-38]. Olefin metathesis can increase the molecular diversify and reactivity
of the natural oil, and therefore the potential for its transformation into functional materials.
Olefin metathesis (Scheme 2.1) is a reversible reaction involving the exchange of the
alkylidene groups between the reactant alkene moieties in the presence of catalysts,
typically transition metal complexes [38, 39].
Scheme 2.1. Representation of olefin metathesis reaction.
Olefin metathesis is categorized further as self-metathesis and cross metathesis [36,
38]. In the self-metathesis reaction (forward reaction in Scheme 2.1) the same olefin
molecules react to produce two different olefin products. The self-metathesis of TAGs
results in a complex mixture comprising linear oligomers (from dimer to pentamer),
macrocyclic structures, cross-linked polymers, as well as trans-/cis isomers [40]. In a cross
metathesis reaction (backward reaction in Scheme 2.1) two different olefins are reacted to
produce a new olefin product. Cross-metathesis of a vegetable oil with olefins results in a
metathesized TAG (MTAG) mixture including modified TAG structures, such as terminal
double bonds, not present in the natural oil [41, 42]. The actual composition of a metathesis
product is highly dependent on the reaction conditions, such as starting materials,

47
temperature, type of catalyst, etc., which provides the possibility of controlling the product
composition [43-45].
The cross-metathesis of a TAG oil can be used to produce a feedstock with increased
molecular diversity and reactivity suitable for the production of more functional polyols
and polyurethanes as demonstrated with triolein [20]. The reaction, among other
modifications, shortens some of the unsaturated fatty acids at the location of the double
bond producing low molecular weight metathesized products with terminal double bonds,
offering less steric hindrance and in some cases increased reactivity [39, 46]. Because of
its low molecular weight and terminal double bond structure, the cross metathesized TAG
can produce polyols with terminal hydroxyl groups and therefore polyurethane networks
with dramatically reduced dangling chains [20].
Cross-metathesis reaction of crude palm oil with ethylene produced terminal alkenes
such as: 1-decene and 1-heptene in low yield [47]. Ethylene cross metathesis is one of the
cheapest and most industrially viable techniques for selective transformation of vegetable
oils, but it still has problems related to low yield, poor selectivity and low catalyst turnover
due to complicated reaction pathways [37, 38]. The modified TAG byproduct obtained via
1-butene cross metathesis of palm oil contains similar terminal structures as those from
ethylene cross metathesis, that can be used as valuable materials to produce polyols without
dangling chain. The composition and the properties of the modified palm oil TAG from 1-
butene metathesis have not been fully understood.
The present work reports on the characterisation of the chemistry, structure, and
physical properties of the product of the cross-metathesis of palm oil with 1-butene

48
(butenolysis) stripped from its olefins (referred to in the text by PMTAG) and the synthesis
of polyols from PMTAG. The uniqueness of the structure of the transformed material
compared to the natural oil is highlighted and its potential for the production of value added
products is assessed. Note that high conversion and productive catalyst turnover were
achieved similarly to what was reported with similar synthetic routes, such as 2- butene
cross metathesis of plant oils [48, 49].
PMTAG was provided by our industry partner, Elevence Renewable Sciences (ERS,
Bolingbrook, Ill., USA), who first introduced the technique [50]. It is in fact the by-product
of the industrial biorefinery that produces 1-decene and 3,4-dodecene linear aliphatic
olefins for the fine chemicals sector. ERS currently operate a biorefinery plant in Indonesia
that processes 400 million lbs. of palm oil annually, with advanced plans to build other
biorefinery processing plants in North America that will utilize cross-metathesis on native
plant oils such as soybean oil and canola oil. The transformation of the by-product into
polyols (and other chemicals) as demonstrated has the potential to increase the profitability
of the bio-refineries dramatically.
The polyol was synthesized by the epoxidation of the PMTAG using hydrogen
peroxide (H2O2) and formic acid followed by ring opening reaction with H2O and HClO4.
This is a well-established economical route to produce polyols. In this method the double
bonds are converted into oxirane moieties and the epoxy groups are converted into
hydroxyl groups by ring opening reaction with suitable reagents like HClO4 and H2O to
give the polyol [51]. The reaction parameters (solvents type, time and temperature) were
optimized in order to produce the most economical and functional polyol.

49
The chemical structure and chemical composition of PMTAG and PMTAG Polyol
were determined by 1H-NMR, GC, MS and HPLC. Their thermal degradation, thermal
transformation behavior and flow properties were characterized with TGA, DSC, and
rotational rheometry, respectively.
2.2 Materials and Methods
2.2.1 Materials
PMTAG is one of the products of the cross-metathesis of palm oil and 1-butene
which was stripped of olefins and provided by ERS. Ethanol (anhydrous), toluene,
potassium hydroxide, and sodium thiosulfate were purchased from ACP chemical Inc.
(Montreal, Quebec, Canada) and were used without further treatment. Iodine monochloride
(95%), potassium iodide (99%), and phenolphthalein were purchased from Sigma-Aldrich
Canada Co. (Oakville, Ontario, Canada).
The general materials for PMTAG polyol synthesis were: formic acid (88 wt %),
hydrogen peroxide (H2O2) solution (30 wt %) purchased from Sigma-Aldrich, Canada,
perchloride acid (70%) from Fisher Scientific, Canada, hexanes (Hx), dichloromethane
(DCM), ethyl acetate (EA) and tetrahydrofuran (THF) from ACP chemical Int. (Montreal,
Quebec, Canada). All were used without further treatment.
2.2.2 Chemistry characterization techniques
2.2.2.1 Titrimetric Methods (OH value, Acid value and Iodine value)
Iodine and acid values were determined according to ASTM D5554-95 and ASTM
D4662-08, respectively. Hydroxyl value was determined according to ASTM D1957-86.

50
2.2.2.2 Nuclear magnetic resonance (NMR)
1H-NMR spectra of PMTAG and PMTAG Polyol were recorded in CDCl3 as
solvent on a Varian Unity-INOVA (McKinley Scientific, USA) at 499.695 MHz. The
spectra were obtained using an 8.6 μs pulse with 4 transients collected in 16202 points.
Datasets were zero-filled to 64000 points, and a line broadening of 0.4 Hz was applied
prior to Fourier transformation. Chemical shifts were referenced relative to residual solvent
peaks (7.26 ppm). The spectra were processed using spinwork NMR Processor, version 3.
2.2.2.3 Mass spectrometry (MS)
Electrospray Ionisation Mass Spectrometry (ESI-MS) analysis of PMTAG Polyol
was performed on a QStar XL quadrupole time-of-flight mass spectrometer (AB Sciex,
Concord, ON) equipped with an ionspray source and modified hot source-induced
desolvation (HSID) interface (Ionics, Bolton, ON). The ion source and interface conditions
were adjusted as follows: ionspray voltage (IS) = 4500 V, nebulising gas (GS1) = 45,
curtain gas (GS2) = 45, declustering potential (DP) = 60 V and HSID temperature (T) =
200 C. Multiply-charged ion signals were reconstructed using the BioTools 1.1.5
software.
2.2.2.4 High pressure liquid chromatography (HPLC)
HPLC was performed on an e2695 HPLC system (Waters Corporation, Milford,
MA, USA) fitted with a Waters ELSD 2424 evaporative light scattering detector. The
HPLC was equipped with an inline degasser, a pump and an auto-sampler. The ELSD
nitrogen flow was set at 25 psi with nebulization and drifting tube maintained at 12 ºC and
55 ºC, respectively. Gain was set at 500.

51
A slow method was used for the HPLC analysis of PMTAG. The analysis was
performed with an X-Bridge column (C18, 150mm × 4.6 mm, 5.0 µm, X-Bridge column,
Waters Corporation, MA, and Superspher 100 RP-18, 250mm × 4.0 mm, Thermo
Science)in series with Superspher 100 RP-18 column (250 mm × 4.0 mm, from Thermo
Scientific, Waltham, MA, USA) both at 30 ºC. The sample (4 L) was passed through the
columns by reversed phase in isocratic mode. The mobile phase (2-propanol: acetonitrile:
heptane (38:57:5)v) was run for 120 min at a flow rate of 0.5 ml/min.
For the analysis of PMTAG polyol, a Betasil diol column (250mm × 4.0 mm, 5.0
µm) was used at 50 ºC. The sample (4 L) was run in normal phase and in gradient elution
mode. The mobile phase was started with heptane: ethyl acetate ratio of (90:10)v run for 1
min at a flow rate of 1 mL/min, then (67:33)v in 55 min. The ratio of ethyl acetate was
increased to 100% in 20 min and then held for 10 min.
In both cases, 5 mg/ml (w/v) solution of crude sample in heptane was filtered
through a filter vial 35540 (Thomson Instrument Company, Oceanside, CA). All solvents
were HPLC grade and obtained from VWR International (Mississauga, ON, Canada).
Waters Empower Version 2 software was used for data collection and data analysis. Purity
of eluted samples was determined using the relative peak area.
2.2.2.5 Gas chromatography (GC)
GC of PMTAG was performed by ERS on an Agilent 7890 equipped with a
split/splitless inlet. The splitter was connected to two detectors: a flame ionization detector
(FID) and Agilent 5975C mass selective detector (MSD) via deactivated guard columns.
The length of the guard column to the FID was 0.5 m and 5.0 m to the MSD. The column

52
used for the analysis was a Restek Rtx-65TG capillary column (Crossbond 65% diphenyl
/ 35% dimethyl polysiloxane; 30 m × 0.25 mm × 0.1 µm df). One microliter of the sample
was injected using a LEAP Technologies Combi-PAL autosampler equipped with a 10 µL
syringe.
2.2.3 Physical characterization techniques
2.2.3.1 Thermogravimetric analysis (TGA)
TGA of PMTAG and PMTAG Polyol was carried out on a TGA Q500 (TA
Instruments, DE, USA). Approximately 8.0 – 15.0 mg of sample was loaded in the open
TGA platinum pan. The sample was equilibrated at 25 °C and then heated to 600 °C at a
constant rate of 10 °C/min. The TGA measurements were performed under dry nitrogen of
40 mL/min for balance purge flow and 60 mL/min for sample purge flow.
2.2.3.2 Differential Scanning Calorimetry (DSC)
DSC measurements of PMTAG and PMTAG Polyol were performed in the
standard mode on a Q200 model (TA Instruments) under a nitrogen flow of 50 mL/min.
The sample (3.5 to 6.5 ± 0.1 mg) in hermetically sealed aluminum DSC pans was
equilibrated at 90 °C for 10 min to erase thermal memory, and then cooled at a constant
rate (5.0 °C/min) to -90 °C where it was held isothermally for 5 min, and subsequently
reheated at 5.0 °C/min to 90 °C.
“TA Universal Analysis” software was used to analyze the TGA and DSC data and
extract the crystallization and melting characteristics. Non-resolved peaks were analyzed
with the help of the first and second derivatives of the differential heat flow. The
measurement temperatures are reported to a certainty of better than ± 0.5 °C.

53
2.2.3.3 Rheology
The flow behavior and viscosity versus temperature of PMTAG and PMTAG
Polyol were measured on a temperature controlled Rheometer (AR2000ex) using a 40-mm,
2° steel geometry. Temperature control was achieved by Peltier attachment with an
accuracy of ~0.2 °C. Shear stress versus shear rate curves were measured at 10 °C intervals
from high temperature (100 °C) to ~ 10 °C below the DSC onset of crystallization
temperature. The range of shear rates (1 - 2000 s-1) was optimized for torque (lowest
possible is 10 μNm) and velocity (maximum suggested of 40 rad/s). The viscosity versus
temperature data were collected at constant shear rate (200 s-1) using the ramp procedure
while the sample was cooling (1.0 °C/min) from ~110 °C to just above the crystallization
point. Data points were collected at intervals of 1 °C.
The shear rate – shear stress curves were fitted with the Herschel-Bulkley equation
(Eq. 2.1), a model commonly used to describe the general flow behavior of liquid materials,
including those characterized by a yield stress.
0
nK Eq. 2.1
Where denotes the shear stress, 0 is the yield stress below which there is no
flow, K the consistency index and n the power index. n depends on constitutive
properties of the material. For Newtonian fluids n = 1, shear thickening fluids, 1n and
for shear thinning fluids, 1n .
The experimental viscosity – temperature data were analyzed using a generalized form
of the van Velzen expression (GvVE, Eq. 2.2).

54
1
ln 1m
AT
Eq. 2.2
The GvVE yields parameters which are physically meaningful; its parameter A relates
directly to the magnitude of the viscosity of the liquid and its exponent m is related to the
complexity of the molecule similar to the parameters of the Andrade and generalized
Andrade models [52]. The goodness of fit was determined using the percent relative
deviation (RD%), referred to herein as residuals (Eq. 2.3).
exp
exp
% 100cal
RD
Eq. 2.3
Where exp and cal are the experimental and calculated viscosities, respectively.
2.3 Results and Discussion
2.3.1 Chemical Characterization of PMTAG
The acid value of PMTAG was less than 1 mg KOH/g, indicating a very low free
fatty acid content. The degree of unsaturation of PMTAG as evaluated by its iodine value
(IV = 52) was higher compared to the starting palm oil (IV= 45), attributed to the overall
lower molecular weight of its unsaturated TAGs. Note that the IV of PMTAG is also higher
than any highly saturated vegetable oil such as coconut oil (IV: 7-10) and palm kernel oil
(IV: 16-19), but much lower than that of the highly unsaturated vegetable oils such as:
soybean oil (IV: 120-136), sunflower oil (IV: 125-144), linseed oil (IV: 136-178), olive oil
(IV: 80-88), tung oil (IV: 163-173), and grape seed oil (IV: 124-143) [53].

55
2.3.2 Compositional Analysis of PMTAG
The compositional analysis of PMTAG was performed using 1H-NMR, GC and
HPLC. Because of its very low free fatty acid content, the fatty acid and TAG profiles of
PMTAG were determined assuming that only TAG structures were present. PMTAG
would naturally comprise all possible transformations of its unsaturated TAGs and all non-
transformed saturated TAGs. The general structures of the transformed TAG can be
described with a model cross metathesis reaction of 1-butene and triolein (OOO) (see
Scheme 2.2). The TAG structures in PMTAG as inferred from all possible transformations
based on this ideal system are shown in Scheme 2.3. The TAG profile of palm oil and
corresponding modified TAG in PMTAG are presented in Table 2.1.
Scheme 2.2. Metathesis reaction of triolein with 1-butene. n=0, the fatty acid is 9-
denenoic acid (D), n= 2, the fatty acid is 9-dodecenoic acid (Dd), and n= 8, the fatty acid
is oleic acid (O).
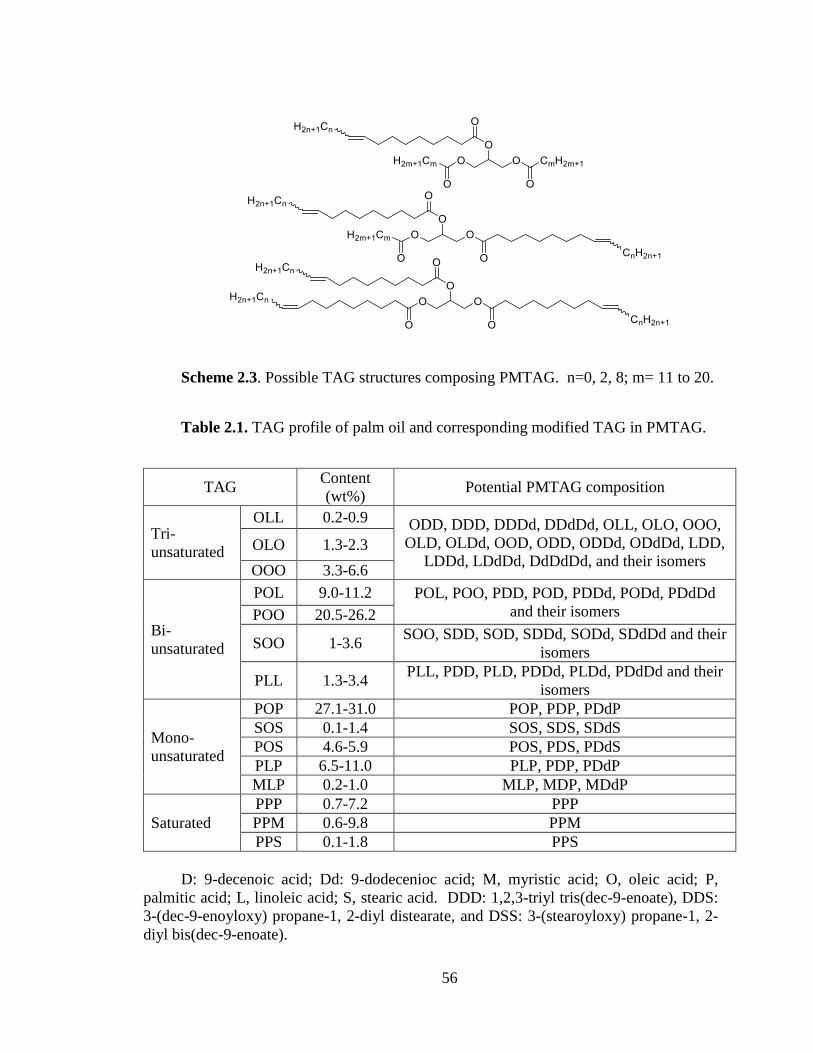
56
Scheme 2.3. Possible TAG structures composing PMTAG. n=0, 2, 8; m= 11 to 20.
Table 2.1. TAG profile of palm oil and corresponding modified TAG in PMTAG.
TAG Content
(wt%) Potential PMTAG composition
Tri-
unsaturated
OLL 0.2-0.9 ODD, DDD, DDDd, DDdDd, OLL, OLO, OOO,
OLD, OLDd, OOD, ODD, ODDd, ODdDd, LDD,
LDDd, LDdDd, DdDdDd, and their isomers OLO 1.3-2.3
OOO 3.3-6.6
Bi-
unsaturated
POL 9.0-11.2 POL, POO, PDD, POD, PDDd, PODd, PDdDd
and their isomers POO 20.5-26.2
SOO 1-3.6 SOO, SDD, SOD, SDDd, SODd, SDdDd and their
isomers
PLL 1.3-3.4 PLL, PDD, PLD, PDDd, PLDd, PDdDd and their
isomers
Mono-
unsaturated
POP 27.1-31.0 POP, PDP, PDdP
SOS 0.1-1.4 SOS, SDS, SDdS
POS 4.6-5.9 POS, PDS, PDdS
PLP 6.5-11.0 PLP, PDP, PDdP
MLP 0.2-1.0 MLP, MDP, MDdP
Saturated
PPP 0.7-7.2 PPP
PPM 0.6-9.8 PPM
PPS 0.1-1.8 PPS
D: 9-decenoic acid; Dd: 9-dodecenioc acid; M, myristic acid; O, oleic acid; P,
palmitic acid; L, linoleic acid; S, stearic acid. DDD: 1,2,3-triyl tris(dec-9-enoate), DDS:
3-(dec-9-enoyloxy) propane-1, 2-diyl distearate, and DSS: 3-(stearoyloxy) propane-1, 2-
diyl bis(dec-9-enoate).
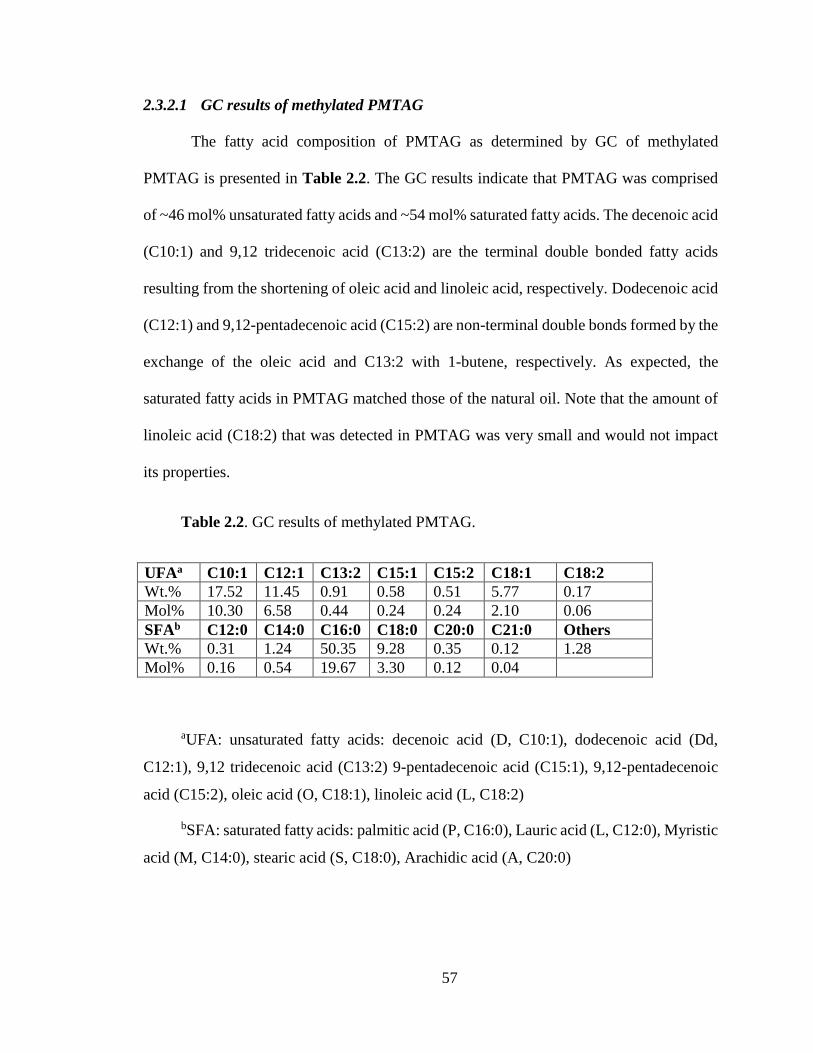
57
2.3.2.1 GC results of methylated PMTAG
The fatty acid composition of PMTAG as determined by GC of methylated
PMTAG is presented in Table 2.2. The GC results indicate that PMTAG was comprised
of ~46 mol% unsaturated fatty acids and ~54 mol% saturated fatty acids. The decenoic acid
(C10:1) and 9,12 tridecenoic acid (C13:2) are the terminal double bonded fatty acids
resulting from the shortening of oleic acid and linoleic acid, respectively. Dodecenoic acid
(C12:1) and 9,12-pentadecenoic acid (C15:2) are non-terminal double bonds formed by the
exchange of the oleic acid and C13:2 with 1-butene, respectively. As expected, the
saturated fatty acids in PMTAG matched those of the natural oil. Note that the amount of
linoleic acid (C18:2) that was detected in PMTAG was very small and would not impact
its properties.
Table 2.2. GC results of methylated PMTAG.
UFAa C10:1 C12:1 C13:2 C15:1 C15:2 C18:1 C18:2
Wt.% 17.52 11.45 0.91 0.58 0.51 5.77 0.17
Mol% 10.30 6.58 0.44 0.24 0.24 2.10 0.06
SFAb C12:0 C14:0 C16:0 C18:0 C20:0 C21:0 Others
Wt.% 0.31 1.24 50.35 9.28 0.35 0.12 1.28
Mol% 0.16 0.54 19.67 3.30 0.12 0.04
aUFA: unsaturated fatty acids: decenoic acid (D, C10:1), dodecenoic acid (Dd,
C12:1), 9,12 tridecenoic acid (C13:2) 9-pentadecenoic acid (C15:1), 9,12-pentadecenoic
acid (C15:2), oleic acid (O, C18:1), linoleic acid (L, C18:2)
bSFA: saturated fatty acids: palmitic acid (P, C16:0), Lauric acid (L, C12:0), Myristic
acid (M, C14:0), stearic acid (S, C18:0), Arachidic acid (A, C20:0)

58
2.3.2.2 1H-NMR of PMTAG
The 1H-NMR spectrum of PMTAG is shown in Figure 2.1. For clarity, the
spectrum is split into two panels: 1a and 1b for the δ 2.5-0.7 ppm and δ 6.0-4.0 ppm
chemical shift ranges, respectively. The corresponding 1H-NMR data are provided in the
Appendix (Table A1). The chemical shifts were attributed according to [54].
(a) (b)
Figure 2.1. 1H-NMR of PMTAG. (a) Chemical shift range between δ 2.5 and 0.7
ppm, (b) Chemical shift range between δ 6.0 and 4.0 ppm
The -CH2CH(O)CH2- and -OCH2CHCH2O- protons of the glycerol skeleton of the
TAG structure were distinctly presented at δ 5.3-5.2 ppm and 4.4-4.1 ppm, respectively.
Two kinds of double bonds were detected: (1) terminal double bonds (n= 0 in Scheme 2.3),
-CH=CH2 and –CH=CH2 at δ 5.8 ppm and 5.0 to 4.9 ppm, respectively, and (2) internal
double bonds (n≠ 0 in Scheme 2.3), -CH=CH- at δ 5.5-5.3 ppm. The α-H to ester group -
C(=O)CH2- was presented at δ 2.33-2.28 ppm, α-H to -CH=CH- was presented at δ 2.03-
1.98 ppm, and β-methylene proton (-C(=O)CH2CH2-) was presented at δ 1.60 ppm. Also,
two kinds of –CH3 were detected, one at 1.0-;0.9 ppm (n= 2 in Scheme 2.3), and another
at 0.9-0.8 ppm (n= 8 in Scheme 2.3). The signature peak of the proton between two double

59
bonds (the chemical shift at 2.6-2.8 ppm) indicative of polyunsaturated fatty acids was not
presented by 1H-NMR of PMTAG.
1H-NMR analysis confirmed that the metathesis reaction did not alter the overall
saturation profile inherited from the starting palm oil but dramatically modified the
configuration and structure of the unsaturated TAGs. The relative amounts of saturated
fatty acids, terminal and internal double bond structures of the PMTAG, as evaluated based
on the relative area under their characteristic 1H-NMR peaks are presented in Table 2.3.
Note that the terminal double bond (mol%), internal double bond RTDB (mol%) and
saturated fatty acid (mol%) were calculated based on the integrated protons under 5.0 to
4.9 ppm, δ 5.5-5.3 ppm and 1.0-0.8 ppm respectively. These data indicate that PMTAG
was constituted of approximately ~50% saturated and ~50% unsaturated fatty acids, half
of which were terminal double bonds (n=0 in Scheme 2.3). The internal double bonds (n≠
0 in Scheme 2.3) contain trans-(δ 5.38-5.34 ppm) and cis (δ 5.33-5.30 ppm)-configurations
with a trans-/cis- ratio of ~2:1.
Table 2.3. Relative amounts of saturated and unsaturated structures in PMTAG as
determined by 1H-NMR.
Fatty Acids Structure Content
(mol %)
Unsaturated
Terminal double
bond
–CH=CH2
–CH=CHCH2CH=CH2 24.9
Internal double
bond
–CH=CHCH2CH3
–CH=CHCH2CH2CH2CH2CH3
–CH=CHCH2CH2CH2CH2CH2CH2CH2CH2CH3
–CH=CHCH2CH=CHCH2CH2CH2CH2CH2CH3
–CH=CHCH2CH=CHCH2CH3
28.4
Saturated 46.7

60
2.3.2.3 HPLC results of PMTAG
The HPLC curves of PMTAG recorded using the method described in Section 2.2.1
are shown in Figure 2.2. The corresponding HPLC data are reported in Table 2.4. The
analysis of the HPLC of PMTAG was carried out with the help of purified DDD, DDS and
DSS used as reference standards, which was synthesized and characterized in our
laboratory. These TAGs are representatives of tri-unsaturated, di-unsaturated and
monounsaturated TAGs that result from 1-butene cross metathesis of palm oil.
Figure 2.2. HPLC of PMTAG (solid line) superimposed with the HPLC of DDD,
DDS and DSS. The standard TAGs are indicated at the side of their HPLC trace (dashed
lines)
As shown in Figure 2.2, an excellent separation of the HPLC peaks was obtained for
PMTAG. Figure 2.2 shows three main groups of HPLC peaks delineated by the elution
Time (min)
0 20 40 60 80 100
LS
U
0
30
60
90
120
200
300
DS
S
DD
D
DD
S

61
times of DDD, DDS and DSS. This indicates the presence of three groups of molecules:
(1) the triunsaturated TAGs showing before DDS, (2) TAGs with two unsaturated moieties
(shortened or not) and those with shortened single unsaturated moiety showing after DDD
up to DSS, and (3) the non-shortened monounsaturated and saturated TAGs showing after
DSS (retention times higher than 52 min). The area % from the HPLC chromatogram of
each peak is presented in Table 2.4. The individual peaks can be assigned more specifically
with the help of the trend in elution time reported in the literature for TAG standards [55].
The TAGs were shown to usually elute successively from MMM (trimyristoylglycerol) to
SOS (1,3-distearoyl-2-oleoyl-sn-glycerol) according to molecular weight and saturation
level in the order MMM, MMP (1,2-dimyristoyl-3-palmitoyl-sn-glycerol), PPM (1,2-
dipalmitoyl-3- myristoyl -sn-glycerol), OOO (Triolein), OOP (1,2-dioleoyl-3-palmitoyl-
sn- glycerol), PPO (1,2-dipalmitoyl-3- oleoyl -sn-glycerol), PPP (tripalmitoylglycerol),
OOS (1,2-dioleoyl-3-stearoyl-sn- glycerol), POS (1-palmitoy-l,2-oleoyl,3-stearoyl-sn-
glycerol) and SOS. DDD eluted first (at ~10.4 min in Figure 2.2) because it has the lowest
molecular weight and highest unsaturation. The group of HPLC peaks that are closest to
DDD are attributable to the highly unsaturated and low molecular weight TAGs. DDD was
followed successively by the triunsaturated TAGS, like DDDd, DDdDd, DdDdDd, DDO,
DDL etc. and their isomers, at retention times between 11 and 18 min. These were followed
by the diunsaturated TAGs having the formula DDX (where X=P, M) before DDS (19.9
min). The diunsaturated molecules with structures like XDDd, XDdDd, XOD, XODd (X=
S, P etc.) and their isomers eluted after DDS at retention time between 20 and 32 min. DXX
and DdXX type of TAG structures (X= P, M) may possibly have eluted before DSS
between 40-50 min. According to the succession criteria established using [55], DSS was

62
followed by DdSS, POS, PPS, SOS and their isomers between 51 and 80 min. The low
molecular weight saturated TAG PPP and PPM may have possibly eluted between the
triunsaturated and diunsaturated TAGs.
Table 2.4. HPLC analysis data of PMTAG.
Peak RT (min) Area (%) Structure
1 10.4 0.16 DDD
2 11.2 0.71 --
3 11.4 0.20 --
4 17.1 10.5 --
5 19.7 0.59 --
6 19.9 11.8 DDS
7 21.7 0.45 --
8 23.3 0.17 --
9 23.9 1.07 --
10 28.2 0.10 --
11 32.6 1.42 --
12 34.3 42.4 --
13 39.7 0.54 --
14 42.0 16.6 --
15 51.8 0.33 DSS
16 74.5 1.86 --
17 79.8 11.2 --
2.3.3 Physical Properties of PMTAG
2.3.3.1 Thermogravimetric Analysis of PMTAG
The TGA and DTG profiles of PMTAG are shown in Figure 2.3. The DTG curve
presented a single peak at ~399 °C indicating a one-step degradation process that is
generally associated with the breakage of the ester bonds [56]. Note however that the DTG
presented an asymmetrical low temperature wing that suggests that some evaporation has
occurred before degradation. Such evaporation is possible due to the presence of low
molecular weight molecules in the PMTAG.

63
Figure 2.3: TGA and DTG profiles of the PMTAG.
The temperature of degradation determined at 1%, 5% and 10% weight loss ( 1%T ,
5%T and 10%T , respectively) were ~260 °C, 310 °C and 330 °C, respectively. These values
are ~20 °C lower than those measured for palm oil [57], probably due to the recording of
the volatilisation of the low molecular weight components of PMTAG. The onset of
thermal degradation ( onT ) of PMTAG as defined by the intersection of the zero weight loss
baseline with the tangent at the inflection point of the TGA curve, was at 339 °C, a
relatively lower temperature than the 347 °C reported for palm oil [57]. However, the DTG
peak temperature of PMTAG (~399 °C) is relatively higher than what was recorded for
palm oil (381 °C) [57]. This indicates that although generally starting to degrade at lower
temperature, the rate of degradation of PMTAG reaches its maximum at a higher
temperature because of its modified structures.
2.3.3.2 Thermal transition behavior
The DSC thermograms obtained during cooling and subsequent heating of PMTAG
(both at 5 °C/min) are presented in Figure 2.4a and 2.4b, respectively. The corresponding
Temperature (oC)
100 200 300 400 500
We
igh
t L
oss
(%
)
0
20
40
60
80
100
DT
G
/%oC
-1
TGA
DTG

64
characteristic temperatures (onset, onT , offset, offT , and peak temperatures, pT ) are listed
in Table 2.8. The cooling thermograms presented relatively well-separated thermal events
(P1, P2 and P3 in Figure 2.4a). Each exotherm is attributable to overlapping peaks due to
molecules with close enough structural features to crystallize in well-defined and separated
ranges of temperatures [58]. This indicates that the molecules of PMTAG form specific
groups which form well-defined melting portions.
The DSC heating thermogram of PMTAG was more complex than its crystallization
counterpart. For example, as many as eight endotherms and two prominent exotherms (at
= 19.3 and 2.9 ºC in Figure 2.4b) were observed in the heating trace of PMTAG. Despite
the polymorphic transformations that occurred, one can still distinguish two group of
endotherms separated at about 30 °C (G1 and G2 in Figure 2.4b) that can be correlated to
the two groups of exotherms observed during crystallization (G1 and G2 in Figure 2.4a)
indicating two distinct PMTAG portions, one melting above room temperature and the
other below room temperature.
Figure 2.4: (a) Crystallization thermograms of PMTAG obtained (b) corresponding
heating profiles (both at 5 °C/min)
-15 0 15 30 45
0.2
0.4
0.6
0.8
1.0(a)
P1
P2
P3
Temperature (oC)
Heat
Flo
w (
Wg
-1)
(
Exo u
p)
G2
G1
-30 -15 0 15 30 45 60
-0.6
-0.4
-0.2
0.0
G1
G2
Temperature (oC)
He
at
Flo
w (
Wg
-1)
(
En
do
do
wn
)
(b)
65
The DSC profile of PMTAG bare close similarity with the profile of the natural
palm oil. The low and high melting portions of PMTAG are reminiscent of the stearin and
olein fractions of palm oil [59]. Therefore, comparably to palm oil and for convenience,
the thermal events that appeared above room temperature (G1 in Figure 2.4a and 2.4b) are
associated with a stearin-like portion of PMTAG, and the thermal events that appeared
below room temperature and at sub-zero temperatures (G2 in Figure 2.4a and 2.4b) are
associated with an olein-like portion of PMTAG. Obviously, the portion represented by the
DSC above 30 C is constituted by the highly saturated and trans- configuration species of
PMTAG, so-called stearin portion, and the portion represented by the DSC below 30 C is
constituted by its highly unsaturated and short length species, so-called olein portion. The
relative enthalpy of crystallization estimated for the stearin (G1) and olein (G2) portions
was 25 % and 75 %, respectively, of the total enthalpy. The melting enthalpy of the stearin
and olein portions represent 23% and 77% of the total enthalpy, respectively, correlating
very well with what was obtained with the enthalpy of crystallization.
The compositional analysis of the two portions can be attempted based on the
composition of PMTAG (Section 3.2) and with the help of previous knowledge of the
crystallization trends observed by DSC for natural TAGs [60]. It is commonly known that
saturated TAGs crystallize at higher temperature than monounsaturated TAGs followed by
diunsaturated TAG and finally triunsaturated TAGs. Symmetrical TAGs crystallize at
higher temperatures than their asymmetrical counterparts. Also for a given level of
saturation, crystallization temperature is higher for higher mass TAGs. The saturated TAGs
like: PPP, MMP and MMM, are known to crystallize above ambient followed by the

66
monounsaturated TAGs such as SOS, POS and PPO, which crystallize below room
temperature, typically above freezing temperature. The diunsaturated TAGs like POO,
OPO, OSO and SOO crystallize at lower temperature which could be as low as ~-22 ºC in
the case of POO, for example [60]. The tri-unsaturated TAGs such as OOO show a single
exotherm at even much lower temperature [60]. The triunsaturated DDD and the
diunsaturated DDS standards, displayed two exotherms each, at ~-40 °C and ~-30 °C, and
at ~ -3 °C, ~ -15 °C, respectively, which fall in the range of temperature of the olein portion
of PMTAG. The monosaturated DSS standard displayed a crystallization peak at ~ 30 °C
and a shoulder at ~25 °C, which indicates that it belongs to the stearin fraction of PMTAG.
Therefore, the exotherm observed at ~32 °C (P1 in Figure 2.4a) is associated with the
highly saturated/trans components of PMTAG and the peak at ~12 °C (P2 in Figure 2.4a)
is related to the mono-unsaturated and di-unsaturated TAGs. The peak at -11 °C (P3 in
Figure 2.4a) is related to the TAGs with the lowest molecular mass and the most
unsaturated tri-unsaturated TAGs.
2.3.3.3 Flow behavior and viscosity of the PMTAG
Selected shear stress versus shear rate curves recorded for PMTAG between 30 ºC
and 100 ºC are shown in Figure 2.5. Fits to the Herschel-Bulkley model (Eq. 2.1) are
included in the figure (dashed lines in Figure 2.5). Evident from Figure 2.5, share rate –
shear stress curves were linear for the whole shear rates range, except at 30 ºC where it was
linear below 150 s-1 only. Application of Eq. 1 generated power index values ( n ) equal to
unity and no yield stress (straight lines in Figure 2.5, R2> 0.99999), indicating a Newtonian
behavior. The deviation from the Newtonian behavior above 150 s-1 at 30 °C is due to the
close proximity of this temperature to the crystallization onset of PMTAG.
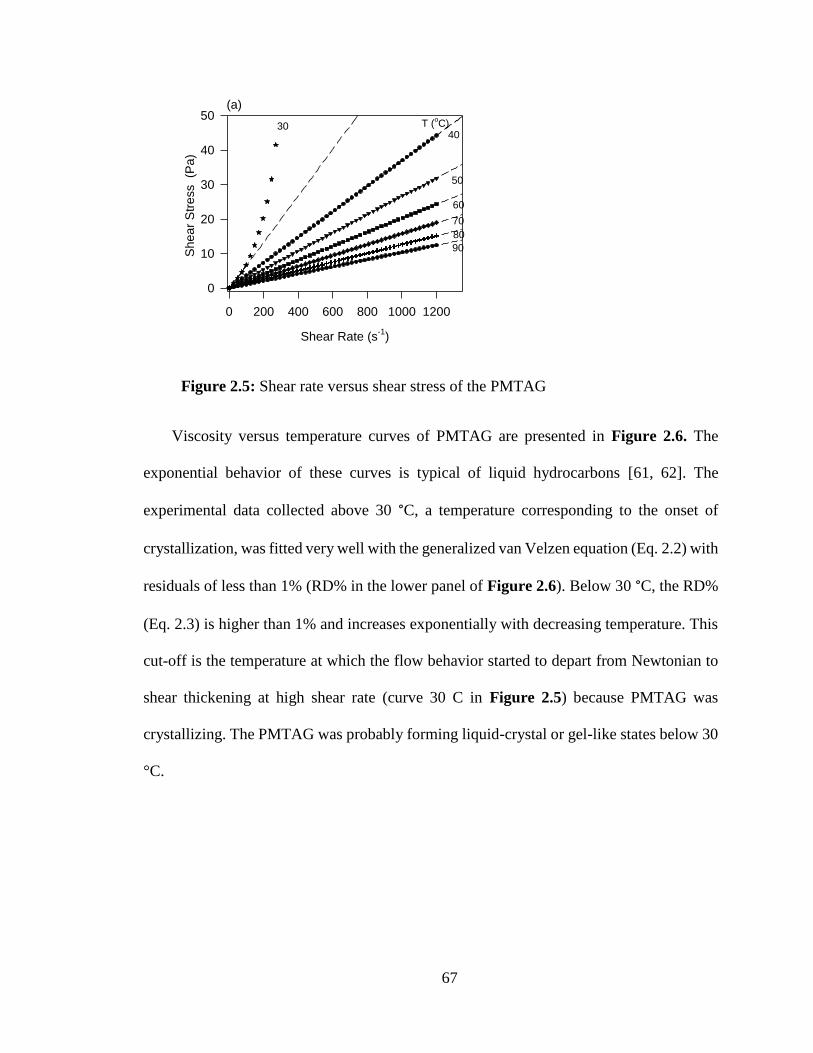
67
Figure 2.5: Shear rate versus shear stress of the PMTAG
Viscosity versus temperature curves of PMTAG are presented in Figure 2.6. The
exponential behavior of these curves is typical of liquid hydrocarbons [61, 62]. The
experimental data collected above 30 °C, a temperature corresponding to the onset of
crystallization, was fitted very well with the generalized van Velzen equation (Eq. 2.2) with
residuals of less than 1% (RD% in the lower panel of Figure 2.6). Below 30 °C, the RD%
(Eq. 2.3) is higher than 1% and increases exponentially with decreasing temperature. This
cut-off is the temperature at which the flow behavior started to depart from Newtonian to
shear thickening at high shear rate (curve 30 C in Figure 2.5) because PMTAG was
crystallizing. The PMTAG was probably forming liquid-crystal or gel-like states below 30
°C.
Shear Rate (s-1
)
0 200 400 600 800 1000 1200
Shear
Str
ess
(Pa)
0
10
20
30
40
50
40
50
T (oC)
60
70
80
90
30
(a)

68
Figure 2.6: Viscosity versus temperature of PMTAG. Dotted lines are fit to the generalized
van Velzen equation (eq.2). The lower panel represents the residuals in % (RD%) versus
temperature.
The viscosity of liquid PMTAG is only slightly lower than that of palm oil [63] and
falls in the range of the highly unsaturated vegetable oils such as soybean oil, sunflower
oil, high oleic sunflower oil, and corn oil [64]. The key elements that brought the viscosity
of PMTAG closer to that of the highly unsaturated vegetable oils were chiefly the
modifications to the molecular mass (molecular mass decreased) introduced by the
metathesis reaction. Importantly, these levels of viscosity will allow for the handling and
processing techniques and equipment in the existing various applications such as the
synthesis of monomers for polymers, fuel and lubricants to be used for PMTAG.
2.3.4 Synthesis of PMTAG Polyol
PMTAG Polyol was prepared from PMTAG in a two-step reaction as described in
Scheme 2.4: (i) epoxidation of the PMTAG by hydrogen peroxide (H2O2) and formic acid
Vis
co
sity (
Pa
.s)
0.02
0.04
0.06
0.08
0.101
oC/min
(b)
20 40 60 80 100 120
RD
/%
-5.0
-2.5
0.0
2.5
5.0
Temperature (oC)

69
(HCOOH), followed by (ii) hydroxylation using HClO4 as a catalyst. The reaction progress
was monitored by TLC and 1H-NMR. The products were analyzed with HPLC and 1H-
NMR.
Scheme 2.4. Synthesis of PMTAG Polyol (n=0, 2, 8; m=11 to 20)
2.3.4.1 Optimization of the Synthesis of PMTAG Polyol
The epoxidation reaction was performed in different media (DCM, EA, THF and
without solvent) and optimised for reactants content (formic acid, and hydrogen peroxide),
time and temperature of the reaction. The effort was targeted at achieving the most
conversion of unsaturation sites into epoxides. The hydroxylation reactions were conducted
at room temperature in THF as well as in water. The ratio of the epoxy PMTAG to HClO4
and the reaction time was varied in order to optimize the cost of the polyol. The details of
the epoxidation and hydroxylation reactions are presented in Table 2.5.

70
The epoxidation of PMTAG using a ratio of PMTAG: Formic acid: H2O2 of 1: 1: 1.4
was effective and complete when it was run with DCM as the solvent (E1). 1H-NMR of the
epoxidized PMTAG of this experiment is shown in Figure 2.7. There were no chemical
shifts related to double bonds (at 5.8, 5.4 and 5.0 ppm) indicating their complete conversion
into epoxides. The chemical shifts of internal epoxy rings were presented at δ 2.9 - 2.7 ppm
and those of terminal epoxy rings at δ 2.7 - 2.4 ppm. The chemical shift due to the protons
-CH2CH(O)CH2- and -OCH2CHCH2O- of the glycerol skeleton (at δ 5.3-5.2 ppm and 4.4-
4.1 ppm, respectively), -C(=O)CH2- (at δ 2.33-2.28 ppm), α-H to -CH=CH- (at δ 2.03-1.98
ppm), and -C(=O)CH2CH2- (at δ 1.60 ppm) indicate that the TAG-like glycerol backbone
structure was preserved.
When epoxidation was conducted in THF (E4), or EA (E5) or without solvent (E6 and
E7), the epoxidation did not complete due to partial miscibility of the reactants in these
experiments. The 1H-NMR data of the epoxy of these experiments (Figures. A1, A2 and
A3 in the Appendix), specifically the relative areas of the δ 5 ppm to 4.8 ppm characteristic
of the terminal double bonds indicate that more than 60% of the terminal double bonds of
PMTAG were not epoxidized. Also a PMTAG Polyol by-product having a formic acid unit
attached to the TAG was detected (characteristic peak at δ ~8ppm in Figures. A1 and A2)
in the product of epoxidation with EA (E5) and the dry epoxidation (E6 and E7). The
structure of the formylated polyols is provided in Scheme A1 in the Appendix). Note that
even with DCM as the solvent, the reduction of formic acid and hydrogen peroxide
concentration in E2 and E3 resulted in an incomplete epoxidation by leaving more than
40% terminal bonds. A complete conversion of unsaturation of PMTAG into the

71
corresponding epoxide in DCM occurred at 1/ 1/ 1.4 ratio by weight of PMTAG, HCOOH
and H2O2, respectively.
Figure 2.7. 1H-NMR spectrum of epoxy PMTAG
The epoxidized PMTAG obtained in E1 was deemed the most suitable to make the
best polyol and chosen for the hydroxylation step because all its double bonds were
converted into epoxides. The hydroxylation of epoxy E1 was carried out at room
temperature in a 3:2 mixture of THF: water. The hydroxylation reaction was optimized for
perchloric acid in three experiments (H1-3 in Table 2.5). As expected, the concentration
of perchloric acid affected both acid value and hydroxyl number of the resulting polyol
strongly. With an HClO4: PMTAG weight ratio of 1:1 (H1 in Table 2.5), the reaction
yielded a polyol (Polyol H1) having a large acid value (> 50 ±5 mg KOH/g) and a relatively
small OH number (120 ±5 mg KOH/g). This was a clear indication of a partial hydrolysis
of the TAG esters. When the HClO4 : PMTAG weight ratio was reduced to 0.1:1 and 0.05:1
(H2 and H3, respectively, in Table 2.5), the reaction yielded polyols (Polyol H2 and H3,
C(O)CH(CH2)7CH3
C(O)CHCH2CH3
-OOCCH2CH2-
-OOCCH2-
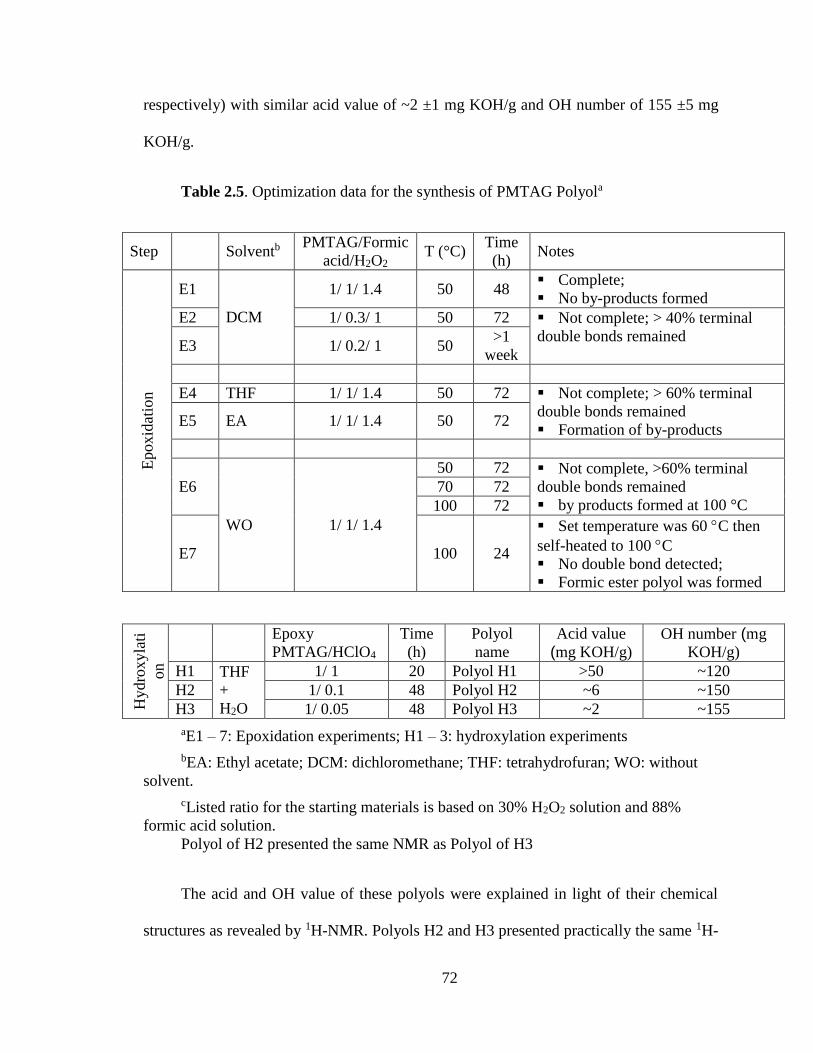
72
respectively) with similar acid value of ~2 ±1 mg KOH/g and OH number of 155 ±5 mg
KOH/g.
Table 2.5. Optimization data for the synthesis of PMTAG Polyola
Step Solventb PMTAG/Formic
acid/H2O2 T (°C)
Time
(h) Notes
Epoxid
atio
n
E1
DCM
1/ 1/ 1.4 50 48 Complete;
No by-products formed
E2 1/ 0.3/ 1 50 72 Not complete; > 40% terminal
double bonds remained
E3 1/ 0.2/ 1 50
>1
week
E4 THF 1/ 1/ 1.4 50 72 Not complete; > 60% terminal
double bonds remained
Formation of by-products E5 EA 1/ 1/ 1.4 50 72
E6
WO 1/ 1/ 1.4
50 72 Not complete, >60% terminal
double bonds remained
by products formed at 100 °C
70 72
100 72
E7 100 24
Set temperature was 60 C then
self-heated to 100 C
No double bond detected;
Formic ester polyol was formed
Hydro
xyla
ti
on
Epoxy
PMTAG/HClO4
Time
(h)
Polyol
name
Acid value
(mg KOH/g)
OH number (mg
KOH/g)
H1 THF
+
H2O
1/ 1 20 Polyol H1 >50 ~120
H2 1/ 0.1 48 Polyol H2 ~6 ~150
H3 1/ 0.05 48 Polyol H3 ~2 ~155
aE1 – 7: Epoxidation experiments; H1 – 3: hydroxylation experiments
bEA: Ethyl acetate; DCM: dichloromethane; THF: tetrahydrofuran; WO: without
solvent.
cListed ratio for the starting materials is based on 30% H2O2 solution and 88%
formic acid solution.
Polyol of H2 presented the same NMR as Polyol of H3
The acid and OH value of these polyols were explained in light of their chemical
structures as revealed by 1H-NMR. Polyols H2 and H3 presented practically the same 1H-

73
NMR (Figure 2.8a), explaining the similarity in their physical properties. In both cases,
the 1H-NMR presented the peak at δ 3.8-3.4 ppm characteristic of the –OH groups but not
the peak of the epoxides at (δ) 2.8-2.4 ppm indicating that conversion to hydroxyl groups
was complete. Polyol H2 and Polyol H3 exhibited the chemical shifts of methylene at δ
5.27 ppm and 4.2-4.0 ppm, and methine protons at δ 4.4-4.2 ppm (Figure 2.8a) typical of
TAG glycerol backbones. Furthermore, the peaks at 4.2-4.0 ppm, and 4.4-4.2 ppm of the
methine protons presented a ratio of 1:1 indicative of the integrity of the TAG backbone
and confirming that the hydrolysis of the TAG did not occur for Polyol H2 and Polyol H3.
The 1H-NMR spectrum of Polyol H1 (Figure 2.8b) presented the typical chemical shifts
of the OH groups and showed the chemical shifts of the TAG structure but unlike Polyol
H2 and Polyol H3 did not present the 1:1 ratio of the methine protons at 4.2-4.0 ppm and
4.4-4.2 ppm an evidence of partial hydrolysis.
Figure 2.8. 1H-NMR of (a) PMTAG Polyol H1and (b) PMTAG Polyol H2 and H3
C(O)CH(CH2)7CH3
C(O)CHCH2CH3
-OOCCH2-

74
2.3.4.2 Standard synthesis procedure
The most economical procedure that yielded a polyol with the lowest acid value
and highest OH number, i.e., Polyol H3, was chosen as the standard method to make the
polyol from PMTAG. It is heretofore simple referred to as PMTAG Polyol. Note, however,
that methods of Table 2.5 may be used to custom-produce polyols that would satisfactorily
meet requirements for target polyurethane products.
2.3.4.3 Standard epoxidation procedure
Formic acid (88%; 200g) was added to a solution of PMTAG (200 g) in DCM (240
mL). The mixture was cooled to 0 °C in an ice bath and hydrogen peroxide (30 %, 280 g)
was added drop wise while stirring with a mechanical stirrer (500 to 600 rpm). After the
addition of hydrogen peroxide, the mixture was raised to 50 °C and kept at this temperature
with stirring until the reaction was complete. The reaction was monitored by a combination
of TLC and 1H-NMR and was deemed complete after 48 h. The reaction mixture was then
diluted with 250 mL of DCM, washed with water (200 mL × 2), and then with saturated
sodium hydrogen carbonate (200 mL × 2), and again with water (200 mL × 2). The resulting
epoxy PMTAG product was rotary evaporated to remove the solvent, and then was dried
over anhydrous sodium sulphate.
2.3.4.4 Standard hydroxylation procedure
Approximately 200 g of crude epoxy PMTAG was dissolved at room temperature in a
500 mL mixture of THF/H2O (3:2) containing 14.5 g of perchloric acid. The resultant
mixture was stirred at room temperature for 36 h, a time after which the reaction which
was monitored by a combination of TLC and 1H-NMR was deemed complete. The reaction
mixture was poured into 240 mL water and extracted with CH2Cl2 (2×240 mL). The

75
organic phase was washed with water (2 × 240 mL), followed by 5% aqueous NaHCO3 (2
× 200 mL), and then with water again (2 × 240 mL), and then dried over Na2SO4. After
removing the drying agent by filtration, the solvent was removed with a rotary evaporator
and further dried by vacuum overnight, giving a light yellow grease-like solid.
2.3.5 Compositional analysis of PMTAG Polyol
PMTAG Polyol was fractionated by flash chromatography using a mixture of ethyl
acetate and hexanes as eluent (ratio EA: Hx from 1:6 to 1:2). Since PMTAG Polyol is a
complex mixture of diols, tetrols and hexols with similar polarities, it is very difficult to
separate the individual molecules with 100% purity. However, the chromatographic
seperation yielded groups of polyols (fractions), which helps to explain the composition of
the PMTAG Polyol. Eight (8) fractions were collected and were characterized by 1H-NMR,
MS and HPLC. The 1H-NMR, MS and HPLC data are presented in Table 2.6. The
structures of PMTAG Polyol present in the polyol fractions determined based on MS and
1H-NMR are provided in the Appendix Scheme A2.
2.3.5.1 1H-NMR and MS Results
The 1H-NMR spectrum of Fraction 1 indicated saturated TAG structures only. It
presented the chemical shift of a glycerol skeleton (at δ 5.3 - 5.2 ppm and 4.4 - 4.1 ppm
related to -CH2CH(O)CH2- and -OCH2CHCH2O- protons, respectively) but not the peaks
related to proton neighbored by hydroxyl groups (at δ 3.8-3.4 ppm), or terminal (at δ 5.8
ppm, 5.0-4.9 ppm) and internal double bonds (δ 5.5-5.3 ppm). Fraction 2 and Fraction 3
comprised the hydrolyzed products with no TAG backbone of the PMTAG polyol. Fraction
4 (C53H102O8·H2O) and Fraction 5 (C52H100O8·2H2O) are PMTAG diols derived of oleic
acid (Scheme 2.5a). Fraction 6 was a mixture of PMTAG diols derived from oleic acid and

76
9-dodecenoic acid of PMTAG (Scheme 2.5a and 2.5b, respectively). Fraction 7 was a
mixture of PMTAG diols and tetrols derived from oleic acid, 9-dodecenoic acid and 9-
decenoic acid (Scheme 2.5a, 2.5b and 2.5c, respectively). Fraction 8 was a mixture of
PMTAG diols, PMTAG tetrols and PMTAG hexols derived from the diols of oleic, 9-
dodecenoic and 9- decenoic acids. The relative amount of hexols, tetrols and diols with
terminal hydroxyl groups in PMTAG polyol, as estimated by 1H-NMR was ~24.1%. This
value is consistent with initial terminal double bonds composing PMTAG.
Scheme 2.5. Diol structures produced from oleic acid, 9-dodecenoic acid and 9-
decenoic acid present in the PMTAG as a result of epoxidation followed by hydroxylation.
Table 2.6. Characterization of PMTAG Polyol fractions
1H-NMR Chemical shifts a MS Formula Structure b
F1
5.2 (1H, m), 4.4-4.2 (2H,
dd)), 4.2-40 (2H, dd), 2.4-
2.2 (6H, t), 1.6-1.5 (6H, m),
1.2 (69H, m), 0.8 (9H, t)
947.8 C61H118O6
Saturated TAGs
849.8 C54H104O6
F2
4.4-4.0 (5H, m), 2.4-2.2
(4H, m), 1.6 (4H, m), 1.2
(40H, m), 0.8 (6H, t)
667.5 C42H82O5
Not a TAG structure;
Contains hydrolyzed by-
products
a) Oleic acid-like diol:
b) 9-dodecenoic acid-like diol:
c) 9-decenoic acid-like diol:

77
F3
5.2 (0.1H, m), 4.4-4.0
(2.4H, m), 3.6 (1H, t), 2.4-
2.2 (3H, t), 1.8-1.2 (48H,
m), 0.8 (6H, t).
825.29 C50H96O8
Not typical TAG structure;
Contain hydrolyzed by-products
with oleic acid diols
F4
5.2 (1H, m), 4.4-4.2 (2H,
dd), 4.2-4.0 (2H, dd), 3.8-
3.4 (2H, m), 2.4-2.2 (6H,
m), 1.6-1.2 (78H, m), 0.8
(9H, t)
884.6 C53H102O8·H2O TAG-like diols containing
one oleic acid-like diol
F5
5.2 (1H, m), 4.4-4.2 (2, dd),
4.2-4.0 (2H, dd), 3.6 (1.5H,
br), 3.4 (1.1H, m), 2.4-2.2
(6H, m), 1.6-1.2 (77H, m),
0.8 (9H, t)
889.5 C52H100O8·2H2O TAG-like diols containing one
oleic acid-like diol
F6
5.2 (1H, m), 4.4-4.2 (2H,
dd), 4.2-4.0 (2H, dd), 3.8-
3.4 (3.2H, m), 2.4-2.2 (6H,
m), 1.6-1.2 (64H, m), 1.0
(3H, t), 0.8 (6H, t)
889.7 C55H106O8 TAG-like diols containing
one oleic acid-like or/and one
9-dodecenoic acid-like diols
805.2 C48H92O8·H2O
833.4 C48H92O8·2H2O
F7a
5.2 (1H, m), 4.4-4.2 (2H,
dd), 4.2-4.0 (2H, dd), 3.8-
3.4 (3.41H, m), 2.4-2.2 (6H,
m), 1.6-1.2 (66H, m), 1.0
(2.6H, t), 0.8 (6H, t)
872.8 C51H98O10 TAG-like diols containing
one 9-dodecenoic acid-like
diol;
TAG-like tetrols containing
one or two oleic acid-like
diols or/and one 9-
dodecenoic acid-like diol
833.4
C47H90O10·H2O;
C45H86O10·2H2O;
C48H92O8·2H2O
805.4 C45H86O10·H2O;
C48H92O8·H2O
F7b
5.2 (1H, m), 4.4-4.2 (2H,
dd), 4.2-4.0 (2H, dd), 3.8-
3.4 (3.1H, m), 2.4-2.2 (6H,
m), 1.6-1.2 (64H, m), 1.0
(2.7H, t), 0.8 (6H, t)
805.4 C45H86O10·H2O TAG-like diols containing one
9-dodecenoic acid-like diol;
TAG-like tetrols containing one
or two oleic acid-like diols
or/and one 9-dodecenoic acid-
like diol
817.8 C47H90O10
844.8 C49H94O10
F7c
5.2 (1H, m), 4.4-4.2 (2H,
dd), 4.2-4.0 (2H, dd), 3.8 -
3.4 (3.3H, m), 2.4-2.2
(5.8H, m), 1.6-1.2 (58H,
m), 1.0 (1.3H, t), 0.8 (5.2H,
t)
719.5 C39H74O10·H2O TAG-like diols containing
one 9-decenoic acid- like
diol;
TAG-like tetrols containing
one or two oleic acid-like,
one or two 9-dodenonic acid-
805.6 C45H86O10·H2O
847.6 C48H92O10·H2O
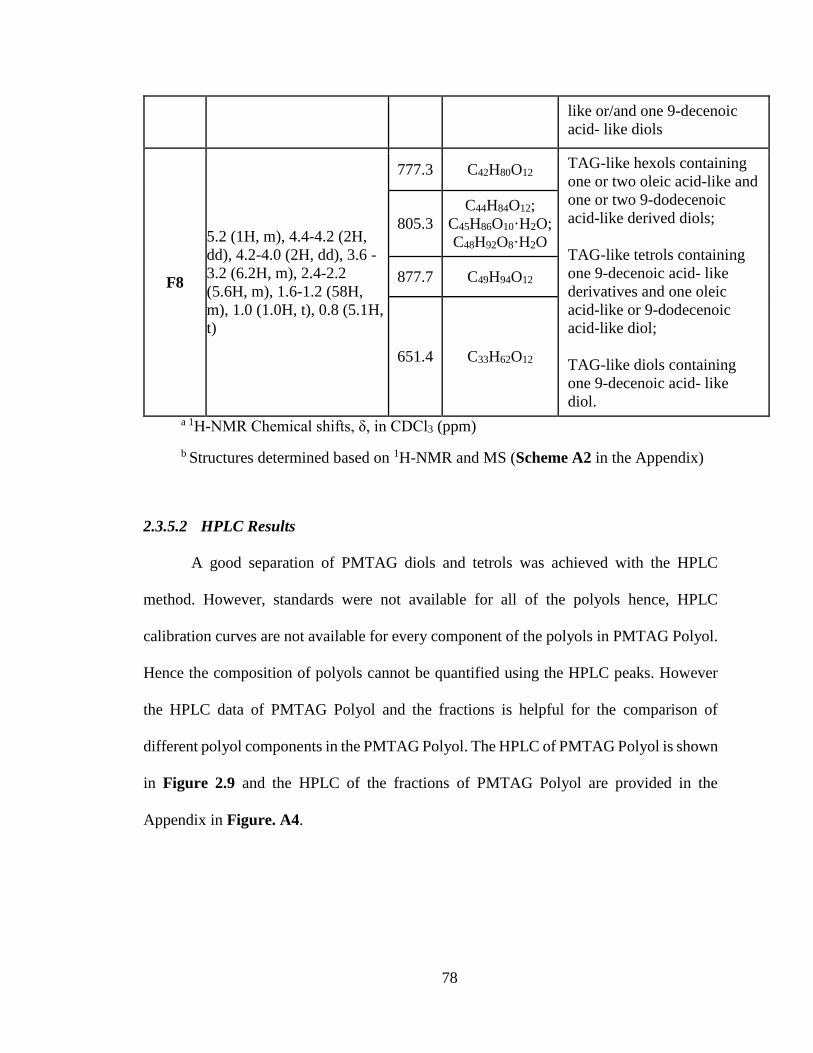
78
like or/and one 9-decenoic
acid- like diols
F8
5.2 (1H, m), 4.4-4.2 (2H,
dd), 4.2-4.0 (2H, dd), 3.6 -
3.2 (6.2H, m), 2.4-2.2
(5.6H, m), 1.6-1.2 (58H,
m), 1.0 (1.0H, t), 0.8 (5.1H,
t)
777.3 C42H80O12 TAG-like hexols containing
one or two oleic acid-like and
one or two 9-dodecenoic
acid-like derived diols;
TAG-like tetrols containing
one 9-decenoic acid- like
derivatives and one oleic
acid-like or 9-dodecenoic
acid-like diol;
TAG-like diols containing
one 9-decenoic acid- like
diol.
805.3
C44H84O12;
C45H86O10·H2O;
C48H92O8·H2O
877.7 C49H94O12
651.4 C33H62O12
a 1H-NMR Chemical shifts, δ, in CDCl3 (ppm)
b Structures determined based on 1H-NMR and MS (Scheme A2 in the Appendix)
2.3.5.2 HPLC Results
A good separation of PMTAG diols and tetrols was achieved with the HPLC
method. However, standards were not available for all of the polyols hence, HPLC
calibration curves are not available for every component of the polyols in PMTAG Polyol.
Hence the composition of polyols cannot be quantified using the HPLC peaks. However
the HPLC data of PMTAG Polyol and the fractions is helpful for the comparison of
different polyol components in the PMTAG Polyol. The HPLC of PMTAG Polyol is shown
in Figure 2.9 and the HPLC of the fractions of PMTAG Polyol are provided in the
Appendix in Figure. A4.

79
Figure 2.9. HPLC of PMTAG Polyol.
The HPLC showed single peaks for almost all the fractions indicating that a very good
separation was obtained with column chromatography. The HPLC peaks of the PMTAG
polyol fractions were easily assigned to the main structures, i.e., saturated TAGs, diols,
tetrols, and hexols that were detected by 1H-NMR and MS. The analysis of the HPLC of
the PMTAG Polyol based on the succession of the HPLC retention times of its fractions
was carried out seamlessly. The major structures present in the PMTAG polyol were
quantified quite accurately using HPLC relative area with the help of the PMTAG polyol
fractions used as standards.
The HPLC data of the PMTAG Polyol fractions indicate that the saturated TAGs (F1)
eluted first (RT between 2.3 - 2.9 min) and the molecules with the largest number of
hydroxyl groups (F8) eluted last (RT> 31 min). Note that the amount of saturated TAG
structures determined from the relative area of HPLC peak of F1 (~42%) matches closely
the amount of saturated material (~47%) present in the PMTAG starting material. The
saturated TAGs (F1) were followed by the hydrolyzed by-products (F2 and F3) at 7 - 11
Time (min)
10 20 30 40 50 60 70 80
LS
U
0
100
200
300
400
1000
2000

80
min then by the PMTAG diols (F4-F6) at 15.5 to 20.5 min. The mixture of PMTAG diols
of short and long fatty chains eluted between 15 to 21 min. F7, the fraction of PMTAG
comprising PMTAG tetrols with short fatty chains and PMTAG diols with internal and
terminal OH groups eluted at 20.5 to 22.3 min and constituted ~ 15.9 % of the total polyol.
F8 which comprised a mixture of diols, tetrols and hexols eluted last at 30.7-33.1 min.
HPLC area of F8 was ~29% of the total. The area under the HPLC peaks of diols, tetrols
and hexols together constituted ~52% of the total. Note that the relative area of each
fraction singled out from the HPLC of the PMTAG polyol matched very well the value
obtained with the area of the individual HPLC of the fraction to the sum of the areas of the
individual HPLC of the fractions.
Table 2.7. HPLC retention time (RT, min) and relative area (A%) of column
chromatography fraction of PMTAG polyol (F1-F8) obtained from the analysis of the
HPLC of PMTAG Polyol
Fraction RT A%
F1 2.5 - 2.9 43
F2 7.1 - 7.2 1
F3 10.5 - 10.6 1
F4 15.5 - 15.6 5
F5 16.7 - 17.4 2
F6 19.3 - 20.3 1
F7 20.3 - 22.3 15
F8 30.4 - 32.7 30
81
2.3.6 Composition of PMTAG Polyol
The 1H-NMR, MS and HPLC of PMTAG Polyol fractions revealed 42% of
unreacted saturated fatty acids, 8% of PMTAG diols (with two hydroxyl groups), 16% of
a mixture of PMTAG diols and tetrols (with four hydroxyl groups) and 30% of PMTAG
diols, tetrols and hexols (with six hydroxyl groups). The structures detected by 1H-NMR
and MS in the PMTAG polyol fractions (F1-F8) are listed in the Appendix in Scheme A2.
The general structures of PMTAG polyol are shown in Scheme 2.6. These were
determined based on the above data with the help of the structures of PMTAG (see Section
3.2). These include PMTAG diols, PMTAG tetrols and PMTAG hexols, all with terminal
hydroxyl groups (n= 0 in Scheme 2.6) as well as internal hydroxyl groups (n=2 or 8 in
Scheme 2.6). The polyol structures with terminal hydroxyl groups were derived from 9-
decenoic acid (n=0 in Scheme 2.6) and those with internal hydroxyl groups (secondary
hydroxyl groups) were formed from fatty acids like 9-dodecenioc acid (n=2 in Scheme 2.6)
and oleic acid (n=8 in Scheme 2.6).

82
Scheme 2.6. General structures present in PMTAG Polyol (n= 0, 2, 8; m=11 to 20)
2.3.7 Physical Properties of PMTAG Polyol
2.3.7.1 Thermal degradation of PMTAG Polyol
The TGA and DTG curves of PMTAG Polyol are presented in Figure 2.10. The
onset temperature of degradation determined at different early weight loss values ( 1%T ~
215°C, 5%T ~295 °C and 10%T ~320 °C at 1%, 5% and 10%, respectively) were lower by
~ 15 °C than those of PMTAG due to the loss of the terminal hydroxyl groups which occur
before the breakage of the ester bonds. The main DTG peak at 374 °C (arrow 1 in Figure
2.10) is associated with the loss of fatty acid chains resulting from the breakage of the ester
bonds [56, 65]. The small DTG shoulder peak at ~ 450 °C (arrow 2 in Figure 2.10) indicate
a second step of degradation wherein the decomposition of ester groups and others high

83
decomposition temperature fragments and the degradation of the remaining carbonaceous
materials from the previous step were recorded [66].
Figure 2.10: TGA and DTG profiles of PMTAG Polyol.
2.3.7.2 Crystallization and Melting Behavior of PMTAG polyol
The DSC thermograms obtained during cooling and subsequent heating of PMTAG
Polyol are presented in Figure 2.11a and 2.11b, respectively. The corresponding
characteristic temperatures ( onT : onset, offT : offset, and pT : peak temperatures) are listed
in Table 2.8.
The DSC of PMTAG Polyol resemble that of PMTAG in many aspects. The cooling
trace of PMTAG Polyol presented two well-defined exotherms (P1 and P2 in Figure
2.11a). Although not as separated as in PMTAG, P1 and P2 indicate a high and a low
crystallizing portions reminiscent of the stearin- and olein-like portions of PMTAG. The
heating thermogram of PMTAG Polyol displayed also two distinct groups of endothermic
events (G1 and G2 in Figure 2.11b) that are associated with the melting of the stearin- and
olein-like portions of PMTAG Polyol.
Temperature (oC)
100 200 300 400 500
Weig
ht Loss (
%)
0
20
40
60
80
100
DT
G (
%oC
-1)
0.0
0.4
0.8
1.2
1.6

84
Figure 2.11: (a) Crystallization of PMTAG polyol (b) heating profile of PMTAG
polyol.
The crystallization and melting peaks of the stearin-like portion of the polyol occurred
at the positions of those of the PMTAG saturated moieties. For example, P1 of the polyol
(Figure 2.11a) and P1 of PMTAG (Figure 2.4a) presented similar onT (~25.5 °C and~24.5
°C, respectively) and pT (~24 °C and ~23 °C, respectively). This portion of PMTAG Polyol
was constituted primarily of the non-functional TAG structures that were not altered by the
epoxidation and hydroxylation reactions. The low temperature exothermic event P2 of the
olein-like portion of PMTAG Polyol peaked at a relatively higher temperature than the P2
of PMTAG (~14 °C compared to 4 °C, Table 2.8) because of the added OH groups. The
presence of the hydroxyl groups explain also the higher melting peaks of the polyol (in
(a)
-20 -10 0 10 20 30 40
Heat
Flo
w
(Wg
-1)
(E
xo u
p)
0.0
0.2
0.4
0.6
0.8 P1
P2
Temperature (oC)
42.3oC
(b)
Temperature (oC)
-40 -20 0 20 40 60
Heat
Flo
w (
Wg
-1)
(Endo d
ow
n)
-0.5
-0.4
-0.3
-0.2
-0.1
0.0
G2
G1

85
Table 2.8, 3T = 30 °C for PMTAG Polyol and 25 °C for PMTAG). Note that the enthalpy
of crystallization measured for P1 of the polyol was 40 J/g, i.e., 42 % of the total enthalpy
of crystallization of the polyol, reflects the balance between the hydroxyl derivatives and
the saturated components of PMTAG Polyol.
Table 2.8. Thermal data of the PMTAG and PMTAG Polyol obtained on cooling and
heating (5 °C/min). onT , offT , and pT , p= 1-6: onset, offset, and peak temperatures, ,C MH
: Enthalpy, C: crystallization and M: melting.
Temperature (C) Enthalpy (J/g)
Cooling 1T 2T 3T 4T 5T 6T onT offT 1H 2H CH
PMTAG 22.9 4.1 -6.4 -22.7 -31.7 -43.6 24.4 -54.1 24.4 67.8 92.1
Polyol 24.1 13.8 25.5 -4.4 40 54.1 94.1
G2 G1
Heating 1T 2T 3T 4T 5T 6T onT offT MH
PMTAG 45.5 40.1 25.0 13.5 -4 -16.9 -59.3 49.0 24.5 65.6 90.0
Polyol 45.3 40.2 30.4 22.4 1.90 46.7 9.5 86.7 96.2
The crystallization and melting data indicate that PMTAG polyol can be separated into
a saturated-rich solid fraction (P1) and a hydroxyl-rich liquid-like fraction (P2). However,
even if a good separation was obtained, the low melting temperature fraction of PMTAG
Polyol would not remain liquid at room temperature and would solidify in time because of
the close proximity and overlap of its crystallization trace with that of the high melting
temperature fraction. With controlled fractionation protocols, the amount of hydroxyl
groups in each fraction may be controlled to some extent, giving custom-made

86
functionalized materials for use in applications that can range from cosmetics to waxes and
high-end polymers.
2.3.7.3 Flow and Viscosity Behavior of PMTAG polyol
The study of the rheological properties of polyols are very important for the
optimization of their processing and transformation. Selected shear stress versus shear rate
curves recorded for PMTAG Polyol between 40 ºC to 100 ºC are shown in Figure 2.12.
Fits to the Herschel-Bulkley model (Eq. 2.1) are included in the figure (dashed lines in
Figure 2.12). Evident from Fig. 6, share rate – shear stress curves were linear for the whole
shear rates range, except at 40 ºC where it was linear below 650 s-1 only. Application of
Eq. 2.1 to the linear region of the share rate – shear stress data generated power index
values ( n ) all practically equal to unity and no yield stress (straight Lines in Figure 2.12,
R2> 0.99999), indicating a Newtonian behavior. The deviation from the Newtonian
behavior above 650 s-1 at 40 °C is due to the close proximity of this temperature to the
crystallization onset of the material.
Figure 2.12: Shear rate versus shear stress of PMTAG Polyol
Shear Rate (s-1
)
0 200 400 600 800 1000 1200
Sh
ea
r S
tre
ss (
Pa
)
0
50
100
150
200
250
300
90
80
70
C)
(a)

87
Figure 2.13: Viscosity versus temperature measured while cooling PMTAG Polyol
at () 1 °C/min. Dotted lines represent the calculated viscosity using the generalized van
Velzen equation (Eq.2.2). Lower panel represent the residuals in % (RD%) versus
temperature. The cut-off is indicated with a vertical dashed line.
The viscosity versus temperature curve of PMTAG polyol shown in Figure 2.13
presented the typical exponential behavior of liquid hydrocarbons [62, 67]. The fit of the
experimental data to the generalized van Velzen equation (GvVE, Eq. 2.2) was excellent
in the temperature region where PMTAG Polyol was liquid and deviates sharply below 35
°C (cut off line in the lower panel of Figure 2.13). The deviation as represented by the
residuals (RD%) is higher than 1% and increases significantly with decreasing temperature.
The cut-off is consistent with the temperature at which shear stress versus shear rate data
showed a shear thickening limit to the Newtonian behavior of the polyol at high shear rate
(curve obtained at 40 C in Figure 2.12). The sharp increase of RD% (Eq. 2.3) is
understandable because after the cut-off temperature, which is very close to the onset of
Vis
cosity (
Pa.s
)
0.0
0.2
0.4
0.6
0.8
20 30 40 50 60 70 80 90 100 110
RD
%
-4
-2
0
2
4
Temperture (oC)

88
crystallization ( onT ) of the material, liquid-crystal or gel-like states of PMTAG polyol
nucleate and grow very rapidly increasing dramatically the viscosity.
The viscosity of PMTAG polyol was higher than PMTAG at all temperatures due
to the hydroxyl groups which increase the polarity and intermolecular attractive force
between the molecules by hydrogen bonding [68]. The viscosity values of some of the
polyols from highly unsaturated oils that are used for polyurethane applications are; soy
polyol (by ozonolysis): 680 mPa.s at 25 C, canola polyol (by ozonolysis): 500-900 mPa.s
at 25 C, rapeseed oil polyol (epoxidation/hydroxylation): 140 at 40 °C and soy polyol
(epoxidation/hydroxylation): 250-990 at 70 °C respectively[13, 14, 69, 70]. Although the
viscosity PMTAG Polyol at 40 °C (330 mPa.s) doesn’t exactly match these values, it is
close enough and in the range of the feasibility of using the same methodologies to make
polyurethanes without drastic changes to the existing handling and processing techniques.
2.4 Conclusions
1-butene metathesized palm oil (PMTAG) is revealed to be different from the natural
oil in terms of composition, chemical structure and physical properties. The metathesis
reaction preserved the saturation level of ~50% of the natural oil and yielded 24.9 mol%
of fatty acids with terminal double bonds. The DSC thermal analysis revealed that
PMTAG, although with a significantly different composition, was constituted of a high-
melting and a low-melting portions akin to the well-known stearin and olein fractions of
palm oil. It is therefore possible to fractionate PMTAG using standard methods to obtain
feedstock with desired unsaturation levels. Furthermore, its flow behavior and viscosity
profile, which is similar to common highly unsaturated vegetable TAG oils, makes it
89
suitable to be processed and transformed into more valuable materials by existing
technology.
Fully functionalized polyols were successfully produced from PMTAG by standard
epoxidation and hydroxylation. The PMTAG polyol with a relatively high hydroxyl value
(155 mg KOH/g) and primary diols, tetrols and hexols and internal hydroxyl groups which
match the PMTAG double bond configuration map, is a suitable starter for a variety of
applications not possible with a non-transformed TAG oil, including rigid and flexible
polyurethane foams. Also inherited from PMTAG, PMTAG Polyol presented a high
melting and low melting molecular fractions that can be directly related to the stearin-like
and olein-like fractions of PMTAG. With adequate melting temperature and viscosity
profile, also in the range of those of polyols made from unsaturated vegetable oil, PMTAG
polyol would lend itself to easy processing and transformation. The cross-metathesis
reaction transformed the natural palm oil into a more useful material with structural and
physical characteristics that improved its prospects as a substrate for further transformation
and the manufacture of a variety of materials including waxes, cosmetics and
polyurethanes.
Acknowledgements We would like to thank the Grain Farmers of Ontario,
Elevance Renewable Sciences, Trent University, the GPA-EDC, Ontario Ministry of
Agriculture, Food and Rural Affairs, Industry Canada and NSERC for financial support.
90
2.5 References
[1] Lligadas G, Ronda JC, Galia M, Cádiz V. Plant oils as platform chemicals for
polyurethane synthesis: current state-of-the-art. Biomacromolecules. 2010;11(11):2825-
35.
[2] Biermann U, Friedt W, Lang S, Lühs W, Machmüller G, Metzger JO, et al. New
syntheses with oils and fats as renewable raw materials for the chemical industry.
Angewandte Chemie International Edition. 2000;39(13):2206-24.
[3] Desroches M, Escouvois M, Auvergne R, Caillol S, Boutevin B. From vegetable oils
to polyurethanes: synthetic routes to polyols and main industrial products. Polymer
Reviews. 2012;52(1):38-79.
[4] Petrović ZS. Polyurethanes from vegetable oils. Polymer Reviews. 2008;48(1):109-55.
[5] Gunstone F. Vegetable oils in food technology: composition, properties and uses: John
Wiley & Sons, 2011.
[6] Firm MRCaC. Polymer Foam Market By Types (Polyurethane, Polystyrene, Polyvinyl
Chloride, Polyolefin, Phenolic, Melamine and Others), Applications (Packaging, Building
& Construction, Furniture & Bedding, Automotive, Wind Energy and Others) &
Geography - Global Trends & Forecasts to 2018. marketsandmarkets. 2013;CH 1465.
[7] Zhang L, Jeon HK, Malsam J, Herrington R, Macosko CW. Substituting soybean oil-
based polyol into polyurethane flexible foams. Polymer. 2007;48(22):6656-67.
[8] Tan S, Abraham T, Ference D, Macosko CW. Rigid polyurethane foams from a soybean
oil-based polyol. Polymer. 2011;52(13):2840-6.
[9] Khoe TH, Otey FH, Frankel EN. Rigid urethane foams from hydroxymethylated linseed
oil and polyol esters. Journal of the American Oil Chemists' Society. 1972;49(11):615-8.
[10] Hu YH, Gao Y, Wang DN, Hu CP, Zu S, Vanoverloop L, et al. Rigid polyurethane
foam prepared from a rape seed oil based polyol. Journal of applied polymer science.
2002;84(3):591-7.
[11] Chuayjuljit S, Sangpakdee T, Saravari O. Processing and properties of palm oil-based
rigid polyurethane foam. The Journal of The Minerals, Metals & Materials Society.
2007;17:7-23.
[12] Babb DA. Polyurethanes from renewable resources. Synthetic Biodegradable
Polymers: Springer; 2012. p. 315-60.
[13] Petrović ZS, Zhang W, Javni I. Structure and Properties of Polyurethanes Prepared
from Triglyceride Polyols by Ozonolysis. Biomacromolecules. 2005;6(2):713-9.

91
[14] Narine S, Kong X, Bouzidi L, Sporns P. Physical Properties of Polyurethanes
Produced from Polyols from Seed Oils: I. Elastomers. Journal of the American Oil
Chemists' Society. 2007;84(1):55-63.
[15] Guo A, Demydov D, Zhang W, Petrovic ZS. Polyols and Polyurethanes from
Hydroformylation of Soybean Oil. Journal of Polymers and the Environment.
2002;10(1):49-52.
[16] Dai H, Yang L, Lin B, Wang C, Shi G. Synthesis and characterization of the different
soy-based polyols by ring opening of epoxidized soybean oil with methanol, 1, 2-
ethanediol and 1, 2-propanediol. Journal of the American Oil Chemists' Society.
2009;86(3):261-7.
[17] Pawlik H, Prociak A, Pielichowski J. Synteza polioli z oleju palmowego
przeznaczonych do otrzymywania elastycznych pianek poliuretanowych. Czasopismo
Techniczne Chemia. 2009;106:111-7.
[18] Hou CT, Lin J-T. Methods for microbial screening and production of polyol oils from
soybean oil through bioprocess. Biocatalysis and Agricultural Biotechnology. 2013;2(1):1-
6.
[19] Guo A, Zhang W, Petrovic ZS. Structure-property relationships in polyurethanes
derived from soybean oil. Journal of Materials Science. 2006;41(15):4914-20.
[20] Zlatanić A, Petrović ZS, Dušek K. Structure and Properties of Triolein-Based
Polyurethane Networks. Biomacromolecules. 2002;3(5):1048-56.
[21] Nagendran B, Unnithan U, Choo Y, Sundram K. Characteristics of red palm oil, a
carotene-and vitamin E–rich refined oil for food uses. Food & Nutrition Bulletin.
2000;21(2):189-94.
[22] Lida H, Sundram K, Siew WL, Aminah A, Mamot S. TAG composition and solid fat
content of palm oil, sunflower oil, and palm kernel olein blends before and after chemical
interesterification. Journal of the American Oil Chemists’ Society. 2002;79(11):1137-44.
[23] Edem D. Palm oil: Biochemical, physiological, nutritional, hematological and
toxicological aspects: A review. Plant Foods for Human Nutrition. 2002;57(3-4):319-41.
[24] Santosa SJ. Palm oil boom in Indonesia: from plantation to downstream products and
biodiesel. CLEAN–Soil, Air, Water. 2008;36(5‐6):453-65.
[25] Ong A, Goh S. Palm oil: a healthful and cost-effective dietary component. Food &
Nutrition Bulletin. 2002;23(1):11-22.
[26] Tanaka R, Hirose S, Hatakeyama H. Preparation and characterization of polyurethane
foams using a palm oil-based polyol. Bioresource technology. 2008;99(9):3810-6.

92
[27] Ogoshi T, Miyawaki Y. Soap and related products: Palm and lauric oil. Journal of the
American Oil Chemists’ Society. 1985;62(2):331-5.
[28] Chang T-S, Yunus R, Rashid U, Choong TS, Awang Biak DR, Syam AM. Palm Oil
Derived Trimethylolpropane Triesters Synthetic Lubricants and Usage in Industrial
Metalworking Fluid. Journal of oleo science. 2015(0).
[29] Shomchoam B, Yoosuk B. Eco-friendly lubricant by partial hydrogenation of palm oil
over Pd/γ-Al 2 O 3 catalyst. Industrial crops and products. 2014;62:395-9.
[30] Abu-Hamdeh NH, Alnefaie KA. A comparative study of almond and palm oils as two
bio-diesel fuels for diesel engine in terms of emissions and performance. Fuel.
2015;150:318-24.
[31] Tulathammakit H, Kitiyanan B. Synthesis of Methyl Ester Sulphonate Surfactant from
Palm Oil Methyl Ester by Using UV or Ozone as an Initiator. Chemical Engineering.
2014;39.
[32] Lee C, Ooi T, Chuah C, Ahmad S. Rigid polyurethane foam production from palm
oil-based epoxidized diethanolamides. Journal of the American Oil Chemists' Society.
2007;84(12):1161-7.
[33] Pawlik H, Prociak A. Influence of palm oil-based polyol on the properties of flexible
polyurethane foams. Journal of Polymers and the Environment. 2012;20(2):438-45.
[34] Arniza M, Hoong S, Idris Z, Yeong S, Hassan H, Din A, et al. Synthesis of
Transesterified Palm Olein-Based Polyol and Rigid Polyurethanes from this Polyol.
Journal of the American Oil Chemists' Society. 2015;92(2):243-55.
[35] Rybak A, Fokou PA, Meier MAR. Metathesis as a versatile tool in oleochemistry.
European Journal of Lipid Science and Technology. 2008;110(9):797-804.
[36] Mol JC, Buffon R. Metathesis in oleochemistry. Journal of the Brazilian Chemical
Society. 1998;9(1):1-11.
[37] Thomas RM, Keitz BK, Champagne TM, Grubbs RH. Highly selective ruthenium
metathesis catalysts for ethenolysis. Journal of the American Chemical Society.
2011;133(19):7490-6.
[38] Malacea R, Dixneuf PH. Alkene Metathesis and Renewable Materials: Selective
Transformations of Plant Oils. Green Metathesis Chemistry: Springer; 2010. p. 185-206.
[39] Connon SJ, Blechert S. Recent developments in olefin cross‐metathesis. Angewandte
Chemie International Edition. 2003;42(17):1900-23.
[40] Refvik M, Larock R. The chemistry of metathesized soybean oil. Journal of the
American Oil Chemists' Society. 1999;76(1):99-102.

93
[41] Zlatanic A, Petrovic ZS, Dušek K. Structure and properties of triolein-based
polyurethane networks. Biomacromolecules. 2002;3(5):1048-56.
[42] Rosenburg DW. To produce reduced chain length esters and alpha-olefins. Google
Patents; 1985.
[43] Li SJ, Hojabri L, Narine SS. Controlling Product Composition of Metathesized
Triolein by Reaction Concentrations. Journal of the American Oil Chemists' Society.
2012;89(11):2077-89.
[44] Tian QP, Larock RC. Model studies and the ADMET polymerization of soybean oil.
Journal of the American Oil Chemists' Society. 2002;79(5):479-88.
[45] Biermann U, Metzger JO, Meier MAR. Acyclic Triene Metathesis Oligo- and
Polymerization of High Oleic Sun Flower Oil. Macromolecular Chemistry and Physics.
2010;211(8):854-62.
[46] Mol J. Catalytic metathesis of unsaturated fatty acid esters and oils. Topics in
Catalysis. 2004;27(1-4):97-104.
[47] Ahmad F, Hamdan S, Yarmo M, Alimunir A. Co-metathesis reaction of crude palm
oil and ethene. Journal of the American Oil Chemists’ Society. 1995;72(6):757-8.
[48] Patel J, Mujcinovic S, Jackson WR, Robinson AJ, Serelis AK, Such C. High
conversion and productive catalyst turnovers in cross-metathesis reactions of natural oils
with 2-butene. Green Chemistry. 2006;8(5):450-4.
[49] RoyáJackson W. Cross-metathesis of unsaturated natural oils with 2-butene. High
conversion and productive catalyst turnovers. Chemical communications. 2005(44):5546-
7.
[50] Schrodi Y, Pederson RL, Kaido H, Tupy MJ. Synthesis of terminal alkenes from
internal alkenes via olefin metathesis. Google Patents; 2013.
[51] Adhvaryu A, Liu Z, Erhan S. Synthesis of novel alkoxylated triacylglycerols and their
lubricant base oil properties. Industrial crops and products. 2005;21(1):113-9.
[52] Harris KR. Temperature and Pressure Dependence of the Viscosities of 2-Ethylhexyl
Benzoate, Bis(2-ethylhexyl) Phthalate, 2,6,10,15,19,23-Hexamethyltetracosane
(Squalane), and Diisodecyl Phthalate. Journal of Chemical and Engineering Data.
2009;54(9):2729-38.
[53] Thomas A. Fats and fatty oils. Ullmann's Encyclopedia of Industrial Chemistry. 2007.
[54] Knothe G, Kenar JA. Determination of the fatty acid profile by 1H‐NMR
spectroscopy. European journal of lipid science and technology. 2004;106(2):88-96.

94
[55] Haryati T, Man YC, Ghazali H, Asbi B, Buana L. Determination of iodine value of
palm oil based on triglyceride composition. Journal of the American Oil Chemists' Society.
1998;75(7):789-92.
[56] Gryglewicz S, Piechocki W, Gryglewicz G. Preparation of polyol esters based on
vegetable and animal fats. Bioresource technology. 2003;87(1):35-9.
[57] Wan Nik W, Ani FN, Masjuki H. Thermal stability evaluation of palm oil as energy
transport media. Energy Conversion and Management. 2005;46(13):2198-215.
[58] Tan C, Man YC. Differential scanning calorimetric analysis of palm oil, palm oil based
products and coconut oil: effects of scanning rate variation. Food Chemistry.
2002;76(1):89-102.
[59] Zaliha O, Chong C, Cheow C, Norizzah A, Kellens M. Crystallization properties of
palm oil by dry fractionation. Food Chemistry. 2004;86(2):245-50.
[60] Man YC, Haryati T, Ghazali H, Asbi B. Composition and thermal profile of crude
palm oil and its products. Journal of the American Oil Chemists' Society. 1999;76(2):237-
42.
[61] Eiteman M, Goodrum J. Density and viscosity of low-molecular weight triglycerides
and their mixtures. Journal of the American Oil Chemists’ Society. 1994;71(11):1261-5.
[62] Goodrum JW, Eiteman MA. Physical properties of low molecular weight triglycerides
for the development of bio-diesel fuel models. Bioresource technology. 1996;56(1):55-60.
[63] Tangsathitkulchai C, Sittichaitaweekul Y, Tangsathitkulchai M. Temperature effect
on the viscosities of palm oil and coconut oil blended with diesel oil. Journal of the
American Oil Chemists' Society. 2004;81(4):401-5.
[64] Santos JCO, Santos IMG, Souza AG. Effect of heating and cooling on rheological
parameters of edible vegetable oils. Journal of food Engineering. 2005;67(4):401-5.
[65] Chang C-C, Wan S-W. China's motor fuels from tung oil. Industrial & Engineering
Chemistry. 1947;39(12):1543-8.
[66] Lin B, Yang L, Dai H, Hou Q, Zhang L. Thermal analysis of soybean oil based polyols.
Journal of thermal analysis and calorimetry. 2009;95(3):977-83.
[67] Eiteman MA, Goodrum JW. Density and viscosity of low-molecular weight
triglycerides and their mixtures. Journal of the American Oil Chemists’ Society.
1994;71(11):1261-5.
[68] Li Y, Sun XS. Di-hydroxylated soybean oil polyols with varied hydroxyl values and
their influence on UV-curable pressure-sensitive adhesives. Journal of the American Oil
Chemists' Society. 2014;91(8):1425-32.

95
[69] Kairytė A, Vėjelis S. Evaluation of forming mixture composition impact on properties
of water blown rigid polyurethane (PUR) foam from rapeseed oil polyol. Industrial crops
and products. 2015;66:210-5.
[70] Guo A, Cho Y, Petrović ZS. Structure and properties of halogenated and
nonhalogenated soy‐based polyols. Journal of Polymer Science Part A: Polymer
Chemistry. 2000;38(21):3900-10.

96
3 Water-Blown Bio-Based Rigid and Flexible Polyurethane
Foams from 1-Butene Metathesized Palm oil Polyol1
3.1 Introduction
Polyurethanes (PUs) are macromolecules containing urethane linkages (-NH-CO-O-
) that are either formed based on the reaction of isocyanate groups and hydroxyl groups
[1], or via non-isocyanate pathways, such as the reaction of cyclic carbonates with amines
[2], self-polycondensation of hydroxyl-acyl azides or melt transurethane methods [3].
Judicious selection of reactants enables the production of a wide range of polyurethane
products such as polyurethane elastomers [4], sheets [4], adhesives [5], coatings [6], and
foams [7] etc.
PU foams are light weight, have good insulation properties, excellent strength to
weight ratio, and impressive sound absorbing properties [1]. Furthermore, their physical
properties can be tailored to a large extent by varying the structure and composition of the
reacting monomers, amount of catalyst and other additives like glycerin, water etc., as well
as the reaction conditions used in the foam formulation [8]. In the case of water blown
polyurethane foams, the reaction of water and isocyanate produces carbon dioxide gas
1 A version of this Chapter is filed as a US provisional patent: U.S. Provisional Patent Application
#61971475, (filed August, 2013), “Metathesized Triacylglycerol Palm Polyols for Use in Polyurethane
Applications and Their Related Physical Properties,” S.S. Narine, Prasanth. K. S. Pillai, S.Li, L.Bouzidi
and A.Mahdevari and Submitted for a publication in Industrial Crops and Products.

97
which forms into small air bubbles. The diffusion of further carbon dioxide inflates the air
bubbles leading to a well-defined cell structure [9]. PU foams are classified as rigid or
flexible according to compressive strength value, and other parameters such cross link
density and hydroxyl value (OH value) of the starting polyol [1]. The market for PU foams
is very large and growing due to high demand across a wide range of industries such as
automotive, building and construction, and packaging [10, 11]. The worth of the global
polyurethane foams market was $46.8 billion in 2014 and is estimated to reach $72.2 billion
by 2020 [12].
Traditionally, PU foams are prepared by the reaction of diisocyanates or
polyisocyanates with petroleum-derived polyols [1]. The development of polyurethanes
from renewable and environmentally friendly feedstock has become the subject of
increasing research because of sustainability and other environmental concerns [13].
Vegetable oils are a particularly promising alternative feedstock for the synthesis of polyols
and polyurethanes because they are biodegradable, available in large quantities, and are
relatively low-cost [14]. A significant body of literature reporting on the synthesis of
polyols and polyurethanes from natural oils is readily available (see for example PU foams
from soybean oil [15, 16], safflower oil, corn oil, sunflower seed oil, linseed oil [17],
rapeseed oil [18], and cotton seed oil [19]).
Palm oil is one of the cheapest and most produced oils in the world that is touted as
a viable renewable feedstock for the economical industrial production of polyols and
polyurethanes [20-23]. However, palm oil does not lend itself easily to chemical
modification because of its relatively high level of saturation (50% fatty acids) which caps
the levels at which it can be functionalized and hence the hydroxyl value of its polyols as

98
compared to highly unsaturated TAG oils such as soybean oil [24]. Furthermore, similar to
most other natural oils, its double bonds are internal and dispersed in the 95%
triacylglycerols (TAGs) and 5% diacylglycerols (DAGs) composing the oil [24-26] which
result in polyols with secondary hydroxyl groups and dangling chains. Such polyols are
less reactive towards polymerization, and known to lead to incomplete crosslinking and
imperfections in the polymer network [7, 27]. The regions where dangling chains are
present do not support stress when the sample is loaded, and act as plasticizers that reduce
the rigidity of the polymer [27, 28]. In fact, the hydroxyl value and the position of the
hydroxyl groups in the fatty chain, the molecular weight of the polyol and the presence of
dangling chains, are the most important factors which affect the properties of polyurethanes
[27-29].
Current research efforts revolve around finding the transformation routes that would
increase the potential of the natural oils as viable sources for polyols and PU foam products.
Such efforts include improving existing synthesis routes, developing new chemistries and
optimizing processing conditions. Olefin metathesis is an example of such novel
approaches that our research group is using as a platform for improved and more suitable
feedstock for the formulation of bio-based materials, particularly polyols and PUs. The
foams of the present work were formulated with a polyol obtained from a product of the
cross-metathesis of 1-butene and palm oil (PMTAG) (so-called PMTAG Polyol). The
chemical and physical properties of the modified TAG material (PMTAG) and its polyol
have already been reported [30].

99
Scheme 3.1. Cross linked polyurethane foam from MDI and PMTAG Polyols. Hexol is
used as a model polyol structure.
PMTAG Polyol is a relatively low molecular weight material comprising ~52% of
functional hexols, tetrols and diols, with half of the hydroxyl groups in terminal positions
[30]. The structures of the polyol with terminal hydroxyl groups were derived from 9-
decenoic acid and those with internal hydroxyl groups (secondary hydroxyl groups) were

100
formed from fatty acids like 9-dodecenioc acid and oleic acid[30]. The unique structure
and composition of PMTAG Polyol and related thermal and rheological properties
indicated enhanced reactivity and kinetics that bode well for further transformation of the
material at manageable reaction conditions into starters and materials for various polymer
applications such as polyurethane foams. The polymerization of PMTAG Polyol into PU
foams as exemplified by a model hexol structure is shown in Scheme 3.1.
The present contribution reports on the preparation and characterization of rigid and
flexible foams from PMTAG Polyol. The effect of terminal hydroxyl PMTAG Polyols on
the physical properties of the polyurethane foams is particularly highlighted. Rigid foams
with densities ranging from 93 kgm-3 to 250 kgm-3, and flexible foams with densities
ranging from 106 kgm-3 to 193 kgm-3 were prepared and characterized by FTIR to confirm
the urethane linkage. The morphology of the foams was examined with scanning electron
microscopy (SEM). Their thermal decomposition and thermal transition behaviours were
determined by thermogravimetric analysis (TGA) and differential scanning calorimetry
(DSC), respectively. The compressive strength of the rigid and the flexible foams were
determined with a texture analyzer.
3.2 Materials and Methods
3.2.1 Materials
PMTAG Polyol [30] was synthesized in our laboratory from PMTAG, a butene
cross-metathesized palm oil product provided by Elevance Renewable Sciences (ERS,
Bolingbrook, Il). Dibutin Dilaurate (DBTDL) and glycerin (99.5 %) were purchased from
Sigma-Aldrich, Canada, and perchloride acid (70%) from Fisher Scientific, Canada. N, N-

101
Dimethylethanolamine (DMEA) from Fischer chemical (USA), diphenylmethane
diisocynate (MDI) from Baer Materials Science (Pittsburgh, PA), and polyether-modified
surfactant (TEGOSTAB B-8404) from Goldschmidt Chemical Canada.
3.2.2 Polymerization Method
The amount of each component of the polymerization mixture was based on 100 parts
by weight of total polyol. All the ingredients, except MDI, were weighed into a beaker and
then MDI was added to the beaker using a syringe. The ingredients were then mechanically
mixed vigorously for 8 to 20 s and then poured into a cylindrical Teflon mold (60 mm
diameter and 35 mm long), which was previously greased with silicone release agent. The
mold was sealed with a hand tightened clamp. The sample was cured for four (4) days at
45 C and post cured for one (1) day at room temperature. Rigid and flexible foams of
different densities were prepared using the same polymerization protocol and formulation
recipe. During the polymerization step, the amounts of mixture was controlled to achieve
the desired densities.
3.2.3 Chemistry and Physical characterization techniques
3.2.3.1 Fourier Transform Infrared Spectroscopy (FTIR)
FTIR spectra were obtained with a Thermo Scientific Nicolet 380 FT-IR
spectrometer (Thermo Electron Scientific Instruments, LLC, USA) equipped with a PIKE
MIRacleTM attenuated total reflectance (ATR) system (PIKE Technologies, Madison, WI,
USA.). Solid samples were loaded onto the ATR crystal area, and sample spectra were
acquired over a scanning range of 400-4000 cm-1 for 32 repeated scans at a spectral
resolution of 4 cm-1.

102
3.2.3.2 Thermogravimetric analysis (TGA)
The thermogravimetric analysis (TGA) was carried out on a TGA Q500 (TA
Instruments, DE, USA) equipped with a TGA heat exchanger (P/N 953160.901).
Approximately 8.0 – 15.0 mg of sample was loaded onto the open TGA platinum pan. The
sample was heated from 25 to 600 °C under dry nitrogen at a constant rate of 10 °C/min.
3.2.3.3 Differential Scanning Calorimetry (DSC)
The thermal transition behavior of the PMTAG Polyol foams was investigated
using a Q200 model (TA Instruments, New Castle, DE) by modulated DSC following
ASTM E1356-03 standard. The sample (3.0 – 6.0 mg) in hermetically sealed aluminum
DSC pan was first equilibrated at 25 °C and heated to 150 °C at 10 °C/min (first heating
cycle). The sample was held at that temperature for 10 min and then cooled down to -90
°C at 10 °C/min, and subsequently reheated to 150 °C at the same rate (second heating
cycle). Modulation amplitude and period were ±1 °C and 60 s, respectively.
The “TA Universal Analysis” software was used to analyze the TGA and DSC
thermograms. The characteristics of non-resolved peaks were obtained using the first and
second derivatives of the differential thermogravimetry (DTG) and differential heat flow.
3.2.3.4 Texture Analysis - Compressive Strength
The compressive strength of the foams were measured at room temperature using
a texture analyser (TA-TX HD, Texture Technologies Corp, NJ, USA). Samples were
prepared in cylindrical Teflon molds of 60-mm diameter and 36-mm long. The cross head
speed was 3.54 mm/min with a load cell of 750 Kgf. The load was applied until the foam
was compressed to approximately 15% and 65% of the original thickness of the rigid and

103
flexible foams, respectively. The compressive strength of the rigid and flexible foams were
calculated at "10% deformation" method according to the standard (literature used as
reference). The flexible foams were compressed to the maximum extent (65%) of its
original thickness. In the case of Rigid Foams, the compressive strength is the stress
prevailing at 10% strain [31] Also compressive strength at 6% deformation of rigid foam
and 25% for flexible foams are reported for comparison purpose.
3.2.3.5 Scanning Electron Microscopy (SEM)
A scanning electron microscope (SEM, model Tescan Vega II), was used under
standard operating conditions (10 keV beam) to examine the pore structure of the foams.
Each sample (~2 cm × 2 cm and 0.5 cm thick), cut from the centre of foam samples
prepared in cylindrical Teflon molds of 60-mm diameter and 36-mm long, was coated with
a thin layer of carbon (~30 nm thick) to ensure electrical conductivity in the SEM chamber
and prevent the buildup of electrons on its surface. All images were acquired using a
secondary electron detector to show the surface features of the samples.
3.2.4 Preparation of PU rigid and flexible foams
Rigid and flexible polyurethane foams were prepared from PMTAG polyol and MDI
using a previously published method [7]. The formulation recipes used to prepare the rigid
and flexible foams are presented in Table 3.1. The amount of each component was based
on 100 parts by weight of total polyol. The characteristics of the PMTAG Polyol (OH value
and acid value) and of the diphenylmethane diisocyanate (MDI) are provided in Table 3.2.
The amount of MDI which was used for the polymerization of both the rigid and flexible
foams was determined in order to achieve an isocyanate index of 1.2 (NCO to OH ratio of
1.2 to 1).

104
The rigid foams were prepared based on a total hydroxyl value of 450 mg KOH/g. In
this case, glycerine (16 parts), a poly hydroxyl cross linker, was added into the reaction
mixture in order to obtain the targeted hydroxyl value (see Table 3.1). DBTDL and DMEA
are the two catalysts that were used for the foam preparation. DBTDL is a cross linking
catalyst which favours the gelling reaction, and DMEA, the co-catalyst, functions as a
blowing catalyst during the polymerization process [1, 32]. The catalyst ratios were fixed
to 1 part of the total weight of the polymerization mixture in the formulation of the rigid
foams. The choice of DBTDL and DMEA and fixed ratio was based on the fairly good
compressive strength previously obtained for rigid PUR foams prepared from terminal
hydroxyl polyols [7].
The flexible foams were prepared based on a total hydroxyl value of 155 mg KOH/g.
In this case, the catalyst amount was fixed to 0.1 parts in order to produce the most flexible
foams with least compressive strength [33]. Note that no glycerine was added in the flexible
foam formulation.
Table 3.1. Formulation Recipe for Rigid and Flexible PMTAG Polyol Foam
Ingredients Parts by weight
Rigid Foam Flexible Foam
PMTAG polyol 100 100
OH: NCO ratio 1:1.2 1:1.2
Glycerol 16 0
Water 2 2
Surfactant 2 2
Catalyst 1 0.1
Co-catalyst 1 0.1

105
Table 3.2. Composition and properties of PMTAG Polyol and diphenylmethane
diisocyanate (MDI)
PMTAG Polyola MDIb
Description: Light yellow waxy solid Description: Dark brown liquid
Composition:
Diols, tetrols and hexols: 52%
Terminal hydroxyl polyol: 24%
Internal hydroxyl polyol: 28%
Composition:
Polymeric MDI: 40-50%
(4, 4’ Diphenylmethane Diisocyanate): 30-40%
MDI mixed isomers: 15-25%
Melting Point (°C) 48 Boiling Point (°C) 208
OH Value (mg KOH/g) 155 NCO (wt%) 31.5
Acid value (mg KOH/g) 2 Functionality 2.4
Equivalent weight (g/mol) 362 Equivalent weight (g/mol) 133
Viscosity @ 40°C (mPa.s) 329-335 Viscosity @ 25 °C (mPa·s) 200
Bulk density (Kgm-3) 1234
a[30]
b[Bayer Materials Science (Pittsburgh, PA)]
Table 3.3. Reactivity profile for the processing of PMTAG Polyol rigid and flexible foams
Cream time (s) Gel time (s) Rise time (s)
Rigid Foam 8 - 12 24 - 28 72 - 74
Flexible Foam 12 - 15 29 - 31 75 - 80
As can be seen in Table 3.3 listing the cream time, gel time and rise time, the rigid
foams formed relatively faster than the flexible foams. The difference in reactivity was
attributed to the extra catalyst and co-catalyst (additional 1 part of both) and the addition
of highly reactive glycerol in the rigid foam formulation (see Table 3.1). Higher catalyst
concentration enabled shorter mix times and the further reactivity profiles of foaming
processes. The addition of glycerol in the polymerization mixture for the rigid foam
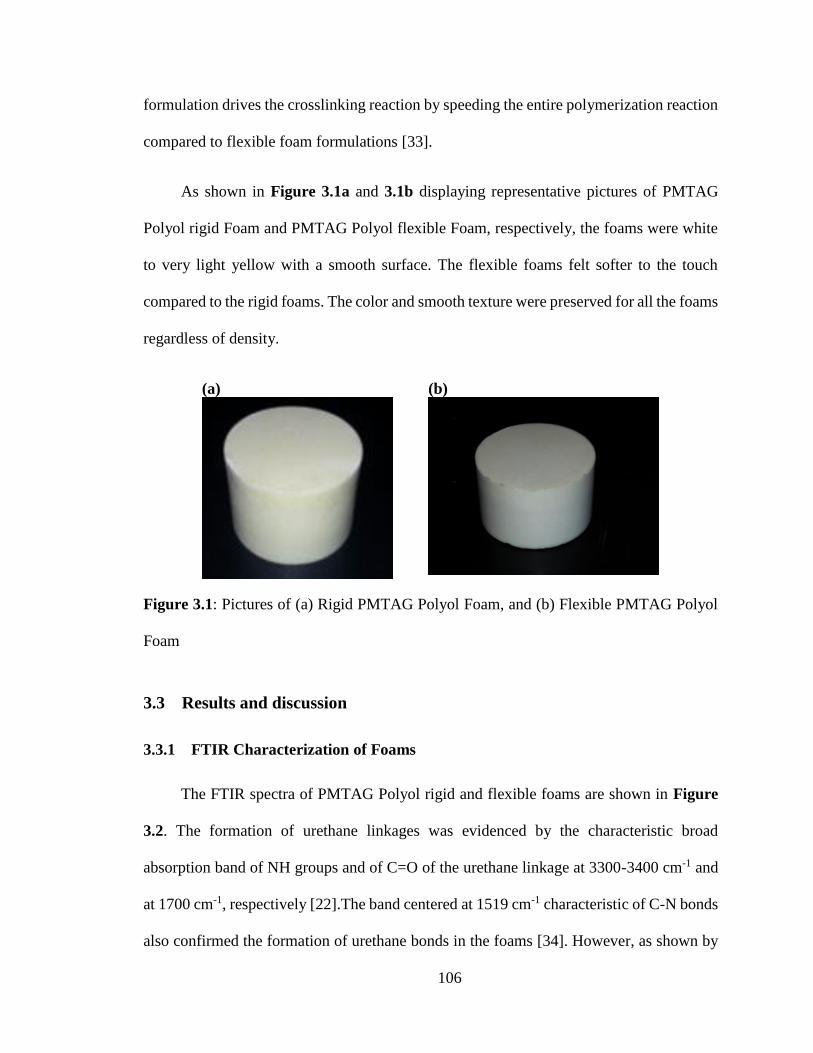
106
formulation drives the crosslinking reaction by speeding the entire polymerization reaction
compared to flexible foam formulations [33].
As shown in Figure 3.1a and 3.1b displaying representative pictures of PMTAG
Polyol rigid Foam and PMTAG Polyol flexible Foam, respectively, the foams were white
to very light yellow with a smooth surface. The flexible foams felt softer to the touch
compared to the rigid foams. The color and smooth texture were preserved for all the foams
regardless of density.
(a) (b)
Figure 3.1: Pictures of (a) Rigid PMTAG Polyol Foam, and (b) Flexible PMTAG Polyol
Foam
3.3 Results and discussion
3.3.1 FTIR Characterization of Foams
The FTIR spectra of PMTAG Polyol rigid and flexible foams are shown in Figure
3.2. The formation of urethane linkages was evidenced by the characteristic broad
absorption band of NH groups and of C=O of the urethane linkage at 3300-3400 cm-1 and
at 1700 cm-1, respectively [22].The band centered at 1519 cm-1 characteristic of C-N bonds
also confirmed the formation of urethane bonds in the foams [34]. However, as shown by

107
the weak band at 2278 cm-1, some NCO groups were still present. This indicated that the
isocyanate was not fully reacted [22, 28]. The overlapping peaks between 1710 and 1735
cm-1 suggested the presence of urea and isocyanurates in the PMTAG Polyol foams. The
peak at 1417 cm-1 reveals the presence of small amount of isocyanurate trimers, indicating
the occurrence of the trimerization reaction of diisocyanates during the foaming process.
The stretching bands of the ester groups are particularly visible at 1744 cm-1 (C=O), 1150-
1160 cm-1 (O-C-C) and 1108-1110 cm-1 (C-C(=O)-O). The stretching vibration of -C-H in
-CH3 and -CH2 groups in the aliphatic chains were also visible at 2923 cm-1, and 2853 cm-
1 respectively [35].
Figure 3.2. Typical FTIR spectra of the PMTAG Polyol foams. (1) PMTAG Polyol Rigid
Foam and (2) PMTAG Polyol Flexible Foam
3.3.2 SEM analysis of PMTAG Polyol Foams
Figure 3.3a and 3.3b show SEM images of the rigid and flexible PMTAG Polyol
foams, respectively. Average cell size of rigid and flexible PMTAG polyol foams were 270
Wave Number (cm-1
)
500100015002000250030003500
Absorb
ance
0.00
0.05
0.10
0.15
0.20
0.25
(1)
(2)
1519 c
m-1
1417 c
m-1
2278 c
m-1
2853 c
m-1
2923 c
m-1
3333 c
m-1

108
± 40 µm and 386 ± 55 µm, respectively. The cell density from the SEM micrographs was
~21 cells per mm2 for the rigid PMTAG polyol foams and ~18 cells per mm2 and flexible
PMTAG polyol foams.
It was apparent from the SEM picture that the cells in the rigid PMTAG polyol foam
were closed and uniformly arranged. The cells in the flexible foams were also closed but
displayed non-uniform size (cell size ranges from 250 µm to 500 µm) and distribution. The
highly compact and closed cell structure of the rigid PMTAG Polyol foams is due to their
high cross linking density attributed to the presence of more primary hydroxyl groups by
the addition of glycerin [36], while the absence of glycerin cross linker and the different
rate of crosslinking of terminal versus internal hydroxyls present in the PMTAG polyol
during flexible foam formulation resulted in less uniform cells [36]. Rigid and flexible
foams with closed cell walls are suitable for thermal insulation applications [37].
(a)
(b)
Figure 3.3. Typical SEM micrographs of (a) Rigid PMTAG Polyol foams and (b) Flexible
PMTAG Polyol Foam

109
3.3.3 Thermal Stability of Foams
Figure 3.4a and 3.4b show the TGA/DTG profiles of rigid and flexible PMTAG
polyol foams, respectively. The onset temperature of degradation of the rigid foam (RF)
was consistently lower than that of the flexible foam (FF), whether determined at 1, 5 or
10% weight loss ( 1%T = 180 ºC and 216 ºC for RF and FF, respectively, 5%T = 253 ºC and
272 ºC for RF and FF, respectively, and 10%T = 275 ºC and 292 ºC for RF and FF,
respectively). This may be due to the degradation of the short chain urethane structure from
the low molecular weight glycerin cross linker. The DTG curves of both rigid and flexible
Polyol foams showed four prominent peaks ( DiT , i=1-4, in Figure 3.4a and 3.4b) which
indicate a multi stage decomposition process. The first peak centered at 1DT = 296-300 °C,
which involved a total weight loss of ~12 to 17 %, is related to the dissociation of urethane
bonds, taken place either through the dissociation into isocyanate and alcohol, or the
formation of primary or secondary amines, olefin and carbon dioxide [38, 39].
Figure 3.4: TGA and DTG profiles of (a) PMTAG rigid foam and (b) PMTAG flexible
foam.
(a)
100 200 300 400 500
0
20
40
60
80
100
DT
G
/%
/oC
Weig
ht
Lost
(%
)
296 o
C
Temperature (oC)
360 o
C 434 o
C
470 o
C
(b)
100 200 300 400 500
20
40
60
80
100
DT
GA
/
%/o
C
Weig
ht
Lost
(%
)
Temperature (oC)
30
3 o
C
360 o
C
434 o
C
470 o
C

110
The second and third DTG peaks (360 and 430 °C) are associated with the
decomposition of the soft segment (polyol back bone) into carbon monoxide, carbon
dioxide, carbonyls (aldehyde, acid, acrolein) olefins and alkenes [39, 40]. These
decomposition steps involved the largest weight loss with ~45-50 % of the total. The last
DTG peak ( 4DT at ~ 470 °C) is related to the decomposition of fragments such as esters or
more strongly bonded fragments associated with the polyol backbone that occur at high
temperature, and probably to the degradation of remaining carbonaceous materials from
the previous step [41].
The rates of the urethane degradation were almost the same (maximum of ~0.40 %/
°C) for the rigid and flexible PMTAG Polyol foams. Also the rates of each step of thermal
degradation were similar for the rigid and flexible foams except in the last step at ~470 °C
where the rigid and flexible PMTAG Polyol foams displayed rates of 0.54 %/°C and
0.27%/°C, respectively. This may be due to the degradation of the left over fragments from
the glycerol backbone used for the preparation of the rigid foams. The overall thermal
stability of the PMTAG Polyol based foams is good and compares fairly well with the
commercial foams and other vegetable based polyol foams [23, 33]..
3.3.4 DSC of Rigid and Flexible Foams
DSC analysis was carried out to study the thermal phase transitions of the PU foams.
Figure 3.5a and 5b show the DSC profiles obtained during the second heating cycle of the
rigid and flexible PMTAG polyol foams, respectively. Three inflection points due to glass
transitions ( g lowT (RF: -10.2 °C, FF: -21.5 °C), intgT (~34 °C), g highT (~50 °C) in Figure
3.5a and 3.5b) were observed in the baseline of the thermograms of both rigid and flexible

111
PMTAG Polyol foams. No melting peaks were observed for any of the foams, indicating
their high cross linking density. The g lowT of the rigid PMTAG Polyol foam was higher
than that of the flexible PMTAG Polyol foam, probably because of higher crosslink density
[29]. Recall that OH value was enhanced to 450 mg KOH/g by the addition of glycerine in
the rigid foam formulation. Both rigid and flexible foam displayed almost same intgT at
~34 °C and g highT at ~50 °C.
The jump in heat capacity (ΔCp) was ~0.4 Jg-1K-1 at g lowT , 0.1 Jg-1K-1 at intgT , and
0.12-0.22 Jg-1K-1 at g highT , suggesting that a large number of molecular chains were
associated with the relaxation of the molecular motion of the polyol backbone [20]. The
magnitude of molecular relaxation of the urethane segment ( g highT at ~50 °C) was much
smaller compared to g lowT due to the intramolecular and intermolecular crosslinking,
which restricts the molecular motion of the hard segment of urethane [20].
Figure 3.5. Typical DSC curves of (a) Rigid PMTAG Polyol Foam and (b) Flexible
PMTAG Polyol Foam.
(a)
-50 0 50 100
0.16
0.20
0.24
0.28Density-164 kgm
-3
Temperature (oC)
Heat
Flo
w
(W
g-1
)
Tg low
Tg int
Tg high
Temperature (oC)
(b)
-50 0 50 100
-0.16
-0.12
-0.08
-0.04
0.00
0.04Density-160 kgm
-3
Heat
Flo
w
(W
g-1
)
Tg low
Tg int
Tg high

112
3.3.5 Compressive Strength of PMTAG Polyol Foams
The mechanical properties of the foams were studied by the compressive stress-strain
measurements. Figure 3.6a and 3.6b represent the compressive strength versus strain of
the rigid and flexible PMTAG Polyol foams, respectively. A linear segment indicative of
the elastic region of the rigid and flexible foams was observed at ~2-4% (Figure 3.6a) and
~8-10% (Figure 3.6b), respectively. The elastic region was followed by a long plateau in
which the stress varied moderately. The plateau region in Figure 3.6a and 3.6b resulted
from the buckling of the cell walls upon further compression of the foams [35]. The curve
related to rigid foam of density 250 kg/m3 (Figure 3.6a) displayed an elastic region only
up to 2% strain with a maximum compressive strength at 5% deformation. Further
compression of the rigid foam of density 250 kg/m3 above 5% caused the breakage of the
resultant foam (Figure 3.6a). This indicate that the cross-linking density and brittleness of
the rigid foams may have increased with the increase in density [29].
The elastic region in the flexible foams observable at ~8-10% (Figure 3.6b) was
followed by a long plateau up to ~25% strain in which the stress varied moderately and
which indicates the buckling of the cells, and then by a relatively steep increase indicative
of the collapse of the cells. Note that the elastic region as well as the plateau were more
extended in the flexible foam than in their rigid foam counterparts, suggesting a very
different structure of the walls. Each region is determined by some mechanism of
deformation. The cell morphology such as cell size, cell wall thickness etc. has a critical
role in the compressive strength of the foams [28]. The extent of bending of the cell walls
during the compression process indicates the compressive strength of the foam such that
the thickness of the cell wall, shape and size of the cells, type of cells (open or closed) etc.,

113
have significant impact on the compressive strength [42]. Linear elasticity is controlled by
cell wall bending and, in case of closed cells, by stretching of the cell walls. The plateau is
associated with the collapse of the cells. When opposing cell walls touch, the further strain
compresses the solid itself increasing stress rapidly, and giving the final so-called
densification region [35].
Figure 3.6. (a) Compressive strength versus strain curves of PMTAG Polyol foams (a)
rigid foam (b) flexible foams.
Figure 3.7a and 3.7b shows the density versus compressive strength of the rigid and
flexible PMTAG polyol foams at different strain %. As seen in Figure 3.7a and 3.7b, the
compressive strength of both rigid and flexible foams increased with increasing foam
density. The highest compressive strength value for the rigid foam (2.5 MPa, Figure 3.7a)
and for the flexible foam (1.07 MPa, Figure 3.7b) was obtained for the foams with the
highest density, i.e., 250 kg/m3 and 193 kg/m3 respectively. The increase in density of the
material increases the number of additional cross links and hence the compressive strength
of the material [42].
0 2 4 6 8 10 12 14
Co
mp
ers
siv
e S
tre
ngth
(
MP
a)
0.0
0.4
0.8
1.2
2.02.42.8
161
109
146
100
Density (kg/m3)
250
Strain (%)
(a) (b)
Strain (%)
0 5 10 15 20 25 30
Com
pre
ssiv
e S
trength
(
MP
a)
0.0
0.5
1.0
1.5
2.0
106
126
146
164
193
Density (kg/m3)
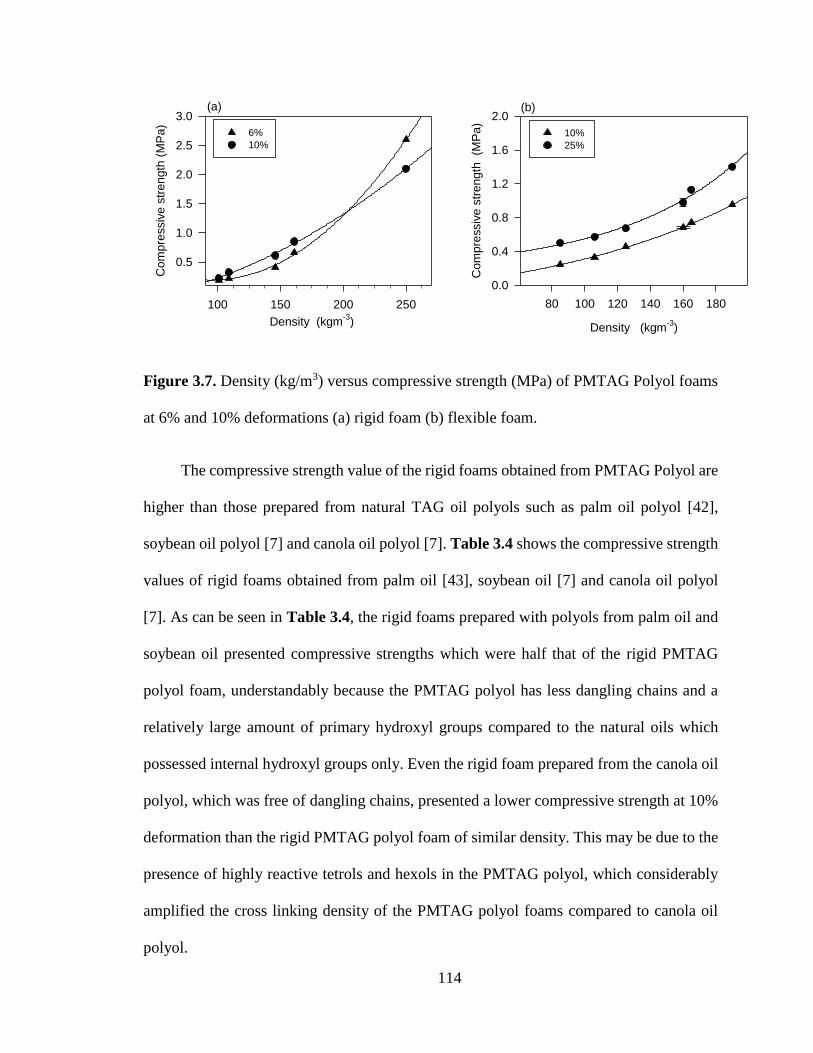
114
Figure 3.7. Density (kg/m3) versus compressive strength (MPa) of PMTAG Polyol foams
at 6% and 10% deformations (a) rigid foam (b) flexible foam.
The compressive strength value of the rigid foams obtained from PMTAG Polyol are
higher than those prepared from natural TAG oil polyols such as palm oil polyol [42],
soybean oil polyol [7] and canola oil polyol [7]. Table 3.4 shows the compressive strength
values of rigid foams obtained from palm oil [43], soybean oil [7] and canola oil polyol
[7]. As can be seen in Table 3.4, the rigid foams prepared with polyols from palm oil and
soybean oil presented compressive strengths which were half that of the rigid PMTAG
polyol foam, understandably because the PMTAG polyol has less dangling chains and a
relatively large amount of primary hydroxyl groups compared to the natural oils which
possessed internal hydroxyl groups only. Even the rigid foam prepared from the canola oil
polyol, which was free of dangling chains, presented a lower compressive strength at 10%
deformation than the rigid PMTAG polyol foam of similar density. This may be due to the
presence of highly reactive tetrols and hexols in the PMTAG polyol, which considerably
amplified the cross linking density of the PMTAG polyol foams compared to canola oil
polyol.
Density (kgm-3
)
100 150 200 250
Co
mp
ressiv
e s
tre
ngth
(M
Pa
)
0.5
1.0
1.5
2.0
2.5
3.0
6%
10%
(a)
Density (kgm-3
)
80 100 120 140 160 180
Co
mp
ressiv
e s
tre
ngth
(M
Pa
)
0.0
0.4
0.8
1.2
1.6
2.0
10%
25%
(b)

115
Table 3.4. Compressive strength of vegetable polyol based rigid foams from the
literature[7, 43].
Rigid Foam from Density
(kg/m3)
Compressive
Strength (MPa)
Polyol Specification
OH value
(mg KOH/g)
dangling
chains
Terminal
OH-groups
Palm Oil Polyol 200-300 1.00-1.50 300 Yes No
Soybean Oil Polyol 160 0.32 185 Yes No
Canola oil polyol 160 0.77 152 No Yes (triols)
3.3.6 Recovery of Flexible Foams
Figure 3.8a shows the percentage of recovery in thickness of flexible PMTAG
Polyol foams as a function of time. The recovery in thickness of the flexible foams were
measured after its maximum compression (65%) using a Vernier caliper. The recovery in
thickness was recorded every minute for the first ten minutes, then after 1, 2, 24 and 48 h.
In all the flexible foams, more than 60% recovery was obtained in less than 2 min, and ~
70 - 80 % after 5 min. At any given time, the flexible foams with highest density achieved
the highest recovery, with a maximum of 91% for the flexible foam having the largest
density (193 kgm-3). The recovery after 48 h of the flexible foams, increased linearly with
density (Figure 3.8b) ( 2R = 0.9710), with a slope of 0.5 % recovery per kgm-3.
The flexibility of the foam was linked to the crosslinking density of the material. The
compression of the low density flexible PMTAG polyol foams may rupture some of the
cells due poor cell wall thickness. This prevents the easy and full recovery of the low
density flexible foams. The increase in density of the flexible foam increases the number

116
of cross links and hence the cell wall thickness which allows the cells to withstand the
stress without breakage.
Figure 3.8. (a) Recovery of PMTAG Flexible Foam as a function of time (min); (b)
Recovery of PMTAG Flexible Foam after 48 h as a function of density.
Vegetable oil based polyols with only internal hydroxyl groups are widely used for
flexible foam applications [44]. This is due to the less tightened cross link network formed
by the internal OH polyols facilitated by the presence of dangling chains. However, the
present data show that flexible foams with good recovery can be achieved from the
PMTAG polyol even if it possesses terminal hydroxyl groups. The complex structure of
PMTAG polyol allows their use in the preparation of functional rigid foams as well as high
performing flexible foams. PMTAG polyol may also be partially substituted with
commercial petroleum based polyols for the preparation of flexible foams with good
physical properties similar to what was achieved with soybean oil polyol [15] and palm oil
polyol [23].
(a)
0 3 6 9 12 1000 2000 3000
Re
co
ve
ry
(%
)
20
40
60
80
100
106
129
146
172
193
Density (kg/m3)
Time (min)
(b)
60 90 120 150 180 210
Recovery
(%
)
50
60
70
80
90
100
Density (kgm-3
)

117
3.4 Conclusions
1-butene cross metathesized pal oil polyol (PMTAG Polyol), a mixture of diols,
tetrols and hexols with 24.1 mol% terminal hydroxyl groups was found to be an ideal
material for the preparation of polyurethane foams. Water blown rigid (densities ranging
from 93 kgm-3 to 250 kgm-3) and flexible (densities ranging from 106 kgm-3 to 193 kgm-3)
foams were successfully prepared from PMTAG polyol and fully characterized with FTIR,
SEM, TGA and DSC. The cellular structure of the foams as evaluated from SEM comprised
of small sized (rigid and flexible foams cell size: 270±40µm and 386±55 µm, respectively)
and closed cells. Both the rigid and flexible PMTAG foams presented better thermal
degradation stability compared to the commercially available vegetable-based and
petroleum-based polyurethane foams. The rigid and flexible PMTAG Polyol foams
displayed a multi-step glass transition attributable to the molecular motion of the polyol
backbone at ~ -10 °C and ~ -20 °C and molecular motion of the urethane segments at higher
temperatures (~ 34 °C and ~50 °C for the rigid and flexible, respectively. The rigid PMTAG
polyol resulted in foams with higher compressive strengths compared to the highly
unsaturated vegetable oil (soybean oil, canola oil) polyol derived rigid foams because of
its terminal hydroxyls. The flexible foams produced from the PMTAG Polyol displayed
good compressive strength with 90% recovery in thickness after compression.
The good thermal stability and the closed cell structure suggests the suitability of the
rigid and flexible foams for thermal insulation applications. The structural and physical
properties of the foams of the present study substantiates the possibility of PMTAG polyol
to compete favorably with the commercial bio-based as well as petroleum standard polyols
for making polyurethane foams at an industrial scale.

118
Acknowledgements We would like to thank the Grain Farmers of Ontario, Elevance
Renewable Sciences, Trent University, the GPA-EDC, Ontario Ministry of Agriculture,
Food and Rural Affairs, Industry Canada and NSERC for financial support.
3.5 References
[1] Szycher M. Szycher's handbook of polyurethanes: CRC press, 1999.
[2] Guan J, Song Y, Lin Y, Yin X, Zuo M, Zhao Y, et al. Progress in study of non-
isocyanate polyurethane. Industrial & Engineering Chemistry Research.
2011;50(11):6517-27.
[3] More AS, Gadenne B, Alfos C, Cramail H. AB type polyaddition route to thermoplastic
polyurethanes from fatty acid derivatives. Polymer Chemistry. 2012;3(6):1594-605.
[4] Kong X, Narine SS. Physical properties of polyurethane plastic sheets produced from
polyols from canola oil. Biomacromolecules. 2007;8(7):2203-9.
[5] Somani KP, Kansara SS, Patel NK, Rakshit AK. Castor oil based polyurethane
adhesives for wood-to-wood bonding. International Journal of Adhesion and Adhesives.
2003;23(4):269-75.
[6] Velayutham TS, Majid WHA, Ahmad AB, Kang GY, Gan SN. Synthesis and
characterization of polyurethane coatings derived from polyols synthesized with glycerol,
phthalic anhydride and oleic acid. Progress in Organic Coatings. 2009;66(4):367-71.
[7] Narine SS, Kong X, Bouzidi L, Sporns P. Physical properties of polyurethanes
produced from polyols from seed oils: II. Foams. Journal of the American Oil Chemists'
Society. 2007;84(1):65-72.
[8] John J, Bhattacharya M, Turner RB. Characterization of polyurethane foams from
soybean oil. Journal of Applied Polymer Science. 2002;86(12):3097-107.
[9] Doyle EN. The development and use of polyurethane products: McGraw-Hill New
York, NY, 1971.
[10] Babb DA. Polyurethanes from Renewable Resources. In: Rieger B, Kunkel A, Coates
GW, Reichardt R, Dinjus E, Zevaco TA, editors. Synthetic Biodegradable Polymers2012.
p. 315-60.
[11] David J, Vojtová L, Bednařík K, Kučerík J, Vávrová M, Jančář J. Development of
novel environmental friendly polyurethane foams. Environmental Chemistry Letters.
2010;8(4):381-5.

119
[12] Firm MRCaC. Polyurethane Foam Market by Type (Flexible Foam, Rigid Foam), by
End-User Industry (Bedding & Furniture, Building & Construction, Electronics,
Automotive, Footwear, Packaging, Others), by Geography - Global Trends & Forecasts to
2020.marketsandmarkets.2015
(http://www.marketsandmarkets.com/PressReleases/polyurethane-foams.asp.).
[13] Desroches M, Escouvois M, Auvergne R, Caillol S, Boutevin B. From vegetable oils
to polyurethanes: synthetic routes to polyols and main industrial products. Polymer
Reviews. 2012;52(1):38-79.
[14] Petrović ZS. Polyurethanes from vegetable oils. Polymer Reviews. 2008;48(1):109-
55.
[15] Zhang L, Jeon HK, Malsam J, Herrington R, Macosko CW. Substituting soybean oil-
based polyol into polyurethane flexible foams. Polymer. 2007;48(22):6656-67.
[16] Tan S, Abraham T, Ference D, Macosko CW. Rigid polyurethane foams from a
soybean oil-based polyol. Polymer. 2011;52(13):2840-6.
[17] Khoe TH, Otey FH, Frankel EN. Rigid urethane foams from hydroxymethylated
linseed oil and polyol esters. J Am Oil Chem Soc. 1972;49(11):615-8.
[18] Hu YH, Gao Y, Wang DN, Hu CP, Zu S, Vanoverloop L, et al. Rigid polyurethane
foam prepared from a rape seed oil based polyol. Journal of Applied Polymer Science.
2002;84(3):591-7.
[19] Babb DA. Polyurethanes from renewable resources. Synthetic Biodegradable
Polymers: Springer; 2012. p. 315-60.
[20] Tanaka R, Hirose S, Hatakeyama H. Preparation and characterization of polyurethane
foams using a palm oil-based polyol. Bioresource Technology. 2008;99(9):3810-6.
[21] Ong A, Goh S. Palm oil: a healthful and cost-effective dietary component. Food &
Nutrition Bulletin. 2002;23(1):11-22.
[22] Chuayjuljit S, Sangpakdee T, Saravari O. Processing and properties of palm oil-based
rigid polyurethane foam. Journal of The Minerals, Metals & Materials Society. 2007;17:7-
23.
[23] Pawlik H, Prociak A. Influence of palm oil-based polyol on the properties of flexible
polyurethane foams. Journal of Polymers and the Environment. 2012;20(2):438-45.
[24] Lida H, Sundram K, Siew WL, Aminah A, Mamot S. TAG composition and solid fat
content of palm oil, sunflower oil, and palm kernel olein blends before and after chemical
interesterification. Journal of the American Oil Chemists Society. 2002;79(11):1137-44.
[25] Santosa SJ. Palm oil boom in Indonesia: from plantation to downstream products and
biodiesel. CLEAN–Soil, Air, Water. 2008;36(5‐6):453-65.

120
[26] Ong AS, Goh S. Palm oil: a healthful and cost-effective dietary component. Food &
Nutrition Bulletin. 2002;23(1):11-22.
[27] Zlatanic A, Petrovic ZS, Dusek K. Structure and properties of triolein-based
polyurethane networks. Biomacromolecules. 2002;3(5):1048-56.
[28] Narine SS, Yue J, Kong X. Production of polyols from canola oil and their chemical
identification and physical properties. Journal of the American Oil Chemists' Society.
2007;84(2):173-9.
[29] Guo A, Demydov D, Zhang W, Petrovic ZS. Polyols and Polyurethanes from
Hydroformylation of Soybean Oil. Journal of Polymers and the Environment.
2002;10(1):49-52.
[30] Prasanth S.Pillai SL, Laziz Bouzidi and Suresh S. Narine. 1-Butene Metathesized
Palm Oil & Its Polyol derivatives: Structure, Chemical composition and Physical
Properties. Submitted to Industrial Crops and Products. 2015.
[31] Tate PM, Talal S. Compressive properties of rigid polyurethane foams. Polymers &
Polymer Composites. 1999;7(2):117-24.
[32] Ashida K. Polyurethane and related foams: chemistry and technology: CRC press,
2006.
[33] Guo A, Javni I, Petrovic Z. Rigid polyurethane foams based on soybean oil. Journal
of Applied Polymer Science. 2000;77(2):467-73.
[34] Piszczyk Ł, Strankowski M, Danowska M, Hejna A, Haponiuk JT. Rigid polyurethane
foams from a polyglycerol-based polyol. European Polymer Journal. 2014;57:143-50.
[35] Gu R, Konar S, Sain M. Preparation and characterization of sustainable polyurethane
foams from soybean oils. Journal of the American Oil Chemists' Society.
2012;89(11):2103-11.
[36] Campanella A, Bonnaillie LM, Wool RP. Polyurethane Foams from Soyoil-Based
Polyols. Journal of Applied Polymer Science. 2009;112(4):2567-78.
[37] Prociak A, Pielichowski J, Sterzyñski T. Thermal diffusivity of polyurethane foams
measured by the modified ångström method. Polymer Engineering & Science.
1999;39(9):1689-95.
[38] Javni I, Petrović ZS, Guo A, Fuller R. Thermal stability of polyurethanes based on
vegetable oils. Journal of Applied Polymer Science. 2000;77(8):1723-34.
[39] Shufen L, Zhi J, Kaijun Y, Shuqin Y, Chow W. Studies on the thermal behavior of
polyurethanes. Polymer-Plastics Technology and Engineering. 2006;45(1):95-108.

121
[40] Gryglewicz S, Piechocki W, Gryglewicz G. Preparation of polyol esters based on
vegetable and animal fats. Bioresource Technology. 2003;87(1):35-9.
[41] Lin B, Yang L, Dai H, Hou Q, Zhang L. Thermal analysis of soybean oil based polyols.
Journal of Thermal Analysis and Calorimetry. 2009;95(3):977-83.
[42] Thirumal M, Khastgir D, Singha NK, Manjunath B, Naik Y. Effect of foam density
on the properties of water blown rigid polyurethane foam. Journal of Applied Polymer
Science. 2008;108(3):1810-7.
[43] Chian K, Gan L. Development of a rigid polyurethane foam from palm oil. Journal of
Applied Polymer Science. 1998;68(3):509-15.
[44] Banik I, Sain M. Water blown soy polyol-based polyurethane foams of different
rigidities. Journal of Reinforced Plastics and Composites. 2007.

122
4 Fractionation Strategies for Improving Functional
Properties of Polyols and derived Polyurethane Foams from
1-butene Metathesized Palm Oil2
4.1 Introduction
Palm oil is one of the most abundant and inexpensive renewable commodity oils in
the world, making it an economical alternative feedstock for the polymer industry [1].
However, its saturation level (~50% saturated fatty acids) limits the hydroxyl value of
polyols derived from the native oil [2]. Furthermore, because of the internal position of its
double bonds, native palm oil produces polyols with dangling chains at the unsaturated
sites which after polymerization leads to incomplete crosslinking and imperfections in the
polymer network [3, 4]. Several strategies have been employed to address these handicaps,
including the recent cross metathesis of palm oil with 1-butene [5].
Olefin cross metathesis enables the shortening of unsaturated fatty acids at the
location of the double bonds, producing low molecular weight TAG products with terminal
double bonds: structures that can yield polyols with primary hydroxyls on functionalization
2 A version of this chapter is filed as a US provisional patent: U.S. Provisional Patent Application
#62107935, (filed January, 2015), “Polyols from the Fractions of Metathesized Triacylglycerols and
Polyurethanes from such Polyols and Their Physical Properties,” S.S. Narine, Prasanth. K. S. Pillai, S.Li,
L.Bouzidi and A.Mahadevari and Submitted for a publication in Industrial Crops and Products
123
[5-7]. Such terminal hydroxyl polyols are free of pendant chains arising from the
unsaturated fatty acid moieties, with reduced steric hindrances and dangling chains in
subsequent polyurethane networks [8]. However, since metathesis does not affect the
saturated moieties of the natural oil, the saturated fatty acid moieties of the native oil (~50
%) still limit the hydroxyl number and provides steric hindrances and dangling chains in
resulting polyurethanes.
The starting material of the present work derives from 1-butene cross metathesis of
palm oil (PMTAG), stripped of short chain olefins, which has been previously well
characterized [5]. PMTAG comprises approximately 25% terminal double bonds, 28%
shortened unsaturated fatty acids, and ~47% of saturates inherited from the natural oil.
PMTAG was easily converted into polyols by standard epoxidation and hydroxylation [5]
which were then used to make improved rigid and flexible polyurethane foams [8].
However, although the compressive strength of the foams was significantly enhanced due
to the reduction of dangling chains associated with the terminal unsaturated fatty acids,
undesirable long pendent chains were still present due to the relatively large number of
saturates left from the natural oil. Opportunely, PMTAG is comprised of two relatively
separate portions akin to the stearic and oleic portions of the natural palm oil, indicating
that it can be separated into high and low melting fractions. If a facile fractionation is
possible, the low melting portion should contain less of the highly saturated components
and therefore should make a feedstock which would help mitigate the problems associated
with the plasticizing action of the dangling chains in rigid foams. The material should also
be more easily processed because of a lower melting temperature and should present less

124
steric hindrance during functionalization to produce polyol and also in crosslinking process
to form polyurethanes.
Crystallization is one of the most effective and economical means for fractionating
vegetable oils [9]. Crystallization fractionation consists of two steps, first the cooling of
the liquid oil using specific processing conditions to a crystallization temperature and then
removal of the solid fat from the liquid oil [10]. During the cooling process, the high
melting components of the oil crystallize first and these can be removed from the liquid oil
via filtration or sedimentation. The parameters of an effective fractionation by
crystallization are determined by the cooling rate, the crystallization temperature and the
crystallization time [11]. Fractionation can be entirely from the melt (dry) or can be solvent
mediated. Solvent aided crystallization, although more expensive, is more efficient and
allows for facile filtration since the viscosity of the liquid oil is reduced when a solvent is
present [11]. Furthermore, it can be advantageous if the solvent was a part of the further
transformation of the material, such as in the synthesis of polyols. For this reason both
solvent and dry crystallization methods were used to fractionate PMTAG in an attempt to
optimize yield and composition of the fractions, particularly with respect to the synthesis
of polyols and rigid polyurethane foams.
Several studies regarding the fractionation of palm oil by dry as well as solvent aided
crystallization have been published [12-14]. The present work reports on the fractionation
of PMTAG and the synthesis of polyols from the fractions. The fractionation was
performed by dry as well as solvent mediated crystallization for optimum yield and quality
of the liquid fraction. Quality here refers to maximum unsaturation content. The polyols
were synthesized by standard epoxidation and hydroxylation reactions, and characterized

125
chemically and physically to determine their suitability as monomers for the preparation of
polyurethane foams. The rigid and flexible foams were prepared with similar densities
(~160 kg m-3) to allow for comparison. The urethane linkage of the foams was confirmed
by FTIR. Their morphology, thermal decomposition and thermal transition behaviours
were studied by scanning electron microscopy (SEM), thermogravimetric analysis (TGA)
and differential scanning calorimetry (DSC), respectively. The compressive strength of the
foams were determined with a texture analyzer.
4.2 Materials and Methods
4.2.1 Materials
PMTAG was provided by Elevance Renewable Sciences (ERS, Bolingbrook, II).
Dichloromethane (DCM), ethanol (anhydrous), toluene, potassium hydroxide, and sodium
thiosulfate were purchased from ACP Chemical Int. (Montreal, Quebec, Canada) and used
without further treatment. Formic acid (88 wt %) and hydrogen peroxide (30 wt% in H2O),
iodine monochloride (95%), potassium iodide (99%), dibutin dilaurate (DBTDL), glycerin
(99.5 %) and phenolphthalein were purchased from Sigma-Aldrich Canada Co. (Oakville,
Ontario, Canada). Perchloric acid (70%), N, N-dimethylethanolamine (DMEA) was
purchased from Fisher Scientific, USA, diphenylmethane diisocynate (MDI) from Bayer
Materials Science (Pittsburgh, PA), and polyether-modified surfactant (TEGOSTAB B-
8404) from Goldschmidt Chemical Canada. HPLC grade solvents were obtained from
VWR International, Mississauga, ON.

126
4.3 Chemistry Characterization Techniques
4.3.1 Titrimetric Methods (OH value, Acid value, Iodine value)
Iodine and acid values of SF- and LF- PMTAG were determined according to ASTM
D5554-95 and ASTM D4662-03, respectively. OH and acid values of the polyols were
determined according to ASTM S957-86 and ASTM D4662-03, respectively.
4.3.2 Proton Nuclear Magnetic Resonance Spectroscopy (1HNMR)
1H-NMR spectra were recorded CDCl3 on a Varian Unity-INOVA at 499.695 MHz
using an 8.6 μs pulse with 4 transients collected in 16 202 points. Datasets were zero-filled
to 64 000 points and a line broadening of 0.4 Hz was applied prior to Fourier transforming
the sets. 1H chemical shifts are internally referenced to CDCl3 (7.26 ppm). The spectra
were processed using spinwork NMR Processor, version 3.
4.3.3 Fourier Transform Infrared Spectroscopy (FTIR)
FTIR spectra of the foams were obtained using a Thermo Scientific Nicolet 380 FT-
IR spectrometer (Thermo Electron Scientific Instruments, LLC, USA) equipped with a
PIKE MIRacleTM attenuated total reflectance (ATR) system (PIKE Technologies,
Madison, WI, USA.). Foam samples were loaded onto the ATR crystal area and held in
place by a pressure arm. The spectra were acquired over a scanning range of 400-4000 cm-
1 for 32 repeated scans at a spectral resolution of 4 cm-1.
4.4 Physical Characterization Techniques
4.4.1 Thermogravimetric Analysis (TGA)
The TGA measurements were carried out on a Q500 model (TA Instruments, DE,
USA) under dry nitrogen of 40 mL/min for balance purge flow and 60 mL/min for sample

127
purge flow. Approximately 8.0 – 15.0 mg of sample was loaded into the open TGA
platinum pan then heated from 25 °C to 600 °C at a constant rate of 10 °C/min.
4.4.2 Differential Scanning Calorimetry (DSC)
DSC was performed on a Q200 model (TA Instruments, New Castle, DE) under a
nitrogen flow of 50 mL/min. Samples between 3.5 and 6.5 (± 0.1) mg were run in
hermetically sealed aluminum DSC pans. DSC measurements of the PMTAG fractions and
PMTAG Polyols were run in standard mode. The sample was equilibrated at 90 °C for 10
min to erase thermal memory, and then cooled at 5.0 °C/min to -90 °C where it was held
isothermally for 5 min, and subsequently reheated at 5.0 °C/min to 90 °C. PMTAG was
also cooled at 0.1 C/min and 1 C/min to investigate the effect of cooling rate on its
crystallization behavior.
In order to obtain a better resolution of the glass transition, the foams were
investigated using modulated DSC following the ASTM E1356-03 standard. The sample
was first equilibrated at 25 °C and heated to 150 °C at 10 °C/min (first heating cycle), held
at that temperature for 5 min and then cooled down to -90 °C at 10 °C/min, and
subsequently reheated to 150 °C at the same rate (second heating cycle). Modulation
amplitude and period were 1 °C and 60 s, respectively.
The “TA Universal Analysis” software version 5.4 was used to analyze the DSC
thermograms and extract the peak characteristics. Characteristics of non-resolved peaks
were obtained using the first and second derivatives of the differential heat flow.
128
4.4.3 Rheology
A temperature-controlled Rheometer (AR2000ex, TA Instruments, DE, USA) fitted
with a 40 mm 2° steel geometry was used to measure the viscosity and flow property of the
PMTAG fractions and PMTAG Polyols. Temperature control was achieved by a Peltier
attachment with an accuracy of 0.2°C. Shear Stress was measured at each temperature by
varying the shear rate from 1 to 1200 s-1. Measurements were taken at 10 °C intervals from
high temperature (100 °C) to 10 °C below the DSC onset of crystallization temperature of
each sample. The viscosity versus temperature data were collected at 200 s-1 using the
constant temperature rate method (1.0 °C/min). Data points were collected from each
sample’s melting point up to 110 °C at intervals of 1 °C. The viscosity obtained in this
manner was in very good agreement with the measured viscosity using the shear rate/share
stress.
The shear rate – shear stress curves were fitted with the Herschel-Bulkley equation
(Eq. 2.1), a model commonly used to describe the general flow behavior of liquid materials,
including those characterized by a yield stress.
0
nK Eq. 4.1
Where denotes the shear stress, 0 is the yield stress below which there is no
flow, K the consistency index and n the power index. n depends on constitutive
properties of the material. For Newtonian fluids n = 1, shear thickening fluids, 1n and
for shear thinning fluids, 1n .

129
4.4.4 Scanning Electron Microscopy (SEM)
A scanning electron microscope (SEM), model Tescan Vega II, was used under
standard operating conditions (10 keV beam) to examine the pore structure of the foams.
A sample of approximately 2 cm x 2 cm and 0.5 cm thick was cut from the centre of a 60-
mm diameter and 36-mm long specimen. The sample was coated with a thin layer of carbon
(~30 nm thick) using an Emitech K950X turbo evaporator to ensure electrical conductivity
in the SEM chamber and prevent the buildup of electrons on the surface of the sample. All
images were acquired using a secondary electron detector to show the surface features of
the sample.
4.4.5 Compressive Strength
The compressive strength of the foams was measured at room temperature using a
texture analyzer (Texture Technologies Corp, NJ, USA). Samples were prepared in
cylindrical Teflon molds of 60-mm diameter and 36-mm long. The cross head speed was
3.54 mm/min with a load cell of 750 kgf. The load was applied until the foam was
compressed to approximately 15% of the original thickness for the rigid foam, and 65%
for the flexible foam.
4.5 Fractionation of PMTAG by dry and solvent mediated crystallization
The fractionation protocol for PMTAG was informed by its cooling thermal
transition behavior. Figure 4.1 shows the DSC cooling thermograms of PMTAG obtained
with 0.1 °C/min, 1.0 °C/min and 5.0 °C/min. The corresponding thermal data (onset ( OnT
), offset ( OffT ) and peak ( pT ) temperatures) are listed in the Appendix in Table A2.

130
Figure 4.1. Crystallization thermograms of PMTAG obtained at 0.1 °C/min, 1
°C/min and 5 °C/min.
As can be seen, all the thermograms of Figure 4.1 present three distinguishable peaks
(P1, P2 and P3 in Figure. 4.1) indicative of three different crystallization events
representing a high and two low temperature crystallizing portions [15]. The lowest
temperature peak (P3) was well separated in the 0.1 C/min experiment only. Although P3
is related to a specific well-defined molecular portion of PMTAG (the lowest crystalizing
portion), it cannot be easily separated from the main low temperature fraction expressed
by P2. In fact, the DSC trace reveals the presence of a high and a low temperature
crystallizing portions reminiscent of the stearin and olein of the natural palm oil [5, 16].
The combined P2 and P3 are the recording of the olein-like portion of PMTAG and P1 the
recording of its stearin-like portion. The data from Figure 4.1 motivates a cooling protocol
and crystallization temperature ranges that would be optimal for the separation of PMTAG
(a)
Temperature (oC)
-20 -10 0 10 20 30 40
Heat
Flo
w (
Wg
-1)
(
Exo u
p)
0.00
0.01
0.02
0.03
0.25
0.50
0.75
1.0
0.1
5.0
P1
P2
P3
Rate
(oC
/min
)

131
into a high and low melting fractions. As is indicated by the DSC thermograms, a better
separation would be obtained with the slowest cooling of PMTAG. One then can choose
an isothermal crystallization temperature (CT ) where only the nucleation of the high
crystallizing molecules (stearin-like portion) are occurred, i.e., above at least the offset of
the first peak to avoid the formation of the low melting crystals (olein-like portion). The
isothermal crystallization time period (Ct ) should be chosen to allow for the stearin-like
portion to solidify. The choice of CT and
Ct will dictate the yield and quality of the
separation provided a proper filtration of the solids from the liquid can be achieved. The
same considerations are valid for both the dry and solvent crystallization, taking into
account their actual crystallization parameters and more importantly, the boiling point of
the solvent, in our case 39.6 °C for DCM.
Four (04) dry fractionation experiments (method labeled D), and one (01) solvent
mediated crystallization experiment (method labeled S) were used to optimize the
fractionation of PMTAG with a compromise between “quality” and yield of the liquid
fraction. The details of the fractionation experiments are presented in Table 4.1.
4.5.1 Dry crystallization experiments
Four sets of fractionation experiments were conducted with the dry crystallization
method (F1-F4 in Table 4.1). Between 200 and 260 g of melted PMTAG was equilibrated
at 90 °C in a round bottom flask placed in a temperature controlled water bath (Julabo
FP50-ME, Julabo USA Inc., Vista, CA). The sample was cooled down at a prescribed rate
(0.05 or 0.035 °C/min) to CT at which point it was crystallized isothermally under vigorous

132
stirring (500 rpm) during Ct . The solid fraction was filtered from the liquid with filter paper
(Fisherbrand™, P5) and with the help of a vacuum pump (BUCHI V-700, Switzerland).
4.5.2 Solvent Mediated Crystallization Experiment
For the solvent mediated fractionation (F5 in Table 4.1), 5 kg of melted PMTAG
was mixed under gentle stirring with 5 kg (3.8L) of DCM (PMTAG to DCM ratio of 1:1
(wt/wt)) in a preheated (37 °C) 20-L jacketed reactor (Heb Biotechnology Co., Ltd, Xi’an,
China). The reactor was kept at 37 °C with a connected temperature controlled circulator
(Hack Phoenix II P1 Circulator, Thermo Electron, Karlsruhe, Germany) until the
dissolution was complete. The PMTAG was then brought under stirring to a temperature
of 2 °C at which the stirring was turned off and the mixture was left to crystallize
isothermally for 24 h allowing for the stearin-like portion of PMTAG to crystallize and
eventually sediment. The crystallized material was then filtered from the liquid easily and
very effectively with filter paper (Fisherbrand™, P8, 15 cm) and vacuum (300 Torr).
Table 4.1. Fractionation data of PMTAG. aCT : Crystallization temperature; b
Ct :
isothermal crystallization time
Experiment Mass (g) Cooling Rate (°C/min) aCT (°C) b
Ct (h) LF: Yield
(wt %)
F1 200 0.050 35.0 7.0 28
F2 250 0.035 39.5 9.0 45
F3 244 0.035 35.0 6.5 37
F4 258 0.035 29.0 11.0 22
F5 5000 Quiescent 2.0 24.0 70

133
4.6 Synthesis of the Polyols
Polyols were synthesized from LF- and SF-PMTAG in a two-step reaction;
epoxidation by formic acid and hydrogen peroxide (H2O2), followed by hydroxylation
using water and perchloric acid (HClO4) as the catalyst following a previously reported
method, [5]. The chemical route is described in Scheme 4.1
Scheme 4.1. Synthesis route of polyols from the liquid and solid fraction of PMTAG
(n=0, 2, 8; m=11 to 20).
This is a well-established economical route to produce polyols with maximum
hydroxyls. In this method the double bonds are converted into oxirane moieties and the
epoxy groups are converted into hydroxyl groups by ring opening reaction with suitable
reagents like HClO4 and H2O to give the polyol. The polyols produced from liquid and
solid fractions are labeled LF-Polyol, and SF-Polyol, respectively.

134
4.6.1 Epoxidation
Formic acid (88%; 200g) was added to a solution of fractionated PMTAG (200 g) in
DCM (240 mL). The mixture was cooled to 0 °C in an ice bath, and hydrogen peroxide (30
%, 280 g) was added drop wise while stirring with a mechanical stirrer (500 to 600 rpm).
After the addition of hydrogen peroxide, the mixture was raised to 50 °C and kept at this
temperature with stirring until the reaction was complete. The reaction was monitored by
a combination of TLC and 1H-NMR, and was deemed complete after 48 h. The reaction
mixture was then diluted with 250 mL of DCM, washed with water (200 mL × 2), and then
with saturated sodium hydrogen carbonate (200 mL × 2), and again with water (200 mL ×
2). The resulting epoxide was rotary evaporated to remove the solvent, and then was dried
over anhydrous sodium sulphate.
4.6.2 Hydroxylation
Approximately 200 g of crude fractionated PMTAG epoxide was dissolved at room
temperature in a 500 mL mixture of THF/H2O (3:2) containing 14.5 g of perchloric acid.
The resultant mixture was stirred at room temperature for 36 h, a time after which the
reaction which was monitored by a combination of TLC and 1H-NMR was deemed
complete. The reaction mixture was poured into 240 mL water and extracted with CH2Cl2
(2×240 mL). The organic phase was washed with water (2 × 240 mL), followed by 5%
aqueous NaHCO3 (2 × 200 mL), and then with water again (2 × 240 mL), and then dried
over Na2SO4. After removing the drying agent by filtration, the solvent was removed with
a rotary evaporator and further dried by vacuum overnight, giving a light yellow grease-
like solid.

135
4.7 Polymerization Method
The formulation recipes for the preparation of rigid and flexible polyurethane foams
from LF-Polyol are provided in Table 4.2. The ingredient amounts are based on 100 parts
by weight of polyol. The amount of MDI was calculated based on an isocyanate index 1.2
(NCO to OH ratio of 1.2 to 1). All the ingredients, except MDI, were weighed into a beaker,
and pre-weighed MDI was added to the beaker using a syringe. The resulting mixture was
mechanically mixed vigorously for 10 to 20 s. the mixture was immediately transferred
into a cylindrical Teflon mold (60 mm diameter and 35 mm long) previously greased with
a silicone release agent, and then sealed with a hand tightened clamp. The sample was
cured for four (4) days at 40 C and post cured for one (1) day at room temperature.
Table 4.2. Formulation Recipes for Rigid and Flexible Foams
Parts by weight
Ingredient Rigid Foams Flexible Foams
LF-Polyol 100 100
OH: NCO ratio 1:1.2 1:1.2
Glycerin 14.5 0
Water 2 2
Surfactant 2 2
Catalyst 1 0.1
Co-catalyst 1 0.1

136
4.8 Results and Discussion
4.8.1 Results of the fractionation of PMTAG
DSC investigation of the fractions confirmed that the fractionation was generally
effective and that a wide range of compositions for the liquid and the solid fractions can be
obtained by tuning the experimental parameters. The DSC cooling and heating
thermograms obtained in experiment F2 representative of the liquid and solid fractions of
PMTAG are presented in Figures 4.2a and 4.2b, respectively. The DSC thermograms of
the liquid and solid fractions obtained by the different fractionation methods are provided
in the Appendix in Figures. A5 – A6 and the corresponding thermal characteristics in
Table A3.
Figure 4.2. Typical DSC thermograms of the liquid (LF) and solid fractions (SF) of
PMTAG. (a) cooling and (b) heating (both at 5 C/min)
(a)
Temperature (oC)
-30 -15 0 15 30 45
Heat
Flo
w
(W
g-1
)
(E
xo u
p)
LF
SF
(b)
Temperature (oC)
-30 -15 0 15 30 45 60 75
Heat
Flo
w
(W
g-1
)
(E
xo u
p)
LF
SF

137
As can be seen in Figure 4.2a, the cooling thermograms of the solid fractions
displayed both the high and low temperature exotherms, indicating that it retained a part of
the olein-like portion of PMTAG. The DSC data of the LF- and SF-PMTAG are provided
in the Appendix Table A4. The enthalpy of the exotherm relevant to the olein-like part of
the solid fraction varied depending on the experiment but its onset of crystallization
remained constant and equal to what was measured for the starting PMTAG (see Figure
4.1). This indicates that the liquid was not selectively trapped in the solid.
F1, F2 and F5 experiments yielded liquid fractions comprising some of the stearin
portions of the PMTAG. However, as evident from the leading peak of LF in Figure 4.2a,
the onset of crystallization (~14 C) as well as the enthalpy were much lower than those of
PMTAG, indicating that the highest crystallizing temperature compounds of the stearin
portion were effectively removed. F3 and F4 experiments yielded liquid fractions
comprising the olein portion of PMTAG only but with relatively low yields (~37 %wt/wt
and 22 %wt/wt, respectively, Table 4.1). The onset temperature of crystallization of the
liquid fractions shifted to sub ambient temperatures, and their heating thermograms were
missing the highest melting peaks at ~ 47 C (Figure 4.2b). This indicates that the stearin
portion of the liquid fraction was depleted from the highest crystallizing components of
PMTAG and enriched with the unsaturated and the short saturated moieties.
The acid value of the SF- and LF- PMTAG fractions were all lower than 0.8 mg
KOH/g, indicating a very low free fatty acid content. The iodine value (IV) of the solid
fractions ranged from ~35 to ~36, much less than the 52 IV value of PMTAG, indicating
the extent at which the fraction was depleted from the unsaturated elements of PMTAG.

138
The liquid fractions of the PMTAG presented an IV of ~60 to ~61, higher than PMTAG,
which confirms that enrichment of the liquid fractions with olein-like molecules.
F2 which provided the liquid fraction with the best compromise between the
decrease in onset temperature of crystallization (13.5 C) and yield (45 %wt/wt) and which
presented the highest iodine value and lowest acidity value was selected for further analysis
and use for the synthesis of polyols. The selected fractions simply labelled LF-PMTAG
and SF-PMTAG for the liquid and solid fractions of PMTAG, respectively. The
corresponding polyols are also simply labeled LF-Polyol and SF-Polyol, respectively.
4.8.2 1H-NMR Characterization of the PMTAG fractions
1H-NMR spectra and corresponding 1H-NMR chemical shifts of LF- and SF-
PMTAG are provided in the Appendix in Figure A7-A8 and Table A5, respectively. As
expected, LF- and SF- PMTAG displayed the same chemical shifts observed for PMTAG
[5]. Scheme 4.2 represents the possible structures of LF- and SF-PMTAG as revealed by
1H-NMR.
The fatty acid profiles calculated based on the relative area under the characteristic
1H-NMR peaks are presented in Table 4.3. the terminal double bond, internal double bond
and saturated fatty acid contents were calculated based on the integrated protons under the
5.0 - 4.8 ppm, δ 5.5-5.3 ppm and 1.0-0.8 ppm peaks, respectively. Note that based on their
very low acid value (<1 mg KOH/g), the analysis of the 1H-NMR of LF and SF-PMTAG
was performed assuming that only TAG structures were present.

139
Scheme 4.2. Possible TAG structures in LF-and SF-PMTAG. n=0, 2, 8; m= 11 to
20.
Table 4.3. Fatty acid profile of SF-PMTAG and LF-PMTAG calculated based on the
relative area under the characteristic 1H-NMR peaks assuming TAG structures only. The
PMTAG data are provided for comparison purposes. TDB: Terminal double bonds; IDB:
Internal double bonds; FA: Fatty acid; SFA: Saturated fatty acid
FA with TDB (mol%) FA with IDB (mol%) SFA (mol%)
n=0 in Scheme 4.1 n=3 in
Scheme
4.1
n=8 in
scheme
4.1
Total
LF-PMTAG 21.1 14.1 16.7 30.8 48.1
SF-PMTAG 20.7 13.2 13.5 26.7 53.2
PMTAG 24.9 15.8 12.6 28.4 46.7
LF-PMTAG comprised more structures with internal double bonds (~31 mol%) and
structures with terminal double bonds (~21 mol%) than SF-PMTAG (~26 mol% and ~20
mol%, respectively). LF-PMTAG also comprised less saturated fatty acid chains than SF-
PMATG (~48 mol% compared to ~53 mol%, Table 4.3). The relatively large decrease in

140
the onset temperature of crystallization and offset temperature of melting of LF-PMTAG
is attributable also to a relatively higher number of TAGs with short saturated moieties
including trisaturated TAGs of the starting material such as trimyristoylglycerol (MMM)
and 1,2-dimyristoyl-3-palmitoyl-sn-glycerol (MMP).
4.8.3 Characterization of the polyols synthesized from LF- and SF-PMTAG
The polyols obtained from the liquid and solid fractions (LF-Polyol and SF-Polyol,
respectively) presented OH values of 184 and 136 mg KOH/g, respectively. Their acid
value was less than 4 mg KOH/g. These chemical characteristics are very suitable for the
further transformation of the polyols into polyurethane foams. The OH value of LF-Polyol
is understandably much higher than the OH value measured for the polyol obtained from
the non-fractionated PMTAG.
The structure of the LF-Polyol and SF-Polyol was determined based on the analysis
of 1H-NMR characteristic chemical shifts. The 1H-NMR data are provided in the Appendix
in Figures A9-A10 and Table A6. The 1H-NMR presented the peak characteristic of the –
OH groups (δ 3.8-3.4 ppm) but not the peak of the epoxides (δ 2.8-2.4 ppm) indicating that
the conversion to hydroxyl groups was complete. The polyols exhibited the chemical shifts
of methylene at δ 5.27 ppm and 4.2-4.0 ppm, and methine protons at δ 4.4-4.2 ppm typical
of TAG glycerol backbones. Furthermore, the peaks the methine protons presented a ratio
of 1:1 indicative of the integrity of the TAG backbone, confirming that the hydrolysis of
the TAG was avoided. Internal and terminal hydroxyls (diols, tetrols and hexols) were
detected in both LF-and SF-Polyols. The amount of hydroxyls as estimated by 1H-NMR
was ~47 %mol in SF-Polyol and~52 %mol in LF-Polyol. The percentage of terminal
hydroxyls in both LF- and SF-Polyols was ~21%. There were more non-terminal hydroxyls

141
in LF-Polyol than in unfractionated PMTAG Polyol (so called PMTAG Polyol) or SF-
Polyol. The possible structures of the polyols are shown in Scheme 4.3.
Scheme 4.3. Possible structures of LF- and SF-Polyols (n= 0, 2, 8; m=11 to 20)
4.8.3.1 Thermal Decomposition of LF- and SF-Polyols
The DTG profiles of LF-and SF-Polyols are shown in Figure 4.3. The corresponding
data are provided in the Appendix in Table A7. The DTG data indicate that the polyols
synthesized from the fractions undergo degradation mechanisms similar to the polyols
made from PMTAG [5]. The DTG curves presented a weak and broad peak centered at ~
220 °C followed by a large peak at 375 - 400 °C and a small shoulder at ~ 450 °C ( 1DT ,
2DT , and 3DT , respectively, in Figures. 4.3) indicating three steps of degradation. The first
step which involved ~1 to 3% weight loss may be due to the loss of hydroxyl groups [17].
The second DTG peak, where ~ 50 - 67% weight loss was recorded, is associated with the
breakage of the ester bonds [18]. Note that this mechanism of degradation was also
dominant in the starting LF- and SF-PMTAG. The small DTG shoulder at ~ 450 °C ( 3DT

142
in Figure. 4.3) indicate the decomposition high temperature fragments and of remaining
carbonaceous materials from the previous steps [17].
Figure 4.3. DTG of LF- and SF-Polyols
4.8.4 Crystallization and Melting Behavior of LF- and SF- Polyols
The crystallization and heating profiles (both at 5 °C/min) of LF- and SF-Polyols
are shown in Figures 4.4a and 4.4b, respectively. The corresponding thermal data are
provided in the Appendix listed in Table A8. As can be seen in Figure 4.4a, the three
peaks in the cooling thermograms of LF- and SF-Polyols (P1, P2 and P3 in Figure 4.4a),
although poorly separated, mirror the peaks observed in the thermograms of LF- and SF-
PMTAG indicating that the two-portion distribution of the starting fractions was preserved
in the polyols. Such a DSC trace indicates that although possible, one cannot separate easily
the high and low melting portions of the polyols. One can also note that the lowest
temperature peak (P3 in Figure 4.4a) is much more prominent in the polyols compared to
their starting material indicating a particular effect of the OH groups on the transition
behavior of the different collections of polyol molecules.
Temperature (oC)
100 200 300 400 500
DT
G
(%
oC
-1)
LF
SF
TD3
TD2
TD1

143
The cooling and heating thermograms of the polyol synthesized with the solid
fractions of PMTAG shows significant differences with those of the liquid Fraction. SF-
Polyol crystallized at 5 C higher temperature than LF-Polyol and presented extra peaks at
the high temperature side of the thermogram (P1 and P1’ of SF at the right side of P1 of
LF in Figure 4.4a). The endotherms of its melting trace were visibly separated contrary to
the greatly overlapped endotherms of LF-Polyol. The crystallization traces of the polyols
are directly related to their unbalanced olein-like/ stearin-like composition, wherein, SF-
Polyol comprised the saturated TAGs (P1 in Figure 4.4a), partially functionalized TAGs
with long saturated moieties (P1’ in Figure 4.4a) as well as higher level hydroxyls such as
tetrols and hexols.
The melting behavior of the polyols is directly related to the degree of separation
in crystallization temperature of “families” of molecules present. The melting peaks of SF-
Polyol are well separated contrary to those of LF-Polyol because of large difference
between the stearin-like molecules (as represented by P1 in Figure 4.4a) and the
functionalized molecules from the olein-like molecules of SF-PMTAG. The occurrence of
a prominent exotherm during the heating of SF-Polyol is an indication of a crystallization
mediated by melt that resulted in the shifting of its offset temperature to ~50 °C closer to
~45°C of LF-Polyol which did not experience a detectable exotherm. This relatively
intense transformation was probably experienced by a substantial number of partially
functionalized TAGs in SF-Polyol. The melting point of LF-Polyols as determined by its
offset temperature of melting was ~45 ºC, a value close to that of PMTAG Polyol: 47 ºC
[5]. This indicates that similar reaction temperatures and equipment can be used for the
further transformation of LF-Polyol into polyurethane foams.

144
Figure 4.4. DSC thermograms of LF- and SF-Polyols obtained from the liquid
fractions and solid fractions of PMTAG during (a) Cooling (5.0 C/min), and (b)
subsequent heating (5 °C/min).
4.8.5 Flow Behavior and Viscosity of LF- and SF-PMTAG Polyols
Selected shear stress versus shear rate curves recorded for LF- Polyol between 30 ºC
to 100 ºC are shown in Figure 4.5 a. Fits to the Herschel-Bulkley model are included in
the figure (dashed lines in Figure. 4.5a). Evident from Figure 4.5a, share rate – shear stress
curves of the LF Polyol were linear for the whole shear rates range, except at 40 ºC where
it was linear below 500 s-1 only, indicating Newtonian behavior. Similar curves indicating
a Newtonian flow within 50 ºC to 90 ºC were obtained for SF-Polyols (data not shown).
The data collected below the onset of crystallization of LF-Polyol (~29 °C) and SF-Polyol
(~32 °C) indicated that the sample has crystallized. Figure 4.5b presents the viscosity
versus temperature plot obtained during cooling at 1 °C/min for LF- and SF-Polyols. As
(a)
Temperature (oC)
-10 0 10 20 30 40
Heat
Flo
w
(Wg
-1)
(
exo u
p)
P2P3
P1
P2
P3
P1
LF
SF
(b)
Temperature (oC)
0 15 30 45 60
Heat
Flo
w
(W
g-1
)
(end
o d
ow
n)
SF
LF
G1 G2

145
evident from the figure, the viscosity of LF-Polyol was higher at all temperatures with the
difference decreasing with increasing temperature. Although relative molecular size could
have played a role, this difference is mainly attributable to a higher number of hydroxyls
in LF-Polyol, as manifest in the OH value. Note that the viscosity of LF-Polyol is also
higher than that of PMTAG Polyol [5, 19], also attributable to the higher OH value of LF-
Polyol compared to PMTAG Polyol [20].
Figure 4.5. (a) Shear rate- shear stress of LF-Polyol), (b) viscosity versus
temperature of LF- and SF-Polyols. Solid lines in (a) are fits to the Herschel-Bulkley model
(Eq. 4.1).
4.9 Polyurethane Rigid and Flexible Foams
Because of its high OH value, favorable thermal transition properties, particularly its
advantageous melting behavior, and suitable viscosity profile, LF-polyol was selected for
making rigid and flexible polyurethane foams. The same density was targeted for the
foams. Rigid foam of density 163 kgm-3 and flexible foam of density 161 kgm-3 were
prepared from LF-Polyol (see formulation recipe in Table 4.2) by the same protocol that
was used for the preparation of PMTAG Polyol foams [8].
(a)
Shear Rate (s-1
)
0 200 400 600 800 1000 1200
Sh
ea
r S
tre
ss
(Pa
)
0
100
200
300
400
500
50
T (oC)
60
70
80
90
40
o C
(b)
Temperature (oC)
45 65 85
Vis
cosity
(P
a.s
)
0.0
0.1
0.2
0.3
0.4
0.5
SF
LF

146
4.9.1 FTIR of LF-PMTAG Polyol Foams
Figure 4.6 represents the FTIR spectra of the rigid and flexible foams prepared
from LF-Polyol. One can first notice that there is no significant difference between the two
spectra. The broad absorption bands of NH groups centered at 3300-3400 cm-1 and C=O at
1700 cm-1 confirms the presence of urethane linkages [21]. The band centered at 1510-
1520 cm-1 is characteristic of C-N bonds in the urethane linkage [22]. The band at 2270
cm-1 related to NCO groups indicates that the isocyanates was not fully reacted [21, 23].
The overlapping peaks between 1710 and 1735 cm-1 suggest the presence of urea and
isocyanurates in the foams. The peak at 1410-1420 cm-1 reveals the presence of
isocyanurate trimers, indicating the occurrence trimerization reaction of diisocyanates
during the foaming process. The characteristic band related to ester carbonyl (C=O) of the
polyol backbone is visible at 1744 cm-1. The stretching vibration of -C-H in -CH3 and -CH2
groups in the aliphatic chains is visible at 2915-2925 cm-1 and 2850-2860 cm-1, respectively
[24].

147
Figure 4.6. Typical FTIR spectra of the rigid (RF) and flexible foams (FF) prepared from
LF-Polyol.
4.9.2 SEM Analysis of LF-Polyol Foams
Figures 4.7a and 4.7b shows SEM images of the rigid and flexible foams,
respectively. one can notice that the rigid foam displayed more compact and uniform closed
cells compared to flexible foam because of the effect of the terminal hydroxyl glycerin
cross linker added in the rigid and not in the flexible foam formulation [25]. In the absence
of a glycerin cross linker, the terminal and internal hydroxyl groups in the same polyol
which cross links at different rates during the polymerization process might be another
reason for the non-uniform cell size of the flexible foam [26].
The rigid foam displayed closed cell structure with ~30 cells/mm2 and a cell size of
217± 24 µm which were higher compared to those of the rigid foams made from PMTAG
Polyol (density ~24 cells/mm2 and cell size 270 ± 40 µm [8]). This is attributable to the
high cross linking density promoted by lesser amount of saturated dangling chains in the
rigid foams made from the high hydroxyl LF-Polyol compared to the rigid PMTAG Polyol
292
5 c
m-1
227
0 c
m-1
Wavenumber (cm-1
)
100015002000250030003500
Ab
so
rba
nce
3344
cm
-1 292
5 c
m-1
RF
FF
227
0 c
m-1
284
8 c
m-1
172
5 c
m-1
151
1 c
m-1
141
4 c
m-1

148
foam. The flexible foam displayed a closed cell structure with cell size of ~330 ± 40 µm
and cell density (~15 cells/mm2) both smaller than those of the flexible foam made from
PMTAG Polyol (cell size ~386 ±55 µm, and density ~18 cells/mm2 [8]).
(a)
(b)
Figure 4.7. SEM images of rigid and flexible LF-Polyol foams: (a) rigid foam, (b)
flexibe foam
4.9.3 Thermal degradation Properties of LF-Polyol Foams
Figures 4.8 shows the DTG profiles of the rigid and flexible LF-Polyol foams. The
corresponding characteristic data are provided in the Appendix listed in Table A8. Both
the rigid and flexible foams prepared from LF-Polyol displayed thermal decomposition
profile comparable with other vegetable based polyol foams [21, 27, 28]. The DTG curves
of the rigid foam and flexible foam showed four prominent peaks (indicated by their peak
temperatures in Figures. 4.8) indicating a multi stage decomposition process. The weight
loss in the first step of the rigid foam degradation (21%) was higher than in the flexible
foam (17%) probably due to the higher amount of short urethane structures from low
molecular weight glycerol [29]. The decomposition peak around 300 °C involved a total

149
weight loss of ~17 to 21 % for the flexible and rigid respectively, and is related to the
dissociation of urethane bonds [29, 30]. The decomposition step in the range 360-430 °C
is associated with the degradation of the soft segments (polyol backbone) [30]. The soft
segments dissociate into carbon monoxide, carbon dioxide, carbonyls (aldehyde, acid,
acrolein), olefins and alkenes [18, 30]. This decomposition step involved the largest weight
loss with ~65% of the total. More strongly bonded fragments and carbonaceous materials
from the previous steps may have decomposed around 450 °C [8, 17].
Figure 4.8. (a) DTG of rigid (RF) and flexible (FF) LF-Polyol foams
Temperature (oC)
100 200 300 400 500
DT
G
(%
/oC
)
30
2 o
C
36
1 o
C
44
6 o
C
30
7 o
C
42
0 o
C
RF
FF

150
4.9.1 Thermal transition Properties of LF-Polyol Foams
Figure 4.9. DSC thermogram of rigid (RF) and flexible (FF) LF-Polyol foams
Figures 4.9 shows the DSC profiles obtained during the second heating cycle of the
rigid and flexible foam from LF-Polyol. The rigid and flexible foams displayed one
inflection point indicating a glass transition at ~ -21.4 °C and ~ -18.0 °C, respectively. The
glass transitions of the rigid and flexible foams are associated with the molecular motion
of the soft segments related to the polyols [31]. Unlike the rigid and flexible foams from
PMTAG Polyol [5], those made from LF-Polyol did not show a glass transition related to
the relaxation of the urethane segment. This may be due to the compact crosslink network
achieved by the foams due to the absence of saturated dangling chains in LF-Polyol.
4.9.2 Compressive Strength of LF-Polyol Foams
The compressive strength versus strain curves of the rigid and flexible foams are
shown in Figure 4.10a and 4.10b, respectively. The rigid and flexible foams displayed
relatively quick yielding up to 6% and 8%, respectively, followed by a plateau-like region
over which there is a little increase in stress with increasing strain. The initial region up to
Temperature (oC)
-40 0 40 80 120
Heat
Flo
w
(W
g-1
) Tg
RF
FF

151
~4% in case of the rigid foam and ~6% in case of flexible foam indicates their respective
elastic regions. The plateau-like region resulted from either the collapse or cell wall
buckling of the foams [24]. Further compression above 30% (Figure. 4.10b) in case of
flexible foams results in crushing of the cell wall and is referred to as the densification
region [24].
Figure 4.10. Compressive strength versus strain curves of (a) Rigid LF-Polyol foam
of density 163 kg/m3 (RF) and (b) Flexible LF-Polyol Foam of density 161 kg/m3 (FF).
Table 4.4. Compressive strength of LF-PMTAG Polyol Foams at different strain (%):
Rigid LF-Polyol Foam (RF), Flexible LF-Polyol Foam (FF); Rigid PMTAG Polyol Foam
(RF-PMTAG Polyol); and Flexible PMTAG Polyol Foam (FF-PMTAG Polyol)
Foams Density (kgm-3) Compressive strength (MPa)
@ Strain (%) 6 10
RF 163 1.19 1.29
RF-PMTAG Polyol 161 0.66 0.85
@ Strain (%) 10 25
FF 160 0.52 0.61
FF-PMTAG Polyol 164 0.69 0.83
Strain (%)
0 3 6 9 12 15
Com
pre
ssiv
e s
tre
ngth
(
MP
a)
0.0
0.4
0.8
1.2
1.6
RF
(a) (b)
Strain (%)
0 10 20 30 40 50
Com
pre
ssiv
e S
trength
(
MP
a)
0.0
0.4
0.8
1.2
1.6
FF

152
The compressive strength of rigid and flexible foams from LF-Polyol at selected
strain is presented in Table 4.4. The rigid foam (RF) displayed a higher compressive
strength than the rigid PMTAG Polyol foam (1.29 MPa compared to 0.85 MPa at 10%, as
seen in Table 4.4). This corroborates that the fractionation process was very effective in
removing the saturated chains from LF-PMTAG, leading to LF-Polyol with much less
pendant chains, which resulted in a higher compressive strength of the rigid foams.
Although LF-Polyol presented a higher OH value than PMTAG Polyol, the flexible foam
from LF-Polyol (FF) displayed a lower compressive strength (see Table 4.4) than the
flexible PMTAG Polyol foam (FF-PMTAG Polyol) because of the higher percentage of
terminal hydroxyls in PMTAG Polyol (~24.1 mol%) compared to the LF-Polyol (~20
mol%).
Figure 4.11. Recovery of LF-Polyol Flexible Foam (FF) as a function of time (min)
Figure 4.11 shows the percentage of recovery in thickness of flexible foams (FF) as
a function of time. The recovery in thickness of the flexible foams were measured after its
maximum compression (65%) using a Vernier caliper. The recovery in thickness was
Time (min)
0 3 6 9 12 15 15003000
Recovery
(
%)
0
20
40
60
80
100
FF

153
recorded every minute for the first ten minutes, then after 1, 2, 24 and 48 h. More than 80%
recovery was obtained in less than 2 min. Similar like FF-PMTAG Polyol, the FF also
showed a good recovery, which substantiates its suitability for flexible foam applications.
4.10 Conclusions
The fractionation by dry and solvent mediated crystallization was demonstrated to
effectively remove the non-functional saturated triacylglycerols (TAGs) of PMTAG. The
fatty acid profile of the fractions of PMTAG was reflected in the chemical characteristics
such as iodine value and physical properties such as the thermal phase transitions. The
liquid fraction (LF-PMTAG) which was devoid of the saturated TAGs and enriched in
unsaturated fatty acid moieties displayed an onset temperature of crystallization 15 °C
lower than the solid fraction (SF-PMTAG) which retained the trisaturated TAGs and some
of the partially unsaturated TAGs. Its onset of crystallization was 11 °C lower than that of
PMTAG also. However, LF-PMTAG possessed a lower percentage of terminal double
bonds compared to PMTAG, probably because these were predominantly found in TAGs
with long saturated fatty acid moieties that were selectively filtered with the solid fraction.
Also, the molar percentage of oleoyl type molecules, with internal double bonds, was
higher in LF-PMTAG compared to PMTAG and SF-PMTAG probably because of its
higher content of tri, dioleoyl type of TAGs as well as their combination with short fatty
acids moieties.
Because the epoxidation and hydroxylation reaction was complete, the polyols
synthesized from LF-PMTAG and SF-PMTAG consisted of diols, tetrols and hexols with
terminal and internal hydroxyl molecules that matched the composition of the starting
fraction. Expectedly, the polyol produced from LF-PMTAG (LF-Polyol) presented an OH

154
value (184 mg KOH/g) that is higher than polyol made with SF-PMTAG (SF-Polyol, 136
mg KOH/g ) and PMTAG Polyol (155 mg KOH/g), the polyol synthesized from the non-
fractionated PMTAG. LF-Polyol presented a melting point at ~45 °C, and a relatively low
viscosity when liquid, all characteristics suitable for the processing and transformation of
the polyol into polyurethane foams using normal polymerization conditions and existing
equipment.
The OH value, melting point and viscosity profile of LF-Polyol allowed the
preparation of rigid as well as flexible foams having enhanced physical and structural
properties. The rigid foam prepared from LF-Polyol for example displayed a compressive
strength more than 50% higher than the rigid foam made from PMTAG. Also, the quality
of the flexible foam made from LF-Polyol as estimated with the compressive strength and
recovery measurements was measurably higher than that of the flexible PMTAG Polyol
foam. The closed cell structure of both the rigid and flexible foams, as shown by SEM,
indicates that they are suitable for structural and thermal insulation applications.
The study demonstrate that the fractionation technology can be used to custom design
PMTAG feedstocks with controlled iodine value and varied distribution of unsaturation,
position of the double bonds and chain length using existing equipment. It was also
demonstrated that polyols with high OH value, and suitable melting and viscosity profiles
can be synthesised from such feedstocks, and that enhanced rigid as well flexible
polyurethane foams can be easily produced without the need for specialized infrastructure,
equipment or technology.

155
4.11 References
[1] Braipson‐Danthine S, Gibon V. Comparative analysis of triacylglycerol composition,
melting properties and polymorphic behavior of palm oil and fractions. European Journal
of Lipid Science and Technology. 2007;109(4):359-72.
[2] Pawlik H, Prociak A. Influence of palm oil-based polyol on the properties of flexible
polyurethane foams. Journal of Polymers and the Environment. 2012;20(2):438-45.
[3] Narine SS, Kong X, Bouzidi L, Sporns P. Physical properties of polyurethanes
produced from polyols from seed oils: II. Foams. Journal of the American Oil Chemists'
Society. 2007;84(1):65-72.
[4] Zlatanić A, Petrović ZS, Dušek K. Structure and Properties of Triolein-Based
Polyurethane Networks. Biomacromolecules. 2002;3(5):1048-56.
[5] Prasanth S. Pillai LB, Shaojun Li and Suresh S. Narine. 1-Butene Metathesized Palm
Oil & Polyol Derivatives: Structure, Chemical Composition and Physical Properties.
Submitted to Industrial Crops and Products. 2015.
[6] Mol J. Catalytic metathesis of unsaturated fatty acid esters and oils. Topics in Catalysis.
2004;27(1-4):97-104.
[7] Connon SJ, Blechert S. Recent developments in olefin cross‐metathesis. Angewandte
Chemie International Edition. 2003;42(17):1900-23.
[8] Prasanth S. Pillai SL, Laziz Bouzidi and Suresh S. Narine Water-Blown Bio-Based
Polyurethane Foams from 1-Butene Metathesized Palm oil Polyol. Submitted to Industrial
Crops and Products. 2015.
[9] Hamm W. Trends in edible oil fractionation. Trends in Food Science & Technology.
1995;6(4):121-6.
[10] Timms RE. Fractional crystallisation- the fat modification process for the 21 st
century. European Journal of Lipid science and Technology. 2005;107(1):48-57.
[11] Dunn RO. Improving the cold flow properties of biodiesel by fractionation: INTECH
Open Access Publisher, 2011.
[12] Kellens M, Gibon V, Hendrix M, De Greyt W. Palm oil fractionation. European
Journal of Lipid Science and Technology. 2007;109(4):336-49.
[13] Ramli M, Siew W, Cheah K. Properties of High‐Oleic Palm Oils Derived by Fractional
Crystallization. Journal of Food Science. 2008;73(3):C140-C5.
[14] Hasmadi M, AINI I, Mamot S, Yusof M. The effect of different types of stirrer and
fractionation temperatures during fractionation on the yield, characteristics and quality of
oleins. Journal of Food Lipids. 2002;9(4):295-307.
156
[15] Tan C, Man YC. Differential scanning calorimetric analysis of palm oil, palm oil based
products and coconut oil: effects of scanning rate variation. Food Chemistry.
2002;76(1):89-102.
[16] Zaliha O, Chong C, Cheow C, Norizzah A, Kellens M. Crystallization properties of
palm oil by dry fractionation. Food Chemistry. 2004;86(2):245-50.
[17] Lin B, Yang L, Dai H, Hou Q, Zhang L. Thermal analysis of soybean oil based polyols.
Journal of Thermal Analysis and Calorimetry. 2009;95(3):977-83.
[18] Gryglewicz S, Piechocki W, Gryglewicz G. Preparation of polyol esters based on
vegetable and animal fats. Bioresource Technology. 2003;87(1):35-9.
[19] Prasanth S. Pillai SL, Laziz Bouzidi and Suresh S. Narine. Solvent Free synthesis of
Polyols from 1-Butene Metathesized Palm Oil for Use in Polyurethane Foams. Submiited
to Journal of Applied Polymer Science. 2015.
[20] Dai H, Yang L, Lin B, Wang C, Shi G. Synthesis and characterization of the different
soy-based polyols by ring opening of epoxidized soybean oil with methanol, 1, 2-
ethanediol and 1, 2-propanediol. Journal of the American Oil Chemists' Society.
2009;86(3):261-7.
[21] Chuayjuljit S, Sangpakdee T, Saravari O. Processing and properties of palm oil-based
rigid polyurethane foam. The Journal of The Minerals, Metals & Materials Society.
2007;17:7-23.
[22] Piszczyk Ł, Strankowski M, Danowska M, Hejna A, Haponiuk JT. Rigid polyurethane
foams from a polyglycerol-based polyol. European Polymer Journal. 2014;57:143-50.
[23] Narine SS, Yue J, Kong X. Production of polyols from canola oil and their chemical
identification and physical properties. Journal of the American Oil Chemists' Society.
2007;84(2):173-9.
[24] Gu R, Konar S, Sain M. Preparation and characterization of sustainable polyurethane
foams from soybean oils. Journal of the American Oil Chemists' Society.
2012;89(11):2103-11.
[25] Szycher M. Handbook of polyurethanes. CardioTech International Inc., Woburn, MA
(US); 1999.
[26] Campanella A, Bonnaillie LM, Wool RP. Polyurethane Foams from Soyoil-Based
Polyols. Journal of Applied Polymer Science. 2009;112(4):2567-78.
[27] Ravey M, Pearce EM. Flexible polyurethane foam. I. Thermal decomposition of a
polyether‐based, water‐blown commercial type of flexible polyurethane foam. Journal of
Applied Polymer Science. 1997;63(1):47-74.

157
[28] Guo A, Javni I, Petrovic Z. Rigid polyurethane foams based on soybean oil. Journal
of Applied Polymer Science. 2000;77(2):467-73.
[29] Javni I, Petrović ZS, Guo A, Fuller R. Thermal stability of polyurethanes based on
vegetable oils. Journal of Applied Polymer Science. 2000;77(8):1723-34.
[30] Shufen L, Zhi J, Kaijun Y, Shuqin Y, Chow W. Studies on the thermal behavior of
polyurethanes. Polymer-Plastics Technology and Engineering. 2006;45(1):95-108.
[31] Tanaka R, Hirose S, Hatakeyama H. Preparation and characterization of polyurethane
foams using a palm oil-based polyol. Bioresource technology. 2008;99(9):3810-6.

158
5 Solvent Free Synthesis of Polyols From 1- Butene
Metathesized Palm Oil for Use in Polyurethane foams3
5.1 Introduction
Polyurethanes (PU) are versatile polymers which have traditionally been
manufactured from petroleum [1]. The range of polyurethane products includes
polyurethane elastomers [2], sheets [2], adhesives [3], coatings [4] and foams [2], spanning
uses across a large array of industries and products. With a market of $82.6 billion in 2012,
PU foams have the largest market share of polymers, projected to reach $131.1 billion by
2018 [5]. PU can be prepared via two principal routes, in the step growth polymerization
of isocyanate (NCO) groups and hydroxyl groups [6] and with non-isocyanate pathways,
such as the reaction of cyclic carbonates with amines [7], self-polycondensation of
hydroxyl-acyl azides or melt transurethane methods [8].
Growing concerns surrounding sustainability, biodegradability, control of CO2
emissions and other environmental problems are driving a search for alternative feedstock
to petroleum. Vegetable oils and their derivatives are seen as good renewable materials for
the synthesis of polymer substrates, particularly for polyols used in PU production. A
3 Aversion of this chapter is filed as a US provisional patent: 2. U.S. Provisional Patent Application
#62109441, (filed January, 2015), “Metathesized Triacylglycerol Green Polyols from Palm oil for Use in
Polyurethane Applications and Their Related Physical Properties,” S.S. Narine, Prasanth. K. S. Pillai, S.Li,
and L. Bouzidi and Submitted for a publication in Journal of Applied Polymer Science

159
considerable body of work has been already published related to the synthesis of polyols
and polyurethanes from a variety of vegetable TAG oils such as soybean oil [9, 10],
safflower oil, corn oil, sunflower seed oil, linseed oil [11], rapeseed oil [12], and cotton
seed oil [13].
Palm oil presents a particularly interesting potential for industrial use as it is one of
the least expensive and most widely available oils (53 million metric ton in 2013: according
to the FAO) [14]. However, its high saturated fatty acid composition (50% of the total) and
the internal nature of its double bonds limit the potential use of palm oil in PU foam
formulations, particularly in rigid PU foams [15]. The internal location of the double bonds
results in polyol functionalization with secondary hydroxyl groups, which are less reactive
and lead to incomplete crosslinking during polymerization and imperfections in the
polymer network [2, 16]. The regions where dangling chains are present do not support
stress when the sample is under force, and act as plasticizers, reducing polymer rigidity
[17, 18].
Olefin cross metathesis of natural oils and fats is an important organic synthesis
technique that is used to produce fine chemicals, substrates and materials, many of which
serve as or are potential petrochemical replacements [16, 19-22]. The cross metathesis
reaction effectively shortens some of the unsaturated fatty acids of the TAGs at the
unsaturated sites, producing terminal double bonds [23, 24], which gives the potential of
producing polyols with primary hydroxyl groups, and therefore dramatically reduces
dangling chains in polyurethane networks[16, 25]. In addition, the composition of a
metathesized product can be controlled by varying the reaction conditions, such as starting

160
materials, temperature, type of catalyst, etc. [26-28] allowing for a large range of designer
materials.
The present work is part of research efforts targeted at investigating the potential of
metathesized vegetable oil products for the production of polyols for PU and other polymer
applications, and other useful materials. The starting material used in the present study is
a 1-butene cross metathesized palm oil (PMTAG) stripped of its olefins, provided by
Elevance Renewable Science (ERS). Its full chemical and physical characterization and its
conversion into polyols, using solvent-mediated processes, for the preparation of rigid and
flexible polyurethane foams have already been reported [29, 30]. Previously, polyols were
produced from PMTAG using epoxidation reactions, followed by a hydroxylation method
and involved the utilization of harsh and dangerous solvents like DCM and THF.
The present effort was targeted at the synthesis of polyols from PMTAG using green,
one pot solvent free epoxidation and hydroxylation pathways. The synthesis of green
polyols from soybean oil and castor oil by solvent free/catalyst free epoxidation for
polyurethane applications was previously reported [31]. The solvent free synthetic route is
not only safer and environmentally friendly, but also much more economical. The
epoxidation and hydroxylation reaction conditions were tuned to control the conversion of
PMTAG double bonds into hydroxyl groups and hence control the hydroxyl value of the
polyols. Four batches (B1-4) of these so-called Green Polyols were produced. The chemical
structure and composition of the polyols were characterized by 1HNMR, HPLC, OH value,
and Iodine value. Thermal stability, thermal transition behavior, and flow properties were
determined by TGA, DSC, and rotational rheometry, respectively. Rigid and a flexible
foams were prepared from the Green Polyols with OH values of 83 and 119 mg KOH/ g
161
respectively. The foams were characterized by FTIR and SEM. Their thermal stability,
thermal transition behavior, and compressive strength were investigated using TGA, DSC,
and a texture analyzer, respectively.
5.2 Materials and Methods
5.2.1 Materials
PMTAG was provided by Elevance Renewable Sciences (ERS, Bolingbrook, II).
Formic acid (88 wt %), Iodine monochloride (95%), potassium iodide (99%),
phenolphthalein, hydrogen peroxide solution (30 wt%), Dibutin Dilaurate (DBTDL) and
glycerin (99.5 %) were purchased from Sigma-Aldrich, Canada (Oakville, Ontario,
Canada). Perchloric acid (70%) and N, N-Dimethylethanolamine (DMEA were purchased
from Fisher Scientific, Canada. Ethanol (anhydrous), toluene, potassium hydroxide, and
sodium thiosulfate were purchased from ACP chemical Inc. (Montreal, Quebec, Canada).
All of the above compounds were used as received. Diphenylmethane diisocynate (MDI)
from Bayer Materials Science (Pittsburgh, PA), Polyether-modified surfactant
(TEGOSTAB B-8404) from Goldschmidt Chemical Canada. The properties of the MDI
are presented in Table A10 in the Appendix.
5.2.2 Chemistry Characterization
5.2.2.1 Titrimetric Methods (OH value, Acid value, Iodine value)
OH and acid values of the PMTAG Polyol were determined according to ASTM
S957-86 and ASTM D4662-03, respectively. Iodine value was determined according to
ASTM D5768-02.
162
5.2.2.2 Proton Nuclear Magnetic Resonance Spectroscopy (1HNMR)
1H-NMR spectra were recorded in CDCl3 on a Varian Unity-INOVA at 499.695
MHz. All spectra were obtained using an 8.6 μs pulse with 4 transients collected in 16 202
points. Datasets were zero-filled to 64 000 points, and a line broadening of 0.4 Hz was
applied prior to Fourier transformation. The spectra were processed using spinwork NMR
Processor, version 3. 1H chemical shifts are internally referenced to CDCl3 (7.26 ppm).
5.2.2.3 Gel Permeation Chromatography (GPC)
Molecular weights and distribution were determined by gel permeation
chromatography (GPC). The measurements were carried out on an e2695 GPC instrument
equipped with a Waters e2695 pump, Waters 2414 refractive index detector and a 5-µm
Styragel HR5E column (Waters Alliance, Milford, MA). Chloroform was used as eluent
with a flow rate of 0.5 mL/min. The concentration of sample was 1 mg/mL and the injection
volume was 10 µL. Polystyrene (PS) standards and pure TAG-oligomers (synthesized
previously [32]) were used for calibration. Waters Empower Version 2 software was used
for data collection and data analysis.
5.2.2.4 Fourier Transform Infrared Spectroscopy (FTIR)
The FTIR spectra of the foams were obtained with a Thermo Scientific Nicolet 380
FTIR spectrometer (Thermo Electron Scientific Instruments, LLC, USA) equipped with a
PIKE MIRacleTM attenuated total reflectance (ATR) system (PIKE Technologies,
Madison, WI, USA.). Solid samples were loaded onto the ATR crystal area, and sample
spectra were acquired over a scanning range of 400-4000 cm-1 for 32 repeated scans at a
spectral resolution of 4 cm-1.

163
5.2.3 Physical Characterization Techniques
5.2.3.1 Thermogravimetric analysis (TGA)
TGA measurements were carried out on a TGA Q500 (TA Instruments, DE, USA)
equipped with a TGA heat exchanger (P/N 953160.901). Approximately 8.0 – 15.0 mg of
sample was loaded into the open TGA platinum pan. The sample was heated at a constant
rate of 10 °C/min from 25 to 600 °C under dry nitrogen. The “TA Universal Analysis”
software (TA Instruments, New Castle, DE) was used to analyze the TGA curves.
5.2.3.2 Differential Scanning Calorimetry (DSC)
DSC measurements were performed on a Q200 model (TA Instruments, New Castle,
DE) under a nitrogen flow of 50 mL/min.
Polyol samples between 3.5 and 6.5 (± 0.1) mg were run in standard mode in
hermetically sealed aluminum pans. The sample was equilibrated at 90 °C for 10 min to
erase thermal memory, and then cooled at 5.0 °C/min to -90 °C where it was held
isothermally for 5 min and subsequently reheated at a 5.0 °C/min to 90 °C.
Foam samples between 3.0 and 6.0 (± 0.1) mg were run in modulated mode in
hermetically sealed aluminum DSC pans. The sample was first equilibrated at 25 °C and
heated to 150 °C at 10 °C/min (first heating cycle). The sample was held at that temperature
for 10 min and then cooled to -90 °C at 10 °C/min, where it is held isothermally for 5 min
and subsequently reheated to 150 °C at the same rate (second heating cycle). The
modulation amplitude and period were ±1 °C and 60 s, respectively.

164
The “TA Universal Analysis” software was used to analyze the DSC thermograms.
The characteristics of non-resolved peaks were obtained using the first and second
derivatives of the differential heat flow.
5.2.3.3 Rheology
The flow behavior and viscosity versus temperature of the polyols were measured on
a temperature controlled Rheometer (AR2000ex) using a 40-mm, 2° steel geometry.
Temperature control was achieved by a Peltier attachment with an accuracy of ~0.1 °C.
Shear stress versus shear rate curves were measured at 10 °C intervals from high
temperature (100 °C) to ~ 10 °C below the DSC onset of crystallization temperature. The
viscosity versus temperature data were collected at constant shear rate (200 s-1) using the
ramp procedure while the sample was cooling (1.0 and 3.0 °C/min) from ~110 °C to just
above the crystallization point. Data points were collected at 1 °C intervals.
The shear rate – shear stress curves were fitted with the Herschel-Bulkley equation
(Eq. 5.1), a model commonly used to describe the general flow behavior of liquid materials,
including those characterized by a yield stress.
0
nK Eq. 5.1
Where denotes the shear stress, 0 is the yield stress below which there is no flow, K
the consistency index and n the power index. n depends on constitutive properties of the
material. For Newtonian fluids n = 1, and for shear thickening and shear thinning fluids
1n and 1n , respectively.

165
5.2.3.4 Texture Analysis
The compressive strength of the foams were measured at room temperature using
a texture analyzer (TA-TX HD, Texture Technologies Corp, NJ, USA). Samples were
prepared in cylindrical Teflon molds 60-mm in diameter and 36-mm in length. During
compressive force measurements, the cross head speed was 3.54 mm/min, recorded on a
750 Kgf load cell for both the rigid and flexible foams. The load was applied until the foam
was compressed to approximately 15% and 65% of the original thickness of the rigid and
flexible foams, respectively.
5.2.3.5 Scanning Electron Microscopy (SEM)
Composite SEM images of the foams were resolved with a Phenom ProX, (Phenom-
World, The Netherlands) scanning electron microscope at an accelerating voltage of 15 kV
and map intensity. Uncoated foams were cut into thin rectangular segments and fixed to a
temperature controlled sample holder with conductive tape. Samples were cooled to -25 °C
to prevent beam induced thermal deformations, and composite images were captured using
the Automated Image Mapping software (Phenom-World, The Netherlands).
5.2.4 Synthesis Methods
5.2.4.1 Epoxidation
2 kg PMTAG was added into 2 kg formic acid (88%) in a 20L reactor fitted with a
HAAKE Phoenix II temperature controlled circulator (Thermoscientific, Newington, NH).
The initial reaction temperature of the epoxidation was varied (Epx
iniT in Table 5.1)
depending on the batch. 2.8 L of hydrogen peroxide (30%) was added to the reactor slowly
(~1 L/h) while the reaction mixture was vigorously stirred. During addition of hydrogen

166
peroxide, the exothermic nature of the epoxidation reaction caused the temperature to
increase. In the case of Batch 3, the temperature controlled system wasn’t used, the
temperature of the reaction reached a maximum of 95 ºC but remained less than 10 min at
that temperature. Due to the exothermic nature of the epoxidation reaction, the temperature
of the other batches also increased ( max
EpxT in Table 5.1). Tap water was circulated to cool
Batch 4, and the control feature of the circulator was used to bring Batch 1 and Batch 2 to
the actual epoxidation temperature (Epx
RT in Table 5.1). The epoxidation reaction was
continued at Epx
RT overnight. The reaction mixture was finally washed with 2×1 L water,
1×1 L 5% NaHCO3 and 2×1 L water sequentially. The mixture was used for the next step
directly. Yield > 95 %.
Table 5.1. Epoxidation reaction temperature and time data for the synthesis of green
polyols. Epx
iniT : Initial temperature of the epoxidation reaction; max
EpxT : highest temperature
reached during the epoxidation reaction; Epx
RT : reaction temperature for epoxidation; Epx
Rt
: reaction time
Epoxidation
Batch Epx
iniT max
EpxT Epx
RT Epx
Rt
1 50 65 48 16 h at 45 ºC then 12 h at 48 ºC
2 40 49 48 16h at 48 ºC
3 25 95 45 16h at 45 ºC
4 25 48 25 16h at 25-48 ºC

167
5.2.4.2 Hydroxylation
The epoxide of PMTAG (2 kg) above was added into 10 L water, and then followed
by 140 g HClO4 (70%) with a ratio of PMTAG/H2O/perchloric acid = 1/5/0.05. The
reaction mixture was heated to ~ 85 °C and stirred at that temperature for 16 h after which
stirring and heat were ceased and the mixture sat at room temperature to aid in separation.
The organic layer was washed with 2×1 L water, 1×1 L 5% NaHCO3 and 2×1 L water
sequentially, and then dried on a rotary evaporator. Yield > 95 %.
5.2.4.3 Polymerization Method
Rigid and flexible polyurethane foams were prepared from B3- and B4-Green polyol
and MDI using a previously published method. The formulation recipes for the rigid and
flexible foams are presented in Table 5.2. The amount of each component was based on
100 polyol parts by weight. As shown in Table 5.2, the rigid foams were prepared based
on a total hydroxyl value of 450 mg KOH/g. In The case of the rigid foams, glycerin, a
poly hydroxyl cross linker, was added into the reaction mixture (20.1 and 18.1 parts for
B3- and B4-Polyol Rigid Foams, respectively) in order to obtain the targeted hydroxyl
value of 450 mg KOH/g (see Table 5.2).
The amount of MDI in both rigid and flexible foam formulations was adjusted to
achieve an isocyanate index of 1.2 (NCO to OH ratio of 1.2 to 1). Note that the NCO to
OH ratio in the rigid foam formulation includes the OH from the added glycerol.
The amount of cross linking catalyst DBTDL, which favors the gelling reaction, and
the co-catalyst DMEA, which functions as a blowing catalyst, were fixed at 1 and 0.5 parts

168
respectively based on the fairly good compressive strength previously obtained for rigid
polyurethane foams prepared from terminal hydroxyl polyols.
The cross linking catalyst DBTDL, which favors the gelling reaction, and the co-
catalyst DMEA, which functions as a blowing catalyst, were used for the polymerization
process. The choice of the catalyst ratios were fixed based on the fairly good compressive
strength previously obtained for rigid polyurethane foams prepared from terminal hydroxyl
polyols.
Table 5.2. Formulation Recipes for Rigid and Flexible Foams. Amounts are based
on 100 parts by weight of total polyol
Rigid Foams Flexible Foams
Ingredient Parts Parts
B3-Green Polyol or
B4-Green Polyol 100 100
OH: NCO ratio 1:1.2 1:1.2
Glycerin B3 20.1 0
B4 18.1 0
Water 2 2
Surfactant 2 2
Catalyst 1 0.5
Co-catalyst 1 0.5
All the ingredients except MDI were melt and weighed into a beaker and mixed for
10-20 s. The pre-measured MDI was then added into the beaker and stirred vigorously for
5 to 20 s and transferred into a cylindrical Teflon mold (60 mm diameter and 35 mm long)
which was previously greased with silicone release agent. The mold was then then sealed
with a hand tightened clamp and the sample was cured for four days at 40 ºC, with an

169
additional post curing of one day at room temperature. Table 5.2 gives the formulation
recipe used for the preparation of rigid and flexible polyurethane foams from B3- and B4-
Green Polyols.
5.3 Results and Discussion
5.3.1 Solvent Free Synthesis of Polyol from PMTAG
The Green Polyols were prepared from PMTAG in a solvent-free one-pot two-step
reaction; epoxidation by formic acid and hydrogen peroxide (H2O2), followed by
hydroxylation using perchloric acid (HClO4) as the catalyst, as described in Scheme 5.1.
The formic acid (88%)/H2O2 (30%)/PMTAG ratio was kept at 1/1.4/1 and
PMTAG/H2O/perchloric acid at 1/5/0.05 in all the batches. The epoxidation conditions
(temperature and time) were adjusted in order to optimize the reaction, control the OH
value, and to manage the amount of formic acid that can become attached to the polyol.
The temperature and time of the four different batches of epoxidation reactions were tuned
so as to control the conversion of the double bonds into epoxides (see Table 5.1). The
controlled double bond conversion subsequently enables the production of polyols with
controlled hydroxyl value. Note that when the temperature was below 70 ºC, the degree of
epoxidation in the melt was limited (~80 to 90 % conversion of total double bonds). Also,
at temperatures higher than 50 °C, the epoxide was opened by formic acid and formic acid
units were found attached to some of the polyol backbones. Therefore, in order to avoid
formic acid units attached to the polyol backbone, the epoxidation temperature should be
kept below 50 ºC. The hydroxylation of all the batches was run at 85 °C over 16 h. The
Green Polyols obtained from the four batches are labelled B1 – B4-Polyol.

170
Scheme 5.1. Solvent-free synthesis of polyols from PMTAG. n= 0, 2, 8; m= 11 to
20.
5.3.2 Chemical Characterization and Compositional Analysis of PMTAG Green
Polyols
The structure of the epoxides was confirmed by 1H-NMR. The characteristic
chemical shift values of the specific protons of B1-, B2-, B3- and B4-epoxy PMTAG are
provided in Appendix in Table A11. The chemical shift at 2.85 ppm, related to the non-
terminal epoxy ring, and the chemical shift at 2.7 to 2.4 ppm related to the terminal epoxy
ring appeared for the epoxidized PMTAG of all the batches, indicating that the epoxidation

171
reaction was successful. However, although the chemical shift at 5.4 ppm related to internal
double bonds disappeared, peaks at 5.0 to 4.8 ppm were still present, indicating that the
terminal double bonds were not completely converted into epoxides.
The relative amount of remaining terminal double bonds (RTDB) as estimated by
1H-NMR for each batch of epoxy PMTAG is provided in Table 5.3. Note that RTDB
(mol%) was calculated as the ratio of remaining terminal double-bonds in the PMTAG
epoxide to the terminal double bonds in the starting PMTAG material. The chemical shift
at δ 8 ppm indicating the presence of formic acid attached to the backbone of the epoxide
was present in the epoxidized PMTAG of B1 and B2 but not B3 and B4. The number of
formic acid units per TAG epoxide, as estimated by 1H-NMR, is provided in Table 5.3.
The structure of the Green Polyols (B1 to B4) were confirmed by 1H-NMR. Figures
A11 in the Appendix show the 1H-NMR spectra of B1-B4 Green Polyols, respectively. The
corresponding 1H-NMR chemical shifts in CDCl3 are listed in Table A12. The spectra of
all the polyols presented the chemical shift related to protons neighbored by –OH (at 3.8-
3.4 ppm) but not the chemical shift related to epoxy rings (at 2.8-2.4 ppm) indicating that
the hydroxylation reaction was complete. The Green Polyols presented the typical chemical
shift related to a glycerol skeleton: -CH2CH(O)CH2- at δ 5.3-5.2 ppm, -
OCH2CH(O)CH2O- at 4.4-4.1 ppm, -C(=O)CH2- at δ 2.33-2.28 ppm, and -C(=O)CH2CH2-
at δ 1.60 ppm. The peak areas of chemical shifts at 4.4 - 4.2 ppm and at 4.2 to 4.0 ppm
were equal, indicating that hydrolysis of the TAGs was avoided. Because the epoxidation
of the terminal double bonds was not complete, the Green Polyols also showed chemical
shifts of the remaining terminal double bonds (-CH=CH2 at 5.8 ppm, and –CH=CH2 at 5.0-
4.8 ppm). The formic acid units on the backbone (chemical shift at δ 8 ppm) were presented

172
in B1- and B2-Polyols but not in B3- and B4-Polyols, similar to their starting epoxides.
The RTDB (mol%) of the Green Polyols and the number of formic acid units per TAG
polyol are listed in Table 5.3.
Table 5.3. Amount of remaining terminal double bonds (RTDB)1, number of formic
acid units per TAG polyol and terminal OH groups as estimated by 1H-NMR. Iodine value,
Acid value and OH number of PMTAG Green Polyols.
Green PMTAG
Epoxides
Green Polyols
Batch RTDB
(mol%)
Formic
acid
units
per
TAG
RTDB
(mol%)
Terminal
OH group
(mol%)
Iodine
Value
OH Value
(mg
KOH/g)
Acid Value
(mg
KOH/g)
B1 25.0 0.14 25.0 18.7 5 113 5
B2 26.0 0.14 26.0 18.5 7 117 1.3
B3 34.0 0.00 34.0 16.6 9 83 1.3
B4 27.0 0.00 27.0 18.3 8 119 1.3
1Remaining terminal double bonds (RTDB%) was calculated as the ratio of remaining
terminal double-bonded fatty acids in Green Polyol to the terminal double bonded fatty
acids in PMTAG
The solvent free synthetic strategy adapted (see section 2.5) was very successful for
the synthesis of Green Polyols with controlled OH values. It was also confirmed in the
1HNMR characterization of the epoxides and polyols that the controlled reaction
parameters such as Epx
iniT and Epx
RT (see Table 5.1) facilitated the avoidance of formic acid
units attached on the epoxide backbone in batches B3 and B4. Also the polyols produced
from the resultant epoxides such as B3-Green Polyol and B4-Green Polyol were completely

173
free from formic acid residuals. The Green Polyols presented OH values between 83 to
119 mg KOH/g (Table 5.3) and very low acid values, except for B1-Green Polyol which
displayed a relatively high acid value due to its longer epoxidation reaction time. Although
the OH values achieved using the green route are relatively lower compared to those of the
PMTAG Polyols prepared previously with solvents [29], they are large enough to make
suitable monomers for the preparation of flexible as well as rigid foams. B3- and B4- Green
Polyols which displayed very low acid values, no formic acid attached and significantly
different OH values (83 and 119 mg KOH/g respectively) were chosen for further physical
characterizations, and used for the preparation of rigid and flexible polyurethane foams.
The GPC of the B3- and B4-Green Polyols (the GPC data are provided in the
Appendix in Figure A12 and Table A13) revealed the presence of relatively important
levels of oligomers in the polyols. These include high molecular weight (Mw: 7030 g/mol)
oligomers as well as low molecular weight (Mw: 1463 g/mol) oligomers. B3- and B4-
Green Polyols comprised 45% and 37% oligomers, respectively, compared to 13%
oligomers in PMTAG Polyol. The higher oligomerization during the solvent free reaction
was due to its higher reaction temperature [33].
The composition of the PMTAG Green Polyols was determined with the help of 1H-
NMR and HPLC analyses of the column chromatographic fractions of B4-Polyol. Seven
different fractions (labelled F1 to F7) were obtained with ethyl acetate and hexanes as the
solvents. Column chromatography, 1H-NMR and HPLC data are provided in in the
Appendix in Table A14.

174
Scheme 5.2. General structures in PMTAG Green Polyol (n= 0, 2, 8; m= 11 to 20)
The 1HNMR of F1 did not present the chemical shift at 3.6-3.2 ppm which is related
to OH groups indicating that it is not the hydroxyl derivative. Also, F1 presented ~ 24
mol% unreacted terminal double bonds. F2 and F3 presented hydrolyzed TAG structures
formed during the hydroxylation reaction. The 1HNMR of F4, F5 and F6 presented
chemical shifts at δ 5.3-5.2 ppm and 4.4-4.1 ppm of -CH2CH(O)CH2- and -
OCH2CH(O)CH2O- of the glycerol skeleton, respectively, and at δ 3.8-3.4 ppm of the
proton neighboring hydroxyl groups indicating the presence of TAG diols and TAG tetrols.
F4, F5 and F6 presented also some unreacted terminal double bonds (~10 mol%) as
revealed by the chemical shifts at 4.8-5.0 ppm. Fraction F7 presented only tetrols (as
revealed by the chemical shift at δ 3.8-3.4 ppm, with ~ 15 mol% unreacted terminal double
bonds.
175
The 1HNMR results were confirmed and complemented by HPLC. The general
structures of the green polyols resulting from these analyses and based on structures of
PMTAG itself [29] are presented in Scheme 5.2.
5.3.3 Physical Properties of PMTAG Green Polyols
5.3.3.1 Thermogravimetric Analysis of Green PMTAG Polyols
As indicated by the DTG profiles of B3- and B4-Green Polyols shown in Figure 5.1,
B3- and B4-Green Polyols presented similar traces indicating a two-step degradation
process. The large DTG peak at ~380 ºC (TD1 in Figure 5.1) is associated with the
breakage of the ester bonds [34]. This dominant step which was initiated at 240 °C and
concluded at ~ -420 °C involved ~ 60% of weight loss. The small DTG shoulder peak at ~
450 °C (TD2, in Figure 5.1) is related to the decomposition of the ester groups and other
fragments, and the degradation of the remaining carbonaceous materials from the previous
step [35]. The onset of degradation of B3- and B4-Green Polyols as determined at 10%
weight loss ( 10%
dT ) was higher than 310 ºC, indicating a good thermal degradation stability
for the Green Polyols, comparable to other vegetable based polyols. Note that 10%
dT of
B4-Green Polyol was relatively smaller compared to B3-Green Polyol (12 ºC lower)
probably due to the loss of terminal hydroxyls which content is higher in B4-Green Polyol
[35].

176
Figure 5.1. DTG profiles of B3- and B4-Green Polyols
5.3.3.2 Crystallization and Melting Behavior of PMTAG Green Polyols
The crystallization and heating profiles (both at 5 °C/min) of B3- and B4-Green
Polyols are shown in Figure 5.2a and 5.2b, respectively. The corresponding thermal data
is listed in the Appendix in Table A15. as can be seen in Figure 5.2, B3- and B4-Green
Polyols present similar crystallization and heating behaviors with marked separation of a
high and low temperature events inherited from the PMTAG similarly to the PMTAG
Polyol synthesized via solvent mediation [29]. The difference between B3- and B4- Green
Polyol manifested in a small difference in their onset temperature of crystallization (26 °C
and 29 °C, respectively) and offset temperature of melting (48 °C and 50 °C, respectively).
Note that these values are consistent with the fact that B3-and B4-Green Polyols were not
liquid at ambient temperature. The large difference in their OH values was not reflected in
either the crystallization or melting traces, indicating that other structural attributes such as
remaining double bonds and short chain moieties played a counter effect. The melting point
of the Green Polyols as determined by the offset temperature of melting is ~2 ºC higher
DT
G
(%
oC
-1)
Temperature (oC)
100 200 300 400 500
0.0
0.5
1.0
1.5
2.0
B3
B4
TD1
TD2

177
than what was measured for the PMTAG Polyol synthesized via solvent mediation [29].
This may be due to the higher percentage of oligomers in the Green Polyols.
Figure 5.2. DSC thermograms of B3-, and B4-Green Polyols obtained during (a) Cooling,
and (b) subsequent heating (5 °C/min).
The heating thermogram of the Green Polyols displayed two groups of endothermic
events (G2 below 30 C, and G1 above 30 C in Figure. 5.2b) corresponding to the melting
of a high and low melting portions of the polyols. the enthalpy of melting of G1 and G2
(~26 J/g and ~66 J/g, respectively) was very similar to the enthalpy of P1 and P2,
respectively, suggesting that they are effectively the recording of the melting of the “high”
and “low” melting portions of the polyol, respectively. These DSC data indicate that with
careful processing, it is possible to separate PMTAG Polyol into two fractions: one mainly
constituted of low melting components, and another mainly constituted of high melting
components. It is expected that at ambient temperature, one fraction will be solid and the
other will remain liquid.
(a)
Temperature (oC)
-60 -30 0 30 60
Heat
Flo
w
/W
g-1
(Exo u
p)
0.0
0.2
0.4
0.6
0.8 P1
B3
B4
P2
(b)
Temperature (oC)
-30 0 30 60
Heat
Flo
w
/W
g-1
(Endo d
ow
n)
-0.6
-0.4
-0.2
0.0
B3
B4
G2
G1
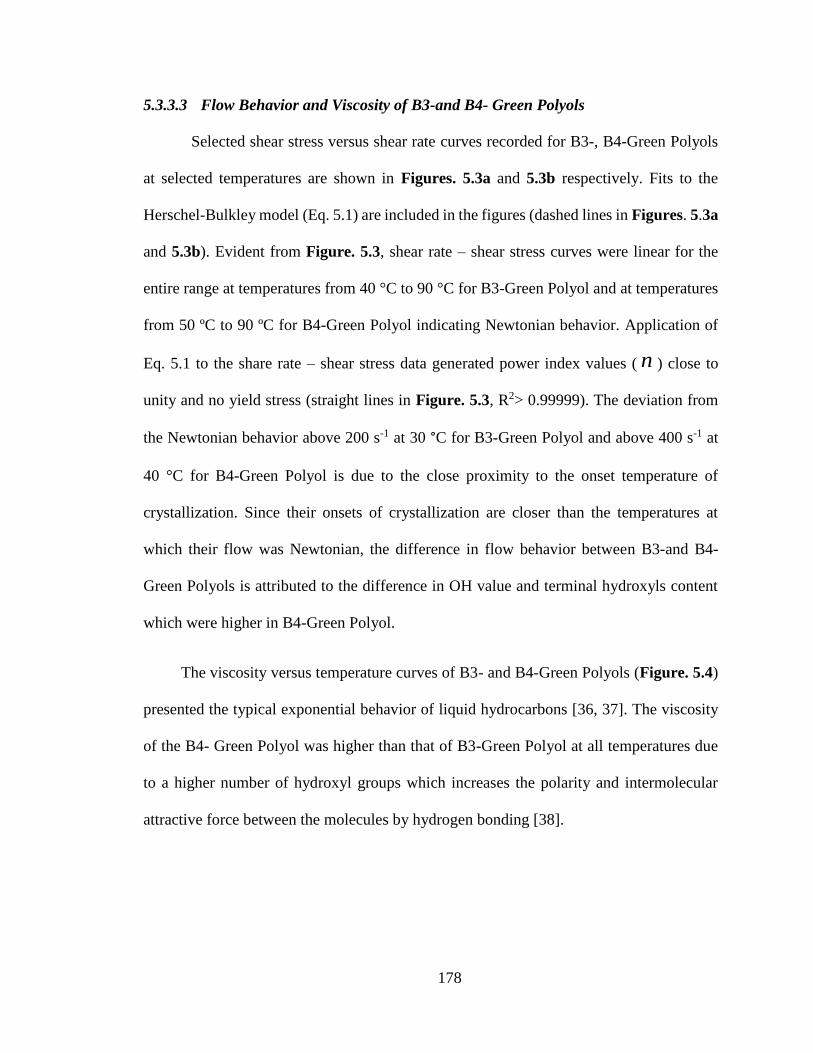
178
5.3.3.3 Flow Behavior and Viscosity of B3-and B4- Green Polyols
Selected shear stress versus shear rate curves recorded for B3-, B4-Green Polyols
at selected temperatures are shown in Figures. 5.3a and 5.3b respectively. Fits to the
Herschel-Bulkley model (Eq. 5.1) are included in the figures (dashed lines in Figures. 5.3a
and 5.3b). Evident from Figure. 5.3, shear rate – shear stress curves were linear for the
entire range at temperatures from 40 °C to 90 °C for B3-Green Polyol and at temperatures
from 50 ºC to 90 ºC for B4-Green Polyol indicating Newtonian behavior. Application of
Eq. 5.1 to the share rate – shear stress data generated power index values ( n ) close to
unity and no yield stress (straight lines in Figure. 5.3, R2> 0.99999). The deviation from
the Newtonian behavior above 200 s-1 at 30 °C for B3-Green Polyol and above 400 s-1 at
40 °C for B4-Green Polyol is due to the close proximity to the onset temperature of
crystallization. Since their onsets of crystallization are closer than the temperatures at
which their flow was Newtonian, the difference in flow behavior between B3-and B4-
Green Polyols is attributed to the difference in OH value and terminal hydroxyls content
which were higher in B4-Green Polyol.
The viscosity versus temperature curves of B3- and B4-Green Polyols (Figure. 5.4)
presented the typical exponential behavior of liquid hydrocarbons [36, 37]. The viscosity
of the B4- Green Polyol was higher than that of B3-Green Polyol at all temperatures due
to a higher number of hydroxyl groups which increases the polarity and intermolecular
attractive force between the molecules by hydrogen bonding [38].

179
Figure 5.3. Shear rate- shear stress of PMTAG Green Polyols. (a) B3-Green Polyol
(b) B4-Green Polyol, respectively.
Figure 5.4. Viscosity versus temperature curves obtained during cooling (1 °C/min)
of B3-Green Polyol (empty circles) and B4-Green Polyol (empty triangles). Dashed lines
are guides for the eye.
The Green Polyols presented a slightly higher viscosity compared to the PMTAG
Polyol prepared using solvents [29]. This is explained by the presence of more oligomers
in the B3- and B4-Green Polyols (37 and 45 %, respectively compared to 13% in PMTAG
Temperature (oC)
40 60 80
Vis
cosity
(P
a.s
)
0.0
0.2
0.4
0.6
0.8 B3
B4

180
Polyol) formed during their hydroxylation step at 85 °C. The viscosities of the Green
Polyols are close to the range of viscosities of other polyols prepared from highly
unsaturated vegetable oils that are currently used in polyurethane applications [33, 39-41].
5.3.4 Polyurethane Foams
One rigid and one flexible foam were prepared from B3- and B4-Green Polyols using
a previously reported polymerization method [30]. As can be seen in Figure 5.5, the
polyurethane foams presented a smooth surface and a light yellow color. Note that the
catalyst amount for flexible foam formulation was fixed (0.5 parts, see Table 5.2), chosen
to avoid the cracks observed during the compression of the flexible foams made with
smaller catalyst concentrations.
(a) B3-RF145 (b) B3-FF162 (c) B4-RF166 (d) B4-FF156
Figure 5.5: Pictures of rigid and flexible foams from B3-and B4-Green PMTAG Polyols.
(a) B3-Green Polyol rigid foam of density 145 kgm-3 (B3-RF145), (b) B3-Green Polyol
flexible foam of density 162 kgm-3 (B3-FF162), (c) B4-Green Polyol rigid foam of density
166 kgm-3 (B4-RF166).and (d) B4-Green Polyol flexible foam of density 156 kgm-3 (B4-
FF156)
5.3.4.1 FTIR of B4-Green Polyol Foams
The FTIR spectra of the rigid and flexible foams produced from both B3- and B4-
Green Polyol confirmed the formation of urethane linkages. As shown in Figure 5.6,

181
representing the FTIR spectra of B4-flexible and a rigid foams typical of all the foams, the
characteristic absorption band of NH groups, C=O and C-N bonds which are associated
with the urethane linkage were presented at 3300-3400 cm-1, 1700 cm-1 and at 1516 cm-1,
respectively, (Figure 5.6) [42, 43]. However, as indicated by the weak band at 2270 cm-1
of the NCO group, some of the isocyanate did not react with the polyol [17, 42]. The
overlapping peaks between 1710 and 1735 cm-1 suggest the presence of urea and
isocyanurates in the foams. The peak at ~1410-1420 cm-1 reveals the presence of
isocyanurate trimers, indicating the occurrence of trimerization reactions of the
diisocyanates during the foaming process. The stretching bands of the ester groups are
particularly visible at 1744 cm-1 (C=O), 1150-1160 cm-1 (O-C-C) and 1108-1110 cm-1 (C-
C(=O)-O). The stretching vibration of -C-H in -CH3 and -CH2 groups in the aliphatic chains
are also visible at 2917-2925 cm-1, and 2850 cm-1 respectively [44]. The CH2 stretching
vibration and CH2 bend are also clearly visible at 2800-3000 cm-1 and 1030-1050 cm-1,
respectively [17].
Figure 5.6. Typical FTIR spectra of rigid (RF) and flexible (FF) B4-Green Polyol
foam.
Wavenumber (cm-1)
800160024003200
Absorb
ance
0.0
0.1
0.2
0.3
3340 c
m-1
2270 c
m-1
1730 c
m-1
1516 c
m-1
2917 c
m-1
1420 c
m-1
2850 c
m-1
RF
FF

182
5.3.4.2 SEM Analysis of Green Polyol Foams
Figures 5.7a, 5.7b and 5.7c, 5.7d show SEM images of the rigid and flexible foams
prepared from B4- and B3-Green Polyol, respectively. The cell structures of Figures 6a-d
are typical of all the rigid and flexible foams prepared in the present work. The
characteristics of the cell structure such as number and size of the cells was determined
from the analysis of all the visually separate cells of at least two specimens of each foam.
The values provided here are the subsequent calculated average and standard deviations.
The Green Polyol rigid foam displayed compact and uniformly distributed cells (B4: 450
± 44 µm, B3: 475± 60 µm). On the other hand, although with a somewhat similar average
cell size (B4: 494±145 µm, B3: 500 ±190 µm) the Green Polyol flexible foam presented a
heterogeneous cell structure with cell size ranging from 277 µm to 784 µm for B4 and 200
µm to 800 µm for B3. The stark differences in cell structure between the rigid and flexible
foams is attributable to the compounded effects of high cross linking density achieved by
the addition of glycerin in the rigid foam formulation and the different rates of crosslinking
of terminal and internal hydroxyls in the Green polyol flexible foam formulation [45].
Since both rigid and flexible foams only contain closed cells, they may also have
applicability in thermos insulation applications.
Both the rigid and flexible foams prepared from the PMTAG Green Polyols
displayed a smaller number of cells and larger cell size than the rigid and flexible foams
from PMTAG Polyol prepared via solvent mediation [30]. Beside the OH value and
terminal OH group effects considerations (OH value 119 mg KOH/g and 18.3% terminal
hydroxyl in the B4-Green Polyol for example vs. OH value of 155 mg KOH/g and 24.1%
terminal hydroxyl groups in the polyol prepared via solvent mediation), the larger amount

183
of oligomers in the Green Polyol (37% in B4-Green Polyol) may have added an extra
contribution for the larger size of cells of the rigid and flexible Green Polyol foams.
(a) (b)
(c) (d)
Figure 5.7. SEM micrographs of (a) B4-Green Polyol rigid foam, (b) B4-Green
Polyol flexible foam, (c) B3-Green Polyol rigid foam and (d) B3-Green Polyol flexible
foam

184
5.3.4.3 Thermal Stability of PMTAG Green Polyol Foams
As exemplified in Figure 5.8 showing the DTG profiles of B4-Green Polyol rigid
and flexible foams, the foams produced with the Green Polyols degraded following a multi
stage process. The first peak centered at 296-300 °C ( 1DT in Figure.5.8) is related to the
dissociation of urethane bonds that has taken place either through the dissociation of the
isocyanate and alcohol or to the formation of primary or secondary amines, olefin and
carbon dioxide [46, 47]. This first step involved a total weight loss of ~12 to 17 %. The
second and third decomposition steps signaled with the DTG peaks at ~ 370 and 420 °C (
2DT and 3DT in Figure 5.8) are associated with the decomposition of the soft segments
[47]. The soft segment (polyol back bone) dissociates into carbon monoxide, carbon
dioxide , carbonyls (aldehyde, acid, acrolein) olefins and alkenes [34, 47]. These two
decomposition steps involved the largest loss with 65% - 80% of the total weight. The last
step of degradation is signaled with the DTG peak at ~ 460 °C ( 4DT in Figure 5.8) and is
related to the decomposition of more strongly bonded fragments associated with the polyol
backbone that occur at high temperature, and probably to the degradation of remaining
carbonaceous materials from the previous step.
Note that the onset temperature of degradation of the rigid foam whether determined
at 5 or 10% weight loss was consistently lower (~16 ºC) than that of the flexible foams.
This can be due to the degradation of short chain urethane structures from the glycerin
cross linker.

185
Figure 5.8. DTG curves of B4-Green Polyol rigid foam (B4-RF) and B4-Green
Polyol Flexible Foam (B4-FF).
5.3.4.4 Thermal Transition of Green Polyol Foams
DSC analysis was carried out on the rigid and flexible foams produced with B4-
Green Polyol to study the thermal phase transition behavior of the Green Polyol foams.
Figure 5.9 shows the DSC profiles obtained during the second heating cycle of rigid and
flexible B4-Green Polyol foams respectively. One can notice that the thermogram of rigid
B4-Green Polyol foam presents two inflection points indicating two glass transitions (
lowTg (arrow 1 in Figure 5.9) at ~-12 °C and highTg (arrow 2 in Figure 5.9) at ~ 49 °C of
B4-RF in Figure 5.9) whereas B4-Green Polyol flexible foam thermogram shows three
inflection points indicating three glass transitions ( gLowT at - 11 °C, intTg at ~ 34 °C and
highTg at ~46 °C of B4-FF , arrow 1, 2 and 3 in Figure. 5.9).
Temperature (oC)
0 100 200 300 400 500 600
DT
G
(%
oC
-1)
0.0
0.4
0.8
1.2
B4-FF
B4-RF
300 o
C295 o
C
368 o
C
421 o
C
456 o
C
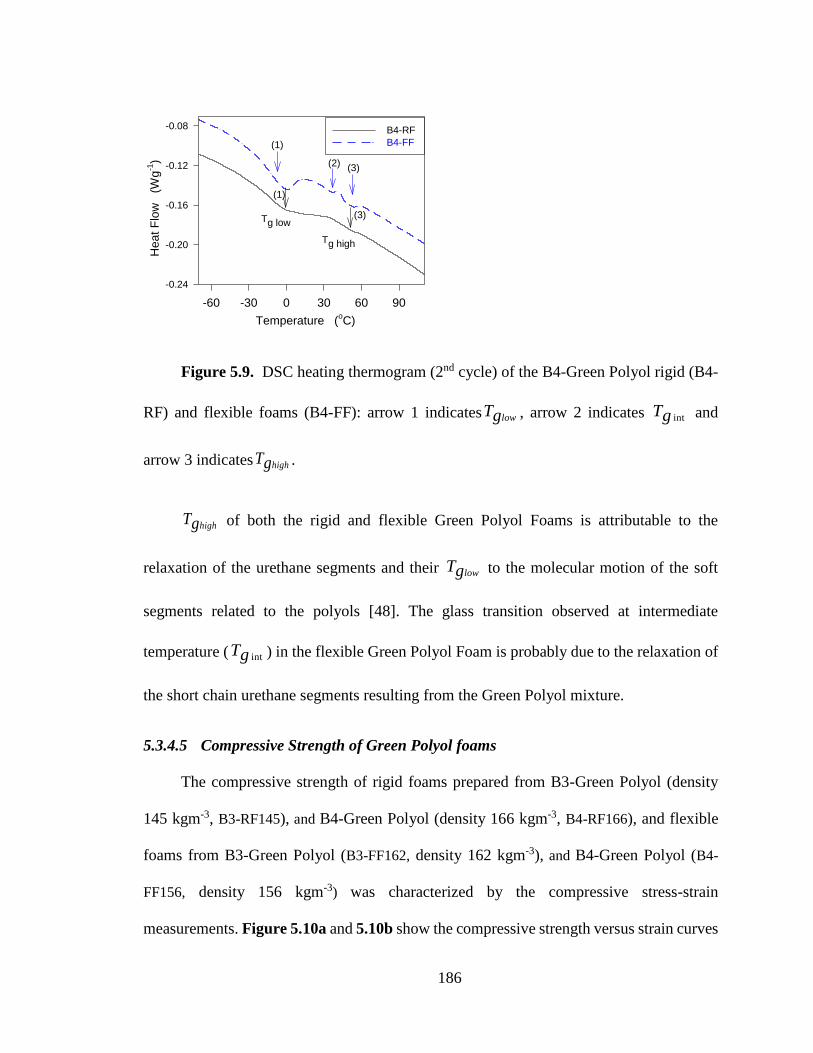
186
Figure 5.9. DSC heating thermogram (2nd cycle) of the B4-Green Polyol rigid (B4-
RF) and flexible foams (B4-FF): arrow 1 indicates lowTg , arrow 2 indicates intTg and
arrow 3 indicates highTg .
highTg of both the rigid and flexible Green Polyol Foams is attributable to the
relaxation of the urethane segments and their lowTg to the molecular motion of the soft
segments related to the polyols [48]. The glass transition observed at intermediate
temperature ( intTg ) in the flexible Green Polyol Foam is probably due to the relaxation of
the short chain urethane segments resulting from the Green Polyol mixture.
5.3.4.5 Compressive Strength of Green Polyol foams
The compressive strength of rigid foams prepared from B3-Green Polyol (density
145 kgm-3, B3-RF145), and B4-Green Polyol (density 166 kgm-3, B4-RF166), and flexible
foams from B3-Green Polyol (B3-FF162, density 162 kgm-3), and B4-Green Polyol (B4-
FF156, density 156 kgm-3) was characterized by the compressive stress-strain
measurements. Figure 5.10a and 5.10b show the compressive strength versus strain curves
Temperature (oC)
-60 -30 0 30 60 90
Heat
Flo
w
(W
g-1
)
-0.24
-0.20
-0.16
-0.12
-0.08 B4-RF
B4-FF
Tg low
Tg high
(1)
(2)(3)
(1)
(3)

187
of the examined rigid and flexible Green Polyol foams, respectively. The rigid and flexible
foams displayed relatively quick yielding followed by a plateau-like region over which
there was a little increase in stress with increase in strain. The elastic region was ~4% in
the case of rigid foams and 6% in case of flexible foams. Each region is determined by a
specific mechanism of deformation. Linear elasticity is controlled by cell wall bending,
and, in the case of closed cells such as in the case of the present foams, by stretching of the
cell walls [44]. The plateau-like region (above ~8% for the rigid foams in Figure 5.10a
and between 10 to 30% for the flexible foams in Figure 5.10b) results from either the
collapse or cell wall buckling of the foams [44]. Further compression of the flexible foams
above 30% resulted in and irreversible damage to the cell walls and is called the
densification region [44].
Figure 5.10. Compressive strength versus strain curves of (a) Rigid foams: B3-RF145
(B3-Green Polyol rigid foam of density 145 kgm-3), B4-RF166 (B4-Green Polyol rigid foam
of density 166 kgm-3) (b) Flexible foams. B3-FF162 (B3-Green Polyol flexible foam of
density 162 kgm-3), B4-FF156 (B4-Green Polyol flexible foam of density 156 kgm-3).
Strain (%)
0 2 4 6 8 10 12
Com
pre
ssiv
e s
trength
(
MP
a)
0.0
0.4
0.8
1.2B4RF-166
B3RF-145
(a)
Strain (%)
0 10 20 30 40 50
Com
pre
ssiv
e S
trength
(
MP
a)
0.0
0.4
0.8
1.2
B4FF-156
B3FF-162
(b)

188
Table 5.4 lists the compressive strength of rigid foams at 6% and 10 % deformation
and that of the flexible foams at 10% and 25% deformation. Even though both the B3- and
B4-Green Polyol rigid foams were prepared based on a total OH value of 450 mg KOH/g,
their compressive strength values were slightly different. The B3- and B4-Green Polyols
rigid foams displayed a higher compressive strength compared to PMTAG Polyol rigid
foam [30]. This may be due to the extra amount of highly reactive glycerol cross linker
added for the rigid foam formulation of B3- and B4-Green Polyol rigid foams to make for
the targeted OH value of 450 mg KOH/g. Four (4) and two (2 parts) of extra glycerol on
top of what was added to PMTAG Polyol were needed for the B3- and B4-Green Polyols,
respectively, to attain the same target OH value of the rigid foam formulations (see Table
5.2).
The compressive strength value of the rigid foams obtained from B3- and B4-Green
Polyols are higher than those prepared from natural TAG oil polyols such as, soybean oil
polyol[2] and canola oil polyol.[2] For example, the rigid B3- and B4-Green polyol foams
presented compressive strengths that are three (3) times larger than the 0.32 MPa of the
rigid foams prepared with polyol from soybean oil with the same density (~160 kg/m3),
understandably because the B3- and B4-Green polyols have lesser dangling chains and
relatively large amounts of primary hydroxyl groups contrary to the soybean oils which
presented internal hydroxyl groups only.
B3FF-162 and B4FF-156 displayed a significantly lower compressive strength than
the flexible foam of similar density 156 kgm-3 made from PMTAG Polyol. This is due to
the more marked effect of the difference in OH value of B3- and B4- Green Polyol (B3: 83
mg KOH/g and B4: 119 mg KOH/g compared to 155 mg KOH/g for PMTAG Polyol and

189
lesser percentage of terminal hydroxyls (B3: 16.5 mol% and B4: 18.3 mol % compared to
24.1 mol%) which become significant in the absence of the added glycerol.
Table 5.4. Compressive strength of rigid foams: B4-RF166 (B4-Green Polyol rigid
foam of density 166 kgm-3) versus RF-165 (PMTAG Polyol rigid foam of density 165 kgm-
3)at 6% and 10 % deformation. Flexible Foams: B3-FF162 (B3-Green Polyol flexible foam
of density 162 kgm-3), B4-FF156 (B4-Green Polyol flexible foam of density 156 kgm-3) and
FF-156 (PMTAG Polyol flexible foam of density 156 kgm-3) at 10% and 25% deformation.
Foams Density
(kgm-3)
Compressive strength
(MPa)
Recovery %: after
48h
Rigid Foams --
@ Strain (%) 6 10 --
B3-RF145 145 0.79 0.94 --
B4-RF166 166 0.72 1.05 --
RF 165 0.66 0.85 --
Flexible Foams --
@ Strain (%) 10 25 --
B3-FF162 162 0.21 0.30 94
B4-FF156 153 0.33 0.38 92
FF-156 156 0.69 0.88 80
The recovery in thickness of the flexible foam made from B4-Green Polyol (B4FF-
156) was measured after 65% compression at suitable times using a Vernier caliper. The
results are presented in Figure 5.11. As can be seen in the Figure 5.11, B4FF-156 recovery
was very fast reaching more than 80% in less than 2 min and ~ 90 % after 5 min. These
values are 10% higher than those achieved by the same density flexible foam produced
with PMTAG Polyol. The difference in flexibility between B4FF-156 and PMTAG Polyol
flexible Foam (Table 5.4), as elucidated by the compressive strength and recovery data,
can be related to the differences in OH value and lesser percentage of terminal hydroxyls

190
in their corresponding polyol structure. This indicates the compressive strength and the
flexibility of the flexible foams can be controlled to a relatively large extent by controlling
the OH value and the terminal hydroxyls of the polyol.
Figure 5.11: Recovery (%) in thickness of B4-FF156 (B4-Green Polyol flexible
foam of density 156 kgm-3) versus time.
The properties of the Green Polyol flexible foams also compare favorably with the
commercial and bio based flexible foams. Although the flexible foam industry relies on
petroleum based polyols such as poly ether polyols [9, 49], lipid-based polyol are
increasingly used, particularly as blends such as soy-castor oil-based polyol [50], rapeseed
polyol [51], soy polyol [9, 31], palm oil polyol. [49]
The flexible foams of the present study present compressive strengths that are in the
0.1 MPa to 0.4 MPa range displayed by these foams. The comparison the overall properties
of the flexible foams of the present work with those materials suggest that the Green
Polyols would be very interesting as blend with commercial petroleum polyols and would
provide highly functional flexible foams. One would expect similar or better results than
Time (min)
0 3 6 9 12 1500 3000
Recovery
(
%)
20
40
60
80
100
B4-FF156

191
what was achieved with palm oil polyol for which a 15% substitution with Alfapol, a
petroleum based polyether polyol, enhanced the compressive strength by ~60% [49] or soy
oil polyol where a 30% substitution caused 50% improvement in compressive strength.[9]
The partial replacement commercial petroleum based polyols with the Green Polyols of the
present work in fact show great promise for both flexible and rigid applications.
5.4 Conclusions
Green Polyols with controlled OH value and primary hydroxyls were successfully
synthesized using an alternative, solvent free epoxidation and hydroxylation reactions. The
solvent free pathway has been demonstrated to be able to yield very versatile green polyols
comprised of diols and tetrols terminal groups. The structures of the polyols although
inherited from the feedstock (PMTAG) were dramatically influenced by the reaction
conditions. A complete functionalization of PMTAG has been achieved with moderate
temperature and reaction time conditions. Furthermore, the formic acid moieties that attach
to the polyol backbone under specific reaction conditions can be managed effectively and
even avoided by adequately tuning the time and temperature of epoxidation reaction.
Two designer polyols (so-called B3- and B4-Green Polyols) having OH values of 83
and 119 mg KOH/g, respectively, and 16 and 18% primary hydroxyl, respectively, were
fully characterized and used to produce very functional rigid as well as flexible foam. Note
that a relatively large number of oligomeric material (~45%) was detected in the Green
Polyols.
The thermal transition behavior of the green polyol was dictated by a high-melting and
low-melting portions that are related to the olein-like and stearin –like portion of PMTAG.

192
However, although clearly separated, their associated thermal events were much closer
than in PMTAG or palm oil because of the hydroxyls groups present in the olein-like
portion of the polyol which shifted its crystallization to a higher temperature (~10 °C).
These polyols presented a melting temperature (48 °C) and viscosity profiles that were very
manageable for preparing the rigid and flexible foams.
Both the rigid and flexible foams prepared from the Green Polyols displayed good
thermal stability with onset of decomposition at ~270 °C comparable to other vegetable
oil-based foams. Their closed cell structure as evaluated from SEM images, indicate that
they are suitable for structural and thermal insulation applications. The compressive
strength of the rigid foams prepared from the Green Polyols compare favorably with those
prepared previously from PMTAG via solvent mediation. One can note that there is more
flexibility in the foams made from Green polyol because of the larger range of control of
the structures of the green Polyol compared to the solvent mediated polyol. Interestingly,
the green polyols produced flexible foams with very good flexibility attributes such as very
high recovery (94 %) coupled with a relatively low but tunable compressive strength. The
findings of the present study, particularly the results obtained with the flexible foams, bode
well for the success of the strategy based on a green economical synthetic route for the
production of polyols from vegetable oil based feedstocks.
Acknowledgements: We would like to thank the Grain Farmers of Ontario, Elevance
Renewable Sciences, Trent University, the GPA-EDC, Ontario Ministry of Agriculture,
Food and Rural Affairs, Industry Canada and NSERC for financial support. We also thank
Dr. Michael Floros for his kind help in taking SEM Pictures.

193
5.5 References
[1] Randall D, Lee S. The polyurethanes book: Huntsman Polyurethanes Belgium, 2002.
[2] Narine SS, Kong X, Bouzidi L, Sporns P. Physical properties of polyurethanes
produced from polyols from seed oils: II. Foams. Journal of the American Oil Chemists'
Society. 2007;84(1):65-72.
[3] Somani KP, Kansara SS, Patel NK, Rakshit AK. Castor oil based polyurethane
adhesives for wood-to-wood bonding. International Journal of Adhesion and Adhesives.
2003;23(4):269-75.
[4] Velayutham TS, Majid WHA, Ahmad AB, Kang GY, Gan SN. Synthesis and
characterization of polyurethane coatings derived from polyols synthesized with glycerol,
phthalic anhydride and oleic acid. Progress in Organic Coatings. 2009;66(4):367-71.
[5] General. Polymer Foam Market By Types (Polyurethane, Polystyrene, Polyvinyl
Chloride, Polyolefin, Phenolic, Melamine and Others), Applications (Packaging, Building
& Construction, Furniture & Bedding, Automotive, Wind Energy and Others) &
Geography - Global Trends & Forecasts to 2018. marketsandmarkets. 2013;CH 1465.
[6] Szycher M. Handbook of polyurethanes. CardioTech International Inc., Woburn, MA
(US); 1999.
[7] Guan J, Song Y, Lin Y, Yin X, Zuo M, Zhao Y, et al. Progress in study of non-
isocyanate polyurethane. Industrial & Engineering Chemistry Research.
2011;50(11):6517-27.
[8] More AS, Gadenne B, Alfos C, Cramail H. AB type polyaddition route to thermoplastic
polyurethanes from fatty acid derivatives. Polym Chem. 2012;3(6):1594-605.
[9] Zhang L, Jeon HK, Malsam J, Herrington R, Macosko CW. Substituting soybean oil-
based polyol into polyurethane flexible foams. Polymer. 2007;48(22):6656-67.
[10] Tan S, Abraham T, Ference D, Macosko CW. Rigid polyurethane foams from a
soybean oil-based polyol. Polymer. 2011;52(13):2840-6.
[11] Khoe TH, Otey FH, Frankel EN. Rigid urethane foams from hydroxymethylated
linseed oil and polyol esters. Journal of the American Oil Chemists Society.
1972;49(11):615-8.
[12] Hu YH, Gao Y, Wang DN, Hu CP, Zu S, Vanoverloop L, et al. Rigid polyurethane
foam prepared from a rape seed oil based polyol. Journal of Applied Polymer Science.
2002;84(3):591-7.
[13] Babb DA. Polyurethanes from renewable resources. Synthetic Biodegradable
Polymers: Springer; 2012. p. 315-60.

194
[14] Jason Potts ML, Ann Wilkings, Gabriel Huppé, Maxine Cunningham, Vivek Voora.
The State ofSustainability Initiatives Review 2014.
[15] Pawlik H, Prociak A. Influence of palm oil-based polyol on the properties of flexible
polyurethane foams. Journal of Polymers and the Environment. 2012;20(2):438-45.
[16] Zlatanic A, Petrovic ZS, Dušek K. Structure and properties of triolein-based
polyurethane networks. Biomacromolecules. 2002;3(5):1048-56.
[17] Narine S, Yue J, Kong X. Production of Polyols from Canola Oil and their Chemical
Identification and Physical Properties. Journal of the American Oil Chemists' Society.
2007;84(2):173-9.
[18] Zlatanic A, Petrovic ZS, Dusek K. Structure and properties of triolein-based
polyurethane networks. Biomacromolecules. 2002;3(5):1048-56.
[19] Rybak A, Fokou PA, Meier MAR. Metathesis as a versatile tool in oleochemistry. Eur
J Lipid Sci Technol. 2008;110(9):797-804.
[20] Mol JC, Buffon R. Metathesis in oleochemistry. Journal of the Brazilian Chemical
Society. 1998;9(1):1-11.
[21] Thomas RM, Keitz BK, Champagne TM, Grubbs RH. Highly selective ruthenium
metathesis catalysts for ethenolysis. Journal of the American Chemical Society.
2011;133(19):7490-6.
[22] Malacea R, Dixneuf PH. Alkene Metathesis and Renewable Materials: Selective
Transformations of Plant Oils. Green Metathesis Chemistry: Springer; 2010. p. 185-206.
[23] Mol J. Catalytic metathesis of unsaturated fatty acid esters and oils. Topics in
Catalysis. 2004;27(1-4):97-104.
[24] Connon SJ, Blechert S. Recent developments in olefin cross‐metathesis. Angewandte
Chemie International Edition. 2003;42(17):1900-23.
[25] Rosenburg DW. To produce reduced chain length esters and alpha-olefins. Google
Patents; 1985.
[26] Li SJ, Hojabri L, Narine SS. Controlling Product Composition of Metathesized
Triolein by Reaction Concentrations. Journal of the American Oil Chemists Society.
2012;89(11):2077-89.
[27] Tian QP, Larock RC. Model studies and the ADMET polymerization of soybean oil.
Journal of the American Oil Chemists Society. 2002;79(5):479-88.
[28] Biermann U, Metzger JO, Meier MAR. Acyclic Triene Metathesis Oligo- and
Polymerization of High Oleic Sun Flower Oil. Macromolecular Chemistry and Physics.
2010;211(8):854-62.
195
[29] Prasanth S. Pillai LB, Shaojun Li and Suresh S. Narine. 1-Butene Metathesized Palm
Oil & Polyol Derivatives: Structure, Chemical Composition and Physical Properties.
Submitted to Industrial Crops and Products. 2015.
[30] Prasanth S. Pillai SL, Laziz Bouzidi and Suresh S. Narine. Water-Blown Bio-Based
Polyurethane Foams from 1-butene Cross-metathesized Palm oil Polyol. Submitted to
Industrial Crops and Products. 2015.
[31] Zhang C, Xia Y, Chen R, Huh S, Johnston PA, Kessler MR. Soy-castor oil based
polyols prepared using a solvent-free and catalyst-free method and polyurethanes
therefrom. Green Chem. 2013;15(6):1477-84.
[32] Li S, Bouzidi L, Narine SS. Synthesis and Physical Properties of Triacylglycerol
Oligomers: Examining the Physical Functionality Potential of Self-Metathesized Highly
Unsaturated Vegetable Oils. Industrial & Engineering Chemistry Research.
2013;52(6):2209-19.
[33] Guo A, Cho Y, Petrović ZS. Structure and properties of halogenated and
nonhalogenated soy‐based polyols. Journal of Polymer Science Part A: Polymer
Chemistry. 2000;38(21):3900-10.
[34] Gryglewicz S, Piechocki W, Gryglewicz G. Preparation of polyol esters based on
vegetable and animal fats. Bioresource Technology. 2003;87(1):35-9.
[35] Lin B, Yang L, Dai H, Hou Q, Zhang L. Thermal analysis of soybean oil based polyols.
Journal of Thermal Analysis and Calorimetry. 2009;95(3):977-83.
[36] Goodrum JW, Eiteman MA. Physical properties of low molecular weight triglycerides
for the development of bio-diesel fuel models. Bioresource technology. 1996;56(1):55-60.
[37] Eiteman MA, Goodrum JW. Density and viscosity of low-molecular weight
triglycerides and their mixtures. Journal of the American Oil Chemists’ Society.
1994;71(11):1261-5.
[38] Li Y, Sun XS. Di-hydroxylated soybean oil polyols with varied hydroxyl values and
their influence on UV-curable pressure-sensitive adhesives. Journal of the American Oil
Chemists' Society. 2014;91(8):1425-32.
[39] Kairytė A, Vėjelis S. Evaluation of forming mixture composition impact on properties
of water blown rigid polyurethane (PUR) foam from rapeseed oil polyol. Industrial Crops
and Products. 2015;66:210-5.
[40] Petrović ZS, Zhang W, Javni I. Structure and Properties of Polyurethanes Prepared
from Triglyceride Polyols by Ozonolysis. Biomacromolecules. 2005;6(2):713-9.
[41] Narine SS, Yue J, Kong X. Production of polyols from canola oil and their chemical
identification and physical properties. Journal of the American Oil Chemists' Society.
2007;84(2):173-9.
196
[42] Chuayjuljit S, Sangpakdee T, Saravari O. Processing and properties of palm oil-based
rigid polyurethane foam. Journal of The Minerals, Metals & Materials Society. 2007;17:7-
23.
[43] Piszczyk Ł, Strankowski M, Danowska M, Hejna A, Haponiuk JT. Rigid polyurethane
foams from a polyglycerol-based polyol. European Polymer Journal. 2014;57:143-50.
[44] Gu R, Konar S, Sain M. Preparation and characterization of sustainable polyurethane
foams from soybean oils. Journal of the American Oil Chemists' Society.
2012;89(11):2103-11.
[45] Campanella A, Bonnaillie LM, Wool RP. Polyurethane Foams from Soyoil-Based
Polyols. Journal of Applied Polymer Science. 2009;112(4):2567-78.
[46] Javni I, Petrović ZS, Guo A, Fuller R. Thermal stability of polyurethanes based on
vegetable oils. Journal of Applied Polymer Science. 2000;77(8):1723-34.
[47] Shufen L, Zhi J, Kaijun Y, Shuqin Y, Chow W. Studies on the thermal behavior of
polyurethanes. Polymer-Plastics Technology and Engineering. 2006;45(1):95-108.
[48] Tanaka R, Hirose S, Hatakeyama H. Preparation and characterization of polyurethane
foams using a palm oil-based polyol. Bioresource Technology. 2008;99(9):3810-6.
[49] Pawlik H, Prociak A. Influence of palm oil-based polyol on the properties of flexible
polyurethane foams. Journal of Polymers and Environment. 2012;20(2):438-45.
[50] Zhang C, Kessler MR. Bio-based Polyurethane Foam Made from Compatible Blends
of Vegetable-Oil-based Polyol and Petroleum-based Polyol. ACS Sustainable Chemistry
& Engineering. 2015;3(4):743-9.
[51] Malewska E, Bąk S, Prociak A. Effect of different concentration of rapeseed-oil-based
polyol and water on structure and mechanical properties of flexible polyurethane foams.
Journal of Applied Polymer Science. 2015;132(35):n/a-n/a.

197
6 Conclusion
6.1 General Conclusion
Palm oil is one of the most inexpensive commodity oils in the world, making it a good
candidate feedstock for the synthesis of renewable bio-based polymers, inclusive of
polyurethanes. However, the steric hindrance associated with the dangling chains of the
saturated and mid-chain substituted or unsubstituted unsaturated fatty acids are significant
limitations in the conversion of palm oil into value added materials such as polyols for the
synthesis of polyurethane foams, especially rigid polyurethane foams. This thesis
investigated several chemical and physical strategies to address the dangling chain issues
of palm oil and its subsequent use in the preparation of rigid and flexible PU foams.
Chemical modification of palm oil involved cross metathesis with 1-butene to give a
metathesized palm oil (PMTAG), followed by epoxidation and hydroxylation, and physical
modification involved fractionation of the PMTAG into its highly saturated stearin and
highly unsaturated olein fractions.
6.2 Rigid foams from PMTAG
The structural and compositional analysis of palm oil chemically modified by cross
metathesis with 1-butene (PMTAG) was determined using 1HNMR, GC and HPLC. It was
revealed that metathesis did not affect the saturated moieties of the starting natural oil,
which remained at ~50%, but significantly modified its unsaturated fatty acids. 50% of the
carbon-carbon double bonds of PMTAG were detected at terminal positions, whilst the
remaining fatty acid moieties with internal double bonds were found to have a cis/trans
configuration ratio 2:1. Furthermore, a major part of the unsaturated content in PMTAG

198
was comprised of 9-decenoic acid (D) and 9-dodecenoic acid (Dd), two moieties not
present in the natural oil.
Epoxidation followed by hydroxylation of PMTAG yielded PMTAG polyol, a mixture
of diols, tetrols and hexols with a maximum OH value of 155 mg KOH/g and 24.1 mol%
terminal hydroxyls. The thermal stability and viscosity of PMTAG polyol were in the range
of other vegetable based polyols such as soybean and canola oil polyols, indicating its
suitability as a commodity material for polyurethane foam preparation.
The rigid foams prepared from the PMTAG polyol displayed three (3) times higher
compressive strength compared to the rigid foams of similar density produced from natural
oil polyols such as palm and soybean oil polyols. This indicated that the introduction of the
terminal hydroxyl groups, and correspondingly the removal of the dangling chains at the
carbon-carbon double bonds, resulted in more rigid polyurethane foams compared to those
obtained from the natural oil polyols, corroborating Hypothesis 1. In fact, comparison of
the OH values and compressive strength of the PMTAG polyol with those of the natural
oils reveal that the position of the OH group (i.e., terminal or not) has a more significant
influence on compressive strength compared to OH value alone.
6.3 Flexible foams from PMTAG
Flexible foams with 80 to 90 % recovery were produced from the terminal hydroxyl
PMTAG polyol by excluding the glycerin cross linker and lowering the catalyst
concentration. This supports Hypothesis 2 that flexible foams could be prepared from
PMTAG polyol by alteration in the formulation recipe of the rigid foams, and shows the
suitability of PMTAG polyol for use in flexible foam applications.

199
6.4 Foams from fractionated PMTAG
PMTAG was fractionated using dry and solvent mediated crystallization fractionation.
As expected, the solid fraction (SF) of both methods consisted of the highly saturated
stearin type molecules of PMTAG, which left the liquid fraction (LF) rich in the highly
unsaturated olein type molecules.
The polyols produced from the olein rich fraction (liquid fraction: LF) of the PMTAG
displayed a higher OH value (184 mg KOH/g) compared to PMTAG polyol (155 mg
KOH/g) due to the removal of the saturated components. In fact, the LF-PMTAG polyols
obtained by either fractionation methods possessed the same OH values, indicating
similarity of composition regardless of the fractionation method.
Rigid foams produced from the LF-PMTAG polyols displayed 1.5 times higher
compressive strength than the rigid foam from PMTAG polyol with the same density. This
substantiates that fractionation by dry and solvent crystallization of PMTAG resulted in a
better feed stock, LF-PMTAG, and corresponding polyol for rigid polyurethane foams
application. This supports Hypothesis 3; i.e., that polyols derived from the olein fraction
of PMTAG would make highly rigid foams compared to rigid PMTAG polyol foams.
Flexible foams, prepared from LF-PMTAG polyols using the same formulation
recipe used in case of PMTAG polyol flexible foams, displayed ~ 80% recovery, but lower
compressive strength than analogous foams from flexible PMTAG polyol due to the lower
number of terminal hydroxyls in the former (18- 20 mol %). Thus, the flexible foams
prepared from LF-PMTAG polyols possessed similar recovery but were more flexible than
the PMTAG polyol flexible foams. This validates the suitability of LF-PMTAG polyols

200
for flexible foam applications and corroborates Hypothesis 4 that flexible foams can be
prepared from olein fraction (liquid fraction) of PMTAG by varying the formulation recipe.
6.5 Green Polyols and Foams
Solvent free epoxidation of PMTAG followed by hydroxylation was used to prepare
green PMTAG polyols. Green polyols with variable OH values and no formic acid attached
were obtained by controlling the reaction temperature of the epoxidation reaction (four
batches B1 to B4). The green polyols with lower OH values and terminal hydroxyls (B3-
Green Polyol with OH value 89 mg KOH/g and 16.5 mol% terminal hydroxyls; and B4-
Green Polyol with OH value 119 mg KOH/g and 18.3 mol % terminal hydroxyls) were
used for the preparation of polyurethane foams.
The flexible foams prepared from the Green Polyols (B3 and B4) displayed lower
compressive strength and higher recovery (~94%) than the PMTAG polyol flexible foam
of similar density. In fact, comparison of the OH values, compressive strength and recovery
of similar density foams revealed that compressive strength increased and recovery
decreased with increasing OH value and number of terminal hydroxyl groups. These results
corroborate, therefore, Hypothesis 5, and further shows that both OH value and terminal
hydroxyl groups are important deciding factors of the strength of the foams.
6.6 Summary
To conclude, cross metathesis and fractionation were used singly and in combination
to successfully to reduce the effects of the dangling chains associated the saturated and
unsaturated fatty acids in palm oil. 1-butene cross metathesis of palm oil modified the
unsaturated fatty acids so as to produce terminal double bonded TAGs (PMTAG).

201
Fractionation of PMTAG reduced the proportion of the highly saturated stearin type
molecules in the PMTAG. Terminal hydroxyl polyols produced from PMTAG and
fractionated PMTAG gave polyurethane foams with enhanced rigidity compared to those
produced from natural oils such as soybean oil and palm oil. Furthermore, green polyols
with variable OH value and, therefore, tunable foam compressibility and recovery were
successfully synthesized from PMTAG by solvent free strategy for use in polyurethane
foam preparation.
6.7 Implications of this study
The fundamental understanding obtained from the study indicates that high saturated
fatty acid content in vegetable oils, whilst a significant barrier to oleo-chemical synthesis,
can be mitigated in the case of palm oil by fractionation and cross-metathesis to produce
highly functional polyols. Issues associated with the fatty acid profiles can therefore
generally be addressed using chemical modification, such as cross metathesis, combined
with physical modification, such as fractionation.
6.8 Future Prospects
The present study has investigated the use of cross metathesis, and the fractionation
of the cross metathesized product to rectify the dangling chain issues of natural vegetable
oils which limits their application for rigid foam preparations. However the study has
considered only the cross metathesis of palm oil using 1-butene, which converted only 50%
of total unsaturated fatty acids into terminal double bonds. Instead of 1-butene, ethylene
can be used for cross metathesis in order to convert all unsaturated fatty acids into terminal
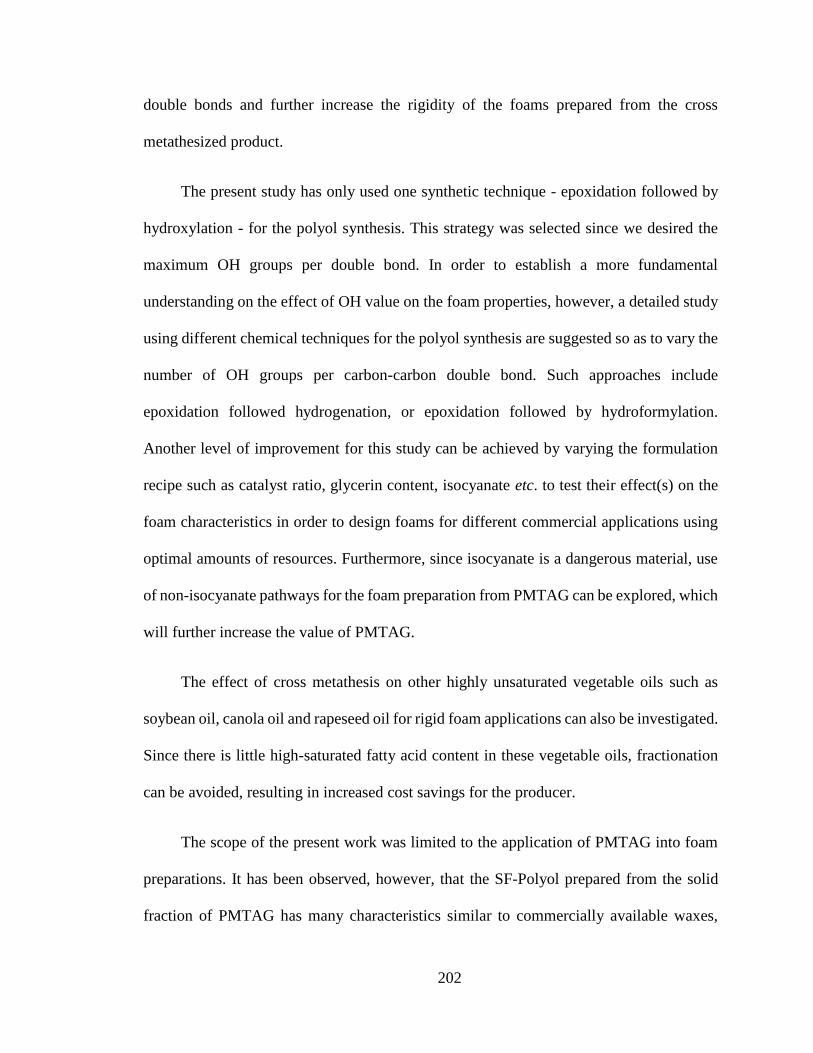
202
double bonds and further increase the rigidity of the foams prepared from the cross
metathesized product.
The present study has only used one synthetic technique - epoxidation followed by
hydroxylation - for the polyol synthesis. This strategy was selected since we desired the
maximum OH groups per double bond. In order to establish a more fundamental
understanding on the effect of OH value on the foam properties, however, a detailed study
using different chemical techniques for the polyol synthesis are suggested so as to vary the
number of OH groups per carbon-carbon double bond. Such approaches include
epoxidation followed hydrogenation, or epoxidation followed by hydroformylation.
Another level of improvement for this study can be achieved by varying the formulation
recipe such as catalyst ratio, glycerin content, isocyanate etc. to test their effect(s) on the
foam characteristics in order to design foams for different commercial applications using
optimal amounts of resources. Furthermore, since isocyanate is a dangerous material, use
of non-isocyanate pathways for the foam preparation from PMTAG can be explored, which
will further increase the value of PMTAG.
The effect of cross metathesis on other highly unsaturated vegetable oils such as
soybean oil, canola oil and rapeseed oil for rigid foam applications can also be investigated.
Since there is little high-saturated fatty acid content in these vegetable oils, fractionation
can be avoided, resulting in increased cost savings for the producer.
The scope of the present work was limited to the application of PMTAG into foam
preparations. It has been observed, however, that the SF-Polyol prepared from the solid
fraction of PMTAG has many characteristics similar to commercially available waxes,

203
indicating its suitability for use as commercial waxes. Furthermore, based on the similar
architectures of terminal polyols reported in the literature for the preparation of bio-based
elastomers and plastic sheets, it is anticipated that the PMTAG polyols of this work, too,
may be used in alternative applications such as elastomer and plastic sheets.

204
Appendix
A1 Butene Cross metathesized Palm oil and Polyol Derivatives: Structure
and Physical properties
Table A 1. Table showing the characteristic chemical shift values of PMTAG
Proton Chemical Shift (ppm)
-(CH2)7CH
3 ~0.8-0.9
-(CH2)2CH
3 ~1.0
-(CH2)- 1.4-1.2
-CH2CH
2COO- ~1.6
-CH2CH= 2.1-1.9
-CH2COO- 2.4-2.2
-OCH2CH(O)CH
2O- 4.3-4.1
-CH=CH2 5.0-4.8
-OCH2CH(O)CH
2O- 5.3-5.2
-CH=CH- 5.5-5.3
-CH=CH2 ~5.8

205
Figure A 1: 1H-NMR of Epoxidation of PMTAG in Ethyl Acetate. Terminal double
bond left : >60%
Figure A 2: 1H-NMR of Epoxidation of without solvent. No double bond detected.
Formic ester polyol formed. Terminal double bond left : >60%

206
Figure A 3: 1H-NMR of Epoxidation of with reduced ratio of H2O2 and HCOOH.
Terminal double bond >40% and Internal double bond >5%
Scheme A 1. Possible structure of the formic ester polyol

207

208

209

210
Scheme A 2. Structures of PMTAG Polyol determined by MS and 1H-NMR

211
F1
Time/min
0 1 2 3 4 5
LS
U
0
600
1200
1800
2400F2
Time (min)
6 7 8
LS
U
0
300
600
900
1200
F3
Time (min)9 10 11 12
LS
U
0
100
200
300
400F4
Time (min)
10 12 14 16 18 20
LS
U
0
300
600
900
1200
1500
F5
Time (min)
15 16 17 18 19
LS
U
0
200
400
600F6
Time (min)
18 19 20 21
LS
U
0
100
200
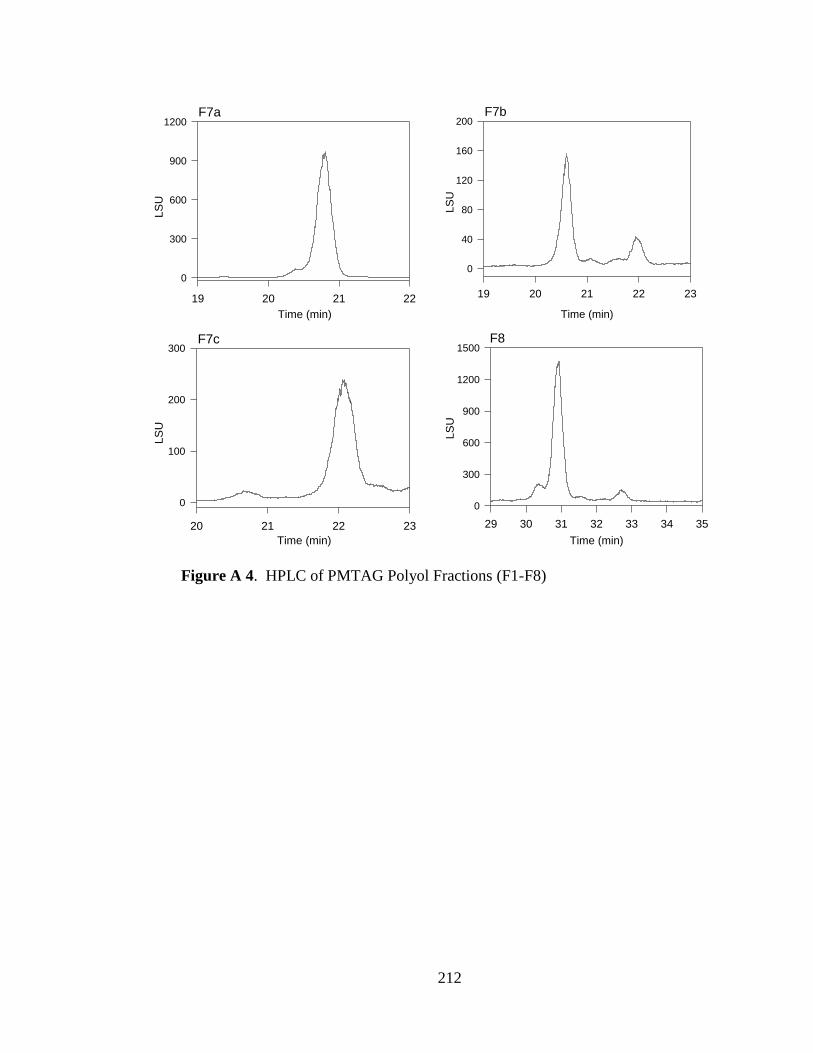
212
Figure A 4. HPLC of PMTAG Polyol Fractions (F1-F8)
F7a
Time (min)
19 20 21 22
LS
U
0
300
600
900
1200F7b
Time (min)
19 20 21 22 23
LS
U
0
40
80
120
160
200
F7c
Time (min)
20 21 22 23
LS
U
0
100
200
300F8
Time (min)
29 30 31 32 33 34 35
LS
U
0
300
600
900
1200
1500

213
A2 Fractionation Strategies for Improving Functional Properties of Polyols
and derived Polyurethane Foams from 1-butene Metathesized Palm Oil
Table A 2. Thermal data of the PMTAG obtained on cooling and heating (at 0.1, 1.0,
5 °C/min). onT , offT and pT , p= 1-6: Onset, offset, and peak temperatures, ,C MH :
Enthalpy, C: crystallization and M: melting.
Cooling Temperature (C) (J/g)
°C/min onT 1T 2T 3T 4T 5T 6T offT 1H 2H CH
0.1 31.7 30.5 11.8 -11.2 -23.0 -30.0 28.8 157.
3 186.1
1.0 26.9 25.5 9.4 4.9 0.4 -14.2 -
21.0 -47.2 26.9 74.3 101.2
5.0 24.4 22.9 4.1 -6.4 -22.7 -31.7 -
43.6 -54.1 24.4 67.8 92.1
Table A 3. Fractionation of PMTAG by crystallization. OnT : onset of crystallization
Experiment OnT
(°C) aF1 14.5 aF2 13.5 aF3 10.0 aF4 8.5 bF5 11.5
a: Dry Fractions
b: Solvent Fractions

214
Figure A 5: Crystallization thermograms of (a) LF(D)-PMTAG , (b)SF(D)-PMTAG
obtained at 5 °C/min and heating profiles of (c) LF(D)-PMTAG , (d) SF(D)-PMTAG at 5
°C/min..
(a) Liquid Fractions
Temperature /oC
-10 0 10 20 30
He
at
Flo
w
/W
g-1
(
Exo
up
) PMTAG
LF1
LF2
LF3
LF4
4 o
C
24.4
14.5
13.5
10.0
8.5
TO
n (
oC
)
0.5
(b) Solid Fractions
Temperature /oC
-10 0 10 20 30
Heat
Flo
w
/W
g-1
(
Exo u
p)
PMTAG
SF1
SF2
24.4
20.5
24.3
24.8
4 o
C
SF3
22.5SF4
TO
n (
oC
)
0.5
(c) Liquid Fractions
Temperature /oC
-20 0 20 40
He
at
Flo
w
/W
g-1
(
En
do
do
wn
)
PMTAG
LF1
LF2
LF3
LF4
(d) Solid Fractions
Temperature /oC
-20 0 20 40
Heat
Flo
w
/W
g-1
(
Endo d
ow
n)
-1.0
-0.5
0.0
0.5
PMTAG
SF1
SF2
SF3
SF4

215
(a)
Temperature /oC
-30 -20 -10 0 10 20 30 40
He
at F
low
/W
g-1
(E
xo u
p)
0.0
0.2
0.4
0.6
0.8
PMTAG
LF(S)
Ton (
oC
)
24.4
11.45
Figure A 6: Crystallization thermograms of (a) LF(S)-PMTAG , (b)SF(S)-PMTAG
obtained at 5 °C/min and heating profiles of (c) LF(S)-PMTAG , (d) SF(S)-PMTAG at 5
°C/min.
(b)
Temperature /oC
-30 -20 -10 0 10 20 30 40
Heat
Flo
w
/W
g-1
(Exo u
p)
0.0
0.2
0.4
0.6
0.8
1.0
1.3
1.5
SF(S)
PMTAG24.4
29.1
Ton (
oC
)
(c)
Temperature /oC
-30 -15 0 15 30 45 60
Heat
Flo
w
/W
g-1
(Endo d
ow
n)
-1.2
-1.0
-0.8
-0.6
-0.4
-0.2
0.0
PMTAG
LF(S)
(d)
Temperature /oC
-30 -15 0 15 30 45 60
Heat
Flo
w
/W
g-1
(Endo d
ow
n)
-1.2
-1.0
-0.8
-0.6
-0.4
-0.2
0.0
PMTAG
SF(S)

216
Table A 4. Thermal data of SF- and LF-PMTAG. onT , offT , 1 3T : onset, offset and
peak temperatures (C), SH , OH , and H (J/g): Enthalpy of the stearin and olein
portions, and total enthalpy, respectively.
Cooling cycle (5 C/min)
Exotherms Enthalpy (J/g)
T (C) onT offT 1T 2T 3T SH OH H
SF- PMTAG 24.9 -31.5 23.9 4.2 -21.3 26.0 64.0 90.0
LF-PMTAG 14.3 -31.5 13.3 4.9 -21.7 9.0 61 70
Heating cycle (5 C/min)
T (C) Endotherms Exotherms
onT offT 1T 2T 3T 4T 5T 1RT 2RT
SF-PMTAG -25.3 49.3 46.6 25.6 13.3 -4.6 -17.2 18.0 2.3
H (J/g) -- -- 28.4 92.7 20.7 10.9 4.9 2.5
LF-PMTAG -25.6 34.5 31.6 25.6 15.4 -4.4 -17.3 18.7 3.1
H (J/g) shoulder 37.9 33.6 9.0 0.4 2.4
.
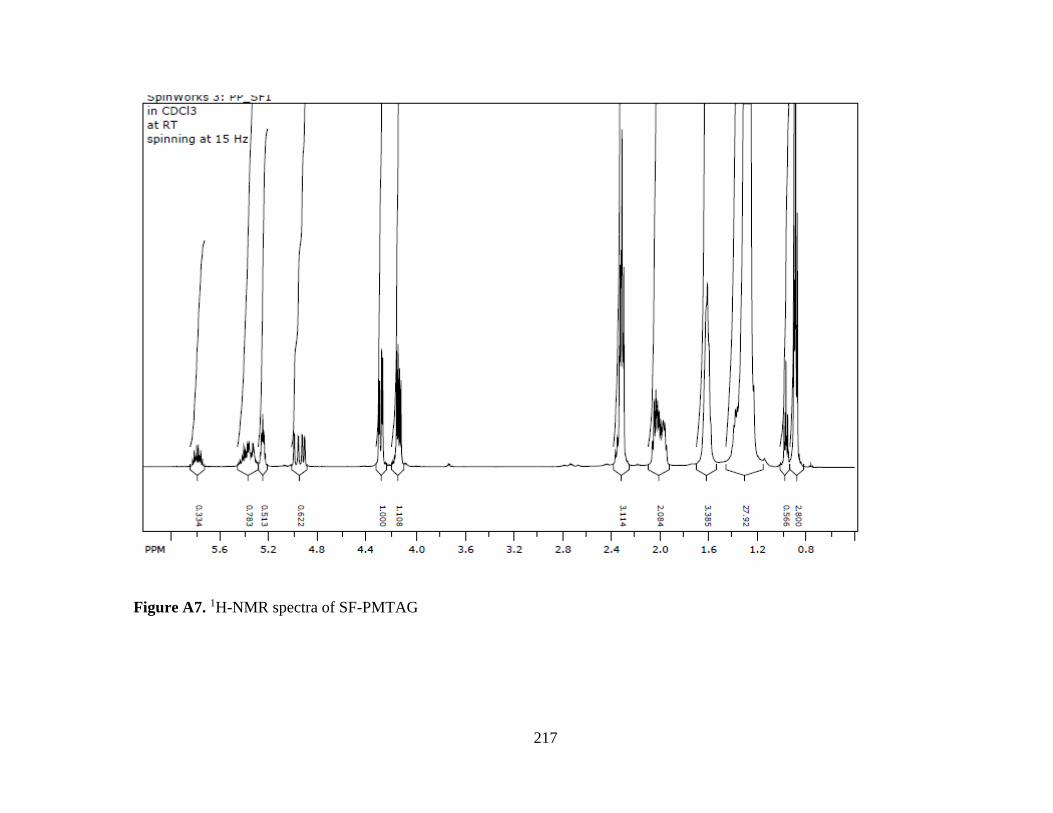
217
Figure A7. 1H-NMR spectra of SF-PMTAG

218
Figure A 8. 1H-NMR spectra of LF-PMTAG
219
Table A 5. 1H-NMR chemical shifts of SF-PMTAG and LF- PMTAG
Fractionated
PMTAG
1H-NMR Chemical shifts (500 MHz), δ, in CDCl3 (ppm)
LF(D)-
PMTAG
5.8 (m, 0.8H), 5.3-5.6 (m, 1.8H), 5.2 (m, 1H) ,5.0-4.8 (dd, 1.3H) ,4.4-
4.2 (dd, 2.0H), 4.2-4.0 (dd, 2.0H), 2.4-2.2 (dd, 6.0H), 1.6-1.2 (m, 58H), 1.2-
1.0 (t, 1.1H), 1-0.8 (t, 5.3H)
LF(S)-
PMTAG
5.8 (m, 0.5H), 5.3-5.6 (m, 2.2H), 5.2 (m, 1.0H) ,5.0-4.8 (dd, 1.1H)
,4.4-4.2 (dd, 2.0H), 4.2-4.0 (dd, 2.0H), 2.4-2.2 (dd, 6.2H), 1.6-1.2 (m, 63H),
1.2-1.0 (t, 1.4H), 1-0.8 (t.5.8H)
SF(D)-
PMTAG
5.8 (m, 0.7H), 5.3-5.6 (m, 1.6H), 5.2 (m, 1.0H) ,5.0-4.8 (dd, 1.2H)
,4.4-4.2 (dd, 2.0H), 4.2-4.0 (dd, 2.0H), 2.4-2.2 (dd, 6.2H), 1.6-1.2 (m, 62H),
1.2-1.0 (t, 1.1H), 1-0.8 (t.5.6H)
SF(S)-
PMTAG
5.8 (m, 0.4H), 5.3-5.6 (m, 1.7H), 5.2 (m, 1.0H) ,5.0-4.8 (dd, 0.81H)
,4.4-4.2 (dd, 2.0H), 4.2-4.0 (dd, 2.0H), 2.4-2.2 (dd, 6.2H), 1.6-1.2 (m, 68H),
1.2-1.0 (t,0 9H), 1-0.8 (t.6.3H)
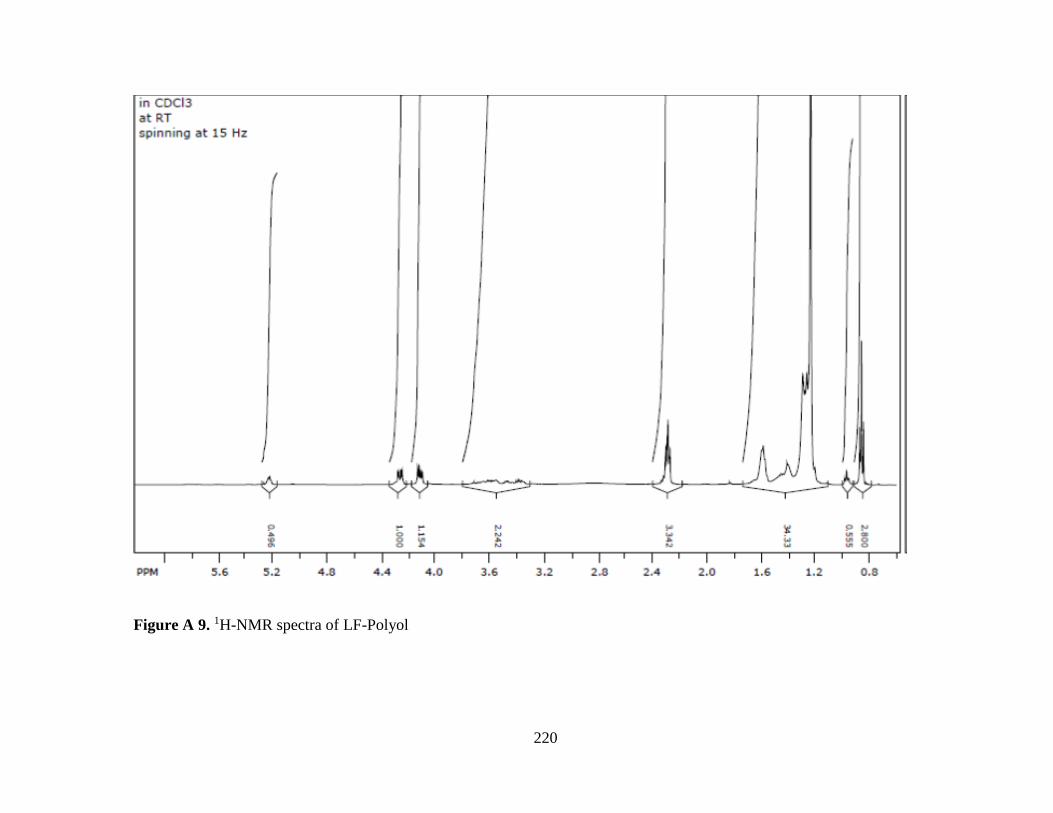
220
Figure A 9. 1H-NMR spectra of LF-Polyol

221
Figure A 10. 1H-NMR spectra of SF-Polyol

Table A 6: Chemical shifts (δ) and their integration values from 1HNMR.
Polyols 1H-NMR Chemical shifts, δ, in CDCl3 (ppm)
LF- Polyol 5.2 (m, 1H), 4.4-4.2 (dd, 2H), 4.2-4.0 (dd, 2H), 3.8 -3.2 (m, 4.5H),
2.4-2.2 (dd, 6.6H), 1.6-1.2 (m, 68H), 1.2-1.0 (t, 1.12H), 1-0.8 (t.5.6H)
SF- Polyol 5.2 (m, 1H), 4.4-4.2 (dd, 2H), 4.2-4.0 (dd, 2H), 3.8 -3.2 (m, 4.14H),
2.4-2.2 (dd, 7.2H), 1.6-1.2 (m, 70H), 1.2-1.0 (t, 1.63H), 1-0.8 (t.7.8H)
Table A 7. Temperature of degradation at 1, 5 and 10% weight loss (1%
dT ,5%
dT , 10%
dT
, respectively), DTG peak temperatures ( DT ), and extrapolated onset ( onT ) and offset (
offT ) temperatures of degradation of LF- and SF- Polyols
Temperature (C) Weight loss (%) at
1%
dT 5%
dT 10%
dT onT 1DT DT offT
onT 1DT DT
LF-Polyol 194 291 315 328 228 376 469 15 2 58
SF-Polyol 177 261 304 294 237 389 422 8 4 67

223
Table A 8. Thermal data of LF- and SF-Polyols obtained on cooling and heating
(both at 5 °C/min). Onset ( onT ), offset (offT ), and peak temperatures ( 1 3T ), Enthalpy of
crystallization ( CH ), and Enthalpy of melting ( MH ). aShoulder peak
SF-Polyol Temperature (C) Enthalpy (J/g)
onT 1T 1 'T 2T 3T offT CH
Cooling 32.1 31.6 28.3 20.1 13.4 -1.2 113
offT 1T 2T 3T 4T onT MH
Heating 49.8 47.2 36.7 25.6a 23.8 2.8 101
LF-Polyol Temperature (C) Enthalpy (J/g)
onT 1T 2T 3T offT CH
Cooling 28.9 25.8 21.3 1.5 0.8 99.6
onT 1T a 2T 3T 4T a offT
MH
Heating 6.6 41.6 32.5 27.2 20.9 44.8 89.9
Table A 9. Temperature of degradation at 1, 5 and 10% weight loss ( 1%
dT , 5%
dT , 10%
dT
, respectively), DTG peak temperatures ( DT ), and extrapolated onset ( onT ) and offset ( offT
) temperatures of degradation of LF(D)-Polyol Foams
Temperature (C) Weight loss (%)
at
5%
dT 10%
dT onT 1DT 2DT 3DT offT onT 1DT 2DT 3DT
LF-Polyol Rigid
Foam(RF163) 265 285 251 302 361 462 494 3 18 45 67
5%
dT 10%
dT onT 1DT 2DT 3DT offT onT 1DT 2DT 3DT
LF-Polyol
Flexible Foam
(FF161)
249 278 250 307 362 450 486 5 17 44 68

224
A3 Solvent Free Synthesis of Polyols from 1-Butene Metathesized Palm Oil
for Use of Polyurethane Foams
Table A 10: Properties of diphenylmethane diisocyanate (MDI)
Appearance Dark brown liquid
Composition Polymeric MDI: 40-50%
(4, 4’ Diphenylmethane Diisocyanate):30-
40%
MDI mixed isomers: 15-25%
Boiling Point (°C) 208
NCO (wt%) 31.5
Functionality 2.4
Equivalent weight (g/mol) 133
Viscosity @ 25 °C (mPa·s) 200
Bulk density (Kgm-3) 1234
Table A 11. 1H-NMR chemical shifts, δ, of B1-, B2-, B3- and B4-epoxy PMTAG.
Polyols 1H-NMR Chemical shifts, δ, in CDCl3 (ppm)
B1-epoxy PMTAG 8.2 (m, 0.28H), 5.8 (m, 0.2H) 5.2 (m, 0.92H) ,5.0-4.8 (dd, 0.40H) ,4.4-4.2
(dd, 2H), 4.2-4.0 (dd, 2H), 2.85 (m, 0.54H), 2.7-2.4 (m, 1.5H) 2.4-2.2 (dd,
7.2H), 1.8-1.2 (m, 74H), 1.2-1.0 (t, 1.3H), 1-0.8 (t, 6.6H)
B2-epoxy PMTAG 8.2 (m, 0.28H), 5.8 (m, 0.18H) 5.2 (m, 1H) ,5.0-4.8 (dd, 0.42H) ,4.4-4.2
(dd, 2H), 4.2-4.0 (dd, 2H), 2.85 (m, 0.48H), 2.7-2.4 (m, 1.4H) 2.4-2.2 (dd,
6.6H), 1.6-1.2 (m, 70H), 1.2-1.0 (t, 1.3H), 1-0.8 (t.7.2H)
B3-epoxy PMTAG 5.8 (m, 0.34H), 5.2 (m, 1H) ,5.0-4.8 (dd, 0.52H) ,4.4-4.2 (dd, 2H), 4.2-4.0
(dd, 2H), 2.85 (m, 0.50H), 2.7-2.4 (m, 1.9H), 2.4-2.2 (dd, 6.2H), 1.6-1.2
(m, 68H), 1.2-1.0 (t, 1.6H), 1-0.8 (t.6.4H)
B4-epoxy PMTAG 5.8 (m, 0.26H), 5.2 (m, 1.1H) ,5.0-4.8 (dd, 0.42H) ,4.4-4.2 (dd, 2H), 4.2-
4.0 (dd, 2H), 2.85 (m, 0.57H), 2.7-2.4 (m, 1.4H), 2.4-2.2 (dd, 6.5H), 1.6-
1.2 (m, 70H), 1.2-1.0 (t, 1.7H), 1-0.8 (t, 5.8H)

225
Table A 12. 1H-NMR chemical shifts, δ, of B1-, B2-, B3- and B4-PMTAG Green
Polyols
Polyols 1H-NMR Chemical shifts, δ, in CDCl3 (ppm)
B1-Green Polyol 8.2 (m, 0.28H) 5.2 (m, 1H) ,5.0-4.8 (dd, 0.40H) ,4.4-4.2 (dd, 2H), 4.2-4.0
(dd, 2H), 3.8 -3.2 (m, 2.1H), 2.4-2.2 (dd, 6.6H), 1.6-1.2 (m, 69H), 1.2-1.0
(t, 1.3H), 1-0.8 (t, 6.6H)
B2-Green Polyol 8.2 (m, 0.28H) 5.2 (m, 1H) ,5.0-4.8 (dd, 0.42H) ,4.4-4.2 (dd, 2H), 4.2-4.0
(dd, 2H), 3.8 -3.2 (m, 2.2H), 2.4-2.2 (dd, 7.4H), 1.6-1.2 (m, 76H), 1.2-1.0
(t, 1.3H), 1-0.8 (t.7H)
B3-Green Polyol 5.2 (m, 1H) ,5.0-4.8 (dd, 0.52H) ,4.4-4.2 (dd, 2H), 4.2-4.0 (dd, 2H), 3.8 -
3.2 (m, 2.2H), 2.4-2.2 (dd, 6.8H), 1.6-1.2 (m, 58H), 1.2-1.0 (t, 1.6H), 1-0.8
(t.5.8H)
B4-Green Polyol 5.2 (m, 1H) ,5.0-4.8 (dd, 0.44H) ,4.4-4.2 (dd, 2H), 4.2-4.0 (dd, 2H), 3.8 -
3.2 (m, 1.6H), 2.4-2.2 (dd, 4.2H), 1.6-1.2 (m, 45H), 1.2-1.0 (t, 1.7H), 1-0.8
(t, 5.8H)

226
Figure A 11: 1HNMR of Selected Polyols
Figure A11a. 1HNMR of B1-Green Polyol.

227
Figure A11b. 1HNMR of B2-Green Polyol.

228
Figure A11c. 1HNMR of B3-Green Polyol
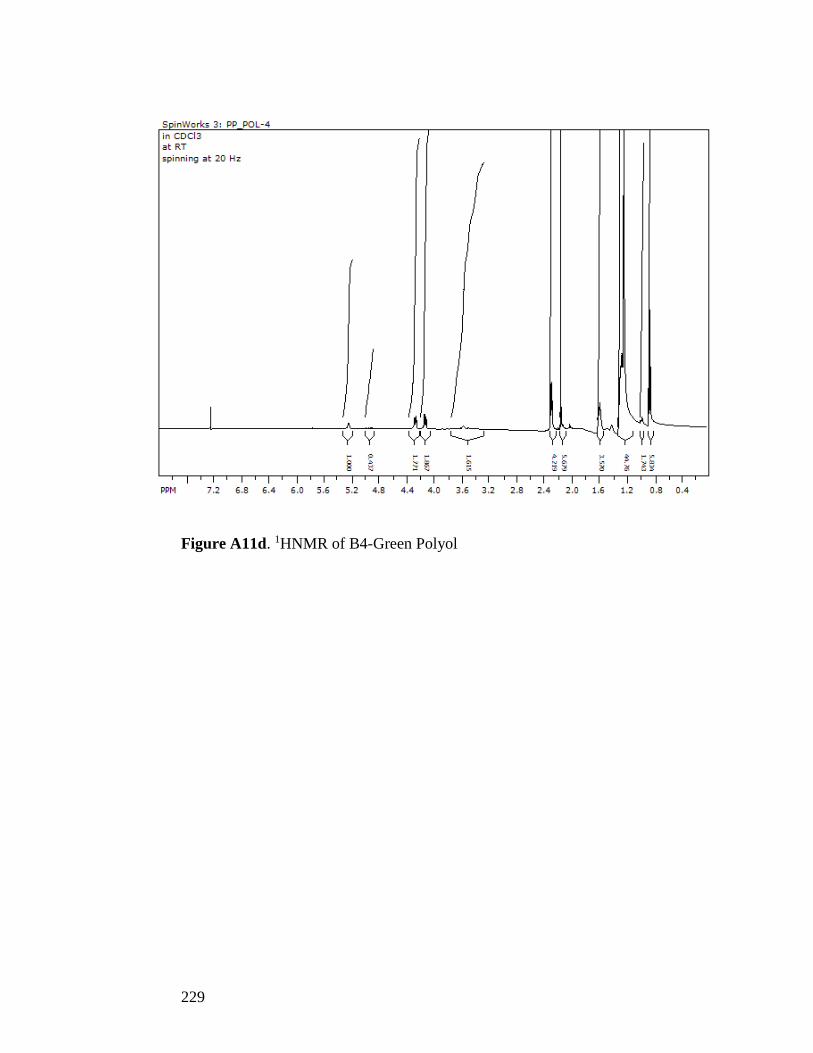
229
Figure A11d. 1HNMR of B4-Green Polyol

230
Figure A 12. GPC chromatogram of B3-Green Polyol (B3), B4-Green Polyol (B4)
and standard PMTAG polyol (S).
Table A 13. Area% of peaks P1 and P2 from GPC
Polyols Peaks Area % Oligomers
B3-Green Polyol P1 45 45%
P2 54
B4-Green Polyol P1 37 37%
P2 63
PMTAG Polyol P1 13 13%
P2 87
P1: Mn: 4437 g/mol and Mw: 7030 g/mol
P2: Mn: 721 g/mol, and Mw: 1463 g/mol
Time (min)
18 19 20 21 22
Inte
nsity(m
V)
0
1
2
3
4B3
B4
S
P1
P2

231
Table A 14. Column chromatography, HPLC and 1H NMR data of the fractions of
B4-Polyol. EA: Hx: ratio of ethyl acetate and hexanes, the solvents used for column
chromatography. RT: HPLC Retention time (min); FA1: Fatty acids with terminal double
bond (9-decenoic acid), FA2: Fatty acid with internal double bond (9-dodecenoic acid);
FA3: Fatty acid with internal double bond (oleic acid). The structure FA1, FA2 and FA3 are
presented in Scheme A3.
Fraction EA: Hx RT A
%
1H-NMRchemical shift Potential structures
F1 1:10 5-9
73
5.8 (m, 0.28H), 5.2 (m, 1H), 4.8-
5.0 (dd, 0.56), 4.3 (dd, 2H), 4.1
(dd, 2H), 2.4 (t, 6H), 2.0 (m, 1H),
1.6 (m), 1.4-1.2 (m), 1.0 (t,
0.8H), 0.8 (t, 7H)
TAG structure
No polyols
Contains FA1, FA2, and
FA3
F2 1:10 7.25
1
4.2-4 (m,0.47H), 2.3 (m, 0.46 H),
1.4-1.2 (m), 1.6(m), 0.8 (m, 1H)
Not a TAG structure
Hydroxylated products
containing FA3
F3 1:10 7.2-11 5.8 (m), 5.2 (m) 4.8(m) 4.4-4.0
(m), 2.4 (m), 2.0 (m), 1.6 (m),
1.4-1.2 (m), 0.8 (t)
Not a TAG structure.
Hydroxylated products,
containing FA3 and FA1;
No FA2
F4 1:8 10.2
1
5.8 (m, 0.20H), 5.2 (m, 1H), 5.0
(dd, 0.4), 4.3 (dd, 2H), 4.1 (dd,
2H), 3.6-3.2 (m, 2H) 2.4 (t, 6H),
2.0 (m, 1H), 1.6 (m), 1.4-1.2 (m),
1.0 (t, 1.8H), 0.8 (t, 4.5H)
TAG structure,
Diols with FA2 and FA3
Contains FA1
F5 1:8 15.2-
16.1 5
5.2 (m, 1H), 4.3 (dd, 2H), 4.1
(dd, 2H), 3.6-3.2 (m) 2.4(t, 6H),
1.6 (m), 1.4-1.2 (m), 0.8 (t, 9H)
Diols, including diol from
FA3
No FA1 and FA2
F6 1:6 16.2-
22.2
12
5.8 (m, 0.20H), 5.2 (m, 1H), 4.8-
5.0 (dd, 0.4), 4.3 (dd, 2H), 4.1
(dd, 2H), 3.6-3.2 (m,) 2.4 (t, 6H),
2.0 (m), 1.6 (m), 1.4-1.2 (m), 1.0
(t, 0.8H), 0.8 (t, 6.6H)
Diols From FA1, FA2 and
FA3.
Contains FA1
F7 1:6 30.1-
34.1
8
5.8 (m, 0.2H), 5.2 (m, 1H), 4.8-
5.0 (dd, 0.4H), 4.3 (dd, 2H), 4.1
(dd, 2H), 3.6-3.2 (m, 3.4H) 2.4 (t,
6H), 1.6 (m), 1.4-1.2 (m), 1.0 (t,
1.6H), 0.8(t, 4H)
Tetrols

232
Scheme A3. Fatty acid (FA1, FA2 and FA3) structures from the B4-Polyol.
Table A15. Thermal data of Green PMTAG Polyols obtained on cooling and heating
(both at 5 °C/min). Onset ( onT ), offset ( offT ), and peak temperatures ( 1 3T ), enthalpy of
crystallization ( CH ), and enthalpy of melting ( MH ). aShoulder peak
Cooling Temperature (C) Enthalpy
(J/g)
onT 1T 2T 3T 4T offT CH
B3-Green Polyol 26.8 24.7 17.3 11.5 -- -4.3 73.6
B4-Green Polyol 28.6 26.0 12.1 -- -- -4.7 84.1
Heating Temperature (C) Enthalpy
(J/g)
onT 1T a 2T 3T 4T offT MH
B3-Green Polyol -1.2 43.9 32.5 24.4 20.9 48.3 91.9
B4-Green Polyol 1.5 43.4 32.3 22.4 -- 49.5 91.6
FA3: oleic acid
FA2: 9-dodecenoic acid
FA1: 9-decenoic acid