synthesis of catalytic membrane surface composites for
TRANSCRIPT

Synthesis of Catalytic Membrane
Surface Composites for Remediating
Azo Dyes in Solution

Synthesis of Catalytic Membrane Surface Composites for
Remediating Azo Dyes in Solution
By
Alexander J. Sutherland, B.Eng
McMaster University
Department of Chemical Engineering
A thesis submitted to the School of Graduate Studies in partial fulfillment of the requirements of
McMaster University for the degree of Master of Applied Science
McMaster University
© Alexander J. Sutherland, August 2019

i
Master of Applied Science (2019)
(Chemical Engineering)
McMaster University
Hamilton, Ontario
Title: Synthesis of Catalytic Membrane
Surface Composites for Remediating
Azo Dyes in Solution
Author: Alexander J. Sutherland
Supervisor Professor Charles-François de Lannoy
Number of Pages xv, 97

ii
Abstract
In the past 30 years zero-valent iron (ZVI) has become an increasingly popular reducing
agent technology for remediating environmental contaminants prone to chemical degradation. Azo
dyes and chlorinated organic compounds (COCs) are two classes of such contaminants, both of
which include toxic compounds with known carcinogenic potential. ZVI has been successfully
applied to the surfaces of permeable reactive barriers, as well as grown into nanoscale particles
(nZVI) and applied in-situ to chemically reduce these contaminants into more environmentally
benign compounds. However, the reactivity of ZVI and nZVI in these technologies is limited by
their finite supply of electrons for facilitating chemical reduction, and the tendency of nZVI
particles to homo-aggregate in solution and form colloids with reduced surface area to volume
ratio, and thus reduced reactivity. The goal of this project was to combine reactive nanoparticle
and membrane technologies to create an electro-catalytic permeable reactive barrier that
overcomes the weaknesses of nZVI for the enhanced electrochemical filtration of azo dyes in
solution. Specifically, nZVI was successfully grown and stabilized in a network of functionalized
carbon nanotubes (CNTs) and deposited into an electrically conductive thin film on the surface of
a polymeric microfiltration support membrane. Under a cathodic applied voltage, this thin film
facilitated the direct reduction of the methyl orange (MO) azo dye in solution, and regenerated
nZVI reactivity for enhanced electro-catalytic operation. The electro-catalytic performance of
these nZVI-CNT membrane surface composites to remove MO was validated, modelled, and
optimized in a batch system, as well as tested in a dead-end continuous flow cell system. In the
batch experiments, systems with nZVI and a -2 V applied potential demonstrated synergistic
enhancement of MO removal, which indicated the regeneration of nZVI reactivity and allowed for
the complete removal of 0.25 mM MO batches within 2-3 hours. Partial least squares regression
iii
(PLSR) modelling was used to determine the impact of each experimental parameter in the batch
system and provided the means for an optimization leading to maximized MO removal. Finally,
tests in a continuous system yielded rates of MO removal 1.6 times greater than those of the batch
system in a single pass, and demonstrated ~87% molar removal of MO at fluxes of approximately
422 L/m2h. The work herein lays the foundation for a promising technology that, if further
developed, could be applied to remediate azo dyes and COCs in textile industry effluents and
groundwater sites respectively.

iv
Acknowledgments
Over the course of my undergraduate and graduate education at McMaster, I have been
privileged with the opportunity to learn from an excellent cast of mentors. In the department of
Chemical Engineering, I have benefitted immensely from the advice and teachings of professors
such as Dr. Carlos Filipe, Dr. David Latulippe, Dr. Emily Cranston, and Dr. Jake Nease in my
technical, professional, and personal development. I have been especially fortunate for the
opportunity to work with my supervisor Dr. Charles-François de Lannoy. His dedication to
learning, critical thinking, and improvement have been invaluable to my research and growth and
continue to serve as a constant source of inspiration. I wish everyone could go through life with
his passion and determination for pursuing new ideas and experiences, and it is these
characteristics most of all that I hope to carry with me in all my future endeavours.
I would like to thank the members of the Latulippe Lab, the Kim lab, and the Canadian
Center for Electron Microscopy for their assistance and generosity. It is with their help and
willingness to share resources and expertise that I have been able to accomplish much of my work.
I would also like to thank NSERC for providing the funding that has enabled me to take part in
this adventure over the years.
I am also very grateful for the unceasingly hardworking administration within the Chemical
Engineering Office. Michelle Whalen, Linda Ellis, and Kristina Trollip have helped me more times
than I can remember, and always with the utmost patience and efficiency. I would also like to
thank the brilliant technicians in our department: Paul Gatt, and Mike Clarke. Their expertise,
creativity, and hard work were instrumental in developing the tools to overcome many of the
challenging hurdles in my work.

v
I would like to express my gratitude and appreciation for the feedback, and support of my
colleagues in the de Lannoy lab. Our collaborations throughout the years have been both
productive and enjoyable. I would especially like to thank Amin Halali and Maria Ruiz-Caldas for
welcoming me into the lab with open arms and for playing such a pivotal role in building my
skillset as a researcher. I cherish all the time we spent together in the lab and feel as though we
have shared the unique experience of defining its tone and culture.
These past few years in the Chemical Engineering department gave me the opportunity to
develop relationships with people that I now count among my dearest friends. My experience at
McMaster has been defined by golden moments brought forth by the sagely advice and wit of
Daniel Osorio, the multi-faceted humour and colourful cynicism of Michael Kiriakou, and the
sheer hilarity and boundless kindness of Taylor Stimpson. In particular, I feel that my friendships
with Michael and Taylor have changed my life by re-forging my personality with new
characteristics, which I can say with at least 37% confidence have altered me for the better. I cannot
imagine a University experience without friends like these, who are solid as they come.
Lastly, I would like to thank my family from the bottom of my heart for all the love and
support they’ve provided throughout the entirety of my academic career. Through TAing, I have
realized that there is an art to offering someone just the right amount of help so that they might
succeed on their own. In that, my parents – Carrie and Reid Sutherland – are Masters in their own
right. Their care and guidance coupled with the encouragement and criticisms (which were of
course, highly constructive) provided by my brothers Andrew and William have fundamentally set
the stage for everything I have ever accomplished.

vi
Table of Contents Abstract ........................................................................................................................................... ii
Acknowledgments.......................................................................................................................... iv
List of Abbreviations ..................................................................................................................... xi
List of Figures ............................................................................................................................... xii
List of Tables ................................................................................................................................ xv
Chapter 1 Introduction .................................................................................................................... 1
Chapter 2 Background .................................................................................................................... 5
2. 1 Chlorinated Organic Compounds ........................................................................................ 5
2.1.1 Organic Contamination in Soils and Groundwater ........................................................ 5
2.1.2 Difficulties in Remediating Chlorinated Organics in Soils and Groundwater .............. 5
2.1.3 Current Treatment Strategies for COCs ......................................................................... 6
2.2 Azo Dye Contamination ....................................................................................................... 8
2.2.1 Classification and Usage of Azo Dyes ........................................................................... 8
2.2.2 Threats Posed by Azo Dye Contamination .................................................................... 8
2.2.3 Current treatment Strategies for Azo Dyes .................................................................... 9
2.3 Membrane Technologies ..................................................................................................... 10
2.3.1 Overview of Membrane Principles and Technologies ................................................. 10
2.3.2 Challenges for Membrane Technologies ..................................................................... 12
2.3.3 Modern Membrane Applications for Remediating COCs & Azo dyes ....................... 13

vii
2.4 Electrically Conductive Membranes ................................................................................... 14
2.4.1 Introduction to Conductive Membranes and Their Benefits........................................ 14
2.4.2 Graphitic Materials for Conductive Thin Film Surface Composites ........................... 15
2.5 Growing Reactive Nanoparticles ........................................................................................ 15
2.5.1 Zero Valent Iron ........................................................................................................... 15
2.5.2 Reactive Nano Zero-Valent Iron Particles ................................................................... 16
2.5.3 Methods for nZVI Synthesis ........................................................................................ 16
2.5.4 Challenges Surrounding Nanoparticle Technologies................................................... 17
2.6 Stabilizing Reactive Nanoparticles ..................................................................................... 18
2.6.1 Surface coatings ........................................................................................................... 18
2.6.2 Substrate-Supports ....................................................................................................... 19
2.7 Objectives ........................................................................................................................... 20
Chapter 3 Proof of Concept Validation of the Electrocatalytic Properties of nZVI-CNT Surface
Composites through Dye Removal in a Batch System ................................................................. 21
Abstract ..................................................................................................................................... 21
3.1 Introduction ......................................................................................................................... 22
3.2 Materials and Methods ........................................................................................................ 24
3.2.1 Materials ...................................................................................................................... 24
3.2.2 Catalytic Membrane Composite Preparation ............................................................... 24
3.2.3 Membrane Characterization ......................................................................................... 25

viii
3.2.4 Electrochemical Batch Removal of Methyl Orange Dye ............................................ 27
3.2.5 Cyclic Voltammetry ..................................................................................................... 28
3.3 Results and Discussion ....................................................................................................... 28
3.3.1 nZVI-CNT Membrane Composite Morphology .......................................................... 28
3.3.2 Catalytic Membrane Conductivity and Iron Content ................................................... 29
3.3.3 MO Batch Removal Performance of Catalytic Membranes ........................................ 31
3.4 Conclusions ......................................................................................................................... 34
Chapter 4 Application of Catalytic Membranes in a Continuous Dead-End Flow System .......... 35
Abstract ..................................................................................................................................... 35
4.1 Introduction ......................................................................................................................... 36
4.2 Materials and Methods ........................................................................................................ 37
4.2.1 Materials ...................................................................................................................... 37
4.2.2 Catalytic Membrane Composite Preparation ............................................................... 38
4.2.3 Membrane Characterization ......................................................................................... 38
4.2.4 Membrane Flow Characterization................................................................................ 39
4.2.5 Continuous Electrochemical Removal of Methyl Orange Dye ................................... 39
4.2.6 Contact Angle Experiments ......................................................................................... 41
4.3 Results and Discussion ....................................................................................................... 41
4.3.1 nZVI-CNT Membrane Composite Morphology .......................................................... 41
4.3.2 Catalytic Membrane Flux and Permeability ................................................................ 42

ix
4.3.3 Continuous Removal of MO Using Catalytic Membranes .......................................... 43
4.4 Conclusions ......................................................................................................................... 50
Chapter 5 Statistical Modelling and Optimization of the Batch Removal Performance of Catalytic
Membranes using Latent Variable Methods ................................................................................. 51
Abstract ..................................................................................................................................... 51
5.1 Introduction ......................................................................................................................... 52
5.2 Materials and Methods ........................................................................................................ 52
5.2.1 Materials ...................................................................................................................... 52
5.2.2 Catalytic Membrane Composite Fabrication with Varying Parameters ...................... 53
5.2.3 Methyl Orange Batch Removal Experiments .............................................................. 53
5.2.4 Modelling Batch Removal Over Time Using PLSR.................................................... 55
5.2.5 Using PLSR to Predict Optimal Batch Removal Performance .................................... 57
5.2.6 Projecting Batch Removal Performance Using Auto-Regression PLS ....................... 59
5.3 Results & Discussion .......................................................................................................... 60
5.3.1 Modelling Batch Removal Over Time Using PLS ...................................................... 60
5.3.2 Using PLS to Predict Optimal Batch Removal Performance ...................................... 64
5.3.3 Projecting Batch Removal Performance Using Auto-Regression PLS ....................... 66
5.4 Conclusions and Future Work ............................................................................................ 69
Chapter 6 Conclusions and Future Work ...................................................................................... 70
6.1 Conclusions ..................................................................................................................... 70

x
6.2 Future Work and Recommendations .............................................................................. 73
Appendix A: Supporting Information ........................................................................................... 75
Description of the custom continuous dead-end flow cell .................................................... 77
Measurement error in continuous experiments examining the effect of the mid-test application
of voltage .............................................................................................................................. 77
Appendix B: References ............................................................................................................... 80
xi
List of Abbreviations
ARPLS Auto-regression partial least squares
CMC Carboxymethyl cellulose
CNT Carbon nanotube
COC Chlorinated organic compound
COD Chemical Oxygen Demand
CV Cyclic Voltammetry
DIW Deionized Water
DLVO Derjaguin Landau Verwey Overbeek
DNAPL Dense non-aqueous phase liquid
DO Deoxygenated
EDS Energy-dispersive x-ray spectroscopy
EPS Extracellular polymeric substance
GO Graphene oxide
ICP-OES Inductively coupled plasma optical emission
spectroscopy
MF Microfiltration
MO Methyl Orange
NF Nanofiltration
nZVI Nano zero-valent iron
PCB Polychlorinated biphenyl
PCE Perchloroethene
PES Polyether sulfone
PLSR Partial least squares regression
PRB Permeable reactive barrier
PVA Polyvinyl alcohol
PVDF polyvinylidene fluoride
RO Reverse osmosis
ROS Reactive oxygen species
SEM Scanning electron microscopy
TCE Trichloroethylene
TEM Transmission electron microscopy
UF Ultrafiltration
VOC Volatile organic compound
ZVI Zero-valent iron

xii
List of Figures
Figure 2.1. The relative size of common contaminants, and the membrane separation pore size
regimes used to separate them. Reproduced from [74]. ................................................................ 11
Figure 3.1. Mechanisms for the degradation of azo dyes by a) direct reduction and c) ROS
mediated reduction, and mechanisms for the degradation of COCs by b) direct reduction and d)
ROS mediated reduction. .............................................................................................................. 22
Figure 3.2. The experimental setup for testing nZVI-CNTs performance in removing MO in
solution under an applied voltage. ................................................................................................ 27
Figure 3.3. TEM-EDS images showing an nZVI-CNT mixture (left) and its main elemental
composition in terms of carbon (middle) and iron (right). ........................................................... 29
Figure 3.4. Left: Conductivity results from 4-point probe measurements on nZVI-CNT and CNT
membrane composites, and right: Cyclic voltammetry on the batch removal system using an nZVI-
CNT cathode, with a grey dotted line shown to outline the MO reduction peak. ........................ 29
Figure 3.5. Results for batch removal of MO using nZVI-CNT cathodes (grey) and CNT cathodes
(black), operating at -2V (squares) or with no applied voltage (circles). Error bars represent the
95% confidence interval. .............................................................................................................. 32
Figure 4.1. a) A visual and b) a schematic of the continuous dead-end flow system used to test the
catalytic membrane’s performance in electrochemically degrading MO. .................................... 40
Figure 4.2. An SEM image of an nZVI-CNT membrane cross section at 5,000x magnification,
showing both the thin film surface composite and the PES support membrane beneath it. ......... 41
Figure 4.3. Pure water flux measurements for 0.45 μm pore size PES membranes (grey) and 0.45
μm pore size PES membranes with 4 mg of nZVI-CNT surface composites at 20-80 psi pressures.
....................................................................................................................................................... 42

xiii
Figure 4.4. MO mole % Removed (orange) and Average Flux (blue) for dead-end continuous flow
cell tests at 40 psi with various membrane surface composite cathode types and applied voltages.
Error bars represent the 95% confidence interval on each set of triplicate tests. ......................... 43
Figure 4.5. Removal rates for dead-end continuous flow cell tests with various membrane surface
composite cathode types and applied voltages. Error bars represent the standard deviation across
three triplicates. ............................................................................................................................. 45
Figure 4.6. MO Mole % Removed (orange) and Average Flux (blue) for a dead-end continuous
flow cell tests at 40 psi using an nZVI-CNT membrane composite cathode, in which a step change
in applied voltage of 0 V to -2 V is made after 30 minutes elapsed. ............................................ 46
Figure 5.1. A schematic of the MO batch removal experiments, in which voltage is supplied to
the surface of the composite cathode, and a graphite strip anode. ................................................ 54
Figure 5.2. A structural visualization of the matrix blocks used in a PLSR model. .................... 56
Figure 5.3. Cumulative 𝑅2 (gray), and cumulative 𝑄2 (black) attained by a PLSR model with the
addition of a first and second component fit to the MO batch removal experiment data. ............ 60
Figure 5.4. Input weights 𝑊1 (gray) and output weights 𝐶1 (black) for the first component of a
PLS model fit to the MO batch removal experiment data. ........................................................... 61
Figure 5.5. Observed (black circles) vs. predicted (white circles) values for MO removal at optimal
experimental parameters, as determined by the PLS model. The range of other experimental tests
is shown for comparison. .............................................................................................................. 66
Figure 5.6. An observed (black circles) vs. predicted (white circles) plot used to validate the
accuracy of the ARPLS model created on the optimum RO removal timeseries data. ................ 67
Figure 5.7. A timeseries plot of observed experimental values (black circles) for MO removal
using optimal parameters, extended using predictions made by the ARPLS model (white circles).

xiv
Error bars on the predictions come from 95% prediction intervals, and the red represent the
cumulative prediction intervals. .................................................................................................... 68

xv
List of Tables
Table 2.1. nZVI surface coating types with examples [7], [28], [112]–[119], [104]–[111]. ....... 19
Table 4.1 Structure and results of a design of experiments investigating the effects of feed
concentration and pressure on the flux and mole % removal of continuous tests using a system
operating at -2 V with an nZVI-CNT cathode, as well as the results of triplicate tests previously
discussed for comparison (blue). .................................................................................................. 49
Table 5.1. Experimental parameters for electrochemical batch removal tests using catalytic nZVI-
CNT membrane surface composites. ............................................................................................ 55
Table 5.2. Input and output variables used to construct a PLSR Model on the batch removal
system. .......................................................................................................................................... 55
Table 5.3. Definitions, dimensions, and indices for the matrix blocks in a PLSR model. Note that
𝑊′, 𝐶′, and 𝑃′ denote the transposes of the 𝑊, 𝐶, and 𝑃 matrices respectively. .......................... 57
Table 5.4. Input decision variable constraints for optimizing the batch removal of MO at 60 min.
....................................................................................................................................................... 58
Table 5.5. Results for the predicted and observed values of optimum MO removal. The decision
variables at the optimum and the constraints they are subject to are also shown. ........................ 65
Table S.1. Data for 41 batch tests used to construct the PLSR model discussed in Chapter 5.
Samples are coded according to the contents of their surface composites with the following
convention: “CT” = nZVI-CNT, “T” = CNT, “S” = None. .......................................................... 79

M.A.Sc. Thesis | Alexander Sutherland McMaster University | Chemical Engineering
1
Chapter 1
Introduction
The remediation of water sources polluted by organic contaminants presents a significant
challenge for modern wastewater treatment [1], [2], [3]. Within the category of organic pollutants,
chlorinated organic compounds (COCs) and azo dyes represent considerable threat, due to their
toxicity, carcinogenic potential [1], [4]–[6], and widespread contamination of groundwater sites
and textile industry effluents respectively [7], [8]. Furthermore, both types of compounds have
proven highly resistant to conventional wastewater treatment practices, and biodegradation in
aquatic ecosystems [1], [5].
Membrane technologies have become ubiquitous over the past few decades and are now
the method of choice for accomplishing a wide variety of wastewater separations [9]–[14]. Among
the types of conventional membranes, reverse osmosis (RO) have been applied to successfully
remove COCs and azo dyes from the environments they contaminate [15], [16]. While RO
membranes demand large pressure gradients (and thus significant degree of energy) to conduct a
separation, membranes with larger pores and less demanding energy constraints cannot be used
due to the small size of the aforementioned organic contaminants. The buildup of biofouling and
scaling on the surface of these membranes increases the transmembrane pressure (TMP) and thus
energy requirements to conduct a given separation [14], [16]–[18]. The accumulation of rejected
contaminants and other ions in solution can also damage the membrane through concentration
polarization, and further increase the TMP requirements through a buildup of osmotic pressure. In
light of these limitations and costly energy requirements, methods other than RO have been
explored for remediating azo dyes and COCs in wastewaters. The current industrially favoured

M.A.Sc. Thesis | Alexander Sutherland McMaster University | Chemical Engineering
2
solutions for remediating these contaminants are advanced oxidation processes in azo dye textile
industry effluents [19], and the use of chemical reductants in groundwaters and soils contaminated
with COCs [20]–[23].
Metallic iron possessing an oxidation state of zero, otherwise known as zero-valent iron
(Fe0, or ZVI), is a chemical reductant capable of remediating both azo dyes and COCs in solution
[22], [24]–[28]. ZVI accomplishes the remediation of these compounds by degrading the azo
linkages and chloride bonds of azo dyes and COCs respectively [20], [26], [29]. ZVI has become
a viable technology for organic remediation due to its high reactivity, low toxicity, low cost, and
natural abundance [21], [27], [30]–[32].
The performance of ZVI can be improved by fabricating this material in nano-scale
particles. Doing so results in nano zero-valent iron (nZVI) which possesses enhanced reactivity
due to its vastly increased surface area to volume ratio (>1000 times) [22], [26], [29], [33]–[36].
However, nZVI’s reactivity is limited by two main challenges. The first of these challenges is the
aggregation of nZVI particles into colloids, which significantly decreases their collective surface
area to volume ratio, and thus their reactivity [26], [31], [32], [34], [37], [38]. Secondly, while
nZVI is an effective reducing agent, it is not selective in the compounds it reacts with. As such,
much of nZVI’s reactivity can be wasted reducing compounds in solution other than the target
contaminants [22]. Regardless of whether nZVI spends its reactivity on target contaminants or
other scavenging compounds in solution, nanoparticle oxidation inevitably limits nZVI’s ability
to operate in a continuous setting.
Graphitic materials such as carbon nanotubes (CNTs) may offer a solution to the challenges
facing both membrane technologies and nZVI in the face of remediating azo dyes and COCs. Prior
work has shown that CNTs can be used to construct electrically conductive, permeable thin film

M.A.Sc. Thesis | Alexander Sutherland McMaster University | Chemical Engineering
3
composites on the surface of polymeric support membranes [39]. With an applied voltage, these
composites demonstrate remarkable resistance to biofouling [14], [39]–[45]. Additionally,
functionalized CNT networks have also been used as a substrate for stabilizing metal nanoparticles
to prevent their homoaggregation [31], [46], [47]. CNT networks accomplish nanoparticle
stabilization by sterically segregating them across their large surface areas, and by electrostatically
stabilizing the positive charge of their metal ion precursors with negatively charged functional
groups [31], [46]–[50]. Furthermore, CNT thin films have shown promise as electrodes for
effectively degrading azo dyes through electrochemical reaction under applied electric potentials
[51], [52].
The objective of this thesis was to produce electrically conductive CNT membrane surface
composites with embedded nZVI, capable of electrochemically removing azo dyes in solution
under a negative applied potential. In this system, polymeric membranes with pore sizes in the
microfiltration regime were used simply as a porous support for an nZVI-CNT nanocomposite thin
film. Rather than facilitating contaminant separation based on size exclusion or solution diffusion
mechanisms, these nZVI-CNT composite membranes serve as reactive barriers with which to
electrochemically degrade contaminants under an applied voltage. While COCs remain an
important and prevalent hazard to the environment, azo dyes were studied exclusively in this
project because they are substantially safer to work with and their concentration change is easier
to evaluate. The contaminant removal techniques developed herein are applicable to both azo dyes
as well as COCs.
We investigated whether it was possible to channel electrons to the embedded nZVI
particles via the conductive CNT network and continuously regenerate their reactivity for the
enhanced electrocatalytic contaminant degradation. A simple batch system was devised to

M.A.Sc. Thesis | Alexander Sutherland McMaster University | Chemical Engineering
4
accomplish this task, in which membrane surface composites were employed as a cathode opposite
a graphite foil anode in a stirred azo dye solution.
The results of the simple batch experiments, as well as other tests with varying
experimental parameters were analyzed using Partial Least Squares Regression (PLSR) modelling.
The models developed provided 1) insight into the impact of each experimental parameter on
contaminant removal, 2) the opportunity to determine the optimal set of system parameters for
achieving maximum contaminant removal, and 3) an extended timeseries projection of
contaminant removal at that optimum.
Finally, the nZVI-CNT composite membrane cathode/graphite anode batch system was
redesigned into a dead-end flow cell to evaluate this technology’s performance in the continuous
removal of an azo dye feed. Contaminant removal and transmembrane flux were used in
combination as metrics to assess this performance, and design of experiments was conducted to
assess the impacts of feed concentration, and feed pressure on contaminant removal. The observed
success in continuously remediating an azo dye contaminant with nZVI CNT surface composite
membranes shows promise for applying this technology as a final excess dye removal step in
textile industry effluent wastewater treatment processes.

M.A.Sc. Thesis | Alexander Sutherland McMaster University | Chemical Engineering
5
Chapter 2
Background
2. 1 Chlorinated Organic Compounds
2.1.1 Organic Contamination in Soils and Groundwater
The organic contamination of soils and groundwater systems poses one of the largest
challenges in modern environmental remediation [1], [2]. Volatile organic compounds (VOCs),
chlorinated organic solvents, pesticides, and other chlorinated aromatics all pose significant threat
to human health through the soils and groundwaters they contaminate [1], [2]. Among these types
of organic pollutants, chlorinated solvents are the most common [21], [53]. Studies have shown
that many of these compounds become hazardous to human health after being processed in the
liver [1]. Chlorinated organic compounds (COCs) such as trichloroethylene (TCE),
perchloroethene (PCE), and polychlorinated biphenyls (PCBs), are found in thousands of soil and
groundwater sites in North America and Europe alone [38]. Such contamination is the by-product
of various industrial activities including pesticide run-off, discharge from metal degreasing, dry
cleaning, and chemical spills [1], [23], [33], [38].
2.1.2 Difficulties in Remediating Chlorinated Organics in Soils and Groundwater
Without even considering the mechanisms of contaminant remediation, the treatment of
soils and groundwater remains a complex challenge due to the wide variety of organic pollutants
and the sites in which they are found. Many chlorinated solvents are heavier than water (including
TCE, 𝜌𝑇𝐶𝐸 = 1.46 g/mL) and therefore permeate downward through groundwater systems and
form plumes of dense non-aqueous phase liquid (DNAPL) [1]. In 2005 the United States
Environmental Protection Agency estimated that the number of groundwater sites contaminated

M.A.Sc. Thesis | Alexander Sutherland McMaster University | Chemical Engineering
6
with DNAPLs in the US ranges from 15 000 to 20 000 [7]. DNAPLs are capable of migrating
vertically and laterally through aquifer systems, and leave a trail of contamination in their wake
[1]. The ability of these contaminants to spread through groundwaters raises the difficulty of
developing methods that efficiently capture and remove them from solution.
Furthermore traditional wastewater treatment techniques such as coagulation,
sedimentation, filtration, etc. have proved ineffective for reducing the concentrations of TCE
below hazardous levels [1]. Due to its chemical structure, TCE is not easily biodegraded or
otherwise transformed through chemical reactions into environmentally benign compounds [1].
2.1.3 Current Treatment Strategies for COCs
2.1.3.1 Ex-situ Treatment
Ex-situ remediation technologies are often referred to as “pump-and-treat” methods,
because they involve the removal of polluted groundwaters and soils from their site to remediate
them with technologies on the surface. Air stripping is an ex-situ technique that takes advantage
of the low Henry’s constant and solubility of VOCs, and uses a counter-current stream of air to
remove those contaminants from the liquid phase and into the gas (air) phase [1]. However,
concentration targets for TCE removal often require an infeasible flow rate of air to obtain.
Furthermore, in this method the contaminant compound is simply transferred into another phase,
rather than being degraded or otherwise transformed into something less harmful [1].
2.1.3.2 In-situ Treatment
Soil Venting relies on the same mechanism as air stripping, but forces air into the soil in-
situ. Once the air streams have stripped contaminants from the groundwater, they are directed to
wells where the COCs can be collected or released to the atmosphere [1][2]. This technology faces

M.A.Sc. Thesis | Alexander Sutherland McMaster University | Chemical Engineering
7
the same limitations as air stripping, with the added challenges that it is more expensive to build
and operate in-situ.
Permeable reactive barriers (PRBs) are loose obstacles to flow possessing reactive metallic
iron in its zero-valent state. Zero-valent iron (ZVI) is capable of degrading COCs through a
reduction mechanism in which the chloride bond is broken down (also known as dechlorination)
[20]–[23]. PRBs are an attractive technology because ZVI is effective at reducing contaminants
and because once installed PRBs require no energy to operate. However, PRBs rely on the
transport of contaminants passed their surface, and can take a long time to accomplish the
remediation of aquifers that have COC contamination spread out over large distances [7].
Furthermore, since the ZVI lining a PRB permanently uses up its reactivity on contaminants and
scavenging compounds alike, PRBs are single use. Add in the high capital costs for installation,
and PRBs quickly become a very expensive option [20].
The targeted injection of chemical reductants is another method for remediating soils in-
situ [23]. Electron-donating reduced metal species such as Fe0, Fe2+, Fe3O4, FeS, and FeS2 are
capable of degrading chlorinated organic compounds by chemical reduction [23]. Highly reactive
nanoscale iron particles can be stabilized in a clay matrix [20], [54], [55] and mixed with
contaminated soils for their in-situ remediation. At least nine full scale plants have been developed
to treat COC contaminated soils this way, but the technology is limited to applications less than
50 feet deep where the soil can be easily mixed [20].

M.A.Sc. Thesis | Alexander Sutherland McMaster University | Chemical Engineering
8
2.2 Azo Dye Contamination
2.2.1 Classification and Usage of Azo Dyes
Dyes exhibit a wide range of structural diversity and are commonly classified by their
solubility in water. Acid, basic, direct, metal-complex, mordant, and reactive dyes are soluble in
water, while the insoluble class is made up of azoic, disperse sulfur, and vat dyes [8]. Azo dyes
are defined as aromatic compounds possessing one or more -N=N- azo linkages [3]. The azo
linkage is a chromophoric chemical group, and is largely responsible for giving the dye its colour
[3]. The dye’s colour is further dependent on what kinds of auxochromic substituents it has on the
aryl rings in its chemical structure [56]. Over 100 000 types of commercial dyes exist, and global
dye productions are estimated to be between 7 × 10⁵ – 1 × 10⁶ tons per year. Azo dyes constitute
the large class of commercial synthetic dye [3], and account for approximately 70% of the dyes
used by humans as a whole [8].
2.2.2 Threats Posed by Azo Dye Contamination
Azo dyes are commonly used in the textile, pharmaceutical, and printing industries [4],
[29], [35], and up to 10-15% of azo dyes used in these applications are discharged to aquatic
environments [8]. Thus, incorporating the production data provided in the previous subsection
(2.2.1), approximately 77,000 tons of azo dyes are discharged to aquatic environments per year.
Azo dyes and the compounds they are transformed into by the human body have been found to be
toxic, and in many cases carcinogenic [4], [5], [6]. Regulations set by the European Union Water
Framework Directive and the Department for Environmental Food and Rural Affairs are
combating this pollution by tightening regulations on textile industry effluents [57].
M.A.Sc. Thesis | Alexander Sutherland McMaster University | Chemical Engineering
9
2.2.3 Current treatment Strategies for Azo Dyes
Azo dyes and other synthetic dyes are resistant to photolysis, able to withstand high
temperatures, and are not easily biodegraded [5]. These attributes make the removal of azo dyes
from water difficult. Instead of relying on conventional wastewater treatment techniques such as
filtration, sedimentation, and aerobic/anaerobic digestion, azo dyes are currently removed from
industrial wastewaters through advanced oxidation processes, adsorption, electrochemical
reaction, and advanced biodegradation. The most industrially used type of these methods are
advanced oxidation processes, which remove dyes by oxidizing the azo linkages and the aryl rings
found in their structures [19]. These strong oxidants are typically compounds that can produce
hydroxyl radicals in solution, such as O3 and H2O2 [3]. The oxidative removal of azo dyes can be
improved through increasing hydroxyl radical concentrations using Fenton’s reagent (Fe3+/H2O2)
and/or applying ultraviolet light to promote degradation by photolysis [58]. However, the high cost
of these oxidizing agents is a limiting factor for conducting large scale dye remediation [59].
Instead of applying pre-synthesized oxidizing agents to remediate azo dyes,
electrochemical cells can be used to generate strong oxidants that degrade dyes in solution.
Electrochemical systems can achieve dye removal in a variety of other ways, including by direct
reduction at a cathode, electrochemical oxidation, electrocoagulation, and electro-Fenton
reactions, just to name a few [51], [60]–[63]. The electrodes in these systems are made from a
diverse array of conductive materials, with metals like platinum and titanium, and graphitic
materials such as graphite, graphene, and carbon nanotubes [51], [52], [64]. Microbial fuel cells
build upon these systems by using microbes that catalyze dye oxidation at the anode, and reduction
at the cathode [61], [65].

M.A.Sc. Thesis | Alexander Sutherland McMaster University | Chemical Engineering
10
Azo dye adsorption using activated carbon, peat, wood chips, etc. as sorbents presents an
alternative technology and removal mechanism, but also struggles due to the economic cost and
the difficulty of sorbent regeneration [59], [66].
2.3 Membrane Technologies
2.3.1 Overview of Membrane Principles and Technologies
Membrane technologies can be broadly described as semi-permeable barriers that separate
a pressurized contaminated feed stream into two parts: a retentate stream rejected by the
membrane, and a permeate stream permitted by the membrane. Over the past few decades,
membrane separation technologies have risen to prominence in both the academic and industrial
sectors for their success in treating wastewaters from a variety of sources, as well as for the
opportunities they present for process intensification [9]–[14]. Their applications include, but are
not limited to, municipal, industrial, and textile wastewater treatment, as well as desalination,
distillation, food processing, gas separations, and fuel cells [44], [67]–[73].
Conventional membranes achieve the removal of contaminants in a feed under an applied
pressure by the mechanism of size exclusion; denying the passage of contaminants too large to
travel through the membrane’s pores [13], [71]. Size exclusion is the most common mechanism
for conducting membrane separations, and as such, membranes are often classified based on the
size of their pores. In order of decreasing size, these categories are microfiltration (MF),
ultrafiltration (UF), nanofiltration (NF), and reverse osmosis (RO) [71]. Importantly, reverse
osmosis membranes stand apart from these other categories in that they do not possess pores for
separation through size exclusion, and instead rely on the mechanism of solution diffusion [12],
[71]. Figure 2.1 below shows a variety of common waterborne contaminants, as well as the general
pore sizes of the different conventional membrane classifications [74].

M.A.Sc. Thesis | Alexander Sutherland McMaster University | Chemical Engineering
11
While conventional size exclusion remains the most common separation mechanism
utilized in membrane technologies, a wide variety of other bases for membrane selectivity exists
in industry and academia. For instance, membranes used in gas separations are non-porous and
selective based on the diffusivity of the feed particles in the membrane material [72], while
membranes for ion exchange conduct separation based on charge [75].
Membranes are typically made of polymers such as polyvinyl alcohol (PVA),
polyvinylidene fluoride (PVDF), polyether sulfone (PES), as well as biopolymers like cellulose
nitrate and cellulose acetate [71], [76]. However, the material used to construct a membrane can
vary widely depending on the separation it is intended for.
Figure 2.1. The relative size of common contaminants, and the membrane separation
pore size regimes used to separate them. Reproduced from [74].

M.A.Sc. Thesis | Alexander Sutherland McMaster University | Chemical Engineering
12
2.3.2 Challenges for Membrane Technologies
While membranes have been proven to be highly effective, economically favourable, and
customizable in achieving a variety of separations, they are universally limited by the problem of
fouling. Fouling is a buildup of material on or inside the membrane’s matrix that obstructs flow
through its pores. This obstruction leads to decreased flux and permeability for constant TMPs
[14], [71], [73], [77]. Depending on the system and the compounds present in the feed, fouling can
be either reversible (by cleaning with methods such as back-washing) or non-reversible. Foulants
can be divided into four main types: micro-biological organisms, organics, inorganics, and
particulates [14].
Biofouling is when bacteria in solution cause the formation of one or more layers of biofilm
on the membrane’s surface [14], [78], [79] and is generally considered the most ubiquitous type
of fouling in membrane applications. Though the process of biofouling has been found to have
many stages [78], it can be generally divided into following two steps: 1) the irreversible
attachment of bacteria to a membrane’s surface and 2) the generation of an extracellular polymeric
substance (EPS) by those bacteria that covers the surface [80]. Biofouling is further problematic
because the EPS layer formed is resistant to many common membrane cleaning procedures [80].
Particulate and colloidal fouling involves the buildup of organic or inorganic compounds
between 0.001 𝜇m and 1 𝜇m in size [14]. Depending on the size of the solids involved, colloids
can either cause blockages in the pores themselves or merely develop a layer of material on the
membrane surface [73], [81], [82]. The rate and extent of colloidal fouling is highly dependent on
the shear rate, bulk concentration, and particle size of the feed solution [83].

M.A.Sc. Thesis | Alexander Sutherland McMaster University | Chemical Engineering
13
Organic foulants can be either dissolved or colloids, but share the commonality of attaching
to the membrane’s surface through adsorption [14]. While inorganic foulants also refer to
dissolved components, these compounds are metals that precipitate onto the surface of the
membrane due to either oxidation or change in pH [14], [84], [85]. This phenomenon is also known
as scaling.
Broadly speaking, the rate and extent of fouling is highly dependent on the operating
conditions, as well as the bulk concentration, and particle size of the feed solution [83].
2.3.3 Modern Membrane Applications for Remediating COCs & Azo dyes
Conventional reverse osmosis membranes have been used to completely remove
chlorinated solvents [15] and dyes [16] from wastewater effluents but are limited by a variety of
problematic factors. These factors include high energy costs required to drive the separation
(particularly in high-salinity solutions that result in large osmotic pressures), membrane damage
due to concentration polarization, and biofouling that is incurred without expensive pre-treatment
steps [16]–[18].
Membrane technologies have also been utilized for removing COCs from wastewaters
through pertraction. Pertraction is a method in which a contaminant is transferred through liquid-
liquid extraction across a membrane barrier from a flow of contaminated wastewater feed to a
solvent flowing in countercurrent [86]–[88]. A good solvent for this technique is one that has high
affinity for the contaminant, very low solubility in water, is non-toxic, and is easily reused [86].
The main costs associated with pertraction are the energy required to flow the streams across the
membrane, the cost of the solvent, and the energy cost for regenerating the solvent (with methods
such as evaporation). While this method has been shown to be more cost effective than air-

M.A.Sc. Thesis | Alexander Sutherland McMaster University | Chemical Engineering
14
stripping and adsorption using activated carbon [86], it requires the use of hazardous solvents, and
– like adsorption – merely transfers the contaminant to another phase without degrading it.
Furthermore, the often dilute concentrations of COCs in soils and groundwaters require high
solvent flow rates for efficient extraction, which drives up energy costs [86], [87].
To subvert the challenges facing the removal of azo dyes and COCs with conventional
membrane separation, membrane technologies using mechanisms other than size exclusion such
as adsorption, biodegradation, membrane distillation, and degradation by reactive oxygen species
(ROS) have been explored [89]–[92].
2.4 Electrically Conductive Membranes
2.4.1 Introduction to Conductive Membranes and Their Benefits
Recent work has shown that applying an electric field across a membrane can combat
organic and colloidal fouling. Additionally, the application of small pulsed electric potentials to a
surface has been shown to prevent the attachment of bacteria, and thus prevent the onset of
biofouling [14], [40]–[43]. This phenomenon is not yet completely understood, as several
mechanisms likely contribute to its result. For instance, the application of negative (cathodic)
potentials has been shown to repel negatively charged bacteria through electrostatic interactions
[39], [93], [94]. Alternatively, the application of negative potentials to electrodes in an aqueous
medium can generate ROS [51], [95] capable of killing bacteria that would otherwise foul the
surface [51], [96]. Whatever the mechanism, the success of this phenomenon in fouling mitigation
has led to the investigation of electrically conductive membrane materials.
Aside from biofouling prevention, electrically conductive membranes have been
investigated for their effectiveness in applications as electrodes, for charged particle selectivity,
M.A.Sc. Thesis | Alexander Sutherland McMaster University | Chemical Engineering
15
for generating ROS in solution, and in a variety of other electrocatalytic separations [39], [51],
[52], [94], [97], [98].
2.4.2 Graphitic Materials for Conductive Thin Film Surface Composites
While modern conventional membranes are commonly made from polymers, conducting
polymers such as polypyrrole are limited in their use as a membrane material by physical properties
that result in poor processing and separation characteristics [39]. Membrane thin film surface
composites made of conductive materials such as graphene oxide (GO) and carbon nanotubes
(CNTs) have received interest as an alternative to conductive polymers and their limitations [44],
[39], [45]. CNTs are essentially 2D graphene seamlessly rolled into a 3D tube configuration with
one or multiple walls. These materials owe their high conductivity to the delocalized nature of
their pi electrons, and their high length-to-diameter aspect ratios (typically >1000:1) [39], [93],
[94], [97], [99]. Dispersions of CNTs can be easily vacuum filtered onto the surface of a polymeric
support membrane to form a porous, electrically conductive thin films capable of simultaneously
preventing biofouling, and removing azo dyes through electrochemical filtration, adsorption, and
the production of ROS in solution [39], [97].
2.5 Growing Reactive Nanoparticles
2.5.1 Zero Valent Iron
Both chlorinated organics and azo dyes can be degraded through redox reactions with
strong reducing agents. Among these reducing agents, elemental iron in its zero valent state (Fe0
or ZVI) remains an established choice for applications in remediating groundwaters and soils
contaminated by chlorinated organics, as well as textile effluents contaminated by azo dyes [22],
[24]–[27][28]. ZVI stands out from other reducing agent remediation technologies due to iron’s

M.A.Sc. Thesis | Alexander Sutherland McMaster University | Chemical Engineering
16
natural abundance, low cost, high reducing potential (𝐸0= -0.44 V), low toxicity, and capacity to
adsorb compounds such as dyes and heavy metals [21], [27], [30]–[32].
2.5.2 Reactive Nano Zero-Valent Iron Particles
The efficacy of ZVI and other reactive metals can be further improved by synthesizing
those materials into spherical particles with diameters in the nanoscale. Nano zero-valent iron
(nZVI) has been the focus of more recent work due to its increased reactivity [22], [26], [29], [33]–
[35]. nZVI and other nanoparticles are relatively more reactive than their macroscale counterparts
because of their increased surface area to volume ratios. This is because as particle size decreases,
there is an increase in the proportion of atoms on the surface of that particle available for reaction,
adsorption, etc. [36].
The high reactivity presented by nanoscale particles has been explored for a variety of
materials and applications. For instance, silver nanoparticles have proven to be effective in
antimicrobial sterilization [25], [36], [100], [101], and have been investigated alongside gold and
platinum nanoparticles for applications in catalysis [49]. Titanium dioxide nanoparticles have also
been applied as adsorbents [49], as well as used for coatings that impart UV protection and self
cleaning properties [36].
nZVI particles generally have diameters less than 100 nm and exhibit a core-shell structure.
While the nanoparticle core consists of highly reactive zero-valent iron, there exists an outer shell
of Fe2+ and Fe3+ oxides and hydroxides [24], [26], [102].
2.5.3 Methods for nZVI Synthesis
The synthesis of nZVI particles can generally be categorized into top down or bottom up
approaches. Top down methods involve physical and chemical methods of breaking down – and

M.A.Sc. Thesis | Alexander Sutherland McMaster University | Chemical Engineering
17
in some cases chemically reducing – iron to a nanoscale zero-valent state. The simplest top down
method consists of mechanically grinding (or milling) macroscale bulk ZVI down into the
nanoscale [102][103]. Thermal reduction is a technique in which iron oxide nanoparticles are
reduced to nZVI at high temperatures (> 500℃) by gases such as H2, CO2, and CO that are
produced from the thermal decomposition of carbon based materials [36][104].
Bottom up methods facilitate the growth of nZVI particles from iron salts. The most
common bottom up methods use strong reducing agents such as sodium borohydride to precipitate
nanoparticles from iron ions in solution [32], [105]. This method is highly effective, however, the
toxicity and cost of sodium borohydride has encouraged researchers to explore polyphenolic plant
extracts as an environmentally friendly reducing agent alternative [36], [55]. Thermal reduction
can also be applied as a bottom up method, by instead using hydrous iron salts as the source for
the precipitated nanoparticles [36]. Electrolysis is a third bottom up method that produces nZVI
from iron salts in solution using an electrochemical cell. Positively charged iron ions are reduced
into nZVI particles at the cathode, and subsequently removed with ultrasonication [80].
Electrolysis is relatively fast and cost effective when compared to chemical reduction, but often
results in nanoparticle aggregation during formation at the cathode [106].
2.5.4 Challenges Surrounding Nanoparticle Technologies
nZVI nanoparticles rapidly homo-aggregate due to their strong magnetic properties and
low surface charge [32], [38], [102], [107]. Aggregation reduces their high surface area to volume
ratio, which causes a significant loss in reactivity [26], [31], [32], [34], [37], [38]. Furthermore,
colloids formed from nZVI aggregates have significantly reduced mobility in soils, which limits
their use for applications such as in the in-situ remediation of groundwaters [26], [102].

M.A.Sc. Thesis | Alexander Sutherland McMaster University | Chemical Engineering
18
A second limiting factor that nZVI faces is passivation, which is the inevitable loss of the
nanoparticle’s reactivity caused by donating electrons to other species [22]. nZVI particles are thus
a one-time-use nanomaterial, requiring continuous resupplying to treat large volumes of
contaminated water.
2.6 Stabilizing Reactive Nanoparticles
nZVI can be stabilized against aggregation through the application of surface coatings,
doping the nanoparticles with other metals, and immobilizing the particles on supports.
2.6.1 Surface coatings
A wide variety of compounds have been tested as nanoparticle coatings to encourage their
dispersion and consequently prevent aggregation [102]. Materials chosen for coatings are
generally those that suppress the tendency and/or ability of the nanoparticles to agglomerate by
electrostatic, magnetic dipole-dipole, and DLVO interactions [107], [108]. Surface coating
molecules achieve this stability by enhancing the repulsive forces between particles with either or
both of electrostatic and steric stabilization. In electrostatic stabilization, charged molecules are
adsorbed to the metal nanoparticle surface to create a double layer that repels the other stabilizer-
covered particles. Steric stabilization, on the other hand, relies on coatings with external structures
that physically impede particle attraction, as well as by osmotic force [32], [37], [108].
Stabilizers can be added during the nano-particle growth before aggregates are formed
(pre-agglomeration) or after nanoparticles have grown and aggregated (post agglomeration) [32].
In both cases the addition of a stabilizer can result in nanoparticle dispersion, however, pre-
agglomeration addition has been shown to be more successful in doing so [104]. Table 2.1 below

M.A.Sc. Thesis | Alexander Sutherland McMaster University | Chemical Engineering
19
provides an overview of several different types and examples of surface coatings used to stabilize
nZVI [7], [28], [116]–[123], [108]–[115].
Table 2.1. nZVI surface coating types with examples [7], [28], [112]–[119], [104]–[111].
Coating Type Examples
Hydrophilic biopolymers Starch, guar gum, alginate, aspartame, chitosan
Natural Organic Matter
(NOM) Humic acid
Polyelectrolytes Carboxymethyl cellulose (CMC), polyacrylic acid, resins, block
coplymers
Oil-based Microemulsions Food grade surfactant
Coatings are of further use for lessening the passivation of nZVI that would occur through
side reactions. nZVI coated with polyelectrolytes such as CMC, are less prone to side reactions
with dissolved oxygen and oxygen rich compounds in solution, and therefore allow the
nanoparticles to save their reactivity for the target compounds [32], [36], [102], [109]. Naturally,
surface coatings detract slightly from nanoparticle reactivity by covering a portion of their
available surface area, however, the reactivity of stabilized particles that remain dispersed exceeds
those that are uncovered but have been allowed to aggregate [32].
2.6.2 Substrate-Supports
With the proper substrate, nanoparticles can be stabilized against aggregation through
steric and electrostatic mechanisms [48]–[50]. Suitable substrates for nZVI and other metal
nanoparticles are those that have a high surface area and negatively charged functional groups to

M.A.Sc. Thesis | Alexander Sutherland McMaster University | Chemical Engineering
20
attract the positively charged metal ions and serve as nucleation sites during nanoparticle growth
[31], [35], [37], [49], [50], [124], [125]. Nano-porous materials can provide stabilization through
the physical segregation of nZVI particles in their structure [49]. A variety of solids have been
explored as substrates for stabilizing nanoparticles , such as cellulose nanocrystals and nanofibers
[49], [50], [126], silica [122], [127], [128], high surface area pyrolyzed carbon materials such as
biochar and activated carbon [129], [130], and graphite materials such as graphene, and carbon
nanotubes [31], [46], [47].
2.7 Objectives
The aim of this project was to fabricate a porous, electrically conductive, catalytic, reactive
surface composite for removing an azo dye model contaminant in solution. The nZVI particles
were grown using a bottom up chemical reduction method and stabilized by a network of COOH-
functionalized carbon nanotubes serving as a substrate. The specific goals of this research include:
• Proof of concept validation for using an applied voltage to regenerate embedded nZVI
reactivity for the enhanced electrocatalytic degradation of contaminants in a simple batch
system.
• Demonstrating the ability of nZVI-CNT surface composite membranes to
electrochemically degrade azo dyes in solution under an applied voltage in batch and
continuous systems.
• Modelling the contaminant removal performance of nZVI-CNT surface composite
membranes in a batch system, to analyze and optimize the contributions of operating
parameters such as applied voltage and nZVI content.

M.A.Sc. Thesis | Alexander Sutherland McMaster University | Chemical Engineering
21
Chapter 3
Proof of Concept Validation of the Electrocatalytic Properties of nZVI-CNT
Surface Composites through Dye Removal in a Batch System
Abstract
Azo dyes and Chlorinated Organic Compounds (COCs) like trichloroethylene (TCE) are
environmental contaminants found in textile industry effluents and groundwater sites respectively.
Both compounds are carcinogenic to humans and hazardous to the environments they contaminate
and are difficult to treat by conventional wastewater processes. In this study, electrocatalytically
active nanocomposite membranes were fabricated and evaluated for their ability to remove azo
dyes. Nano zero-valent iron (nZVI) particles were grown and stabilized within a network of
dispersed single and double-walled carbon nanotubes (CNTs), and this mixture was filtered onto
the surface of a microfiltration PES support membrane to form a porous, conductive, reactive
surface nanocomposite. These catalytic surface nanocomposites were tested as a cathode alongside
a graphite anode for their ability to remove methyl orange (MO) dye in a batch system under -2 V
applied voltage. In a well-mixed batch, it was found that complete removal of 0.25 mM MO (7.5
mMoles in 30 mL) by the charged membranes occurred within 2-3 hours of operation. The
performance of these nZVI-CNT cathodes alongside controls suggests that the application of an
applied current regenerates the spent reactivity of the embedded iron nanoparticles. Continuous
regeneration of nZVI reactivity on a membrane surface offers substantial advantages over single-
use approaches for the treatment of azo dyes and COCs in solution.

M.A.Sc. Thesis | Alexander Sutherland McMaster University | Chemical Engineering
22
3.1 Introduction
Chemical reductants such as ZVI have been proved to be effective in remediating organics
such as azo dyes and COCs into less toxic compounds by degrading their characteristic bonds
(their azo linkages and chloride bonds respectively) [23], [29], [59]. Among these technologies,
nZVI has emerged as an increasingly attractive option for facilitating reductive remediation of
these organics, due to its enhanced reactivity [26], [35], cheap source material, and non-toxicity
[4], [76]. A mechanism for the direct and ROS mediated reduction of azo dyes and COCs using
zero valent iron is shown in Figure 3.1.
Figure 3.1. Mechanisms for the degradation of azo dyes by a) direct reduction
and c) ROS mediated reduction, and mechanisms for the degradation of COCs by
b) direct reduction and d) ROS mediated reduction.

M.A.Sc. Thesis | Alexander Sutherland McMaster University | Chemical Engineering
23
Unfortunately, the nZVI’s ability to remediate contaminants is limited by two main
problems. The first of these problems is the tendency of nanoparticles to homo-aggregate into
colloids, resulting in the loss of high surface area to volume ratio and thus decreased reactivity
[32], [131]. Secondly, nZVI’s high potential for oxidation allows many oxygen rich compounds
in solution can scavenge its reactivity, limiting its potential for reducing and remediating target
contaminants [22], [36], [38]. Furthermore, even if nZVI were able to selectively reduce
contaminant compounds in solution, it still faces the issue of loss in reactivity through reducing
contaminants in its intended operation [22]. Thus, technologies utilizing nZVI lack the ability to
operate continuously without nanoparticle replacement.
Recent work has shown that nanoparticle aggregation can be mitigated by growing and
stabilizing those particles on surfaces and in the pores of substrates [31], [35], [37], [49], [50],
[124], [125]. CNTs have been investigated as a nanoparticle stabilizing substrate [132] due to their
high surface area, and ability to possess functional groups that aid in stabilization [79], [84], [132].
This study focuses on developing conductive CNT membrane surface composites with
embedded stabilized catalytic nZVI particles for remediating methyl orange in solution. The
permeable network of CNTs in this surface composite layer allows for the passage of a
contaminated feed, while the nZVI particles stabilized in the CNT network facilitate a reduction
reaction to degrade the contaminants. Furthermore, when a negative voltage is applied to the
conductive surface composite, the CNTs function as an electrode capable of both directly reducing
azo dyes in solution and channeling electrons to regenerate the reactivity of the embedded nZVI
particles. Thus, with an applied pressure and voltage, nZVI-CNT membranes can continuously
electro-catalytically degrade azo dyes from a aqueous feed stream.

M.A.Sc. Thesis | Alexander Sutherland McMaster University | Chemical Engineering
24
3.2 Materials and Methods
3.2.1 Materials
All solutions used for synthesis, characterization, and testing were prepared in de-ionized
water from a Sartorious Arium Mini device. Single/double walled COOH-functionalized carbon
nanotubes (1-4 nm diameter, 5-30 𝜇m length, 2.73 wt% functional content) were purchased from
Cheaptubes. The following chemicals used were all of lab grade purity (> 98% pure). Iron sulfate
pentahydrate and sodium chloride were both purchased from Sigma Aldrich. Sodium borohydride
was purchased from Alfa Aesar.
All nitrogen gas used came from Air Liquide compressed nitrogen tanks (100% pure). The
circular flat sheet polyether sulfone microfiltration membranes were purchased from Sterlitech
(0.45 𝜇m pore size, 47 mm diameter). Methyl orange powder was purchased from Sigma Aldrich.
3.2.2 Catalytic Membrane Composite Preparation
Single/double walled COOH-functionalized carbon nanotubes were dispersed in a round
bottom flask of deoxygenated (DO) water using a QSonica probe sonicator for 30 minutes effective
time (two seconds dormant alternating with two seconds active). During sonication, nitrogen gas
was bubbled into the flask at low pressure to maintain a nitrogen-rich solution and minimize the
concentration of dissolved oxygen.
After sonication, the flask was closed with a septum cap. Nitrogen was continuously
bubbled into the solution through a needle which pierced the septum and extended into the solution.
A second shorter needle which pierced the septum did not reach the solution and was used as a
pressure release. Low pressures and low gas flow rates were used to facilitate bubbling/stirring
and to maintain a nitrogen atmosphere within the flask to prevent the oxidation of nZVI in
M.A.Sc. Thesis | Alexander Sutherland McMaster University | Chemical Engineering
25
subsequent steps. Iron Sulfate Pentahydrate was added in a ratio of 3:1 Fe2+ ions to -COOH
functional groups of the dispersed CNTs. After an hour of mixing time – over which the positively
charged iron ions became associated with the negatively charged functional groups – sodium
borohydride dissolved in DO water was added dropwise to the round bottom flask at a controlled
rate of 0.5 mL/minute for 10 minutes using a KdScientific syringe pump. An appropriate amount
of NaBH4 was added to achieve a BH4-: Fe2+ ratio of 2:1, with 10% excess of NaBH4 to account
for undesirable side reactions with water. The NaBH4 reduces iron ions into zero-valent iron
nanoparticles on the surface of the CNTs. The mixture was kept bubbling under nitrogen for one
hour past the addition of sodium borohydride to ensure the reaction reached completion. Once the
reaction was assumed complete, the round bottom flask containing the dispersed nZVI-CNT
mixture was sealed under nitrogen atmosphere.
In an N2-enriched glovebox, the nZVI-CNT mixture was filter-deposited onto the surface
of 0.45 𝜇m pore size flat sheet polyether sulfone (PES) membranes using a vacuum pump
following the same protocol as previously published [133]. The surface composites of each
membrane consisted of 10 mg of nZVI-CNT mixture, and were each approximately 35.5 mm in
diameter. The newly fabricated nZVI-CNT membranes were dried under the ambient N2
environment inside the glovebox then stored separately in air. It should be noted that during
storage, the nZVI within the membrane surface composite oxidized due to exposure to ambient
air. Exposure to air was expected to cause the formation of a shell of iron oxides and hydroxides
around an inner core of nZVI that will slowly oxidize over time.
3.2.3 Membrane Characterization
The prepared catalytic membranes and the nZVI-CNT material used to fabricate them were
characterized with both Scanning Electron Microscopy (SEM) and Transmission Electron

M.A.Sc. Thesis | Alexander Sutherland McMaster University | Chemical Engineering
26
Microscopy (TEM). For TEM studies, newly prepared nZVI-CNT mixtures were diluted with DO
water before being drop-deposited and dried on the surface of holey carbon-coated copper grids
inside a glovebox under a nitrogen atmosphere. These grids were subsequently analyzed under
TEM-EDS (Jeol2010F) to show the structure and elemental composition of the catalytic composite
material. For examining the catalytic membrane cross-section, nZVI-CNT membranes were cut
into small pieces (< 20 mm2) and frozen with liquid nitrogen for approximately 5 minutes under
vacuum. These frozen membrane pieces were cracked in half using tweezers, sputter coated with
5 nm thick coatings of Au and imaged under SEM (JEOL JSM-7000F).
Sheet resistivity measurements were taken using a HALL HL5500PC four point-probe
device to measure the electrical conductivity of the nZVI-CNT membrane surface composites.
These sheet resistivities were converted to conductivity values by taking the inverse of each
measurement and dividing by an average surface composite thickness estimated from cross-
sectional SEM images.
Catalytic membrane iron content was determined through a mass balance and
measurements taken using Inductively Coupled Plasma Optical Emission Spectrometry (ICP-
OES). These tests analyzed the permeate samples obtained from the vacuum filtration step of the
catalytic surface composite synthesis process. The permeates were diluted to volumes of 12 mL
and tested with a Vista-Pro CCD Simultaneous ICP-OES device over a measuring range of 20 –
100 ppm. Once the iron concentration of the permeate is known, the mass of iron in the surface
nanocomposite can be calculated by subtracting the mass of iron in the permeate sample from the
iron assumed to be in the aliquot of well mixed nZVI-CNT mixture filter deposited onto the PES
support membrane.

M.A.Sc. Thesis | Alexander Sutherland McMaster University | Chemical Engineering
27
3.2.4 Electrochemical Batch Removal of Methyl Orange Dye
The azo dye, methyl orange (MO), was chosen as a model contaminant. The UV-Vis
absorbance of MO is approximately linearly proportional to its concentration. A calibration curve
(Figure S1) was generated using a UV-Vis spectrophotometer to determine the concentration of
MO after exposure to the catalytic membranes. Figure 3.2 shows the experimental batch system,
in which a conductive membrane composite (nZVI-CNT or CNT) as the working electrode, and
graphite strip (VWR, 𝑙 × 𝑤 × 𝑡 = 5 cm × 2 cm × 0.5 mm) as the counter electrode
electrochemically degrade a batch of MO. The electrodes were spaced 3 mm apart with a parallel
overlapping area of ~3.8 cm2.
Figure 3.2. The experimental setup for testing nZVI-CNTs
performance in removing MO in solution under an applied
voltage.

M.A.Sc. Thesis | Alexander Sutherland McMaster University | Chemical Engineering
28
A constant negative voltage (-2 V) was applied between the membrane composite cathode
and the graphite strip anode using an Autolab potentiostat/galvanostat to form an electrochemical
cell. Over the course of a three-hour period, 200 µL samples were taken from the well-mixed batch
(stirring at 900 rpm) at 10-minute intervals. The absorbances for these samples were measured at
464 nm in a Tecan Spark 10M UV-Vis Spectrophotometer, and the corresponding concentration
was calculated from the absorbance-concentration calibration curve (Figure S1).
3.2.5 Cyclic Voltammetry
Cyclic voltammetry (CV) tests were conducted to assess the nature of the electrochemical
reactions taking place in the batch and continuous MO removal systems. Using an experimental
setup identical to the batch removal system, a CV test was conducted between -2 V and 2 V at a
scan rate of 10 mV/s using an Autolab Potentiostat. A sufficient amount of sodium chloride was
dissolved in the batch system to ensure a solution conductivity of 1000 𝜇S/m.
3.3 Results and Discussion
3.3.1 nZVI-CNT Membrane Composite Morphology
Dark-field TEM images show CNTs with adsorbed nZVI particles (Figure 3.3), which are
accompanied by TEM-EDS scans showing the carbon and iron content. The elemental analysis of
this image yields carbon, oxygen, and iron atomic percentages of 56.3%, 13.7%, and 5.5% (with
the remaining percentage being composed of copper from the TEM grid, and Na from the addition
of NaBH4 during nanoparticle synthesis). Figure 3.3 and its corresponding atomic % breakdown

M.A.Sc. Thesis | Alexander Sutherland McMaster University | Chemical Engineering
29
confirm that the structure observed on the CNTs is an iron nanoparticle with a diameter of ~57
nm.
3.3.2 Catalytic Membrane Conductivity and Iron Content
The results of the conductivity tests performed are shown in Figure 3.4 (left), which show
that membranes with nZVI-CNT and CNT composites are highly conductive (40 098 ± 3570 S/m,
and 97 877 ± 7714 S/m respectively.
Figure 3.3. TEM-EDS images showing an nZVI-CNT mixture (left) and its main elemental
composition in terms of carbon (middle) and iron (right).
0.00E+00
2.00E+04
4.00E+04
6.00E+04
8.00E+04
1.00E+05
1.20E+05
Co
nd
uct
ivit
y (S
/m)
nZVI-CNTs CNTs
-1.5
-1
-0.5
0
0.5
1
1.5
-2 -1 0 1 2
Cu
rren
t (m
A)
Voltage (V)
Figure 3.4. Left: Conductivity results from 4-point probe measurements on nZVI-CNT and CNT
membrane composites, and right: Cyclic voltammetry on the batch removal system using an nZVI-
CNT cathode, with a grey dotted line shown to outline the MO reduction peak.

M.A.Sc. Thesis | Alexander Sutherland McMaster University | Chemical Engineering
30
These results in Figure 3.4 (left) indicate that the 10 mg nZVI-CNT membrane composites
are on average 2.4-times less conductive than 10 mg CNT membrane composites. We hypothesize
that the lower nZVI-CNT composite conductivity values are a result of the presence of oxidized
iron within the composite. Although nZVI nanoparticles are highly conductive, the corrosion layer
of iron oxides and hydroxides that develops on the surface of these nanoparticles with exposure to
oxygen in storage is electrically insulating. Incorporating an electrically insulting material to the
surface composite reduces the overall conductivity of the network. While nZVI-CNT membrane
composites are less conductive than those made up solely of CNTs, the catalytic membrane thin
films are still highly conductive and effective as an electrode material for facilitating the
electrochemical degradation of azo dyes and COCs [51]. Figure 3.4 (right) shows the results of a
CV scan between -2 V and 2 V using an nZVI-CNT cathode, a graphite strip anode, and a 1 mM
MO solution brought to 1000 𝜇S/m through the addition of NaCl. The peak around -0.5V in the
scan is indicative of the direct reduction of methyl orange occurring at the cathode [64].
The mass of iron remaining in the surface composite was determined by measuring the iron
concentration in the liquid permeates of the vacuum deposition stage during the membrane surface
composite fabrication process. ICP-OES was used to quantify the permeate iron content. The
results of these measurements yielded negligible concentration of iron in the permeate samples.
We concluded that the iron vacuum deposited onto the membrane surface remains either within
the CNT network of the surface composite, or within the pores of the PES support membrane.

M.A.Sc. Thesis | Alexander Sutherland McMaster University | Chemical Engineering
31
3.3.3 MO Batch Removal Performance of Catalytic Membranes
Membranes with catalytic nZVI-CNT surface composites were first tested in a batch
system rather than a continuous system for a few important reasons. First and foremost, a batch
system, lacks parameters that complicate comparisons of experimental results, such as feed
pressure and flow rate. Since the retention time of MO in a continuous membrane flow cell affects
the extent to which the model contaminant is degraded, differing flow rates between the various
experiments complicates comparisons between them. Thus, the relatively simpler batch system is
preferable for examining the ability of an applied voltage to regenerate the reactivity of the
embedded nZVI particles. Secondly, a batch system allows for the examination of a given
membrane composite’s affinity to adsorb MO over time, and further distinguishes the contributions
of adsorption and chemical reaction.
Figure 3.5 shows the concentration of 0.25 mM MO over a three-hour batch test using
conductive membrane composites as a cathode and a graphite strip as an anode. 0.25 mM (~82
ppm on a mass basis) was chosen to reflect common textile industry effluent concentrations (50 –
80 ppm) [134]. This data corresponds to triplicate tests for batch removal using an nZVI-CNT
surface composite membrane as well as data for three controls: membranes without nZVI, without
applied voltage, and without nZVI or applied voltage. The systems, shown in Figure 3.5 were
tested in triplicate, with each test using a new membrane sample.

M.A.Sc. Thesis | Alexander Sutherland McMaster University | Chemical Engineering
32
From the nZVI-CNT (-2 V) test results displayed in Figure 3.5, MO dye concentration 𝐶
over time 𝑡 can be described as decaying exponentially from the initial concentration 𝐶0 by the
relation: 𝐶 = 𝐶0𝑒𝛼𝑡, where 𝛼 is some parameter 𝛼 < 0 encapsulating the contributions of
regenerated and/or added catalytic nZVI reactivity, direct reduction at surface of the CNTs (in the
presence of an applied voltage), ROS reactivity, and adsorption. A model describing the decrease
in MO concentration over time in the presence of an nZVI-CNT cathode and -2 V applied voltage
was fit with linear-in-parameters regression and is given by 𝐶 = 0.25𝑒−0.023𝑡 (𝑅2 = 0.996).
Comparing the series in Figure 3.5, it is evident that MO removal is achieved in all systems
with and without nZVI and with and without applied voltage. However, the rate of MO removal
-0.05
0
0.05
0.1
0.15
0.2
0.25
0.3
0 50 100 150
Met
hyl
Ora
nge
Co
nce
ntr
atio
n (
mM
)
Elapsed Time (minutes)
CNTs (0V)
Iron-CNTs(0V)
CNTs (-2V)
Iron-CNTs(-2V)
Figure 3.5. Results for batch removal of MO using nZVI-CNT cathodes (grey) and CNT
cathodes (black), operating at -2V (squares) or with no applied voltage (circles). Error bars
represent the 95% confidence interval.
M.A.Sc. Thesis | Alexander Sutherland McMaster University | Chemical Engineering
33
varies significantly. Applied voltage and the presence of nZVI both contributed to greater MO
removal. With no applied voltage, both systems with and without iron-particles managed to
remove MO, however, the systems with nZVI achieved higher removal than those without. This
indicates that the presence of nZVI enhances MO removal. The removal of MO without applied
voltage can be explained by two phenomena. Firstly CNTs and iron nanoparticles (in both nZVI
and iron oxide states) have demonstrated high affinity for the adsorption of dyes [29], [35], [52].
Secondly, MO removal in the absence of applied voltage could indicate the reduction of MO by
nZVI remaining beneath the oxidized shell covering the nanoparticles [26]. The added adsorptive
capacity and remaining reactivity of nZVI particles could provide evidence as to why systems with
nZVI-CNT cathodes remove more MO than systems with CNT cathodes. However, it should be
noted that at the 95% confidence level, there is currently insufficient statistical evidence to suggest
that a difference exists in the true mean removal of MO from systems using nZVI-CNT composites
and systems using CNT composites when there is no applied voltage to the system.
The results of Figure 3.5 indicate that applying -2 V to the batch system causes a large
increase in MO removal and highlights the impact of CNT membranes with nZVI as compared
with those without. Comparing the two systems without nZVI – labelled CNTs (0 V) and CNTs (-
2 V) on Figure 3.5 – it is evident that CNT systems with an applied voltage achieved increased
MO removal. This elevated MO removal is due to the reductive electrochemical degradation of
the dye at the surface of the CNT cathode [64]. Furthermore, examining the nZVI-CNT results
with -2 V applied, elevated removal of MO is observed when nZVI is included and a voltage is
applied, suggesting that a synergistic effect exists between the two. This finding lends support to
the hypothesis that an applied voltage regenerated the reactivity of the nZVI particles thereby
causing enhanced electro-catalytic MO removal. Furthermore, the aforementioned exponential

M.A.Sc. Thesis | Alexander Sutherland McMaster University | Chemical Engineering
34
rate at which the nZVI-CNT system removes MO dye resembles the kinetics of nZVI’s
degradation of azo dyes in the literature [29]. This elevated removal allows an nZVI-CNT system
with -2 V applied to fully remove 0.25 mM MO from a 30 mL batch within 2-3 hours (100%
removal), while a CNT system with -2 V applied only reduces MO concentrations of batches with
identical specifications to 0.05-0.07 mM within 2-3 hours (70-79% removal).
3.4 Conclusions
nZVI nanoparticles can be grown and stabilized onto a network of functionalized carbon
nanotubes. This nZVI-CNT mixture can be readily deposited onto a support membrane to form a
conductive, continuously reactive, and adsorptive thin film composite. Results of batch tests using
conductive membrane surface composites as a cathode and graphite foil as an anode have shown
that these membranes can remove MO by electrochemical reaction and adsorption, at an
exponentially decaying rate. These same results indicate that an applied voltage to a membrane
surface composite possessing nZVI enables increased removal of MO. The enhanced removal of
MO through an applied voltage to embedded nZVI nanoparticles suggests the partial restoration
of nZVI reactivity lost to passivation. With -2 V applied to a system using a 10 mg nZVI-CNT
cathode, batches of 0.25 mM MO can be fully removed within 2-3 hours.

M.A.Sc. Thesis | Alexander Sutherland McMaster University | Chemical Engineering
35
Chapter 4
Application of Catalytic Membranes in a Continuous Dead-End Flow
System
Abstract
Effluents from textile industry processes using azo dyes require continuous treatment to
comply with increasingly strict environmental regulations. In this study, membranes with
conductive catalytic nZVI-CNT composites are employed as electrochemically reactive barriers
to continuously remediate a pressurized feed of methyl orange dye. These tests were conducted in
a custom-built dead-end flow cell at feed pressures ranging between 20 and 80 psi, with a -2 V
voltage applied to the electrochemical cell formed by a membrane surface composite cathode
opposite a graphite strip anode. Systems using nZVI-CNT membranes achieved ~87 mole %
removal of methyl orange and demonstrated a 2.7 times greater removal rate than batch tests of
analogous parameters, and 1.6 times greater than other continuous tests using membrane surface
composites that lacked nZVI. Furthermore, the application of voltage to the membrane thin film
surface composite increases the transmembrane flux through system, allowing for increased
throughput at a given feed pressure. The results of these experiments show promise in the
continuous removal of contaminants from wastewaters through reductive degradation, such as azo
dyes and chlorinated organic compounds.

M.A.Sc. Thesis | Alexander Sutherland McMaster University | Chemical Engineering
36
4.1 Introduction
Membrane separations have become prevalent and ubiquitous in modern wastewater
treatment applications. RO membranes have proven to be capable of removing dyes and
chlorinated solvents from wastewaters [15]–[18]. However, this conventional method of
membrane separation is plagued by issues such as high transmembrane pressure gradients (and
thus high energy costs), membrane damage due to concentration polarization, and biofouling [14],
[16]–[18], [71], [73], [77].
Electrically conductive membranes have shown promise in preventing biofouling [14],
[40]–[43]. Such membranes have been prepared by filter depositing graphitic materials such as
CNTs into conductive, porous thin films on the surface of conventional polymer support
membranes. Additionally, CNT films have been shown to facilitate the electrochemical
degradation of dyes under an applied voltage.
Nano zero-valent iron particles represent an alternative technology for remediating COCs
and azo dyes and can be grown and stabilized on the carboxylic acid groups of functionalized
CNTs. Furthermore, the results of studies presented in Chapter 3 suggest that the reactivity of
nZVI embedded within a thin film nanocomposite of CNTs can be regenerated through the
application of a negative voltage. These regenerated nanoparticles add electro-catalytic reactivity
to the electrochemical capabilities of the CNTs for enhanced removal of organic contaminants
under an applied voltage.
The objective of this work was to develop a conductive, porous, reactive nanoparticle-
embedded membrane surface composite capable of remediating an azo dye feed solution. The
membrane surface composite achieves this remediation using electrochemical reaction under an

M.A.Sc. Thesis | Alexander Sutherland McMaster University | Chemical Engineering
37
applied voltage rather than conventional size exclusion. The performance of these membranes
regarding membrane flux, permeability, and contaminant removal was tested in a continuous dead-
end flow configuration under an applied voltage. The reliance of contaminant removal on an
applied voltage for electrochemical degradation rather than size exclusion presents the opportunity
for operations using membranes with larger pores. This effectively means that the application of a
low negative voltage undercuts the need for vastly greater transmembrane pressures, and thus
offers savings in terms of operating energy requirements.
4.2 Materials and Methods
4.2.1 Materials
Pure water flux measurements were conducted with reverse osmosis (RO) filtered water.
Apart from these pure water flux tests, all solutions used for synthesis, characterization, and testing
were prepared in de-ionized water from a Sartorious Arium Mini device. Single/double walled
COOH-functionalized carbon nanotubes (1-4 nm diameter, 5-30 𝜇m length, 2.73 wt% functional
content) were purchased from Cheaptubes. The following chemicals used were all of lab grade
purity (> 98% pure). Iron sulfate pentahydrate and sodium chloride were both purchased from
Sigma Aldrich. Sodium borohydride was purchased from Alfa Aesar. Sodium dodecyl sulfate was
purchased from Anachemia.
All nitrogen gas used came from Air Liquide compressed nitrogen tanks (100% pure). The
circular flat sheet polyether sulfone microfiltration membranes were purchased from Sterlitech
(0.45 𝜇m pore size, 47 mm diameter). Methyl orange powder was purchased from Sigma Aldrich.

M.A.Sc. Thesis | Alexander Sutherland McMaster University | Chemical Engineering
38
4.2.2 Catalytic Membrane Composite Preparation
The procedure to fabricate nZVI-CNT membrane surface composites for continuous tests
was nearly identical to that for the batch tests explained in Section 3.2.2, with three notable
differences. Firstly, the line of nitrogen gas placed into the solution for mixing and preserving a
deoxygenated environment in the process for fabricating membranes for batch tests was instead
kept above the solution in the void space of the round bottom flask. Mixing was instead
accomplished by bath sonication. Secondly, membrane composites used for continuous tests
contained 4 mg of nZVI-CNT, rather than 10 mg. A lower composite mass was chosen for the
continuous tests to achieve higher fluxes, to increase membrane fabrication throughput, and to
lower the extent to which contaminant removal was facilitated by adsorption rather than
electrochemical reaction. Thirdly, sodium dodecyl sulfate (SDS) was added in a 1:1 mass ratio
with CNTs before the probe sonication step to ensure proper dispersion of the CNT network. While
the addition of SDS was assumed to decrease surface composite conductivity, it is necessary for
maintaining nZVI-CNT dispersion to fabricate uniform membrane surface composites with
reproducible permeabilities.
4.2.3 Membrane Characterization
The prepared catalytic membranes and the nZVI-CNT material used to fabricate them were
characterized with Scanning Electron Microscopy (SEM). To examine the catalytic membrane
cross-section, nZVI-CNT membranes were cut into small pieces (< 20 mm2) and frozen with liquid
nitrogen for approximately 5 minutes under vacuum. These frozen membrane pieces were cracked
in half using tweezers, sputter coated with 5 nm thick coatings of Au and imaged under SEM
(JEOL JSM-7000F).

M.A.Sc. Thesis | Alexander Sutherland McMaster University | Chemical Engineering
39
4.2.4 Membrane Flow Characterization
The permeabilities of the membranes possessing catalytic surface composites were
determined from pure water flux measurements. In these experiments a membrane was placed
inside a Sterlitech flow cell (37 mm inner diameter) and subjected to a pressurized flow of DIW
from a reservoir. The pressure gradient driving this flow was supplied by pressurized nitrogen gas.
Before testing, each membrane was pressurized for one hour under 90 psi. Flux was measured for
each pressure in the range of 20 – 80 psi at 10 psi increments. When testing at a given pressure,
the cumulative mass of permeate was recorded at 10 second intervals up to one minute. From these
measurements, the average volumetric flux in each interval was calculated. Flux was calculated
using the surface area of the membrane. Membrane permeability was determined from the linear
regression of the slope of the flux measurements plotted against their corresponding pressures.
4.2.5 Continuous Electrochemical Removal of Methyl Orange Dye
Figure 3.1 (a) and (b) show the electrochemical membrane flow cell and its schematic
representation, respectively. Within the custom-built dead-end electrochemical flow cell, the
electro-catalytically active membrane is positioned at the bottom of the cell chamber opposite a
graphite anode. A more detailed description of the electrochemical flow cell can be found in the
SI and is similar in design to several other cells in the literature [94], [135], [136].

M.A.Sc. Thesis | Alexander Sutherland McMaster University | Chemical Engineering
40
The membrane separated a N2-pressurized MO feed from an external reservoir. The
spacing between cathode and anode can be adjusted as the graphite anode is attached to a stainless-
steel electrode protruding from the top of the cell. Using an Autolab potentiostat attached to the
stainless-steel electrodes, -2 V was applied to the membrane composite cathode and graphite
anode. Permeate from the flow cell was collected in beakers stirred at 300 rpm over 10-minute
intervals. At the end of each interval, the collected mass was weighed, and flux was calculated.
Three 200 𝜇L aliquots of permeate sample were taken at the end of each 10-minute interval to test
the concentration of MO in that sample by the same method discussed for the batch system
experiments.
Figure 4.1. a) A visual and b) a schematic of the continuous dead-end flow system used
to test the catalytic membrane’s performance in electrochemically degrading MO.

M.A.Sc. Thesis | Alexander Sutherland McMaster University | Chemical Engineering
41
4.2.6 Contact Angle Experiments
The contact angle of 0.25 mM MO droplets on the surface of 4 mg nZVI-CNT surface
composite membranes was measured using an Optical Contact Angle device (OCA 35). These
tests were completed to examine the wetting and electro-wetting characteristics of MO on the
nZVI-CNT composite surface with and without an applied voltage. During electro-wetting tests,
2 V was applied to the surface through contact with the probes of a GW Instek GPS-1850D DC
power supply.
4.3 Results and Discussion
4.3.1 nZVI-CNT Membrane Composite Morphology
The SEM image in Figure 4.2 shows a cross section of an nZVI-CNT membrane.
Analyzing this image, and others taken on membrane samples of identical specifications, the
average thickness of the 10 mg nZVI-CNT membrane surface composite was found to be
approximately 6 𝜇m.
Figure 4.2. An SEM image of an nZVI-CNT membrane
cross section at 5,000x magnification, showing both the thin
film surface composite and the PES support membrane
beneath it.
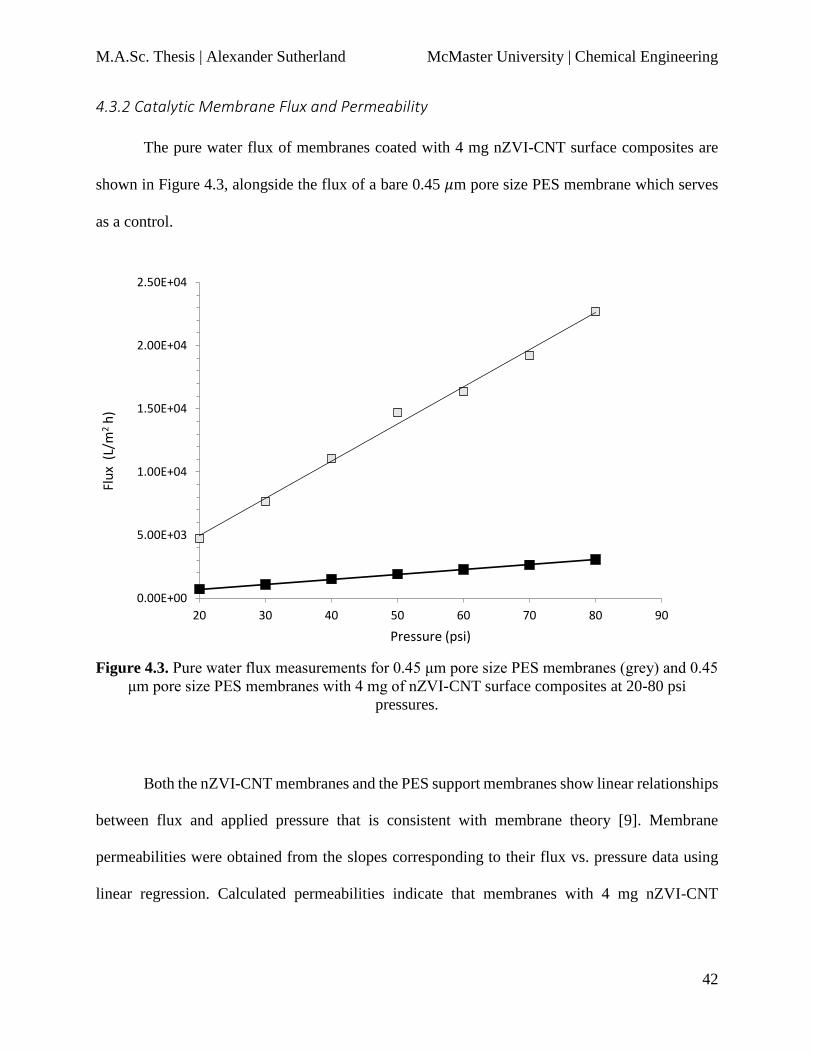
M.A.Sc. Thesis | Alexander Sutherland McMaster University | Chemical Engineering
42
4.3.2 Catalytic Membrane Flux and Permeability
The pure water flux of membranes coated with 4 mg nZVI-CNT surface composites are
shown in Figure 4.3, alongside the flux of a bare 0.45 𝜇m pore size PES membrane which serves
as a control.
Both the nZVI-CNT membranes and the PES support membranes show linear relationships
between flux and applied pressure that is consistent with membrane theory [9]. Membrane
permeabilities were obtained from the slopes corresponding to their flux vs. pressure data using
linear regression. Calculated permeabilities indicate that membranes with 4 mg nZVI-CNT
0.00E+00
5.00E+03
1.00E+04
1.50E+04
2.00E+04
2.50E+04
20 30 40 50 60 70 80 90
Flu
x (
L/m
2h
)
Pressure (psi)
Figure 4.3. Pure water flux measurements for 0.45 μm pore size PES membranes (grey) and 0.45
μm pore size PES membranes with 4 mg of nZVI-CNT surface composites at 20-80 psi
pressures.

M.A.Sc. Thesis | Alexander Sutherland McMaster University | Chemical Engineering
43
composites are ~7.5 times less permeable than their PES support membranes alone, with
permeabilities of 565.7 ± 8.0 L/m2h·bar and 4258 ± 371.6 L/m2h·bar respectively.
4.3.3 Continuous Removal of MO Using Catalytic Membranes
With the results of the batch system experiments having provided a proof-of-concept of the
regenerative electro-catalytic performance of nZVI-CNT surface composite membranes, tests in a
continuous system were carried out to determine the impact of flow through the catalytic
membrane surfaces on reductive degradation efficacy. Figure 4.4 shows the mole % decrease in
concentration between the MO in the feed and MO in the permeate, as well as volumetric flux for
the continuous removal of 0.25 mM MO in a dead-end flow cell at 40 psi. These tests used nZVI-
CNT surface composites as a cathode opposite a graphite anode with -2 V applied voltage. The
results of the following three types of control experiments are also included in Figure 4.4 for
comparison: systems without nZVI, without applied voltage, and without nZVI or applied voltage.
0
100
200
300
400
500
600
0.0
20.0
40.0
60.0
80.0
100.0
120.0
CNT (0V) Iron-CNT (0V) CNT (-2V) Iron-CNT (-2V)
Ave
rage
Flu
x (L
/m2
h)
MO
Rem
ova
l (%
)
MO Removal (%) Avg Flux
Figure 4.4. MO mole % Removed (orange) and Average Flux (blue) for dead-end continuous
flow cell tests at 40 psi with various membrane surface composite cathode types and applied
voltages. Error bars represent the 95% confidence interval on each set of triplicate tests.

M.A.Sc. Thesis | Alexander Sutherland McMaster University | Chemical Engineering
44
Systems with nZVI-CNT composites operating at -2 V achieved 87.3 ± 3.2 % removal of MO on
average. These results were closely comparable to those of control experiments lacking nZVI (92.6
± 3.6%). It should be noted that within the 95% confidence interval there is no statistical difference
between the mean percentage removal of MO by these systems. Control systems operating without
applied voltage using nZVI-CNT and CNT composites achieved insignificant removal of MO and
were closely comparable to one another (2.9% and 2.6% removal, respectively).
While systems with nZVI-CNT composites operating at -2 V and those without nZVI at -2 V
achieved statistically similar MO removal, the nZVI-CNT membranes had significantly higher
flux than the pure CNT membranes (422 ± 93.2 L
m2h, and 247 ± 55.8
L
m2h respectively). With a
greater transmembrane flux and the same MO removal, this suggests that systems with nZVI-CNT
composite membranes degrade MO at a higher rate. Based on the time-dependent nature of the
chemical reaction observed in the batch system experiments, it is logical to assume that a
compromise exists between throughput (flux) and degradation (mole % of MO removed) in the
system. A lower throughput enables a higher retention time of MO within the catalytic membrane,
and thus greater contact time for degradation. Thus, the removal rate 𝑅, of MO is a more
informative metric than mole % removal for describing a catalytic membrane’s ability to remove
contaminants in the permeate. The trade-off between throughput and degradation suggests that
removal rate is the system’s target objective to be maximized, as it is the product of throughput
and contaminant concentration reduction. The removal rate 𝑅𝑖 over any given time interval 𝑡𝑖 is
given by 𝑅𝑖 = (𝐶0 − 𝐶𝑖)𝑉𝑖
𝑡𝑖 , where 𝑉𝑖 represents the permeate volume collected over the 𝑖th
interval, and 𝐶0 and 𝐶𝑖 represent the molar concentrations (M) of the feed and the permeate
collected over the 𝑖th interval, respectively. Figure 4.5 shows the average values for removal rates

M.A.Sc. Thesis | Alexander Sutherland McMaster University | Chemical Engineering
45
over the course of continuous removal tests for the same experimental and control systems as
outlined in Figure 4.4.
Cross examining Figure 4.4 and 4.5, it is evident that although the systems using nZVI-CNT
composites and those containing only CNTs show similar results in percent removal, the higher
fluxes through the nZVI-CNT composites indicate that those systems are removing MO at a 1.6
times higher rate on average.
The results from Figure 4.5 also suggest that higher fluxes are achieved when a voltage is
applied to the membrane surface composite. To investigate the effect of applied voltage on flux,
an experiment was carried out in which a voltage was applied mid-test, and MO removal and flux
were tracked throughout. Specifically, 0.25 mM MO was transported through nZVI-CNT
0
1E-09
2E-09
3E-09
4E-09
5E-09
6E-09
7E-09
8E-09
9E-09
CNT (0V) Iron-CNT (0V) CNT (-2V) Iron-CNT (-2V)
MO
Rem
ova
l Rat
e (
Mo
les/
s)
Figure 4.5. Removal rates for dead-end continuous flow cell tests with various
membrane surface composite cathode types and applied voltages. Error bars
represent the standard deviation across three triplicates.

M.A.Sc. Thesis | Alexander Sutherland McMaster University | Chemical Engineering
46
composite membranes under 40 psi with no applied voltage. After 30 minutes had elapsed, a -2 V
voltage was applied to the nZVI-CNT membranes and the test was continued for two more hours.
The flux and mole % removal throughout this test are presented in Figure 4.6.
0
10
20
30
40
50
60
70
80
90
100
0
50
100
150
200
250
300
0 20 40 60 80 100 120 140
MO
Rem
ova
l (M
ole
%)
Vo
lum
etri
c Fl
ux
(L/m
2h
)
Elapsed Time (minutes)
Volumetric Flux
MO Removal
-2.5
-2
-1.5
-1
-0.5
0
0 20 40 60 80 100 120 140
Ap
plie
d P
ote
nti
al (
V)
Elapsed Time (minutes)
Figure 4.6. MO Mole % Removed (orange) and Average Flux (blue) for a dead-end
continuous flow cell tests at 40 psi using an nZVI-CNT membrane composite cathode, in
which a step change in applied voltage of 0 V to -2 V is made after 30 minutes elapsed.

M.A.Sc. Thesis | Alexander Sutherland McMaster University | Chemical Engineering
47
From Figure 4.6, it is apparent that both MO removal and volumetric flux increased with the
application of -2 V voltage. The response of flux to the step change in applied voltage appears
similar to that of a first order response [137] and reached a steady state value nearly twice that at
0 V applied after approximately one hour. MO removal responded more rapidly to the step change
in voltage, reaching a steady state (~76% moles removed) value after approximately 20 minutes
(two sampling periods). Interestingly, the steady state flux achieved through the nZVI-CNT
membrane composite post application of-2 V did not achieve the same flux as when the voltage
was applied from the beginning of flux measurements.
Through a phenomenon known as electro-wetting, wetting of electrically conductive surfaces
can be enhanced by inducing a charge on a capacitor or electrode in the presence of conductive
liquids [131], [138]. Thus, it possible that the increased transmembrane flux was caused by
enhanced adhesion forces of MO to the conductive surface composites when cathodic voltages
were applied during membrane flux tests [131]. Contact angle experiments were carried out to
investigate this effect using 0.25 mM droplets on an nZVI-CNT surface composite with and
without an applied 2 V DC voltage. The observed contact angles were found to be 56.7 ± 4.3° and
68.2 ± 4.0° for surface composites with and without applied voltage, respectively, indicating that
an applied voltage does encourage MO wetting. However, the 0.25 mM solution used in this study
was prepared with DIW and therefore was not very conductive (~28 𝜇S/m). As such, electro-
wetting may not account for all the increased flux observed in the continuous MO removal
experiments, and that other mechanisms may be at work, such as alterations to the CNT network
under an applied voltage.
Removal rate, 𝑅, can also be used to compare the performance of the continuous and batch
systems. However, since the batch system has no permeate volume collected over time, its rate of

M.A.Sc. Thesis | Alexander Sutherland McMaster University | Chemical Engineering
48
removal is instead determined by 𝑅(𝑡) =𝑑𝐶(𝑡)
𝑑𝑡𝑉𝑏𝑎𝑡𝑐ℎ, where 𝐶(𝑡) represents the concentration of
the batch as a function of time (modelled by linear-in-the-parameters regression), and 𝑉𝑏𝑎𝑡𝑐ℎ
represents the volume of the batch. As previously discussed, the concentration of a batch system
as a function of time takes the form of 𝐶(𝑡) = 0.25𝑒𝛼𝑡, where 𝛼 < 0 and is representative of the
system parameters. Thus, removal rate is a monotonically decreasing function of time, and the
instantaneous removal rate, 𝑅(0), can be used for establishing the maximum, most optimistic
estimate of removal rate for comparison against the average removal rate of its continuous system
counterpart. 𝐶(𝑡) = 0.25e−0.023t represents the relationship of concentration over time for a nZVI-
CNT composite cathode system operating at -2 V. The maximum, instantaneous rate of removal
for that system is given by: 𝑅(0) =𝑑𝐶(0)
𝑑𝑡(0.03L) = 2.875 × 10⁻⁹ moles/s. This removal rate is
approximately 2.7 times less than that of its continuous counterpart, indicating that the continuous
system is more effective than a batch system operating at its theoretical maximum MO removal
rate. Additionally, the continuous system out-performs the batch system by achieving higher
throughput. For instance, the continuous system can reduce the concentration of 30 mL of 0.25mM
MO (the volume and molar concentration of the batch system) by ~87% in approximately 10-20
minutes, while the batch system requires approximately 90 minutes to achieve the same MO
removal.
Further comparing the results of the batch and continuous systems, it may seem that the former
possesses the advantage that it can continue in operation until a given batch of MO is completely
removed, while the permeate MO concentration of the latter is constant and less than 100%. A
two-factor design of experiments was devised to address this claim and investigate the
manipulation of experimental factors on flux and MO removal. Concentration was chosen as a
factor to investigate its effect on the kinetics of the reduction reaction to degrade MO, and the mass

M.A.Sc. Thesis | Alexander Sutherland McMaster University | Chemical Engineering
49
transfer of MO to the membrane surface. Pressure was chosen as a second factor to manipulate
flow rate through the cell, and thus the retention time of the MO feed. The DOE experimental
factors and corresponding results are shown below in Table 4.1.
Table 4.1 Structure and results of a design of experiments investigating the effects of feed
concentration and pressure on the flux and mole % removal of continuous tests using a system
operating at -2 V with an nZVI-CNT cathode, as well as the results of triplicate tests previously
discussed for comparison (blue).
Experiment Number
Order Tested
MO Concentration
(mM)
Feed Pressure
(psi)
Flux (L/m2h)
MO Removal (Mole %)
Removal Rate (Moles/s ×109)
1 4 0.125 20 229 93.6 2.26
2 2 0.25 20 280 89.5 5.35
3 3 0.125 80 485 65.0 3.30
4 1 0.25 80 505 72.3 7.56
N/A N/A 0.25 40 422 87.3 7.85
The results of this DOE confirm the compromise between flux and the extent to which the
concentration of the MO feed is degraded. Compared to the nZVI-CNT/-2 V/0.25 mM/40 psi tests
previously discussed (87.3% removal, as shown in blue in Table 4.1), tests at lower pressures (20
psi) and thus lower flux achieve slightly higher removal (89.5%), and tests at higher pressures (80
psi) and thus higher flux, achieve significantly less removal (72.3%). The results of this DOE also
indicate that the concentration of the MO feed has a limited effect in the flux and mole % removal
in a continuous system. Thus, if mole % removal remains constant regardless of the feed

M.A.Sc. Thesis | Alexander Sutherland McMaster University | Chemical Engineering
50
concentration, a second pass of MO through a system operating at 80 psi would likely achieve
similar results (92.3 mole % removed) to a single pass of a system operating at 20 psi (89.5 mole
% removed).
Finally, the results of Experiment 4 in the DOE (0.25 mM, 80 psi) illustrate the point that
suitable constraints must be considered when using removal rate as a metric of system
performance. Since removal rate is the product of volumetric flow rate and change in
concentration, Experiment 4 yielded a high removal rate due to its high flux through the membrane
despite its relatively poor decrease in MO concentration (72.3% removal). Removal rate is a
pragmatic metric for benchmarking system performance because it encapsulates information about
both flux and mole % removal. Thus, minimum constraints must be applied on those outputs when
seeking to maximize removal rate to avoid sacrificing either output at the expense of the other.
4.4 Conclusions
The membranes with nZVI-CNT composites achieved ~87% molar removal of MO feed
in a single pass through a continuous dead-end flow cell operated at -2 V and 40 psi. The average
rate of removal of the continuous system was found to outperform the instantaneous (maximum)
rate of removal of its batch system counterpart by 2.7 times. The application of a negative voltage
to the nZVI-CNT composite cathode caused an increase in the transmembrane flux due to electro-
wetting. The concentration of the MO feed in a continuous system appears to have little effect on
that system’s removal rate. The pressure of the feed, however, has a significant effect on the flux,
as pressure controls the retention time of MO within the membrane, and thereby the MO removal
rate, and the total MO mole % removal.

M.A.Sc. Thesis | Alexander Sutherland McMaster University | Chemical Engineering
51
Chapter 5
Statistical Modelling and Optimization of the Batch Removal Performance
of Catalytic Membranes using Latent Variable Methods
Abstract
Chlorinated organic compounds and azo dyes represent challenging contaminants in
modern wastewater treatment. We developed electro-catalytic membrane surface composites
composed of carbon nanotubes (CNTs) and nano zero-valent iron (nZVI) particles to treat these
contaminants. 41 membranes with varying synthesis parameters were produced and tested in an
electrochemical cell to evaluate the impact of seven experimental variables in chemically reducing
methyl orange (MO) dye over a 60-minute period. An electrochemical cell was formed from the
iron nanoparticle-CNT catalytic membrane composite as the cathode, and a graphite foil strip as
the anode, in an MO electrolyte. Partial least squares regression (PLSR) was used to develop a
model relating the membrane characteristics and experimental parameters to the removal of MO
over time. The importance and effect of each parameter on MO removal was evaluated. The
validated PLSR model was used to solve for an optimum set of membrane and experimental
parameters to achieve maximum MO removal. The MO removal under predicted optimum
conditions closely matched experimental data and achieved approximately 255% more removal
than that of tests based on a priori chosen parameters. Finally, an Auto-regression partial least
squares (ARPLS) model was developed to predict MO removal timeseries data beyond the
experimentally evaluated 60-minute test window.

M.A.Sc. Thesis | Alexander Sutherland McMaster University | Chemical Engineering
52
5.1 Introduction
Partial least squares regression (or projection to latent structures regression, PLSR) is a
data driven method for relating input and output data matrices to derive a multivariate linear model
[139]. A PLSR model takes a data set with 𝑁 observations of 𝐾 number of variables (dimensions)
and captures the variation in the data by projecting that system into a reduced dimensional space
of 𝐴 components. This reduced set of components (𝐴 < 𝐾) is essentially the collection of hidden
(but physically meaningless) variables within the data that encapsulate its variation and are thus
termed “latent variables”. Latent variables are useful for both an analysis of the relationship
between the input and output data matrices, and for quantitative predictions of the outputs given a
new set of input observations [139], [140].
Previous work in Chapter 3 has demonstrated the enhanced electro-catalytic batch removal
of methyl orange dye using nZVI-CNT surface composite membrane cathodes alongside a graphite
anode. Having validated this concept, it is desirable to investigate the effects of each of the seven
experimental parameters in the batch system (listed in Table 5.1) to model and optimize azo dye
removal performance. In this study, a Partial Least Squares (or Projection to Latent Structures)
regression (PLSR) model was developed to accomplish these objectives.
5.2 Materials and Methods
5.2.1 Materials
All the solutions used for synthesis, characterization, and testing were prepared in de-
ionized water from a Sartorious Arium Mini device. Single/double walled COOH-functionalized
carbon nanotubes (1-4 nm diameter, 5-30 𝜇m length, 2.73 wt% functional content) were purchased
from Cheaptubes. The following chemicals used were all of lab grade purity (> 98% pure). Iron
M.A.Sc. Thesis | Alexander Sutherland McMaster University | Chemical Engineering
53
sulfate pentahydrate was purchased from Sigma Aldrich. Sodium borohydride was purchased from
Alfa Aesar. Sodium dodecyl sulfate was purchased from Anachemia.
All nitrogen gas used came from Air Liquide compressed nitrogen tanks (100% pure). The
circular flat sheet polyether sulfone ultrafiltration membranes were purchased from Sterlitech
(0.45 𝜇m pore size, 47 mm diameter). Methyl orange powder was purchased from Sigma Aldrich.
5.2.2 Catalytic Membrane Composite Fabrication with Varying Parameters
The procedure for developing the catalytic nZVI-CNT surface composites used in this
study built upon the both the procedural foundations established in Section 3.2.2 and the alterations
to that procedure discussed in Section 4.2.2. Namely the synthesis parameters for the membrane
composites developed in this study were varied for the purpose of understanding their effect on
contaminant removal through subsequent modelling. The mass of the nZVI-CNT surface
composite varied between 5 – 10 mg, and the ratio of SDS surfactant used for CNT dispersion
varied between 1:1 and 1:1.5 mg of CNT: mg of SDS.
5.2.3 Methyl Orange Batch Removal Experiments
A batch test system was devised to test the performance of nZVI-CNT membranes in
removing contaminants under varying experimental parameters. The azo dye, methyl orange
(MO), was chosen as a model contaminant so that UV-Vis-measured dye intensity (absorbance)
data could be correlated to dye concentration via a calibration curve (Figure S1). This calibration
curve was used to calculate the concentration of samples obtained over the course of a batch test.
Figure 5.1 shows a schematic of the experimental design, in which a conductive membrane and a
graphite strip are hung as electrodes in a batch of 0.25mM MO dye. A voltage is applied between

M.A.Sc. Thesis | Alexander Sutherland McMaster University | Chemical Engineering
54
the catalytic membrane cathode, and the graphite strip anode, to form an electrochemical cell that
facilitates the degradation of the 0.25 mM MO dye batch.
200 µL samples are taken from the well mixed batch (stirring at 900 rpm) at 10-minute
intervals. The absorbances for these samples are then measured at 464 nm using a Tecan Spark
UV Vis Spectrophotometer and Figure S1 is used to calculate the corresponding concentration and
moles degraded. The experimental parameters varied are listed below in Table 5.1.
Figure 5.1. A schematic of the MO batch removal
experiments, in which voltage is supplied to the
surface of the composite cathode, and a graphite
strip anode.

M.A.Sc. Thesis | Alexander Sutherland McMaster University | Chemical Engineering
55
Table 5.1. Experimental parameters for electrochemical batch removal tests using catalytic
nZVI-CNT membrane surface composites.
Experimental Parameters Range Units
Batch Concentration 0.025 – 0.25 Millimolar (mM)
Applied Voltage -2 – 0 Volts (V)
Electrode Spacing 0.3 – 2 Centimeters (cm)
Iron Content 0 – 1.07 Mass (mg)
CNT Content 0 – 10 Mass (mg)
Surfactant Ratio 1:0 – 1:1.5 mg CNTs: mg SDS
Batch Volume 0.03 – 0.1 Litres (L)
5.2.4 Modelling Batch Removal Over Time Using PLSR
Using data from 41 batch MO removal experiments, a PLSR model was developed in
Aspen Plus ProMV to relate the seven experimental inputs to seven outcome variables. These
seven outcome variables are the moles removed from the system at seven 10-minute time
increments up to one hour, as shown in Table 5.2.
Table 5.2. Input and output variables used to construct a PLSR Model on the batch removal
system.
Input Variables
Output Variables
Batch Concentration
Moles MO removed at:
0 minutes
Applied Voltage 10 minutes
Electrode Spacing 20 minutes
Iron Content 30 minutes
CNT Content 40 minutes
Surfactant Ratio 50 minutes
Batch Volume 60 minutes
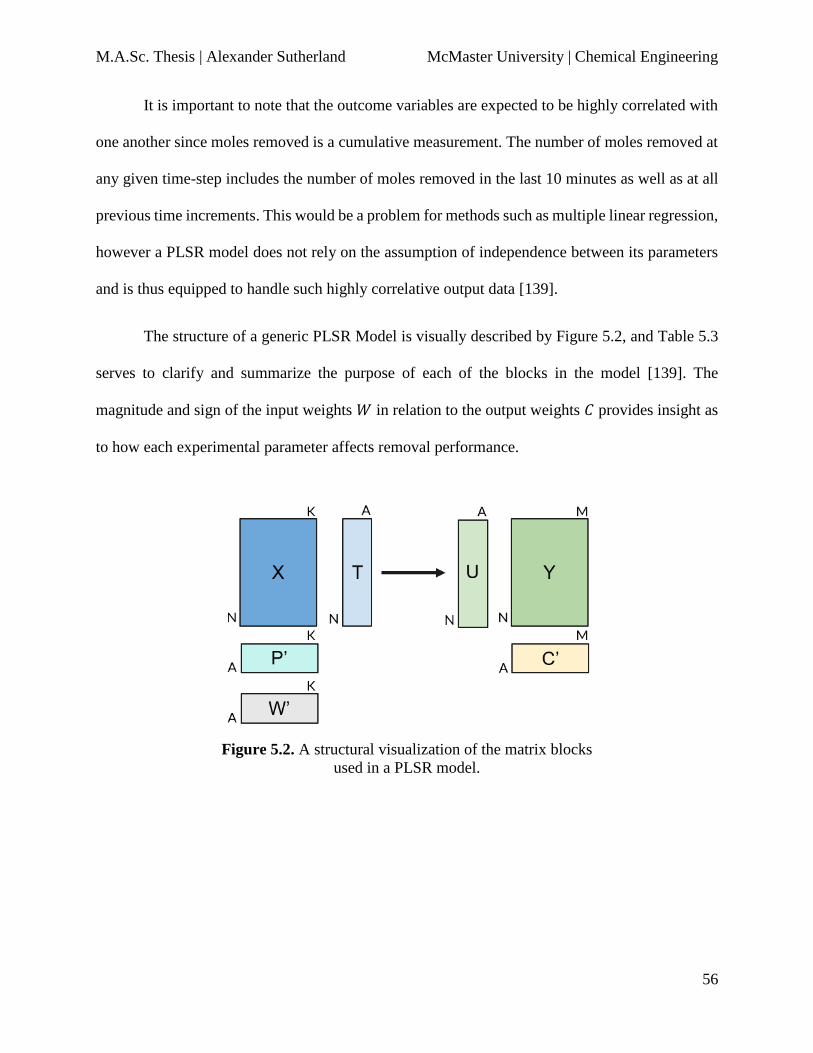
M.A.Sc. Thesis | Alexander Sutherland McMaster University | Chemical Engineering
56
It is important to note that the outcome variables are expected to be highly correlated with
one another since moles removed is a cumulative measurement. The number of moles removed at
any given time-step includes the number of moles removed in the last 10 minutes as well as at all
previous time increments. This would be a problem for methods such as multiple linear regression,
however a PLSR model does not rely on the assumption of independence between its parameters
and is thus equipped to handle such highly correlative output data [139].
The structure of a generic PLSR Model is visually described by Figure 5.2, and Table 5.3
serves to clarify and summarize the purpose of each of the blocks in the model [139]. The
magnitude and sign of the input weights 𝑊 in relation to the output weights 𝐶 provides insight as
to how each experimental parameter affects removal performance.
Figure 5.2. A structural visualization of the matrix blocks
used in a PLSR model.

M.A.Sc. Thesis | Alexander Sutherland McMaster University | Chemical Engineering
57
Table 5.3. Definitions, dimensions, and indices for the matrix blocks in a PLSR model. Note that
𝑊′, 𝐶′, and 𝑃′ denote the transposes of the 𝑊, 𝐶, and 𝑃 matrices respectively.
5.2.5 Using PLSR to Predict Optimal Batch Removal Performance
Aspen Plus ProMV software was used to conduct an optimization using the model
developed. The objective of the optimization was to maximize MO removal achieved by the
completion of the test (i.e. MO moles removed at 60 minutes). Constraints were placed on each of
the input decision variables so that the software would reach a solution that was experimentally
feasible. These experimental constraints are listed in Table 5.4.
Dimensions Index Definition
A 𝑎 The total number of components in the PLS Model
K 𝑘 The total number of input variables in the PLS Model
M 𝑚 The total number of components in the PLS Model
N 𝑖 The total number of observations used in the PLS Model
Matrix Dimensions Definition
X N x K Input data with N # of observations of K # of variables
Y N x M Output data with N # of observations of M # of variables
T N x A Input scores with N # of observations of A # of components
U N x A Output scores with N # of observations of A # of components
W K x A Input weights for K # of variables corresponding to A # of
components, which can be used to calculate T given X: 𝑇 = 𝑋𝑊
C M x A Output weights for M # of variables corresponding to A # of
components, which can be used to predict Y given T:
�̂� = 𝑇𝐶′
P K x A The loading matrix for the PLSR Model, which can be used to
predict Y given X and T:
�̂� = 𝑇𝑃′

M.A.Sc. Thesis | Alexander Sutherland McMaster University | Chemical Engineering
58
Table 5.4. Input decision variable constraints for optimizing the batch removal of MO at 60 min.
Experimental Parameters
Lower Constraint
Upper Constraint
Batch Concentration (mM)
0.025 0.25
Applied Voltage (V)
--- 0
Electrode Spacing (cm)
0.03 ---
Iron Content (mg)
0 ---
CNT Content (mg)
0 ---
Surfactant Ratio
1.1 ---
Batch Volume (L)
0.03 ---
Note that while some of the observations used to construct this model had surfactant ratios
of 1 mg CNTs: 0 mg SDS surfactant, a minimum constraint of 1 mg CNTs: 1 mg SDS is specified
in the optimization formulation. A non-zero mass of SDS is a necessary experimental parameter
for synthesizing uniform nZVI-CNT membrane coatings. A lack of surfactant – and thus a lack of
membrane surface uniformity– is acceptable for batch removal tests since flow through the
membrane was not examined in this study. However, for continuous trans-membrane contaminant
degradation, a minimum amount of surfactant is required to ensure a uniform membrane composite
thickness. Composite uniformity ensures repeatable trans-membrane fluxes of contaminants. Thus
minimum non-zero constraints were placed on surfactant ratio to ensure that this model would
reach optimization result that was useful for future continuous systems analysis.

M.A.Sc. Thesis | Alexander Sutherland McMaster University | Chemical Engineering
59
After solving for the optimum experimental parameters, a test was carried out with the
corresponding optimal decision variables to compare how the maximized MO removal
performance predicted by the software compared to an experimentally measured value.
5.2.6 Projecting Batch Removal Performance Using Auto-Regression PLS
Auto-Regression Partial Least Squares (ARPLS) was implemented to predict data in the
optimal batch removal timeseries beyond the experimentally observed data. ARPLS uses
repeatedly forward shifted timeseries data to create a set of input variables at future times. Each
variable created at a subsequent time step uses the timeseries data shifted forward by one
observation. The variable columns created by these shifts are called a lags [141]. The ensemble of
lagged variables forms a block of input data that can be provided to a PLSR model to predict the
next point in the timeseries.
In this study, an ARPLS model was generated using input data blocks of nine observations
and six variables (𝐾 = 6, one for each lag from 0 to 5) to describe the timeseries data of optimal
removal performance. After constructing the model, an investigation of the loading plot for
component 1 showed that each of the lags used in the model made a significant contribution. As
such, none of these lags were excluded in subsequent analysis. The model was first validated by
using it to predict MO removal for all time increments between 150 – 180 min inclusive and
comparing these predicted values to those observed in experimental testing under the same
conditions. Then the validated model was used to predict batch removal values for ten time
increments beyond those measured experimentally. Estimates of the error in these predictions were
determined and are further discussed in Section 5.5.

M.A.Sc. Thesis | Alexander Sutherland McMaster University | Chemical Engineering
60
5.3 Results & Discussion
5.3.1 Modelling Batch Removal Over Time Using PLS
A two-component PLSR model was used to describe the relationship between the
experimental input parameters 𝑋 and the MO removal at different time increments 𝑌. This means
that the seven variables in the system were projected onto a space with two latent variables that
best capture the variability in the data. Figure 5.3 shows a summary of the cumulative 𝑅2 and 𝑄2
values attained with the addition of components 1 and 2.
Additional components were not kept in the model, as their addition raised only the
cumulative 𝑅2 with no change to the cumulative 𝑄2. This is an indication that adding more
0
0.1
0.2
0.3
0.4
0.5
0.6
0.7
0.8
0.9
1
Component 1 Component 2
Cu
mu
lati
ve R
2, Q
2
Figure 5.3. Cumulative 𝑅2 (gray), and cumulative 𝑄2 (black)
attained by a PLSR model with the addition of a first and second
component fit to the MO batch removal experiment data.

M.A.Sc. Thesis | Alexander Sutherland McMaster University | Chemical Engineering
61
components would overfit the model, increasing the accuracy with which it predicts the training
data used to make it, but lowering its predictive power for use with future observations due to
overfitting [139]. Figure 5.3 shows that two components yield a model with an 𝑅2 of 0.64 and a
𝑄2 of 0.58, which indicates a respectable degree of predictive power [139].
The weights for the input and output variables with respect to the first component (𝑊1 and
𝐶1 respectively) are shown in a bar plot given by Figure 5.4. As previously explained, the output
variable weights for the removal of MO at different time increments are highly correlated with one
another.
Based on the input weights relative to the determined output weights, the PLSR model
suggests that initial batch concentration, negative applied voltage, mass of CNTs in the membrane
-0.4
-0.2
0
0.2
0.4
0.6
0.8
Inp
ut
We
igh
ts W
1, O
utp
ut
We
igh
ts C
1
Figure 5.4. Input weights 𝑊1 (gray) and output weights 𝐶1 (black) for the
first component of a PLS model fit to the MO batch removal experiment data.

M.A.Sc. Thesis | Alexander Sutherland McMaster University | Chemical Engineering
62
composite, and mass of iron in the membrane composite are correlated with increasing batch
removal. By the same analysis batch size, surfactant ratio, and electrode spacing are anti-correlated
with increasing batch removal.
Of the seven input variables, batch concentration possesses the strongest positive
correlation with MO removal. The magnitude of its weight in the model therefore suggests that the
rate of MO removal by electrochemical reduction and adsorption is highly dependent on its
concentration. This indicates that the mass transfer of MO molecules to the surface of the
membrane cathode is a limiting factor to its removal, which is substantiated by prior work and
theoretical models for unsteady state diffusion and reaction based on Fick’s law [9], [98]. This
could be problematic for practical applications, as COCs and azo dyes are often found in trace
levels of contamination (ppm concentrations) [32].
The correlation of the mass of CNTs and iron mean that both materials are important for
facilitating the reduction of adsorption of MO. This finding is substantiated by previous work, as
increasing the mass of those materials in the membrane surface composite increases its surface
area and thus the sites available for reaction and adsorption [25], [26], [29], [32], [34], [35], [38],
[49], [124]. The CNTs’ performance as an adsorbent and electrode for the electrochemical
reduction of azo dyes is well known. Distinguishing the mechanism of nZVI removal of azo dyes
that is positively correlated to azo dye removal is more challenging. We hypothesize two separate
mechanisms: 1) the applied voltage to the membrane composite regenerates the reactivity of the
embedded iron nanoparticles, reducing them back to a zero-valent state such that they can
continually reduce MO molecules and electro-catalytically remove them from solution; and 2) the
iron acts as an additional adsorbent and electrical conductor for electrochemical degradation of
MO. Further experiments and controls are required to explain this correlation, such as X-ray

M.A.Sc. Thesis | Alexander Sutherland McMaster University | Chemical Engineering
63
photoelectron spectroscopy (XPS) and the development of an adsorption isotherm. XPS could be
used to examine the electrochemical state of the iron in the membrane surface composite and
confirm whether it has been chemically reduced back to nZVI. An adsorption isotherm using
nZVI-CNT surface composite membranes and MO as the adsorbent and adsorbate respectively
would help in deconvoluting the contributions made to MO removal by adsorption and reaction.
Figure 5.4 implies that applying negative cathodic voltages to the membrane surface
composite increases MO removal. An increase in the voltage magnitude may speed up the kinetics
of the reduction reaction, or it may accelerate the iron particle regeneration. Additionally, charged
electrodes in an oxygenated aqueous medium can produce hydrogen peroxide, a strong reducing
agent that could be contributing to the removal of MO via a mediated reduction mechanism [142],
[143].
Referring again to Figure 5.4, batch size, the mass ratio of surfactants to CNTs, and
electrode spacing are anti-correlated to performance to roughly the same degree. It is intuitive that
increasing surfactant ratio has a negative effect on removal. SDS stabilizes hydrophobic CNTs in
an aqueous environment by wrapping around them to minimize interactions with water. Surfactant
wrapping of CNTs reduces their contact with each other in the membrane surface composite
network. This lowers the conductivity of the composite and thus its performance as an electrode
and as a scaffold with which to pass electrons to regenerate the reactivity of the iron particles. In
addition, wrapping CNTs with SDS blocks surface sites for the nucleation of nZVI particles during
membrane composite fabrication, and blocks potential sites for reaction during testing. The anti-
correlation of electrode spacing with MO removal is a result of the weakening of the electric field
between the electrodes with increasing distance. Finally, the anti-correlation between batch size
and MO removal is likely due to the experimental setup, i.e. that the same stirring apparatus and

M.A.Sc. Thesis | Alexander Sutherland McMaster University | Chemical Engineering
64
speed (900 rpm) were used for all tests. Assuming the rate of removal is mass transfer limited,
larger batches will be stirred less effectively than smaller ones, lowering the rate of convective
mass transfer to the membrane composite surface [9].
5.3.2 Using PLS to Predict Optimal Batch Removal Performance
Having run the optimization problem previously outlined in section 5.3.2, maximized MO
removal values were predicted by the PLSR model for the optimum set of input parameters. Of
the constraints placed upon the optimization, only those for batch concentration (maximum of 0.25
mM) and surfactant ratio (minimum ratio of 1 mg SDS:1 mg CNTs) were active at the solution to
the optimization problem. A constraint is considered active when the solver used to carry out the
optimization finds that the optimal value for its corresponding decision variable exists at a limit
posed by that constraint. An experiment was carried out using those same optimal parameters for
comparison and validation of the model. The MO removal results predicted by the PLSR model,
and those determined experimentally are included in Table 5.5.

M.A.Sc. Thesis | Alexander Sutherland McMaster University | Chemical Engineering
65
Table 5.5. Results for the predicted and observed values of optimum MO removal. The decision
variables at the optimum and the constraints they are subject to are also shown.
Experimental Parameters
Lower Constraint
Upper Constraint
Optimum
Time Interval
(min)
Predicted Removal
(𝝁moles)
Observed Removal (𝝁moles)
Batch
Concentration (mM)
0.025 0.25 0.25 0 0 0
Applied Voltage (V)
--- 0 -3.2 10 1.84 1.79
Electrode Spacing (cm)
0.03 --- 1.3 20 2.87 2.89
Iron Content (mg)
0 --- ~1.0 30 3.72 4.26
CNT Content (mg)
0 --- ~10 40 4.69 5.09
Surfactant Ratio
1.1 --- 1:1 50 5.29 5.62
Batch Volume (L)
0.03
---
0.09 60 5.89 6.05
While the experimentally observed MO removal values from the test carried out with
optimal parameters slightly out-perform the predictions made by the PLS model at the optimum,
the maximum deviation of the predicted data from the observed data was ~14.3% (occurring at an
elapsed time of 30 minutes), which speaks to the similarity of the data.
The model’s success in predicting the optimum membrane performance highlights the
benefits of this optimization. Figure 5.5 shows the observed vs. predicted MO removal at the
optimum experimental parameters in relation to experimental trials whose parameters lie within
the feasible solution space of the optimization (i.e. within the constraints imposed on the
optimization decision variables).

M.A.Sc. Thesis | Alexander Sutherland McMaster University | Chemical Engineering
66
As seen in Figure 5.5, it is evident that the model is not only accurate in predicting MO
removal, but also successful in determining a set of experimental parameters that substantially
improved MO removal; the test performance of at the optimum surpassed that of the next highest-
performing observation by 255%.
5.3.3 Projecting Batch Removal Performance Using Auto-Regression PLS
An ARPLS model with 5 lags and one component (𝑅2 = 0.98, 𝑄2 = 0.98) was fit to
describe the timeseries data for MO removal using the optimum conditions explored in section
5.3.2. Unlike previous experiments, the batch test carried out under optimum conditions proceeded
for 210 minutes (3.5 hours) to collect a suitable number of observations for this analysis. The goal
Figure 5.5. Observed (black circles) vs. predicted (white circles) values for MO
removal at optimal experimental parameters, as determined by the PLS model. The
range of other experimental tests is shown for comparison.

M.A.Sc. Thesis | Alexander Sutherland McMaster University | Chemical Engineering
67
of this model was to predict timeseries data beyond those experimentally measured to determine
the amount of time required to completely degrade the MO batch. Figure 5.6 shows an observed
vs. predicted plot used to validate the performance of the ARPLS model. This figure compares
predictions made for time increments between and including 150-210 minutes to experimental data
at those same times.
The trajectory of the observed values is steeper than those predicted by the ARPLS model,
thus the two series diverge overtime. As expected with an auto-regressive method, the accuracy of
the prediction decreases with each successive time step, as each prediction adds to the cumulative
error of all those before it.
1.00E-02
1.05E-02
1.10E-02
1.15E-02
1.20E-02
1.25E-02
1.30E-02
150 160 170 180 190 200 210 220
MO
Rem
ova
l (m
Mo
les)
Elapsed Time (minutes)
Figure 5.6. An observed (black circles) vs. predicted (white circles) plot used to validate
the accuracy of the ARPLS model created on the optimum RO removal timeseries data.

M.A.Sc. Thesis | Alexander Sutherland McMaster University | Chemical Engineering
68
Figure 5.7 shows the application of the ARPLS model to predict MO removal for ten time-
increments from 210 minutes to 310 minutes, as well as the experimental observations preceding
those predictions.
From Figure 5.7, the values predicted using the ARPLS model appear to match the
trajectory of the data, with relatively small error as indicated by the prediction intervals. However,
the error in the model predictions compounds with every time step. Upper and lower conservative
estimates of this compounded error are shown by the red bars on Figure 5.7. Thus, this model
0
0.005
0.01
0.015
0.02
0.025
0 50 100 150 200 250 300 350
Mo
les
Rem
ove
d (
mM
ole
s)
Elapsed Time (minutes)
Figure 5.7. A timeseries plot of observed experimental values (black circles) for MO removal
using optimal parameters, extended using predictions made by the ARPLS model (white circles).
Error bars on the predictions come from 95% prediction intervals, and the red represent the
cumulative prediction intervals.

M.A.Sc. Thesis | Alexander Sutherland McMaster University | Chemical Engineering
69
succeeds in making accurate predictions approximately 30 to 50 minutes into the future but would
likely fail in accurately predicting the time required to remove all the MO from the system due to
the compounding error added with each prediction.
5.4 Conclusions and Future Work
In this study a PLSR model was used to examine the effects of experimental parameters on
the removal of methyl orange from a batch system with electro-catalytic nZVI-CNT surface
composite membranes. In order of decreasing importance, initial batch concentration, negative
applied voltage, mass of CNTs forming the thin film network, and the mass of nZVI embedded in
the network were all found to be positively correlated with MO removal. Conversely, electrode
spacing, surfactant ratio, and batch size were all found to be anti-correlated with MO removal. A
constrained optimization to maximize MO removal was successfully implemented and predictions
were validated with experimental results. The MO removal operating at these optimal conditions
was found to be 255% greater than the next highest performing observation within the feasible set.
Finally, experimental data for MO removal using the optimal parameters over a 3.5-hour period
was modelled with ARPLS. The model proved accurate enough to predict MO removal 30 to 50
minutes into the future beyond experimentally collected data.

M.A.Sc. Thesis | Alexander Sutherland McMaster University | Chemical Engineering
70
Chapter 6
Conclusions and Future Work
6.1 Conclusions
The focus of this project was to develop permeable, electrically conductive,
electrochemically reactive membrane surface composites capable of facilitating the enhanced
electro-catalytic degradation of azo dyes in solution. SEM and TEM images have shown that nZVI
can be grown and stabilized in a network of functionalized CNTs. ICP-OES and 4-point probe
conductivity tests results confirm that this network can be filter deposited into a conductive thin
film on the surface of a polymeric support membrane without the loss of iron. The results of batch
system tests indicate a synergistic enhancement of dye removal is achieved by adding nZVI and a
negative voltage to the membrane surface composite, as compared to controls. This enhanced dye
removal could be caused by electro-catalytic reactivity supplied by nZVI reactivity regenerated
through the application negative cathodic voltages. It is also possible that the enhanced reactivity
of the solution is caused by electro-Fenton chemistry, however, such an effect would be more
significant at pH values lower than the neutral pH at which these tests were conducted.
A statistical analysis of batch system test results using a PLSR model constructed with two
components showed that the following parameters were positively correlated with increased MO
removal in order of decreasing importance: initial batch concentration, applied negative voltage,
mass of CNTs composing the surface composite thin film, and mass of iron embedded in the
surface composite thin film. Conversely, the model found the following parameters (in order of
decreasing importance) to be anti-correlated with batch removal: batch size, surfactant ratio, and
electrode spacing. An optimization of these batch system parameters yielded a timeseries of

M.A.Sc. Thesis | Alexander Sutherland McMaster University | Chemical Engineering
71
expected removal results 255% higher (after 60 minutes) than any of the experiments with
parameters in the feasible set formed by the constraints specified in the optimization formulation.
The model and its optimization result were validated by conducting a batch test using the optimal
set of experimental parameters. The observed timeseries results of this experiment closely matched
those predicted by the model at the optimum, with a maximum deviation of ~14.3% between any
pair of values in the observed vs. predicted timeseries.
nZVI-CNT membranes with 4 mg of surface composite mass were employed to remove
MO in a continuous system utilizing an electrochemical dead-end flow cell. Approximately 87
mole % removal of MO was achieved in the permeate of systems operating at 40 psi with -2 V
voltage applied to the nZVI-CNT surface composite cathode opposite a graphite anode. The
average rate of permeate flux across the nZVI-CNT surface composite membrane at 40 psi was
422 ± 93.2 L/m2h. While nZVI-CNT surface composite systems achieved similar MO permeate
concentrations to those using CNT membrane composites with no nZVI, the transmembrane flux
at 40 psi through the former system type was on average ~1.7 times greater than those achieved
by the latter. As such, nZVI-CNT surface composite cathode systems at 40 psi and -2 V removed
MO at a rate ~1.6 times greater than those using CNT surface composite cathodes.
It was observed that a step change of 0 to -2 V applied to a continuous system using an
nZVI-CNT cathode approximately doubled the transmembrane flux (from 94.1 ± 4.00 L/m2h to
199 ± 5.81 L/m2h). Based on relevant theory [131], [138] and the results of contact angle
experiments showing increased wetting of MO with a 2 V applied voltage to an nZVI-CNT
membrane surface composite, it is likely that this observed increase in flux is due to electro-
wetting.

M.A.Sc. Thesis | Alexander Sutherland McMaster University | Chemical Engineering
72
The results of a design of experiments varying the concentration of the MO feed and the
feed pressure in a continuous dead-end electrochemical system using nZVI-CNT cathodes with -
2 V applied confirmed that a compromise exists between throughput (transmembrane flux) and
effluent quality (decrease in MO permeate concentration). Increasing the MO feed pressure
resulted in higher fluxes, but at the expense of relatively increased MO permeate concentrations.
Conversely, lower MO feed pressures result in slightly lower MO permeate concentrations but
result in a much lower transmembrane flux through the system. Contrary to the results of the batch
system modelling discussed in Section 5.3.1 – which indicated that MO batch concentration had a
strong correlation with MO removal over time – the concentration of the MO feed to the
electrochemical continuous tests had an insignificant effect on MO permeate concentration. Flux
was similarly unaffected by MO feed concentration. Since direct reduction of MO at the surface
composite cathode is primarily responsible for its removal from the system, it is likely that this
discrepancy in the importance of MO feed concentration to the batch and continuous systems can
be explained by the differences in the mass transfer of MO to the cathode. In the batch system,
MO dye comes into contact with the cathode through solution diffusion and convective mass
transfer driven by stirring, both of which are directly proportional to dye concentration [9]. In the
continuous system, however, the pressure applied to the feed drives the mass transfer of MO to the
cathode’s surface, and therefore the role of concentration in encouraging MO diffusion to the
cathode is less important.
Finally, comparing the average removal rate of the continuous system to the maximum
(instantaneous) removal rate of the batch system, it is apparent that the former removes MO feed
2.7 times faster. Furthermore, the continuous system demonstrates higher throughput than the
batch system. A continuous system operating at 40 psi using an nZVI-CNT cathode with -2 V

M.A.Sc. Thesis | Alexander Sutherland McMaster University | Chemical Engineering
73
applied can remediate a 30 mL 0.25 mM MO feed by 87 mole % in 10-20 minutes, while a batch
system with identical specifications (excluding the applied pressure) achieves that same molar
removal within approximately 90 minutes (1.5 hours).
6.2 Future Work and Recommendations
Further studies and experiments are required to understand the adsorptive capacities of the
membrane surface composites and distinguish the effects of adsorption and degradation on MO
removal. This can be accomplished by conducting multiple batch tests using nZVI-CNT surface
composite membranes without a graphite electrode or an applied voltage, in which the steady state
removal of MO at various concentrations is determined to construct an adsorption isotherm.
A variety of experiments could be conducted to further analyze the performance of nZVI-
CNT surface composites in a continuous system. The PLSR model for the batch system discussed
in Chapter 5 indicates that the more negative voltages applied to the cathode result in increased
MO removal. Continuous removal experiments at varying potentials would yield a greater
understanding of the relationship between MO removal and increasingly greater magnitudes of
applied negative voltage. If there are diminishing returns on MO removal at increasingly negative
potentials, these experiments could serve in determining an optimal operating voltage.
Furthermore, since various potentials will have different effects on electrochemical MO
degradation through direct reduction at the CNT cathode, regeneration of nZVI, and ROS
generation, a larger range of voltages will help to examine how these mechanisms contribute to
MO Removal. In these experiments, the flow cell would ideally be retrofit with a dissolved oxygen
probe to continuously monitor the concentration of ROS in solution and its contribution to MO
degradation.

M.A.Sc. Thesis | Alexander Sutherland McMaster University | Chemical Engineering
74
Additionally, experiments with multiple dead-end flow cells in series with different feed
concentration would help to better understand the capabilities and kinetics of MO degradation in
a continuous system. This could be accomplished by using permeate from one continuous removal
test as the feed for a second test using the same cell but cleaned and with a different nZVI-CNT
surface composite membrane.
While the decolourization of MO indicates its degradation, the substituents of that reaction
must still be considered if this technology is to ever be used on a larger scale. Thus, tests analyzing
the total organic carbon present in permeate samples should be completed in subsequent
continuous removal tests to determine whether or not this technology can meet environmental
standards of chemical oxygen demand (COD).
If this technology is developed and optimized further, the nZVI-CNT composite membrane
system discussed in this thesis would be best utilized in textile industry outlets and pump-and-treat
processes for azo dyes and COCs respectively. Textile industry effluents typically possess azo
dyes in concentrations between 50 and 100 ppm and have few other constituents [134]. Thus nZVI-
CNT membrane modules could be easily retrofitted on the tail end of existing textile industry
plants. This technology also shows promise for treating contaminated groundwaters, since pump-
and-treat methods are an attractive pathway for remediating chlorinated solvents due to their
relatively low retardation rate in water. For instance, the retardation rate of TCE is ~2, meaning
that TCE migrates through aquifers at similar speeds to water (half speed since retardation rate =
2) and can therefore be removed from aquifers efficiently with pumping [1]. These advantages
form a basis for how this technology might prove successful in treating these contaminants
industrially in the future.

M.A.Sc. Thesis | Alexander Sutherland McMaster University | Chemical Engineering
75
Appendix A: Supporting Information
Repeated batch system experiments using nZVI-CNT Surface Composite Cathodes
In the series of batch system experiments using nZVI-CNT surface composite membranes
at -2 V (discussed in Chapter 3), one of the membrane samples was used in a second test with
identical parameters. This test was carried out to briefly examine whether repeatable values of MO
batch removal could be achieved using the same nZVI-CNT membrane, anode, and applied
voltage. The results of these two tests are displayed below in Figure S.2.
0
0.05
0.1
0.15
0.2
0.25
0.3
0 0.5 1 1.5 2 2.5 3 3.5
Co
nce
ntr
atio
n (
mM
)
Absorbance at 464nm
Figure S.1. A calibration curve generated for correlating absorbance of
methyl orange samples at 464 nm to concentration (mM). The points
represent stock solutions measured, while the line represents the result of a
quadratic model determined with regression: 𝑦 = 0.0075𝑥2 + 0.056𝑥.

M.A.Sc. Thesis | Alexander Sutherland McMaster University | Chemical Engineering
76
The results shown in Figure S.2 suggest that the system in the second test is operating at a
slightly reduced removal rate compared to the first experimental test. This slightly reduced
performance could indicate that in successive runs of the batch removal system, sites for adsorption
and reaction on the nZVI-CNT cathode are occupied by the products of the MO degradation
reaction. However, given the size of the 95% confidence interval error bars in the data of the
identical nZVI-CNT (-2 V) system shown in Figure 3.5, it is likely that the two series observed in
Figure S.2 are within error of one another. Therefore, no definitive statistically significant claim
can be made. More experiments are required to ascertain whether this phenomenon is occurring,
and to thereby investigate how reusable this technology is.
0
0.05
0.1
0.15
0.2
0.25
0.3
0 20 40 60 80
Met
hyl
Ora
nge
Co
nce
ntr
atio
n (
mM
)
Elapsed Time (minutes)
Test #1
Test #2
Figure S.2. Batch system results for a first (light) and second (dark) test
run using an nZVI-CNT surface composite cathode and a graphite foil
anode at -2 V.

M.A.Sc. Thesis | Alexander Sutherland McMaster University | Chemical Engineering
77
Description of the custom continuous dead-end flow cell
The two-part cell is designed such that the top part screws down to clamp the membrane
atop a porous support with an O-ring. The purpose of this configuration is such that the area of the
membrane encompassed by the O-ring is exposed to the feed, while the area outside the O-ring is
contacted by two stainless steel electrodes. The stainless-steel electrodes protrude from the flow
cell, such that they can be attached to a voltage generator and conduct current to the surface of the
membrane surface composite within.
Note that while the nitrogen gas cylinder was effective in applying a given pressure to the
feed in the reservoir in which it was held, it is expected that the pressure of the flow just before
the membrane surface is significantly reduced. This is due to the major and minor losses in fluid
energy accrued through flow through system tubing, compressions and expansions in the flow
path, changes in flow direction, and the exiting of flow from the system piping and into the main
chamber of the dead end flow cell [144].
Measurement error in continuous experiments examining the effect of the mid-test
application of voltage
It is likely that the MO permeate concentration reached steady state more rapidly than the
data indicates. The results show that there is one sampling interval between the two steady states
with permeate demonstrating intermediate MO removal (~68%), but this is likely because
permeate leaving the membrane does not immediately exit the flow cell and into the permeate
beaker, as it must first pass through the porous support on which the membrane sits, and then
through a short channel. Thus, the value of mole % removed in the 30-40-minute interval reflects
a mixture of MO permeate pre and post application of -2V voltage.

M.A.Sc. Thesis | Alexander Sutherland McMaster University | Chemical Engineering
78
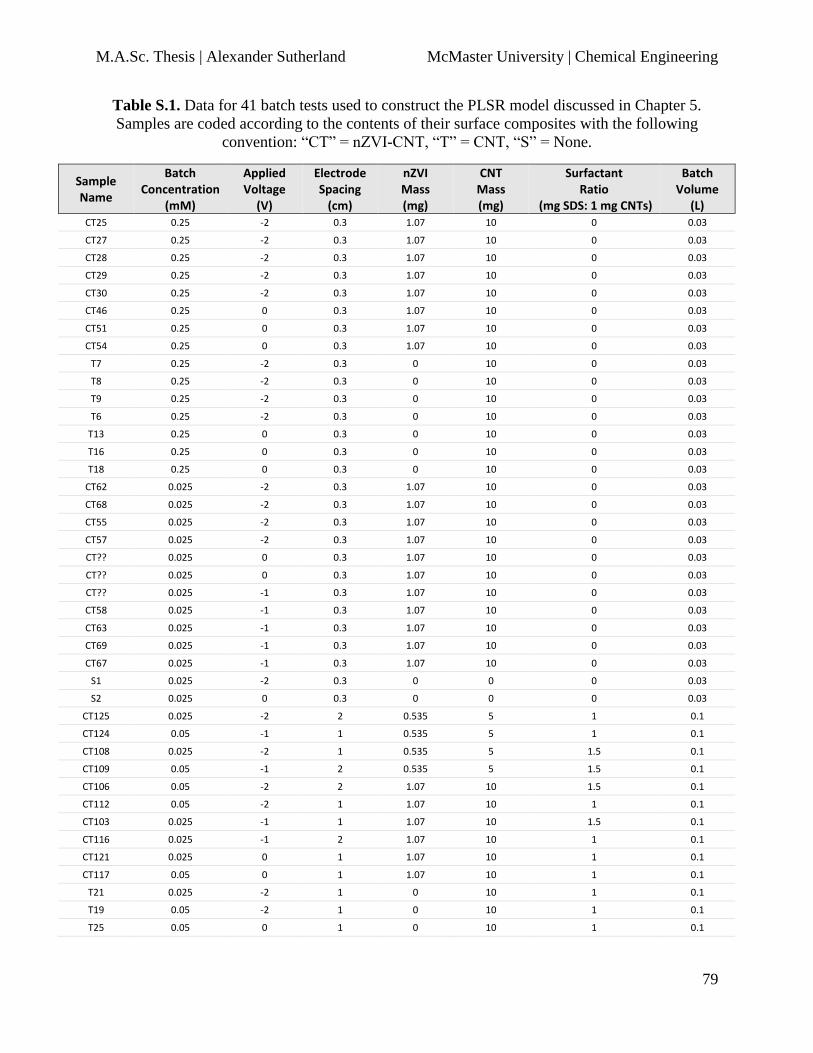
M.A.Sc. Thesis | Alexander Sutherland McMaster University | Chemical Engineering
79
Table S.1. Data for 41 batch tests used to construct the PLSR model discussed in Chapter 5.
Samples are coded according to the contents of their surface composites with the following
convention: “CT” = nZVI-CNT, “T” = CNT, “S” = None.
Sample Name
Batch Concentration
(mM)
Applied Voltage
(V)
Electrode Spacing
(cm)
nZVI Mass (mg)
CNT Mass (mg)
Surfactant Ratio
(mg SDS: 1 mg CNTs)
Batch Volume
(L) CT25 0.25 -2 0.3 1.07 10 0 0.03
CT27 0.25 -2 0.3 1.07 10 0 0.03
CT28 0.25 -2 0.3 1.07 10 0 0.03
CT29 0.25 -2 0.3 1.07 10 0 0.03
CT30 0.25 -2 0.3 1.07 10 0 0.03
CT46 0.25 0 0.3 1.07 10 0 0.03
CT51 0.25 0 0.3 1.07 10 0 0.03
CT54 0.25 0 0.3 1.07 10 0 0.03
T7 0.25 -2 0.3 0 10 0 0.03
T8 0.25 -2 0.3 0 10 0 0.03
T9 0.25 -2 0.3 0 10 0 0.03
T6 0.25 -2 0.3 0 10 0 0.03
T13 0.25 0 0.3 0 10 0 0.03
T16 0.25 0 0.3 0 10 0 0.03
T18 0.25 0 0.3 0 10 0 0.03
CT62 0.025 -2 0.3 1.07 10 0 0.03
CT68 0.025 -2 0.3 1.07 10 0 0.03
CT55 0.025 -2 0.3 1.07 10 0 0.03
CT57 0.025 -2 0.3 1.07 10 0 0.03
CT?? 0.025 0 0.3 1.07 10 0 0.03
CT?? 0.025 0 0.3 1.07 10 0 0.03
CT?? 0.025 -1 0.3 1.07 10 0 0.03
CT58 0.025 -1 0.3 1.07 10 0 0.03
CT63 0.025 -1 0.3 1.07 10 0 0.03
CT69 0.025 -1 0.3 1.07 10 0 0.03
CT67 0.025 -1 0.3 1.07 10 0 0.03
S1 0.025 -2 0.3 0 0 0 0.03
S2 0.025 0 0.3 0 0 0 0.03
CT125 0.025 -2 2 0.535 5 1 0.1
CT124 0.05 -1 1 0.535 5 1 0.1
CT108 0.025 -2 1 0.535 5 1.5 0.1
CT109 0.05 -1 2 0.535 5 1.5 0.1
CT106 0.05 -2 2 1.07 10 1.5 0.1
CT112 0.05 -2 1 1.07 10 1 0.1
CT103 0.025 -1 1 1.07 10 1.5 0.1
CT116 0.025 -1 2 1.07 10 1 0.1
CT121 0.025 0 1 1.07 10 1 0.1
CT117 0.05 0 1 1.07 10 1 0.1
T21 0.025 -2 1 0 10 1 0.1
T19 0.05 -2 1 0 10 1 0.1
T25 0.05 0 1 0 10 1 0.1

M.A.Sc. Thesis | Alexander Sutherland McMaster University | Chemical Engineering
80
Appendix B: References
[1] H. H. Russell, J. E. Matthews, and G. W. Sewell, “Ground Water Issue: TCE Removal from
Contaminated Soil and Ground Water,” pp. 1–10, 1992.
[2] R. D. Fox, “Physical / Chemical Treatment of Organically Contaminated Soils and
Sediments,” Air Waste Manag. Assoc., vol. 2247, 2012.
[3] H. Zollinger, Color Chemistry: Syntheses, Properties, and Applications of Organic Dyes
and Pigments, Second Edi. Wiley-VCH Weinheim, 1991.
[4] K. Chung, “The significance of azo-reduction in the mutagenesis and carcinogenesis of azo
dyes,” vol. 114, pp. 269–281, 1983.
[5] H. Mansour, R. Mosrati, D. Corroler, K. Ghedira, D. Barillier, and L. Chekir, “In vitro
mutagenicity of Acid Violet 7 and its degradation products by Pseudomonas putida mt-2 :
Correlation with chemical structures,” Environ. Toxicol. Pharmacol., vol. 27, no. 2009, pp.
231–236, 2009.
[6] E. Engel, R. Vasold, and M. Landthaler, “Azo Pigments and a Basal Cell Carcinoma at the
Thumb,” 2008.
[7] J. Quinn, C. Geiger, C. Clausen, and K. Brooks, “Field Demonstration of DNAPL
Dehalogenation Using Emulsified Zero-Valent Iron,” Environ. Sci. Technol., no. 519, pp.
1309–1318, 2005.
[8] V. K. Gupta, “Application of low-cost adsorbents for dye removal – A review,” J. Environ.
Manage., vol. 90, no. 8, pp. 2313–2342, 2009.
[9] C. J. Geankoplis, Transport Processes and Separation Process Principles, 4th ed. Prentice

M.A.Sc. Thesis | Alexander Sutherland McMaster University | Chemical Engineering
81
Hall PTR, 2011.
[10] J. a. Moulijn and A. Stankiewicz, “Process Intensification,” Chem. Eng. Prog., no. January,
pp. 22–34, 2000.
[11] F. J. Armellini et al., “Separations research needs for the 21st century,” Water Res., vol. 44,
no. 3, pp. 283–288, 1992.
[12] E. Drioli and E. Fontananova, “Membrane technology and sustainable growth,” Chem. Eng.
Res. Des., vol. 82, no. December, pp. 1557–1562, 2004.
[13] H. K. Lonsdale, “The Growth of Membrane Technology,” J. Memb. Sci., vol. 10, pp. 81–
181, 1982.
[14] W. Guo, H. Ngo, and J. Li, “Bioresource Technology A mini-review on membrane fouling,”
Bioresour. Technol., vol. 122, pp. 27–34, 2012.
[15] E. S. K. Chian and W. N. Bruce, “Removal of Pesticides by Reverse Osmosis,” Environ.
Sci. Technol., no. 6, pp. 52–59, 1971.
[16] C. A. Buckley, “Membrane Technology for the Treatment of Dyehouse Effluents,” Water
Sci. Technol., vol. 25, no. 10, pp. 203–209, 1992.
[17] D. De Jager, M. S. Sheldon, and W. Edwards, “Colour removal from textile wastewater
using a pilot-scale dual-stage MBR and subsequent RO system,” Sep. Purif. Technol., vol.
135, pp. 135–144, 2014.
[18] N. Al-bastaki, “Removal of methyl orange dye and Na 2 SO 4 salt from synthetic waste
water using reverse osmosis,” Chem. Eng. Process., vol. 43, pp. 1561–1567, 2004.
[19] C. Cripps, J. A. Bumpus, and S. D. Aust, “Biodegradation of Azo and Heterocyclic Dyes

M.A.Sc. Thesis | Alexander Sutherland McMaster University | Chemical Engineering
82
by Phanerochaete chrysosporium,” vol. 56, no. 4, pp. 1114–1118, 1990.
[20] T. Sale and C. Newell, “A Guide for Selecting Remedies for Subsurface Releases of
Chlorinated Solvents,” no. March. pp. 1–142, 2011.
[21] F. Obiri-Nyarko, S. J. Grajales-Mesa, and G. Malina, “An overview of permeable reactive
barriers for in situ sustainable groundwater remediation,” Chemosphere. 2014.
[22] L. Chen, S. Jin, P. H. Fallgren, N. G. Swoboda-Colberg, F. Liu, and P. J. S. Colberg,
“Electrochemical depassivation of zero-valent iron for trichloroethene reduction,” J.
Hazard. Mater., vol. 239–240, pp. 265–269, 2012.
[23] B. H. Kueper, H. F. Stroo, C. M. Vogel, and C. H. Ward, Chlorinated Solvent Source Zone
Remediation. 2014.
[24] X. Guan et al., “The limitations of applying zero-valent iron technology in contaminants
sequestration and the corresponding countermeasures: The development in zero-valent iron
technology in the last two decades (1994-2014),” Water Res., vol. 75, pp. 224–248, 2015.
[25] Y. Liu, T. Phenrat, and G. V. Lowry, “Effect of TCE concentration and dissolved
groundwater solutes on NZVI-promoted TCE dechlorination and H2 evolution,” Environ.
Sci. Technol., vol. 41, no. 22, pp. 7881–7887, 2007.
[26] F. Fu, D. D. Dionysiou, and H. Liu, “The use of zero-valent iron for groundwater
remediation and wastewater treatment: A review,” J. Hazard. Mater., vol. 267, pp. 194–
205, 2014.
[27] T. Phenrat, T. Thongboot, and G. V. Lowry, “Electromagnetic Induction of Zerovalent Iron
(ZVI) Powder and Nanoscale Zerovalent Iron (NZVI) Particles Enhances Dechlorination of
M.A.Sc. Thesis | Alexander Sutherland McMaster University | Chemical Engineering
83
Trichloroethylene in Contaminated Groundwater and Soil: Proof of Concept,” Environ. Sci.
Technol., vol. 50, no. 2, pp. 872–880, 2016.
[28] Z. Zongshan, L. I. U. Jingfu, T. A. I. Chao, Z. Qunfang, H. U. Jingtian, and J. Guibin,
“Rapid decolorization of water soluble azo-dyes by nanosized zero-valent iron immobilized
on the exchange resin,” Sci. China Ser. B Chem., vol. 51, no. 20537020, 2008.
[29] S. Nam and P. G. T. M, “Reduction of Azo Dyes with Zero-Valent Iron,” vol. 34, no. 6, pp.
1837–1845, 2000.
[30] I. Mcdonald et al., “Rusty old stars: a source of the missing interstellar iron?,” 2018.
[31] X. Lv et al., “Nanoscale Zero-Valent Iron (nZVI) assembled on magnetic Fe3O4/graphene
for Chromium (VI) removal from aqueous solution,” J. Colloid Interface Sci., vol. 417, pp.
51–59, 2014.
[32] X. Zhao, W. Liu, Z. Cai, B. Han, T. Qian, and D. Zhao, “An overview of preparation and
applications of stabilized zero-valent iron nanoparticles for soil and groundwater
remediation,” Water Res., vol. 100, pp. 245–266, 2016.
[33] W. Zhang, C. Wang, and H. Lien, “Treatment of chlorinated organic contaminants with
nanoscale bimetallic particles,” vol. 40, pp. 387–395, 1998.
[34] Y. Sun, J. Li, T. Huang, and X. Guan, “The influences of iron characteristics, operating
conditions and solution chemistry on contaminants removal by zero-valent iron: A review,”
Water Res., vol. 100, pp. 277–295, 2016.
[35] J. Fan, Y. Guo, J. Wang, and M. Fan, “Rapid decolorization of azo dye methyl orange in
aqueous solution by nanoscale zerovalent iron particles,” J. Hazard. Mater., vol. 166, pp.

M.A.Sc. Thesis | Alexander Sutherland McMaster University | Chemical Engineering
84
904–910, 2009.
[36] R. A. Crane and T. B. Scott, “Nanoscale zero-valent iron : Future prospects for an emerging
water treatment technology,” J. Hazard. Mater., vol. 211–212, pp. 112–125, 2012.
[37] Q. Wang, H. Qian, Y. Yang, Z. Zhang, C. Naman, and X. Xu, “Reduction of hexavalent
chromium by carboxymethyl cellulose-stabilized zero-valent iron nanoparticles,” J.
Contam. Hydrol., vol. 114, no. 1–4, pp. 35–42, 2010.
[38] N. C. Mueller et al., “Application of nanoscale zero valent iron (NZVI) for groundwater
remediation in Europe,” Environ. Sci. Pollut. Res., vol. 19, no. 2, pp. 550–558, 2012.
[39] C. F. de Lannoy, D. Jassby, D. D. Davis, and M. R. Wiesner, “A highly electrically
conductive polymer-multiwalled carbon nanotube nanocomposite membrane,” J. Memb.
Sci., vol. 415–416, pp. 718–724, 2012.
[40] M. Oner, O. Dogan, and G. Oner, “The influence of polyelectrolytes architecture on calcium
sulfate dihydrate growth retardation,” J. Cryst. Growth, vol. 186, pp. 427–437, 1998.
[41] K. H. Schoenbach, F. E. Peterkin, R. W. Alden, and S. J. Beebe, “The Effect of Pulsed
Electric Fields on Biological Cells : Experiments and Applications,” IEEE Trans. Plasma
Sci., vol. 25, no. 2, pp. 284–292, 1997.
[42] O. Paper, “Electrochemical prevention of marine biofouling on a novel titanium-nitride-
coated plate formed by radio-frequency arc spraying,” Appl. Microbiol Biotechnol, pp. 502–
509, 1998.
[43] S. Shim, S. H. Hong, Y. Tak, and J. Yoon, “Prevention of Pseudomonas aeruginosa
adhesion by electric currents,” Biofouling, vol. 7014, 2011.

M.A.Sc. Thesis | Alexander Sutherland McMaster University | Chemical Engineering
85
[44] U. R. Farooqui, A. L. Ahmad, and N. A. Hamid, “Graphene oxide : A promising membrane
material for fuel cells,” Renew. Sustain. Energy Rev., vol. 82, no. July 2017, pp. 714–733,
2018.
[45] F. Perreault, A. Fonseca de Faria, and M. Elimelech, “Environmental applications of
graphene-based nanomaterials,” Chem. Soc. Rev., vol. 44, no. 16, pp. 5861–5896, 2015.
[46] Z. Li, L. Wang, L. Yuan, C. Xiao, L. Mei, and L. Zheng, “Efficient removal of uranium
from aqueous solution by zero-valent iron nanoparticle and its graphene composite,” J.
Hazard. Mater., vol. 290, pp. 26–33, 2015.
[47] H. Chen, Y. Cao, E. Wei, T. Gong, and Q. Xian, “Chemosphere Facile synthesis of graphene
nano zero-valent iron composites and their ef fi cient removal of trichloronitromethane from
drinking water,” Chemosphere, vol. 146, pp. 32–39, 2016.
[48] P. Geladi, “Notes on the History and Nature of Partial Least Squares (PLS) Modelling,” vol.
2, no. October 1987, pp. 231–246, 1988.
[49] A. Moores and M. Kauhsik, “Review - nanocellulose as versatile supports for metal
nanoparticles and their applications in catalysis,” Green Chem., pp. 622–637, 2016.
[50] T. Pradeep, “Noble metal nanoparticles for water purification : A critical review,” Thin
Solid Films, vol. 517, no. 24, pp. 6441–6478, 2009.
[51] S. Y. Yang, C. D. Vecitis, and H. Park, “Electrocatalytic water treatment using carbon
nanotube filters modified with metal oxides,” Environ. Sci. Pollut. Res., pp. 1–8, 2017.
[52] C. D. Vecitis, G. Gao, and H. Liu, “Electrochemical carbon nanotube filter for adsorption,
desorption, and oxidation of aqueous dyes and anions,” J. Phys. Chem. C, vol. 115, no. 9,

M.A.Sc. Thesis | Alexander Sutherland McMaster University | Chemical Engineering
86
pp. 3621–3629, 2011.
[53] B. Huang, C. Lei, C. Wei, and G. Zeng, “Chlorinated volatile organic compounds ( Cl-
VOCs ) in environment — sources , potential human health impacts , and current
remediation technologies,” Environ. Int., vol. 71, pp. 118–138, 2014.
[54] R. Sengupta et al., “A Short Review on Rubber / Clay Nanocomposites With Emphasis on
Mechanical Properties,” Engineering, vol. 47, pp. 21–25, 2007.
[55] P. K. Tandon, R. C. Shukla, and S. B. Singh, “Removal of Arsenic ( III ) from Water with
Clay-Supported Zerovalent Iron Nanoparticles Synthesized with the Help of Tea Liquor,”
no. Iii, 2013.
[56] A. D. Towns, “Developments in azo disperse dyes derived from heterocyclic diazo
components,” vol. 42, 1999.
[57] A. Tilche and D. Orhon, “Appropriate basis of effluent standards for industrial
wastewaters,” Water Sci. Technol., vol. 45, no. 12, pp. 1–12, 2002.
[58] S. N. Petrova, M. V. Volodarskii, S. V. Makarov, and L. Z. Li, “Oxidation of Azo Dyes
with Inorganic Peroxides in the Presence of Cationic Surfaces,” Russ. J. Appl. Chem., vol.
81, no. 9, pp. 1573–1577, 2008.
[59] T. Robinson, G. Mcmullan, R. Marchant, and P. Nigam, “Remediation of dyes in textile
effluent : a critical review on current treatment technologies with a proposed alternative,”
Bioresour. Technol., vol. 77, pp. 247–255, 2001.
[60] E. Brillas and C. A. Martinez-Huitle, “Applied Catalysis B : Environmental
Decontamination of wastewaters containing synthetic organic dyes by electrochemical

M.A.Sc. Thesis | Alexander Sutherland McMaster University | Chemical Engineering
87
methods : A general review,” Appl. Catal. B Environ., vol. 87, pp. 105–145, 2009.
[61] I. M. Banat, P. Nigam, D. Singh, and R. Marchant, “Microbial Decolorization of Textile-
Dye Containing Effluents: A Review,” vol. 58, no. 1996, pp. 217–227, 1997.
[62] W. Chou, C. Wang, and C. Chang, “Comparison of removal of Acid Orange 7 by
electrooxidation using various anode materials,” Desalination, vol. 266, no. 1–3, pp. 201–
207, 2011.
[63] E. Guivarch, S. Trevin, and C. Lahitte, “Degradation of azo dyes in water by Electro-Fenton
process,” Env. Chem Lett, pp. 38–44, 2003.
[64] V. Perazzolo, C. Durante, and A. Gennaro, “Nitrogen and sulfur doped mesoporous carbon
cathodes for water treatment,” J. Electroanal. Chem., vol. 782, pp. 264–269, 2016.
[65] D. Pant, A. Singh, G. Van Bogaert, I. Olsen, and S. Nigam, “Bioelectrochemical systems (
BES ) for sustainable energy production and product recovery from organic wastes and
industrial wastewaters,” RSC Adv., pp. 1248–1263, 2012.
[66] K. C. L. N. Rao, K. Krishnaiah, and Ashutosh, “Colour Removal from a Dyestuff Industry
Effluent Using Activated Carbon,” Indian J. Chem. Technol., no. January, pp. 13–19, 1994.
[67] D. González, J. Amigo, and F. Suárez, “Membrane distillation : Perspectives for sustainable
and improved desalination,” Renew. Sustain. Energy Rev., vol. 80, no. April 2016, pp. 238–
259, 2017.
[68] N. Voutchkov, “Energy use for membrane seawater desalination – current status and
trends,” Desalination, vol. 431, no. October 2017, pp. 2–14, 2018.
[69] A. W. Mohammad and C. Y. Ng, “Ultrafiltration in Food Processing Industry : Review on

M.A.Sc. Thesis | Alexander Sutherland McMaster University | Chemical Engineering
88
Application , Membrane Fouling , and Fouling Control,” Food Bioprocess Technol, pp.
1143–1156, 2012.
[70] A. Deshmukh et al., “Environmental Science Membrane distillation at the water-energy
nexus : limits , opportunities , and challenges,” Energy Environ. Sci., vol. 11, pp. 1177–
1196, 2018.
[71] B. Van Der Bruggen, C. Vandecasteele, T. Van Gestel, W. Doyenb, and R. Leysenb,
“Review of Pressure-Driven Membrane Processes,” Environ. Prog., vol. 22, no. 1, pp. 46–
56, 2003.
[72] M. Rezakazemi and A. Ebadi, “Progress in Polymer Science State-of-the-art membrane
based CO 2 separation using mixed matrix membranes ( MMMs ): An overview on current
status and future directions,” Prog. Polym. Sci., vol. 39, no. 5, pp. 817–861, 2014.
[73] W. Gao et al., “Membrane fouling control in ultra fi ltration technology for drinking water
production : A review,” Desalination, vol. 272, no. 1–3, pp. 1–8, 2011.
[74] “Rosmosis Ltd.,” 2009. [Online]. Available:
http://www.rosmosis.com/page.aspx?page_id=78.
[75] Y. Tanaka, S. Moon, V. V Nikonenko, and T. Xu, “Ion-Exchange Membranes,” Int. J.
Chem. Eng., vol. 2012, 2012.
[76] B. Singh, V. Kochkodan, R. Hashaikeh, and N. Hilal, “A review on membrane fabrication :
Structure , properties and performance relationship,” Desalination, vol. 326, pp. 77–95,
2013.
[77] M. Elimelech, “Organic Fouling and Chemical Cleaning of Nanofiltration Membranes :

M.A.Sc. Thesis | Alexander Sutherland McMaster University | Chemical Engineering
89
Measurements and Mechanisms,” Environ. Sci. Technol., vol. 38, no. 17, pp. 4683–4693,
2004.
[78] P. Watnick, “MINIREVIEW Biofilm , City of Microbes,” J. Bacteriol., vol. 182, no. 10,
pp. 2675–2679, 2000.
[79] R. M. Donlan, “Biofilms: Microbial Life on Surfaces,” Emerg. Infect. Dis., vol. 8, no. 9, pp.
881–890, 2002.
[80] N. Hilal et al., “Methods Employed for Control of Fouling in MF and UF Membranes : A
Comprehensive Review,” Sep. Sci. Technol., vol. 6395, 2007.
[81] G. Amy, “Fundamental understanding of organic matter fouling of membranes,”
Desalination, vol. 231, pp. 44–51, 2008.
[82] R. D. Cohen and R. F. Probstein, “Colloidal Fouling of Reverse Osmosis Membranes,” J.
Colloid Interface Sci., vol. 114, no. 1, pp. 194–207, 1986.
[83] G. B. T, R. H. Davis, and A. L. Zydney, “The behavior of suspensions and macromolecular
solutions in crossflow microfiltration,” J. Memb. Sci., vol. 96, pp. 1–58, 1994.
[84] E. S. P. B. V, M. Bruslovsky, and J. Borden, “Flux decline due to gypsum precipitation on
RO membranes,” Desalination, vol. 86, pp. 187–222, 1992.
[85] C. Tzotzi, T. Pahiadaki, S. G. Yiantsios, A. J. Karabelas, and N. Andritsos, “A study of
CaCO 3 scale formation and inhibition in RO and NF membrane processes,” J. Memb. Sci.,
vol. 296, pp. 171–184, 2007.
[86] R. Klaassen, P. H. M. Feron, and A. E. Jansen, “Membrane Contactors in Industrial
Applications,” Chem. Eng. Res. Des., vol. 83, no. March, pp. 234–246, 2005.

M.A.Sc. Thesis | Alexander Sutherland McMaster University | Chemical Engineering
90
[87] R. Klaassen and A. E. Jansen, “The Membrane Contactor : Environmental Applications and
Possibilities,” Environ. Prog., vol. 20, no. 1, pp. 37–43, 2001.
[88] S. Schlosser, “Separation of mixtures by pertraction or membrane based solvent extraction
and new extractants,” no. January 2009, 2014.
[89] S. Mozia, M. Tomaszewska, and A. W. Morawski, “Photocatalytic membrane reactor (
PMR ) coupling photocatalysis and membrane distillation — Effectiveness of removal of
three azo dyes from water,” Catal. Today, vol. 129, pp. 3–8, 2007.
[90] S. Mozia, M. Tomaszewska, and A. W. Morawski, “A new photocatalytic membrane reactor
( PMR ) for removal of azo-dye Acid Red 18 from water,” Appl. Catal. B Environ., vol. 59,
pp. 131–137, 2005.
[91] E. Alventosa-deLara, S. Barredo-Damas, M. I. Alcaina-Miranda, and M. I. Iborra-Clar,
“Ultrafiltration technology with a ceramic membrane for reactive dye removal :
Optimization of membrane performance,” J. Hazard. Mater., vol. 209–210, pp. 492–500,
2012.
[92] F. Ibney, K. Yamamoto, F. Nakajima, and K. Fukushi, “Removal of structurally different
dyes in submerged membrane fungi reactor — Biosorption / PAC-adsorption , membrane
retention and biodegradation,” J. Memb. Sci., vol. 325, pp. 395–403, 2008.
[93] A. Ronen, W. Duan, I. Wheeldon, S. Walker, and D. Jassby, “Microbial Attachment
Inhibition through Low-Voltage Electrochemical Reactions on Electrically Conducting
Membranes,” Environ. Sci. Technol., 2015.
[94] C. F. De Lannoy, D. Jassby, K. Gloe, A. D. Gordon, and M. R. Wiesner, “Aquatic biofouling

M.A.Sc. Thesis | Alexander Sutherland McMaster University | Chemical Engineering
91
prevention by electrically charged nanocomposite polymer thin film membranes,” Environ.
Sci. Technol., vol. 47, no. 6, pp. 2760–2768, 2013.
[95] B. P. Chaplin, “Critical Review of Electrochemical Advanced Oxidation Processes for
Water Treatment Applications,” Environ. Sci. Process Impacts, pp. 1–23, 2012.
[96] E. S. P. B. V, S. Avlonitis, and T. Hodgkiess, “Chlorine Degradation of Aromatic
Polyamides,” Desalination, vol. 5, no. 85, pp. 321–334, 1992.
[97] C. D. Vecitis, “Electrochemical Carbon Nanotube Filter Oxidative Performance as a
Function of Surface Chemistry Electrochemical Carbon Nanotube Filter Oxidative
Performance as a Function of Surface Chemistry,” Environ. Sci. Technol., pp. 9726–9734,
2011.
[98] W. Duan, G. Chen, C. Chen, R. Sanghvi, A. Iddya, and S. Walker, “Electrochemical
removal of hexavalent chromium using electrically conducting carbon nanotube / polymer
composite ultra filtration membranes,” J. Memb. Sci., vol. 531, no. March, pp. 160–171,
2017.
[99] L. C. Venema, J. W. G. Wildo, and C. Dekker, “Electronic structure of atomically resolved
carbon nanotubes ¨,” Nature, vol. 584, no. 10, pp. 1996–1999, 1998.
[100] Y. Liu and G. V. Lowry, “Effect of particle age (Fe0 content) and solution pH on NZVI
reactivity: H2 evolution and TCE dechlorination,” Environ. Sci. Technol., vol. 40, no. 19,
pp. 6085–6090, 2006.
[101] L. Yong, A. Wahab, C. Peng, and N. Hilal, “Polymeric membranes incorporated with metal
/ metal oxide nanoparticles : A comprehensive review Polymeric membranes incorporated

M.A.Sc. Thesis | Alexander Sutherland McMaster University | Chemical Engineering
92
with metal / metal oxide nanoparticles : A comprehensive review,” Desalination, vol. 308,
no. January, pp. 15–33, 2010.
[102] R. Mukherjee, R. Kumar, A. Sinha, Y. Lama, and A. Krishna, “Technology A review on
synthesis , characterization , and applications of nano zero valent iron ( nZVI ) for
environmental remediation,” Crit. Rev. Environ. Sci. Technol., vol. 46, no. 5, pp. 443–466,
2016.
[103] S. Li, W. Yan, and W. Zhang, “Solvent-free production of nanoscale zero-valent iron ( nZVI
) with precision milling,” Green Chem., pp. 1618–1626, 2009.
[104] F. He and D. Zhao, “Manipulating the Size and Dispersibility of Zerovalent Iron
Nanoparticles by Use of Carboxymethyl Cellulose Stabilizers,” Environ. Sci. Technol., vol.
41, no. 17, pp. 6216–6221, 2007.
[105] N. T. K. Thanh, N. Maclean, and S. Mahiddine, “Mechanisms of Nucleation and Growth of
Nanoparticles in Solution,” Chem. Rev., vol. 3, no. 1, 2014.
[106] P. Kanuparthi, Phytotoxicity of Nanoparticles, no. June 2018. 2019.
[107] T. Phenrat and N. Saleh, “Aggregation and Sedimentation of Aqueous Nanoscale
Zerovalent Iron Dispersions,” Environ. Sci. Technol., vol. 41, no. 1, pp. 284–290, 2007.
[108] F. He, D. Zhao, J. Liu, and C. B. Roberts, “Stabilization of Fe - Pd Nanoparticles with
Sodium Carboxymethyl Cellulose for Enhanced Transport and Dechlorination of
Trichloroethylene in Soil and Groundwater,” Ind. Eng. Chem. Res., vol. 46, pp. 29–34,
2007.
[109] B. Chisholm, “Polymer modified iron nanoparticles for environmental remediation,”

M.A.Sc. Thesis | Alexander Sutherland McMaster University | Chemical Engineering
93
Polym. Prepr., no. January 2008, pp. 3–5, 2015.
[110] A. Tiraferri and Æ. R. Sethi, “Enhanced transport of zerovalent iron nanoparticles in
saturated porous media by guar gum,” J. Nanoparticle Res., pp. 635–645, 2009.
[111] A. Tiraferri, K. Loon, R. Sethi, and M. Elimelech, “Journal of Colloid and Interface Science
Reduced aggregation and sedimentation of zero-valent iron nanoparticles in the presence of
guar gum,” J. Colloid Interface Sci., vol. 324, pp. 71–79, 2008.
[112] N. Saleh et al., “Adsorbed Triblock Copolymers Deliver Reactive Iron Nanoparticles to the
Oil / Water Interface,” Nano Lett., vol. 5, no. 12, pp. 2489–2494, 2005.
[113] A. N. Bezbaruah, S. Krajangpan, B. J. Chisholm, E. Khan, and J. J. Elorza, “Entrapment of
iron nanoparticles in calcium alginate beads for groundwater remediation applications,” J.
Hazard. Mater., vol. 166, pp. 1339–1343, 2009.
[114] N. Saleh et al., “Surface Modifications Enhance Nanoiron Transport and NAPL Targeting
in Saturated Porous Media,” Environ. Eng. Sci., vol. 24, no. 1, 2007.
[115] N. Saleh and H. Kim, “Ionic Strength and Composition Affect the Mobility of in Water-
Saturated Sand Columns,” Environ. Sci. Technol., pp. 3349–3355, 2008.
[116] S. Raj and K. Æ. Dhriti, “Transport of surface-modified iron nanoparticle in porous media
and application to arsenic ( III ) remediation,” J. Nanoparticle Res., pp. 725–735, 2007.
[117] B. W. Hydutsky, E. J. Mack, B. B. Beckerman, J. M. Skluzacek, and T. E. Mallouk,
“Optimization of Nano- and Microiron Transport through Sand Columns Using
Polyelectrolyte Mixtures,” Environ. Sci. Technol., vol. 41, no. 18, pp. 6418–6424, 2007.
[118] K. M. Sirk, N. B. Saleh, T. Phenrat, H. Kim, B. Dufour, and J. Ok, “Effect of Adsorbed

M.A.Sc. Thesis | Alexander Sutherland McMaster University | Chemical Engineering
94
Polyelectrolytes on Nanoscale Zero Valent Iron Particle Attachment to Soil Surface
Models,” Environ. Sci. Technol., vol. 43, no. 10, pp. 3803–3808, 2009.
[119] S. R. Kanel and H. Choi, “Transport characteristics of surface-modified nanoscale zero-
valent iron in porous media,” Water Sci. Technol., vol. 55, no. 1–2, pp. 157–162, 2007.
[120] B. Zhu and T. Lim, “Influences of Amphiphiles on Dechlorination of a Trichlorobenzene
by Nanoscale Pd / Fe : Adsorption , Reaction Kinetics , and Interfacial Interactions,”
Environ. Sci. Technol., vol. 42, no. 12, pp. 4513–4519, 2008.
[121] L. I. Xie and C. Shang, “Role of Humic Acid and Quinone Model Compounds in Bromate
Reduction by Zerovalent Iron,” Environ. Sci. Technol., vol. 39, no. 4, pp. 1092–1100, 2005.
[122] B. Zhu, T. Lim, and J. Feng, “with palladized nanoscale Fe 0 particles supported on chitosan
and silica,” Chemosphere, vol. 65, pp. 1137–1145, 2006.
[123] B. Geng, Z. Jin, T. Li, and X. Qi, “Chemosphere Kinetics of hexavalent chromium removal
from water by chitosan-Fe 0 nanoparticles,” Chemosphere, vol. 75, no. 6, pp. 825–830,
2009.
[124] H. C. Choi, M. Shim, S. Bangsaruntip, H. Dai, and S. U. V, “Spontaneous Reduction of
Metal Ions on the Sidewalls of Carbon Nanotubes,” pp. 9058–9059, 2002.
[125] B. Kim, W. M. Sigmund, and P. O. Box, “Functionalized Multiwall Carbon Nanotube /
Gold Nanoparticle Composites,” no. 17, pp. 8239–8242, 2004.
[126] J. Yang, X. Liu, L. Huang, and D. Sun, “Antibacterial Properties of Novel Bacterial
Cellulose Nanofiber,” Chinese J. Chem. Eng., vol. 21, no. 12, pp. 1419–1424, 2013.
[127] E. Petala, K. Dimos, A. Douvalis, T. Bakas, and J. Tucek, “Nanoscale zero-valent iron

M.A.Sc. Thesis | Alexander Sutherland McMaster University | Chemical Engineering
95
supported on mesoporous silica : Characterization and reactivity for Cr ( VI ) removal from
aqueous solution,” J. Hazard. Mater., vol. 261, pp. 295–306, 2013.
[128] X. Qiu, Z. Fang, B. Liang, F. Gu, and Z. Xu, “Degradation of decabromodiphenyl ether by
nano zero-valent iron immobilized in mesoporous silica microspheres,” J. Hazard. Mater.,
vol. 193, pp. 70–81, 2011.
[129] P. D. Mines et al., “Granular activated carbon with grafted nanoporous polymer enhances
nanoscale zero-valent iron impregnation and water contaminant removal,” Chem. Eng. J.,
vol. 339, no. January, pp. 22–31, 2018.
[130] H. Dong, J. Deng, Y. Xie, C. Zhang, and Z. Jiang, “Stabilization of nanoscale zero-valent
iron ( nZVI ) with modified biochar for Cr ( VI ) removal from aqueous solution,” J. Hazard.
Mater., vol. 332, pp. 79–86, 2017.
[131] J. Isrealachvili, Intermolecular and Surface Forces, Third. Elsevier, 2011.
[132] M. Zarei, A. R. Khataee, and M. Fathinia, “Electrochimica Acta Photoelectro-Fenton
combined with photocatalytic process for degradation of an azo dye using supported TiO 2
nanoparticles and carbon nanotube cathode : Neural network modeling,” Electrochim. Acta,
vol. 55, no. 24, pp. 7259–7265, 2010.
[133] M. A. Halali, “The Effect of Cross-Linkers on the Permeability of Electrically Conductive
Membranes,” Ind. Eng. Chem. Res., 2019.
[134] D. A. Y. M. Scholz, Textile dye wastewater characteristics and constituents of synthetic
effluents : a critical review, vol. 16, no. 2. Springer Berlin Heidelberg, 2018.
[135] G. Gao, Z. Qiaoying, and C. Vecitis, “CNT–PVDF composite flow-through electrode for

M.A.Sc. Thesis | Alexander Sutherland McMaster University | Chemical Engineering
96
single-pass sequential reduction–oxidation,” J. Mater. Chem. A, no. 2, pp. 6185–6190,
2014.
[136] A. Sweity, Y. Oren, Z. Ronen, and M. Herzberg, “The influence of antiscalants on
biofouling of RO membranes in seawater desalination,” Water Res., vol. 47, no. 10, pp.
3389–3398, 2013.
[137] T. E. Marlin, “Process Control,” 2007.
[138] F. Mugele and J.-Ch. Baret, “Electrowetting : from basics to applications,” J. Phys.
Condens. Matter, 2005.
[139] S. Wold and M. Sjostrom, “PLS-regression : a basic tool of chemometrics,” pp. 109–130,
2001.
[140] J. V Kresta, J. F. Macgregor, and T. E. Marlin, “Multivariate Statistical Monitoring of
Process Operating Performance,” vol. 69, 1991.
[141] C. Wikstrom, E. Johansson, A. Nordahl, S. Rannar, and M. Sandberg, “Multivariate process
and quality monitoring applied to an electrolysis process Part II . Multivariate time-series
analysis of lagged latent variables,” pp. 233–240, 1998.
[142] J. M. Campos-martin, G. Blanco-brieva, and J. L. G. Fierro, “Hydrogen Peroxide Synthesis :
An Outlook beyond the Anthraquinone Process Angewandte,” pp. 6962–6984, 2006.
[143] Y. Liu, Q. Fan, Y. Liu, and J. Wang, “Fenton-like oxidation of 4-chlorophenol using H 2 O
2 in situ generated by Zn-Fe-CNTs composite,” J. Environ. Manage., vol. 214, pp. 252–
260, 2018.
[144] P. J. Pritchard and J. W. Mitchell, Fox and McDonald’s Introduction to Fluid Mechanics,
M.A.Sc. Thesis | Alexander Sutherland McMaster University | Chemical Engineering
97
9th ed. Wiley & Sons, 2015.