synthesis, characterization and functionalization of ... · synthesis, characterization and...
TRANSCRIPT

SYNTHESIS, CHARACTERIZATION
AND FUNCTIONALIZATION OF
VERTICALLY ALIGNED CARBON
NANOTUBE ARRAYS
A DISSERTATION SUBMITTED TO
THE MATERIALS SCIENCE AND NANOTECHNOLOGY
PROGRAM OF THE GRADUATE SCHOOL OF ENGINEERING
AND SCIENCE
OF BILKENT UNIVERSITY
IN PARTIAL FULFILLMENT OF THE REQUIREMENTS
FOR THE DEGREE OF
DOCTOR OF PHILOSOPHY
By
Gökçe Küçükayan Doğu
December 2012

ii
I certify that I have read this thesis and that in my opinion it is fully adequate, in
scope and in quality, as a thesis for the degree of Doctor of Philosophy.
______________________________
Assist. Prof. Dr. Erman Bengü (Advisor)
I certify that I have read this thesis and that in my opinion it is fully adequate, in
scope and in quality, as a thesis for the degree of Doctor of Philosophy.
______________________________
Prof. Dr. Oğuz Gülseren
I certify that I have read this thesis and that in my opinion it is fully adequate, in
scope and in quality, as a thesis for the degree of Doctor of Philosophy.
______________________________
Assoc. Prof. Dr. Dönüş Tuncel

iii
I certify that I have read this thesis and that in my opinion it is fully adequate, in
scope and in quality, as a thesis for the degree of Doctor of Philosophy.
______________________________
Assoc. Prof. Dr. Hilmi Volkan Demir
I certify that I have read this thesis and that in my opinion it is fully adequate, in
scope and in quality, as a thesis for the degree of Doctor of Philosophy.
_____________________________
Assist. Prof. Dr. Göknur Cambaz Büke
Approved for the Graduate School of Engineering and Science:
______________________________
Prof. Dr. Levent Onural
Director of the Graduate School

iv
ABSTRACT
Synthesis, Characterization and Functionalization of
Vertically Aligned Carbon Nanotube Arrays
Gökçe Küçükayan Doğu
Ph.D. in Materials Science and Nanotechnology Graduate Program
Advisor: Assist. Prof. Dr. Erman Bengü
December, 2012
In the last decade, there has been an increased interest on carbon nanotubes
(CNTs) for various applications due to their unique structural, electronic,
mechanical and chemical properties. Synthesis of CNTs is no more a challenge
with the enhancements and diversity in production techniques. The remaining
challenges regarding CNTs for high-volume manufacturing and commercial
applications are related to the followings; firstly, gaining control over
orientation and density of CNTs during growth for building two and/or three
dimensional functional structures and secondly, modulating properties of these
structures through a facile route. With regards to these challenges, the growth
dynamics of vertically aligned carbon nanotubes (VA-CNTs) were investigated
in this thesis. The first part of this thesis explains synthesis of VA-CNTs

v
achieved through the use of a newly designed alcohol catalyzed chemical vapor
deposition system in detail. Various catalyst layers were used in the experiments
for understanding growth mechanism and thereby the effect of synthesis
parameters. The catalyst layers were deposited on SiO2 wafers through physical
vapor deposition techniques. The configuration of these catalyst layers were
engineered to tune the density and alignment of VA-CNTs by considering the
competing mechanism between the subsurface diffusion and migration of
catalyst particles. In addition, the annealing parameters were investigated for
synthesizing taller and aligned CNTs. The characterization of catalyst layers and
VA-CNTs were performed using analysis of Scanning Electron Microscopy,
Raman Spectroscopy, Atomic Force Microscopy, X-ray Photoelectron
Spectroscopy, Electron Energy Loss Spectroscopy, High Resolution
Transmission Electron Microscopy and Raman Spectroscopy.
In the second part, effect of synthesis parameters such as growth temperature
and pressure, carbon source type and concentration were examined to better
understand the growth dynamics of VA-CNTs. Physical and structural
transitions of CNTs were observed induced by the decomposition reaction
processes of various carbon sources at a related growth temperature. Growth
behavior of VA-CNTs was investigated under different carbon source
concentration and pressure to find an optimum growth range.

vi
The results indicated that while the synthesis method followed in this work is a
catalytic based process where the reaction kinetics has a profound influence on
the growth of VA-CNTs molecular diffusion mechanisms were found to be
playing a key role in determining the growth, size, orientation and structural
properties of VA-CNTs. Hence, an approach incorporating the kinetic and
diffusion related processes were followed for building an empirical model for
uncovering the dominant mechanisms responsible for the termination of growth
of VA-CNTs.
In the following sections of the thesis, the preliminary studies regarding Li
intercalation to VA-CNTs and cell growth on CNTs were performed for possible
future applications of two and three-dimensional structures based on CNTs. In
situ Li intercalation was studied during the growth of VA-CNTs which does not
require post processing for the intercalation mechanism as commonly performed
in the existing literature. Li intercalation in the CNTs was confirmed by using
X-ray Photoelectron Spectroscopy, Electron Energy Loss Spectroscopy and
Raman Spectroscopy following the changes induced by the charge transfer from
Li to the carbon lattice.
In the second application case, used of VA-CNTs were examined as a scaffold
for growing mesenchymal stem cells (MSCs). Surfaces covered with VA-CNTs
were patterned by using elasto-capillary mechanism to create suitable ‘nests’ for
MSCs to be anchored. The cell viability test was conducted on seeded MSCs on

vii
CNT nests and indicated no toxic effect of CNT nests when they were used as
scaffold. Furthermore, an aging effect of cells on adhesion was investigated.
As a conclusion, the work presented here demonstrated that control over
structural and surface properties of VA-CNTs could be attained by taking
advantage of a wide range of growth parameters such as temperature, pressure
and carbon source type. Hence, the two case studies examined in this study
demonstrated a path for aligned and denser CNTs synthesized with desired
properties using the learnings attained in the first part of the thesis to be used as
anode materials for Li ion batteries and as alternative scaffolds for tissue
engineering applications.
Keywords: vertically aligned carbon nanotubes, lithium intercalation, scaffold,
chemical vapor deposition, physical vapor deposition, growth mechanism,
application

viii
ÖZ
Dik Olarak Hizalanmış Karbon Nanotüplerin
Sentezlenmesi, Karakterizasyonu ve
İşlevselleştirilmesi
Gökçe Küçükayan Doğu
Ph.D. Malzeme Bilimi ve Nanoteknoloji Programı
Tez Yöneticisi: Yrd. Doç. Dr. Erman Bengü
Aralık, 2012
Son on yıllık süreçte, karbon nanotüplerin çeşitli uygulama alanlarındaki
kullanımı üzerine olan ilgi nanotüplerin eşsiz yapısal, elektriksel, mekaniksel ve
kimyasal özelliklerinden dolayı hızla artmıştır. Son zamanlarda çeşitlenen
karbon nanotüp üretim metotlarıyla artık bu yapıları üretmek zor değildir.
Önemli olan karbon nanotüplerin yüksek miktarda üretimini ve kitlesel
uygulamalardaki kullanımını yaygınlaştırmaktır. Bunları gerçekleştirmek ise
şunlara bağlıdır; fonksiyonel iki ve/veya üç boyutlu yapılar için yönlenmiş ve
uygun yoğunlukta karbon nanotüp büyütülmesinde kontrol sağlanması ve
yapısal özelliklerinin kolay bir şekilde değiştirilmesidir. Bu problemlerden yola
çıkarak tezde, dik olarak hizalanmış karbon nanotüplerin (VA-CNT) büyüme

ix
dinamiği incelenmiştir. Tezin ilk kısmı VA-CNT’ lerin yeni tasarlanan alkol
katalizörlü kimyasal buhar kaplama tekniği ile sentezlenmesini açıklamaktadır.
Büyüme mekanizmasını anlamak için yapılan deneylerde kullanılan katalizör
tabakaları fiziksel buhar kaplama metodu ile kaplanmıştır. VA-CNT’ lerin
yoğunluklarının ve yönlenmesinin ayarlanması yüzey altı difüzyon ile katalizör
parçacıklarının yüzeydeki göçü arasında rekabet eden mekanizmayı göz önüne
alarak katalizör tabakalarının farklı şekilde düzenlenmesi ile sağlanmıştır.
Ayrıca, katalizör tavlama parametreleri daha uzun ve daha iyi hizalanmış karbon
nanotüpler üretmek için incelenmiştir. Katalizör tabakalarının ve karbon
nanotüplerin karakterizasyonları taramalı Elektron Mikroskobu, Raman
Spektroskopisi, Atomik Kuvvet Mikroskobu, X-ışını Fotoeletron
Spektroskopisi, Elektron Enerjisi Kayıp Spektroskopisi, Yüksek Çözünürlüklü
Geçirgenli Elektron Mikroskobu kullanılarak gerçekleştirilmiştir.
İkinci kısımda, VA-CNT’ lerin büyüme mekanizmalarını daha iyi anlamak için
sentez sıcaklığı, sentez basıncı, karbon kaynağı tipi ve konsantrasyonu gibi
üretim parametrelerinin etkileri belirli değer aralıklarında incelenmiştir. İlgili
sıcaklıkta karbon kaynaklarının bozulma tepkimelerinin etkisiyle karbon
nanotüplerde fiziksel ve yapısal dönüşümler gözlenmiştir. Ayrıca, farklı
konsantrasyonlarda ve basınçlarda kullanılan karbon kaynağı ile sentezlenen
VA-CNT’ lerin uzunlukları kullanılarak en verimli karbon nanotüp üretme
aralığı bulunmuştur.

x
Tezde kullanılan sentez metodu reaksiyon kinetiğinin VA-CNT’ lerin
büyümesine etkisi olan katalitik temelli bir süreç olmasına rağmen moleküler
difüzyon büyüme mekanizması da VA-CNT’ lerin boyutlarında, yapılarında ve
hizalanmalarında önemli bir rol oynamaktadır. Bundan ötürü, karbon
nanotüplerin büyümesinin sonlanmasından sorumlu etkiyi bulmak için
kullanılan yaklaşımdaki hesaplamalarda kinetik ve difüzyon temelli süreçler göz
önüne alınmıştır.
Tezin takip eden bölümlerinde, karbon nanotüp temelli iki ve üç boyutlu
yapıların olası uygulama alanı için lityumun (Li) karbon nanotüp yapısında
araya ilave edilmesi ve karbon nanotüpler üzerinde hücre büyütülmesi üzerine
ön çalışma yapılmıştır. Li’ un karbon nanotüp yapısında araya ilave edilmesi
literatürde yaygın bir biçimde büyüme basamağından sonra ek işlemler ile
yapılırken, tezde Li’ un yapıya ilave edilmesi karbon nanotüplerin büyümesiyle
eş zamanlı olarak tek basamakta gerçekleştirilmiştir. Yapıya Li’ un ilave
edilmesi, X-ışını Fotoeletron Spektroskopisi, Elektron Enerjisi Kayıp
Spektroskopisi ve Raman Spektroskopisi kullanılarak teyit edilmiştir.
İkinci uygulama alanında VA-CNT’ ler mezenkimal kök hücrelerin
büyütülmesinde yapı iskelesi olarak incelenmiştir. Karbon nanotüplerle kaplı
yüzeyler “elasto-capillary” mekanizmasından faydalanarak hücrelerin
tutunabileceği karbon nanotüp yuvaları oluşturmak için şekillendirilmişlerdir.
Daha sonra hücrelerin yaşlanmasının yüzeylere yapışmaya olan etkisi
xi
incelenmiştir. Ayrıca, hücre yaşayabilme testi karbon nanotüp yuvalarının
üzerine ekilen hücrelerde gerçekleştirilmiş ve karbon nanotüplerin yapı iskelesi
olarak kullanıldığında hücrelerde herhangi bir zehirlenme etkisi görülmemiştir.
Sonuç olarak tezde kullanılan sıcaklık, basınç ve karbon kaynağı gibi çeşitli
sentez parametreleri ile VA-CNT’ lerin yüzeysel ve yapısal özelliklerinin
kontrol edilebileceği görülmüştür. Dolayısıyla, gerçekleştirilen iki ön çalışma
yoğun ve hizalanmış karbon nanotüplerin Li iyon pillerinde anot malzemesi ve
doku mühendisliği uygulamasında alternatif yapı iskelesi olarak kullanımı
üzerine bir yol sunmaktadır.
Anahtar kelimeler: dik hizalanmış karbon nanotüpler, lityum katkılandırılması,
yapı iskelesi, kimyasal buhar kaplama, fiziksel buhar kaplama, uygulama

xii
Dedicated to my family and husband,

xiii
Acknowledgements
I would like to express my sincere gratitude to my supervisor, Dr. Erman Bengü,
for all of his patience and endless support. He taught me how to conduct
research and approach scientific problems during all these years. He also taught
me how to write and talk about research. Apart from research, I have learned
much from him. It has been a unique and inspiring experience.
My honest regards go to Dr. Oğuz Gülseren, Dr. Rasim Ovalı and Şener Şen
from Physics Department for their theoretical calculations which lightened my
studies. Without their calculations, it would not be possible to answer the
challenges. I would also like to acknowledge Dr. Can Akçalı, Verda Bitirim and
Damla Gözen from Molecular Biology and Genetics Department for their
valuable collaboration throughout the stem cell study. Furthermore, many thanks
go to Dr. Göknur Cambaz Büke for her advices and guidance in writing this
dissertation.
I could never forget the assistance of my lab colleagues with whom I spent most
of my time during Ph.D. Serim Ilday, Beril Baykal, Dr. Devrim Sam, Dr.
Kuldeep Rana and Hüseyin Alagöz; thank you all for your golden discussions
and aids. Special thanks go to Dr. Mustafa Fatih Genişel and Ethem Anber for
helping me a lot during the construction of chemical vapor deposition system in
Dr. Bengü’s laboratory.

xiv
List of researchers outside Bilkent University helped me in this dissertation. I
would like to express my thanks to Dr. Servet Turan and Dr. Hilmi Yurdakul for
their collaboration in transmission electron microscope analysis at Anadolu
University. I am also grateful to Dr. Raşit Turan and Dr. Mustafa Kulakçı for
providing me an access to their electron beam evaporation equipment at Middle
East Technical University.
I would like to acknowledge Department of Chemistry, Advanced Research
Laboratory (ARL) and National Nanotechnology Research Center (UNAM) at
Bilkent University for providing access to their facilities and clean rooms. I also
want to thank to The Scientific and Technological Research Council of Turkey
(TÜBİTAK) for granting me a graduate scholarship during my Ph.D. (2211-
National Scholarship Programme for Ph.D. Students).
I would like to pay another special tribute to my mom, dad and brother for their
never-ending love and encouragement. Their belief in me always brightened the
way throughout my career. Last but not the least, I am thankful to my husband
for being such a caring companion. His consistent support and motivation has
meant everything to me. I could not image to complete this dissertation without
their supports and I am feeling so lucky to have them.

xv
Contents
. Introduction ......................................................................................... 1 Chapter 1
1.1 Discovery of carbon nanotubes ............................................................. 1
1.2 Structure, properties and characterization of carbon nanotubes ............ 3
1.3 Thesis objective ..................................................................................... 8
. Literature Review .............................................................................. 10 Chapter 2
2.1 Synthesis methods for carbon nanotubes............................................. 10
Chemical vapor deposition method ............................................... 11 2.1.1
Laser ablation method ................................................................... 13 2.1.2
Arc discharge method .................................................................... 14 2.1.3
Pyrolysis ........................................................................................ 14 2.1.4
2.2 Growth mechanism of carbon nanotubes ............................................ 15
2.3 Synthesis of vertically aligned carbon nanotubes ................................ 18
2.4 Vertically aligned carbon nanotubes as multi-functional surfaces ...... 27
Anode material for lithium ion battery .......................................... 27 2.4.1
Extracellular matrix for cells ......................................................... 30 2.4.2
. Materials and Method ........................................................................ 32 Chapter 3
3.1 Experimental procedure and equipment .............................................. 32
Preparation of catalyst layers ........................................................ 34 3.1.1
3.1.1.1. Physical vapor deposition method ......................................... 34
3.1.1.2. Wet chemistry method ........................................................... 37
Synthesis of vertically aligned carbon nanotubes ......................... 38 3.1.2
3.2 Characterization techniques ................................................................. 40
Raman spectroscopy ...................................................................... 40 3.2.1
Atomic force microscopy .............................................................. 40 3.2.2
Scanning electron microscopy ...................................................... 41 3.2.3
Transmission electron microscopy ................................................ 41 3.2.4
X-Ray photoelectron spectroscopy ............................................... 42 3.2.5
Contact angle measurement .......................................................... 43 3.2.6

xvi
. Results and Discussion ...................................................................... 44 Chapter 4
4.1 Growth of vertically aligned carbon nanotubes ................................... 45
Optimization of catalyst design ..................................................... 45 4.1.1
Optimization of annealing step ..................................................... 60 4.1.2
Effect of growth parameters .......................................................... 67 4.1.3
Modeling for the growth of vertically aligned carbon nanotubes . 88 4.1.4
4.2 Functionalization of vertically aligned carbon nanotubes ................... 99
Lithium intercalation of vertically aligned carbon nanotubes ....... 99 4.2.1
Cell attachment on patterned carbon nanotubes .......................... 111 4.2.2
. Conclusions ..................................................................................... 122 Chapter 5
Appendixes ........................................................................................................ 127
Appendix I ......................................................................................................... 128
Appendix II ....................................................................................................... 130
Appendix III ...................................................................................................... 131
Appendix IV ...................................................................................................... 133
Appendix V ....................................................................................................... 135
Appendix VI ...................................................................................................... 136
Appendix VII ..................................................................................................... 137
Bibliography ...................................................................................................... 142
List of Publications ............................................................................................ 178
Copyright Licences ........................................................................................... 180

xvii
List of Figures
The number of publications regarding CNT by years. ......................... 1 Figure 1.
CNTs and “carbon filaments” reported in the literature by various Figure 2.
researchers at different years; (a) 1991, (b) 1952 and (c) 1984 (1, 2, 4). ............. 2
Representative drawings for carbon allotropes; (a) graphene, (b) Figure 3.
fullerene and (c) diamond. ................................................................................... 3
Representative drawings for one end capped (a) SWCNT and (b) open Figure 4.
ended MWCNT. ................................................................................................... 4
(a) High resolution TEM image of a MWCNT shows the side walls Figure 5.
and the hollow core (14) while (b) STM image of a SWCNT indicates the
atomic sequencing (15). ....................................................................................... 5
The nature of the G and D modes in Raman for graphite (16). ............ 7 Figure 6.
Schematic drawings for (a) CVD, (b) laser ablation and (c) discharge Figure 7.
methods. ............................................................................................................. 11
Schematic representation of processes occurring on the catalyst Figure 8.
particle during the growth of a CNT. ................................................................. 16
Representative drawings show the (a) base and (b) tip growth models Figure 9.
of CNT. ............................................................................................................... 18
(a-c) The first reported VA-CNTs by Li et al. at 1996 (73). (d) By Figure 10.
Hata et al., the millimeter tall VA-CNTs synthesized using water assisted CVD
are compared with a match for a size reference (8). .......................................... 21
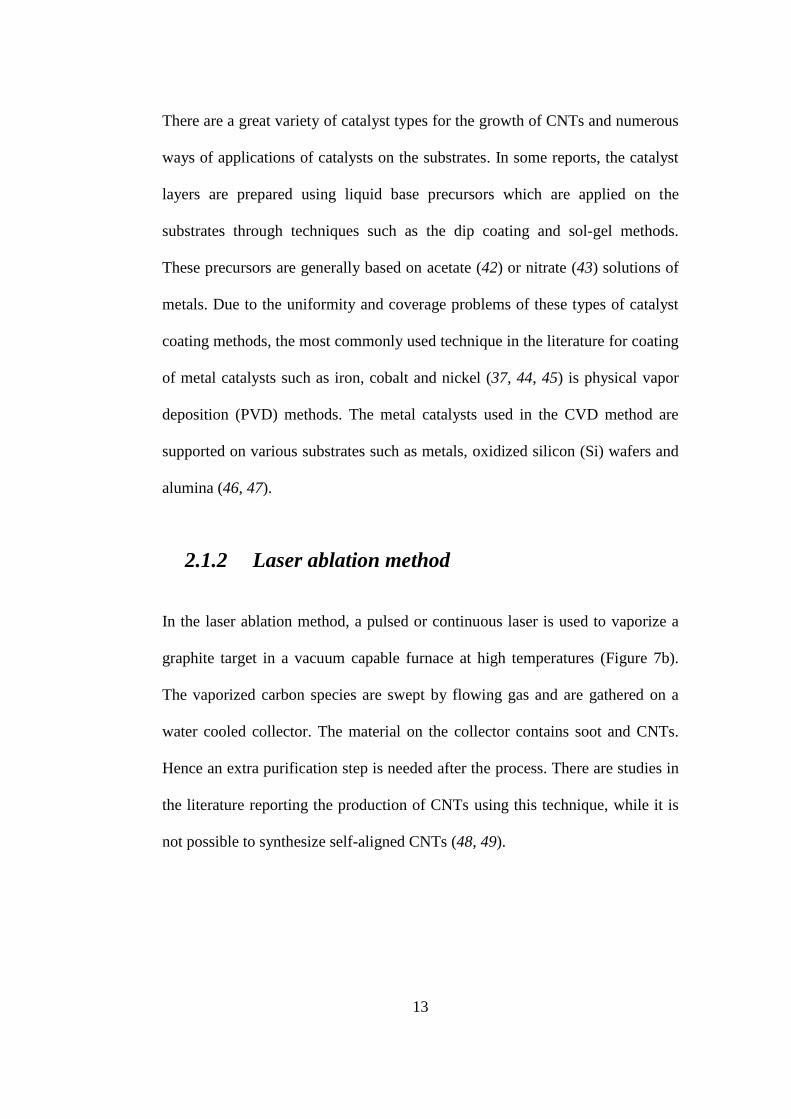
SEM images of the catalyst islands formed on (a) 0.5 nm and (b) 6 Figure 11.
nm Al buffer layer (86). ..................................................................................... 25

xviii
SEM images of CNTs on Si substrates with TiN, TiO2 and Al2O3 Figure 12.
buffer layer (92). ................................................................................................ 26
Working principle of Li-ion battery showing the charge-discharge Figure 13.
cycle ................................................................................................................... 28
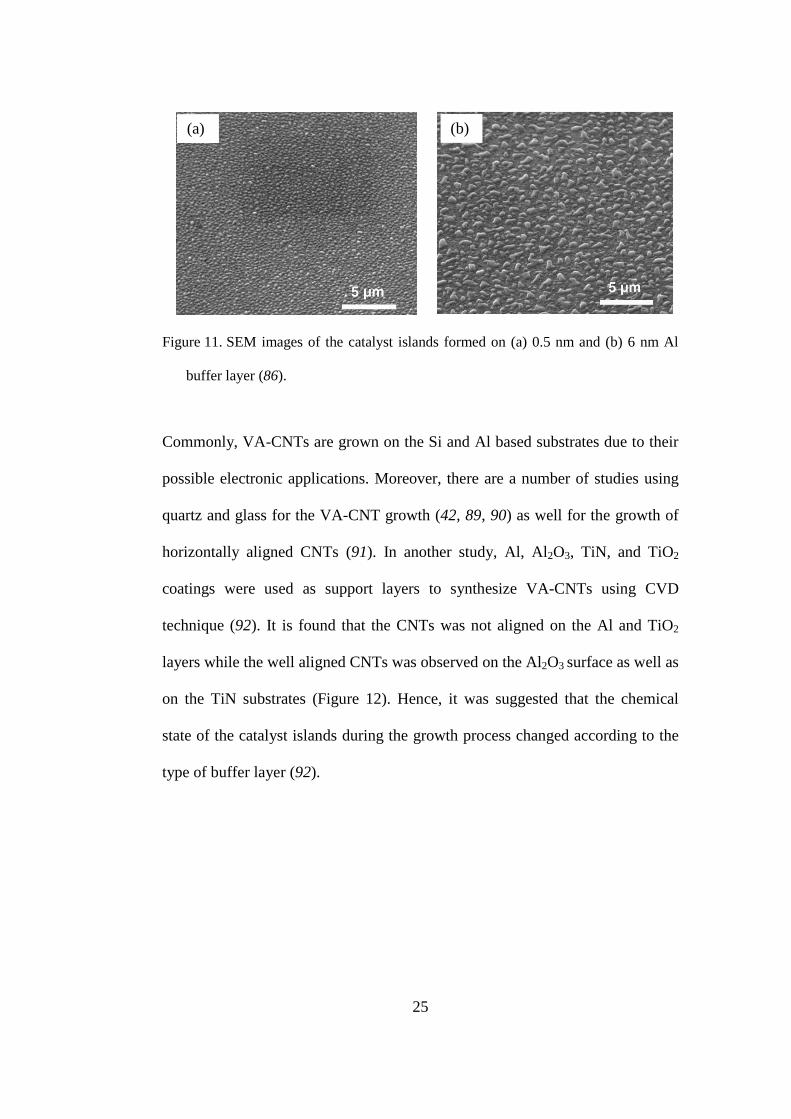
Schematic representation shows three steps for the synthesis of VA-Figure 14.
CNTs; preparation of catalyst layers, annealing and growth. The annealing and
growth steps are performed inside an ACCVD furnace. .................................... 33
Photograph of (a) thermal and (b) e-beam (I) evaporation systems. 35 Figure 15.
Drawings for the catalyst configurations used in the experiments. .. 35 Figure 16.
Photograph of EBE-4 (II) system mounted with XPS. ..................... 36 Figure 17.
Photograph and schematic drawing of the ACCVD experimental set Figure 18.
up. ....................................................................................................................... 38
SEM image of CNTs grown on (a) 1nm Fe/SiO2 and (b) 1nm Fe/10 Figure 19.
nm Al layers at temperature of 625 0C. .............................................................. 46
Side view SEM images showing the alignment of CNTs grown on (a) Figure 20.
1nm Fe/10nm Al and (b) 1nm Co/10nm Al catalyst layers. .............................. 48
Schematic representation showing the subsurface diffusion and Figure 21.
coarsening of catalyst particles on the buffer layer of Al during a heat treatment.
............................................................................................................................ 50
Side view SEM images of VA-CNTs grown on (a) normal and (b) Figure 22.
sandwich catalyst configurations. HRTEM images of CNTs grown on (c)
normal and (d) sandwich catalyst configurations. (e) Raman spectra of VA-
CNTs grown on both catalyst configurations. .................................................... 52

xix
Top view SEM images of collapsed CNTs grown on (a) normal and Figure 23.
(b) sandwich catalyst designs. 2D contact mode AFM images of (c) normal and
(d) sandwich catalyst designs after reduction process. (e) Size distribution of
particles on both catalyst designs after reduction process. ................................. 54
A representative drawing of a sandwich catalyst layer after the Figure 24.
reduction process. ............................................................................................... 56
SEM images of VA-CNTs synthesized at 625 °C using sandwich Figure 25.
catalyst design on varying thickness of bottom Al layer (3, 5, 7 and 10 nm).
AFM images of H2-reduced catalyst layers at 625 °C and the plot for the change
of VA-CNT length and average particle size distribution (w) versus bottom Al
layer thickness. ................................................................................................... 58
(a) SEM and (b) HRTEM images of CNTs synthesized at 625 °C on Figure 26.
the 0.5nm Al/1nm Fe/10nm Al catalyst configuration. ...................................... 60
(a-h) SEM images of VA-CNTs grown on the non-reduced and H2-Figure 27.
reduced sandwich catalyst layers at 625 °C for 5,10, 15, 20, 30 and 60 minutes,
respectively. (h) The plot shows changes in the length of VA-CNTs by reduction
time. .................................................................................................................... 62
Top view SEM images of (a) as-deposited and H2-reduced at 625 °C Figure 28.
for (b) 15 minutes and (c) 60 minutes sandwich catalyst layers. ....................... 63
(a-f) XPS spectra of Co 2p regions for various Co layers (● and *, Figure 29.
respectively, indicate that Co layers are prepared using e-beam (I) and EBE-4
(II) evaporation systems). ................................................................................... 65

xx
SEM images of VA-CNTs synthesized at 625 °C using ethanol, Figure 30.
acetone and isopropanol as carbon sources. ....................................................... 68
(a) Raman spectra of VA-CNTs grown at 625 °C using acetone, Figure 31.
ethanol and isopropanol as carbon sources. (b) The plot for I(G/D) and I(2D/G)
ratios of VA-CNTs versus carbon sources. ........................................................ 70
SEM images of VA-CNTs synthesized at 750 °C using ethanol, Figure 32.
acetone and isopropanol as a carbon source. ...................................................... 72
(a) Raman spectra of VA-CNTs grown at 750 °C using acetone, Figure 33.
ethanol and isopropanol. (b) The plot for I(G/D) and I(2D/G) ratios of VA-
CNTs versus carbon sources. ............................................................................. 73
TEM images of VA-CNTs synthesized at temperatures of (a) 625 °C Figure 34.
and (b) 750 °C using ethanol as carbon source. White arrows show the
amorphous carbon presence on the side wall of a CNT. .................................... 75
CNT surfaces after the growth step at 625 °C using (a) benzene and Figure 35.
(b) toluene as carbon sources. ............................................................................ 77
Dynamic contact angle measurements of VA-CNTs synthesized Figure 36.
using various carbon sources at temperatures of (a) 625 °C and (b) 750 °C. The
volume of water droplet used for the measurements was 8 µL. ......................... 79
SEM images of VA-CNTs synthesized under pressures of 40, 56, 69, Figure 37.
81 and 94 Torr at 625 °C (pressure set). The plot of the VA-CNT length versus
pressure. .............................................................................................................. 82
SEM images of VA-CNTs synthesized using various liquid ethanol Figure 38.
temperatures (32, 50, 71, 81 °C) at 625 °C (concentration set). The plot of the

xxi
VA-CNT length versus pressure that obtained by varying liquid ethanol
temperature. ........................................................................................................ 86
Raman spectra of VA-CNTs synthesized at pressure of 40 and 94 Figure 39.
Torr (black and red lines, respectively) with an inset of magnified D and G
bands. .................................................................................................................. 87
XPS spectra taken from the top surface of VA-CNTs. C 1s peak at Figure 40.
284.4 eV was attributed to the presence of CNTs while there was no signal for
Co 2p indicating the root growth type. ............................................................... 91
Representative side view schematic of VA-CNTs showing the Figure 41.
boundary conditions for the calculations. .......................................................... 92
The plot of the VA-CNT length versus growth time with Figure 42.
representative SEM images of VA-CNTs grown at 625 °C............................... 94
An illustration for the arrangement of CNTs in a closed packed Figure 43.
design on a substrate (Each circle represents a CNT). ....................................... 96
Side view SEM images of grown VA-CNTs from the (a) non-Li (Set Figure 44.
3) and (b) Li containing (Set 1) catalyst layers. (c) S/TEM image of a CNT from
Set 1 (165). ....................................................................................................... 102
EEL spectra of Set 1 for (a) Li-K edge and (b) C-K edge (inset shows Figure 45.
where the spectrum is taken from). (c) A comparison of Raman spectra for VA-
CNTs from Set 1 (Li containing) and Set 3 (non-Li containing) (165). .......... 104
Li 1s XPS spectra of (a) Set 4, (b) Set 2, (c) Set 3 and (d) Set 1. C 1s Figure 46.
XPS spectra of (e) Set 3 and (f) Set 1 (165). .................................................... 106

xxii
Li 1s XPS spectra of (a) Set 5 and (b) Set 6. (c) C 1s XPS spectra of Figure 47.
Set 5 (165). ....................................................................................................... 110
(a) SEM and (b) HRTEM images of VA-CNTs synthesized at 625 °C Figure 48.
on the sandwich catalyst layers for the cell attachment experiments. (c) 2D AFM
image from the top view of VA-CNTs with inset of top view SEM image. (d)
Raman spectra of the synthesized VA-CNTs indicating the variety of MWCNTs
as shown in RBM mode as inset (194). ............................................................ 113
Schematic representation of experimental approach (194). ............ 114 Figure 49.
45° tilted SEM images of non-coated and collagen coated CNT Figure 50.
surfaces with higher magnified SEM images showing the smoothing effect of
collagen. ........................................................................................................... 115
Attached MSCs from P0 passage on the (a) non-coated and (b) Figure 51.
collagen coated CNT surfaces. (c) The plot of average areal density of MSCs
from three subsequence passages. (-) indicates CNT surfaces without collagen
while (+) means collagen coated CNT surfaces (194). .................................... 117
MTT assay plots showing the percent viability of MSCs from Figure 52.
different passages on the (a) non-coated patterned CNTs and (b) collagen coated
patterned CNTs (* indicates significant p<0.05.) (194). .................................. 120
XPS spectra of normal design and sandwich design catalyst layers Figure 53.
before and after reduction at 625 °C (black line indicates the layers before the
reduction whereas pink line represents the spectra of catalyst layers after the
reduction). ........................................................................................................ 129

xxiii
The images after masking to calculate the compacted areas shown by Figure 54.
black. ................................................................................................................ 130
The proposed arrangement of CNTs on the substrate. .................... 131 Figure 55.
The expression of the markers for bone marrow derived MSCs and Figure 56.
hematopoetic stem cells at (a) mRNA and (b) protein levels (194). ................ 136
(a) Possible Li adsorption sites; top (1), hollow (2) and bridge (3) for Figure 57.
6x6 unit cell. (b) PDOS for Li intercalated cases shown in (c) and (d). Dotted
line indicates the Fermi level. Top and side views of the optimized geometry
and the charge density of (c) Li intercalated bilayer graphene and (d) similar
system but starting from Li substitution to a C site on top layer (165). ........... 138

xxiv
List of Tables
Table 1. The properties of catalyst layers and VA-CNTs on normal and
sandwich catalyst designs. .................................................................................. 56
Table 2. Tabulation of binding energies of Co 2p peaks for different catalyst
configurations indicating the catalyst state before and after the reduction step. 67
Table 3. Summary of the values used in the experiment series of pressure and
concentration. The bold values are for the pressure set while the rest is for the
concentration set. ................................................................................................ 84
Table 4. Summary of the experiments conducted for Li intercalation study. .. 101
Table 5. Binding energies and FWHM for C 1s and Li 1s XPS peaks. ........... 107
Table 6. The atomic ratio of Co/Al calculated for the designs before and after
reduction process. ............................................................................................. 129
Table 7. Calculated values of the ethanol flow in the pressure set. ................. 134
Table 8. Calculated values of the ethanol flow in the concentration set. ......... 135
Table 9. Binding energies, Li-C bond distances, and total charge transfer from
Li to C network for Li doped AA stacking bilayer resulted from LDA
calculations (165). ............................................................................................ 141

xxv
GLOSSARY
ACCVD: Alcohol catalyzed chemical vapor deposition
AFM: Atomic force microscopy
CNT: Carbon nanotube
CVD: Chemical vapor deposition
D band mode: Disorder mode
DFT: Density functional theory
e-beam: Electron beam evaporation
ECM: Extracellular matrix
EELS: Electron energy loss spectroscopy
G band mode: Tangential mode
HRTEM: High resolution transmission electron microscopy
MSC: Mesenchymal stem cell
MWCNT: Multi-walled carbon nanotube
PVD: Physical vapor deposition
RAMAN: Raman spectroscopy
RBM: Radial breathing mode
SEI: Solid electrolyte interphase
SEM: Scanning electron microscopy
STM: Scanning tunneling microscope
S/TEM: Scanning transmission electron microscopy
SWCNT: Single-walled carbon nanotube

xxvi
TEM: Transmission electron microscopy
VA-CNT: Vertically aligned carbon nanotube
XPS: X-ray photoelectron spectroscopy
a: diameter of a carbon source molecule
C0: Initial concentration of carbon source
C*: Effective carbon source concentration at the root
d: Diameter of CNT
Dc: Mass diffusion coefficient
De: Efficient diffusion coefficient of a gas molecule
Dk: Knudsen diffusion coefficient
Dm: Molecular diffusion coefficient
F: Filling fraction
h: Average height of particles
J: Net diffusion flux
ks: Overall reaction rate constant
L: Total length of VA-CNTs
m: Reaction rate order
NA: Avagodro’s number
R: Gas constant
r: Reaction rate of carbon source
T: Process temperature
t: Process time
w: Average particle size distribution

xxvii
wL: Wave numbers (cm-1
)
ρ: Areal density of CNTs
δ: Theoretical Van der Waals tube distance (0.34 nm)
λ: mean free path
γ: Growth rate of CNTs
β: Porosity value of arrays
ε: Tortuosity of diffusion channels
x: Distance between two adjacent CNTs (pore size)
1
Chapter 1
Introduction
1.1 Discovery of carbon nanotubes
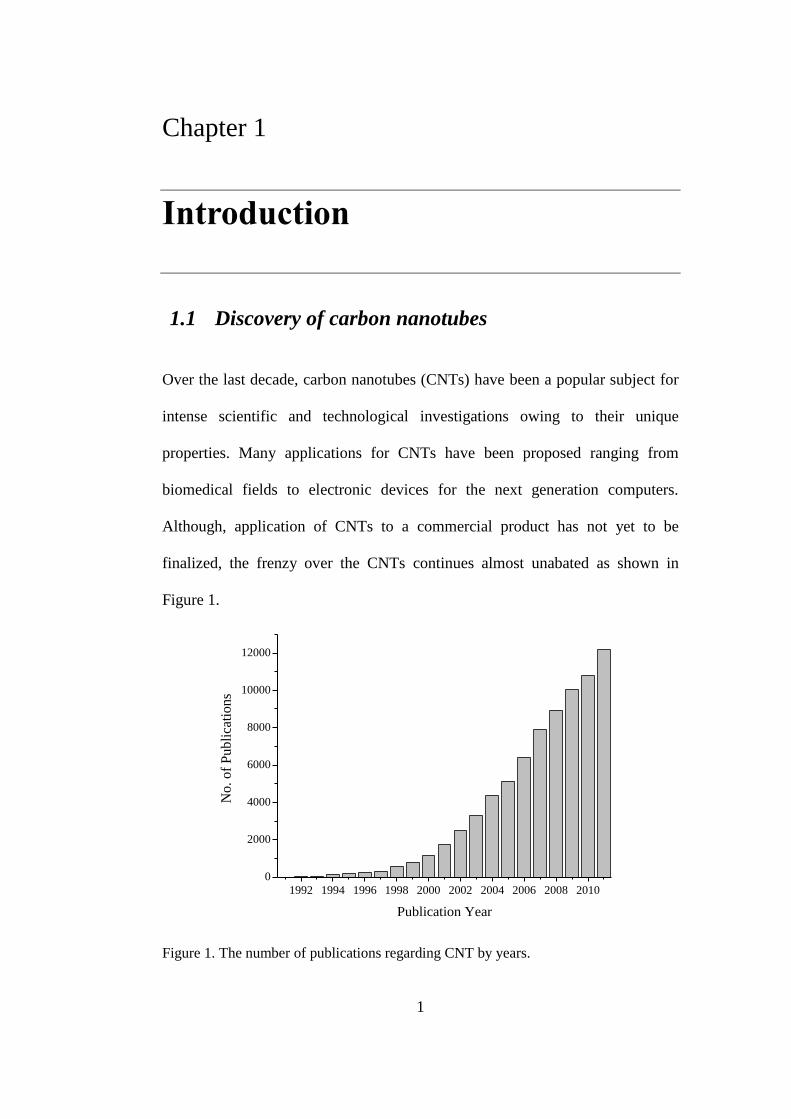
Over the last decade, carbon nanotubes (CNTs) have been a popular subject for
intense scientific and technological investigations owing to their unique
properties. Many applications for CNTs have been proposed ranging from
biomedical fields to electronic devices for the next generation computers.
Although, application of CNTs to a commercial product has not yet to be
finalized, the frenzy over the CNTs continues almost unabated as shown in
Figure 1.
1992 1994 1996 1998 2000 2002 2004 2006 2008 2010
0
2000
4000
6000
8000
10000
12000
No
. o
f P
ub
lica
tio
ns
Publication Year
The number of publications regarding CNT by years. Figure 1.

2
It is widely recognized that Iijima in 1991 has reported the first observation of
CNTs (1). However, there have been earlier reports displaying TEM images of
hollow carbonaceous structures which can be easily recognized as CNTs (2–4).
The 1991 report by Iijima was actually the first one to accurately describe the
atomic scale details of these structures and proposing that these were
“nanotubes”(1). Nevertheless, the study by two Soviet scientists in 1952 merit
recognition in this regard (2). Radushkevich and Lukyanovich had observed
similar structures in 1952 but due to the limited resolution of electron
microscopy in those years, they called their observations as “carbon filaments”
(2). Similarly, in 1984, Tibbetts reported similar hollow tubular structures as
“filaments” (4). Figure 2 shows the most known CNT and “carbon filaments”
early reported in the literature.
CNTs and “carbon filaments” reported in the literature by various researchers Figure 2.
at different years; (a) 1991, (b) 1952 and (c) 1984 (1, 2, 4).
Still in the light of these earlier reports what now appears to be CNTs, the work
by Iijima cannot be dismissed, as only Iijima attempted to explain the atomic
(a) (b) (c)

3
structure of his observations through single-sheets of graphite and naming his
observations as CNTs (1). Furthermore, CNTs continue inspiring further
researches on this field.
1.2 Structure, properties and characterization of carbon
nanotubes
Carbon is the sixth element of the periodic table and has the ability of
hybridization in various forms such as sp (acetylene), sp2 (ethylene) and sp
3
(methane). Carbon is one of the few elements to display orbital hybridization
which as a result allows for many carbon allotropes to exist. The best known
allotropes of carbon are diamond (5), fullerenes (6) and graphite (7) as shown in
Figure 3. Extended flat sheets made up of carbon atoms in honeycomb patterns
form graphene layers where carbon atoms are hybridized in the sp2 form.
Representative drawings for carbon allotropes; (a) graphene, (b) fullerene and Figure 3.
(c) diamond.
(c) (b) (a)

4
In addition to the widely known carbon allotropes such as diamond and
graphene, CNT is another one; technically originated from graphene. Single
walled carbon nanotubes (SWCNTs) can be defined as the seamless cylinders
with hollow cores formed by the wrapping of a single flat graphene sheet
(Figure 4a). In fact, rolling up a graphene sheet is not the true mechanism for the
growth of CNTs. The actual growth mechanism will be provided in the next
chapter. Other than SWCNTs, there is another type of CNTs called as multi
walled carbon nanotubes (MWCNTs) as displayed in Figure 4b. These
structures consist of multiple layers of concentric tubes. While the diameter of
SWCNTs can be up to 2 nm, MWCNT’s diameter changes with the number of
concentric tubes varying between 5 – 40 nm. The lengths of CNTs vary from a
few micrometers to up to several millimeters (8–13).
Representative drawings for one end capped (a) SWCNT and (b) open ended Figure 4.
MWCNT.
While the resolution of current day scanning electron microscopes (SEMs) can
easily allow for the observation of CNTs; their diameter and length, the atomic
(b) (a)

5
structure of the sidewalls is generally characterized by using a transmission
electron microscope (TEM) (Figure 5a). Atomic force microscope (AFM) and
scanning tunneling microscope (STM) are also used for atomic level
characterization of CNTs (Figure 5b).
(a) High resolution TEM image of a MWCNT shows the side walls and the Figure 5.
hollow core (14) while (b) STM image of a SWCNT indicates the atomic
sequencing (15).
The most widely used analytical technique for the characterization of CNTs is
Raman Spectroscopy (Raman). Raman allows for the investigation of the
morphology (single or multi walled), electronic properties (semiconductor or
metallic), crystallinity and defectivity of CNTs. CNTs have two common
Raman active peaks in their spectrum; D (disorder) band around 1380 cm-1
and
G (tangential) band around 1590 cm-1
(16, 17). While D mode corresponds to
the breathing like vibration mode of sp2 sites only possible in hexagonal carbon
rings, G mode is the stretching vibration of any sp2
sites in plane as shown in
Figure 6 (16, 17). Figure 6 explains the various factors, which can impact the
peak positions of the modes as well as the intensities. The intensity ratio of the
(a) (b)

6
D to the G band for CNTs (I(D)/(G)) is to the amount of disorder in the CNT
sample. The crystallinity information of CNTs can be obtained by calculating
the intensity ratio of G and 2D bands (overtone of the D band) (I(2D)/(G)) (18,
19). D and G bands are active in all types of CNTs while another active band
exists for SWCNTs. This band prevails in the low-frequency region up to 300
cm-1
and is called the radial breathing (RBM) mode. This mode is akin to a
finger print for the presence of SWCNTs and can supply a clue for the diameter
distribution of SWCNTs in the samples (20, 21). To relate the RBM mode
frequencies with the diameter of SWCNTs, a following formula (Eq.1) has been
developed with the help of density functional theory (DFT) calculations where
wL is wavenumbers in cm-1
and d is diameter of SWCNT in nm;
In addition, Raman spectrum of SWCNTs can be used in determining the
chirality of SWCNTs (22). Besides the usual electrical conductivity tests, G
band splitting in Raman spectrum can provide a clue on electrical properties of
SWCNTs as well (23).

7
The nature of the G and D modes in Raman for graphite (16). Figure 6.
The electrical properties of CNTs depend on the number of sidewalls, diameter
and chirality of the CNTs. SWCNTs can be either semiconductor or metallic
while MWCNTs are metallic without the introduction of doping elements to the
structure capable of carrying current densities up to 109 Acm
-2 (for comparison;
the limit for copper is around 106 Acm
-2) (15, 24–26). In general, SWCNTs
without any dopants can act as semiconducting materials rather than metallic
however, some studies reported that small amounts of dopants such as boron,
phosphorous or sulfur can change the electrical properties drastically (23–25,
27).
8
1.3 Thesis objective
As indicated earlier, large-scale commercialization of CNTs requires two major
difficulties to be overcome. One is gaining control over the growth of well-
aligned, high density CNTs. The other one is regulating and controlling the
properties of CNTs through a facile route.
Motivated by the first challenge, an alcohol catalyzed chemical vapor deposition
(ACCVD) system was designed to synthesize dense and impurity free vertically
aligned carbon nanotubes (VA-CNTs) under various growth conditions. Since
the discovery of CNTs in 1991, similar synthesis routes for the growth of VA-
CNTs have been followed. However, in this work an attempt at the optimization
of the ACCVD process has been made with regards to regulating the VA-CNTs
properties for high-volume manufacturing and commercial applications.
Furthermore, data gathered during this attempt has been used to build a model of
growth for better understanding the growth mechanism. The uncovered growth
dynamics of VA-CNTs assisted to build two and three dimensional functional
structures on the surfaces through a facile route.
Relevant with the second challenge, the synthesis of VA-CNTs was studied to
tailor the surface and structural properties of VA-CNTs using several growth
parameters needed no further modifications. For this aim, two different studies
of VA-CNTs were conducted; lithium (Li) intercalation and mesenchymal stem

9
cell (MSC) growth. In the Li intercalation study, VA-CNTs were grown already
Li intercalated with vertical arrangement which was needed no further lithiation
processes. This would provide good conductivity, fast ion diffusion, high rate
capacity and surface area for the anode material applications of CNTs in the Li-
ion battery field with the help of alignment and lithiation. Furthermore, in the
study of MSC growth, VA-CNTs were prepared to be used as scaffolds utilized
from the wettability properties of surfaces. VA-CNTs would be an alternative
scaffolds for tissue engineering applications compared to the widely used
polymer based ones.

10
Chapter 2
Literature Review
2.1 Synthesis methods for carbon nanotubes
There are many methods to produce inorganic carbon based materials. While
graphite presents little trouble during its synthesis, diamond requires precision
and harsh environments. Similar to diamond, synthesis of CNTs also requires
precision controlled growth parameters and specialized equipment. Regularly,
the synthesis of CNTs can be categorized in two main groups with regards to the
starting materials; gas-phase and solid-state methods. Laser ablation, arc
discharge and pyrolysis techniques are involved in the high-energy group in
which CNTs are synthesized by the evaporation of a solid carbon source or a
carbonaceous solid; commonly graphite is used (Figure 7). The gas-phase
method is the most used one in the literature and it is based on the
decomposition of a gaseous carbon source over a metal catalysts as seed for the
growth of CNTs. Amongst the techniques utilizing the gas-phase route, catalytic
chemical vapor deposition (CVD) technique is the frequently known and used
one (Figure 7a).

11
One of these synthesis methods would meet the needs depending on the desired
properties of CNTs. However, the focus of the recent studies is the self-
alignment of CNTs in an easy way where they could be easily used for various
applications such as sensors and biomaterials. In this section, CVD, laser
ablation and arc discharge methods are described.
Schematic drawings for (a) CVD, (b) laser ablation and (c) discharge Figure 7.
methods.
Chemical vapor deposition method 2.1.1
CVD has become a popular method to grow carbon structures which is partly
due to the simple setup and high possibility to be scaled up for industrial
production. In the CVD technique, a gaseous carbon source is flowed into a
(a)
(b) (c)
12
temperature and atmosphere controlled furnace. The carbon containing gas
decomposes into reactive carbonaceous species on the hot surface of the
substrate with assistance of catalyst layer on the substrate (28). As the carbon
source cracks, carbon deposits on the catalyst surface and diffuses into the
catalyst which will eventually act as a root for growing CNTs (Figure 7a).
Commonly, flammable gases such as methane (29), acetylene (30), ethylene
(31) and carbon monoxide (32) or vapor of alcohols (11, 12, 33, 34) are used as
carbon source.
The characteristics of CNTs synthesized by CVD method depends on the
experimental parameters such as carbon source, catalyst type, operation
temperature and pressure of the gas (35–38). While SWCNTs are reported to be
synthesized at higher temperatures with uniformly dispersed catalyst layer,
MWCNTs are grown at comparatively lower temperatures (35) and even
without a metal catalyst layer (39, 40). In this technique, it is possible to
eliminate the impurities, and limit formation of amorphous carbon during the
growth of CNTs (41). This could be achieved by flowing small amounts of
oxidative gases inside the furnace. Thus, this flexibility of CVD process allows
for having amorphous carbon free CNTs without any need for an extra
purification step. Moreover, self-aligned CNTs can only be successfully
synthesized through CVD technique. Hence, alignment of the CNTs can play a
key role for the manufacturing of electronic devices.
13
There are a great variety of catalyst types for the growth of CNTs and numerous
ways of applications of catalysts on the substrates. In some reports, the catalyst
layers are prepared using liquid base precursors which are applied on the
substrates through techniques such as the dip coating and sol-gel methods.
These precursors are generally based on acetate (42) or nitrate (43) solutions of
metals. Due to the uniformity and coverage problems of these types of catalyst
coating methods, the most commonly used technique in the literature for coating
of metal catalysts such as iron, cobalt and nickel (37, 44, 45) is physical vapor
deposition (PVD) methods. The metal catalysts used in the CVD method are
supported on various substrates such as metals, oxidized silicon (Si) wafers and
alumina (46, 47).
Laser ablation method 2.1.2
In the laser ablation method, a pulsed or continuous laser is used to vaporize a
graphite target in a vacuum capable furnace at high temperatures (Figure 7b).
The vaporized carbon species are swept by flowing gas and are gathered on a
water cooled collector. The material on the collector contains soot and CNTs.
Hence an extra purification step is needed after the process. There are studies in
the literature reporting the production of CNTs using this technique, while it is
not possible to synthesize self-aligned CNTs (48, 49).

14
Arc discharge method 2.1.3
The arc discharge method is based on the synthesis of CNTs by generating
electric arc between two graphite electrodes under an inert atmosphere (helium
or argon) at low pressures (Figure 7c). The carbon vaporizes from one of the
electrodes (anode) into the plasma and deposited on the other rod (cathode)
which is cooled down and where the CNTs are formed (50, 51). Although the
original discovery of CNTs was done through using this technique (1), it is not
surprising to have a mixture of soot and CNT at end of the process as well as
non-aligned CNTs.
Pyrolysis 2.1.4
Besides the others, pyrolysis based methods are also known to produce CNTs.
The basis of the technique is to sublime and decompose a carbon-based
precursor at high temperatures under the flow of inert gases inside a high
temperature furnace. Solid or liquid carbon precursors can be used in this
technique. While the solid precursors are placed inside the furnace before
heating starts, the vapor from the liquid precursors are generally introduced into
the furnace by a sweeping gas such as argon (Ar), nitrogen (N2) or hydrogen
(H2) (52). Generally, hydrocarbons and alcohols are used for the carbon source
and organometallic compounds for the catalyst to synthesize CNTs using this
method (53–55). Similar to the arc discharge and laser ablation methods, the
product contains CNTs as well as soot at the end of the process.

15
2.2 Growth mechanism of carbon nanotubes
Commonly, the accepted mechanism for CNT growth is originated from carbon
atoms dissolving into the catalyst to form CNTs. This is based on the vapor-
liquid-solid mechanism suggested for whiskers growth (56). In this model, the
catalyst is in a liquid form and adsorbs the reactant gases around which cause
the super saturation of the catalyst resulting in the eventual precipitation/growth
of a solid product (whisker). The growth of CNTs by catalytic methods includes
the four sequential steps shown in Figure 8. These are; (1) carbon source
adsorption, (2) dissociation of precursors on the catalyst surface, (3) carbon bulk
or/and surface diffusion and (4) carbon precipitation at the catalyst – CNT
interface. The carbon sources such as methane and acetylene require these gases
dissociating into carbon at the catalyst surface at elevated temperatures. Hence,
this step is the crucial for the growth of CNTs. Then, carbon atoms on the
surface diffuse over or through the catalyst, which is determined by the catalyst
type and growth conditions. The diffused carbon reaches back to the surface and
precipitates at the catalyst – CNT interface. The precipitation starts at the edge
of catalyst where the surface activation energy is the lowest.

16
Schematic representation of processes occurring on the catalyst particle Figure 8.
during the growth of a CNT.
Generally, the carbon diffusion over or through the catalyst particle is assumed
to be the rate limiting step eventually leading to the termination of CNT growth
(57, 58). However, this is not enough to explain the effects of catalyst quality
and carbon precursor type on the growth. In a study by Robertson et al., it is
shown that the CNT growth termination mechanism is actually more complex
than explaining it by one rate limiting step (59). Both diffusion step and
molecular dissociation was shown to have an effect on the growth kinetics.
Moreover, it is reported that during synthesis of self-aligned CNTs as the CNTs
get longer the decrease in the growth rate were attributed to the slowing rate of
the diffusion of carbon feedstock rather than the carbon diffusion to the catalyst
(60). In this case, hydrocarbon precursors experience difficulty in reaching the

17
catalyst hence the adsorption step which is the initial step for the growth will be
severely stunned.
Overall, there are two growth models for CNTs; base and tip growth models
(Figure 9). In the base growth mechanism, the CNT grows while the catalyst
stays on the support due to the strong interaction between the support and
catalyst (Figure 9a). Arriving carbon atoms are added to the structure from the
bottom of the CNT where the catalyst is located. Nevertheless, for the tip growth
model, catalyst particle is lifted off the support by the CNTs due to the weaker
interaction between catalyst and support (Figure 9b). In this model, the
decomposed carbon is precipitated to sidewalls from the top where the catalyst
is. Any of the mechanisms could be responsible for the growth of CNTs during
CVD depending on the carbon source, growth temperature, types of catalyst and
support. In the literature, there is one study linking the oxidation state of the
catalyst to whether the base or tip growth would be taking place (61). According
to the study, if the catalyst is partially oxidized first the reduction of the catalyst
is induced by the reducing atmosphere found in CVD systems. Hence, carbon
will deposit on the metal rich part of the oxidized catalyst which is generally the
top of the particle. Hence, the use of oxidized catalysts will lead to a base
growth model. Conversely, in the case of metallic catalyst, carbon diffuses into
the whole particle and it preferentially deposits on the edge of the catalyst
particle which leads the tip growth model. Contrary to the study summarized
above by Bernier et al. (61), there are studies suggesting the effect of the buffer

18
(support) layer and the interaction between the buffer and catalyst layers on the
growth models (62–64). Furthermore, the pretreatment and growth conditions
also govern the growth mechanism. Hence, the growth models for CNTs should
be considered case-by-case for each individual system.
Representative drawings show the (a) base and (b) tip growth models of CNT. Figure 9.
2.3 Synthesis of vertically aligned carbon nanotubes
Through the advances in the growth techniques, the synthesis of CNTs is no
more a significant struggle. Yet, starting with the last decade, the current
challenge is to synthesize aligned CNTs on a desired surface for various
applications. For example, in the field of thin film transistors, while the best
reported electron mobility for the randomly scattered CNTs is around 30 cm2V
-
1s
-1, it is 1300 cm
2V
-1s
-1 for aligned ones (65, 66). Moreover, it is reported that
the use of powdered CNTs could be toxic for cells, which is in contrast to the
(a)
(b)

19
studies noting the affirmative effects of the aligned and attached CNTs on the
viability of cells (67, 68).
In the literature, well-oriented CNTs have been successfully synthesized mostly
using the CVD method due to the earlier mentioned advantages of the technique
(69, 70). The orientation of CNTs could be controlled either in horizontal (71) or
vertical direction (8). Generally, well-oriented CNT arrays do not contain
impurities and almost all of them are identical in terms of size. Other than direct
growth of aligned CNTs, there are post synthesis assemblies for controlling the
alignment of randomly scattered CNTs. The post synthesis techniques involve
dispersing CNTs in liquid solutions and then orienting them using spin coating,
and with the application of magnetic and electrical fields (72). Although the post
synthesis methods are relatively simple to apply, they have problems leading
more defects and contamination due to the used liquid solutions for dispersion
(72).
The first synthesis of VA-CNTs was achieved by Li et al. at 1996 (73). In the
report, VA-CNTs were synthesized by CVD technique using iron nitrate
embedded in mesoporous silica (Figure 10a - c) (73). SEM and TEM analysis
indicated that the CNTs were thick and short. As mentioned before, flammable
gases such as methane (29), acetylene (30), ethylene (31) are commonly used
for CVD and these hydrocarbon sources decompose on the catalyst surface by
leaving excess carbon behind causing the termination of VA-CNT growth.

20
Hence, later on, Hata et al. at 2004 has shown that by the addition of small
amounts of water vapor in the synthesis environment, the accumulated extra
amorphous carbon on the catalyst was removed allowing for taller VA-CNTs
(8). Hata and his group produced the millimeter tall VA-CNTs as a result of the
increased catalyst lifetime and activity by water vapor addition and called this
process as “super-growth” (Figure 10d) (8).

21
(a-c) The first reported VA-CNTs by Li et al. at 1996 (73). (d) By Hata et Figure 10.
al., the millimeter tall VA-CNTs synthesized using water assisted CVD are
compared with a match for a size reference (8).
As mentioned before, the purity of VA-CNTs is one of the most important
parameters for applications in the electronics and material science fields. It was
found that the addition of oxygen containing species to the reaction chamber
during the growth of CNTs had a great effect on the size and purity of VA-
(a) (b)
)
(a)
(c)
(d)

22
CNTs and these oxidative species were called “growth enhancers” (8, 41, 74,
75). Particularly, the water addition had an significant impact when hydrocarbon
sources are used to synthesize CNTs (9, 76). Furthermore, there are recent
studies in the literature for the use of growth enhancers other than water vapor
such as carbon dioxide (CO2) and oxygen (O2) to synthesize impurity free and
longer VA-CNTs (77, 78). In these reports, it was found that CO2 and O2 had the
same role as an etching agent to keep the catalyst from poisoning. Contrary to
the study reporting the enhancing effect of O2 on the catalytic activity (78),
Hauge et al. reported that even trace amounts of O2 could be detrimental for the
catalyst (79). It is likely that water may react with the catalyst and could be
saturating the surface with hydroxyl groups (79). In the case of CO2, H2 gas
should be introduced into the growth environment to result in reaction with CO2
to form water and which then achieves the surface hydroxylation as well as the
etching of excess carbon (Rxn. 1 and 2). Moreover, Hauge et al. suggested that
the surface hydroxylation also keeps the catalyst from coarsening (79).
CO2(g) + H2(g) CO(g) + H2O(g) (Rxn. 1)
C(s) + H2O(g) → CO(g) + H2(g) (Rxn. 2)
Other than hydrocarbon sources, alcohols are another one of the commonly used
carbon sources during CVD method for the growth of VA-CNTs (33, 34).
Alcohol usage for the VA-CNT synthesis provides a significant advantage in
discarding the amorphous carbon formation on the catalyst surface without

23
introducing any extra oxidative compounds such as water and CO2. During
synthesis in the CVD furnace, alcohols are decomposed into species containing
OH radicals which can efficiently remove the unwanted amorphous carbons
from the catalyst surfaces and etch away the ends of the CNTs keeping them
clean (80, 81). In a study by Oida et. al., the effect of various alcohol sources
such as methanol (CH3OH), ethanol (C2H5OH) and isopropanol (2-C3H7OH) on
the growth of VA-CNTs using hot filament CVD reactor has been investigated
(82). In the study, they reported that the shortest CNTs were grown with
methanol, while ethanol resulted in the longest CNTs (82). Hence, it was
suggested that the growth rate is a competing race between two mechanisms;
deactivation (oxidation) and poisoning (amorphous carbon coating) of the
catalyst and it is not simply related with the ratio of C/OH. It is reasonable to
compare the decomposition rate of alcohols using their standard enthalpy of
formation. Ethanol has a higher enthalpy value than methanol meaning to a
slower decomposition than methanol as well as the slower generation of
oxidative species. Hence, the growth of CNTs would be expected to be affected
by the rate of these competing reactions (82). In the literature, there are also
reports indicating the effect of carbon precursors on the quality of CNTs (83–
85).
As mentioned before, the carbon source is not the only parameter influencing
the growth and properties of VA-CNTs. The configuration and thickness of
catalyst and buffer (support) layers are used to control whether the growth

24
would be in vertical or horizontal directions. Mostly, PVD techniques are
preferred to be used in depositing the catalyst layers. Recently, the studies done
by McLaughlin et al. (86) and Liao et al. (87) investigated the effect of the
aluminum (Al) buffer layer thickness on the growth of VA-CNTs. It was found
that thin Al layers with an average thickness around 5 nm was the optimum for
growing longer VA-CNTs compared to the thicker Al layers. Two possible
mechanisms were suggested for the increase in length of CNTs with decreasing
in Al thickness. The first one is that the retardation of carbon diffusivity in the
catalyst with increasing Al content resulting the slower growth and the second is
the change in the size of the catalyst islands subjected to the thermal treatment
(86, 87). The catalyst islands grow as the thickness of buffer layer increases as
shown in Figure 11. In another report done by Burt and co-workers, the effect of
Al grain size was studied on the CNT growth (88). The grain size of Al buffer
layer was altered by elevating the temperature during the Al deposition process.
It is found that the highest deposition temperature of Al layer resulted in the
tallest VA-CNT length due to the reduced grain size of Al layer. Moreover, it is
also reported that the grain size of Al layer was higher on the silicon oxide
(SiO2) than Si surfaces due to the wetting properties of Al on the Si based
surfaces (88).
25
SEM images of the catalyst islands formed on (a) 0.5 nm and (b) 6 nm Al Figure 11.
buffer layer (86).
Commonly, VA-CNTs are grown on the Si and Al based substrates due to their
possible electronic applications. Moreover, there are a number of studies using
quartz and glass for the VA-CNT growth (42, 89, 90) as well for the growth of
horizontally aligned CNTs (91). In another study, Al, Al2O3, TiN, and TiO2
coatings were used as support layers to synthesize VA-CNTs using CVD
technique (92). It is found that the CNTs was not aligned on the Al and TiO2
layers while the well aligned CNTs was observed on the Al2O3 surface as well as
on the TiN substrates (Figure 12). Hence, it was suggested that the chemical
state of the catalyst islands during the growth process changed according to the
type of buffer layer (92).
(a) (b)

26
SEM images of CNTs on Si substrates with TiN, TiO2 and Al2O3 buffer Figure 12.
layer (92).
Beside the effect of buffer layers on the growth, the activity of catalyst layers
was also found to be strongly depending on the type of carbon source. A survey
of literature shows that there is selective matching between the catalyst particles
and the carbon source to enhance the performance of the catalyst. In a study by
Choo et al., it is reported that the growth rate of VA-CNTs on the Fe catalyst
layer was higher than Co and Ni where ethylene was used as the carbon source
(93). However, the growth rate enhancement is not the only effect on the CNTs.
TEM images showed that the degree of crystallinity of the CNTs changed with
the catalyst type. It was suggested that the rate of bulk diffusion of carbon atoms
determined the growth rate which could be affecting the defect formation and

27
(93). Also, other studies reveal that Fe as a catalyst performs better for
decomposing hydrocarbon sources while alcohol based sources are cracked on
the Co catalyst layer more efficiently (94–96). The possible reasons for the
selectivity are the decomposition rate differences for each carbon sources on the
catalysts and the deactivation rate of the catalysts. It is reported that Co can be
easily deactivated by the accumulation of amorphous carbon on the surface than
Fe and thus the use of alcohols as carbon sources would help to extend the
catalyst life by etching a way the excess carbon (94).
2.4 Vertically aligned carbon nanotubes as multi-
functional surfaces
CNTs have fascinating for scientists due to their unique properties leading to
their possible applications in numerous fields. Since the last decade, aligned
CNTs are becoming more popular due to the simple handling, denser and
orientated arrangement. Hence, there are reports using VA-CNTs for potential
applications as field emission materials (97), sensors (98), supercapacitors (99)
and catalyst support (100). In this section, the applications of VA-CNTs for Li-
ion battery materials and biological scaffolds will be discussed.
Anode material for lithium ion battery 2.4.1
A typical Li-ion battery consists of a conducting electrolyte and two electrodes;
an anode (made of carbon based materials) and a cathode (made of a Li-

28
containing metal oxide) (Figure 13). During charging process, Li ions are
extracted from the cathode and diffuse into the anode and intercalation of Li into
the carbonaceous anode takes place. Upon discharge, Li ions are delivered by
the anode and inserted into the cathode. During charge-discharge cycles, a
passive layer forms on the anode comprising of organic and inorganic
decomposed electrolyte in the first charging cycle. This layer is named solid
electrolyte interphase (SEI) and consumes some of the Li irreversibly.
Working principle of Li-ion battery showing the charge-discharge cycle Figure 13.
Carbon based materials are the primary candidates for electrode applications in
Li-ion batteries due to their structural stability (101). However, there exist some
limitations for the use of conventional carbon based materials which are slow
ion diffusion, low surface area, low lithiation capability and poor conductivity.
To overcome these disadvantages, the introduction of CNTs as an electrode
material has been studied to provide higher lithiation and an overall better

29
performance (102–104). Furthermore, there are reports in the literature for
improving Li adsorption capacity of the CNT based anodes by numerous ways
such as doping, functionalizing, defect engineering, hybridizing CNTs with
fullerenes and ex situ doping of CNTs with Li (103, 105).
VA-CNTs are recently used as electrodes to enhance the conductivity and the
rate capacity for the charge transfer (104, 106, 107). Moreover, the alignment of
CNTs increases the Li ion diffusion during the charge cycles. Durstock et al.
have shown the enhancement in the storage and rate capacities of anode
materials when as synthesized VA-CNTs were used as electrodes (104). These
values were even higher than the ones for the graphite and randomly scattered
CNTs emphasizing the role of alignment (101, 103). Further improvement in the
conductivity has been studied by using VA-CNTs grown on stainless steel
substrates (108).
Beside the carbon based structures, Si material would be used as an anode which
has the highest specific capacity even higher than graphitic carbon. However, it
has two major limitations; very fragile due to the high volume expansion during
charging and non-conductive material. Hence, new hybrid structures are
proposed to overcome the limitations of Si and CNTs. Recently, there are
studies using composite materials made of VA-CNTs and Si (106, 107). In
these, VA-CNTs were first synthesized and then decorated with Si
nanoparticles. As a result of electrochemical tests, it is found that such a hybrid

30
material exhibited the best rate capability ever reported for Si based and VA-
CNT based electrodes (106, 107). Moreover, there was no structural damage
observed for CNTs (106, 107).
Extracellular matrix for cells 2.4.2
In recent years, owing to the multiple-lineage potentials and immune-privileged
properties, MSCs have become a feasible and potential source for the cell-based
therapy and tissue engineering applications due to their proliferative and
differentiation capabilities. MSCs, which are also called as bone marrow stromal
cells, have the ability to differentiate into other types of cells such as adipocytes,
chondrocytes, osteocytes and cardiomyocytes without inducing any immune
reactions in the host.
A key issue in MSC based tissue engineering is to control the growth and
differentiation of cells. Extracellular matrix (ECM) has an important role in
proliferation and differentiation of MSCs (109). Commonly, used ECMs are
consists of protein fibers such as collagen and elastin and these are extracted
from animal tissues. However, these structures are limited by the dimension and
the potential pathogen risk (110). Therefore, there has been a tremendous
demand to develop better scaffolds which mimic the surrounding native tissue.
As an alternative to common used scaffolds, CNTs can be considered due to the
similar sizes with collagen fibers (111). Giersig et al. formed regular 3D

31
patterns on the surface of VA-CNTs and then fibroblast cells were successfully
grown on the surface (112). Moreover, VA-CNTs have also been reported as a
suitable scaffold material due to their superb electrical conductivity to guide the
growth of cells (113).
The used form of CNTs in cell experiments has a profound role at the viability
of cells. While the powder and liquid use of MWCNTs induced DNA damages
in mouse embryonic stem cells (67), Corat et al. (68) and Giersig et al. (114)
reported that adhesion and growth of fibroblast cells was achieved successfully
without having any toxic effects of VA-CNTs which were already attached
firmly to a substrate. Later, further cell viability tests were conducted using VA-
CNTs and cells and Corat et al. reported that VA-CNTs are not toxic to cells
(68, 115). Regarding to these reports in the literature, the use of VA-CNTs could
provide a great advantage for biomaterial applications.

32
Chapter 3
Materials and Method
In this chapter, the synthesis and characterization techniques are briefly
described. The first section of this chapter reviews the experimental procedure
followed during the work for the synthesis and application of VA-CNTs using
ACCVD method. In the following section, characterization techniques and
parameters used for the physical and chemical analysis of the surfaces are
reviewed.
3.1 Experimental procedure and equipment
In this study, ACCVD method was used to synthesize VA-CNTs. The alignment
of CNTs was easily managed using this technique which consists of three steps
(Figure 14);
- Step 1: preparation of catalyst layers
- Step 2: annealing of catalyst layers
- Step 3: growth of VA-CNTs
For the first step, two different catalyst preparation methods were followed for
different purposes in this study. One of these is based on the thin film
33
technology achieved by PVD techniques while the other is the wet chemistry
based method. These techniques will be described particularly at the following
section. After the preparation of catalyst layers, the surfaces were conducted to
Steps 2 and 3 inside the ACCVD furnace. Figure 14 shows the summary of
catalyst preparation methods as well the steps performed inside the ACCVD
furnace.
Schematic representation shows three steps for the synthesis of VA-CNTs; Figure 14.
preparation of catalyst layers, annealing and growth. The annealing and growth
steps are performed inside an ACCVD furnace.

34
Preparation of catalyst layers 3.1.1
3.1.1.1. Physical vapor deposition method
First, a pre-cleaned Si (100) wafer was oxidized thermally at 900 °C for 30
minutes to have a 30 nm thick layer of SiO2. This SiO2 layer on the Si wafer was
used as a substrate in this study. Following the oxidation step, Al layer was
deposited on a SiO2 wafer using a thermal evaporation system at 2 × 10⁻⁶
mbar
pressure with an average deposition rate of 0.5 Å/sec (Figure 15a). The
thickness of Al layer was varied as 3, 5, 7 or 10 nm. Al pellets with a purity of
%99.9 were used as Al source in the thermal deposition system (Ted Pella Inc.).
The purpose of the bottom Al layer in this study is to inhibit the diffusion of
catalyst particles to the substrate and to minimize the agglomeration of particles
during the ACCVD process. Subsequently, a 1 nm thick catalyst layer either Fe
or Co was deposited on the top of Al layer using the electron beam (e-beam (I))
deposition technique (Figure 15b). During the e-beam (I) deposition, the
chamber base pressure was kept around 10-7
Torr and the deposition rate was 0.1
Å/sec. Fe and Co powders with high purities were used for e-beam (I) (Sigma
Aldrich, %99.99). In this study, substrates after the catalyst layer depositions
which are ready for ACCVD growth are defined as 1nm Co/10nm Al and also
named as “normal catalyst configuration” (Figure 16). Other than this design, a
sandwich catalyst configuration was also used where a second layer of Al (top
Al layer) was deposited on the catalyst layer to pin and inhibit the coarsening of
catalyst particles (Figure 16). 0.5 nm thick Al layer was put on a 1 nm thick

35
catalyst layer using the e-beam (I) deposition system at 0.1 Å/sec rate under 10-7
Torr pressure (layer configuration is 0.5nm Al/1nm Co/10nm Al). The samples
prepared by using PVD methods were used for the experiments performed to
understand the effects of parameters and growth mechanism of VA-CNTs.
Photograph of (a) thermal and (b) e-beam (I) evaporation systems. Figure 15.
Drawings for the catalyst configurations used in the experiments. Figure 16.
(a) (b)

36
Beside the use of e-beam (I) deposition, another PVD instrument; EBE-4 (II)
was also used for the deposition of Co catalyst layer on the 10 nm thick Al layer
(Figure 17). The deposition using the EBE-4 (II) instrument is also based on the
electron beam deposition technique. However, using this instrument provides a
valuable advantage for the analysis of catalyst layers without exposing layers to
air due to vacuum transfer ability between the chamber of EBE-4 (II) and the
chamber of X-ray photoelectron spectroscopy instrument (XPS). Using the
EBE-4 (II), 1nm thick Co catalyst layers were deposited on the 10nm thick Al
layers with a rate of 0.05 Å/sec while a second layer of Al was not coated on
these samples (indicated as 1nm Co●/10nm Al). %99.999 purity of Co rod was
used as a metal source (Ted Pella Inc.). This deposition technique was only used
when the catalyst layers will be analyzed by XPS without exposing to air.
Photograph of EBE-4 (II) system mounted with XPS. Figure 17.

37
3.1.1.2. Wet chemistry method
VA-CNTs were also grown on the catalyst layers prepared through the wet
chemistry technique which is based on dissolving nitrates of cobalt
(Co(NO3)2.6H2O), aluminum (Al(NO3)3.9H2O) and lithium (LiNO3) and then
subsequently coating the substrates using the mixture of these solutions. In this
study, VA-CNTs grown on catalyst layers prepared through the solution based
method were only used for Li intercalation study.
For Li intercalation study, two types of catalyst solutions were prepared. The
first one was a Li containing catalyst solution prepared by dissolving
Al(NO3)3.9H2O, Co(NO3)2.6H2O and LiNO3 (molar ratio of Al/Co/Li is 1/1/1.4)
mixture in 10 ml ethanol, and the second was without Li. The second catalyst
solution was which Al(NO3)3.9H2O and Co(NO3)2.6H2O (molar ratio of Al/Co:
1/1) were mixed in 10 ml ethanol solution. All the reagents were from Sigma
Aldrich (ACS reagent ≥ 98%). After mixing these two solutions for an hour on a
magnetic stirrer, the corresponding solution was applied on the oxidized Si
(100) substrates (1 × 1 cm2) by using a micropipette (volume of solution is about
40 µL). Then, the substrates were left for air drying under ambient conditions.
Following these steps, the substrates were treated in the ACCVD for the growth
of Li intercalated VA-CNTs.

38
Synthesis of vertically aligned carbon nanotubes 3.1.2
The synthesis of VA-CNT forests were achieved using an ACCVD furnace
designed and built in the Department of Chemistry at Bilkent University (Figure
18). As mentioned before, ACCVD process is consists of two steps, annealing of
catalyst layers (Step 2) and growth of CNTs (Step3). The prepared catalyst layer
was first subjected to the annealing process and then to the growth process
inside the ACCVD furnace under a controlled atmosphere.
Photograph and schematic drawing of the ACCVD experimental set up. Figure 18.

39
In the annealing step, a catalyst layer was reduced at either temperature of 625
°C or 750 °C and pressure of 4 Torr under a flowing atmosphere of 20 sccm H2
and 100 sccm Ar. This step is also called as reduction (annealing) step which is
required to have uniform catalyst islands on the Al/SiO2 layer for initiating the
CNT growth. During this study, optimization of the reduction step was
performed at 625 °C by varying the reduction time; 5, 10, 15, 20, 30 and 60
minutes.
Following the reduction step, the annealed catalyst layer was conducted to the
growth inside the ACCVD furnace either at temperature of 625 °C or 750 °C.
During the growth, 100 sccm Ar and 20 sccm H2 gases are flowed through a
bubbler containing the liquid carbon source to sweeping its vapor to the furnace.
To keep the temperature of liquid carbon source constant during the growth, the
bubbler is placed inside a water filled tank kept at 32 °C unless otherwise
mentioned. For this study, as for the liquid carbon sources toluene, benzene,
ethanol, acetone and isopropanol were used for the growth. If otherwise is not
mentioned, the growth process was run for 30 minutes at 40 Torr pressure.

40
3.2 Characterization techniques
Raman spectroscopy 3.2.1
Micro Raman equipment (Horiba Ltd., LabRAM HR model, Kyoto, Japan) was
used at the wavelength of the Ar ion laser, 514.5 nm. In order to calibrate the
instrument before data collection, the spectrum was adjusted to zero
wavenumber. All Raman data in this study was collected with 600 groove/cm
grating using a 50× objective lenses and averaged for 10 times. Deconvolution
of Raman spectrum was performed with the aid of spectral analysis software
(Peak Fit version 4.12). To obtain D and G band positions and intensities, a
spectrum was fitted using a function of Gaussian–Lorentzian type peak fitting.
Atomic force microscopy 3.2.2
AFM (Nanomagnetics Ltd.) analysis was performed on the prepared and
annealed catalyst layers using contact mode with a force constant of 0.7 – 1 V.
512 × 512 resolution AFM images were taken with a scan speed of 0.6 µm/s
while there was no applied bias voltage to the samples. All topography images
were equalized in x and y directions to correct the plane. No image filtering was
applied during data processing.

41
Scanning electron microscopy 3.2.3
SEM (Carl Zeiss Evo 40) with an energy-dispersive X-ray (EDX) spectrometer
was used for imaging samples. For determining alignment and length of CNTs,
VA-CNT sample grown on Si wafers was prepared as following; first it was cut
into two parts and then pasted on a 90° tilted stub for side view imaging. A
relatively high voltage setting (10 kV) was used for high vacuum mode imaging.
Biological samples (cells on CNTs) were imaged using SEM at low vacuum
mode (at 40 bar of water vapor pressure) to prevent shrinkage of cells. 10 kV
accelerating voltage was set for imaging.
Transmission electron microscopy 3.2.4
For TEM (JEOL 200kX) imaging, VA-CNT samples were prepared by
sonicating the samples in a 10 ml of ethanol. Then, a few drops were taken from
the suspension and dropped onto a copper based holey-carbon TEM grid. High
resolution TEM (HRTEM), Scanning TEM (S/TEM) and low resolution
imaging were made at the accelerating voltage of 300 kV. Electron energy loss
spectroscopy (EELS) mounted in the TEM instrument is utilized to obtain
chemical information about VA-CNTs. In this study, EELS has been used to
understand the chemical structure of CNTs intercalated with Li.
42
X-Ray photoelectron spectroscopy 3.2.5
The XPS analysis were performed in an ultra-high vacuum system with a
background pressure of ~10-10
Torr equipped with XR50M X-ray Source, Focus
500 monochromator and Phoibos 100 analyzer by Specs GmbH. The
photoelectrons were generated by a monochromatic source; Al Kα primary
radiation (power set to 400 Ws). In order to overcome the charging effects, a
flood gun was used with 30 µA current for all spectrum. The pass energy was
set to 25 eV with an energy step width of 0.05 meV and a dwell time of 0.1 ms.
The resultant spectrum for each sample was the average of five scans. The
energy resolution of the equipment is found to be 0.89 eV (full width half
maximum of Ag 3d5/2 peak).
The peak positions for Co 2p were found by a deconvolution process using
Doniach-Sunjic (DS) asymmetric behavior due to the unfilled one-electron
levels (conduction electrons). All peak positions for the catalyst layer samples
were repositioned with respect to C 1s peak at 284.4 eV even; the flood gun was
used to eliminate the charge accumulation. Quantification for the atomic
concentrations was performed by fitting Co 2p and Al 2p peaks using Gaussian-
Lorentizan (GL) behavior with corresponding Scofield factors; 12.6 for Co 2p3/2
and 0.356 for Al 2p3/2. Moreover, Gaussian-Lorentizian fitting was used for the
deconvolution of Li 1s and C 1s peaks in the Li intercalation study.

43
Contact angle measurement 3.2.6
The dynamic contact angle measurements were conducted on the synthesized
VA-CNTs using the contact angle instrument (Dataphysics OCA 15 Plus).
Water was used as the liquid for the wettability properties. 8 µL amount of
water was dropped on the surfaces of VA-CNTs by the help of an automatic
syringe. Contact angle values reported in this work were averaged using three
consecutive measurements.

44
Chapter 4
Results and Discussion
The study presented here has two main purposes; first one is investigating the
growth mechanism of VA-CNTs and second is applying them as biomaterials
and energy materials. The number of studies published on the effect of synthesis
parameters show that there is not an accurate description of effect of growth
parameter for the synthesis of CNTs. Every growth method has its own optimum
parameter set for having the VA-CNTs with desired properties. The future
application fields for CNTs would require more controlled growth of VA-CNTs
having higher densities and desired surface properties. Hence, it is of great
importance to investigate the effect of growth parameters and kinetics of VA-
CNTs. On the basis of this, the effect of growth parameters on the synthesis of
VA-CNTs will be discussed in the first part. Mainly, the diffusion and/or
catalyst deactivation processes govern the acceleration or deceleration of CNT
growth. Thus, in order to probe the mechanisms dominating the growth
termination of VA-CNTs an attempt has been made.
In the second part of this thesis, the applications of VA-CNTs will be discussed.
The synthesized VA-CNTs were used as scaffolds for stem cell seeding. The
aim of this study was to speed up the growth of stem cells on the CNT

45
templates. As another study for functionalization of VA-CNTs, the intercalation
of Li inside the CNTs was studied to enhance the performance of carbonaceous
anode materials.
4.1 Growth of vertically aligned carbon nanotubes
Optimization of catalyst design 4.1.1
In the literature, numerous different ways of catalyst designs were encountered
for the synthesis of VA-CNTs. However, each catalyst configuration is unique
for different synthesis technique and condition. Thus, in this study, the main aim
is to uncover the optimum catalyst configuration resulting in the growth of VA-
CNTs with desired properties by using the ACCVD method. The starting point
for the optimum catalyst configuration is chosen as the simplest and most
common one; a catalyst layer on the top of a buffer layer which is also
designated as normal catalyst design.
The buffer (support) layer deposition plays a key role in the growth of CNTs
(63, 116–118). One of the important effects of the buffer layer is to inhibit the
diffusion of catalyst particles to substrate. The characteristics of CNTs such as
adhesion to a substrate and density could be manipulated by varying the
morphology and chemical structure of support layer. For instance, it was
reported that powdered catalyst and support did not result in a dense CNT

46
growth while well dispersed and continuous thin layers of catalyst on a buffer
layer initiated the growth of VA-CNTs (63).
First, a comparative study on the barrier effect of support layer was conducted
using Fe as a catalyst layer. A Fe layer of 1 nm thickness was deposited on a 30
nm thick SiO2 wafer using an e-beam (I) evaporation method. Then, the
prepared catalyst layer (1 nm Fe/SiO2) was subjected to the annealing and
growth processes at temperature of 625 0C inside the ACCVD furnace. The
SEM image of the 1nm Fe/SiO2 sample revealed the growth of randomly
scattered CNTs on the surface which was far from the main aim of having dense
and aligned CNTs (Figure 19a). Hence as a next step, a 10 nm thick Al layer
was placed beneath a 1 nm thick Fe catalyst layer (1 nm Fe/10 nm Al) to
enhance the density of CNTs. This catalyst layer was subjected to ACCVD
processes in same manner with the 1nm Fe/SiO2 sample. As a result, CNTs were
comparatively denser but still no alignment was achieved (Figure 19b).
SEM image of CNTs grown on (a) 1nm Fe/SiO2 and (b) 1nm Fe/10 nm Al Figure 19.
layers at temperature of 625 0C.
(a) (b)

47
In this study, CNTs synthesized on Si substrates without support layers were
lacking alignment although there were studies in the literature reporting the
growth of CNTs on Si wafers without having support layers (119–122). In some
of these studies, a thick catalyst layer was used to overcome a mass decrease of
catalyst due to a diffusion through a substrate (121, 122). To investigate the
effect of support layer, the diffusivity coefficient (Dc) of Fe in Al and Si layers
were calculated following the Arrhenius equation (Eq. 1). It was found that the
Dc value of Fe/Al sample (~10-10
cm2/s) is less than the Fe/SiO2 sample’s (~10
-8
cm2/s) which was similar to the previous report by Lee et al. (118). This
indicates that the presence of support layer hinders the diffusion of catalyst
particles into a substrate and hence almost all the catalyst islands stay on the
surface during thermal processes. Thus, this may explain the observation of
denser CNT formation on the 1 nm Fe/10 nm Al catalyst configuration
compared to the 1 nm Fe/SiO2 in this study.
(
)
As mentioned in Chapter 2, controlling alignment of CNTs has a vital role for
further possible applications. In the initial experiments, the growth of denser
CNTs on a Fe catalyst layer with the presence of Al was observed but still the
alignment was not achieved (Figure 20a). When cobalt (Co) was used as the
catalyst layer alternative to Fe (1nm Co/10nm Al) and subjected to the ACCVD
processes at 625°C in a same manner, 10 µm tall VA-CNTs were successfully
synthesized (Figure 20b). SEM images show that Co catalyst layer has higher

48
activity than Fe layer for synthesis of VA-CNTs (Figure 20). A survey of
literature on the comparative performance of different catalysts indicates that the
activity of a catalyst layer strongly depends on the type of carbon source used
for the growth. In these studies, it was reported that Co has higher activity with
alcohol based carbon sources while Fe is more active with hydrocarbon sources
such as ethylene or acetylene (94, 123). However, the activity should not only
be counted as an ability of catalyst to decompose a carbon source, it is also
meaning to an ability to solve carbon and to diffuse into the catalyst.
Side view SEM images showing the alignment of CNTs grown on (a) 1nm Figure 20.
Fe/10nm Al and (b) 1nm Co/10nm Al catalyst layers.
The first action of a catalyst is to absorb the molecules of carbon on its surface.
During this interaction, electrons from carbon species are transferred to the
catalyst which has non-filled ‘d’ orbital and the electronic structure of carbon
species changes in a such manner that the dissociation of carbon source occurs.
Therefore, the activity of a catalyst is relevant with its electronic configuration.
This would give a reason why Fe is more active with unsaturated carbon sources
(a) (b)

49
(containing double or triple bonds) while Co is more efficient with saturated
carbon sources (31, 124). Other than the dissociation ability, the carbon
solubility also has a profound effect on the activity of catalysts. After a carbon
source molecule is decomposed on a catalyst surface, carbon atoms are diffused
within the catalyst and a CNT growth starts by the precipitation of carbon.
Therefore, the solubility of carbon on a catalyst should not be underestimated
when the catalyst is evaluated for the activity to grow CNTs.
The annealing step (reduction step) has a vital role in promoting the formation
of catalyst islands due to wetting behavior and surface energy of metals used in
coating. During ACCVD process, there is a competing mechanism between
subsurface diffusion and migration of catalyst particles on the surface (Figure
21). Small particles can diffuse into the support layer over time while others are
mobile on the surface to form bigger particles which is called ‘Ostwald
ripening’. If particles on the surface became larger in size due to the ripening,
there would be no possibility to produce denser and thinner VA-CNTs. In order
to inhibit the diffusion of particles, a sandwich catalyst design has been
developed to produce denser VA-CNTs. In this method, a second layer of non-
transition and inactive metal, which is commonly Mo, Al or MgO, is deposited
on a catalyst layer (125–128) and this second layer stabilizes catalyst particles
on the surface by inhibiting their mobility. In the literature, there are studies
reporting the enhanced catalytic activity of catalyst particles by using the
sandwich catalyst design (126, 127). The possible explanation for the

50
enhancement was that the additives suppressed the formation of secondary
phases of catalysts with the bottom layers which are known to be inactive for
growing CNTs.
Schematic representation showing the subsurface diffusion and coarsening Figure 21.
of catalyst particles on the buffer layer of Al during a heat treatment.
To enhance the density of VA-CNTs in this study, a second layer of Al was
deposited on Co catalyst layer to inhibit the coarsening of Co particles and thus,
the density of particles would be increased by pinning them on the buffer layer
(0.5nm Al/1nm Co/10nm Al). Samples with the sandwich design (0.5nm
Al/1nm Co/10nm Al) was subjected to the ACCVD steps at 625 °C in a same
manner mentioned before. Figure 22a and b show SEM images of VA-CNTs
grown on the 0.5nm Al/1nm Co/10nm Al and 1nm Co/10nm Al layers,
respectively. It was observed that the length of VA-CNTs on sandwich design
was higher than the CNTs grown on normal catalyst configuration. The reason
for the shorter CNTs is the decrease in the activity of catalyst due to the
subsurface diffusion. As shown in Figure 21, the subsurface diffusion of catalyst
particles might lead to a decrease in the number of active particles because of
diffusion
coarsening

51
mass loss. To provide a macroscopic proof for the subsurface diffusion in both
catalyst designs, an analysis was performed on the H2 - reduced and as-deposited
catalyst layers using a surface sensitive technique; XPS. The atomic
concentrations of Co and Al were estimated from XPS spectra for all samples
(Appendix I). In the 1nm Co/10nm Al sample, it was found that there was a
decrease in Co concentration from % 74 to % 11 induced by H2-reduction step.
For the 0.5nm Al/1nm Co/10nm Al sample, the decrease of Co concentration
was from % 51 to % 38 which provided an evidence for the subsurface diffusion
of Co. When the ratios of Co concentration decrease in samples before and after
the reduction step were compared, it was found that the catalyst particles on the
1nm Co/10nm Al sample were diffused more than the particles on the 0.5nm
Al/1nm Co/10nm Al sample. Regarding to these, it was suggested that the top
Al layer pinned the particles by inhibiting their mobility.

52
Side view SEM images of VA-CNTs grown on (a) normal and (b) sandwich Figure 22.
catalyst configurations. HRTEM images of CNTs grown on (c) normal and (d)
sandwich catalyst configurations. (e) Raman spectra of VA-CNTs grown on both
catalyst configurations.
(a) (b)
(d) (c)
(e)

53
HRTEM images of CNTs grown on normal and sandwich catalyst designs
indicated that CNTs had 2 or 3 side walls with an average diameter around 7 nm
(Figure 22c and d). However, the graphitization of CNT sidewalls grown on the
normal catalyst was less than the sidewalls of sandwich design sample.
The presence of top Al layer immobilized the catalyst particles on the surface
and thus, the areal density of VA-CNTs (ρ) would be increased due to an
increase in numbers of active particles on the surface. Recently, there are three
ways to measure the density even none of them provides the exact value. The
first method is counting CNTs in SEM or TEM which is less quantitative.
Another one is based on the weight gain of substrate after the growth process
and the last method is the liquid-induced compaction method (129–132). In
order to compute the density increment of VA-CNTs by catalyst design, the
liquid-induced compaction method was applied to VA-CNTs grown on the
normal and sandwich catalyst configurations comparatively. In this method,
VA-CNTs on the surfaces were soaked into deionized water and as a result of
this; CNTs were compacted to a maximum density due to the wetting / drying
process. The top view SEM images show the top surfaces of VA-CNTs grown
on the normal and sandwich catalyst designs after the compaction process which
help to estimate the filling fractions (F) (Figure 23a and b). The value of F is the
areal ratio of compacted surface to total surface and is calculated using Image J
software by masking the top of compacted areas (Appendix II) (133). The ρ
value of CNTs is expressed with F and d where d is tube diameter determined

54
by TEM images and δ is the theoretical Van der Waals tube distance (0.34 nm)
(Eq. 2) (Appendix III) (134).
√
Top view SEM images of collapsed CNTs grown on (a) normal and (b) Figure 23.
sandwich catalyst designs. 2D contact mode AFM images of (c) normal and (d)
sandwich catalyst designs after reduction process. (e) Size distribution of particles
on both catalyst designs after reduction process.
(a) (b)
(d) (c)
(e)

55
By using the equation, it was found that the density of VA-CNTs on the normal
catalyst design was ~2×10-11
cm-2
while the sandwich catalyst design yielded
~9×10-11
cm-2
CNTs. Based on these values, it is suggested that the presence of
top Al layer increased the density of CNTs. Furthermore, AFM analysis
performed on the H2-reduced 1nm Co/10nm Al (normal) and 0.5nm Al/1nm
Co/10nm Al (sandwich) samples to find out a macroscopic evidence for the
density increment of catalyst particles (Figure 23c and d, respectively). When
2D AFM images were processed for the particle size distribution (w), it was
found that the average value of w for the particles in the sandwich catalyst
design (~12nm) were smaller than the average value of w for the particles in the
normal configuration (~23nm) (Figure 23e). This indicates that during the
thermal annealing, the top Al layer immobilized the particles and hence
inhibited the coarsening. In comparison, the average height value (h) of the
particles was found to be 2 nm for the normal catalyst configuration while it was
5 nm for the sandwich catalyst configuration. The reason for thicker particles in
the sandwich configuration is the presence of second Al layer on the top of
catalyst layer.
Moreover, no CNT growth was observed when the thickness of top Al layer was
increased from 0.5 nm to 1nm. The possible explanation is the full coverage of
catalyst surface by comparatively thicker top Al layer and as a result no catalytic
activity was observed.

56
Table 1 summarizes the properties of catalyst layers and VA-CNTs on both
catalyst designs. Regarding to these, the role of top Al layer is found to be
pinning catalyst particles on surface as shown in Figure 24. Furthermore,
sandwich catalyst configuration (0.5nm Al/1nm Co/10nm Al) yielded denser
and taller VA-CNTs comparatively. Thus, the optimum catalyst design in this
study was the sandwich method where a second layer of Al was deposited on the
catalyst layer (0.5nm Al/1nm Co/10nm Al).
Table 1. The properties of catalyst layers and VA-CNTs on normal and sandwich
catalyst designs.
Normal design Sandwich design
Co/Al %at. before reduction 49 60
Co/Al %at. after reduction 16 47
Average w values (nm) 23 12
Length of VA-CNTs (µm) 4 10
% F 10 40
ρ (cm-2
) 2×10-11
9×10-11
A representative drawing of a sandwich catalyst layer after the reduction Figure 24.
process.

57
Motivated by the earlier studies in the literature, buffer layer thickness was
varied to investigate its effect on growth of CNTs (86–88, 135, 136). As shown
in Figure 25, well aligned CNTs were grown at 625 °C using ethanol as carbon
source on 3, 5 or 7nm thick bottom Al layers having the sandwich catalyst
design. The side view SEM image of VA-CNTs grown on the 0.5nm Al/1nm
Co/10nm Al catalyst configuration was provided previously in Figure 22d. In
order to better understand the height difference of VA-CNTs in respect to
varying Al thickness, contact mode AFM analysis was performed on the
reduced catalyst layers at 625 °C (Figure 25). The images indicated that the
particle size were different for each thickness of Al layer. The values of w were
calculated and it was found that the reduced catalyst particle size on a surface
was widened as the thickness of bottom Al layer increased. Moreover, the length
of VA-CNTs decreased as long as thicker Al buffer layer was used (Figure 25).

58
SEM images of VA-CNTs synthesized at 625 °C using sandwich catalyst Figure 25.
design on varying thickness of bottom Al layer (3, 5, 7 and 10 nm). AFM images of
H2-reduced catalyst layers at 625 °C and the plot for the change of VA-CNT length
and average particle size distribution (w) versus bottom Al layer thickness.

59
In the literature, thicker Al layers have represented more expansion of a layer
which resulted in more porous structures. Thus, this porous morphology could
contribute an increase in carbon adsorption (87, 136). Regarding to this, a
possible explanation of VA-CNT length decrease with respect to thicker Al
layers is the high amount of carbon adsorption due to porous structure of thick
Al layer and thus the growth rate of CNT could be retarded.
Even the high yield of CNT synthesis was not achieved by using 1nm Fe/10 nm
Al catalyst layer, the sandwich catalyst design was also conducted using Fe to
synthesize well aligned CNT arrays at 625 °C using ethanol as carbon source
(0.5nm Al/1nm Fe/10nm Al). While Figure 26a shows SEM image of randomly
scattered CNTs, HRTEM image points that Fe catalyst resulted in thicker CNTs
compared with the CNTs synthesized using Co catalyst (Figure 26b). A
comparison of HRTEM images of CNTs synthesized using Co (Figure 22d) and
Fe (Figure 26b) catalysts indicates that type of catalyst has an important role in
thickening CNTs.
(a) (b)

60
(a) SEM and (b) HRTEM images of CNTs synthesized at 625 °C on the Figure 26.
0.5nm Al/1nm Fe/10nm Al catalyst configuration.
Optimization of annealing step 4.1.2
In the previous section, it was found that denser and oriented CNTs were grown
on Co catalyst layer which had sandwich design. But the catalyst design is not
the only factor affecting the density and orientation of CNTs as well as the
nucleation of catalyst particles. The pretreatment parameters such as time and
temperature also have a critical effect on the growth of CNTs. Several
researchers have reported various methods for an annealing process to increase
the growth yield of CNTs by using gas-assisted processes (38, 137–140).
The majority of the research has been focused on gaining control over the
growth of VA-CNTs. Thus, a study has been performed on the sandwich
catalyst layers to better understand the effect of reduction step on the growth of
VA-CNTs. The catalyst layers having 0.5nm Al/1nm Co/10nm Al configuration
have been reduced at 625 °C and 4 Torr pressure under Ar/H2 atmosphere for 5,

61
10, 15, 20, 30 and 60 minutes. Then in a same manner, all of them were
subjected to the growth step at 625 °C using ethanol as a carbon source for 30
minutes. As shown in SEM images (Figure 27a-g), it was found that randomly
scattered CNTs were only grown on non-reduced catalyst layer while well-
ordered VA-CNTs were synthesized on reduced layers. The plot in Figure 27h
shows how the length of VA-CNTs changes with respect to reduction time. The
plot points a decrease in the growth rate of CNTs as the reduction process time
was prolonged. The optimum reduction time for the highest VA-CNT growth
was found to be 15 minutes at the growth temperature of 625 °C. A possible
explanation of the decrease in the growth is the depressed catalytic activity since
catalyst diffuses more as the reduction process is prolonged. To better
understand the effect of time on the catalyst restructuring, SEM analysis were
done on as-deposited and H2-reduced sandwich catalyst films for 15 and 60
minutes (Figure 28). SEM images clearly indicate that deposited film is a
discontinuous thin layer due to the Volmer-Weber film nucleation (141) and no
active islands were formed without the reduction process (Figure 28a).
Moreover, a comparison of SEM images of 15 minutes and 60 minutes reduced
catalyst layers indicates that catalyst particle sizes are getting bigger as the
process time prolongs. All these suggest that islands are coarsening and
diffusing more at longer thermal processes and hence 15 minute reduction at
temperature of 625 °C is the optimum window for longer VA-CNT growth.

62
(a-h) SEM images of VA-CNTs grown on the non-reduced and H2-reduced Figure 27.
sandwich catalyst layers at 625 °C for 5,10, 15, 20, 30 and 60 minutes, respectively.
(h) The plot shows changes in the length of VA-CNTs by reduction time.
(a) (b)
(d) (c)
(e)
(f)
(f)
(h) (g)
(f)

63
Top view SEM images of (a) as-deposited and H2-reduced at 625 °C for (b) Figure 28.
15 minutes and (c) 60 minutes sandwich catalyst layers.
To find out the catalyst state, XPS analysis has been cemployed on the catalyst
layers before and after the H2-reduction process at 625 °C for 15 minutes. In this
part, two different types of catalyst layer were used to better understand the
effect of air exposure. First type was the typical sandwich configuration
(0.5nmAl/1nmCo/10nmAl) deposited using e-beam evaporation (I) technique
and it was identified as “1nm Co●” in Figure 29. The second type layer was
1nm Co/10nm Al configuration deposited using EBE-4 (II) evaporation system
which was already mounted in the XPS instrument. This type catalyst layer was
(a) (b)
(c)

64
designated as “1nm Co*” in Figure 29. 1nm Co● layer before reduction process
(as-is) had Co 2p3/2 peak at 781.1 eV with a small shoulder at lower binding
energy while Co 2p1/2 peak appeared at 797 eV (Figure 29a and Table 2).
Moreover, a broad shake-up satellite (designated with s letter in Figure 29),
which is the characteristic sign of oxidized Co, was observed for the as-is form
of 1nm Co● layer. In the literature, it was reported that shake-up satellite peak at
5 eV higher than its main peak and a spin-orbit coupling of around 15.5 eV
indicated the formation of CoO (Co in the form of +2 valency) (142, 143). The
catalyst layers deposited using e-beam evaporation (I) technique (1nm Co●)
were have to be exposed to air before transferred to the XPS chamber. Hence, it
was not surprising to observe the oxidized form of Co beside the presence of
metallic Co which was indicated by a small peak around 778 eV (144). As
shown in Figure 28a, the catalyst layers are inhomogeneous on the surface and
this provides more surface area for air oxidation in contrast to thick layers. Even
the reduction process has been performed on the 1nm Co● sample, there was
almost no shift at the position of peaks; still Co was in the form of oxide (Figure
29b). This would be explained by the ACCVD design, where the reduction has
been performed, is not connected to the XPS chamber directly. Hence, the
reduced sample was exposed to air while it was being transferred to the XPS
chamber and resulted in the formation of oxide on the Co layer. In the case of air
exposed thick layer of Co (40nm Co●), both metallic and oxide Co 2p3/2 peaks
appeared at 777.9 eV and 780.2 eV, respectively (Figure 29c). This indicated

65
that some oxidation occurred only on the top few layers of thick Co and
underneath top few layers, Co still remained metallic.
(a-f) XPS spectra of Co 2p regions for various Co layers (● and *, Figure 29.
respectively, indicate that Co layers are prepared using e-beam (I) and EBE-4 (II)
evaporation systems).

66
To better understand the chemical state of catalyst after the deposition, a second
set of deposition had been performed using EBE-4 technique (II) where the
deposition chamber is connected to the XPS analysis chamber and hence
samples after the deposition process were not exposed to air. When a
comparison was done between XPS spectra of samples 1nm Co* air exposed
(Figure 29d) and 1nm Co* no air exposure (Figure 29e), it is clear that there was
a shift towards higher binding energy indicating the oxidation of metallic Co by
air exposure. Moreover, the shake-up satellite peak (s) around 785 eV pointed
the presence of oxides on the 1nm Co* air exposed sample. XPS spectra of thick
Co layer (40nm Co*) deposited using EBE-4 (II) shows clear metallic Co 2p
peaks at 778.2 eV and 793.2 eV contrary to the air exposed 40nm Co● sample.
As a conclusion, it is clear that all catalyst surfaces either deposited using e-
beam (I) or EBE-4 (II) instruments were in form of CoO when exposed to air
even after the reduction process. Thus, an in-situ system is required to figure out
the interaction between Co and Al during the reduction process.

67
Table 2. Tabulation of binding energies of Co 2p peaks for different catalyst
configurations indicating the catalyst state before and after the reduction step.
Binding energy (eV)
Co 2p3/2 Co 2p1/2
(a) 1nm Co● before reduction (as is) 781.1 797
(b) 1nm Co● after reduction 780.6 796.5
(c) 40 nm Co● before reduction (as is) 777.9 / 780.2 793 / 796
(d) 1nm Co* before reduction (air exposed) 779.7 795.5
(e) 1nm Co* before reduction (no air exposure) 778.3 793.3
(f) 40 nm Co* before reduction (no air
exposure)
778.2 793.2
Effect of growth parameters 4.1.3
In this section, growth process parameters such as temperature, carbon source
type and pressure were investigated. Firstly, the effect of carbon source type
under two different growth temperatures was investigated. The sandwich
catalyst design (0.5nm Al/1nm Co/10nm Al) was applied for the synthesis of
VA-CNTs using ethanol, acetone and isopropanol as carbon sources under a
flowing atmosphere of 100 sccm Ar and 20 sccm H2 at 625 0C or 750
0C for 30
minutes. The reduction step for these experiments was conducted in a same
manner discussed before at relevant temperatures, 625 0C or 750
0C.
Figure 30 shows the SEM images of synthesized VA-CNTs at temperature of
625 0C using ethanol, acetone and isopropanol as carbon sources. There was no

68
apparent difference in length of VA-CNTs synthesized using different carbon
sources and they were at average height of 6 µm. However, the difference in the
alignment of CNTs was distinguishable. VA-CNTs synthesized using ethanol
and isopropanol were well aligned while it was curly and entangled when
acetone was used.
SEM images of VA-CNTs synthesized at 625 °C using ethanol, acetone and Figure 30.
isopropanol as carbon sources.
SEM was not the only technique to characterize VA-CNTs. Raman spectroscopy
was also conducted to investigate the effect of carbon source type on
crystallinity and defectiveness of CNTs. As mentioned before, CNTs have two
characteristics peaks; D and G bands appear around 1340 cm-1
and 1595 cm-1
,
respectively and second order 2D band is the overtone of D band frequency.
While intensity ratio of G to D bands (I(G/D)) provides a measure for the
defectiveness of sample, intensity ratio of 2D to G bands (I(2D/G)) points out
the amount of side wall crystallinity of CNTs. If I(G/D) value is high, it means
that CNTs are comparatively less defective. When I(2D/G) value is
comparatively higher, it indicates that CNTs are better crystallized. Raman
spectra of VA-CNTs grown at 625 °C using varying carbon source was provided

69
in Figure 31a. Furthermore, the values of I(G/D) and I(2D/G) of VA-CNTs
grown using acetone were the highest one when compared to others (Figure
31b). This indicated that VA-CNTs grown using acetone had less defective
structure and less amount of amorphous carbon while they were having well
crystalline sidewalls. It is well known that acetone is ketone and has one
unsaturated double bond with oxygen (C=O) which has different chemical
structure when compared to alcohols. Furthermore, lower formation enthalpy of
acetone (ΔHf ~ -247 kJ/mol at 880 K) points that the decomposition of acetone
would be easy to occur compared to other carbon sources. However, a carbon
atom in the C=O group does not participate in formation of CNT (84). This
carbon atom involves in formation of CO molecule. Hence, fewer amounts of
carbon molecules involves in the growth of VA-CNTs and this would be
responsible for less amorphous carbon presence and better crystalline structure
of CNTs. But still, alignment is an issue for synthesis of CNTs when acetone is
used as a liquid carbon source.

70
(a) Raman spectra of VA-CNTs grown at 625 °C using acetone, ethanol and Figure 31.
isopropanol as carbon sources. (b) The plot for I(G/D) and I(2D/G) ratios of VA-
CNTs versus carbon sources.
(a)
(b)

71
The alignment of VA-CNTs was achieved at 625 °C in case of ethanol and
isopropanol usage where both sources have one bonded OH groups (Figure 30).
However, it was found that ethanol as carbon source resulted in less defective
CNTs (Figure 31b). In use of alcohols as carbon sources, OH group acts as
etchant and protects the surface of catalyst from poisoning. Excess carbon is not
the only species being etched by OH groups but also grown CNTs would be
etched. For that reason, in case of alcohol use CNTs would have more defect
comparatively and as a consequence they would have lower I(G/D) ratio.
Regarding to this, it was reasonable that VA-CNTs synthesized using alcohol
sources resulted in relatively higher defect density. When ethanol and
isopropanol cases were examined, ethanol case resulted in lower defect density
in the CNTs which is most probably due to a smaller ratio of C/OH for ethanol.
Moreover, a lower formation enthalpy of ethanol compared to isopropanol
favors ethanol decomposition more easily (82, 84).
Beside the lower growth temperature, VA-CNTs were also synthesized at 750
°C using ethanol, acetone and isopropanol in same manner described above. In
Figure 32, SEM images of VA-CNTs show that there was a significant increase
in length of CNTs when acetone was used. It was the ‘tallest’ VA-CNTs ever
synthesized in this study with almost 200 µm in length. Although, CNTs seemed
well aligned at low magnification images for the acetone case, they were curlier
compared to others at higher magnified images.

72
SEM images of VA-CNTs synthesized at 750 °C using ethanol, acetone and Figure 32.
isopropanol as a carbon source.
Raman spectra of VA-CNTs synthesized at high growth temperature, 750 °C,
was shown in Figure 33a. D and G bands were almost at similar wavenumbers
for each carbon source. However, RBM mode only appeared at 220 cm-1
and
240 cm-1
for VA-CNTs synthesized using ethanol and this indicated the
presence of SWCNTs in major amount of MWCNTs. The highest I(G/D) ratio
value was found for the ethanol case which indicated the lower defect density in
VA-CNTs as shown in Figure 33b. Hence, it was found that at higher growth
temperature, ethanol resulted in better quality of CNT arrays. In the case of
acetone, the tallest arrays were observed for this study and this might lead more
amorphous carbon presence in the sample grown at 750 °C which resulted in a
lower I(G/D) ratio compared to the case at 625 °C.

73
(a) Raman spectra of VA-CNTs grown at 750 °C using acetone, ethanol and Figure 33.
isopropanol. (b) The plot for I(G/D) and I(2D/G) ratios of VA-CNTs versus carbon
sources.
(a)
(b)
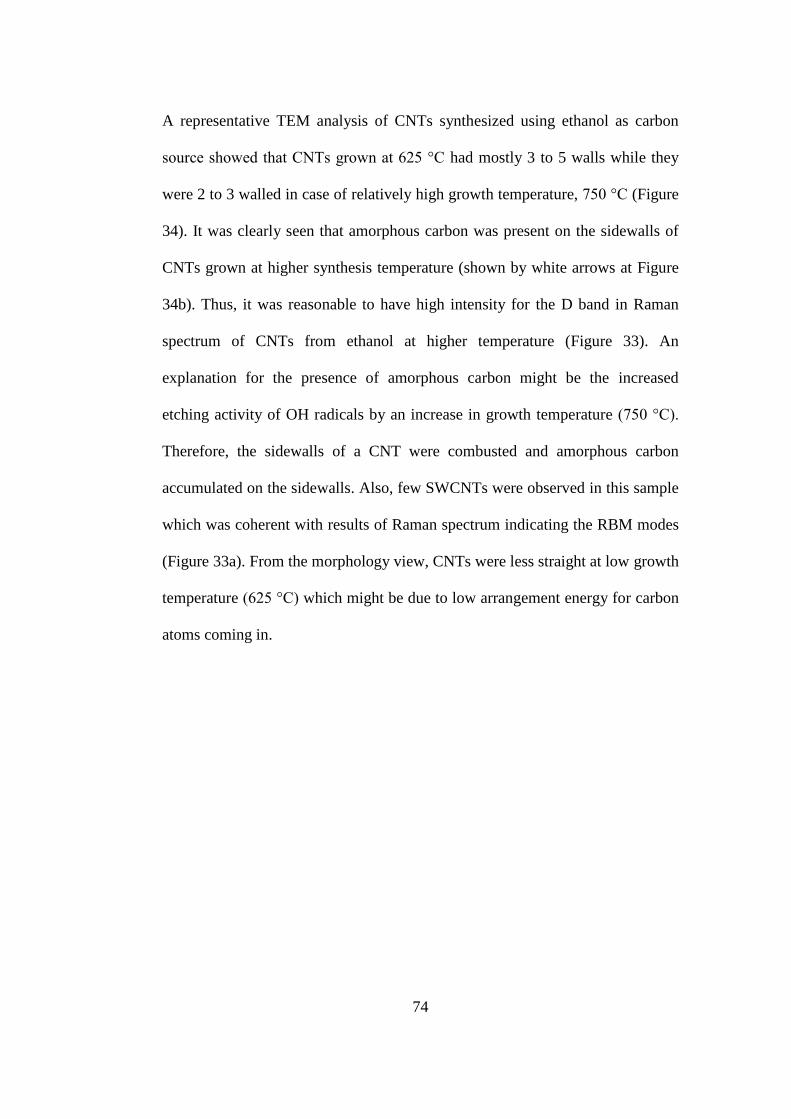
74
A representative TEM analysis of CNTs synthesized using ethanol as carbon
source showed that CNTs grown at 625 °C had mostly 3 to 5 walls while they
were 2 to 3 walled in case of relatively high growth temperature, 750 °C (Figure
34). It was clearly seen that amorphous carbon was present on the sidewalls of
CNTs grown at higher synthesis temperature (shown by white arrows at Figure
34b). Thus, it was reasonable to have high intensity for the D band in Raman
spectrum of CNTs from ethanol at higher temperature (Figure 33). An
explanation for the presence of amorphous carbon might be the increased
etching activity of OH radicals by an increase in growth temperature (750 °C).
Therefore, the sidewalls of a CNT were combusted and amorphous carbon
accumulated on the sidewalls. Also, few SWCNTs were observed in this sample
which was coherent with results of Raman spectrum indicating the RBM modes
(Figure 33a). From the morphology view, CNTs were less straight at low growth
temperature (625 °C) which might be due to low arrangement energy for carbon
atoms coming in.

75
TEM images of VA-CNTs synthesized at temperatures of (a) 625 °C and (b) Figure 34.
750 °C using ethanol as carbon source. White arrows show the amorphous carbon
presence on the side wall of a CNT.
(a)
(b)
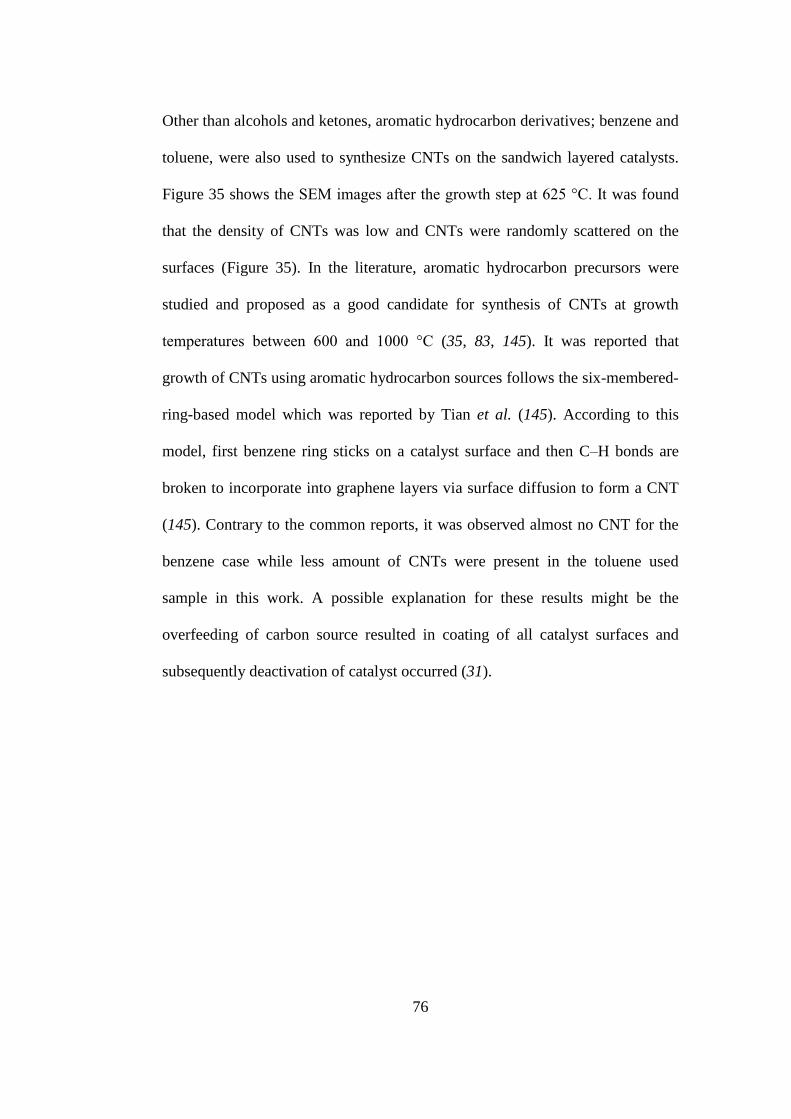
76
Other than alcohols and ketones, aromatic hydrocarbon derivatives; benzene and
toluene, were also used to synthesize CNTs on the sandwich layered catalysts.
Figure 35 shows the SEM images after the growth step at 625 °C. It was found
that the density of CNTs was low and CNTs were randomly scattered on the
surfaces (Figure 35). In the literature, aromatic hydrocarbon precursors were
studied and proposed as a good candidate for synthesis of CNTs at growth
temperatures between 600 and 1000 °C (35, 83, 145). It was reported that
growth of CNTs using aromatic hydrocarbon sources follows the six-membered-
ring-based model which was reported by Tian et al. (145). According to this
model, first benzene ring sticks on a catalyst surface and then C–H bonds are
broken to incorporate into graphene layers via surface diffusion to form a CNT
(145). Contrary to the common reports, it was observed almost no CNT for the
benzene case while less amount of CNTs were present in the toluene used
sample in this work. A possible explanation for these results might be the
overfeeding of carbon source resulted in coating of all catalyst surfaces and
subsequently deactivation of catalyst occurred (31).

77
CNT surfaces after the growth step at 625 °C using (a) benzene and (b) Figure 35.
toluene as carbon sources.
As a summary, it was found that alcohols and ketones would be a good
candidate for the synthesis of well aligned and denser CNTs while aromatic
hydrocarbons were not sufficient under these ACCVD growth conditions.
Raman and SEM analysis showed that VA-CNTs synthesized using alcohols
and ketones had different heights and structural properties. For a further step in
(b)
(a)

78
characterizing the properties of VA-CNTs, dynamic contact angle measurements
were employed in order to investigate the wettability properties of surfaces
(Figure 36). In the literature, the numerous studies have been reported on the
wettability of carbon films where mostly VA-CNTs have been declared as a
hydrophobic surface without doing any modification (146–150). There are
several agents that influence the surface energy and hence the surface wettability
as well. These are chemical modification, roughness and relative presence of
sp2-sp3 bonds (147, 151, 152). In this study, it was found that VA-CNTs
synthesized at 625 °C using ethanol presented hydrophobic (contact angle ~
150°) surface and the wettability did not change drastically by time which is
consistent with previous reports (148, 153). The decrease in size of water
droplet on the surfaces by time was mainly due to the evaporation (Figure 36).
In contrary, VA-CNTs grown at 750 °C using ethanol had super-hydrophobic
(contact angle ~ 180°) surfaces at least for 20 minutes. The trend in the contact
angle plots (Figure 36a and b) were determined in the same behavior with the
graphs of I(G/D) ratio which also provided an information for impurities (Figure
31b and Figure 33b). This emphasized that the presence of amorphous carbon on
the surface or between CNT arrays resulted in shifting the wettability properties
of VA-CNTs from super-hydrophobic to hydrophobic properties. Moreover, the
consequences of water droplet contact with the VA-CNT surfaces synthesized
using ethanol were given in Figure 36. It was clearly seen that the hydrophobic
VA-CNTs grown at low synthesis temperature (625 °C) were patterned after
their contact with water droplet. However, the super-hydrophobic VA-CNTs

79
grown at high growth temperature (750 °C) kept their original alignment even
after a droplet on CNT surface was evaporated. As a conclusion, it is found that
wettability of VA-CNTs could be tuned by varying carbon source without
inducing any chemical modification and thus 2D and 3D functional CNT
surfaces could be built by a facile route for further applications.
Dynamic contact angle measurements of VA-CNTs synthesized using Figure 36.
various carbon sources at temperatures of (a) 625 °C and (b) 750 °C. The volume of
water droplet used for the measurements was 8 µL.
(a)
(b)
80
Beside the investigation of carbon source type effect, the effect of growth
pressure on VA-CNT synthesis was also investigated. The reduction step for all
pressure experiments was conducted in a same manner discussed before at
temperature of 625 0C. After the annealing step, the reduced catalyst layers were
subjected to the growth step at 625 0C for 30 minutes using ethanol at varying
ACCVD pressure; 40, 56, 69, 81 and 94 Torr. During the growth step, the
temperature of liquid ethanol inside the bubbler was kept at 32 °C and the
pressure of ACCVD system was adjusted by the valve placed at the end of the
furnace. In order to investigate the growth behavior VA-CNTs with respect to
both pressure and catalyst design, different bottom Al layer thickness was used
in the sandwich catalyst design; 3, 5, 7 and 10 nm Al.
Figure 37 shows the SEM images of synthesized VA-CNTs at different ACCVD
pressures at 625 °C and the plot represents the change of CNT length versus
ACCVD pressure. Regarding to the plot in Figure 37, it was found that there
was an increase in the height of VA-CNTs till 69 Torr pressure where the
highest VA-CNT was achieved for each catalyst design. Then, there was a
tremendous decrease in the height of VA-CNTs with respect to pressure.
Contrary to the effect of carbon source type and temperature, varying ACCVD
pressure has the benefit of only affecting the carbon source concentration flowed
inside the furnace and not to the decomposition processes. As mentioned before
in this study, ethanol was carried inside the ACCVD furnace by bubbling Ar and
H2 gases through and unreacted ethanol was collected inside a trap at the end of

81
the furnace by liquid N2 cooling. The amount of reacted ethanol was calculated
by measuring the volumes of unreacted ethanol which was cooled down at the
end of the ACCVD growth (calculations were provided at Appendix IV).
Regarding to these calculations, it was found that there was a decrease in
amount of ethanol carried inside the furnace from 3.1 to 1.5 sccm as the pressure
increased from 40 to 94 Torr, respectively. The flow amount of Ar and H2 gases
were kept constant at 120 sccm while the total amount of flow including
ethanol, Ar and H2 gases decreased with respect to increased pressure. The
decrease in the total amount of flow was resulted in an ascend of ethanol
residence time (τ) which was expressed with the following equation (Eq. 3);
The increase in value of τ with respect to pressure provides more time to carbon
species to contact with catalyst surface which leads a rise in carbon
concentration on the surface of catalyst particle. If contact time of carbon
species increases, there is more possibility for carbon coating on catalyst surface
since the carbon precipitation is a slower process than the carbon diffusion
process. Thus, the increased value of τ would be the reason for the growth of
shorter VA-CNTs after a certain value of ACCVD pressure.

82
SEM images of VA-CNTs synthesized under pressures of 40, 56, 69, 81 and Figure 37.
94 Torr at 625 °C (pressure set). The plot of the VA-CNT length versus pressure.

83
The aim of the following experimental set (concentration set) was to investigate
how growth of VA-CNTs has been affected from comparatively higher carbon
source flow while ACCVD pressure was kept at similar values with pressure set.
In the previous set (pressure set), temperature of liquid ethanol inside the
bubbler was kept at 32 °C and the pressure of ACCVD system was adjusted by
the pressure valve. However, in the following set, the only way to obtain higher
concentrations of ethanol flow inside the ACCVD furnace was to increase the
temperature of liquid ethanol inside the bubbler while the pressure was kept at
similar values with the previous pressure set (see Table 3 for the values of
pressure inside the ACCVD, amount of ethanol flow and temperature of liquid
ethanol inside the bubbler). Hence, a second set of experiment (concentration
set) was conducted where the temperature of liquid ethanol inside the bubbler
was altered by using a heater. Varying the temperature of ethanol inside the
bubbler affects the amount of ethanol flow inside the furnace and as a
consequence the pressure of ACCVD would change. Thus, in this set of
experiment, the temperatures of bubbler were selected as 52, 71 and 83 °C to
provide similar pressures used in pressure set experiments. The pressures
obtained by increasing ethanol temperature are given in Table 3.

84
Table 3. Summary of the values used in the experiment series of pressure and
concentration. The bold values are for the pressure set while the rest is for the
concentration set.
Pressure of
ACCVD (Torr)
Temperature of liquid
ethanol (°C)
Flow of gas
ethanol (sccm)
40 32 3.1
56 32 2.9
69 32 2.6
81 32 2.2
94 32 1.5
53 50 4.5
71 71 6.3
81 83 7.2
Figure 38 shows side view SEM images of VA-CNTs synthesized at various
temperatures of liquid ethanol which was designated as concentration set. The
plot in Figure 38 indicated that the optimum value of temperature was 50 °C
which resulted in tallest VA-CNTs at 53 Torr pressure. To better understand the
effect of ethanol temperature on the growth, the amounts of ethanol flow were
calculated and tabulated in Table 3 for each temperature (Appendix V).
According to these values, the flow of ethanol was increased with respect to
temperature which also caused an increase in flow concentration of ethanol. As
mentioned before, over-feeding of carbon source would deactivate a catalyst
particle by covering the surface with excess amount of carbon. In this study, it
was observed that the growth rate accelerated up to 53 Torr pressure although
the amount of ethanol flow was increased as the temperature of ethanol was

85
raised (Figure 38). After a pressure was reached to 53 Torr, the growth rate of
CNTs was decelerated even the pressure was increased up to 81 Torr. The
possible explanation for the higher growth rate up to 53 Torr pressure would be
related with τ. Just as the amount of flow inside the furnace has been increased,
the τ of carbon source inside the furnace would be decreased (Eq.5). Therefore,
the carbon source molecules would have less time for the decomposition and
also for the contact of carbon with catalyst and this would help to keep the
catalyst surface clean. However, after 53 Torr pressure, the concentration of
carbon source was came up a threshold value causing the deactivation of
catalyst by coating the surface with carbon even the value of τ decreased. In the
plot, there was no height value for the 0.5nm Al/1nm Co/10nm Al catalyst
configuration at 81 Torr pressure since randomly scattered CNTs rather than
VA-CNTs were present on the surface (Figure 38).

86
SEM images of VA-CNTs synthesized using various liquid ethanol Figure 38.
temperatures (32, 50, 71, 81 °C) at 625 °C (concentration set). The plot of the VA-
CNT length versus pressure that obtained by varying liquid ethanol temperature.

87
Furthermore, Raman analysis was conducted on synthesized VA-CNTs using
0.5nm Al/1nm Co/10nm Al catalyst design. Raman spectra of all VA-CNTs
synthesized using different concentrations and pressures were almost identical in
terms of intensity and peak positions. Thus, only two Raman spectra of VA-
CNTs synthesized at pressure of 40 and 94 Torr (pressure set) were shown here
as a representative ones (Figure 39). D and G bands were located around 1327
and 1573 cm-1
, respectively, and the ratio of I(G/D) was around 0.7. This
indicated the presence of amorphous carbon and suggested that the amount of
amorphous carbon did not change with respect to an increase in ACCVD
pressure. Regarding to the results, an increase in the pressure or temperature of
ethanol only affects the activity of catalyst, not the formation of CNT.
Raman spectra of VA-CNTs synthesized at pressure of 40 and 94 Torr Figure 39.
(black and red lines, respectively) with an inset of magnified D and G bands.

88
In this study, an optimized strategy was developed for the growth of VA-CNTs
using ACCVD method by alternating the growth parameters such as carbon
source type, temperature and pressure. As a conclusion, the optimum growth
range could be offered rather than pointing a certain growth parameter. Alcohol
sources resulted in well aligned CNTs rather than hydrocarbon sources at
temperature of 625 and 750 °C under the pressure of 40 – 69 Torr. Hence, it is
vital to use alcohols as a carbon source to produce VA-CNTs using ACCVD
method. Furthermore, it is found that surface properties of VA-CNTs could be
tuned by varying growth parameters without inducing any chemical
modification and thus 2D and 3D functional CNT surfaces could be built by a
facile route for further applications. For instance, hydrophobic VA-CNTs grown
at 625 °C using ethanol would be useful for cell applications (154) while super-
hydrophobic VA-CNTs would be more successful for self-cleaning surfaces
(155).
Modeling for the growth of vertically aligned 4.1.4
carbon nanotubes
To modify CNT properties and to extend their applications, it is important to
understand their growth mechanism. In the literature, there are recent reports
investigating the growth kinetics of VA-CNTs using in situ measuring systems
(59, 60, 156–160). However, in this study, there was no in situ system mounted

89
with the ACCVD furnace hence a road of approach was followed for
understanding the growth mechanism of VA-CNTs.
Before main processes responsible for the growth termination will be studied, all
the possible reactions for ethanol decomposition will be discussed with help of
thermodynamic parameter which is the formation Gibbs free energy (ΔGf) at
around 600 °C (161). From the view of thermodynamic equilibrium, reactions 3,
4, 5, 6, 7 and 10 are favorable to occur. However, reactions 8 and 9 are
unfavorable due to comparatively higher ΔGf value. Main ethanol
decomposition reactions are 3 and 4 where methane (CH4) and ethylene (C2H4)
are produced to be used as carbon source for CNT growth. For carbon synthesis,
reaction 6 has the lowest ΔGf value compared with reaction 5. Thus, originally
CNTs are grown from the decomposition of C2H4 when ethanol is used as the
feedstock.

90
There are two main concepts responsible from the growth termination of CNTs;
diffusion limit of carbon feedstock and catalyst poisoning. It is worth clarifying
that the concept of diffusion limit comes forward when CNT growth model is
the bottom up. The concentration of carbon source molecules at the root of
CNTs would be much lower than the top if carbon source molecules are not
diffusing fast enough through the root of CNTs. As follows, the growth rate
would be decreased due to this concentration difference between the root and
top of arrays. This effect is called diffusion limit of carbon feedstock. Other than
diffusion limit, another important limitation comes from the catalyst coating by
amorphous carbon.
To figure out the dominant processes in this study, following calculations were
performed by using data collected from VA-CNTs grown on 0.5nm Al/1nm
Co/10nm Al catalyst layers under 40 Torr pressure. First, it was needed to define
the growth model of VA-CNTs in order to check whether the diffusion limit was
dominant or not. For this, XPS analysis was performed on top of VA-CNTs. The
signal of C 1s at 284.4 eV was coherent with the presence of CNTs while there
was not a signal for Co 2p (Figure 40). This indicated that in this study the

91
growth was root type and diffusion limit should be considered as well the
catalyst poisoning for the termination of VA-CNTs.
XPS spectra taken from the top surface of VA-CNTs. C 1s peak at 284.4 eV Figure 40.
was attributed to the presence of CNTs while there was no signal for Co 2p
indicating the root growth type.
Figure 41 represents the root growth and boundary conditions for the following
calculations. It was assumed that the diffusion of feedstock was only from the
top side (neglected the diffusion from sides of arrays because of high width of
film and higher collision frequency in the anisotropic structure of film).
Following the basic diffusion theory (Fick’s Law; Eq. 4), the difference in the
amount of feedstock diffusing in and out should be equal to the consumption
inside the dx region. It was assumed that the system was at the steady state and
there would be no consumption. This was expressed by Eq. 5 where De is the
effective diffusion coefficient, S CNT film area, and C feedstock concentration.

92
Representative side view schematic of VA-CNTs showing the boundary Figure 41.
conditions for the calculations.
(
)
(
)
At the root of CNTs where the catalyst is during the growth, the growth rate of
CNT (γ) equals to the reaction rate of carbon source (r) or net diffusion flux at
the equilibrium case (Eq. 6) where ks is the surface reaction constant of carbon
source, C* effective carbon source concentration at the root, L total length of
VA-CNTs and m reaction order. In here ks is the reaction constant for overall
processes which are the carbon source decomposition, carbon diffusion inside
the catalyst and carbon precipitation for CNT formation.
(
)

93
Using this relation, the flux equation is solved as;
𝐷𝑒 (𝑑𝐶
𝑑𝑥)𝑥 𝐷𝑒 (
𝑑𝐶
𝑑𝑥)𝑥 𝑑𝑥
⇒ 𝑑𝐶
𝑑𝑥 𝑐𝑜𝑛𝑠𝑡𝑎𝑛𝑡 𝑣𝑎𝑙𝑢𝑒 𝑜𝑟
𝑑 𝐶
𝑑𝑥
This means that feedstock concentration is linearly changing from top to bottom.
𝑑𝐶
𝑑𝑥
𝐶 𝐶
𝐿
𝐷𝑒𝑆𝐶 𝐶
𝐿 𝑘𝑠𝑆𝐶
𝑚 𝑆 𝑑𝐿
𝑑𝑡
To investigate the reaction order, the growth of VA-CNT were conducted under
40 Torr pressure at 625 °C for varying growth duration after the sandwich
catalyst layer was reduced at 625 °C for 15 minutes. The plot of the VA-CNT
length versus growth time showed that the length of VA-CNTs increased by
ACCVD time till 20 minutes (Figure 42). After 20 minutes passed, the growth
rate slowed down and then it was terminated around 40 minutes. Even, the
ACCVD time prolonged to 60 minutes, the length of VA-CNTs did not change.
This is a typical decay process and is expected to be a first order reaction rate.
Hence, based on this plot it was assumed that m equals to one and ks was
constant with respect to time. Moreover, it was assumed that reactions were
irreversible meaning that there would be no reactivation mechanism of catalyst
as shown in reaction 8.

94
The plot of the VA-CNT length versus growth time with representative Figure 42.
SEM images of VA-CNTs grown at 625 °C.
According to the first order reaction rate, C* was calculated using Eq. 7 and it
was found that;
Using Eq. 8, the length difference was driven as;

95
The integration of Eq. 9 resulted in a formula for the length of VA-CNT related
with t, De, ks and C0 (Eq. 10).
√(
)
Using this formula, an explanation would be done for the growth termination
which was the result of either strong diffusion or no diffusion process. If (De/ks)2
< (2DeC0t);
√ √
If (De/ks)2 > (2DeC0t);
To find out the limiting factor, the values of De, ks and C0 should be defined.
First, the type of feedstock diffusion was needed to be assigned using mean free
path of carbon molecule under these conditions (λ). In a porous solid, a
molecule may collide with another molecule or with pore walls. When gas
pressure is high, molecule-molecule collisions dominate. In other words,
molecular diffusion occurs if λ is relatively short compared to a pore size (x) (λ
<< x). At low pressure, collisions are dominantly between molecules and the
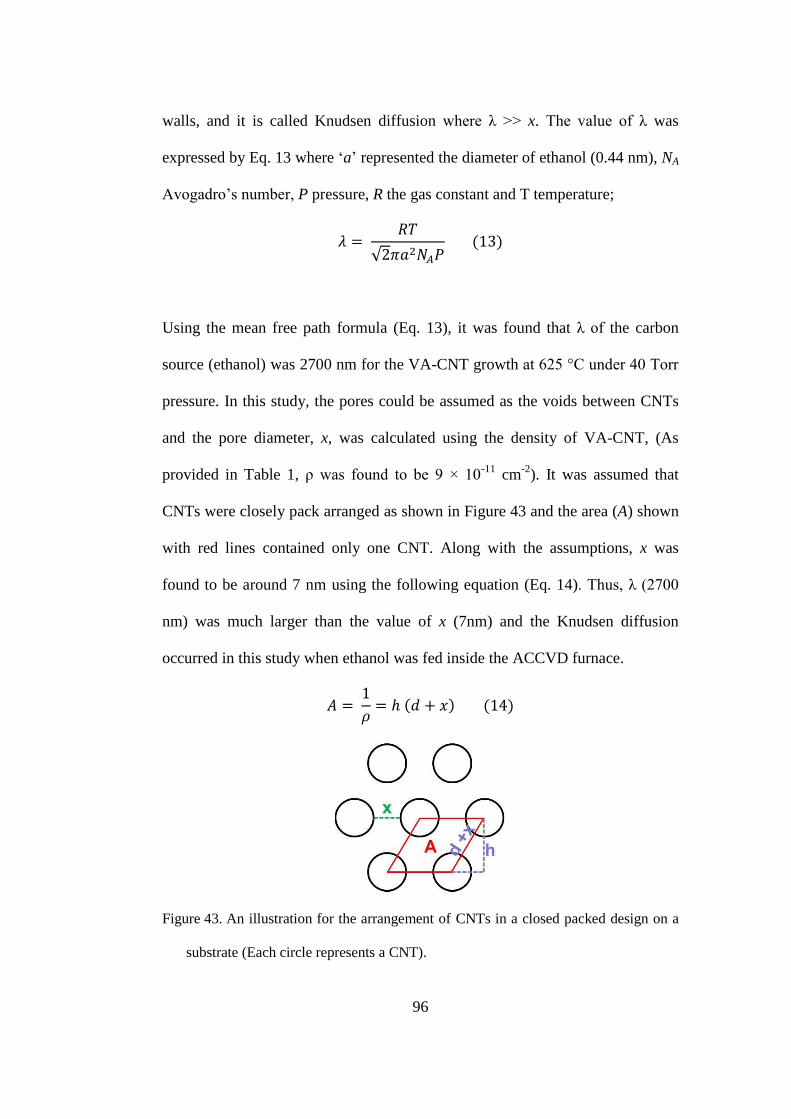
96
walls, and it is called Knudsen diffusion where λ >> x. The value of λ was
expressed by Eq. 13 where ‘a’ represented the diameter of ethanol (0.44 nm), NA
Avogadro’s number, P pressure, R the gas constant and T temperature;
√
Using the mean free path formula (Eq. 13), it was found that λ of the carbon
source (ethanol) was 2700 nm for the VA-CNT growth at 625 °C under 40 Torr
pressure. In this study, the pores could be assumed as the voids between CNTs
and the pore diameter, x, was calculated using the density of VA-CNT, (As
provided in Table 1, ρ was found to be 9 × 10-11
cm-2
). It was assumed that
CNTs were closely pack arranged as shown in Figure 43 and the area (A) shown
with red lines contained only one CNT. Along with the assumptions, x was
found to be around 7 nm using the following equation (Eq. 14). Thus, λ (2700
nm) was much larger than the value of x (7nm) and the Knudsen diffusion
occurred in this study when ethanol was fed inside the ACCVD furnace.
An illustration for the arrangement of CNTs in a closed packed design on a Figure 43.
substrate (Each circle represents a CNT).

97
De is expressed as the sum of Knudsen diffusion coefficient (Dk) and the
molecular diffusion coefficient (Dm) (Eq. 15). However, it was found that the
diffusion of feedstock gas was dominantly Knudsen diffusion and thus De was
equal to Dk. It is well known that Knudsen diffusion coefficient for cylindrical
pores was expressed as in equation 16. However, CNTs did not perfectly
straight as cylinders and hence, corrections factors for the shape of pores are
added in the previous reports (60) (Eq. 17).
√
√
In the corrected coefficient equation, β represents the porosity value of arrays
and ε is the tortuosity of diffusion channels while M is the molecular weight of
gas (Methanol = 46 g/mol). While β quantifies the ratio of area available for
gaseous transport, ε is a quantity which characterizes the nature of the porous
pathways followed by diffusing species. In the literature, β was reported as 0.92
(156) and ε was 1.5 for VA-CNTs (60). Using these values, Dk was found to be
1.84 mm2/s (Eq. 17).
To calculate the initial concentration of feedstock (C0), it was assumed that
ethanol behaved as an ideal gas at the synthesis conditions used in this study.
98
Thus, the ideal gas law provided a relation between the pressure of chamber and
the concentration where R is the gas constant (62.36 L Torr/K mol) (Eq. 18).
Using the ideal gas law, it was calculated that C0 value of ethanol feedstock was
7 × 10⁻⁴
mol/L at 625 °C and 40 Torr. To investigate the dominant process
responsible for the growth termination during the synthesis, a comparison
between values of (De/ks)2 and 2DeC0t was performed. However, for this
comparison there was only one missing constant, ks. To determine the value for
ks, in-situ measuring systems are required which was not present in this study.
Hence, it was assumed that the value of ks was between 0.1 and 0.4 mm/s as
reported previously in the literature for MWCNTs (159).
Regarding to these values, the growth of VA-CNTs at 625 °C under 40 Torr
pressure was found to be in a regime where there was not a strong diffusion
limit. In a rough conclusion, the growth most probably terminated due to the
catalyst deactivation by the accumulation of excess carbon on catalyst surface.
In a case of high ethanol pressure, the growth shifts to a regime where there is a
strong diffusion limit rather than catalyst poisoning.
99
4.2 Functionalization of vertically aligned carbon
nanotubes
Lithium intercalation of vertically aligned 4.2.1
carbon nanotubes
In the literature, there are examples of studies using carbon based materials as
electrode in Li-ion batteries due to the structural stability and high capacity
(101, 162). Particularly, CNTs are preferred to be used as an electrode material
in order to overcome the limitations commonly for conventional electrodes such
as low lithiation capacity, slow ion diffusion, low surface area and poor
conductivity (102–104, 106, 107). Furthermore, there was no structural
damaging as Li intercalated with CNTs (106, 107). Recently, it was showed that
the improvement in the storage, conductivity and rate capacities was achieved if
VA-CNTs were used as electrodes (104, 108). It was also reported that aligned
CNTs enhanced the Li ion diffusion during charge cycles where it was higher
than the graphite and randomly scattered CNTs (101, 103).
In the literature, few studies were published on the growth of carbon
nanostructures using Li-containing compounds; however no detailed
examination was performed to understand the incorporation of Li to the carbon
network (163, 164). In this study, the aim is to in situ intercalate VA-CNTs

100
during the growth process and investigate the incorporation of Li to the CNT
structure using Raman, XPS, S/TEM and EELS (165).
For the Li study, the catalyst layers were prepared using wet chemistry method
described in Chapter 3. Basically, SiO2 wafers were coated using two different
catalyst layers; the one was with Li containing (mixture of Al(NO3)3.9H2O,
Co(NO3)2.6H2O and LiNO3 solutions) and the other was without Li (mixture of
Al(NO3)3.9H2O and Co(NO3)2.6H2O solutions). After the catalyst layers were
put on the substrates and left for air drying, they were subjected to the reduction
and growth steps in the ACCVD furnace at 625 °C by using Ar, H2 and ethanol
for the growth of CNTs. However, for some experiments only the reduction step
at 625 °C was performed on the catalyst layers in a same manner described
before in order to better examine the intercalation of Li. Hence, for the
simplicity, all the experiments conducted in this study were named and a table
was given for the summary of experiments (Table 4).

101
Table 4. Summary of the experiments conducted for Li intercalation study.
Experiment
name Catalyst content Process run
Observations
after ACCVD
Set 1 Li containing Co ACCVD(reduction+growth) CNT
Set 2 Li containing Co ACCVD (reduction) -
Set 3 Co ACCVD(reduction+growth) CNT
Set 4 Co ACCVD (reduction) -
Set 5 Co ACCVD(reduction +growth)
+ LiNO3 annealing CNT
Set 6 Co LiNO3 annealing -
The growth of VA-CNTs from Li containing catalyst solution (Set 1) was
achieved at 625 °C as is the case in the non-Li containing catalyst solution (Set
3) (Figure 44a and b). For further morphological investigation, since SEM is not
a powerful technique, S/TEM analysis on the CNTs from Set 1 was conducted
(Figure 44c). It was observed that the length of the CNT was around 5 µm and
the diameter was between 10 to 20 nm. The particles seen in the S/TEM image
was most probably due to the unreacted catalyst stuck on the side walls of CNT.

102
Side view SEM images of grown VA-CNTs from the (a) non-Li (Set 3) and Figure 44.
(b) Li containing (Set 1) catalyst layers. (c) S/TEM image of a CNT from Set 1
(165).
103
Other than the electron microcopy images, EELS analysis was performed on the
CNT synthesized from Set 1 in order to investigate the chemical composition of
the structure. The EEL spectra for Li-K and C-K edges were provided in Figure
45a and b, respectively, taken from the side wall of CNT (inset image in Figure
45b). Beside the data obtained from the side wall of CNT, the spectra was also
collected from the Li containing catalyst particle from Set 1 in order to better
differentiate the shape of Li-K edge. The energy and shape of Li-K edge from
the side walls of CNT was different than the LiF, as the reference, and the Li
containing catalyst particle (Figure 45a). It was found that the Li-K edge was at
55.6 eV for the spectra taken from the side walls of CNT which was shifted by
0.6 – 0.8 eV with respect to the metallic Li-K edge where it was reported to be at
55 eV (166) and 54.8 eV (167). When Li intercalates with C, a new form of
compound is generated which is called as LiC6 and a charge transfer occurs
between Li and C. Thus, it is likely that the shift was due to a charge transfer
from the Li to the C atoms in the structure. In the literature, it was reported that
0.2 eV shift was observed for bulk LiC6 compared to the metallic Li-K edge
(168). It was not surprising to observe a sharp edge for the C-K edge which
suggested the presence of graphite sheets in the sample (Figure 45b). The edge
was centered at 285.5 eV (π*) corresponding to the unoccupied anti-bonding π*-
states of sp2-hybridized C. In the literature, C-K edge for pure CNTs was
reported to be at 285 eV (169) while it was at 285.5 eV for CNTs intercalated by
alkali metals (170). Regarding to the EELS spectra, the results would be in
agreement with the presence of Li in VA-CNTs.

104
EEL spectra of Set 1 for (a) Li-K edge and (b) C-K edge (inset shows where Figure 45.
the spectrum is taken from). (c) A comparison of Raman spectra for VA-CNTs
from Set 1 (Li containing) and Set 3 (non-Li containing) (165).
Other than microscopy techniques, Raman analysis could also provide an
evidence for Li intercalation by shifts in wavenumbers of G band while there
would be no shift for D band. Hence, in order to get more information, high
resolution Raman analysis was performed on grown VA-CNTs using the Li
containing (Set 1) and non-containing (Set 3) catalysts (Figure 45c). It was
found that the G band corresponding to in-plane vibration of C atoms was at
(a) (b)
(c)

105
1594 cm-1
and 1582 cm-1
for VA-CNTs grown in Set 1 and Set 3, respectively.
However, D band for both samples attributed to disorder and defects was found
to be at same wavenumber value of 1344 cm-1
. This indicated that the D band
position did not get affected by the presence of Li while the G band shifted up
11 cm-1
respect to the Set 3 with the presence of Li. In the literature, there are
several studies reporting a G band shift toward higher wave numbers values
(171, 172). The possible explanation for this is the charge transfer due to the
insertion of Li to the carbon network (165, 171, 172).
Although TEM and Raman analysis techniques resulted in strong evidences for
the presence of Li in the carbon matrix, XPS analysis was also performed. To
better understand the chemical states of Li, other than VA-CNTs from Set 1 and
Set 3 the catalyst layers from Set 2 and Set 4 were also analyzed. As tabulated in
Table 4, Li-containing (Set 2) and non-containing (Set 4) catalyst layers were
only subjected to the reduction step at 625 °C to figure out the catalyst state
after thermal treatment. XPS spectra for Li 1s and C 1s peaks were shown in
Figure 46 and the binding energies of the peaks were tabulated in Table 5. The
XPS spectrum of reduced non-Li containing catalyst layer (Set 4) was shown in
Figure 46a. As shown, it had a broad asymmetric peak observed at 59.5 eV
which was corresponding to Co 3d (173). In the XPS spectrum of reduced Li-
containing catalyst (Set 2), there was a second peak centered at 54.9 eV which
fitted to metallic Li (Figure 46b) (174). This indicated that Li and Co were
metallic on the substrates after the reduction step conducted.

106
Li 1s XPS spectra of (a) Set 4, (b) Set 2, (c) Set 3 and (d) Set 1. C 1s XPS Figure 46.
spectra of (e) Set 3 and (f) Set 1 (165).
(a) (b)
(c) (d)
(e) (f)

107
Table 5. Binding energies and FWHM for C 1s and Li 1s XPS peaks.
Experiments Binding energy
Li 1s (eV)
Binding energy
C 1s (eV)
Set 1 55.8 284.3(0.9)
285.0 (1.9)
Set 2 54.9 -
Set 3 - 284.3 (0.7)
285.5 (2.8)
After the chemical state of reduced catalyst layers were investigated, XPS
analysis was carried on the synthesized VA-CNTs using these catalysts (Set 1
and Set 3). For the case where CNTs were grown on the non-Li containing
catalyst layers (Set 3), Co 3d peak was observed at 59.3 eV (Figure 46c). In the
Set 1 (Li containing catalyst), three peaks were appeared around 55 eV (metallic
Li 1s), 55.8 eV (Li 1s) and 59.5 eV (Co 3d) (Figure 46d). It was reported that Li
1s peak for the case of Li intercalation in the LiC6 shifted towards higher
binding energy compared to the metallic Li and appeared at 56 eV and the main
reason for the shift is the charge transfer from Li to C (175). Regarding to the
results, it was found that there was a shift towards higher binding energy when
the Li 1s peaks of reduced Li containing catalyst (Set 2 – 54.9 eV) and CNTs
grown on the Li containing catalyst (Set 1 – 55.8 eV) were compared. This
supported the idea of Li intercalation during the CNT growth (Set 1).

108
The effect of Li intercalation was also observed at C 1s peak. Firstly, the shape
of C 1s peak of CNTs grown using Li containing catalyst (Set 1) was distinct to
that for CNTs grown on non-Li containing catalyst (Set 3) (Figure 46e and f,
respectively). The main C 1s peak for Set 1 was broader than the one in Set 3.
After the deconvolution of sample Set 3, it was found that the graphitic C peak
was at 284.3eV with 0.7 eV full width half maximum (FWHM) with a broad
component at 285.5 eV due to C-H bonding which was consistent with the
reports (176–178) (Figure 46e). In the case of Set 1, the C 1s peak had a main
component at 284.3 eV and a broader one at 285 eV (Figure 46f). The peak at
285 eV was corresponding to the Li intercalated CNTs and shifted toward
higher binding energy with respect to the peak at 284.3 eV which was for the
CNTs grown with non-Li containing catalyst. According to the report done by
Momose et al., C 1s peak has been observed between 285 – 285.2 eV for the Li
intercalated LiC6 and LiC2 (179). Moreover, it was reported that the broadening
of the peak with respect to that graphitic C peak (284.3 eV) was due to re-
distribution of charge on the carbon network induced by Li (178, 180, 181).
In order to further confirm the intercalation of Li during the growth, another set
of experiments were conducted where VA-CNTs were synthesized using non-Li
containing Co catalyst at 625 °C in a same manner. After VA-CNTs were
grown, they were soaked in a LiNO3 solution for overnight. Next, a drop
containing CNTs were taken from the LiNO3 solution and put on a Si substrate.
Air dried CNTs on the substrate were subjected to the annealing step at 625 °C

109
under 4 Torr pressure and flowing atmosphere of Ar and H2 (5:1). This sample
was named as Set 5 in Table 4. Moreover, for comparison, Si substrate was
coated with only LiNO3 solution and then conducted to the annealing step in a
same manner with Set 5. This sample was called as Set 6 in Table 4. In here, the
aim was to promote the ex situ Li intercalation.
In order to investigate the ex situ intercalation, a comparison between the XPS
spectrum of Set 5 and Set 6 was performed. In the case of Set 5, Li 1s peak was
appeared to be at 54.6 eV (Figure 47a). Moreover, it was found that Li 1s peak
from Set 6 (54.8 eV) was also observed at almost same binding energy (Figure
47b). Regarding to the previous reports, Li 1s peak both from Set 5 and Set 6
was attributed to metallic Li (174). Furthermore, no evidence was obtained for
the asymmetric broadening and shifts in the C 1s peak of Set 5 indicating the Li
intercalation (Figure 47c). Thus, it was clear to say that ex situ intercalation of
Li did not occur by the annealing.

110
Li 1s XPS spectra of (a) Set 5 and (b) Set 6. (c) C 1s XPS spectra of Set 5 Figure 47.
(165).
The results of XPS study strongly indicated the intercalation of Li to occur
during the growth of CNTs by using Li containing catalysts. It was investigated
that Li intercalation did not take place if Li source was supplied after CNT
growth. Beside XPS analysis, TEM and Raman results were also suggesting the
in situ Li intercalation of VA-CNTs by charge transfer from Li to carbon
structure. In the literature, there is a controversy for charge transfer between Li
and carbon. In order to estimate the charge transfer for this study, density
(a) (b)
(c)

111
functional theory (DFT) calculations were done by Dr. Oguz Gulseren and co-
workers (165). The results of DFT calculations were given in Appendix VII.
Cell attachment on patterned carbon nanotubes 4.2.2
The research on the cell attachment has gained important attraction in the last
four decades. In recent years, MSCs have become a potential candidate for the
tissue engineering applications due to their multiple lineage potentials and
immune-privileged properties (182, 183). In the literature, there are studies
showing the differentiation capabilities of stem cells into liver and osteocyte
cells which would be used for the cell based therapy and tissue engineering
(184, 185). However, a key point is to manage the growth and differentiation of
cells outside of a body. Since then, ECMs derived from animal tissues such as
collagens are used and have an important role in the growth of MSCs (109).
However, their use brings out some limitations by the dimension and pathogen
risk for the growth of cells on (110). Therefore, developing better biomaterials is
being attracted interest to mimic the candidates for cell adhesion and growth
(111, 186).
The application of CNTs has been studied for cell growth in tissue engineering
(187, 188). Moreover, CNTs would be considered to be used for scaffold
applications since their similar sizes with commonly used collagens (68, 111–
114). The fundamental principle for cell viability on ECM surfaces is the
attachment of cells to surfaces to survive, migrate and grow. The properties of

112
surface such as roughness have a significant role for mimicking the adhesion,
proliferation and viability of cells. There are studies in the literature reporting
the effect of topography on cell attachment (189, 190). Moreover, it is found
that the expressions of cells are increased on relatively rougher surfaces (191).
However, the results sometimes are controversy for the relationship between
surface properties and adhesion (192, 193). In this study, the focus was to use
VA-CNTs as functional surfaces to grow cells on. Moreover, the aging effect on
the adhesion of cells on the CNTs was also investigated.
For the cell attachment study, the catalyst layers were prepared using PVD
techniques as described at Chapter 3 (0.5nm Al/1nm Co/10nm Al) (194). The
synthesis process of VA-CNTs was performed in a same manner by using
ethanol as a carbon source at the low growth temperature (625 °C). The reason
for choosing the temperature of 625 °C instead of 750 °C was the hydrophobic
surface properties of VA-CNTs grown at 625 °C as shown in Figure 36a. Cells
preferentially attach on hydrophilic surfaces, not on super-hydrophobic surfaces
as in the case of 750 °C grown VA-CNTs. Hence, for the cell attachment
experiments VA-CNTs were synthesized at 625 °C using ethanol which had an
average 8 µm length as shown in Figure 48a. TEM image was confirmed that
CNTs were multi-walled with an average diameter of 10 nm (Figure 48b). In
order to investigate the surface properties of the VA-CNTs, 2D AFM analysis
was conducted from the top surface of VA-CNTs (Figure 48c). It was found that
the average w value was around 40 nm and also the top view SEM image

113
confirmed the smoothness of the surface (Figure 48c, inset). Furthermore,
Raman spectra of the synthesized VA-CNTs represented the D and G bands at
1344 and 1582 cm-1
, respectively (Figure 48d).
(a) SEM and (b) HRTEM images of VA-CNTs synthesized at 625 °C on the Figure 48.
sandwich catalyst layers for the cell attachment experiments. (c) 2D AFM image
from the top view of VA-CNTs with inset of top view SEM image. (d) Raman
spectra of the synthesized VA-CNTs indicating the variety of MWCNTs as shown
in RBM mode as inset (194).
As discussed before, cells prefer to attach themselves on rougher surfaces than
plane surface (193, 195). Hence, the presence of patterns on the surface is
critical for the preparation of a suitable scaffold for anchoring of the cells. Thus,
(a) (b)
(c) (d)

114
after the VA-CNTs were synthesized, the next step was to create the patterned
surfaces for the growth of MSCs. For this, a simple method was applied where 5
µL deionized water was dropped with a syringe on the VA-CNTs as shown in
Figure 49 and left for air drying. It was observed that VA-CNTs were self-
patterned to form a suitable nest for the cells by some of them collapsing on the
substrate due to the capillary forces exerted by water (Figure 50). Similar
observation was also reported by Robertson et al. (196). The main reason for the
self-assembled CNTs is thought to be the elasto-capillary effect of VA-CNTs.
As shown in Figure 50, the size of these nests was around 10 µm which is
equivalent with the average size of MSCs providing a suitable nest.
Schematic representation of experimental approach (194). Figure 49.
In the literature, there are reports using a composite materials such as
CNT/collagen to improve the cell attachment and viability (111, 197–201). In
order to investigate the collagen coating effect on the growth of MSCs,
following the patterning step, CNT surfaces were either coated with collagen or
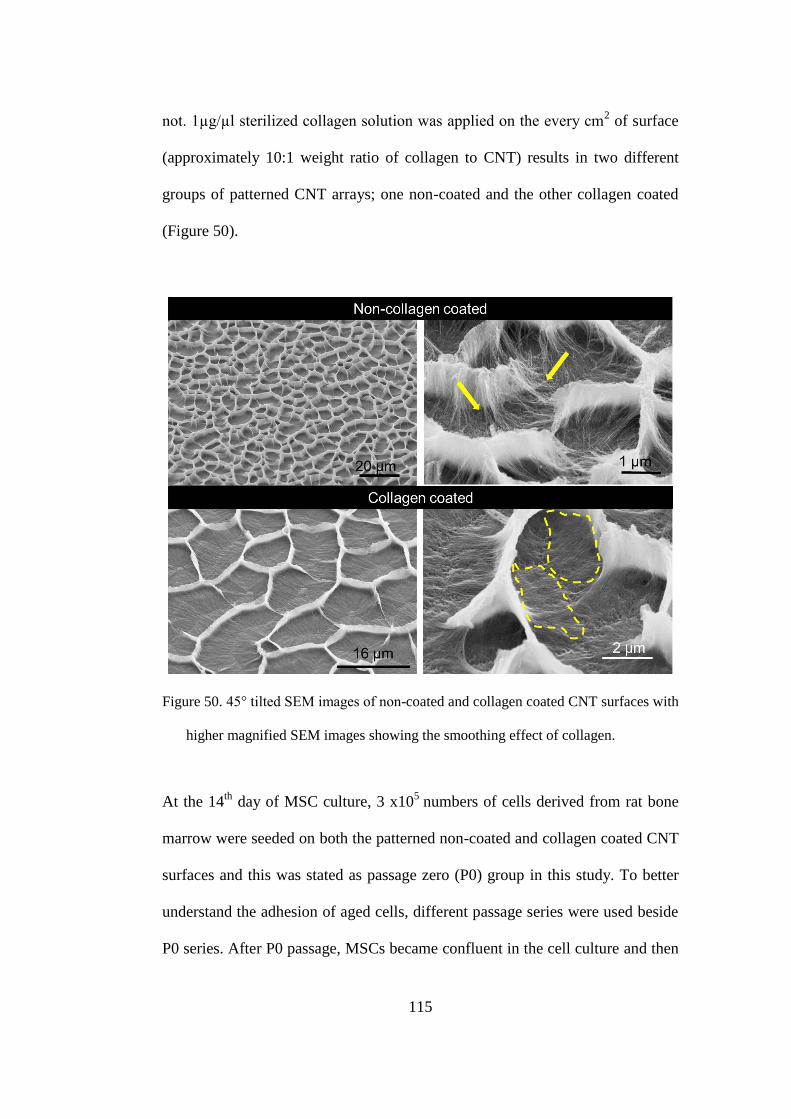
115
not. 1µg/µl sterilized collagen solution was applied on the every cm2 of surface
(approximately 10:1 weight ratio of collagen to CNT) results in two different
groups of patterned CNT arrays; one non-coated and the other collagen coated
(Figure 50).
45° tilted SEM images of non-coated and collagen coated CNT surfaces with Figure 50.
higher magnified SEM images showing the smoothing effect of collagen.
At the 14th
day of MSC culture, 3 x10⁵
numbers of cells derived from rat bone
marrow were seeded on both the patterned non-coated and collagen coated CNT
surfaces and this was stated as passage zero (P0) group in this study. To better
understand the adhesion of aged cells, different passage series were used beside
P0 series. After P0 passage, MSCs became confluent in the cell culture and then

116
they were passaged for second and third times. In the rest of this study, these
were stated as the first passage (P1) and the second passage (P2) groups,
respectively. In the same manner with P0, MSCs from P1 and P2 passages were
also seeded on the patterned CNT surfaces. The isolation and characterization of
MSCs was shown in Appendix VI.
Low vacuum SEM images show that MSCs from P0 passage attached on both
non-coated and collagen coated CNT surfaces after three days passed over the
seeding of cells (Figure 51a and b). There were so fewer amounts attached cells
from P1 and P2 passages on the patterned CNT surfaces. Hence, SEM images
were not shown for these passages. Comparison between SEM images did not
provide enough information on the adhesion. Hence, all CNT surface was
scanned under SEM and numbers of attached MSCs on both CNT surfaces for
three passage series were counted. The average areal density of cells was
calculated by dividing the number of cells to the total CNT surface area (Figure
51c).

117
Attached MSCs from P0 passage on the (a) non-coated and (b) collagen Figure 51.
coated CNT surfaces. (c) The plot of average areal density of MSCs from three
subsequence passages. (-) indicates CNT surfaces without collagen while (+) means
collagen coated CNT surfaces (194).
The plot shows a decrease in the number of the MSCs through the passage of the
cells. When a comparison was done between P0 and P1 and P2, it was found
that the decrease was statistically significant (Figure 51c). However, there was
not a statistically significant decrease between the number of the cells both on
the coated and non-coated patterned CNTs from P1 and P2 passages. Thus, it
(b) (a)
(c)

118
was suggested that early passages of MSCs, P0, should be preferred for seeding
on the patterned CNT surfaces. Interestingly, the number of the MSCs from P0
passage on the non-coated CNT surfaces (P0 (-)) was higher than the collagen
coated surfaces (P0 (+)) but not at P1 and P2 series (Figure 51c). In the recent
literature about composites of collagen and CNT, the goal is not only to improve
the poor mechanical properties of collagen, but also to add further functionality
to the scaffold (154, 202). In a study by Cho and Borgens, it was reported the
effect of CNT addition into collagen and applied electrical stimuli on the cell
viability of PC12 (197). According to that study, the metabolic activity of PC12
cells was decreased by the CNT amount at around 50% (wt.) CNT loading
(197). However, there was no mention of a root cause for this observation.
Contrary to the studies, it was found that the number of MSCs for P0 was
noticeably higher for the non-coated CNT surfaces than the collagen coated
surfaces as shown in (Figure 51c). Simultaneously, there are other studies
reporting the enhancement in the viability and the attachment of different type
of cells with the addition of CNT to the ECM (198, 200). The study by Hirata et
al. indicated higher DNA expression for attached mouse osteoblast cells
(MC3T3-E1) to a 3D collagen sponge coated with MWCNTs (198). In addition,
another study confirmed the enhancement in the number of viable smooth
muscle cells grown on the collagen/CNT matrix (200). Furthermore, surface
topography also affects the adhesion of cells to ECM (193, 195). Regarding to
these, it was not surprising to observe the attached MSCs both on the collagen
coated and non-coated CNT surfaces. It was suggested that the collagen coating

119
on the patterned CNT surfaces acted as a smoothing agent by filling the gaps
between the CNTs. Thus, this would limit the anchoring points required for the
adhesion of cells. The SEM image provided in Figure 50, displays the
comparison of the as-is and collagen infiltrated CNT array surfaces which
indicated the smoothing action of the collagen by filling the gaps between
individual CNTs.
In addition to the cell count under SEM, the cell viability test (MTT assay; 3-
(4,5-dimethyl-2-thiazolyl)-2,5-diphenyl-tetrazolium bromide) was conducted on
the MSCs from several passage series grown on the patterned CNT surfaces in
the presence and absence of collagen coating. Spectrophotometrical absorbance
of the samples was measured by ELISA reader with the wavelength between
550 and 600 nm. The graphs for cell viability are shown in Figure 52 and the
control groups in the plots were chosen as cells grown on the bare bottom of 96-
well culture plates without CNTs. According to these plots, MSCs from P0
passage not only had the highest capacity of viability both on non-coated and
collagen coated patterned CNT surfaces, but also higher than the control groups
(Figure 52). However, as the cells from later passage series (P1 and P2) were
seeded on the both coated and non-coated surfaces, the cell viability was
drastically decreased even it was lower than the control group. Thus, this
suggested that either non-coated or collagen coated patterned CNT arrays would
be used for suitable ECM to grow cells on from early passages (P0). This should

120
be remembered when scaffolds comprised of CNTs would be used for seeding
cells. This may have important regenerative medicine applications.
MTT assay plots showing the percent viability of MSCs from different Figure 52.
passages on the (a) non-coated patterned CNTs and (b) collagen coated patterned
CNTs (* indicates significant p<0.05.) (194).
The results of the count (Figure 51c) and viability (Figure 52) tests
demonstrated the positive effect of CNTs which were either collagen coated or
non-coated for the attachment of MSCs from the early passages (P0) while there
was a negative effect on the cell adhesion in later passages (P1 and P2). The
possible explanation for this observation would be the aging of MSCs as the
passage number increased (203, 204). In the literature, similar adversely effect
of passage number on the cell viability was observed by the researchers where
the mean percent senescence increased significantly with cell passaging and

121
high passage numbers adversely affected the functioning of stem cells (203,
204).
The CNT toxicity is open to discussion in the literature. While some reports
were claiming toxic effect of CNTs (205, 206), some were with opposite views
exist (68, 114, 115). In a study by Zhu et al., DNA damaged was induced by
powdered form of MWCNTs (67) which was similar with the findings of Liu et
al. (207). On the other hand, researchers found that fibroblast cells were
attached and grown on the VA-CNTs without having any deleterious toxic effect
if the CNTs were firmly attached to a substrate (68, 114, 115). Furthermore,
there are other reports using the patterned CNTs for the growth of cells without
having any toxic effects (113, 202). According to the reports, it is appeared that
the form of CNTs used for scaffold applications have a key role in the viability
of cells. Therefore, using VA-CNTs for the ECM applications where it is firmly
attached to the substrate limits the possible toxic effects besides presenting
numerous anchoring points to the cells.

122
Chapter 5
Conclusions
In this thesis, the aim was to gain control over density and orientation of CNTs
and secondly, to modulate properties of VA-CNTs during growth. Gaining
control on growth of CNTs would provide new application fields by easily
building 2D and 3D functional surfaces. With regards to these, the growth
parameters and dynamics of VA-CNTs were investigated in this study and a
summary of the important points are given below.
Firstly, the effect of catalyst layer configuration on CNT density and alignment
was investigated as functions of reduction parameter and layer design. After
detailed analysis of catalyst layers using SEM, AFM, HRTEM, XPS and
Raman, it was found that the sandwich catalyst layer design was the best for this
study to have a high density and well aligned arrays on SiO2 substrates. In the
sandwich design, the Al barrier layer was crucial to inhibit the subsurface
diffusion of catalyst particles and the top Al layer acted as a pin to slow down
the migration of catalyst particles during the reduction process. Furthermore, the
effect of reduction step was investigated on the density and length of CNTs and
it was found that there was an optimum reduction time. As a conclusion, the

123
sandwich catalyst design would provide relatively tall, dense and well aligned
CNTs.
Secondly, the parameter of reduction step was not the only one affecting the
growth of VA-CNTs and thus the effect of synthesis parameters was also
investigated. In this study, a morphology transition of CNTs from well aligned-
straight to aligned ‘spaghetti’ like structures was achieved by varying carbon
source type from alcohols to ketones. Furthermore, with the help of Raman
analysis it was found that carbon source type has affected the crystallinity and
defect density of VA-CNTs. The most crystalline VA-CNTs were obtained
using acetone while CNTs had comparatively higher defect densities when
ethanol was used. This finding was explained by the molecular structure of
sources. In use of alcohols, OH group acts as an etchant and protects the surface
of catalyst from poisoning while it also etches the side walls which results in
defective structures. Hence, just by varying the carbon source type the quality
and morphology of arrays would be tuned during the growth.
Other synthesis parameters affecting the growth of VA-CNTs were carbon
source concentration and pressure inside the flow. In this study, the growth
behavior of VA-CNTs was found to have a Gaussian like dependence on the
ethanol pressure. Contrary to the effect of carbon source type and temperature,
changes in the pressure only affected the residence time and not the
decomposition process of carbon source. Thus, the increased residence time
124
with pressure was declared as the possible reason for the growth deceleration
due to the deactivation of catalyst sites with respect to increased concentration
of carbonaceous species on the catalyst surface. Furthermore, the effect of
carbon source concentration was investigated. In the opposite of pressure set
experiments, the increased carbon concentration in the flow resulted in less
contact time with the catalyst surface. As similar with pressure set results, it was
found that the growth rate decreased with respect to increased carbon
concentration. The possible reason was the catalyst poisoning due to the over-
feeding of carbon source by increased concentration. In a conclusion, the growth
of VA-CNTs followed a Gaussian like behavior rather than the continuous type
due to the decreased catalytic activity by coating of excess carbon in the growth
media when the residence time and concentration of carbon source were
increased in this study.
In order to understand the growth mechanism of CNTs, a method of approach
was developed by a combination of kinetic and diffusion related processes
which were possible limitations for the growth of VA-CNTs. According to these
assumptions and calculations, it was found that kinetic mechanism was
responsible for the growth termination. Diffusion of feedstock gas did not show
any dominant effect on the growth termination of VA-CNTs. This calculation
was consistent with the experimental data where the growth rate decreased by
increased residence time and carbon concentration due to decreased catalytic
activity.
125
Thirdly, the surface properties of VA-CNTs were investigated and found that
the wettability of grown VA-CNTs have been manipulated just by varying
growth parameters. While super-hydrophobic VA-CNTs were obtained at 750
°C, hydrophobic surfaces were grown at 625 °C. This showed that synthesis
parameters tuned the surface properties of VA-CNTs as well as their structural
properties by a facile route without inducing any chemical modification. Since
the cells would not prefer to attach on super-hydrophobic surfaces, VA-CNTs
synthesized at 625 °C were used as scaffolds for MSCs attachment experiments.
It was found that the patterned non-coated or collagen coated CNT surfaces
would be used as an alternative scaffold to commercial ones for growing MSCs
without encountering any toxicity. But the MSCs from P0 passage resulted in
better counts on the patterned non-coated CNT surfaces than the cells from P1
and P2 passage series. The decrease in the attachment of cells by passage series
was declared as the aging effect of MSCs. Moreover, collagen coating had an
adverse impact on the cell adhesion. It acted as smoothing agent by filling the
gaps between patterned CNTs which resulted in decrease of anchoring points
required for cell adhesion. Overall, this study demonstrated that surface
properties of VA-CNTs could be manipulated in a facile route during their
growth and hence they could be used as patterned CNT surfaces as a scaffold for
MSC growth and adhesion.

126
Fourth, the functionalization of VA-CNTs with Li during their growth (in situ)
has been investigated to overcome the requirements of good conductivity, fast
ion diffusion, high rate capacity and surface area. In the Li intercalation case, a
charge transfer occurs to carbon lattice resulting in shifts in the spectra.
Regarding to the results of XPS, EELS and Raman, the intercalation of Li inside
the carbon matrix of CNTs was confirmed during their growth. The further
study was also performed to intercalate Li after the growth of CNTs (ex situ)
however; the insertion of Li inside the matrix was not achieved. As a
conclusion, in situ Li intercalation during the growth of VA-CNTs was possible
through a facile route while their alignment was preserved.
Finally, the results presented in this study can contribute to better understand the
catalytic growth and mechanism of VA-CNTs using ACCVD method. The
investigation of experimental parameters help to control the growth and
properties of VA-CNTs for building functional surfaces to be used in future
applications.

127
Appendixes

128
Appendix I
To better understand the effect of top layer Al, XPS analysis were done on the reduced
and as is catalyst layers having configurations as 1nm Co/10nm Al and 0.5nm Al/1nm
Co/10nm Al. The XPS spectra of catalyst layers are shown in Figure 53. The pink lines
are for the layers after reduction while the black lines are for the form of layers before
the reduction process. Generally, the fitting of Co peaks should be performed using
Doniach-Sunjic (DS) asymmetric behavior due to the unfilled one-electron levels
(conduction electrons). However, if DS fitting is used, the atomic ratios would not be
the correct values because in that case extra areas will be added to the calculations due
to the tails of DS fitted peaks. Hence, the fitting of Co 2p and Al 2p regions were
performed using the mixture of Gaussian- Lorentizian (GL) instead of DS. In Figure 53,
it is clearly observed a decrease in the counts for the Co peaks when the layers were
subjected to the reduction. However, in contrast, the counts for the Al peaks were
increased after the reduction process. Using the Co 2p3/2 and Al 2p3/2 peaks, the atomic
ratios were calculated as in
Table 6.

129
XPS spectra of normal design and sandwich design catalyst layers before Figure 53.
and after reduction at 625 °C (black line indicates the layers before the reduction
whereas pink line represents the spectra of catalyst layers after the reduction).
Table 6. The atomic ratio of Co/Al calculated for the designs before and after reduction
process.
Atomic ratio of Co/Al
before reduction
Atomic ratio of Co/Al
after reduction
Normal catalyst design 51 / 49 38 / 62
Sandwich catalyst design 74 / 26 11 / 89

130
Appendix II
The liquid compaction method is based on the volume shrinkage of material
after contact with a liquid and dried. In this study, it was used to calculate the
areal density of VA-CNTs grown on the catalyst configurations of 1nm
Co/10nm Al and 0.5nm Al/1nm Co/10nm Al at 625 °C. First, the substrates with
VA-CNTs were immersed into a beaker filled with deionized water and then
pulled back. After the surfaces were left to dry, top view SEM images were
taken. To find out the values of F, Image J program was used to pattern a mask
from top view SEM images (133). Figure 54 shows the images after a mask was
applied on the SEM images. The black areas show the places where the CNTs
were compacted to a maximum area after the contact while the white ones are
for the bended CNTs. Hence, the value of F is the ratio of the sum of black areas
to the total image area.
The images after masking to calculate the compacted areas shown by black. Figure 54.

131
Appendix III
To calculate the areal density of CNTs, firstly it is assumed that CNTs are
closely packed arranged and the intertube distance (δ) is 0.34 nm which is also
called as theoretical Van der Waals tube distance. As shown in Figure 55, the
area signed as A contains one CNT arranged with a theoretical δ distance.
The proposed arrangement of CNTs on the substrate. Figure 55.
Hence, the definition of A provides a maximum density for CNTs having d
diameters. Using a simple math for a trapezoid, an equation for A would be
found.
√
Then, the equation for the theoretical ρ would be found as below;

132
√
However, it is known that the arrangement of VA-CNTs is relevant with the
catalyst design. Hence, a correction factor which was F should be added to the
theoretical equation. The value of F was found as shown in Appendix II.
According to this correction factor, the equation for ρ is;
√
The value of d was found to be around 7 nm for CNTs grown on the catalyst
layers of 1nm Co/10nm Al and 0.5nm Al/1nm Co/10nm Al at 625 °C.
Furthermore, the F values were % 10 and % 40 for the layers of 1nm Co/10nm
Al and 0.5nm Al/1nm Co/10nm Al, respectively. Using these values, ρ was
found to be ~2×10-11
cm-2
and ~9×10-11
cm-2
for the layers of 1nm Co/10nm Al
and 0.5nm Al/1nm Co/10nm Al, respectively.

133
Appendix IV
Ar and H2 gases were flowing through a bubbler containing ethanol to carry the
carbon source inside the ACCVD furnace. Some of the carried ethanol was
decomposed to form CNTs while the unreacted ethanol was collected at the trap
cooled by liquid N2. To find out the volumetric amount of ethanol (Q) flowed
inside the furnace, the following equation is used where ΔV represents the
change in the volume by time, Δt.
Regarding to this equation, ΔV is the change in the ethanol volume at the
bubbler after the growth and Δt is the total ACCVD time which is 30 minutes.
The initial volume of ethanol for all experiments was kept constant at 149 mL.
Using the equation, the values for Q were calculated and tabulated in the Table
7.

134
Table 7. Calculated values of the ethanol flow in the pressure set.
Pressure (Torr) Left volume of ethanol at the
bubbler (mL)
Calculated Q (sccm)
40 55 3.1
56 62 2.9
69 70 2.6
81 82 2.2
94 105 1.5

135
Appendix V
In the concentration set of experiments, the initial volume of ethanol at the
bubbler was taken different than 149 mL because the carbon source does not last
till the end of growth time. If the temperature of bubbler is increased, the growth
will not proceed for 30 minutes. Hence, for every temperature, the initial volume
of ethanol at the bubbler was changed. As shown before in Appendix IV, the
volumetric amount of ethanol (Q) flowed inside the furnace was calculated
using the change in the volume of bubbler by time. The growth lasts for 30
minutes for all experiments.
Table 8. Calculated values of the ethanol flow in the concentration set.
Temperature of
ethanol at the
bubbler (°C)
Pressure
(Torr)
Initial volume
of ethanol at the
bubbler (mL)
Left volume of
ethanol at the
bubbler (mL)
Calculated
Q (sccm)
32 40 149 55 3.1
50 53 149 15 4.5
71 71 200 10 6.3
83 81 230 14 7.2
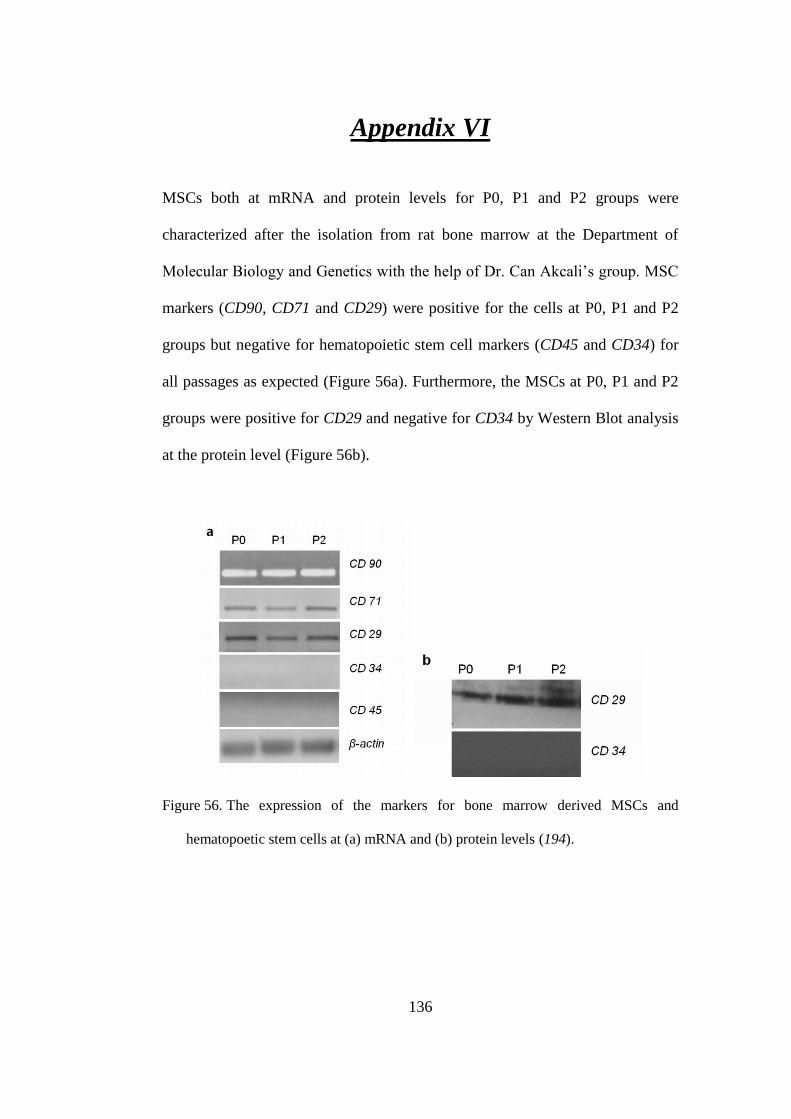
136
Appendix VI
MSCs both at mRNA and protein levels for P0, P1 and P2 groups were
characterized after the isolation from rat bone marrow at the Department of
Molecular Biology and Genetics with the help of Dr. Can Akcali’s group. MSC
markers (CD90, CD71 and CD29) were positive for the cells at P0, P1 and P2
groups but negative for hematopoietic stem cell markers (CD45 and CD34) for
all passages as expected (Figure 56a). Furthermore, the MSCs at P0, P1 and P2
groups were positive for CD29 and negative for CD34 by Western Blot analysis
at the protein level (Figure 56b).
The expression of the markers for bone marrow derived MSCs and Figure 56.
hematopoetic stem cells at (a) mRNA and (b) protein levels (194).

137
Appendix VII
DFT calculations for the in situ Li intercalation of VA-CNTs were performed by
Dr. Oguz Gulseren and his co-workers using the projector-augmented-wave
potentials (208). The details for the calculations would be found in the recent
published work (165). A bilayer graphene system with AA (8 initial
configurations) and AB (12 initial configurations) stacking having one Li atom
on were used and optimized to better understand the binding of Li with CNT.
Furthermore, charge densities for the proposed systems were investigated to
determine the charge transfer during the intercalation using Bader analysis. All
the results of the proposed systems were described in three groups; adsorption,
substitution and intercalation. The calculation for the binding energy was
described in the below:
Ebinding = Etotal – (Ebi-graphene + nLi X μLi)
Etotal; total energy of the relaxed composite system
Ebi-graphene; energy of graphitic system (i.e. bilayer graphene or bilayer graphene
with vacancies)
nLi; number of Li atoms
μLi; chemical potential of single Li atom

138
There were three possible adsorption sites; top (on top of a carbon atom), hollow
site (above the center of a hexagon), and the bridge site (above the bond
between two carbon atoms) designated as 1, 2, and 3 in Figure 57. After the
systems left for the relaxation, it was found that the Li atom was ~2.2 Å away
from the nearest carbon atom where a bonding occurred. The most energetically
stable (the highest binding energy) system was the adsorption of Li atom sitting
above the center of a hexagon with the binding energy of 2.29 eV while the
other sites had binding energies of around 1.9 eV.
(a) Possible Li adsorption sites; top (1), hollow (2) and bridge (3) for 6x6 Figure 57.
unit cell. (b) PDOS for Li intercalated cases shown in (c) and (d). Dotted line
indicates the Fermi level. Top and side views of the optimized geometry and the

139
charge density of (c) Li intercalated bilayer graphene and (d) similar system but
starting from Li substitution to a C site on top layer (165).
Other than adsorption systems, the substitution geometries were also conducted
by replacing one carbon atom with Li atom at the hexagon. In this case, very
strong bonds of C-C and Li-C were present; 1.42 Å for C-C and 2.2 Å for Li-C.
In the case of double carbon vacancy on graphene system, it was found that Li
atom was introduced and after the relaxation of system, it was situated between
the graphene layers. Hence, the length of Li-C was around 2.2 Å in the defective
graphene and the binding energy was 3.54 eV and 3.29 eV for single and double
carbon vacancy cases, respectively. Furthermore, the position of Li atom was
checked when left between the graphene layers. Hence, it was found that Li
placed on a hollow site and Li-C length was around 2.2 Å whereas the binding
energy was ~3.01eV.
Even, the highest energies were found for the substituted Li cases as a result of
binding energy calculations, they were not correct since the energies were
calculated with respect to defective graphene systems. Thus, the calculations
indicated that Li energetically preferred to be between two graphene layers
where Li was at mid hollow site as shown in Figure. The binding energies, Li-C
bond distances, and total charge transfer from Li to carbon network were listed
in the table below.

140
As mentioned before, the charge transfer from Li to the graphene system was
calculated using the Bader Analysis. In order to calculate the charge transfer
accurately, ten times denser grids were used than the common ones and the
difference of charges before and after Li intercalation around each atom was
counted. Finally, it was found that almost 0.86 electrons were passed from the
Li atom to the nearest carbon atom while it was leaving a positively charged Li
core behind. In the case of perfect intercalation case, an electron coming from
the Li atom was shared symmetrically by carbon atoms as shown in Figure 57c.
However, for the case of intercalation in defective systems, the extra charge was
placed more around the missing C atoms to compensate the dangling bonds
(Figure 57d).

141
Table 9. Binding energies, Li-C bond distances, and total charge transfer from Li to C
network for Li doped AA stacking bilayer resulted from LDA calculations (165).
Adsorption
geometry
Binding
energy (eV)
Li-C bond
distance (Å)
Total charge
transferred to carbon
atoms (e)
Outer top 1.93 1.99 0.9
Outer bridge 1.96 2.08 0.9
Outer hollow 2.29 2.21 0.88
Mid top 2.6 2.01 0.84
Mid bridge 2.63 2.09 0.84
Mid hollow 3.01 2.3 0.85
Substituted:
Single C
vacancy
3.54 2.27 0.84
Substituted:
Double C
vacancy
3.29 2.12 0.86
142
Bibliography
(1) Iijima, S. Helical microtubules of graphitic carbon. Nature 1991, 354, 56–
58.
(2) V.M. Lukyanovich, L. V. R. CNT ilk paper.pdf. Zurn Fisic Chim 1952,
26, 88–95.
(3) Oberlin, A. Carbonization and graphitization. Carbon 1984, 22, 521–541.
(4) Tibbetts, G. G. Why are carbon filaments tubular? Journal of Crystal
Growth 1984, 66, 632–638.
(5) Angus, J. C.; Hayman, C. C. Low-pressure, metastable growth of
diamond and “Diamondlike ” phases. Science 1988, 241, 913–921.
(6) Chai, Y.; Cuo, T.; Jin, C.; Hauflerj, R. E.; Chibante, L. P. F.; Fure, J.;
Wang, L.; Alford, J. M.; Smalley, R. E. Fullerenes with metals inside.
Journal of Physical Chemistry 1991, 95, 7564–7568.
(7) Novoselov, K. S.; Geim, A. K.; Morozov, S. V.; Jiang, D.; Zhang, Y.;
Dubonos, S. V.; Grigorieva, I. V.; Firsov, A. A. Electric field effect in
atomically thin carbon films. Science 2004, 306, 666–669.
(8) Hata, K.; Futaba, D. N.; Mizuno, K.; Namai, T.; Yumura, M.; Iijima, S.
Water-assisted highly efficient synthesis of impurity-free single-walled
carbon nanotubes. Science 2004, 306, 1362–1364.

143
(9) Nishino, H.; Yasuda, S.; Namai, T.; Futaba, D. N.; Yamada, T.; Yumura,
M.; Iijima, S.; Hata, K. Water-assisted highly efficient synthesis of
single-walled carbon nanotubes forests from colloidal nanoparticle
catalysts. Journal of Physical Chemistry C 2007, 111, 17961–17965.
(10) Cui, X.; Wei, W.; Chen, W. Lengthening and thickening of multi-walled
carbon nanotube arrays grown by chemical vapor deposition in the
presence and absence of water. Carbon 2010, 48, 2782–2791.
(11) Sugime, H.; Noda, S. Millimeter-tall single-walled carbon nanotube
forests grown from ethanol. Carbon 2010, 48, 2203–2211.
(12) Zhang, Y.; Gregoire, J. M.; Dover, R. B. V.; Hart, A. J. Ethanol-promoted
high-yield growth of few-walled carbon nanotubes. Journal of Physical
Chemistry C 2010, 114, 6389–6395.
(13) Bradford, P. D.; Wang, X.; Zhao, H.; Maria, J.-P.; Jia, Q.; Zhu, Y. T. A
novel approach to fabricate high volume fraction nanocomposites with
long aligned carbon nanotubes. Composites Science and Technology
2010, 70, 1980–1985.
(14) Ebbesen, T. W.; Ajayan, P. M. Large scale synthesis of carbon nanotubes.
Nature 1992, 358, 220–221.

144
(15) Odom, T. W.; Huang, J.-L.; Kim, P.; Lieber, C. M. Atomic structure and
electronic properties of single-walled carbon nanotubes. Nature 1997,
391, 62–64.
(16) Robertson, J. Diamond-like amorphous carbon. Materials Science and
Engineering R 2002, 37, 129–281.
(17) Ferrari, A. C. Raman spectroscopy of graphene and graphite: Disorder,
electron–phonon coupling, doping and nonadiabatic effects. Solid State
Communications 2007, 143, 47–57.
(18) Donato, M. G.; Messina, G.; Santangelo, S.; Galvagno, S.; Milone, C.;
Pistone, A. Aid of Raman spectroscopy in diagnostics of MWCNT
synthesised by Fe-catalysed CVD. Journal of Physics: Conference Series
2007, 61, 931–935.
(19) Kim, Y. A.; Hayashi, T.; Osawa, K.; Dresselhaus, M. S.; Endo, M.
Annealing effect on disordered multi-wall carbon nanotubes. Chemical
Physics Letters 2003, 380, 319–324.
(20) Wu, G.; Yang, X.; Dong, J. Radial breathinglike mode of the collapsed
single-walled carbon nanotube bundle under hydrostatic pressure. Applied
Physics Letters 2006, 88, 223114.
(21) Rols, S.; Righi, A.; Alvarez, L.; Anglaret, E.; Almairac, R.; Journet, C.;
Bernier, P.; Sauvajol, J. L. Diameter distribution of single wall carbon

145
nanotubes in nanobundles. The European Physical Journal B 2000, 18,
201–205.
(22) Jorio, A.; Saito, R.; Hafner, J.; Lieber, C.; Hunter, M.; McClure, T.;
Dresselhaus, G.; Dresselhaus, M. Structural ( n, m) determination of
isolated single-wall carbon nanotubes by resonant Raman scattering.
Physical Review Letters 2001, 86, 1118–1121.
(23) McGuire, K.; Gothard, N.; Gai, P. L.; Dresselhaus, M. S.; Sumanasekera,
G.; Rao, A. M. Synthesis and Raman characterization of boron-doped
single-walled carbon nanotubes. Carbon 2005, 43, 219–227.
(24) Chen, C. F.; Tsai, C. L.; Lin, C. L. The characterization of boron-doped
carbon nanotube arrays. Diamond and Related Materials 2003, 12, 1500–
1504.
(25) Ayala, P.; Arenal, R.; Rümmeli, M.; Rubio, a.; Pichler, T. The doping of
carbon nanotubes with nitrogen and their potential applications. Carbon
2010, 48, 575–586.
(26) Frank, S. Carbon nanotube quantum resistors. Science 1998, 280, 1744–
1746.
(27) Maciel, I. O.; Campos-Delgado, J.; Pimenta, M. A.; Terrones, M.;
Terrones, H.; Rao, A. M.; Jorio, A. Boron, nitrogen and phosphorous

146
substitutionally doped single-wall carbon nanotubes studied by resonance
Raman spectroscopy. Physica Status Solidi B 2009, 246, 2432–2435.
(28) Hsieh, C.-T.; Lin, Y.-T.; Lin, J.-Y.; Wei, J.-L. Synthesis of carbon
nanotubes over Ni- and Co-supported CaCO3 catalysts using catalytic
chemical vapor deposition. Materials Chemistry and Physics 2009, 114,
702–708.
(29) Colomer, J.; Stephan, C.; Lefrant, S.; Van Tendeloo, G.; Willems, I.
Large-scale synthesis of single-wall carbon nanotubes by catalytic
chemical vapor deposition (CCVD) method. Chemical Physics Letters
2000, 317, 83–89.
(30) Zhong, G.; Hofmann, S.; Yan, F.; Telg, H.; Warner, J. H.; Eder, D.;
Thomsen, C.; Milne, W. I.; Robertson, J. Acetylene: A Key Growth
Precursor for Single-Walled Carbon Nanotube Forests. The Journal of
Physical Chemistry C 2009, 113, 17321–17325.
(31) Hernadi, K.; Fonseca, A.; Nagy, J. B.; Siska, A.; Kiricsi, I. Production of
nanotubes by the catalytic decomposition of different carbon-containing
compounds. Applied Catalysis A: General 2000, 199, 245–255.
(32) Nikolaev, P.; Bronikowski, M. J.; Bradley, R. K.; Rohmund, F.; Colbert,
D. T.; Smith, K. A.; Smalley, R. E. Gas-phase catalytic growth of single-
walled carbon nanotubes from carbon monoxide. Chemical Physics
Letters 1999, 313, 91–97.

147
(33) Ortega-Cervantez, G.; Rueda-Morales, G.; Ortiz-López, J. Catalytic CVD
production of carbon nanotubes using ethanol. Microelectronics Journal
2005, 36, 495–498.
(34) Kohno, M.; Orii, T.; Hirasawa, M.; Seto, T.; Murakami, Y.; Chiashi, S.;
Miyauchi, Y.; Maruyama, S. Growth of single-walled carbon nanotubes
from size-selected catalytic metal particles. Applied Physics A 2004, 79,
787–790.
(35) Li, Q.; Yan, H.; Zhang, J.; Liu, Z. Effect of hydrocarbons precursors on
the formation of carbon nanotubes in chemical vapor deposition. Carbon
2004, 42, 829–835.
(36) Vm, S.; Mohamed, A. R.; Abdullah, A. Z.; Chai, S.-P. Role of reaction
and factors of carbon nanotubes growth in chemical vapour
decomposition process using methane—A highlight. Journal of
Nanomaterials 2010, 2010, 1–11.
(37) Huang, Z. P.; Wang, D. Z.; Wen, J. G.; Sennett, M.; Gibson, H.; Ren, Z.
F. Effect of nickel, iron and cobalt on growth of aligned carbon
nanotubes. Applied Physics A 2002, 74, 387–391.
(38) Cantoro, M.; Hofmann, S.; Pisana, S.; Ducati, C.; Parvez, a.; Ferrari, a.
C.; Robertson, J. Effects of pre-treatment and plasma enhancement on
chemical vapor deposition of carbon nanotubes from ultra-thin catalyst
films. Diamond and Related Materials 2006, 15, 1029–1035.

148
(39) Xu, X.; Huang, S.; Hu, Y.; Lu, J.; Yang, Z. Continuous synthesis of
carbon nanotubes using a metal-free catalyst by CVD. Materials
Chemistry and Physics 2012, 133, 95–102.
(40) Zhu, J.; Jia, J.; Kwong, F.; Ng, D. H. L.; Crozier, P. A. Metal-free
synthesis of carbon nanotubes filled with calcium silicate. Carbon 2012,
50, 2666–2669.
(41) Futaba, D. N.; Goto, J.; Yasuda, S.; Yamada, T.; Yumura, M.; Hata, K. A
background level of oxygen-containing aromatics for synthetic control of
carbon nanotube structure. Journal of the American Chemical Society
2009, 131, 15992–15993.
(42) Murakami, Y. Growth of vertically aligned single-walled carbon
nanotube films on quartz substrates and their optical anisotropy.
Chemical Physics Letters 2004, 385, 298–303.
(43) Emmenegger, C.; Bonard, J.; Mauron, P.; Lepora, A. Synthesis of carbon
nanotubes over Fe catalyst on aluminium and suggested growth
mechanism. Carbon 2003, 41, 539–547.
(44) Moisala, A.; Nasibulin, A. G.; Kauppinen, E. I. The role of metal
nanoparticles in the catalytic production of single-walled carbon
nanotubes — a review. Journal of Physics: Condensed Matter 2003, 15,
S3011–S3035.

149
(45) Veziri, C. M.; Karanikolos, G. N.; Pilatos, G.; Vermisoglou, E. C.;
Giannakopoulos, K.; Stogios, C.; Kanellopoulos, N. K. Growth and
morphology manipulation of carbon nanostructures on porous supports.
Carbon 2009, 47, 2161–2173.
(46) Sigurdson, S.; Sundaramurthy, V.; Dalai, a. K.; Adjaye, J. Effect of
anodic alumina pore diameter variation on template-initiated synthesis of
carbon nanotube catalyst supports. Journal of Molecular Catalysis A:
Chemical 2009, 306, 23–32.
(47) Matthews, K. D.; Lemaitre, M. G.; Kim, T.; Chen, H.; Shim, M.; Zuo, J.-
M. Growth modes of carbon nanotubes on metal substrates. Journal of
Applied Physics 2006, 100, 044309.
(48) Yudasaka, M.; Zhang, M.; Iijima, S. Porous target enhances production of
single-wall carbon nanotubes by laser ablation. Chemical Physics Letters
2000, 323, 549–553.
(49) Scott, C. D.; Arepalli, S.; Nikolaev, P.; Smalley, R. E. Growth
mechanisms for single-wall carbon nanotubes in a laser-ablation process.
Applied Physics A 2001, 72, 573–580.
(50) Journet, C.; Maser, W. K.; Bernier, P.; Loiseau, A. Large-scale
production of single-walled carbon nanotubes by the electric-arc
technique. Nature 1997, 388, 756–758.

150
(51) Zhao, X. Macroscopic oriented web of single-wall carbon nanotubes.
Chemical Physics Letters 2003, 373, 266–271.
(52) Cheng, H. M.; Li, F.; Su, G.; Pan, H. Y.; He, L. L.; Sun, X.; Dresselhaus,
M. S. Large-scale and low-cost synthesis of single-walled carbon
nanotubes by the catalytic pyrolysis of hydrocarbons. Applied Physics
Letters 1998, 72, 3282.
(53) Mahanandia, P.; Vishwakarma, P. N.; Nanda, K. K.; Prasad, V.; Barai,
K.; Mondal, a. K.; Sarangi, S.; Dey, G. K.; Subramanyam, S. V.
Synthesis of multi-wall carbon nanotubes by simple pyrolysis. Solid State
Communications 2008, 145, 143–148.
(54) Liu, B. C.; Lee, T. J.; Lee, S. H.; Park, C. Y.; Lee, C. J. Large-scale
synthesis of high-purity well-aligned carbon nanotubes using pyrolysis of
iron(II) phthalocyanine and acetylene. Chemical Physics Letters 2003,
377, 55–59.
(55) Rao, C. N. R.; Govindaraj, A. Carbon nanotubes from organometallic
precursors. Accounts of Chemical Research 2002, 35, 998–1007.
(56) Wagner, R. S.; Ellis, W. C. Vapor-liquid-solid mechanism of single
crystal growth. Applied Physics Letters 1964, 4, 89–90.

151
(57) Liu, K.; Jiang, K.; Feng, C.; Chen, Z.; Fan, S. A growth mark method for
studying growth mechanism of carbon nanotube arrays. Carbon 2005, 43,
2850–2856.
(58) Chhowalla, M.; Teo, K. B. K.; Ducati, C.; Rupesinghe, N. L.;
Amaratunga, G. A. J.; Ferrari, A. C.; Roy, D.; Robertson, J.; Milne, W. I.
Growth process conditions of vertically aligned carbon nanotubes using
plasma enhanced chemical vapor deposition. Journal of Applied Physics
2001, 90, 5308–5317.
(59) Wirth, C. T.; Zhang, C.; Zhong, G.; Hofmann, S.; Robertson, J. Diffusion
and reaction limited growth of carbon nanotube forests. ACS Nano 2009,
3, 3560–3566.
(60) Xiang, R.; Yang, Z.; Zhang, Q.; Luo, G.; Qian, W.; Wei, F.; Kadowaki,
M.; Einarsson, E.; Maruyama, S. Growth deceleration of vertically
aligned carbon nanotube arrays: Catalyst deactivation or feedstock
diffusion controlled? Journal of Physical Chemistry C 2008, 112, 4892–
4896.
(61) Dijon, J.; Szkutnik, P. D.; Fournier, a.; Goislard de Monsabert, T.;
Okuno, H.; Quesnel, E.; Muffato, V.; De Vito, E.; Bendiab, N.; Bogner,
a.; Bernier, N. How to switch from a tip to base growth mechanism in
carbon nanotube growth by catalytic chemical vapour deposition. Carbon
2010, 48, 3953–3963.

152
(62) Song, I. K.; Yu, W. J.; Cho, Y. S.; Choi, G. S.; Kim, D. The determining
factors for the growth mode of carbon nanotubes in the chemical vapour
deposition process. Nanotechnology 2004, 15, S590–S595.
(63) Anderson, P. E.; Rodriguez, N. M. Influence of the support on the
structural characteristics of carbon nanofibers produced from the metal-
catalyzed decomposition of ethylene. Chemistry of Materials 2000, 12,
823–830.
(64) Mattevi, C.; Wirth, C. T.; Hofmann, S.; Blume, R.; Cantoro, M.; Ducati,
C.; Cepek, C.; Knop-Gericke, A.; Milne, S.; Castellarin-Cudia, C.; Dolafi,
S.; Goldoni, A.; Schloegl, R.; Robertson, J. In-situ X-ray photoelectron
spectroscopy study of catalyst−support interactions and growth of carbon
nanotube forests. Journal of Physical Chemistry C 2008, 112, 12207–
12213.
(65) Cao, Q.; Hur, S.-H.; Zhu, Z.-T.; Sun, Y. G.; Wang, C.-J.; Meitl, M. A.;
Shim, M.; Rogers, J. A. Highly bendable, transparent thin-film transistors
that use carbon-nanotube-based conductors and semiconductors with
elastomeric dielectrics. Advanced Materials 2006, 18, 304–309.
(66) Ishikawa, F. N.; Chang, H.; Ryu, K.; Chen, P.; Badmaev, A.; Gomez, L.;
Arco, D.; Shen, G.; Zhou, C. Transparent electronics based on transfer
printed aligned carbon nanotubes on rigid and flexible substrates. ACS
Nano 2009, 3, 73–79.

153
(67) Zhu, L.; Chang, D. W.; Dai, L.; Hong, Y. DNA damage induced by
multiwalled carbon nanotubes in mouse embryonic stem cells. Nano
letters 2007, 7, 3592–3597.
(68) Lobo, a. O.; Corat, M. a. F.; Antunes, E. F.; Palma, M. B. S.; Pacheco-
Soares, C.; Garcia, E. E.; Corat, E. J. An evaluation of cell proliferation
and adhesion on vertically-aligned multi-walled carbon nanotube films.
Carbon 2010, 48, 245–254.
(69) Huczko, A. Synthesis of aligned carbon nanotubes. Applied Physics A:
Materials Science & Processing 2002, 74, 617–638.
(70) Seah, C.-M.; Chai, S.-P.; Mohamed, A. R. Synthesis of aligned carbon
nanotubes. Carbon 2011, 49, 4613–4635.
(71) Xiao, J.; Dunham, S.; Liu, P.; Zhang, Y.; Kocabas, C.; Moh, L.; Huang,
Y.; Hwang, K.-C.; Lu, C.; Huang, W.; Rogers, J. A. Alignment controlled
growth of single-walled carbon nanotubes on quartz substrates. Nano
letters 2009, 9, 4311–4319.
(72) Ma, Y.; Wang, B.; Wu, Y.; Huang, Y.; Chen, Y. The production of
horizontally aligned single-walled carbon nanotubes. Carbon 2011, 49,
4098–4110.

154
(73) Li, W. Z.; Xie, S. S.; Qian, L. X.; Chang, B. H.; Zou, B. S.; Zhou, W. Y.;
Zhao, R. A.; Wang, G. Large-scale synthesis of aligned carbon
nanotubes. Science 1996, 274, 1701–1703.
(74) Futaba, D. N.; Hata, K.; Namai, T.; Yamada, T.; Mizuno, K.; Hayamizu,
Y.; Yumura, M.; Iijima, S. 84% Catalyst activity of water-assisted growth
of single walled carbon nanotube forest characterization by a statistical
and macroscopic approach. The journal of physical chemistry. B 2006,
110, 8035–8038.
(75) Futaba, D.; Hata, K.; Yamada, T.; Mizuno, K.; Yumura, M.; Iijima, S.
Kinetics of water-assisted single-walled carbon nanotube synthesis
revealed by a time-evolution analysis. Physical Review Letters 2005, 95,
056104 –1–4.
(76) Yoshihara, N.; Ago, H.; Tsuji, M. Chemistry of water-assisted carbon
nanotube growth over Fe-Mo / MgO catalyst. Journal of Physical
Chemistry C 2007, 111, 11577–11582.
(77) Nasibulin, A. G.; Brown, D. P.; Queipo, P.; Gonzalez, D.; Jiang, H.;
Kauppinen, E. I. An essential role of CO2 and H2O during single-walled
carbon nanotube synthesis from carbon monoxide. Chemical Physics
Letters 2006, 417, 179–184.

155
(78) Wen, Q.; Qian, W.; Wei, F.; Ning, G. Oxygen-assisted synthesis of
SWNTs from methane decomposition. Nanotechnology 2007, 18,
215610–1–7.
(79) Pint, C. L.; Pheasant, S. T.; Parra-Vasquez, A. N. G.; Horton, C.; Xu, Y.;
Hauge, R. H. Investigation of optimal parameters for oxide-assisted
growth of vertically aligned single-walled carbon nanotubes. The Journal
of Physical Chemistry C 2009, 113, 4125–4133.
(80) Yu, G.; Gong, J.; Wang, S.; Zhu, D.; He, S.; Zhu, Z. Etching effects of
ethanol on multi-walled carbon nanotubes. Carbon 2006, 44, 1218–1224.
(81) Maruyama, S.; Kojima, R.; Miyauchi, Y.; Chiashi, S.; Kohno, M. Low-
temperature synthesis of high-purity single-walled carbon nanotubes from
alcohol. Chemical Physics Letters 2002, 360, 229–234.
(82) Oida, S.; Sakai, A.; Nakatsuka, O.; Ogawa, M.; Zaima, S. Effect of
alcohol sources on synthesis of single-walled carbon nanotubes. Applied
Surface Science 2008, 254, 7697–7702.
(83) Liu, W.-W.; Aziz, A.; Chai, S.-P.; Mohamed, A. R.; Tye, C.-T. The effect
of carbon precursors (methane, benzene and camphor) on the quality of
carbon nanotubes synthesised by the chemical vapour decomposition.
Physica E 2011, 43, 1535–1542.

156
(84) Montoro, L. A.; Corio, P.; Rosolen, J. M. A comparative study of
alcohols and ketones as carbon precursor for multi-walled carbon
nanotube growth. Carbon 2007, 45, 1234–1241.
(85) Botello-Méndez, A.; Campos-Delgado, J.; Morelos-Gómez, A.; Romo-
Herrera, J. M.; Rodríguez, Á. G.; Navarro, H.; Vidal, M. A.; Terrones, H.;
Terrones, M. Controlling the dimensions, reactivity and crystallinity of
multiwalled carbon nanotubes using low ethanol concentrations.
Chemical Physics Letters 2008, 453, 55–61.
(86) Mathur, A.; Roy, S. S.; Dickinson, C.; McLaughlin, J. A. Effect of thin
aluminum interlayer on growth and microstructure of carbon nanotubes.
Current Applied Physics 2010, 10, 407–410.
(87) Teng, F.-Y.; Ting, J.-M.; Sharma, S. P.; Liao, K.-H. Growth of CNTs on
Fe-Si catalyst prepared on Si and Al coated Si substrates. Nanotechnology
2008, 19, 095607–1–6.
(88) Burt, D. P.; Whyte, W. M.; Weaver, J. M. R.; Glidle, A.; Edgeworth, J.
P.; Macpherson, J. V.; Dobson, P. S. Effects of metal underlayer grain
size on carbon nanotube growth. The Journal of Physical Chemistry C
2009, 113, 15133–15139.
(89) Terrado, E.; Redrado, M.; Muñoz, E.; Maser, W. K.; Benito, a. M.;
Martínez, M. T. Aligned carbon nanotubes grown on alumina and quartz

157
substrates by a simple thermal CVD process. Diamond and Related
Materials 2006, 15, 1059–1063.
(90) Tsai, T.-Y.; Tai, N.-H.; Chen, K. C.; Lee, S. H.; Chan, L. H.; Chang, Y.
Y. Growth of vertically aligned carbon nanotubes on glass substrate at
450 °C through the thermal chemical vapor deposition method. Diamond
and Related Materials 2009, 18, 307–311.
(91) McNicholas, T. P.; Ding, L.; Yuan, D.; Liu, J. Density enhancement of
aligned single-walled carbon nanotube thin films on quartz substrates by
sulfur-assisted synthesis. Nano letters 2009, 9, 3646–50.
(92) de los Arcos, T.; Gunnar Garnier, M.; Oelhafen, P.; Mathys, D.; Won
Seo, J.; Domingo, C.; Vicente Garcı a-Ramos, J.; Sánchez-Cortés, S.
Strong influence of buffer layer type on carbon nanotube characteristics.
Carbon 2004, 42, 187–190.
(93) Kim, N. S.; Lee, Y. T.; Park, J.; Ryu, H.; Lee, H. J.; Choi, S. Y.; Choo, J.
Dependence of the vertically aligned growth of carbon nanotubes on the
catalysts. The Journal of Physical Chemistry B 2002, 106, 9286–9290.
(94) Ago, H.; Nakamura, Y.; Ogawa, Y.; Tsuji, M. Combinatorial catalyst
approach for high-density growth of horizontally aligned single-walled
carbon nanotubes on sapphire. Carbon 2011, 49, 176–186.

158
(95) Murakami, T.; Mitikami, K.; Ishigaki, S.; Matsumoto, K.; Nishio, K.;
Isshiki, T.; Harima, H.; Kisoda, K. Catalytic mechanism of a Fe–Co
bimetallic system for efficient growth of single-walled carbon nanotubes
on Si∕SiO2 substrates. Journal of Applied Physics 2006, 100, 094303–1–
4.
(96) Zhou, W.; Ding, L.; Liu, J. Role of catalysts in the surface synthesis of
single-walled carbon nanotubes. Nano Research 2009, 2, 593–598.
(97) Li, C.-S.; Su, S.-H.; Chi, H.-Y.; Yokoyama, M. Application of highly
ordered carbon nanotubes templates to field-emission organic light-
emitting diodes. Journal of Crystal Growth 2009, 311, 615–618.
(98) Yilmazoglu, O.; Popp, A.; Pavlidis, D.; Schneider, J. J.; Garth, D.;
Schüttler, F.; Battenberg, G. Vertically aligned multiwalled carbon
nanotubes for pressure, tactile and vibration sensing. Nanotechnology
2012, 23, 085501–1–8.
(99) Basirico, L.; Lanzara, G. Moving towards high-power, high-frequency
and low-resistance CNT supercapacitors by tuning the CNT length, axial
deformation and contact resistance. Nanotechnology 2012, 23, 305401–
1–13.
(100) Yuan, Y.; Smith, J. A.; Goenaga, G.; Liu, D.-J.; Luo, Z.; Liu, J. Platinum
decorated aligned carbon nanotubes: Electrocatalyst for improved

159
performance of proton exchange membrane fuel cells. Journal of Power
Sources 2011, 196, 6161–6167.
(101) Tae, Y.; Seung, C.; Sun, Y. Improved electrochemical performance of Li-
doped natural graphite anode for lithium secondary batteries. Journal of
Power sources 2005, 139, 230–234.
(102) Maurin, G.; Henn, F.; Simon, B.; Colomer, J.; Nagy, J. B. Lithium doping
of multiwalled carbon nanotubes produced by catalytic decomposition.
Nano Letters 2001, 1, 75–79.
(103) Yang, Z.; Wu, H. The electrochemical impedance measurements of
carbon nanotubes. Chemical Physics Letters 2001, 343, 235–240.
(104) Welna, D. T.; Qu, L.; Taylor, B. E.; Dai, L.; Durstock, M. F. Vertically
aligned carbon nanotube electrodes for lithium-ion batteries. Journal of
Power Sources 2011, 196, 1455–1460.
(105) Okada, S.; Saito, S.; Oshiyama, A. Energetics and electronic structures of
encapsulated C60 in a carbon nanotube. Physical Review Letters 2001,
86, 3835–3838.
(106) Gohier, A.; Laïk, B.; Kim, K.; Maurice, J. High-rate capability silicon
decorated vertically aligned carbon nanotubes for Li-ion batteries.
Advanced Materials 2012, 24, 2592–2597.

160
(107) Evanoff, K.; Khan, J.; Balandin, A. A.; Magasinski, A.; Ready, W. J.;
Fuller, T. F.; Yushin, G. Towards ultrathick battery electrodes : Aligned
carbon nanotube – enabled architecture. Advanced Materials 2012, 24,
533–537.
(108) Kim, B.; Chung, H.; Chu, K. S.; Yoon, H. G.; Lee, C. J.; Kim, W.
Synthesis of vertically-aligned carbon nanotubes on stainless steel by
water-assisted chemical vapor deposition and characterization of their
electrochemical properties. Synthetic Metals 2010, 160, 584–587.
(109) Ma, P. X. Biomimetic materials for tissue engineering. Advanced Drug
Delivery Reviews 2008, 60, 184–98.
(110) Li, W.; Tuli, R.; Huang, X.; Laquerriere, P.; Tuan, R. S. Multilineage
differentiation of human mesenchymal stem cells in a three-dimensional
nanofibrous scaffold. Biomaterials 2005, 26, 5158–5166.
(111) Hirata, E.; Uo, M.; Takita, H.; Akasaka, T.; Watari, F.; Yokoyama, A.
Multiwalled carbon nanotube-coating of 3D collagen scaffolds for bone
tissue engineering. Carbon 2011, 49, 3284–3291.
(112) Correa-duarte, M. A.; Wagner, N.; Morsczeck, C.; Thie, M.; Giersig, M.
Fabrication and biocompatibility of carbon nanotube-based 3D networks
as scaffolds for cell seeding and growth. Nano Letters 2004, 28–31.

161
(113) Zhang, X.; Prasad, S.; Niyogi, S.; Morgan, A.; Ozkan, M.; Ozkan, C.
Guided neurite growth on patterned carbon nanotubes. Sensors and
Actuators B 2005, 106, 843–850.
(114) Giannona, S.; Firkowska, I.; Rojas-Chapana, J.; Giersig, M. Vertically
aligned carbon nanotubes as cytocompatible material for enhanced
adhesion and proliferation of osteoblasts-like cells. Journal of
Nanoscience and Nanotechnology 2007, 7, 1679–1683.
(115) Lobo, A. O.; Antunes, E. F.; Machado, A. H. A.; Pacheco-soares, C. Cell
viability and adhesion on as grown multi-wall carbon nanotube films.
Materials Science and Engineering C 2008, 28, 264–269.
(116) Amama, P. B.; Pint, C. L.; Kim, S. M.; Mcjilton, Ќ. L.; Eyink, K. G.;
Stach, E. A.; Hauge, R. H.; Maruyama, B. Influence of alumina type on
the evolution and activity of alumina- supported Fe catalysts in single-
walled carbon nanotube carpet growth. ACS Nano 2010, 4, 895–904.
(117) Sakurai, S.; Nishino, H.; Futaba, D. N.; Yasuda, S.; Yamada, T.; Maigne,
A.; Matsuo, Y.; Nakamura, E.; Yumura, M.; Hata, K. Role of subsurface
diffusion and Ostwald ripening in catalyst formation for single-walled
carbon nanotube forest growth. Journal of the American Chemical
Society 2012, 134, 2148–53.

162
(118) Lee, H. C.; Alegaonkar, P. S.; Kim, D. Y.; Lee, J. H.; Yoo, J. B. Growth
of carbon nanotubes: effect of Fe diffusion and oxidation. Philosophical
Magazine Letters 2007, 87, 767–780.
(119) Murakami, Y.; Miyauchi, Y.; Chiashi, S.; Maruyama, S. Direct synthesis
of high-quality single-walled carbon nanotubes on silicon and quartz
substrates. Chemical Physics Letters 2003, 377, 49–54.
(120) Lee, C. J.; Kim, D. W.; Lee, T. J.; Choi, Y. C.; Park, Y. S.; Kim, W. S.;
Lee, Y. H.; Choi, W. B.; Lee, N. S.; Kim, J. M.; Choi, Y. G.; Yu, S. C.
Synthesis of uniformly distributed carbon nanotubes on a large area of Si
substrates by thermal chemical vapor deposition. Applied Physics Letters
1999, 75, 1721.
(121) Fan, S. Self-Oriented Regular Arrays of Carbon Nanotubes and Their
Field Emission Properties. Science 1999, 283, 512–514.
(122) Jin, C.; Woon, D.; Jae, T.; Chul, Y.; Soo, Y.; Hee, Y.; Bong, W.; Sung,
N.; Park, G.; Min, J. Synthesis of aligned carbon nanotubes using thermal
chemical vapor deposition. Chemical Physics Letters 1999, 312, 461–
468.
(123) Mizuno, K.; Hata, K.; Saito, T.; Ohshima, S.; Yumura, M.; Iijima, S.
Selective matching of catalyst element and carbon source in single-walled
carbon nanotube synthesis on silicon substrates. Journal of Physical
Chemistry C 2005, 109, 2632–2637.

163
(124) Dupuis, A. The catalyst in the CCVD of carbon nanotubes—a review.
Progress in Materials Science 2005, 50, 929–961.
(125) Zhao, Y.; Huang, D.; Saito, Y. A temperature window for ethanol
chemical vapor deposition of a carbon nanotube array catalyzed by Co
particles. Nanotechnology 2007, 18, 445608–445613.
(126) Sugime, H.; Noda, S.; Maruyama, S.; Yamaguchi, Y. Multiple
“optimum” conditions for Co–Mo catalyzed growth of vertically aligned
single-walled carbon nanotube forests. Carbon 2009, 47, 234–241.
(127) Yoshida, H.; Shimizu, T.; Uchiyama, T.; Kohno, H.; Homma, Y.; Takeda,
S. Atomic-scale analysis on the role of molybdenum in iron-catalyzed
carbon nanotube growth. Nano letters 2009, 9, 3810–3815.
(128) Cantoro, M.; Hofmann, S.; Pisana, S.; Scardaci, V.; Parvez, A.; Ducati,
C.; Ferrari, A. C.; Blackburn, A. M.; Wang, K.-Y.; Robertson, J. Catalytic
chemical vapor deposition of single-wall carbon nanotubes at low
temperatures. Nano letters 2006, 6, 1107–1112.
(129) Zhong, G.; Warner, J. H.; Fouquet, M.; Robertson, A. W.; Chen, B.;
Robertson, J. Growth of ultrahigh density single-walled carbon nanotube
forests by improved catalyst design. ACS nano 2012, 6, 2893–2903.

164
(130) Esconjauregui, S.; Fouquet, M.; Bayer, B. C.; Ducati, C.; Smajda, R.;
Hofmann, S.; Robertson, J. Growth of ultrahigh density vertically aligned
carbon nanotube forests for interconnects. ACS nano 2010, 4, 7431–7436.
(131) Esconjauregui, S.; Fouquet, M.; Bayer, B. C.; Ducati, C.; Robertson, J.
Catalyst design for the growth of highly packed nanotube forests. Physica
Status Solidi B 2011, 248, 2528–2531.
(132) Futaba, D. N.; Hata, K.; Yamada, T.; Hiraoka, T.; Hayamizu, Y.;
Kakudate, Y.; Tanaike, O.; Hatori, H.; Yumura, M.; Iijima, S. Shape-
engineerable and highly densely packed single-walled carbon nanotubes
and their application as super-capacitor electrodes. Nature materials
2006, 5, 987–994.
(133) Rasband, W. S. Image J. U. S. National Institutes of Health, Bethesda,
Maryland, USA.
(134) Dijon, J.; Okuno, H.; Fayolle, M.; Vo, T.; Pontcharra, J.; Acquaviva, D.;
Bouvet, D.; Ionescu, A. M.; Esconjauregui, C. S.; Capraro, B.; Quesnel,
E.; Robertson, J. Ultra-high density carbon nanotubes on Al-Cu for
advanced Vias. Electron Devices Meeting 2011, 33, 760–763.
(135) Zhang, R. Y.; Amlani, I.; Baker, J.; Tresek, J.; Tsui, R. K. Chemical
vapor deposition of single-walled carbon nanotubes using ultrathin Ni /Al
film as catalyst. Nano Letters 2003, 3, 731–735.

165
(136) Wu, W.; Teng, F.; Ting, J. The effect of an Al underlayer on Fe – Si thin
film catalysts for the improved growth of carbon nanotubes. Carbon
2011, 49, 4589–4594.
(137) Zhang, G.; Mann, D.; Zhang, L.; Javey, A.; Li, Y.; Yenilmez, E.; Wang,
Q.; McVittie, J. P.; Nishi, Y.; Gibbons, J.; Dai, H. Ultra-high-yield
growth of vertical single-walled carbon nanotubes: Hidden roles of
hydrogen and oxygen. Proceedings of the National Academy of Sciences
of the United States of America 2005, 102, 16141–16145.
(138) Pisana, S.; Cantoro, M.; Parvez, a.; Hofmann, S.; Ferrari, a. C.;
Robertson, J. The role of precursor gases on the surface restructuring of
catalyst films during carbon nanotube growth. Physica E: Low-
dimensional Systems and Nanostructures 2007, 37, 1–5.
(139) Zhang, Y.; Zou, G.; Doorn, S. K.; Htoon, H.; Stan, L.; Hawley, M. E.;
Sheehan, C. J.; Zhu, Y.; Jia, Q. Tailoring the Morphology of Carbon
Nanotube Arrays : From Spinnable Forests to Undulating Foams. ACS
nano 2009, 3, 2157–2162.
(140) Zhan, Z.; Zhang, Y.; Sun, G.; Zheng, L.; Liao, K. The effects of catalyst
treatment on fast growth of millimeter-long multi-walled carbon nanotube
arrays. Applied Surface Science 2011, 257, 7704–7708.
(141) Ohring, M. The Materials Science of Thin Films; 2nd ed.; Acedemic
Press, 2002; pp. 87–96.
166
(142) Petitto, S. C.; Langell, M. a. Surface composition and structure of Co3O4
(110) and the effect of impurity segregation. Journal of Vacuum Science
& Technology A: Vacuum, Surfaces, and Films 2004, 22, 1690–1696.
(143) Riva, R.; Miessner, H.; Vitali, R.; Piero, G. D. Metal – support interaction
in Co/SiO2 and Co/TiO 2. Applied Catalysis A: General 2000, 196, 111–
123.
(144) Girardon, J.; Lermontov, A.; Gengembre, L.; Chernavskii, P.;
Gribovalconstant, A.; Khodakov, A. Effect of cobalt precursor and
pretreatment conditions on the structure and catalytic performance of
cobalt silica-supported Fischer Tropsch catalysts. Journal of Catalysis
2005, 230, 339–352.
(145) Tian, Y.; Hu, Z.; Yang, Y.; Wang, X.; Chen, X.; Xu, H.; Wu, Q.; Ji, W.;
Chen, Y. In situ TA-MS study of the six-membered-ring-based growth of
carbon nanotubes with benzene precursor. Journal of the American
Chemical Society 2004, 126, 1180–11833.
(146) Yan, A.; Xiao, X.; Külaots, I.; Sheldon, B. W.; Hurt, R. H. Controlling
water contact angle on carbon surfaces from 5° to 167°. Carbon 2006, 44,
3116–3120.
(147) Banerjee, D.; Mukherjee, S.; Chattopadhyay, K. K. Controlling the
surface topology and hence the hydrophobicity of amorphous carbon thin
films. Carbon 2010, 48, 1025–1031.

167
(148) Zhao, B.; Futaba, D. N.; Yasuda, S.; Akoshima, M.; Yamada, T.; Hata, K.
Exploring advantages of diverse carbon nanotube forests with tailored
structures synthesized by supergrowth from engineered catalysts. ACS
nano 2009, 3, 108–114.
(149) Meng, L.-Y.; Park, S.-J. Effect of fluorination of carbon nanotubes on
superhydrophobic properties of fluoro-based films. Journal of colloid and
interface science 2010, 342, 559–563.
(150) Lau, K. K. S.; Bico, J.; Teo, K. B. K.; Chhowalla, M.; Amaratunga, G. a.
J.; Milne, W. I.; McKinley, G. H.; Gleason, K. K. Superhydrophobic
carbon nanotube forests. Nano Letters 2003, 3, 1701–1705.
(151) Ramos, S. C.; Vasconcelos, G.; Antunes, E. F.; Lobo, A. O.; Trava-
Airoldi, V. J.; Corat, E. J. Total re-establishment of superhydrophobicity
of vertically-aligned carbon nanotubes by CO2 laser treatment. Surface
and Coatings Technology 2010, 204, 3073–3077.
(152) Georgakilas, V.; Bourlinos, A. B.; Zboril, R.; Trapalis, C. Synthesis ,
characterization and aspects of superhydrophobic functionalized carbon
nanotubes. Chemistry of Materials 2008, 20, 2884–2886.
(153) Bu, I. Y. Y.; Oei, S. P. Hydrophobic vertically aligned carbon nanotubes
on Corning glass for self cleaning applications. Applied Surface Science
2010, 256, 6699–6704.

168
(154) Nguyen-vu, T. D. B.; Chen, H.; Cassell, A. M.; Andrews, R. J.;
Meyyappan, M. Vertically aligned carbon nanofiber architecture as a
multifunctional 3-D neural electrical interface. IEEE Transactions on
Biomedical Engineering 2007, 54, 1121–1128.
(155) Sethi, S.; Ge, L.; Ci, L.; Ajayan, P. M.; Dhinojwala, A. Gecko-inspired
carbon nanotube-based self-cleaning adhesives. Nano Letters 2008, 8,
822–825.
(156) Puretzky, A. A.; Geohegan, D. B.; Jesse, S.; Ivanov, I. N.; Eres, G. In situ
measurements and modeling of carbon nanotube array growth kinetics
during chemical vapor deposition. Applied Physics A 2005, 81, 223–240.
(157) Louchev, O. A.; Laude, T.; Sato, Y.; Kanda, H. Diffusion-controlled
kinetics of carbon nanotube forest growth by chemical vapor deposition.
Journal of Chemical Physics 2003, 118, 7622–7634.
(158) Wang, X.; Feng, Y.; Unalan, H. E.; Zhong, G.; Li, P.; Yu, H.;
Akinwande, A. I.; Milne, W. I. The mechanism of the sudden termination
of carbon nanotube supergrowth. Carbon 2011, 49, 214–221.
(159) Einarsson, E.; Murakami, Y.; Kadowaki, M.; Maruyama, S. Growth
dynamics of vertically aligned single-walled carbon nanotubes from in
situ measurements. Carbon 2008, 46, 923–930.

169
(160) Vinten, P.; Lefebvre, J.; Finnie, P. Kinetic critical temperature and
optimized chemical vapor deposition growth of carbon nanotubes.
Chemical Physics Letters 2009, 469, 293–297.
(161) Wang, G.; Wang, H.; Tang, Z.; Li, W.; Bai, J. Simultaneous production
of hydrogen and multi-walled carbon nanotubes by ethanol
decomposition over Ni/Al2O3 catalysts. Applied Catalysis B:
Environmental 2009, 88, 142–151.
(162) Shimoda, H.; Gao, B.; Tang, X.; Kleinhammes, A.; Fleming, L.; Wu, Y.;
Zhou, O. Lithium intercalation into opened single-wall carbon nanotubes:
storage capacity and electronic properties. Physical Review Letters 2001,
88, 5–8.
(163) Rana, K.; Sil, A.; Ray, S. Modification of the structure of multi-walled
carbon nanotubes by choice of catalyst and their electrochemical
behavior. Materials Chemistry and Physics 2010, 120, 484–489.
(164) Rana, K.; Sil, A.; Ray, S. Synthesis and characterization of carbon
nanotubes by using catalyst LiNi0.5Co0.5O2 on anodized alumina
substrate. Advanced Materials Research 2009, 67, 197–202.
(165) Rana, K.; Kucukayan-Dogu, G.; Sen, H. S.; Boothroyd, C.; Gulseren, O.;
Bengu, E. Analysis of Charge Transfer for in Situ Li Intercalated Carbon
Nanotubes. The Journal of Physical Chemistry C 2012, 116, 11364–
11369.

170
(166) Lru, D.-R.; Williams, D. B. The electron-energy-loss spectrum of lithium
metal. Philosophical Magazine Part B 1986, 53, L123–L128.
(167) Wang, F.; Graetz, J.; Moreno, M. S.; Ma, C.; Wu, L.; Volkov, V.; Zhu, Y.
Chemical distribution and bonding of lithium in intercalated graphite:
identification with optimized electron energy loss spectroscopy. ACS
Nano 2011, 5, 1190–1197.
(168) Hightower, a.; Ahn, C. C.; Fultz, B.; Rez, P. Electron energy-loss
spectrometry on lithiated graphite. Applied Physics Letters 2000, 77,
238–240.
(169) Liu, X.; Pichler, T.; Knupfer, M.; Fink, J. Electronic and optical
properties of alkali-metal-intercalated single-wall carbon nanotubes.
Physical Review B 2003, 67, 125403–125411.
(170) Cupolillo, A.; Giallombardo, C.; Papagno, L. Electronic properties of
alkali–metal intercalated single walled carbon nanotubes. Surface Science
2007, 601, 2828–2831.
(171) Claye, a.; Nemes, N.; Jánossy, a.; Fischer, J. Structure and electronic
properties of potassium-doped single-wall carbon nanotubes. Physical
Review B 2000, 62, R4845–R4848.
(172) Bendiab, N.; Anglaret, E.; Bantignies, J.-L.; Zahab, a.; Sauvajol, J.; Petit,
P.; Mathis, C.; Lefrant, S. Stoichiometry dependence of the Raman

171
spectrum of alkali-doped single-wall carbon nanotubes. Physical Review
B 2001, 64, 1–6.
(173) Strydom, A.; Strydom, H. J. X-ray photoelectron spectroscopy studies of
some cobalt (II) nitrate complexes. Inorganic Chemistry Acta 1989, 159,
191–195.
(174) Baer, Y.; Citrin, P. H.; Wertheim, G. K. X-Ray photoemission from
lithium: An explanation of its X-ray edge. Physical Review Letters 1976,
37, 49–52.
(175) Imanishi, N.; Ohashi, S.; Ichikawa, T.; Takeda, Y.; Yamamoto, O.
Carbon-lithium anodes for lithium secondary batteries. Journal of Power
Sources 1992, 39, 185–191.
(176) Datsyuk, V.; Kalyva, M.; Papagelis, K.; Parthenios, J.; Tasis, D.; Siokou,
a.; Kallitsis, I.; Galiotis, C. Chemical oxidation of multiwalled carbon
nanotubes. Carbon 2008, 46, 833–840.
(177) Buqa, H.; Blyth, R. I. R.; Golob, P.; Evers, B.; Schneider, I.; Santis
Alvarez, M. V.; Hofer, F.; Netzer, F. P.; Ramsey, M. G.; Winter, M.;
Besenhard, J. O. Negative electrodes in rechargeable lithium ion batteries
— Influence of graphite surface modification on the formation of the
solid electrolyte interphase. Ionics 2000, 6, 172–179.

172
(178) Kanamura, K.; Shiraishi, S.; Takezawa, H.; Takehara, Z. XPS Analysis of
the Surface of a Carbon Electrode Intercalated by Lithium Ions. 1997,
4756, 1797–1804.
(179) Momose, H.; Honbo, H.; Takeuchi, S.; Nishimura, K.; Horiba, T.;
Muranaka, Y.; Kozono, Y.; Miyadera, H. X-ray photoelectron
spectroscopy analyses of lithium intercalation and alloying reactions on
graphite electrodes. Journal of Power Sources 1997, 68, 208–211.
(180) Mordkovich, V. Z. Synthesis and XPS investigation of superdense
lithium-graphite intercalation compound, LiC2. Synthetic Metals 1996,
80, 243–247.
(181) Wertheim, G. K.; Van Attekum, P. M. T. M.; Basu, S. Electronic
structure of lithium graphite. Solid State Communications 1980, 33,
1127–1130.
(182) da Silva Meirelles, L.; Caplan, A. I.; Nardi, N. B. In search of the in vivo
identity of mesenchymal stem cells. Stem cells 2008, 26, 2287–2299.
(183) Nauta, A. J.; Fibbe, W. E. Immunomodulatory properties of mesenchymal
stromal cells. Blood 2007, 110, 3499–3506.
(184) Tai, B. C. U.; Du, C.; Gao, S.; Wan, A. C. a; Ying, J. Y. The use of a
polyelectrolyte fibrous scaffold to deliver differentiated hMSCs to the
liver. Biomaterials 2010, 31, 48–57.

173
(185) Kang, Y.; Kim, S.; Khademhosseini, A.; Yang, Y. Creation of bony
microenvironment with CaP and cell-derived ECM to enhance human
bone-marrow MSC behavior and delivery of BMP-2. Biomaterials 2011,
32, 6119–6130.
(186) Yang, W.; Thordarson, P.; Gooding, J. J.; Ringer, S. P.; Braet, F. Carbon
nanotubes for biological and biomedical applications. Nanotechnology
2007, 18, 412001.
(187) Saito, N.; Usui, Y.; Aoki, K.; Narita, N.; Shimizu, M.; Hara, K.; Ogiwara,
N.; Nakamura, K.; Ishigaki, N.; Kato, H.; Taruta, S.; Endo, M. Carbon
nanotubes: biomaterial applications. Chemical Society reviews 2009, 38,
1897–903.
(188) Chen, R. J.; Bangsaruntip, S.; Drouvalakis, K. a; Kam, N. W. S.; Shim,
M.; Li, Y.; Kim, W.; Utz, P. J.; Dai, H. Noncovalent functionalization of
carbon nanotubes for highly specific electronic biosensors. Proceedings
of the National Academy of Sciences of the United States of America
2003, 100, 4984–9.
(189) Tay, C. Y.; Gu, H.; Leong, W. S.; Yu, H.; Li, H. Q.; Heng, B. C.;
Tantang, H.; Loo, S. C. J.; Li, L. J.; Tan, L. P. Cellular behavior of human
mesenchymal stem cells cultured on single-walled carbon nanotube film.
Carbon 2010, 48, 1095–1104.

174
(190) Park, S. Y.; Namgung, S.; Kim, B.; Im, J.; Kim, J. Y.; Sun, K.; Lee, K.
B.; Nam, J.-M.; Park, Y.; Hong, S. Carbon nanotube monolayer patterns
for directed growth of mesenchymal stem cells. Advanced Materials
2007, 19, 2530–2534.
(191) Dalby, M.; Yarwood, S.; Riehle, M.; Johnstone, H.; Affrossman, S.;
Curtis, A. Increasing fibroblast response to materials using
nanotopography: morphological and genetic measurements of cell
response to 13-nm-high polymer demixed islands. Experimental Cell
Research 2002, 276, 1–9.
(192) Gentile, F.; Tirinato, L.; Battista, E.; Causa, F.; Liberale, C.; di Fabrizio,
E. M.; Decuzzi, P. Cells preferentially grow on rough substrates.
Biomaterials 2010, 31, 7205–7212.
(193) Kunzler, T. P.; Huwiler, C.; Drobek, T.; Vörös, J.; Spencer, N. D.
Systematic study of osteoblast response to nanotopography by means of
nanoparticle-density gradients. Biomaterials 2007, 28, 5000–5006.
(194) Bitirim, C. V.; Kucukayan-Dogu, G.; Bengu, E.; Akcali, K. C. Patterned
carbon nanotubes as a new three-dimensional scaffold for mesenchymal
stem cells. Materials Science and Engineering C 2012, submitted.
(195) Dalby, M. J.; Gadegaard, N.; Tare, R.; Andar, A.; Riehle, M. O.; Herzyk,
P.; Wilkinson, C. D. W.; Oreffo, R. O. C. The control of human

175
mesenchymal cell differentiation using nanoscale symmetry and disorder.
Nature materials 2007, 6, 997–1003.
(196) Wirth, C. T.; Hofmann, S.; Robertson, J. Surface properties of vertically
aligned carbon nanotube arrays. Diamond and Related Materials 2008,
17, 1518–1524.
(197) Cho, Y.; Borgens, R. B. The effect of an electrically conductive carbon
nanotube/collagen composite on neurite outgrowth of PC12 cells. Journal
of biomedical materials research. Part A 2010, 95, 510–517.
(198) Hirata, E.; Uo, M.; Takita, H.; Akasaka, T.; Watari, F.; Yokoyama, A.
Development of a 3D collagen scaffold coated with multiwalled carbon
nanotubes. Journal of biomedical materials research. Part B, Applied
biomaterials 2009, 90, 629–634.
(199) Silva, E. E.; Colleta, H. H. M.; Ferlauto, A. S.; Moreira, R. L.; Resende,
R. R.; Oliveira, S.; Kitten, G. T.; Lacerda, R. G.; Ladeira, L. O.
Nanostructured 3-D collagen/nanotube biocomposites for future bone
regeneration scaffolds. Nano Research 2010, 2, 462–473.
(200) MacDonald, R. a; Laurenzi, B. F.; Viswanathan, G.; Ajayan, P. M.;
Stegemann, J. P. Collagen-carbon nanotube composite materials as
scaffolds in tissue engineering. Journal of biomedical materials research.
Part A 2005, 74, 489–496.

176
(201) Sridharan, I.; Kim, T.; Wang, R. Adapting collagen/CNT matrix in
directing hESC differentiation. Biochemical and biophysical research
communications 2009, 381, 508–512.
(202) Supronowicz, P. R.; Ajayan, P. M.; Ullmann, K. R.; Arulanandam, B. P.;
Metzger, D. W.; Bizios, R. Novel current-conducting composite
substrates for exposing osteoblasts to alternating current stimulation.
Journal of biomedical materials research 2002, 59, 499–506.
(203) Gruber, H.; Somayaji, S.; Riley, F.; Hoelscher, G.; Norton, H.; Ingram, J.;
Hanley, E. N. Human adipose-derived mesenchymal stem cells: serial
passaging, doubling time and cell senescence. Biotechnic and
Histochemistyr 2012, 87, 303–311.
(204) Crisostomo, P. R.; Wang, M.; Wairiuko, G. M.; Morrell, E. D.; Terrell, A.
M.; Seshadri, P.; Nam, U. H.; Meldrum, D. R. High passage number of
stem cells adversely affects stem cell activation and myocardial
protection. Shock 2006, 26, 575–580.
(205) Smart, S. K.; Cassady, a. I.; Lu, G. Q.; Martin, D. J. The biocompatibility
of carbon nanotubes. Carbon 2006, 44, 1034–1047.
(206) Jia, G.; Wang, H.; Yan, L.; Wang, X.; Pei, R.; Yan, T.; Zhao, Y.; Guo, X.
Cytotoxicity of carbon nanomaterials: single-wall nanotube, multi-wall
nanotube, and fullerene. Environmental science & technology 2005, 39,
1378–1383.

177
(207) Liu, D.; Yi, C.; Zhang, D.; Zhang, J.; Yang, M. Inhibition of proliferation
and differentiation of mesenchymal stem cells by carboxylated carbon
nanotubes. ACS Nano 2010, 4, 2185–2195.
(208) Blochl, P. E. Projector augmented-wave method. Physical Review B
1994, 50, 17953–17979.

178
List of Publications
1. Rana, K.; Kucukayan-Dogu, G.; Sen S. H.; Boothroyd C.; Gulseren O.;
Bengu E. Analysis of charge transfer for in Situ Li intercalated carbon
nanotubes. The Journal of Physical Chemistry C 2012 116,
11364−11369.
2. Sam, E. D.; Kucukayan-Dogu, G.; Baykal, B.; Dalkilic Z.; Rana K.;
Bengu E. Simultaneous growth of self-patterned carbon nanotube forests
with dual height scales. Nanoscale 2012 4, 3746 – 3753.
3. Rana, K.; Kucukayan-Dogu, G.; Bengu, E. Growth of vertically aligned
carbon nanotubes over self-ordered nano-porous alumina films and their
surface properties. Applied Surface Science 2012 258, 7112-7117.
4. Bitirim, V. C.; Kucukayan-Dogu, G.; Bengu, E.; Akcali, K. C. Patterned
carbon nanotubes as a new three-dimensional scaffold for mesenchymal
stem cells. submitted to Materials Science and Engineering C 2012.
5. Kucukayan, G.; Ovalı, R.; Ilday, S.; Baykal, B.; Yurdakul, H.; Turan, S.;
Gülseren, O.; Bengu, E. An experimental and theoretical study of the
sulfur effect on the pyrolytically grown carbon nanotubes using sucrose
based solid state precursors. Carbon 2011 49, 508 – 517.
6. Kucukayan-Dogu, G.; Bitirim, V. C.; Gozen, D.; Bengu, E.; Akcali, K. C.
Preferential attachment of metastatic cancer cells to patterned carbon
nanotubes. In prepration.

179
7. Kucukayan-Dogu, G.; Sen, H. S.; Yurdakul, H.; Turan, S.; Gulseren, O.;
Bengu, E. The doping of phosphorous on the pyrolytically grown carbon
nanotubes using sucrose based solid state precursors. In prepration.
Proceedings
1. Kucukayan, G.; Kayacan, S.; Baykal, B.; Bengu, E. Use of saccharides as
solid-state precursors for the synthesis of carbon nanotubes. MRS
Proceedings 2008 1081, P05-14.

180
Copyright Licences
NATURE PUBLISHING GROUP LICENSE
TERMS AND CONDITIONS
This is a License Agreement between Gokce Dogu ("You") and Nature
Publishing Group ("Nature Publishing Group") provided by Copyright
Clearance Center ("CCC"). The license consists of your order details, the
terms and conditions provided by Nature Publishing Group, and the
payment terms and conditions.
All payments must be made in full to CCC. For payment instructions,
please see information listed at the bottom of this form.
License Number 3065211121554
License date Jan 10, 2013
Licensed content publisher Nature Publishing Group
Licensed content publication Nature
Licensed content title Helical microtubules of graphitic
carbon
Licensed content author Sumio Iijima
Licensed content date Nov 7, 1991
Volume number 354
Issue number 6348
Type of Use reuse in a thesis/dissertation
Requestor type academic/educational
Format print and electronic
Portion figures/tables/illustrations
Number of
figures/tables/illustrations 1
Figures 1
Author of this NPG article no
Your reference number
Title of your thesis / dissertation
Synthesis, Characterization and
Functionalization of Vertically
Aligned Carbon Nanotube Arrays
Expected completion date Jan 2013
Estimated size (number of pages) 200
Total 0.00 USD

181
ELSEVIER LICENSE
TERMS AND CONDITIONS
This is a License Agreement between Gokce Dogu ("You") and Elsevier
("Elsevier") provided by Copyright Clearance Center ("CCC"). The
license consists of your order details, the terms and conditions provided
by Elsevier, and the payment terms and conditions.
All payments must be made in full to CCC. For payment instructions,
please see information listed at the bottom of this form.
Supplier
Elsevier Limited
The Boulevard,Langford Lane
Kidlington,Oxford,OX5 1GB,UK
Registered Company Number 1982084
Customer name Gokce Dogu
Customer address Bilkent University
Ankara , 06800
License number 3065391036099
License date Jan 10, 2013
Licensed content publisher Elsevier
Licensed content publication Journal of Crystal Growth
Licensed content title Why are carbon filaments tubular?
Licensed content author Gary G. Tibbetts
Licensed content date May 1984
Licensed content volume number 66
Licensed content issue number 3
Number of pages 7
Start Page 632
End Page 638
Type of Use reuse in a thesis/dissertation
Portion figures/tables/illustrations
Number of figures/tables/illustrations 1
Format both print and electronic
Are you the author of this Elsevier
article? No
Will you be translating? No
Order reference number

182
Title of your thesis/dissertation
Synthesis, Characterization and
Functionalization of Vertically
Aligned Carbon Nanotube Arrays
Expected completion date Jan 2013
Estimated size (number of pages) 200
Elsevier VAT number GB 494 6272 12
Permissions price 0.00 USD
VAT/Local Sales Tax 0.0 USD / 0.0 GBP
Total 0.00 USD
183
NATURE PUBLISHING GROUP LICENSE
TERMS AND CONDITIONS
This is a License Agreement between Gokce Dogu ("You") and Nature
Publishing Group ("Nature Publishing Group") provided by Copyright
Clearance Center ("CCC"). The license consists of your order details, the
terms and conditions provided by Nature Publishing Group, and the
payment terms and conditions.
All payments must be made in full to CCC. For payment instructions,
please see information listed at the bottom of this form.
License Number 3065850543447
License date Jan 11, 2013
Licensed content publisher Nature Publishing Group
Licensed content publication Nature
Licensed content title Large-scale synthesis of carbon
nanotubes
Licensed content author T. W. Ebbesen, P. M. Ajayan
Licensed content date Jul 16, 1992
Volume number 358
Issue number 6383
Type of Use reuse in a thesis/dissertation
Requestor type academic/educational
Format print and electronic
Portion figures/tables/illustrations
Number of
figures/tables/illustrations 3
Figures 3
Author of this NPG article no
Your reference number
Title of your thesis / dissertation
Synthesis, Characterization and
Functionalization of Vertically
Aligned Carbon Nanotube Arrays
Expected completion date Jan 2013
Estimated size (number of pages) 200
Total 0.00 USD

184
NATURE PUBLISHING GROUP LICENSE
TERMS AND CONDITIONS
This is a License Agreement between Gokce Dogu ("You") and Nature
Publishing Group ("Nature Publishing Group") provided by Copyright
Clearance Center ("CCC"). The license consists of your order details, the
terms and conditions provided by Nature Publishing Group, and the
payment terms and conditions.
All payments must be made in full to CCC. For payment instructions,
please see information listed at the bottom of this form.
License Number 3065860004055
License date Jan 11, 2013
Licensed content publisher Nature Publishing Group
Licensed content publication Nature
Licensed content title Atomic structure and electronic properties
of single-walled carbon nanotubes
Licensed content author Teri Wang Odom, Jin-Lin Huang, Philip
Kim, Charles M. Lieber
Licensed content date Jan 1, 1998
Volume number 391
Issue number 6662
Type of Use reuse in a thesis/dissertation
Requestor type academic/educational
Format print and electronic
Portion figures/tables/illustrations
Number of
figures/tables/illustrations 1
Figures 2
Author of this NPG article no
Your reference number
Title of your thesis / dissertation
Synthesis, Characterization and
Functionalization of Vertically Aligned
Carbon Nanotube Arrays
Expected completion date Jan 2013
Estimated size (number of
pages) 200
Total 0.00 USD

185
THE AMERICAN ASSOCIATION FOR THE ADVANCEMENT OF
SCIENCE LICENSE
TERMS AND CONDITIONS
This is a License Agreement between Gokce Dogu ("You") and The American
Association for the Advancement of Science ("The American Association for
the Advancement of Science") provided by Copyright Clearance Center
("CCC"). The license consists of your order details, the terms and conditions
provided by The American Association for the Advancement of Science, and
the payment terms and conditions.
All payments must be made in full to CCC. For payment instructions,
please see information listed at the bottom of this form.
License Number 3065401123468
License date Jan 10, 2013
Licensed content publisher The American Association for the Advancement of
Science
Licensed content
publication Science
Licensed content title Water-Assisted Highly Efficient Synthesis of
Impurity-Free Single-Walled Carbon Nanotubes
Licensed content author Kenji Hata, Don N. Futaba, Kohei Mizuno,
Tatsunori Namai, Motoo Yumura, Sumio Iijima
Licensed content date Nov 19, 2004
Volume number 306
Issue number 5700
Type of Use Thesis / Dissertation
Requestor type Scientist/individual at a research institution
Format Print and electronic
Portion Figure
Number of figures/tables 1
Order reference number
Title of your thesis /
dissertation
Synthesis, Characterization and Functionalization
of Vertically Aligned Carbon Nanotube Arrays
Expected completion date Jan 2013
Estimated size(pages) 200
Total 0.00 USD

186
ELSEVIER LICENSE
TERMS AND CONDITIONS
This is a License Agreement between Gokce Dogu ("You") and Elsevier
("Elsevier") provided by Copyright Clearance Center ("CCC"). The license
consists of your order details, the terms and conditions provided by Elsevier,
and the payment terms and conditions.
All payments must be made in full to CCC. For payment instructions,
please see information listed at the bottom of this form.
Supplier
Elsevier Limited
The Boulevard,Langford Lane
Kidlington,Oxford,OX5 1GB,UK
Registered Company Number 1982084
Customer name Gokce Dogu
Customer address Bilkent University
Ankara , 06800
License number 3065391432974
License date Jan 10, 2013
Licensed content publisher Elsevier
Licensed content publication Materials Science and Engineering: R:
Reports
Licensed content title Diamond-like amorphous carbon
Licensed content author J. Robertson
Licensed content date 24 May 2002
Licensed content volume number 37
Licensed content issue number 4–6
Number of pages 153
Start Page 129
End Page 281
Type of Use reuse in a thesis/dissertation
Intended publisher of new work other
Portion figures/tables/illustrations
Number of figures/tables/illustrations 1
Format both print and electronic
Are you the author of this Elsevier
article? No
Will you be translating? No

187
Order reference number
Title of your thesis/dissertation
Synthesis, Characterization and
Functionalization of Vertically Aligned
Carbon Nanotube Arrays
Expected completion date Jan 2013
Estimated size (number of pages) 200
Elsevier VAT number GB 494 6272 12
Permissions price 0.00 USD
VAT/Local Sales Tax 0.0 USD / 0.0 GBP
Total 0.00 USD

188
THE AMERICAN ASSOCIATION FOR THE ADVANCEMENT OF
SCIENCE LICENSE
TERMS AND CONDITIONS
This is a License Agreement between Gokce Dogu ("You") and The American
Association for the Advancement of Science ("The American Association for
the Advancement of Science") provided by Copyright Clearance Center
("CCC"). The license consists of your order details, the terms and conditions
provided by The American Association for the Advancement of Science, and
the payment terms and conditions.
All payments must be made in full to CCC. For payment instructions,
please see information listed at the bottom of this form.
License Number 3065401303203
License date Jan 10, 2013
Licensed content
publisher
The American Association for the Advancement of
Science
Licensed content
publication Science
Licensed content title Large-Scale Synthesis of Aligned Carbon Nanotubes
Licensed content author W. Z. Li, S. S. Xie, L. X. Qian, B. H. Chang, B. S.
Zou, W. Y. Zhou, R. A. Zhao, G. Wang
Licensed content date Dec 6, 1996
Volume number 274
Issue number 5293
Type of Use Thesis / Dissertation
Requestor type Scientist/individual at a research institution
Format Print and electronic
Portion Figure
Number of
figures/tables 1
Order reference number
Title of your thesis /
dissertation
Synthesis, Characterization and Functionalization of
Vertically Aligned Carbon Nanotube Arrays
Expected completion
date Jan 2013
Estimated size(pages) 200
Total 0.0 USD

189
ELSEVIER LICENSE
TERMS AND CONDITIONS
This is a License Agreement between Gokce Dogu ("You") and Elsevier
("Elsevier") provided by Copyright Clearance Center ("CCC"). The license
consists of your order details, the terms and conditions provided by Elsevier,
and the payment terms and conditions.
All payments must be made in full to CCC. For payment instructions,
please see information listed at the bottom of this form.
Supplier
Elsevier Limited
The Boulevard,Langford Lane
Kidlington,Oxford,OX5 1GB,UK
Registered Company Number 1982084
Customer name Gokce Dogu
Customer address Bilkent University
Ankara , 06800
License number 3065400256610
License date Jan 10, 2013
Licensed content publisher Elsevier
Licensed content publication Current Applied Physics
Licensed content title
Effect of thin aluminum interlayer on
growth and microstructure of carbon
nanotubes
Licensed content author A. Mathur,S.S. Roy,C. Dickinson,J.A.
McLaughlin
Licensed content date March 2010
Licensed content volume number 10
Licensed content issue number 2
Number of pages 4
Start Page 407
End Page 410
Type of Use reuse in a thesis/dissertation
Portion figures/tables/illustrations
Number of
figures/tables/illustrations 1
Format both print and electronic
Are you the author of this
Elsevier article? No

190
Will you be translating? No
Order reference number
Title of your thesis/dissertation
Synthesis, Characterization and
Functionalization of Vertically Aligned
Carbon Nanotube Arrays
Expected completion date Jan 2013
Estimated size (number of pages) 200
Elsevier VAT number GB 494 6272 12
Permissions price 0.00 USD
VAT/Local Sales Tax 0.0 USD / 0.0 GBP
Total 0.00 USD

191
ELSEVIER LICENSE
TERMS AND CONDITIONS
This is a License Agreement between Gokce Dogu ("You") and Elsevier
("Elsevier") provided by Copyright Clearance Center ("CCC"). The license
consists of your order details, the terms and conditions provided by
Elsevier, and the payment terms and conditions.
All payments must be made in full to CCC. For payment instructions,
please see information listed at the bottom of this form.
Supplier
Elsevier Limited
The Boulevard,Langford Lane
Kidlington,Oxford,OX5 1GB,UK
Registered Company
Number 1982084
Customer name Gokce Dogu
Customer address Bilkent University
Ankara , 06800
License number 3065400582013
License date Jan 10, 2013
Licensed content publisher Elsevier
Licensed content publication Carbon
Licensed content title Strong influence of buffer layer type on
carbon nanotube characteristics
Licensed content author
Teresa de los Arcos,M Gunnar Garnier,Peter
Oelhafen,Daniel Mathys,Jin Won
Seo,Concepción Domingo,José Vicente
Garcı a-Ramos,Santiago Sánchez-Cortés
Licensed content date 2004
Licensed content volume
number 42
Licensed content issue
number 1
Number of pages 4
Start Page 187
End Page 190
Type of Use reuse in a thesis/dissertation

192
Intended publisher of new
work other
Portion figures/tables/illustrations
Number of
figures/tables/illustrations 1
Format both print and electronic
Are you the author of this
Elsevier article? No
Will you be translating? No
Order reference number
Title of your
thesis/dissertation
Synthesis, Characterization and
Functionalization of Vertically Aligned
Carbon Nanotube Arrays
Expected completion date Jan 2013
Estimated size (number of
pages) 200
Elsevier VAT number GB 494 6272 12
Permissions price 0.00 USD
VAT/Local Sales Tax 0.0 USD / 0.0 GBP
Total 0.00 USD