synthesis and characterization of nanocrystalline nickel
TRANSCRIPT

Synthesis and Characterization of Nanocrystalline Nickel-Zinc Spinel Ferrite Thin Films
Using the Spin-Spray Deposition Method
by
Nicole M. Ray
A Dissertation Presented in Partial Fulfillment of the Requirements for the Degree
Doctor of Philosophy
Approved April 2013 by the Graduate Supervisory Committee:
William Petuskey, Chair
Rodolfo Diaz Ralph Chamberlin
ARIZONA STATE UNIVERSITY
May 2013

i
ABSTRACT
The overall objective of this project is to optimize the development of magnetic
ferrite thin films targeted for enabling low-loss broadband communication devices,
miniaturized low-microwave inductors and electromagnetic noise suppressors. The focus
of this objective is to design and build a reactor and improve the spin-spray process. Each
film is then characterized and optimized to have a high permeability and high frequency
in the range of 500 MHz – 3 GHz. Films produced by the µ-droplet deposition regime
yields a higher Snoek's product than the continuous liquid layer regime. The highest
Snoek's product occurs when it is deposited at an oxidant pH of 8.28. The Ni-Zn-Co
ferrite magnetic domains were imaged using the Lorentz TEM in which multi-grain
domains are experimentally observed for the first time.

ii
ACKNOWLEDGMENTS
I would like to acknowledge my advisor, Professor William T. Petuskey, for all
his guidance and support through this research. I would also thank Prof. Rudy Diaz, Prof.
Ralph Chamberlin, Prof. Dave Smith, and Prof. Molly McCartney. Additional thanks to
my colleagues Dr. Sergio Clavijo, Dr. Heath Lorzel, Blake Rogers, Tom Sebastian,
Kaushik Venkata, and Desai Zhang for their time and commitment to this project. I
would also like to thank Northrop Grumman and ASU for their support through the years.
Finally, and most importantly I would like to thank my family for all their support and
encouragement.

iii
TABLE OF CONTENTS
CHAPTER Page
1 INTRODUCTION .................................................................................. 1
Applications ........................................................................................ 1
Research Objectives ............................................................................ 2
Classification of Ferrites ..................................................................... 3
Soft Ferrites ......................................................................................... 5
Literature Review .............................................................................. 12
Ferrite Processing Methods .............................................................. 23
2 EXPERIMENTAL METHODOLOGY .............................................. 26
Spin-disc Reactor .............................................................................. 26
Reaction Chemistry and Methodologies .......................................... 31
Electron Microscopy ......................................................................... 43
X-ray Diffraction ............................................................................... 47
Particle Induced X-ray Emission ...................................................... 48
Magnetic Properties .......................................................................... 50
3 SYSTEMATICS OF SPIN-SPRAY DEPOSITION ............................ 57
Crystallite Size Analysis ................................................................... 58
Systematic of Reactor ....................................................................... 64
Magnetic Results and Discussion ..................................................... 79
4 STRUCTURE AND MAGNETIC PROPERTIES .............................. 88
Experimental Procedure .................................................................... 89

iv
Results and Discussion ..................................................................... 90
5 LAMINATION OF THIN FILMS ..................................................... 110
Preparation ...................................................................................... 110
Lamination ...................................................................................... 113
Summary ......................................................................................... 117
6 CONLUSIONS AND FUTURE WORK ........................................... 118
Process Improvements .................................................................... 119
Experiments ..................................................................................... 121
REFERENCES ......................................................................................... 125
APPENDIX
A SDR SYSTEMATICS .......................................................................... 132

1
Chapter 1
INTRODUCTION
There a many challenges in thin film science. Conceivably one of the most
difficult is growing a dense and well adherent ceramic oxide film, normally produced at
high temperatures, onto a plastic substrate at low temperatures. With the continued down
scaling of device dimensions and increased demand for system-on-chip (SOC),
applications are driving significant improvement in performance with lower fabrication
cost. There is a lot of room to improve the performance for high frequency circuits from
the passive circuits, such as transmission lines and capacitors through reducing losses at
high frequency.
APPLICATIONS
The major objective of this research is to develop magnetic ferrite thin films for
applications relating to low-loss broadband communication devices, miniature low-
microwave inductors and electromagnetic noise suppressors. This project integrates
fundamental materials research with materials development targeted towards optimizing
synthesis for achieving desired properties of high permeability, low core losses, high
density films, and low temperature synthesis. Success of this project is measured by
demonstrating the nanostructural properties of spinel ferrites, such as nickel zinc cobalt
ferrite, (Ni2+, Zn2+, Co2+, Fe2+, 3+)3O4, or magnetite, (Fe2+, Fe3+)3O4, capable of enhancing
the sensitivity and versatility of RF antennas while providing the significant advantage of
synthesizing at low temperatures, thus enabling the use of polymer substrates [1, 2].
2
Global positioning systems (GPS), and synthetic aperture radar (SAR) require a
dual-band, or tri-band antenna which would benefit from avoiding the use of two
different antennas. Microstrip antennas (i.e. patch antennas) are of great interest for
wireless and mobile applications due to their physical characteristics [1]. Patch antennas
are light weight, low volume, a flexible design, low sensitivity to manufacturing
tolerances, and are easy to install [1].
RESEARCH OBJECTIVES
There are four main objectives in this research study, which control the focus of
this project. They are:
• How does the pH effect the texturing and composition of the thin films?
• Is there a correlation between texturing and electromagnetic properties?
• How does Snoek’s product change after annealing at high temperature?
• What happens to the magnetite microstructure and morphology after annealing?
The section on research methodology explains the process in which the research
objectives have been executed, thus far.
CLASSIFICATION OF FERRITES
Ferrites, specifically the spinel ferrite structure, belong to a unique crystal
structure, shown in Fig. 1. It is a structurally isotropic material belonging to the cubic
Bravais lattice with an fd3m space group [3]. This general formula is AB2O4, where (A)

3
and (B) are metal cations and oxygen as the anion. Magnetite and nickel zinc ferrites are
suitable candidates among many for high frequency applications such as transformer
cores and antenna applications.
Normal Spinel.
A normal spinel ferrite has eight divalent ions in the eight available tetrahedral
sites (A site) and the sixteen trivalent ions occupying the sixteen octahedral sites (B site)
[4]. The oxygen ions are in the face-centered cubic configuration. An example of a
normal spinel is magnesium aluminate, MgAl2O4, which is used for applications in
refractory, electromagnetic windows and transparent armor. The magnesium ions are
formally located on the tetrahedral sites, and the aluminum ions are located on the
octahedral sites. Fig. 1. shows the magnesium aluminate spinel in the normal spinel
crystal structure form. At high temperatures, however, there is significant mixing of
magnesium and aluminum between the two cation sites, which gives rise to
magnesium/aluminum stoichiometry. The composition of magnesium aluminate spinel is
known to range from MgO-rich to Al2O3-rich compositions.

4
Fig. 1. Normal spinel in [111] direction.
Inverse Spinel.
Nickel zinc ferrite is an inverse spinel, where iron has two different oxidation
states, Fe2+ and Fe3+, which occupy different lattice sites. The inverse spinel space group
consists of 56 atoms, in which 32 are oxygen anions in a close packed cubic structure,
and the remainder atoms are metal cations residing on eight of the 64 available
tetrahedral sites (A site) and 16 of the 32 available octahedral sites (B sites) [3]. Divalent
cations (Ni2+, Zn2+, and Co2+) occupy the octahedral sites, while half of the trivalent
cations (Fe3+) occupy the tetrahedral sites (A sites) and the rest occupy the octahedral
sites (B sites). The size and valence of the cation species determines the filling of these
sites which strongly influence the magnetic and electronic properties[3]. Due to cation
disordering of the spinel structure, the lattice parameter (ɑ) is slightly large, ɑ = 8.36Å,
which is discussed in later chapters.
O Mg (tetrahedral) Al (Octahedral)

5
Fig. 2. Inverse spinel ferrite crystal structure.
SOFT FERRITES
In recent studies, high frequency soft magnetic nanoferrites have received a great
deal of attention due to their low conductivity properties. For high frequency
applications, magnetic insulators are the material choice for their high permeability, low
coercivity, and high saturation magnetization. Soft ferrites first became commercially
available in 1945, the first introduced was magnetite. Although, its conductivity is
relatively high compared to ferrite compositions with fully oxidized iron (Fe3+). The
cubic or soft ferrites all have the same general chemical formula, MO – Fe2O3 where M is
a transition metal such as nickel, zinc, manganese, iron, or magnesium. [5]
Soft ferrites are further broken down into two categories according to their
frequency range. In the frequency ranges from audio up to 500 MHz, they are classified
as ‘non-microwave ferrites,’ and, for frequencies ranging from 100 MHz to 500 GHz,
they are classified as ‘microwave ferrites.’ In the case of spin-spray deposition at low

6
temperatures microwave ferrites are chosen for their frequency range and high
permeability properties. [5]
High Frequency.
For high frequency materials, the eddy currency effect is very important to the
overall properties [6]. As the frequency rises, the skin depth becomes thinner, in which
the alternating magnetic flux can penetrate [6]. In order to diminish these losses small
grain sizes are needed. From Snoek’s theory in 1948, Snoek suggested there is a
compromise between small grains with low losses at high frequencies; and for large
grains at low frequencies [6]. Thus, he proposed a limiting value law correlating with the
product of the frequency and permeability reaches a limiting value. A way of examining
the problem is to plot the complex permeability, µ’ and µ”, as a function of frequency.
From experimental analysis it has been found at lower frequencies the losses are greater
and the permeability is higher [4, 7]. To overcome these limitations, a material with a
preferred plane, rather than a preferred direction is developed, it is referred to as
Ferroxplana (spinel) ferrite which, for these materials, typically operates between 800
MHz and 1.6 GHz [6, 8].
Nickel Zinc Ferrite.
Nickel zinc ferrite is the often chosen due to its high permeability and high
frequency capabilities found in literature [9]. As pointed out by Jacob L. Snoek, an ideal
ferrite used for high frequency should not have too high of a permeability, have a high

7
saturation magnetization, contain no ferrous iron, and have a dense structure, which falls
within the parameters of nickel zinc ferrite [7]. In order to contain little to no ferrous iron
and have a dense structure, the material must form at a low temperature, around 70-
100°C [7]. The spin-spray deposition method is designed to meet the low temperature
requirements and still maintain uniform thin film deposition in a controlled atmosphere
[10].
Nickel zinc spinel ferrite has proven in journal articles to exceed Snoek’s limit [9,
11-13]. In 1948 J. L. Snoek first derived the limit for multiple bulk oxides to understand
how well the material performed. He developed an equation using the data collected from
his experiments on magnetite (Fe3O4) for bulk materials in which he described how well
this material performs, called Snoek’s product, and is described in Eqn. (6).
Magnetite samples were made by reducing pressed bars of hematite (Fe2O3) at
1300ºC in a nitrogen atmosphere [7]. There were two maxima unmistakably found for
initial permeability; one lies just below the Curie point, the second lies just above the
point where the magnetic anisotropy for magnetite changes its character [7]. However,
this profile only represents the initial permeability it does not show the frequency, see
Fig. 3 [7].
𝑆𝑛𝑜𝑒𝑘′𝑠 𝑃𝑟𝑜𝑑𝑢𝑐𝑡 (𝐺𝐻𝑧) = 𝑓(𝐻𝑧) ∗ (𝜇𝐷𝐶 − 1) (6)

8
Fig. 3. µ0 versus Temperature (ºC) for magnetite (Fe3O4), prepared by
the reduction of Fe2O3 in nitrogen at 1300 ºC [7].
This implies an inverse relationship between f and µDC assuming that Snoek's
product is constant for a class and composition of a ferrite material. In general for spinel
ferrites, when the peak of the loss curve is at a low frequency the higher the initial
permeability, µ0, will measure. High permeability ferrites could be used as cores for a
small frequency range. Figure 4 below shows a typical plot for the complex permeability
of bulk polycrystalline Ni-Zn ferrites [4]. Here, the initial real part, µ', and the imaginary
part of the complex permeabilities are a function of frequency for different compositions
of nickel and zinc. In general µ' at low frequencies tend to be very high. However, its
magnitude decreases for ferrites of greater resonance frequency, as indicated by the peak
in µ".

9
Fig. 4. Frequency dependence of the real and imaginary parts of initial permeability,
µ’and µ”respectively for polycrystalline ferrites [4].
In 1969, De Lau found that Ni-Zn-Co ferrite properties could be improved
significantly by reducing the grain sizes. That is the Snoek's product could be raised. It
greatly affected the frequency just below the ferromagnetic resonance frequency and it
further reduced domain wall motion [6]. Moreover, De Lau found that with the addition
of small amounts of Co2+ and Co3+ in iron deficient Ni-Zn ferrite decreases domain wall
motion in response to magnetization orientation process and related losses in high
frequency magnetic fields of diminutive amplitude [14]. The Co2+ ions will preferentially

10
occupy on the octahedral sites leading to domain wall stabilization. The distribution over
the octahedral sites affected the exchange of electrons between Co2+ and Co3+, and
changed the magnetic domain pattern, associated with reorganizing following the
reorganization of the Co2+ ions [14].
In Ni-Zn ferrites which do not contain cobalt, a reduction in grain size leads to a
decrease in the domain wall permeability and the corresponding losses. In Fig. 5, De Lau
shows that by reducing the grain size below 1 µm the high frequency properties of Ni-Zn
ferrites can be improved. Dense, polycrystalline samples were fabricated by hot pressing
technique.
Spin spray deposition techniques display the same characteristics with the
addition of Co2+ and Co3+ ions. The frequency ranges from 500 MHz to 1 GHz, and the
complex permeability, µ’, ranges from 20 – 60, as shown in Fig. 6. The vast difference
between De Lau Ni-Zn-Co ferrite bulk samples and the spin-spray deposition technique is
the grain size. De Lau’s grain sizes were on the order of 1 µm in using the hot pressed
samples, while the spin-spray deposition technique yield grains as small at 10 nm to 60
nm.

11
Fig. 5. High frequency properties of bulk Ni-Zn ferrite prepared by continuous hot
pressing [14].
Fig. 6. Permeability spectrum for Ni0.19Zn0.39Co0.05Fe2.38O4.

12
In 2002, Abe et al. was the first group to report depositing a Ni-Zn spinel ferrite
thin film with a high permeability and high frequency using a newly developed technique
called ferrite plating [15]. This technique exceeded Snoek’s limit for bulk materials,
which was 18.45 GHz when the resonant frequency is taken at the inflection point in µ',
shown in Fig. 7.
Fig. 7. First documented high permeability, high frequency Ni-Zn ferrite
exceeding Snoek’s limit [15].
LITERATURE REVIEW
In 1835, Justus Freiherr von Liebig first deposited a thin film of silver using
chemical solution deposition (CSD) in the presence of a reducing species, such as
formaldehyde. This famous reaction, in the electroless deposition community, is
considered to be one of the first examples of a chemical bath deposition. Since, there

13
have been nearly hundreds of materials deposited by CBD from chalcogenides, oxides
and other non-metallic compounds. Early nickel zinc ferrite depositions began using CSD
as early as 1983 and electroless deposition techniques discussed in later sections.
The work of Abe & Matsushita et al.
Masanori Abe and Nobuhiro Matsushita were the first research scientists to spin-
spray plate magnetite thin films at low temperatures [16]. Abe et al. first attempted
depositing Ni-Zn ferrites by electrodeposition method published in 1983, seen using the
apparatus Fig. 8 [10, 16]. Figure 8 illustrates the reaction vessel and apparatus used in
ferrite deposition. The ferrite-plating method promotes the growth and formation of
spinel ferrite films. The electroless method deposits films at high deposition rates, 2
µm/min, and only is capable of depositing on metal substrates. Therefore, Abe et al. re-
engineered the method using ultrasonic energy, and then later a process called spin-spray
deposition.
Later they developed a two reactant approach that was enhanced by ultrasonic
energy in Fig. 9. The substrate is immersed into an electrolyte solution of in this case
with a metal chlorides (Fe2+ and M2+), and hydrolyzing the substrate surface. The reaction
is accomplished by introducing a reducing agent which releases hydrogen from the
surface of the substrate, leaving a negative charge on the surface. Some of the adsorbed
FeOH+ ions are oxidized to FeOH2+ ions which cause ferrite formation. Equation 1 shows
the formation of spinel ferrite, or (M2+, Fe2+, Fe3+)3O4.

14
𝐱𝑭𝒆𝑶𝑯𝟐+ + 𝐲𝑭𝒆𝑶𝑯+ + 𝒛𝑴𝑶𝑯(𝒏−𝟏) + 𝑶𝑯−
→ (𝐹𝑒3+,𝐹𝑒2+,𝑀𝑛+)3𝑂4 + 4𝐻+ (1)
Where (𝑥 + 𝑦 + 𝑧 = 3)
Fig. 8. Electrodeposition method used for ferrite plating by Abe et al. [16, 17].

15
Fig. 9. Ultrasound-enhanced ferrite plating method [17].
Following the electroless plating method, Abe et al. proposed to use ultrasound in
order to encapsulate polyacrylate microspheres with ferrite thin film coatings. Figure 9
represents the Ultrasound-enhanced ferrite plating method first published in 1997 [18].
The microspheres, about 4.5 microns in diameter, were dispersed in the reactant solution
and exposed to the oxidizing solution, sodium nitrite, which was introduced via an
injection port [17]. Ultrasound waves were turned on (19.4 KHz, 600 W) [17, 18]. The
solution was kept at a low temperature, 70ºC and at a mildly acidic pH = 6.0 by adding
ammonium acetate [17]. The advantage of this method was the round bottom shape of the
vessel which prevented sedimentation of the particles around the corners of the flat
bottom, and thus producing uniform ferrite encapsulation of the particles [18]. The
second advantage was that by buffering the solution to pH = 6.0 the system was more

16
stable and allowed for finer grain growth [18]. The magnetic properties at this point were
not measured until the process was improved [17].
The third method was an improved spin-spray plating process onto a spinning
heated platen using alternating aqueous solutions, seen in Fig. 10 [11]. The Ni-Zn-Co
ferrite films were deposited onto glass and polyimide substrates by simultaneously
spraying the reactant and oxidizing solution onto the substrate from 70-100ºC [16, 19].
The solutions were sprayed at a rate of 40-80 mL/min on an 8" platen, while at a rate of
150 rpm [19]. The reactant solution consisted of iron chloride tetrahydrate (FeCl2∙4H2O),
nickel chloride hexahydrate (NiCl2∙6H2O), cobalt chloride hexahydrate (CoCl2∙6H2O)
and zinc chloride (ZnCl2). The oxidant is an aqueous solution containing glacial acetic
acid (CH3COOH), sodium nitrite (NaNO2), and ammonium hydroxide (NH4OH) for pH
balance. Abe and Matsushita exhibited exceptional properties for Ni-Zn ferrite and Ni-
Zn-Co ferrite films [17, 20]. The high complex permeability, µ, ranges from 20 to 120 at
a resonance frequency of 100 MHz to 3.3 GHz [2, 17, 20]. An example is seen in Fig 11,
which shows both the film microstructure and the complex permeability.

17
Fig. 10. Spin-spray plating method [11].
Fig. 11. Spinel thin film ferrite, Ni0.19Zn0.23Fe2.58O4, displaying a (a) columnar structure
and its (b) real and imaginary permeability [15].

18
The saturation magnetization for these ferrites ranges from 170 – 580 emu/cc and
the coercivity 30 – 200 Oe depending on the grain size and position (radial or
perpendicular) of the sample. The exceptional electrical and magnetic properties have
been attributed to columnar structure and crystalline morphology of the thin films.
Presently, Matsushita et al. are depositing zinc oxide (ZnO) rod arrays via the
spin spray plating process on non-seeded glass substrates [21]. ZnO is a wide band gap
semiconductor, which has attractive physical and chemical properties with respect to
optical absorption and emission, piezoelectricity, high electrical conductivity, and
catalytic activity [21]. The reason for using ZnO as a possible material for these
applications is the tunable properties such as morphology, size, surface area, and
crystalline orientation [21].
The Work of Lubitz et al.
In 1994, P.J. van der Zaag, P. Lubitz, and M. Abe began annealing experiments
on Mn-Zn ferrite and Ni-Zn ferrite samples. The material of most interest was Ni-Zn
spinel ferrite, because of their magnetic character and high resistivity for microwave
inductor or micromagnetic device applications [22, 23]. Until 1994, most reports in
literature on ferrite plating have involved structural quality of deposited films and the
magnetic parameters, such as saturation magnetization, Ms, and coercivity, Hc. However,
most applications require a high initial permeability, µi. Hence, Lubitz et al. began
studying techniques to increase the initial permeability.

19
Lubitz et al. conducted annealing experiments on specimens from the spin-spray
method developed by Abe et al. in 1993[24]. The films were 0.5 – 2 microns thick with
varied nickel and zinc compositions. The samples in the first set of experiments were
annealed to 500ºC for 30 minutes[23]. Figure 12 shows the effect annealing has on
dielectric loss at 9.5 GHz. The transition observed for the dielectric losses following the
annealing experiments is the specimens normalizing to their pre-annealed values, about
0.2, at a relatively low annealing temperature, 325ºC for 30 minutes [23]. This is effect is
associated primarily with annealing temperature [23].
Fig. 12. Annealing effect of a thin film ferrite, composition Ni0.34Zn0.18Fe2.48O4, on (a)
dielectric losses at 9.5 GHz [23].

20
Thus far, most reports in literature on ferrite films deal with the structural quality
and magnetic parameters of thin film ferrites[22]. In 1999, Lubitz et al. performed
experiments in order to increase the initial permeability. He first tested
Ni0.17Zn0.38Fe2.45O4 films using the spin-spray ferrite plating method at 80ºC on glass
substrates using the procedure outlined by Zhang et al. method [24]. Next, the thin film
samples were annealed to 500ºC for 30 minutes in air [22]. The initial permeabilities of
the as-deposited and the annealed specimens were measured, as shown in Fig. 13. It is
found that the initial permeability was strongly dependant on microstructure and
thickness [22]. The mean grain size was 0.25 ± 0.01 µm, since the grain size is relatively
small compared to the data of bulk Ni-Zn ferrite, the permeability is expected to be low.
However, the measured initial permeabilities were comparable to bulk Ni-Zn ferrite and
increased when annealed [22]. The high value in permeability has been attributed to the
low temperature deposition, limiting the adverse magnetostrictive effects between the
substrate and film [22]. Other reasons for the high permeability were the grain size and
microstructure. These are record high values for Ni-Zn ferrite films deposited on glass
substrates recorded in literature for initial permeability [22].

21
Fig. 13. Initial permeability measured for as-deposited (ᵒ) and annealed ()
Ni0.17Zn0.38Fe2.45O4 films [22].
Fig. 14. Columnar structure for Ni0.17Zn0.38Fe2.45O4 film that exhibited as-deposited µi =
28 ± 3 and annealed µi = 60 ± 5 [22].

22
The Work of Sun et al.
In 1999, Sun et al. wrote a popular publication on thermodynamic-based grain-
size limit of polycrystalline materials, specifically for bulk amorphous selenium [25]. He
extrapolated data points from an enthalpy equation, shown below in Eqn. (2), which
showed a linear relationship between the enthalpy of crystallization, ΔHcryst, and the
reciprocal of grain size, 1/d [25].
∆𝐻𝑐𝑟𝑦𝑠𝑡 = ∆𝐻𝑙−𝑐 + 2𝛾𝑔𝑉𝑚/𝑑 (2)
Where γ is the grain-boundary enthalpy, g is the geometry factor, Vm is the molar
volume, and d is the average grain size. The purposes of the derivations were to find the
lower limit of polycrystalline materials. The lower limit grain-size limit (GSL) for
polycrystalline selenium was established to be 4.0 nm [25].
In 2008, Sun et al. published a paper on spin-spray deposited multiferroic
composites with strong surface adhesion. These materials have two constituent phases of
ferro-ferrimagnetic and ferroelectric phases, and possible applications in multifunctional
devices. Typical ferroelectric materials, such as lead zirconate titanate (PZT), are good
suppliers of OH- groups on the surface, which assists in the ferrite film formation
through spin-spray deposition [26]. Ni0.23Fe2.77O4 (NFO) / Pb (Zr,Ti)O3 is a multiferroic
composite obtained by spin spray depositing NFO on a PZT substrate at 90º [26]. These
films displayed a strong interface adhesion and excellent wetting between NFO and PZT

23
as observed using high resolution transmission electron microscopy (HRTEM), seen in
Fig. 15. These films have also displayed strong magnetoelectric coupling (ME coupling).
Fig. 15. Cross-sectional image of NFO/PZT (a) HSTEM of Ni-Ferrite growing in PZT
crack (b) and HRTEM image ferrite and (C) PZT interface [26].
FERRITE PROCESSING METHODS
There are many different processing methods for spinel ferrites, that can be
categorized as conventional and non-conventional. Spin-spray plating is a non-
conventional processing type, this section will cover most non-conventional processing
methods. Other such methods are described below.

24
Coprecipitation.
Coprecipitation is simple in that a solute precipitates out of solution from a liquid
carrier that facilitates the containing and reaction of reactants, that bind together [6]. It is
not used in commercial applications, or on large scales heavily because of output
percentage [6]. The precipitates can take the form of hydroxides, oxalates, or carbonates
to later be thermally decomposed to the comparable oxide [6]. The advantages of use the
coprecipitation method is greater homogeneity, greater reactivity, high purity, fine,
particle size, and the calcining step is eliminated [6].
Sol-Gel Synthesis.
Sol-gel synthesis is a wet-chemical technique in which small colloidal particles
are suspended in a solution (sol), usually by hydrolysis [6, 27]. The sol acts as a precursor
for an integrated network (gel) of particles[6, 27]. Typical precursors are metal salts, such
as iron chloride tetrahydrate [6, 27]. After they link together they form a gel, or ceramic
particles, and further processing is needed to obtain the ceramic particles, such as
centrifuging or burning off the precursor [6].
Chemical Vapor Deposition.
Chemical vapor deposition, or CVD, is a chemical process in which the substrate
is exposed to volatile precursors that thermally react and decompose on the substrate
surface developing solid thin films [6, 28]. The advantages of using CVD is superior
conformality, high throughput, high deposition rate, and cleanliness (depositing only

25
films) [6, 28]. CVD processing is also a scalable process which is commonly used in
industry, however it is very expensive compared to other techniques [6, 28].

26
Chapter 2
EXPERIMENTAL METHODOLOGY
SPIN-DISC REACTOR
Spinel ferrite thin films are produced using aqueous solutions for a thin film
deposition method known as spin-spray plating, a.k.a. ferrite plating method as described
by Matsushita et al. [29]. This is a scalable, low temperature (70-100ºC) process capable
of adjusting the composition, rotation rate, flow rates, temperature, different types of
substrates, including polymers (i.e. polyether ether ketone, glass, polyimide film, and
single crystalline substrates). The spin-spray process consists of many steps shown in the
flow diagram on the next page.
The spin disc reactor (SDR) consists of a rotating platen which is contained in a
stainless steel chamber. The platen has low temperature heating capabilities up to 300ºC.
Inside the chamber there is a polytetrafluoroethylene (PTFE) seal protecting the cast iron
shaft, rotating the platen, from corroding. There are three outlets in the chamber; two are
for the waste from the reaction solutions and the other is to circulate nitrogen through the
chamber. The chamber cover is made from poly methyl methacrylate with holes drilled
through for the nebulizer inputs and nitrogen purge. Figure 16 represents a flow chart of
the spin-spray process, including characterization and post-processing.

27
Fig. 16. Flow chart for spin-spray process [30].
Two peristaltic pumps (Gilson Minipuls 3, Middleton, WI) control the flow rate
of the atomizing nebulizers from the large liquid reaction vessels. The nitrogen that
supplies the nebulizers is used as a purge into the containment chamber and fed through a
NOx scrubber to rid the nitrogen of contaminants. As seen in Figs. 17 and 18, SDR 3.0 is
automated using Signal Express from National Instruments. It records the platen rotation
rate, pH, average power output, temperature of platen, and temperature of the chamber
are recorded in real time during the experiment.

28
Fig. 17. SDR used for spin-spray deposition.

29
Fig. 18. Image of SDR 3.0 set-up with large containment vessels.
After the equipment is set-up, the platen is thoroughly cleaned with deionized
water and acetone. The substrate is positioned on the platen and cleaned with deionized
water and acetone, as well. Since this is a low temperature process many different
substrates can be used, such as polyimide film, glass, silicon wafers, thermoplastic film
and mica. All of these substrates have been used successfully; however glass (quartz) and
thermoplastic films are usually used in order to test the permeability and anneal samples.
Understanding the precise parameters for each experiment is crucial for
controlling film properties. Using the spin-spray deposition method the polymer
substrates are attached to the heated platen (70-100ºC) using polyimide tape. The platen
NOx Scrubber
Reaction Vessels
Waste
Temperature Controller
Peristaltic Pump
Nebulizers & Reactor

30
rotates between 90 - 300 rpm while the reactant and oxidant alternately spray the
substrate at a flow rate of 30 - 100 mL/min depending on the experimental conditions.
Introducing nitrogen into the system is important on many levels. The nitrogen prevents
the aqueous solutions from oxidizing, atomizes the liquid solutions, prevents the shaft
from corroding, and assists in forcing the liquids off the platen. The spinel ferrite layer
then builds up via either the sequential reaction theory or the µ-droplet collision theory
depending on how the reactor is set-up.
The reaction vessels are filled with two different solutions, a metal chloride and
an oxidizing solution. The precursor (metal chloride) solution consists of iron chloride
tetrahydrate, nickel chloride hexahydrate, zinc chloride, and cobalt chloride hexahydrate.
The oxidizing solution is a mixture of sodium nitrite (NaNO2), which acts as the oxidant,
glacial acetic acid (CH3COONH4) and ammonium hydroxide (NaOH), which buffers the
solution ranging from 7-11.
It is also very important to use nanopure deionized and deaired water (18.2 MΩ)
during the fabrication process, otherwise the ferrite oxidizes into hydrated iron (III)
oxide, because of the molecular O2 otherwise which is normally present when is exposed
to air. When the deposition is completed, distilled water is pumped through the entire
system, washing the vessel, tubing, nebulizers and thin films for at least 20 minutes. After
the films are washed and cooled down the top is taken off and the nitrogen is blown
carefully on the films to dry them off.

31
REACTION CHEMISTRY AND METHODOLOGIES
This section discusses the aqueous chemistry of the spin-spray deposition method
used by the sequential reaction approach operating under the microdroplet regime
parameters.
Solubility.
Figure 19 shows the solubility of nickel, zinc, and iron oxide in water at 25°C.
The plot below has been produced at room temperature using FactSage®, which is a
software program with a fully integrated database used for computing thermodynamic
calculations. The effective pH is 6.0 for each experiment but can range from 4.0 – 8.0.
For each of the curves, NaOH is used as a base to modify the pH; and for each of the
reactants metal chlorides are inputted into the calculations with the correct stoichiometry.
Note that the database used does not have data for Ni(OH)20 or for Zn(OH)2
0. Due to the
absence of Ni(OH)20 in the database the NiO curve begins to curve upwards above a pH
of 10.75 instead of leveling out [31]. In the ZnO curve, at an effective pH above 8.5,
Zn(NH)4 complexes can become present due to the aqueous chemistry in the oxidant, and
the solid phase deposition rate decreases [21]. For iron oxide the curve is constant
between pH's 5.6 and 7.0, and then steadily decreases, seen in Fig. 19.

32
Fig. 19. Solubility data created in FactSage® for (a) NiO, (b) ZnO, and (c) FeO at room
temperature. Shading marks the range of pH used in this study.
Since the spin-spray depositions are performed at 90°C the Ksp values were
calculated using FactSage®. The nickel and zinc oxide slopes are comparative to that in
literature. However, the iron oxide slope varies from the literature slightly, most likely
due to the precursor, iron chloride, see Fig. 20 [32].
HNiO2
Ni2+
ZnCl+
ZnOH+
FeCl+
FeOH+
FeO2-

33
Fig. 20. The effect of temperature on the solubility of (a) NiO, (b) ZnO, and (c) FeO.
Sequential Reaction Theory.
There are two different modes of deposition, namely, by a continuous liquid layer,
also known as the sequential reaction theory, and the microdroplet (µ-droplet) regime.
The sequential reaction theory is used by Abe and Matsushita et al. shown in Fig. 22 to
explain their results. It implies that the flow rate of reactants to is sufficiantly high
enough that a continuous liquid film forms on the spinning platen. Reactants diffuse
through the layer and deposit onto the ferrite at the solid surface. In Fig. 22 the spinning
spray platen has an oxidant and reactant nozzle directly above the substrate in close
90°C

34
proximity. Ferrite layers grow via the squential exposure of the chloride and oxidant
reactants. The liquid by products is then flung off due to continuous force.
Fig. 22. Abe and Matsushita et al. ferrite plating set-up for the continuous layering
method [33].
The surface of the substrate is terminated with OH- groups after exposure to the
oxidant, then iron (Fe2+) and metal chlorides (M2+ = Ni2+, Zn2+, and Co2+) are absorbed,
while releasing the H+ ions [34]. Exposure to the oxidizing agent again changes the
surface species to OH groups. This process is cyclically repeated, thus building up the
ferrite films layer-by-layer [34].
There are four basic processes that occur during the sequential reaction theory,
shown in Fig. 23. First, a continuous layer of metal ions, such as M2+ and Fe2+, coat the
substrate surface which adsorb onto the surface [17]. It is assumed that the substrate

35
surface contains OH- groups for the metals ions to adsorb onto. Second, the oxidant layer
is sprayed onto the surface, in a continuous layer, and the Fe2+ ions are oxidized to Fe3+
ions. Next, the metal ions are adsorbed onto the surface, forming the spinel ferrite layers,
and H+ ions are dissociated and released [17]. Finally, this process is repeated to form
multiple spinel ferrite layers. Using magnetite as an example, the oxidation-reduction
reaction of this process is shown in Eqn. (3) [17],
3𝐹𝑒2+ + 4𝐻2𝑂 → 𝐹𝑒3𝑂4 + 8𝐻+ + 2𝑒− (3)
Fig. 23. Principle theory of ferrite plating method using Fe2+→Fe3+ oxidation according
to Abe and Matsushita [35].

36
µ-droplet Regime.
A second method is the µ-droplet theory. It is based on the same concept as the
sequential reaction theory except instead of a continuous liquid layer, there are micron-
sized droplets that form four jet streams of droplets. After performing multiple literature
research, experiments and simulations, it has been concluded the µ-droplet regime uses
lower flow rates than the continuous flow regime and obtains higher growth rates. This is
caused by the oxidizers ability to get to the reaction surface faster, see schematic in Fig.
24.
Fig. 24. Schematic illustration of growth rate effects between the continuous fluid layer
regime and the µ-droplet regime [36].

37
In the µ-droplet theory the droplets reach the surface they react and spin off the
platen, Fig. 25 shows a simulation of the jet stream of droplets. The droplets are on the
order of 50 microns, as calculated using computational fluid dynamics (CFD) by Dr.
Heath Lorzel [37]. CFD utilizes numerical methods and algorithms to solve and analyze
problems that involve fluid flow, in this case the spin disc reactor (SDR). Figure 25
represents a simulation of the µ-droplet theory using the correct dimensions of the
reactor. The first image represents atomized liquid when the nebulizers are turned on at
55 psi. Fig. 26 and 27 shows a schematic of the reaction between the precursor and
oxidizer µ-droplets which form the spinel ferrite. When the reaction between the
precursor and oxidant occur the ferrite deposits on the substrate and the excess spins off
the platen and drains out into the waste.

38
Fig. 25. Simulations of the jet stream using (a) 4- inner nozzles (b) 4- outer nozzles, and
the best coverage of the platen using all (c) 8 nozzles [38].

39
Fig. 26. Computational Fluid Dynamics (CFD) simulations from FLUENT of the µ-
droplet regime with nebulizers turned on [37].
Fig. 27. Schematic of µ-droplet collision theory.
Platen
Substrate
Oxidant Precursor
40
Aqueous Chemistry.
For both methods the aqueous solutions are referred to as the reactant (or
precursor), containing metal chlorides, and the oxidant which supplies the oxygen atoms
to the chemical reaction. The reactant contains iron chloride tetrahydrate (FeCl2∙4H2O),
nickel chloride hexahydrate (NiCl2∙6H2O), and zinc chloride (ZnCl2) for Ni-Zn spinel
ferrites, with the addition of cobalt chloride tetrahydrate (CoCl2∙6H2O) for Ni-Zn-Co
spinel ferrites. There are two oxidants used in these experiments, the first is a simple
aqueous solution made up of glacial acetic acid (CH3COOH), sodium nitrite (NaNO2)
and aqueous ammonia hydroxide (NH4OH). The second is used to balance pH with
ammonium carbonate [(NH4)2CO3], sodium acetate (CH3COONa), sodium nitrite
(NaNO2), and sodium hydroxide (NaOH). The pH ranges from 7.5 to 9.5 with the optimal
pH above 7.5.
The pH is one of the most important parameters using this deposition method. It
determines the type, microstructure, particle size, and concentration of the spinel ferrite.
At higher pH’s (pH > 9.0) the microstructure is not columnar, while if the pH is lower the
structure is columnar, but more or less the spin-sprayed spinel morphology consists of
nanocrystalline substructure. If the pH is higher than 9.0 than the morphology changes
from uniform columnar network to a non-columnar morphology with micro-cracks and
pores, see Fig. 28 below. The Snoek's product is highest around an oxidant pH of 8.0
(pHEFF = 6.0) for the µ-droplet regime, and around a pH of 7.0 for the continuous liquid
layer regime, shaded in blue.

41
Fig. 28. The effect of oxidant pH on Snoek’s product (GHz), taking only the isotropic
data from Matsushita et al. [13], [34].
Sessile Droplet Experiment.
In order to obtain the best substrate for the spin-spray depositions, a sessile
droplet experiment was produced. A nebulizer was attached to a Zeiss Optical
microscope and placed at correct distance above the plane (about six inches). Various
substrates were placed perpendicular to the ocular lens, as they would be placed on the
platen. The substrates used in this experiment were glass, polyimide, polyether ether
Magnetically Amorphous

42
ketone (PEEK), and a thin film Ni-Zn-Co ferrite. The images and contact angles of the
micro-droplets are shown in Fig. 29.
Fig. 29. Sessile droplets on (a) glass (θ = 164.8°) (b) polyimide (θ = 124.9°) (c) PEEK (θ
= 160.1°) and (d) Ni0.19Zn0.30Co0.05Fe2.46 (θ = 95.6°)
According to the experiments, the glass and PEEK substrates had the best wetting
angles, which was also proved in the actual depositions. Finding the contact angle of the
substrates greatly improved the spin-spray deposition process. A more uniform, and less
flakey material was formed after changing the substrate from polyimide to PEEK (or
glass). After a full layer of ferrite deposits onto the substrate, the ferrite contact angle

43
dominates. As seen above in Fig. 29 when the droplets reach the spinel ferrite surface the
wetting angle decreases and less of the precursor reacts.
ELECTRON MICROSCOPY
Scanning Electron Microscopy.
To analyze the grain sizes, morphology and microstructures electron microscopy
was used, specifically a Hitachi S7800 Scanning Electron Microscope (SEM).
In a typical cold field emission electron gun SEM (FEG) the electron beam emits
electrons from an electric field, which emits electrons from an electron gun. A FEG-SEM
usually has a tungsten filament cathode, the SEM is illustrated in Fig. 30. The electron
beam, ranging from 0.2 keV – 40 keV, is focused by one to two condenser lenses and
passes through a pair of scanning coils in the electron column to deflect the beam in the x
and y axes in order to scan in raster mode. When the primary beam interacts with the
specimen, the electron immediately loses energy by randomly scattering and absorbing
within the interaction volume, extendeing from 100 nm to 5 microns depending on the
specimen density and atomic number. The energy exchange between the specimen and
electron beam results in elastic scattering and emission of electromagnetic radiation and
secondary electrons by inelastic scattering, both in which can be detected.

44
Fig. 30. SEM path diagram.
SEM measures the thicknesses and images the microstructure and morphology of
each ferrite deposition. The Hitachi S7800 measures the sample surface using a high
energy beam of electrons. This particular instrument uses a cold field emission electron
gun (FEG), and contains a five axis motorized specimen stage. The resolution of the SEM
is 5 nm, with an equipped Energy-dispersive X-ray Spectroscopy (EDS) detector for
basic elemental detection. Since EDS is not sensitive enough to analyze the
concentration of cobalt in the Ni-Zn-Co ferrite system, Particle Induced X-ray Emission
(PIXE) is used, which is 100 times more sensitive than EDS.

45
Transmission Electron Microscopy.
Transmission electron microscopy (TEM) analysis was performed using a Phillips
CM200 microscope by Desai Zhang and Lin Zhou. The instrument used is very versatile
which has an acceleration voltage of up to 200 kV, a point resolution of 0.19 nm, and a
0.14 nm line resolution. This particular instrument uses a Schottky Field Emission
source, which is made by coating a tungsten tip in zirconium oxide. The computer
controlled eucentric goniometer can tilt ±45º along the A-axis and ±30º along the B-axis,
making it ideal for diffraction research. Furthermore, it can also be used for imaging
magnetic materials at nanometer resolutions, and electron holography of electric and
magnetic fields.
Given a sufficient amount of current the source begins to emit electrons
thermionically into a vacuum, shown in the schematic in Fig. 31. Once extracted the
upper lens permitting for the formation of the electron probe to size and location for later
interaction with the sample. Two physical effects manipulate the electron beam. The first
is the interaction of electrons with a magnetic field, allowing electromagnetic to
manipulate the electron beam. The second is and electrostatic field, which can deflect the
electrons at a constant angle. The coupling of these two deflections is extremely
important in TEM especially STEM for beam shifting, it is essential for control over the
beam path. Optical configuration can also be rapidly changed by enabling and disabling
lenses, which allow for beam convergence. [39]

46
The sample preparation for TEM begins with cutting the sample and gluing it
onto a silicon wafer. Next the sample is polished on a polishing wheel, and then dimpled.
Finally the sample is ion milled until it is electron transparent and can be imaged on the
TEM.
See Chapter 3 for a more in depth analysis of TEM and Holography imaging.
Fig. 31. TEM electron path diagram.
47
X-RAY DIFFRACTION
X-ray Diffraction (XRD) was performed on the D5000 diffractometer. Powder
diffraction uses x-rays on powder, micro- or nanocrystalline samples for structural
characterization on materials. Ideally, each crystalline sample will be equally oriented.
The orientation average causes the three dimensional reciprocal space to be projected into
a single dimension. To eliminate texturing effects and achieve true randomness, it may be
necessary to rotate the sample.
When the scattered radiation is collected, the rotational averaging leads to smooth
diffraction rings around the beam axis [40]. The angle between the beam axis and the ring
is called the scattering angle (denoted as 2θ). According to Bragg’s law, Eqn. 7, each ring
corresponds to a particular reciprocal lattice [40].
𝑛𝜆 = 2𝑑 sin 𝜃 (7)
Though, Laue was credited with discovering diffraction, Bragg constructed the
equation which predicted when diffraction took place, it is a widely known equation in
crystallography [40]. Where λ, is the wavelength of radiation, 1.54Å for copper, d is the
inter-planar spacing and θ is the angle between the incident ray and relevant crystal plane.
Fig. 32, schematically represents an x-ray diffracting from part of a single crystal.

48
Fig. 32. Schematic of Bragg’s Law.
PARTICLE INDUCED X-RAY EMISSION
Particle induced x-ray emission (PIXE) is a non-destructive elemental analysis
technique for measuring material composition. Helium ions bombard the inner shell of
electrons, 1-3 MeV energy, and the outer shell electrons relax and emit characteristic x-
rays, seen in Fig. 33. The spectrum is deconvoluted with a software program called
Gupix. The analysis output can be seen in Fig. 34, for where typical compositions for
spinel ferrite thin films in this study are NixZny Co0.05Fe2.95-x-yO4, where x = 0.1-0.5 and y
= 0.2-0.3.

49
Fig. 33. Representation of particle induced x-ray emission (PIXE)
Fig. 34. Typical PIXE spectrum for Ni0.19Zn0.39Co0.05Fe2.38O4.

50
MAGNETIC PROPERTIES
AC Magnetic Properties.
For ferrimagnetic spinels and hexagonal ferrimagnetic oxides having the preferred
direction of magnetization on the z-axis, where 𝐻𝜑𝐴 = 𝐻𝜃𝐴 = 𝐻𝐴 [4]. The rotational
permeability is then isotropic, and reduces to Eqn. (8) [4].
(𝜇0−1)4𝜋
= 23 𝑀𝑠𝐻𝐴 (8)
Where HA is the field, Ms is the magnetization saturation, and µ0 is the initial
permeability. The initial permeability can be calculated for rotations according to Eqn.
(8) using the crystal anisotropy and magnetic saturation data [4]. Some of the more
obvious properties that effect this measurement are size and distribution of pores as well
as average crystallite size [4]. Smit and Wijn have shown with Ni0.5Zn0.5Fe2O4 there is an
substantial increase in permeability with an increase in density of material, which was
done through sintering, see Fig. 35 [4].

51
Fig. 35. The effect of porosity on initial permeability for Ni0.5Zn0.5Fe2O4 and Ni Fe2O4
spinel ferrites.
The AC permeability is measured by Dr. Sergio Clavijo and Tom Sebastian using
a Microstrip permeameter. Assessing the permeability of the ferrite accurately is essential
to finding to the quality of the material. The permeameter used by our group has been
designed and modified to fit the spin-spray deposited film. The idea behind the
Microstrip permeameter is to place a layer of the permeable material against the
shortened end of the strip, which is shown in Fig. 36.

52
Fig. 36. Microstrip Permeameter designed to fit thin film ferrite samples.
The geometry of field structure in the microstrip permeameter is shown below in
Fig. 37. There are many advantages of choosing the microstrip transmission line, which
are as follows:
(1) The electric field has minimal interaction with the ferrite sample and the magnetic
field is approximately constant due to the geometry.
(2) There is no electromagnetic limit for the low frequency measurement.
(3) The high frequency measurement is only limited by the onset of radiation from
design.
Sample
Microstrip

53
Fig. 37. Geometry of the field structure in microstrip permeameter.
The largest problem with any permeability measurement device is its sensitivity
to film thickness. Typically the films are around 1 µm thick and the spacing between the
microstrip and ground is 1 mm, so the anticipated µeff is in the 1.0X range. Assuming the
length of the microstrip is electrically small, t1, and the permittivity has been separately
determined, where the input impedance immediately yields the effective permeability of
the region where the material under test Zin, in Eqn. (9) and Eqn. (10) [41].
𝑍𝑖𝑛 = 𝜇𝑒𝑓𝑓𝜀𝑟
𝜂0 tan𝜇𝑒𝑓𝑓𝜀𝑟𝑘0𝑡1 (9)
Where k0 is the free space wave number, and η0 is the characteristic impedance of the
transmission line [41].
𝑍𝑖𝑛𝑡1 𝑠𝑚𝑎𝑙𝑙⎯⎯⎯⎯ 𝑗𝜔𝜇0𝜇𝑒𝑓𝑓𝑡1 = 𝑗𝜔𝐿𝑃 (10)
Where Lp is the permeance (µ*t, units Henry) of the region, 𝐿𝑃 = 𝜇0𝜇𝑒𝑓𝑓𝑡1.

54
The next step is to extract the permeability relating µeff and µfilm using the
morphology function [42]. In this specific permeameter the morphology function has
been derived from a four pole sum of Debye functions, seen in Eqn. (11) [41]. The
morphology function links the sample geometry to the permeability in the actual test [41].
𝜇𝑒𝑓𝑓 = 1 + 𝛼01+𝑗𝑣
𝛽0
+ 𝛼11+𝑗𝑣
𝛽1
+ 𝛼21+𝑗𝑣
𝛽2
− 𝑗𝛼3𝑣
(11)
Where α and β are constants, and v is used to determine µfilm.
Eqn. (11) can now be inverted to a fourth order polynomial which can determine v,
shown in Eqn. (12) [41]. The permeability can now be extracted from this equation.
𝑣 = 𝑗𝜇𝑓𝑖𝑙𝑚−1
= 𝑗𝜒𝑓𝑖𝑙𝑚
(12)
DC Magnetic Properties.
Large magnetic permeabilities and low losses are important features in
determining the usefulness of spinel ferrite thin films. Magnetostatic and low frequency
behaviors are characterized by a magnetometer (MPMS® SQUID VSM, Quantum
Design, San Diego, CA), which uses a direct current to measure the magnetic hysteresis
loop for any given material. The magnetometer used in these experiments is a vibrating
sample magnetometer with a superconducting quantum interface device. The initial
permeability, saturation magnetization, remanent magnetization, and coercive field can
all be obtained from the hysteresis loops. An example of thin film magnetite (Fe3O4,
purple curve) and thin film Ni-Zn ferrite (NixZnyFe3-x-yO4, red curve) is shown in Fig. 38.

55
For the NixZnyFe3-x-yO4 curve, a comparably large permeability, remanent magnetization
(129 emu/cc), and saturation magnetization (187 emu/cc), with a small coercive field (28
Oe) and energy loss per cycle is seen.
Fig. 38. Hysteresis loops for magnetite (purple) and Ni-Zn ferrite (red) at 300K.
When the field is increased indefinitely until reaching saturation, designated Ms, the
magnetic dipoles within the material are aligned in the direction of the magnetic field, H
(Oe) [5]. The saturation magnetization is only dependent on only the magnetic moments,
m, and number of atoms per unit volume, n [5].

56
𝑀𝑠 = 𝑛𝒎 (13)
From Eqn. (13) it is noted the magnetization saturation is only dependent on the materials
present in the sample, and hence not structure sensitive [5].
When the applied field is reduced to zero after magnetizing the magnetic sample
the remaining magnetic induction is called the remanent induction, BR, and the remaining
magnetization is called the remanent magnetization, MR, Eqn. (14) [5]. The remanent
magnetization is an independent parameter and is most important in permanent magnet
applications, since permanent magnets are used in an open circuit configuration [5].
𝐵𝑅 = µ0𝑀𝑅 (14)

57
Chapter 3
SYSTEMATICS OF SPIN-SPRAY DEPOSITION
The purpose of this chapter is to report on best experimental designs and the
parametric trends observed. Multiple trends were found that assist in explaining the
magnetic and electrical properties of the Ni-Zn-Co ferrite thin films deposited.
For bulk spinel ferrites prepared by traditional ceramic processing methods, the
raw materials are typically prepared by weighing and blending the constituent oxides as
powders, calcining from 900 – 1100°C and then ball milling the calcined material
afterward. In order to control the particle packing in conventional ferrites, slurry is made
with a binder and then sprayed into pressable powders for use in a die press. The final
step is sintering at high temperatures, in order to burn of the binder and residuals [6].
One of the largest considerations for industry is the cost, quality, and reproducibility of
the product [6]. During conventional processing, iron oxide is one of the largest cost
concerns, especially if it is needed in the purest form. There are four main sources;
natural iron ore, hydrochloric acid regeneration, decomposition from copperas, and the
most expensive oxidation of carbonyl iron [6].
Since conventional ferrites have been extensively researched, and scaled up to the
industrial level, non-conventional ferrite techniques have recently been a focus point. In
this chapter the spin-spray process is analyzed specifically for data trends. The data trend
analysis will eventually assist in the expansion of the reactor to an industrial scale.

58
CRYSTALLITE SIZE ANALYSIS
X-Ray Diffraction (XRD) in this research is mainly used for phase identification
and grain size analysis. Both powders and thin films were use on the D5000 for analysis.
Grain are not always orientated randomly, in the case of textured films the x-ray
intensifies a preferred film plane, (hhh). After rigorous analysis of Ni0.24Fe2.76O4,
ZnFe2O4, and (Ni, Zn) xFe3-xO4, the thin film spinel ferrite deposited using spin-spray
deposition methods was found to have preferred orientation around the high density
packed basal plane, i.e. (hhh), and the (0hh) plane. In the case of Zn0.57Fe2.43O4, in Fig.
39, the preferred orientation is in the (222) direction. Figure 40 shows the preferred
orientation of Ni0.24Fe2.76O4 in the (022) direction. For Ni-Zn-Co spinel ferrites, Fig. 41
shows the slight preferred orientation of a typical Ni0.18Zn0.23Co0.05Fe2.54O4 film about the
(022) direction.

59
Fig. 39. Zn0.57Fe2.43O4 diffraction pattern showing preferential orientation about the basal
plane.
Fig. 40. Ni0.24Fe2.76O4 diffraction pattern showing preferential orientation about the basal
plane.

60
Fig. 41. Ni0.18Zn0.23Co0.05Fe2.54O4 diffraction pattern showing preferential orientation
about the basal plane.
The grain sizes for Ni-Zn-Co and Mn-Zn ferrite films were analyzed using the
same D5000 diffractometer. The diffraction patterns from the D5000 were analyzed for
the crystallite size using MDI Jade Software and the Scherrer equation was used to
confirm the results, see Eqn. (15) below.
𝑡 = 0.9(𝜆)𝐵𝑐𝑜𝑠(𝜃) (15)
where B is the line broadening at half the maximum intensity in radians, θ is the Bragg
angle, λ is the wavelength of the radiation peak to peak, for copper 1.5406 nm, and t is
the thickness of grains in units of nanometers (nm).
When the diffraction patterns were analyzed the background was subtracted and
striped of the Kα2 peak using MDI Jade 9.0 software. Next the data was configured to a

61
text file and uploaded into Microsoft Excel and where the Scherrer equation was applied.
The values calculated ranged from 55.27 nm ± 11.28 nm. The diffraction pattern along
with the sample’s grain size was calculated using Eqn. (15) are shown below in Figs. 42 -
43 for two different samples.
Fig. 42. Mn0.03Zn0.68Fe2.29O4 unannealed with crystallite size (ie. XS) of 42.06 nm
calculated from fit centered at 35.26º 2θ.

62
Fig. 43. Mn0.01Zn0.35Fe2.64O4 unannealed with crystallite size of 73.24 nm calculated from
fit at 36.97º 2θ.
Scherrer calculations estimate the average grain size assuming a random grain
orientation across the sample. It also does not account for the integral breadth, the
skewness, or background of the peak [43]. However, as seen in Fig. 39-41 there is a slight
preferential orientation in these thin film samples. The Jade software program fits a peak
profile using a shape functions such as the Pearson VII or Pseudo-Voigt function. Table I
shows the crystallite size calculated for unannealed Mn0.01Zn0.35Fe2.64O4 using the
Scherrer equation and the Pearson VII function which is used to control the skewness.
The Pearson VII was popular during the 1980s-1990s for describing the peak shape from
conventional powder diffraction pattern [43]. The Pearson VII function is basically a
Lorentzian function raised to the m power, seen in Eqn. (16) [43].

63
𝐼(2𝜃) = 𝐼𝑚𝑎𝑥𝑤2𝑚
𝑤2+21/𝑚−1(2𝜃−2𝜃0)2𝑚 (16)
Where m represents the peak shape, Imax is the peak intensity, 2θ0 is the 2θ position of the
peak maximum, and w is the peak width. When m→1 the function becomes a Lorentzian
function, and approaches a Guassian function when m→∞, or when m ˃10 [43].
Table I. Unannealed Mn0.01Zn0.35Fe2.64O4 crystallite size calculated using MDI Jade 9
and the Pearson VII equation [43].
Pearson VII Equation for Mn0.01Zn0.35Fe2.64O4 2θ d (Å) Height Area FWHM XS (nm)
35.597 2.52 172 5975 0.531 17 37.237 2.4127 479 16130 0.476 19 39.46 2.2817 177 2320 0.192 67 40.993 2.1999 104 2843 0.403 24
Table II shows very similar crystallite sizes using the Pseudo-Voigt equation
which uses a line profile resulting from the convolution of two broadening mechanisms.
The major difference is the Pearson VII function allows for a continuous variation of the
shape parameter from pure Lorentzian to pure Gaussian [43]. The Pseudo-Vogt function
applies a variable proportion of pure Lorentzian to pure Gaussian by parameter η, seen in
Eqn. (17) [43].
𝐼(2𝜃) = 𝐼ℎ𝑘𝑙[𝜂𝑳(2𝜃 − 2𝜃0) + (1 − 𝜂)𝑮(2𝜃 − 2𝜃0)] (17)
Where Ihkl is the intensity of the peak, L(2θ - 2θ0) and G(2θ - 2θ0) are normalized
Lorentzian and Gaussian functions respectively, and η is the Lorentzian fraction [43].

64
The combination function can be tailored to a specific peak shape, when η parameter
varies from 0 being pure Lorentzian to 1, pure Gaussian [43].
Table II. Unannealed Mn0.01Zn0.35Fe2.64O4 crystallite size calculated using MDI Jade 9
and the Psuedo-Voigt function [43].
Pseudo-Voigt Equation for Mn0.01Zn0.35Fe2.64O4 2θ d (Å) Height Area FWHM XS (nm)
29.886 3.575 152 2972 0.237 46 29.031 3.0733 601 15807 0.386 24 30.401 2.9379 159 3710 0.359 27 35.751 2.5095 546 16997 0.444 21
SYSTEMATICS OF REACTOR
Deposition Trends.
After collecting the electrical and magnetic data from several different
experiments using the spin-spray deposition method, results were analyzed to uncover
systematic data trends. The first step in this analysis is to list the input and output
parameters of the spin spray process, shown in Table III. The input parameters for each
of the experiments were held constant except time and pHEFF. The output parameters then
are analyzed against the input parameters and eachother to find trends in the data.

65
Table III. The input parameters for the spin spray process and measured output
parameters.
Input Parameters Output Parameters Reactants Thickness Oxidants Grain Size
pH RDep RPM Quality TSet µ'
Nebulizer Flow Rate Frequency Nebulizer Configuration Snoek's Product
VSolutions MS N2 Pressure MR
Time HC Substrate Cation Fractions
There is a distinct trend in the data of an increase in iron in the film with
decreasing nickel and zinc as the deposition rate increases. This suggests that iron
deposits and reacts more rapidly than nickel and zinc. Fig. 44-46 shows the deposition
rates (nm/min) against the cation fraction in the film of each constituent. In Matsushita et
al. it is reported to increase the deposition rate and still maintain the desired properties
the oxidant is replaced with potassium acetate (KOCOCH3) and potassium hydroxide
(KOH), instead of using ammonium acetate (NH4COCH3), and ammonia (NH4OH) [13].
Due to the buffer change in these experiments the composition of the films changed, and
hence the magnetic properties [13]. The Snoek’s product in these samples still exceeds
the bulk, which makes KOCOCH3 a viable solution for increasing the deposition rate,
shown in Fig. 47.

66
Fig. 44. An increase in deposition rate generally yields a higher cation fraction of iron in
the film.

67
Fig. 45. An increase in deposition rate yields a decrease in cation fraction of zinc in the
film.

68
Fig. 46. An increase in deposition rate yields a step change decrease in cation fraction of
nickel in the film after a deposition rate of 14.0 nm/min.
69
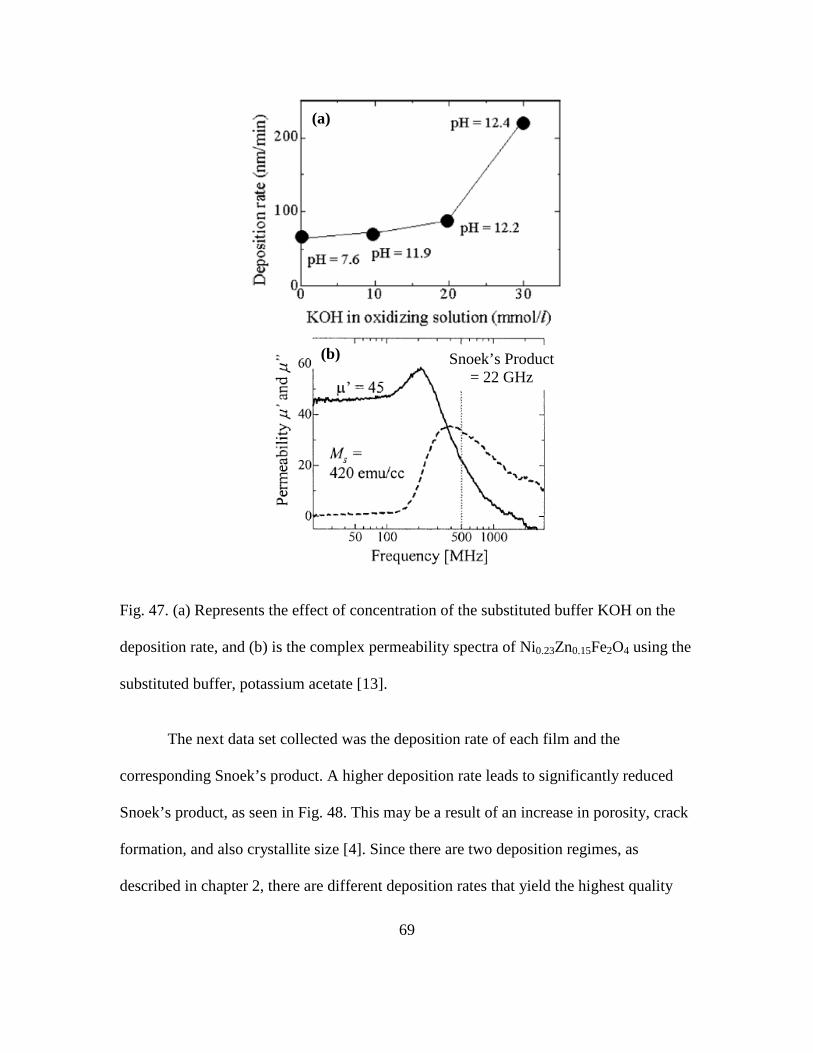
Fig. 47. (a) Represents the effect of concentration of the substituted buffer KOH on the
deposition rate, and (b) is the complex permeability spectra of Ni0.23Zn0.15Fe2O4 using the
substituted buffer, potassium acetate [13].
The next data set collected was the deposition rate of each film and the
corresponding Snoek’s product. A higher deposition rate leads to significantly reduced
Snoek’s product, as seen in Fig. 48. This may be a result of an increase in porosity, crack
formation, and also crystallite size [4]. Since there are two deposition regimes, as
described in chapter 2, there are different deposition rates that yield the highest quality
(b)
(a)
Snoek’s Product = 22 GHz

70
film. The µ-droplet regime performs the best at deposition rates below 30 nm/min. Abe et
al. was able to deposit high quality films in the continuous liquid layer regime up to 73
nm/min by changing their oxidizing solution [13]. The reason for changing the oxidant
was to avoid using ammonium complexes (NH4) and increase the growth rate of the
ferrite films [13]. To obtain a high deposition rate Abe et al. buffered their oxidizing
solution with potassium acetate (KOCOH3) and potassium hydroxide (KOH) as the pH
buffer and adjuster, respectively [13]. Although, the pH buffer was changed the
microstructure and Snoek’s product remained the same [13].
Since the pH and deposition rate depend on eachother, the pH of the oxidant and
the pH of the metal chlorides are closely examined for trends. There was a definite effect
of oxidant pH on the Snoek’s product, plotted in Fig. 49. The highest Snoek's product,
34.5 GHz, occurred at a pH of 8.277; the film was high quality, with uniform coverage
and a concentration of Ni0.19Zn0.39Co0.05Fe2.38O4. After plotting Snoek’s product against
the reactant pH no useful trend could be found, see Fig. 50.

71
Fig. 48. Snoek’s product as a function of deposition rate in the µ-droplet regime.
Nanocrystalline substructure

72
Fig. 49. Effect of Snoek's product over an increase in oxidant pH, with the highest value
around 8.28 (Ni0.19Zn0.39Co0.05Fe2.38O4) plotted for limited pH ranges.

73
Fig. 50. The effect of oxidant and metal chloride pH on the Snoek’s Product.
Comparing the results of films grown in the µ-droplet regime to those grown in
the continuous liquid layer regime, as studied by Abe et al., a completely different trend
line was observed [11, 13]. However, both regimes suggest that film morphologies
change dramatically for oxidant pH of greater than 9.0 the film morphology changing
from nanocrystalline columnar substructure to non-columnar. Coincidently, the Snoek’s
product significantly decreases, as well [11, 13]. Both trends have been plotted in Fig. 51,
where the shaded region represents the columnar region for both the µ-droplet regime and
the continuous liquid layer regime [11, 13]. Note the data used from Abe et al. came only
from isotropic films to keep the data consistent.

74
Fig.51. Snoek’s product as a function of oxidant pH for the µ-droplet Collision Theory
and the Sequential Reaction Theory [11, 13].
Macroscopic magnetic properties of materials are a consequence of magnetic
moments associated with individual electrons [44]. Each electron has a magnetic moment
associated with orbital and spinning motion [44]. The most fundamental magnetic
moment is the Bohr magneton, µB, with a magnitude of 9.27E-24 A-m2 [44]. For each
electron in an atom, the spin magnetic moment is ± m1µB, where m1 is the magnetic
quantum number of the electron [44]. The Bohr magneton of a spinel ferrite can give a
good estimate of the spin contribution, which relates to the permeability, because that is
Magnetically Amorphous

75
what is effectively being measure [45]. The spin of an electron is a universal property in
all materials, states, and temperatures [45]. If the atom has a completely filled electron
shell or subshells there is a total cancellation of both orbital and spin moments [44]. For
an example, magnetite is an inverse spinel with a calculated Bohr magneton of 4 µB.
Compared to the normal spinel zinc ferrite, with a Bohr magneton of 0 µB, magnetite is
much more permeable. In the case of zinc ferrite, shown in Table IV below, the zinc
cations force the iron cations onto the octahedral sites which cancel out the magnetic
moment.
The permeability of the various ferrites has been measured using the microstrip
permeameter. According to the calculated Bohr magneton the Ni-Zn-Co ferrite, it should
have a higher magnetic moment than the simpler ferrite (Fe3O4, NiFe2O4, ZnFe2O4),
which has been proven in Fig. 52. Figure 52 compares a Ni-Zn ferrite, composition
Ni0.21Zn0.29Fe2.50O4, and a Ni-Zn-Co ferrite, with the composition
Ni0.19Zn0.39Co0.05Fe2.38O4. The addition of 2% cobalt increases the frequency while
maintaining a high permeability consequently the Snoek’s product from 17.70 GHz to
34.95 GHz.

76
Table IV. Calculated magnetic moments of common spinels [3].
Material Spinel Type Tetrahedral Sites Octahedral Sites µB calc
Fe3+ ↓5 µB Fe2+ ↑4 µB
Fe3+ ↑5 µB
Fe3+ ↓5 µB Ni2+ ↑2 µB
Fe3+ ↑5 µB
Zn2+ ↑0 µB Fe3+ ↑5 µB
Fe3+ ↓5µB
Zn2+ ↓0 µB*(0.5) Ni2+ ↑2 µB*(0.5)
Fe2+ ↓4 µB*(0.5) Fe2+ ↑4 µB*(0.5)
Fe3+ ↑5 µB
Zn2+ ↓0 µB*(0.29) Ni2+ ↑2 µB*(0.21)
Fe3+ ↓5 µB*(0.5) Fe2+ ↑4 µB
Fe3+ ↑5 µB
Zn2+ ↓0 µB*(0.39) Ni2+ ↑2 µB*(0.19)
Fe3+ ↓5 µB*(0.38) Co2+ ↑3 µB*(0.05)
Fe2+ ↑4 µB
Fe3+ ↑5 µB
Mixed
Inverse
Ni0.21Zn0.29Fe2.5O4
Ni0.19Zn0.39Co0.05Fe2.38O4
2 µB
0 µB
6 µB
6.92 µB
7.38 µB
NiFe2O4
ZnFe2O4
Ni0.5Zn0.5Fe2O4
Mixed
4 µBFe3O4
Inverse
Normal
Mixed

77
Fig. 52. Complex permeability spectra of (a) Ni0.19Zn0.39Co0.05Fe2.38O4 in blue, and (b)
Ni0.21Zn0.29Fe2.50O4 in black.
In Fig. 53, Abe and Matsushita et al. demonstrate ferrite films deviated from
Snoek’s product, as well, however not because of the same phenomenon. The Ni-Zn-Co
spinel ferrites in Matsushita’s research show a 2D spin dynamic phase shown with arrows
in Fig. 53 [29]. The 2D spin dynamic phase is a heuristic theory and can be seen in other
ferrite nanoparticles. It is suggested by Abe et al. that by adding 2% cobalt into the spin-
spray process it creates in-plane anisotropy, which enhances the properties of the films
[9]. Due to this phenomenon a so-called "2D spin dynamic" phase is created [9]. This
phase is only seen when applying an external magnetic field, that aligns the domains in
one direction, thus making the film directionally dependent.
(a) (b)

78
Fig. 53. 2D spin dynamic phase measure by Abe and Matsushita et al. [29].
Bulk Ni-Zn ferrites have very high permeabilities and low resonance frequencies.
The Snoek’s product ranges from 1.44 GHz to 3.95 GHz which are quite low compared
to the thin film ferrites deposited using the spin-spray deposition method, which range
from 2.03 GHz to 34.95 GHz depending on the deposition rate. In this particular
research, Snoek’s law is exceeded, most likely due to having multi-grain domains
(MGD), which will be discussed later in chapter 4. The data from our experiments have
been collected and combined to develop a ternary composition map of Snoek's product as
a function of cation composition of the nickel, zinc, and iron cation fractions with an
added fourth dimension in Fig. 54. Figure 54 was developed using MatLab®, which used
a meshgrid to plot the surface contour of the measured Snoek’s product. The meshgrid
2D Spin Dynamic

79
produced a three-dimensional coordinate array creating the contour. Each composition
has a fixed 2% cobalt amount. Within this space, the composition exhibiting the greatest
Snoek's product was Ni0.19Zn0.39Co0.05Fe2.38O4.
Fig 54. Typical Snoek’s product values for Ni-Zn-Co ferrite are on average 17.34 GHz,
where Co is added at a constant concentration of 2% [46].
MAGNETIC RESULTS AND DISCUSSION
The purpose for adding cobalt originally was to increase the frequency. The
results shown in Fig. 55, that plots magnetism versus applied magnetic field, shown that

80
the magnetic saturation, MS, and remnant, MR, field has increased seen in Fig. 55. For the
composition Ni0.24Zn0.61Co0.02Fe2.13 the magnetic saturation is 556 emu/cc (0.70 T), the
remnant magnetization is 332 emu/cc (0.41 T) and the coercive field is 91.3 Oe. This
hysteresis loop suggests it is a soft magnet given the shape of the loop and narrowness of
the loop. Note in figure, two hysteresis loops were taken.
Fig. 55. Hysteresis loop for Ni0.24Zn0.61Co0.02Fe2.13.
Coercivity is used to distinguish between hard and soft magnets. It is a structure
sensitive magnetic property, and can easily be affected by heat treatment or deformation.
The coercivity of a soft magnet typically ranges from 12-125 Oe (954.9 A/m to 9947.2
MS = 556 emu/cc MR = 322 emu/cc HC = 91.3 Oe

81
A/m), whereas it is typically hard magnet is greater than 125 Oe for a hard magnet [6].
Additionally, magnetic inclusions, such as second-phase particles, with different
magnetic properties from those in the matrix material cause changes in the hysteresis
properties which in turn change the shape of the loop [47]. Second-phase particles
introduce pinning sites that impede domain wall motion which increase coercivity and
hysteresis loss [48]. The particle diameter also influences the coercive field in the
magnetic hysteresis loop as seen in extensive length by Herzer et al. [5, 49, 50]. When
the grain sizes are larger than the critical exchange length, Lex (≅ 40 nm), the coercivity
decreases as the grains divide into multidomain grains (MD) [5].
A typical diagram plotting the coercivity as a function of a grain size is shown in
Fig. 56 for materials. Herzer et al. was one of the first to publish results for soft magnetic
materials in 1990 [49]. Shown in Fig. 56 there is an increase in Hc with grain size in the
single-domain (SD) region, D6, for grains up to 40 nm in diameter [45, 49]. For grains in
the region labeled 1/D, they reside in the multidomain (MD) region, more than one
domain per grain [45, 49].

82
Fig. 56. Coercivity as a function of grain size for various soft magnetic material [49].
Since all materials behave differently, spinel ferrites from literature were plotted
the same way in order to see where the spin-spray deposited thin films would fall on the
graph, this is shown in Fig. 57. The trend formulated is very similar to what Herzer et al.
established in 1990, however, the data collected from ASU’s deposited films from the
spin-spray process does not quite fit on the graph. This is most like caused by the
magnetic domains. For the Ni-Zn-Co ferrites the spin-spray deposition method creates
multi-grain domains (MGD), which essentially means there is more than one grain per
magnetic domain region; this will be discussed at length in chapter 4. There are many
different domain theories, including but not limited to the Stoner-Wohlfarth Model, the

83
Kittel Theory, the Phenomenological Theory, and the Random Anisotropy Model [45,
51-54].
Fig. 57. Coercivity as a function of grain size for various spinel ferrites reported in the
literature and compared to the ASU samples [54-56].
Stoner-Wohlfarth Model.
The Stoner-Wohlfarth Model is widely used for single-domain grains, which
assumes the particle has uniaxial anisotropy and is in an equilibrium state [53]. The next
assumption is that all the magnetic moments within in the particle are always aligned

84
parallel at any given point [53]. Stoner et al. used the second derivative of the energy of
a system, shown in Eqn. (18) and plotted a hysteresis loop [53].
𝐸 = 𝐾𝑢𝑉 sin2(𝜙 − 𝜃) − µ0𝑀𝑠𝑉𝐻 cos𝜃 (18)
where V is the volume, Ms is saturation magnetization, and µ0 is the vacuum
permeability. By taking the second derivative of Eqn. (18) and plotting mh vs. h, a
hysteresis loop is made [53].
𝜕2𝜂𝜕2𝜙
= cos2(𝜙 − 𝜃) + ℎ cos𝜙 > 0 (19)
Different materials produce different shapes of curves [53]. The hysteresis loop
shape strongly depends on the angle between the magnetic field and the easy axis; the
larger the angle, the more reversible the rotation occurs [53]. These calculations apply to
identical, isotropic and uniaxial magnetocrystalline particles [53]. In reality, each
material, or sample, will have a unique Ku value [53]. From the hysteresis loop the
domain states, single-domain or multidomain, can be measured by plotting Mrs/Ms vs.
Hcr/Hc [57]. Where Mcr and Hcr are the remanent saturation and remanent coercivity,
respectively [58].
Kittel Model.
By 1950, another theory emerged, established by Charles Kittel, which was much
simpler than the Stoner-Wohlfarth Model. Kittel et al. performed a simple experiment to
saturate a sample consisting of magnetic particles suspended in a non-magnetic matrix

85
[45, 59]. The field required to saturate nickel or iron is considerably larger in a
multidomain particle than in a single-domain particle [59]. The first sample (a) has
particles so small that it never forms a domain wall, and thus is always is single-domain;
and (b) a larger particle, with a multidomain structure [59].
(a) Had a virtually spherical shape and was 200 Å in diameter. The field required
to saturate the sample was 550 Oe [45, 59]. From the saturation value, single-domain
particles can be concluded, even though the value was slightly higher than expected [59].
(b) To saturate the particle, it is necessary to overcome the maximum
demagnetizing field, 4πIs/3 for a sphere. For sample (b) The spherical carbonyl particles,
8 µm in diameter, and saturated at 2100 Oe [59]. Hence the particles in sample (b)
formed a multidomain structure [59].
In summary, Kittel et al. stated the idea that the energy density for multidomain
particles must be supplied by an external magnetic field, while with single domain
particles the amount of energy density is always present. Refer to Eqn. (20) for single
domain particle and Eqn. (21) for multidomain particles [45, 59, 60].
𝐻𝑠 = 2𝐾𝑀𝑠
(20)
𝐻𝑚 = 4𝜋𝑀𝑠3
(21)
Here Ms, is the magnetization saturation and K is a constant [60].
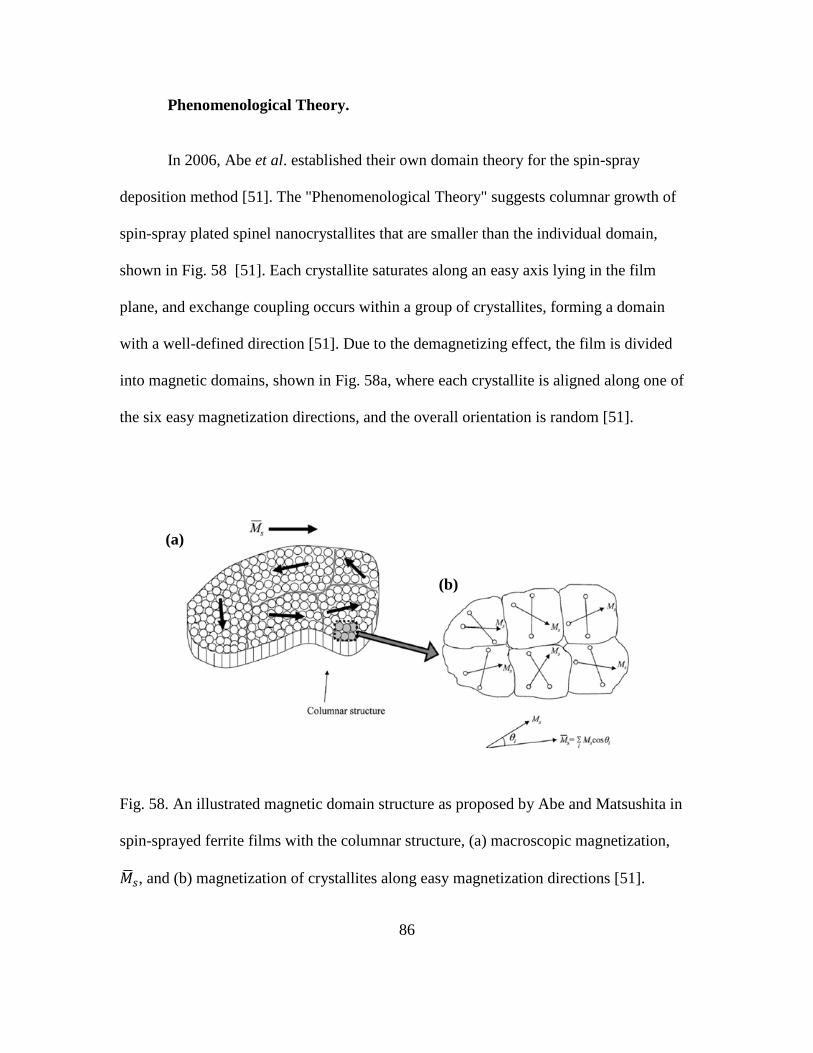
86
Phenomenological Theory.
In 2006, Abe et al. established their own domain theory for the spin-spray
deposition method [51]. The "Phenomenological Theory" suggests columnar growth of
spin-spray plated spinel nanocrystallites that are smaller than the individual domain,
shown in Fig. 58 [51]. Each crystallite saturates along an easy axis lying in the film
plane, and exchange coupling occurs within a group of crystallites, forming a domain
with a well-defined direction [51]. Due to the demagnetizing effect, the film is divided
into magnetic domains, shown in Fig. 58a, where each crystallite is aligned along one of
the six easy magnetization directions, and the overall orientation is random [51].
Fig. 58. An illustrated magnetic domain structure as proposed by Abe and Matsushita in
spin-sprayed ferrite films with the columnar structure, (a) macroscopic magnetization,
𝑀𝑠, and (b) magnetization of crystallites along easy magnetization directions [51].
(b)
(a)

87
The in-plane properties for a two-dimensional material is similar to a multidomain
polycrystalline material [51]. Therefore, the random symmetry along the plane yields Dx
= Dz = 0, and Dy = 1 (film is thin) and there is no net depolarization effect [51, 61]. For a
field applied in a random direction on the plane the susceptibility would be the average of
Xxx and Xzz, which is seen in Eqn. (23).
𝑋𝑥𝑥 = 0,𝑋𝑦𝑦 = 4𝜋𝑀𝑠𝐻𝐴+4𝜋𝑀𝑠𝐷𝑦−𝐷𝑥
,𝑋𝑧𝑧 = 4𝜋𝑀𝑠𝐻𝐴+4𝜋𝑀𝑠(𝐷𝑧−𝐷𝑥) (22)
𝑋𝑎𝑣𝑔 = 4𝜋𝑀𝑠2𝐻𝐴 (23)
Where Dx, Dy, and Dz are depolarization factors, and Xxx, Xyy, and Xzz are directional
susceptibilities, and hence Xavg is the average susceptibility [61]. From these equations
the permeability can be derived using the relation, Xavg = µ - 1.
The phenomenological theory gives a plausible explanation for exceeding Snoek’s
limit using the spin-spray method, however there are many problems with this journal
article [51]. The first issue is with the misleading title of "Phenomenological theory of
permeability in films having no in-plane magnetic anisotropy: Application of spin-
sprayed ferrite films [51]." In actuality, the high permeability and high frequency occur
when Co2+ is added to spin-spray process while an external magnetic field is applied. Abe
et al. have reported their highest Snoek's product producing films using this method [9].

88
Chapter 4
STRUCTURE AND MAGNETIC PROPERTIES
Spin-spray deposition of spinel ferrite films at low temperatures was developed
by spraying a reaction solution (FeCl2, NiCl2, and ZnCl2) and oxidizer solution
simultaneously onto a heated rotating platen. Lorentz TEM observations of magnetic
domain walls, grain boundaries, and cross-sections were performed on Ni-Zn-Co ferrite
thin films. The films were deposited uniformly and have columnar crystallites 80 – 150
nm in diameter. Multi-grain domains (MGD) were observed owing to the high Snoek’s
product. The magnetic domains were on average 235.71 ± 109.54 nm and the smaller
physical grains were on average 95.13 ± 38.76 nm in size. This observation suggested an
explanation why these materials have higher Snoek's products than for bulk materials
where the physical grain size is larger than the magnetic domain size.
INTRODUCTION
Recently spinel ferrites have received a great deal of attention for their uniquely
tunable properties such as resistivity, permeability, coercive field and core losses [6, 62].
Ferrite films are usually developed using vapor deposition or epitaxy techniques [6].
However, with one extra advantage of developing deposition techniques for ferrite thin
films at low temperatures, 90°C, is that a variety of substrate materials can be used,
including on plastics. This method was first demonstrated by Abe et al. [16, 63]. In this
study, the Ni-Zn-Co ferrite films were deposited and magnetically characterized into the
gigahertz range, well beyond conventional bulk ferrites. These films are isotropic
89
materials which make them viable for low-loss broadband communications, miniaturized
low-microwave inductors, or for antenna applications.
For most applications, such as electromagnetic interference (EMI) devices, the
permeability and resonant frequency are the main consideration [52, 64]. In this research,
the Multi-Grain Domains (MGD) contribute to the high permeabilities and high resonant
frequencies built up by the µ-droplet regime [16, 63]. In order to prove this theory Lorenz
transmission electron microscope (TEM) of the magnetic domains were imaged, as well
as the grain boundaries and cross-sections of the film.
Magnetic domains are formed to reduce the magnetostatic energy which is the
magnetic potential energy in the flux lines [6]. Their size and geometries are determined
by the reduction of magnetostatic, magnetocrystalline anisotropy, magnetostrictive, and
domain wall energy [6]. Other factor contributing to the domain structure are voids, grain
boundaries, and non-magnetic inclusions [6].
EXPERIMENTAL PROCEDURE
Nickel zinc cobalt ferrite films, of compositions Ni0.24Zn0.61Co0.02Fe2.13O4 (Film
#1) and Ni0.18Zn0.50Co0.05Fe2.27O4 (Film #2), were deposited onto silicon wafers using the
spin-spray plating method. The reactant solution of FeCl2 + NiCl2 + ZnCl2 + CoCl2 and
the oxidant solution containing NaNO2 + CH3COOH + NH4OH were sprayed
simultaneously onto a rotating platen heated to 90°C [15, 65]. The ferrite layer built up
through sequential exposure and reaction.

90
The complex permeability spectra were measured to distinguish between the
domain wall and spin rotation contributions [66]. The instrument used to measure the
real, µ’, and imaginary permeabilities, µ’’, effects on frequency were a vector network
analyzer with a customized microstrip permeameter [42, 67].
The samples were then prepared for examination by TEM first by sectioning and
cutting them down to size a size that would fit in the instrument. The next step was to
thin the actual sample by polishing down to about 100 μm thickness, and then dimpled to
create thin area with thickness smaller than 10 μm. Further thinning was down by argon
ion-milling, rendered the material to be electron transparent regions [68].
RESULTS AND DISCUSSION
Permeability Measurements.
Figure 59 plots the real and imaginary parts of the complex permeability for film
#1, Ni0.24Zn0.61Co0.02Fe2.13O4 , and film #2, Ni0.18Zn0.50Co0.05Fe2.27O4 . Both films
exhibited high permeability and high frequency properties. The Snoek's limit was
exceeded for both films and calculated for each film as 18.4 GHz and 12.0 GHz,
respectively. These values are at least a factor of 10 greater than bulk (Ni, Zn, Co)xFe2-
xO4 spinel ferrite which is typically 1 - 3 GHz. Figure 59b, film #2, has considerable
noise compared to film #1 due to its relative thickness. It reached the lower limits of the
permeameter, which is about 300 nm. These are typical permeability graphs for spin-

91
spray deposited films using the µ-droplet regime, and are comparable to plots in literature
for films deposited by the continuous liquid layer regime.
Fig. 59. Complex permeability spectra of (a) film #1 and (b) film #2.
(a)
(b)
Ni0.24Zn0.61Co0.02Fe2.13O4
Ni0.18Zn0.50Co0.05Fe2.27O4

92
Sample Morphology by Scanning Electron Microscopy.
Each sample was analyzed by SEM (Hitachi S7800) for thickness, grain
morphology and sizes, and structural changes. Typical thicknesses, excluding the
substrate, range from 0.6 – 12 µm. The growth rate and particle size were dependent on
the oxidant pH. If the pH was higher (pH > 9.0) the growth rate and particle size
increases. Current growth rate ranges from 4.0-18.0 nm/min, with the optimum growth
rate at 4.0 nm/min. The microstructure for Ni-Zn ferrite and Ni-Zn-Co ferrite was very
similar. The thin films were columnar in appearance consisting of a nanocrystalline
substructure, seen in Fig. 60-63. There are different substructures ranging in size from,
15-30 nm nanocrystalline substructures, the tops of the columns range from 100 - 500
nm, and 0.3 – 12 µm thickness. Figure 64 displays a significantly higher growth rate and
a non-uniform structure. This difference is caused by the significantly low amount of
zinc and the high pH of the aqueous solution.
Imaging the thicknesses of the thin films is crucial to this research, as well as
documenting the conditions of this deposition. The thickness was dependent on the
position of the nebulizers; which was directly beneath the nebulizers. The difference in
thickness across the film is caused from not having a continuous liquid layer on the
substrate; which was found by simulated results using CFD in Fig. 65, by Heath Lorzel
[69]. Matsushita and Abe resolved this issue by placing two separate sample substrates, 5
cm by 5 cm, directly underneath the nozzles [11], instead of attempting to deposit
uniformly over the entire substrate. The fluid flow simulation assisted in re-positioning

93
the nebulizers in order to maximize the deposition area uniformly and utilize the µ-
droplet growth regime.
Fig. 60. Columnar structure of Ni0.19Zn0.30Co0.05Fe2.46O4, sample NZCF110128.

94
Fig. 61. . Ni-Zn-Co ferrite plan view sample with a composition,
Ni0.19Zn0.30Co0.05Fe2.46O4, sample NZCF110128.

95
Fig. 62. After long-term deposition, in plan-view, with a composition
Ni0.31Zn0.25Co0.04Fe2.40, sample NZCF111117.

96
Fig. 63. Ni-Zn-Co ferrite sample with a composition, Ni0.31Zn0.25Co0.04Fe2.4O4,
thicker film grown than usual but the properties and microstructure have been
maintained, sample NZCF111117.
8.23 µm

97
Fig. 64. Spinel ferrite sample, NZCF110823, composition Ni0.23Zn0.33Co0.05Fe2.40O4,
depositing at an extremely fast rate of 375 nm/min, (a) representing columnar features
and (b) showing bulk material.
Bulk
Columnar
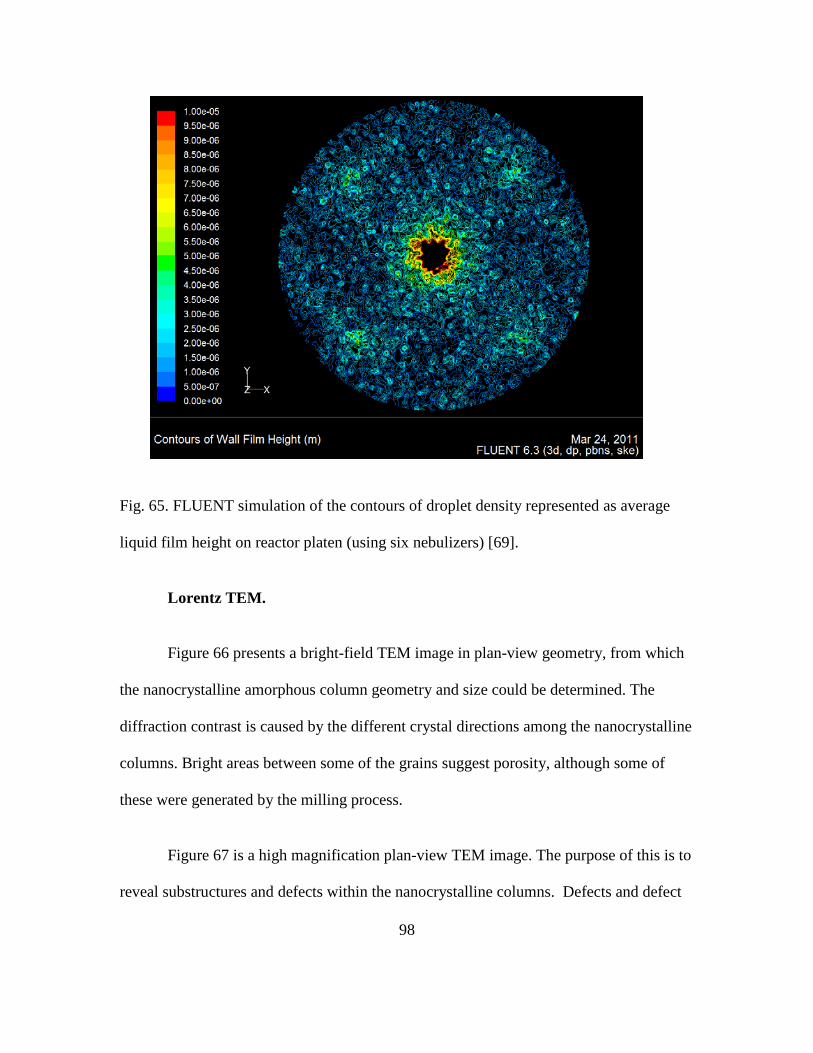
98
Fig. 65. FLUENT simulation of the contours of droplet density represented as average
liquid film height on reactor platen (using six nebulizers) [69].
Lorentz TEM.
Figure 66 presents a bright-field TEM image in plan-view geometry, from which
the nanocrystalline amorphous column geometry and size could be determined. The
diffraction contrast is caused by the different crystal directions among the nanocrystalline
columns. Bright areas between some of the grains suggest porosity, although some of
these were generated by the milling process.
Figure 67 is a high magnification plan-view TEM image. The purpose of this is to
reveal substructures and defects within the nanocrystalline columns. Defects and defect

99
systems such as dislocations and stacking faults (labeled in Fig. 67) reveal a mottling in
the contrast that suggests domain sizes that are much smaller than the physical grain
itself. Combined with the lattice strain, these defects contribute to an especially
complicated diffraction contrast in the image. Notice that bright field images are
constructed using diffraction contrast, in Fig. 66 the mottling seen is caused by different
crystallographic orientations and compositional variations. The light regions in the bright
field image are caused from pores formed by the milling process.
Fig. 66. Bright-field TEM image with grain size averaging 95.13 ± 38.76 nm of film #1.
500 nm
Pores
Composition Variation

100
Fig. 67. High magnification TEM plan-view image, film #1.
Since compositional variation was noticed on the bright field images, a scanning
transmission electron microscopic (STEM) image was taken with a corresponding energy
dispersive x-ray spectroscopy (EDXS) line profile. The line profiles of nickel, zinc,
cobalt, and iron decrease fractionally about the same; it is likely the graph is changes as
an artifact of the measurement. The estimated beam size is about 2 nm and has an energy
resolution of 130 eV, see Fig. 68a and 68b.
Stacking Fault

101
Fig. 68. (a) STEM image showing the (b) corresponding line profiles for Ni, Zn, Fe, and
Co using EDXS.
Each grain column consists of a nanocrystalline substructure, each of which looks
like single crystal texturing within a larger grain. This can be concluded from Figs. 69
and 70, even if there is not a perfect crystal within the actual column. In other words the
nanocrystalline column boundaries are seen as crystal grain boundaries; see Fig. 70 for a
(a)
(b)
(a)

102
wider representation. The boundaries vary in shape and size, and often are filled with
amorphous material, which may influence the magnetic properties. Since the magnetic
domain boundaries are broken up to reduce the total energy in the system the magnetic
field does not penetrate the amorphous regions in the material.
Fig. 69. TEM cross-section, showing a grain boundary filled with amorphous material in
film #2.
The low magnification bright field cross-section TEM image, Fig. 70, establishes
a very clear view of the columnar structure. This image shows a high quality film growth
in the µ-droplet regime. The ferrite columns are firmly attached to the glass substrate, and
show a uniform thickness.
Amorphous

103
Fig. 70. Cross-section of film #2 showing single crystalline spinel ferrite.
Using off-axis electron holography an electron phase distribution map can be
generated. The electron phase map contours parallel to magnetic field lines integrated in
the incident beam direction. To locate the magnetic domain, the direction of the phase
gradient on the sample is needed. With "Digital Micrograph" (DM) software processing
the gradient map is obtained. The color represents the gradient directions of the magnetic
field, and the color wheel indicates the relation between the gradient and color. From the
gradient map the magnetic domain can be established on the original image, see Fig. 71.

104
Fig.71. Off-axis electron holography (Left) electron gradient map and (Right) Lorentz
image with magnetic domains labeled.
In the image on the right, the white arrows indicate the direction of magnetic
induction for each domain that shown outlined in red. It is important to note that the
magnetic domain often comprise of several physical crystal grains, or portions of several
grains, otherwise known as multi-grain domains (MGD). The size and geometry of the
magnetic domains are affected by crystal structure, and the magnetic domain boundaries
often follow and coincide with the column boundaries. A statistical analysis indicates
that the magnetic domain boundaries coincide with the physical grain boundaries 41.55%
of the time.
In hard magnets comprising of large grain structures, the domains divide into
regions of 90° or 180° magnetic orientations in order to lower the external stray energy
field [5]. The 90° and 180° domains organize to accommodate internal flux closure to

105
prevent demagnetization of the hard magnet. Figure 72 illustrates 90° and 180° domains
within a single crystal while Fig. 73 shows and example of nanocrystalline grains in an
amorphous matrix of random anisotropy [5, 70].
Fig. 72. Hard magnet
Fig. 73. A soft magnet with random anisotropy.

106
Thermodynamically, it is more advantageous to have the magnetic structure
divided into domains that minimize the free energy, rather than be uniformly magnetized
throughout in one direction [4]. In the electron holography image there are few, if any,
90° domain walls visible. In general the domains are aligned in Fig. 71 diagonally from
bottom left to upper right; however they are not perfectly aligned. The material acts more
like a soft magnetic material with nanocrystalline grains than a hard magnetic material.
Random Anisotropy Model.
The random anisotropy model best represents the magnetic domains in the Ni-
Zn-Co ferrite thin films deposited using the spin-spray plating method. The ferrite films
deposited display a multiphase material with nanocrystalline grains with amorphous
boundary features shown in Figs. 66 – 71. Nanocrystalline texturing is often seen within
what appears to be single grains that are less than 100 nm [70]. Particle reduction is a
well know method to divide into single-domain particles, which increases the coercivity
value to a maximum, controlled by the anisotropies [70].
The random anisotropy model (RAM) basically explains the high frequency and
high permeability properties by considering exchange-coupled nanocrystals with uniaxial
magnetocrystalline anisotropy, K [71]. The magnetocrystalline anisotropy is relates to the
crystal symmetry, and for cubic crystals the easy axis has 6 major directions [70]. The
fundamental idea to understanding the effect of magnetocrystalline anisotropy is to
recognize that the grains are much smaller than the ferromagnetic exchange length, Lex0,

107
the minimum length the magnetic moments are forced to align; which is given by Eqn.
(24) [70].
𝐿𝑒𝑥 = 𝐴/⟨𝐾1⟩ (24)
Where A is the exchange stiffness (relates the exchange integral Jhkl with interaction
parameter), and K1 is the anisotropy [70, 72].
The magnetocrystalline anisotropy is averaged over the randomly fluctuating
anisotropies, drawn in Fig. 51 [50, 70]. Essentially, ferromagnetically coupled grains, of
size D, with magnetocrystalline anisotropies K1 are oriented at random [50]. Within the
volume of the exchange length, Lex, the effective anisotropy, ⟨𝐾⟩, is a product from the
mean fluctuation amplitude of the anisotropy energy [50]. Hence, if the grain size, D, is
less than the exchange length, Lex, than [73]
⟨𝐾⟩ = 𝐾1 ∙ 𝐷𝐿𝑒𝑥06
= 𝐾14 ∙𝐷6
𝐴3 (25)
Equation (25) is true for three-dimensional structures; however spin-spray deposited
ferrites are considered having a two-dimensional structure, so the equation changes to
[50, 73]
⟨𝐾⟩ = 𝐾12 ∙𝐷2
𝐴 (26)
The dependence of grain size is still important, by an exponential factor of 2; however
other factors also play a role.

108
The coercivity and initial permeability plays an important role in the random
anisotropy model and are closely correlated to the effective anisotropy by Eqns. (27) and
(28) in the case of two-dimensional materials [50].
𝐻𝑐 = 𝑝𝑐⟨𝐾⟩𝑀𝑠
≈ 𝑝𝑐𝐾12
𝑀𝑠𝐴 ∙ 𝐷2 (27)
𝜇𝑖 = 𝑝𝑖𝑀𝑠
𝜇0⟨𝐾⟩≈ 𝑝𝜇
𝑀𝑠𝐴𝜇0𝐾12
∙ 1𝐷2
(28)
Where pc and pµ are dimensionless pre-factors close to unity [50, 70, 73].
There is not much data for two-dimensional materials with coercivity or initial
permeability plots to compare the Ni-Zn-Co ferrite films with, however, Herzer started
collecting data on three dimensional materials. He was able to find the critical grain size
at which the exchange length begins to equal the grain size, D = Lex ≈ 40 nm, labeled in
Fig. 74 [50]. If the grain size exceeds the domain wall width, domains form within the
grain, and the coercivity and initial permeability decrease [50, 70].

109
Fig. 74. Effect of grain size on coercivity for 3D materials made of magnetic metal alloys
[50, 70].
Summary.
Multi-grain domains were experimentally observed definitively for the first time.
Electron holographic imaging revealed the size of magnetic domains, Lex, to be greater
than the physical grain size (e.g., Fig. 71). Though spin-spray deposition exhibited soft
magnetic properties within the plan of the film, such behavior is not exceeded in the third
dimension [50, 70].
40 nm

110
Chapter 5
LAMINATION OF THIN FILMS
This chapter discusses the lamination of Ni-Zn-Co spinel ferrites for antenna
applications. This lamination procedure has been filed as a provision patent under the
U.S. Application Serial No. 61/552,208, filed on October 27, 2011 [74].
PREPARATION
Thin films ferrites are prepared using the spin-spray deposition method. First, the
metal chloride (Fe, Ni, Zn, Co, Mn, etc…) and oxidant solutions are prepared using
deionized water. In this case the precursor is used for Ni-Zn-Co ferrite. It consists of
iron chloride tetrahydrate, nickel chloride hexahydrate, zinc chloride, and cobalt chloride
hexahydrate. The oxidizing solution is a mixture of sodium nitrite (NaNO2), which acts
as the oxidant, and sodium acetate (CH3COONa) which buffers the solution ranging from
a pH of 7.0 – 11.0. When the deposition is completed, distilled water is pumped through
the entire system, washing the vessel, tubing, nebulizers and thin films for at least 20
minutes.
Substrate.
The substrate can ultimately have any thickness, in this case 12.5 - 25.4µm thick
polyether ether ketone (PEEK) substrate was used. As seen from Fig. 75 and 76
depositing on a glass substrate gives a much more uniform coverage firmly attached to
the surface than a thermoplastic substrate. However, the PEEK substrate has many
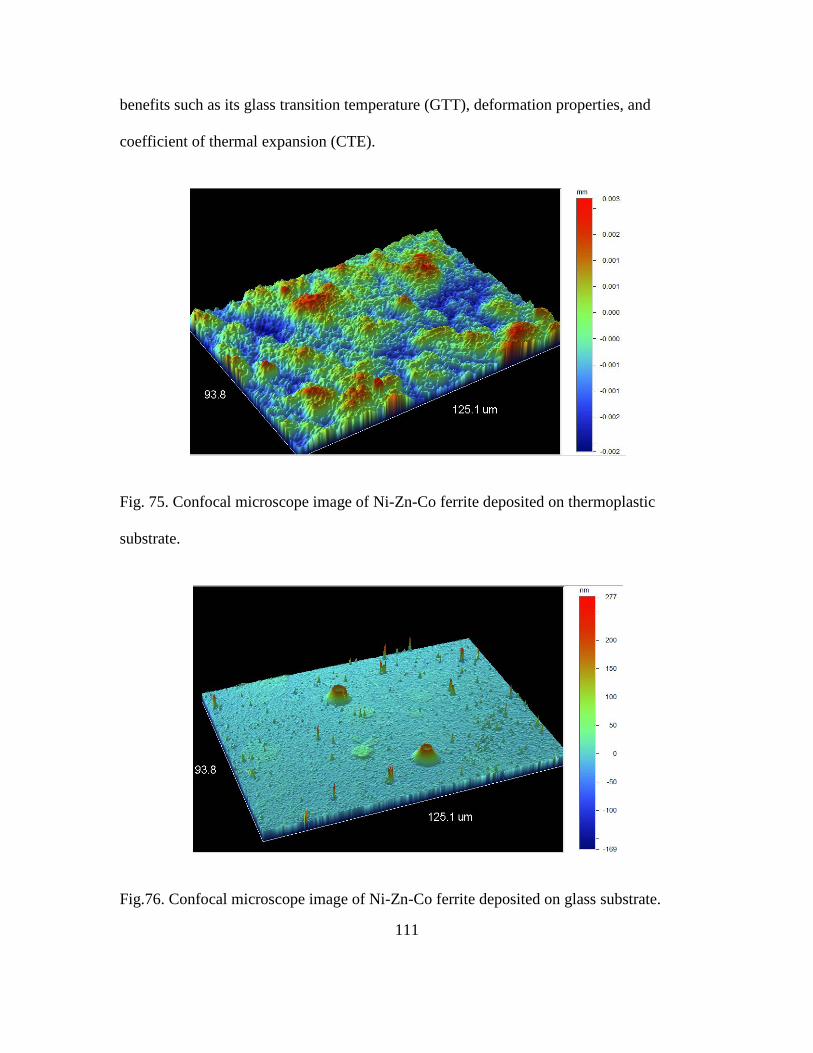
111
benefits such as its glass transition temperature (GTT), deformation properties, and
coefficient of thermal expansion (CTE).
Fig. 75. Confocal microscope image of Ni-Zn-Co ferrite deposited on thermoplastic
substrate.
Fig.76. Confocal microscope image of Ni-Zn-Co ferrite deposited on glass substrate.

112
The GTT was measured using a differential scanning calorimeter (DSC) to
measure the thermal transitions for the polymer and the thin film deposited onto the
polymer [75]. According to the graph in Fig.77 the GTT of the PEEK is at 341°C, and it
is an exothermic reaction. The DSC measures the sum of all heat flows, which makes it
sometimes difficult to interpret the data, when measuring composites, however in the
case of PEEK it straight forward [75]. When ferrite is deposited onto the substrate the
GTT does not change.
Fig. 77. The measured glass transition temperature of the plastic substrate in red and in
black a deposited Ni-Zn-Co ferrite thin film same substrate.
113
LAMINATION
The second stage is preparing the films for lamination. After the films are washed
and cooled down the reactor top is taken off and the nitrogen is blown carefully on the
films to dry them off. The films are then cut to the desired size and stacked into layers
with for the desired thickness and width.
Next, the stacked layers of Ni-Zn-Co ferrite are placed in between two aluminum
blocks, i.e. laminate mold seen in Fig. 78. If needed, pressure is applied to keep the
laminate mold closed tightly. Then the layered sample is placed into a 3-zone tube
furnace and heated to 330 - 400ºC for about two hours in a helium atmosphere, in order
to keep the ferrite from oxidizing. The temperature ramp rate is held at 15-50ºC/minute.
When the cycle is finished the layered sample is left to cool down without disturbance at
the same ramp rate.

114
Fig. 78. Aluminum mold for thin film laminate.
Results.
Figure 79 shows an optical image of laminate of this method used on Ni-Zn-Co
ferrite, and Table IV shows the characteristics of the layers used in this example. The
final sample was 3" x 3" x 0.2", and each layer had 12 µm PEEK and 12 µm Ni-Zn-Co
ferrite with approximately the same composition. To maximize the efficiency of this
process the laminate was stacked in a mosaic; each layer could consist of 1, 2 or 3
separate sections to complete the layer. Since this laminate was too large to fit in the
permeameter, Dr. Sergio Clavijo simulated the results using a prototype with the same
samples, see Fig. 80 [76].

115
Fig. 79. Optical image of ferrite and PEEK layers.
Ferrite
PEEK

116
Table IV. Characteristics of the individual sample layers for L111017.
Sample ID Composition NZCF20110927 Ni0.19Zn0.22Co0.05Fe2.54 NZCF20110930 Ni0.19Zn0.29Co0.04Fe2.48
NZCF20111004 Ni0.20Zn0.24Co0.06Fe2.50
NZCF20111006 Ni0.16Zn0.32Co0.04Fe2.48
NZCF20111101 Ni0.43Zn0.34Co0.04Fe2.19
NZCF20111102 Ni0.37Zn0.30Co0.05Fe2.28
NZCF20111107 Ni0.18Zn0.13Co0.04Fe2.65
NZCF20111108 Ni0.37Zn0.22Co0.05Fe2.36
NZCF20111110 Ni0.31Zn0.31Co0.05Fe2.34
NZCF20111114 Ni0.24Zn0.07Co0.04Fe2.64
NZCF20111115 Ni0.29Zn0.30Co0.05Fe2.37
NZCF20111116 Ni0.27Zn0.22Co0.05Fe2.45
NZCF20111117 Ni0.31Zn0.25Co0.04Fe2.40
NZCF20111129 Ni0.34Zn0.34Co0.05Fe2.27
NZCF20111130 Ni0.28Zn0.27Co0.06Fe2.40
NZCF20111201 Ni0.27Zn0.26Co0.04Fe2.43
NZCF20111202 Ni0.35Zn0.34Co0.05Fe2.26
NZCF20111203 Ni0.35Zn0.21Co0.04Fe2.44
NZCF20111204 Ni0.30Zn0.35Co0.05Fe2.30

117
Fig. 80. Predicted permeability for a 3" x 3" x 0.2" laminate. The solid (red) and dashed
(blue) curves represents the initial and imaginary permeability, respectively, if there are
no pores or cracking in the laminate. The curves with symbols represent a small degree of
cracking induced in the layering procedure.
SUMMARY
The spinel ferrite laminates have many applications in the high frequency range.
The spin-spray deposition method provides an operation advantage synthesizing at low
temperatures. The laminate applications include antennas, low-loss broadband
communication devices, miniaturized low-microwave inductors, and electromagnetic
noise suppressors.
1 107× 1 108× 1 109× 1 1010×
0
10
20
0
10
20
Frequency (Hz)
Rel
ativ
e Pe
rmea
bilit
y

118
Chapter 6
CONCLUSIONS & FUTURE WORK
Throughout this dissertation, the fabrication and characterization of
nanocrystalline spinel ferrite thin films fabricated by the spin-spray deposition was
examined and discussed. The spin-spray deposition method is an aqueous reaction that
occurs at low temperature with the delivery of reactants via a dual spraying of metal
chloride and oxidizing reactant onto a rotating platen. The basic principle behind the
aqueous reaction is converting the iron oxidation states from Fe2+ to Fe3+.
As demonstrated in chapter 4, the magnetic domain structure is considered multi-
grain domain (MGD) with a complex nanocrystalline substructure. Understanding the
magnetic properties through nanocrystalline magnetic domain behaviors became a large
part of this project, which led to interpreting the data trend analysis. The MGD structure
can be interpreted through the random anisotropy model, which is basically modeled after
the idea that the ferromagnetic exchange length, Lex, is larger than the grain size [50, 70,
73].
The optimum pHEFF for deposition is found for depositing the optimum Ni-Zn-Co
ferrite film in µ-droplet regime of the rotating platen. There is a steep decline in Snoek's
product with an increase in deposition rate, which can be caused from the reaction
kinetics of iron (Fig. 48), crystallite size, porosity, or cracking. The last three causes can

119
lead to a significantly lower Snoek's product value, in which the materials will act like a
bulk powder.
To give an example of how well these films perform compared to others in
literature, they have been plotted on the same graph as De-Sheng et al. [77]. He compares
the anisotropy field from the hard plane (Ha1) and the easy plane (Ha2) to determine the
Snoek's limit [77]. There is a line drawn in shown in black where Ha1/Ha2 =1, which is
equivalent to Snoek's limit for bulk materials (or spherical particle composites), in which
the spinel ferrite thin films have exceeded, shown in Fig. 81 [77].
PROCESS IMPROVMENTS
Film Properties.
For the last four years, only a limited composition range has been targeted in
order to understand the spin disc reactor better. As of late the processing mechanisms for
the spin disc reactor were analyzed in chapter 3. The next step in this process, in which
has already begun, is to map the different cation fractions contributing to spinel ferrite
films, see Fig. 82, to see if there are any other compositions that can increase the
frequency range into to GHz range while maintaining the Snoek's product.

120
Fig. 81. The ratio of (µ-1)/Ms of various types of spinel ferrite thin films deposited using
the spin-spray method plotted as a function of the resonance frequency [77].
Another improvement that could be made to the process is buffering the chloride
solution. The metal chloride solutions used in this study have not been buffered, and
ranges from 3.70 – 4.30. By varying the pHChloride it will allow for morphology changes
within the spinel structure, which in turn relates to the Snoek's product values.

121
Fig. 82. Cation fraction map with highest Snoek's product labeled in red areas.
EXPERIMENTS
Environmental Testing.
Experimentally, the spinel ferrite films developed during the spin-spray
deposition method need to be tested under extreme environments. Since Ni-Zn-Co ferrite
films will be used for electromagnetic interference devices (EMI) they will need to be
tested for thermal shock, hardness testing, and damp heat testing [78].

122
Thermal shock testing for ceramics depend not only on temperature change but
mechanical and thermal properties as well [44]. It basically measures the ability of a
material to withstand failure under rapid cooling [44]. Therefore it is best to have high
fracture strengths, thermal conductivities, low elastic moduli, and low thermal expansion
coefficient [44]. Since Ni-Zn-Co ferrite are brittle materials, thermal stresses as a
consequence of thermal changes may lead to fracturing or plastic deformation [44]. The
main sources of thermal stress are thermal expansion and temperature gradients during
heating and cooling [44].
Next hardness testing is used, which measures a materials resistance to localized
plastic deformation [44]. There are many different types of hardness tests including the
Rockwell, Brinell, Vickers, and Knoop hardness tests. Hardness tests are very common
tests to perform over other mechanical tests for several reasons. They are inexpensive,
simple, and easy to learn since they have been studied for over 250 years [79]. It a near
non-destructive test with only a small indent occurring during the test [44]. Another
advantage using this test is through the hardness data other mechanical properties can be
extrapolated, such as tensile strength [44]. In the case on Ni-Zn-Co spinel ferrite thin
films the Vickers hardness test method would be applied, however, instead of using a
microindenter, a nanoindenter would be used in order to test the individual columns.
The damp heating tests are proposed to be used to expose materials to
environments for testing delamination, electrical and magnetic degradation behavior [80].
Damp heating experiments are usually performed for 1000 hours at 85°C in an 85%

123
humid environment. The experiment is rather extreme, and the failures seen in the
experiments may not be seen in the field [80]. For thin film ferrites, the largest concern
would be the substrate, especially if it were deposited onto a plastic. The polymer may
absorb water, or deuterium, which in turn changes the electrical properties of the overall
laminate.
The last test proposed would be measure the magnetic properties at different
temperatures using the superconducting quantum interference device (or SQUID) from
10 K – 400 K (-263.15°C – 126.85°C). When the material is exposed to a higher or lower
temperature, the area (i.e. loss) of the hysteresis loop will change due to disorder [6]. At
higher temperatures the direction of dipole moments randomize, decreasing the area of
the hysteresis and giving disorder with no net polarization [81]. Also phase transitions
can be found during temperature cycles, it which there will be an increase in polarization
[81]. The permeability is an important property that is strongly dependent on the
temperature, and is one of the most important properties measured when evaluating the
electromagnetic properties [6]. Figure 83 is an example extracted from Liu et al.
depicting ferromagnetic behavior in synthesized cobalt ferrite nanoplatelets dispersed in
ethanol [55].

124
Fig. 83. Hysteresis loops of CoFe2O4 at different temperatures [55].

125
REFERENCES 1. Vishwakarma, R.K., Dual-band stacked rectangular microstrip antenna for
mobile applications. Antenna Test and Measurement Society, 2010. 2. Kondo, K., et al., Spin sprayed Ni(–Zn)–Co ferrite films with natural resonance
frequency exceeding 3 GHz. Journal of Applied Physics, 2007. 101(9): p. 09M502.
3. W. D. Kingery, H.K.B., and D. R. Uhlmann, Introduction to Ceramics1960, New
York: John Wiley and Sons, Inc. 1032. 4. Wijn, J.S.a.H.P.J., Ferrites1959, New York: John Wiley & Sons. 369. 5. Jiles, D., Introduction to Magnetism and Magnetic Materials. 2 ed1998, New
York: Chapman and Hall. 536. 6. Goldman, A., Modern Ferrite Technology. 2 ed2006, Pittsburgh, PA: Springer.
438. 7. Snoek, J.L., New Developements in Ferromagnetic Materials1947, New York:
Elsevier Publishing Company, Inc. 136. 8. Neelakanta, P.S., Handbook of Electromagnetic Materials: Monolithic and
Composite Versions and Their Applications1995, Boca Raton, FL: CRC Press. 9. Nabuhiro Matsushita, T.N., and Masonori Abe, Ni-Zn-Co Ferrite Films Prepared
at 90ºC Having µ'' = 30 at 3 GHz. IEEE, 2002. 38(5): p. 3. 10. Tamaura, M.A.Y., Ferrite-Plating in Aqueous Solution: A New Method for
Preparing Magnetic Thin Film. Japanese Journal of Applied Physics, 1983. 22(8). 11. Nobuhiro Matsushita, C.P.C., Tomohiro Mizutani, and Masanori Abe, High-Rate
Low-Temperature (90 °C) Deposition of Ni-Zn Ferrite Films Highly Permeable in Gigahertz Range. IEEE, 2002. 38(5): p. 3156-3158.
12. M. Abe, A.I.S., N. Matsushita, and Y. Shimada, Ferromagnetic Resonance Study
on Magnetic Homogeneity in Spin-Sprayed NiZn Ferrite Films Highly Permeable at Gigahertz Frequencies. IEEE, 2003. 39(5): p. 3142-3144.
13. Nobuhiro Matsushita, M.T., Masataka Shigemori, and Masanori Abe, High
Deposition Rate Obtained for Spin-Sprayed Ni-Zn Ferrite Films Without Using Ammonia Ions. IEEE, 2004. 40(4): p. 2817-2819.

126
14. Lau, J.G.M.D., Improvement of High-Frequency Properties of Iron-Deficient Ni-Zn-Co Ferrites by Reduction of Grain Size IEEE, 1969. 5(3): p. 1.
15. Matsushita, N., et al., Ni–Zn ferrite films with high permeability (μ'=~30,
μ"=~30) at 1 GHz prepared at 90 °C. Journal of Applied Physics, 2002. 91(10): p. 7376.
16. Tamaura, M.A.Y., Ferrite plating in aqueous solution: New technique for
preparing magnetic thin film. Journal of Applied Physics, 1984. 55(6): p. 3. 17. Abe, M., Ferrite plating: a chemical method preparing oxide magnetic films at
24–100°C, and its applications. Electrochimica Acta, 2000. 45: p. 7. 18. Makoto Ojima, F.S., Yoshitaka Kitamoto and Masanori Abe, Ultrasound
Enhanced Ferrite Plating of Polymer Microspheres for Magnetic Cellular Segregation. IEEE, 1999. 35(5): p. 3.
19. Nabuhiro Matsushita, T.N., and Masonori Abe, Spin-sprayed Ni-Zn-Co ferrite
films with high µr''>100 in extremely wide frequency range 100 MHz-1 GHz. Journal of Applied Physics, 2003. 3(10): p. 7133-7135.
20. Matsushita, N., et al., Ni-Zn ferrite films synthesized from aqueous solution usable
for sheet-type conducted noise suppressors in GHz range. Journal of Electroceramics, 2006. 16(4): p. 557-560.
21. Wagata, H., et al., Single-Step Fabrication of ZnO Rod Arrays on a Nonseeded
Glass Substrate by a Spin-Spray Technique at 90 °C. Crystal Growth & Design, 2010. 10(8): p. 3502-3507.
22. P. J. van der Zaag, P.L., Y. Kitamota & M. Abe, The permeability of plated ferrite
films. IEEE, 1999. 35(5): p. 3. 23. Peter Lubitz, S.H.L., Frederic J. Rachford and Brian J. Rappoli Effects of
Annealing on the Microwave Properties of Spin-Spray Ni-Zn Ferrites. IEEE, 1994. 30(6): p. 3.
24. Zhang, Q., et al., Preparation of NiZn ferrite films by spin-spray ferrite plating on
oxygen-plasma-treated substrates. Journal of Applied Physics, 1993. 73(10): p. 6284.
25. Lu, N.X.S.K., Grain-size limit of polycrystalline materials. Physical Review B,
1999. 59(9): p. 3.

127
26. Liu, M., et al., Spin-spray deposited multiferroic composite Ni0.23Fe2.77O4/Pb(Zr,Ti)O3 with strong interface adhesion. Applied Physics Letters, 2008. 92(15): p. 152504.
27. Scherer, C.J.B.a.G.W., Sol-Gel Science: The Physices and Chemistry of Sol-Gel
Processing1990, Boston: Academic Press Inc. 462. 28. D.M. Dobkin, M.K.Z., Principles of Chemical Vapor Deposition2003,
Netherlands: Kluwer Academic Publishers. 279. 29. Nabuhiro Matsushita, T.N., and Masonori Abe, Ni-Zn-Co ferrite films prepared at
90C having µ"=30 at 3 GHz. IEEE, 2002: p. BW 11. 30. Ray, N.M., SDR III System Flow Chart, 2012. 31. Donald A. Palmer, P.B.a.D.J.W., Solubility of Nickel Oxide and Hydroxide in
Water, in Properties of Water and Steam2004: Kyoto. p. 264-269. 32. PElERR TREMAINEI, R.V.M., AND G. R. SHIERHJAN, A CALCULATION
OF GIBBS FREE ENERGIES FOR FERROUS IONS AND THE SOLUBILITY OF MAGNETITE IN H2O AND D2O TO 300°C. Thermochimica Acta., 1977. 19: p. 287-300.
33. Ailoor, S.K., et al., Coupling of MnZn-ferrite films onto electronic components by
a novel solution process for high frequency applications. Journal of Materials Chemistry, 2009. 19(31): p. 5510.
34. Nobuhiro Matsushita, C.P.C., Tomohiro Mizutani, and Masanori Abe, High Rate
Low-Teperature (90ºC) Deposition of Ni-Zn Ferrite Films highly Permeable in Gigahertz Range. IEEE, 2002. 38(5): p. 3156-3158.
35. Abe, M., Nano-Crystalline and Thin Film Magnetic Oxides. High Technology, ed.
M.A. Ivan Nedkov. Vol. 72. 1998, Netherlands: Kluwer Academic Publisher. 36. Petuskey, W.T., Growth Hypothesis, 2011: PowerPoint. 37. Lorzel, H., Particle Traces Colored by Particle Z Velocity (m/s), in Computation
Fluid Dynamics (CFD)2010. 38. Lorzel, H.M., Comparisons With Experimental Results Attempt to Establish a
Correlation Between Computed Fluid Variables and Observed Film Growth, in FLUENT2012.
39. Rose, H.H., Optics of high-performance electron microscopes. Science and
Technology of Advanced Materials, 2008. 9(1): p. 014107.

128
40. Paul Barnes, T.C., Simon Jacques Advanced Certificate in Powder Diffraction on the Web. Bragg's Law, 2006.
41. Tom Sebastian, S.A.C., and Rodolfo E. Diaz, Improved accuracy thin film
permeability extraction for a microstrip permeameter. Journal of Applied Physics, 2012: p. 8.
42. Diaz, R.E., W.M. Merrill, and N.G. Alexopoulos, Analytic framework for the
modeling of effective media. Journal of Applied Physics, 1998. 84(12): p. 6815. 43. MDI Jade 9.0, 2011. 44. William D. Callister, J., An Introduction to Materials Science and Engineering. 7
ed2007, New York: John Wiley & Sons Inc. 45. Cullity, B.D., Introduction to Magnetic Materials1972, Canada: Addison-Wesley
Publishing Co., Inc. 666. 46. Ray, N.M., Cation Fraction versus Snoek's Product, in MatLab2013, MatLab. 47. de Lacheirrerie, E.D.T., Magnetism: Materials and Applications2005, New York:
Springer Publishing. 48. Lui Yi, D.S., and David J. Sellmyer, Handbook of Magnetic Material. Vol. 1.
2006, New York: Springer Publishing. 49. Herzer, G., GRAIN SIZE DEPENDENCE OF COERCIVITY AND
PERMEABILITY IN NANOCRYSTALLINE FERROMAGNETS. IEEE, 1990. 26(5): p. 1397 - 1402.
50. Herzer, G., Nanocrystalline Soft Magnetic Materials. Physica Scripta, 1993. T49:
p. 307 - 314. 51. Abe, M., et al., Phenomenological theory of permeability in films having no in-
plane magnetic anisotropy: Application to spin-sprayed ferrite films. Journal of Applied Physics, 2006. 99(8): p. 08M907.
52. Yoshikawa, H., et al., TEM observations of magnetic domains and grain
boundaries on spin-sprayed ferrite films exhibiting high permeability usable for gigahertz noise suppressors. IEEJ Transactions on Electrical and Electronic Engineering, 2007. 2(4): p. 445-449.
53. E. C. STONER, F.R.S.A.E.P.W., A MECHANISM OF MAGNETIC HYSTERESIS
IN HETEROGENEOUS ALLOYS. IEEE, 1991. 27(4): p. 3475 - 3518.

129
54. Chinnasamy, C.N., et al., Unusually high coercivity and critical single-domain size of nearly monodispersed CoFe[sub 2]O[sub 4] nanoparticles. Applied Physics Letters, 2003. 83(14): p. 2862.
55. Liu, W., et al., Understanding the formation of ultrafine spinel CoFe2O4
nanoplatelets and their magnetic properties. Journal of Applied Physics, 2012. 112(10): p. 104306.
56. Sarkar, D., M. Mandal, and K. Mandal, Domain controlled magnetic and electric
properties of variable sized magnetite nano-hollow spheres. Journal of Applied Physics, 2012. 112(6): p. 064318.
57. R. DAY , M.F., and V.A. SCHMIDT, HYSTERESIS PROPERTIES OF
TITANOMAGNETITES: GRAIN-SIZE ANDCOMPOSITIONAL DEPENDENCE. Physics of the Earth and Planetary Interiors, 1977. 13: p. 260-267.
58. Dunlop, D.J., The rock magnetism of fine particles. Physics of Earth and
Planetary Interiors, 1981. 26: p. 1-26. 59. C. Kittel, J.K.G., Ferromagnetic Domain Theory. Solid State Physics, 1956. 3: p.
437 - 564. 60. Kittel, C., Theory of the Structure of Ferromagnetic Domains in Films and Small
Particles. Physical Review, 1946. 70(11-12): p. 965-971. 61. Diaz, R.E., Interim Report, 2007, Arizona State University. 62. Subramani, A.K., et al., A simple process for ferrite film preparation from one
solution without using hazardous oxidizing agent. Journal of Applied Physics, 2007. 101(9): p. 09M504.
63. Tamaura, M.A.Y., Ferrite-Plating in Aqueous Solution: A New Method for
Preparing Magnetic Thin Films. Journal of Applied Physics, 1983. 22(8): p. 3. 64. Subramani, A.K., et al., NiZnCo ferrite films by spin spray technique: morphology
and magnetic properties. Journal of Materials Science, 2007. 43(7): p. 2372-2376. 65. Matsushita, N., T. Nakamura, and M. Abe, Spin-sprayed Ni–Zn–Co ferrite films
with high μrʺ>100 in extremely wide frequency range 100 MHz–1 GHz. Journal of Applied Physics, 2003. 93(10): p. 7133.
66. Kawano, K., et al., The grain size effect on the magnetic properties in NiZn ferrite
and the quality factor of the inductor. Journal of Magnetism and Magnetic Materials, 2009. 321(16): p. 2488-2493.

130
67. Sebastian, T., S.A. Clavijo, and R.E. Diaz, Improved accuracy thin film
permeability extraction for a microstrip permeameter. Journal of Applied Physics, 2013. 113(3): p. 033906.
68. D. V. Sridhara Rao, K.M.a.C.J.H., TEM specimen preparation techniques.
Microscopy: Science, Technology, Applications and Education, 2010. 2: p. 1232 - 1244.
69. Lorzel, H., Contours of Wall Film Height, in FLUENT2011. 70. Herzer, G., THE RANDOM ANISOTROPY MODEL: A Critical Review And
Update. NATO Science Series II: Mathematics, Physics and Chemistry, 2005. 184: p. 15.
71. Buschow, K.H.J., Handbook of Magnetic Materials. Vol. 18. 2009, Great Britain:
Elsevier. 72. Velle, L.R., New topics in Condensed Matter Research, 2007, Nova Science
Publishers, Inc.: New York. p. 221. 73. Herzer, G., Magnetization process in nanocrystalline ferromagnets. Materials
Science and Engineering: A, 1991. 133: p. 1 - 5. 74. Ray, W.T.P.a.N.M., Thin Film ferrite Lamination Method, 2011. 75. Nielsen, S., Food Analysis2010, New York: Springer. 602. 76. Clavijo, S., Predicted permeability for a laminated spinel ferrite., 2011: Year end
report, 2011. p. Predicted permeability for a laminated 3”x3”x0.2” ferrite. The solid and dashed curves show the permeability of the laminated ferrite if cracking would be zero. The curves with symbols represent the expected permeability when a small degree of cracking is induced in the layering procedure.
77. De-Sheng, X., Bianisotropy Picture of Higher Permeability at Higher
Frequencies. Chin. Phys. Lett., 2008. 25(11). 78. Hall, J.R.J.P.S., Handbook of Microstrip Antennas. Vol. 1. 1989, London: Peter
Peregrinus Ltd. 1295. 79. Walley, S.M., Historical origins of indentation hardness testing. Materials
Science and Technology, 2012: p. 17.

131
80. Owen, J.I., Growth, Etching, and Stability of Sputtered ZnO:AI for Thin-Film Silicon Solar Cells2011, Zentralbibliothek: Forschungszentrum Jülich. 192.
81. Temperature dependence of the Hysteresis loop. 2004-2012; Available from:
http://www.doitpoms.ac.uk/tlplib/ferroelectrics/temp_dependence.php. 82. Lorzel, H., Simulation of complex permeability effects on domain, in
FLUENT2012. p. Simulations of real and imaginary permeability for single and multi-domain grains.

132
APPENDIX A
SDR SYSTEMATICS
Fig. 84. Effect of number of cycles, or rotations, on growth rate.

133
Fig. 85. Computed variable for droplet density represented as average liquid film height
[82].

134
Fig. 86. Domain size effect with crystallite size, extrapolated data from journal articles
and ASU data [54, 55].

135
Fig. 87. Laminate, L111214, developed using the thin film lamination method.