synthesis and characterization of a biocomposite derived ... · synthesis and characterization of a...
TRANSCRIPT

i
SYNTHESIS AND CHARACTERIZATION OF A
BIOCOMPOSITE DERIVED FROM BANANA PLANTS (MUSA
CAVENDISH)
Submitted in fulfillment of the requirements of the degree of Doctor of Philosophy in
Chemistry in the Faculty of Applied Sciences at the Durban University of
Technology
Vimla Paul
2015

ii
DECLARATION
This thesis is being submitted to the Durban University of Technology for the degree
of Doctor of Philosophy in Chemistry. I declare that this work is my own and has not
been submitted before for any degree or examination to this or any other university
or institution for this or any other degree or award.
________________________________
Vimla Paul
Student Number: 18551350
I hereby approve the final submission of the thesis.
Supervisor: ___________________________ Date:_______________
Professor K Kanny
Co- supervisor:__________________________ Date:________________
Professor GG Redhi

iii
ABSTRACT
Over decades synthetic composites have become an indispensable part of our lives
with their various applications such as packaging, sporting equipment, agriculture,
consumer products, medical applications, building materials, automotive industry,
and aerospace materials among others. Although these polymers have the desired
properties for the above applications, they are invariably costly. Furthermore, they
cannot be easily disposed of at the end of their useful lives and simply pile up and
cause significant damage to the environment. However, the dwindling supply of
fossil fuel, increased oil prices, together with the growing public concern of
greenhouse gas emissions and global warming, has forced scientists to search for
new development of sustainable materials from renewable resources. Hence in recent
years, there is an increased interest in biocomposite manufacturing with natural
resources as environmental issues are addressed.
The research work presented in this dissertation is to the best of the author’s
knowledge a world-first overall investigation pertaining to the concept of
synthesizing a banana sap based bio-resin (BSM) reinforced with banana fibres. In
this work the chemical composition of banana sap was determined to investigate the
chemical reactions taking place in the resin formulation.
BSM was synthesized, characterized and proposed as a potential bio-resin to be used
in the biocomposite manufacture for non-functional motor vehicle components.
BSM, a hybrid bio-resin was synthesized with equimolar quantities of maleic
anhydride and propylene glycol and 50% banana sap. A control resin without the
banana sap was also synthesized for comparison purposes. It was proposed that the
presence of sugars, esters and pthalates from the sap, determined by HPLC and GC-
MS, contributed to the cross-linking of the polymer chain. The acid value and
viscosity of BSM were determined and found to be within specification of an
industry resin. The molecular weights of the BSM and control resins were 2179 and
2114 units respectively. These were within the required molecular weight of

iv
unsaturated polyester resins. The gel and cures times of the BSM were 60% lower
than the control resin suggesting that the banana sap behaved as an accelerator for
the curing process. The lower cure time meant that using the banana sap in the
formulation was cost effective and time saving. The thermal properties of BSM
showed improved degradation temperatures and degree of crystallinity compared to
the control resin. A parametric study showed that increasing banana sap
concentration in the resin formulation led to increased tensile and flexural properties
with 50% being the optimum amount of sap to be added to the formulation.
The synthesized bio-resin and control resin were applied to biocomposites and
characterized in terms of physical, thermal, mechanical, morphological, chemical and
biodegradable properties. Mechanical tests indicated a 15 % increase in tensile
strength, 12 % improvement in tensile modulus and a 25 % improvement in the
flexural modulus, when compared to structures produced without banana sap.
Natural fibres present the challenge of poor adhesion to the matrix. Chemical
treatment of the banana fibre was done to improve on the compatibility of resin to
fibre. Fibre pull-out showed that treated fibres had a better bond than the untreated
fibre.
Parametric studies were also done to evaluate the effect of fortifying the BSM resin
with nanoclay. A 5% clay loading resulted in a 24% increase in tensile strength and
28% increase in flexural properties.
Finally biodegradation studies of the BSM bio-resin, BSM biocomposite, control
resin and control composite were investigated and compared to a positive reference,
cellulose. Results showed that over a period of 55 days the BSM biocomposite
showed 17.6% biodegradation compared to 8% with the control composite. No
difference in biodegradation between the BSM bio-resin and the control resin was
recorded. BSM biocomposite was proposed as a potential replacement to synthetic
composites that contribute to the environmental landfill problems.
The main contribution of this research is the use of the reinforcement and matrix
from the same natural source. An enriched understanding of the synthesis,

v
characterization and performance of the banana sap based bio-resin and
biocomposite for the use of non-functional motor vehicle components is the key
outcome of this investigation.

vi
PLAGIARISM
I declare that this thesis is my own work. I have appropriately referenced the work of
other people that I have used. I have not and will not allow anyone to copy my work
with the intentions of passing it as his or her own work.
___________________________________
Vimla Paul
Student Number: 18551350

vii
DEDICATION
To my parents…… you raised me up

viii
ACKNOWLEDGEMENTS
I would like to thank my Lord and Saviour Jesus Christ for giving me the wisdom
and knowledge from above to complete this thesis. You have made all things
possible for me.
My heartfelt appreciation and gratitude goes to Prof. K Kanny for introducing me to
the fascinating world of biocomposites. His continuous support and guidance is
highly appreciated.
I would like to thank my co-supervisor, Prof. G Redhi for his assistance.
My heartfelt gratitude goes to Dr Shalini Singh for her continued assistance in her
thorough editing of the thesis.
Sincere thanks goes to Dr Ajay Bissessur for all his guidance and editing of the
analytical aspect of this research.
My appreciation goes to the staff in the Department of Chemistry, Mechanical
Engineering, Biotechnology, Mathematics and Physics and the Institute of water
research who assisted me in so many ways.
I would like to place on record my sincere thanks to Dr Mohan, Dr Mithilkumar,
Avinash Ramsaroop, Avy Naicker, Jimmy Chetty and Ugan Padayachee for their
constant advice and assistance.
I would also like to thank Paul Moonsamy and Kreson Moodley from NCS resin for
their invaluable contribution to this research.
My appreciation goes to Dr Maya Jacob and Dr Sudhakar Muniyasamy from CSIR,
Port Elizabeth.
I acknowledge the financial support received from National Research Foundation
(NRF), DUT Research Department and Kentron Student Support.
Last but most important, thanks to my husband, Noah and my two daughters,
Kirvania and Gabrielle for their constant encouragement, ceaseless moral support
and continuous prayers throughout the course of my study.

ix
ABBREVIATIONS
BS - Banana sap
MA - Maleic anhydride
PG - Propylene glycol
BSM - Banana sap maleate bio-resin
HPLC - High performance liquid chromatography
GC–MS - Gas chromatography–mass spectroscopy
TA -Thermal analysis
DSC - Differential scanning calorimetry
TG - Thermogravimetry
DMA - Dynamic mechanical analysis
UV/VIS - Ultra violet/visible spectroscopy
nm - nanometre
FT-IR - Fourier transform infra-red
DCM - Dichloromethane
ASTM - American Society for Testing and Materials
XRD - X-Ray diffraction
SEM - Scanning electron microscope
ICP-AES - Inductively coupled plasma-atomic emission spectroscopy
UPR - Unsaturated polyester resin
HDT - Heat deflection temperature
MEKP - Methyl Ethyl Ketone Peroxide
UPR - Unsaturated polyester resin
SENB - Single edge notch beam
BSMF - Banana sap bio-resin + fibre
CRF - Control resin + fibre
CR - Control resin
LCA - Life cycle analysis
AFM - Atomic force microscopy

x
LIST OF FIGURES
Figure 2.1 Graph showing the effect of adding fibre to the matrix 8
Figure 2.2 Fibre- reinforced plastic composites used in 2002 9
Figure 2.3 Classification of bio-based composites 10
Figure 2.4 Natural fibre composites in the Mercedes Benz E-class 13
Figure 2.5 General mechanism of plastic biodegradation under aerobic
conditions 14
Figure 2.6 Schematic classification of reinforcing natural fibre 16
Figure 2.7 Schematic drawing of cellulose 18
Figure 2.8 Structural constitution of a material vegetable fibre cell 18
Figure 2.9 Mature local banana plants and extracted banana fibres 23
Figure 2.10 Classification of bio-based polymers 25
Figure 2.11 Structures of glucose, fructose and sucrose found in banana sap 28
Figure 3.1 Schematic diagram of research design 29
Figure 3.2 Extraction of BS from sheets of pseudostem using Pinette Emidecau
Hydraulic Press 32
Figure 3.3 Schematic diagram of the formation of polypropylene maleate resin
35
Figure 3.4 Cross-linking of polypropylene maleate with styrene monomer 36
Figure 3.5 Experimental setup for the processing of the control and BSM bio-
resin 37
Figure 3.6 Free radical formation of MEKP with Co2+ taking place during the
curing of the resin 39
Figure 3.7 Schematic diagram of VARIM technique 41
Figure 3.8 Method of vacuum infusion for BSM resin onto banana fibres 42
Figure 3.9 Viscoelastic spectrum for a typical amorphous polymer 45
Figure 3.10 Amorphous and semi-crystalline polymer morphologies 46
Figure 3.11 Schematic diagram for fibre pull-out test 50
Figure 3.12 Dimensions of SENB specimen 52
Figure 3.13 Structure of layered Montmorillonite silicate 54
Figure 3.14 Biodegradation flask for respirometric testing 57
xi
Figure 4.1 Reaction scheme showing a positive Molisch test for carbohydrates 63
Figure 4.2 HPLC analysis and quantification of carbohydrates in BS 64
Figure 4.3 HPLC analysis and quantification of carbohydrates in the condensate
65
Figure 4.4 A possible reaction scheme of the product formed when glucose is
attached to maleic acid- propylene glycol polymer backbone 66
Figure 4.5 A possible reaction scheme of the product formed when fructose is
attached to maleic acid- propylene glycol polymer backbone 67
Figure 4.6 Quantification of phenolic compounds in BS by UV/VIS 68
Figure 4.7 Gas chromatogram of the DCM extract of BS 70
Figure 4.8A Correlation of acid value and viscosity as a function of time of the
control resin 72
Figure 4.8B Correlation of acid value and viscosity as a function of time of the
BSM bio-resin 73
Figure 4.9 Consequence of cooking the resin to obtain larger molecular weights
74
Figure 4.10 Molecular weight distribution of the control and BSM bio-resin 75
Figure 4.11 Gel time and peak exotherm profile of BSM resin 78
Figure 4.12 FTIR of starting materials of the resin namely banana sap, maleic
anhydride and propylene glycol 79
Figure 4.13 FTIR scans of the BSM resin during 2, 12, 13 and 15 hours of
processing time 80
Figure 4.14 FTIR scan of an overlay of the cured control and BSM resins 81
Figure 4.15 TG of BSM and control resin showing the onset degradation
temperatures 82
Figure 4.16 Comparison of DSC curves of BSM resin and control resin 83
Figure 4.17 Dynamic DSC curves of BSM bio-resin at 5 - 20 °C/min 84
Figure 4.18 Kissinger’s and Ozawa-Flynn-Wall plots of ln q versus temperature
85
Figure 4.19 HDT curve of BSM and control resin 87
Figure 4.20 Effect of frequency on the storage modulus of BSM resin 88

xii
Figure 4.21 Variation in storage modulus (Eʹ) as a function of temperature of
BSM and control resin at 10 Hz 89
Figure 4.22 Variation in loss modulus (Eʹ) as a function of temperature of BSM
and control resins at 10 Hz 90
Figure 4.23 A plot of the tan delta of BSM and control resins as a function of
temperature at 10 Hz 91
Figure 4.24 Effect of varying concentrations of BS on stiffness 92
Figure 4.25 The effect of increasing BS concentration on stiffness compared to
control resin 93
Figure 4.26 Effect of increasing BS concentration on flexural load 94
Figure 4.27 Effect of increasing BS on flexural modulus compared to the control
resin 95
Figure 4.28 Effect of increasing concentration of BS on hardness compared to
control sample 95
Figure 5.1 SEM images of banana fibres: (A) untreated and (B) treated with 2 %
NaOH 99
Figure 5.2 A comparison of FTIR spectra of (1) untreated and (2) treated with
2% NaOH 99
Figure 5.3 Moisture absorption at 24, 48, 72 and 96 hours of BSM and control
biocomposites 103
Figure 5.4 SEM of the cross section of banana fibre showing the bundles into
which moisture can be absorbed 105
Figure 5.5 HDT curves showing the deflection temperature of BSM and control
biocomposites 107
Figure 5.6 Mass loss of BSM and control biocomposites from 200 - 500 °C 108
Figure 5.7 DSC curves of BSM and control biocomposites showing Tm and
crystallization temperatures 109
Figure 5.8 Temperature dependence of storage modulus (Eʹ) of BSM and control
biocomposites at 10 Hz 111
Figure 5.9 Temperature dependence of Loss Modulus for BSM and control
biocomposites at 10 Hz 112

xiii
Figure 5.10 Comparison of tan delta as a function of temperature of BSM and
control biocomposite at 10 Hz 113
Figure 5.11 SEM of tensile fracture surface of BSM and control biocomposite 114
Figure 5.12 Fibre pull-out test of treated and untreated fibres 115
Figure 5.13 XRD of BSM resin and BSM composite 116
Figure 5.14 Variation of tensile stress as a function of % strain of BSM and
control biocomposite 118
Figure 5.15 Variation of flexural stress as a function of strain of control and BSM
biocomposite 119
Figure 5.16 Comparison of tensile strength of BSM biocomposite at ambient and
elevated temperatures 120
Figure 5.17 Comparison of flexural strength of BSM biocomposite at ambient and
elevated temperatures 121
Figure 5.18 Images of impact damage observed for biocomposites impacted by
drop weight 123
Figure 5.19 Image of BSM biocomposite showing crack growth 124
Figure 5.20 Time dependence on crack length of control and BSM biocomposites
124
Figure 5.21 Strain energy versus time of control and BSM biocomposite 125
Figure 5.22 Creep compliance of BSM and control biocomposite as a function of
time 126
Figure 5.23 Creep data of BSM and control biocomposites showing increasing
creep (strain) as a function of time 127
Figure 5.24 Tensile strength of neat BSM resin and BSM nanocomposites infused
with different nanoclay weight 128
Figure 5.25 Effect of increasing nanoclay concentration on flexural strength of
neat BSM and BSM nanocomposites 129
Figure 5.26 The effect of increasing nanoclay concentration on the onset
temperature of TGA 130
Figure 5.27 The effect of increasing nanoclay concentration on the degradation
temperature of the DSC thermograph 131

xiv
Figure 5.28 The effect of increasing amounts of nanoclay on storage modulus of
BSM resin 132
Figure 5.29 The effect of increasing amounts of nanoclay on loss modulus of
BSM bio-resin and nanoclays 132
Figure 5.30 The effect of increasing amounts of nanoclay on damping of BSM
resin 133
Figure 6.1 Optical Microscope images of control composite samples on days 0
and 120 with 20 x magnification 136
Figure 6.2 Optical microscope images of BSM biocomposite sample from days 0
and 120 with 20 x magnification 137
Figure 6.3 Image of Aspergillus niger growth on (A) control biocomposite and
(B) BSM biocomposite sample 138
Figure 6.4 Image of zone diameter of growth measurement of dilution plating of
fungal growth on control composite and BSM composite 139
Figure 6.5 CO2 emission of BSM composite and control resin samples 140
Figure 6.6 CO2 emission of the BSMF compared to CRF after 13 days of
incubation 141
Figure 6.7 A comparison of the mass loss observed between the BSMF before
and after composting showing the onset degradation temperatures 143
Figure 6.8 FTIR overlay scan showing BSMF before (bottom scan) and after
(top scan) composting for 55 days 145
Figure 6.9 Possible reaction scheme for removal of -C=O peaks from the BSM
resin and the formation of CO2 146
Figure 6.10 SEM images of CR and BSM before and after biodegradation 147
Figure 6.11 SEM images of CRF and BSMF before and after biodegradation 148

xv
LIST OF TABLES
Table 2.1 Mechanical properties of some natural fibres 21
Table 2.2 Selected bio-resins showing their origin and uses 26
Table 3.1 Chemical and physical properties of MA and PG 30
Table 3.2 Properties of Cloisite® 30B 31
Table 3.3 Materials used for the preparation of the resins 36
Table 3.4 Percentage composition of BS in BSM 37
Table 3.5 Checklist of characterization techniques conducted in this study 43
Table 3.6 Physical and chemical properties of compost used in biodegradation
57
Table 3.7 Description of test materials used for biodegradation studies 58
Table 4.1 Physical properties of banana sap compared to water 61
Table 4.2 Elemental analysis of banana sap by ICP-AES 62
Table 4.3 Concentration of sugars present in banana sap and the condensate 64
Table 4.4 Identification of compounds extracted from BS by GC-MS 69
Table 4.5A Acid value and viscosity values of control resin 71
Table 4.5B Acid value and viscosity values of BSM bio-resin 72
Table 4.6 Specifications of the control and BSM resins 76
Table 4.7 Gel time, time to peak, cure time and peak exotherm of control resin
77
Table 4.8 Gel time, time to peak, cure time and peak exotherm of control resin
compared to BSM resin 77
Table 4.9 Crystallization temperature, melting point and enthalpy change of
control resin and BSM resin 83
Table 4.10 Heats of reaction and peak temperatures at different heating rates 85
Table 5.1 Chemical assay of banana fibres 98
Table 5.2 Chemical resistivity test on control and BSM biocomposite 102
Table 5.3 Water uptake characteristics of control and BSM composite samples
buried in nutrient rich soil 104
Table 5.4 Swelling index values of resin samples 106

xvi
Table 5.5 Apparent cross-link density values (1/Q) of resin 106
Table 5.6 Degree of crystallinity of BSM and control biocomposites 110
Table 5.7 Interlayer spacing in the neat BSM and BSM composite 116
Table 5.8A Mechanical properties of BSM and control biocomposites at ambient
temperature 119
Table 5.8B Mechanical properties of BSM and control biocomposites at ambient
and elevated temperature 120
Table 5.9 Impact energy values of test samples 122
Table 5.10 Effect of nanoclay concentration on onset and melt temperatures 130
Table 6.1 Mass loss of control and BSM biocomposite samples buried in
nutrient rich soil 136
Table 6.2 Biodegradability of composites and test materials 142
Table 6.3 Tm, enthalpy, crystallinity, onset temperature and percentage residue
of the samples at day 0 and day 55 145

xvii
TABLE OF CONTENTS
DECLARATION ......................................................................................................... ii
ABSTRACT ................................................................................................................ iii
PLAGIARISM ............................................................................................................ vi
DEDICATION ........................................................................................................... vii
ACKNOWLEDGEMENTS ...................................................................................... viii
ABBREVIATIONS .................................................................................................... ix
LIST OF FIGURES ..................................................................................................... x
LIST OF TABLES ..................................................................................................... xv
TABLE OF CONTENTS ......................................................................................... xvii
CHAPTER 1- INTRODUCTION ................................................................................ 1
1.1 Overview ...................................................................................................... 1
1.2 Purpose of the study ..................................................................................... 3
1.3 Aims and Objectives of the research ............................................................ 4
1.4 Delimitations of the study ............................................................................ 5
1.5 Structure of the thesis ................................................................................... 5
CHAPTER 2- LITERATURE REVIEW ..................................................................... 7
Introduction .............................................................................................................. 7
2.1 Biocomposites .............................................................................................. 9
2.2 Applications of biocomposites ................................................................... 12
2.3 Biodegradation of polymers ....................................................................... 13
2.4 Natural fibres .............................................................................................. 15
2.4.1 Structure and composition of natural fibres ........................................... 17
2.4.2 Factors affecting natural fibres in composite applications ..................... 19
2.4.2.1 Moisture absorption in fibres ......................................................... 19
2.4.2.2 Fibre treatment ............................................................................... 20
2.4.3 Properties of natural fibres ..................................................................... 20

xviii
2.4.4 Banana fibres .......................................................................................... 21
2.5 Matrices in biocomposites ......................................................................... 23
2.5.1 Thermosetting Polymers ........................................................................ 23
2.5.2 Polyester chemistry ................................................................................ 24
2.5.3 Properties of polymers ........................................................................... 24
2.6 Bio-based matrix systems .......................................................................... 25
2.7 Banana sap ................................................................................................. 27
2.8 Summary .................................................................................................... 28
CHAPTER 3 - RESEARCH METHODOLOGY AND RESEARCH DESIGN ....... 29
Introduction ............................................................................................................ 29
3.1 Materials ..................................................................................................... 30
3.2 Experimental Design and methodology ..................................................... 32
3.2.1 Extraction of BS and BF ........................................................................ 32
3.2.2 Chemical composition of banana sap ..................................................... 33
3.2.3 Chemical composition of banana fibre .................................................. 34
3.2.4 Chemical treatment of banana fibre ....................................................... 34
3.3 Resin preparation ....................................................................................... 34
3.3.1 Preparation of control and BSM bio-resin ............................................. 36
3.3.2 Dilution of bio-resin ............................................................................... 38
3.3.3 Curing of bio-resin ................................................................................. 39
3.4 Preparation of biocomposite ...................................................................... 40
3.4.1 Vacuum assisted resin infusion moulding (VARIM)............................. 41
3.5 Characterization techniques and basic procedures ..................................... 42
3.5.1 Fourier transform infrared spectroscopy (FTIR).................................... 43
3.5.2 Thermal analysis (TA) ........................................................................... 44
3.5.3 Heat distortion ........................................................................................ 45
3.5.4 Dynamic Mechanical Analysis (DMA) ................................................. 45

xix
3.5.5 X-Ray Diffraction analysis (XRD) ........................................................ 46
3.5.6 Scanning Electron Microscope (SEM)................................................... 47
3.5.7 Water absorption .................................................................................... 47
3.5.8 Swelling tests ......................................................................................... 48
3.5.9 Chemical resistivity tests........................................................................ 49
3.6 Mechanical properties ................................................................................ 49
3.6.1 Tensile properties ................................................................................... 50
3.6.2 Flexural properties ................................................................................. 50
3.6.3 Fibre pull-out tests ................................................................................. 50
3.6.4 Impact tests............................................................................................. 51
3.6.5 Hardness tests ......................................................................................... 51
3.6.6 Fracture toughness: Single Edge Notched Bend (SENB) ...................... 51
3.6.7 Creep tests .............................................................................................. 53
3.7 Hybrid polymers (with nanoclays) ............................................................. 53
3.8 Biodegradability tests ................................................................................. 54
3.8.1 Soil burial tests ....................................................................................... 55
3.8.2 Microbial growth tests............................................................................ 55
3.8.2.1 Growth measurement: Dilution Plating ......................................... 55
3.8.2.2 Growth measurement: Suspension Culture .................................... 56
3.8.3 Respirometric tests ................................................................................. 56
3.9 Summary .................................................................................................... 60
CHAPTER 4– RESULTS AND DISCUSSION: THE SYNTHESIS AND
CHARACTERIZATION OF THE BIO-RESIN FROM BANANA SAP ................. 61
Introduction ............................................................................................................ 61
4.1 Characterization of banana sap .................................................................. 61
4.1.1 Physical testing of BS ............................................................................ 61
4.1.2 ICP-AES analysis of BS ........................................................................ 62

xx
4.1.3 Qualitative and quantitative analysis of carbohydrates .......................... 62
4.1.4 Analysis of phenolic compounds ........................................................... 67
4.1.5 GC-MS analysis of banana sap .............................................................. 68
4.2 Synthesis of control and BSM resins ......................................................... 70
4.3 Characterization of control and BSM resins .............................................. 75
4.3.1 Physical testing ...................................................................................... 75
4.3.2 Gel time, time to peak, cure time, peak exotherm ................................. 76
4.3.3 Adjustment of stability and gel time ...................................................... 78
4.3.4 FT-IR analysis of BSM and control resin .............................................. 79
4.3.5 Thermal analysis (TA) of BSM and control resins ................................ 81
4.3.6 Kinetic studies on BSM and control resins ............................................ 83
4.3.6.1 Dynamic kinetic analysis ............................................................... 84
4.3.7 Heat distortion temperature (HDT) ........................................................ 86
4.3.8 Dynamic Mechanical Analysis (DMA) ................................................. 87
4.3.9 Mechanical properties of control and BSM resin .................................. 91
4.4 Summary .................................................................................................... 96
CHAPTER 5 –RESULTS AND DISCUSSION: SYNTHESIS AND ANALYSIS OF
BIOCOMPOSITE ...................................................................................................... 97
Introduction ............................................................................................................ 97
5.1 Banana fibres .............................................................................................. 97
5.1.2 Chemical analysis of banana fibres ........................................................ 97
5.1.3 Chemical treatment of banana fibre ....................................................... 98
5.1.4 FT-IR analysis of untreated and treated fibre ........................................ 99
5.2 Analysis of biocomposite ......................................................................... 101
5.2.1 Chemical resistivity tests...................................................................... 101
5.2.2 Water absorption behaviour ................................................................. 102
5.2.3 Swelling index and cross-link density determination .......................... 105

xxi
5.2.4 Heat distortion temperature (HDT) ...................................................... 107
5.2.5 Thermal analysis .................................................................................. 108
5.2.6 Dynamic Mechanical Analysis (DMA) ............................................... 110
5.2.6.1 Storage Modulus (Eʹ) ................................................................... 110
5.2.6.2 Loss Modulus (Eʺ) ....................................................................... 111
5.2.6.3 Damping Factor (Tan Delta) ........................................................ 112
5.2.7 Scanning Electron Microscopy (SEM) ................................................ 113
5.2.8 Fibre pull-out tests ............................................................................... 114
5.2.9 X-Ray Diffraction analysis .................................................................. 115
5.2.10 Mechanical properties of biocomposite ........................................... 117
5.2.11 Tensile and flexural tests at ambient and elevated temperatures ..... 119
5.2.12 Impact tests....................................................................................... 122
5.2.13 Fracture toughness of biocomposite material .................................. 123
5.2.13.1 Single edge notch beam test ..................................................... 123
5.2.14 Creep tests ........................................................................................ 126
5.3 Nanoclay infusion in resin and biocomposite .......................................... 128
5.3.1 Mechanical analysis ............................................................................. 128
5.3.1.1 Tensile tests .................................................................................. 128
5.3.1.2 Flexural tests ................................................................................ 129
5.3.2 Thermal analysis .................................................................................. 130
5.3.3 Dynamic Mechanical Analysis ............................................................ 131
5.4 Summary .................................................................................................. 133
CHAPTER 6 –RESULTS AND DISCUSSION: BIODEGRADATION STUDIES
OF BSM BIO-RESIN AND BIOCOMPOSITE ...................................................... 135
Introduction .......................................................................................................... 135
6.1 Results ...................................................................................................... 135
6.1.1 Soil burial tests ..................................................................................... 135
6.1.1.1 Microscopic evaluation of biodegraded samples ......................... 136

xxii
6.1.2 Fungal growth test ................................................................................ 137
6.1.3 Respirometric tests ............................................................................... 139
6.1.3.1 Thermal analysis .............................................................................. 143
6.1.3.2 FTIR analysis ............................................................................... 145
6.1.3.3 SEM analysis ................................................................................... 146
6.2 Summary .................................................................................................. 148
CHAPTER 7 - CONCLUSIONS AND RECOMMENDATIONS .......................... 150
Summary .............................................................................................................. 150
7.1 Recommendations for future work........................................................... 151
7.1.1 Renewable precursors for bio-resin formulation.................................. 151
7.1.2 Consistent quality of biocomposite/ speed of production .................... 152
7.1.3 Fibre-matrix interfacial adhesion of BSM bio-resin and banana fibres152
7.1.4 Fibre loading in the biocomposite ........................................................ 152
7.1.5 Effect of nanoclay in the bio-resin ....................................................... 153
7.1.6 Biodegradability predictions ................................................................ 153
REFERENCES ......................................................................................................... 154
APPENDICES ......................................................................................................... 168
Appendix A3.1 ..................................................................................................... 168
Appendix A3.2 ..................................................................................................... 170
Appendix A3.3 ..................................................................................................... 171
PUBLICATIONS ....................................................... Error! Bookmark not defined.

1
CHAPTER 1- INTRODUCTION
“Persistence of plastics in the environment, the shortage of landfill space, the
depletion of petroleum resources, concerns over emissions during incineration,
and the entrapment by and ingestion of packaging plastics by fish, fowl and
animals have spurred efforts to develop biodegradable/bio-based plastics.”[1]
This thesis is concerned with the study involving the formulation of a bio-composite
with a banana sap based bio-resin (referred to as BSM) as the matrix and banana
fibres as the reinforcement to replace traditional composites. The thesis gives a brief
overview to bio-based composites. It is followed by the introduction of the context of
the work, the overall objectives of the study, the delimitations, scope and finally the
structure of the thesis.
1.1 Overview
Over decades synthetic composites have become an indispensable part of our lives
with their various applications such as packaging, sporting equipment, agriculture,
consumer products, medical applications, building materials, auto-industry and
aerospace materials among others. Although petroleum derived polymers (namely,
vinyl ester, polyester and epoxy) have the desired properties for the above
applications, they are invariably costly. These traditional synthetic resins are also
unsustainable as petroleum resources are being depleted [1, 2]. Furthermore, they
cannot be easily disposed of at the end of their useful lives and simply accumulate
causing significant damage to the environment. The occurrence of plastics in the
environment, the lack of landfill space, CO2 emission during incineration of the
plastics and the ingestion and entrapment hazards has created an enormous
environmental impact [1]. There is therefore an increasing urgency to develop bio-
based products that can ease the widespread dependence on fossil fuels. The use of
natural fibres and natural bio-based resin systems for the production of bio-
composites has been pursued by researchers worldwide as they address
environmental concerns [3, 4]. These new bio-based materials are used for

2
construction, furniture, packaging and automotive components [5]. Furthermore,
according to the European Union’s directive on end-of-life vehicles, from 2015
onwards, all new vehicles should be 85% reusable and recyclable by weight, 10%
can be used for energy recovery and only 5% can be used in landfills [6]. Japan has
stipulated similar stringent legislation requiring 88% of a vehicle to be recovered in
2005 and 95% by 2015 [7]. These concerns and new legislations have forced the
development of environmentally friendly bio-based and biodegradable polymers and
their composites in recent years [8]. The composite manufacturing industry is thus
searching for an alternative plant based natural fibre reinforcement source which
could be derived from flax, hemp, kenaf, jute, sisal, pineapple and banana fibre that
will not burden the environment [9]. These materials ought to perform their function
sufficiently, and also need to decompose in the environment with time thereby
addressing the landfill and CO2 emission problems.
In order to reduce the environmental impact, synthetic resins can be replaced with
more “green” alternatives. For example, they can be sourced from soybean, tung oil,
corn and sugar cane and processed as natural thermosetting polymers or natural
resins [10-13]. Numerous studies have been done on natural resins in combination
with natural fibres to create this desired polymer [13-15]. However, no reports have
been found where the bio-resins and fibres are from the same source as outlined in
this study.
Over the last decade there has been a significant increase in research on the
replacement of synthetic fibres with natural fibres as reinforcement in plastic
composites especially in the auto-industry [1, 16-19]. The use of natural fibres has
the advantages of its non-abrasive behaviour, biodegradability, low energy
consumption and low cost. Furthermore, natural fibres have been extensively used as
reinforcements with polymeric matrices [20].
In the quest to utilize the natural resources of South Africa to address this situation, it
was found that among all the natural resources, banana fibre and plant research was
relatively new and unexplored. In Kwa-Zulu Natal, South Africa, there is an
abundance of banana plants that grow within 2 to 3 years and once the fruit is

3
harvested the plant is thereafter unused and regarded as waste. Currently there is no
information available locally on how much of banana sap and fibre is left over as
waste annually. However, a study in Kolkata, India estimated this to be 60-80 t/ha of
biomass residue [21].
Studies by Satyanarayana and co-workers show that banana fibres can be a good
choice for reinforcement in composites [22]. Banana fibres are used in many types of
synthetic and bio-based polymers. Since the intention of this study is to derive the
matrix and reinforcement from the same plant source, it was then decided to utilize
the banana sap in the formulation of the resin, and the banana fibre as the
reinforcement. It is also significant to note that this bio-composite is produced from
agricultural waste. To the best of our knowledge, there have been no reports of a
banana sap based bio-resin reinforced with banana fibres.
Natural fibre-reinforced composites, also known as bio-composites, could also be
used in the plastic industry, auto-industry and packaging industry to reduce material
costs [17]. The automobile industry applies bio-composites in a variety of interior
and exterior applications such as door and instrument panels, glove-boxes, arm rests,
seat backs and package trays [23]. There are some biologically derived polymers that
are used in car tyres, biomedical applications, clothing fibres and packaging [24].
The significant weight saving, the ease of production, and the low cost of the
reinforcement and matrix have made natural fibre reinforced composites an attractive
alternate material to glass fibre reinforced composites.
1.2 Purpose of the study
The purpose of this study was to synthesize a bio-derived, bio-based resin using
banana sap as a starting material; to prepare a bio-composite reinforced with non-
woven banana fibres and to examine the potential mechanical, chemical and
morphological properties of the bio-composite.

4
1.3 Aims and Objectives of the research
The aim of this research was to develop a bio-resin from banana sap, using
banana fibres as the reinforcement and thus forming a bio-degradable bio-
composite which can be used for non-functional components in the automotive
industry and is compliant with respect to the new legislation implemented by the
EU.
The following specific research objectives were targeted:
1. To identify the chemical composition of the extracted banana sap from the
pseudostem of a banana plant.
2. To synthesize and characterize a natural resin system using the sap of the
banana plant in the resin formulation. To study the cure behaviour of the
banana sap based bio-resin.
3. To extract the banana fibre from the plant and to treat the fibre to improve
adhesion in the matrix.
4. To reinforce the banana fibre with banana sap based bio-resins using vacuum
infusion.
5. To use analytical techniques such as Inductively coupled plasma-atomic
emission spectroscopy (ICP-AES), High performance liquid chromatography
(HPLC), Gas chromatography-mass spectrometry (GC-MS), Scanning
electron microscopy (SEM), Fourier transform infra-red (FT-IR), Dynamic
mechanical analysis (DMA), Differential scanning calorimetry (DSC) and
Thermogravimetric analysis (TGA) to characterise the sap, bio-resin and bio-
composite.
6. To determine the mechanical properties of the neat bio-resin and the
biocomposite. To fortify the bio-resin with nanoclays and study the
mechanical and thermal properties thereof.
7. To study the biodegradable nature of the biocomposite.

5
1.4 Delimitations of the study
Only banana plants collected from Durban, Kwa-Zulu Natal will be used.
The bio-resin produced is not a 100% “green bio-resin”.
The fibres are hydrophobic making compatibility with the bio-resin difficult.
To overcome this problem, the fibre will be treated before mixing with the
bio-resin.
In this study only 30% fibre loading will used for the manufacture of the
biocomposite.
1.5 Structure of the thesis
The thesis is divided into 7 chapters. This chapter provides a background to the study
by detailing the replacement of traditional composites with bio-composites. It also
gives the aims and objectives of the study and the delimitations.
Chapter 2 presents a comprehensive literature review outlining fibre reinforced
polymer (FRP) composites followed by the use of biocomposites to address the
environmental issues at hand. This chapter makes reference to the current status of
natural fibre or bio-composite research with emphasis on bio-based thermosetting
polymers. A review of natural fibres is also presented, in particular banana fibres: its
origin and uses are reported. The chapter concludes with a review of research in the
development of bio-composites and its applications.
Chapter 3 details the research design and methodology of the study. This chapter
includes the detailed description on the synthesis of two resins, namely 1) the bio-
resin made with banana sap and 2) control resin without the banana sap. In addition,
a description of the two biocomposites that were manufactured, namely the BSM
biocomposite and the control biocomposite is outlined.

6
Chapter 4 reports on the chemical composition of the banana sap and its function in
the formulation of the bio-resin1. Firstly, a detailed description of the chemical and
physical properties of the banana sap by various analytical techniques namely ICP,
HPLC and GC-MS is presented. A parallel comparison is drawn to a control resin
without the banana sap for all the analyses. A detailed description of the chemical,
physical and mechanical properties of the bio-resin is presented.
Chapter 5 discusses the chemical composition of the banana fibres and addresses the
hydrophilic property of the fibre by chemical treatment, and the synthesis and
characterization of the bio-composite. A comparative study on the chemical, physical
and thermo-mechanical properties of the biocomposite between the BSM bio-
composite and the control composite2 is given. The latter part of Chapter 5 reports on
the effect of nanoclay infusion with the bio-resin and the resultant properties. The
mechanical, thermal and dynamic mechanical properties of the nanoclay infused bio-
resin and biocomposite is given.
Chapter 6 presents the study of the biodegradation of the bio-composites.
Biodegradation tests conducted with the fungal growth of Aspergillis Niger on the
biocomposite and soil burial test is detailed. To verify the biodegradation of the
composite material, respirometric testing was conducted over a period of 55 days to
measure the conversion of organic carbon into carbon dioxide.
Chapter 7 will provide conclusions based on major findings obtained in Chapters
Four to Six. Recommendations and areas for future work based on this thesis are also
presented.
1 Extracts from Chapter 4 have been published as “Formulation of a novel bio-resin from banana sap”,
Industrial Crops and Products, 43, (2013), 496-505.
2 Extracts from Chapter 5 have been published as “Mechanical, thermal and morphological properties
of a bio-based composite derived from banana plant source”, Composites Part A, 68, (2015), 90-100.

7
CHAPTER 2- LITERATURE REVIEW
This chapter deals with literature review of both traditional composites and
biocomposites. It is structured into three main sections namely the matrix,
reinforcement (natural fibres), and the bio-composite. The first section describes
various sources, uses and synthesis of bio-based resins. The second section describes
the different natural fibres, their classification and structure as well as various bio-
resins. Finally a description of the bio-composites is given.
Introduction
Composite material have been used for centuries dating back to about 2500 years ago
where the Egyptians used straw and clay in composite systems to build walls [25].
The rapid development and use of composites led to an increased production of
synthetic composites dating back to 1940 [26, 27].
Over the last several decades, there has been an increased use of composite material
in the auto industry, sports industry, civil engineering and construction industries and
these industries exploit the advantages of the composite materials. Karbhari reasons
that there are many benefits associated with using fibre reinforced polymers, such as
lightweight properties, ease of construction and corrosion resistant features [28].
Matthews and Rawlings further argue that composites possess very high strength-to-
weight and stiffness-to-weight ratios that has made them attractive to the aviation
industry and recently in the sports and leisure industry [27].
Composites are lightweight, strong, stiff material made from two or more
constituents with significantly different physical or chemical properties that when
combined, produce a material with characteristics different from the individual
components [29]. There are two main categories of constituent materials: matrix
(polymer) and reinforcement (fibre) and the interaction of the combined constituents
ensure the final composite material has superior material properties for the required

8
application. Figure 2.1 shows the cumulative effect of adding fibres to the matrix
forming the composite.
Figure 2.1: Graph showing the effect of adding fibre to the matrix
These versatile materials are used in many diverse fields, from surf boards to guitars,
motor vehicle components to microlight aircrafts, and electronic components such as
printed circuit boards and electrical contacts [1, 30]. Glass fibres have been the
dominant fibre and are used in 95% of cases to reinforce thermoplastics and
thermoset composites. The fibre-reinforced composites market (Figure 2.2) is a
multibillion-dollar business [31] and 31% of this market is dominated by the
automotive industry using natural fibre-based materials. Furthermore, Thomas and
Pothan reported that the automotive industry were the forerunners in changing from
conventional to biocomposite material which will be highlighted in the next section
[32].

9
Figure 2.2: Fibre - reinforced plastic composites used in 2002 [33]
2.1 Biocomposites
Broadly defined, biocomposites as shown in Figure 2.3 are composite materials made
from natural or biofibre and non-biodegradable polymers such as polypropylene
(PP), polyethylene (PE) and epoxies, or with biopolymers such as polylactic acid
(PLA) and polyhydroxyalkanoates (PHAs) [1, 34]. The biocomposite made in this
study was classified as eco-friendly and “green” since natural fibre and a renewable
resource-based polymer were used.

10
Figure 2.3: Classification of bio-based composites [1]
Several researchers have contributed to the knowledge of biocomposites. For
instance, Thomas and Pothan present a book on natural fibre reinforced polymer
composites. In particular, natural fibre-surface modification, nanocomposites based
on natural fibres and fibre reinforced rubber composites to name a few are discussed
in detail [32]. A number of high quality chapters have been included in the book.
Meier et al. reviewed plant oil renewable resources as green alternatives with
emphasis on using plant oils as raw materials for monomers and polymers [35].
Puglia et al. reviewed natural fibre based composites with emphasis on natural fibres
with matrices ranging from thermosets, thermoplastic and biodegradable
biocomposites [36]. John and Thomas reviewed various aspects of biofibres and
biocomposites in their review article [37] where they classified biocomposites into
green, hybrid and textile and highlighted the applications of these biocomposites.
Finally, they discuss that the material revolution of this century may be provided by
the green composites.
Although very little reviews have been found on banana fibre with natural-based bio-
resins, research is growing with regards to banana fibre as reinforcement with

11
synthetic resin especially unsaturated polyester resin, which is the type of resin used
in this study.
Several researchers have used banana fibres as reinforcements. Indira et al. found
that a 30% banana fibre content reinforced in a phenol formaldehyde (PF) resin by
resin transfer moulding, gave a maximum tensile strength of 24 MPa and flexural
strength of 44 MPa [38]. Joseph et al. compared two composites (banana fibre/PF
and glass/PF) and they reported that the tensile strength was 26 MPa for the banana
fibre/PF at 45% fibre loading and 13 MPa for the latter at 25% fibre loading [39].
In another study, Lui et al. used banana fibres in a high density polyethylene/nylon-6
blend matrix and found that the tensile and flexural strengths of a 29.3% fibre
loading were 25.5 MPa and 31.7 MPa respectively [40]. In addition, Singh et al.
found that 10% banana fibre reinforced with a silica powder gave the tensile and
flexural strengths of 27.6 MPa and 29.6 MPa respectively [41]. Furthermore, Pothan
et al. reinforced banana fibres with 30% fibre loading in a polyester resin and they
found that the tensile and flexural strengths were 47.6 MPa and 53.5 MPa
respectively [42].
Pothan and co-workers reported on the dynamic mechanical analysis of different
fibre loading of banana fibre reinforced polyester composites [3]. In addition,
Savistano reported on the mechanical properties of Kraft pulp made from waste sisal
and banana fibres reinforced cement composites [43]. They reported that the
composites had flexural strength of 20 MPa and fracture toughness values in the
range 1.0-1.5 kJ.m-2
. The afore mentioned researchers have used banana fibre in a
synthetic resin system compared to a natural/hybrid resin system used in the current
study and the results that they reported are similar to what was obtained in this thesis.
Majhi et al. made a biocomposite of polylactic acid and banana fibre at 30% fibre
loading and they reported that a tensile strength of 35 MPa was possible for a natural
fibre/natural resin system [44].
It will be shown in Chapter 5 that the strength of the biocomposite produced in this
study compares well to the work of other researchers.

12
2.2 Applications of biocomposites
Biocomposites have various uses such as household appliances, housing,
construction, medical, aerospace, automotive among others.
The applications of natural fibre composites are greatly concentrated in the interior
of passenger cars and truck cabins. They are used in door panels, cabin linings and
for thermo-acoustic insulation. The natural fibre composites can be a very cost
effective material for the following applications: interior of automotive vehicle,
furniture, building and construction industry, toys, lampshades, suitcases, helmets,
electrical devices among others [45].
Many European industries are eco-driven; especially the European automotive
industry which is trying to make every component recyclable [46, 47]. Leao et al.
reported that the tensile strength of caraua, jute, sisal and ramie with polypropylene
biocomposites used in the automotive industry were 46 MPa, 16 MPa, 23 MPa and
34 MPa at 50% fibre loading respectively [48]. According to Luz et al. sugarcane
bagasse-reinforced composites used for aesthetic covering inside a motor vehicle
results in lower environmental impacts and are lighter when compared to talc-filled
composites [49]. Alves and co-workers replaced glass fibres with jute fibres to
produce a structural frontal bonnet of an off-road vehicle (Buggy) [5]. They showed
that the jute fibre composites, being lighter in weight, reduced fuel consumption
hence enhanced the environmental performance of the buggy. Shih and Huang found
that the mechanical properties and thermal stability were enhanced when banana
fibres were mixed by melt blending with polylactic acid (PLA) compared to the
virgin PLA [50]. They concluded that the incorporation of banana fibres can reduce
production cost while meeting demands of environmental protection agencies.
Due to its good compatibility and bonding with resin matrix, banana fibre is
considered as an effective reinforcing constituent in both natural and synthetic resin
systems [51].

13
Daimler- Chrysler has used flax and hemp instead of glass fibres [46]. Mercedes-
Benz and Toyota have also incorporated the uses of natural fibre into composites [6].
Thomas Schuh reported that when flax/sisal fibre mat embedded in an epoxy resin
matrix was used for door panels of Mercedes-Benz E-Class, a 20 % weight reduction
was achieved, and the mechanical properties were improved [52]. The distribution of
these composites throughout the vehicle is shown in Figure 2.4.
Figure 2.4: Natural fibre composites in the Mercedes Benz E-class [52]
2.3 Biodegradation of polymers
An important function of biocomposites in automotive components is that it must
biodegrade after its end of life.
Biodegradability is defined as the degradation results from the action of naturally-
occurring microorganisms such as bacteria, fungi and algae (according to ASTM
D6400-99) [53, 54]. A compostable plastic is one that undergoes degradation by
biological processes during composting to yield CO2, water, inorganic compounds
and biomass and leaves no visible, distinguishable or toxic residue. The consumption
of oxygen or the formation of CO2 is also a good indicator of polymer degradation
[55, 56].

14
Smith classified biodegradable polymers according to their chemical composition,
synthesis method, processing method, economic importance, application among
others [57]. Furthermore, these polymers can be obtained from natural resources, or
they can be synthesized from crude oil [53, 57]. Biodegradation of polymers can be
monitored by visual observations (roughening of the surface, formation of holes or
cracks, defragmentation, changes in colour or formation of biofilms on the surface.
Degradation mechanism can be obtained by scanning electron microscopy (SEM) or
atomic force microscopy (AFM).
Polymers are potential substrates for heterotrophic microorganisms such as bacteria
and fungi. According to Muller [54], microorganisms are unable to transport
polymeric material directly to the cells but must first eliminate enzymes, which
depolymerize the polymers outside the cells as illustrated in Figure 2.5 to produce
water, carbon dioxide and methane, together with new biomass as bi-products.
Laboratory test for biodegradation involves the use of synthetic media and
inoculation with either a mixed or individual microbial strains. In such tests, the
activity of the mircoorganisms is observed.
Figure 2.5: General mechanism of plastic biodegradation under aerobic
conditions [54]

15
The objective is to design polymers that will serve its purpose and use and thereafter
undergo destruction by a stimulus of the environment, such as microbial, hydrolytic,
oxidative or catalytic [58]. More importantly, the breakdown products should not be
toxic or persist in the environment.
Gautam identified many uses of biodegradable polymers such as packaging (food
containers, wraps, nets, foams), plastic bags (super market carrier bags), catering
products (cutlery, plates, cups), agriculture (mulch films, plant pots, nursery films),
hygiene products and medical and dental implants [58].
It is important to note that the biodegradation of the biocomposite is caused by the
natural fibres and the bio-resin system. The next sections deal with these two
components.
2.4 Natural fibres
The use of natural fibres dates back to at least 5500 years ago when ancient
Egyptians pressed thin stems of papyrus on which to write [59]. There are about
2000 species of fibres in various parts of the world used for various applications,
classified into three major types as animal fibres, vegetable fibres and mineral fibres.
A broad classification of vegetable fibres [1] is represented schematically in Figure
2.6 with banana fibres classified as a leaf fibre.

16
Figure 2.6: Schematic classification of reinforcing natural fibre [1]
Although natural fibres were used in composites for many years, synthetic fibres
such as glass and carbon fibres were preferred due to their high strength-to-weight
ratios, easy mouldability and durability [32]. The automotive industry is under
tremendous pressure to utilize natural fibres for the manufacture of the components
such as door panels, headliners, package trays, dashboards and trunk-liners.
Lightweight parts are produced from natural fibre composites, consequently reducing
fuel consumption. Furthermore, natural fibre composites aids in improved recycling
possibilities, hence reducing the waste disposal predicament.
The advantages of natural fibres listed below renders it a potential replacement for
synthetic fibres in composites [46, 60-62]:
Readily available, abundant, low density, low cost and biodegradable.
Plant fibres are obtained from renewable resources. Low energy is required
during production and show carbon dioxide neutrality.
Natural organic products. There is no dermal issue for their handling
compared to glass fibres and do not pose a bio-hazard upon disposal.
Natural fibres are non-abrasive and exhibit great formability.

17
Light in weight (less than half the density of glass fibres).
Cheap compared to glass fibres.
Exhibit good thermal insulating and acoustic properties due to their hollow
tubular structures.
However natural fibres have the disadvantages of low modulus, high moisture
absorption, decomposition in alkaline environment or in biological attack, and
variability in mechanical and physical properties. To overcome the high moisture
absorption problem, the fibres need to be chemically treated, which will be discussed
later in section 2.4.2.2.
2.4.1 Structure and composition of natural fibres
All plant fibres are composed of cellulose and are stronger and stiffer than animal
fibres. Since they are more suitable for use in composite material, this study will
focus on plant fibres. Biofibres are hollow cellulose fibrils held together by lignin
and hemicellulose [63]. The main components of natural fibres are cellulose, hemi-
cellulose, lignin, pectin and waxes [37, 47, 61, 64].
Cellulose is regarded as the most abundant polymer in nature that is found in plants,
green algae and some bacteria [65]. Cellulose is a linear, high molecular weight
polymer that can be described as natural, renewable and biodegradable [66].
Cellulose is a natural polymer consisting of 1,4-β-D- anhydroglucose (C6H11O5)
repeating units joined by 1,4-β-D-glycosidic linkages at C1 and C4 position, in which
each single unit contains three hydroxyl groups as shown in Figure 2.7 [67, 68]. The
hemicellulose is responsible for the biodegradation, moisture absorption and thermal
degradation of the fibre. It is made up of polysaccharides composed of a combination
of 5- and 6 carbon ring sugars.
Lignin is a complex hydrocarbon polymer with both aliphatic and aromatic
constituents. Lignin, an amorphous polymer is thermally stable but is responsible for
UV degradation. It is a complex three-dimensional copolymer of aliphatic and
aromatic constituents of very high molecular weight [37, 67]. Pectin, whose function
is to hold the fibre together, is a polysaccharide like cellulose and hemicellulose. The
mechanical strength of the plant fibre is related to the distribution of lignin between

18
hemi-cellulose and cellulose, causing binding and stiffening of the plant fibers to
occur.
Figure 2.7: Schematic drawing of cellulose [69]
A single fibre has a diameter of approximately 10-20 µm. The microstructure of
natural fibres is made up of different hierarchical structures as shown in Figure 2.8.
Each fibre cell is made up of four concentric layers i.e. primary wall, outer secondary
wall, middle secondary wall and inner secondary wall.
Figure 2.8: Structural constitution of a material vegetable fibre cell [70]

19
As mentioned earlier cellulosic fibres have the disadvantage of absorbing moisture.
One way of overcoming this is to chemically treat the fibres to promote better
adhesion to the matrix. Pretreatment of fibres can clean the fibre surface, reduce the
moisture uptake and increase the surface roughness.
2.4.2 Factors affecting natural fibres in composite applications
Although natural fibres has some advantageous properties, they also have the
drawback of forming aggregates during processing, variation in fibre quality due to
the natural processes affecting growth, thermal instability and low resistance to
moisture absorption [61, 71]. Although variation in fibre quality is a serious
delimitation, banana fibre is an agricultural waste product which is available all year
round. The banana plant (genus Musa Cavendish), is an annual herbaceous plant, and
has been suggested as a suitable crop for bio-composite applications [72-74]. These
characteristics lead to poor matrix-fibre compatibility and therefore compromise
overall composite performance. In this study, these limitations have restricted the
application of natural fibre biocomposite to the interior components of the motor
vehicle.
2.4.2.1 Moisture absorption in fibres
The absorption of moisture by biocomposites decreases their mechanical properties
[75-77]. It was found that moisture absorption of pineapple-leaf fibre reinforced low
density polyethylene (LDPE) composites increased linearly with fibre loading [78].
Stark (2001) reported that wood flour-polypropylene (PP) composites with 20%
wood flour reached equilibrium after 1500 hours in a water bath and absorbed only
1.4% moisture while composites with 40% loading reached equilibrium after 1200
hours and absorbed 9% moisture [76]. Factors such as fibre concentration, size and
shape affect moisture absorption in composites [79].
If the reinforcement does not properly adhere to the matrix, it does not add strength
to the composite. Therefore, different fibre treatment methods have been invented to
(i) obtain an efficient hydrophobic barrier and (ii) minimize their interfacial energy
with the non-polar polymer matrix and improve adhesion between biofibres and the

20
matrix [68, 77]. Several authors [62, 71, 80, 81] have suggested various chemical
treatments of natural fibres to improve adhesion between the fibre and matrix.
2.4.2.2 Fibre treatment
The interaction and adhesion between the fibre and the matrix have a noteworthy
effect on the mechanical and physical properties of the fibre composites. To ensure
good compatibility, treatment of the fibres has been attempted. These reagents
contain reactive functional groups that modify the fibre making them hydrophobic
and improves interfacial adhesion between the fibre and matrix [82].
Bogoeva‐Gaceva investigated various chemical treatments of fibres such as
dewaxing, mercerization, bleaching, cyanoethylation, silane treatment, benzoylation,
peroxide treatment, isocyanate treatment, acrylation, latex coating and steam-
explosion [60]. Furthermore, Nassif used 10% NaOH to chemically treat banana
fibres and reported that the dielectric strength and thermal conductivity increased by
29% and 139% respectively [83]. Li et al. suggested that alkaline treatment was one
of the most-used classical treatments that partially removes lignin, wax and oils
from the fibre cell wall [62]. Therefore this research focused only on alkali treatment
of the fibres. Moreover, Herrera and George et al. explain that the purpose of the
alkaline treatment was to increase the surface roughness and the amount of cellulose
exposed on the fibre surface, resulting in better mechanical interlocking and
increased number of reaction sites [68, 78]. Hydrogen bonding broken in the
network structure increases the surface roughness. The fibre treatment therefore
improves the bonding strength between the fibre and the matrix which is of utmost
importance in the formation of composites [84]. This bonding strength is determined
by measuring the force required to pull out a fibre embedded in the matrix. Single
fibre test can be used to measure interfacial properties such as interfacial shear
strength and frictional stress [85].
2.4.3 Properties of natural fibres
The mechanical properties of natural fibres are much lower when compared to
synthetic fibres as shown in Table 2.1. However, properties such as density, stiffness

21
and elongation render plant fibres comparable to values of E-glass, Kevlar and
carbon, making them suitable replacements in composites [1]. In particular banana
fibre has comparable density and elongation to break. Plant fibres have low
elongation to break compared to thermoplastics, however they have much higher
tensile strength and stiffness [34]. The principal benefits of using plant fibres in
composites are to reduce costs, improve tensile strength, stiffness or other
mechanical properties and finally to make the composite “greener” [34].
Table 2.1: Mechanical properties of natural fibres as compared to conventional
reinforcing fibres [1, 17, 62]
Fibre Density/
(g/cm3)
Elongation/
(%)
Tensile
strength/
(MPa)
Young’s
Modulus/
(GPa)
Cotton 1.5-1.6 3.0-10.0 287-597 5.5-12.6
Jute 1.3-1.46 1.5-1.8 393-773 10-30
Flax 1.4-1.5 1.2-3.2 345-1500 27.6-80.0
Hemp 1.48 1.6 550-900 70
Ramie 1.5 2.0-3.8 200-938 44-128
Sisal 1.3-1.5 2.0-14 400-700 9.0-38
Coir 1.2 15.0-30.0 175-220 4.0-6.0
Oil Palm 1.4 14 248 2
Banana 1.3 2.5-3.7 540 13-26
E-glass 2.55 2.5 3400 73
Kevlar 1.44 2.5-3.7 3000 60
Carbon 1.78 1.4-1.8 4000 230-240
2.4.4 Banana fibres
Bananas are a major food crop globally and are grown and consumed in more than
100 countries throughout the tropics and sub-tropics [86]. It is the fourth most
widespread fruit crop in the world [87]. Bananas are said to be native to tropical
South and Southeast Asia. They are among the most important commercial

22
subtropical fruits grown in South Africa and are planted for sale in local markets or
self-consumption [88]. Since only a fraction of all bananas are sold in the world
markets, according to the Agri-food business development centre, South Africa ranks
29th
in the world producing 250 000 metric tonnes of bananas [88, 89].
Bananas are mainly produced in Mpumalanga, Limpopo and both the North and
South Coasts of Kwa-Zulu Natal. In Kwazulu Natal the major banana growing area
is the North Coast with 15% (1 700 ha) of total area cultivated with bananas in 2010
[88]. South African records refer only to banana used for consumption and there are
no records of the use of the wasted banana plant once the fruit is harvested.
The banana plant is a large herbaceous flowering plant of the genus Musa. Each
pseudostem can only produce a single bunch of bananas. After harvesting of a single
bunch of bananas, the pseudostem dies and great amounts of agricultural residues are
produced, causing environmental pollution [90, 91]. Exploitation of waste banana
plants will be favorable to the environment and will have profitable economic
benefits [92]. Since there is no further use for the plant, the researcher decided to use
this waste material to produce a biocomposite material. Figure 2.9 shows typical
mature local banana plants and the banana fibres extracted from the pseudostem. The
fibres have many uses such as making cloth, string, rope, cordage and paper making
[93]. Applications for the banana plant residues represent an important contribution
to increase the economic importance of banana plantations [90].

23
Figure 2.9: Mature local banana plants (left). Extracted banana fibres (right)
2.5 Matrices in biocomposites
Already mentioned biocomposites comprises of natural fibres and synthetic or
natural resin systems. Synthetic resins are either thermosets or thermoplastics. This
study is confined to the use of thermosets and the modification thereof.
2.5.1 Thermosetting Polymers
Thermosets are polymers made of large molecules, with repeating structural units of
monomers that undergo irreversible curing. These liquids at room temperature enable
easy addition of fibres or other additives before being cured. Curing of thermosets is
achieved by the addition of a catalyst or hardener and an accelerator and or heat.
Unlike a thermoplastic, once cured, thermosets cannot be reversed to the liquid
phase. This is due to the crosslinking of the molecules whereby a rigid three
dimensional network is formed through the reactive sites within the molecule [27].
Thermosetting polymers are the commonly used in the composites industry [27].
Holbery and Houston also reported that thermosets generally have low viscosity,
perform at ambient temperatures and low pressures and are therefore appropriate for
typical composite applications [6].
The most commonly used thermoset resins in natural-fibre composites for
automotive applications are polyester, vinylester and epoxy resins [6, 94]. Mohanty

24
et al. have reported that polymeric resins such as vinyl ester, polyester and epoxy,
used in the composites are invariably costly and unsustainable as petroleum
resources are being depleted [1]. The focus of this research is on the development of
a bio-resin by modifying the unsaturated polyester with banana sap to produce a
hybrid polyester resin.
2.5.2 Polyester chemistry
Unsaturated polyester resins (UPR) are important matrix resins for general purpose
fibre reinforced composites [27, 95, 96]. UPR consists of two polymers, namely a
short chain polyester containing polymerizable double bonds and a vinyl monomer.
They are rarely sold as such, because they are brittle at room temperature and
difficult to handle. Instead, whenever polyester is freshly synthesized in a plant, it is
mixed with the vinyl monomer in the molten state. Thus materials that are viscous at
room temperature, with a styrene content of approximately 60% are sold. However,
in this study 35% styrene was used for easy diffusion of the bio-resin into the fibres
by vacuum infusion and to reduce the styrene emission making the biocomposite
environmentally friendly. UPR are made in a two-step process: first, unsaturated and
saturated acids or anhydrides are reacted with diols in a polycondenzation reaction;
secondly the resulting pre-polymer is dissolved in styrene to form a syrup like resin
[97, 98]. This research is based on the two-step process adopted by UPR systems.
2.5.3 Properties of polymers
Since the resin or matrix is a binding agent for the composite, it should have
properties of stiffness, good strength and toughness, good thermal properties, good
adhesion and chemical properties. Chemical properties such as viscosity, glass
transition temperature, gel time, cure time, shelf life or stability, environmental
resistance and volatile emissions during processing, are some of the parameters to be
considered when processing a resin [97]. A major concern regarding the application
of these resins in composite materials is the phenomenon of temperature elevation,
such as the interior of a motor vehicle which can become extremely hot in summer.
This study focusses on characterizing the bio-resin for the above mentioned
properties.

25
2.6 Bio-based matrix systems
The American Society for Testing and Materials (ASTM) defines a bio-based
material as an organic material in which carbon is derived from a renewable
resource via biological processes. Bio-based materials include all plant and animal
mass derived from CO2 recently fixed via photosynthesis [99].
The schematic classification of bio-based polymers is represented in Figure 2.10.
This study produced a renewable resource-based polymer from banana fibre and a
hybrid resin using banana sap.
Figure 2.10: Classification of bio-based polymers [1]
The term “bio-resin” refers to a resin that is made of raw materials derived from
renewable resources such as plant oils (soybean oil, pine oil castor oil),
polysaccharides (starch, cellulose) and proteins [60, 77]. Rubber, tannins, lignin,
soybean oil, epoxidized pine oil waste, castor oil, furfural alcohol-based resins,
lactic acid, cashew nut shell liquid, carbohydrates, proteins and bio-alkyds are some
of the raw materials used in the manufacturing of commercial thermosetting resins
[77]. Table 2.2 shows selected bio-resins and that have been used to replace synthetic
resins. It has been noted that world production giants are incorporating bio-resins

26
into their products [100]. For instance, in 1941 Henry Ford made a car with 70%
cellulose fibers in a phenolic resin matrix extended with soybean meal. He used a
sledgehammer to demonstrate the strength and impact resistance of his company’s
all-plastic-body car [46]. Furthermore, John Deere built tractor bodies using soy bean
oil based bio-resins [46] whilst Airbus and Boeing replaced old aircraft with new
bio-resin bodies [99].
Table 2.2: Selected bio-resins showing their origin and uses
Bio-resin Origin, properties, uses Reference
Natural rubber Milky white fluid known as latex from a tropical rubber tree. [101]
Tannin-based
adhesives
From timber species such as wattle or mimosa bark extract
and pine. Used for exterior wood bonding.
[99, 102-
104]
Lignin From woody plant glue. Lignin with hemp and flax used for
car dashboard panels, computer and television frames.
[105]
Cashew nut
shell liquid
(CNSL)
Phenolic-based for uses such as resins, friction lining material,
surface coating. CNSL with hemp fibres gave low cost,
mechanically robust materials
[106-108]
Polysaccharid
es
Blends from starch with aliphatic polyesters, PLA,
polycaprolactone, PVA or cellulose acetate. Uses: single use
microwavable dishes, catering utensils, horticultural
applications, mulch bags, shopping bags.
[105]
Cellulose
derived
biopolymers
From wood and sugar cane bagasse. Used for cellophane
films, membranes for reverse osmosis, packaging.
[99]
Furfural By-product of sugar cane bagasse, oats, wheat bran and
corncobs. Used for binding glass, rockwool and carbon fibres.
[109]
Soybean and
palm oil
From soy bean and oil palm trees. Used for particle boards,
thermoset resins, foams, household and furniture applications
[11, 110]
Polylactic acid
(PLA)
From lactic acid. Used in medical applications, packaging
among others.
[111-113]
Aliphatic
polymers
From polycondenzation of aliphatic glycol and aliphatic
dicarboxylic acid. Used in medical application, films, compost
bags, bottles among others
[114]

27
The review of plant based polymers from different natural sources however indicates
that no research has been done using banana sap in the resin. It is therefore the focus
of this research to develop a bio-resin using banana sap.
2.7 Banana sap
Banana sap is a clear liquid extracted from the pseudostem of the banana plant.
Studies on the chemical composition of the banana sap from pseudostem such as
carbohydrates, fibre composition and mineral content have been reported [87, 90,
115, 116]. It is also reported that the moisture content of fresh banana pseudostem is
about 96% [91]. Furthermore, Aziz and co-workers reported the presence of
polyphenols and flavonoids in the sap [87]. Oxidative browning takes place when the
sap is exposed to air implying the presence of phenolic compounds. However, to the
best of our knowledge, there is still a gap of knowledge regarding the full
characterization, especially the chemical structures of the components of the banana
sap. In this study, monosaccharides (glucose and fructose) and disaccharide (sucrose)
were found in the banana sap, the structures of which are shown in Figure 2.11. With
reference to other research [117] on the use of saccharides in the formation of ester-
carboxylic derivatives, we predict that these sugars actually attach themselves to the
backbone of the maleate polymer. Hirose and coworkers dissolved glucose in
ethylene glycol and added it to succinic anhydride and dimethylbenzylamine to form
a saccharide polyacid and consequently the thermal stability increased [117].

28
Figure 2.11: Structures of glucose, fructose and sucrose found in banana sap
[118]
2.8 Summary
In this chapter the biocomposites from various sources was reviewed and it is clear
that natural fibres are gaining acceptance within the auto-industry. Various
researchers have used banana fibres and synthetic or in some cases natural resin
systems and it was found that comparable mechanical properties such as tensile
strength were obtained. However it has been found that no research has been
conducted with banana sap used in resin formation. An ideal agricultural waste has
been suggested in the form of banana sap. Using the fibre and sap from the same
plant source led to the development of a biocomposite with similar or better
mechanical properties that could be used for non-functional motor vehicle
components.
The next chapter will provide the research methodology and design used in this
study.

29
CHAPTER 3 - RESEARCH METHODOLOGY AND RESEARCH
DESIGN
Introduction
In order to achieve the objectives of this research, a quantitative research approach
was used, where the research was conducted by collecting numerical experimental
data that was then objectively analyzed with value-free and unbiased facts. The
literature review that was conducted early in the study provided the underpinning
knowledge for the research that has been done and the current trends and more
importantly the gaps in the knowledge in this field.
A positivist approach based on knowledge gained from “positive” verification of
observation of experimentation was used in this study. A schematic diagram (Figure
3.1) outlines the design of the experiment followed by a synopsis of the
experimentation.
Figure 3.1: Schematic diagram of research design
The banana sap and fibres were extracted from the pseudostem of the banana plant
obtained from a local plantation in Durban, Kwa-Zulu Natal. The sap was
characterized by HPLC and GC-MS to determine the constituents, and the sap was

30
then used as is in the resin formulation. The bio-resin was constituted from banana
sap, maleic anhydride and propylene glycol. This was compared to a control resin
made with maleic anhydride and propylene glycol. The bio-resin and the control
resin were fully characterized for their thermal, mechanical and chemical properties.
The banana fibres were extracted, washed and chemically treated with alkaline
solution. The fibres were infused with the bio-resin by vacuum infusion and cured. A
control composite specimen was also prepared and a comparison was made between
both composites. Five samples were tested for mechanical properties and triplicate
analyses were performed for all other tests. To improve the strength of the resins, the
resin was fortified with nanoclay and the mechanical and thermal properties were
determined.
This chapter outlines the materials used in the preparation of the bio-resin and
biocomposites followed by the experimental section discussing the instrumentation
used. Extraction and characterization of the sap and fibres are also given.
3.1 Materials
Maleic anhydride (MA), propylene glycol (PG), cobalt napthenate (6%), styrene and
methyl ketone peroxide (MEKP), tert- hydroquinone (THQ) and tert- butyl catechol
(TBC) were all purchased from Sigma Aldrich, South Africa. Table 3.1 summarizes
the properties of MA and PG.
Table 3.1: Chemical and physical properties of MA and PG [119]
Maleic anhydride (MA) Propylene glycol (PG)
Appearance white solid colourless clear liquid
Molecular weight (g/mol) 98.06 76.1
Boiling point (°C) 202 188
Melting point (°C) 52.8 -59
In this study MA was converted to maleic acid and reacted with PG to form the
unsaturated polyester resin. MA is soluble in water, ether, acetate, chloroform and

31
dioxane at ambient temperature and is used as a chemical intermediate in the
synthesis of fumaric and tartaric acid, certain agricultural chemicals, many resins,
dye intermediates and pharmaceuticals. It is also used as a co-monomer for saturated
polyester resins, as an ingredient in bonding agents used to manufacture plywood, a
corrosion inhibitor and a preservative in oils and fats [120]. PG is one of the main
reactants for UPR. It is also used as a preservative in food and tobacco products, in
pharmaceuticals and personal-care products [121].
The bio-resin was fortified with the nanoclay, Cloisite® 30B which was obtained
from Southern Clay Products, USA. Cloisite® 30B is a natural montmorillonite
modified with a quaternary ammonium salt. The properties of the salt are shown in
Table 3.2.
Table 3.2: Properties of Cloisite® 30B [122]
Specific Gravity (g/cm3) 1.98
Bulk Density (g/cm3) 0.2283 (loose), 0.3638 (packed)
Loss On Ignition (%) 30
Particle Size (≤ µm) 2 (10 %), 6 (50 %), 13 (90 %)
Hardness (Shore D) 83
Tensile Strength, Ultimate 101
Elongation at Break (%) 8
Modulus of Elasticity (GPa) 4.657
Flexural Modulus (GPa) 3.78
Izod Impact, Notched (J/cm) 0.27
Deflection Temperature at 0.46 MPa (°C) 96
Moisture Content (%) < 2
Organic Modifier methyl, tallow, bis-2-hydroxyethyl,
quaternary ammonium
X-Ray Diffraction d-Spacing (001) (Å) 18.5
Modifier Concentration (meq/ 100g clay) 90.00
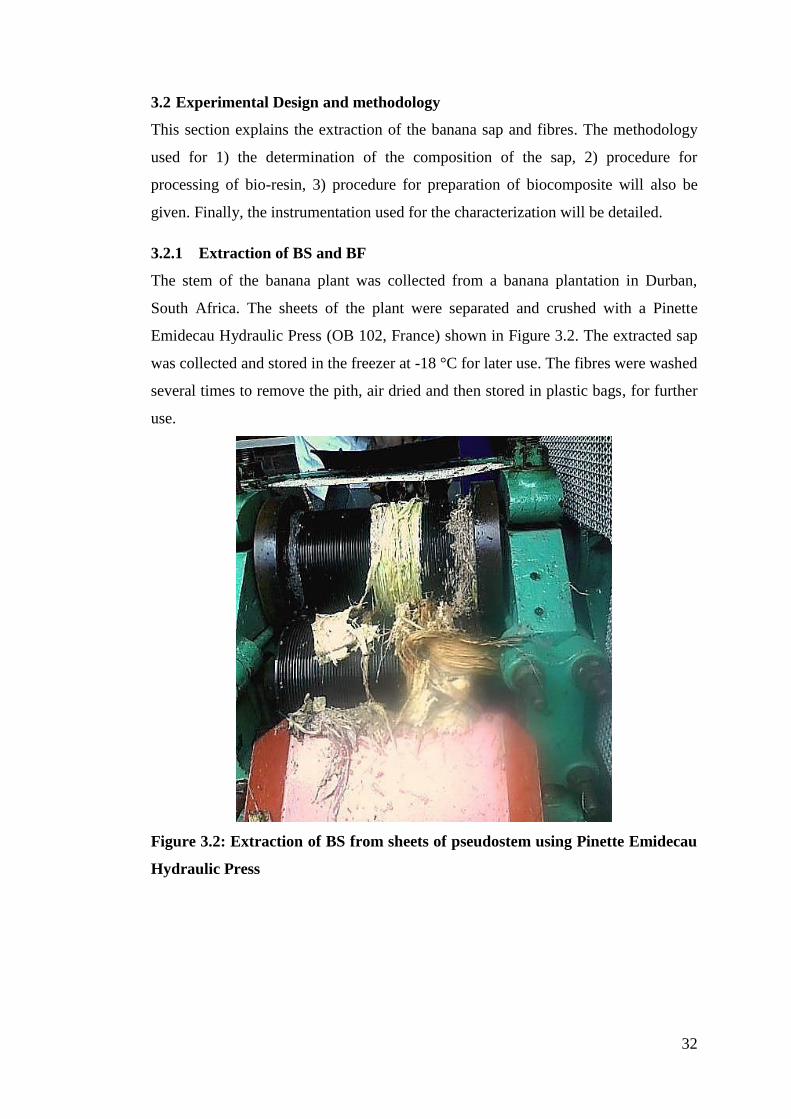
32
3.2 Experimental Design and methodology
This section explains the extraction of the banana sap and fibres. The methodology
used for 1) the determination of the composition of the sap, 2) procedure for
processing of bio-resin, 3) procedure for preparation of biocomposite will also be
given. Finally, the instrumentation used for the characterization will be detailed.
3.2.1 Extraction of BS and BF
The stem of the banana plant was collected from a banana plantation in Durban,
South Africa. The sheets of the plant were separated and crushed with a Pinette
Emidecau Hydraulic Press (OB 102, France) shown in Figure 3.2. The extracted sap
was collected and stored in the freezer at -18 °C for later use. The fibres were washed
several times to remove the pith, air dried and then stored in plastic bags, for further
use.
Figure 3.2: Extraction of BS from sheets of pseudostem using Pinette Emidecau
Hydraulic Press
33
The fibres were processed into a needle punched, non-woven mat in a two-step
process at the Council for Scientific and Industrial Research (CSIR) laboratories,
Port Elizabeth. The procedure for the fibre processing is detailed in Appendix A3.1.
3.2.2 Chemical composition of banana sap
In order to determine the chemical composition of the banana sap, physiochemical
analyses were performed (in triplicate). Mineral analysis of metals was determined
by Inductively Coupled Plasma-Atomic Emission Spectroscopy (ICP-AES).
The amount of water present in the sap was confirmed by the Dean and Stark
method, which involved continuously removing water that was produced during a
chemical reaction performed at reflux temperature [123]. The sap was qualitatively
analyzed for carbohydrates using the Molisch test [124]. Concentrated H2SO4 was
carefully added to 2 mL of BS and 2 drops of α-naphthol in 95% ethanol in a test
tube until a violet colour was observed.
Spectrophotometric analysis of total phenols was carried out using a Perkin Elmer
UV/VIS spectrophotometer. The total phenolic content of extracts was determined
using the Folin-Ciocalteu method [125]. The extracts were oxidized with Folin-
Ciocalteu reagent, and the reaction neutralized with sodium carbonate. The
absorbance of the resulting blue colour was measured at 765 nm after 60 min. Gallic
acid (GA) was used as a standard and the total phenolic content was expressed as mg
GA equivalent/L of extract. The standard curve was prepared using concentrations
50-500 mg/L.
High Performance Liquid Chromatography (HPLC) analysis of sugars was
performed using the Perkin Elmer 250 Binary pump HPLC unit. A refractive index
detector, Rheodyne 7125 manual injector, Phenomenex Rezex H organic acid
column and Clarity software from Data Apex version 2.4.04.139 was used. The
mobile phase was made up of 0.0025M H2SO4/H2O. Chromatograms were then
recorded, and the peak areas from the sample were identified by comparison to pure
standards of 0.1% concentration.
Gas Chromatography-Mass Spectrometry (GC-MS) analysis of the organic
compounds was performed using the Agilent Technologies 6890 Series GC coupled
with an Agilent 5973 Mass Selective Detector, driven by Agilent Chemstation
34
software. The samples were prepared by liquid-liquid extraction using
dichloromethane, ethyl acetate and hexane to extract the polar, medium polar and
non- polar components. All solvents were of high purity gas chromatograph grade.
The organic extracts were concentrated by rotary evaporator (rotavap) and analyzed
by GC-MS.
3.2.3 Chemical composition of banana fibre
Fibre composition was determined through a number of tests conducted by the
Animal Sciences Department at North Dakota State University. This included dry
matter testing, neutral detergent solutions and acid detergent solution
characterization, as well as starch spectrophotometry. These measurements allowed
for the collection of percentage dry matter, as well as percentage cellulose,
hemicellulose, lignin, starch, and ash. Dry matter determination was done according
to Association of Official Analytical Chemists (AOAC) standard 930.15, and the
samples were weighed at room temperature, heated at 100 °C for 24 hours, cooled in
a desiccator, and then re-weighed for a second time. Neutral detergent fibre, acid
detergent fibre, and acid detergent lignin analysis were performed using an
ANKOM200/220
Fiber Analyzer (ANKOM Technology, Fairport, NY) according to
methods in the USDA Agricultural Handbook No. 379 [126].
The determination of starch was performed after an acid and enzymatic isolation
using a micro-titre reading with a SPECTRAmax 340 Microplate Reader in
accordance with the literature [127].
3.2.4 Chemical treatment of banana fibre
The fibres were chemically treated by immersing in 2% sodium hydroxide (reagent
grade) for 24 hours at room temperature. After the alkaline treatment the fibres were
rinsed with water and 10% acetic acid solution (reagent grade), thereafter they were
rinsed with water again until a neutral pH was obtained. The fibres were dried in an
oven at 80 °C overnight.
3.3 Resin preparation
Since the resins prepared in this research were based on unsaturated polyester resin
(UPR) chemistry using MA and PG a brief introduction to this chemistry is given.

35
MA is bi-functional because it has two acid groups and also because of its
unsaturated ̶ CH:CH ̶ grouping [128] as shown in Figure 3.3
O
OH
OH
C
C
O
O
C
C
O
O + H2O +
HO CH2
HO
CH3
O
C C
O
OO(CH2)3OO
MALEIC ANHYDRIDE MALEIC ACIDPROPYLENE GLYCOL
POLY(PROPYLENE MALEATE)
CH2
CH
CH
CH
CH
CH CH (CH2)3
Figure 3.3: Schematic diagram of the formation of polypropylene maleate resin
The polyester resin formed in this reaction was a linear polymer containing reactive
double bonds [128] cross-linked with a vinyl reactive monomer, styrene as shown in
Figure 3.4. The cross-linking reaction between the styrene and the double bonds was
highly exothermic and the temperature was controlled at 50 °C.

36
O
C C
O
OO(CH2)3OO CH CH (CH2)3
O
C C
O
OO(CH2)3OO CH CH (CH2)3
+CH CH2
O
C C
O
OO(CH2)3OO CH CH (CH2)3
CH2
CHPh n
O
C C
O
OO(CH2)3OO CH CH (CH2)3
O
C C
O
OO(CH2)3OO CH CH (CH2)3
CH2
CHPh n
Figure 3.4: Cross-linking of polypropylene maleate with styrene monomer
3.3.1 Preparation of control and BSM bio-resin
The following section details the method employed to synthesize and characterize the
control resin and BSM bio-resin. The materials used for the preparation of the resins
are summarized in Table 3.3.
Table 3.3: Materials used for the preparation of the resins
Control resin BSM bio-resin
Equal molar masses of MA+ PG + 10%
excess PG
Equal molar masses of MA+ PG +10%
excess PG + BS (30-64%)
A reactor flask as shown in Figure 3.5 was set up with a heating mantle, mechanical
stirrer, condenser, temperature probe and water trap.
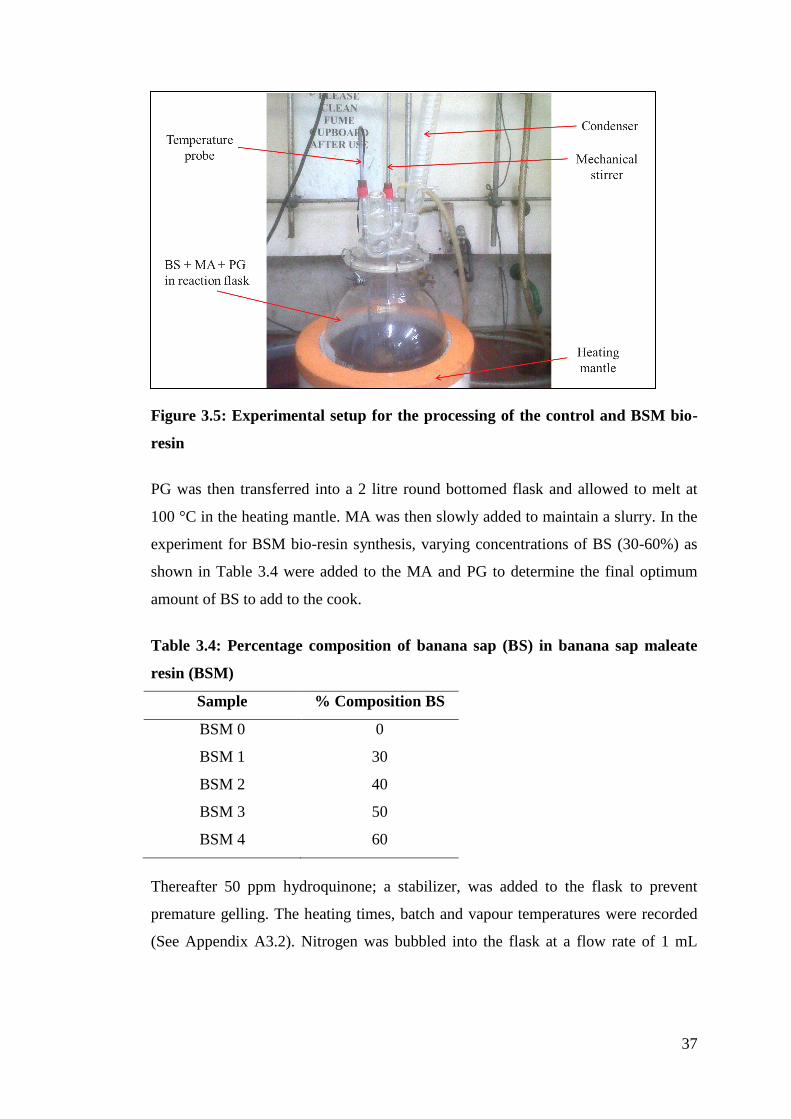
37
Figure 3.5: Experimental setup for the processing of the control and BSM bio-
resin
PG was then transferred into a 2 litre round bottomed flask and allowed to melt at
100 °C in the heating mantle. MA was then slowly added to maintain a slurry. In the
experiment for BSM bio-resin synthesis, varying concentrations of BS (30-60%) as
shown in Table 3.4 were added to the MA and PG to determine the final optimum
amount of BS to add to the cook.
Table 3.4: Percentage composition of banana sap (BS) in banana sap maleate
resin (BSM)
Sample % Composition BS
BSM 0
BSM 1
BSM 2
BSM 3
BSM 4
0
30
40
50
60
Thereafter 50 ppm hydroquinone; a stabilizer, was added to the flask to prevent
premature gelling. The heating times, batch and vapour temperatures were recorded
(See Appendix A3.2). Nitrogen was bubbled into the flask at a flow rate of 1 mL

38
/min to create an inert atmosphere. At the end of the reaction some of the solvent, in
this instance PG, was distilled off. Therefore, a 10% excess was initially added to
accommodate for this loss. Under good agitation, the temperature was slowly
increased to 150 °C at 1 °C/min intervals followed by a ramp from 150 °C to 200 °C
at 0.5 °C/min.
The acid number, which is a measure of carboxylic acid in the polymer, was
measured every hour. The titration method as shown in Appendix A3.3 was used to
measure the acid number of the banana sap maleate according to ASTM D 13863
method [129] which is defined by the amount of potassium hydroxide in milligrams
required to neutralize 1 g of sample. Viscosity measurements were performed using a
Cone and Plate viscometer. The molecular weight distribution was done by gel
permeation chromatography. During the processing of the resin, samples were taken
every hour, and then every half-hour (towards the end of the processing) to measure
acid number, viscosity and molecular weight distribution. When the acid number was
below 50 and the viscosity was between 5-8 poise, the reaction was terminated and
the resin was thinned with styrene containing inhibitors.
3.3.2 Dilution of bio-resin
As previously mentioned, once the resin was cooked, it was necessary to for it to be
thinned or diluted in order to prevent gelling. The resin was diluted with a co-
monomer namely styrene, whose function was two-fold. Styrene helped tailor the
viscosity of the resin to an acceptable level and also modified the property of the
cured polymer and biocomposite. In order to prevent premature gelation and improve
the shelf life of the resin, initiators were added to the styrene and mixed with the
resin. The hot resin was added to 35-40% styrene to which 100 ppm of tert-
hydroquinone (THQ), 50 ppm of di- tert-butylcatechol (TBC) and copper napthenate
were added to stabilize the resin. The styrene was maintained at a temperature of 50
°C. Viscosity, % volatiles and density of the resin with styrene was measured and
compared to the specifications of a similar industry sample. Viscosity measurements
were taken by placing a 500 mL sample in a water bath at 25 °C for one hour. The
3 ASTM D1386 test method for acid number of synthetic and natural waxes Vol 15.04

39
viscosity was measured with an ICI viscometer with a spindle number 5 at 10 rpm.
Since 35-40 % of styrene was added to resin, the value for the volatiles was between
35 and 40 %. The volatiles were determined by measuring the mass of the resin
before and after heating for one hour at 125 °C. The density was measured using a
density cup.
3.3.3 Curing of bio-resin
Cure times were controlled by adjusting the amount of catalyst and accelerator.
Peroxy catalyst such as Methyl Ethyl Ketone Peroxide (MEKP) liberated free
radicals at ambient temperatures using certain metal accelerators such as cobalt
napthenate to aid in the curing process as shown in Figure 3.6.
H3C C
O
O
CH2CH3
OH
OH
H3C C
O
O
CH2CH3+ Co++
Figure 3.6: Free radical formation of MEKP with Co2+
taking place during the
curing of the resin
To measure the gel times, 100 g of the resin was weighed out into a plastic cup and
covered with aluminium foil and then equilibrated in a water bath at 25 °C for 30
minutes. Cobalt naphthenate (1%) accelerator was weighed and added to the resin.
1% of MEKP catalyst was added and stirred for one minute and the timer was
immediately started. The resin was continuously stirred until the product started to
gel. Thereafter the clock was stopped, and the gel time recorded. The thermometer
probe was quickly attached to the cup, and the temperature and the product curing
times were recorded.

40
3.4 Preparation of biocomposite
As mentioned previously, a biocomposite material comprises of reinforcing fibres
embedded in the matrix system. The matrix systems consist of resin polymer,
initiator and catalyst. The structural properties of the fibre-matrix interface are
important for the mechanical and physical properties of composite materials. The
matrix has the function to provide a physical form for the composites by binding
fibres together and distributing the fibres in a predetermined manner in the
composites. The matrix also transmits the load to the reinforcing fibres and protects
the fibres from environmental attack. The most widely reported fibre loading is from
20% to 50% [38, 40-42, 130]. In this study the researcher decided to use 30% fibre
loading using the non-woven banana fibres to create laminates of 3-4 mm thickness
for the various mechanical tests.
There are several different routes for composites manufacturing. Each distinct route
has its own speciality and suitability. Some of the most popular manufacturing routes
are [131]:
Spray Lay-up
Vacuum Bagging
Filament Winding
Pultrusion
Resin Transfer
Infusion Processes
Prepreg Moulding
Low-Temp Prepreg
Resin Film Infusion
Wet/Hand Lay-up
In this research, only the vacuum assisted resin infusion moulding (VARIM)
technique as shown in Figure 3.7 was used. The advantages of using vacuum
infusion is the low cost due to the reduced tooling costs, occurrence of low volatile
styrene emissions, use of higher fibre volume fractions, low void content, better fibre
wet-out due to pressure and resin flow throughout the structural fibres [29].

41
3.4.1 Vacuum assisted resin infusion moulding (VARIM)
Vacuum Bag
Distribution
Mesh
Mould (painted with release agent)
Fibres
Peel Ply
Vacuum
Sealing Tape
Vacuum Pipe
Infusion Pipe
Figure 3.7: Schematic diagram of VARIM technique [131]
The non- woven mat fibres were infused with the control and BSM resins by vacuum
assisted resin infusion moulding. In this technique a vacuum was used to impregnate
the banana fibres with BSM and control resin. Figure 3.7 shows a schematic diagram
of this process. A glass sheet was polished and shone five times with a release agent,
which served in preventing the composite panel from adhering to the glass surface.
The fibres were then laid out on the glass panel, and a peel ply and distribution mesh
were placed on top of these. The peel ply was used to prevent the adhesion of the
fibres to the distribution mesh. The distribution mesh assisted the resin flow process.
Infusion and vacuum pipes were laid and the entire setup was covered with a vacuum
bag which was sealed with vacuum sealing tape. The infusion pipe was initially
closed off, and the vacuum pipe was connected to a vacuum pump. The pump was
turned on and all the air inside the vacuum bag was removed. The infusion pipe was
then inserted into the resin mixture, that was well mixed with 1% cobalt napthenate
and 1% MEKP, and opened. Once all the fibres were wetted, the infusion pipe was
closed and the pressure was held constant during curing process at room temperature
for 24 hours. The biocomposite sheet was post cured at 80 °C for three hours. Figure
3.8 shows the infusion of the fibres with the BSM resin using the VARIM technique.
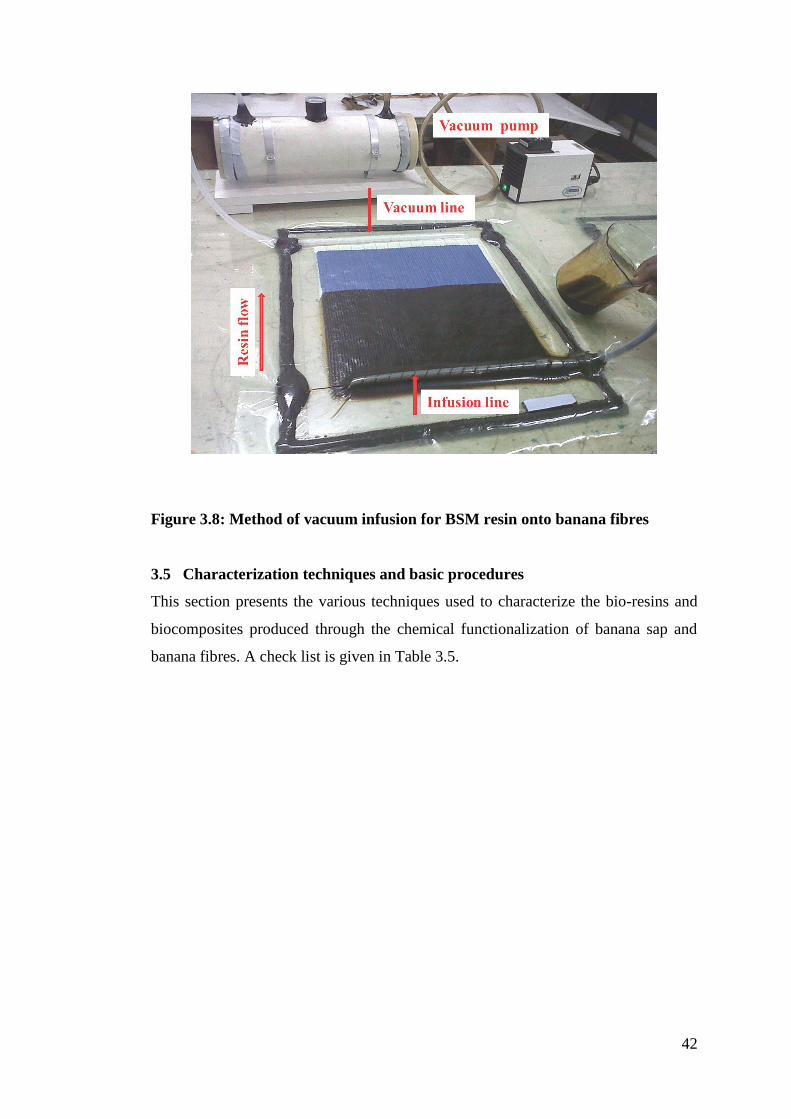
42
Figure 3.8: Method of vacuum infusion for BSM resin onto banana fibres
3.5 Characterization techniques and basic procedures
This section presents the various techniques used to characterize the bio-resins and
biocomposites produced through the chemical functionalization of banana sap and
banana fibres. A check list is given in Table 3.5.

43
Table 3.5: Checklist of characterization techniques conducted in this study
Technique Reason for test
FTIR Determination of functional groups
TG/DSC Determination of degradation temperature,
melting and crystallization temperatures
HDT Deflection temperature under load
DMA Elastic and viscoelastic properties
XRD Determine amorphous/crystallinity
SEM Study surface structure and morphology
Water absorption Moisture uptake
Swelling test Swelling resistance
Chemical resistivity Resistance to water and harsh chemicals
Tensile test
(ambient + elevated temperature)
Material strength
Tensile modulus
(ambient + elevated temperature)
Measure of stiffness of material
Flexural test
(ambient + elevated temperature)
Flexural strength
Flexural modulus
(ambient + elevated temperature)
Resistance to deformation under load
Pull-out test Study of fibre/matrix interface
Impact test Resistance to impact
Delamination Separation of reinforcement from matrix
Biodegradability test Disintegration of biocomposite to give
CO2, water, inorganic compounds and
biomass
3.5.1 Fourier transform infrared spectroscopy (FTIR)
Functional groups of the resins and the fibres were determined by the use of a Varian
800 FTIR, Scimitar Series instrument with Attenuated Total Reflectance (ATR) in

44
the range of 400-4000 cm-1
, and a resolution of 2 cm-1
for each sample. Whilst the
resins were being processed, approximately 1g of sample was taken for analysis
every hour and FTIR measurements were done. The fibres were cut and milled to
provide a size of sample between 100-200 µm which was then analyzed to determine
the functional groups.
3.5.2 Thermal analysis (TA)
Thermogravimetry (TG) measured the mass of a sample as a function of temperature
and time. Differential scanning calorimetry (DSC) is a technique whereby the
temperature change occurring whilst a chemical reaction or phase change took place
in the polymer, for example crystallization, was monitored until the reaction was
complete. The TG and DSC tests were performed using the TA SDT Q600
instrument at a temperature range of 40-400 °C, with a heating rate of 10 °C/min
under nitrogen flow of 50 ml/min. TA techniques were also used to analyse the
curing behaviour of the bio-resin, and isothermal and dynamic methods were used.
Kinetic studies were investigated on how different experimental conditions can
influence the speed of a chemical reaction and give information about the reactions
mechanism. Cure kinetics is an intregral aspect of thermosetting resin as they
establish the optimum processing conditions. While extensive cure kinetic studies
have been conducted on unsaturated polyester resin, research on bio-resins is limited.
Reaction kinetics was studied using the isothermal mode of the DSC. In order to
select suitable temperatures for the isothermal experiments, a dynamic DSC scan
from 40-500 °C at a heating rate of 5 °C/min was first obtained.
Samples between 10-15 mg were placed in the DSC pans. Dynamic scans were
performed at four different heating rates: 5, 10, 15, 20 °C/min from 30-500 °C. The
cured samples were cooled to 30 °C at a rate of 10 °C/min. To complete the heat-
cool-heat cycle, the sample was then reheated to 500 °C to confirm the nonexistence
of residual curing.
Two dynamic kinetic models based on multiple heating rates that are useful in
determining the activation energy of the curing reaction have been proposed by
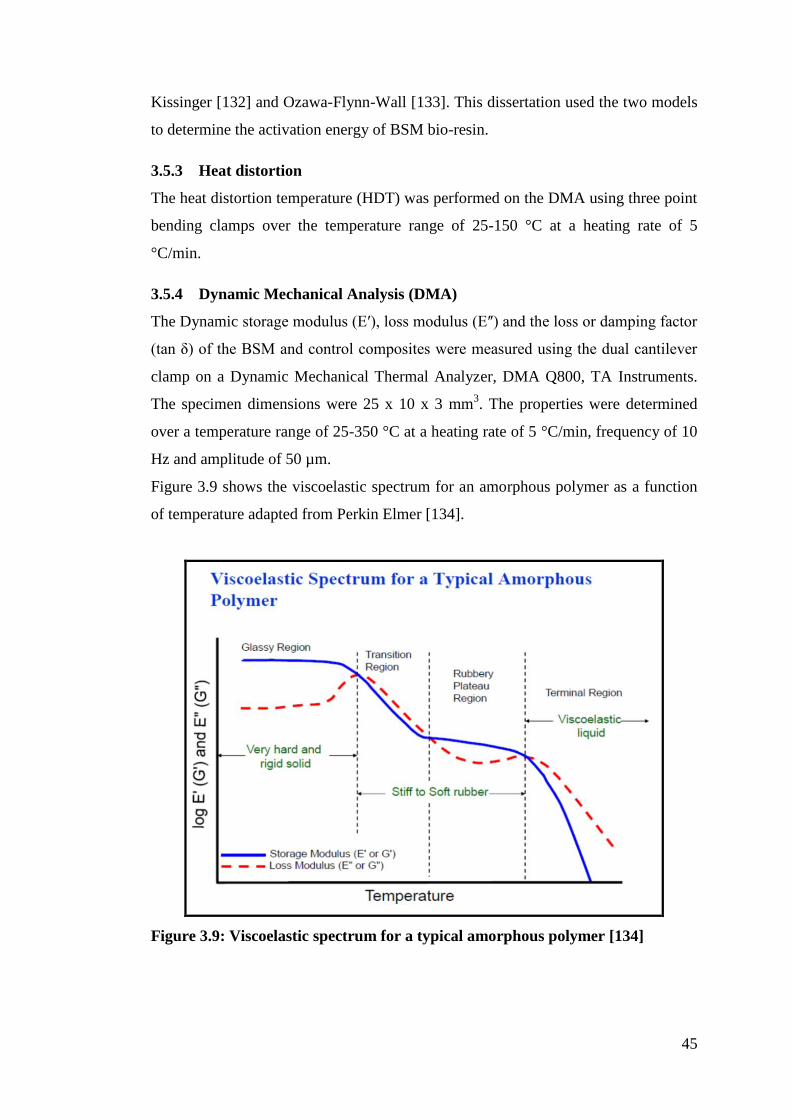
45
Kissinger [132] and Ozawa-Flynn-Wall [133]. This dissertation used the two models
to determine the activation energy of BSM bio-resin.
3.5.3 Heat distortion
The heat distortion temperature (HDT) was performed on the DMA using three point
bending clamps over the temperature range of 25-150 °C at a heating rate of 5
°C/min.
3.5.4 Dynamic Mechanical Analysis (DMA)
The Dynamic storage modulus (Eʹ), loss modulus (Eʺ) and the loss or damping factor
(tan δ) of the BSM and control composites were measured using the dual cantilever
clamp on a Dynamic Mechanical Thermal Analyzer, DMA Q800, TA Instruments.
The specimen dimensions were 25 x 10 x 3 mm3. The properties were determined
over a temperature range of 25-350 °C at a heating rate of 5 °C/min, frequency of 10
Hz and amplitude of 50 µm.
Figure 3.9 shows the viscoelastic spectrum for an amorphous polymer as a function
of temperature adapted from Perkin Elmer [134].
Figure 3.9: Viscoelastic spectrum for a typical amorphous polymer [134]

46
3.5.5 X-Ray Diffraction analysis (XRD)
Amorphous polymers are randomly oriented and are intertwined whereas semi-
crystalline polymers pack together in ordered regions as shown in Figure 3.10. The
crystalline region is shown by the neat or orderly packing of the polymer chain
whereas the amorphous region is indicated by spaghetti-like polymer chains.
Figure 3.10: Amorphous and semi-crystalline polymer morphologies [135]
XRD patterns were carried out for dried and finely grounded neat resin and
composite samples on a PANalytical Empyrean XRD instrument using Cu and Kα
radiation generated at 45 mA and 40 kV.
When an X-ray beam hits a sample, and is diffracted, the distance between the planes
of the atoms that constitute the sample can be determined by applying Braggs Law
(equation 3.1).
nλ = 2dsinθ (3.1)
Where n is the order of the diffracted beam, λ is the wavelength of the incident beam,
d is the distance between the adjacent planes of the atoms (d spacing), and θ is the

47
angle of incidence of the x-ray beam. Since λ is known and θ can be measured, then
d-spacing can be calculated.
3.5.6 Scanning Electron Microscope (SEM)
Scanning electron microscope was used to observe the surface structure and
morphology of the treated and untreated banana fibres as well as the neat resins and
the fracture surface of the biocomposites. SEM analysis of all the polymer and
composite samples were performed using an environmental scanning electron
microscope (EVO 15 HD, Carl Zeiss) at an accelerating voltage of 20 kV.
3.5.7 Water absorption
The water absorption test was done according to ASTM standard test method D5704.
The dimensions of the test samples were 61 mm x 61 mm x 1 mm. The sample was
first dried in an air oven at 50 °C for 24 h, cooled in a desiccator and immediately
weighed to the nearest 0.001 g which was then taken as the dry initial weight of the
sample, Mo. The specimen was immersed in a container of distilled water maintained
at a temperature of 25 °C for 24 hours. After 24 hours, the specimen was dried and
reweighed to constant weight, designated as M1. The analysis was done in triplicate
and the percentage of water absorbed by the composite material was calculated by
using weight difference between the samples immersed in water and the dry samples
using equation 3.2.
∆M�t =mt − m0
m0 × 100
(3.2)
where, ΔMt is moisture uptake at time t, mt and mo are the mass of the wet weight
and dry weight at time t, respectively.
The diffusion of water in the composite medium was studied using Fick’s steady
state flow by applying equation 3.3:
4 ASTM D570. (1995). Standard test method for water absorption of plastic materials.

48
Mt
M∞=
�Dt4
L π(3.3)
Where Mt is the weight of water content at time t, M∞ is the equilibrium water
content, L is the sample thickness and D is diffusion coefficient whilst Mt /M∞ ≤ 0.6
was maintained.
The movement of the solvent molecules in the polymer segments was characterized
by the diffusion coefficient. The absorption of water by the natural fibre was related
to the permeability of the water molecules through the biocomposite material.
Therefore, the sorption coefficient are related to the equilibrium sorption and is
calculated by the equation 3.4:
S = M∞/Mt (3.4)
Where, M∞ and Mt are the percentage of water uptake at infinite time and time t.
The permeability coefficient P, (mm2/s), which implies the net effect of sorption and
diffusion and is given by the equation 3.5:
P = D x S (3.5)
3.5.8 Swelling tests
Circular samples of the BSM and control resins (diameter approx. 2 cm) of ASTM
standard D58905 were weighed and immersed in test bottles with airtight stoppers
containing toluene at 80 °C. The initial weight, swollen weight and deswollen
weights were recorded using an analytical balance.
The swelling index measures the swelling resistance of the BSM and control bio-
resins and was calculated using the equation:
Swelling index % =As
W × 100
(3.6)
5 ASTM 5890- Standard Test Method for Swell Index of Clay Mineral Component of Geosynthetic
Clay Liners

49
Where As was the amount of solvent absorbed by the sample, W was the initial
weight of sample before swelling.
The extent of cross-linking can be determined from the reciprocal swelling values
1/Q where Q is the amount of solvent absorbed by 1 g of sample:
Q =
Swollen wt. −dried wt.
Original wt. ×100
formula wt.
(3.7)
3.5.9 Chemical resistivity tests
Chemicals can affect the strength, flexibility, surface appearance, colour, dimensions
or weight of plastics. Chemical attack on the polymer chain results in the reduction
of chemical properties such as oxidation, reaction of functional groups and
depolymerization. Furthermore, physical changes take place such as adsorption of
solvent resulting in the softening and swelling of the polymer, permeation of the
solvent through the polymer and dissolution in the solvent [97].
The immersion test was adapted using ASTM D 5436. The samples were visually
observed and classified as: high resistance with no attack and possibly slight
absorption, or limited resistance with a slight attack by absorption or swelling, and
no resistance where the material will decompose or dissolve within a specified time.
A specimen sample of 2 cm x 2 cm of the control and BSM composites were
immersed for 30 days at room temperature in the following solutions: water ethanol,
benzene, acetone, chloroform, petrol, 10% H2SO4, 10% HCl, 10% HNO3, 10%
NaOH. The initial masses were recorded, and after 30 days the specimens were
reweighed and the % change in weight were recorded.
3.6 Mechanical properties
The standard mechanical properties were determined by the procedures found in
ASTM standards for plastics. The mechanical properties studied were tensile strength
6 ASTM D543 - 06 Standard Practices for Evaluating the Resistance of Plastics to Chemical Reagents

50
and modulus, flexural strength and modulus at ambient and elevated temperatures,
impact, fracture test and creep.
3.6.1 Tensile properties
The tensile properties of the neat resins and biocomposite materials samples were
tested on a LLOYD Universal Testing Machine with a crosshead speed of 1mm/min
according to ASTM standard test method (D638). The test samples were rectangular
in shape with dimensions 150 mm x 15 mm x 4 mm. The test specimen was held
tightly by the two grips, the lower grip being fixed. The output data in the form of
stress-strain graphs was computed from the console microprocessor.
3.6.2 Flexural properties
The flexural properties were tested on a LLOYD Universal Testing Machine with a
crosshead speed of 1mm/min using the three point testing method adapted from
ASTM standard test method (D790). The test samples were rectangular in shape with
dimensions 64 mm x 12.7 mm x 4 mm.
3.6.3 Fibre pull-out tests
The resin was poured into cylindrical capsules as shown in Figure 3.11. One end of
the treated and untreated fibre was immersed at a depth of 1 cm into the resin with
the opposite end protruding from the resin. The resin was cured at room temperature.
The fibre and resin ends were attached to the tensile clamps.
Figure 3.11: Schematic diagram for fibre pull-out test [84]

51
3.6.4 Impact tests
One of the major concerns in the use of natural plant fibre reinforced polymeric
composites is their response to impact damage and the capacity of the composites to
withstand it during their service life. In automotive applications such damage to
materials may be introduced by bumps, crashes and falling foreign objects which can
cause a severe reduction in load bearing capabilities of these materials [136]. Impact
testing is about resisting impact and gives an insight to the material’s toughness.
Drop weight impact testers
Cylindrical mass pieces of 242 g and 318 g were dropped vertically onto the square
specimens of 50 mm x 4 mm thickness. The height of the fall was recorded. Since
the mass either stops dead on the specimen or breaks it, the test was essentially
recorded as pass or fail. The energy absorbed by a specimen was calculated by the
product of impactor mass, impactor height and gravitational force (equation 3.8)
from which it was dropped from increasing heights until the specimen fractured or
broke. Both the mass and the drop height were varied till an indentation was
observed.
Impact Energy = mass x height x gravity (3.8)
3.6.5 Hardness tests
The Barcol hardness test was used to determine the indentation hardness of materials
through the depth of penetration of an indenter.
3.6.6 Fracture toughness: Single Edge Notched Bend (SENB)
The ASTM D 5045–93 testing standard was used as the guideline for the SENB test
coupons [137]. Each specimen had an initial crack length of 5 mm. Specimens were
subjected to this test using a three-point-bend fixture. SENB tests were done on the
Lloyds universal testing machine fitted with a 5 kN load cell at a cross-head speed of
10 mm/min. The dimensions of the test specimen for plane strain conditions are
shown in Figure 3.12 (a) and (b) [138].

52
Figure 3.12: (a) and (b) Dimensions of SENB specimen [138]
This test was performed to determine the Mode I fracture toughness (KI) of the
manufactured composite structures. Fracture toughness measures the resistance of a
material to the propagation of a crack. KI was evaluated using equation 3.9.
W
af
WB
PIK (3.9)
Where,
KI = stress intensity factor (MPa√m)
P = critical load (N)
B = thickness of specimen (m)
W = height of specimen (m)
f(a/W) = correction factor calculated in equation 3.10:
2
2
3 W
a7.2
W
a93.315.2
W
a1
W
a99.1
W
a1
W
a212
W
a
W
S3
W
af (3.10)
Where,
S = span length of the specimen (m)
a = crack length (m)
W = height of the specimen (m)
The Mode I strain energy release rates, GI, for the SENB specimens was determined
as follows,

53
2
E
II
KG (3.11)
Where,
GI = Mode I strain energy release rate (J/m2)
E = Youngs Modulus (GPa)
3.6.7 Creep tests
The creep test was performed using the DMA instrument (TA Instruments DMA
Q800). An initial “scouting” experiment was performed to establish the optimum
temperature range (the materials ambient temperature modulus and glass transition
temperature) to conduct the creep experiment. The specimen was 4 mm thickness x
12.5 mm width x 50 mm length. The samples were tested using a dual cantilever
clamp at a constant load of 1 MPa from 25-200 °C at 5 °C/min for 22 hours. The data
was obtained from the TA Universal software, TA to obtain the creep compliance.
For the Time-temperature superposition (TTS) analysis, the data was obtained using
the Rheology Advantage Analysis software, TA to predict long-term creep
deformation of the control and BSM composite samples from accelerated testing data
at different temperature levels and smooth master curves were obtained.
3.7 Hybrid polymers (with nanoclays)
Biocomposites have the challenge of not having the desired mechanical strength
compared to the traditional counterparts. A new class of composite material
incorporating nanofillers or nanoclays has been investigated to improve mechanical,
thermal and barrier properties of bio-based composite material [139, 140]. Many
researchers have found that montmorillonite was the most commonly used layered
silicate because of its high cation-exchange capacity, excellent swelling ability, high
aspect ratio, ease of modification, commonly available and inexpensive [141-143].
Laoutid et al. indicated that the minimal amount of nanoclays (1-5% wt) added can
improve the reinforcement of the polymer matrix by increasing flexural strength by
up to 31 % and lowering the coefficient of linear thermal expansion [144]. Praveen et
al. investigated the effect of nanoclay loading on the tensile and dynamic mechanical

54
properties of short banana fibre-filled styrene butadiene rubber composites. They
found that nanoclay addition to the composites led to improved elongation at break
and frequency damping properties [145].
Figure 3.13: Structure of layered Montmorillonite silicate [140]
In this study it was decided to use Cloisite® 30B, a layered alkyl quaternary
ammonium salt bentonite silicate shown in Figure 3.13. It was used as an additive to
the bio-resin to improve the mechanical, thermal and mechanical properties.
1, 3 and 5% of Cloisite® 30B was added to the control resin and the BSM resin. The
resins with the nanoclays were homogenised on an ultrasonic bath for one hour to
ensure complete mixing. The accelerator and catalyst were then added and the resin
was cured overnight at room temperature and post-cured for 3 hours at 80 °C.
3.8 Biodegradability tests
55
In this section different tests namely soil burial, microbial growth and respirometric
tests were conducted to verify the biodegradability of the BSM bio-composite. A
comparison was made to the control specimens.
3.8.1 Soil burial tests
Two biodegradability tests, namely soil burial test and microbial growth test were
conducted. Both the control and BSM bio-composite samples with dimensions of 2
cm x 2 cm were weighed and buried in a large container of soil, to which soil
nutrients were added. These tests were conducted at ambient temperature (25-30 °C).
The biodegradation was monitored for 120 days. The specimens were weighed to
record the wet mass and then washed and dried at 40 °C for 24 hours, thereafter they
were re-weighed to record the dry mass.
3.8.2 Microbial growth tests
For the microbial growth test, Aspergillus niger (a fungi that is most commonly
found in decaying vegetation or soil and plants) was grown on potato dextrose agar
for five days. The spores were collected and suspended in sterile water. The sterile
control and BSM bio-composites were inoculated with the spores and incubated at 30
°C for seven days. Change in fungal growth was observed and analyzed. Growth
measurement of the fungi was determined by two methods namely dilution plating
and optical density of culture suspension.
3.8.2.1 Growth measurement: Dilution Plating
1 g sample from the zone of maximum growth of the fungi was cut, weighed and
soaked for 30 minutes in 0.1% peptone water at room temperature. The soaked
samples were then homogenized / vortexed for 1 minute in a homogenizer / vortex-
mixer. Dilutions up to 10-4
in 0.1% peptone water were prepared, following the
serial-dilution method, of homogenized / vortexed samples and spot plated with 0.1
ml-0.01 mL inoculum, from 10-3
and 10-4
dilutions, in pre-sterilized Petri-dishes
containing potato-dextrose agar medium. The plates were then incubated at 25 oC for
4-5 days in an incubator. The plates were checked for growth every day. The zone-
diameter was recorded using an appropriate measuring scale.

56
3.8.2.2 Growth measurement: Suspension Culture
1 g sample from the area of maximum growth was cut, weighed and soaked for 30
minutes in 0.1% peptone water at room temperature. The soaked samples were then
homogenized / vortexed for 1 minute in a homogenizer / vortex-mixer.
The homogenized /vortexed samples were added to pre-sterilized 250 mL
Erlenmeyer flasks containing 50 mL potato-dextrose broth. The flasks were then
incubated at 25 oC, at 150 rpm for 4-5 days* in an orbital-shaker incubator. The
flasks were checked for growth every day. The optical density, which is a measure of
light scattering or turbidity, for growth in absorbance units was recorded using a
spectrophotometer (Merck, Spectroquant Pharo 300) at 600 nm after 2.5 times
dilution of culture.
*60 hrs used in this experiment.
3.8.3 Respirometric tests
This section focuses on a respirometric method that provided a direct measurement
of the oxygen consumed by micro-organisms in biodegradation processes from an air
or oxygen-enriched environment in a closed vessel.
Biodegradation Test: The biometer flask technique developed by Chiellini research
group, Biolab, University of Pisa [146] was used in this study to test the
biodegradability of the composite and polymer samples as shown in Figure 3.14
labelled by (A) Lid with airtight seal, (B) Beaker containing KOH solution, (C) Top
layer of coarse perlite particles, (D) Layer of composting soil, mixed with sample
material and fine perlite, (E) Bottom layer of coarse perlite particles.

57
Figure 3.14: A biodegradation flask for respirometric testing
Compost inoculum that was three months old was sieved to a size of < 0.8 cm. Its
physical and chemical characteristics were determined according to the ASTM
D6400 standard [147] and the results are shown in Table 3.6.
Table 3.6: Physical and chemical properties of compost used in biodegradation
test
Analysis of inoculum
Respiration Rate 57.2 mg CO2 per gram volatile solids in the first ten days
Total dry solids (%) 55
pH value 7.2
Moisture (%) 50 (wet basis)
Volatile Solids (%) 23 (dry weight basis)
Total Nitrogen (%) 0.9 (dry weight)
The compost was mixed with finely ground perlite particles in a 1:1 dry weight ratio
to maintain proper humidity and aerobic conditions. The BSM composite test
materials (Table 3.7) were pelletized to an average size of ≥ 100 μm and then added
to the compost mixture in a ratio of 1:6 (w/w sample to dry solids of compost).
Cellulose powder with a particle size of less than 20 μm (cellulose microcrystalline,

58
Sigma Aldrich, South Africa) was used as the positive control reference, since it was
considered as a fully biodegradable material [148]
Table 3.7: Description of test materials used for biodegradation studies
S.N Sample Description Amount
(mg)
%
Carbon
Carbon
(mg)
Th CO2
(mg)
1 BSMF_A banana sap maleate + Fibre 5055 61.32 3099.73 11365.66
2 BSMF_B banana sap maleate + Fibre 5033 61.32 3086.24 11316.20
3 BSMF_C banana sap maleate + Fibre 5003 61.32 3067.84 11248.75
4 BSM_A banana sap maleate 5005 65.49 3277.77 12018.51
5 BSM_B banana sap maleate 5020 65.49 3287.60 12054.53
6 BSM_C banana sap maleate 5024 65.49 3290.22 12064.13
7 CR_A Control Resin 5001 66.13 3307.16 12126.26
8 CR_B Control Resin 5017 66.13 3317.74 12165.05
9 CR_C Control Resin 5003 66.13 3308.48 12131.11
10 CRF_A Control Resin+Fibre 5012 60.17 3015.72 11057.64
11 CRF_B Control Resin+Fibre 5011 60.17 3015.12 11055.44
12 CRF_C Control Resin+Fibre 5010 60.17 3014.52 11053.23
13 Cellulose –A Microcrystalline cellulose 5001 42.3 2115.42 7756.55
14 Cellulose –B Microcrystalline cellulose 5005 42.3 2117.12 7762.76
15 Cellulose –C Microcrystalline cellulose 5009 42.3 2118.81 7768.96
The mixture was then placed in a 1000 mL glass airtight flask. The compost and
pelletized particle mixture was placed between two layers of wetted perlite, each
being 15 g in mass. Water was added to the perlite in order to create a moist
environment. Finally, a beaker containing 40 ml of potassium hydroxide solution
(0.5 N KOH) was placed on the upper layer to trap emitted carbon dioxide. The BSM
composite and control samples were tested in triplicate and the flasks were kept in an
IsoTemp Oven which maintained the samples at the optimum composting
temperature of 58 ± 2 °C. The conditions within the oven and flasks were aerobic.
The flasks were periodically removed from the oven and the KOH solution was
titrated with 0.1N HCl. After each titration, the beaker was washed and refilled with
fresh KOH solution. The moisture in the test flask was recorded with a moisture
analyzer. The moisture content of each flask was measured with a moisture analyzer

59
and was maintained between 50-55% by measuring the weight loss due to
evaporation.
The biodegradation of the material was tracked by trapping all of the emitted CO2 in
the KOH solution. The carbon dioxide emitted by organic metabolization of the
material was representative of the total degradation. Gaseous CO2 emitted reacted
with the KOH in the beaker. Eqn. 3.12 below describes this:
2KOH + CO2 → K2 CO3 + H2O (3.12)
The beaker containing KOH was removed from the biodegradation flask and barium
chloride (1N BaCl2) was added to the KOH-K2CO3 solution. This reaction is shown
below (Eqn. 3.13):
K2 CO3 + BaCl2 → + BaCO3 + 2KCl (3.13)
The barium carbonate formed in Eqn. 3.20 appeared as a cloudy white precipitate.
The remaining amount of KOH in the solution was determined by titrating with 0.5N
HCl, using phenolphthalein as an endpoint indicator (Eqn. 3.14).
KOH +HCl →H2O + KCl
(3.14)
The theoretical amount of carbon dioxide produced by total oxidation of incubated
materials in each flask (ThCO2 in g per vessel) was calculated using the following
expression (Eqn. 3.15):
ThCO2= Mtotal × Ctotal × 4412�
(3.15)
where, Mtotal is the total dry amount of constituent or plastic materials (g) added to
the compost, Ctotal is the relative amount of total organic carbon (g) in the total dry
solids, 44 is the molar mass of carbon dioxide and 12 is the atomic mass of carbon.
The rate and extent of biodegradation of the materials listed in Table 3.7 was
evaluated in compost environments under controlled conditions according to the
ASTM D5338 method [149]. A biodegradation curve was obtained by plotting

60
released CO2 (%) versus composting time. Biodegradation was calculated as the
percentage of carbon in the polymer mineralized as CO2 according to Eqn. 3.16:
Biodegradation �% = (CO2)s-( CO2 )c ThCO2 ×100
(3.16)
where (CO2)s and (CO2)c are the amount of CO2 produced in the sample and in the
control (blank) respectively.
The respirometric test was conducted in a biometer flask in a controlled environment
where the temperature was between 58-60 °C, pH 7-8 and moisture 50-55%. These
conditions were suitable for mesophilic and thermophilic microorganisms (bacteria
and fungi) in organic manure compost environment.
After 55 days of incubation a known amount of sample was recovered from
respective test flasks to characterize the changes in structural and thermal properties
of BSM, BSMF, CR and CRF test materials. The recovered samples were easily
distinguishable; further washed with de-ionized water and dried in oven at 40 °C for
4 hrs. These were analyzed using TGA, DSC, FTIR and SEM techniques.
3.9 Summary
This chapter explained the method used in the preparation of the bio-resin and
biocomposite in comparison to the control specimens. The materials used were
defined. An explanation of the various techniques and its applicability in this study
was given. The next chapter discusses the chemical composition of the banana sap
and its role in the formulation of the bio-resin. The synthesis and characterization of
the bio-resin is presented.

61
CHAPTER 4– RESULTS AND DISCUSSION: THE SYNTHESIS
AND CHARACTERIZATION OF THE BIO-RESIN FROM
BANANA SAP
Introduction
This chapter focuses on the analysis of the banana sap (BS) and the synthesis and
characterization of the bio-resin (BSM). Since physical and chemical analysis results
of BS were not available, it was deemed critical to develop the knowledge of results.
The first part of this chapter deals with the findings and analysis of BS and its
purpose in the formulation of the bio-resin. Chemical compounds present in the sap
were identified and predictions were made of the reaction with the bio-resin. The
second part of this study involves the synthesis of a bio-resin7 using BS. Throughout
this study comparison is made to a control sample.
4.1 Characterization of banana sap
The BS was characterized in order to understand its chemical and physical
background and to foresee its role in the bio-resin formulation.
4.1.1 Physical testing of BS
Since the water content of BS was over 90% [91], its chemical and physical
properties were compared to that of water. Table 4.1 shows a comparison of the
physical properties of BS to deionized water.
Table 4.1: Physical properties of BS compared to water
Physical parameter Banana sap Water
Total dissolved solid (TDS) (%) 0.88 -
pH 5.45 7.00
Conductivity (mS/cm) 6.67 5.89
Density (g/cm3) 1.0030 0.9970
7 Extracts from Chapter 4 have been published as “Formulation of a novel bio-resin from banana sap”,
Industrial Crops and Products, 43, (2013), 496-505.

62
Interferences by inorganic and organic substances shown by TDS act as a benchmark
indicator for the species of Musa Cavendish analyzed. BS is acidic in nature (pH
5.45) which could be attributed to the tannic acid in the sap [150]. Literature
reviewed showed that traditional medicine capitalized on the astringent property of
BS related to the pH for the treatment of a variety of ailments [151]. The presence of
ions in the BS was confirmed by a conductivity reading of 6.67 mS/cm which was
further verified by ICP-AES shown in Table 4.2. The larger value of the conductivity
indicated that more ions were present in the BS than water.
4.1.2 ICP-AES analysis of BS
The elemental values shown in Table 4.2 are indicative of this species of banana
plant and the results may vary from species to species because of climate and locality
variation. As expected it was found that potassium and magnesium were the most
abundant elements present in the BS. In another study conducted in Brazil with
indigenous banana plants, Feriotti and Iguti found that the BS contained 874 mg.L-1
of potassium, 88 mg.L-1
sodium and 116 mg.L-1
of magnesium [152].
Table 4.2 : Elemental analysis of banana sap by ICP-AES
Element Banana sap (mg/L)
Potassium 200
Magnesium 100
Iron 7.3
Silicon 7.0
Copper 6.5
Sodium 5.1
Sulphur 3.2
Phosphorus 1.8
Calcium 1.5
4.1.3 Qualitative and quantitative analysis of carbohydrates
Carbohydrates are synonymous with the term saccharide. The carbohydrates
(saccharide) are categorized into monosaccharides, disaccharides, oligosaccharides

63
and polysaccharides. This study focuses on monosaccharides and disaccharides
which are commonly referred to as sugars [153].
A positive Molisch test (Figure 4.1), indicative of a purple colour, obtained for BS
indicated the presence of carbohydrates.
Figure 4.1: Reaction scheme showing a positive Molisch test for carbohydrates
[154]
As a consequence of the positive Molisch test, the concentration of carbohydrates in
the BS was further quantified by HPLC analysis. Two sets of HPLC analysis were
performed. Firstly the initial BS that was added to the processing of the bio-resin was
analyzed and secondly the solvent (normally water) expelled during the
polycondenzation reaction of the bio-resin synthesis was analyzed. Figure 4.2 shows
the retention times and areas of the calibration standard solutions of 1% sucrose,
glucose and fructose. BS was sequentially quantified by matching the area and
retention time with the respective standards. Table 4.3 lists the concentration of
sucrose (0.021%), fructose, (0.036%) and glucose (0.04%) quantified by HPLC in
BS by the calibration standard method. It was important to further analyze these
sugars that were reported by other researchers as possible cross-linkers [117, 155,
156].

64
Figure 4.2: HPLC analysis and quantification of carbohydrates in BS
Table 4.3: Concentration of sugars present in initial banana sap and the
condensate collected during the polycondenzation reaction
*ND-Not detected
Sugars Sugars in initial sap (%) Sugars in condensate (%)
Sucrose 0.021 0.016
Glucose 0.036 ND*
Fructose 0.040 ND*
Banana sap
Standard
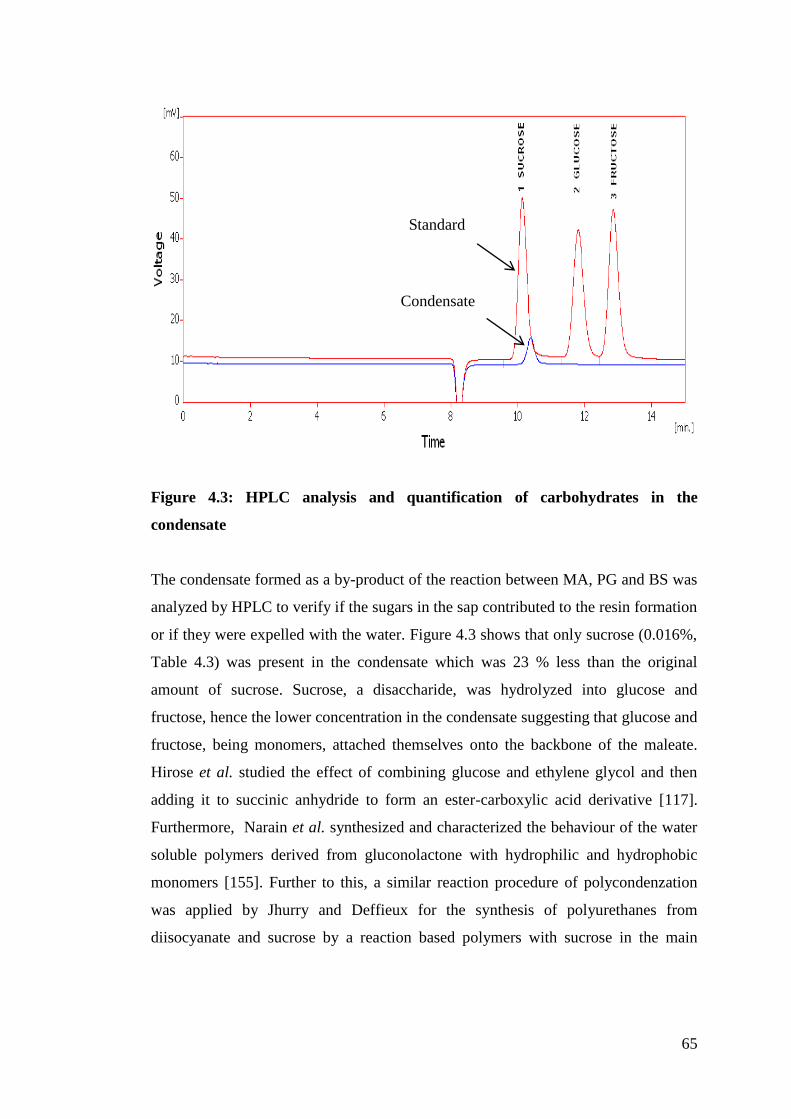
65
Figure 4.3: HPLC analysis and quantification of carbohydrates in the
condensate
The condensate formed as a by-product of the reaction between MA, PG and BS was
analyzed by HPLC to verify if the sugars in the sap contributed to the resin formation
or if they were expelled with the water. Figure 4.3 shows that only sucrose (0.016%,
Table 4.3) was present in the condensate which was 23 % less than the original
amount of sucrose. Sucrose, a disaccharide, was hydrolyzed into glucose and
fructose, hence the lower concentration in the condensate suggesting that glucose and
fructose, being monomers, attached themselves onto the backbone of the maleate.
Hirose et al. studied the effect of combining glucose and ethylene glycol and then
adding it to succinic anhydride to form an ester-carboxylic acid derivative [117].
Furthermore, Narain et al. synthesized and characterized the behaviour of the water
soluble polymers derived from gluconolactone with hydrophilic and hydrophobic
monomers [155]. Further to this, a similar reaction procedure of polycondenzation
was applied by Jhurry and Deffieux for the synthesis of polyurethanes from
diisocyanate and sucrose by a reaction based polymers with sucrose in the main
Standard
Condensate

66
chain [156]. From the work done by these researchers it is evident that sugars such as
glucose and fructose can be effectively used as cross-linkers in biopolymers.
In this study, two possible synthetic pathways are shown in Figures 4.4 and 4.5 for
the possible reactions of glucose and fructose with the maleic acid-propylene glycol
polymer backbone. Fructose and glucose have at least two reactive ends that
connected to the polymer chains. As seen in Figures 4.4 and 4.5 the polymer chains
were lengthened resulting in a higher molecular mass compared to the control resin.
Tillet et al. showed that a lower molecular-weight range often required a cross-
linking step to obtain satisfactory mechanical properties [157]. The molecular
weights of the BSM and control resins were 2179 and 2114 g.mol-1
respectively. It is
also important to note that BS is a complex matrix with many chemical compounds
as shown by HPLC and GC-MS. It is also possible that the other components could
have contributed to the increase in the strength of the material. In another study,
Lamaming et al. showed that by adding glucose and sucrose to binderless particle
boards increased the modulus of rapture and internal bond strength [158].
Figure 4.4: A possible reaction scheme of the product formed when glucose is
attached to maleic acid- propylene glycol polymer backbone
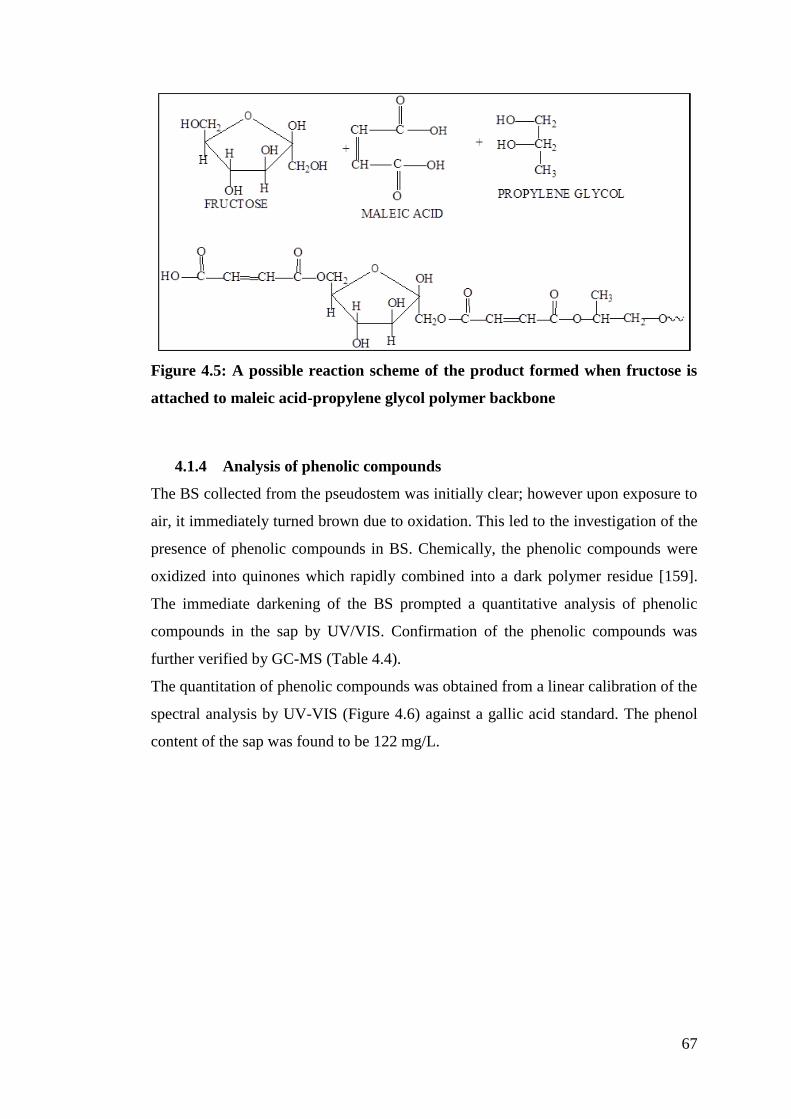
67
Figure 4.5: A possible reaction scheme of the product formed when fructose is
attached to maleic acid-propylene glycol polymer backbone
4.1.4 Analysis of phenolic compounds
The BS collected from the pseudostem was initially clear; however upon exposure to
air, it immediately turned brown due to oxidation. This led to the investigation of the
presence of phenolic compounds in BS. Chemically, the phenolic compounds were
oxidized into quinones which rapidly combined into a dark polymer residue [159].
The immediate darkening of the BS prompted a quantitative analysis of phenolic
compounds in the sap by UV/VIS. Confirmation of the phenolic compounds was
further verified by GC-MS (Table 4.4).
The quantitation of phenolic compounds was obtained from a linear calibration of the
spectral analysis by UV-VIS (Figure 4.6) against a gallic acid standard. The phenol
content of the sap was found to be 122 mg/L.
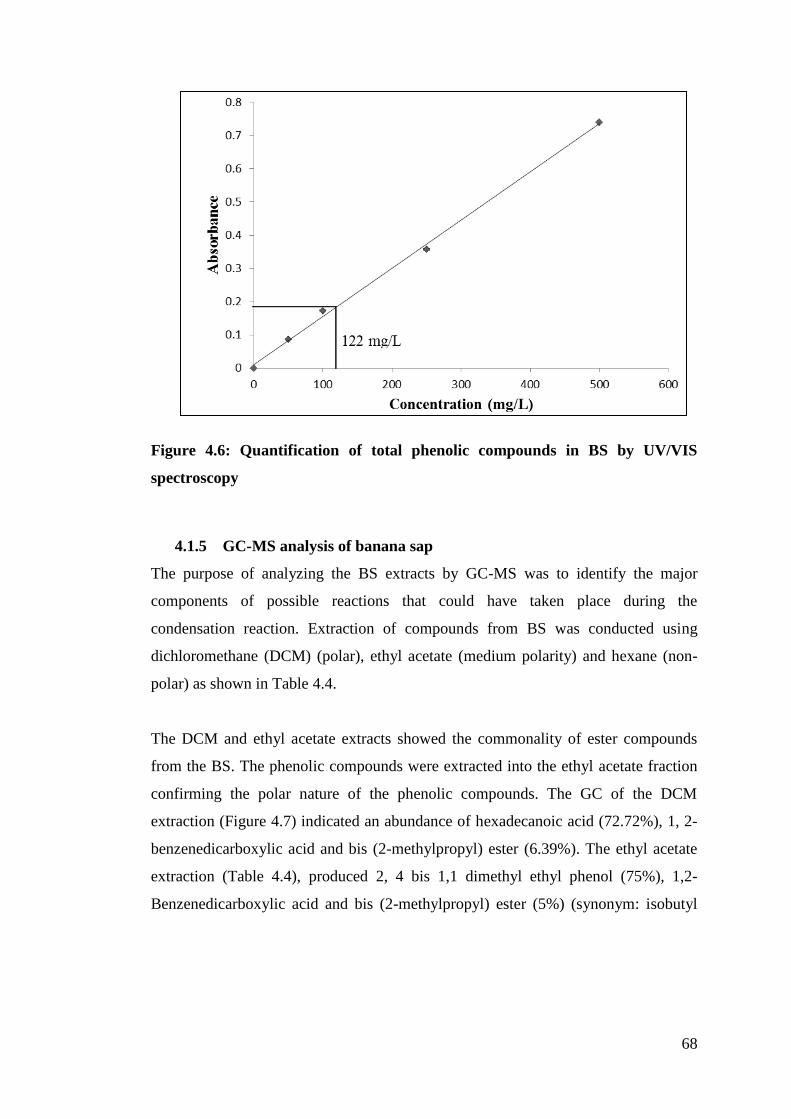
68
Figure 4.6: Quantification of total phenolic compounds in BS by UV/VIS
spectroscopy
4.1.5 GC-MS analysis of banana sap
The purpose of analyzing the BS extracts by GC-MS was to identify the major
components of possible reactions that could have taken place during the
condensation reaction. Extraction of compounds from BS was conducted using
dichloromethane (DCM) (polar), ethyl acetate (medium polarity) and hexane (non-
polar) as shown in Table 4.4.
The DCM and ethyl acetate extracts showed the commonality of ester compounds
from the BS. The phenolic compounds were extracted into the ethyl acetate fraction
confirming the polar nature of the phenolic compounds. The GC of the DCM
extraction (Figure 4.7) indicated an abundance of hexadecanoic acid (72.72%), 1, 2-
benzenedicarboxylic acid and bis (2-methylpropyl) ester (6.39%). The ethyl acetate
extraction (Table 4.4), produced 2, 4 bis 1,1 dimethyl ethyl phenol (75%), 1,2-
Benzenedicarboxylic acid and bis (2-methylpropyl) ester (5%) (synonym: isobutyl

69
phthalate). The hexane extraction (Table 4.4) indicated the presence of the
1,3dimethyl benzene (34%) and ethyl benzene (15%).
The phenolic compounds were confirmed by the UV/VIS and GC-MS methods. It is
possible that these esters and phenolic compounds self-polymerize before attaching
themselves to the maleate backbone.
Table 4.4: Identification of most abundant compounds extracted from BS by
GC-MS
DCM extract Abundance
%
Ethyl acetate
extract
Abundance
%
Hexane extract Abundance
%
Hexadecanoic
acid
1,2-Benzene
dicarboxylic
acid, butyl 2
methylpropyl
ester
6, 10, 14
trimethyl- 2-
Pentadecanone
Dihydro-5-
pentyl 2(3H)-
furanone
Dibutyl
phthalate
72.72
6.39
5.14
4.8
3.18
2,4-bis-1,1-
dimethylethyl
phenol
1,2,3 trimethyl
benzene
1-ethyl-3-
methyl
Benzene
1,2-Benzene
dicarboxylic
acid, bis
(2methylpropyl)
ester
51.4
12.2
7.3
2.6
1,3 dimethyl
benzene
Ethyl benzene
3 methyl
heptane
2 methyl
heptane
34
15
12.6
9

70
Figure 4.7: Gas chromatogram of the DCM extract of BS
As mentioned earlier, BS is a complex matrix with various components. In the
current work, it is possible that hexadecanoic acid (which is commonly known as
palmitic acid) present in the BS, together with MA, reacted with the PG to form the
hybridized BSM resin. Research elsewhere has shown that derivatives of
hexadecanoic acid can be isolated into monomers and are used as starting material
for a wide range of bio-polyesters [160]. Stales et al. showed that 1,2-
Benzenedicarboxylic acid-1,2-bis(2-methylpropyl) ester otherwise known as isobutyl
phthalate behave as a plasticizer [161]. Plasticizers are chemical substances used to
soften PVC to produce flexible and durable goods such as floors, cables and wall
coverings.
4.2 Synthesis of control and BSM resins
Banana sap was the major component in the manufacture of the resin; hence the
chemical analysis performed in the previous sections on the BS gave a better
understanding of the mechanisms that occurred.
During the condensation polymerization process, propylene glycol and maleic
anhydride reacted with the BS to form a hybrid unsaturated polyester resin and water

71
as a by-product. This water was analyzed by HPLC (Figure 4.3) as discussed in
section 4.1.3. The acid number, which is an indication of the measure of carboxylic
acid, of the resin was periodically measured during the processing of the resins as
shown in Table 4.5A and B. Generally, an acid value less than 50 is desirable [128]
and it was found that BSM and control resins had acid values of 43 and 44
respectively.
A comparison of the acid values and viscosities of the control and BSM resins
showed that with an increase in reaction time there was a corresponding decrease in
the acid numbers. In Table 4.5A and Figure 4.8A the acid number of the control
sample decreased from 125 to 44 and the viscosity increased from 0.9 to 4 poise. In
Table 4.5A an increase in acid value of the control resin between the 13th and 14th
hour of the experiment from 83.9 to 87.2 was observed. This was due to increasing
temperatures during the resin processing when PG was lost. To overcome this spike
in temperature and acid value, 50mL of PG was added to the cook to stabilise the
reaction.
Table 4.5A: Acid value and viscosity values of control resin
Time (hours) Acid value Viscosity (Poise) 5 124.5 0.9 6 105.4 1.1 7 100.8 1.3 9 99.2 1.9 10 96.7 2.1 11 89.6 2.8 12 80.7 3 13 83.9 3.1 14 87.2 4 15 72.4 4.9 16 58.7 4 17 44.4 4.1

72
Figure 4.8A: Correlation of acid value and viscosity as a function of time of the
control resin
In Table 4.5B and Figure 4.8B the acid value for BSM bio-resin decreased from 147
to 43 and the viscosity increased from 0.1 to 6 poise. With a decrease in acid value
and an increase in viscosity the polymer chain length grew with time shown by the
increase in molecular weight as shown in Figure 4.10. Since the initial acid value of
147 of the BSM bio-resin was higher than the control resin due to the water in the
BS, the processing of the BSM resin took a longer time.
Table 4.5B: Acid value and viscosity values of BSM bio-resin
Time (hours) Acid value Viscosity
(Poise) 15 147.1 1 16 96.1 2.5 17 86.7 2.8 18 76.2 4 19 69.7 4.9 20 63.1 6.9 21 61.1 11 22 44.8 5 23 43 6

73
Figure 4.8B: Correlation of acid value and viscosity as a function of time of the
BSM bio-resin
Unsaturated polyester resins are important in the industrial field and the molecular
weight at most is between 1000 and 2500 g/mol and it is not an overstatement to say
that molecular weights above 3000 can be achieved [162]. Since it was desirable to
obtain a polymer chain of the above molecular weights it was found that further
processing of the resin to obtain lower acid value, higher viscosity and molecular
mass resulted in the resin gelling and being completely charred as shown in Figure
4.9. The optimum values the BSM bio-resin was: acid value < 50, viscosity between
4-6 poise and molecular weight of 2000-2500 g/mol.

74
Figure 4.9: Consequence of cooking the resin to obtain larger molecular weights
It was also observed that as the acid value decreased, the viscosity and the molecular
weight increased. As the acid-glycol esterification reaction proceeded, an increase in
viscosity and molecular weight at the end of the processing was recorded. Visual
observation showed the thickening of the bio-resin. Here the large polymer chains
started to join together and thus the molecular weight increased. Figure 4.10 showed
the increase in molecular weight growth with time. The BSM resin had a molecular
weight (MW) of 2179 units and the control resin had a molecular weight of 2114
units. The higher molecular weight of BSM was contributed by the cross-linking of
glucose, fructose and possibly other components of the BS attached to the maleate
backbone as proposed in Figures 4.4 and 4.5 respectively.

75
Figure 4.10: Molecular weight distribution of the control and BSM bio-resin
4.3 Characterization of control and BSM resins
Various analytical and mechanical testing performed on the BSM and control resins
will be explained in this section.
4.3.1 Physical testing
Table 4.6 illustrates the comparison of the results of the control and BSM resin to an
industry standard resin that was also an unsaturated polyester resin. Although the
viscosity, density and gel times of the control and BSM were similar to the industry
resin, there were inconsistencies with the acid value. The starting materials for the
industry resin were different to MA and PG resulting in a lower acid value which
was a measure of the amount of carboxylic groups on the polymer chain.

76
Table 4.6: Specifications of the control and BSM resins as compared to an
industry resin*
Test Industry Resin* Control resin BSM resin
Acid value (mg KOH/g resin) 18-26 44 43
Volatile content 39-43 39 40
Viscosity at 25°C
(Brookfield sp 3 500 rpm)
200-300 300 200
Stability at 120°C (hours)
at ambient (months)
4
6
4
-
2.5
-
Rel. density at 25°C (g.cm-3
) 1.10 1.098 1.093
Time to gel (min) 20-25 28 20
Time to peak (min) 40-50 36 31
Peak exotherm (°C) 140-160 203 207
*The name of the industry resin cannot be disclosed due to confidentiality
4.3.2 Gel time, time to peak, cure time, peak exotherm
The gel times of 28 minutes and 20 minutes were obtained for BSM and control
resins respectively as shown in Table 4.6. The time-to-peak of 36 minutes and 31
minutes were obtained for the BSM and control resins respectively. However these
gel and cure times can be lengthened or shortened by varying the amount of cobalt
naphthenate and MEKP to accommodate the size of the laminate to be prepared.
The time-to-peak exotherm is the interval between the initial mixing of reactants
(MEKP and cobalt naphthenate) of a thermosetting polymer until the highest
exothermic temperature is reached. The resin continued to harden after it gelled until
it obtained its full hardness and properties. This exothermic reaction proceeded
quickly.

77
Table 4.7: A comparison of gel time, time to peak, cure time and peak exotherm
of control resin by varying the amount of Co added
The mass of the accelerator (cobalt) added to the control resin varied from 0.5 g, 0.8
g and 1.0 g and the catalyst (MEKP) was held constant at 1 g as shown in Table 4.7.
The gel times decreased from 39 min to 28.1 min to 16.3 min respectively with the
increasing amount of cobalt. The cure times decreased from 91.17 min to 66.46 min
to 40.49 min, respectively. Controlling cure times was deemed an advantage as the
cure times can be adjusted to suit the manufacturing process.
Table 4.8: Gel time, time to peak, cure time and peak exotherm of control resin
compared to BSM resin
Table 4.8 show the gel and cures times of the BSM and control resin with the
accelerator and catalyst kept constant. BSM gelled at 15.30 min compared to the
control resin at 39 min. This was possibly due to the BS in the resin behaving as an
accelerator for the curing of the unsaturated resin. In addition the presence of glucose
and fructose in BS serve as cross-linking agents in the resin formulation, thus
lowering gel time. The gel time of the control resin was 39.00 min as compared to
15.30 min for the BSM resin. Similarly, the cure times of the control and BSM resins

78
were 91.17 min and 37.37 min respectively. The cure time of BSM bio-resin was
more than halved with the result that using the BS in the formulation was cost
effective and time saving. A typical graph of the relationship of temperature and gel
time is shown in Figure 4.11. The duration of the curing can be controlled by
carefully adjusting the amount of catalyst and accelerator to accommodate the panel
size and the type of application so that the resin does not gel whilst being infused
into the fibres.
Figure 4.11: Gel time and peak exotherm profile of the resin
4.3.3 Adjustment of stability and gel time
The requirement of the stability test of the BSM resin was that it be stable for up to 4
hours in an oven at 120 °C. However, it was observed that the BSM resin failed this
test and gelled within 2.5 hours at 120 °C (see Table 4.6). To improve the stability of
the resin, 400 ppm of Ethanox®, an antioxidant was added. Ethanox® is used to
enhance thermal stability, improve lubricant performance and reduce sludge
formation of resins [163]. The shelf life of the BSM resin improved and the sample
gelled only after 4 hours. But with improved stability, the gel times were
compromised. When 400 ppm of Ethanox® was added, the gel time of the BSM
resin increased to 38 minutes. To address this compromise, the amount of accelerator
and catalyst the gel time can be adjusted as required.

79
4.3.4 FT-IR analysis of BSM and control resin
Fourier Transform Infra-Red analysis was performed on BS, PG, MA and the control
and BSM resins. Figure 4.12 shows the FTIR scans of the functional groups of MA,
PG and BS that were used as the starting material in the formation of the resin. The
carbonyl groups of the MA are at 1855 cm-1
and 1776 cm-1
. The FTIR analysis of the
PG and BS were dominated by hydroxyl moieties at 3310 cm-1
and 3320 cm-1
,
respectively. The peak at 1628 cm-1
in the BS was attributed to the presence of
ketones and 1030 cm-1
to C-O stretching. During the processing of the bio-resin the
functional groups of MA, PG and BS react to form chemical bonds that are either
enhanced or diminished as shown in Figure 4.13.
Figure 4.12: FTIR of starting materials of the resin namely banana sap, maleic
anhydride and propylene glycol
The polyester chain grows as the acid and the hydroxyl groups combine to form ester
and water is removed in the polycondenzation reaction as seen in Figure 4.13 during

80
the processing at 2 hours, 12, 13 and 15 hours. As the resin was processed and the
water from the BS was removed, the O-H band at 3400 cm-1
slowly disappeared. The
carbonyl stretch at 1709 cm-1
and 1716 cm-1
gradually became more pronounced as
the esters were formed. The peak at 1640 cm-1
gradually disappeared as the -C=C-
stretching bond broke.
Figure 4.13: FTIR scans of the BSM resin during 2, 12, 13 and 15 hours of
processing time
Figures 4.14 show the FTIR overlay scans of the cured control and BSM resins. It
was noticed that the broad band associated with OH groups at 3530 cm-1
almost
disappeared with the BSM bio-resin as the cured BSM bio-resin did not have any
moisture in it. A strong absorption band at 2920 cm-1
was assigned to –C=C–
functionality of the polyester group. A greater crosslinking in BSM showed a more
intense double bond peak. The prominent peak at 1727 cm-1
representing the
carbonyl peak (C=O) was more intense for the BSM bio-resin than the control resin.
This functional group is associated with a larger ester group of the BSM. These ester

81
compounds in the BS were identified by GC-MS as shown in Table 4.4. There was a
shift in wavenumbers from 1150 cm-1
to 1100 cm-1
from the control to BSM resins.
These peaks are indicative of the –C-O-C- ester linkages and the shift was attributed
to the addition of BS in the resin.
Figure 4.14: FTIR scan of an overlay of the cured control and BSM resins
4.3.5 Thermal analysis (TA) of BSM and control resins
Thermal gravimetric analysis provided information on the initial and final
degradation behavioural patterns and decomposition of the BSM resin in comparison
to the control resin. The thermogravimetric plots (Figure 4.15) show that the initial
onset degradation temperature of the BSM resin at 352 °C and the control composite
at 343 °C are comparable. In a separate reaction that looked at degradation patterns
the final degradation of BSM resin was reached at 403 °C while that for the control
composite was 392 °C. The weight loss at final degradation of BSM and the control
were 6.2% and 9.9%, respectively. The presence of organics such as esters, sugars

82
and phenolic compounds from the BS [164] increased the thermal stability of the
BSM resin resulting in increased thermal properties.
Figure 4.15: TG curves of BSM and control resin showing the onset degradation
temperature
Figure 4.16 showed a shift in the DSC thermogram of BSM compared to the control
resin. BSM resin had a higher melt and crystallization enthalpy than the control resin
(Table 4.9) thus an indication that the BS resin was more stable and harder. A
possible reason was due to the organics and sugars present in BS (GC-MS data Table
4.4 and HPLC data Table 4.3) which may have initiated cross-linking on the polymer
backbone. The percent crystallinity was calculated based on 140 J/g for a 100%
crystalline polymer (polyethylene terephthalate). BSM had a crystallinity of 58% and
the control resin had 52%. Since, crystallinity is an indication of amount of
crystalline region in the polymer with respect to amorphous content, it can be
concluded that the BSM and control resins are both amorphous and crystalline. XRD
results of the BSM resin and BSM biocomposite that give an indication of the

83
crystallinity are further explained in Figure 5.13, Chapter 5. Crystallinity influences
many of the polymer properties such as hardness, modulus, tensile, stiffness and
melting point [165].
Figure 4.16: Comparison of DSC curves of BSM resin and control resin
Table 4.9: Crystallization temperature, melting point and enthalpy change of
control resin and BSM resin
4.3.6 Kinetic studies on BSM and control resins
During the curing cycle of the resins, many complex physical and chemical changes
take place [166]. For that reason it was deemed important to perform cure kinetic
studies for thermosetting resins to obtain the ideal processing conditions that will
provide the required structural performance for specific applications [166].
Sample Melt enthalpy
(J/g)
Crystallization enthalpy
(J/g)
Degree of crystallinity
(%)
Control Resin 62.7 135.0 52
BSM Resin 126.5 208.4 58
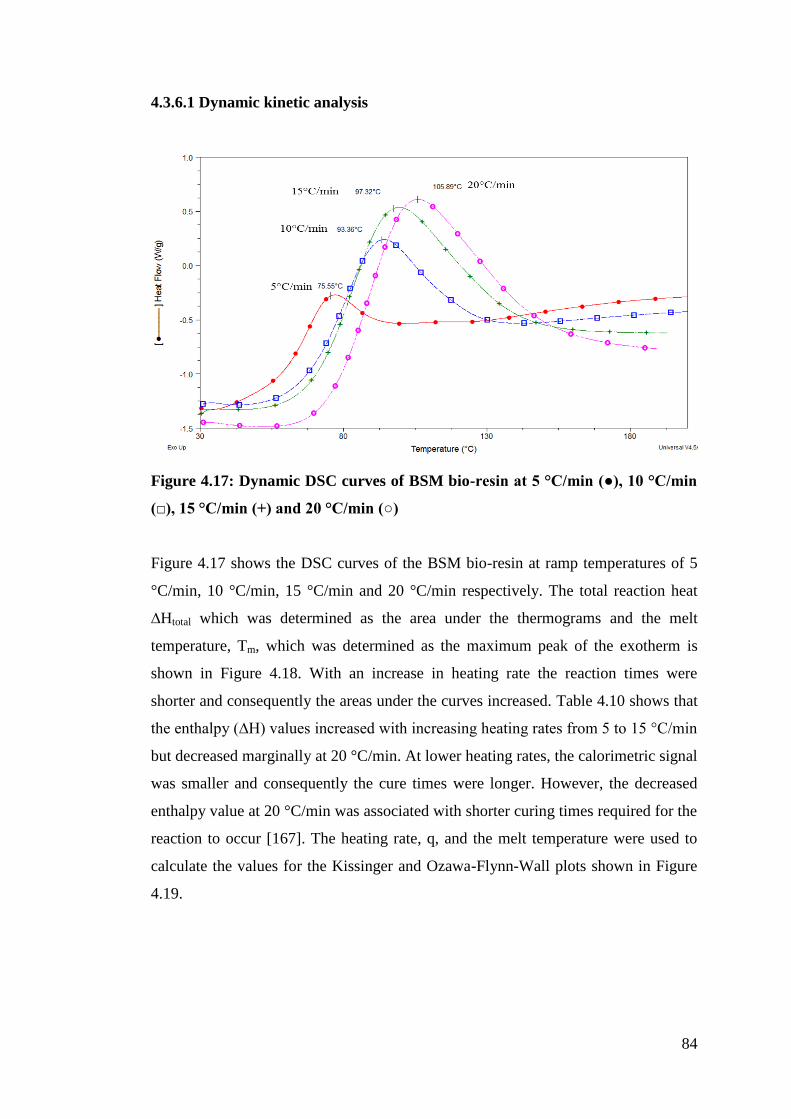
84
4.3.6.1 Dynamic kinetic analysis
Figure 4.17: Dynamic DSC curves of BSM bio-resin at 5 °C/min (●), 10 °C/min
(□), 15 °C/min (+) and 20 °C/min (○)
Figure 4.17 shows the DSC curves of the BSM bio-resin at ramp temperatures of 5
°C/min, 10 °C/min, 15 °C/min and 20 °C/min respectively. The total reaction heat
∆Htotal which was determined as the area under the thermograms and the melt
temperature, Tm, which was determined as the maximum peak of the exotherm is
shown in Figure 4.18. With an increase in heating rate the reaction times were
shorter and consequently the areas under the curves increased. Table 4.10 shows that
the enthalpy (∆H) values increased with increasing heating rates from 5 to 15 °C/min
but decreased marginally at 20 °C/min. At lower heating rates, the calorimetric signal
was smaller and consequently the cure times were longer. However, the decreased
enthalpy value at 20 °C/min was associated with shorter curing times required for the
reaction to occur [167]. The heating rate, q, and the melt temperature were used to
calculate the values for the Kissinger and Ozawa-Flynn-Wall plots shown in Figure
4.19.

85
Table 4.10: Heats of reaction and peak temperatures at different heating rates
q (°C) ΔH (Jg -1
) Tm (°C) Tm (K) Tm2
(K) 1000/Tm (K) Kissinger OFW (ln q/Tm
2) (ln q) 5 189.7 77.03 350.18 122626 2.86 -10.11 1.61 10 240.3 94.21 367.36 134953.4 2.72 -9.51 2.30 15 252.2 99.43 372.58 138815.9 2.68 -9.13 2.71 20 246.5 105.89 379.04 143671.3 2.64 -8.88 3.00
Figure 4.18: Kissinger’s (■) and Ozawa-Flynn-Wall (●) plots of ln q versus
temperature
The activation energy (Ea) of the BSM bio-resin defined as the minimum amount of
energy required for a chemical reaction to occur, was determined by the application
of Kissinger and OWF methods from the gradients of Figure 4.18 for the BSM resin
system. The value of the activation energy using Kissinger’s method was calculated
(shown below) using equation 4.1 as referred to by Rantuch et al. [168].
Ea = −aR (4.1)
where, a is the slope from Kissinger’s plot (-5.638) and R is the universal gas
constant (8.314 J K-1
mol-1
).
The value for the activation energy using the OFW method was calculated using
equation 4.2 as referred to by Rantuch et al. [168].

86
Ea = −bR
1.0516 (4.2)
where, b is the slope of the OFW plot (-6.3646) and R is the universal gas constant
(8.314 J K-1
mol-1
).
Activation energy of 46.87 J mol-1
was obtained by applying Kissinger’s method,
while a slightly higher value of 50.32 J mol-1
was obtained using the OFW method.
These results were consistent with other researchers who also found activation
energies from the OFW method to be marginally higher than the values obtained by
the Kissinger method [169] [170]
In another study, Pistor et al. investigated the influence of glass and sisal fibers on
the cure kinetics of UPR [167]. They reported that the neat UPR had an Ea of 43.9-
47.2 J.mol-1
and the addition of the fibres to the resin resulted in higher Ea. Other
researchers have reported Ea values of pure UPR as 40.7 J mol-1
[171].
The Ea for BSM resin was 50.60 J mol-1
which is higher than that reported by Pistor
et al. [167] and Kosar and Gomez [171]. Since BSM had other chemical components
such as sugars and esters in its composition, it therefore required more energy for the
chemical reaction to occur than the UPR resulting in a higher Ea.
4.3.7 Heat distortion temperature (HDT)
If a plastic is subjected to heat it will become pliable and will easily distort under
load and it may not perform the function intended especially if that function is
structural [97]. HDT was used to measure the temperature of a polymer that deforms
under a specific load. Figure 4.19 show the HDT values of BSM and control resin
occur at 91.40 °C and 93.04 °C, respectively. Deformation of the BSM resin takes
place at a higher displacement but lower temperature as compared to the control
resin. The HDT value of a material depends on the compactness and the glass
transition temperature and the changes of hardness with temperature play a critical
role. Yang and Puckett produced UPR’s with different acids and marginally higher
values were reported for HDT. The HDT results obtained are comparable to a
producer of UPR and vinyl ester resins [172] where similar values were reported.

87
Figure 4.19: HDT curve of BSM and control resin
4.3.8 Dynamic Mechanical Analysis (DMA)
The viscoelastic properties of the BSM and control resins were determined by using
the DMA. The DMA is the preferred method of determining the glass transition (Tg)
or α transition, for polymers with rigid backbones. Glass transition is a major
transition that occurs where the amorphous phase is converted to rubbery and glassy
states in viscoelastic polymers as shown in Figure 3.9.
Figure 4.20 shows the plot of the storage modulus (Eʹ) of BSM resin as a function of
temperature at three different frequencies namely 1, 10 and 100Hz. The viscoelastic
properties of a material are dependent on temperature and frequency. The elastic
modulus of a material decreased over a period of time if it was subjected to a
constant stress. Pothan and co-workers reported that this is so because the material
undergoes molecular rearrangement in an attempt to minimize the localized stresses
[81]. They also reported that modulus measurements performed over a short period
of time (high frequency) result in higher values and longer times (low frequency)
produce lower results [81]. It was found that 1 Hz gave lower values and 100 Hz
gave increased values. There were also electrical noises with the plots especially for
the damping curves (not shown) and it was therefore decided to use 10 Hz in this
experiment.

88
Figure 4.20: Effect of frequency on the storage modulus of BSM resin
The storage modulus as a function of temperature of the control and BSM resins as
shown in Figure 4.21. The sudden decrease in storage modulus occurred at the lowest
temperature and indicated physical softening of the resins. The initial storage moduli
of BSM and control were 7320 MPa and 7591 MPa respectively. Although the initial
change in the glassy region of the resins started at the same temperature, BSM had a
lower modulus implying that softening of the bio-resin occurred at a lower modulus.
However, between 136 °C and 160 °C the control curve plateaued out and decreased
in a similar way as shown by the BSM resin. This region is the rubbery plateau
region (Figure 3.9) during which the amorphous polymer changes from a stiff to soft
rubber state.
Amorphous polymers are randomly oriented and are intertwined whereas semi-
crystalline polymers pack together in ordered regions called crystallites. The Tg of
the semi-crystalline polymer was lower than the amorphous polymer (Figure 3.10).
The BSM resin showed a lower modulus value compared to the control resin which
can be attributed to a larger degree of crystallinity of the BSM resin (Table 4.9)

89
Figure 4.21: Variation in storage modulus (Eʹ) as a function of temperature of
BSM and control resin at 10 Hz
Figure 4.22 shows the peaks in loss modulus of BSM and control resins that occurred
at the middle temperature and indicated segmental motion within the material. The
loss moduli of the control and BSM resins increased with temperature until it reached
Tg at 167 °C and 161°C respectively and thereafter it dropped back to the pre-
transition values. From this softening region onwards, the loss modulus of control
and BSM resins decreased sharply. However, the control resin indicated an increase
in modulus value than the BSM resins since the control resin had a lower
crystallinity value than BSM resin (Table 4.9).
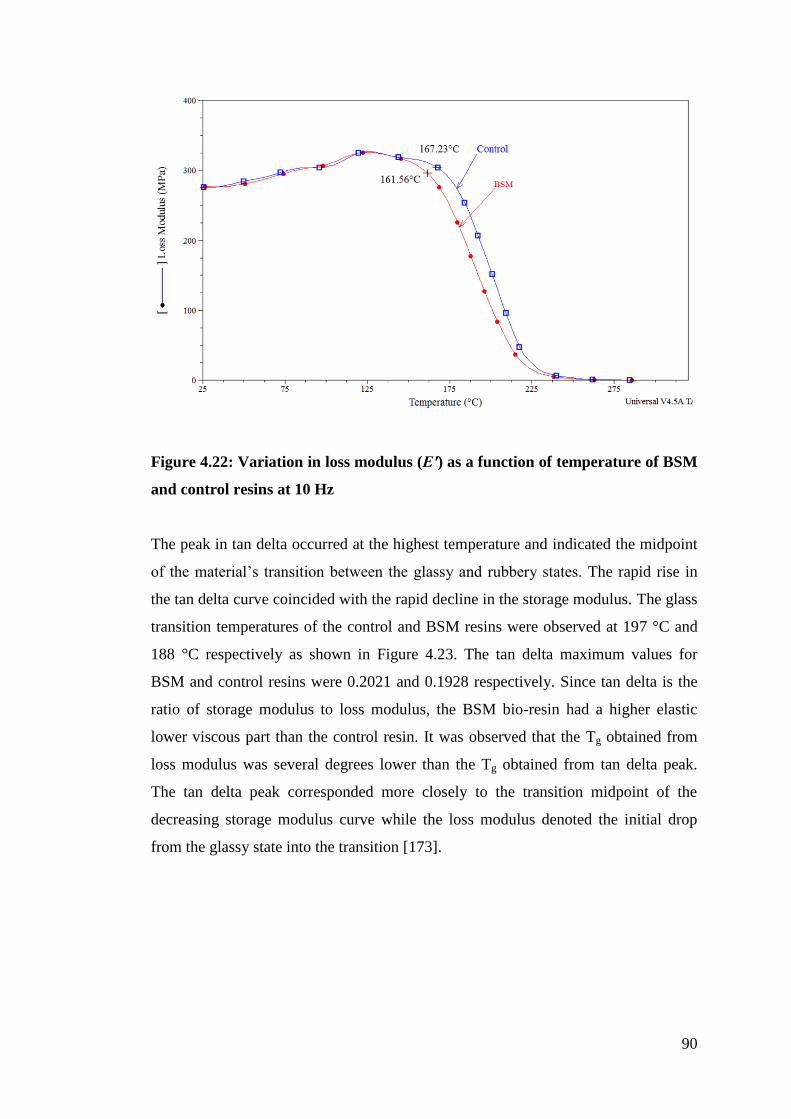
90
Figure 4.22: Variation in loss modulus (Eʹ) as a function of temperature of BSM
and control resins at 10 Hz
The peak in tan delta occurred at the highest temperature and indicated the midpoint
of the material’s transition between the glassy and rubbery states. The rapid rise in
the tan delta curve coincided with the rapid decline in the storage modulus. The glass
transition temperatures of the control and BSM resins were observed at 197 °C and
188 °C respectively as shown in Figure 4.23. The tan delta maximum values for
BSM and control resins were 0.2021 and 0.1928 respectively. Since tan delta is the
ratio of storage modulus to loss modulus, the BSM bio-resin had a higher elastic
lower viscous part than the control resin. It was observed that the Tg obtained from
loss modulus was several degrees lower than the Tg obtained from tan delta peak.
The tan delta peak corresponded more closely to the transition midpoint of the
decreasing storage modulus curve while the loss modulus denoted the initial drop
from the glassy state into the transition [173].

91
Figure 4.23: A plot of the tan delta of BSM and control resins as a function of
temperature at 10 Hz
4.3.9 Mechanical properties of control and BSM resin
A parametric study of the mechanical properties was done using varying
concentrations of BS to ascertain the optimum concentration of BS to be added to the
maleate resin outlined in section 3.3.1.
Mechanical tests of the BSM bio-resins were compared to the control resin. Tensile
strength, hardness, rigidity and brittleness, are the most fundamental mechanical
properties that were analyzed and evaluated in order to characterize the formulated
resin. Figure 4.24 shows the effect of increasing concentration of BS on the
stress/strain behaviour of BSM compared to the control resin. It was noticed that
with an increase of BS in the resin formulation the stiffness increased. However,
BSM4 which had 60% BS decreased in stiffness. It was suggested that the maximum
amount of BS to be added would be 50%. The addition of BS resulted in the dilution
of PG-MA ratio. Higher concentrations of BS would dilute the bio-resin resulting in
reduced crosslink density caused by reduced maleate content. The sites available for
crosslinking with styrene decreased. It was suggested that self-crosslinking of the
styrene may have occurred and the residual styrene left in the cured resin reduced the

92
mechanical properties of the resin thus rendering it brittle. It was also deduced that
during the process of formation of the resin, varying amounts of the organics such as
glucose and fructose from the BS reacted with maleate resin.
Figure 4.24: Effect of varying concentrations of BS on stiffness
Figure 4.25 show that by increasing the concentration of BS in the resin there was an
increase in dynamic stiffness. The stiffness of the resin represented the resistance to
deformation. However when 60% BS was added a decrease in stiffness occurred.
Besides the BS diluting the maleate resin, compounds such as dibutyl phthalate and
diphenyl esters present in the BS, shown in Table 4.4, can behave as plasticizers that
may reduce interactions between segments of the polymer chain. These plasticizers
have been reported to reduce the modulus [174]. It was also concluded that an
optimum amount of 50% of the BS was added to the maleate in order for the reaction
to reach completion to its fully cured state.

93
Figure 4.25: The effect of increasing BS concentration on stiffness compared to
control resin
The three point flexural test shown in Figure 4.26 was carried out in accordance to
the stipulated ASTM D790 method. Under static load BSM 1, 2 and 3 required 90 N,
160 N, and 270 N, respectively to extend the sample when compared to the control
sample that broke at 40 N. BSM 4, however did not follow the trend. This sample
had the most amount of BS which consequently led to the reduced maleate
concentration and saturation for crosslinking with styrene. The brittle nature of this
sample resulted in the sample breaking at a load of 50 N.

94
Figure 4.26: The effect of increasing BS concentration on flexural load
Figure 4.27 show the effect of increasing the concentration of BS on the flexural
modulus. The flexural modulus increased with increasing concentrations of BS in the
resin. When compared to the control resin, 30% BS showed 81% increase, 40% BS
showed 93% increase, 50% BS showed 190% increase and 60% BS showed 43%
increase in flexural modulus. However 60% BS showed lower modulus than the
other concentrations of BS.

95
Figure 4.27: Effect of increasing BS on flexural modulus compared to the
control resin
Figure 4.28 Effect of increasing concentration of BS on hardness compared to
control sample

96
Measurement of the hardness of a resin or polymeric material is related to the
strength and elastic characteristics of the biopolymer. The Barcol hardness value
(measured on a scale of 0-100) was obtained by measuring the resistance to
penetration of a sharp steel point under a spring load. The hardness value is used to
measure the degree of cure of the plastic. The reaction with 40% BS produced a
resin with the highest value of hardness of 50 units as shown in Figure 4.28.
It has thus been observed that the addition of BS to the resin mixture contributed
positively to mechanical properties of the bio-resin. The mechanical results showed
that BSM1 to 3 were stronger than but not as tough as the control sample. BSM 4
showed lower strength and toughness. The mechanical properties showed that BSM2
(40% BS) and BSM 3 (50% BS) gave optimum results. It was therefore decided to
use 50% BS in the formulation of the resin.
4.4 Summary
The physical testing of BS gave the TDS, pH, conductivity and density of the musa
cavendish species. The ICP-AES analysis showed the elements present in BS with
potassium and magnesium being the most abundant. Qualitative analysis proved the
presence of carbohydrates by a positive Molisch test. This was further verified by
HPLC analysis that quantified the sucrose, fructose and glucose present in the sap.
GC-MS results showed that BS is a complex matrix with esters, phenolic
compounds, aromatic compounds to mention a few. Predictions were made for the
possible reaction of fructose and glucose on the maleate polymer backbone. There
was an increase in molecular weight when BS was added to the resin formulation.
Gel times and cure times were improved with BSM compared to control resin. FTIR
analysis showed that the ketone peak from BS and strong carbon-carbon double
bonds making a positive contribution to the resin formation. The addition of BS
increases the molecular weight of the BSM bio-resin and consequently improves the
thermal degradation and mechanical properties. The optimum concentration of BS to
be added to the resin was 50% producing optimum tensile and flexural properties.

97
CHAPTER 5 –RESULTS AND DISCUSSION: SYNTHESIS AND
ANALYSIS OF BIOCOMPOSITE
Introduction
Biocomposites produced from natural fibres have been successfully used in various
resins, however there is still a need to research and develop new plant based
biocomposites [166] such as those based on BS and banana fibres. The first part of
this chapter focuses on the analysis of the banana fibre and the second part deals with
the synthesis and analysis of a biocomposite8 compared to the control sample.
The last part of Chapter 5 focuses on the fortification of the bio-resin and
biocomposite with nanoclay.
5.1 Banana fibres
This section outlines the chemical composition of the banana fibre and also addresses
the problem of the hydrophilic nature of the fibre by chemical treatment.
5.1.2 Chemical analysis of banana fibres
The banana fibres obtained from a local garden in Durban, South Africa was
extracted as discussed in section 3.2.1. A chemical assay of the fibres was obtained.
Table 5.1 shows that banana fibres consist of 58.92% cellulose, 16.11%
hemicellulose and 7.31% lignin. These results are consistent with results obtained by
others [39], where 63% cellulose, 19% hemicellulose and 5% lignin in banana fibres
was reported.
8 Extracts from Chapter 5 have been published as “Mechanical, thermal and morphological properties
of a bio-based composite derived from banana plant source”, Composites Part A 68, (2015), 90-100

98
Table 5.1: Chemical assay of banana fibres9
Av dry matter (%) 93.89
Ash (%) 3.28
Crude protein (%) 1.62
Cellulose (%) 58.92
Hemicellulose (%) 16.11
Lignin (%) 7.31
Starch (%) 11.72
Crude fat (%) 1.06
Gross energy (%) 40.36
Arabinose (%) 2.93
Galactose (%) 1.26
Glucose (%) 53.65
Xylose (%) 8.82
Mannose (%) 1.01
5.1.3 Chemical treatment of banana fibre
Chemical modification was used to enhance the compatibility of the resin with the
banana fibre. The procedure for the chemical modification is outlined in section
3.2.4. SEM images at magnification between 500-2000 X were obtained for treated
and untreated fibres. Figure 5.1A shows the SEM image of untreated fibre. A smooth
surface containing lignin, pectin, cellulose and hemicellulose (Table 5.1) was
observed. The treatment of banana fibre with 2% NaOH resulted in a rough surface
where the hemicellulose and pectin where removed and the hydrogen bonds were
broken (Figure 5.1B).
9 Results obtained in accordance to ASTM conducted at the Animal Sciences department at North
Dakota State University

99
Figure 5.1: SEM images of banana fibres:
(A) untreated and (B) treated with 2% NaOH
5.1.4 FT-IR analysis of untreated and treated fibre
Figure 5.2: A comparison of FTIR spectra of (1) untreated and (2) treated with
2 % NaOH

100
Figure 5.2 show the functional groups of the untreated and treated fibres. For the
untreated fibre, the broad band observed at 3439 cm-1
is related to the stretching
vibration of the OH groups from the cellulose (carbon 2, 3 and 6 of the glucose)
[175, 176]. After the alkali treatment the intensity of this band was reduced due to
the hydrogen bonding caused by OH group. The peak at 2908 cm
-1 assigned to the C-
H aliphatic stretching band of fibre was reduced after the alkali treatment due to the
removal of the hemicellulose [177]. In the untreated BF the peak at 1627 cm-1
corresponded to the C=O stretching of hemicellulose. After alkali (NaOH) treatment,
a major reduction in peak intensity was observed, possibly indicative of the removal
of hemicellulose and lignin from the fibre surface; a result analogous to the alkali
treatment of kenaf fibres reported by El-Shekeil et al. [178]. The reduction in
intensity of the absorption band at 1627 cm-1
may be attributed to a decrease of lignin
and consequently a reduction of the C=O functionality. A similar observation was
made by Barreto et al. with alkali treatement of sisal fibres [179]. The sharp peak
observed at 1313 cm -1
was assigned to C-H asymmetric deformation and
disappeared after alkylation thus indicating crosslinking. The prominent peak at 1014
cm-1
was due to the vibration of the –COC. The intensity of this peak increased
after alkali treatment possibly due to the relaxation of crosslinking that increased the
intensity and resolution [64]. From the FTIR analysis, it was evident the alkali
treatment removed the lignin and hemicellulose from the surface of the fibre. The
NaOH breaks the intermolecular H- bonding of the fibre and formed –ONa bonds on
the fibre surface which in turn reduced the hydrophilic behaviour of the fibre as
shown in the following reaction [180]:
Fibre –OH + NaOH Fibre –O- Na
+ + H2O
This resulted in the surface becoming less crystalline, which was further suggested
by the less resolute FT-IR peaks, thereby allowing improved fibre/matrix adhesion.
In comparison, the untreated fibre was more crystalline or more orderly structured as
seen by the high resolute peaks.
An important consequence of fibre treatment is the matrix –fibre interface that will
be discussed under fibre pull-out test in section 5.2.8.
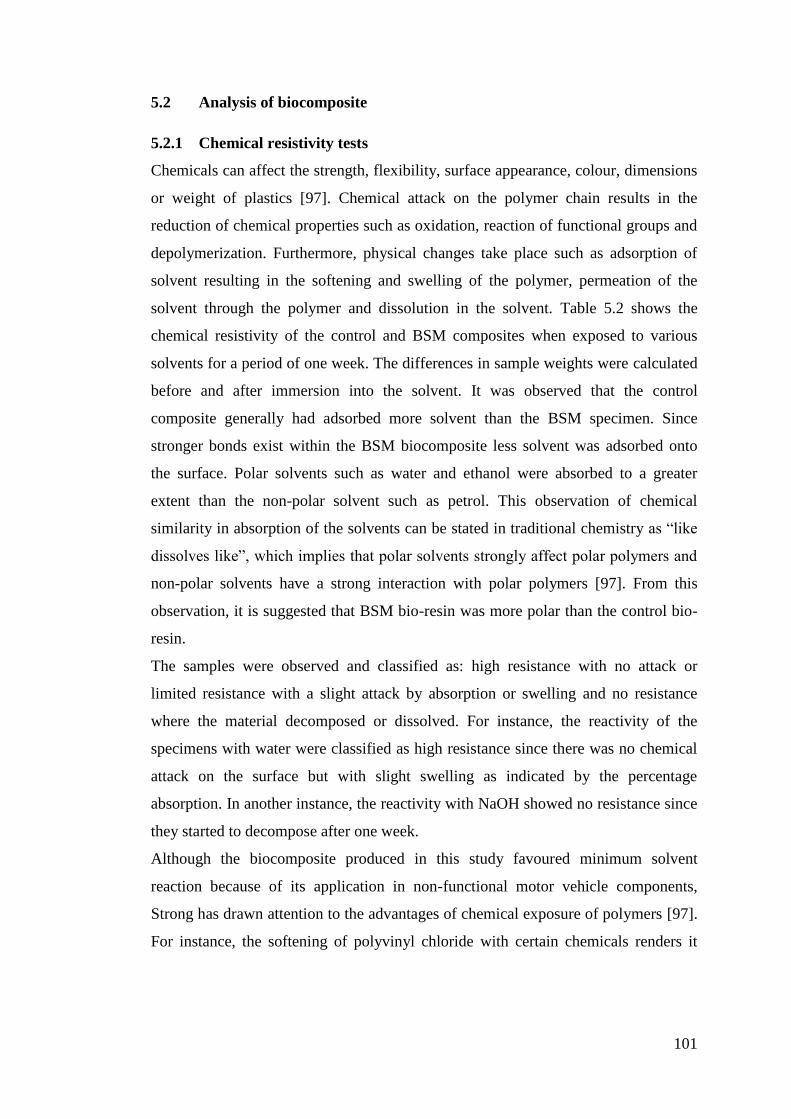
101
5.2 Analysis of biocomposite
5.2.1 Chemical resistivity tests
Chemicals can affect the strength, flexibility, surface appearance, colour, dimensions
or weight of plastics [97]. Chemical attack on the polymer chain results in the
reduction of chemical properties such as oxidation, reaction of functional groups and
depolymerization. Furthermore, physical changes take place such as adsorption of
solvent resulting in the softening and swelling of the polymer, permeation of the
solvent through the polymer and dissolution in the solvent. Table 5.2 shows the
chemical resistivity of the control and BSM composites when exposed to various
solvents for a period of one week. The differences in sample weights were calculated
before and after immersion into the solvent. It was observed that the control
composite generally had adsorbed more solvent than the BSM specimen. Since
stronger bonds exist within the BSM biocomposite less solvent was adsorbed onto
the surface. Polar solvents such as water and ethanol were absorbed to a greater
extent than the non-polar solvent such as petrol. This observation of chemical
similarity in absorption of the solvents can be stated in traditional chemistry as “like
dissolves like”, which implies that polar solvents strongly affect polar polymers and
non-polar solvents have a strong interaction with polar polymers [97]. From this
observation, it is suggested that BSM bio-resin was more polar than the control bio-
resin.
The samples were observed and classified as: high resistance with no attack or
limited resistance with a slight attack by absorption or swelling and no resistance
where the material decomposed or dissolved. For instance, the reactivity of the
specimens with water were classified as high resistance since there was no chemical
attack on the surface but with slight swelling as indicated by the percentage
absorption. In another instance, the reactivity with NaOH showed no resistance since
they started to decompose after one week.
Although the biocomposite produced in this study favoured minimum solvent
reaction because of its application in non-functional motor vehicle components,
Strong has drawn attention to the advantages of chemical exposure of polymers [97].
For instance, the softening of polyvinyl chloride with certain chemicals renders it
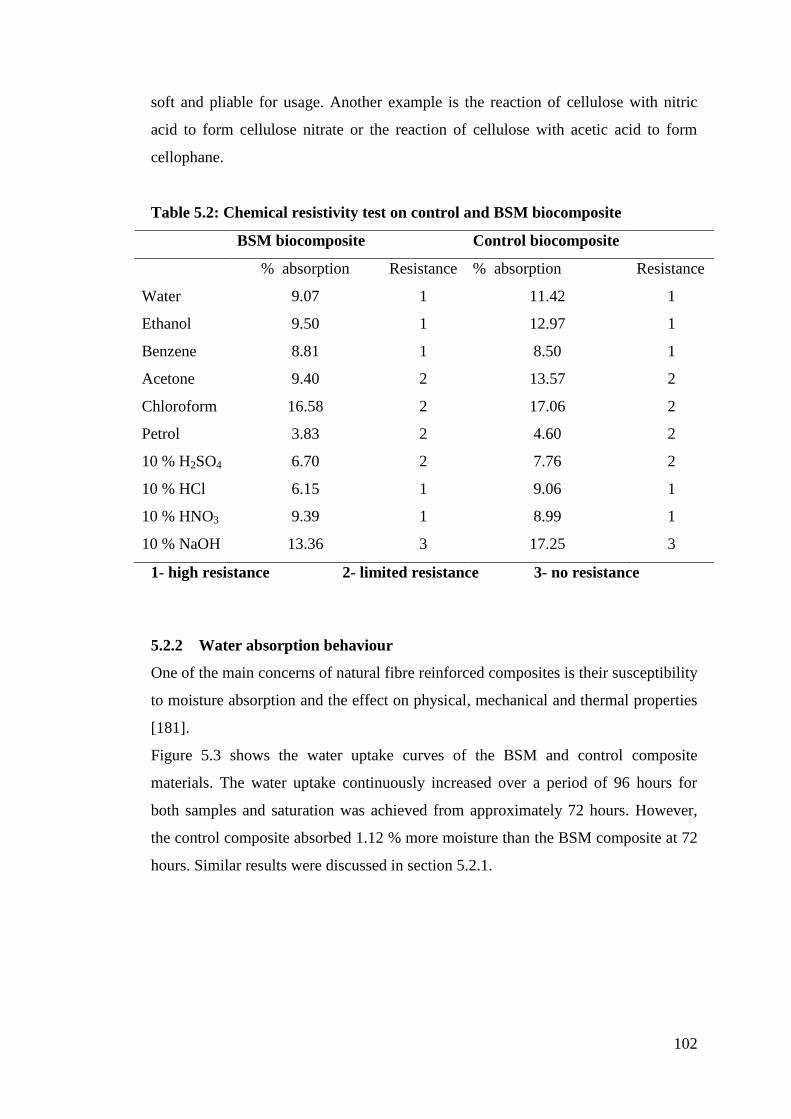
102
soft and pliable for usage. Another example is the reaction of cellulose with nitric
acid to form cellulose nitrate or the reaction of cellulose with acetic acid to form
cellophane.
Table 5.2: Chemical resistivity test on control and BSM biocomposite
BSM biocomposite Control biocomposite
% absorption Resistance % absorption Resistance
Water 9.07 1 11.42 1
Ethanol 9.50 1 12.97 1
Benzene 8.81 1 8.50 1
Acetone 9.40 2 13.57 2
Chloroform 16.58 2 17.06 2
Petrol 3.83 2 4.60 2
10 % H2SO4 6.70 2 7.76 2
10 % HCl 6.15 1 9.06 1
10 % HNO3 9.39 1 8.99 1
10 % NaOH 13.36 3 17.25 3
1- high resistance 2- limited resistance 3- no resistance
5.2.2 Water absorption behaviour
One of the main concerns of natural fibre reinforced composites is their susceptibility
to moisture absorption and the effect on physical, mechanical and thermal properties
[181].
Figure 5.3 shows the water uptake curves of the BSM and control composite
materials. The water uptake continuously increased over a period of 96 hours for
both samples and saturation was achieved from approximately 72 hours. However,
the control composite absorbed 1.12 % more moisture than the BSM composite at 72
hours. Similar results were discussed in section 5.2.1.

103
Figure 5.3: Moisture absorption at 24, 48, 72 and 96 hours of BSM and control
biocomposites
The diffusion of water in the composite material was studied using Fick’s steady
state flow equation. Table 5.3 shows that the BSM composite had a lower water
uptake, however the diffusion, sorption and permeability coefficients were similar.
The permeability coefficient indicated the amount of moisture permeated through
uniform area of the composite per second. The permeability coefficient was be
considered as the total effect of diffusion and sorption as referred to work done by
Indira et al. [180].

104
Table 5.3: Water uptake characteristics of control and BSM composite samples
buried in nutrient rich soil
Sample Water uptake
at infinite
time M∞ (%)
Diffusion
coefficient D
(mm2/s)
Sorption
coefficient
S
Permeability
coefficient P
(mm2/s)
Control Composite 8.37 1.34E-05 1.641 2.19E-05
BSM Composite 7.39 1.35 E-05 1.642 2.21E-05
Giridhar and Rao found that the compactness of the fibre accounted for the
absorption level of moisture in the composite [182]. Espert also explained that
moisture diffusion in polymeric composites took place in three different ways [183].
Firstly diffusion of molecules occurred inside the micro voids in the polymer chains,
thereafter water flowed through capillary action into the voids at the interfaces
between fibre and the matrix and finally the transport of micro cracks in the matrix
occurred from the swelling of the natural fibre particularly in natural fibre
composites [184]. SEM of the cross section of a banana fibre is given in Figure 5.4.
When the biocomposite was exposed to moisture, the cross section of the hydrophilic
banana fibre swelled; consequently inducing micro cracks in the resin. The high
cellulose content of the fibre further contributed to more water being adsorbed [185].
On a micro level, these cracks increased in dimension, water molecules reacted with
the interface, hence loosening the fibre and the matrix and consequently decreasing
the tensile and flexural behaviour.
It has been concluded that the determination of the water absorption of
biocomposites is an important aspect to study since the research deals with natural
fibres.

105
Figure 5.4: Scanning electron micrograph of the cross section of banana fibre
showing the bundles into which moisture can be absorbed
Further to studying the absorption behaviour of the biocomposites with water, the
swelling test of the neat BSM and control resins with toluene was studied.
5.2.3 Swelling index and cross-link density determination
When a cross-linked polymer is placed in a solvent such as toluene, it will absorb the
solvent. Consequently, it will swell rather than dissolving in it. The steady state
swelling ratio is a direct function of the extent of cross-linking of the sample, hence a
swelling test is a simple, low-cost technique to characterize the polymer network
[186]. In this study, the swelling test was conducted on the BSM and control resins to
give an indication of the swelling index and cross-link density. These resins were
used in the manufacture of the biocomposite. The swelling index measured the
swelling resistance of the BSM and control bio-resins in toluene and is given in
Table 5.4. The BSM resin was found to have a higher swelling resistance to toluene.
A probable explanation for this could be due to an improved polymer network
structure as shown in Figure 3.10 where amorphous and crystalline morphologies
exist. Furthermore, Table 4.9 showed that BSM had a marginal increase in

106
crystallinity value. BSM with a higher crystallinity value implied that there was a
neater packing of the polymer molecules. The control resin with a lower crystallinity
value has spaghetti like polymer chains which allowed for easier diffusion of the
toluene. This was compared to the BSM resin which had neatly packed polymer
chains of a more crystalline structure, where it was found that the toluene a took
longer to be diffused.
The cross-link density is an important property affecting the major characteristics of
a cross-linked system. The swelling of the cross-linked polymer prevented the
molecule from becoming completely surrounded by the fluid but had caused swelling
[187].
Table 5.4: Swelling index values of resin samples
Sample Swelling index values (%)
Control resin 0.44
BSM resin 0.83
Table 5.5: Apparent cross-link density values (1/Q) of resin
Sample Apparent cross-link density values
Control resin 5.56
BSM resin 8.80
Apparent cross-link densities of the BSM and control resins is given by the
reciprocal of Q (amount of solvent absorbed) shown in Table 5.4. According to
Strong lower cross-link density means that the material is less strong, less stiff and
more sensitive to solvent attack and has a lower decomposition temperature [97].
Therefore the control resin with a lower molecular weight (2114 g.mol-1
) and
consequently lower cross-link density (5.56) would have the following
characteristics: 1) be more susceptible to solvent attack 2) have lower decomposition
temperature and 3) reduced strength. These findings were consistent with the

107
chemical resistance test discussed in section 5.2.1; thermal properties in section 5.2.5
and mechanical properties in section 5.2.10 of the BSM and control biocomposites.
5.2.4 Heat distortion temperature (HDT)
As elevated temperature performance of structural composites is an important
consideration, HDT of the biocomposite was determined. HDT is temperature at
which a polymer deforms under a specific load. Figure 5.5 show the HDT values of
BSM and control composite material at 108.50 °C and 104.68 °C respectively. The
higher HDT value of the BSM biocomposite denotes the deflection temperature
under load at which the specimen may be used as a rigid material. Moreover, the
HDT value of a material depends on the compactness (stiffness) and the glass
transition temperature. Strong suggests that HDT should not be considered a
fundamental property of plastics as are the thermal transitions properties such as
glass transition and melting point [97] which will be discussed in the next two
sections.
Figure 5.5: HDT curves showing the deflection temperature of BSM and control
biocomposites

108
5.2.5 Thermal analysis
Thermal stability of biocomposite material is of significant importance especially for
its application in non-functional components in motor vehicles since exposure to
temperature is inevitable.
The thermogravimetric curves of the BSM and control composites are given in
Figures 5.6. The degradation temperature of the BSM and control composites
occurred at 377 °C and 363 °C respectively. It is suggested that the higher
degradation temperature of the BSM composite could be attributed to the presence of
organics such as esters and phenolic compounds in the BS [164] which resulted in
increased thermal stability.
Figure 5.6: The mass loss of BSM and control biocomposites from 200-500 °C
The DSC curves of BSM and control composites are given in Figure 5.7. The
melting point temperatures (Tm) of the control and BSM composites were 369 °C and
385 °C, respectively. The crystallization temperature of the control and BSM
composite were 317 °C and 343 °C respectively. The broad peaks observed were due
to the impurities in the biocomposite material, which in this case is the banana fibre.
109
Figure 5.7: DSC curves of BSM and control biocomposites showing the Tm and
crystallization temperatures
The degree of crystallinity was determined from the crystallization exotherm on
heating (see Figure 5.7) using the Equation 5.1 below:
Degree of crystallinity =
%100f
cf
H
HH
100% (5.1)
where fH is the enthalpy of melting, cH is the enthalpy of crystallization, and
%100fH is the enthalpy of melting for a fully crystalline polymer (140 J/g) [173].
Table 5.6 show that the BSM composite had 45% degree of crystallinity indicating
that there was a more orderly polymer network arrangement than the control
composite. Crystallinity is an indication of the amount of the crystalline region in the
polymer with respect to amorphous content thereby rendering the BSM
biocomposites as amorphous and crystalline since a purely crystalline material would
be 100%. Crystallinity affects many of the polymer properties such as hardness,
modulus, tensile, stiffness and melting point [165, 188].

110
Table 5.6: Comparison of the degree of crystallinity of BSM and control
biocomposites
Sample Melt enthalpy
(J/g)
Crystallization
enthalpy (J/g)
Degree of
Crystallinity (%)
Control Composite 101.7 57.15 31.72
BSM Composite 89.55 25.66 45.64
5.2.6 Dynamic Mechanical Analysis (DMA)
5.2.6.1 Storage Modulus (Eʹ)
The storage modulus as a function of temperature of the BSM and control
composites is shown in Figure 5.8. With increasing temperature the storage modulus
of the biocomposites decreased as the matrix softened. From Figure 5.8 it was noted
that the change in storage modulus at approximately 150 °C of the BSM and control
composites occurred between 2600-2300 MPa. The results were compared to the
change in modulus of the pristine BSM resin at a value of 1640 at 150 °C as shown
in Figure 4.22. The increase in modulus of the biocomposite was associated with
restriction imposed by the banana fibres on molecular motion in the matrix at higher
temperature. Similar findings were reported by Manikandan et al. and Joseph et al.
[189, 190]. However, the decrease of matrix modulus in composites was partially
compensated by the stiffness of the fibre. Furthermore, Pothan and co-workers
reported that neat polyester resin had a higher dynamic modulus than the fibre filled
system and the lowering of the modulus was due to the dilution of the polymer [3].
This study showed that the BSM biocomposite had a larger modulus than the BSM
resin. The increase in storage modulus suggests enhanced adhesion between the
banana fibre and the BSM matrix leading to better stress transfer from matrix to
fibre.

111
Figure 5.8: Temperature dependence of storage modulus (Eʹ) of BSM and
control biocomposites at 10 Hz
5.2.6.2 Loss Modulus (Eʺ)
The effect of temperature on the loss modulus of the BSM and control composite is
shown in Figure 5.9. It was observed that from ambient to approximately 166 °C, the
BSM composite had a higher loss modulus than the control composite. Thereafter,
there was a crossover of the loss modulus values with BSM biocomposite having a
lower modulus. Since loss modulus is often associated with “internal friction” and
can be affected by various molecular motions, transitions and morphology [191], the
behaviour of the BSM biocomposite can be explained in similar light. It is possible
that the bonding between the BSM resin and banana fibres is stronger than the
control composite resulting in less internal friction till 166 °C. It appears that
thereafter the control biocomposite dissipated more energy than the BSM composite.

112
Figure 5.9: Temperature dependence of Loss Modulus for BSM and control
biocomposites at 10 Hz
5.2.6.3 Damping Factor (Tan Delta)
The ratio of Eʹ and Eʺ gives the tangent of the phase angle δ and tan δ is known as
the damping that gives the energy dissipation. Figure 5.10 showed that damping of
BSM resin and control resin occurred at 184 °C and 196 °C respectively with the
BSM biocomposite taking place at a higher amplitude. Martinez-Hernandez et al.
reported that a weak fibre matrix adhesion will result in higher values of tan δ [192].
When the fibre is strongly bonded to the matrix, the mobility of the polymer chains is
lessened thus reducing the damping [193]. Figure 5.10 show that the control and
BSM biocomposites had a lower tan δ when compared to the neat BSM resin in
Figure 4.24. It was also noted that the BSM composite showed a lower tan δ value
than the control composite inferring that BSM resin had better bonding properties
than the control resin used in the composite preparation.

113
Figure 5. 10: Comparison of tan delta as a function of temperature of BSM and
control biocomposite at 10 Hz
5.2.7 Scanning Electron Microscopy (SEM)
Scanning electron microscopy images of the fractured surfaces of the tensile test
were taken to study the fracture mechanism of (A) BSM and (B) control specimens
shown in Figure 5.11. Figure 5.11A shows that fibre breakage and to a lesser degree
fibre pull-out took place with the BSM specimen. However Figure 5.11B showed
that the fracture caused the fibres to be pulled out and more holes in the control
specimen was observed. Since the matrix and reinforcement were from the same
banana plant source greater compatibility was expected. It appears that the BSM bio-
resin and fibre were well bonded compared to the control specimen. When the
adhesion is poor and load was applied, the fibres were easily pulled out. Figure
5.11B showed that in the control composite, fibre/matrix debonding was evident
because the fibre was not well-bonded to the control resin. It is suggested that to
improve the fibre/matrix bonding, the fibre should be chemically treated. To study
the fibre/matrix interface, fibre pull-out test was necessary.
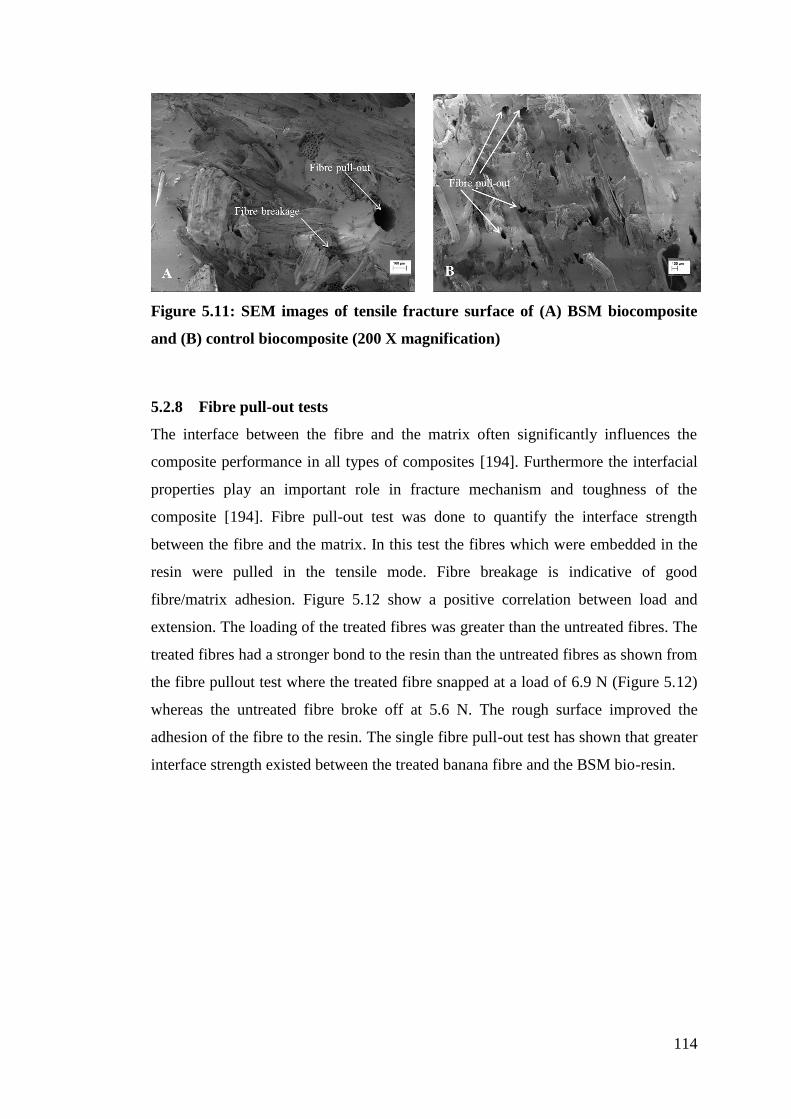
114
Figure 5.11: SEM images of tensile fracture surface of (A) BSM biocomposite
and (B) control biocomposite (200 X magnification)
5.2.8 Fibre pull-out tests
The interface between the fibre and the matrix often significantly influences the
composite performance in all types of composites [194]. Furthermore the interfacial
properties play an important role in fracture mechanism and toughness of the
composite [194]. Fibre pull-out test was done to quantify the interface strength
between the fibre and the matrix. In this test the fibres which were embedded in the
resin were pulled in the tensile mode. Fibre breakage is indicative of good
fibre/matrix adhesion. Figure 5.12 show a positive correlation between load and
extension. The loading of the treated fibres was greater than the untreated fibres. The
treated fibres had a stronger bond to the resin than the untreated fibres as shown from
the fibre pullout test where the treated fibre snapped at a load of 6.9 N (Figure 5.12)
whereas the untreated fibre broke off at 5.6 N. The rough surface improved the
adhesion of the fibre to the resin. The single fibre pull-out test has shown that greater
interface strength existed between the treated banana fibre and the BSM bio-resin.
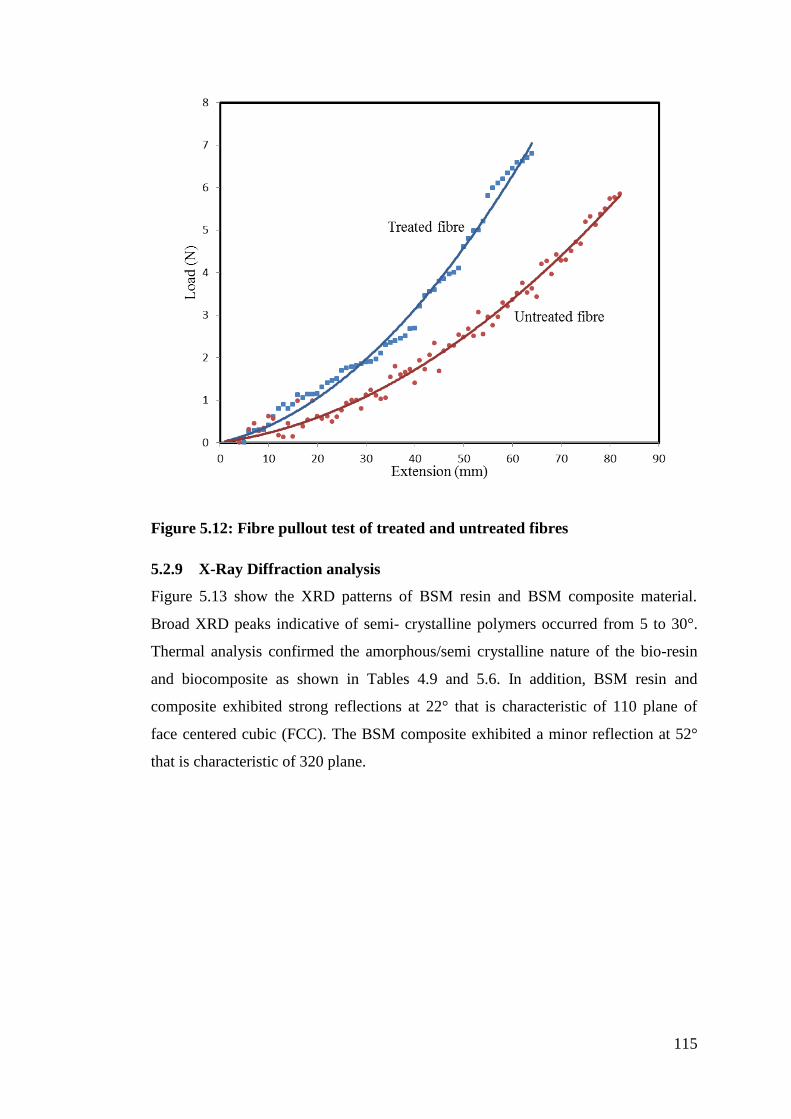
115
Figure 5.12: Fibre pullout test of treated and untreated fibres
5.2.9 X-Ray Diffraction analysis
Figure 5.13 show the XRD patterns of BSM resin and BSM composite material.
Broad XRD peaks indicative of semi- crystalline polymers occurred from 5 to 30°.
Thermal analysis confirmed the amorphous/semi crystalline nature of the bio-resin
and biocomposite as shown in Tables 4.9 and 5.6. In addition, BSM resin and
composite exhibited strong reflections at 22° that is characteristic of 110 plane of
face centered cubic (FCC). The BSM composite exhibited a minor reflection at 52°
that is characteristic of 320 plane.

116
Figure 5.13: X-ray diffraction pattern of BSM resin and BSM composite
The d-spacing of the neat BSM resin and BSM composite calculated from equation
3.1 (Chapter 3) is listed in Table 5.7. The peaks appearing at 3.48 ° corresponded to
the neat BSM resin with d001 = 29.48. In BSM composite sample, the peak shifted to
a lower angle (2θ = 3.16, d001 = 32.45) suggesting the formation of an intercalated
morphology [195]. This intercalation stemmed from the insertion of the banana
fibres within the resin.
Table 5.7: Interlayer spacing in the neat BSM and BSM composite
Sample 2θ (°) d-spacing (nm)
Neat BSM 3.48 29.48
BSM composite 3.16 32.45

117
5.2.10 Mechanical properties of biocomposite
Mechanical properties are an important indicator of a polymeric or composite
material’s behaviour under loading. In this work, tensile, flexural, impact, creep and
fracture behaviour were conducted for BSM and control biocomposites.
Figure 5.14 illustrates the tensile stress-strain curves of the BSM and control
biocomposites. The addition of BS to the matrix resulted in an increase in the tensile
stress when compared to the control resin. The BSM composite failed at a mean
stress value of 26.1± 1.14 MPa while the control specimen failed at 22.2 ± 0.82 MPa.
This represents an 18% increase in tensile stress. From Table 5.8A, the value of
P=0.04 indicated a significant difference between the BSM and control composite.
Furthermore, the mean tensile moduli of the BSM and control composites were 2968
± 148.3 MPa and 2609 ± 218.2 MPa, respectively, indicating a significant difference
between the BSM and control composites. The only difference between these two
composite materials is the presence of BS in BSM composite. In a previous paper
[164], phenolic compounds were detected in BS that form strong hydrogen bonds
[196] and it was proposed that these phenolic compounds attach themselves to the
polymer backbone that could contribute to the strength of the material.
The flexural test result is presented in Figure 5.15. The BSM composite has a mean
flexural stress value of 32.3 MPa and the control sample at 30.4 MPa resulting in a
6% increase in flexural strength. Statistical analysis showed no significant difference
between the two samples (P=0.24). Sapuan and co-workers produced a banana fibre
reinforced epoxy biocomposite for household utilities and they reported tensile
stress value of 14 MPa and flexural stress of 26 MPa [74]. However the values for
flexural strength in this study were higher than those reported by Sapuan. The BS
used in the manufacture of the BSM bio-resin imparted improved mechanical
properties. This may be due to the strong chemical bond between the fibre and BSM
matrix as confirmed with SEM analysis.

118
Figure 5.14: Variation of tensile stress as a function of % strain of BSM and
control biocomposite
Table 5.8A: Mechanical properties of BSM and control biocomposites at
ambient temperature
Mechanical property BSM biocomposite
(mean values with SD)
Control biocomposite
(mean values with SD)
P
α=0.05
Tensile Strength (MPa) 26.1± 1.14 22.0 ± 0.82 0.04*
Flexural Strength (MPa) 32.3 ± 2.32 30.4 ± 3.5 0.24
Tensile Modulus (MPa) 2968 ± 148.3 2609 ± 218.2 0.04*
Flexural Modulus (MPa) 1994 ± 122 1492 ± 45.2 0.001*
*Denotes significant difference with α=0.05

119
Figure 5.15: Variation of flexural stress as a function of strain of control and
BSM biocomposite
5.2.11 Tensile and flexural tests at ambient and elevated temperatures
Table 5.8B shows the mean and standard deviation values of the tensile and flexural
properties of the BSM biocomposite at ambient and elevated temperatures. At a 95%
confidence interval, the mean and standard deviation of the flexural modulus of BSM
composite at ambient temperature was 1994 ± 122 MPa. At 55 ± 5 °C the flexural
modulus of the BSM composite decreased to 1557 ± 150 MPa. Similarly, the mean
and standard deviation value of the tensile modulus of BSM composite at ambient
temperature was 2968 ± 148 MPa. At 55 ± 5 °C, the tensile modulus of the BSM
composite decreased to 2413 ± 328 MPa. The P values in Table 5.8B showed the
significance difference in the mechanical properties between the BSM composite at
ambient and elevated temperatures with P ≤ 0.05.
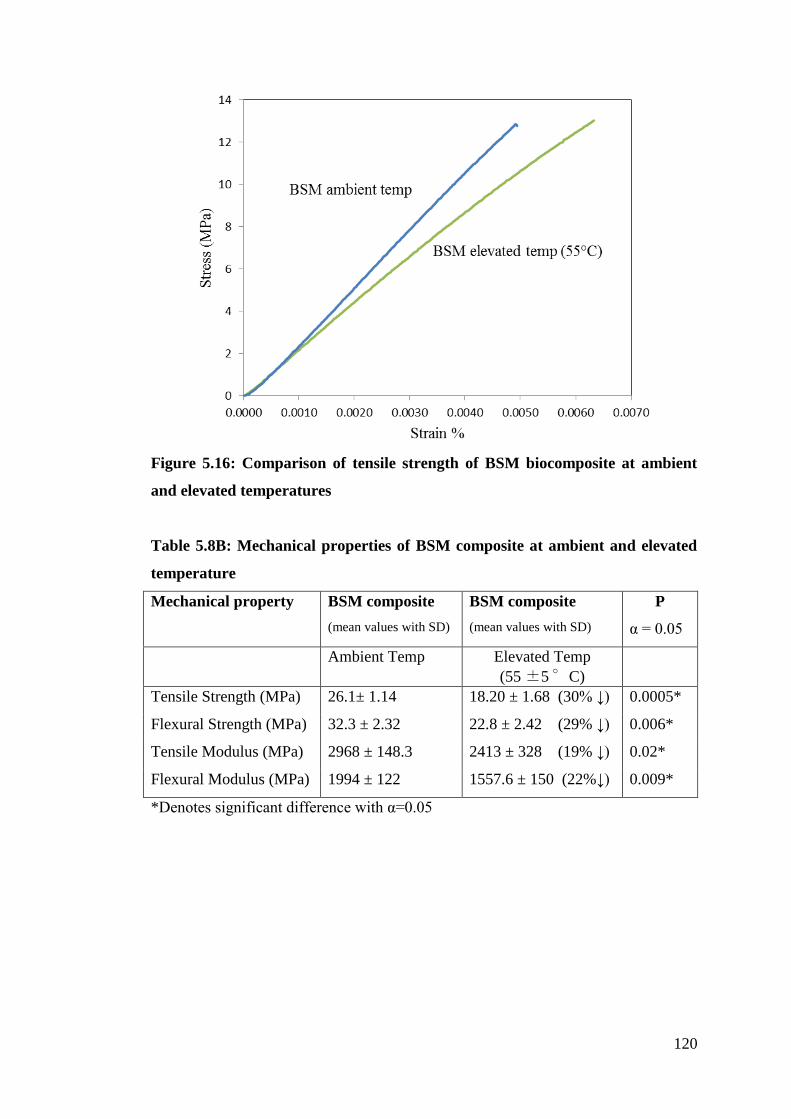
120
Figure 5.16: Comparison of tensile strength of BSM biocomposite at ambient
and elevated temperatures
Table 5.8B: Mechanical properties of BSM composite at ambient and elevated
temperature
Mechanical property BSM composite
(mean values with SD)
BSM composite
(mean values with SD)
P
α = 0.05
Ambient Temp Elevated Temp
(55 ±5 °C)
Tensile Strength (MPa) 26.1± 1.14 18.20 ± 1.68 (30% ↓) 0.0005*
Flexural Strength (MPa) 32.3 ± 2.32 22.8 ± 2.42 (29% ↓) 0.006*
Tensile Modulus (MPa) 2968 ± 148.3 2413 ± 328 (19% ↓) 0.02*
Flexural Modulus (MPa) 1994 ± 122 1557.6 ± 150 (22%↓) 0.009*
*Denotes significant difference with α=0.05

121
Figure 5.17: Comparison of flexural strength of BSM biocomposite at ambient
and elevated temperatures
Figures 5.16 and 5.17 illustrates flexural and tensile properties of the BSM
composite material at ambient and elevated temperatures (55 ± 5 °C). The tensile
strength decreased from 26.1± 1.14 MPa to 18.20 ± 1.68 MPa. The flexural strength
decreased from 32.3 ± 2.32 MPa to 22.8 ± 2.42 MPa. From Table 5.8B significant
difference was noted for the tensile and flexural test between the control and BSM
composite. Factors such as adhesion at interface between the fibre and the resin, the
mechanical properties of the fibre and resin can affect the strength and performance
of composite material [197].

122
5.2.12 Impact tests
Table 5.9 show the energy absorbed by impact of the resins and biocomposite
materials. The BSM and control resins shattered on impact and were classed as
brittle. As expected the neat resins absorbed lesser energy than the biocomposite
specimens since the fibres in the biocomposites were the adsorbents to absorb the
impact. On impact 2.37 J.m3
of energy from the drop-weight was transferred to the
control biocomposite whereas 2.18 J.m3
was transferred to the BSM biocomposite.
Since BSM biocomposite absorbed 9% less energy than the control biocomposite, it
was reckoned that the ability of BSM bio-resin to dissipate energy by crack
propagation was lower than the control resin. According to the drop-weight impact
test, BSM biocomposite had a higher resistance to crack formation (discussed further
in section 5.2.13). It was therefore concluded that the interface between the BSM
bio-resin and fibre was greater than the control resin and fibre. Impact toughness is
significantly affected by molecular weight [101] and is generally increased by higher
molecular weights of the polymer. The molecular weights of the BSM and control
resins were 2179 and 2114 units respectively suggesting that the polymer network of
BSM with a higher molecular weight did not have as much movement thereby
concentrating the energy in one area. There was a decreased ability to transfer the
energy between the chains hence the impact energy was lower. Stronger bonds
impart greater stiffness, hence decreasing the energy required for impact. Figure 5.18
compares the impact indent images of the control and BSM composites.
Table 5.9: Impact energy values of test samples
Sample Impact (J.m3)
Control Resin 0.75-0.95
BSM Resin 0.71
Control biocomposite 2.37
BSM biocomposite 2.18

123
Figure 5.18: Images of impact damage observed for biocomposites impacted by
drop weight
5.2.13 Fracture toughness of biocomposite material
5.2.13.1 Single edge notch beam test
Four layers of banana fibres were used for the infusions of the control resin and the
BSM resins. Samples were cut according to ASTM D 504510
specifications [198].
The samples were marked for measurement of the crack length. The crack length
measured as a function of time was video recorded to capture the crack growth.
Figure 5.19 shows the image of the crack length initiated by crack growth beneath
the loading of 1kN. The crack initiated directly beneath the loading point, which was
typical of Mode 1 crack.
10ASTM D5045 test method for Fracture Toughness and Strain Energy Release Rate of Plastic
Materials

124
Figure 5. 19: Image of BSM biocomposite showing crack growth
Figure 5.20: Time dependence on crack length of control and BSM
biocomposites
Figure 5.20 shows the crack length formation as a function of time. Crack initiation
of the BSM biocomposite commenced at 184 seconds compared to 150 seconds for
the control composite. This delay in time was accounted for by a stronger bond
between the BSM bio-resin/ fibre interface than the control resin/fibre. It was also
shown in the impact studies in section 5.2.13 that the ability of BSM bio-resin to

125
dissipate energy by crack propagation was lower than the control resin. BSM showed
a linear increase of crack length with time. However, at around 150 s the crack length
of the control biocomposite was constant. There could have been bundles of fibres
attached to the resin that took a longer time for the crack to grow. It was also
important to note that these were random fibres and the propagation of the crack had
least resistance. Likewise, the addition of banana fibre content increased the
possibility of fibre agglomeration, which created regions of stress concentration that
required less energy to elongate the crack propagation [199].
Figure 5.21: Strain energy versus time of Control and BSM biocomposite
Figure 5.21 compares the strain energy of the BSM and control composites
calculated using equation 3.5. An increase in the strength and the modulus resulted in
a decrease in the fracture toughness of the BSM composite. As the modulus
increased, the strain energy decreased which was related to fracture toughness.

126
5.2.14 Creep tests
Creep behaviour of polymer matrix composites is a critical issue for many modern
engineering applications such as aerospace, civil engineering and automotive
components [200]. DMA was a useful apparatus used to predict the creep behaviour
of the composites under accelerated conditions. Although DMA predictions were
conducted at low stress levels, some qualitative creep level predictions were deduced
from this method. Since it was not practical to conduct creep tests for entire lifetime
of the material, the creep predictions were attempted by accelerated testing. The
procedure used for the tensile creep test was a revised version of the testing
procedure used by Goertzen and Kessler [201]. Figure 5.22 compares the creep
compliance of BSM and control biocomposites as a function of time. These analyses
were conducted over a period of 22 hours and the results were analysed using the TA
Universal software. It was noted that the creep compliance of BSM biocomposite
gradually increased from approximately 11 hours.
Figure 5.22: Creep compliance of BSM and control biocomposite as a function
of time
When the specimens were heated under applied, BSM showed a higher creep than
the control biocomposite from 12 hours. Strong explained that transitional

127
movements occur when atoms move from one place to another in space within the
polymer and these movements allow the polymer chain to slowly disentangle and
move apart [97]. Similarly, when the biocomposite was subjected to an applied load,
the solid polymer slowly began to creep. Molecular weight of the bio-resin can affect
the creep resistance of the biocomposite. In this study the molecular weights of BSM
bio-resin and the control resin were 2179 g.mol-1
and 2114 g.mol-1
respectively.
Strong also stated that in general, a higher molecular weight increased properties
such as creep [97].
Figure 5. 23: Creep data of BSM and control biocomposites showing increasing
creep (strain) as a function of time
Figure 5.23 shows the creep data of percentage strain as a function of time using the
Rheology Advantage Data Analysis software where the x-axis showed the time
limited to 900 seconds. With an increase in time BSM had a higher creep than the
control corresponding to a higher molecular movement within the polymer. Initially
the control composite showed better creep resistance; however from 125 °C onwards
the BSM composite showed improved creep resistance at higher temperatures. This
phenomenon was explained by the limited movement of the molecular chains of the
polymer matrix due to the chemical reaction between the BS and maleate resin.
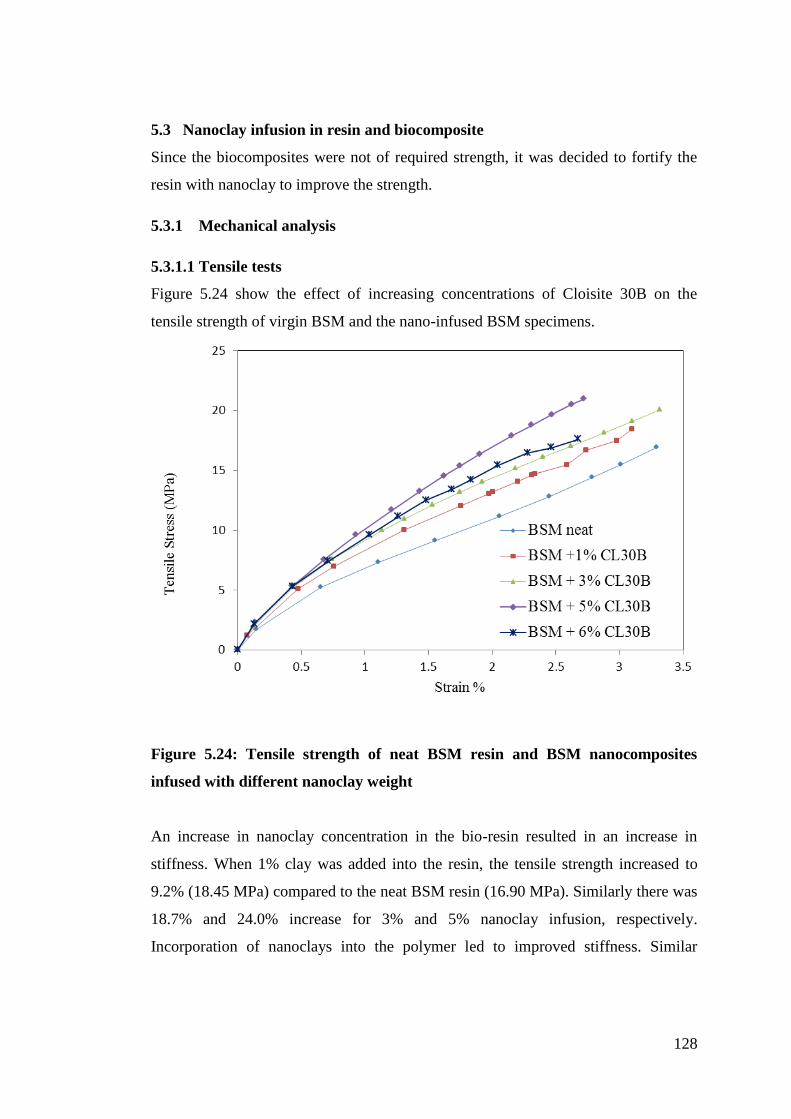
128
5.3 Nanoclay infusion in resin and biocomposite
Since the biocomposites were not of required strength, it was decided to fortify the
resin with nanoclay to improve the strength.
5.3.1 Mechanical analysis
5.3.1.1 Tensile tests
Figure 5.24 show the effect of increasing concentrations of Cloisite 30B on the
tensile strength of virgin BSM and the nano-infused BSM specimens.
Figure 5.24: Tensile strength of neat BSM resin and BSM nanocomposites
infused with different nanoclay weight
An increase in nanoclay concentration in the bio-resin resulted in an increase in
stiffness. When 1% clay was added into the resin, the tensile strength increased to
9.2% (18.45 MPa) compared to the neat BSM resin (16.90 MPa). Similarly there was
18.7% and 24.0% increase for 3% and 5% nanoclay infusion, respectively.
Incorporation of nanoclays into the polymer led to improved stiffness. Similar

129
conclusions of nanoclay inclusion leading to improved stiffness-toughness balance
were presented by Miyagawa and co-workers [202].
However, as shown in Figure 5.24, further increase in clay content to 6% decreased
the tensile strength as the excess clay formed agglomeration sites. Similar findings
were reported by Agag et al. [203].
5.3.1.2 Flexural tests
Figure 5. 25: Effect of increasing nanoclay concentration on flexural strength of
neat BSM and BSM nanocomposites
Figure 5.25 shows that the flexural properties of the BSM increased with increasing
nanoclay concentration. When compared to the neat resin there was a 7% increase in
flexural strength with 3% nanoclay, and 28% increase with the 5% nanoclay.
Although there was 18% decrease in the flexural strength with the 1% nanoclay, the
modulus for all the clay infused samples increased.

130
5.3.2 Thermal analysis
The thermal behaviour of the bio-resin improved when fortified with increasing
amounts of nanoclay. Figure 5.26 show the TGA curves of the onset temperatures of
the neat BSM and the nanoclay infused BSM. Tables 5.5 show the increase in
degradation temperatures and melt temperatures when increasing amounts of
nanoclay were added.
Figure 5.26: The effect of increasing nanoclay concentration on the onset
temperature of TGA
Table 5.10: Effect of nanoclay concentration on onset and degradation
temperatures
Sample Onset temp (°C) Tm (°C)
BSM Neat 318 371
BSM + 1% nanoclay 331 374
BSM + 3% nanoclay 334 380
BSM + 5% nanoclay 336 382

131
The onset temperature obtained from TGA indicated that decomposition of the bio-
resin increased with increasing clay loading when compared to the neat resin. The
dispersed clay created a barrier that delayed the release of thermal degradation
products when compared to the neat resin as shown by Agag et al. [204]. DSC curves
(Figure 5.27) provided the degradation temperatures of the blended nanocomposites
and the neat resin. An increase in clay content resulted in an increase in degradation
temperature.
Figure 5.27: The effect of increasing nanoclay concentration on the degradation
temperature of the DSC thermograph
5.3.3 Dynamic Mechanical Analysis
A parametric study was done to investigate the effect of adding increasing amounts
of nanoclay on the viscoelastic properties of the bio-resin. This section discusses the
storage modulus, loss modulus and damping of the BSM bio-resin with nanoclay.
The effect of adding increasing amount of nanoclays on the storage modulus as a
function of temperature is shown in Figure 5.28. It is well established that fillers or
nanoclays as in this instance, increases the storage modulus [205]. There was an
incremental increase in storage moduli from 7320 MPa (neat resin), 7552 MPa (1%
clay), 7851 MPa (3% MPa) and 8173 MPa (5% clay). A 12% increase in storage

132
modulus was noted between the neat BSM and BSM +5% nanoclay. The first change
in modulus was related to the relaxation of the amorphous phase (α-phase
relaxation). In this state, the glassy state of the amorphous phase goes through its
glass transition temperature and there was a sharp drop in modulus [206].
Figure 5.28: The effect of increasing amounts of nanoclay on storage modulus of
BSM resin
Figure 5. 29: The effect of increasing amounts of nanoclay on loss modulus of
BSM bio-resin and nanoclays

133
Figure 5.30: The effect of increasing amounts of nanoclay on damping of BSM
resin
Figure 5.30 shows the tan delta values of the BSM and BSM with nanoclays and not
much variation in results are observed. The Tg temperature was between 184 °C to
187°C with the tan delta maximum between 0.2042 and 0.2026.
5.4 Summary
A new plant based biocomposite was produced using banana fibre and banana sap
based bio-resin. Mechanical, chemical, physical and morphological properties of this
material were determined. It was shown that the tensile and flexural properties
improved by 18% and 6% respectively when compared to a control biocomposite.
The fractured surfaces are inspected using the SEM and it was found that in some
instances poor adhesion between the fibre and matrix existed evident by the presence
of voids or holes. To overcome the fibre pullout from the matrix, it was deemed
necessary to chemically treat the fibres for improved adhesion. Consequently the
treated fibres showed greater interfacial strength. Stronger bonds between the fibre
and resin impart greater stiffness, hence decreasing the energy required for impact.

134
The lower impact performance of BSM composite could depend on the nature of the
constituent and the fibre/matrix interface.
There was an improvement in thermal properties of the BSM biocomposite
compared to the control biocomposite. DMA showed the viscoelastic properties of
the composite. The increase in storage modulus of the BSM composite indicated
enhanced adhesion between the banana fibre and the BSM matrix leading to better
stress transfer from matrix to fibre.
In order to improve the strength of the composites, Cloisite 30B nanoclay was added
to the resin. Tensile, flexural and thermal degradation properties also improved when
the nanoclay was added.
It was suggested that the BSM could be used for non-functional components in the
automotive industry but the industry requires that the material degrade after its end of
life. The next chapter discusses the biodegradability of the biocomposites and bio-
resin.

135
CHAPTER 6 –RESULTS AND DISCUSSION:
BIODEGRADATION STUDIES OF BSM BIO-RESIN AND
BIOCOMPOSITE
Introduction
This chapter discusses the biodegradation studies of the BSM bio-resin and
biocomposites using soil burial, microbial growth and respirometric testing
techniques11
. The soil burial and microbial growth tests give an indication of the
physical and chemical degradation, whereas the respirometric testing quantifies the
evolution of CO2 during biodegradation.
6.1 Results
6.1.1 Soil burial tests
Biodegradability of biocomposites was measured using the soil burial test method
as described by Kumar [112]. Table 6.1 shows the percentage mass loss of the
control and BSM biocomposite over a 120 day period due to the disintegration that
took place in the soil. The mass loss of the control and BSM biocomposites increased
with increasing time. Although BSM biocomposite had a higher final mass loss, a lag
period was observed between days 30 to 60 for the BSM sample. This could be due
to the resin and fibre taking a longer time to disintegrate. The higher weight loss
could be attributed to the absorbance of moisture making it more prone to attack by
mirco-organisms such as fungi. The average mass loss for the control composite after
120 days was 7.15% ± 0.53 and the BSM composite had a mass loss of 7.12% ±
1.24. At 95 % confidence interval, there was no significant difference (P = 0.975 >
0.05) in the mean values.
11 Extracts from Chapter 6 have been published as “Mechanical, thermal and morphological properties
of a bio-based composite derived from banana plant source”, Composites Part A 68, (2015), 90-100

136
Table 6.1: Mass loss of control and BSM biocomposite samples buried in
nutrient rich soil
Day Control biocomposite
(% mass loss)
BSM biocomposite
(% mass loss)
30 6.1 6.1
60 6.6 6.1
90 6.8 7.1
120 7.5 8.6
Mean 7.15 7.12
SD 0.53 1.23
6.1.1.1 Microscopic evaluation of biodegraded samples
Optical light microscopic images were taken to observe the microbial growth of the
control and BSM biocomposite samples before and after soil burial as shown in
Figure 6.1. From Figure 6.1 it was observed that no fungal growth was visible in the
control composite material at day 0 and after 120 days. Although Table 6.1 shows a
mass loss for the control sample, no fungal growth was visible. This is suggestive
that there was no interaction between the nutrients and microbes in the soil and the
control resin.
Figure 6.1 : Optical Microscope images of control composite samples on days 0
and 120 with 20 x magnification

137
Figure 6.2 shows fungal growth of the fibres in the BSM biocomposite at day 30, 60,
90 and 120 indicated by the black growth on the fibres. The one difference between
Figure 6.1 and 6.2 is the use of the BSM resin in the latter. It is therefore possible
that the micro-organisms attached themselves on the BSM bio-resin and facilitated
fungal growth on the fibres. Arutchelvi et al. made similar observations suggesting
that micro-organisms can attach to the surface of the polymer surface [207].
Figure 6.2 : Optical microscope images of BSM biocomposite sample from day
0 to day 120 with 20 x magnification
Burying the BSM composite in soil or placing it in any other natural environment
such as lakes or rivers may represent the ideal practical environmental conditions;
however there are several shortcomings associated with these types of test. Firstly,
environmental conditions such as temperature, pH, or humidity cannot be well
controlled; moreover, the analytical opportunities to monitor the degradation process
are limited. To address this shortcoming, alternate test methods such as fungal
growth test were conducted.
6.1.2 Fungal growth test
The fungal growth test as described in section 3.8.2 was performed in a controlled
environment where temperature and humidity were controlled in an incubator.

138
Observation of the optical images shown in Figure 6.3(A) and (B), the microbial
growths of fungal species (Aspergillus niger ) had been identified on the both control
biocomposite and BSM biocomposite. Although both biocomposites supported
growth, the BSM biocomposite showed a more concentrated growth than the control
sample as seen in Figures 6.3 (A) and (B). Once the organism attached itself to the
surface of the composite, it began to grow by using the polymer and the cellulosic
fibres as the carbon source as also shown by Arutchelvi et al. [207].
However, the fungal species cannot be easily quantified by microbial observation as
compared to bacterial species due to the fungal mycelium thickness. Figure 6.3 (A)
shows that the BSM biocomposite had a denser fungal growth than the control
composite. However, attempts were made to measure the growth by dilution plating
and measurement of optical density of the suspension culture. Figures 6.4 (A) and
(B) showed that the BSM composite had a zone diameter of 14 mm and the Control
composite had a zone diameter of 11mm after 72 hours of incubation.
Figure 6.3: Image of Aspergillus niger growth on (A) control biocomposite and
(B) BSM biocomposite sample

139
Figure 6.4: Image of zone diameter of growth measurement of dilution plating
of fungal growth on control composite and BSM composite
Optical density measurements by UV/visible spectroscopy of the diluted culture
suspensions of the BSM composite showed an absorbance value of 1.51 absorbance
units whereas the control sample had an absorbance value of 1.29.
From the zone diameter measurements of the microbial growth and the optical
density measurements, BSM composite supported more microbial growth than the
control sample.
6.1.3 Respirometric tests
The respirometric test was conducted according to ASTM D5338 to determine the
cumulative measurement of CO2 emission by acid-base titration. Aerobic
biodegradation of the BSM composite materials was carried out for a 55 day
incubation period under composting conditions. The amount of CO2 emitted (average
of three samples) was plotted against incubation time as shown in Figure 6.5.

140
Figure 6.5: CO2 emission of BSM composite and control resin samples
Figure 6.5 illustrated that all the samples as described in Table 3.7 had a lower rate
of biodegradability compared to cellulose, used as a positive reference material
described in section 3.8.3. BSMF biocomposite showed an increase of
biodegradability compared to BSM, CR and CRF. A further illustration was made in
Figure 6.6 to show the comparison of the CO2 emission between the BSMF and
CRF. The BSMF and CRF emitted CO2 during the biodegradation process. However,
it was noticed that from day 13, more CO2 was emitted from the BSMF than CRF.
Furthermore, from day 33 a significant difference in CO2 emission was noticed. A
two-tailed test revealed a P value of 0.0462. P values < 0.05 are deemed significant
therefore, BSMF was significantly different from CRF. It is obvious that the banana
fibres will degrade to a greater extent, however it can be further explained that the
fructose and glucose from the BS cross-linked with the polymer backbone as shown
in Figure 4.4 and 4.5 contributed to the increased biodegradation of the
biocomposite. Similarly, Singh and co-workers concluded that by attaching sugars to
non-degradable hydrocarbon polymers encouraged biodegradation by bacteria and
fungi [41].

141
Figure 6.6: CO2 emission of the BSMF compared to CRF after 13 days of
incubation
Generally, compost is a heterogeneous substance with various carbon sources and the
degradation of polymeric intermediate products cannot be determined with sufficient
accuracy. As a consequence, carbon mass balance can be only guaranteed to assess
the ultimate biodegradation, namely plastic carbon to carbon dioxide is measured
(CO2 = C plastic). The percentage of biodegradation can be calculated from the
difference to the initial carbon and as per Equation 3.16 in Chapter 3.
Table 6.2 shows the percentage biodegradation of BSM biocomposite and test
samples described in Table 3.7 in Chapter 3 that were studied in the compost
medium.
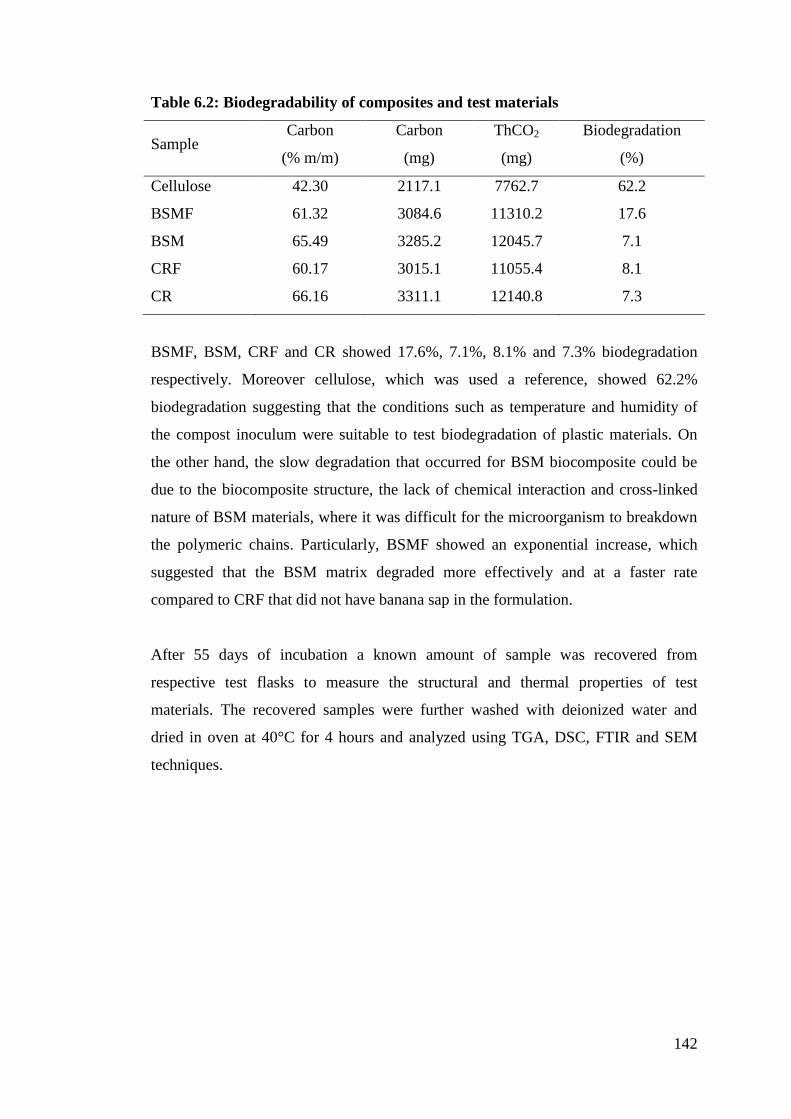
142
Table 6.2: Biodegradability of composites and test materials
Sample Carbon
(% m/m)
Carbon
(mg)
ThCO2
(mg)
Biodegradation
(%)
Cellulose 42.30 2117.1 7762.7 62.2
BSMF 61.32 3084.6 11310.2 17.6
BSM 65.49 3285.2 12045.7 7.1
CRF 60.17 3015.1 11055.4 8.1
CR 66.16 3311.1 12140.8 7.3
BSMF, BSM, CRF and CR showed 17.6%, 7.1%, 8.1% and 7.3% biodegradation
respectively. Moreover cellulose, which was used a reference, showed 62.2%
biodegradation suggesting that the conditions such as temperature and humidity of
the compost inoculum were suitable to test biodegradation of plastic materials. On
the other hand, the slow degradation that occurred for BSM biocomposite could be
due to the biocomposite structure, the lack of chemical interaction and cross-linked
nature of BSM materials, where it was difficult for the microorganism to breakdown
the polymeric chains. Particularly, BSMF showed an exponential increase, which
suggested that the BSM matrix degraded more effectively and at a faster rate
compared to CRF that did not have banana sap in the formulation.
After 55 days of incubation a known amount of sample was recovered from
respective test flasks to measure the structural and thermal properties of test
materials. The recovered samples were further washed with deionized water and
dried in oven at 40°C for 4 hours and analyzed using TGA, DSC, FTIR and SEM
techniques.
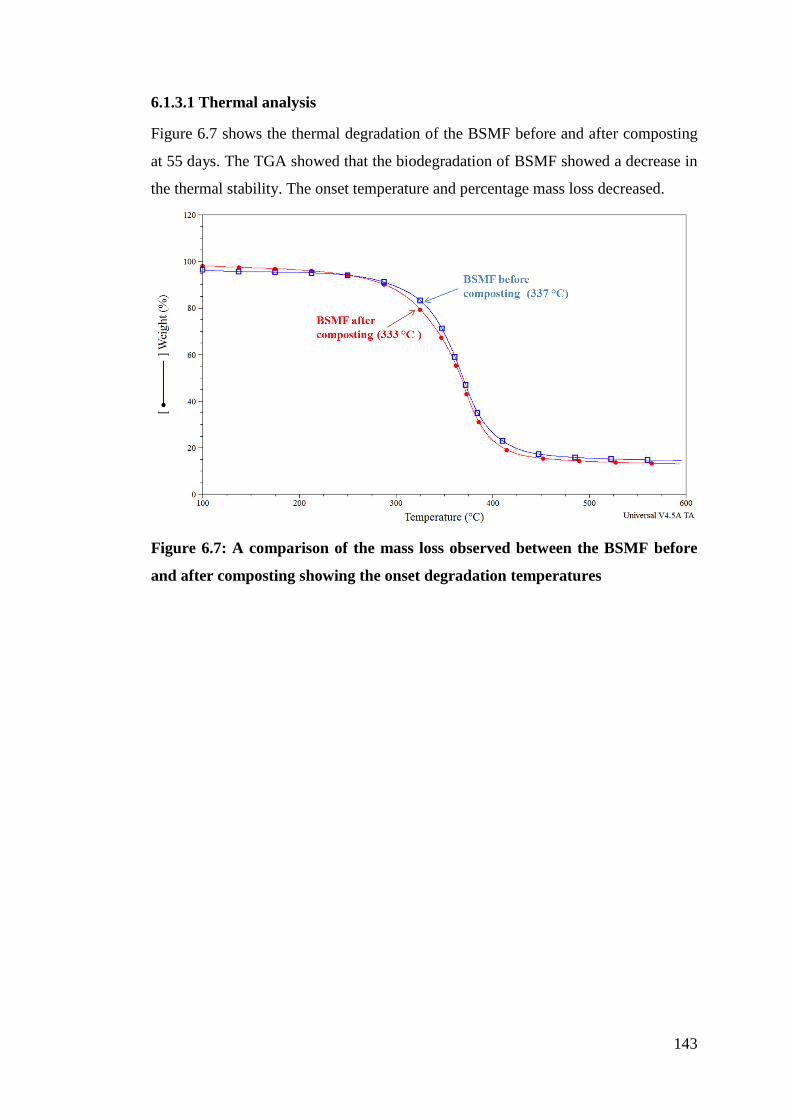
143
6.1.3.1 Thermal analysis
Figure 6.7 shows the thermal degradation of the BSMF before and after composting
at 55 days. The TGA showed that the biodegradation of BSMF showed a decrease in
the thermal stability. The onset temperature and percentage mass loss decreased.
Figure 6.7: A comparison of the mass loss observed between the BSMF before
and after composting showing the onset degradation temperatures
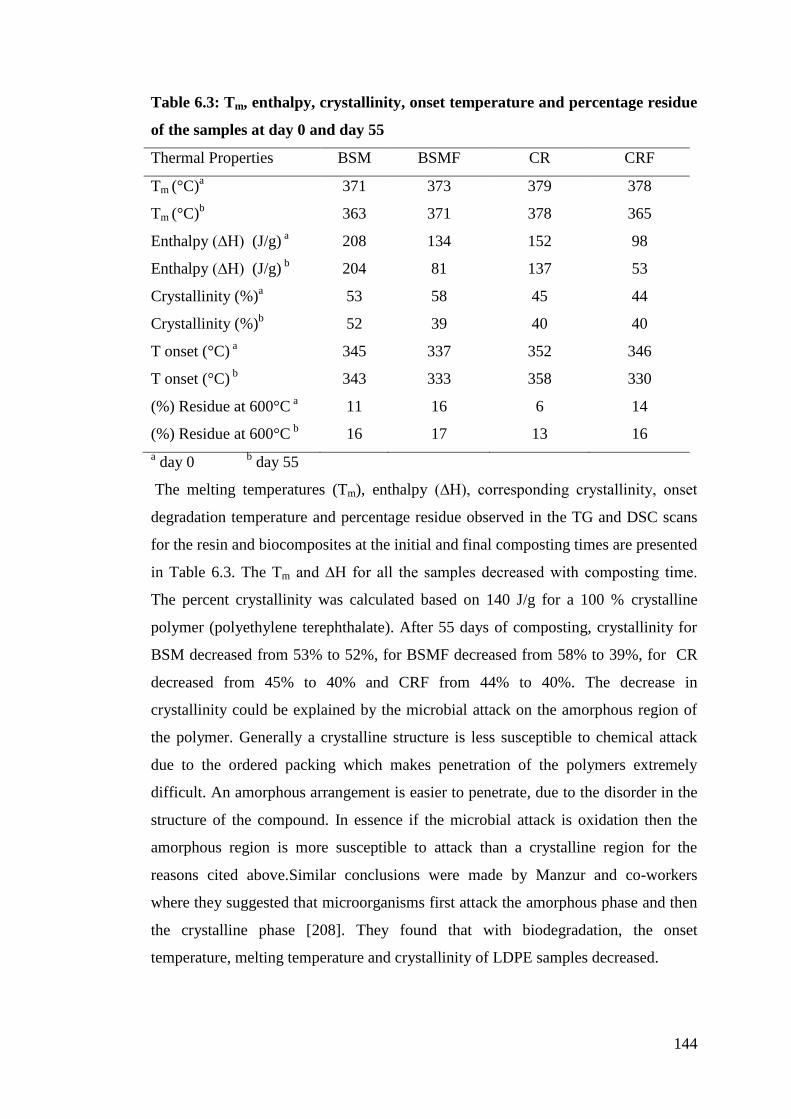
144
Table 6.3: Tm, enthalpy, crystallinity, onset temperature and percentage residue
of the samples at day 0 and day 55
Thermal Properties BSM BSMF CR CRF
Tm (°C)a
371 373 379 378
Tm (°C)b
363 371 378 365
Enthalpy (∆H) (J/g) a
208 134 152 98
Enthalpy (∆H) (J/g) b
204 81 137 53
Crystallinity (%)a
53 58 45 44
Crystallinity (%)b
52 39 40 40
T onset (°C) a
345 337 352 346
T onset (°C) b
343 333 358 330
(%) Residue at 600°C a
11 16 6 14
(%) Residue at 600°C b
16 17 13 16
a day 0
b day 55
The melting temperatures (Tm), enthalpy (∆H), corresponding crystallinity, onset
degradation temperature and percentage residue observed in the TG and DSC scans
for the resin and biocomposites at the initial and final composting times are presented
in Table 6.3. The Tm and ∆H for all the samples decreased with composting time.
The percent crystallinity was calculated based on 140 J/g for a 100 % crystalline
polymer (polyethylene terephthalate). After 55 days of composting, crystallinity for
BSM decreased from 53% to 52%, for BSMF decreased from 58% to 39%, for CR
decreased from 45% to 40% and CRF from 44% to 40%. The decrease in
crystallinity could be explained by the microbial attack on the amorphous region of
the polymer. Generally a crystalline structure is less susceptible to chemical attack
due to the ordered packing which makes penetration of the polymers extremely
difficult. An amorphous arrangement is easier to penetrate, due to the disorder in the
structure of the compound. In essence if the microbial attack is oxidation then the
amorphous region is more susceptible to attack than a crystalline region for the
reasons cited above.Similar conclusions were made by Manzur and co-workers
where they suggested that microorganisms first attack the amorphous phase and then
the crystalline phase [208]. They found that with biodegradation, the onset
temperature, melting temperature and crystallinity of LDPE samples decreased.

145
6.1.3.2 FTIR analysis
Figure 6.8 illustrates the FTIR spectrum of BSMF before and after composting. The
initial stage of biodegradation consists of water diffusion into the amorphous region
of the polymer followed by hydrolytic scission of the ester bond [209]. Absorption of
moisture into the polymer surface was confirmed by the OH peak at 3435 cm-1
. The
peak at 2950 cm-1
which represents the C=C stretch was reduced in intensity after
composting as there was degradation of the polymer chain. The C=O ester bond at
1736 cm-1
was also reduced in intensity due to the breaking up of the ester bond.
Figure 6.8: FTIR overlay scan showing BSMF before (bottom scan) and after
(top scan) composting for 55 days
A possible reaction scheme for the removal of C=O peaks and the formation of CO2
is shown in Figure 6.9. The reduction in intensity of carbonyl peak at 1735 cm-1
was
confirmed by FTIR shown in Figure 6.8. The mechanism showed that during
biodegradation the removal of the carbonyl functional group and the formation of
CO2 took place. The ester bonds (-O-C=O) are susceptible to attack by the moisture
and microbes from the soil. During biodegradation, these bonds break with the
release of CO2.

146
Figure 6.9: Possible reaction scheme for removal of -C=O peaks from the BSM
resin and the formation of CO2
6.1.3.3 SEM analysis
SEM micrographs of the surface characteristics of CR and BSM before and after
composting are shown in Figure 6.10. SEM micrographs of CR and BSM before
composting referred to as initial in the figure showed smooth surfaces. However,
after 55 days of composting, CR showed erosion of the resin surface. The surface of
the BSM showed microvoids, cracks and erosion. The surfaces appeared rough and
embrittled as the microbes in the soil interacted with the resin and CO2 was emitted.
After biodegradation, the surface became irregular and a large number of pits and
roughness appeared.

147
Figure 6.10: SEM images of CR and BSM before and after biodegradation
Figure 6.11 shows the surface morphology of the decomposted BSMF and CRF
samples in comparison to the samples before composing. BSMF and CRF showed
smooth surfaces at the initial stage. After 55 days of composting, the surface of
BSMF and CRF showed erosion as fibres were exposed and the resin was breaking
apart. The fibres appeared more exposed due to the microbial attack of resin. The
SEM results confirmed that under composting conditions, microorganisms attack the
surface of the neat resins and the composites, by illustration of the changes in
morphology of the specimens.
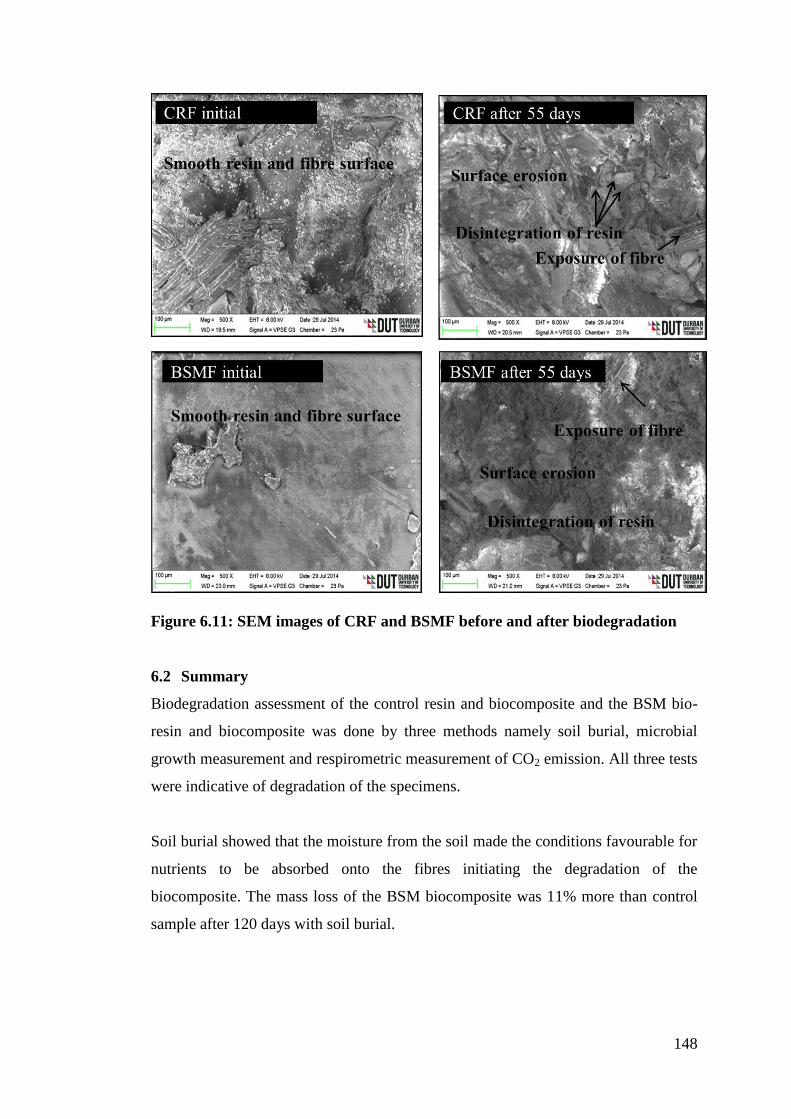
148
Figure 6.11: SEM images of CRF and BSMF before and after biodegradation
6.2 Summary
Biodegradation assessment of the control resin and biocomposite and the BSM bio-
resin and biocomposite was done by three methods namely soil burial, microbial
growth measurement and respirometric measurement of CO2 emission. All three tests
were indicative of degradation of the specimens.
Soil burial showed that the moisture from the soil made the conditions favourable for
nutrients to be absorbed onto the fibres initiating the degradation of the
biocomposite. The mass loss of the BSM biocomposite was 11% more than control
sample after 120 days with soil burial.

149
The fungal species could not be easily quantified due to the fungal mycelium
thickness supported by filamentous growth. However the growth was measured by
dilution plating and measurement of optical density of the suspension culture. The
zone diameters of the BSM and control biocomposites were 14 mm and 11 mm
respectively after 72 hours of incubation. The optical densities of the BSM and
control biocomposites were 1.51 and 1.29 absorbance units respectively.
The respirometric test method gave a quantification of the CO2 emitted during the
biodegradation period of 55 days. Results indicated that compost microbial systems
and conditions provided a very suitable environment for the biodegradation of the
BSM biocomposites. A 17.6% biodegradation was noted for BSMF which was 54%
more than the CRF indicating that the extent of conversion of organic carbon to CO2
of the two biocomposites. This conversion resulted in the bio-assimilation of the
composite material. The eroded surface morphologies were confirmed by SEM
images. The disintegration of the material resulted in a decrease in onset degradation
temperatures, melt temperatures and crystallinity confirmed by TGA and DSC
results. FTIR confirmed disintegration of the biocomposites by indication of the
reduction of intensity of the main functional groups.
Biodegradation of the biocomposites was favoured under suitable conditions such as
temperature, humidity, nutrients and micro-organisms in the soil.

150
CHAPTER 7 - CONCLUSIONS AND RECOMMENDATIONS
Summary
The conclusion of the presented doctoral thesis is summarized in the following items.
A novel bio-resin using banana sap as a precursor, reinforced with banana fibres to
produce a biocomposite was successfully synthesized and characterized. In an
attempt to address the dire environmental issues, this beneficial product was made
from agricultural waste.
The banana sap was used as a precursor to synthesize the hybrid resin, called BSM,
which was further characterized for viscosity, acid value, molecular weight, density,
gel times, thermal, mechanical and chemical properties. It was concluded that the
sugars, particularly fructose and glucose, and organics from the BS may have served
as cross-linkers increasing the molecular chain length in the bio-resin formulation,
which imparted improved strength to the resin. Furthermore, it was found that
improved adhesion between fibre and resin took place when the fibres were
chemically treated with alkaline solution.
The biocomposite was characterized for mechanical, thermal, morphological and
biodegradation properties. Since this application was for the automotive sector,
mechanical tests were conducted at ambient and elevated temperatures and it was
found that tensile and flexural properties decreased at elevated temperatures. An
increase in the strength and the modulus resulted in a decrease in the fracture
toughness of the BSM composite. As the modulus increased, the strain energy
decreased which is related to fracture toughness. The fructose and glucose in the
banana sap increased the cross-link density impacting on the fracture toughness.
Impact properties are considered as an important aspect for the automotive sector.
Impact studies showed that the BSM biocomposite had a lower value due to the

151
stronger bonds within the BSM bio-resin that imparted greater stiffness, hence
decreasing the energy required for impact.
On closer investigation of the BSM biocomposite, it was found that the mechanical
and thermal properties improved when the bio-resin was fortified with Cloisite 30B
nanoclay.
Regarding biodegradability, the biocomposites showed evidence of biodegradation at
the end of their lifespan. Soil burial, microbial growth and respirometric testing of
CO2 emission proved that over time degradation of the BSM biocomposite was
underway. However, the short-coming of predicting the exact time frame for
complete disintegration was still evident.
This work has shown that BS can be effectively used as a precursor in the bio-resin
formulation which can be used as a matrix for the synthesis of the bio-composite.
7.1 Recommendations for future work
The accomplishment of this research has brought to fore certain limitations,
challenges and consequently opportunities for future research directions. It is
expected that by addressing these keys areas, it will help future researchers to realize
the goal of producing 100% bio-based bio-composites to be used as functional
components in the automotive sector. The following section outlines the
recommendations for future research.
7.1.1 Renewable precursors for bio-resin formulation
This research has utilized non-renewable acid and alcohol to form the polyester
based bio-resin. To improve the sustainability of the bio-resins, aliphatic polyesters
need to replace the aromatic polyesters in the synthetic formulation. Polyesters can

152
be produced from the poly-condensation of 1,4 butanediol and succinic acid to form
poly butyl succinate (PBS) and the banana sap can be incorporated into the poly-
condensation reaction. Since very little research has been done in this respect with
banana sap, theoretically positive results are expected. Researchers have developed
systems to reduce or replace styrene monomers in acrylated biopolymers [210].
However, bio-based monomers for BS based resins also need to be investigated and
developed so that styrene emission can be reduced.
7.1.2 Consistent quality of biocomposite/ speed of production
An important concern is the possible variation in quality of the biocomposite due to
deficiency of standardized banana fibres. Climatic and geographic conditions have a
huge impact on the quality and properties of the fibres. This is a major drawback if
the biocomposites are to be used as functional components in the motor vehicle. It is
therefore recommended that the fibres of consistent properties of strength and
diameter (within 10% standard deviation) be used for the biocomposite.
To use the biocomposite for functional components that are invariably larger in size,
the speed of production is a major setback. Vacuum infusion is suitable for smaller
components, however for larger parts where high mechanical strength is needed, an
alternative method such as sheet moulding compounds (SMC) is recommended.
7.1.3 Fibre-matrix interfacial adhesion of BSM bio-resin and banana fibres
In this research, the fibres were chemically treated with alkaline solution. However,
the effect of different fibre treatments should be studied to investigate the
improvement of mechanical and chemical properties compared to untreated fibres.
The fibre/matrix interface needs to be further investigated to understand the bonding
taking place at a molecular level.
7.1.4 Fibre loading in the biocomposite
Since varying the fibre loading was not within the scope of the work it is
recommended that various fibre loading be investigated. Varying the distribution of
the fibres in the bio-composite production will maximize the databank of mechanical
properties and it would give good insight into optimizing loading properties.

153
7.1.5 Effect of nanoclay in the bio-resin
This work involved the use of Cloisite 30B only. It would be of great interest to
obtain a databank of mechanical and chemical properties of the bio-resin with an
array of nanoclays.
7.1.6 Biodegradability predictions
Although this study focused on the biodegradability of the bio-composite, it is of
greater importance to predict the exact time of disintegration into CO2, H2O and cell
biomass. Furthermore, a life cycle analysis (LCA) should be conducted to ascertain
life-cycle cost, production and transportation of the banana sap and fibres and the
end-of-life recyclability. Presently this work is nonexistent for banana sap based
polymers and bio-composites, and is a fundamental requirement for
commercialization.
154
REFERENCES
1. Mohanty, A., Misra, M., Drzal, L., Selke, S.E., B.R., H., and Hinrichsen, G.,
Natural Fibres, Biopolymers and Biocomposites: An Introduction, in Natural
Fibers, Biopolymers, and Biocomposites, M.M. Mohanty A, Drzal L, Editor.
2005, Taylor Francis: USA. p. 1-36.
2. Qiu, K., Biobased and biodegradable polymer nanocomposites. 2012, Cornell
University.
3. Pothan, L.A., Oommen, Z., and Thomas, S., Dynamic mechanical analysis of
banana fiber reinforced polyester composites. Composites Science and
Technology, 2003. 63(2): p. 283-293.
4. Yu, L., Dean, K., and Li, L., Polymer blends and composites from renewable
resources. Progress in Polymer Science, 2006. 31(6): p. 576-602.
5. Alves, C., Ferrão, P., Silva, A., Reis, L., Freitas, M., Rodrigues, L., and
Alves, D., Ecodesign of automotive components making use of natural jute
fiber composites. Journal of Cleaner Production, 2010. 18(4): p. 313-327.
6. Holbery, J. and Houston, D., Natural-fiber-reinforced polymer composites in
automotive applications. Journal of Minerals & Materials Characterization &
Engineering, 2006. 58(11): p. 80-86.
7. Japan Automobile Recycling Promotion Centre. The authorized automotive
recycling coordinator. [online] 2010 [cited 2014.]; Available from:
http://www.jarc.or.jp/en/recycling/.
8. Anstey, A., Muniyasamy, S., Reddy, M.M., Misra, M., and Mohanty, A.,
Processability and Biodegradability Evaluation of Composites from Poly
(butylene succinate)(PBS) Bioplastic and Biofuel Co-products from Ontario.
Journal of Polymers and the Environment: p. 1-10.
9. Bismarck, A., Baltazar-Y-Jimenez, A., and Sarikakis, K., Green composites
as panacea? Socio-economic aspects of green materials. Environment,
Development and Sustainability, 2006. 8(3): p. 445-463.
10. Casado, U., Marcovich, N., Aranguren, M., and Mosiewicki, M.,
High‐strength composites based on tung oil polyurethane and wood flour:
Effect of the filler concentration on the mechanical properties. Polymer
Engineering & Science, 2009. 49(4): p. 713-721.
11. Nava, H., Brooks, S., and Skrobacki, T., Soybean based hybrid unsaturated
polyester resin system. Technical Paper at Composites, 2010.
12. Guimarães, J.L., Wypych, F., Saul, C.K., Ramos, L.P., and Satyanarayana,
K.G., Studies of the processing and characterization of corn starch and its
composites with banana and sugarcane fibers from Brazil. Carbohydrate
Polymers, 2010. 80(1): p. 130-138.
13. Miyagawa, H., Mohanty, A.K., Burgueño, R., Drzal, L.T., and Misra, M.,
Novel biobased resins from blends of functionalized soybean oil and
unsaturated polyester resin. Journal of Polymer Science Part B: Polymer
Physics, 2007. 45(6): p. 698-704.
155
14. Wambua, P., Ivens, J., and Verpoest, I., Natural fibres: can they replace glass
in fibre reinforced plastics? Composites Science and Technology, 2003.
63(9): p. 1259-1264.
15. O'Donnell, A., Dweib, M., and Wool, R., Natural fiber composites with plant
oil-based resin. Composites Science and Technology, 2004. 64(9): p. 1135-
1145.
16. Annie Paul, S., Boudenne, A., Ibos, L., Candau, Y., Joseph, K., and Thomas,
S., Effect of fiber loading and chemical treatments on thermophysical
properties of banana fiber/polypropylene commingled composite materials.
Composites Part A Applied Science and Manufacturing, 2008. 39(9): p.
1582-1588.
17. Bledzki, A.K. and Gassan, J., Composites reinforced with cellulose based
fibres. Progress in polymer science, 1999. 24(2): p. 221-274.
18. Ellison, G., McNaught, R., and Eddleston, E., The use of natural fibres in
nonwoven structures for applications as automotive component substrates.
Ministry of Agriculture Fisheries and Food., 2000. 26(04).
19. Gironès, J., Lopez, J.P., Vilaseca, F., Bayer R, J., Herrera-Franco, P.J., and
Mutjé, P., Biocomposites from Musa textilis and polypropylene: Evaluation
of flexural properties and impact strength. Composites Science and
Technology, 2011. 71(2): p. 122-128.
20. Nayak, S.K., Degradation and flammability behavior of PP/banana and glass
fiber-based hybrid composites. International Journal of Plastics Technology,
2009. 13(1): p. 47-67.
21. Ray, D., Nayak, L., Ammayappan, L., and Nag, D., Energy conservation
drives for efficient extraction and utilization of banana fibre. International
Journal of Emerging Technology and Advanced Engineering, 2013. 3(8): p.
296-310.
22. Satyanarayana, K., Sukumaran, K., Kulkarni, A., Pillai, S., and Rohatgi, P.,
Performance of banana fabric-polyester resin composites, in Composite
Structures 2. 1983, Springer. p. 535-548.
23. Pervaiz, M. and Sain, M.M., Carbon storage potential in natural fiber
composites. Resources, conservation and Recycling, 2003. 39(4): p. 325-340.
24. Henton, D.E., Gruber, P., Lunt, J., and Randall, J., Polylactic acid technology,
in Natural fibers, biopolymers, and biocomposites, M.M. Mohanty A, Drzal
L, Editor. 2005, CRC Press: USA. p. 527-616.
25. Brouwer, W.D. Natural fibre composites in structural components: alternative
applications for sisal? [online] 2001 [cited 2013.]; Available from:
http://www.fao.org/docrep/004/Y1873E/y1873e0a.htm.
26. Palucka, T. and Bensaude-Vincent, B. Origins of Composites. [online] 2002
[cited July 2014.]; Available from:
http://authors.library.caltech.edu/5456/1/hrst.mit.edu/hrs/materials/public/co
mposites/Composites_Overview.htm.
27. Matthews, F. and Rawlings, R., Composite materials: Engineering and
science. Vol. 1. 1999, Abington, England: Woodhead Publishing.
28. Karbhari, V.M., Materials considerations in FRP rehabilitation of concrete
structures. Journal of materials in civil engineering, 2001. 13(2): p. 90-97.

156
29. Mazumdar, S., Composites manufacturing: Materials, Product and Process
Engineering. Vol. 1. 2001, Florida, USA: CRC Press.
30. Chung, D., Composite materials for electrical applications, in Composite
Materials: Science and Applications. 2003, Springer: London. p. 73-89.
31. Plastic News. Fiber-reinforced plastics use. [online] 2002 [cited August
2014.]; Available from:
http://www.plasticsnews.com/article/20020826/FYI/308269999/fiber-
reinforced-plastics-use-2002.
32. Thomas, S. and Pothan, L.A., Natural Fibre Reinforced Polymer Composites
from Macro to Nanoscale. 2009, USA: Old City Publishers.
33. Plastic News. Plastics demand increasing, but supply outlook still plentiful.
[online] 2012 [cited August 2014.]; Available from:
http://www.plasticsnews.com/article/20120830/NEWS/308309985/plastics-
demand-increasing-but-supply-outlook-still-plentiful.
34. Glenn, G., Holtman, K., Ludvik, C., Chiou, B., Iman, S., Orts, W., and Wood,
D., Green composites derived from natural fibres, in Natural Fibre Reinforced
Polymer Composites from Macro to Nanscale, S. Thomas and L.A. Pothan,
Editors. 2009, Old City Publishing, Inc.: Philadelphia, USA. p. 113-139.
35. Meier, M.A., Metzger, J.O., and Schubert, U.S., Plant oil renewable resources
as green alternatives in polymer science. Chemical Society Reviews, 2007.
36(11): p. 1788-1802.
36. Puglia, D., Biagiotti, J., and Kenny, J., A Review on Natural Fibre-Based
Composites—Part II. Journal of Natural Fibers, 2005. 1(3): p. 23-65.
37. John, M.J. and Thomas, S., Biofibres and biocomposites. Carbohydrate
Polymers, 2008. 71(3): p. 343-364.
38. Indira, K., Parameswaranpillai, J., and Thomas, S., Mechanical Properties
and Failure Topography of Banana Fiber PF Macrocomposites Fabricated by
RTM and CM Techniques. ISRN Polymer Science, 2013. 2013.
39. Joseph, S., Sreekala, M.S., Oommen, Z., Koshy, P., and Thomas, S., A
comparison of the mechanical properties of phenol formaldehyde composites
reinforced with banana fibres and glass fibres. Composites Science and
Technology, 2002. 62(14): p. 1857-1868.
40. Liu, H., Wu, Q., and Zhang, Q., Preparation and properties of banana fiber-
reinforced composites based on high density polyethylene (HDPE)/Nylon-6
blends. Bioresource Technology, 2009. 100(23): p. 6088-6097.
41. Singh, R., Gupta, R., Adsul, M.G., Kuhad, R.C., Gokhale, D.V., and Varma,
A.J., Biodegradation of Styrene-Butadiene-Styrene Coploymer via Sugars
Attached to the Polymer Chain. Advances in Materials Physics and
Chemistry, 2013. 3: p. 112.
42. Pothan, L.A., Thomas, S., and Neelakantan, N., Short banana fiber reinforced
polyester composites: mechanical, failure and aging characteristics. Journal
of Reinforced Plastics and Composites, 1997. 16(8): p. 744-765.
43. Savastano Jr, H., Warden, P., and Coutts, R., Brazilian waste fibres as
reinforcement for cement-based composites. Cement and Concrete
Composites, 2000. 22(5): p. 379-384.
44. Majhi, S.K., Nayak, S.K., Mohanty, S., and Unnikrishnan, L., Mechanical
and fracture behavior of banana fiber reinforced Polylactic acid
157
biocomposites. International Journal of Plastics Technology, 2010. 14: p. 57-
75.
45. Doan, T.T.L. and Loan, T., Investigation on jute fibres and their composites
based on polypropylene and epoxy matrices. 2006, Disertasi. Vietnam:
Fakultat Maschinenwesen der Technischen Universität Dresden. p. 1-126.
46. Peijs, T. Composites turn green. Department of Materials, Queen Mary,
University of London [online] 2002 [cited 2014.]; Available from:
http://www.e-polymers.org/.
47. Westman, M.P., Fifield, L.S., Simmons, K.L., Laddha, S., and Kafentzis,
T.A., Natural Fiber Composites: A Review. 2010: Pacific Northwest National
Laboratory.
48. Leao, A.L., Rowell, R., and Tavares, N., Applications of natural fibers in
automotive industry in Brazil—thermoforming process, in Science and
technology of polymers and advanced materials. 1998, Springer. p. 755-761.
49. Luz, S.M., Caldeira-Pires, A., and Ferrao, P., Environmental benefits of
substituting talc by sugarcane bagasse fibers as reinforcement in
polypropylene composites: Ecodesign and LCA as strategy for automotive
components. Resources, Conservation and Recycling, 2010. 54(12): p. 1135-
1144.
50. Shih, Y.-F. and Huang, C.-C., Polylactic acid (PLA)/banana fiber (BF)
biodegradable green composites. Journal of Polymer Research, 2011. 18(6):
p. 2335-2340.
51. El‐Meligy, M.G., El‐Zawawy, W.K., and Ibrahim, M.M., Lignocellulosic
composite. Polymers for advanced technologies, 2004. 15(12): p. 738-745.
52. Schuh, T.G., Renewable materials for automotive applications. Daimler-
Chrysler AG, Stuttgart, 1999.
53. Environment and Plastics Industry Council, Biodegradable polymers: a
review. 2000, EPIC.
54. Müller, R.J., Biodegradability of polymers: regulations and methods for
testing. Biopolymers Online, 2005.
55. Puechner, P., Mueller, W.-R., and Bardtke, D., Assessing the biodegradation
potential of polymers in screening-and long-term test systems. Journal of
Environmental Polymer Degradation, 1995. 3(3): p. 133-143.
56. Hoffmann, J., Řezníčèková, I., Vaňòková, S., and Kupec, J., Manometric
determination of biological degradability of substances poorly soluble in
aqueous environments. International Biodeterioration & Biodegradation,
1997. 39(4): p. 327-332.
57. Smith, R., Biodegradable polymers for industrial applications. 2005: CRC
Press
58. Gautam, S. Bio-degradable Plastics- Impact on Environment. [online] 2009
[cited September 2013.]; Available from:
http://www.cpcb.nic.in/upload/NewItems/NewItem_150_PlasticsWaste.pdf.
59. Francesca Jourdan. The papyrus and its origins. [online] 1999 [cited 2012.];
Available from: http://www.ptahhotep.com/articles/Papyrus.html.
60. Bogoeva‐Gaceva, G., Avella, M., Malinconico, M., Buzarovska, A.,
Grozdanov, A., Gentile, G., and Errico, M.E., Natural fiber eco‐composites.
Polymer composites, 2007. 28(1): p. 98-107.

158
61. Saheb, D.N. and Jog, J., Natural fiber polymer composites: a review.
Advances in Polymer Technology, 1999. 18(4): p. 351-363.
62. Li, X., Tabil, L.G., and Panigrahi, S., Chemical treatments of natural fiber for
use in natural fiber-reinforced composites: A review. Journal of Polymers and
the Environment, 2007. 15(1): p. 25-33.
63. Jayaraman, K., Manufacturing sisal–polypropylene composites with
minimum fibre degradation. Composites Science and Technology, 2003.
63(3): p. 367-374.
64. Elanthikkal, S., Gopalakrishnapanicker, U., Varghese, S., and Guthrie, J.T.,
Cellulose microfibres produced from banana plant wastes: Isolation and
characterization. Carbohydrate Polymers, 2010. 80(3): p. 852-859.
65. Jonas, R. and Farah, L.F., Production and application of microbial cellulose.
Polymer Degradation and Stability, 1998. 59(1): p. 101-106.
66. Heydarzadeh, H., Najafpour, G., and Nazari-Moghaddam, A., Catalyst-free
conversion of alkali cellulose to fine carboxymethyl cellulose at mild
conditions. World Applied Sciences Journal, 2009. 6(4): p. 564-569.
67. Nevell, T.P. and Zeronian, S.H., Cellulose chemistry fundamentals, in
Cellulose chemistry and its applications, T.P. Nevell and S.H. Zeronian,
Editors. 1985, Ellis Horwood Ltd: England. p. 15-30.
68. Herrera, F.P.J. and Valadez-Gonzalez, A., Fibre-matrix adhesion in natural
fiber composites, in Natural fibers, biopolymers and biocomposites, M.M.
Mohanty A, Drzal L, Editor. 2005, CRC Press, Taylor Francis Group: USA.
p. 177-230.
69. Chloe Van. Cellulose. [online] 2010 [cited 2014.]; Available from:
https://myorganicchemistry.wikispaces.com/Cellulose.
70. Rong, M.Z., Zhang, M.Q., Liu, Y., Yang, G.C., and Zeng, H.M., The effect
of fiber treatment on the mechanical properties of unidirectional sisal-
reinforced epoxy composites. Composites Science and Technology, 2001.
61(10): p. 1437-1447.
71. Joseph, K., Thomas, S., and Pavithran, C., Effect of chemical treatment on
the tensile properties of short sisal fibre-reinforced polyethylene composites.
Polymer, 1996. 37(23): p. 5139-5149.
72. Daneel, M., Dillen, N., Husselman, J., De Jager, K., and De Waele, D.,
Results of a survey on nematodes and diseases of Musa in household gardens
in South Africa and Swaziland. InfoMusa, 2003. 12: p. 8-11.
73. Reddy, N. and Yang, Y., Biofibers from agricultural byproducts for industrial
applications. Trends in Biotechnology, 2005. 23(1): p. 22-27.
74. Sapuan, S., Leenie, A., Harimi, M., and Beng, Y.K., Mechanical properties of
woven banana fibre reinforced epoxy composites. Materials and Design,
2006. 27(8): p. 689-693.
75. Marcovich, N.E., Reboredo, M.M., and Aranguren, M.I., Dependence of the
mechanical properties of woodflour–polymer composites on the moisture
content. Journal of Applied Polymer Science, 1998. 68(13): p. 2069-2076.
76. Stark, N., Influence of moisture absorption on mechanical properties of wood
flour-polypropylene composites. Journal of Thermoplastic Composite
Materials, 2001. 14(5): p. 421-432.
159
77. Laine, L. and Rozite, L. Eco-efficient composite materials. [online] 2010
[cited August 2013.]; Available from:
http://www.ketek.fi/anacompo/STATE%20OF%20THE%20ART.pdf.
78. George, J., Bhagawan, S., and Thomas, S., Effects of environment on the
properties of low-density polyethylene composites reinforced with pineapple-
leaf fibre. Composites Science and Technology, 1998. 58(9): p. 1471-1485.
79. Wang, W., Sain, M., and Cooper, P.A., Study of moisture absorption in
natural fiber plastic composites. Composites Science and Technology, 2006.
66(3-4): p. 379-386.
80. Gassan, J. and Bledzki, A.K., Possibilities for improving the mechanical
properties of jute/epoxy composites by alkali treatment of fibres. Composites
Science and Technology, 1999. 59(9): p. 1303-1309.
81. Pothan, L.A., Thomas, S., and Groeninckx, G., The role of fibre/matrix
interactions on the dynamic mechanical properties of chemically modified
banana fibre/polyester composites. Composites Part A: Applied Science and
Manufacturing, 2006. 37(9): p. 1260-1269.
82. Joshy, M., Isora Fibre Reinforced Polyester and Epoxy Composites, in
Faculty of Technology. 2007, Cochin University of Science and Technology:
India. p. 254.
83. Nassif, R.A., Effect of chemical treatment on the some electrical and thermal
properties for unsaturated polyester composites using banana fibers. Matrix,
2010. 1: p. 7.
84. Wang, C., Fracture mechanics of single-fibre pull-out test. Journal of
Materials Science, 1997. 32(2): p. 483-490.
85. Yue, C. and Cheung, W., Interfacial properties of fibrous composites. Journal
of materials science, 1992. 27(12): p. 3181-3191.
86. International Network for the Improvement of Banana and Plantain. Bananas.
[online] 2000 [cited September 2013.]; Available from:
http://www.bioversityinternational.org/fileadmin/bioversity/publications/pdfs
/664_Networking_Banana_and_Plantain.pdf.
87. Aziz, N., Ho, L., Azahari, B., Bhat, R., Cheng, L., and Ibrahim, M., Chemical
and functional properties of the native banana pseudo-stem and pseudo-stem
tender core flours. Food Chemistry, 2011. 128(3): p. 748-753.
88. Department of Agriculture. A profile on the South African banana market
value chain. 2011 [cited August 2012.]; Available from:
http://www.nda.agric.za/docs/AMCP/Bananamvcp2011-12.pdf.
89. Nation Master. Agriculture statistics- banana production (most recent) by
country. 2000 [cited 14 July 2012.]; Available from:
http://www.nationmaster.com/red/graph/agr_ban_pro-agriculture-banana-
production&b_map=1.
90. Oliveira, L., Cordeiro, N., Evtuguin, D.V., Torres, I.C., and Silvestre, A.J.D.,
Chemical composition of different morphological parts from ‘Dwarf
Cavendish’ banana plant and their potential as a non-wood renewable source
of natural products. Industrial Crops and Products, 2007. 26(2): p. 163-172.
91. Li, K., Fu, S., Zhan, H., Zhan, Y., and Lucia, L.A., Analysis of the chemical
composition and morphological structure of a banana psuedo-stem.
BioResources, 2010. 5(2).

160
92. De Beer, Z. and Sigawa, A. Banana (Musa spp.) juice production in South
Africa. 2008.
93. Wigglesworth. Uses of Abaca. 2007; Available from:
http://www.wigglesworthfibres.com/products/abaca/usesofabaca.html.
94. NCS resins. Unsaturated polyester resins. [online] n.d [cited 2013.];
Available from: http://www.ncsresins.com/unsaturated-polyester-resin.
95. Aziz, S.H., Ansell, M.P., Clarke, S.J., and Panteny, S.R., Modified polyester
resins for natural fibre composites. Composites Science and Technology,
2005. 65(3): p. 525-535.
96. Andjelkovic, D., Culkin, D., and Loza, R. Unsaturated polyester resins
derived from renewable resources. in Composites and Polycon. 2009. Tampa,
Florida, USA.
97. Strong, B., Plastics Materials and Processing. 3 ed. Vol. 1. 2006, New Jersey:
Pearson Prentice Hall.
98. Skrifvars, M., Synthetic Modification and Characterisation of Unsaturated
Polyesters. 2000: M. Skrifvars.
99. Celluwood, Bio-resin systems. 2008(ID: ECO/10/277331): p. 40-48.
100. Composites Technology. Bio-Composites Update: Bio-Based Resins Begin to
Grow. 2008 [cited 23 September 2014.]; Available from:
http://www.compositesworld.com/articles/bio-composites-update-bio-based-
resins-begin-to-grow.
101. Strong, B., Microstructures in polymers, in Plastics Materials and Processing,
D. Yarnell, Editor. 2006, Pearson Prentice Hall: New Jersey. p. 73-117.
102. Kim, S. and Kim, H.-J., Curing behavior and viscoelastic properties of pine
and wattle tannin-based adhesives studied by dynamic mechanical thermal
analysis and FT-IR-ATR spectroscopy. Journal of adhesion science and
technology, 2003. 17(10): p. 1369-1383.
103. Kim, S. and Kim, H.-J., Evaluation of formaldehyde emission of pine and
wattle tannin-based adhesives by gas chromatography. Holz als Roh-und
Werkstoff, 2004. 62(2): p. 101-106.
104. Kim, S., Lee, Y.-K., Kim, H.-J., and Lee, H.H., Physico-mechanical
properties of particleboards bonded with pine and wattle tannin-based
adhesives. Journal of adhesion science and technology, 2003. 17(14): p.
1863-1875.
105. Clarinval, A. and Halleux, C., Classification of biodegradable polymers, in
Biodegradable polymers for industrial applications, R. Smith, Editor. 2005,
Woodhead Publishing: Cambridge, GBR. p. 3-29.
106. Lubi, M.C. and Thachil, E.T., Cashew nut shell liquid (CNSL)-a versatile
monomer for polymer synthesis. Designed Monomers and polymers, 2000.
3(2): p. 123-153.
107. Ikeda, R., Tanaka, H., Uyama, H., and Kobayashi, S., Synthesis and curing
behaviors of a crosslinkable polymer from cashew nut shell liquid. Polymer,
2002. 43(12): p. 3475-3481.
108. Mwaikambo, L. and Ansell, M., Hemp fibre reinforced cashew nut shell
liquid composites. Composites science and technology, 2003. 63(9): p. 1297-
1305.

161
109. Harlin, A., Edelmann, K., Immonen, K., Mroueh, U.-M., Pingoud, K., and
Wessman, H., Industrial biomaterial visions. VIT Research Notes, 2009.
2522: p. 1-94.
110. Oprea, S. and Doroftei, F., Biodegradation of polyurethane acrylate with
acrylated epoxidized soybean oil blend elastomers by Chaetomium globosum.
International Biodeterioration & Biodegradation, 2011. 65(3): p. 533-538.
111. Iovino, R., Zullo, R., Rao, M., Cassar, L., and Gianfreda, L., Biodegradation
of poly (lactic acid)/starch/coir biocomposites under controlled composting
conditions. Polymer Degradation and Stability, 2008. 93(1): p. 147-157.
112. Kumar, R., Yakubu, M., and Anandjiwala, R., Biodegradation of flax fiber
reinforced poly lactic acid. Express Polymer Letters, 2010. 4(7): p. 423-430.
113. Narayanan, N., Roychoudhury, P.K., and Srivastava, A., L (+) lactic acid
fermentation and its product polymerization. Electronic Journal of
Biotechnology, 2004. 7(2): p. 167-178.
114. Vert, M., Aliphatic polyesters: Great degradable polymers that cannot do
everything. Biomacromolecules, 2005. 6(2): p. 538-546.
115. Cordeiro, N., Belgacem, M.N., Torres, I.C., and Moura, J., Chemical
composition and pulping of banana pseudo-stems. Industrial Crops and
Products, 2004. 19(2): p. 147-154.
116. Mukhopadhyay, S., Fangueiro, R., Arpaç, Y., and Şentürk, Ü., Banana
Fibers–Variability and Fracture Behaviour. Cellulose, 2008. 31: p. 3.61.
117. Hirose, S., Hatakeyama, T., and Hatakeyama, H. Synthesis and thermal
properties of epoxy resins from ester‐carboxylic acid derivative of alcoholysis
lignin. in Macromolecular Symposia. 2003. Wiley Online Library.
118. Labcat. Simple sugars: fructose, glucose and sucrose. [online] 2009 [cited 20
September 2014.]; Available from:
https://cdavies.wordpress.com/2009/01/27/simple-sugars-fructose-glucose-
and-sucrose/.
119. Timothy R. Felthouse, Joseph C. Burnett, Ben Horrell, Michael J. Mummey,
and Yeong-Jen Kuo. Maleic anhydride. [online] 2001 [cited 16 February
2013.]; Available from: http://jws-
edck.interscience.wiley.com:8095/kirk_articles_fs.html.
120. Office of environmental health hazard assessment. Maleic anhydride. [online]
2001 [cited 16 February 2013.]; Available from:
http://oehha.ca.gov/air/chronic_rels/pdf/maleic.pdf.
121. Coptis Formulation and Regulatory software For Cosmetic Laboratories.
Propylene Glycol. 2012 [cited February 2014.]; Available from:
http://www.drugs.com/inactive/propylene-glycol-270.html.
122. Property., M.M. Cloisite 30B nanoclay. 2011 [cited 2014; Available from:
http://www.matweb.com/search/DataSheet.aspx?MatGUID=1213e923b3544
011850ad51fa523571c.
123. Metter Toledo Petrochemicals News. Improved Water Analysis of Oils,
Combining Two Techniques. [online] 2012 [cited 2013.]; Available from:
http://us.mt.com/dam/LabDiv/SegNews/downloads/Petrochemicals_News_14
_en.pdf.
162
124. Harper college. The Molisch Test. [online] n.d. [cited 15 February 2013.];
Available from: http://www.harpercollege.edu/tm-
ps/chm/100/dgodambe/thedisk/carbo/molisch/molisch.htm.
125. Singleton, V. and Rossi Jr, J.A., Colorimetry of total phenolics with
phosphomolybdic-phosphotungstic acid reagents. American journal of
Enology and Viticulture, 1965. 16(3): p. 144-158.
126. Goering, H. and Van Soest, P., Forage fiber analysis. ARS, USDA. Agr.
Handbook, 1970. 379.
127. Herrera-Saldana, R. and Huber, J., Influence of varying protein and starch
degradabilities on performance of lactating cows. Journal of Dairy Science,
1989. 72(6): p. 1477-1483.
128. Parkyn, B., Commercial polyester resins, in Polyesters, unsaturated polyesters
and polyester plasticisers, B. Parkyn, F. Lamb, and B.V. Clifton, Editors.
1967, London Iliffe Books Ltd: London
129. Keener, T.J., Stuart, R.K., and Brown, T.K., Maleated coupling agents for
natural fibre composites. Composites Part A Applied Science and
Manufacturing, 2004. 35(3): p. 357-362.
130. Joseph, P., Rabello, M.S., Mattoso, L., Joseph, K., and Thomas, S.,
Environmental effects on the degradation behaviour of sisal fibre reinforced
polypropylene composites. Composites Science and Technology, 2002.
62(10-11): p. 1357-1372.
131. Ramsaroop, A., Fracture properties of fibre and nano reinforced composite
structures, in Department of Mechanical Engineering. 2007, Durban
University of Technolgy: Durban.
132. Kissinger, H.E., Reaction kinetics in differential thermal analysis. Analytical
chemistry, 1957. 29(11): p. 1702-1706.
133. Flynn, J.H. and Wall, L.A., A quick, direct method for the determination of
activation energy from thermogravimetric data. Journal of Polymer Science
Part B: Polymer Letters, 1966. 4(5): p. 323-328.
134. Elmer., P., Dynamic Mechanical Analysis Basics: Part 2 Thermoplastic
Transitions and Properties. 2007.
135. Encyclopædia Britannica Online. Amorphous polymer: amorphous and
semicrystalline polymer morphologies. [online] 2014 [cited 12 September
2014.]; Available from:
http://www.britannica.com/EBchecked/media/268/Amorphous-and-
semicrystalline-polymer-morphologies.
136. Dhakal, H., Zhang, Z., Richardson, M., and Errajhi, O., The low velocity
impact response of non-woven hemp fibre reinforced unsaturated polyester
composites. Composite structures, 2007. 81(4): p. 559-567.
137. Moodley, V., The synthesis, structure and properties of polypropylene
nanocomposites, in Mechanical Engineering. 2007, Durban University of
Technology: South Africa.
138. Prasad, M.S., Venkatesha, C., and Jayaraju, T., Experimental Methods of
Determining Fracture Toughness of Fiber Reinforced Polymer Composites
under Various Loading Conditions. Journal of Minerals & Materials
Characterization & Engineering, 2011. 10(13): p. 1263-1275.

163
139. Thostenson, E.T., Ren, Z., and Chou, T.-W., Advances in the science and
technology of carbon nanotubes and their composites: a review. Composites
science and technology, 2001. 61(13): p. 1899-1912.
140. Sinha Ray, S. and Okamoto, M., Polymer/layered silicate nanocomposites: a
review from preparation to processing. Progress in polymer science, 2003.
28(11): p. 1539-1641.
141. Zhao, F., Wan, C., Bao, X., and Kandasubramanian, B., Modification of
montmorillonite with aminopropylisooctyl polyhedral oligomeric
silsequioxane. Journal of Colloid and Interface Science, 2009. 333(1): p. 164-
170.
142. Girish, G., Synthesis-Structure-Processing-property relationships in polymer
nanocomposites, in Chemical Engineering Department. 2003, Pune: India.
143. Utracki, L., Sepehr, M., and Boccaleri, E., Synthetic, layered nano-particles
for polymeric nanocomposites (PNC's). Polymers for advanced technologies,
2007. 18(1): p. 1-37.
144. Laoutid, F., Bonnaud, L., Alexandre, M., Lopez-Cuesta, J.-M., and Dubois,
P., New prospects in flame retardant polymer materials: from fundamentals to
nanocomposites. Materials Science and Engineering: R: Reports, 2009. 63(3):
p. 100-125.
145. Praveen, S., Chattopadhyay, P.K., Jayendran, S., Chakraborty, B.C., and
Chattopadhyay, S., Effect of nanoclay on the mechanical and damping
properties of aramid short fibre filled styrene butadiene rubber composites.
Polymer International, 2010. 59(2): p. 187-197.
146. Chiellini, E., Corti, A., and Swift, G., Biodegradation of thermally-oxidized,
fragmented low-density polyethylenes. Polymer Degradation and Stability,
2003. 81(2): p. 341-351.
147. D6400, A., Standard Specification for Labeling of Plastics Designed to be
Aerobically Composted in Municipal or Industrial Facilities, in ASTM
International,. 2012: West Conshohocken, PA.
148. Chiellini, E. and Solaro, R., Biodegradable polymers and plastic. 2003, New
York, USA: Kluwer Academic/Plenum Publishers,.
149. D5338-03, A., Standard Test Method for Determining the Aerobic
Biodegradation of Plastic Materials Under Controlled Composting
Conditions. 2004: West Conshohocken, PA.
150. Transport Information Service. Bananas. [online] 2013 [cited 2014.];
Available from: http://www.tis-gdv.de/tis_e/ware/obst/banane/banane.htm.
151. Kumar, K., Bhowmik, D., Duraivel, S., and Umadevi, M., Traditional and
Medicinal Uses of Banana. Journal of Pharmacognosy and Phytochemistry,
2012.
152. Feriotti, D. and Iguti, A. Proposal for Use of Pseudostem from Banana Tree
(Musa cavendish). in International Congress of Engineering and Food. 2012.
153. Reusch, W. Carbohydrates. [online] 2013 [cited 2014.]; Available from:
https://www2.chemistry.msu.edu/faculty/reusch/virttxtjml/carbhyd.htm.
154. Ashok, R. Coloured reactions of carbohydrates. [online] 2013 [cited 2014.];
Available from: http://www.authorstream.com/Presentation/raniashok-
1429879-coloured-reactions-of-carbohydrates/.

164
155. Narain, R., Jhurry, D., and Wulff, G., Synthesis and characterization of
polymers containing linear sugar moieties as side groups. European Polymer
Journal, 2002. 38(2): p. 273-280.
156. Jhurry, D. and Deffieux, A., Sucrose-based polymers: Polyurethanes with
sucrose in the main chain. European Polymer Journal, 1997. 33(10): p. 1577-
1582.
157. Tillet, G., Boutevin, B., and Ameduri, B., Chemical reactions of polymer
crosslinking and post-crosslinking at room and medium temperature. Progress
in Polymer Science, 2011. 36(2): p. 191-217.
158. Lamaming, J., Sulaiman, O., Sugimoto, T., Hashim, R., Said, N., and Sato,
M., Influence of chemical components of oil palm on properties of binderless
particleboard. BioResources, 2013. 8(3): p. 3358-3371.
159. Rice-Evans, C., Miller, N., and Paganga, G., Antioxidant properties of
phenolic compounds. Trends in plant science, 1997. 2(4): p. 152-159.
160. Arrieta-Baez, D., Cruz-Carrillo, M., Gómez-Patiño, M.B., and Zepeda-
Vallejo, L.G., Derivatives of 10, 16-dihydroxyhexadecanoic acid isolated
from tomato (Solanum lycopersicum) as potential material for aliphatic
polyesters. Molecules, 2011. 16(6): p. 4923-4936.
161. Stales, C.A., Peterson, D.R., Parkerton, T.F., and Adams, W.J., The
environmental fate of phthalate esters: a literature review. Chemosphere,
1997. 35(4): p. 667-749.
162. IFI Claims Patent Services. High-molecular weight unsaturated polyester
resin. [online] 2012 [cited 6 January 2015.]; Available from:
http://www.google.com/patents/EP0503935B1?cl=en.
163. Albemarle. Ethanox 4703. [online] 2013 [cited 2013.]; Available from:
http://albemarle.com/Products-and-Markets/Polymer-
Solutions/Antioxidants/Lubricants-187.html.
164. Paul, V., Kanny, K., and Redhi, G., Formulation of a novel bio-resin from
banana sap. Industrial Crops and Products, 2013. 43: p. 496-505.
165. Raghavendra, Hegde, M., Kamath, G., and Atul Dahiya. Polymer
crystallinity. [online] [cited 14 September 2014.]; Available from:
http://web.utk.edu/Textiles/polymer20%Crystallinity.
166. Manthey, N., Development of hemp oil based bioresins for biocomposites, in
Centre of Excellence in Engineered Fibre Composites, Faculty of
Engineering and Surveying. 2013, University of Southern Queensland:
Australia.
167. Pistor, V., Soares, S.S.d.S.d., Ornaghi Júnior, H.L., Fiorio, R., and Zattera,
A.J., Influence of glass and sisal fibers on the cure kinetics of unsaturated
polyester resin. Materials Research, 2012. 15(4): p. 650-656.
168. Rantuch, P., Kačíková, D., and Nagypál, B., Investigation of activation
energy of polypropylene composite thermooxidation by model-free methods.
European Journal of Environmental and Safety Sciences, 2014. 2(1): p. 12-
18.
169. Barral, L., Cano, J., López, J., López‐Bueno, I., Nogueira, P., Abad, M., and
Ramirez, C., Kinetic studies of the effect of ABS on the curing of an
epoxy/cycloaliphatic amine resin. Journal of Polymer Science Part B:
Polymer Physics, 2000. 38(3): p. 351-361.

165
170. Islam, M.S., Pickering, K.L., and Foreman, N.J., Curing kinetics and effects
of fibre surface treatment and curing parameters on the interfacial and tensile
properties of hemp/epoxy composites. Journal of Adhesion Science and
Technology, 2009. 23(16): p. 2085-2107.
171. Kosar, V. and Gomzi, Z., In-depth analysis of the mathematical model of
polyester thermosets curing. European polymer journal, 2004. 40(12): p.
2793-2802.
172. Bufa. Unsaturated Polyester Resins, Vinyl Ester Resins and Epoxy Systems.
[online] 2013 [cited 15 August 2013.]; Available from:
https://www.buefa.de/wps/wcm/connect/cf3beadf-b938-40ed-a7e5-
e5141ebd4710/Komplettprogramm_2013_Englisch_UP_Harze.pdf?MOD=A
JPERES&CACHEID=cf3beadf-b938-40ed-a7e5-e5141ebd4710.
173. Turi, E.A., Thermal Characterization of Polymeric Materials Vol. 1. 1981,
London: Academic Press.
174. Sigma Aldrich. Plasticizers. [online] 2015 [cited 10 January 2015.];
Available from: http://www.sigmaaldrich.com/materials-science/material-
science-products.html?TablePage=16371266.
175. Calado, V., Barreto, D., and d'Almeida, J., The effect of a chemical treatment
on the structure and morphology of coir fibers. Journal of Materials Science
Letters, 2000. 19(23): p. 2151-2153.
176. Fan, M., Dai, D., and Huang, B., Fourier transform infrared Spectroscopy for
natural Fibres. Fourier Transform–Materials Analysis. Intech, 2012.
177. Bessadok, A., Marais, S., Gouanvé, F., Colasse, L., Zimmerlin, I., Roudesli,
S., and Métayer, M., Effect of chemical treatments of Alfa ( Stipa
tenacissima) fibres on water-sorption properties. Composites science and
technology, 2007. 67(3): p. 685-697.
178. El-Shekeil, Y., Sapuan, S., Abdan, K., and Zainudin, E., Influence of fiber
content on the mechanical and thermal properties of Kenaf fiber reinforced
thermoplastic polyurethane composites. Materials & Design, 2012. 40: p.
299-303.
179. Barreto, A.C.H., Rosa, D.S., Fechine, P.B.A., and Mazzetto, S.E., Properties
of sisal fibers treated by alkali solution and their application into cardanol-
based biocomposites. Composites Part A Applied Science and
Manufacturing, 2011. 42(5): p. 492-500.
180. Indira.KN, Grohens.Y, Baley.C, Thomas.S, Joseph.K, and Pothen.LA,
Adhesion and Wettability Characteristics of Chemically Modified Banana
Fibre for Composite Manufacturing. Journal of Adhesion Science and
Technology, 2011. 25(13): p. 1515-153.
181. Thwe, M.M. and Liao, K., Effects of environmental aging on the mechanical
properties of bamboo–glass fiber reinforced polymer matrix hybrid
composites. Composites Part A: Applied Science and Manufacturing, 2002.
33(1): p. 43-52.
182. Giridhar, J. and Rao, R., Moisture absorption characteristics of natural fibre
composites. Journal of reinforced plastics and composites, 1986. 5(2): p. 141-
150.
183. Espert, A., Vilaplana, F., and Karlsson, S., Comparison of water absorption in
natural cellulosic fibres from wood and one-year crops in polypropylene

166
composites and its influence on their mechanical properties. Composites Part
A Applied Science and Manufacturing, 2004. 35(11): p. 1267-1276.
184. Dhakal, H., Zhang, Z., and Richardson, M., Effect of water absorption on the
mechanical properties of hemp fibre reinforced unsaturated polyester
composites. Composites Science and Technology, 2007. 67(7): p. 1674-1683.
185. Bismarck, A., Aranberri‐Askargorta, I., Springer, J., Lampke, T., Wielage,
B., Stamboulis, A., Shenderovich, I., and Limbach, H.H., Surface
characterization of flax, hemp and cellulose fibers; Surface properties and the
water uptake behavior. Polymer Composites, 2004. 23(5): p. 872-894.
186. Cambridge Polymer Group. Swelling measurements of crosslinked polymers.
[online] 2000 [cited 12 February 2014.]; Available from:
http://www.campoly.com/files/3013/5216/6056/005.pdf.
187. Jose, J.P. and Thomas, S., Alumina–clay nanoscale hybrid filler assembling
in cross-linked polyethylene based nanocomposites: mechanics and thermal
properties. Physical Chemistry Chemical Physics, 2014. 16(28): p. 14730-
14740.
188. Hale, A. and Bair, H., Polymer blends in Thermal characterization of
polymeric materials, E.A. Turi, Editor. 1997, Academic Press: New York. p.
745-886.
189. Manikandan Nair, K., Thomas, S., and Groeninckx, G., Thermal and dynamic
mechanical analysis of polystyrene composites reinforced with short sisal
fibres. Composites Science and Technology, 2001. 61(16): p. 2519-2529.
190. Joseph, P., Joseph, K., Thomas, S., Pillai, C., Prasad, V., Groeninckx, G., and
Sarkissova, M., The thermal and crystallisation studies of short sisal fibre
reinforced polypropylene composites. Composites Part A Applied Science
and Manufacturing, 2003. 34(3): p. 253-266.
191. Kwan, K.S., The role of penetrant structure in the transport and mechanical
properties of a thermoset adhesive. 1998, Virginia Polytechnic Institute and
State University.
192. Martínez-Hernández, A., Velasco-Santos, C., De-Icaza, M., and Castaño,
V.M., Dynamical–mechanical and thermal analysis of polymeric composites
reinforced with keratin biofibers from chicken feathers. Composites Part B:
Engineering, 2007. 38(3): p. 405-410.
193. Shanmugam, D. and Thiruchitrambalam, M., Static and Dynamic Mechanical
Properties of alkali treated unidirectional continuous Palmyra Palm Leaf
Stalk Fiber/Jute fiber reinforced hybrid polyester composites. Materials and
Design, 2013. 50: p. 533-542.
194. Jia, Y., Yan, W., and HY, L. Numetrical study on carbon fibre pullout using a
cohesive zone model in ICCM 18th International conference on composite
materials. 21 - 26 August 2011. Korea.
195. Kord, B. and Kiakojouri, S.M.H., Effect of nanoclay dispersion on physical
and mechanical properties of wood flour/polypropylene/glass fiber hybrid
composites. BioResources, 2011. 6(2): p. 1741-1751.
196. Surabhi Sinha. Phenols. [online] [cited 10 October 2014.]; Available from:
http://www.britannica.com/EBchecked/topic/455507/phenol.
197. Mishra, S., Mohanty, A., Drzal, L., Misra, M., Parija, S., Nayak, S., and
Tripathy, S., Studies on mechanical performance of biofibre/glass reinforced

167
polyester hybrid composites. Composites Science and Technology, 2003.
63(10): p. 1377-1385.
198. D5045, A., Standard test method for plane strain fracture and strain energy
release rate of plastic materials. 1996.
199. Huda, M., Drzal, L., D., R., A., M., and Mishra, M.K., Natural fibre
composites in the automotive sector. 2008, Woodhead Publishing Limited.
200. Acha, B.A., Reboredo, M.M., and Marcovich, N.E., Creep and dynamic
mechanical behavior of PP–jute composites: Effect of the interfacial
adhesion. Composites Part A: Applied Science and Manufacturing, 2007.
38(6): p. 1507-1516.
201. Goertzen, W. and Kessler, M., Creep behaviour of carbon fiber/epoxy matrix
composites. Materials Science and Engineering A, 2006. 421: p. 217-225.
202. Miyagawa, H., Mohanty, A.K., Burgueño, R., Drzal, L.T., and Misra, M.,
Characterization and thermophysical properties of unsaturated polyester-
layered silicate nanocomposites. Journal of nanoscience and nanotechnology,
2006. 6(2): p. 464-471.
203. Sathe, S.N., Srinivasa Rao, G., Rao, K., and Devi, S., The effect of
composition on morphological, thermal, and mechanical properties of
polypropylene/nylon‐6/polypropylene‐g‐butyl acrylate blends. Polymer
Engineering & Science, 1996. 36(19): p. 2443-2450.
204. Agag, T., Koga, T., and Takeichi, T., Studies on thermal and mechanical
properties of polyimide–clay nanocomposites. Polymer, 2001. 42(8): p. 3399-
3408.
205. Lee, B.L. and Nielsen, L.E., Temperature dependence of the dynamic
mechanical properties of filled polymers. Journal of Polymer Science:
Polymer Physics Edition, 1977. 15(4): p. 683-692.
206. Lei, S., Hoa, S.V., and Ton-That, M.-T., Effect of clay types on the
processing and properties of polypropylene nanocomposites. Composites
Science and Technology, 2006. 66(10): p. 1274-1279.
207. Arutchelvi, J., Sudhakar, M., Arkatkar, A., Doble, M., Bhaduri, S., and
Uppara, P.V., Biodegradation of polyethylene and polypropylene. Indian
Journal of Biotechnology, 2008. 7(1): p. 9.
208. Manzur, A., Limón‐González, M., and Favela‐Torres, E., Biodegradation of
physicochemically treated LDPE by a consortium of filamentous fungi.
Journal of Applied Polymer Science, 2004. 92(1): p. 265-271.
209. Pamuła, E., Błażewicz, M., Paluszkiewicz, C., and Dobrzyński, P., FTIR
study of degradation products of aliphatic polyesters–carbon fibres
composites. Journal of Molecular Structure, 2001. 596(1): p. 69-75.
210. Campanella, A., La Scala, J.J., and Wool, R.P., The use of acrylated fatty
acid methyl esters as styrene replacements in triglyceride‐based thermosetting
polymers. Polymer Engineering & Science, 2009. 49(12): p. 2384-2392.
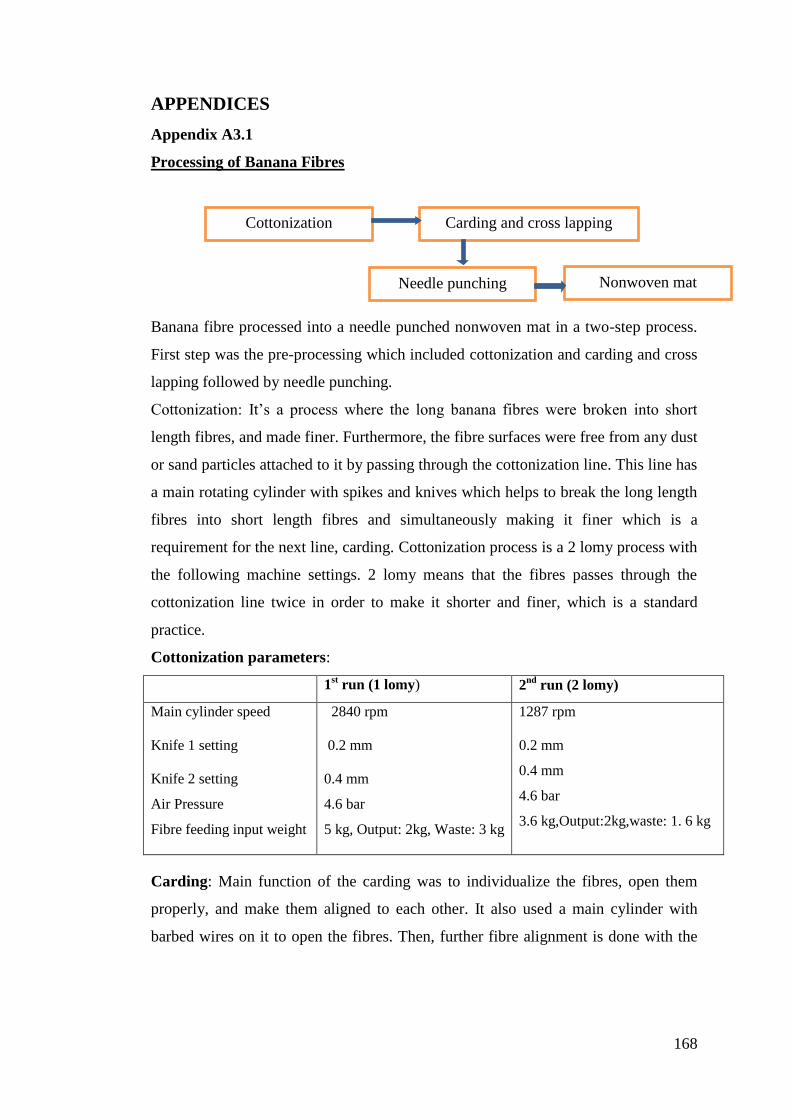
168
APPENDICES
Appendix A3.1
Processing of Banana Fibres
Banana fibre processed into a needle punched nonwoven mat in a two-step process.
First step was the pre-processing which included cottonization and carding and cross
lapping followed by needle punching.
Cottonization: It’s a process where the long banana fibres were broken into short
length fibres, and made finer. Furthermore, the fibre surfaces were free from any dust
or sand particles attached to it by passing through the cottonization line. This line has
a main rotating cylinder with spikes and knives which helps to break the long length
fibres into short length fibres and simultaneously making it finer which is a
requirement for the next line, carding. Cottonization process is a 2 lomy process with
the following machine settings. 2 lomy means that the fibres passes through the
cottonization line twice in order to make it shorter and finer, which is a standard
practice.
Cottonization parameters:
1st run (1 lomy) 2
nd run (2 lomy)
Main cylinder speed
Knife 1 setting
Knife 2 setting
Air Pressure
Fibre feeding input weight
2840 rpm
0.2 mm
0.4 mm
4.6 bar
5 kg, Output: 2kg, Waste: 3 kg
1287 rpm
0.2 mm
0.4 mm
4.6 bar
3.6 kg,Output:2kg,waste: 1. 6 kg
Carding: Main function of the carding was to individualize the fibres, open them
properly, and make them aligned to each other. It also used a main cylinder with
barbed wires on it to open the fibres. Then, further fibre alignment is done with the
Cottonization Carding and cross lapping
Needle punching Nonwoven mat

169
help of other rollers. Further alignment is achieved with the help of the cross lapper,
which lays the carded web in to cross machine direction over one another so that
there is uniform strength in the web in all directions (length and width wise).
Banana fibres after cottonization were subjected to a humidifier for 2 hours (95%
humidity). Then, fibres were blended manually with the cotton fibres (carrier fibres)
in a 90% / 10% mix. The mix was then fed into the carding machine. The first
carding produced no usable web probably since the fibres had not been blended
sufficiently. The mix was then fed into the card one more time, and the second time
around a usable web was forming.
Carding machine and cross lapper parameters:
Fibre feeding speed: 0.9 m/min
Main cylinder speed: 200 rpm
Cross lapper speed: 0.9 m/min
Fibre mix: 90% banana, 10% cotton.
Note: It is not possible to process 100% banana fibres, because of the fibre are very
weak and also very brittle. So it needs to mix with a carrier fibre for processing.
Needle punching: The carded cross-lapped web is subjected to the action of the
barbed needles in a needle bed to produce nonwoven mat. By the mechanical action
of the needles, fibres are bonded together. There are more than 2000 needles in the
needle board. Each needle has a latch type of section at the tip of the needle. Initially
the needles pass through a bulky fibre web and while doing so, it pushed down
several fibres together. In the next step the same needle set, comes back to the
original position. In this motion, it releases the fibres from the needle latch, thereby
boning the fibres together by mechanical action.
Processing parameters:
Parameter Setting
Fibres feeding 0.59 m/min
Needle depth 5 mm
Stroke Frequency 300 in

170
Appendix A3.2
Raw data for processing of resin
DATE TIME
BATCH
TEMP
S/H
TEMP
ACID
VALUE
MELT @
120°C DIST COMMENTS
DAY 1 9.3 22.3 23 start batch
10.25 65.6 26 batch clear
10.45 165 100 start distillation
178 exotherm
11.45 158.8 100 65
13.5 192.4 96 124.5 0.9 255
14.5 190.3 75 105.4 1.1 290
15.5 189.6 71 100.8 1.3 295
heat off
DAY 2 7.3 26 21 296 heat on
8.3 58 24 stirrer on
9.3 195.8 80 92.7 1.9 300
10.25 189.4 39 99.2 1.9 305
11.45 205.1 94 96.7 2.1 315
12.45 208.7 94 89.6 2.8 325 added 35g PG
3.3 208.1 93 80.7 3 335
DAY 3 7.4 36.7 23 350 heat on
8.55 147.5 25 stirrer on
9.55 202.3 77 83.9 3.1 350
10.55 206.5 78 87.2 4 355
removed long
column
11.55 204.9 71 72.4 4.9 360
added 75g PG
@1pm
13.55 201.1 70 58.7 40 370
14.5 206.1 70 58.4 4.1
15.4 heat off

171
Appendix A3.3
Raw data for processing of resin
Date Time
Batch
temp
S/h
temp
Acid
value
Melt @
120°c Distillation Comments
DAY 1 11.15 26 22 start batch
11.45 103 99 200
DAY 2 7.4 250
water
distilled out
4.3 104 98 800 heat off
DAY 3 8 73 21 1100 heat on
11.45 183 101 147.05 0.1 1240
12.45 191 64 96.1 2.5 2120
1.4 190 82 86.7 2.8 2320
2.45 203 59 76.2 4 2500
3.4 200 59 67.7 4.9
3.5 heat off
DAY 4 7.45 heat on
8 stirrer on
8.3 201 83 63.1 6.9
9.15 196 69 61.1 11
9.3 179 66
added 100g
PG
10 198 78 44.8 5
10.15 43 6 heat off