synopsis res terrae final - university of oulu · res terrae publications of the department of...
TRANSCRIPT

RES TERRAE
Publications of the Department of Geosciences University of Oulu Oulun yliopiston geotieteiden laitoksen julkaisuja
Ser. A, No. 27
2009
Antti Pasanen
The application of ground penetrating radar to the study of Quaternary depositional environments

2

Antti Pasanen
The application of ground penetrating radar to the study of depositional
environments
Res Terrae, Ser. A, No. 27, OULU, 2009
RES TERRAE - Publications of the Department of Geosciences, University of Oulu, Oulun yliopiston geotieteiden laitoksen julkaisuja Ser. A, Contributions ISSN 0358-2477 Ser. B, Raportteja - Reports ISSN 0358-2485 Ser. C, Opetusjulkaisuja - Teaching material ISSN 0358-2493 Editorial board - Toimituskunta: Dr. Pekka Tuisku, Päätoimittaja - Editor-in-Chief Prof. Vesa Peuraniemi Dr. Aulis Kärki, Toimitussihteeri - Sub-Editor Julkaisu ja levitys - Published and distributed by: Oulun yliopisto, geologian osasto - University of Oulu, Department of Geology, P.O. Box 3000, 90014 University of Oulu, Finland Telephone: 08-5531430, International tel: +358-8-5531430 Telefax: 08-5531484, International fax: +358-8-5531484 E-mail: [email protected] www: http://cc.oulu.fi/~resterr/

4

5
THE APPLICATION OF GROUND PENETRATING RADAR TO THE
STUDY OF DEPOSITIONAL ENVIRONMENTS
ANTTI PASANEN
Department of Geosciences, University of Oulu, P.O. Box 3000, FI-90014 University of
Oulu, Finland
ABSTRACT
This thesis comprises five original papers dealing with the internal structures of the Middle
and Late Pleistocene clastic, coarse-grained sediments. The study of these structures is
important for the determination of the depositional environment. The internal structures
have been studied using well established sedimentological methods, including section
logging, borehole records, clast lithological and clast-fabric analyses, and structural
measurements from the glaciotectonic thrust faults and folds.
The sedimentological methods usually give point-form data. This was compensated for by
extensive use of ground penetrating radar (GPR) on the deposits. GPR is the main method
applied in this thesis. The data have been interpreted using the radar stratigraphy and radar
facies analysis techniques. By using these techniques the internal structure of the deposit
and the relative stratigraphic position can be determined, and the depositional environment
can be interpreted. Geomorphology was also used in preliminary studies and to assist in
evaluating the depositional environment.
The depositional environments studied in this thesis comprise fluvial, glacial,
glaciodeltaic, glaciotectonic and littoral environments. The original papers are from three
different regions, two are from East Anglia, England, two from the Oulu region, Finland
and one from Russian Karelia, Northwest Russia. The implications of the interpretation of
the internal structures and depositional environments includes the determination of the
glacial shear-stress direction of the Late Weichselian glaciation in the Oulu region, the
reconstruction of the ice-limit of the Wolstonian (Saalian) glaciation in East Anglia and

6
the reconstruction of the palaeotopography of the White Sea Basin in Northwest Russia
during the late Younger Dryas Stadial (Late Weichselian).
The development and use of the radar stratigraphy method are outlined and discussed. It is
suggested that the reflections caused by the secondary processes should be included in the
radar stratigraphical interpretation and that an atlas of the radar facies from different
depositional environments should be prepared.
Keywords: ground penetrating radar, radar stratigraphy, sedimentology, glaciations,
depositional environment, East Anglia, White Sea, England, Finland, Russia.
7
ACKNOWLEDGEMENTS
I would like to express my sincere gratitude to my supervisors, Professor Juha Pekka
Lunkka, from the University of Oulu and Professor Philip L. Gibbard, from the University
of Cambridge, for introducing me to sedimentology and radar stratigraphy. I would like to
thank them for their advice, guidance and support during this project. I would also like to
thank Professor Matti Räsänen and Professor Nick Eyles who reviewed this thesis.
I owe my gratitude for the staff of the Department of Geology, University of Oulu and
especially for M.Sc. Tiina Eskola for assisting in the data collection, M.Sc. Keijo Nuutinen
for introducing me to the ground penetrating radar technique and assisting in the data
collection, and Mrs. Kristiina Karjalainen for help with drafting of the figures. The whole
Palaeoecology Group and M.Sc. Anna-Riikka Pehkonen-Ollila, M.Sc. Helena Vikstedt and
B.Sc. Brita Telenvuo are thanked for interesting ‘on and off topic’ conversations during
the coffee breaks. I would also like to thank Professor Veli-Pekka Salonen from the
University of Helsinki, Finland and M.Sc. Niko Putkinen from the Geological Survey of
Finland.
My gratitude goes also to the staff and students of the Quaternary Palaeoenvironments
Group in the Department of Geography, University of Cambridge, England for
conversations, company and helping me during my stay in Cambridge, especially B.Sc.
M.Phil. Oliver Bazely, BA M.Phil. Karolina Leszczynska, M.Sc M.Phil Deepti Bisht, PhD
Maria Papanikolaou, B.Sc. PhD Steve Boreham, B.Sc. Chris Rolfe and Professor Emeritus
Richard G. West. From Cambridge I would also like to thank Mrs. Ann Jennings, MA PhD
Laurie Friday and MA PhD Adrian Friday for taking care of me during my stay. Keep up
the good work with the rabbits!
I would like to thank my friends and family for taking my mind off the thesis when most
needed, and my father for initially pushing me to pursue an academic career. Most of all, I
would like to thank my wife, Hanna Mari, for the enormous support she has given me
during this thesis and before it.

8
This study was financed by the research grants obtained from the Academy of Finland,
project numbers 210909 and 119124, the Finnish Academy for Science and Letters/Yrjö,
Vilho and Kalle Väisälä Foundation, the Thule Institute PACE-project, Walter och Lisi
Wahls stiftelse för naturvetenskaplig forskning, the Emil Aaltonen Foundation, the Oulu
University Scholarship Foundation and the Finnish Graduate School in Geology. I am
grateful for all the financiers.

9
ABBREVIATIONS
2D Two-dimensional
3D Three-dimensional
CDP Common depth point
CMP Common mid point
GPR Ground Penetrating Radar
GPS Global Positioning System
Hz, MHz Hertz, megahertz
LGM Last Glacial Maximum
OSL Optically Stimulated Luminescence
SIS Scandinavian Ice Sheet
TWT Two-way travel time
ε, εr Dielectric permittivity, relative dielectric permittivity
μ, μr Magnetic permittivity, relative magnetic permittivity
σ Electric conductivity

10
LIST OF ORIGINAL PAPERS
This thesis is based on the following five papers, referred to as Papers I, II, III, IV and V.
I. Gibbard, P. L., West, R. G., Pasanen, A. H., Wymer, J. J., Boreham, S., Cohen,
K. M. & Rolfe, C., 2008. Pleistocene geology of the Palaeolithic sequence at
Redhill, Thetford, Norfolk, England. Proceeding of the Geologists’
Association, 199(2), 175-192.
II. Pasanen, A. & Lunkka, J. P., 2008. Glaciotectonic deformation of till-covered
glaciofluvial deposits in Oulu region, Finland. Bulletin of the Geological
Society of Finland, 80, 89-103.
III. Gibbard, P. L., Pasanen, A., West, R. G., Lunkka, J. P., Boreham, S., Cohen, K.
M. & Rolfe, C. 2009. Late Middle Pleistocene glaciation in Eastern England.
Boreas 10.1111/j.1502-3885.2009.00087.x. ISSN 0300-9483. (in press)
IV. Pasanen A. 2009. Radar stratigraphy of the glaciotectonically deformed
deposits in Isoniemi area, Haukipudas, Finland. Bulletin of the Geological
Society of Finland, 81, 37–49.
V. Pasanen A., Lunkka J. P., Putkinen N. Reconstruction of the White Sea Basin
during the late Younger Dryas. Manuscript. (in review)

11
CONTRIBUTIONS
The following table indicates the major contributions of the authors of the original articles.
Paper I II III IV V
Planning PG,RW AP, JPL PG,RW,AP AP AP,JPL
Data collection PG,RW, AP AP PG,RW,AP AP AP,JPL,NP
Data analysis PG,RW, AP,SB AP PG,RW,AP,SB AP AP,JPL
Interpretation of results PG,RW, AP AP, JPL PG,RW,AP,SB AP AP,JPL
Manuscript preparations PG,RW, AP AP, JPL PG,RW,AP,SB AP AP,JPL,NP
Table 1. Contributions. AP= Antti Pasanen, JPL= Juha Pekka Lunkka, PG= Philip L.
Gibbard, RW= Richard G. West, SB= Steve Boreham, NP=Niko Putkinen
All the material in this study was collected by the authors unless otherwise stated in the
original papers. AP was in charge of the ground penetrating radar (GPR) in Papers I, III,
IV and V. SB conducted the clast lithological analyses in Papers I and III. The
preparations and part of the sedimentological analyses for Papers I and III were started
before AP started his PhD project but AP carried out the field studies performed in 2007,
and took part in writing together with PG and RW. Paper II was written by AP with
comments from JPL, Paper IV was written by AP and Paper V by AP and JPL.

12
CONTENTS
ABSTRACT
ACKNOWLEDGEMENTS
ABBREVIATIONS
LIST OF ORIGINAL PAPERS
CONTRIBUTIONS
CONTENTS
1 Introduction 13
1.1 Earlier studies ....................................................................... 14
1.1.1 Fluvial depositional environment................................ 14
1.1.2 Deltaic depositional environment................................ 16
1.1.3 Glaciofluvial depositional environment ...................... 16
1.1.4 Glacial depositional environment................................ 17
1.2 The aim of the thesis and contents ....................................... 19
2 Study areas 20
3 Methods 23
3.1 Geomorphology.................................................................... 24
3.2 Sedimentology ...................................................................... 24
3.3 Ground penetrating radar...................................................... 25
3.3.1 Operational principle ................................................... 25
3.3.2 Radar stratigraphy ....................................................... 26
3.3.3 Equipment, data collection and post-processing......... 28
4 Review of the original papers 29
5 Discussion 34
6 Conclusions 39
REFERENCES
ORIGINAL PAPERS

13
1 Introduction
The internal structures of sediments (bed assemblages, contacts between units, three-
dimensional form of the units and lateral variability) are the most important indicators of
the depositional environment. By studying them, different depositional environments can
be separated, even within a single sedimentological formation. Traditionally internal
structures have been studied with section and borehole logging using lithofacies analysis
(Miall, 1977; Eyles et al., 1983) for example. The sections and land cuttings are hardly
ever laterally continuous or their direction does not conform to the alignment of geological
formations. This demonstrates one of the fundamental problems with the traditional
method of geological investigation; the data obtained usually provide point-form vertical
profiles which must be correlated with other profiles. The correlation can be difficult or
impossible, especially in areas with high lateral diversity of the sedimentary facies.
Therefore, a continuous profiling method is needed. Geophysical methods can assist in
correlation between sections and boreholes but they can be also used separately for the
interpretation of the depositional environment and relative stratigraphical position. High-
resolution reflection seismics offer sufficient vertical resolution for the recognition of the
macro-scale sedimentary structures. From the 1980’s onwards, ground penetrating radar
(GPR) has been used as a high-resolution geophysical profiling technique for application
to electrically low conductivity subsurfaces [cf. Daniels et al. (1988) for a review of the
early history of GPR]. The conductivity of unsaturated, coarse-grained sediments (sands
and gravels) is usually low (<1 mS/m; Jol, 1995) which allows good penetration depth for
the GPR method. GPR has proven to be more effective in the first few tens of metres
compared to high-resolution reflection seismics. In land-based studies, GPR offers higher
vertical resolution (in decimetres for a 100 MHz antenna; Jol, 1995) and faster data
collection speed (several line kilometres per day) compared to land-based high-resolution
reflection seismics (McCann et al., 1988; Roberts et al., 1992; Cardimona et al., 1998).
Unsaturated, coarse-grained sediments are effective attenuators of the high frequency
(>100 Hz) acoustic pulses (Roberts et al., 1992). The received wavelength can exceed 15
m giving a vertical resolution of several metres in these sediments (Roberts et al., 1992).
Also in shallow seismic studies the first metres or tens of metres may be unresolvable.
High-resolution reflection seismics have proved its usability in off-shore investigations

14
and on-land in studies where deep penetration depths are needed. McCann et al. (1988),
Cardimona et al. (1998), Baker et al. (2001) and Nitsche et al. (2004) have compared the
land-based reflection seismics and GPR in engineering and geological applications.
In the late 1970’s, seismic stratigraphy was developed to aid hydrocarbon investigations
(Mitchum et al., 1977; Roksandic, 1978; Sangree & Widmier, 1979). Because the
propagation and reflection of the electromagnetic wave is analogous to the acoustic wave,
Beres & Haeni (1991), Baker (1991) and Jol & Smith (1991) suggested that the principles
of the seismic stratigraphy could be used in the interpretation of the GPR data.
1.1 Earlier studies
Seismic stratigraphy has been tested on worldwide datasets, whereas for GPR such
datasets have not been available. Nevertheless, a substantial number of publications in the
application of GPR from different depositional environments have been published since
the early 1990’s providing a good basis for today’s interpretations. Gawthorpe et al. (1993)
fully defined the concept of radar stratigraphy and its relationship to seismic stratigraphy.
The earlier studies mentioned above and some studies after Gawthorpe et al. (1993)
publication e.g. Beres et al. (1995; 1999) and Smith & Jol (1997), have used radar facies
approach to differentiate between sedimentological units from GPR data. In the radar
facies approach the radar surfaces and radar packages are not defined.
Van Overmeeren (1998) gathered radar facies of the unconsolidated sediments in the
Netherlands. His work consists of examples of push-moraines, glaciofluvial,
glaciolacustrine, aeolian, fluvial, lacustrine, marine and coastal depositional environments
for hydrogeological applications. In addition to the examples of the studies mentioned
below, many studies in other depositional environments, including particularly coastal and
aeolian settings, have been performed in recent years. Neal (2004) compiled a more
complete list of such studies, where GPR have been used in sedimentological applications.
1.1.1 Fluvial depositional environment
Fluvial deposits are important groundwater reservoirs in many places in densely populated
areas, such as central Europe. It is important to understand the internal structure and

15
heterogeneities of these sediments in order to prevent the pollution of the groundwater
reservoirs, for example. The fluvial depositional environment has been studied using GPR
by Gawthorpe et al. (1993), Roberts et al. (1997), Bridge et al. (1998), Vandenberghe &
van Overmeeren (1999) and Best et al. (2003), among others. As mentioned above,
Gawthorpe et al. (1993) were the first to exploit the full potential of radar stratigraphy.
They used 2D GPR profiles to study a modern point bar on the Madison River in Montana,
USA. Gawthorpe et al. (1993) noticed that the radar sequence boundaries represent
erosional episodes whereas radar sequences and radar facies represent accretion of point
bars. With the advent of sequence stratigraphy, the term ‘sequence’ is no longer used in
radar stratigraphy, instead radar sequences are called ‘radar packages’ and radar sequence
boundaries ‘radar surfaces’ (Neal et al., 2002; Neal, 2004). Roberts et al. (1997) used the
radar facies approach to study structures of an avulsed channel in the River Rhône, Aoste,
France. They used a grid of GPR transects to obtain a pseudo-3D image of the subsurface.
They noticed that in the profile along the channel the reflections are continuous with low
angle dips. They also noticed packages of dipping reflections which they thought were
produced by the downstream growth of gravel bars. The cross-valley profiles showed
continuous dipping reflections. They concluded that the radar facies assemblage represents
complete or partial channel fill of the avulsed channels. Bridge et al. (1998) noticed the
similar low-angle dips in the downstream direction in their study of the large-scale
structures of the deposit on Calamus River in Nebraska, USA. They also noticed that in
cross-channel profiles over braid and point bars the reflections were parallel to the bar
surfaces or they are slightly dipping towards the cut banks. They also constructed a revised
facies model for sandy, braided river from their results. Vandenberghe & van Overmeeren
(1999) gathered a GPR dataset from former Maas-Rhine confluence area in the
Netherlands. They showed distinct radar facies for meandering, braided and transitional
river types and confirmed the facies with section and borehole logging. They also notified
the difference in the radar facies in the floodplains of the different river types. Best et al.
(2003) represented a facies model for modern, growing, mid-channel sand braid bar
obtained from 3D GPR, vibracores and trenching from Jamuna River in Bangladesh. The
data were combined with the bathymetric surveys.

16
1.1.2 Deltaic depositional environment
The deltaic depositional environment was one of the first in which the radar facies and
radar stratigraphical approach was applied. The studies from this environment were
performed by Jol & Smith (1991), Smith & Jol (1992; 1997), and Asprion & Aigner
(1999), among others. Jol & Smith (1991) studied six different types of river deltas in
Canada. They noticed that GPR provides a ‘big picture’ of the subsurface for the
sedimentologists and geomorphologists in areas where section and borehole logs are not
available. Their study provided the framework for GPR investigations in deltaic
environment and for radar facies analysis. Later Smith & Jol (1992) studied the Lake
Bonneville delta in Brigham City, Utah, USA. Here they noticed the striking similarity of
the inclined strata in the exposures and GPR profiles, and interpreted both to represent
foreset beds. Smith & Jol (1997) subsequently noticed a similarly inclined reflection
pattern from Peyto Lake delta in Canada. They also described a radar facies representing
braided river topset facies and bottomset facies. The radar facies assemblage was
interpreted to represent a Gilbert-type delta. Asprion & Aigner (1999) combined 3D GPR
survey and outcrop information to characterise heterogeneities in a glaciofluvial delta in
Singen Basin, Southwest Germany. They also showed that the spatial distribution of the
heterogeneities in aquifers can be reconstructed using 3D GPR.
1.1.3 Glaciofluvial depositional environment
Glaciofluvial sediments underlie vast areas in recently glaciated terrains, such as in
Finland. They are important groundwater reservoirs and therefore, it is important to
understand their internal structure and depositional environment. Glaciofluvial
depositional environments have been studied using GPR by Sutinen (1992), Olsen &
Andreasen (1995), Beres et al. (1995; 1999), Mäkinen & Räsänen (2003) and others.
Sutinen (1992) used GPR to determine meltwater palaeoflow patterns in eskers and end
moraines in Northern Finland for his PhD thesis. Olsen & Andreasen (1995) studied the
Kronhede sandur in Jylland, Denmark using a grid of GPR transects and sediment logging
to characterise the sediments and the 3D geometry of the jökulhlaup deposit forming the
top part of the sandur. Their interpretation of the GPR data was achieved using the radar
facies approach. Beres et al. (1995) showed that 3D GPR studies can be used both cost-

17
and time effectively to study the geometries and facies of sedimentary units. They studied
proglacial braided-river gravels and sands in Switzerland, and noticed that 3D data
provides more detail and more reliable information on the heterogenities of the subsurface
compared to 2D GPR data. They defined the palaeocurrent directions, the boundaries
between different sedimentary facies and the level of the ground-water table. Beres et al.
(1999) studied the same area again using 2D GPR. They correlated 2D and 3D GPR data
with their section logging and noticed that the time slices of the 3D GPR amplitude blocks
shows structural trends not visible in 2D GPR and section logging. Mäkinen & Räsänen
(2003) studied the fan-like Virttaankangas enlargement of the Säkylänharju glaciofluvial
ridge in Southwest Finland. They used a combination of section logging, drilling, GPR,
seismic and gravimetric methods to describe the stratigraphy, morphology and
depositional history of Virttaankangas. As a result they were able to show that
Virttaankangas formed as a spit-platform and superimposed nearshore sediments deposited
during the glacio-isostatically-driven forced regression of the Baltic Sea Yoldia and
Ancylus stages.
1.1.4 Glacial depositional environment
Glacial depositional environments consist of deposits directly deposited by a glacier, i.e.
tills. The identification of the radar facies representing till can be difficult because it
usually includes fine-grained sediments, which causes the attenuation of the
electromagnetic wave. Therefore, in this study the glacial depositional environment takes
also into account the secondary structures in sediments caused by glaciotectonic
deformation (subglacial and proglacial). Glaciotectonised deposits can give additional
information of the depositional environment and glacier behaviour in recently glaciated
terrains. Glacial depositional environments have been studied using GPR by Sutinen
(1992), Lønne & Lauritsen (1996), Van Overmeeren 1997, Overgaard & Jakobsen 2001,
Jakobsen & Overgaard (2002) and Bakker (2004), among others. Sutinen (1992) used GPR
to study internal structures of morainic landforms, drumlins and Rogen moraines, in
addition to glaciofluvial formations mentioned above. From the results he identified three
Weichselian ice advances in Northern Finland. Lønne & Lauritsen (1996) studied the
geomorphology and internal structure of a modern push-moraine in Svalbard in
Spitsbergen using GPR and section logging. They noticed reflections from primary

18
bedding, buried ice blocks and thrust faults. In their study the present-day morphology of
the push-moraine was controlled by: 1) zones of thrust faults and 2) the position of ice
blocks. Van Overmeeren (1997) used GPR to image abrupt ‘steps’ in the groundwater
level in push-moraines close to the village of Epe in the Netherlands. With borehole
logging he confirmed that the ‘steps’ are caused by inclined clay strata which acted as
sliding planes during the glaciotectonic deformation. Overgaard & Jakobsen (2001) and
Jakobsen & Overgaard (2002) studied the ice-pushed ridge in northwest Zealand, Denmark
using the radar facies approach on closely spaced GPR transects. They correlated their
radar facies with the section logging, geological maps and borehole data. The facies they
identified include a glaciotectonised glaciofluvial facies, a penecontemporanously
deposited facies and a post-deformational facies. The structures interpreted from their GPR
data include thrust planes, major folds and minor faults. They concluded that the
deformation style is a thin-skinned proglacial thrust complex and constructed a structural
geological map from the radar facies. In a later study from the same area (Jakobsen &
Overgaard, 2002) they also concluded that the thrust complex suffered a shortening of 4%
and that the original morphology of the complex is controlled by thrusting and folding of
earlier glaciofluvial sediments, similar to the observation of Lønne & Lauritsen (1996).
However, they noted that the modern morphology is smoothed penecontemporaneously to
the deformation and by post-deformational sedimentation. Bakker (2004) studied the
internal structure of a push-moraine in the Veluwe area of the Netherlands in his
unpublished PhD thesis. The methods used in his thesis comprise GPR, borehole logging,
cone-penetration tests, high-resolution reflection seismics and gamma logs. He
differentiated three different glaciotectonic styles with GPR. The distribution of these
glaciotectonic styles coincides with the geomorphological units. The glaciotectonic styles
consisted of: 1) imbricated thrusts, 2) imbricated thrusts and folds and 3) large-scale folds.
He concluded that the Veluwe push-moraine was caused by a single major push event,
which is expressed by distinct zonal distribution of glaciotectonic styles. He also
concluded that the current geomorphology of the push-moraine is a direct reflection of the
internal architecture and glaciotectonic mechanisms.
19
1.2 The aim of the thesis and contents
The aim of this thesis is to study the internal structures of the clastic, coarse-grained
deposits using radar facies analysis, radar stratigraphy and traditional sedimentological
methods, including section and borehole logging with the main emphasis on the GPR
method's radar stratigraphical interpretation. The internal structure, and the depositional
environments derived from the internal structure, in the study sites in Finland, England and
Northwest Russia and their implications are discussed. The implications include the
reconstructions of the glacial limit and palaeoelevation, for example. Despite of the fact
that, in places deeper penetration depths, provided by reflection seismics, would be needed
because of the large thickness of the deposits, 2D GPR was chosen as the only geophysical
method used in this thesis because of its better vertical resolution and faster data
collection.
Papers I and III represent the East Anglia, England contribution to this study. Paper I
concentrates on the study of a fluvial sequence at Redhill, Thetford, Norfolk using section
and borehole logging, GPR and biostratigraphy. The study was undertaken to determine
the depositional environment and to date the sediments. In Paper III coarse-grained
sediments overlying Chalk bedrock hills on the eastern margin of the Fenland were studied
using section logging, borehole records and GPR to determine the depositional
environment and the position and nature of the glacial limit.
Papers II and IV concentrates on the glaciotectonised deposits in the Oulu region, Finland.
In Paper II deposits were studied using conventional sedimentological techniques
including clast-fabric and structural measurements in Isoniemi, Haukipudas and
Hangaskangas, Oulu to gain information on the glaciotectonic shear-stress directions and
to shed light on the deposition of the sediments. In Paper IV the Isoniemi area was studied
using 2D GPR. The radar stratigraphy of the area was determined and the depositional
environments were interpreted and correlated with the sedimentological study in Paper II.
Paper V concentrates on the proglacial deltas in Russian Karelia, Northwest Russia. The
glaciofluvial plains earlier interpreted as delta planes in Kalevala end moraine were
studied using geomorphological and GPR methods. From the results the extent of the
White Sea Basin during the late Younger Dryas Stadial was reconstructed.

20
2 Study areas
Three areas in England, Finland and Russia (Fig. 1), consisting mainly of fluvial, glacial,
glaciofluvial, glaciodeltaic and littoral depositional environments, have been studied in this
thesis. The study area in Papers I and III was East Anglia in England. In Paper I, Redhill
site (52°25’28N 0°43’18E) in Thetford, Norfolk was investigated (Fig. 2). The study area
consisted of fluvial terraces and a modern river floodplain incised into the Chalk bedrock
(Upper Cretaceous). In Paper III nine sites in Cambridgeshire, Suffolk and Norfolk were
studied during 2007 (Fig. 2). The sites were geomorphologically interpreted to represent
proglacial deltas or fan deltas on top or on the distal side of the Chalk bedrock hills. The
interpretation was confirmed with GPR survey in five sites. In two of the sites
geomorphological interpretation suggested that the steep proximal slope represented ice-
contact slopes.
Fig. 1. Map of northern Europe and the study areas mentioned in the text. The shaded
boxes show the areas covered in Figs 2-4.

21
Papers II and IV represent the studies in the Oulu region (Fig. 3). In Paper II the till-
covered, glaciotectonised, glaciofluvial sequences in Isoniemi, Haukipudas (65°09’N
25°15’E) and Hangaskangas, Oulu (63°37’N 43°13’E) were investigated. The Isoniemi
area represents the northern part of the 25 km2 broad glaciofluvial Isoniemi-Virpiniemi
complex. Also in the Isoniemi area the steep slope dipping towards the west at the Runteli
Ridge was interpreted geomorphologically to represent an ice-contact slope. The
Hangaskangas area is situated 20 km south-east of the Isoniemi area. Here the formation
occupies approximately 9 km2 and on its’ flanks littoral deposits, formed in the Litorina
Stage of the Baltic Basin, occur (Helle & Ylinen, 1965; Eronen et al., 1995). The bedrock
below the sediments in the Isoniemi and Hangaskangas areas consists of sedimentary
siltstone, called the Muhos Formation (Korsman et al., 1997). In addition, the northern part
of the Isoniemi site occurs on the mica-schists of the Palaeoproterozoic Kiiminki Schist-
belt. The bedrock contact between the Muhos Formation and Palaeoproterozoic granites is
close to the Hangaskangas site.
Fig. 2. Study sites in East Anglia,
England. In Paper I the
study site was Redhill. The
other sites are situated on
the eastern margin of the
Fenland and are discussed
in Paper III. The major
cities are marked with
squares and the rivers with
italic font.
22
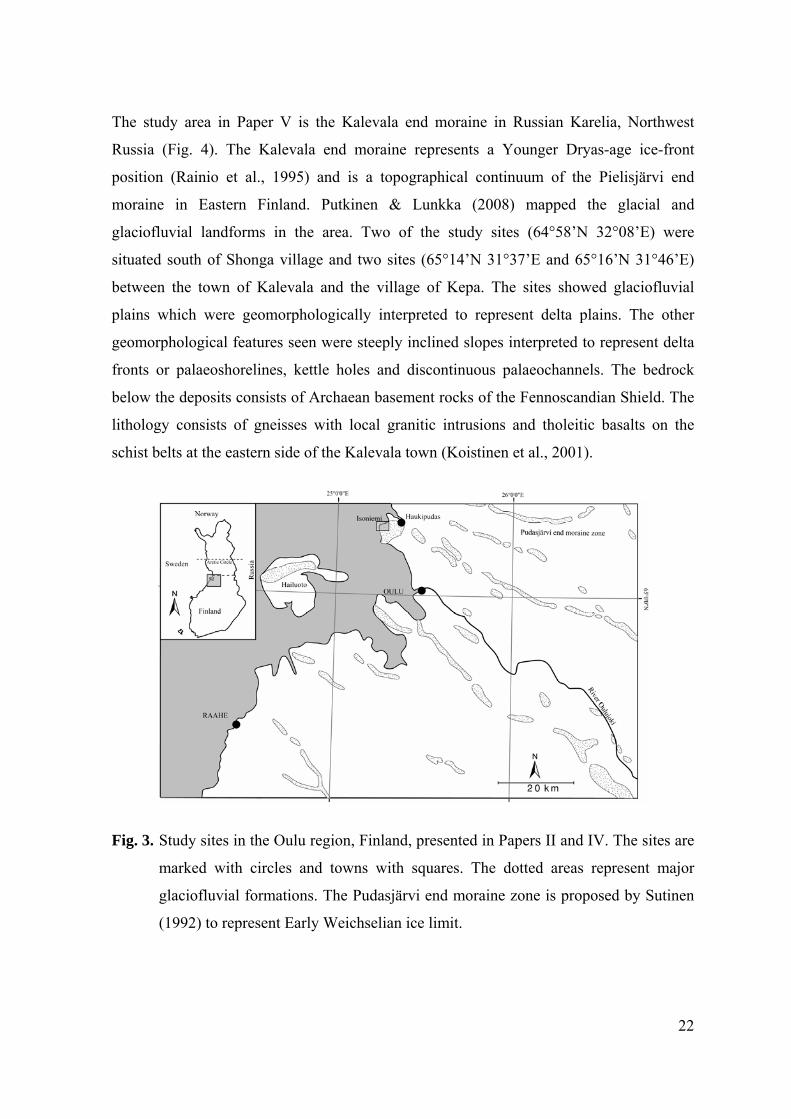
The study area in Paper V is the Kalevala end moraine in Russian Karelia, Northwest
Russia (Fig. 4). The Kalevala end moraine represents a Younger Dryas-age ice-front
position (Rainio et al., 1995) and is a topographical continuum of the Pielisjärvi end
moraine in Eastern Finland. Putkinen & Lunkka (2008) mapped the glacial and
glaciofluvial landforms in the area. Two of the study sites (64°58’N 32°08’E) were
situated south of Shonga village and two sites (65°14’N 31°37’E and 65°16’N 31°46’E)
between the town of Kalevala and the village of Kepa. The sites showed glaciofluvial
plains which were geomorphologically interpreted to represent delta plains. The other
geomorphological features seen were steeply inclined slopes interpreted to represent delta
fronts or palaeoshorelines, kettle holes and discontinuous palaeochannels. The bedrock
below the deposits consists of Archaean basement rocks of the Fennoscandian Shield. The
lithology consists of gneisses with local granitic intrusions and tholeitic basalts on the
schist belts at the eastern side of the Kalevala town (Koistinen et al., 2001).
Fig. 3. Study sites in the Oulu region, Finland, presented in Papers II and IV. The sites are
marked with circles and towns with squares. The dotted areas represent major
glaciofluvial formations. The Pudasjärvi end moraine zone is proposed by Sutinen
(1992) to represent Early Weichselian ice limit.

23
Fig. 4. Lake Mikkolanjärvi, Lake Päiväjärvi and Shonga study sites and additional control
sites used in the reconstruction of the White Sea Basin during the late Younger
Dryas (Fig. 7) in Russian Karelia, Northwest Russia. The black lines in inset map
show major end moraines interpreted to represent Younger Dryas age.
3 Methods
The main methods used in this study comprise geomorphology, sedimentology and GPR.
Geomorphology was used mainly as a preliminary surveying method but it also provided
many important observations for the interpretation of the depositional environment and
deformational style at individual localities. Sedimentological and GPR methods were used
to study the internal structure of the sediments and to verify the geomorphological
interpretations. These methods were chosen because of the nature of the studied sediments.
Clastic, coarse-grained sediments are exploited for civil engineering purposes, such as
building, and therefore, sections are readily available in many places in these deposits for
sedimentological studies. Moreover, these deposits provide a good penetration depth for

24
the GPR method. Other methods used in this thesis are borehole logging (Papers I, III and
IV), clast lithological analysis (Papers I and III) and palaeotopographical reconstruction
(Paper V). The main survey methods are discussed briefly below. Discussion of the other
methods can be found in original papers.
3.1 Geomorphology
Geomorphological methods were used as a preliminary survey method in all the original
papers presented here. They also provided valuable information concerning the ice-front
position in Papers III and IV. Geomorphology is based on the recognition of the external
form and topography of the landforms. The geomorphological interpretation was done
using satellite imagery, map interpretation and field surveys. During the field surveys the
grain size of the sediments close to the modern ground surface was determined visually to
aid the geomorphological interpretation.
3.2 Sedimentology
Sedimentology was the main method adopted in Paper II. In other papers the method was
used in conjunction with the GPR technique, except in Paper IV where results of
sedimentological study from Paper II were used to correlate with the GPR results. In this
method, the structure, texture, thickness, lower contact and lateral continuity of the
sedimentary units are determined. By determining these elements in each unit a vertical
profile could be drawn and the facies and depositional setting interpreted. The texture,
structure and lower contact of the units were described using the lithofacies codes and
contact descriptions modified after Miall (1977; 1985), Eyles et al. (1983) and Eyles &
Miall (1984). In addition, deformational structures were measured and clast-fabric analysis
was performed in Paper II. The structural studies consisted of the measurement of the
direction and angle of the dip on fold axis, fold planes and fault planes of the thrust faults.
Also the folding types were defined. Clast-fabric analysis consisted of measuring the dip
angles and directions of 40-50 clasts in diamicton with the axis ratio c. 2:1. The
significance of the clast-fabric analysis results were studied using Eigenvalue 1/Eigenvalue
3 method described by Woodcock & Naylor (1983).

25
3.3 Ground penetrating radar
3.3.1 Operational principle
GPR provides a high resolution, electromagnetic technique for the study of the shallow
subsurface. Because of its non-intrusive nature, it can be used in delicate areas, such as
nature reserves, and in places where the use of intrusive methods is not allowed or
possible.
In reflection profiling, common offset antenna configuration is the most commonly used in
sedimentological and engineering applications. In common offset studies the transmitter
and receiver antennae separation remains the same and the transmitter-receiver pair is
towed, in the continuous method, or moved in predefined steps, in the step method, along
the survey line. Common mid-point (CMP) or common depth-point (CDP) studies, where
the transmitter and receiver are moved away from the common central point, can be used
to estimate the electromagnetic wave velocity of the first subsurface layer. Many modern
shielded antennae are encased in a single casing making this type of survey impossible.
Other instrument configurations consist of a common source, common receiver, wide-
angle reflection and refraction and tomographic configurations. As a consequence of the
instrument limitations and ease of data post-processing and interpretation, only the
common offset configuration was used in this thesis.
In GPR reflection profiling in sediments a pulse of high frequency (usually 25-1000 MHz)
electromagnetic energy is transmitted to the subsurface. Part of the pulse is reflected from
the electrical boundaries while part of it travels through the boundary and reflects from the
boundaries at a lower elevation or attenuates or scatters. The amplitude and the two-way
travel time (TWT) in nanoseconds are recorded at the receiver antenna. The obtained data
are shown at the data logger in a diagram where the vertical axis represents TWT and the
horizontal axis survey time or distance depending on the equipment used.
The properties of the material controlling the behaviour of the electromagnetic wave in a
medium are dielectric permittivity (ε), electrical conductivity (σ) and magnetic
permeability (μ). At the discontinuities of εr (relative dielectric permittivity), μr (relative
magnetic permittivity) and σ in the subsurface, some of the energy is reflected back to the
26
surface. The higher the contrast below and above the discontinuity, the higher the
reflection amplitude recorded. Van Dam & Schlager (2000) and van Dam et al. (2002 a; b)
noticed that abrupt changes in εr are the main reason for the reflections in GPR surveys.
The value of the εr for dry, coarse-grained sediments is between 2.5 and 7.5, whereas for
fresh water it is 80 (Neal, 2004). Therefore, the reflections are caused where the
sediment’s porosity and ability to hold water changes. Van Dam & Schlager (2000) and
van Dam et al. (2002 a; b) also noticed that that goethite iron oxide precipitates and
organic material caused reflections in GPR images. The reflections were caused by the
higher water retention capacity of goethite and organic material compared to that of the
surrounding sediment. Van Dam & Schlager (2000) and van Dam et al. (2002 a; b) noticed
that μr and σ were not significantly altered and therefore, μr and σ were not responsible for
the reflections. The sharpness of the reflection received is a function of εr transition zone
width compared to the wavelength of the survey. The wavelength must be approximately
three times the transition zone width to get a sharp reflection (Neal, 2004). In coarse-
grained sediments εr governs the velocity of the electromagnetic wave. The influence of μr
and σ can be assumed to be minimal.
The velocity estimation for the subsurface can be done using e.g. CMP survey, radar
tomography, drilling, hyperbolae fitting and published tables for sediments (e.g. Davis &
Annan, 1989; Hänninen, 1991; Gawthorpe et al, 1993; Neal, 2004). The full physical basis
for the GPR method and for the propagation, attenuation and reflection of the
electromagnetic wave is given, for example, by Annan & Davis (1976), Davis & Annan
(1986) Daniels et al. (1988) and Neal (2004).
3.3.2 Radar stratigraphy
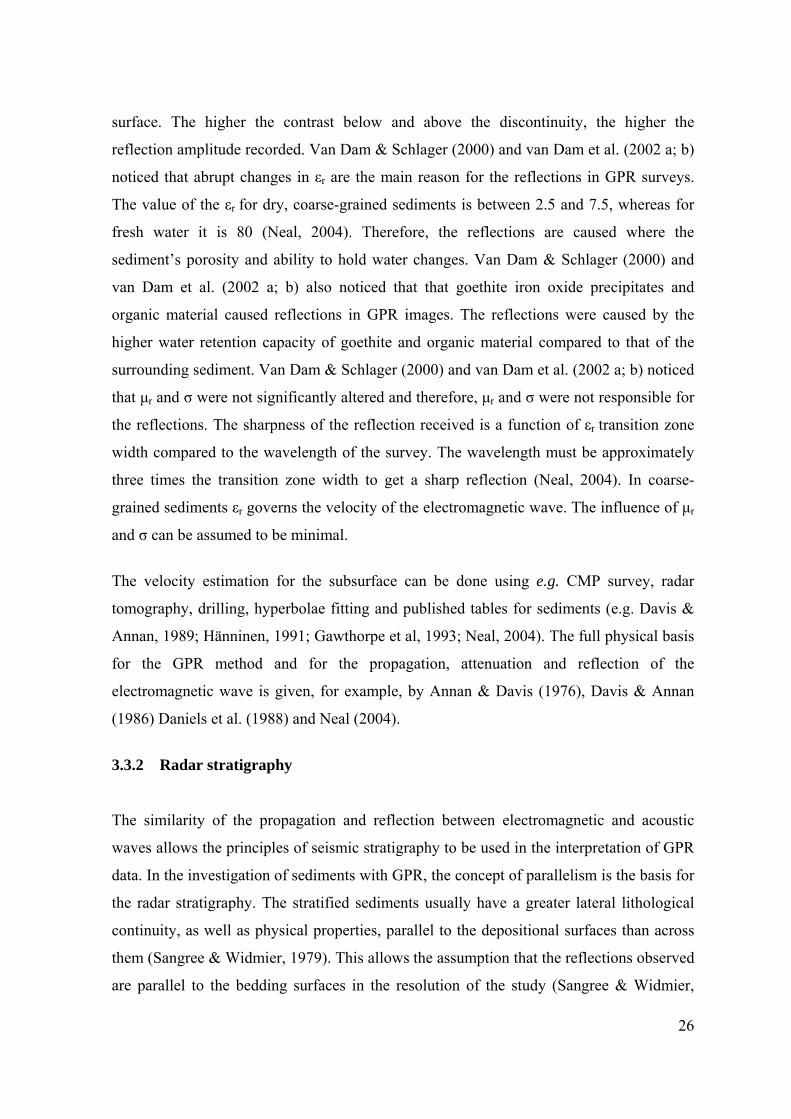
The similarity of the propagation and reflection between electromagnetic and acoustic
waves allows the principles of seismic stratigraphy to be used in the interpretation of GPR
data. In the investigation of sediments with GPR, the concept of parallelism is the basis for
the radar stratigraphy. The stratified sediments usually have a greater lateral lithological
continuity, as well as physical properties, parallel to the depositional surfaces than across
them (Sangree & Widmier, 1979). This allows the assumption that the reflections observed
are parallel to the bedding surfaces in the resolution of the study (Sangree & Widmier,
27
1979). There are also exceptions to this concept. In GPR surveys the most common
reflections which are not parallel to the bedding surfaces are caused by the ground-water
table, offset reflections, diffraction hyperbolae, reflection multiples and reflections from
secondary structures e.g. deformation structures. The development of the equipment and
shielding of the antenna has resulted in a decrease of these reflections especially from
overhead objects. Neal (2004) suggests that when performing a radar stratigraphy
interpretation, this type of reflections should be recognised and removed in post-
processing or ignored in the interpretation.
The terminology of the building blocks of radar stratigraphy is adopted after Neal et al.
(2002). The building blocks consist of radar surfaces, radar facies and radar packages.
Radar surfaces are defined as systematic reflection terminations and they represent non-
depositional or erosional hiatuses (Gawthorpe et al., 1993). The interpreter must take care
when defining radar surfaces because the reflection terminations may be caused by
apparent truncation of reflection or interference effects. Gawthorpe et al. (1993) defined
radar packages as fundamental stratigraphical units identified from GPR data, which are
genetically related packages of strata, defined by radar surfaces. They also defined radar
facies as representing changes in reflection characteristics within a radar package.
However, in this thesis the definition of radar packages and radar facies is adopted after
Neal et al. (2002) and Neal (2004). They defined radar packages as the three-dimensional
external geometry of the deposits. The radar facies was defined as ‘two- or three-
dimensional sets of reflections that lie between the radar surfaces’ (Neal et al., 2002).
The geological interpretation of the radar stratigraphy includes the interpretation of the
nature of the boundaries (radar surfaces), bed assemblages (radar facies) and geometry of
the deposits (radar packages) (Neal et al., 2002). The terminology for the definition of the
radar surfaces, radar facies and radar packages used in this thesis follows the terminology
gathered by Neal (2004). In this terminology the reflection geometry for the upper
boundary can represent erosional truncation, toplap or concordant reflection ending,
whereas for the lower boundary it can be onlap, downlap or concordant. The 3D external
geometry can be e.g. a sheet or a wedge. The radar facies are described by their shape, dip,
dip direction and continuity of the reflections. Also the relationship between reflections,
amplitude and wave velocity are essential for the description. By defining the radar

28
stratigraphy and using the description presented above the depositional processes and
environments, as well as, the relative stratigraphical position between units can be
interpreted.
3.3.3 Equipment, data collection and post-processing
The antenna centre frequency used in this thesis was 100 MHz. This frequency was
selected because of its good balance between the penetration depth and vertical resolution.
A 250 MHz centre frequency antenna was also tested on sites in Finland and Russia, but
because of the inadequate penetration depth, it was not used systematically. In addition,
because of the higher vertical resolution of the 250 MHz centre frequency antenna, the
amount of reflections and diffractions increased compared to those from the 100 MHz
centre frequency antenna making the post-processing and interpretation challenging. The
shielded antennae were manufactured by Malå Geoscience. The antennae were controlled
by the same manufacturers X3M controller unit and the data was logged with Panasonic
Toughbook CF-29 rugged laptop. The data collection was performed in a time trigger
mode because the equipment was not equipped with a measuring wheel. The antennae
were towed by hand and by a vehicle. The horizontal positioning was done using Garmin
e-trex, hand-held, global positioning system (GPS) device and markers to mark known
positions on the map. The vertical profile was recorded using the calibrated altimeter of
the GPS device and enhanced with elevation data obtained from the map contours, markers
of the highest and lowest positions and by adjusting interpreted horizontal reflectors such
as the groundwater table. In Paper I the vertical profile was obtained using levelling data.
Because of the relatively high survey speed, the stacking was low; usually two scans were
combined into one.
The raw data was post-processed in GeoDoctor 2.054 software manufactured by
Roadscanners Oy. The post-processing steps included: 1) data editing, 2) depth
conversion, 3) topography correction 4) adjustment of the time-zero level, 5) amplitude
zero-level correction, 6) automatic background removal, 7) vertical high- and low-pass
filtering, and 8) automatic or exponential gain control. Post-processing is essential for the
improvement of the data quality and interpretation. Neal (2004) has discussed the different

29
filters and post-processing steps used in sedimentological applications of the GPR in more
detail.
4 Review of the original papers
Paper I
Paper I presents results of a study on a late Middle Pleistocene (Palaeolithic) sequence at
Redhill, Thetford, Norfolk, England. The studies of post-Anglian-age fluvial sediments in
Eastern England (equivalent to the post-Elsterian-age in Central Europe) are important
because of their environmental significance but also because of the prolific artefactual
finds during the last two centuries. The old diggings on the banks of River Little Ouse
have been studied since the late 19th century by several workers. The site was then
forgotten but rediscovered in 2004 and the diggings were opened for section logging. In
addition to this, a transect of boreholes was put down adjacent to the diggings, GPR study
was performed in the area and the sediments were sampled for clast lithological analysis.
The section logging and borehole records, together with the historical descriptions,
suggested that the sediments were deposited by flowing water, most probably by a gravel-
bed stream of variable flow energy and abundant sediment supply above the Chalk
bedrock. The GPR survey showed seven radar facies which were interpreted to represent
bedding planes in the Chalk bedrock, a solution hollow filled with fluvial sediments, point
bars, mid-channel bars, fluvial channel fill, cross-cutting channel-floor scours and
colluvial deposits. The sediments overlying the Chalk bedrock were divided into three
depositional environments. The sediments on the higher terrace were interpreted to
represent deposition in a shallow, gravel-bed braided river facies. Downslope sediments
that occur between the higher and lower terraces, the deposition was interpreted to have
caused by the mass-movement of the sediments, probably in periglacial conditions. The
lower terrace was interpreted to represent deposition in modern river floodplain.
Palaeolithic artefacts, vertebrate remains and mollusc shells were found in the sediments
by earlier workers. The artefact and vertebrate assemblages show a striking similarity to
those of the Lynch Hill/Corbets Tey Member in the River Thames valley suggesting a late
Middle Pleistocene Wolstonian (Saalian) age. The Redhill terrace sediments are incised
into the Anglian Stage glacial deposits. The age determination is supported with the
30
similar artefact findings and optically stimulated luminescence dating (OSL) from the late
Saalian Stage deposits in the Netherlands. It was also concluded that the valley sides
provided a source of flint for the Palaeolithic humans.
Paper II
In Paper II glaciotectonised glaciofluvial deposits underlying till were studied at Isoniemi
and in the Hangaskangas areas in the Oulu region, Finland. The study of the glacial
sediments in the central area of the glaciation is important when trying to understand the
behaviour of the ice sheet. The stratigraphical investigations suggest that the Oulu region
was covered by the Scandinavian Ice Sheet (SIS) twice during the Weichselian Stage. It
has been hypothesised that the Isoniemi area represents a part of the Early Weichselian ice
limit. The deposits were studied using conventional sedimentological techniques including
clast-fabric and structural measurements. The sedimentary strata in the Isoniemi area
consisted of: 1) deformed sand and gravel facies, 2) diamicton facies 3) cobble gravel
facies and 4) sand and pebble gravel facies. The strata seen in the Hangaskangas area were
similar, except the cobble gravel facies was not observed. Facies 1 and 2 are the most
important for the study of the glaciotectonic and ice-movement history in the Oulu region.
The deformed sand and gravel facies was interpreted to represent glaciotectonically
deformed glaciofluvial, possibly fan-delta sediments. The diamicton facies was interpreted
to represent deformation till originated from reworked earlier sediment and glacially
transported sediment. The cobble gravel was interpreted to represent washed till during the
subsequent littoral phase. The sand and pebble gravel facies was interpreted to represent
littoral reworking of the earlier sediments. The glaciotectonic deformation consisted of
thrust faults and tight to isoclinal folds which are gently inclined or recumbent. In the
Isoniemi area, two shear-stress directions were observed (from northwest and southwest)
but the clear time relationship between the directions could not be determined. The main
direction was from the northwest and it was thought that this was the latest. The same
directions were also seen from the clast-fabric analyses from the till.
Similar shear-stress directions were observed in the Hangaskangas area. Here the
southwest-aligned shear-stress direction was observed cutting the sediment strata
suggesting that it was the latest direction.

31
It was hypothesised that the fan-delta sediments may represent pre-Late Weichselian
deposits whereas the glaciotectonic deformation occurred in the Late Weichselian. During
the deformation the deposits were saturated with water and the water depth exceeded 200
m. The glacio-isostatic uplift raised the area to the water level and littoral reworking
occurred.
Paper III
In Paper III coarse-grained sediments overlying the Chalk bedrock hills on the eastern
margin of the Fenland were studied using section logging, borehole records, clast lithology
and GPR. In Eastern England the deposits of the Middle Pleistocene Wolstonian (Saalian)
glaciation have been masked by the Late Pleistocene Devensian (Weichselian) glaciation
in places. The controversy on the number of glaciations observed from terrestrial
sequences in Eastern England is caused because the Wolstonian glacial deposits are
thought by some authors to represent a pre-Wolstonian age event. This paper presents the
evidence for the eastern limit of the glaciation at the eastern margin of the Fenland and
contemporaneous glaciation in Britain and mainland Europe during the Wolstonian Stage.
For the sedimentological studies and clast-fabric analysis old diggings, studied in late-19th
and mid-20th century, together with new sections were opened at four sites. In addition to
this borehole data was obtained from five sites. The simplified overall sequence observed
consisted of horizontally bedded sands, interpreted to represent bottomset facies of a delta,
overlain by tabular cross-bedded sands, and gravels interpreted as foreset facies of a delta,
both of these lying on the Upper Cretacious Chalk bedrock and clay. The alternative
interpretation of regressive shoreface deposition for the tabular cross-bedded sands can
also be considered. However, the facies association and upwards coarsening sequence
observed does not support this interpretation. The sedimentological study and the clast
lithological analysis showed a high abundance of Chalk clasts and diamicton balls, latter
interpreted to represent till. The occurrence of the fragile materials provides evidence to
confirm the short transport distance and glaciofluvial origin of the deltas. In the course of
the study new sites were found using geomorphological methods and the total number of
sites used in this study reached nine. GPR survey was performed in six sites. The results
confirmed the sedimentological interpretation, but also new radar facies, not seen in the
sedimentological study, were observed. The most important features for the determination

32
of the position of the ice margin and ice-sheet behaviour, which were not observed in the
section logging, were the channel facies continued to the delta core facies, and thrust faults
and folds in the Chalk bedrock. The channel facies was interpreted to have formed below
the ice-front, whereas the delta-core facies was interpreted to have formed outside it, most
probably simultaneously with the channel facies. The origin of the thrust faults and folds
were interpreted as being of glaciotectonic nature. A steep proximal slope at two of the
sites was interpreted geomorphologically to represent ice-contact slope. In one of the sites
thrusting and folding seen in the GPR survey supports this interpretation. The glaciodeltaic
sediments were then correlated with the Wolstonian Tottenhill glaciodeltaic sediments in
North Norfolk and with the sequences and artefacts from the Netherlands. The correlation
and two separate OSL dates giving ca. 160 ka from Tottenhill and Warren Hill (the latter
was earlier interpreted as pre-Anglian fluvial sequence) sites supported the Wolstonian
age. It was concluded that the ice-sheet advanced to the Fenland basin from the north
damming the westward-flowing rivers. The deltas were formed in front of the glacier in a
proglacial lake of which water level was dropping during the deposition. The current
position of the fan-deltas shows the Wolstonian ice-limit in the eastern Fenland. The lake
reached the maximum level of c. 32 m OD before draining.
Paper IV
Paper IV expands the sedimentological work of Paper II from the Isoniemi area which was
studied using 2D GPR transects. In the radar stratigraphy 10 radar facies and seven radar
surfaces bounding the radar facies were observed. In places the radar transects were
undertaken in two directions to obtain a pseudo-3-D view on the deposits. The radar facies
was correlated with the sedimentological records obtained in Paper II. The strata recorded
in Paper IV showed: 1) glaciotectonically deformed glaciofluvial sediments, 2) till, 3)
proglacial channel and channel fill, 4) rip current or proglacial channel and channel fill and
5) littoral reworking of the earlier sediments. In addition to this, separate radar reflections
were identified from the glaciotectonically deformed glaciofluvial sediments, which were
interpreted to represent glaciotectonic thrust faults. In places old borehole data, obtained
for groundwater and aggregate investigations, could be used to verify the interpretations. It
was hypothesised that the steep proximal slope of the Runteli ridge represents an ice-
contact slope and the genesis of the ridge owes its origin to ice-push. It was thought that
33
after the deposition of the glaciofluvial sediments the order of events was: 1) glacier
advance, deposition of till and the first deformation, 2) retreat of the glacier and cutting
and infilling of the proglacial channels, 3) further retreat of the glacier, possible readvance
or oscillation, formation of the Runteli Ridge and the proglacial deformation cutting the till
bed into patchy till and forming the thrust faults on the proximal side of the area, 4) cutting
and filling by rip currents and 5) littoral reworking. It can also be the case that the
sediments representing cutting and infilling of the channel (2) and cutting and filling by rip
currents (4) represent different stages of lower shoreface clinoforms. This interpretation is
justified according to the evidence presented but it does not explain the occurence of the
large channel forms in the GPR images.
Paper V
Paper V presents the first numerical reconstruction of the extent of the White Sea Basin
during the late Younger Dryas Stadial. The White Sea basin was covered by the
Weichselian Scandinavian Ice Sheet (SIS) during the last glacial maximum c. 17 000-
18 000 years ago. The eastern flank of the SIS retreated to the Kalevala end moraine
between c. 17 000-11 500 years ago. The ice retreat history is relatively well known but
the palaeoenvironmental setting, in front of the ice sheet and in White Sea Basin, is poorly
understood and partially controversial. The controversies include the extent and the nature
of the water body, its connection with the Barents Sea and Baltic Basin and the occurrence
of dead-ice masses in deep basins of the White Sea.
In order to shed light on the palaeoenvironmental setting and on these controversies four
sites at the Kalevala end moraine, earlier interpreted as glaciofluvial plains, were studied
using geomorphological, sedimentological and GPR methods. The geomorphological
study showed that the flat plains were incised by discontinuous meltwater channels. Also
dead-ice kettle holes and steep slopes from the edge of the flat plain were observed. The
shallow test pits showed fluvial facies interpreted as delta topset sedimentation. The GPR
survey showed inclined reflections interpreted as delta foreset sedimentation and the
deposits were interpreted to represent Gilbert-type glaciofluvial deltaic sediments in three
sites out of four. These deposits were overlain by littoral sediments in places. Together the
evidence suggests that the deltas grew to the contemporary water level. An alternative

34
interpretation of the inclined reflections representing lower shoreface deposits was also
considered. However, the occurrence of fluvial topset facies and littoral facies on top of
inclined reflections does not support this interpretation.
The elevations of the deltas in Kalevala end moraine, together with the shoreline elevation
at the mouth of the River Vyg, were used to define the shoreline gradient. The gradient,
0.42 metres / kilometre, were then used to reconstruct a relative rebound surface which
was added to the present topography of the White Sea Basin and adjacent onshore areas.
This was done in order to reconstruct the elevation of the area (relative to the present 123
metre level in the Kalevala end moraine) during the late Younger Dryas.
The reconstruction and the geological evidence suggested that saline water intruded into
White Sea Basin before the late Younger Dryas. However, it was thought that
glaciolacustrine environment occurred in front of the ice sheet at the west whereas saline
or brackish environment dominated at the north and east. It was concluded on the basis of
the reconstruction that the water body in the White Sea Basin during the late Younger
Dryas was more extensive than today inundating the present onshore areas on the western
side of the White Sea and in the Arkhanglesk area. It was also concluded that the water
body was connected to the Barents Sea through the Gorlo Strait and it was separated from
the Baltic Basin by the Maaselkä – Uikujärvi threshold. The geological observations do
not support the assumption that the huge dead-ice masses occupied the White Sea basin
during its deglaciation.
5 Discussion
The results presented in this thesis show that GPR has became one of the most useful
techniques in the study of the internal structures of clastic, coarse-grained sediments.
When using the GPR technique and radar stratigraphical interpretation in conjunction with
the well-established sedimentological and geomorphological techniques, knowledge of the
subsurface can be dramatically enhanced in comparison to using the latter two techniques
alone. Radar stratigraphical interpretation can also be used separately. The interpreter,
using this technique, must have knowledge of how the reflections obtained with GPR are

35
formed. In addition to this the sedimentological background must be strong for the
sedimentological and geological interpretation of the radar facies, radar surfaces and radar
packages.
The post-processing parameters used in GPR have been derived from reflection seismics.
In reflection seismics migration is used routinely. Neal (2004) suggests that the use of
migration should also be a routine step in the GPR post-processing. Although migration
has very good features, such as correction of the angle of the dipping surfaces and removal
of the diffraction hyperbolae, the use of migration can sometimes be problematic
especially when using time-trigger data collection mode and where no ground truthing is
available. Moreover, migration has a tendency to remove weak amplitude reflections and
leave only the high amplitude reflections. This can be favourable when performing radar
stratigraphy interpretation and the aim is to determine the relative stratigraphic position
between the radar facies. When interpreting the depositional environment, migration may
mask the radar facies reflection configuration making it impossible to determine the
depositional environment. Sometimes, even diffraction hyperbolae, usually caused by
outsized clasts, may help in determination of the depositional environment. Therefore, it is
suggested that the use of migration in GPR post-processing should always be tested to suit
the survey objectives and data collection.
In radar stratigraphy, the reflections caused by something other than the original
sedimentary surfaces should be removed in post-processing or ignored (Gawthorpe et al.,
1993, Neal, 2004). In Papers III and IV, the reflections caused by glaciotectonic thrusting
were identified. If the strict definition of parallelism were applied in these cases, the
thrusts should have been ignored. In glaciated terrains, glaciotectonic deformation can
provide invaluable information on the ice-sheet dynamics and therefore, cannot be
ignored. The terminology for such reflections has not been established. In Papers III and
IV the reflections are called ‘secondary elements’. Bakker (2004) used a term
‘glaciotectonic element (thrusts)’, whereas Lønne & Lauritsen (1996), Overgaard &
Jakobsen (2001) and Jakobsen & Overgaard (2002) merely used the terms ‘thrust faults’
and thrusts’. This kind of terminology may be confusing because it mixes description and
interpretation. Therefore, it is suggested that the term ‘secondary element’ or ‘secondary
radar element’ should be used in the description and they should be described using the

36
terminology adopted from Neal (2004). It is also suggested that the secondary elements
should be recognised and used as part of the facies analysis of the radar stratigraphical
interpretation in the sediments where secondary sedimentary or deformation structures
may give additional information of the development of the deposit.
Previous studies have shown that geomorphological units can be related to the radar
facies (e.g. Lønne & Lauritsen, 1996; Smith & Jol, 1997; Jakobsen & Overgaard, 2002;
Bakker, 2004). The geomorphological approach was used in Papers III, IV and V as a
preliminary surveying technique to assess the depositional environment. The steep
proximal slopes of the Chalk bedrock hills in East Anglia (Paper III) and of the
glaciofluvial sediments in Isoniemi (Paper IV) were interpreted to represent ice-contact
slopes. It was hypothesised that glaciotectonic deformation should have occurred in the
Chalk bedrock and glaciofluvial sediments below these slopes. In both cases, the radar
images indeed showed thrusting and folding, which were interpreted to support the
geomorphological interpretation (Fig. 5). In Paper V flat glaciofluvial plains on the
Kalevala end moraine were geomorphologically interpreted to represent the uppermost
surfaces of a delta. The geomorphological interpretation was based on the flat surfaces
Fig. 5. GPR image from the Isoniemi study site. Radar surface RS1 is marked with the
solid black line and it is interpreted to represent a wave-cut surface. Radar facies
RF1 is interpreted to represent glaciotectonised glaciofluvial deposit and RF2 is
interpreted as littoral reworking deposit. Secondary elements SE1 are marked with
dashed black lines and they are interpreted to represent glaciotectonic thrust fault
planes.

37
and inclined landforms interpreted to represent delta fronts. Discontinuous palaeochannels
were also identified indicating that the contemporary water level was close to the
glaciofluvial plains. This geomorphological interpretation could be confirmed in three sites
out of four using GPR, where the survey showed inclined reflections interpreted to
represent delta foreset bedding (Fig. 6). In addition to this, horizontal reflections at the top
of the radar image were interpreted to represent deltatopset bedding. After the GPR survey
it would have been easy to interpret all these flat glaciofluvial areas as representing deltaic
surfaces. However, at the fourth site dead-ice kettle holes were seen in the flat surface. The
geomorphological interpretation once again suggested the top of the delta which had
grown to or close to the water level. In this case, no foreset or topset bedding could be
interpreted from the GPR images and it was thought that even though the sediments most
probably represent glaciofluvial sedimentation, it was controlled by the bedrock and till
surfaces which were observed close to the modern ground surface. Nevertheless, the
geomorphological interpretation can provide information about the evolution of the
landforms but it should always be confirmed with the study of the internal structures of the
sediments beneath.
The applications of the study of the internal structures of the sediments are numerous. The
most straightforward applications are the determination of the depositional environment
and relative stratigraphic position of the sediments of which the first was mainly used in
this thesis. The determination of the depositional environment can lead to other
applications. In this thesis these applications included determination of the ice-front
position in East Anglia (Paper III) and reconstruction of the palaeotopography of the
White Sea Basin during the late Younger Dryas in Northwest Russia (Paper V). In Paper
III the deltaic deposits were observed on a north-south orientated curve. These deposits
were interpreted as representing glaciofluvial sedimentation in the deltaic deposits in East
Anglia implying the water level of a proglacial lake. A similar observation from the
Northwest Russia and measuring the current elevation of the deltaic surfaces, formed at the
same water level, lead to the reconstruction of the palaeotopography of the White Sea
Basin (Fig. 7).

38
Fig. 6. GPR image from the Lake Mikkolanjärvi study site in the area between the town of
Kalevala and the village of Kepa, Northwest Russia (Fig. 4). Radar surfaces RS1-
RS4 are marked with dashed black lines and groundwater table GW with solid
black line. RS1 is interpreted to represent an erosional top surface of the crystalline
bedrock. RS2-RS4 are interpreted as erosional surfaces, probably caused by
rearrangement of the flow pattern. Radar facies RF1 is interpreted as crystalline
bedrock, whereas RF2 and RF3 are interpreted to represent foreset bedding of the
glaciofluvial delta. The different dip direction in RF2 and below RS4 compared to
RF3 are thought to be caused by minor changes in the water flow direction and its
velocity. The horizontal reflections on top of the image between 340-470 metres
are thought to represent topset bedding.
The two decades of the use of GPR in sedimentological studies have produced a large
volume of publications and a large dataset from different depositional environments
around the world. It would be most advantageous for the people working with GPR in
sediments if a radar-stratigraphical atlas of the radar facies in different depositional
environments could be collected. This would greatly assist the interpretation but also
promote the use of GPR in the study of clastic, coarse-grained sediments, in general.

39
Fig. 7. The reconstruction of the White Sea Basin during the late Younger Dryas. The
reconstruction shows that large, currently onshore areas were inundated at the
western side of the White Sea and at the Arkhangelsk region.
6 Conclusions
The conclusions presented below illustrate issues important for the radar stratigraphical
interpretation and using GPR in clastic, coarse-grained sedimentary successions. These
issues are not or are only slightly addressed in the original papers which concentrate on
other matters than GPR and radar stratigraphy methodology.

40
1) GPR has proven to be one of the most useful methods for the investigation of low-
conductivity, clastic, coarse-grained subsurfaces to aid with the correlation of the
sedimentological data and in the determination of the depositional environment.
2) As a non-intrusive method, GPR can be used in delicate areas and where sections and
boreholes are not available or allowed.
3) Where landscape morphology is available, geomorphological interpretation can assist
in the interpretation of depositional environments but it should always be confirmed
with the study of the internal structures.
4) The outcomes of the use of the radar stratigraphical interpretation are the
determination of the depositional environment and the relative stratigraphical position
of the sedimentary facies.
5) Secondary elements or secondary radar elements, such as reflections caused by
glaciotectonic deformation, can provide valuable information concerning the history
of the deposits and should be integrated with the radar stratigraphical interpretation
method.
6) The number of studies in which GPR is applied to understand the sedimentology is
substantial, consisting of different depositional environments from around the world,
and they should be collected into an atlas of radar stratigraphy.
REFERENCES
Annan, A. P. & Davis, J. L., 1976. Impulse radar sounding in permafrost. Radio
Science, 11(4), 383-394.
Asprion U. & Aigner T., 1999. Towards realistic aquifer models: three-dimensional
georadar surveys of Quaternary gravel deltas (Singen Basin, SW Germany).
Sediment.Geol. 129(3-4), 281-297.
Baker G. S., Steeples D. W., Schmeissner C., Pavlovic M. & Plumb R., 2001. Near-
surface imaging using coincident seismic and GPR data. Geophys.Res.Lett. 28(4),
627-630.

41
Baker P. L., 1991. Response of ground-penetrating radar to bounding surfaces and
lithofacies variations in sand barrier sequences. Explor.Geophys. 22(1), 19-22.
Bakker M. A. J., 2004. The Internal Structure of Pleistocene Push Moraines. A
multidisciplinary Approach with Emphasis on Ground-Penetrating Radar. TNO Built
Environment and Geosciences, Geological Survey of Netherlands, Netherlands, PhD
Thesis.
Beres M. & Haeni F. P., 1991. Application of Ground-Penetrating-Radar Methods in
Hydrogeologie Studies. Ground Water 29(3), 375-386.
Beres M., Green A., Huggenberger P. & Horstmeyer H., 1995. Mapping the
Architecture of Glaciofluvial Sediments with 3-Dimensional Georadar. Geology
23(12), 1087-1090.
Beres M., Huggenberger P., Green A. G. & Horstmeyer H., 1999. Using two- and
three-dimensional georadar methods to characterize glaciofluvial architecture.
Sediment.Geol. 129(1-2), 1-24.
Best J. L., Ashworth P. J., Bristow C. S. & Roden J., 2003. Three-dimensional
sedimentary architecture of a large, mid-channel sand braid bar, Jamuna River,
Bangladesh. Journal of Sedimentary Research 73(4), 516-530.
Bridge J., Collier R. & Alexander J., 1998. Large-scale structure of Calamus River
deposits (Nebraska, USA) revealed using ground-penetrating radar. Sedimentology
45(6), 977-986.
Cardimona S. J., Clement W. P. & Kadinsky-Cade K., 1998. Seismic reflection and
ground-penetrating radar imaging of a shallow aquifer. Geophysics 63(4), 1310-1317.
Daniels D. J., Gunton D. J. & Scott H. F., 1988. Introduction to subsurface radar. IEE
Proceedings 135(4), 278-320.
Davis J. L. & Annan A. P., 1986. High-Resolution Sounding using Ground-Probing
Radar. Geosci.Can. 13(3), 205-208.

42
Davis J. L. & Annan A. P., 1989. Ground-Penetrating Radar for High-Resolution
Mapping of Soil and Rock Stratigraphy. Geophys.Prospect. 37(5), 531-551.
Eronen M., Forsström L., Holappa K., Jungner H. & Roman S., 1995.
Radiohiiliajoitus Oulun Hangaskankaan sinisimpukkaesiintymästä. Geologi 47, 47-52.
Eyles N., Eyles C. H. & Miall A. D., 1983. Lithofacies Types and Vertical Profile
Models - an Alternative Approach to the Description and Environmental Interpretation
of Glacial Diamict and Diamictite Sequences. Sedimentology 30(3), 393-410.
Eyles N. & Miall A. D., 1984. Glacial facies. In: Walker RG (ed) Facies Models.
Ainsworth Press Ltd. Kitchener, Ontario: Geoscience Canada, Reprint Series 1, 15-38.
Gawthorpe R. L., Collier R. E. L., Alexander J., Bridge J. S. & Leeder M. R., 1993.
Ground penetrating radar: application to sandbody geometry and heterogeneity
studies. Geological Society, London, Special Publications 73(1), 421-432.
Helle R. & Ylinen M., 1965. Hangaskankaasta Kajaanin-Rokuan harjujaksossa. Yritys
siitepölyanalyysin ja radiohiiliajoituksen avulla selvittää harjun rakennetta. Terra 77,
104-111.
Hänninen P., 1991. Maatutkaluotaus maaperägeologisissa tutkimuksissa. 1 Espoo:
Geologian tutkimuskeskus.
Jakobsen P. R. & Overgaard T., 2002. Georadar facies and glaciotectonic structures in
ice marginal deposits, northwest Zealand, Denmark. Quaternary Science Reviews
21(8-9), 917-927.
Jol H. M. & Smith D. G., 1991. Ground Penetrating Radar of Northern Lacustrine
Deltas. Canadian Journal of Earth Sciences 28(12), 1939-1947.
Jol H. M., 1995. Ground penetrating radar antennae frequencies and transmitter
powers compared for penetration depth, resolution and reflection continuity.
Geophys.Prospect. 43(5), 693-709.

43
Koistinen T., Stephens M. B., Bogatchev V., Nordgulen Ø., Wennerström M.. &
Korhonen J., 2001. Geological map of the Fennoscandian Shield, scale 1:2 000 000.
Geological Surveys of Finland, Norway and Sweden and the Northwest Department of
Natural Resources of Russia.
Korsman K., Koistinen T., Kohonen J., Wennerström M., Ekdahl E., Honkamo M.,
Idman H. & Pekkala Y., 1997. Suomen kallioperäkartta – Berggrundskarta över
Finland – Bedrock map of Finland 1:1 000 000. Geological Survey of Finland, Espoo.
Lønne I. & Lauritsen T., 1996. The architecture of a modern push-moraine at Svalbard
as inferred from ground-penetrating radar measurements. Arct.Alp.Res. 28(4), 488-
495.
McCann D. M., Jackson P. D. & Fenning P. J., 1988. Comparison of the seismic and
ground probing radar methods in geological surveying. IEE Proceedings 135, 380-
390.
Miall A. D., 1977. A review of the braided-river depositional environment. Earth-
Science Reviews, 13(1), 1-62.
Miall A. D., 1985. Architectural-element analysis: A new method of facies analysis
applied to fluvial deposits. Earth-Science Reviews, 22(4), 261-308.
Mitchum R. M., Vail P. R. & Sangree J. B., 1977. Stratigraphic interpretation of
seismic reflection patterns in depositional sequences. In: Payton CE (ed) Seismic
Stratigraphy - Applications to Hydrocarbon Exploration. AAPG Memoirs 16, 117-123.
Mäkinen J. & Räsänen M., 2003. Early Holocene regressive spit-platform and
nearshore
sedimentation on a glaciofluvial complex during the Yoldia Sea and
the Ancylus Lake phases of the Baltic Basin, SW Finland. Sedimentary Geology 158,
25-56.
Neal A., Richards J. & Pye K., 2002. Structure and development of shell cheniers in
Essex, southeast England, investigated using high-frequency ground-penetrating radar.
Marine Geology 185(3-4), 435-469.

44
Neal A., 2004. Ground-penetrating radar and its use in sedimentology: principles,
problems and progress. Earth-Sci.Rev. 66(3-4), 261-330.
Nitsche F. O., Bell R., Carbotte S. M., Ryan W. B. F. & Flood R., 2004. Process-
related classification of acoustic data from the Hudson River Estuary. Marine Geology
209(1-4), 131-145.
Olsen H. & Andreasen F., 1995. Sedimentology and Ground-Penetrating Radar
Characteristics of a Pleistocene Sandur Deposit. Sediment.Geol. 99(1), 1-&.
Overgaard T. & Jakobsen P. R., 2001. Mapping of glaciotectonic deformation in an ice
marginal environment with ground penetrating radar. J.Appl.Geophys. 47(3-4), 191-
197.
Putkinen N. & Lunkka J. P., 2008. Ice stream behavior and deglaciation of the
Scandinavian Ice Sheet in the Kuittijärvi area, Russian Karelia. Bulletin of the
Geological Society of Finland 80, 19-37.
Rainio H., Saarnisto M. & Ekman I., 1995. Younger Dryas end moraines in Finland
and NW Russia. Quaternary International, 28, 179-192.
Roberts M. C., Pullan S. E. & Hunter J. A., 1992. Applications of land-based high
resolution seismic reflection analysis to Quaternary and geomorphic research.
Quaternary Science Reviews 11(5), 557-568.
Roberts M. C., Bravard J. P. & Jol H. M., 1997. Radar signatures and structure of an
avulsed channel: Rhone River, Aoste, France. Journal of Quaternary Science 12(1),
35-42.
Roksandic M. M., 1978. Seismic facies analysis concepts. Geophys.Prospect. 26(2),
383-398.
Sangree J. B. & Widmier J. M., 1979. Interpretation of depositional facies from
seismic data. Geophysics 44(2), 131-160.
Smith D. G. & Jol H. M., 1992. Ground-Penetrating Radar Investigation of a Lake
Bonneville Delta, Provo Level, Brigham-City, Utah. Geology 20(12), 1083-1086.

45
Smith D. G & Jol H. M., 1997. Radar structure of a Gilbert-type delta, Peyto Lake,
Banff National Park, Canada. Sediment.Geol. 113(3-4), 195-209.
Sutinen R., 1992. Glacial Deposits, their electrical properties and surveying by image
interpretation and ground penetrating radar. Geological Survey of Finland, Bulletin
392, 123.
Van Dam, R. L. & Schlager W., 2000. Identifying causes of ground-penetrating radar
reflections using time-domain reflectrometry and sedimentological analyses.
Sedimentology 47, 435-449.
Van Dam, R. L., Schlager W, Dekkers M. J & Huisman J. A., 2002a. Iron oxides as a
cause of GPR reflections. Geophysics 67(2), 536-454.
Van Dam, R. L., van den Berg, E. H., van Heteren S., Kasse C., Kenter, J. A. M. &
Groen K., 2002b. Influence of organic matter in soils on radar-wave reflection:
sedimentological implications. Journal of Sedimentary Research 72(3), 341-352.
Van Overmeeren R. A., 1997. Imaging groundwater 'steps' in push moraines by
georadar. Geological Society, London, Engineering Geology Special Publications
12(1), 63-73.
Van Overmeeren R. A., 1998. Radar facies of unconsolidated sediments in The
Netherlands: A radar stratigraphy interpretation method for hydrogeology.
J.Appl.Geophys. 40(1-3), 1-18.
Vandenberghe J. & van Overmeeren R. A., 1999. Ground penetrating radar images of
selected fluvial deposits in the Netherlands. Sediment.Geol. 128(3-4), 245-270.
Woodcock N. H. & Naylor M. A., 1983. Randomness testing in three-dimensional
orientation data. Journal of Structural Geology, 5(5), 539-548.

46