syngenta annual review 2015 2015 annual review · 2016-04-07 · report 2015. the annual review...
TRANSCRIPT

Syn
gent
a A
nnua
l Rev
iew
201
5
Annual Review 2015

i Syngenta Annual Review 2015 Contents
About the Syngenta Annual ReportThe full print edition of Syngenta’s Annual Report 2015 comprises:
the Annual Review 2015, summarizing both financial and non-fi ancial performance
the Financial Report 2015
the Corporate Governance Report and Compensation Report 2015.
The Annual Review includes quantitative and qualitative information on strategies, policies and actions taken regarding our business and corporate responsibility goals.
For further information, including the Form 20-F, the Our Industry publication and a section with answers to many “Questions about Syngenta”, visit our corporate website: www.syngenta.com
Syngenta’s Annual Report also serves as our annual Communication on Progress (COP) for the United Nations Global Compact.
You can find our online Annual Report 2015 on: www.ar2015.syngenta.com
ii-09Strategic overviewii At a glance
01 Bringing plant potential to life
02 Chairman’s statement
04 Chief Executive Officer’s statement
06 Our business model
08 Our strategy
26-35The Good Growth Plan
27 Make crops more efficient
28 Rescue more farmland
30 Help biodiversity flourish
31 Empower smallholders
32 Help people stay safe
34 Look after every worker
10-13Research and Development10 The industry’s most productive
innovation engine
14-25Crops in focus14 Cereals
16 Corn
17 Diverse fi ld crops
18 Rice
20 Soybean
21 Specialty crops
23 Sugar cane
23 Vegetables
24 Lawn and Garden
36-45Operational performance37 People
38 Sustainable operations
42 Business integrity
44 Public debates
64-67Corporate information64 Board of Directors
65 Executive Committee
66 Shareholder information
46-63Performance data46 Regional performance
47 Product line performance
48 Financial information
55 Non-financial information
63 Independent Assurance Report on the Syngenta Non-financial Reporting

Group performanceOur focus has been on improving profitability while continuing to support our customers in a volatile economic environment.
Financial performance
Non-financial performance
ii Syngenta Annual Review 2015 At a glance
Crop performanceWe are using our deep understanding of crops to develop integrated offers, which increasingly bring together genetics and chemistry.
Read more about “Crops” on pages 14–25
1 Growth at constant exchange rates (CER)2 Including sales of Crop Protection products
to Seeds3 Fully diluted excluding restructuring and impairment4 For a definition of cash flow return on investment,
see page 54
5 2015 dividend is subject to shareholder approval at the Annual General Meeting on April 26, 2016
6 2014 value was estimated and not assured7 Per 200,000 hours, according to US OSHA definition8 Through sales
Read more about “Financial information” on pages 48–54
Read more about “Non-financial information” on pages 55–62
1 Crop sales are based on Syngenta estimates
Crop sales $m1
2015
2014
2013
13.41
15.13
14.69
Group sales
+1% (CER1)$13.4bn
2015
2014
2013
11%
11%
13%
11%
Cash flow returnon investment4
2015
2014
2013
10.00
11.38
10.92
Crop Protection sales2
-1% (CER1)$10.0bn
2015
2014
2013
2.84
3.16
3.20
Seeds sales
+5% (CER1)$2.8bn
2015 84%
Seed supply farms in our fair labor program6
84%
2014 53%
2015
2014
17.2
13.8
Smallholders reached8
17.2m
2015
2014
2013
5.7
4.7
2.8
People trained on safe use
5.7m
2015
2014
2013
0.38
0.37
0.41
Recordable illness and injury rate7
0.38
2015
2014
2013
17.78
19.42
19.30
Earnings per share3
-8%$17.78
2015
2014
2013
11.00
11.00
10.00
Dividend per share5
CHF11.000%
2015
2014
2013
1.36
1.43
1.38
Research and Development investment
-3% (CER1)$1.4bn
2015
2014
2013
2.78
2.93
2.90
EBITDA
$2.8bn+16% (CER1)
Lawn and Garden $648m
Vegetables $1,540m
Specialty crops $1,882m
Sugar cane $271m
Soybean $2,515mCereals $1,686m
Corn $3,161m
Diverse field crops$1,105m
Rice $588m

iii Syngenta Annual Review 2015 At a glance
Business highlightsThroughout 2015, we continued to strengthen our offer through market-leading innovation and collaboration. Here are some highlights from the year.
Our global reachOur teams around the world combine their local knowledge with our global assets and expertise, tailoring solutions that create value for growers.
Breakthrough corn herbicideSyngenta received US EPA approval for ACURON®, providing a step change in technology to address herbicide resistance.
Read more on page 17
Syngenta and DSM partnershipThe companies will develop and jointly commercialize microbial-based agricultural solutions, including bio-controls, bio-pesticides and bio-stimulants.
Read more on page 12
New high-performance fungicidesORONDIS™ and SOLATENOL™ received US EPA approval, expanding Syngenta’s market-leading fungicide portfolio.
Read more on pages 11 and 15
The Good Growth PlanWe made significant progress and, with the Open Data Institute, published data to enable the unlocking of environmental, social and economic value.
Read more on pages 26–35
R&D Days: unparalleled pipelineWe demonstrated that our R&D is the most productive in the industry and set out a pipeline of unparalleled innovation across chemistry, seeds and traits.
Read more on pages 10–13
Corn traits licensing agreement Our licensing collaboration with KWS and Limagrain is further affirmation of the value of Syngenta’s innovative GM traits portfolio.
Read more on page 16
North America
Europe, Africa and Middle East
Latin America
AsiaPacific
Europe, Africa and Middle EastSales 1 $m 3,884
Employees 2,3 13,047
Research and Development sites 47
Production and Supply sites 42
North AmericaSales 1 $m 3,410
Employees 2 4,335
Research and Development sites 34
Production and Supply sites 35
Latin AmericaSales 1 $m 3,632
Employees 2 4,962
Research and Development sites 13
Production and Supply sites 12
Asia PacificSales 1 $m 1,837
Employees 2 6,360
Research and Development sites 25
Production and Supply sites 23
Countries
90Production and Supply sites 4
112Research and Development sites
119Employees
28,7041 Excluding Lawn and Garden2 Permanent full-time equivalent (FTE) as of September 30, 20153 Including headquarters (Switzerland)4 Including six multi-functional production sites

Bringing plant potential to lifeWe apply world-class science and the most productive research and development in the industry to achieve a step change in agricultural productivity.In more than 90 countries around the world, we enable millions of farmers to improve global food security by making better, more sustainable use of available resources.
Syngenta Annual Review 2015 01
Strateg
ic overview
Research and
D
evelop
ment
Cro
ps
in focu
sT
he Go
od
G
rowth P
lanO
peratio
nal p
erform
anceP
erform
ance d
ataC
orp
orate
inform
ation

02 Syngenta Annual Review 2015
Chairman’s statement
2015 was a challenging year on a number of fronts, but one during which Syngenta demonstrated its resilience, outperformance and excellence. In agricultural markets, crop prices remained subdued and impacted the willingness of growers to invest in technology. Nevertheless, preliminary data suggest that the Company managed to gain market share on a global basis, while posting an improvement in margin. In these extraordinary circumstances, the Board is proud of what our Company has achieved.
Economic uncertainty in emerging markets, which represent over 50 percent of our sales, led to significant currency weakness, notably in Brazil and the CIS. These devaluations restricted our sales growth, but our teams managed to cope with the turbulence through a number of actions in the field – leveraging the quality of our offer – which enabled us to progressively increase prices.
While profit growth was curtailed by difficult agricultural markets and currency headwinds, profitability improved driven by the Accelerating Operational Leverage program which, in its second year, delivered more than the targeted savings. The program is really gaining momentum in the organization, and I am confident that our 2018 savings target of $1 billion will be achieved and result in clear profitability and cash flow leadership.
Extraordinary circumstances, impressive resilience and a promising future“Preliminary data suggest that the Company managed to gain market share on a global basis, while posting an improvement in margin. In these extraordinary circumstances, the Board is proud of what our Company has achieved.”
Michel Demaré Chairman

Syngenta Annual Review 2015 03
Strateg
ic overview
Research and
D
evelop
ment
Cro
ps
in focu
sT
he Go
od
G
rowth P
lanO
peratio
nal p
erform
anceP
erform
ance d
ataC
orp
orate
inform
ation
Chairman’s statement
Our industry-leading Research and Development productivity and innovation pipeline was showcased at our R&D days, attended by more than 570 investors, customers, stakeholders and employees over three days in September. With unrivaled breadth and depth of technologies across chemicals, seeds and biotech traits, Syngenta is in a very strong position to drive future growth. The ongoing success of the new fungicide ELATUS™ in Brazil, the launch of the novel herbicide ACURON® in the USA and the expansion of our corn traits licensing – evidenced by the license agreement concluded with KWS/Limagrain in October – demonstrate not just our innovation power, but also our ability to create significant value from that innovation.
Excellent progress was made during the year with The Good Growth Plan. Each target within our six commitments was achieved, and we remain on track to meet our 2020 goals. We also increased the number of reference farms in our network to over 1,000 globally, giving us extensive and rich data. We reinforced our transparent approach by publishing these data in partnership with the Open Data Institute, so that interested stakeholders can analyze and work with our results.
In addition, 2015 was the first year in which we achieved audit level of assurance for The Good Growth Plan. This is unique in the industry – and very rare in any industrial sector – and demonstrates the rigorous nature of The Good Growth Plan and the real, quantifiable and tangible benefits that it brings to society and the environment. Finally, we became the first agriculture company to receive accreditation by the Fair Labor Association (FLA) for our program in India. Building on this strong foundation, we are now working with the FLA on accreditation for our global program.
We also made significant progress in developing a clear framework for measuring and tracking the sustainability of our own operations. These are centered on five areas – energy, water, waste, suppliers and logistics – and the majority of associated actions will be completed by the end of 2016.
The Good Growth Plan and the Syngenta Foundation for Sustainable Agriculture, which continued its excellent job in supporting smallholders across the world, really place Syngenta at the forefront of sustainability in our industry and make, in my opinion, a real difference.
In October, Chief Executive Officer Mike Mack informed the Board of his decision to step down from his role after eight years. Mike led the Company with passion and dynamism, developing an innovative integrated strategy, driving significant growth in sales and creating a new relationship with society through The Good Growth Plan. On behalf of the Board of Directors, I should like to thank Mike for his immense contribution to Syngenta.
Mike was succeeded by John Ramsay, who has a long and distinguished track record of leadership in the Company. John is currently acting in an ad interim capacity, while a full internal and external search is conducted. The Company is in solid hands, which allows a disciplined process to take place to select our future leader.
2015 witnessed much speculation about industry consolidation, and a merger was announced towards the end of the year between two of our US-based competitors. This was partly driven by challenging market conditions and diminishing returns on R&D, while investors expect greater and faster returns from the industry as a whole. As the structure of the industry started to show irrevocable signs of profound changes, it was important for the Company to remain agile and assume no status-quo.
In that context, I was very pleased to announce on February 3, 2016, a transaction with ChemChina that I firmly believe is in the best interests of shareholders and all other stakeholders in Syngenta, including our employees, our customers and our communities. It is a transaction for growth and long-term investment, and one which recognizes the tremendous value of our Company – our innovation, our broad and deep market presence and the excellence of our people. Moreover, the governance structure agreed in the transaction reflects the high standards that have guided the Company since its inception in 2000 – Syngenta remains Syngenta, and will continue its ambitious standalone strategy supported by an ambitious owner. Even better, growers around the world will continue to have a choice.
I should like to thank my Board colleagues for their judgment and support during this process, and for their guidance during the year.
Finally, I should particularly like to thank all the employees of Syngenta for their dedication, hard work and commitment to the Company. The volatility created by the markets and by the industry consolidation discussions have not caused them to lose focus. On the contrary, they start 2016 with the same determination and pride in what Syngenta has to offer to farmers around the world. I am confident they will deliver again, whatever the circumstances.
Michel Demaré Chairman

04 Syngenta Annual Review 2015
Chief Executive Officer’s statement
As shareholders in an agriculture company, you are familiar with the impact – positive or negative – that commodity prices can have on our business. The evolution of commodity prices is determined by multiple factors, including notably the weather. However, over the last two years, geopolitical and economic events have also had a significant influence on our business.
Managing currency volatilityThe 2014 events in Russia and Ukraine had continuing implications in 2015 because of the massive currency devaluations in those two countries. I am pleased to say that we were successful in offsetting these devaluations through price increases. While higher prices had some impact on sales of seeds, where local alternatives were available, our crop protection business was virtually unscathed. This shows the importance of high-value chemistry to customers in these countries and the strength of our market positions.
In January 2015, the Swiss National Bank removed the Swiss franc peg against the Euro, resulting in a rapid appreciation of the franc. With some 13 percent of our costs in Swiss francs compared with less than 1 percent of our sales we, like many other Swiss companies, stood to be adversely affected by this move. However, thanks to our well-established hedging program we were able to minimize the impact.
Clear goals are key to our objective of outperformance“I remain convinced that the emerging markets, which today are experiencing such turmoil, continue to represent the major growth driver for our industry in the future. I am equally convinced that Syngenta has the necessary skills and experience, as well as the right portfolio, to succeed in these markets.”
John Ramsay Chief Executive Officer Ad interim

Syngenta Annual Review 2015 05
Strateg
ic overview
Research and
D
evelop
ment
Cro
ps
in focu
sT
he Go
od
G
rowth P
lanO
peratio
nal p
erform
anceP
erform
ance d
ataC
orp
orate
inform
ation
Chief Executive Officer’s statement
The next currency challenge was the rapid devaluation of the Brazilian real, which accelerated during the summer – just as the planting season was getting underway. With growers confronted with severe liquidity constraints, it has not been possible immediately to raise prices in response to the movement in the currency. In the coming season, however, we will begin to do so, building on our experience in the CIS countries. In the meantime, our focus has been on helping our customers through this period of economic difficulty, while safeguarding our balance sheet through rigorous risk management.
Overall I am proud of the way we have navigated through this period of currency instability. Currency movements reduced our sales by $1.8 billion in 2015 and yet the impact on EBITDA was contained at around $100 million.
Ongoing promise of emerging marketsDuring my career of over 30 years at Syngenta and its legacy companies, I have spent extended periods in both Latin America and Asia Pacific. I remain convinced that the emerging markets, which today are experiencing such turmoil, continue to represent the major growth driver for our industry in the future. I am equally convinced that Syngenta has the necessary skills and experience, as well as the right portfolio, to succeed in these markets.
Managing for profitabilityI am conscious that in recent years our profitability has fallen short of our own and our shareholders’ expectations. I am therefore pleased that in 2015, despite low commodity prices and currency volatility, we were able to increase profitability. In the current environment, the need for efficiency improvements has emerged as a prevalent industry theme. Syngenta took early action in this respect, having announced our Accelerating Operational Leverage (AOL) program in February 2014. The program has three pillars – global operations, commercial and R&D – with targeted savings of $1 billion in 2018. We delivered savings ahead of target at $ 300 million in 2015 and are firmly on track to deliver the 2016 target.
As part of our commitment to improved profitability, we have undertaken a review of all our seeds businesses, which will be concluded at the end of the first quarter of 2016. We will assess the profitability potential of each asset as well as its importance in the context of an integrated offer.
R&D excellenceAt our R&D Days in September, we demonstrated that Syngenta has the most productive R&D engine in the industry, with every dollar spent generating $ 10.70 in sales over the last ten years. We also explained that investment in R&D is not just about invention – it must also enable products to be successfully brought to market. With regulatory hurdles becoming steeper, our expertise and foresight in this area are increasingly important – Syngenta has a 100 percent success rate in bringing products from development to launch. We have now put in place the platforms that will enable us further to increase R&D productivity, while continuing to excel at the invention and the development of new products.
I took over as the CEO ad interim of Syngenta at the end of October. One of my first moves has been to align the organization behind clear goals which are key to our objective of outperformance. The goals comprise: meeting or exceeding our financial commitments; further improving the customer experience in order to maintain and grow market share; and driving simplification in everything we do to increase our speed and impact. I am confident that we have the framework in place to achieve these goals, all of which are underpinned by the AOL program. Our strength in innovation, which has been amply demonstrated in the course of 2015, will be a further driver in terms of the customer experience.
I have been deeply impressed by the loyalty and determination of our people during the last year, which has brought considerable challenges. This gives me the utmost conviction that we can achieve our goals and deliver on Syngenta’s immense promise.
John Ramsay Chief Executive Officer Ad interim

Creating value through innovationOur business enables growers to meet ever-growing demand for food and other plant-based resources such as biofuels. Demand is rising: both for greater quantity, driven primarily by population growth, and for higher quality, driven by rising affluence and changing diets.
These needs must be met without putting further pressure on resources that are already overstretched. We help farmers rise to the challenge through innovation rooted in our deep understanding of crops and the needs of growers worldwide.
Our business model
Uniquely equipped to succeedNo competitor comes close to our range of experience: in biosciences and breeding; in chemistry; across a huge variety of crops; and across geographies and climate zones worldwide.
This enhances the scope and pace of our innovation, enabling us to transfer technologies between crops and address challenges with holistic solutions that integrate both seed and crop protection science.
It gives us particular strength in serving smallholders and emerging markets, where the greatest opportunities for yield improvement – and our business growth – exist.
Our expertise and our open, collaborative culture have made us a trusted and sought-after partner: we have built a rich network of productive alliances with academic institutions, other agricultural businesses and growers. These relationships leverage our own resources – accelerating our innovation, sharpening our production efficiency and increasing our flexibility.
The resources we depend on
Financial capital
People and the intellectual property they create
Chemical, biological, genetic and computational sciences
Natural resources
Facilities and services
Local communities
Laws and regulations
06 Syngenta Annual Review 2015

What we do
Research and developmentWhat we do
Crop protection discovery and innovation
Advanced seed breeding
Addressing insect, fungus, weed and environmental stress on crops
Who we work with
Scientists and universities
Research institutions
Farmers and suppliers
NGOs
Agricultural extension services
Production
What we do
Active ingredients
Intermediates
Formulation, fill and packaging
Seed production
Who we work with
Chemical suppliers
Toll manufacturers
Seed supply farms
Lawn and Garden supply chain
Commercial
What we do
Product management
Crop-based offers
Marketing, sales and distribution
Who we work with
Growers
Distributors
Demonstration farms
Processors and the food chain
Agronomists
Agricultural extension services
Technology providers
Supporting activities
What we do
Stewardship
Product registration
Health, Safety, Environment, Quality and Security
Technology and engineering
Multi-stakeholder dialogue
Who we work with
Industry associations
NGOs and IGOs
What we create
Products, services and solutions
The value we provide
Return on investment for growers and shareholders
Food, feed, fuel and fiber
Sustainable intensification of agriculture to provide food security
Grower and customer satisfaction
Sustainable production
Development of our people and partners along the value chain
Economic value shared with employees, suppliers, governments and communities
Collective wellbeing of communities
Stimulating research and sharing knowledge
Products
Herbicides
Insecticides
Fungicides
Seedcare
Seeds
Traits
Crops
Cereals
Corn
Diverse field crops
Rice
Soybean
Specialty crops
Sugar cane
Vegetables
Lawn and Garden
Adjacent technologies
Nutrients
Financial services
Information systems
Agronomic know-how
Crops
Integrated solutions
for growers
Products Adjacent technologies
Syngenta Annual Review 2015 07
Strateg
ic overview
Research and
D
evelop
ment
Cro
ps
in focu
sT
he Go
od
G
rowth P
lanO
peratio
nal p
erform
anceP
erform
ance d
ataC
orp
orate
inform
ation
Our business model

Our strategy
Accelerating value creationOur focus is on delivering higher profitability and above-market growth, building on the success of our innovation. We are adapting our integrated strategy where necessary to ensure that it is closely aligned with the varying needs of our customers around the world. Strong new products are vital for success, and our ongoing investment in Research and Development is securing the flow of innovation for many years to come.
In a turbulent market environment, Syngenta’s ambition remains unchanged: to bring greater food security in an environmentally sustainable way to an increasingly populous world by creating a worldwide step change in farm productivity. The launch of The Good Growth Plan and its increasing influence across the business is taking us nearer to realizing our ambition.
Our strategy needs to be at the service of profitability as well as growth. We have heightened our focus on cost efficiency, enabling us to deliver higher margins even in a context of lower crop prices. In doing so, we are exploiting the global platforms put in place since launching our integrated strategy in 2011.
08 Syngenta Annual Review 2015
Integration: five years on Create integrated offers in the field supported by agronomic expertise and a deep understanding of grower needs now and in the future
Syngenta was the first company to develop an integrated strategy combining crop protection, seeds, seed care and traits. The value of the strategy is now widely recognized across the industry.
In the first five years of strategy implementation, we have gathered numerous insights from customers and from our sales people around the world. This is enabling us to adapt and fine tune the strategy in accordance with the conditions of each territory.
Broad technology platformsBroad technology platforms, underpinned by Research and Development (R&D), are a pre-requisite for providing comprehensive solutions across crops. Syngenta is well placed as the world number one in crop protection, number three in seeds and a leading player in both seed treatment and genetically modified traits. We recognize, however, that alone we cannot fulfil every need. We have already demonstrated our willingness to enter into partnerships and collaborations to give our customers access to additional tools.
Strong emerging market presenceThe integrated strategy achieved early success in the emerging markets, where technology adoption and intensification are resulting in ongoing demand for complete solutions accompanied by agronomic advice. As a consequence, we have been able to show share gains in both crop protection and seeds in many of these countries.

Syngenta Annual Review 2015 09
Strateg
ic overview
Research and
D
evelop
ment
Cro
ps
in focu
sT
he Go
od
G
rowth P
lanO
peratio
nal p
erform
anceP
erform
ance d
ataC
orp
orate
inform
ation
Our strategy
Flow of innovationAn upturn in innovation is now leading to share gain in a number of developed markets too. While a fully integrated approach cannot be applied uniformly in every market, we continue to strengthen our positions through the breadth and depth of our portfolio. With differentiated seeds technologies such as HYVIDO® and ENOGEN®, we can generate additional crop protection sales by demonstrating the superior results achieved through combining genetics and chemistry.
Innovation: delivering now and in the future Bring strong new products to market and combine chemistry and genetics to create new solutions and business models
Following the launch in 2014 of three new active ingredients – including the blockbuster ELATUS™ – in 2015, we launched ACURON®, a new corn herbicide and another blockbuster. The introduction in the USA was positively received as a major step forward in managing resistant weeds. Meanwhile, ELATUS™ continued to grow in its second season in Brazil. The success of both products shows that our customers have an appetite for new technologies even in depressed market conditions.
Innovation in seed breeding and traits2015–2020 Our HYVIDO® hybrid barley will expand further, demonstrating how innovation can spur integrated offers in developed markets. In corn, our focus is increasingly on the realization of trait revenues through licensing agreements as well as through our branded business. In recent years, Syngenta has had the highest rate of trait innovation in the industry, and this has stimulated demand for both existing and future traits. As a result, trait revenue is expected to more than double between 2014 and 2020.
2020–2025 Syngenta has a leading position in the development of hybrid wheat, building on the success of HYVIDO®. We expect to be first to market with this game-changing technology, with progressive launches across three regions.
2025–2030 Starting in the middle of the next decade, the industry will see a new wave of trait innovation in which Syngenta will again play a leading role. Our pipeline includes replacement traits for insect control and solutions for problems not yet addressed by traits, including sucking pests and soybean rust.
Outperform: targeting above-market growth Our goal is to improve profitability while creating value for our customers through higher yields and better use of resources
Market outperformanceOur objective of above-market growth is underpinned by our recent new product launches, current strong pipeline and experience in tailoring and adapting integrated offers. We are well placed in the emerging markets, having completed a period of extensive investments, and our long experience of managing risk is enabling us to navigate the current volatility in several of these countries.
Focus on seedsMarketing seeds, which are often the grower’s first decision point, can expand the opportunity for crop protection sales. While we have already seen evidence of this in practice, we are also focusing on maximizing profitability for each of our seeds assets. We are developing clear actions for each of the different crops within the business, with a particular focus on those where profitability is significantly below the average.
Accelerating Operational LeverageThe improvement in seeds gross margin will contribute to the increase in EBITDA margin targeted under the Accelerating Operational Leverage program. The program targets savings of $ 1 billion in 2018, with around 40 percent coming from global supply, 40 percent from commercial operations and 20 percent from R&D. There are multiple work streams driving progress for each of these pillars. Cost savings account for about 60 percent of the $ 1 billion target, with the remainder dependent on market growth of around 4 percent. Achievement of the cost savings is a paramount objective throughout the organization.

Research and Development
10 Syngenta Annual Review 2015
The industry’s most productive innovation engineSyngenta invests around $ 1.4 billion a year in R&D, and is unique in combining chemistry, genetics, breeding and computational science to develop new products and solutions. Our R&D function is already the most productive and innovative in the industry, and we continue to increase returns while accelerating the pace of innovation.
Our markets present major opportunities for creating long-term, sustainable value through the successful development and application of technology. To realize these opportunities in 2015, we invested $1.36 billion into research and development (R&D).
2015
2014
2013
1.36
1.43
1.38
Investment in Research and Development $bn
Our R&D strategy aims to anticipate and meet growers’ needs, faster and better than our competitors.
Major opportunities to create sustainable valueToday’s solutions are mostly in the area of biotic stress: controlling weeds, insects and disease. These challenges never stand still. We must constantly find new ways to address emerging new pests and resistance to established solutions.
We aim to anticipate problems, leveraging our broad portfolio of technologies to create new solutions. For example, we predicted the emergence of glyphosate-resistant weeds and began work on meeting the challenge a decade ago. This has yielded a series of new products – most recently ACURON®, which combines multiple modes of action to combat resistant weeds and inhibit the development of further resistance. We launched ACURON® in 2015 in the USA, where resistant weed infestations in corn have risen by 50 percent in just four years.
Further solutions will come from our work on bio-controls, which offer the advantage of precisely targeted action and can be used alongside synthetic chemistry. Examples of current projects in this area include RNA-based bio-controls to combat Colorado potato beetle, and we are now aiming to extend the scope of this technology to corn rootworm and other pests.
Challenges such as heat, drought and cold are known as abiotic stress – and represent future opportunity. Our recent solutions have included AGRISURE ARTESIAN® – optimized for water use efficiency – and ISABION®, which increases rice yields by protecting young plants from cold during transplantation.

Strateg
ic overview
Research and
D
evelop
ment
Syngenta Annual Review 2015 11
Cro
ps
in focu
sT
he Go
od
G
rowth P
lanO
peratio
nal p
erform
anceP
erform
ance d
ataC
orp
orate
inform
ation
Research and Development
Accelerating the pace of innovationBetween 2008 and 2014, we launched an average of one new active ingredient (AI) a year and over 600 new crop protection products. Between 2016 and 2024, we are stepping up the pace, with 10 new AI launches planned from a pipeline with over $ 4 billion of sales potential.
The major product launch in weed control was ACURON® – a breakthrough solution providing four active ingredients and three different modes of action to help growers manage weed resistance. We also received US approval for ORONDIS™, which offers a step change in controlling diseases such as downy mildew and late blight, at significantly lower application rates than other fungicides.
ORONDIS™ is based on the AI oxathiapiprolin, licensed from DuPont: one example of the way we are using partnerships to bring innovation to the market faster. Across our crop protection portfolio in 2015, we released more than 70 new formulations.
Recent active ingredient launches
Products introduced since 2008
Product Indication Crops Year of peak sales Peak sales
SEGURIS® Fungicide Cereals, diverse field crops, rice, specialty crops, vegetables
2018 >$ 150m
VIBRANCE® Fungicide Cereals, corn, diverse field crops, rice, soybean, specialty crops, vegetables
2020 ~$ 500m
CLARIVA® Seedcare Cereals, diverse field crops, soybean 2018 >$ 200m
ELATUS™ SOLATENOL™
Fungicide Cereals, corn, diverse field crops, soybean, specialty crops, vegetables
2020 ~$ 1,000m
FORTENZA® MINECTO™
Seedcare Cereals, corn, diverse field crops, rice, soybean, specialty crops, vegetables
2018 2020
>$ 400m
ACURON® Herbicide Cereals, corn, diverse field crops 2020 >$ 500m
New Crop Protection pipeline
New blockbusters in large markets
Product Indication Crops Status Launch year Peak sales
ADEPIDYN™ Fungicide Cereals, corn, soybean, specialty crops, vegetables
Stage 3 2016/2017 >$ 750m
Lead 1 Insecticide Multiple crops Stage 3 2021 >$ 750m
Lead 2 Herbicide Multiple crops Stage 2 2023 >$ 600m
Lead 3 Fungicide Cereals, soybean Stage 1 (late) 2022 >$ 600m
Lead 8 Herbicide Multiple crops Stage 1 (late) 2024 >$ 500m
Large products in smaller segments
Product Indication Crops Status Launch year Peak sales
ORONDIS™ Fungicide Vegetables, specialty crops Stage 3 2016 >$ 150m
Lead 4 Insecticide Vegetables, specialty crops Stage 3 2021 >$ 250m
Lead 5 Seedcare Cereals, corn, soybean Stage 1 (late) 2021 >$ 400m
Lead 6 Seedcare Multiple crops Stage 1 (late) 2022 >$ 200m
Lead 7 Seedcare Multiple crops Stage 1 (late) 2022 >$ 100m
Stage 1: Invention, optimization Stage 2: Evaluation Stage 3: Development and launch

12 Syngenta Annual Review 2015
In seeds, we achieved the largest number of genetically modified (GM) trait introductions in the industry between 2010 and 2014. We are progressing three new GM traits for soybean and corn through the regulatory approval processes. These are OH2 soybean and corn molecular stacks for herbicide tolerance and corn rootworm. We also have a strong research pipeline, with more than 20 corn trait leads in late research or with late research potential. Our traits have now been licensed by all our major competitors, reflecting the strength of our technology.
In 2015, our breeding programs resulted in significant new launches in corn, soybean and rice, as well as new yield records for wheat and barley. In Vietnam, the first hybrid developed in Syngenta’s local rice breeding program was approved for sale.
We are currently working to translate the success of non-GM technology HYVIDO® hybrid barley into hybrid wheat, thereby revolutionizing the world’s largest crop. We have already demonstrated the yield performance of hybrids in wheat and see long-term sales potential of over $ 3 billion.
We expect to launch our first products around the end of the decade.
Productivity is risingWe are accelerating the pace of new product launches, while also increasing their value. Average sales per AI launch more than doubled from $ 0.2 billion in 2000–2004 to $ 0.5 billion in 2010–2014. Trait productivity is also increasing, with combined peak sales potential of $ 0.9 billion in 2010–2014, compared with just $ 0.1 billion in 2000–2004.
Integrating our breeding, traits and chemical innovation engines into a single R&D structure has allowed us to innovate at scale across crops and indications while enhancing collaboration and removing duplication of functions. In product safety and regulatory activities, outsourcing more than half our re-registration work has cut product safety cost per active ingredient to two-thirds of the industry average.
Our integrated technology approach enables us to combine genetics, chemistry and computational science to develop new AIs with precisely targeted modes of action. In seeds, our unified R&D platform allows us to take full advantage of our global presence and the broadest range of crops in the industry, applying our strengths in genomics, molecular markers and precision trialing to transfer technology across crops.
Partnerships with academic institutions and technology companies are key to the productivity and pace of our innovation. In November, Syngenta and DSM announced an R&D partnership to develop microbial-based agricultural solutions, including bio-controls, bio-pesticides and bio-stimulants. The collaboration aims to accelerate the delivery of a broad spectrum of products based on naturally occurring micro-organisms for pre- and post-harvest application around the world. The collaboration is underpinned by the potential of double-digit growth in the use of biological solutions over the next 10 years.
Hybrid wheat launch plan Syngenta wheat hybrids could cover 82 million hectares.
2020France, USA
2021India
2022Canada
2023Germany,
UK2024Poland
2025CIS
Technical proof of concept already achieved:
Yield performance of hybrids
Robustness of sterility system
Seed production capability
New traits pipeline
The industry’s next wave of new GM traits is some years out, but Syngenta has the platform and the capabilities to continue delivering leading trait innovation to the market.
New abiotic stress traitsR
elat
ive
pro
bab
ility
of l
aunc
h
Years
10 15 20
New traits
Next generation traits
Corn rootworm
Carbohydrate yieldin corn
Drought stress in corn
Herbicide tolerance
Sucking insects
New soybean rust
Size of circles represents relative sales potential
Broad Lepidoptera
Strateg
ic overview
Research and
D
evelop
ment
Syngenta Annual Review 2015 13
Cro
ps
in focu
sT
he Go
od
G
rowth P
lanO
peratio
nal p
erform
anceP
erform
ance d
ataC
orp
orate
inform
ation
Research and Development
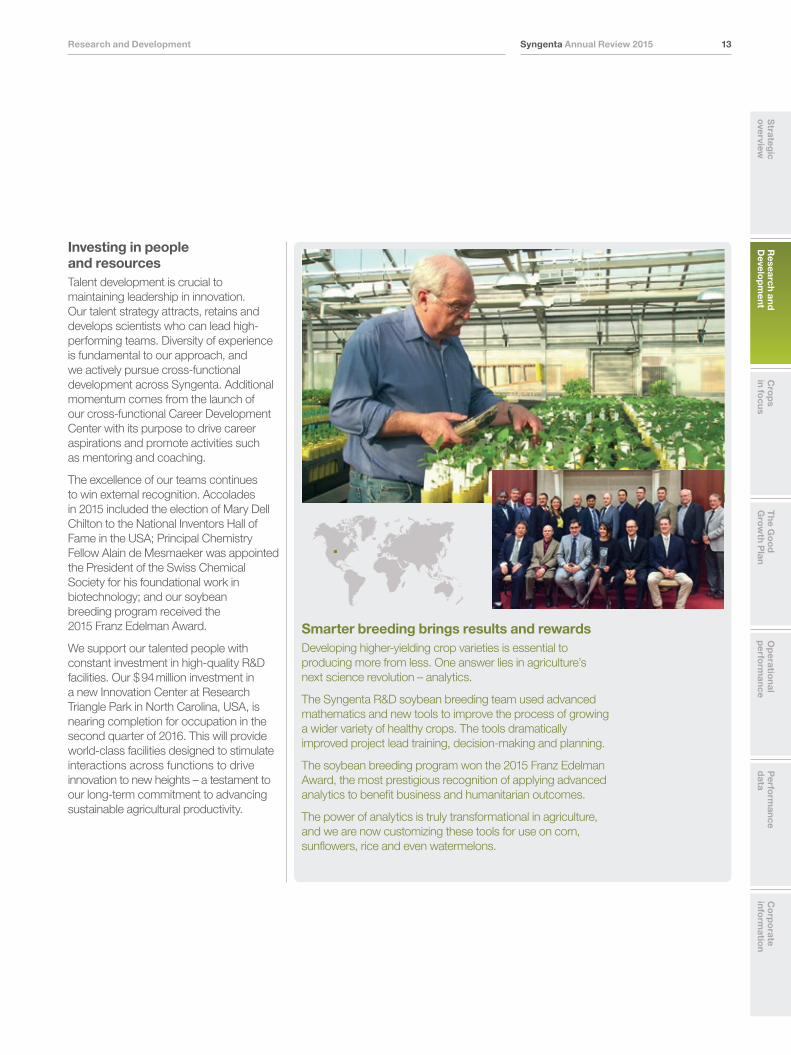
Investing in people and resourcesTalent development is crucial to maintaining leadership in innovation. Our talent strategy attracts, retains and develops scientists who can lead high-performing teams. Diversity of experience is fundamental to our approach, and we actively pursue cross-functional development across Syngenta. Additional momentum comes from the launch of our cross-functional Career Development Center with its purpose to drive career aspirations and promote activities such as mentoring and coaching.
The excellence of our teams continues to win external recognition. Accolades in 2015 included the election of Mary Dell Chilton to the National Inventors Hall of Fame in the USA; Principal Chemistry Fellow Alain de Mesmaeker was appointed the President of the Swiss Chemical Society for his foundational work in biotechnology; and our soybean breeding program received the 2015 Franz Edelman Award.
We support our talented people with constant investment in high-quality R&D facilities. Our $ 94 million investment in a new Innovation Center at Research Triangle Park in North Carolina, USA, is nearing completion for occupation in the second quarter of 2016. This will provide world-class facilities designed to stimulate interactions across functions to drive innovation to new heights – a testament to our long-term commitment to advancing sustainable agricultural productivity.
Smarter breeding brings results and rewardsDeveloping higher-yielding crop varieties is essential to producing more from less. One answer lies in agriculture’s next science revolution – analytics.
The Syngenta R&D soybean breeding team used advanced mathematics and new tools to improve the process of growing a wider variety of healthy crops. The tools dramatically improved project lead training, decision-making and planning.
The soybean breeding program won the 2015 Franz Edelman Award, the most prestigious recognition of applying advanced analytics to benefit business and humanitarian outcomes.
The power of analytics is truly transformational in agriculture, and we are now customizing these tools for use on corn, sunflowers, rice and even watermelons.

Seeing the world as growers see itOur aim is to transform the way crops are grown by looking at each crop through the eyes of the grower. We’ve integrated our business so that we can combine a broad range of technologies that will have the greatest impact on yields, quality and resource efficiency. No other company offers solutions for such a large number of crops.
Crops in focus
All crop sales in this section are based on Syngenta estimates.
14 Syngenta Annual Review 2015
Focus on returns supported by ongoing innovationFarmers are investors. Whatever the scale of their activities, they must weigh the amount they invest in inputs against the returns they can reap in terms of yield and quality.
In 2015, commodity prices remained soft for all major crops. Such conditions put product performance under even greater scrutiny: growers must be convinced that their investment in seeds and crop protection technology will be worthwhile, even at lower crop prices.
Innovation can bring competitive edge in challenging markets. Pest pressures, resistance and climate change present constantly evolving threats to farmers’ returns, and demand new solutions regardless of the crop price cycle.
By integrating seeds and chemistry into protocols, we can offer farmers simple and reliable ways to maximize performance. And we are transferring know-how across our broad crop portfolio: experience with GROMORE™ in rice, for example, has informed the development of similar offerings in soybean, potatoes, vegetables, cotton and sugar cane. Our expertise in hybridization has expanded the sunflower market and is now revolutionizing barley growing; we are making significant progress in rice and expect to launch wheat hybrids at the end of the decade.
Cereals
Sales $m
$1,686 m Crop Protection 1,553
Seeds 133
Current portfolio highlights
Leading seeds business: wheat, conventional and hybrid barley
Integrated growing systems, variety-specific protocols: optimizing yield and quality delivery
SDHI fungicide technology: SOLATENOL™, SEGURIS®/BONTIMA®, VIBRANCE®
Cereals is the world’s largest crop by acreage, grown in over 120 countries worldwide thanks to its exceptional agronomic versatility. Wheat is also the world’s largest food crop.
With leading positions in crop protection, seed treatment and seeds, we are uniquely placed to offer compelling solutions to growers’ challenges. We have taken a lead in helping growers meet the specific needs of their various customers including food companies, pasta makers, brewers and maltsters. Our integrated solutions – combining seeds with crop protection and agronomic protocols – enable growers to raise both their yields and quality.
Cereals present major opportunities for technification. Syngenta has made substantial investments that have placed us at the forefront of the technology drive, and we are already beginning to reap the benefits. Our hybrid-seed technology is revolutionizing barley farming and is set to do the same for wheat – a much larger opportunity – in the 2020s.
Cro
ps
in focu
s S
trategic
overview
Syngenta Annual Review 2015 15
Research and
D
evelop
ment
The G
oo
d
Grow
th Plan
Op
erational
perfo
rmance
Perfo
rmance
data
Co
rpo
rate info
rmatio
n
Crops in focus
The cereals market was not an easy one in 2015, as softening commodity prices made premium products harder to sell. Despite these conditions, we built on our crop protection success in 2014, increasing share in most markets. This reflects the strength of our portfolio: with both traditional and new technologies, we offer an unrivaled breadth of solutions across all geographies, notably in the area of resistance management.
Towards the end of the year, we received registration for our breakthrough SDHI fungicide SOLATENOL™ for wheat in the USA. This new chemistry has already shown major success against soybean rust in Latin America. The US registration came too late to affect 2015 sales significantly, but will be a major driver in 2016.
Increasing our leadership in wheatThe German and Italian seed businesses acquired in 2014 have reinforced our global leadership in conventional wheat. They have expanded our industry-leading germplasm portfolio and strengthened the opportunities open to us as we transfer our hybridization technology from barley to wheat.
We are currently developing wheat hybrids adapted to the highest-value markets, and made encouraging progress in 2015 after successfully completing technical proof of concept in late 2014. Having tackled the technological aspects, we expect to launch hybrid wheat around the end of this decade.
Profiting from innovation in barleyMeanwhile, HYVIDO® has positioned us at the forefront of driving hybrid barley adoption. In 2015, in a market facing the lowest commodity prices for a decade, we increased European acreage of this premium product by 20 percent. With 2015 launches in Italy, Serbia, Hungary, Bulgaria and Romania, HYVIDO® is rapidly replacing older technologies, with a strong pull-through of our complementary crop protection products. As the expansion of HYVIDO® continues, we are also increasing profitability by developing new hybrids that cost less to produce and by outsourcing hybrid supply.
In France, the ongoing introduction of new hybrids has added to the attraction of the offer: 40 percent of our 2015 sales were for products launched that year. Backing HYVIDO® with our Cashback Yield Guarantee makes the choice very attractive for farmers, and planted acreage doubled from 25,000 hectares in 2014 to 50,000 hectares in 2015. We are targeting a similar increase in 2016.
OutlookIn 2016, we expect continued progress. We will drive further cereals sales in the Americas and in Europe through our partnerships with the value chain, particularly in pasta and malting barley for beer. SOLATENOL™ will be launched in North America, where it has significant sales potential, and has just received a registration in Europe. VIBRANCE® – one of our fastest-growing Seedcare products in North America and Europe – will also benefit from new European registrations.
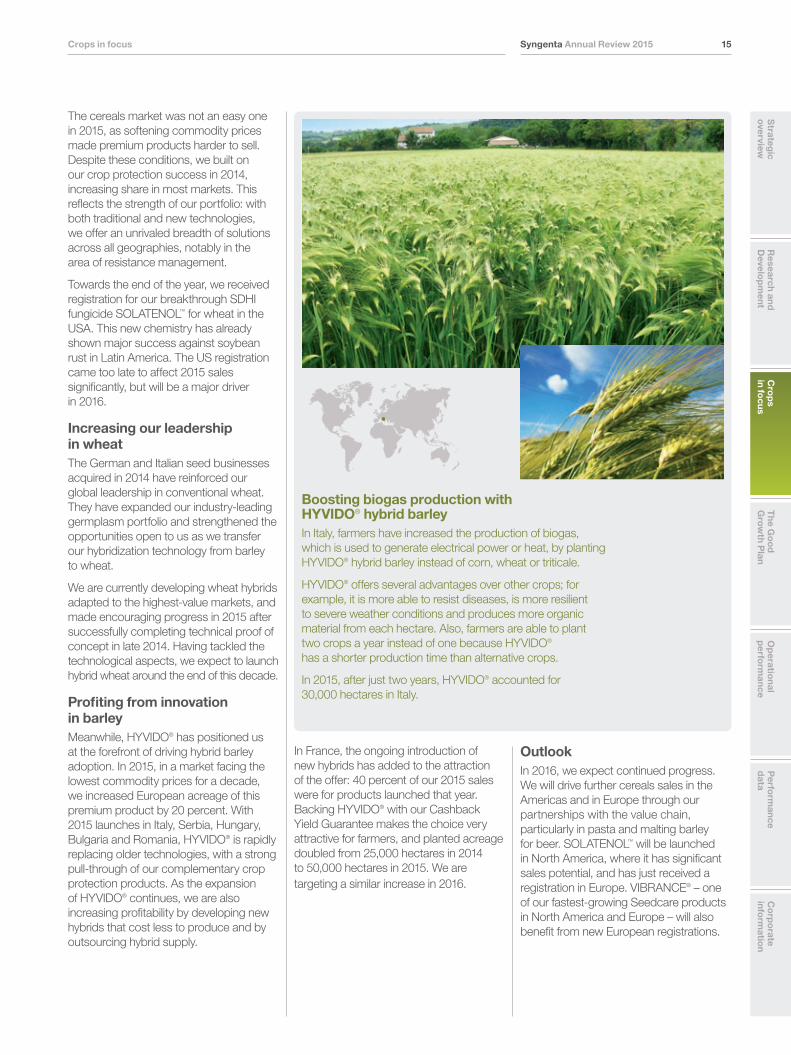
Boosting biogas production with HYVIDO® hybrid barleyIn Italy, farmers have increased the production of biogas, which is used to generate electrical power or heat, by planting HYVIDO® hybrid barley instead of corn, wheat or triticale.
HYVIDO® offers several advantages over other crops; for example, it is more able to resist diseases, is more resilient to severe weather conditions and produces more organic material from each hectare. Also, farmers are able to plant two crops a year instead of one because HYVIDO® has a shorter production time than alternative crops.
In 2015, after just two years, HYVIDO® accounted for 30,000 hectares in Italy.

16 Syngenta Annual Review 2015
Corn
Sales $m
$ 3,161m Crop Protection 1,988
Seeds 1,173
Current portfolio highlights
ACURON®: new herbicide for enhanced weed control
ENOGEN® corn offer
Water optimization native trait: AGRISURE ARTESIAN®
Integrated insect and weed resistance management solutions
Corn is Syngenta’s largest single crop. It is widely grown across the world – for food, animal feed and, in the USA, for bio-ethanol.
Corn growers in many areas face a variety of pest pressures and unpredictable weather conditions. Our technological leadership enables us to address these challenges with innovative and clearly differentiated solutions. Our strong proprietary trait platform is enabling us to expand our footprint and profitability in seeds, with increasing revenues coming from trait licensing as well as seed sales. In 2015, we announced a licensing agreement with KWS and Limagrain under which we provide the two companies and their joint ventures with worldwide rights to our GM corn traits portfolio. This collaboration follows on from licensing agreements with all other major corn seed companies.
Producing more with lessWe help growers to reduce their water needs. In 2014, North American growers planted 400,000 hectares of our AGRISURE ARTESIAN® hybrids – which provide season-long drought protection and also provide high yields in normal
conditions. Although there were no widespread corn drought events in 2014, high grower satisfaction resulted in a 50 percent uplift to 600,000 hectares planted in 2015.
In the biofuels market, corn with our ENOGEN® trait makes bio-ethanol production substantially more efficient. As well as producing more fuel from a given amount of crop input, it can cut a typical bio-ethanol plant’s water use by around 1.7 million liters a year. In 2015, ENOGEN® acres more than doubled compared to 2014. Contracted production plants currently have a combined annual capacity of over 4.75 billion liters of ENOGEN®-based ethanol.
Our CELLERATE™ process, co-developed with Cellulosic Ethanol Technologies, enhances production yields by producing ethanol from waste corn kernel fibers. The first plant fitted with this technology reached production scale in 2015. It has demonstrated potential to increase production from existing plants by a further 6 percent – or an extra 7.7 billion liters of fuel annually – on top of ENOGEN®-based yield improvements.
Water efficiency is a cost issue as well as an environmental one: irrigation can cost US farmers $ 550 a hectare. Our response is Water+ Intelligent Irrigation, an integrated approach that cuts water inputs by combining AGRISURE ARTESIAN®
GM corn tackles pests, weeds and weatherGrowing corn in Vietnam is challenging due to the Asian corn borer – the most damaging corn pest in Asia – weeds and adverse weather. Syngenta is helping farmers overcome these issues with genetically modified (GM) corn. It is the first GM crop to be approved and grown in Vietnam.
The double-stack corn variety – which is herbicide tolerant and insect resistant – improves productivity and crop quality. Farmers receive a better return on investment, and Vietnam’s dependence on corn imports is reduced.
The introduction of GM corn in 2015 supports Syngenta’s market leadership in Vietnam and is another step towards meeting the global demand for food, feed, fiber and biofuels.

Cro
ps
in focu
s S
trategic
overview
Syngenta Annual Review 2015 17
Research and
D
evelop
ment
The G
oo
d
Grow
th Plan
Op
erational
perfo
rmance
Perfo
rmance
data
Co
rpo
rate info
rmatio
n
Crops in focus
Diverse field crops
Sales $m
$1,105m Crop Protection 593
Seeds 512
Current portfolio highlights
High-value hybrids: NK®, SYNGENTA®, SPS®, MARIBO®, HILLESHÖG®
Integrated sunflower weed control system: native trait, LISTEGO®, CAPTORA®
Enhanced root health: VIBRANCE®
Diverse field crops – principally consisting of sunflower, oilseed rape and sugar beet – are attractive crops offering generally robust margins. Demand is driven by a wide range of markets: vegetable oils and sugars, animal feed, industrial applications and biofuel production. Productivity varies widely, offering ample scope for growth through technology intensification.
SunflowerSyngenta is the market leader in sunflowers. In our largest markets, Russia and Ukraine, 2015 revenues were impacted by adverse exchange rates and soft commodity prices. We were, however, able to maintain profitability through price increases.
with agronomic protocols and irrigation equipment developed with Lindsay Corporation. In 2015, the number of hectares enrolled was up 70 percent – with growers earning a return on investment of around $ 230 per hectare.
Combating weed and insect resistanceResistant weeds and insects are eroding the effectiveness of conventional crop protection practices and products. This provides increasing opportunity for our strong technology portfolio and solutions with multiple modes of action.
In 2015, our breakthrough herbicide ACURON® received approval by the US Environmental Protection Agency. Combining a new chemical, bicyclopyrone, with three other active ingredients, it controls a wider range of weeds than any existing selective herbicide used in corn and will be critical in making corn production more sustainable. Though approval came towards the end of the planting season, 200,000 hectares were treated in 2015; global sales are forecast to reach $ 500 million by 2020.
Sales of our insect control traits are expanding, boosted by China’s approval of AGRISURE VIPTERA® corn for import. Insect resistance is a particular issue in the tropical conditions of Latin America, where AGRISURE VIPTERA® is the only trait without resistance issues and the only effective response to a critical challenge, fall armyworm. In North America, our AGRISURE DURACADE® trait and FORCE® insecticide are key tools for farmers combating corn rootworm pests.
Profiting from technology leadershipIn the year ahead, sales and profit growth will be powered by our unique technologies – particularly ENOGEN®, AGRISURE ARTESIAN® and ACURON®. We also expect further progress in Asia Pacific: we are spearheading trait expansion in Vietnam, where we are already market leader and have received approval for a trait that controls Asian corn borer, a significant corn pest in ASEAN countries.
Globally, we have 30 percent market share of planted sunflower acreage but 38 percent of crop value due to the high value and performance of our hybrids. Portfolio rejuvenation is a key part of our strategy, and between 2015 and 2016 we will have replaced a third of our seeds portfolio as we introduce new next-generation herbicide-tolerant varieties as well as high-oleic varieties that meet market needs.
Herbicide tolerance is a cost-effective way to improve yield, particularly in combination with our leading herbicides for broomrape control: LISTEGO® and CAPTORA®. Our integrated offer is the only successful solution for broomrape, which can destroy a crop entirely. It will spearhead our drive for growth across the market in 2016.
Oilseed rapeWe achieved ambitious crop protection sales targets in our key European markets. Seeds sales grew strongly as the market trend towards hybridization continued. We successfully integrated the German and Polish winter oilseed rape breeding operations acquired in 2014.
European farmers continue to face crop damage resulting from the EU’s temporary suspension of neonicotinoid seed treatment, which prevents use of the insecticide CRUISER®. No current alternatives are as effective as CRUISER®, but our contingency plans for replacement, as well as our continuing work on renewing our insecticide portfolio, are resulting in important new products for both the short and longer term.
In the Canadian canola seed market, our integrated whole-farm approach – seed, crop protection and rotation with cereal crops – is delivering good results, and further growth is expected in 2016.

18 Syngenta Annual Review 2015
Rice
Sales $m
$ 588 m Crop Protection 575
Seeds 13
Current portfolio highlights
GROMORE™: integrated rice protocols
New crop protection products: CHESS® and VOLIAM TARGO®
Leading native trait for bacterial leaf blight
Rice is a staple for more than 2 billion people, providing livelihoods for almost a billion growers and workers in the value chain. Our activities in Rice are focused on Asia Pacific, where 125 million hectares of rice are grown: around 27 percent of Syngenta’s Asian revenues come from our Rice business.
Crop productivity varies considerably – Asia’s most technified markets average around 6–7 tonnes per hectare, roughly double the yields achieved by less developed countries. But current improvements in productivity are not keeping pace with demand and resources are under pressure – the supply of water for this water-intensive crop is diminishing, and urbanization and industrialization are reducing the availability of land and labor.
Sugar beetA global oversupply of sugar caused reductions in sugar beet acreage in 2015, although in Russia poor weather conditions resulted in many farmers replanting. Business performance was disappointing and we are currently focusing on driving improved profitability.
We are working with European farmers to prepare for the elimination of EU sugar quotas in 2017, which will intensify competition from imported cane sugar. We expect sugar beet’s share of the world sugar market to remain stable as European companies strive to improve their sugar production cost efficiency. Although the changes will be challenging for smaller players, they will bring new export opportunities for the biggest processors – who are becoming more demanding customers as a result. There is already growing pressure in the market for higher quality produce at competitive prices.
Building a differentiated offerIn most of our key markets, we are the leaders in crop protection, with a consistent record of growth. In recent years, we have become more active in seeds, with emphasis on hybrid seeds and technologies offering substantial productivity increases – particularly for the low-tech farmers who grow most of the world’s rice. This effort has gathered momentum since the 2012 acquisition of Devgen’s two-line hybrid technology and broad germplasm portfolio. Hybrids represent a significant market opportunity, as their penetration outside China is less than 5 percent.
We have three strategic aims: maximizing the potential of our crop protection portfolio; building a profitable seeds business; and building a differentiated offer around labor saving and convenience. Underpinning all these is the GROMORE™ program, which integrates seeds and crop protection protocols to deliver major advances in productivity, reliability and quality. GROMORE™ has now reached over a million growers across Asia Pacific, consistently raising yields by up to 30 percent.
Reaching smallholders more efficientlyA focus on smallholders is central to our strategy. The challenge is one of scale: Asia Pacific has over 300 million smallholder rice farmers, so we need an efficient way to reach them, generate demand and service them while keeping close track of effectiveness and profitability. Having developed GROMORE™ as a proven and scalable agronomic solution, we have now established an efficient industrialized platform for smallholders that will be piloted in Thailand in early 2016.

Cro
ps
in focu
s S
trategic
overview
Syngenta Annual Review 2015 19
Research and
D
evelop
ment
The G
oo
d
Grow
th Plan
Op
erational
perfo
rmance
Perfo
rmance
data
Co
rpo
rate info
rmatio
n
Crops in focus
Falling market prices for rice, and adverse weather in South Asia and ASEAN, had an adverse effect on crop protection sales in 2015. But successful product introductions included CHESS® and VOLIAM TARGO®, which performed particularly well in South Asia and China.
Building our position in hybridsIn seeds, we are progressing with work on the Devgen two-line hybrid technology platform. We anticipate market launch of our first two-line products in 2018 in the Philippines. Meanwhile, we have registered our first locally-developed hybrid in the important Vietnamese market.
We have been building capability in our R&D and production organizations to support future growth, while rationalizing our existing seeds portfolio to raise average margins.
We have discontinued the TEGRA® mechanized offer, which was not realizing sufficient levels of profitability; however, we will continue to work on the related technology, leveraging our experience in the GROMORE™ protocols.
In 2016, we will be expanding the smallholder approach to drive GROMORE™ sales in many more smallholder rice markets, while building on the success of our recent crop protection launches.
Overcoming natural threats to riceRice faces not only pests and disease, but also abiotic stress such as heat and cold. This affects growers in terms of yield, time and ultimately their livelihood.
With ISABION®, a biostimulant, rice can better withstand abiotic stress. By enhancing the plant’s nutrient uptake, ISABION® mitigates the impact of heat or cold and delivers superior yield under stress conditions. This is particularly important in light of climate change.
In trials across Asia, rice seedlings treated with ISABION® were more vigorous and yielded up to 10–15 percent more than untreated plants. ISABION® is available in Asia including China and India. New offerings in more countries and for other crops will follow.
ISABION® Untreated
20 Syngenta Annual Review 2015
Soybean
Sales $m
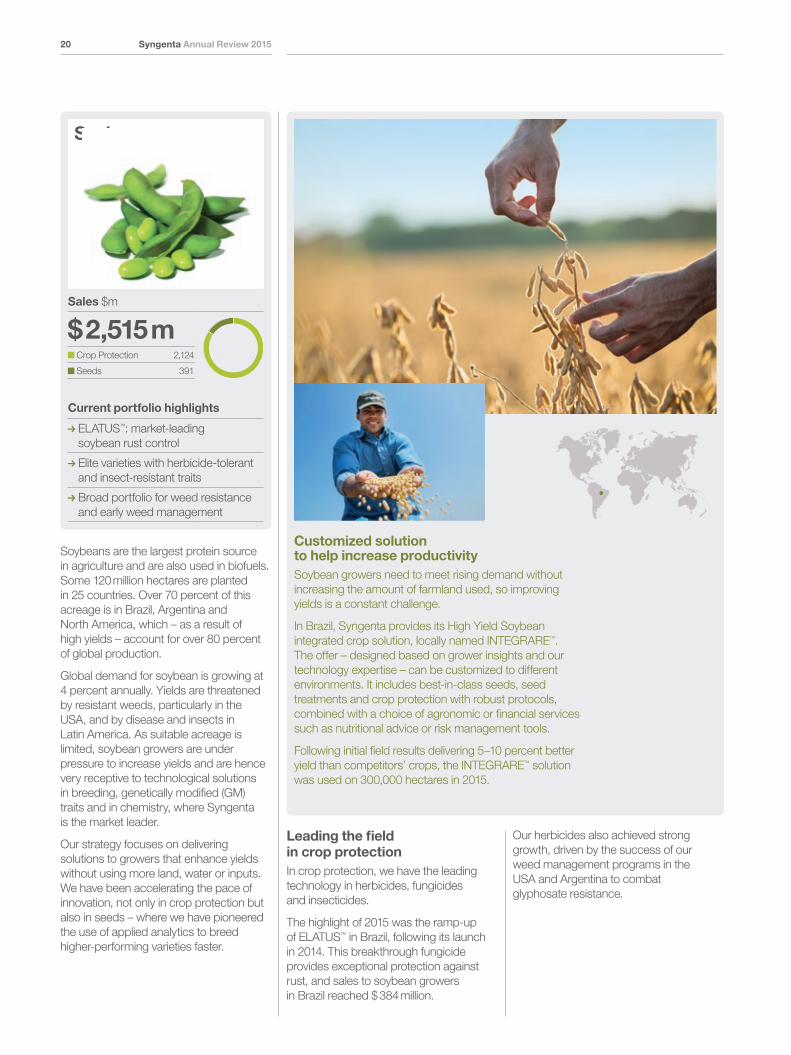
$ 2,515 m Crop Protection 2,124
Seeds 391
Current portfolio highlights
ELATUS™: market-leading soybean rust control
Elite varieties with herbicide-tolerant and insect-resistant traits
Broad portfolio for weed resistance and early weed management
Soybeans are the largest protein source in agriculture and are also used in biofuels. Some 120 million hectares are planted in 25 countries. Over 70 percent of this acreage is in Brazil, Argentina and North America, which – as a result of high yields – account for over 80 percent of global production.
Global demand for soybean is growing at 4 percent annually. Yields are threatened by resistant weeds, particularly in the USA, and by disease and insects in Latin America. As suitable acreage is limited, soybean growers are under pressure to increase yields and are hence very receptive to technological solutions in breeding, genetically modified (GM) traits and in chemistry, where Syngenta is the market leader.
Our strategy focuses on delivering solutions to growers that enhance yields without using more land, water or inputs. We have been accelerating the pace of innovation, not only in crop protection but also in seeds – where we have pioneered the use of applied analytics to breed higher-performing varieties faster.
Leading the field in crop protectionIn crop protection, we have the leading technology in herbicides, fungicides and insecticides.
The highlight of 2015 was the ramp-up of ELATUS™ in Brazil, following its launch in 2014. This breakthrough fungicide provides exceptional protection against rust, and sales to soybean growers in Brazil reached $ 384 million.
Our herbicides also achieved strong growth, driven by the success of our weed management programs in the USA and Argentina to combat glyphosate resistance.
Customized solution to help increase productivitySoybean growers need to meet rising demand without increasing the amount of farmland used, so improving yields is a constant challenge.
In Brazil, Syngenta provides its High Yield Soybean integrated crop solution, locally named INTEGRARE™. The offer – designed based on grower insights and our technology expertise – can be customized to different environments. It includes best-in-class seeds, seed treatments and crop protection with robust protocols, combined with a choice of agronomic or financial services such as nutritional advice or risk management tools.
Following initial field results delivering 5–10 percent better yield than competitors’ crops, the INTEGRARE™ solution was used on 300,000 hectares in 2015.

Cro
ps
in focu
s S
trategic
overview
Syngenta Annual Review 2015 21
Research and
D
evelop
ment
The G
oo
d
Grow
th Plan
Op
erational
perfo
rmance
Perfo
rmance
data
Co
rpo
rate info
rmatio
n
Crops in focus
Specialty crops
Sales $ m
$1,882 m Crop Protection 1,882
Seeds 0
Current portfolio highlights
Broad crop protection technology footprint and breadth
Recent launches: ELATUS™, REFLECT®, DYNALI®, AMPLIGO®, DURIVO®, VIBRANCE®
Commercial ramp-up of sustainability-based solutions
Our Specialty crops business is focused on crop protection in more than 40 high-value crops around the world. It holds strong positions in many markets, with around 80 percent of sales coming from four principal Specialty crop groups: potatoes, cotton, fruits and plantation crops.
Specialty crop growers often have limited access to new technology, as individually their markets are too small to justify substantial research and development investment. We bring Syngenta’s broad portfolio of crop protection technology to these smaller market sectors by assessing new active ingredients for their applicability to specialty crops. Where necessary, we then introduce new formulations or make the best use of existing solutions.
Raising profitability through efficiency, partnerships and innovationIn soybean seeds, our emphasis in 2015 was on increasing profitability. Building on our excellent germplasm portfolio, our use of applied analytics has further enhanced our ability to develop differentiated, high-yielding varieties that complement our crop protection technology.
The rapid introduction of new traited varieties in our Brazil portfolio was supported by a new partnership model, which has multipliers in the market, as well as by a focus on efficiency within the Accelerating Operational Leverage program.
An integrated strategy for growthWe are uniquely placed to help growers increase their yields sustainably, and our integrated crop strategy in soybean builds on the broadest portfolio in the industry. We developed our High Yield Soybean solution in close collaboration with our customers, looking at their specific needs for each crop stage and providing them with a complete offer to increase yield and provide assurance of return on investment.
This solution combines our best-in-class portfolio – seeds, seed treatment and crop protection – and customized protocols with agronomic support such as nutrition advice and financial services including risk management. Tailored for each territory, it was first launched in Brazil as INTEGRARE™, with 300,000 hectares planted in 2015. It is now being expanded in the USA under the AGRIEDGE® umbrella with 150,000 hectares planted in 2015, and being piloted in Argentina as INTEGRASOJA™.
Looking aheadIn 2016, we expect to extend our crop protection leadership as we drive SOLATENOL™ sales in Latin and North America and launch a further SDHI fungicide, based on the new active ingredient ADEPIDYN™, in Argentina. We will continue to enhance seed profitability as we introduce new traited varieties in our portfolio, and will further extend our High Yield Soybean solution.
In 2015, we achieved more than 270 new use registrations in Specialty crops. These included applications for our chlorantraniliprole-based insecticide mixtures – DURIVO®, AMPLIGO® and VOLIAM TARGO® – across Europe. We anticipate a particularly strong grower response to the launch in 2016 of our new high-performance fungicide, ORONDIS™, which achieved US registration in late 2015.
We also enhance existing products. In 2015, we gained first registration for an innovative new formulation of our emamectin insecticide. On fruit trees, potatoes and grapes, the new formula halves the application rate by using a sunscreen additive to reduce ultraviolet degradation of the active ingredient.
Potatoes: contributing to food security in ChinaOver the past three years of trial and commercial use, our Potato Healthy Tuber solution – combining quality seed potatoes, chemistry and growing protocols – has helped Chinese growers to increase yields by over 30 percent and earn a 3:1 return on their investment. In 2016, we plan further enhancements in partnership with other leading suppliers in areas such as breeding and machinery.
Fruits: enhancing growers’ access to marketsChanging regulatory and food chain requirements make it increasingly difficult for fruit growers to access profitable markets for their produce. Our Fruit Quality Contract solution provides market access guidance backed by tailored crop protection protocols. In 2015, we tripled its coverage to 30,000 hectares. Current acreage is mainly in Europe, but we see potential in rapidly-growing export markets such as Chile and India. Growth will be boosted in 2016 by unique new digital applications offering faster and more precise market access recommendations.

22 Syngenta Annual Review 2015
Cotton: improving agronomic knowledge in IndiaOur integrated FAST START PERFORMANCE™ (FSP) program is gaining rapid acceptance among cotton growers in India, with participants up from 3,500 to more than 12,000 in 2015. FSP enhances growers’ agronomic knowledge, while its optimized chemistry and protocols support early crop establishment and ensure strong plant growth. Average yield increases of over 20 percent and improved fiber quality have raised growers’ profitability and satisfaction. We launched FSP to over 700 industry representatives in Australia for the 2015 season, in partnership with Cotton Seed Distributors. Trials will continue in 2016 to assess new seed treatment approaches.
Coffee: expanding NUCOFFEE®
In Brazil, we continue to grow our NUCOFFEE® program. This enhances growers’ profitability through agronomic protocols to improve productivity, combined with quality assurance to secure higher prices. In 2015, we expanded NUCOFFEE® to smaller farms in Brazil and introduced it to leading growers and cooperatives in Colombia. Further expansion will follow in 2016.
Helping growers access attractive marketsApple growers can face a challenge in exporting to some European countries. Supermarkets, especially in Germany, demand high-quality fruit with minimum pesticide residue levels that are even lower than European Union requirements.
Syngenta has responded with the Fruit Quality Contract (FQC). In 2015, we began working with seven grower groups in Poland. We provide growers with training and customized advice on crop protection using fast-degrading active ingredients. Residue levels are met, and growers gain access to attractive markets.
The goal for 2016 is to scale up to 3,000 hectares of apple orchards in Poland.

Cro
ps
in focu
s S
trategic
overview
Syngenta Annual Review 2015 23
Research and
D
evelop
ment
The G
oo
d
Grow
th Plan
Op
erational
perfo
rmance
Perfo
rmance
data
Co
rpo
rate info
rmatio
n
Crops in focus
Vegetables
Sales $ m
$1,540 m Crop Protection 924
Seeds 616
Current portfolio highlights
Innovative cyantraniliprole insecticide and seed treatment mixtures: sucking pests
Broad seeds portfolio with leading native traits: leafy and fruity vegetables, brassicas
Commercial ramp-up of MAXVEG™ integrated smallholder offer
Our global Vegetables business covers more than 30 species across five categories: peppers and tomatoes, melons and cucumbers, salad vegetables, brassicas and sweet corn. Across all these markets, there is an overall trend of rising expectations in terms of both quality and seasonal availability. We help growers meet the requirements of their customers – whether consumers, retailers or processors – while improving their productivity and sustainability.
Currently our major Vegetables markets are Europe and the USA, which continue to grow well. We are targeting future growth in Latin America, Africa and Asia Pacific and, in particular, see substantial potential in China and sub-Saharan Africa.
Sugar cane
Sales $ m
$ 271 m Crop Protection 271
Seeds 0
Current portfolio highlights
Unique chemical solutions for biotic stress: MODDUS®, CALLISTO®, ACTARA®
Integrated fields
Nursery solution: PLENE® PB
Demand for sugar cane continues to grow – to feed the world’s increasing appetite for sugar and also for use in biofuel production. More than 40 percent of the world’s sugar cane is now produced in Brazil, which has more than doubled its production in the past decade. Brazil is therefore our largest single market for sugar cane.
In comparison to other field crops, relatively few technologies are available for sugar cane, signifying considerable scope for intensification. Yields currently average 75 tonnes per hectare, but could potentially be raised to several hundred tonnes. Until recently, cultivation methods remained highly traditional, with pest control achieved largely by pre-harvest crop burning. Now many countries are phasing out crop burning – the practice will soon be banned throughout Brazil – and harvesting is becoming increasingly mechanized. These trends are driving greater demand for herbicides, insecticides and fungicides.
Revolutionizing sugar cane cultivationIn order to raise vigor and yields, we have been developing new crop protection protocols while pursuing our work on breeding. We are producing high-quality seedlings under the PLENE® brand at our Itápolis biofactory in Brazil. Branded PLENE® PB, these pre-germinated plants are used by sugar mills and growers to plant their nurseries and to fill the gaps found in fields after crop establishment or after harvesting, with the aim of recovering the full yield potential of the fields. PLENE® PB was introduced on 380 hectares in 2014 and planted on 2,500 hectares in 2015.
Meanwhile, we are making further progress towards the launch in 2017 of the full PLENE® program, incorporating a system of direct mechanized planting. This system is being developed through a licensing agreement for CEEDS™ (Crop Expansion Encapsulation and Drilling Systems), a technology allowing growers to plant small encapsulated seedlings instead of large pieces of cut sugar cane. This increases the number of hectares that can be planted in a day, enabling mills and growers to further improve yields and quality by planting only in optimal weather conditions. In 2016, we will run the first demonstration plots with customers.
We are also harnessing our experience in genetically modified traits for soybean and corn to develop new sugar cane varieties as part of integrated solutions against insects and herbicide resistance.
Rationalizing to enhance profitabilityIn 2015, we rationalized our crop protection portfolio but increased profitability. We moved away from some high-volume but low-margin products, to focus on fungicides and insecticides where our products are clearly differentiated from the competition. The launch of AMPLIGO® for borers and other insects was well received and sales have been growing rapidly.

24 Syngenta Annual Review 2015
Bringing big crop solutions to smaller cropsAs is the case for specialty crops, vegetable growers can miss out on new technology as their separate crops cannot justify substantial investment in R&D. To give growers access to Syngenta’s broad portfolio of crop protection technology, we evaluate new active ingredients under development for larger crops to identify suitable applications for vegetables. We then introduce new formulations that bring vegetable growers the benefits of the latest chemistry, or ensure that they can make best use of products formulated for other crops.
This cost-effective approach has made us a top-three player in all five of our Vegetable categories, maximizing the value of our innovation.
We achieved more than 400 new use registrations in Vegetables in 2015. These included a range of vegetable applications in Europe for our insecticide mixtures DURIVO®, AMPLIGO® and VOLIAM TARGO®.
In 2015, we received first registration for an innovative new formulation of our emamectin insecticide, which halves the application rate by reducing ultraviolet degradation of the active ingredient.
Lawn and Garden
Sales $ m
$ 648 m Crop Protection 455
Seeds 193
Our Lawn and Garden business provides industry-leading chemistry for professional turf and landscape markets such as golf courses, and for industrial pest management. It also includes Syngenta Flowers, a market leader in mass market and value-added plants which develops innovative solutions for seasoned and hobby gardeners alike. Our high-value chemistry solutions, flower offerings and retail partnerships help to enrich lives and make living environments inspiring and healthy.
Lawn and Garden achieved a strong financial performance in 2015. We drove growth by launching new products, increasing market penetration, broadening our reach in new and established markets and expanding our flower retail programs. And, although we faced some market headwinds, we mitigated risks by prioritizing investments and controlling costs.
Bringing technology benefits to smallholdersSmallholders are increasingly important to us as we expand our reach in emerging markets. We aim to boost their profitability by making technology more accessible. Our MAXVEG™ platform integrates modern chemistry and agronomy to maximize marketable yields through safe, effective use of crop protection – consistently raising productivity by more than 20 percent.
In 2015, we expanded MAXVEG™ throughout India and China. Reaching vast numbers of smallholders, particularly in Asia, is a challenge we also face in rice. We are drawing on our experience of the GROMORE™ rice program for the mass marketing and delivery of MAXVEG™ across a wide range of vegetables.
Innovating in Vegetables Seeds, growing crop protectionOur Vegetables Seeds business is high margin with a significant global footprint and a wide array of class-leading varieties. It has an excellent record of innovation and introduced 180 new varieties in 2015.
In our crop protection business, we can leverage technology from other parts of the business. Our product pipeline remains very strong, and in 2016 we will benefit from the US launch of our new high-performance fungicide, ORONDIS™.

Cro
ps
in focu
s S
trategic
overview
Syngenta Annual Review 2015 25
Research and
D
evelop
ment
The G
oo
d
Grow
th Plan
Op
erational
perfo
rmance
Perfo
rmance
data
Co
rpo
rate info
rmatio
n
Crops in focus
Innovations drive market share growthIn our key North American turf and ornamentals market, we gained market share through new product launches including APPEAR®, HERITAGE ACTION™, MAINSPRING®, SECURE® and VELISTA®. These offer customers value by increasing productivity and sustainability – and, in turf applications, playability.
Our professional pest management business has expanded mainly in North America, following successful integration of the DuPont professional insecticides portfolio acquired in 2012. Numerous registrations currently pending will enable us to introduce this innovative chemistry portfolio in all of our other regions. The potential was demonstrated in 2015 by the excellent take-up of ACTELLIC® CS300, which we launched into many African countries. This encapsulated insecticide provides long-lasting control against malarial mosquitoes resistant to pyrethroids.
We also made promising progress in new tree care technologies – including micro-injection to control pests in trees in France. This is a highly profitable business where we are strongly positioned for growth through our combination of high-value chemistry and product innovation based on deep understanding of customer needs.
Flowers offer pleases retailersOur premium flowers business is based on industry-leading innovation, high-quality genetics and an efficient distribution network. A strong performance in 2015 resulted from increased profitability in the mass market plants business, successful reorganization of the Europe-based FLORIPRO SERVICES® and an improved seeds forecasting process. Our flowers retail programs showed continued success during the crucial spring period, setting new value-added price points while boosting profitability for our retail and channel partners. We also made significant progress in attaining GLOBALG.A.P. and GRASP certification for our flowers farms.
Controlling multiple turf diseasesThe fungicide VELISTA® successfully controls multiple diseases affecting turf through the innovative SDHI mode of action. It is a valuable addition to our portfolio, and can be used in rotation with other fungicides to help manage the resistance of turf grass to other treatments.
Syngenta’s formulation department was quickly able to develop the newly-acquired active ingredient, penthiopyrad, into a product that met the quality and efficacy required by the company and its customers.
VELISTA® has been well accepted by customers in the important golf sector, and sales have outstripped expectations.

26 Syngenta Annual Review 2015
Securing a sustainable futureThe challenge of feeding a fast-growing world population is well documented. As a business that serves the agricultural industry, helping farmers rise to that challenge is part of our mission. It’s central to our strategy for business growth.
The Good Growth Plan goes further: it’s our commitment to help farmers meet the challenge sustainably. That’s central to our strategy for ensuring that our own business has a sustainable long-term future. This is far-sighted business planning with hard, stretch targets. We’re consciously setting our sights higher – and measuring and reporting the impact.
The Good Growth Plan
Across our six commitments, we are establishing a growing body of productive partnerships. We are maximizing the value of what we learn by leveraging knowledge across projects, partners, territories and crops.
Supporting the UN’s Sustainable Development GoalsIn 2015, the United Nations (UN) announced 17 Sustainable Development Goals (SDGs) that member states will be expected to use to frame their agendas and political policies over the 15 years from January 2016.
We welcome these goals, and believe they will help to mobilize the action and innovation needed to make a better and more sustainable world. To achieve them, member states will need to build multi-stakeholder partnerships, address governance challenges, and invest in new technologies and business models. They will need better data for monitoring and accountability, made openly accessible to accelerate sustainable innovation and technological advancement. With The Good Growth Plan, we believe Syngenta has already begun to make its contribution.
For more on the UN’s SDGs, visit: sustainabledevelopment.un.org/topics
See detailed performance data for The Good Growth Plan on pages 57–58
The Good Growth Plan is an integral part of our business strategy. Its six commitments focus our skills and resources on understanding and meeting the most pressing needs of our customers and stakeholders. It demands innovation and enterprise from every part of our organization.
The Plan considers: the resource efficiency that must underpin current productivity; the ecosystem resilience necessary to sustain future productivity; and the knowledge transfer needed to support and strengthen rural communities. It pays particular attention to smallholders, because they have the greatest potential to increase farm productivity.
As part of our business strategy, it sets targets that are quantified, measurable and ambitious. While we cannot be certain that we will achieve them all by the 2020 target date, we do know that we will not achieve them on our own. Working in partnership with others – farmers, academic institutions, NGOs, governments and other organizations – is an essential part of the Plan. To foster collaboration, we are publishing our targets and results transparently, and sharing data openly so that all interested parties can build on what we learn.
Two years into The Good Growth Plan, more than 3,600 farmers and many organizations are working with us to demonstrate and measure what is possible for 21 crops, the environment and the people in 42 countries. We are gathering increasingly reliable data, independently collected and validated, and publishing it in accordance with best practice – using open data formats to be as transparent, accountable and useful as possible.

Op
erational
perfo
rmance
The G
oo
d
Grow
th Plan
Strateg
ic overview
Syngenta Annual Review 2015 27
Research and
D
evelop
ment
Cro
ps
in focu
sP
erform
ance d
ataC
orp
orate
inform
ation
The Good Growth Plan
Make crops more efficientIncrease the average productivity of the world’s major crops by 20 percent without using more land, water or inputs
2020
2015
2014
20%
2%2
0%
Average productivity increase1
2%
1 On reference farms compared to baseline 2014
No. of Reference farms
No. of Benchmark farms
860
2,738
1,062
2,586
Farm network
2015 2014
Progress and key achievements
Improved statistical precision by increasing the number of reference farms
Shared results with farmers, researchers and those seeking to understand how best to save scarce resources
Collaborating to harmonize data exchange standards to accelerate innovation in agriculture
Feeding a fast-growing world population, while mitigating the impacts of climate change, requires a step change in farm productivity and resource efficiency. We are working with farmers to help them grow more from less – focusing particularly on smallholders, who have the greatest potential to increase productivity.
Syngenta at the forefront of open data in agricultureTo test and measure what’s possible, we have created a network of reference farms across crops and regions in our key markets. These farmers are working with our field experts to trial new solutions and raise productivity. In 2014, we established 860 of these farms, and signed-up additional benchmark farms for comparison.
In 2015, the network covered more than 1,000 reference farms and just under 2,600 benchmark farms. In some areas, such as China and parts of Latin America, we’ve doubled the number of reference farms to gain better insights.
Our crop advisers have been working with reference farmers to optimize the way they use new products coming out of our R&D pipeline and to provide feedback data for our technical teams. We share performance reports with reference and benchmark farmers, so that they can compare results with their peers and identify opportunities for improving efficiency.
We are now gathering an abundance of real-world farm data for 21 crops in 42 countries. For 2015, the global average productivity increase on reference farms was 2 percent.
The unique and unprecedented data resource of The Good Growth Plan will help us to understand what makes crops and protocols more efficient. To turn the data into knowledge and insight, we’re actively sharing data with growers, academics and governments to unlock the benefits as quickly as possible.
Higher quality wheat for better pasta productionProducing high-quality pasta begins with growing top-quality durum wheat, which has consistently high protein content. In Italy, we are helping growers produce more, top-quality durum wheat through the value chain project “Grano Armando”, guaranteeing them a higher, more reliable income.
More than 1,000 growers benefit from a sustainable cultivation protocol, quality seeds and farmer support. The growers also join a network that connects them with pasta manufacturers in Italy.
Yields are 15 percent higher than average, and the protein content of the wheat is 14 percent, as opposed to the Italian average of 12 percent.

28 Syngenta Annual Review 2015
Rescue more farmlandImprove the fertility of 10 million hectares of farmland on the brink of degradation
2020
2015
2014
10.0
2.4
0.8
Impacted farmland m ha1
2.4m1.6
1 Cumulative since baseline 2014
Progress and key achievements
Embedded soil protocols in our commercial offers
Consulted multiple stakeholders to inform our program
Engaged decision makers on soil policy, in partnership with UNCCD
Agriculture relies on healthy and fertile soil. But a third of the world’s arable land is thought to have been affected by degradation and desertification.
We are raising awareness of this issue and promoting conservation practices based on minimum soil disturbance, crop rotation and permanent ground cover. These are aimed at preventing, halting and reversing land degradation by contributing to organic carbon storage, water retention and soil biological activity.
And to increase the speed of innovation and knowledge transfer, we’ve been collaborating with the Open Data Institute (ODI) and have published our aggregated baseline and progress data for anyone to access online and use free of charge.
This puts us at the forefront of open data in agriculture, enabling us to reach people and communities with ideas and solutions, quickly and cost-effectively. It opens our data to scrutiny, helping to ensure that it’s collected and used with rigor. And it’s a two-way flow: we should be able to link our farm data with other agricultural data on open-access collaborative platforms.
As part of this effort we have joined Global Open Data for Agriculture and Nutrition (GODAN), a consortium of companies, governments and NGOs working to make agricultural data accessible and usable worldwide. We want to work with GODAN to use open data better, so that we help to create insights on what works best on the farm to optimize the use of scarce resources.
What next?We’re working to improve the way we share The Good Growth Plan data with growers, empowering them to make positive changes by highlighting best practices linked to efficiency results. While continuing our collaboration with the ODI, we look forward to supporting GODAN with the harmonization of agricultural data exchange standards that are accessible to all. And we’re aiming to build a community around our data by developing tools and platforms that make it easier to use.
Demonstrating the benefits of soil conservationThis work is about changing perspectives: land’s economic value is chronically understated. Land has long been valued solely for its current productivity, while often disregarding ecosystem resilience and future productivity. But it is also about meeting clear grower expectations.
We continue to build our best soil knowledge and tools – diagnostics, management practices and technologies – into our commercial offers. But achieving the desired benefits of soil conservation depends on many other tools and services at farm level. That’s why we support the creation of inclusive platforms where multiple stakeholders – including those representing machinery, financial solutions and educational opportunities – join forces to offer farmers a compelling soil conservation proposition. We have piloted this approach for smallholders in Mexico, medium-sized growers in Hungary and large-scale farmers in Russia.
At the same time, we have run smaller demonstration projects in many countries, generally in partnership with local universities or non-governmental organizations, to show growers what can be achieved under local conditions and how sound practices result in better yields and livelihoods.
In 2015, our programs impacted 1.6 million hectares of land, bringing the two-year cumulative total to 2.4 million hectares.

Op
erational
perfo
rmance
The G
oo
d
Grow
th Plan
Strateg
ic overview
Syngenta Annual Review 2015 29
Research and
D
evelop
ment
Cro
ps
in focu
sP
erform
ance d
ataC
orp
orate
inform
ation
The Good Growth Plan
Better soil leads to better cropsFertile soil is the foundation of sustainable agriculture. But poor farming practices and extreme weather lead to erosion and infertility. In Eastern Russia, we are helping farmers switch from traditional plowing to new techniques that preserve soil and increase growers’ yields.
Working with local universities, we educate farmers in minimum tillage, which avoids churning up the earth. Soil retains moisture and porosity, as the passages made by root systems, worms and insects are undisturbed.
Minimum tillage, along with crop rotation, is leading to cost-effective, high-quality production. In 2015, we held four events connecting 245 farmers with scientists and Syngenta employees. So far, the project involves seven farms covering 464,000 hectares.
Sustainable implementation on the farm also requires supportive agricultural policy frameworks. That’s why we work with the United Nations Convention to Combat Desertification (UNCCD) and have developed the Soil Leadership Academy for policy and decision makers. In October 2015, the Academy successfully ran its first simulation exercise for national policy makers at the UNCCD Conference in Turkey.
We have also worked with the United Nations Global Compact (UNGC) on developing a set of sustainable soil management principles. These were published in October 2015 after extensive stakeholder consultation.
What next?In the coming year, we will continue working with our commercial teams on building good practices into our offer, supporting demonstration projects on the ground and building multi-stakeholder networks that promote integrated offers. In addition to this ‘push’ activity, we are also encouraging ‘pull’ from the value chain – raising awareness of good soil practices among food processors and retailers while promoting the benefits of marketing these practices to consumers, to stimulate demand for more sustainably grown produce.

30 Syngenta Annual Review 2015
Help biodiversity flourishEnhance biodiversity on 5 million hectares of farmland
2020
2015
2014
5.0
1.60.9
0.7
Impacted farmland m ha1
1.6m
1 Cumulative since baseline 2014
Progress and key achievements
Integrated biodiversity conservation in customer loyalty programs
Opened new demonstration plots with universities and local stakeholders
Forged breakthrough implantation partnership in US potato fields
Biodiversity determines the health and resilience of ecosystems – directly affecting erosion control, soil formation, nutrient cycling, pollination, biological pest control and climate regulation.
In the past 35 years, biodiversity has declined by more than a quarter – an unprecedented rate. The main causes are population growth, consumption patterns and habitat destruction.
Biodiversity is damaged as species’ habitats are lost or fragmented. Smaller, more isolated species populations limit genetic variation and evolutionary adaption, and increase the possibility of extinction; and climate change exacerbates these trends. Landscape connectivity is recognized as the greatest opportunity to enhance biodiversity in agricultural landscapes. Planting rich habitats on marginal and less productive farmland alongside fields and waterways creates interconnected habitat infrastructures and corridors. We call them multifunctional field margins, because they help to prevent soil
erosion and protect waterways while boosting biodiversity.
A joined-up approach to landscape connectivitySyngenta has a long history of biodiversity enhancement projects: our Ecoaguas project has been restoring and managing riparian forests in Colombia for two decades. In Germany, our customer loyalty
scheme rewards farmers with seeds and support for planting field margins.
However, achieving desired results on the ground is a slow and resource-intensive process. Growers have to be convinced to invest in marginal and less productive land for biodiversity, and they need support in implementing the necessary management protocols.
Redundant land becomes home to bees and butterfliesR.D. Offutt, the largest potato grower in the USA, planted non-productive corners of its potato fields in Minnesota with regional wildflower seeds to create environmentally diverse habitats and increase the number of pollinators. The habitats provide forage for honeybees, monarch butterflies and other pollinating insects, as well as reducing soil erosion and protecting water resources.
Syngenta advised on how to prepare the sites and which plants to use. In 2015, more than 240 hectares were planted – a good size project when even small areas of less than half a hectare can make a difference.

Op
erational
perfo
rmance
The G
oo
d
Grow
th Plan
Strateg
ic overview
Syngenta Annual Review 2015 31
Research and
D
evelop
ment
Cro
ps
in focu
sP
erform
ance d
ataC
orp
orate
inform
ation
The Good Growth Plan
Two years into The Good Growth Plan, we have projects in over 30 countries across Europe, Latin America, North America and Asia. These encompass a variety of local partnerships and environmental and cultural approaches to create multifunctional field margins, managed forests and biodiversity-friendly farming.
Our programs are now impacting a total area of 1.6 million hectares – with 0.9 million hectares added in 2015 alone – but we still have a long way to go. We have been working with partners around the world to identify priority programs, agree specific targets and define protocols for implementation. The core task is still to raise awareness and establish biodiversity alongside water and soil conservation as a primary goal for farmers and value-chain partners.
Our work is dependent on engaging stakeholders to stimulate dialogue and explore environmental governance issues. In 2015, we held two major international workshops attended by more than 60 experts, with another 175 contributing through surveys. These have helped us to find common ground and develop a compelling framework for implementing and reporting biodiversity projects more effectively and cost efficiently.
What next?We continue to work with external stakeholders – academics, policymakers and conservation experts – to build on experience from the demonstration sites. To achieve the expected long-term economic benefits of biodiversity conservation, we are also working to link growers to consumers. We are encouraging retailers and food processors to set biodiversity enhancement standards for their suppliers, enabling them to promote sustainable food production and consumption to consumers. Another key goal is to incorporate the concept of multifunctional habitats into our commercial offer, and make investment in field margin habitats simpler and cheaper for farmers.
Empower smallholdersReach 20 million smallholders and enable them to increase productivity by 50 percent
2020
2015
20.0
17.2
Smallholders reached1
17.2m
2014 13.81 Through sales
Progress and key achievements
Carried out Social Impact Assessments in China, India and Mexico
Collaborated with University of Zurich to develop a sustainability embeddedness model
Established new partnerships aimed at empowering smallholders
The world’s estimated 500 million smallholders hold the key to future food security. Their relatively low productivity means they offer the greatest potential for steeply increasing food production sustainably.
With partners such as USAID, we aim to raise smallholders’ productivity and earnings sustainably – not only by bringing them products, know-how and training but also by helping them to finance higher-yielding products and reach markets to sell their crops.
Reaching more, and measuring our impactWe estimate that over half of our sales are in developing economies dominated by smallholder farmers, particularly in Asia Pacific, Latin America and Africa. In 2015, we increased the number of smallholders we reach through sales from 13.8 million to 17.2 million.
Our contact with smallholders comes primarily through our sales teams. In emerging and less developed economies, millions of growers are so small-scale and dispersed that it is not easy to know where they are, what they grow or how to contact them. Our sales management information system helps us reach them more effectively by integrating information that identifies smallholders and tracks our interactions with them. We have been standardizing the way we do this in Asia, and we expect to do the same in Latin America in 2016. This will help us to build local smallholder profiles, understand grower needs, develop and promote locally tailored protocols and training, and improve our go-to-market strategies.
Our commitment is not just to reach smallholders but to empower them. To better understand smallholders’ needs, we are working with development agencies and other partners such as: IDH, The Sustainable Trade Initiative; the Sustainable Markets Intelligence Center (CIMS); and the Sustainable Food Lab. To measure the benefits we are bringing to local communities, we are using social impact assessments of our smallholder go-to-market strategies.
In 2015, for example, an independent assessment by CIMS found that growers in our Nicaraguan FRIJOLNICA™ program – which now has over 12,000 participants – were achieving double the national average kidney and black bean yield. They were more optimistic about the future than the control group and keen to spread good practice by sharing their insights with neighbors.
We are now carrying out similar assessments in other smallholder markets: China, India and Mexico.
Partnering to extend our reachThrough the World Economic Forum’s Grow Africa and Grow Asia platforms, we work with other public and private players to develop partnerships that enable smallholder farmers to produce more in a sustainable way. In this way we can empower more growers, equipping them with agronomic know-how and training that help them use inputs safely and efficiently.

32 Syngenta Annual Review 2015
We continue to seek new partnerships and opportunities to reach smallholders worldwide. In 2015, we were invited to join the Advisory Board of the Sustainable Food Lab, whose social impact assessment framework we have been using. We became the first company in our industry to be accepted as a supporting partner by Sustainability Initiative Fruits and Vegetables, part of the Dutch government’s IDH initiative.
We also became one of the three corporate participants in a University of Zurich project, funded by the Swiss Commission for Technology and Innovation (CTI), aimed at designing a tool-kit that measures the positive sustainability
Help people stay safeTrain 20 million farm workers on labor safety, especially in developing countries
2020
2015
20.0
10.4
2014 4.7
People trained on safe use1
10.4m
1 Cumulative since baseline 2014
5.7
Progress and key achievements
Rolled out new guidelines for safe and responsible use training
Redesigned train-the-trainer program and launched new online tool
Engaged with stakeholders at global Farmer Safety Workshop
We share a responsibility to help improve occupational health and safety in agriculture – particularly among smallholders and farm workers in developing countries. Our training programs raise awareness of hazards, principally those related to crop protection products, and show how to manage and prevent them. More than 90 percent of our training is delivered by our own sales and stewardship teams. To extend our reach, we also work with both commercial and academic partners.
effects of locally-embedded Swiss-based multinational companies in developing countries. University students are working with local academics, value chain representatives and other stakeholders to assess Syngenta’s impact in Colombia and Kenya.
What next?We’ll continue to extend our smallholder reach with the help of our growing body of partners. We’ll also be extending the social impact assessment program into other countries, and sharing what we learn to show transparently where we are active and what difference we are making.
Farmers help each other to become more prosperousEncouraging progressive smallholders to share expertise with others makes a tangible difference by increasing yields and incomes.
In East Java, Indonesia, successful rice growers are educating other farmers in good agricultural practices and the implementation of our GROMORE™ solution. Rice growers who raise yields to 10 tonnes per hectare are invited to join the Rice Ten Tonne Club. Supported by Syngenta agronomists and government farming counselors, these lead farmers then pass on their knowledge to groups of smallholders.
So far, more than 15,000 smallholders are benefiting from modern methods of growing rice.

Op
erational
perfo
rmance
The G
oo
d
Grow
th Plan
Strateg
ic overview
Syngenta Annual Review 2015 33
Research and
D
evelop
ment
Cro
ps
in focu
sP
erform
ance d
ataC
orp
orate
inform
ation
The Good Growth Plan
Better training, more lasting impactIn 2015, we reached 5.7 million people – more than 70 percent of them smallholders – through dedicated safety training programs or through safe use briefings linked to commercial activities. The cumulative total of people reached in the first two years of this commitment exceeded 10 million.
Safe use training has for many years been an integral part of the way we do business worldwide, but our approach has varied from country to country. As part of The Good Growth Plan commitment we have harmonized our approach, developing guidelines and tools that enable our people to plan and implement training consistently. These were launched in 2015 and are now distributed in six languages.
To embed the new guidelines, we also rolled out revised train-the-trainer protocols in 2015 – initially in Latin America and Asia. The primary focus of this work is not on the number of farm workers we reach, but on the quality of training that our trainers impart and its lasting impact. To support this initiative, we created a new online tool: www.pesticidewise.com. Targeting farmers and trainers, this aims to raise awareness of the hazards and risks of using pesticides and explains what users can do to mitigate them.
Training farmers to stay safeAs we work with farmers in Mexico to increase productivity in a sustainable way, we ensure they are also trained in safe use of crop protection products.
We have joined with government and partners from industry in the MasAgro program – The Sustainable Modernization of Traditional Agriculture, overseen by the International Maize and Wheat Improvement Center or CIMMYT. The aim is to target smallholders who lack access to agricultural technologies and markets to help them raise productivity of corn and wheat, increasing incomes.
To ensure as many people as possible are trained, Syngenta experts educate CIMMYT technicians who then train farmers. In 2015, the program reached 2,600 smallholders.

34 Syngenta Annual Review 2015
Look after every workerStrive for fair labor conditions throughout our entire supply chain network
2015
2014
84%
53%
Seed supply farms in our Fair Labor Program1
84%
1 2014 value was estimated and not assured
Progress and key achievements
First agricultural company to receive FLA accreditation
GLOBALG.A.P./GRASP certification for our flower farms
Joined Together for Sustainability initiative
Labor standards are a priority concern for all our farms and production plants. We expect the same from our suppliers, and take positive action to ensure fair labor conditions in our supply chain.
Our more than 30,000 seed supply farms in 36 countries pose particular challenges. Since 2004, we have worked with the Fair Labor Association (FLA) to address labor standards on these farms. Under our Fair Labor Program, our supplier contracts set out standards in nine areas: Employment Relationship; Nondiscrimination; Harassment and Abuse; Forced Labor; Child Labor; Freedom of Association and Collective Bargaining; Health, Safety and Environment; Hours of Work; and Compensation. Each year, we audit compliance on at least 20 percent of farms in each country; the FLA independently audits a further 2 to 5 percent in higher-risk countries, and ensures transparency by publishing all its findings.
Major endorsement for our Fair Labor ProgramIn 2015, we completed implementation of our Fair Labor Program in the Philippines and began implementation in China. By the end of the year, the program covered 27,091 suppliers in Asia Pacific, Eastern Europe and Latin America. This represented 84 percent of our seed supply chain, and we remain on track for 100 percent by 2020. The total number of seed suppliers in 2015 was significantly lower than in previous years, reflecting market demand and our work on streamlining the supply chain.
In 2015, we became the first agriculture company to receive FLA accreditation, for our program in India. This major endorsement confirms that we have effective systems and procedures across all our production and supply operations to communicate our standards, assess compliance, train staff to assess and resolve non-compliance, and give workers confidential reporting channels.
The program demonstrated its effectiveness by identifying key areas requiring improvement. These included wage payments, on-farm health, safety and environmental measures, and access to grievance mechanisms. Corrective action plans were developed and actions piloted in the following growing season.
All our own flower seeds production sites in the Europe, Africa and Middle East region and our site in Guatemala are GLOBALG.A.P. certified, and our sites in Portugal and the Netherlands are certified to G.A.P.’s social practice standard (GRASP). By the end of 2015, our larger third-party suppliers had also achieved G.A.P. certification.
We recognize that we don’t have all the answers, and it is important to learn from others working in related fields. In November 2015, we held a global Farmer Safety Workshop to share experience and ideas with representatives of the value chain, academia and other civil society organizations such as the Sustainable Agriculture Network, Solidaridad and the Centre for Development Innovation at Wageningen UR. This has deepened our understanding of the many cultural and behavioral factors involved in helping farmers to work more responsibly and safely. For example, we need to improve our training to target women in countries where they do much of the farm work, but have not been encouraged to actively participate in training sessions.
What next?In the year ahead we will be rolling out new training programs based on our revised guidelines and incorporating the learning from our Farmer Safety Workshop. We are also adopting new approaches and partnerships to extend our training footprint – particularly in Africa and other areas where we need to supplement our own internal resources in order to reach the number of people we have committed to train.

Op
erational
perfo
rmance
The G
oo
d
Grow
th Plan
Strateg
ic overview
Syngenta Annual Review 2015 35
Research and
D
evelop
ment
Cro
ps
in focu
sP
erform
ance d
ataC
orp
orate
inform
ation
The Good Growth Plan
There are around 900 companies in our chemicals supply chain, and our assessment program checks their compliance with our health, safety, quality and labor standards. In 2015, we joined the Together for Sustainability initiative. This brings together international chemical companies – 14 so far – to share joint supplier audits on health, safety, environmental, social and ethical issues in line with the principles of the United Nations Global Compact, Responsible Care and the International Labor Organization. This enables us to reach deeper into our supply chain and to raise the bar for suppliers. It will also free up resources so that we can conduct ‘deep dive’ assessments of our strategically most important suppliers.
What next?In 2016, we will continue to roll out our Fair Labor Program for seeds suppliers, completing coverage of Latin America and Asia Pacific. We will also begin reporting compliance levels for all countries in the program – an important step for transparency. While we have come a long way in improving labor conditions in the supply chain, we recognize that there is still more to be done. The Good Growth Plan measures will enable better informed discussion of the challenges we face and the progress we are making.
Keep up to date with The Good Growth Plan Throughout the year, we provide updates on The Good Growth Plan website. There, you’ll find more information about each commitment as well as a range of case studies from the field. Visit: www.goodgrowthplan.com
To find more about our approach to open data or to access the files, visit: www.data.syngenta.com
Taking a stand for fair laborIn Argentina, millions of people work in agriculture. Fair labor on farms is an issue of great importance. In 2011, an audit of our fair labor compliance in Argentina carried out in partnership with the Fair Labor Association (FLA) showed key areas for improvement.
A subsequent supply chain review led to an ambitious program to enhance labor and safety practices for field workers on our seed supply farms. This included improving workers’ access to training, focusing on health and safety risk identification and reporting. In 2015, our Argentine supply chain achieved 99.5 percent compliance with the FLA Code of Conduct.

36 Syngenta Annual Review 2015
Maximizing the value of innovationExcellence in innovation underpins our business strategy and The Good Growth Plan. As a sustainable business, we aim to capture all the potential value that our innovation creates. We need a talented and motivated workforce. We must be efficient and profitable. And we have to earn the support of employees, regulators and the public as a responsible and respected organization.
Delivering outstanding quality with focus on profitability Our operations strategy encompasses all our procurement, supply, production, distribution, quality and business services. It aims to support profitable growth by ensuring we deliver innovation to growers with scale, agility and efficiency. Our efforts have been strengthened by Syngenta’s Accelerating Operational Leverage (AOL) program, which has focused attention across the business on enhancing efficiency, profitability and the experience we provide for customers.
A key enabler of AOL is the Operational Excellence program that we are implementing. This is a well-proven approach to systematically and continuously improve the efficiency and value of our operations. It is designed to unleash the potential of our people by giving them a greater sense of direction, engagement and achievement in their work. It augments our culture of innovation by bringing greater rigor and discipline to the way we work. And it will ensure that we improve the customer experience as we increase the efficiency of our operations.
We have built an internal Operational Excellence team and trained our own coaches so that we have in-house capability to apply this methodology over the long term.
We continue to invest in our production assets to ensure that we have the right facilities and capacity to satisfy demand efficiently. As part of our ongoing review of capacity, we also consider where we need our own production facilities and whether it makes better sense to partner with external suppliers instead.
As an integral element of our operations strategy, we have continued to focus on the sustainability of our operations. Just as The Good Growth Plan seeks to increase the sustainability of our offers in the field by 2020, this work aims to secure the long-term viability of our internal and external operations.
We now have a framework for sustainable operations, based on the principle that we will maximize the pace and impact of our initiatives if we focus on the areas offering greatest scope for beneficial change. This framework identifies five focus areas: energy, water, waste, suppliers and logistics.
Our operational performance has many facets. But it all depends on one factor: our people. The long-term success of our business will be shaped by the talent, skills and motivation of the people who work here.
See Non-financial information and data on pages 55–62
Operational performance
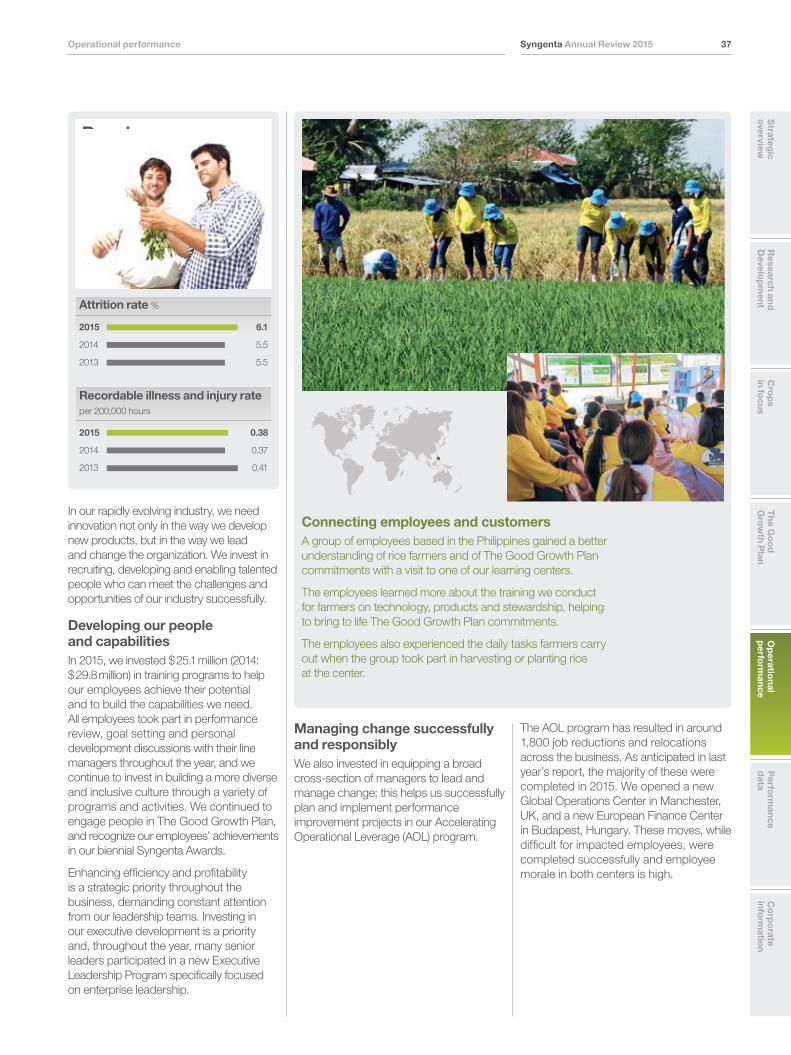
Op
erational
perfo
rmance
Strateg
ic overview
Syngenta Annual Review 2015 37
Research and
D
evelop
ment
Cro
ps
in focu
sT
he Go
od
G
rowth P
lanP
erform
ance d
ataC
orp
orate
inform
ation
Operational performance
Connecting employees and customersA group of employees based in the Philippines gained a better understanding of rice farmers and of The Good Growth Plan commitments with a visit to one of our learning centers.
The employees learned more about the training we conduct for farmers on technology, products and stewardship, helping to bring to life The Good Growth Plan commitments.
The employees also experienced the daily tasks farmers carry out when the group took part in harvesting or planting rice at the center.
People
2015
2014
2013
6.1
5.5
5.5
Attrition rate %
2015
2014
2013
0.38
0.37
0.41
Recordable illness and injury rate per 200,000 hours
In our rapidly evolving industry, we need innovation not only in the way we develop new products, but in the way we lead and change the organization. We invest in recruiting, developing and enabling talented people who can meet the challenges and opportunities of our industry successfully.
Developing our people and capabilitiesIn 2015, we invested $ 25.1 million (2014: $ 29.8 million) in training programs to help our employees achieve their potential and to build the capabilities we need. All employees took part in performance review, goal setting and personal development discussions with their line managers throughout the year, and we continue to invest in building a more diverse and inclusive culture through a variety of programs and activities. We continued to engage people in The Good Growth Plan, and recognize our employees’ achievements in our biennial Syngenta Awards.
Enhancing efficiency and profitability is a strategic priority throughout the business, demanding constant attention from our leadership teams. Investing in our executive development is a priority and, throughout the year, many senior leaders participated in a new Executive Leadership Program specifically focused on enterprise leadership.
Managing change successfully and responsiblyWe also invested in equipping a broad cross-section of managers to lead and manage change; this helps us successfully plan and implement performance improvement projects in our Accelerating Operational Leverage (AOL) program.
The AOL program has resulted in around 1,800 job reductions and relocations across the business. As anticipated in last year’s report, the majority of these were completed in 2015. We opened a new Global Operations Center in Manchester, UK, and a new European Finance Center in Budapest, Hungary. These moves, while difficult for impacted employees, were completed successfully and employee morale in both centers is high.

38 Syngenta Annual Review 2015
Building our talent pool efficientlyWe continued to have a high employee retention rate in 2015. Due to restructuring, total turnover was 12.5 percent – higher than in 2014 (9.9 percent) but still lower than in 2013 (14.1 percent). The number of voluntary leavers – which excludes retirement and restructuring – rose slightly to 6.1 percent (2014: 5.5 percent).
Although our staff turnover remains relatively low, we still need to recruit new people each year – not only to replace those who retire or leave, but also to enter new markets and acquire new skills and experience. In 2015, we entered a partnership agreement with IBM Kenexa, one of the world’s largest recruitment consultancies, to manage our global recruitment. Starting in the UK and Asia Pacific in 2015, it will operate globally by the end of 2016.
Working safely and securelyWe aim to be an industry leader in health and safety standards and performance. To this end, we make continuous investments in our safety program to sustain a best-in-class Illness and Injury Rate (IIR) of below 0.5. The rate remained low in 2015, at 0.38 recordable incidents per 200,000 hours (2014: 0.37). This was a good performance in a year that saw a further increase in the proportion of field work, where injury rates tend to be higher.
Sadly, there was one fatality during the year: a sales promotion employee in Bangladesh died when his motorcycle collided with a bus while he was returning from a business meeting. We have programs in place to continuously improve the safety of our sales force when driving, including online e-training targeted at accident causes. In Latin America, we have introduced satellite-based tracking of fleet vehicles. This generates reports on parameters such as speed, seat belt use and driving time, which we use to identify the need for improvement. In Brazil, where it now covers one-third of all vehicles, vehicle incidents in 2015 were 60 percent lower than in 2014. Across Syngenta, the number of incidents per million km driven was 1.3 in 2015 – lower than our benchmark figure of 2.0–3.0.
Sustainable operations
2015
2014
2013
124
114
116
CO2e emissions intensity g/$sales
2015
2014
2013
14.4
15.6
16.0
Hazardous waste intensity g/$sales
2015
2014
2013
2.6
2.5
2.5
Water usage intensity liters/$sales
Our efficiency and our sustainability go hand-in-hand. Our viability – now and in the future – depends on using resources efficiently and maintaining our license to operate by minimizing our external impacts. This is why our sustainability standards and performance are closely scrutinized and approved by Syngenta’s Board.
Since the launch of our new Health, Safety, Environment and Security reporting system at the end of 2013, we were able to collect more and better data on health and safety incidents. In 2015, we have been able to use this data to analyze risks to our people’s health and safety more closely and take appropriate action to control and minimize them.
Since 2011, our Goal Zero initiative has sought to achieve zero harm to people and zero safety incidents, on the principle that all accidents are preventable. The construction project to quadruple the size of our Formosa plant in Brazil exemplifies this commitment. While the plant maintained operations throughout the two-year project, with up to 1,500 people on site, in 2015 it completed 1.2 million hours worked without a single lost-time incident.
We also take the security of our people, products, assets and information extremely seriously at all times. As a global organization, we remain exposed to a significant and complex range of potential risks – from the counterfeiting of our products to cybercrime. We aim to assess and address emerging security risks proactively, before they become live issues, and we train our local security staff in how to handle emergencies to safeguard our people and surrounding communities. In 2015, under our Security 360° program, our security professionals evaluated 117 sites to determine risk levels, and helped to develop site-specific risk management plans.
Counterfeiting of our products can be hazardous to users, the public and the environment. We have increased our resources for combating it, and in 2015 played an active part in securing seizures of some 323 tonnes of counterfeit and illegally imported chemicals (2014: 178 tonnes) with an estimated retail value of $ 43 million (2014: $ 17 million). We also contributed to the seizures of 91 tonnes of counterfeit seeds with an estimated market value of $ 11.4 million.

Op
erational
perfo
rmance
Strateg
ic overview
Syngenta Annual Review 2015 39
Research and
D
evelop
ment
Cro
ps
in focu
sT
he Go
od
G
rowth P
lanP
erform
ance d
ataC
orp
orate
inform
ation
Operational performance
Ensuring we have the capacity to deliverOur Finished Product Processing teams continue to deliver high-quality seeds and crop protection products to meet demand – safely, reliably, responsively and cost effectively. Production is carried out both in-house and through toll manufacturers: we continually review our in-house production assets to increase agility, minimize disruption, reduce idle capacity and ensure delivery in line with our integrated strategy and long-term goals.
In 2015, investment continued at our Paulinia site in Brazil to ensure we can meet demand for SOLATENOL™ in Latin America. We continue to build on established relationships with toll manufacturers who have demonstrated their ability to deliver to our quality and cost standards.
All our eight global active ingredient sites have ongoing ‘lean’ initiatives to enhance Operational Excellence and have maintained their ability to deliver at high capacity. All expansion projects were delivered on time and budget, including key projects at Huddersfield, UK, and Monthey, Switzerland, as well as at Nantong in China. In 2015, we announced our intention to divest our site in Goa, India, in a further consolidation of internal capacity.
Empowering people to achieve excellenceIncreased customer demand for crop protection products created production challenges at Syngenta’s diversified agri-chemical formulating and packaging facility in Omaha, USA. Employees faced rising overtime and heavy workloads.
To meet production targets without putting undue — and unsustainable — strain on resources, management introduced Operational Excellence: a well-proven approach to continuously improve efficiency and value. By embracing the idea of continuous improvement, employees changed the culture of their site through a focus on new techniques and teamwork.
Today, four years on, overtime has been reduced, work processes are more efficient and there is a more positive working environment.

40 Syngenta Annual Review 2015
Making our operations more sustainableThese are the principal actions currently underway to enable us to understand what is necessary to ensure the sustainability of our operations and to set appropriate targets. The majority of these actions are due for completion by the end of 2016.
Action by focus area Significance Completion
Energy
Carry out detailed audit of our top 10 sites, accounting for over 80 percent of our energy use
The energy audit program is based on EU energy requirements: audits will set baselines for all sites in the program with targets for improvement
2016
Water
Establish a water footprint for the seed supply business
Seed supply is our principal water-using activity, so we are including it in our data collection process and will cover water types and usage patterns
2016
Waste
Establish waste footprints for the 10 active ingredients generating over 80 percent of our hazardous waste
Our hazardous waste comes mainly from active ingredient production: a life-cycle approach to key products will cut hazardous waste generation by optimizing processes and enhancing recycling and reuse
2016
Suppliers
Conduct sustainability risk assessments for 100 percent of direct and indirect procurement categories
This will identify the supply markets which represent the biggest sustainability risks, to guide future action
2016
Actively participate in the Together for Sustainability (TfS) initiative
By applying consistent standards across the industry, this initiative is improving sustainable sourcing and raising standards across the supply chain while cutting complexity and costs
2016
Ensure 100 percent participation by active ingredient and other strategic suppliers in our improvement program, and by key third-party waste treatment providers in our compliance program
Regular audits will reduce risks from third-party waste management 2020
Logistics
Adopt fourth-party logistics (4PL) to cover our global operations in Crop Protection and field crops
A 4PL supplier acts as a single interface between the client and multiple logistics service providers. Their role is to optimize the logistics and transportation network in order to drive continuous service improvement and cost reduction. This can significantly cut CO2 emissions by optimizing road, rail and sea transport and storage
2020

Op
erational
perfo
rmance
Strateg
ic overview
Syngenta Annual Review 2015 41
Research and
D
evelop
ment
Cro
ps
in focu
sT
he Go
od
G
rowth P
lanP
erform
ance d
ataC
orp
orate
inform
ation
Operational performance
Ensuring our viability for the futureIn 2015, we increased our effort to analyze the external impacts of our operations and identified five key focus areas for reducing our impact – as set out in the table: “Making our operations more sustainable”.
Three of the focus areas concern the way we use resources: energy, waste and water. Our energy and waste impacts come primarily from our production sites; and although we have some 300 of these, just 10 sites account for about 80 percent of the impacts. We have, therefore, been focusing our attention on these sites.
While our water efficiency initiatives are concentrating on the most water-intensive manufacturing sites, we understand that our greatest water-consuming activity by far is seed production. We have, therefore, been devoting considerable attention to water use on our seed supply farms and how best to manage it.
The two other focus areas concern the way we work with third-party suppliers. Our business model is evolving to place greater emphasis on outsourcing. As a result, external suppliers now account for a large – and growing – part of our environmental footprint. So we are placing more attention on the way we work together to help them manage their environmental impacts effectively and efficiently. In addition to our production suppliers, we are also looking closely at logistics – the way we transport and store materials through the distribution chain – where greater efficiency will have a substantial impact on costs as well as our environmental footprint.
We have identified priority actions for our sustainability performance in these five focus areas. Our work so far has centered on understanding our footprints, to see where the risks are highest and how we can invest efficiently to achieve desirable change. This in turn will allow us to set location-specific targets that are relevant and demanding – a process scheduled to complete by the end of 2016. In the meantime, we have continued to work on tracking and reducing our impacts, as we have done for many years.
Using resources more efficiently Our environmental impacts arise mostly in the areas of energy, hazardous waste, wastewater and water consumption. A summary of each of these follows – for more detailed performance data see pages 60–61. We report our performance both in absolute terms and as intensity expressed per dollar of sales. The benefits of concentrating attention on the sites where our impacts are greatest are evident in the 2015 figures.
Energy We have energy efficiency programs at all our sites. The drive for ever-greater efficiency is continuous and permanent: when targets are met, we will set new and more demanding ones.
We are currently undertaking detailed energy audits on our top 10 sites, which account for over 80 percent of our energy use. These audits will guide target setting and action plans in 2016.
In 2015, we continued to reduce our energy consumption. Absolute energy consumption reduced by 7 percent to 9,222 TJ, driven by the reduction in production over the year. Energy intensity and, consequently, CO2e emissions intensity increased slightly.
The contribution to our carbon footprint from distribution has remained stable while the need for business travel has been reduced by the installation of telepresence rooms at all our major sites. Enabling people to join virtual meetings instead of traveling saves energy, travel costs and management time.
Waste One of our major impacts is hazardous waste, generated mostly by our active ingredient manufacturing sites. As well as reducing the waste generated during production, we aim to convert or reuse as much waste as possible. To do this, we constantly review the opportunities for optimizing both new and existing processes, and for regenerating or reusing unavoidable waste – usually as an additional source of energy.
In 2015, we reduced hazardous waste generation by 18 percent to 193,000 tonnes – due principally to a substantial initiative at our Huddersfield, UK, site and reduced production in Goa, India. The reduction in intensity was 8 percent.
Water Until recently, our data collection on water use has been largely confined to our manufacturing sites. In 2015, we commissioned a major third-party analysis of our water footprint across our toll manufacturing and seed production supply chains, as well as our own sites. This highlighted the impact of seed production, which used more than 1.1 billion m3 of rain and irrigation water in 2015, compared with just 35 million m3 for chemical manufacturing plants. We are now gaining a better understanding of our water use and profiling more accurately to discriminate, for example, between rain-fed and irrigation-fed water use in fields. This work is continuing so that we can fully understand the risk implications of measures to reduce our water footprint.

42 Syngenta Annual Review 2015
Business integrity
2015
2014
2013
196
96
110
Compliance cases reported
2015
2014
2013
24
25
21
Corporate community investment $m
We believe that building and maintaining a culture of doing the right thing is crucial to managing risk and growing a sustainably successful business. It is also the essential foundation on which The Good Growth Plan is built.
We comply with all local, national and international laws, codes and conventions, and uphold the principles set out in the Universal Declaration of Human Rights and the International Labor Organization’s Core Conventions. We expect our suppliers to do the same.
In 2015, water use was down 7 percent in absolute terms and practically unchanged in intensity. In our manufacturing operations, the principal factor was a reduction in water consumption for processing mainly in our sites at Goa, India, Huddersfield, UK, and St. Gabriel, USA.
Wastewater effluents were down 6 percent overall, although the principal factor was reduced production.
Air emissions Air emissions reduced in both absolute and intensity terms. This was partly due to lower SO2 emissions resulting from reduced production at our Goa site.
Working in partnership with suppliers Our strategic approach to suppliers ensures that we work with partners who meet our standards of operation, possess differentiated technical capability and are able to meet our expectations of year-on-year cost savings, as well as understanding the benefits and risks of working in our industry.
In 2015, our supply chain included more than 30,000 seed supply farms. We are committed to covering all these suppliers with our Fair Labor Program, developed over more than a decade with the Fair Labor Association (FLA). This program aims to communicate, monitor and ensure FLA-approved standards on child labor, health and safety, rights awareness, wages and benefits, working hours, harassment, abuse and discrimination. In 2015, 84 percent of seed supply farms were covered by the program. For more details, see “Look after every worker” on page 34.
In October 2015, we received accreditation from the FLA for the Fair Labor Program in India. FLA accreditation is significant recognition, and we are the first agriculture company to receive it. The FLA concluded that we have appropriately rigorous systems and procedures to ensure fair labor standards throughout our Indian production and supply operations.
In our drive to ensure sustainable procurement – and to audit suppliers rigorously and efficiently – we successfully applied to join Together for Sustainability (TfS) in 2015. TfS brings together 14 international chemical companies to work jointly on supplier audits and assessments on health, safety and the environment, as well as social and ethical issues which support the principles of the UN Global Compact, Responsible Care and the International Labor Organization. Its vision is to become the global standard for sustainability in chemical supply chains. TfS membership will help us meet the commitments contained in The Good Growth Plan; and by eliminating duplication of audits, it enables us to raise the bar for suppliers while achieving greater efficiency.
Distributing more efficiently, with less CO2 During 2015, we began optimizing our logistics activities – both transport and storage – to enable cost-efficient growth, increased compliance and improved visibility of operations while reducing our carbon footprint. This work involves standardizing and optimizing processes, leveraging scale and making increasing use of ‘fourth-party logistics’ providers in which a single partner integrates and co-ordinates all logistics operations across the supply chain. This work will cut our CO2 emissions, while increasing the efficiency, scalability and productivity of the way we deliver our products to customers.
Op
erational
perfo
rmance
Strateg
ic overview
Syngenta Annual Review 2015 43
Research and
D
evelop
ment
Cro
ps
in focu
sT
he Go
od
G
rowth P
lanP
erform
ance d
ataC
orp
orate
inform
ation
Operational performance
But real business integrity demands more than regulatory and legal compliance. We have been moving beyond a rules-based approach to build a values-based culture of doing the right thing, which we share with our partners and suppliers. This supports our longstanding policy of engaging actively with the communities in which we operate, to build mutual understanding and benefit.
Building a ‘do the right thing’ cultureOur Code of Conduct sets out clear ethical, environmental, and social responsibilities for all employees; we expect them to honor these and report any suspected breaches. We also monitor our suppliers’ compliance – both with our standards and external regulations – on issues such as health and safety, the environment, fair labor practices and animal welfare.
Building a ‘do the right thing’ culture is an explicit line management responsibility. We have introduced compliance sessions in which managers meet with their teams to discuss relevant compliance topics and encourage employees to speak up if they have concerns. We want to create a climate in which people feel confident about speaking to their leaders without hesitation, so that ethical issues can be addressed before they become problems. Our compliance helpline, successfully re-launched in 2014, remains a vital part of our vigilance in monitoring, detecting and preventing misconduct by allowing employees to seek advice or report concerns confidentially.
Our Compliance and Risk Management Committees (CRMCs) at region, territory and function levels have been instrumental in raising compliance awareness and fostering the manager-led compliance sessions. These committees are our most important drivers of a compliance and risk management mindset and culture, and in 2015, we produced a CRMC handbook to help leaders establish and run these meetings effectively.
Our success in establishing a climate of openness is demonstrated by a steady increase in questions being raised – through line managers, CRMCs and the helpline. To give us a clearer overview, all matters initiated through any of these routes are being entered into a single case-management system. We have now adopted the annual total number of entries as the most useful performance indicator in this area: in 2015, the total was 196.
We continue to make our approach to compliance more systematic and consistent globally. When we appoint third-party service providers, we have begun using a new due diligence process to screen them for compliance risks. This includes an online questionnaire and risk-scoring tool that automates consistent assessment, approvals and controls. We are introducing the new process progressively, using a risk-based approach. In 2015, we piloted it in Argentina, China, Morocco and Turkey to assess its effectiveness under a range of different conditions. In 2016, we will roll it out to 10 more countries.
At many production sites we have introduced training programs for local suppliers on our Code of Conduct and other important policies.
In 2016, we will continue to work on our compliance culture and business integrity through manager-led sessions. For new recruits, we will be supplementing the existing Code of Conduct training with a new e-learning module providing a fuller overview of our key compliance policies, and we are taking additional steps to ensure that all new joiners complete the courses in full.
Earning the support of our neighborsEvery country and region expects us to meet its legal and regulatory requirements; but we also strive to meet wider social expectations. Our operations are part of local economies and communities, urban and rural, in more than 90 countries worldwide. We aim to benefit them in a variety of ways.
We provide economic benefit by paying taxes and providing employment, as well as by buying goods and services, which we source locally where appropriate. Each year, we report this contribution as “Economic value shared”. In 2015, it totaled $ 13,440 million (2014: $ 14,982 million). The lower figure in 2015 was due largely to reductions in purchased goods and in savings as a result of our Accelerating Operational Leverage program – there is a detailed breakdown of the figures on page 62.
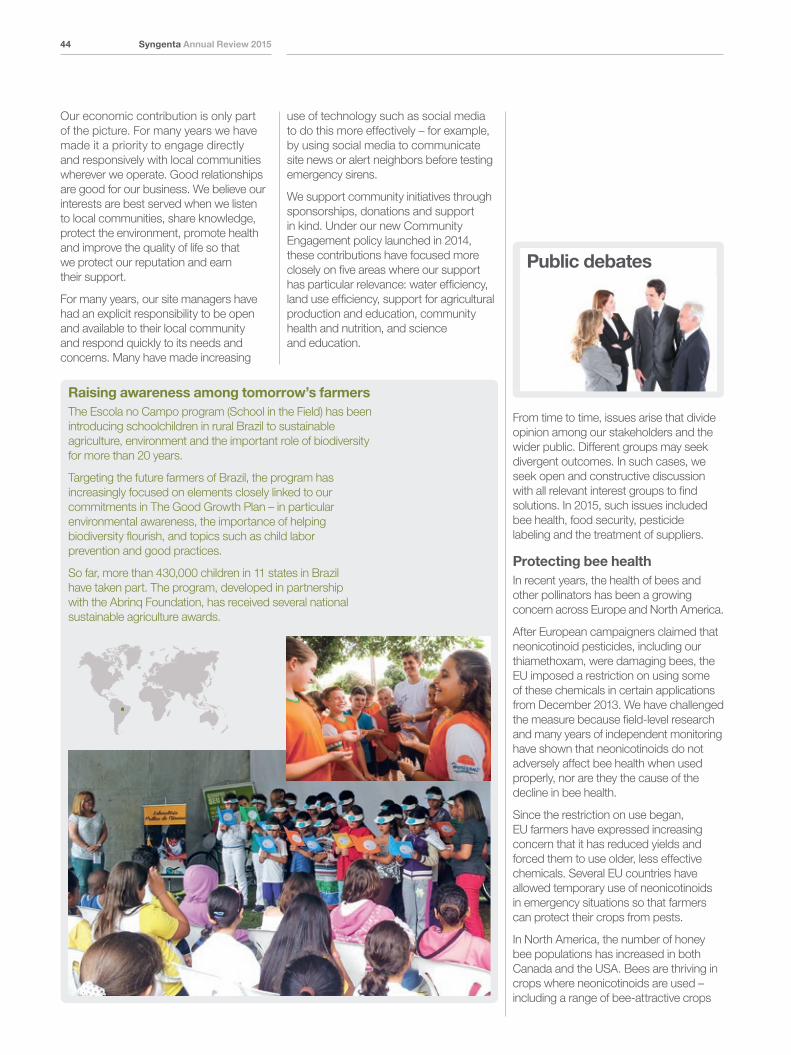
44 Syngenta Annual Review 2015
Public debates
From time to time, issues arise that divide opinion among our stakeholders and the wider public. Different groups may seek divergent outcomes. In such cases, we seek open and constructive discussion with all relevant interest groups to find solutions. In 2015, such issues included bee health, food security, pesticide labeling and the treatment of suppliers.
Protecting bee healthIn recent years, the health of bees and other pollinators has been a growing concern across Europe and North America.
After European campaigners claimed that neonicotinoid pesticides, including our thiamethoxam, were damaging bees, the EU imposed a restriction on using some of these chemicals in certain applications from December 2013. We have challenged the measure because field-level research and many years of independent monitoring have shown that neonicotinoids do not adversely affect bee health when used properly, nor are they the cause of the decline in bee health.
Since the restriction on use began, EU farmers have expressed increasing concern that it has reduced yields and forced them to use older, less effective chemicals. Several EU countries have allowed temporary use of neonicotinoids in emergency situations so that farmers can protect their crops from pests.
In North America, the number of honey bee populations has increased in both Canada and the USA. Bees are thriving in crops where neonicotinoids are used – including a range of bee-attractive crops
Raising awareness among tomorrow’s farmersThe Escola no Campo program (School in the Field) has been introducing schoolchildren in rural Brazil to sustainable agriculture, environment and the important role of biodiversity for more than 20 years.
Targeting the future farmers of Brazil, the program has increasingly focused on elements closely linked to our commitments in The Good Growth Plan – in particular environmental awareness, the importance of helping biodiversity flourish, and topics such as child labor prevention and good practices.
So far, more than 430,000 children in 11 states in Brazil have taken part. The program, developed in partnership with the Abrinq Foundation, has received several national sustainable agriculture awards.
Our economic contribution is only part of the picture. For many years we have made it a priority to engage directly and responsively with local communities wherever we operate. Good relationships are good for our business. We believe our interests are best served when we listen to local communities, share knowledge, protect the environment, promote health and improve the quality of life so that we protect our reputation and earn their support.
For many years, our site managers have had an explicit responsibility to be open and available to their local community and respond quickly to its needs and concerns. Many have made increasing
use of technology such as social media to do this more effectively – for example, by using social media to communicate site news or alert neighbors before testing emergency sirens.
We support community initiatives through sponsorships, donations and support in kind. Under our new Community Engagement policy launched in 2014, these contributions have focused more closely on five areas where our support has particular relevance: water efficiency, land use efficiency, support for agricultural production and education, community health and nutrition, and science and education.

Op
erational
perfo
rmance
Strateg
ic overview
Syngenta Annual Review 2015 45
Research and
D
evelop
ment
Cro
ps
in focu
sT
he Go
od
G
rowth P
lanP
erform
ance d
ataC
orp
orate
inform
ation
Operational performance
such as canola. In July 2015, the province of Ontario implemented a new regulation targeting an 80 percent reduction in neonicotinoid-treated corn and soybean seeds by 2017. We are disappointed with this decision, as the arbitrary reduction in treated seeds planted is not evidence-based and will disadvantage growers without contributing to bee health.
Bees and bee health are crucial to agriculture, and much of our industry’s seed production depends on bees for pollination. This is why we have been committed to bee health for many years through initiatives like Operation Pollinator, which focuses on improving pollinator habitats and nutrition in the farm landscape across the globe.
Read more on www.operationpollinator.com
Debating how to feed the planet
Syngenta joined Basel’s exhibit at EXPO Milano 2015, where the theme was “Feeding the planet, energy for life”. Our display highlighted the challenges of food security and our R&D innovations and partnerships in pursuit of sustainable solutions.
Our participation drew criticism from some NGOs – who, in anticipation of EXPO Milano, staged a protest against Syngenta. Their overall charge was that Syngenta is part of a globalized agricultural system based on fossil fuels, chemistry and genetic research, which in their view is unsustainable.
We engaged in open discussion and confirmed our view that there is no single solution to the world’s food security challenges. Many approaches and methodologies are needed, and we can only be one part of a much wider effort. Investments in agricultural research are a fundamental part of the solution. Together with our partners, we are committed to innovating for food security. Our participation in Expo Milano has stimulated the debate.
Ensuring safe use of pesticidesMany agricultural chemicals can be hazardous if used incorrectly. So we attach great importance to growers using them safely and responsibly. Our focus is on product labels and on providing safe use training for farm workers – one of our commitments in The Good Growth Plan, see page 32.
We aim to comply with all local legislation on product labeling, marketing and safe use training – and we review our compliance regularly. As a member of the industry body CropLife International, we also undertake to comply with the International Code of Conduct on Pesticide Management (ICCPM) set out by the UN’s Food and Agriculture Organization (FAO) and the World Health Organization.
In 2015, a group of European NGOs filed a complaint with the FAO stating that Syngenta, among others, was selling a number of products in the Indian Punjab market carrying labels inconsistent with the ICCPM standards. They argued that Indian labeling regulations are inadequate, and that we should therefore apply ICCPM standards instead.
In line with agreed procedures, the FAO is currently consulting on this issue with the Indian government and other stakeholders; we have welcomed this approach. To date, given the incompatibilities between Indian government regulations and the ICCPM recommendations, we have to comply with local regulations. However, we have confirmed that we will work with other stakeholders to address any problems that the FAO consultations may identify, and to seek solutions. We have also invited representatives of the NGOs concerned to join our ongoing work on enhancing training protocols.
This case highlights a broader issue: the need for greater harmonization between countries to achieve more consistent approaches to labeling and safe use standards. We believe the FAO is the appropriate facilitator and arbiter for this work.
Read more on the ICCPM: www.fao.org – and search “ICCPM”
Treating growers fairlyIn December 2014, the Danish NGO, DanWatch, published an online documentary alleging that we dealt improperly with seed growers in rural Andhra Pradesh, India. It claimed that Syngenta was party to exploitative moneylending to growers – and that this, together with low seed prices paid to growers, was linked to labor violations on farms.
Serious allegations demand a serious response. We have worked with the Fair Labor Association (FLA) since 2004 to address labor conditions in our seed supply chain – see “Look after every worker” on page 34. So we asked the FLA to commission an urgent independent investigation. This confirmed that the moneylending and low-price allegations were unfounded; but it did highlight areas for improvement – particularly in the transparency of money flows between intermediaries and growers. We took prompt action to implement improvements.
India faces acute labor and worker welfare challenges, and we recognize low wages in particular as an issue requiring constant attention. As part of our response to the independent investigation, we announced a joint FLA-Syngenta multi-stakeholder consultation event in India in January 2016 to address ways of ensuring that our suppliers pay agreed minimum wages. We are confident that this will result in positive change.
Read more on www.fairlabor.org/affiliate/syngenta

46 Syngenta Annual Review 2015
Europe, Africa and the Middle East
2015
2014
2013
3,884
4,547
4,223
Sales1 $m
The region achieved further growth at constant exchange rates in the fourth quarter, measured against a strong finish to the 2014 season: higher volumes in the quarter were supported by a successful campaign for corn and sunflower seeds.
Full year growth reflected significant price increases in the CIS which offset currency depreciation. Crop Protection volumes were slightly above 2014 levels – despite dry conditions, low disease pressure and depressed cereals prices – with strong performances by the cereal fungicides SEGURIS® and MODDUS® as well as Seedcare. This offset the erosion of seeds volumes in the CIS caused by price increases.
North America
2015
2014
2013
3,410
3,582
3,848
Sales1 $m
Volume growth was strong in the fourth quarter, driven by the success of ACURON™, a newly launched herbicide that provides corn farmers with an effective solution to combat weed resistance. Sales in the quarter also included trait revenues of $145 million from the licensing agreement with KWS and Limagrain announced in October.
The deliberate reduction in glyphosate volumes and lower glyphosate prices reduced full year sales by 4 percent. In the USA, ongoing low commodity prices negatively affected the demand for crop enhancement applications. In Canada, sales were lower owing to dry weather conditions and high channel inventories of Seedcare products.
Latin America
2015
2014
2013
3,632
4,279
3,991
Sales1 $m
Market conditions deteriorated in the second half of the year, with the sharp depreciation of the Brazilian real as well as tight credit conditions for growers in both Brazil and Argentina. Despite this, ELATUS™ performed well in its second year in Brazil, demonstrating the continuing customer demand for new technology.
The fourth quarter also included $ 55 million in trait revenue from the KWS and Limagrain agreement. In 2015, the Company implemented a change in contractual sales terms for crop protection products in Brazil, which caused a timing change in sales recognition. The full year effect was a $ 239 million increase in sales.
The deliberate reduction in glyphosate volumes and lower glyphosate prices reduced sales by $ 224 million.
Asia Pacific
2015
2014
2013
1,837
2,033
1,935
Sales1 $m
Full year sales volumes were affected by extended drought conditions in ASEAN and the phase-out of paraquat sales in China due to a regulatory change Pricing gains however were broad-based, with significant increases notably in South Asia; seeds sales in ASEAN reflected the continued adoption of genetically modified (GM) technology. Australasia saw good volume growth with increased cotton acreage driving higher Seedcare sales.
1 Excluding Lawn and Garden
All sales commentaries are at constant exchange rates.
Regional performance

Perfo
rmance
data
Strateg
ic overview
Syngenta Annual Review 2015 47
Research and
D
evelop
ment
Cro
ps
in focu
sT
he Go
od
G
rowth P
lanO
peratio
nal p
erform
anceC
orp
orate
inform
ation
Performance data
Crop Protection
2015
2014
2013
2,894
3,083
3,051
Selective herbicides Sales1 $m
Sales performance in North America was driven by the success of ACURON™, which achieved its target of $100 million sales in its launch year. This more than offset the impact of dry weather conditions in Canada. In Europe, strong price gains were recorded in the CIS to compensate for currency depreciation. Sales in Latin America were higher as a result of the change in sales terms in Brazil.
2015
2014
2013
913
1,445
1,545
Non-selective herbicidesSales1 $m
The sales decline is largely a result of the decision to reduce volumes of solo glyphosate in order to improve the profitability of the business. TOUCHDOWN® prices were also lower, reflecting a decline in the active ingredient purchasing costs. GRAMOXONE® sales in China have been phased out following a regulatory change affecting paraquat liquid formulations.
2015
2014
2013
3,357
3,518
3,035
FungicidesSales1 $m
Broad-based growth was achieved across the portfolio despite dry conditions in parts of Europe and Asia Pacific. ELATUS™ performed well in its second year in Brazil, with total sales exceeding $ 400 million. Volume growth was solid across Europe with a strong performance by the cereals fungicides ALTO®, MODDUS® and SEGURIS®. In January 2016, Syngenta announced that SOLATENOL™, the active ingredient used in ELATUS™, has been approved by the EU authorities, with first sales in France expected for the 2016/2017 season.
2015
2014
2013
1,705
2,066
1,912
InsecticidesSales1 $m
Growth came from price increases in Europe and volume growth in Asia Pacific, as well as new product introductions in China and India. This did not compensate for the impact of reduced sales in Latin America, due to dry weather and low insect pressure in Argentina and to high channel inventories in Brazil. However, ACTARA® performed strongly in Brazil in the fourth quarter with an improvement in the sugar cane market.
2015
2014
2013
994
1,115
1,228
SeedcareSales1 $m
Growth in Europe reflected a solid performance of Seedcare solutions for the cereals market in the CIS and Central Europe. In Asia Pacific, sales were boosted by increased focus on key accounts in China and by broad-based growth in Australasia. In North America, sales were affected by high channel inventories in the Canadian cereals market and lower cotton acres in southern US states.
Seeds
2015
2014
2013
1,564
1,665
1,654
Corn and soybeanSales $m
Corn sales were up in all regions, with a significant progression in the Americas owing to the licensing agreement with KWS and Limagrain, for which revenue was recorded in the fourth quarter. This was partially offset by lower US branded sales due to the acreage shift from corn to soybean. Corn volumes were down in Europe as a consequence of reduced acreage, but the impact was offset by significant price increases in the CIS.
Strong price gains were recorded in Asia Pacific, driven by increased adoption of GM technology. Soybean sales in Latin America were lower, as sales were shifted to distributors as part of the implementation of the Integrated Business Partner model in Brazil.
2015
2014
2013
658
827
842
Diverse field cropsSales $m
Sunflower sales increased significantly in Europe, the most important region, reflecting substantial price increases in the CIS which fully offset the impact of currency depreciation. These price increases had some impact on volume, as high-value hybrids faced competition from local seeds. Sugar beet sales were lower, as oversupply on the sugar market led to significant acreage shifts in Europe.
2015
2014
2013
616
663
708
VegetablesSales $m
Growth was broad-based across the four regions. Price increases were robust, owing to a focus on capturing value for high-quality hybrids across the portfolio and in particular to the strong return on investments being achieved by growers in South Asia. Sweet corn sales in the USA were affected by high processor inventories.
1 Includes sales of Crop Protection products to Seeds and excludes non-product line sales
Product line performance

48 Syngenta Annual Review 2015
Financial informationA summary of Syngenta’s consolidated financial statements and other financial information is provided on pages 48 to 54. For full details and analysis of the Group’s audited financial results, prepared in accordance with IFRS, please refer to our comprehensive Financial Report 2015, which is available on request or on our website www.ar2015.syngenta.com
References to EBITDA in the following financial information excludes the impact of restructuring, impairment and discontinued operations.1
Summarized financial information 2015 and 2014
Excluding restructuringand impairment 1
Restructuring and impairment
As reported under IFRS
Year ended December 31 ($ m, except per share amounts) 2015 2014 2015 2014 2015 2014
Sales 13,411 15,134 – – 13,411 15,134Gross profit 6,369 6,955 – (13) 6,369 6,942Marketing and distribution (2,210) (2,497) (2,210) (2,497)Research and development (1,362) (1,430) (1,362) (1,430)General and administrative (568) (717) (388) (193) (956) (910)Operating income 2,229 2,311 (388) (206) 1,841 2,105Income before taxes 1,980 2,101 (388) (206) 1,592 1,895Income tax expense (336) (311) 88 38 (248) (273)Net income 1,644 1,790 (300) (168) 1,344 1,622Attributable to non-controlling interests (5) (3) – – (5) (3)Attributable to Syngenta AG shareholders: 1,639 1,787 (300) (168) 1,339 1,619
Earnings/(loss) per share ($ )2
Basic 17.83 19.49 (3.26) (1.83) 14.57 17.66Diluted 17.78 19.42 (3.26) (1.82) 14.52 17.60
2015 20142015 CER3
Gross profit margin excluding restructuring and impairment 47.5% 46.0% 49.1%EBITDA4 2,777 2,926EBITDA margin 20.7% 19.3%Tax rate on results excluding restructuring and impairment 17% 15%Free cash flow 5 795 1,083Trade working capital to sales6 38% 34%Debt/Equity gearing 7 31% 25%Net debt 7 2,586 2,248Cash flow return on investment 8 11% 11%
1 For further discussion of restructuring and impairment charges, see page 54. Net income and earnings per share excluding restructuring and impairment are provided as additional information and not as an alternative to net income and earnings per share determined in accordance with IFRS
2 The weighted average number of ordinary shares in issue used to calculate the earnings per share were as follows: For 2015 basic EPS 91,908,128 and diluted 92,206,535; for 2014 basic EPS 91,674,127 and diluted 92,007,089
3 For a description of CER, see page 544 EBITDA is defined on page 545 For a description of free cash flow, see page 546 Period end trade working capital as a percentage of 12-month sales7 For a description of net debt and the calculation of debt/equity gearing, see page 548 For a description of the cash flow return on investment calculation, see page 54

Perfo
rmance
data
Strateg
ic overview
Syngenta Annual Review 2015 49
Research and
D
evelop
ment
Cro
ps
in focu
sT
he Go
od
G
rowth P
lanO
peratio
nal p
erform
anceC
orp
orate
inform
ation
Performance data Financial information
Full year sales
Year ended December 312015 ($ m)
2014 ($ m)
Actual %
CER %
Group salesEurope, Africa and Middle East 3,884 4,547 -15 +10North America 3,410 3,582 -5 -4Latin America 3,632 4,279 -15 -5Asia Pacific 1,837 2,033 -10 -3Total integrated sales 12,763 14,441 -12 –Lawn and Garden 648 693 -7 +3Group sales 13,411 15,134 -11 +1
Crop Protection by region
Europe, Africa and Middle East 2,892 3,312 -13 +10North America 2,326 2,578 -10 -8Latin America 3,249 3,769 -14 -4Asia Pacific 1,538 1,722 -11 -4Total 10,005 11,381 -12 -1
Seeds by region
Europe, Africa and Middle East 1,017 1,274 -20 +9North America 1,116 1,044 +7 +8Latin America 400 522 -23 -6Asia Pacific 305 315 -3 +2Total 2,838 3,155 -10 +5
Sales by business
Crop Protection 10,005 11,381 -12 -1Seeds 2,838 3,155 -10 +5Elimination of Crop Protection sales to Seeds (80) (95) n/a n/aTotal integrated sales 12,763 14,441 -12 –Lawn and Garden 648 693 -7 +3Group sales 13,411 15,134 -11 +1
Full year product line sales
Year ended December 312015 ($ m)
2014 ($ m)
Actual %
CER%
Selective herbicides 2,894 3,083 -6 +6Non-selective herbicides 913 1,445 -37 -31Fungicides 3,357 3,518 -5 +9Insecticides 1,705 2,066 -17 -8Seedcare 994 1,115 -11 –Other crop protection 142 154 -8 -1Total Crop Protection 10,005 11,381 -12 -1Corn and soybean 1,564 1,665 -6 +4Diverse field crops 658 827 -20 +8Vegetables 616 663 -7 +5Total Seeds 2,838 3,155 -10 +5Elimination of Crop Protection sales to Seeds (80) (95) n/a n/aLawn and Garden 648 693 -7 +3Group sales 13,411 15,134 -11 +1

50 Syngenta Annual Review 2015
Condensed consolidated income statement
Year ended December 31 ($m, except share and per share amounts) 2015 2014
Sales 13,411 15,134Cost of goods sold (7,042) (8,192)Gross profit 6,369 6,942Marketing and distribution (2,210) (2,497)Research and development (1,362) (1,430)General and administrative:
Restructuring (388) (193)Other general and administrative (568) (717)
Operating income 1,841 2,105Income from associates and joint ventures 7 7Financial expense, net (256) (217)Income before taxes 1,592 1,895Income tax expense (248) (273)Net income 1,344 1,622Attributable to:
Syngenta AG shareholders 1,339 1,619Non-controlling interests 5 3
Net income 1,344 1,622Earnings per share ($ ):
Basic 14.57 17.66Diluted 14.52 17.60
Weighted average number of shares:Basic 91,908,128 91,674,127Diluted 92,206,535 92,007,089
All activities were in respect of continuing operations.
Restructuring and impairment before taxes
Year ended December 31 ($m) 2015 2014
Accelerating operational leverage programs:Cash costs 228 49Non-cash impairment costs 33 14Pension curtailment gain (21) –
Integrated crop strategy programs:Cash costs 27 61
Operational efficiency programs:Cash costs – 18
Acquisition, divestment and related costs:Cash costs 91 27Non-cash items Reversal of inventory step-ups – 13 Fixed asset impairment 1 –
Other non-cash restructuring:Non-current asset impairment 29 24
Total restructuring and impairment before taxes 1 388 206
1 $ nil (2014: $13 million) is included within Cost of goods sold

Perfo
rmance
data
Strateg
ic overview
Syngenta Annual Review 2015 51
Research and
D
evelop
ment
Cro
ps
in focu
sT
he Go
od
G
rowth P
lanO
peratio
nal p
erform
anceC
orp
orate
inform
ation
Performance data Financial information
Condensed consolidated balance sheet
At December 31 ($m) 2015 2014
AssetsCurrent assets:
Cash and cash equivalents 1,141 1,638Trade receivables 4,128 3,698Other accounts receivable 845 747Inventories 4,345 4,861Derivative and other financial assets 401 377Other current assets 338 244Total current assets 11,198 11,565
Non-current assets:Property, plant and equipment 3,383 3,562Intangible assets 3,040 3,186Deferred tax assets 783 1,008Financial and other non-current assets 396 420Associates and joint ventures 177 188Total non-current assets 7,779 8,364
Total assets 18,977 19,929Liabilities and equity
Current liabilities:Trade accounts payable (3,311) (3,472)Current financial debt and other financial liabilities (730) (1,329)Income taxes payable (444) (706)Other current liabilities (983) (984)Provisions (193) (216)Total current liabilities (5,661) (6,707)
Non-current liabilities:Financial debt and other non-current liabilities (3,501) (2,976)Deferred tax liabilities (668) (665)Provisions (727) (676)Total non-current liabilities (4,896) (4,317)
Total liabilities (10,557) (11,024)Equity:
Shareholders’ equity (8,401) (8,889)Non-controlling interests (19) (16)Total equity (8,420) (8,905)
Total liabilities and equity (18,977) (19,929)

52 Syngenta Annual Review 2015
Condensed consolidated cash flow statement
Year ended December 31 ($m) 2015 2014
Income before taxes 1,592 1,895Reversal of non-cash items 1,203 808Cash (paid)/received in respect of:
Interest and other financial receipts 472 277Interest and other financial payments (623) (483)Income taxes (482) (330)Restructuring costs (125) (26)Contributions to pension plans, excluding restructuring costs (156) (184)Other provisions (80) (70)
Cash flow before change in net working capital 1,801 1,887Change in net working capital:
Change in inventories 32 326Change in trade and other working capital assets (868) (332)Change in trade and other working capital liabilities 225 50
Cash flow from operating activities 1,190 1,931Additions to property, plant and equipment (453) (600)Proceeds from disposals of property, plant and equipment 74 39Purchases of intangible assets (90) (82)Purchases of investments in associates and other financial assets (29) (38)Proceeds from disposals of intangible and financial assets 46 39Acquisitions and divestments, net (10) (87)Cash flow used for investing activities (462) (729)Increases in third party interest-bearing debt 1,098 2,272Repayments of third party interest-bearing debt (1,174) (1,556)(Purchases)/sales of treasury shares and options over own shares, net (34) (104)Distributions paid to shareholders (1,078) (1,032)Cash flow used for financing activities (1,188) (420)Net effect of currency translation on cash and cash equivalents (37) (46)Net change in cash and cash equivalents (497) 736Cash and cash equivalents at the beginning of the year 1,638 902Cash and cash equivalents at the end of the year 1,141 1,638
Free cash flow
Year ended December 31 ($m) 2015 2014
Cash flow from operating activities 1,190 1,931Cash flow used for investing activities (462) (729)Cash flow used for/(from) marketable securities – (1)Cash flow used for/(from) foreign exchange movements and settlement of hedges of inter-company loans 67 (118)Free cash flow 795 1,083

Perfo
rmance
data
Strateg
ic overview
Syngenta Annual Review 2015 53
Research and
D
evelop
ment
Cro
ps
in focu
sT
he Go
od
G
rowth P
lanO
peratio
nal p
erform
anceC
orp
orate
inform
ation
Performance data Financial information
Full year segmental results excluding restructuring and impairment
2015 ($m)Europe, Africa,
Middle EastNorth
AmericaLatin
AmericaAsia
PacificNon-
regionalTotal
integratedLawn and
Garden
Group
Sales 3,884 3,410 3,632 1,837 – 12,763 648 13,411Cost of goods sold (1,889) (1,779) (2,118) (1,012) 54 (6,744) (298) (7,042)Gross profit 1,995 1,631 1,514 825 54 6,019 350 6,369Marketing and distribution (586) (537) (557) (286) (83) (2,049) (161) (2,210)Research and development – – – – (1,310) (1,310) (52) (1,362)General and administrative (126) (84) (39) (35) (274) (558) (10) (568)Operating income/(loss) 1,283 1,010 918 504 (1,613) 2,102 127 2,229
2014 ($m)Europe, Africa,
Middle EastNorth
AmericaLatin
AmericaAsia
PacificNon-
regionalTotal
integratedLawn and
Garden
Group
Sales 4,547 3,582 4,279 2,033 – 14,441 693 15,134Cost of goods sold (2,167) (2,003) (2,492) (1,107) (92) (7,861) (318) (8,179)Gross profit 2,380 1,579 1,787 926 (92) 6,580 375 6,955Marketing and distribution (720) (564) (615) (314) (110) (2,323) (174) (2,497)Research and development – – – – (1,376) (1,376) (54) (1,430)General and administrative (161) (92) (77) (48) (307) (685) (32) (717)Operating income/(loss) 1,499 923 1,095 564 (1,885) 2,196 115 2,311
Segmental operating income reconciled to segmental results excluding restructuring and impairment
2015 ($m) Europe, Africa,
Middle EastNorth
AmericaLatin
AmericaAsia
PacificNon-
regional Total
integratedLawn and
Garden
Group
Operating income/(loss) 1,155 973 890 484 (1,781) 1,721 120 1,841Restructuring and impairment:
Expenses 128 37 28 20 168 381 7 388Operating income excluding restructuring and impairment 1,283 1,010 918 504 (1,613) 2,102 127 2,229Operating margin (%) 33.1 29.6 25.3 27.5 n/a 16.5 19.6 16.6
2014 ($m) Europe, Africa,
Middle EastNorth
AmericaLatin
AmericaAsia
PacificNon-
regionalTotal
integratedLawn and
Garden
Group
Operating income/(loss) 1,456 901 1,069 560 (1,981) 2,005 100 2,105Restructuring and impairment:
Cost of goods sold 1 13 – – – – 13 – 13Expenses 30 22 26 4 96 178 15 193
Operating income excluding restructuring and impairment 1,499 923 1,095 564 (1,885) 2,196 115 2,311Operating margin (%) 33.0 25.8 25.6 27.8 n/a 15.2 16.6 15.3
1 Reversal of inventory step-up
54 Syngenta Annual Review 2015
Constant exchange rates (CER)Results in this report from one period to another period are, where appropriate, compared using constant exchange rates (CER). To present that information, current period results for entities reporting in currencies other than US dollars are converted into US dollars at the prior period’s exchange rates, rather than at the exchange rates for the current year. CER margin percentages for gross profit and EBITDA are calculated by the ratio of these measures to sales after restating the measures and sales at prior period exchange rates. The CER presentation indicates the underlying business performance before taking into account currency exchange fluctuations.
EBITDAEBITDA is defined as earnings before interest, tax, non-controlling interests, depreciation, amortization, restructuring and impairment. Information concerning EBITDA has been included as it is used by management and by investors as a supplementary measure of operating performance. Management excludes restructuring from EBITDA in order to focus on results excluding items affecting comparability from one period to the next. EBITDA is not a measure of cash liquidity or financial performance under generally accepted accounting principles and the EBITDA measures used by Syngenta may not be comparable to other similarly titled measures of other companies. EBITDA should not be construed as an alternative to operating income or cash flow as determined in accordance with generally accepted accounting principles.
Restructuring and impairment before taxesRestructuring represents the effect on reported performance of initiating and enabling business changes that are considered major and that, in the opinion of management, will have a material effect on the nature and focus of Syngenta’s operations, and therefore require separate disclosure to provide a more thorough understanding of business performance.
Restructuring includes the incremental costs of closing, restructuring or relocating existing operations, and gains or losses from related asset disposals. Restructuring also includes the effects of analyzing and preparing for potential industry consolidation transactions as well as completing and integrating significant business combinations and divestments, including related transaction costs, gains and losses. Recurring costs of normal business operations and routine asset disposal gains and losses are excluded.
Impairment includes impairment losses associated with major restructuring as well as impairment losses and reversals of impairment losses resulting from major changes in the markets in which a reported segment operates.
The incidence of these business changes may be periodic and the effect on reported performance of initiating them will vary from period to period. As each such business change is different in nature and scope, there will be little continuity in the detailed composition and size of the reported amounts which affect performance in successive periods. Separate disclosure of these amounts facilitates the understanding of performance including and excluding items affecting comparability. Syngenta’s definition of restructuring and impairment may not be comparable to similarly titled line items in financial statements of other companies.
Free cash flowFree cash flow comprises cash flow from operating and investing activities: excluding investments in and proceeds from marketable securities, which are included in investing activities; excluding cash flows from and used for foreign exchange movements and settlement of related hedges on inter-company loans, which are included in operating activities; and including cash flows from acquisitions of non-controlling interests, which are included in financing activities.
Free cash flow is not a measure of financial performance under generally accepted accounting principles and the free cash flow measure used by Syngenta may not be identical to similarly titled measures of other companies. Free cash flow has been included as it is used by many investors as a useful supplementary measure of cash generation.
Net debt reconciliationNet debt comprises total debt net of cash and cash equivalents and marketable securities. During 2015, Syngenta redefined net debt to exclude fair values of financing-related derivatives, as these are now offset by the financial assets and liabilities arising from collateral paid and received under Credit Support Annex contracts (CSAs). Net debt is not a measure of financial position under generally accepted accounting principles and the net debt measure used by Syngenta may not be comparable to the similarly titled measure of other companies. Net debt has been included as it is used by many investors as a useful measure of financial position and risk. The following table presents the derivation of the debt/equity gearing ratio:
($m) 2015 20141
Net debt 2,586 2,248Shareholders’ equity 8,401 8,889Debt/Equity gearing ratio 31% 25%
1 Under the definition of net debt used in 2014, debt/equity gearing ratio was 27%
Cash flow return on investment
Cash flow return on investment is a measure used by Syngenta to compare cash returns to average invested capital. Gross cash flow used in the calculation comprises cash flow before change in net working capital, excluding interest and other financial receipts and payments. Invested capital comprises: total current assets, excluding cash and derivative and other financial assets; total non-current assets, excluding non-current derivative and other financial assets and defined benefit pension assets, and adjusted to reflect the gross book values of property, plant and equipment and intangible assets; total current liabilities, excluding current financial debt and other financial liabilities; and deferred tax liabilities.
Perfo
rmance
data
Strateg
ic overview
Syngenta Annual Review 2015 55
Research and
D
evelop
ment
Cro
ps
in focu
sT
he Go
od
G
rowth P
lanO
peratio
nal p
erform
anceC
orp
orate
inform
ation
Performance data Non-financial information
Non-financial informationAt Syngenta, non-financial information refers to quantitative and qualitative information on strategies, policies or activities pursued towards our business, environmental and social goals.
Our non-financial performance is reported throughout this Annual Review and quantified in the Non-financial performance summary on pages 57 to 62.
Corporate ResponsibilityCorporate Responsibility (CR) is integral to our business. Our ambition is to bring greater food security to an increasingly populous world in an environmentally sustainable way by creating a worldwide step change in farm productivity. The Good Growth Plan sets specific, ambitious and measurable targets focused on boosting resource efficiency, rejuvenating ecosystems and strengthening rural communities. We are also committed to developing our people, reducing our environmental footprint, enhancing our social engagement, raising supply chain sustainability and doing business responsibly. Syngenta is guided by the conviction that short-, medium- and long-term value creation depends on successfully integrating business, social and environmental performance.
Corporate Responsibility governanceOur Board-level Corporate Responsibility Committee, chaired by the Syngenta Chairman, acts as custodian on all CR matters. At senior executive level, the Corporate Responsibility Panel directs CR-related standards, strategy, objectives and partnerships, and the Compliance and Risk Management Committee reviews and advises on non-financial reporting and the effectiveness of implementation of internal policies.
Materiality and stakeholder engagementWe regularly assess stakeholder concerns and expectations, as well as the issues that we believe present the greatest risks and opportunities for our business. We engage with and collect feedback from stakeholders in a variety of ways. We listen to the grower community through satisfaction surveys and farmers’ direct contact with our sales teams on the ground. We also engage directly with our employees and locally with the communities close to our operations.
Our interaction with industry associations, non-governmental organizations, governments and the investor community enables us to gather feedback on our activities and monitor issues important to stakeholders. We conduct research to better understand consumers’ perceptions of topics associated with agriculture and our industry; and we aim to be open and accessible – for example, answering their frequently asked questions under “Questions about Syngenta” on our website.
In 2015, we conducted an assessment to identify our most material issues to help drive our strategy, determine allocation of effort and resources, and guide our external communication and reporting. The most important issue to our stakeholders is our contribution to food security. In particular, they want to know how our technologies and products will enable growers to deliver sustainably the quality and quantity of food needed by a growing population. We contribute to addressing these issues through our Good Growth Plan.
Director level
Senior executive level
Board of Directors
Compliance and Risk Management Committee
Corporate Responsibility Committee
Corporate Responsibility Panel

Materiality matrix
We have three levels of disclosure based on the importance of the issues to our stakeholders and to Syngenta.
56 Syngenta Annual Review 2015
Approach to non-financial reportingThe Non-financial performance summary on the following pages presents data on our progress towards four goals:
The Good Growth PlanHelp shape the future sustainability of agriculture, and deliver solutions that are better, more productive and more beneficial to rural economies
PeopleAttract and retain talent while creating an environment that stimulates innovation and personal performance and development
Sustainable operationsManage our environmental footprint and maintain the highest standards in our operations
Business integrityMaintain the highest standards across our entire business and go beyond regulatory compliance, while benefiting the communities and economies in which we operate
Our non-financial reporting is for the operations of Syngenta Group, including material interactions with selected third parties as reported in the Non-financial performance summary. Our non-financial reporting is guided by the Global Reporting Initiative principles and is externally assured, see page 63. The non-financial reporting period is October 1 to September 30.
Syngenta is a signatory to the United Nations Global Compact. Syngenta’s Annual Report serves as our Communication on Progress (COP) made in implementing these principles.
Approval of Non-financial performance summaryThe information in the Non-financial performance summary on pages 57 to 62 of the Annual Review was approved by the Board of Directors on February 2, 2016. Syngenta’s Board of Directors and management are responsible for establishing and maintaining adequate internal controls over non-financial reporting.
Syngenta’s internal controls over non-financial reporting were designed to provide assurance to Syngenta’s Board of Directors and management regarding the reliability of non-financial reporting and the preparation and fair presentation of the information published in the Non-financial performance summary.
All internal controls, no matter how well designed, have inherent limitations and therefore may not prevent or detect misstatements. In designing internal controls over non-financial reporting, Syngenta used the criteria established in Internal Control – Integrated Framework (2013) issued by the Committee of Sponsoring Organizations of the Treadway Commission (COSO). PricewaterhouseCoopers AG, Switzerland, an independent registered public accounting firm, has issued an opinion on Syngenta’s Non-financial performance summary, which is included in the Annual Review on page 63.
Read more on: www.cr.syngenta.com www.questions.syngenta.com www.gri.syngenta.com
Focus areas We share our views, we measure and evaluate performance, and we have set or plan to set goals or quantitative targets on the most important issues, in particular our contribution to food security.
Biodiversity
Energy, hazardous waste and water use
Health, safety and wellbeing
Human rights and fair labor practices
Land productivity
Logistics optimization
Product stewardship
Science and intellectual property
Smallholder empowerment
Soil and water conservation
Supply chain sustainability
Talent attraction and retention
Monitored activitiesWe share our views, and we measure and evaluate performance on these issues to sustain the trust and confidence of our stakeholders, and for us to be a responsible business.
Animals in research
Community relations and stakeholder engagement
Corporate conduct
Corporate governance
Economic value shared
Environmental compliance and liabilities
Greenhouse gas and other air emissions
Product responsibility compliance
Security practices
PositionsWe share our views on the issues that engage public interest and have a bearing on our business.
Biofuels
Biotechnology
Climate change adaptation
Diminishing crop diversity and monoculture practices
Food availability, affordability and waste
Land grabbing
Local investment and sourcing
Marketing practices
Organic agriculture
Pollinators and pesticide use
Product registration
Public policy and advocacy
Responsible practices for product development
Rural development
Tax transparency
Transparency
Positions
Monitored activities
Focus areas
Importance to Syngenta
Imp
ort
ance
to s
take
hold
ers

Perfo
rmance
data
Strateg
ic overview
Syngenta Annual Review 2015 57
Research and
D
evelop
ment
Cro
ps
in focu
sT
he Go
od
G
rowth P
lanO
peratio
nal p
erform
anceC
orp
orate
inform
ation
Performance data Non-financial information
Non-financial performance summaryThe Good Growth Plan
2015 2014 2013
Make crops more efficient 1
Total number of reference farms 1,062 860 –Total number of benchmark farms 2,586 2,738 –Annual average productivity increase on reference farms compared to baseline 2014 2% – –
Performance of reference farm clusters compared to baseline 2014 3, 4
Performance of benchmark farm clusters compared to baseline 2014 3, 4
2015 2014 2013 2015 2014 2013
Total number of clusters 2 172 205 – 172 205 –Land productivity index:
≤0% 148 205 – 149 205 –>0 – <5% 6 – – 6 – –5 – <10% 5 – – 5 – –10 – <15% 3 – – 3 – –15 – <20% 4 – – 4 – –≥20% 6 – – 5 – –
Nutrient efficiency index:≤0% 148 205 – 146 205 –>0 – <5% 2 – – 5 – –5 – <10% 0 – – 2 – –10 – <15% 5 – – 4 – –15 – <20% 2 – – 2 – –≥20% 15 – – 13 – –
Pesticide efficiency index:≤0% 145 205 – 146 205 –>0 – <5% 4 – – 2 – –5 – <10% 1 – – 2 – –10 – <15% 3 – – 1 – –15 – <20% 0 – – 1 – –≥20% 19 – – 20 – –
1 2014 first year of reporting2 Reduced number of clusters in 2015 due to cluster consolidation3 2014 value was restated to represent clusters with reference and/or benchmark farms4 Number of clusters with reference and/or benchmark farms per range of percentage increase in land productivity, nutrient efficiency and pesticide efficiency
since the 2014 baseline. US Department of Agriculture data are used for benchmark farms in clusters located in the USA
The table above presents the number of reference farms, benchmark farms and clusters in the network. It also outlines the distribution of percentage increases in land productivity, nutrient efficiency and pesticide efficiency on a cluster basis.
A cluster presents homogeneous agro-climatic conditions and contains reference and/or benchmark farms with similar grower characteristics. Reference farms were selected by Syngenta and are recommended to use Syngenta products and follow optimized protocols. Benchmark farms were randomly selected by a third-party research agency and represent grower practice for each cluster. The reduction of clusters in 2015 versus 2014 was due to the consolidation of some clusters with similar conditions and characteristics.
Performance of reference and benchmark farm clusters compared to baseline 2014 represents the distribution of percentage increases achieved in reference and benchmark farms compared to the baseline year on a cluster basis. The table is set up to show trends over time on reference and benchmark farms. As the baseline year is 2014, all clusters are reported as “≤0%” in 2014.
Read more about how we are measuring The Good Growth Plan on www.data.syngenta.com

58 Syngenta Annual Review 2015
The Good Growth Plan continued Cumulative since baseline 2014 2015 2014 2013
Rescue more farmland 1
Hectares of impacted farmland (m) 2.4 1.6 0.8 –
Help biodiversity flourish 1 Hectares of impacted farmland (m) 1.6 0.9 0.7 –
Empower smallholders 1
Smallholders reached through sales (m) 2 17.2 13.8 –
Help people stay safePeople trained on safe use (m) 10.4 5.7 4.7 2.8
Of which: smallholders 1 72% 71% 74% –Countries with established Syngenta product toxicovigilance programs 100 100 100
Crop Protection sales represented 93% 93% 93%
Look after every workerSeed supply farms included in Syngenta Fair Labor Program 3, 4 27,091 28,361 22,895
Of which: farms in Fair Labor Association (FLA)’s audit scope 4 18,571 28,361 22,895 Total seed supply farms covered by Syngenta Fair Labor Program 3, 5 84% 53% – HSEQ assessments at chemical suppliers 84 72 86HSEQ assessments at formulation, fill and packaging suppliers and seed toll manufacturing 6 34 74 38HSEQ assessments at warehouse/logistics service providers 118 156 157
1 2014 first year of reporting2 2014 value was restated due to clarification of definitions and scope3 Until 2014, figure included only number of farms in Fair Labor Association (FLA)’s audit scope4 Reduction in 2015 due to decrease in production volumes and reorganization of seed suppliers5 2014 value was estimated and not assured6 Seed toll manufacturing has been included since 2014
Read more about how we are measuring The Good Growth Plan on www.data.syngenta.com
People2015 2014 2013
EmploymentEmployees 1 28,704 29,340 28,149
Europe, Africa and Middle East 2 13,047 13,300 12,763North America 4,335 4,636 4,654Latin America 4,962 4,945 5,221Asia Pacific 6,360 6,459 5,511
Part-time employees 984 948 976Turnover rate 3 12.5% 9.9% 14.1%
of which: <35 years 41% 43% 43%35–50 years 43% 41% 35%>50 years 16% 16% 22%
Attrition rate 4 6.1% 5.5% 5.5%Senior managers 332 359 366
Headquarters 44% 42% 47%Europe, Africa and Middle East 16% 18% 13%North America 18% 18% 18%Latin America 12% 12% 12%
Asia Pacific 10% 10% 10%
1 Permanent full-time equivalent (FTE)2 Including headquarters (Switzerland)3 Including voluntary leavers, retirees and restructuring4 Includes only voluntary leavers

Perfo
rmance
data
Strateg
ic overview
Syngenta Annual Review 2015 59
Research and
D
evelop
ment
Cro
ps
in focu
sT
he Go
od
G
rowth P
lanO
peratio
nal p
erform
anceC
orp
orate
inform
ation
Performance data Non-financial information
People continued2015 2014 2013
DiversityNationalities in senior management 1 33 37 41Female employees 30% 29% 30%Female employees in management roles 22% 21% 20%Female employees in senior management 14% 13% 13%
Employee development 2
Training investment ($ m) 25.1 29.8 27.1Average training investment per employee ($ ) 3 874 1,015 964
Reward and recognitionEmployees eligible to participate in Employee Share Purchase Plan (ESPP) 4 20,088 20,666 18,790
of which: employees participating 4 44% 44% 47%Employees participating in long-term equity incentive plans 1,370 1,304 1,226
Health, safety and wellbeingRecordable injury and illness rate (IIR) per 200,000 hours 5 0.38 0.37 0.41Recordable injury rate per 200,000 hours 5 0.35 0.33 0.35
Europe, Africa and Middle East 6 0.48 0.41 0.38North America 0.69 0.54 0.64Latin America 0.24 0.41 0.38Asia Pacific 0.11 0.10 0.15
Recordable occupational illness rate per 200,000 hours 5 0.03 0.04 0.07Europe, Africa and Middle East 6 0.04 0.03 0.07North America 0.04 0.02 0.14Latin America 0.06 0.12 0.08Asia Pacific 0.01 0.01 0.02
First aid cases 413 420 623Recordable injuries 7 154 145 148
Bruise, strain, sprain and dislocation 39% 52% 44%Cut and abrasion 31% 19% 22%Bone fracture 13% 11% 15%Concussion and internal injury 3% 4% 1%Multiple injuries 1% 3% –Other 13% 11% 18%
Cases of recordable occupational illness 14 17 28Cases of work-related stress 26 35 36
1 2014 value was restated due to a calculation error and revised definition2 Includes only training delivered by external providers 3 Permanent full-time equivalent (FTE) 4 2014 value was restated due to late reporting from one country5 According to US OSHA definition for injuries and illness6 Including headquarters (Switzerland)7 New reporting system and injury categories introduced in 2014. 2013 percentages were restated in 2014 to align to new breakdown

60 Syngenta Annual Review 2015
Sustainable operations2015 2014 2013
EnergyEnergy intensity (MJ/$sales) 0.69 0.66 0.69 Energy (TJ) 9,222 9,930 10,202
Gas (TJ) 3,840 3,946 4,050 Electricity (TJ) 2,349 2,460 2,459 Steam (TJ) 1,547 1,633 1,578 Oil (TJ) 536 854 975 Other (TJ) 950 1,037 1,140
Greenhouse gases Total CO2e emissions intensity (g/$sales) 124 114 116 Total CO2e emissions (000s tonnes) 1,660 1,730 1,710 Within direct control:
CO2e emissions from own operations (000s tonnes) 574 620 634CO2 emissions from company vehicles (000s tonnes) 70 75 76
Within indirect control:CO2e emissions from purchased energy (000s tonnes) 400 419 417 CO2 emissions from business trips (000s tonnes) 36 43 40 CO2 emissions from distribution (000s tonnes) 580 573 543
Other air emissionsOther air emissions intensity (g/$sales) 0.088 0.099 0.103 Other air emissions (tonnes) 1,176 1,500 1,514
NOx (tonnes) 462 523 440Non-halogenated VOCs (tonnes) 384 435 427Halogenated VOCs (tonnes) 26 32 21Particulates (tonnes) 79 101 105SO2 (tonnes) 210 386 494NH3 (tonnes) 6 6 8HCl (tonnes) 9 17 19
WaterWater usage intensity (liters/$sales) 2.6 2.5 2.5Water usage (million cubic meters) 35.0 37.8 36.8
Cooling (million cubic meters) 20.8 21.2 19.4Irrigation (million cubic meters) 6.8 7.0 7.6Processing and washing (million cubic meters) 5.3 7.3 7.4Product ingredient (million cubic meters) 0.2 0.3 0.3Sewage and sanitary (million cubic meters) 1.1 1.0 1.1Other (million cubic meters) 0.8 1.0 1.0
Origin of water:Surface fresh water (million cubic meters) 24.4 26.7 25.6Underground water (million cubic meters) 7.8 7.7 7.8Drinking water from municipal network (million cubic meters) 2.7 2.9 3.0Recovered rain water (million cubic meters) 0.1 0.1 0.1Saline water (million cubic meters) 0.0 0.4 0.3
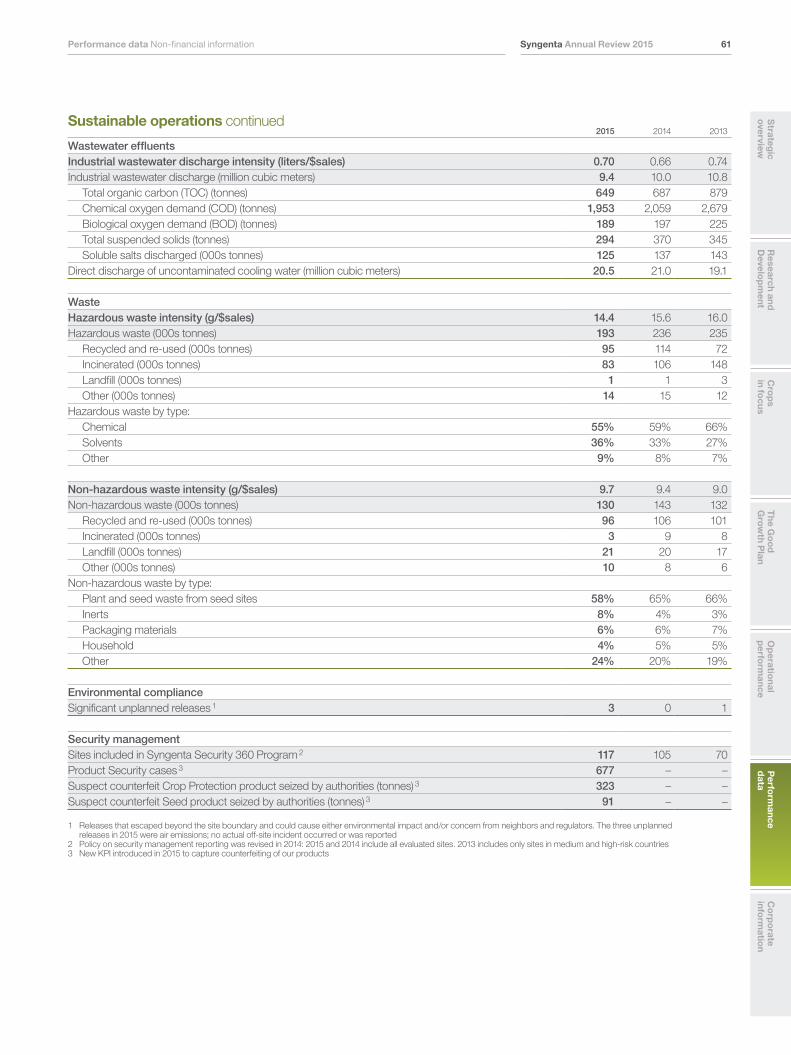
Perfo
rmance
data
Strateg
ic overview
Syngenta Annual Review 2015 61
Research and
D
evelop
ment
Cro
ps
in focu
sT
he Go
od
G
rowth P
lanO
peratio
nal p
erform
anceC
orp
orate
inform
ation
Performance data Non-financial information
Sustainable operations continued2015 2014 2013
Wastewater effluentsIndustrial wastewater discharge intensity (liters/$sales) 0.70 0.66 0.74Industrial wastewater discharge (million cubic meters) 9.4 10.0 10.8
Total organic carbon (TOC) (tonnes) 649 687 879 Chemical oxygen demand (COD) (tonnes) 1,953 2,059 2,679 Biological oxygen demand (BOD) (tonnes) 189 197 225 Total suspended solids (tonnes) 294 370 345 Soluble salts discharged (000s tonnes) 125 137 143
Direct discharge of uncontaminated cooling water (million cubic meters) 20.5 21.0 19.1
WasteHazardous waste intensity (g/$sales) 14.4 15.6 16.0 Hazardous waste (000s tonnes) 193 236 235
Recycled and re-used (000s tonnes) 95 114 72 Incinerated (000s tonnes) 83 106 148 Landfill (000s tonnes) 1 1 3 Other (000s tonnes) 14 15 12
Hazardous waste by type:Chemical 55% 59% 66%Solvents 36% 33% 27%Other 9% 8% 7%
Non-hazardous waste intensity (g/$sales) 9.7 9.4 9.0 Non-hazardous waste (000s tonnes) 130 143 132
Recycled and re-used (000s tonnes) 96 106 101Incinerated (000s tonnes) 3 9 8Landfill (000s tonnes) 21 20 17Other (000s tonnes) 10 8 6
Non-hazardous waste by type:Plant and seed waste from seed sites 58% 65% 66%Inerts 8% 4% 3%Packaging materials 6% 6% 7%Household 4% 5% 5%Other 24% 20% 19%
Environmental complianceSignificant unplanned releases 1 3 0 1
Security managementSites included in Syngenta Security 360 Program 2 117 105 70Product Security cases 3 677 – –Suspect counterfeit Crop Protection product seized by authorities (tonnes) 3 323 – –Suspect counterfeit Seed product seized by authorities (tonnes) 3 91 – –
1 Releases that escaped beyond the site boundary and could cause either environmental impact and/or concern from neighbors and regulators. The three unplanned releases in 2015 were air emissions; no actual off-site incident occurred or was reported
2 Policy on security management reporting was revised in 2014: 2015 and 2014 include all evaluated sites. 2013 includes only sites in medium and high-risk countries3 New KPI introduced in 2015 to capture counterfeiting of our products

62 Syngenta Annual Review 2015
Business integrity2015 2014 2013
Corporate conduct Compliance cases reported 1 196 96 110
Animal testing compliance Management system audits performed in contract laboratories 13 17 13
Management system non-compliances found 0 0 0
Biotechnology and regulatory compliance Employees completing trial regulatory compliance training 1,627 1,711 1,228Trial locations requiring a permit 2 155 411 420Trial inspections performed by Syngenta 169 203 272
Economic value sharedEconomic value shared ($ m) 13,440 14,982 14,864
Payments to suppliers 3 8,453 9,613 9,792Employee wages and benefits 4 2,725 2,888 2,828Payments to governments (taxes) 5 432 366 405Payments to providers of capital 6 1,223 1,285 1,139Capital expenditure 7 583 805 679Corporate community investment 8 24 25 21
1 Since 2015, the number of cases reported includes all cases managed by Group Compliance: cases reported through the compliance helpline, line management, directly to Group Compliance or other channels. In previous years, the value only included cases reported via the helpline
2 In 2015, an additional 220 North American trial locations not requiring a permit were handled as regulated and managed in accordance with the North American Regulatory Compliance Program
3 Decrease in Payments to suppliers mainly reflects lower production activity due to lower sales and efforts to reduce inventory4 Employee benefits and wages increased due to termination costs from the AOL restructuring program, but show a decrease due to the impact of foreign exchange translation5 Consists of income and other taxes paid, excluding VAT (included in Payments to suppliers) and employment-related taxes (included in Employee wages and benefits)6 Consists of expenditures for dividends, share repurchases (excluding those for employee share plans) and interest on debt7 Decrease in capital expenditure reflects lower investment in Property, Plant and Equipment during the period8 The PwC Independent Assurance Report includes in its scope only the Corporate community investment figure used in the calculation of Economic value shared

Perfo
rmance
data
Strateg
ic overview
Syngenta Annual Review 2015 63
Research and
D
evelop
ment
Cro
ps
in focu
sT
he Go
od
G
rowth P
lanO
peratio
nal p
erform
anceC
orp
orate
inform
ation
Performance data Non-financial information
Independent Assurance Report on the Syngenta Non-financial ReportingTo the Board of Directors, Syngenta AG, Basel (‘Syngenta’)
We have been engaged to perform assurance procedures to provide assurance on the Non-financial performance summary of Syngenta included in the Annual Review 2015 (‘Report’).
Scope and Subject matter Our assurance engagement and the related levels of assurance focused on the data and information disclosed in the aggregated non-financial reporting of Syngenta for the financial year ended December 31, 2015:Reasonable AssuranceThe following subject matter contained in the Report is within the scope of the reasonable assurance: – The application of the Syngenta reporting guidelines published on The Good Growth Plan Progress Data website in the non-financial reporting; and
– the internal reporting system and procedures to collect and aggregate the non-financial data for the six Good Growth Plan commitments on page 56, excl. the materiality matrix; and
– the data and information in the Non-financial performance summary, in all material aspects, on pages 57 and 58 (excl. people indicators) of the Report.
Limited AssuranceThe related Non-financial performance summary disclosed, in all material aspects, on pages 58 (limited to people indicators) to 62 of the Report is within the scope of the limited assurance.
Our assurance procedures do not cover the indicators on payments to suppliers, employee wages and benefits, payments to governments and providers of capital, and capital expenditure presented in the related Non-financial performance summary on page 62 of the Report.
CriteriaThe reporting criteria used by Syngenta are described and disclosed on The Good Growth Plan Progress Data website and in the internal non-financial reporting guidelines. These define those procedures based on the related sections of the ‘Standard Disclosure’ of the Sustainability Reporting Guidelines G4 published in 2013 by the Global Reporting Initiative (GRI), by which the non-financial performance data are internally gathered, collated and aggregated.
The accuracy and completeness of non-financial performance indicators are subject to inherent limitations given their nature and methods for determining, calculating and estimating such data. Accordingly, our assurance report should therefore be read together with the related reporting criteria.
Responsibilities and MethodologyThe Board of Directors of Syngenta AG is responsible for both the subject matter and the reporting criteria as well as for the entire reporting process of the selected information in accordance with the criteria. This responsibility includes the design, implementation and maintenance of related internal control relevant to this reporting process that is free from material misstatement, whether due to fraud or error.
Our responsibility is to perform a limited or reasonable assurance engagement to express an opinion on positions in the related Non-financial performance summary on pages 57 to 62. We planned and conducted our engagement in accordance with International Standard on Assurance Engagements (ISAE 3000) (revised) ‘Assurance engagements other than audits or reviews of historical financial information’. That standard requires that we comply with ethical requirements and plan and perform our procedures to obtain reasonable or limited assurance whether the related Non-financial performance summary were prepared, in all material aspects, in accordance with the Reporting Criteria.
A limited assurance engagement under ISAE 3000 (revised) is substantially less in scope than a reasonable assurance engagement in relation to both the risk assessment procedures, including an understanding of internal control, and the procedures performed in response to the assessed risks. Consequently, the nature, timing and extent of procedures for gathering sufficient appropriate evidence are deliberately limited relative to a reasonable assurance engagement and therefore less assurance is obtained with a limited assurance engagement than for a reasonable assurance engagement.
The procedures selected depend on the assurance practitioner’s judgment.
Our Independence and Quality ControlWe have complied with the independence and other ethical requirements of the Code of Ethics for Professional Accountants issued by the International Ethics Standards Board for Accountants, which is founded on fundamental principles of integrity, objectivity, professional competence and due care, confidentiality and professional behavior.
Our firm applies International Standard on Quality Control 1 and accordingly maintains a comprehensive system of quality control including documented policies and procedures regarding compliance with ethical requirements, professional standards and applicable legal and regulatory requirements.
Summary of work performedOur assurance procedures included the following work but not limited to: – Evaluation of the application of group guidelines;
– Visits of six different sites in Argentina and Brazil selected based on quantitative and qualitative criteria;
– Testing of the performance indicators on a sample basis for evidence supporting the Non-financial performance summary relative to completeness, accuracy, adequacy and consistency;
– Review of the documentation supporting relevant data on a sample basis, including management and reporting structures and documentation;
– Reviewing the management and reporting processes. Assessing the consolidation process of data at the Group level.
We have neither carried out any work in respect of projections and targets nor such outside of the agreed scope.
We believe that the evidence we have obtained is sufficient and appropriate to provide a basis for our assurance conclusions.
Reasonable assurance conclusionIn our opinion, – The Good Growth Plan guidelines as published on The Good Growth Plan Progress Data website are being applied, in all material aspects; and
– The internal reporting systems to collect and aggregate The Good Growth Plan data are functioning as designed and provide an appropriate basis for this reporting; and
– The data and information disclosed in the Non-financial performance summary in the Report on pages 57 and 58 (excl. people indicators) give a fair picture of Syngenta’s non-financial performance.
Limited assurance conclusionBased on our work performed on the related Non-financial performance summary nothing has come to our attention causing us to believe that disclosed data and information in the related Non-financial performance summary in the Report on pages 58 (limited to the people indicators) to 62 does not give a fair picture of Syngenta’s non-financial performance, in all material aspects, in accordance with the reporting criteria.
PricewaterhouseCoopers AG Zurich, February 16, 2016 Gerd Tritschler Bettina Buomberger

64 Syngenta Annual Review 2015
Board of Directorsat December 31, 2015
Syngenta is led by a strong and experienced Board of Directors. The Board includes representatives with seven nationalities, drawn from broad international business and scientific backgrounds. Its members bring diversity in expertise and perspective to the leadership of a complex, highly-regulated, global business.
1
4
7
2
5
8
3
6
9
1 Michel DemaréChairman of the Board, non-executive Director. Chairman of the Chairman’s & Governance Committee, the Corporate Responsibility Committee and the Nomination Committee. He is also Chairman of the Syngenta Foundation for Sustainable Agriculture
Born: 1956 Nationality: Belgian Initial appointment: 2012
2 Jürg WitmerVice Chairman, non-executive Director. Chairman of the Compensation Committee, member of the Chairman’s & Governance Committee and the Nomination Committee
Born: 1948 Nationality: Swiss Initial appointment: 2006
3 Vinita BaliNon-executive Director. Member of the Corporate Responsibility Committee
Born: 1955 Nationality: Indian Initial appointment: 2012
4 Stefan BorgasNon-executive Director. Member of the Audit Committee
Born: 1964 Nationality: German Initial appointment: 2009
5 Gunnar BrockNon-executive Director. Chairman of the Audit Committee and member of the Nomination Committee
Born: 1950 Nationality: Swedish Initial appointment: 2012
6 Eleni Gabre-MadhinNon-executive Director. Member of the Corporate Responsibility Committee
Born: 1964 Nationality: Swiss Initial appointment: 2013
7 David LawrenceNon-executive Director. Member of the Audit Committee and Chairman of the Science and Technology Advisory Board
Born: 1949 Nationality: British Initial appointment: 2009
8 Eveline SaupperNon-executive Director. Member of the Compensation Committee
Born: 1958 Nationality: Swiss Initial appointment: 2013
9 Jacques VincentNon-executive Director. Member of the Compensation Committee
Born: 1946 Nationality: French Initial appointment: 2005
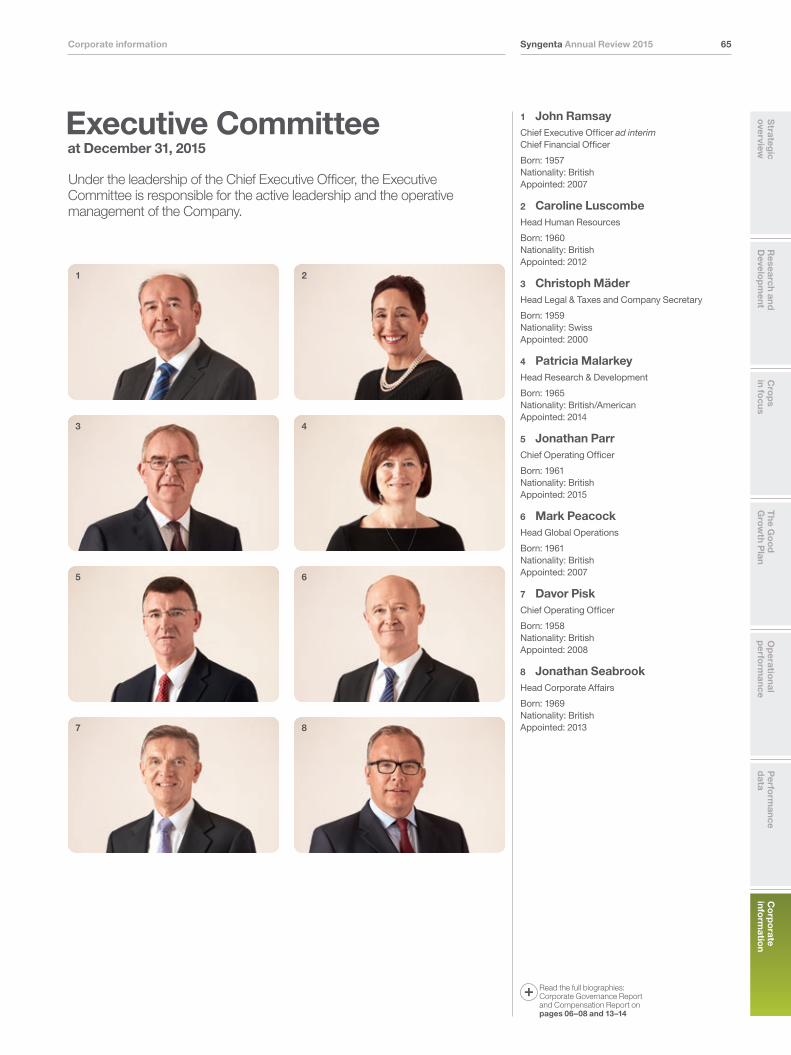
Co
rpo
rate info
rmatio
nS
trategic
overview
Syngenta Annual Review 2015 65
Research and
D
evelop
ment
Cro
ps
in focu
sT
he Go
od
G
rowth P
lanO
peratio
nal p
erform
anceP
erform
ance d
ata
Corporate information
Executive Committeeat December 31, 2015
Under the leadership of the Chief Executive Officer, the Executive Committee is responsible for the active leadership and the operative management of the Company.
1
4
7
2
5
8
3
6
1 John RamsayChief Executive Officer ad interim Chief Financial Officer
Born: 1957 Nationality: British Appointed: 2007
2 Caroline LuscombeHead Human Resources
Born: 1960 Nationality: British Appointed: 2012
3 Christoph MäderHead Legal & Taxes and Company Secretary
Born: 1959 Nationality: Swiss Appointed: 2000
4 Patricia MalarkeyHead Research & Development
Born: 1965 Nationality: British/American Appointed: 2014
5 Jonathan ParrChief Operating Officer
Born: 1961 Nationality: British Appointed: 2015
6 Mark PeacockHead Global Operations
Born: 1961 Nationality: British Appointed: 2007
7 Davor PiskChief Operating Officer
Born: 1958 Nationality: British Appointed: 2008
8 Jonathan SeabrookHead Corporate Affairs
Born: 1969 Nationality: British Appointed: 2013
Read the full biographies: Corporate Governance Report and Compensation Report on pages 06–08 and 13–14

66 Syngenta Annual Review 2015
Syngenta shares are listed on the SIX Swiss Exchange and on the New York Stock Exchange, where the shares are traded as ADS (American Depositary Shares).1
Trading symbols
SIX Swiss Exchange
New York Stock
Exchange
Shares SYNN SYT
Shares in issueAt December 31, 2015 Number of shares
Total shares in issue 92,945,649
of which treasury shares 1,161,397
Share price and market capitalization 2
At December 31, 2015
Share price (CHF) 392.30
Share price ($) (ADS) 78.73
Market capitalization (CHF million) 36,007
Market capitalization ($ million) 36,283
Dividend historyCHF
2011 8.00
2012 9.50
2013 10.00
2014 11.00
2015 3 11.00
1 1 share = 5 ADS2 For the purposes of calculating market capitalization
the number of shares stood at 91.8 million3 To be submitted to shareholders for approval
at the Annual General Meeting on April 26, 2016
Reporting dates
First quarter trading statement April 20, 2016
Annual General Meeting April 26, 2016
Half-year results July 22, 2016
Third quarter trading statement October 25, 2016
A full form 20-F is accessible at: www.investors.syngenta.comInvestors can subscribe to media releases by email or via RSS at: www.investors.syngenta.comThe full year results press release can be viewed up to six months after the event at: www.fyr-2015.syngenta.com
Shareholder information
%50
45
30
25
40
35
5
0
10
-5
-10
20
15
-15
Syngenta ADS S&P 500 Dow Jones
Syngenta ADS price performance January 1, 2015 – December 31, 2015
Dec 31, 2015$78.73
High: $93.61Low: $61.92
(Indexed to zero at closing price on December 31, 2014)
Jan Feb Mar Apr May Jun Jul Sep Oct NovAug Dec
* Closing high/low during the year
*
35
30
%
20
25
15
10
5
0
-5
-10
-15
Syngenta Eurotop 300 SMI
Syngenta share price performance January 1, 2015 – December 31, 2015
Jan Feb Mar Apr May Jun Jul Sep Oct NovAug Dec
Dec 31, 2015CHF392.30
High: CHF430.80Low: CHF281.60
* Closing high/low during the year
(Indexed to zero at closing price on December 31, 2014)
*

Syngenta Annual Review 2015 67Corporate information
Research and
D
evelop
ment
Cro
ps
in focu
sT
he Go
od
G
rowth P
lanO
peratio
nal p
erform
anceP
erform
ance d
ataC
orp
orate
inform
ation
Strateg
ic overview
%
45
60
75
30
15
0
-15
Syngenta ADS S&P 500 Dow Jones
Syngenta ADS price performance January 1, 2011 – December 31, 2015
Dec 31, 2015$78.73$79.94$80.80$58.94 $64.24
Mar Jun Sep Mar Jun Sep Mar Jun Sep Mar Jun Sep Mar Jun Sep Dec2015
Dec2011
Dec2012
Dec2013
Dec2014
(Indexed to zero at closing price on December 31, 2010)
%60
50
30
40
20
0
-10
-20
-30
Syngenta Eurotop 300 SMI
10
Syngenta share price performance January 1, 2011 – December 31, 2015
Dec 31, 2015CHF392.30CHF355.20 CHF320.00CHF275.00 CHF366.60
Mar Jun Sep Mar Jun Sep Mar Jun Sep Mar Jun Sep Jun Sep Dec2015
Dec2011
Dec2012
Dec2013
Dec2014
(Indexed to zero at closing price on December 31, 2010)
Mar
150 200 250 300 350%100500
Total shareholder return1 January 1, 2006 – December 31, 2015
Syngenta share
Syngenta ADS
FTSE EU Chemicals
S&P US Chemicals
S&P 500
Eurotop 300
SMI
NASDAQ
1 Share price appreciation plus reinvested dividends, calculated on a monthly basis, indexed to closing price on December 31, 2005
Article number SYN01002.EN
Syn
gent
a A
nnua
l Rev
iew
201
5
Syngenta supports the 10 principles of the United Nations Global Compact through an established commitment to Corporate Responsibility and ongoing implementation of policies on human rights, fair labor, environmental protection and anti-corruption.
Switzerland Investor Relations T +41 61 323 5883 F +41 61 323 5880 E [email protected]
Media Relations T +41 61 323 2323 F +41 61 323 9044 E [email protected]
Share Register T +41 41 798 4833 F +41 41 798 4849 E [email protected]
Shareholder Services T +41 61 323 2121 F +41 61 323 5461 E [email protected]
Corporate Responsibility E [email protected]
Syngenta switchboard T +41 61 323 1111 F +41 61 323 1212 E [email protected]
USA Investor Relations T +1 202 737 6520 T +1 202 737 6521 E [email protected]
Media Relations T +1 202 737 8913 E [email protected]
Contacts for ADS holders T +1 888 269 2377 – from within the USA T +1 201 680 6825 – from outside the USA E [email protected]
Syngenta AG Corporate Affairs Schwarzwaldallee 215 P.O. Box CH-4002 Basel Switzerland
www.syngenta.com
For the business year 2015, Syngenta has published three books: the Annual Review 2015 (including information about our non-financial performance), the Financial Report 2015, and the Corporate Governance Report and Compensation Report 2015.
All documents were originally published in English. The Annual Review 2015 and the Corporate Governance Report and Compensation Report 2015 are also available in German.
These publications are also available on the Internet: www.syngenta.com
© 2016 Syngenta AG, Basel, Switzerland. All rights reserved.
Editorial completion: February 2016
Copywriting: KainesLang, Berwick-upon-Tweed, UK
Design and production: Radley Yeldar, London, UK
Printing: Stämpfli Ltd., Bern, Switzerland
Printed on Hello Silk, made with wood fiber from managed forests and manufactured at a mill that has achieved the ISO14001 and EMAS environmental management standards.
® Registered trademarks of a Syngenta Group Company
™ Trademarks of a Syngenta Group Company
The SYNGENTA Wordmark and BRINGING PLANT POTENTIAL TO LIFE are registered trademarks of a Syngenta Group Company.
Cautionary statement regarding forward-looking statements: This document contains forward-looking statements, which can be identified by terminology such as “expect”, “would”, “will”, “potential”, “plans”, “prospects”, “estimated”, “aiming”, “on track” and similar expressions. Such statements may be subject to risks and uncertainties that could cause the actual results to differ materially from these statements.
We refer you to Syngenta’s publicly available filings with the US Securities and Exchange Commission for information about these and other risks and uncertainties. Syngenta assumes no obligation to update forward-looking statements to reflect actual results, changed assumptions or other factors.
This document does not constitute, or form part of, any offer or invitation to sell or issue, or any solicitation of any offer, to purchase or subscribe for any ordinary shares in Syngenta AG, or Syngenta ADSs, nor shall it form the basis of, or be relied on in connection with, any contract therefor.