synergistic effect of natural antimicrobials produced from
TRANSCRIPT
Wayne State University
Wayne State University Dissertations
1-1-2017
Synergistic Effect Of Natural AntimicrobialsProduced From Food On Foodborne PathogensAnd Effect Of Meat Production Method OnQuality And Shelf Life Of MeatMahdi Hassan Al-AliWayne State University,
Follow this and additional works at: https://digitalcommons.wayne.edu/oa_dissertations
Part of the Nutrition Commons
This Open Access Dissertation is brought to you for free and open access by DigitalCommons@WayneState. It has been accepted for inclusion inWayne State University Dissertations by an authorized administrator of DigitalCommons@WayneState.
Recommended CitationAl-Ali, Mahdi Hassan, "Synergistic Effect Of Natural Antimicrobials Produced From Food On Foodborne Pathogens And Effect OfMeat Production Method On Quality And Shelf Life Of Meat" (2017). Wayne State University Dissertations. 1773.https://digitalcommons.wayne.edu/oa_dissertations/1773
SYNERGISTIC EFFECT OF NATURAL ANTIMICROBIALS PRODUCED FROM
FOOD ON FOODBORNE PATHOGENS AND EFFECT OF MEAT PRODUCTION
METHOD ON QUALITY AND SHELF LIFE OF MEAT
by
MAHDI HASSAN HUSSAIN AL-ALI
DISSERTATION
Submitted to the Graduate School
of Wayne State University,
Detroit, Michigan
in partial fulfillment of the requirements
for the degree of
DOCTOR OF PHILOSOPHY
2017
MAJOR: NUTRITION AND FOOD SCIENCE
Approved By:
_______________________________________
Advisor Date
_______________________________________
_______________________________________
_______________________________________
_______________________________________
© COPYRIGHT BY
MAHDI AL-ALI
2017
All Rights Reserved
ii
DEDICATION
This dissertation is dedicated to
MY FAMILY
For their love, support, and patience

iii
ACKNOWLEDGEMENTS
It is my pleasure to thank those who made this dissertation possible. I owe my deepest
gratitude to my advisor, Dr. Ahmad R. Heydari for his endless patience, continuous guidance,
support and encouragement at all stages of the study. I would also like to acknowledge my
committee members Dr. Diane Cress, Dr. Paul Burghardt and Dr. Hikmat Jamil for their time and
willingness to serve on this committee and for their valuable suggestions. My appreciation also
extends to the following people who in one way or the other have helped me in my research:
Andrew James, Ali Fardous, Varun Tahlan, Tom Prychetco, and all graduate students in the
department.
I would like to express my appreciation to the faculty and staff; Dr. Catherine Jen, Dr.
Ahmad Heydari, Dr. Pramod Khosla, Dr. Paul Burghardt, Dr. Smiti Gupta, Dr. Diane Cress, Dr.
Yifan Zhang, Dr. Kevin Zhou. I will never forget them.

iv
TABLE OF CONTENTS
Dedication …………………………………………………………………………………………..…………………………… ii
Acknowledgements ………..………………………………………………………………..………………..…………… iii
List of Tables ……….……..………………………………………….………………………………………………..……… vi
List of Figures ………………………………………………………………………………………..…….……….………… vii
Overview and Specific Aims ………………………………………………….……….…………………..……….…… 1
CHAPTER 1: THE SYNERGISTIC EFFECT OF NATURAL ANTIMICROBIALS PRODUCED FROM FOOD LACTOFERRIN, LYSOZYME AND NISIN ON FOODBORNE PATHOGENS Abstract …………………..…………………………………………………………………………………..……...…….….….… 5
Introduction ……………………....…………………………………………………………………....................……...…. 6
Materials and Methods …………………….…………………………………………………………………….…….…… 15
Results and discussion …………………………………………………………………………………………..……...…… 39
References …………………………………………………………………………………..…………………………….…….… 44
CHAPTER 2: MOLECULAR CHARACTERIZATION OF TOXIN GENES AND ANTIBIOTIC RESISTANCE OF STAPHYLOCOCCUS AUREUS ISOLATES FROM MEAT Abstract ……………………………………………………………………………………….…………….……………….…….. 51
Introduction ……………..…………………..…………………………………………………………………………………… 52
Materials and methods ……………………………..………………..………………………………….………….……… 62
Results and discussion …………………….………………………………………………..……………………………… 103
References ……………………………………………………………………………………………………………….………. 107
CHAPTER 3: EFFECT OF MEAT PRODUCTION METHOD ON MICROBIAL CONTENT AND PHYSIOCHEMICAL QUALITY INDICATORS IN FRESH MEAT Abstract ……………….…………………………………………………………………………………………….………….... 117
Introduction ……………..……..……………………………………………………………………………………….……… 118
v
Materials and Methods ………………………..…..……………………………………………………………………… 125
Results and discussion ……………………………………………………………………………………………………… 145
References …………………………………….………………………………………………………………………………... 154
CHAPTER 4: EFFECT OF MEAT PRODUCTION METHOD ON SHELF LIFE OF MEAT DURING REFRIGERATED STORAGE Abstract ………………………………..………..…………………………………………………………..…………………… 164
Introduction …………………………………..…..…………………………………………………….……………………… 164
Materials and Methods ……………..…………………………………………………………………….………….…… 169
Results and discussion ……………………………………………………………………………………………………... 188
References ………………………………..……………………………………………………………………………………… 198
Abstract ………………………………………………………………………………………………….……………………….. 206
Autobiographical Statement ………………………………….…………………………………………………………. 208

vi
LIST OF TABLES
Table 1.1. Minimal inhibitory concentrations (MIC) of lactoferrin, lysozymenand nisin against tasted bacteria …………………………………….……………………….…..…....……… 18
Table 1.2. Fractional inhibitory concentration (FIC) against L. monocytogenes S. aureus, E. coli and S. typhimurium (in-vitro) …………….………………………………. 19 Table 2.1. Biochemical and genotypic identification of S. aureus in meat ………….………… 66
Table 2.2. PCR primers for detection of enterotoxin (ESs), Nuc, 16srRNA and Mec A genes ……………………………………………………………………….… 67 Table 2.3. Distribution of enterotoxin genes among S. aureus isolates ………..….………… 101
Table 2.4. Antimicrobial resistance of S. aureus isolates from meat …...…..………………… 102

vii
LIST OF FIGURES
Figure 1.1 Structure of nisin …………..………………………………………………………………….……..…… 9
Figure 1.2 Antimicrobial mechanism of nisin ………………………………………………………..……. 10
Figure 1.3 Three dimensional structures of diferric human Lactoferrin and Bovine lactoferrin ………………………………………..……..…………………………………….. 11 Figure 1.4 Mechanism of antibacterial action of lactoferrin ………………………………………… 12
Figure 1.5 Structure of lysozyme …………….…………………….………………………..…………………… 13
Figure 1.6 β 1-4 glycosidic bonds in the peptidoglycan layer of the bacterial cell wall … 15
Figure 1.7 Antimicrobial activity of nisin at 625 µg/ml on L. monocytogens ATCC 19114 growth in beef in comparison to control at 4 °C ………………….….. 20 Figure 1.8 Antimicrobial activity of nisin at 625 µg/ml on S. aureus ATCC 29213growth in
beef in comparison to control at 4 °C ………………………………...............…………… 21 Figure 1.9 Antimicrobial activity of nisin at 1250 µg/ml on E. coli ATCC 25922 growth in beef in comparison to control at 4 °C ……....……………………………….. 22 Figure 1.10 Antimicrobial activity of nisin at 2500 µg/ml on Salmonella typhimurium ATCC 14028 growth in beef in comparison to control at 4 °C …..………..……… 23 Figure 1.11 Antimicrobial activity of lysozyme at 1250 µg/ml on L. monocytogens
ATCC 19114 growth in beef in comparison to control at 4 °C ……….……….…… 24
Figure 1.12 Antimicrobial activity of lysozyme at 1250 µg/ml on S. aureus ATCC 29213 growth in beef in comparison to control at 4 °C ……………..………………. 25
Figure 1.13 Antimicrobial activity of lysozyme at 2500 µg/ml on E. coli ATCC 25922 growth in beef in comparison to control at 4 °C ………………………………………… 26
Figure 1.14. Antimicrobial activity of lactoferrin at 2500 µg/ml on L. monocytogens ATCC 19114 growth in beef in comparison to control at 4 °C …………....…… 27
Figure 1.15 Antimicrobial activity of lactoferrin at 2500 µg/ml on S. aureus ATCC
29213 growth in beef in comparison to control at 4 °C ……………..………..…….. 28
Figure 1.16 Antimicrobial activity of lactoferrin at 2500 µg/ml on E. coli ATCC 25922

viii
growth in beef in comparison to control at 4 °C .…………………..……..…....……… 29
Figure 1.17 Antimicrobial activity of nisin at 625 µg and lactoferrin at 2500 µg/ml on L. monocytogens ATCC 19114 growth in beef in comparison to control at 4°C ……………………………………………………..…… 30 Figure 1.18 Antimicrobial activity of nisin at 625 µg/ml and lactoferrin at 2500 µg/ml on S.aureus ATCC 29213growth in beef in comparison to control at 4°C .......................................................................... 31 Figure 1.19 Antimicrobial activity of nisin at 1250 µg/ml and lactoferrin at 2500 µg/ml on E. coli ATCC 25922 growth in beef in comparison to control at 4 °C ………………………………………………………………………………………... 32 Figure 1.20 Antimicrobial activity of lysozyme at 1250 µg/ml and lactoferrin at 2500 µg/ml on S. aureus ATCC 29213 growth in beef in comparison to control at 4 °C ……………………………………………………………………… 33 Figure 1.21 Antimicrobial activity of lysozyme at 2500 µg/ml and lactoferrin at 2500 µg/ml on E. coli ATCC 25922 growth in beef in comparison to control at 4 °C ……………………………………………………………………… 34 Figure 1.22. Antimicrobial activity of lysozyme at 1250 µg/ml and lactoferrin at 2500 µg/ml on L. monocytogens ATCC 19114 growth in beef in comparison to control at 4 °C …………………………………..……… 35 Figure 1.23. Antimicrobial activity of nisin at 625 µg/ml and lysozyme at 1250 µg/ml and on L. monocytogens ATCC 19114 growth on beef in comparison to control at 4 °C ….…………………………………..… 36 Figure 1.24. Antimicrobial activity of nisin at 625 µg/ml and lysozyme at 1250 µg/ml on S. aureus ATCC 29213 growth on beef in comparison to control at 4 °C ………..……………………………………………………….…… 37 Figure 1.25. Antimicrobial activity of nisin at 1250 µg/ml and lysozyme at 2500 µg/ml on E. coli ATCC 25922 growth in beef in comparison to control at 4 °C …………………………………….…………………..………….. 38 Figure 2.1 Virulence factors of S.aureus ……………………………………………….………….…..…..… 54
Figure 2.2. Mechanisms of antimicrobial resistance ……………………………………………..……… 61
Figure 2.3. Biochemical mechanisms of antimicrobial resistance …………….………..………… 62

ix
Figure 2.4. S. aureus 16srRNA gene in beef samples …………………………………………………….. 68
Figure 2.5. S. aureus 16srRNA in chicken samples ………………………………………………………… 69
Figure 2.6. S. aureus 16srRNA gene (left) – nuc gene in lamb samples ……………..………..… 70
Figure 2.7. S. aureus Nuc gene in samples chicken ………………………………..……………………… 71
Figure 2.8. S. aureus Nuc gene in beef samples ………………………………….………………………… 72
Figure 2.9. S. aureus Mec A gene in samples chicken ……………….………..………………………… 73
Figure 2.10. S. aureus Mec A gene in beef samples ………..…………..………………………..………… 74
Figure 2.11. S. aureus Mec A gene in lamb sample …………………...………..……………….………… 75
Figure 2.12. S. aureus sea gene in beef samples ……………………………..……………………………… 76
Figure 2.13. S. aureus seb gene in beef samples ……………….……….…………………………………… 77
Figure 2.14. S. aureus sec gene in beef samples ……………………………………………………………… 78
Figure 2.15. S. aureus sed gene in beef samples ………………………………..…………………………… 79
Figure 2.16. S. aureus see gene in beef samples ……………..……………………………………………… 80
Figure 2.17. S. aureus seg gene in beef samples ……………………………………………………………… 81
Figure 2.18. S. aureus seh gene in beef samples ………………..…………………………………………… 82
Figure 2.19. S. aureus sei gene in beef samples ……………………………………………………………… 83
Figure 2.20. S. aureus sej gene in beef samples ……………………………..…………………………….… 84
Figure 2.21. S. aureus sea gene in lamb samples ………………………………………………………….… 85
Figure 2.22. S. aureus seb gene (left), sec gene (right) in lamb samples …………..……..……… 86
Figure 2.23. S. aureus sed gene (left), see gene in lamb samples ………………………………….… 87
Figure 2.24. S. aureus see gene (left), seg gene (right) in lamb samples …………….…………… 88
Figure 2.25. S. aureus seh gene (left), sei gene in lamb samples ………………………………..…… 89

x
Figure 2.26. S. aureus sej gene in lamb samples ……………………………………………………………… 90
Figure 2.27. S. aureus sea gene in chicken samples ……………………………………………….….……. 91
Figure 2.28. S. aureus seb gene in chicken samples …………….………………………………….….…… 92
Figure 2.29. S. aureus sec gene in chicken samples ……………………………………………….……….. 93
Figure 2.30. S. aureus sed gene in chicken samples ………………….……………………………..……… 94
Figure 2.31. S. aureus sed gene in chicken samples …………………….………..………………………… 95
Figure 2.32. S. aureus see gene in chicken samples ……………….…………………………………..…… 96
Figure 2.33. S. aureus seg gene in chicken samples ……………….………………………………..……… 97
Figure 2.34. S. aureus seh gene in chicken samples ……………….…………………………………..…… 98
Figure 2.35. S. aureus sei gene in chicken samples ……………………………………..………………..… 99
Figure 2.36. S. aureus sej gene in chicken samples …………………………..…………………………… 100
Figure 3.1. Autoxidation of lipid ……………….………………………………………………………………… 123
Figure 3.2. Hemoglobin molecule ……………...………………………………………………………………. 124
Figure 3.3. Effect of slaughter method on hemoglobin content …………………..……………… 125
Figure 3.4. Aerobic plate count in fresh halal and non-halal beef ………………………..……… 130
Figure 3.5. Psychrotrophic bacteria in fresh halal and non-halal beef ………….……..……… 131
Figure 3.6. Pseudomonas in fresh halal and non-halal beef ………………………………………… 132
Figure 3.7. S. aureus bacteria in fresh halal and non-halal beef ……..…………………………… 133
Figure 3.8. Lactic acid bacteria in fresh halal and non-halal beef …..……………………………. 134
Figure 3.9. Enterobacteriaceae in fresh halal and non-halal beef ……….………………………. 135
Figure 3.10. E. coli in fresh halal and non-halal beef ………..…………………..…….………………… 136
Figure 3.11. Total coliform in fresh halal and non-halal beef ………….…………………………..… 137
xi
Figure 3.12. Fecal coliform in fresh halal and non-halal beef …………...…………………………… 138
Figure 3.13. Yeast and mold in fresh halal and non-halal beef ……….………….…………………. 139
Figure 3.14. Lipid oxidation in fresh halal and non-halal beef …………………………..………….. 140
Figure 3.15. Heme iron in fresh halal and non-halal beef ……………….……..……………………… 141
Figure 3.16. PH in fresh halal and non-halal beef …….…………………………………………………… 142
Figure 3.17. Thaw loss in fresh halal and non-halal beef ………………..…………………….………. 143
Figure 3.18. Drip loss in fresh halal and non-halal beef ………………..…………………….………… 144
Figure 4.1. Aerobic plate count in halal and non-halal beef during refrigerated storage …………………………………………………………………….… 173 Figure 4.2. Psychrotrophic bacteria in halal and non-halal beef during refrigerated storage …………………………………………………………………….… 174 Figure 4.3. E. coli bacteria in halal and non-halal beef during refrigerated storage …..… 175
Figure 4.4. S. aureus in halal and non-halal beef during refrigerated storage ……………… 176
Figure 4.5. Pseudomonas bacteria in halal and non-halal beef during refrigerated storage ……………………………………………………………………………….... 177 Figure 4.6. Total coliform bacteria in halal and non-halal beef during refrigerated storage ………………………………………………………………………………… 178 Figure 4.7. Lactic acid bacteria in halal and non-halal beef during refrigerated storage …………………………………………………………………………..……. 179 Figure 4.8. Enterobacteriaceae in halal and non-halal beef during refrigerated storage ….................................................................................. 180 Figure 4.9. Fecal coliform in halal and non-halal beef during refrigerated storage …………………………………………………………………..….………… 181 Figure 4.10. Yeast and mold in halal and non-halal beef during refrigerated storage ……….…………………………………………………………………..…… 182 Figure 4.11. Lipid oxidation in halal and non-halal beef during refrigerated storage ………………………………………………………………………….……… 183

xii
Figure 4.12. Heme iron in halal and non-halal beef during refrigerated storage …….…………………………………………………………………………… 184 Figure 4.13. pH in halal and non-halal beef during refrigerated storage ………………….…………………………………………………..……….... 185 Figure 4.14. Thaw loss in halal and non-halal beef during refrigerated storage …………………………………………………………………….………….. 186 Figure 4.15. Drip loss in halal and non-halal beef during refrigerated storage …………………………………………………………………………………. 187

1
OVERVIEW AND SPECIFIC AIMS
The increased usage of foods formulated with chemical preservatives such as nitrites,
benzoates, sulfites, sorbates, salt and other chemical compounds has raised consumer health
concerns (Murdock et al. 2006). As a result, the use of natural antimicrobial preservatives have
been preferred by the food industry due to consumers’ demands (DuFour et al. 2003). Nisin,
lactoferrin and lysozyme are three natural compounds that have received considerable attention
in recent years (Murdock and Matthews 2002). Properties of these three sources of natural
antimicrobials can be used to improve microbial safety of foods. The combination of natural
antimicrobials could possibly increase the effectiveness of the antimicrobials proving to be better
than if they were used alone against foodborne pathogens. Synergistic or additive effects
between the antimicrobials may permit the use of relatively low amounts of each antimicrobial
and thereby reduce cost of the antimicrobial treatment while improving the antimicrobial
efficiency.
Nisin is produced by Lactococcus lactis subsp. lactis. It is effective against gram-postive
bacteria and with reduced or no effectiveness against gram-negative bacteria (Delves-Broughton
et al, 1996). Nisin mechanism of action is to bind the cell membrane and form pores that destroy
membrane integrity. Pore formation leads to leakage of K+ ions and ATP, depletion of the proton
motive force, and depolarization of transmembrane potential, resulting in cell death (Millette et
al., 2004). It has also been reported that nisin interferes with cell wall biosynthesis by binding
with lipid II, a peptidoglycan precursor (Bauer and Dicks, 2005).
Lysozyme, a lytic enzyme found in foods such as milk and eggs. Like nisin, lysozyme’s
activity is also limited to gram-positive bacteria because gram-negative cell walls are protected

2
by an outer membrane (Proctor and Cunningham, 1988). Lysozyme’s mechanism of action based
on hydrolysis of the β (1–4) glycosidic linkages in bacterial peptidoglycan within the cell wall
(Cunningham et al., 1991).
Lactoferrin, an iron-binding glycoprotein, is natural antimicrobial component of milk and
other external secretions such as tears and saliva (Murdock and Matthews 2002); (Farnaud and
Evans 2003). Lactoferrin exerts an antimicrobial effect against a wide range of gram-negative
and gram-positive bacteria, fungi, and parasites (Shimazaki 2000; Masschalck et al. 2001). Its
actions can be classified into several different modes of action: by sequestering free iron, thereby
restricting the growth of gram-positive and gram-negative bacteria; interfering with bacterial
membrane function; and by binding bacterial lipopolysaccharide, thereby impairing bacterial cell
wall/membrane function (IUCCI et al. 2007).
The lack of activity by nisin and lysozyme against gram-negative organisms is because of
their inability to penetrate the cell wall. However, in the presence of lactoferrin, general chelator,
has the ability to release lipopolysaccharide (LPS) and permeabilize the gram-negative cell wall.
This permits nisin and lysozyme to have access to the inner membrane thus providing a novel
system for control of gram-negative pathogens such as E. coli O157:H7 (Ellison, 1994, and Branen
and Davidson, 2004).
There are different types of meat classifications based on the method of animal
slaughtering and processing. Halal meat is produced without stunning prior to slaughter,
resulting in a rapid and complete bleeding of animals (Eliasi and Dwyer, 2002); (Grandin and
Regenstein, 1994). Studies have shown that halal slaughter results in significantly lower residual
hemoglobin than conventional slaughter with stunning (non-Halal) (Nakyinsige et al, 2014). The
3
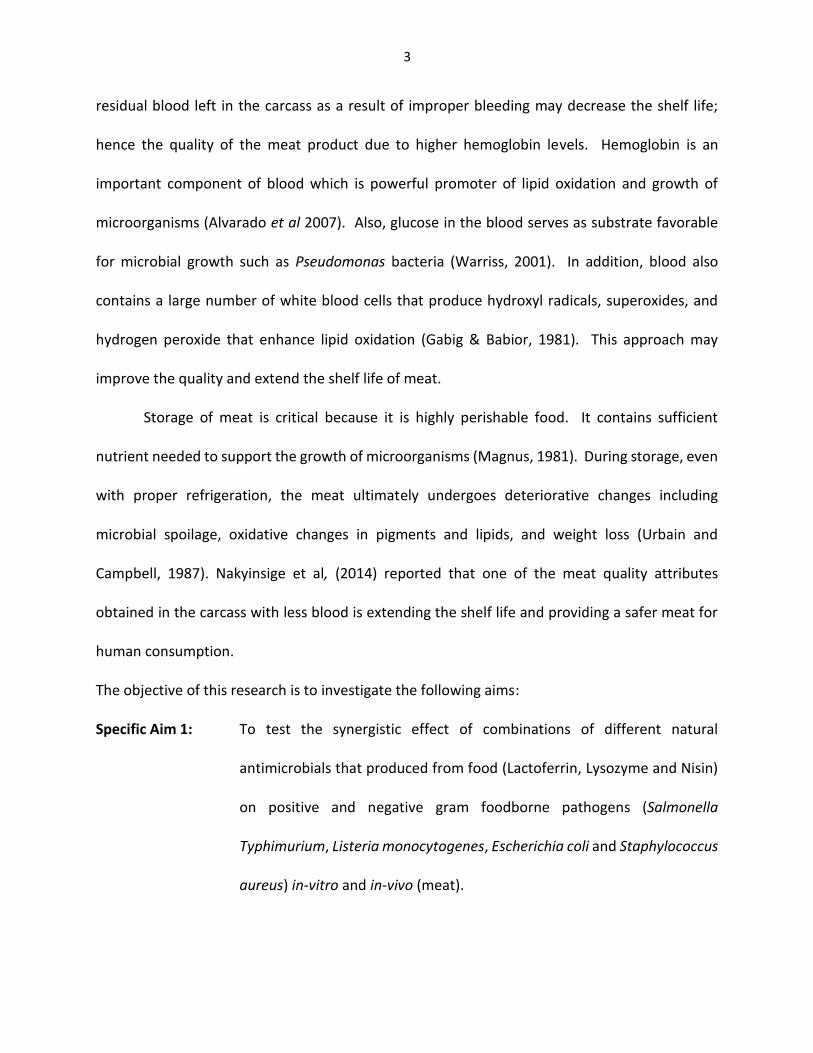
residual blood left in the carcass as a result of improper bleeding may decrease the shelf life;
hence the quality of the meat product due to higher hemoglobin levels. Hemoglobin is an
important component of blood which is powerful promoter of lipid oxidation and growth of
microorganisms (Alvarado et al 2007). Also, glucose in the blood serves as substrate favorable
for microbial growth such as Pseudomonas bacteria (Warriss, 2001). In addition, blood also
contains a large number of white blood cells that produce hydroxyl radicals, superoxides, and
hydrogen peroxide that enhance lipid oxidation (Gabig & Babior, 1981). This approach may
improve the quality and extend the shelf life of meat.
Storage of meat is critical because it is highly perishable food. It contains sufficient
nutrient needed to support the growth of microorganisms (Magnus, 1981). During storage, even
with proper refrigeration, the meat ultimately undergoes deteriorative changes including
microbial spoilage, oxidative changes in pigments and lipids, and weight loss (Urbain and
Campbell, 1987). Nakyinsige et al, (2014) reported that one of the meat quality attributes
obtained in the carcass with less blood is extending the shelf life and providing a safer meat for
human consumption.
The objective of this research is to investigate the following aims:
Specific Aim 1: To test the synergistic effect of combinations of different natural
antimicrobials that produced from food (Lactoferrin, Lysozyme and Nisin)
on positive and negative gram foodborne pathogens (Salmonella
Typhimurium, Listeria monocytogenes, Escherichia coli and Staphylococcus
aureus) in-vitro and in-vivo (meat).
4
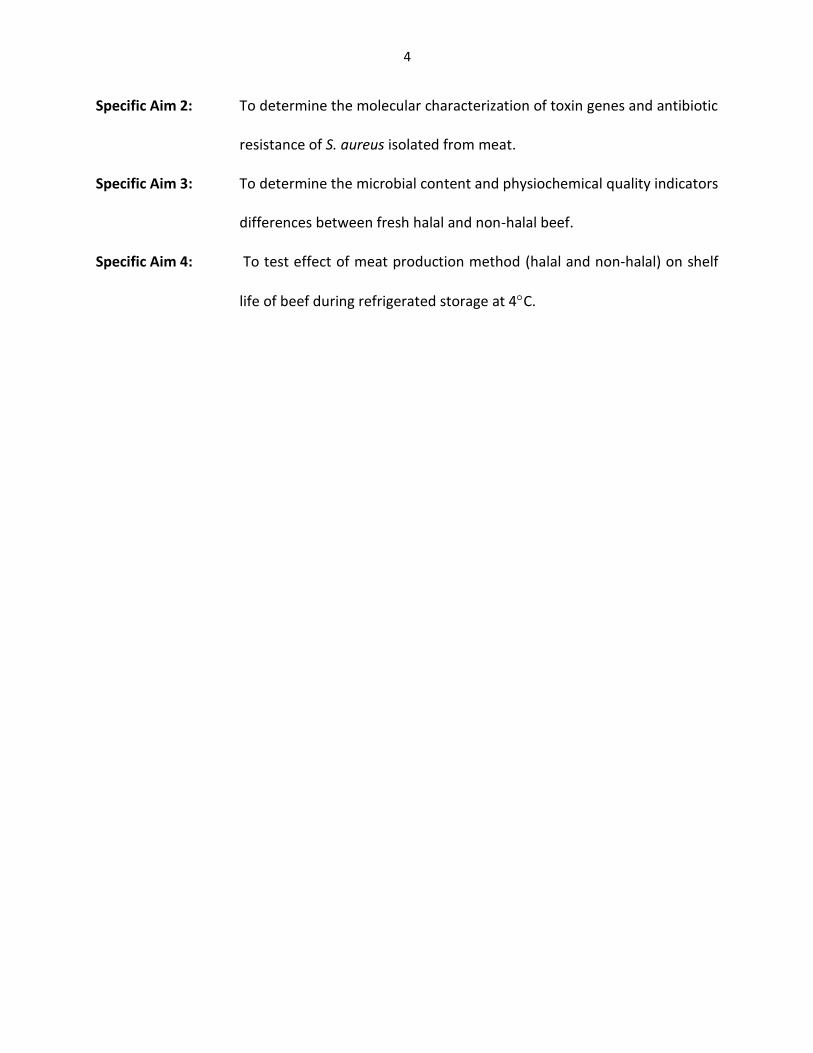
Specific Aim 2: To determine the molecular characterization of toxin genes and antibiotic
resistance of S. aureus isolated from meat.
Specific Aim 3: To determine the microbial content and physiochemical quality indicators
differences between fresh halal and non-halal beef.
Specific Aim 4: To test effect of meat production method (halal and non-halal) on shelf
life of beef during refrigerated storage at 4C.

5
CHAPTER 1 THE SYNERGISTIC EFFECT OF NATURAL ANTIMICROBIALS PRODUCED FROM FOOD LACTOFERRIN, LYSOZYME AND NISIN ON FOODBORNE PATHOGENS
Abstract The aim of this study was to evaluate the synergistic effect of three natural antimicrobial that are
produced from food (lactoferrin from milk, lysozyme from eggs and nisin from Lactococcus lactis)
on foodborne pathogens that include S. aureus, E. coli, salmonella typhimurium and listeria
monocytogenes in-vitro and in-vivo (meat). Minimal inhibitory concentration (MIC) for each
antimicrobial was measured by broth micro dilution method in cation-adjusted Mueller-Hinton II
broth (CAMHB) whereas Synergy between antimicrobial was calculated using the fractional
inhibitory concentration (FIC) index which was measured using the checkerboard method.
Antimicrobial activity of lactoferrin, lysozyme and nisin individually in-vitro showed that
MICs for nisin against tested bacteria were the lowest while lysozyme’s MICs were relatively less.
FICs for antimicrobial combinations showed that five combinations exhibited synergistic effect as
the following: lactoferrin with nisin against S. aureus, L. monocytogenes, and E. coli. Lactoferrin
with lysozyme exhibited synergistic effect against E. coli and S. aureus. In addition, four
combinations showed additive effect as following: lactoferrin with nisin against L.
monocytogenes, S. aureus and E. coli, and lactoferrin with lysozyme against L. monocytogenes.
Using antimicrobial combinations against tested pathogens bacteria demonstrated improved
(MIC), compared to the parent compounds.
Antimicrobial activity in food model-meat (in-vivo) showed that lactoferrin, lysozyme and
nisin individually and in combinations had significant effect (p<0.01) on growth of gram-positive
bacteria, L. monocytogenes and S. aureus compared to control. On the other hand, nisin and
lysozyme individually had less effect on the growth of gram-negative bacteria, S. typhimurium

6
and E. coli. Conversely, when nisin or lysozyme used in combinations with lactoferrin proved
enhanced nisin and lysozyme activity against E. coli.
According to results of the present study, we concluded that using natural antimicrobial
combinations of lactoferrin with lysozyme, lactoferrin with nisin and lysozyme with nisin can
synergistically function against foodborne pathogens in meat industry and may be a novel system
to control foodborne pathogens and offer unique properties.
Introduction
The control of microbial pathogens in food is a significant concern because of increase in
foodborne illnesses cases around the world in spite of the various methods available to control
pathogen and spoilage bacteria in food. The Center for Disease Control and Prevention estimated
that foodborne diseases causes approximately 76 million illnesses, 325,000 hospitalizations and
5000 deaths in the United States each year (Mead et al., 1999). There are numerous
antimicrobials in plants, animals, and microorganisms where they often take part in defense
mechanisms. Nisin, lactoferrin and lysozyme are three natural compounds that have received
considerable attention in recent years (Murdock and Matthews, 2002). Properties of these three
sources of natural antimicrobials can be used to improve microbial safety of foods. Synergistic
effect of these natural antimicrobials in meat and food industry may be a novel system to control
pathogenic bacteria and offer unique properties. These such properties increase the
effectiveness of the antimicrobials, proving to be more effective rather than if they were used
alone against foodborne pathogens. Moreover, these antimicrobial synergistically decrease the
amount and cost for antimicrobial treatment and eliminate the harmful chemical effects while
improving the efficacy.
7
Nisin is produced by Lactococcus lactis subsp. lactis. Its effective against gram-positive
bacteria and with reduced or no effectiveness against gram-negative bacteria (Delves-Broughton
et al, 1996). Its mechanism of action is to bind the membrane and form pores that destroy the
membrane integrity. Pore formation leads to leakage of K+ ions and ATP, depletion of the proton
motive force, and depolarization of transmembrane potential resulting in cell death (Millette et
al., 2004). It has also been reported that nisin interferes with cell wall biosynthesis by binding
with lipid II, a peptidoglycan precursor (Bauer and Dicks, 2005).
Lysozyme is a lytic enzyme found in foods such as milk and eggs. Like nisin, lysozyme’s
activity is also limited to gram-positive bacteria because gram-negative cell walls are protected
by an outer membrane (Proctor and Cunningham, 1988). Its mechanism of action is the
hydrolysis of the β (1–4) glycosidic linkages in bacterial peptidoglycan of cell wall (Cunningham
et al., 1991).
Lactoferrin, an iron-binding glycoprotein, is natural antimicrobial component of milk and
other external secretions such as tears and saliva (Murdock and Matthews 2002; Farnaud and
Evans 2003). Lactoferrin exerts an antimicrobial effect against a wide range of gram-negative
and gram-positive bacteria, fungi, and parasites (Shimazaki 2000; Masschalck et al. 2001). Its
actions can be classified into several different modes of action: by sequestering free iron, thereby
restricting the growth of gram-positive and gram-negative bacteria; by interfering with bacterial
membrane function; and by binding bacterial lipopolysaccharide, thereby impairing bacterial cell
wall/membrane function (IUCCI et al. 2007).
The lack of activity by nisin and lysozyme against gram-negative organisms is because of
their inability to penetrate the cell wall. However, in the presence of lactoferrin, a general

8
chelator, has the ability to release lipopolysaccharide (LPS) and permeabilize the gram-negative
cell wall allowing nisin and lysozyme to have access to the inner membrane and thus providing a
novel system for control of gram-negative pathogens, such as E. coli O157:H7 (Ellison
1994; Branen and Davidson 2004).
This chapter is aimed to measure the synergistic effect of three natural antimicrobials,
Lactoferrin (from milk), lysozyme (from egg) and nisin (from Lactococcus lactis bacteria) on
foodborne pathogens that include S. aureus, E. coli, salmonella typhimurium and listeria
monocytogenes in-vitro and in-vivo (meat).
Nisin:
Nisin was discovered in 1928 by Rogers and Whittier. It was produced by Lactococcus
lactis subsp. lactis, which is a heat-stable protein (Holzapfel et al, 1995) and was named
bacteriocins. It was produced as a protection mechanism to some lactic acid bacteria (LAB)
(Juncioni de Arouz et al., 2009). Many companies have been producing nisin as antimicrobial
against different types of bacteria since the 1960's synthetically or naturally by using some
bacterial culture in fermented dairy ( Bailey and Hurst, 1971; Lee and Kim, 1985). Since then, it
has effectively been used as preservative in dairy and meat products (Reunanen and Saris 2004;
Samelis et al. 2005). Food and Drug Administration (FDA) approved nisin as GRAS (Generally
Regarded as Safe) for use in some dairy product and salad dressing (Anonymous 2000; Cleveland
et al. 2001).
Nisin is a single-chained molecule consist of a 34 amino acid with molecular weight
3500Da. It possess two important properties cationic and hydrophobic. The cationic properties
because the mixture of three lysine residues and one or more histidine residues (Chandrapati &

9
O’Sullivan, 1998). It has important functional properties such as acid tolerance and thermal
stability at low pH due to it containing distinguished amino acid (De Vuyst & Vandamme, 1992).
In addition, Nisin presents amphipathic properties because its N-terminal region contain
hydrophobic residues and the C-terminal region contain hydrophilic residues.
Figure 1.1. Structure of Nisin
There are two types of nisin depending on type of the amino acid residue in position 27,
Nisin A, a natural variant produced by L. lactis subsp. lactis ATCC 11454 and the amino acid
histidine is located at position 27 while Nisin Z is produced by other species of L. lactis and the
amino acid, asparagine, is located at position 27. This change give a good characteristic of
diffusion in the nisin Z but there is no differences in antimicrobial activity. However, asparagine
contains a side chain with a higher polarity than histidine allowing Nisin Z to be better soluble at
a pH of 6 or above.
Nisin bacteriostatic function is due to its ability to bind the cytoplasmic membrane and
form pores that damage the membrane (Abee et al., 1995; Kuwano et al., 2005). This induces
cell death due to loss of different important cell compounds such as ATP, some ions like K+, and
the proton motive force (Sahl, 1991; Bruno and Montville, 1993; Millette et al., 2004). Also, many
studies have shown that the antimicrobial actions of nisin may be attributed to interferes with
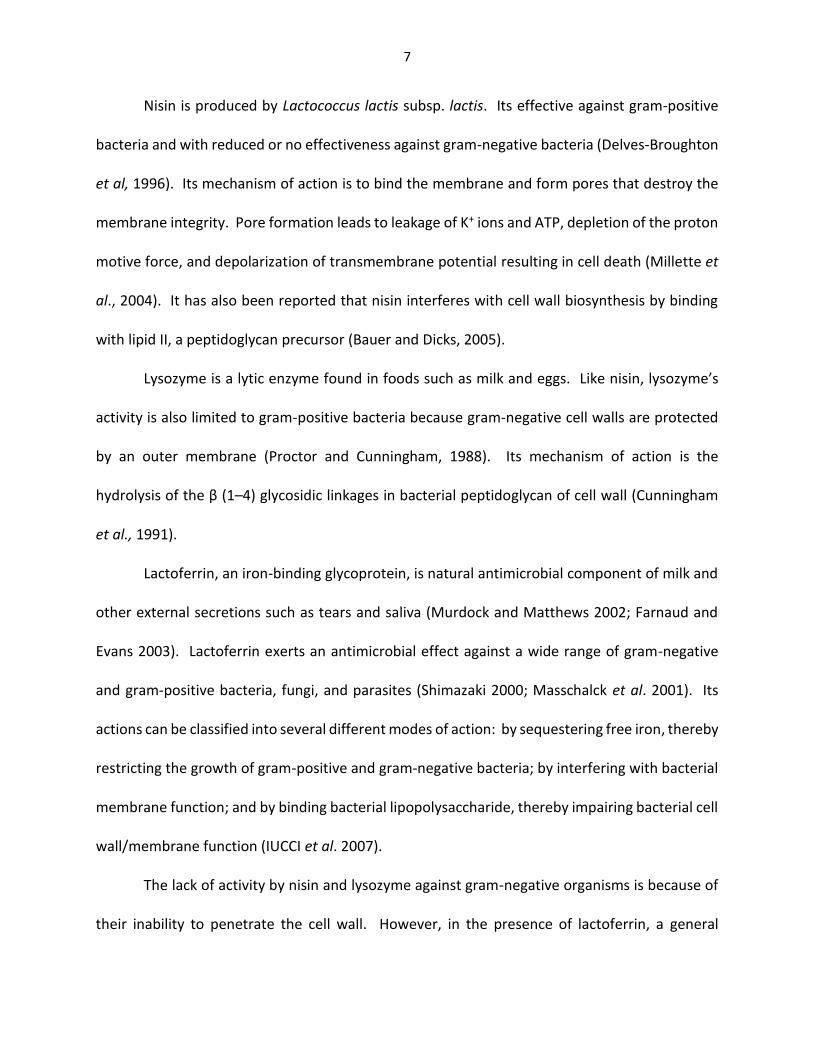
10
cell wall biosynthesis by binding with lipid II, an important compound in a peptidoglycan layer
(Mantovani and Russell, 2001; Bauer and Dicks, 2005).
Figure 1.2. Antimicrobial Mechanism of Nisin
Many studies indicated that cell resistance to nisin depend on cell content of lipid II .The
high levels of lipid II the high resistance to nisin (Brotzel et al., 1998).
Lactoferrin
Lactoferrin, a single-chained molecule with a molecular weight of 78 kDa, is a member of
the transferrin protein family contains two lobes with four domains that assist the reversible
binding of two iron ions (Odell et al. 1996; Ye et al. 2000). Lactoferrin is a natural bio-preservative
that is found in many mammalian secretions, such as milk, tears, saliva (Odell et al. 1996; Ye et
al. 2000). It is also thought to be one of the most powerful antimicrobial agents in milk (Bellamy
et al. 1993; Chantaysakorn and Richter 2000). The possible use of bovine lactoferrin for
decontamination on the surface of beef carcasses, and subsequently its use as a natural food
preservative is gaining importance (Al-Nabulsi and Holley 2006).

11
Figure 1.3. Three dimensional structures of diferric human Lactoferrin and bovine lactoferrin.
Bacteriostatic function of lactoferrin is due to its ability to take up the Fe3+ ion, limiting
use of this nutrient by bacteria at the infection site and inhibiting the growth of these
microorganisms as well as the expression of their virulence factors, lactoferrin bactericidal
function has been attributed to its direct interaction with bacterial surfaces. The positively
charged N-terminus of lactoferrin prevents the interaction between LPS and the bacterial cations
(Ca2+ and Mg2+), causing a release of LPS from the cell wall, an increase in the membrane’s
permeability and ensuring damage to the bacteria. In 1988 it was shown that lactoferrin damages
the external membrane of gram-negative bacteria through an interaction with lipopolysaccharide
(LPS).

12
Figure 1.4. Mechanism of antibacterial action of lactoferrin. (A) Gram-positive bacteria: LF is bound to negatively charged molecules of the cell membrane such as lipoteichoic acid, neutralizing wall charge and allowing the action of other antibacterial compounds such as lysozyme. (B) Gram-negative bacteria: LF can bind to lipid A of lipopolysaccharide, causing liberation of this lipid with consequent damage to the cell membrane.
It’s mechanism of action against gram-positive bacteria is based on binding due to its net
positive charge to anionic molecules such as lipoteichoic acid, resulting in a reduction of negative
charge on the cell wall and thus favoring contact between lysozyme and the underlying
peptidoglycan over which it exerts an enzymatic effect. Attachment-inhibiting mechanisms are
unknown, but it has been suggested that lactoferrin oligo-amino acid glycan’s bind bacterial
adhesins, preventing their interaction with host cell receptors.
Today, it can be obtained as native lactoferrin, isolated from the milk and colostrum of
several mammals, or as recombinant lactoferrin (rLF) generated from bacterial, fungal and viral
expression systems. The expression of this protein has also been attained in higher organisms
such as plants and mammals.
Lysozyme:
Lysozyme is a lytic enzyme that is found in foods such as milk and eggs with hydrolytic
13
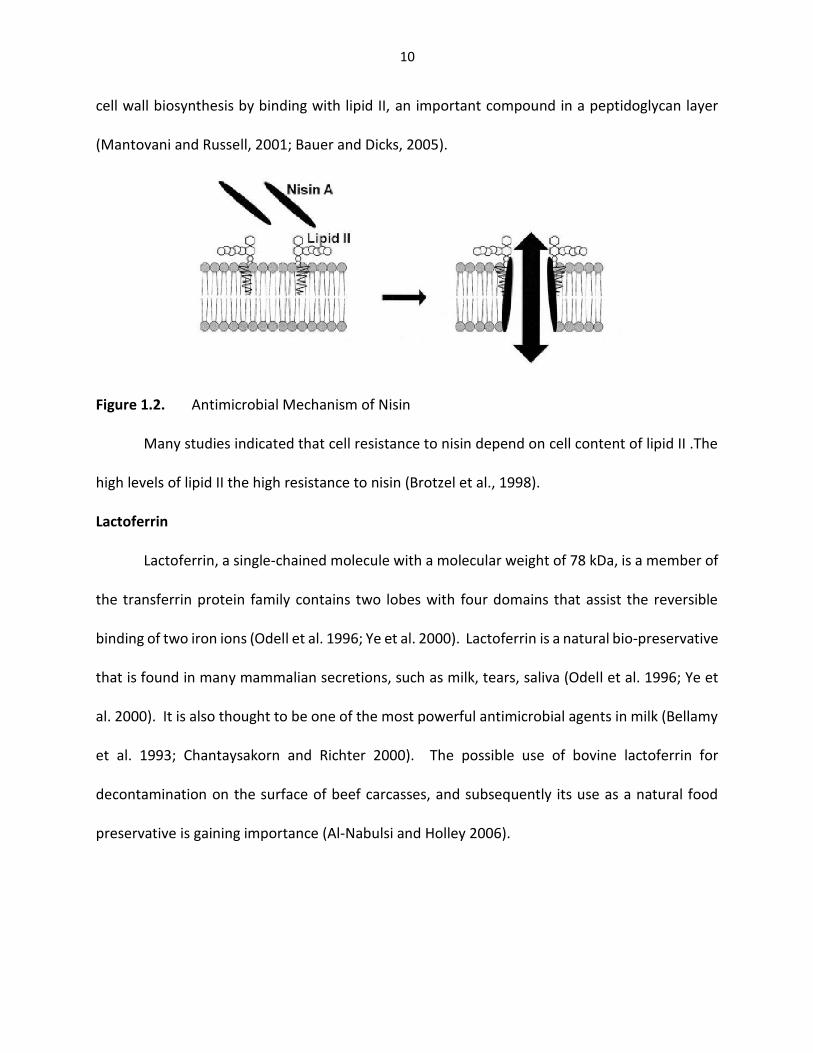
activity. It is a single polypeptide chain consisting of 129 amino acids with a molecular weight
between 14, 300 - 14, 600 Daltons. The majority of commercially prepared lysozyme is purified
from egg whites. Lysozyme is naturally occurring that is produced by many animals, and humans.
It exhibits activity against a cellular structure specific to bacteria (Proctor & Cunningham, 1988).
Lysozyme has a small number of applications in the food industry with the major usage involving
the prevention of late blowing in semi-hard cheeses which is caused by the fermentation of
lactate by butyric acid bacteria, primarily Clostridium tyrobutyricum (Cunningham et al, 1991;
Branen and Davidson 2004).
Figure 1.5. Structure of lysozyme
Lysozyme has been demonstrated to be active throughout pH 4 to pH 10 (Davies et al.,
1969). However, high ionic strength (>0.2 M salt) was shown to have an inhibitory effect on
lysozyme activity (Davies et al., 1969; Chang and Carr, 1971). The lysozyme molecule is cross-
linked with four disulfide bonds, which are significant for its enzymatic activity. In order for
lysozyme to remain enzymatically active, at least two disulfide bonds must remain intact.
14
However, if three or four disulfide bonds are broken within the lysozyme structure, lysozyme
loses its activity. The activity spectrum of lysozyme is limited to specific gram-positive bacteria
(McKenzie and White, 1991). They have been proven quite ineffective against gram-negative
bacteria due to the outer membrane barrier that surrounds and protects the peptidoglycan layer.
Among gram-negative bacteria, some genera such as Salmonella and Shigella are the most
sensitive, whereas E. coli, Vibrio and Proteus are relatively resistant to lysozyme activity.
Considering these results, the antimicrobial actions of lysozyme may be attributed to the direct
and indirect interaction as well as bacteriolytic actions that destroy cell wall of microorganisms.
The susceptibility of gram-negative organisms to lysis by lysozyme can be increased by
the use of detergents and chelators (Shively and Hartse, 1964). EDTA, a chelator, can have the
antimicrobial effect by limiting the availability of cations and can act to destabilize the cell
membranes of bacteria by complexing di-valent cations which act as salt bridges between
membrane macromolecules, such as lipopolysaccharides (Shelef & Seiter, 1993).
Antimicrobial mechanism of lysozyme against bacteria is based on the hydrolysis of the β
1-4 glycosidic bonds in the peptidoglycan layer of the bacterial cell wall between N-acetyl
glucosamine (NAG) and N-acetyl muramic acid (NAM). Phillips (1973) studied hydrolysis of
peptidoglycan by lysozyme. He hypothesized that lysozyme attaches to the bacterial cell wall by
interacting with six of the residues connected to NAM. The attachment changes the
conformation of the NAM structure, allowing the Glu 35 residue of the lysozyme molecule to
donate a hydrogen atom to the oxygen atom in the glycosidic bond, resulting in cleavage of the
bond.

15
Figure 1.6. β 1-4 glycosidic bonds in the peptidoglycan layer of the bacterial cell wall
Materials and methods
A) Bacterial cultures:
The cultures used in this study were Escherichia coli (ATCC 25922), Listeria monocytogens
(ATCC 19114), Salmonella Typhimurium (ATCC 14028) and Staphylococcus aureus (ATCC 29213).
All cultures were obtained from American type culture collection (ATCC) Thermo Fisher
Company. Cultures were maintained on tryptic soy agar (TSA) slants and were transferred each
month to maintain viability. Test inoculums were prepared by transferring 24-hour old cultures
via a cotton swab to 5 ml of 0.85% saline. The saline suspension was adjusted to an optical
density of 0.1 for each bacteria which is corresponds to 0.5 McFarland standard (1 x 10⁸ Cfu/ml).
Once standardized, 50 µl of the saline suspension was transferred to 10 ml of cation-adjusted
Mueller-Hinton II broth (CAMHB).
B) Antimicrobials:
Nisin from Lactococcus lactis (ssp. lactis) was obtained from Sigma-Aldrich (N5764). Nisin
was solubilized in 0.02 M HCl with heating (60 – 70 °C) to aid solubilization. Lactoferrin was

16
obtained from Sigma-Aldrich (L9507). Lactoferrin was dissolved in 0.05 M phosphate buffer (pH
7.5). Lysozyme was obtained from thermo scientific company.
C) Determination of minimum inhibitory concentration (MIC):
The MIC for each antimicrobial was tested by broth micro dilution procedure according
to the National Committee of Clinical Laboratories Standards (NCCLS) guidelines (Jorgensen,
1993).The concentration of each antimicrobial was diluted in CAMBH to 10.000 µg/ml and 100 µl
of each antimicrobial was added into the first row of a 96-well plate and 50 µl of CAMHB was
added to each subsequent row. Then each antimicrobial was serially diluted to obtain final
concentration of 5000, 2500, 1250, 625, 312, 156, 78, 39 µg/ml. To each well, 50 µl of
standardized inoculum was added, giving a bacterial concentration of 5x10⁵ CFU/ml. A positive
control (no antimicrobial) and negative control (no inoculum) were included in each 96-well
plate. Plates were incubated for 24 hours at 37°C and observed after 24 hours. MIC was tested
as the lowest concentration showing inhibition of bacterial growth.
D) Determination of synergy:
Synergy between antimicrobial was tested using the checkerboard method
(Moody, 1992; Schelz et al.2006). Antimicrobial (A) was diluted along the x-axis, while
antimicrobial (B) was diluted along the y-axis. The final volume in each well was 100 µl,
including 50 µl of antimicrobial dilution and 50 µl of bacteria standardized in CAMHB. Plates
were incubated at 37°C for 24 hours. The fractional inhibitory concentration (FIC) indices
were calculated as FICA + FICB, where FICA and FICB are the respective MIC of antimicrobial A
and B. Therefore FICs were calculated as:
17
𝐹𝐼𝐶𝐴 =MICA Combination
MICA Alone 𝐹𝐼𝐶𝐵 =
MICB Combination
MICB Alone
The combination was considered synergistic if the sum of the FICs were equal to or less
than 0.5. If the values were between 0.5 – 1.0, 1.0 – 4.0 or higher than 4.0, they were consider
additive, indifferent or antagonistic respectively.
E) Treatment of beef sample:
Experimental meat samples were aseptically collected from various markets
situated in Detroit, Michigan. The procedure of (Kim et al, 2007) was followed to prepare and
process the meat samples that were divided into similar pieces and weighed approximately 5 g.
The meat sample were then sterilized individually by irradiation using a UV chamber (GS Gene
Linker UV chamber-BIO RAD) and inoculated with the bacteria standardized in CAMHB.
Furthermore, meat samples were treated with a twofold concentration of the individual in-vitro
MIC of the antibacterial that expressed synergism. Then meat pieces were stored in refrigerator
temperature (4°C) in 60 mm Petri dishes. Samples were prepared for day 0, day 2, day 4 and day
6 for each bacterial treatment. Bacterial count for each bacteria were carried out where 45 ml
of 0.1% sterilized peptone water was mixed vigorously for 60 seconds at 230 rpm with each
sample by stomacher bag. 1 ml of the solution was taken and serially diluted from 10-1 to 10-5.
Then 1 ml of each dilution was inoculated to duplicate sterile plate of TSA and incubated at 37°C
for 24 hours. After the incubation period, colonies were counted by colony counter. The
bacterial count was multiplied by the dilution factor then transformed to Log CFU/g.
F-Statistical analysis:- All experiments were conducted in triple ANOVA (Analysis of Variance)
and Tukey’s test were used (IBM SPSS statistics 23).

18
Table 1.1. Minimal inhibitory concentrations (MIC) for nisin, lysozyme and lactoferrin against foodborne pathogens bacteria
Foodborne Pathogens
Nisin (µg /ml)
Lysozyme (µg /ml)
Lactoferrin (µg /ml)
L.monocytogene ATCC 19114
312
625
1250
E. Coli ATCC25922
625
1250
1250
S. aureus ATCC 29213
312
625
1250
Salmonella Typhimurium ATCC 14028
1250
2500
1250
19
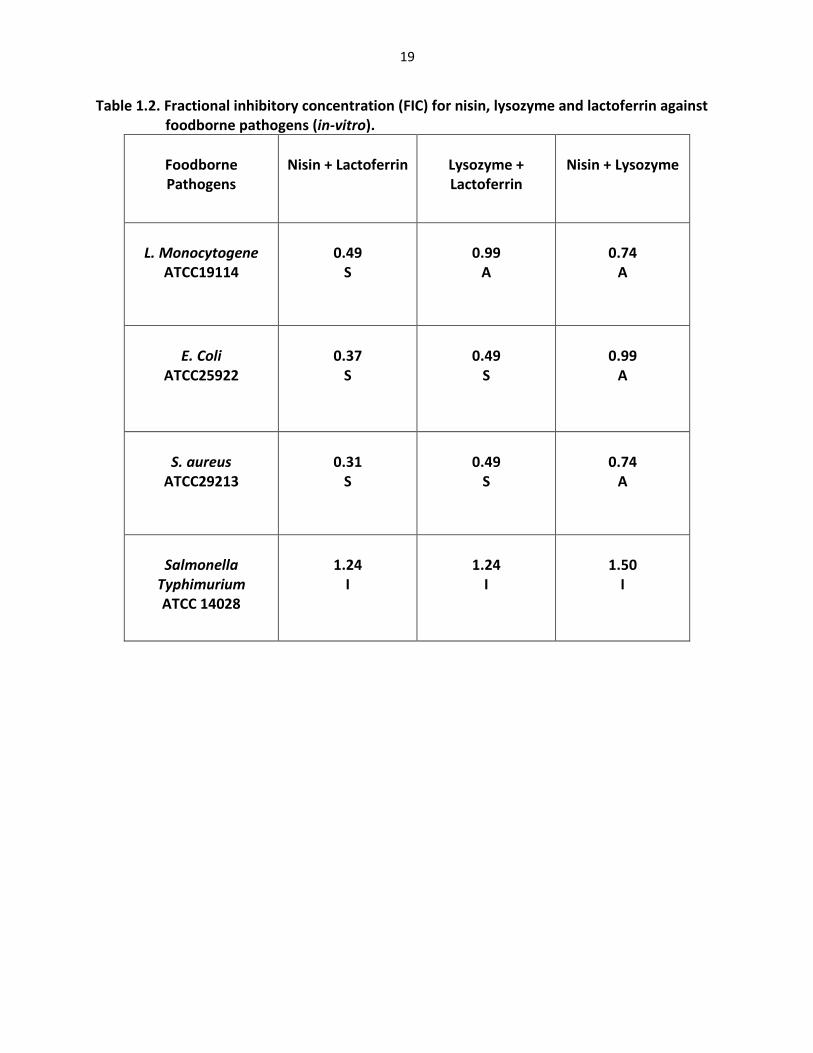
Table 1.2. Fractional inhibitory concentration (FIC) for nisin, lysozyme and lactoferrin against foodborne pathogens (in-vitro).
Foodborne Pathogens
Nisin + Lactoferrin
Lysozyme + Lactoferrin
Nisin + Lysozyme
L. Monocytogene
ATCC19114
0.49
S
0.99
A
0.74
A
E. Coli
ATCC25922
0.37
S
0.49
S
0.99
A
S. aureus
ATCC29213
0.31
S
0.49
S
0.74
A
Salmonella
Typhimurium ATCC 14028
1.24
I
1.24
I
1.50
I
20
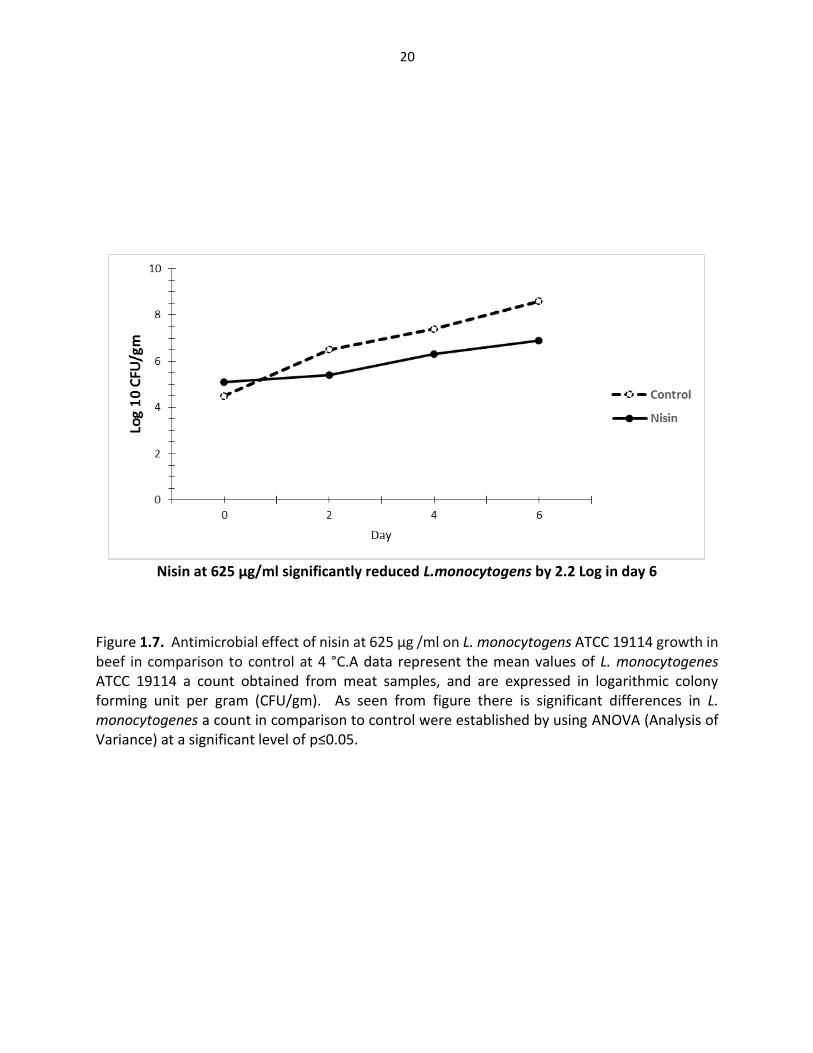
Nisin at 625 µg/ml significantly reduced L.monocytogens by 2.2 Log in day 6
Figure 1.7. Antimicrobial effect of nisin at 625 µg /ml on L. monocytogens ATCC 19114 growth in beef in comparison to control at 4 °C.A data represent the mean values of L. monocytogenes ATCC 19114 a count obtained from meat samples, and are expressed in logarithmic colony forming unit per gram (CFU/gm). As seen from figure there is significant differences in L. monocytogenes a count in comparison to control were established by using ANOVA (Analysis of Variance) at a significant level of p≤0.05.

21
Nisin at 625 µg/ml significantly reduced S. aureus by 2.6 Log in day 6
Figure 1.8. Antimicrobial activity of nisin at 625 µg /ml on S. aureus ATCC 29213growth in beef in comparison to control at 4°C.A data represent the mean values of S. aureus ATCC 29213a count obtained from meat samples, and are expressed in logarithmic colony forming unit per gram (CFU/gm). As seen from figure there is significant differences in S. aureus ATCC 29213a count in comparison to control were established by using ANOVA (Analysis of Variance) at a significant level of p≤0.05.
22
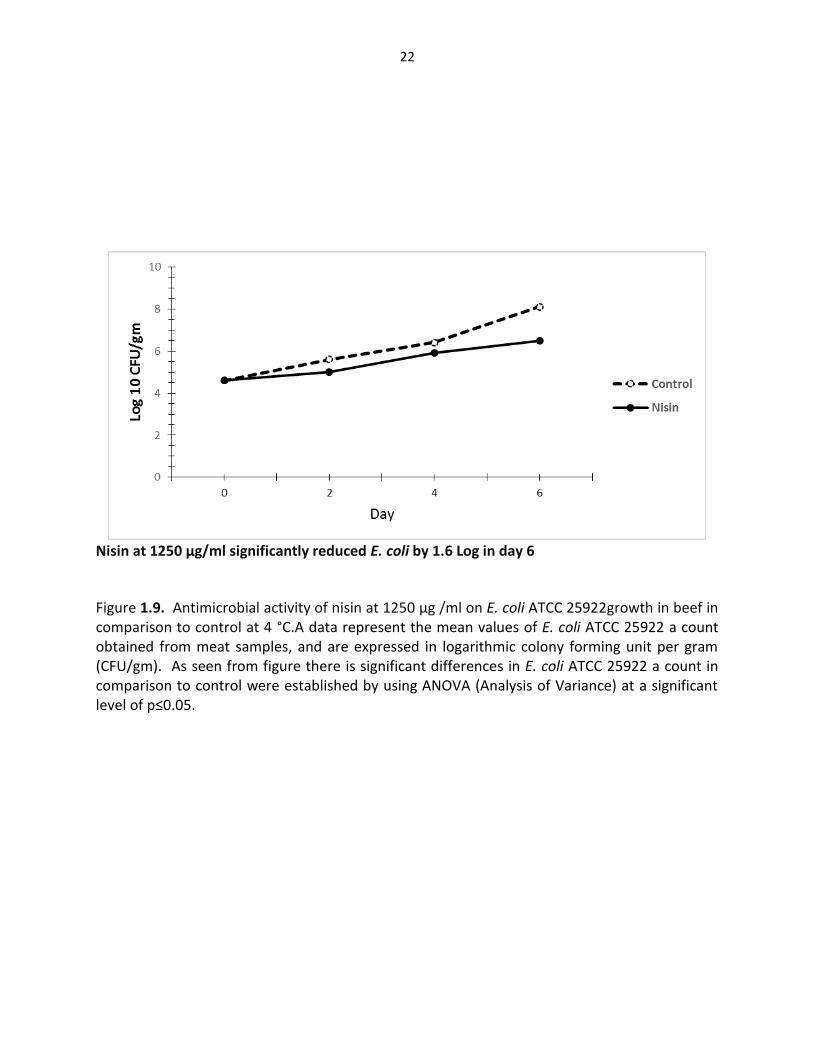
Nisin at 1250 µg/ml significantly reduced E. coli by 1.6 Log in day 6
Figure 1.9. Antimicrobial activity of nisin at 1250 µg /ml on E. coli ATCC 25922growth in beef in comparison to control at 4 °C.A data represent the mean values of E. coli ATCC 25922 a count obtained from meat samples, and are expressed in logarithmic colony forming unit per gram (CFU/gm). As seen from figure there is significant differences in E. coli ATCC 25922 a count in comparison to control were established by using ANOVA (Analysis of Variance) at a significant level of p≤0.05.
23
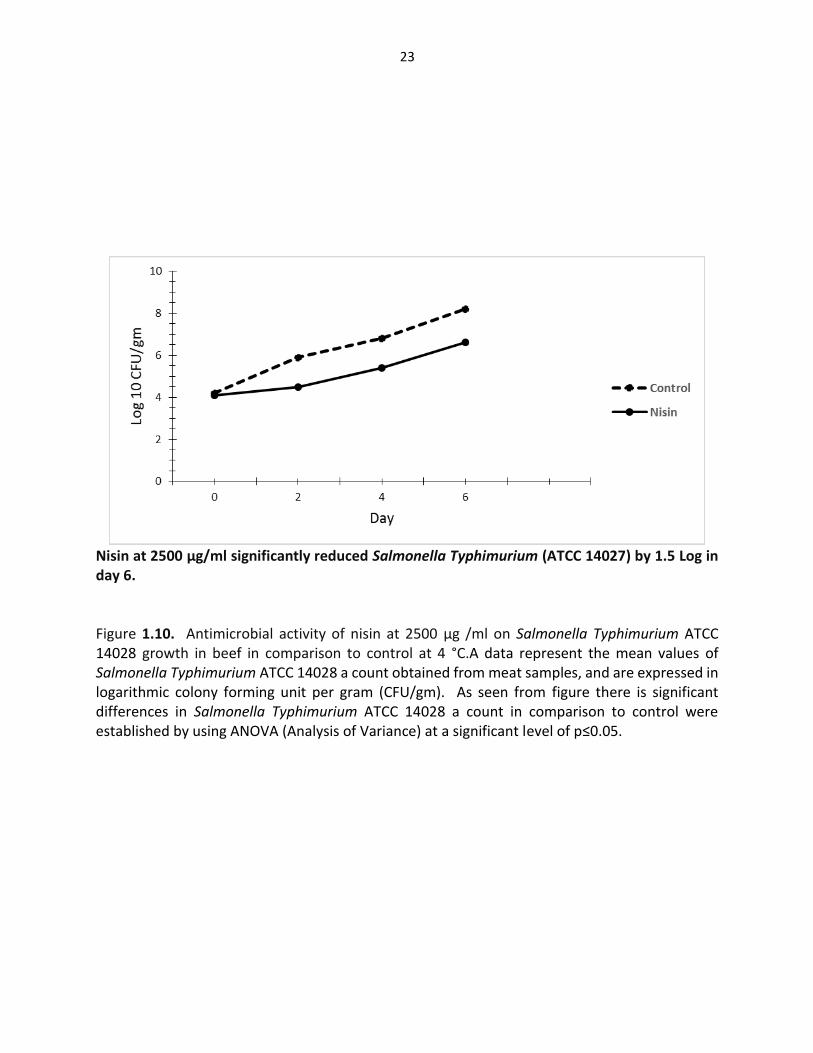
Nisin at 2500 µg/ml significantly reduced Salmonella Typhimurium (ATCC 14027) by 1.5 Log in day 6. Figure 1.10. Antimicrobial activity of nisin at 2500 µg /ml on Salmonella Typhimurium ATCC 14028 growth in beef in comparison to control at 4 °C.A data represent the mean values of Salmonella Typhimurium ATCC 14028 a count obtained from meat samples, and are expressed in logarithmic colony forming unit per gram (CFU/gm). As seen from figure there is significant differences in Salmonella Typhimurium ATCC 14028 a count in comparison to control were established by using ANOVA (Analysis of Variance) at a significant level of p≤0.05.
24
Lysozyme at 1250 µg/ml significantly reduced L.monocytogens (ATCC 19114) by 2.7 Log in day 6
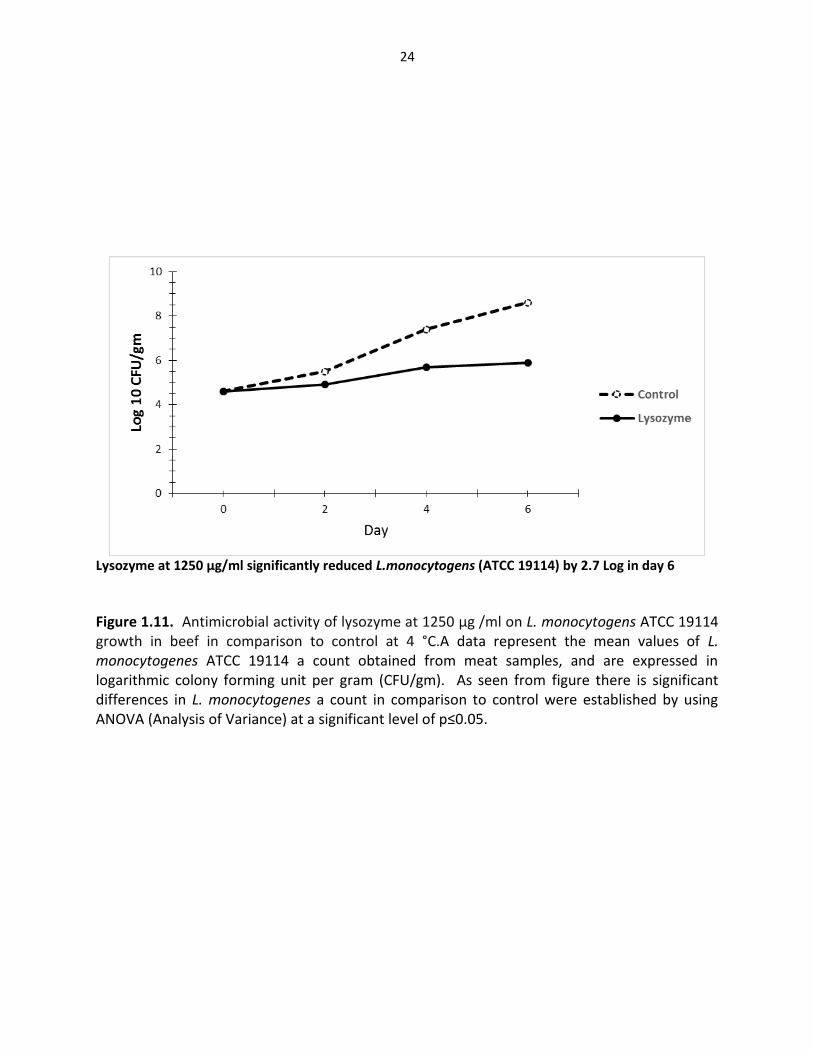
Figure 1.11. Antimicrobial activity of lysozyme at 1250 µg /ml on L. monocytogens ATCC 19114 growth in beef in comparison to control at 4 °C.A data represent the mean values of L. monocytogenes ATCC 19114 a count obtained from meat samples, and are expressed in logarithmic colony forming unit per gram (CFU/gm). As seen from figure there is significant differences in L. monocytogenes a count in comparison to control were established by using ANOVA (Analysis of Variance) at a significant level of p≤0.05.
25
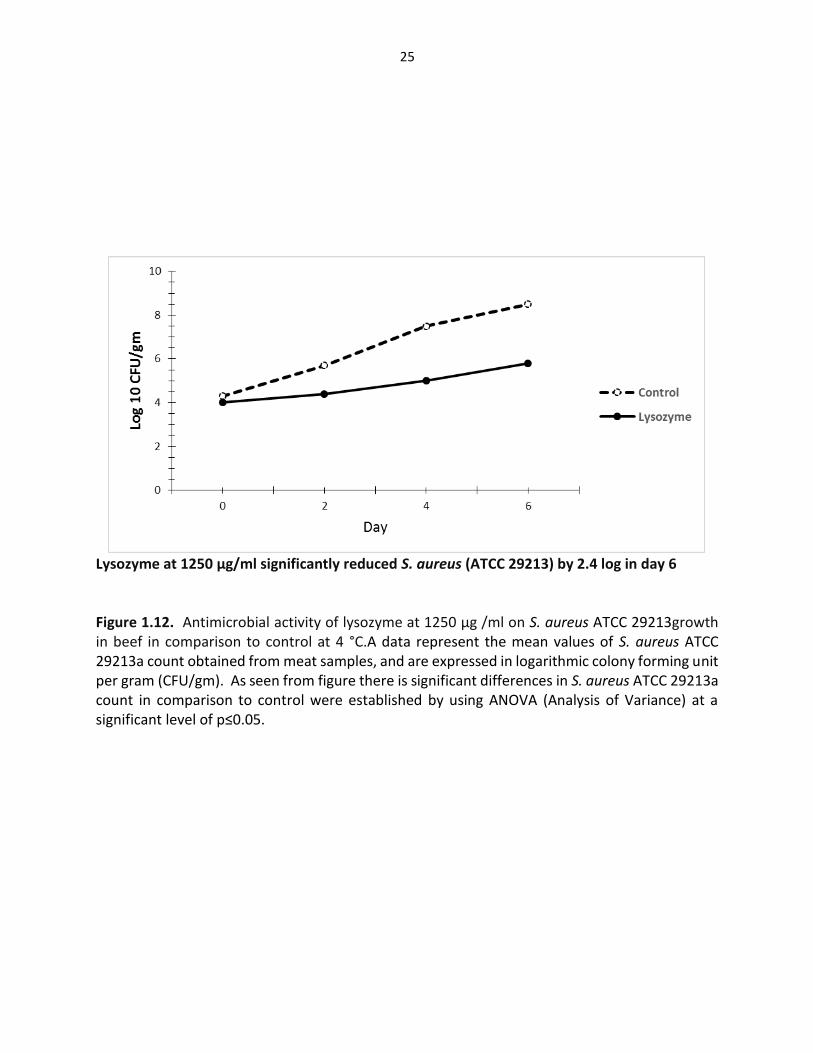
Lysozyme at 1250 µg/ml significantly reduced S. aureus (ATCC 29213) by 2.4 log in day 6 Figure 1.12. Antimicrobial activity of lysozyme at 1250 µg /ml on S. aureus ATCC 29213growth in beef in comparison to control at 4 °C.A data represent the mean values of S. aureus ATCC 29213a count obtained from meat samples, and are expressed in logarithmic colony forming unit per gram (CFU/gm). As seen from figure there is significant differences in S. aureus ATCC 29213a count in comparison to control were established by using ANOVA (Analysis of Variance) at a significant level of p≤0.05.

26
Lysozyme at 2500 µg/ml significantly reduced E. coli (ATCC 25922) by 1.3 Log in day 6
Figure 1.13. Antimicrobial activity of lysozyme at 2500 µg /ml on E. coli ATCC 25922 growth in beef in comparison to control at 4 °C.A data represent the mean values of E. coli ATCC 25922 a count obtained from meat samples, and are expressed in logarithmic colony forming unit per gram (CFU/gm). As seen from figure there is significant differences in E. coli ATCC 25922 a count in comparison to control were established by using ANOVA (Analysis of Variance) at a significant level of p≤0.05.
27
Lactoferrin at 2500 µg/ml significantly reduced L.monocytogens (ATCC 19114) by 2.0 Log in day 6
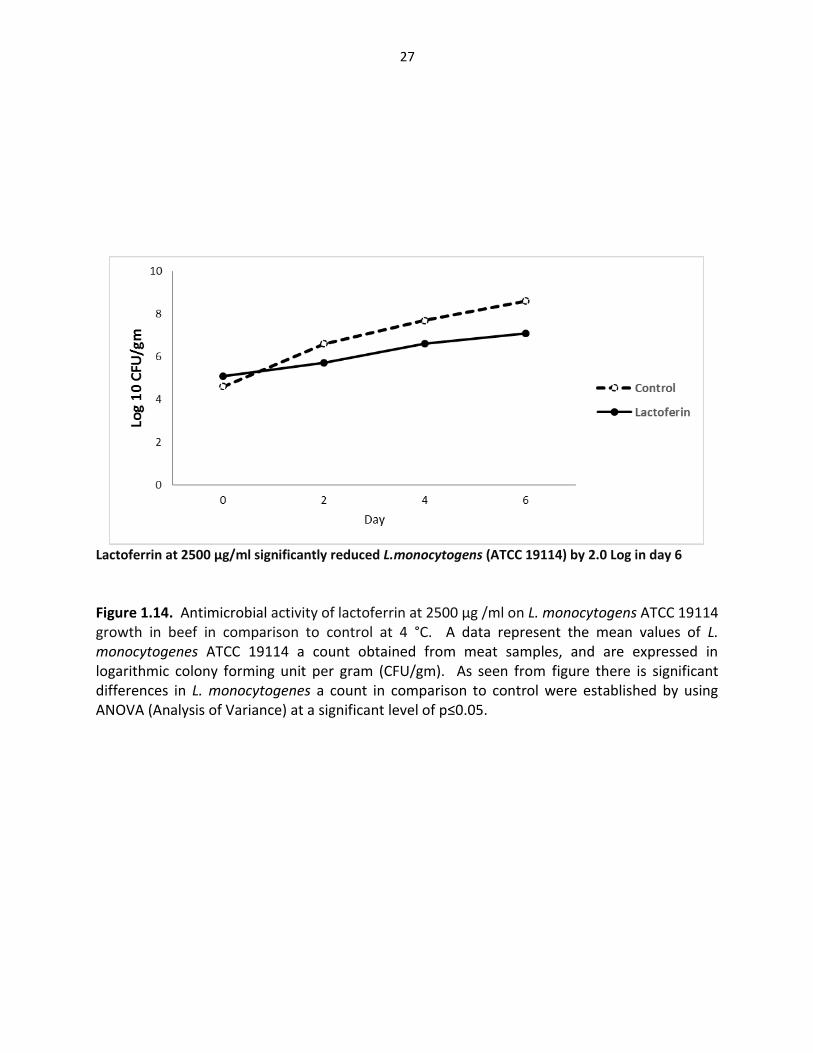
Figure 1.14. Antimicrobial activity of lactoferrin at 2500 µg /ml on L. monocytogens ATCC 19114 growth in beef in comparison to control at 4 °C. A data represent the mean values of L. monocytogenes ATCC 19114 a count obtained from meat samples, and are expressed in logarithmic colony forming unit per gram (CFU/gm). As seen from figure there is significant differences in L. monocytogenes a count in comparison to control were established by using ANOVA (Analysis of Variance) at a significant level of p≤0.05.
28
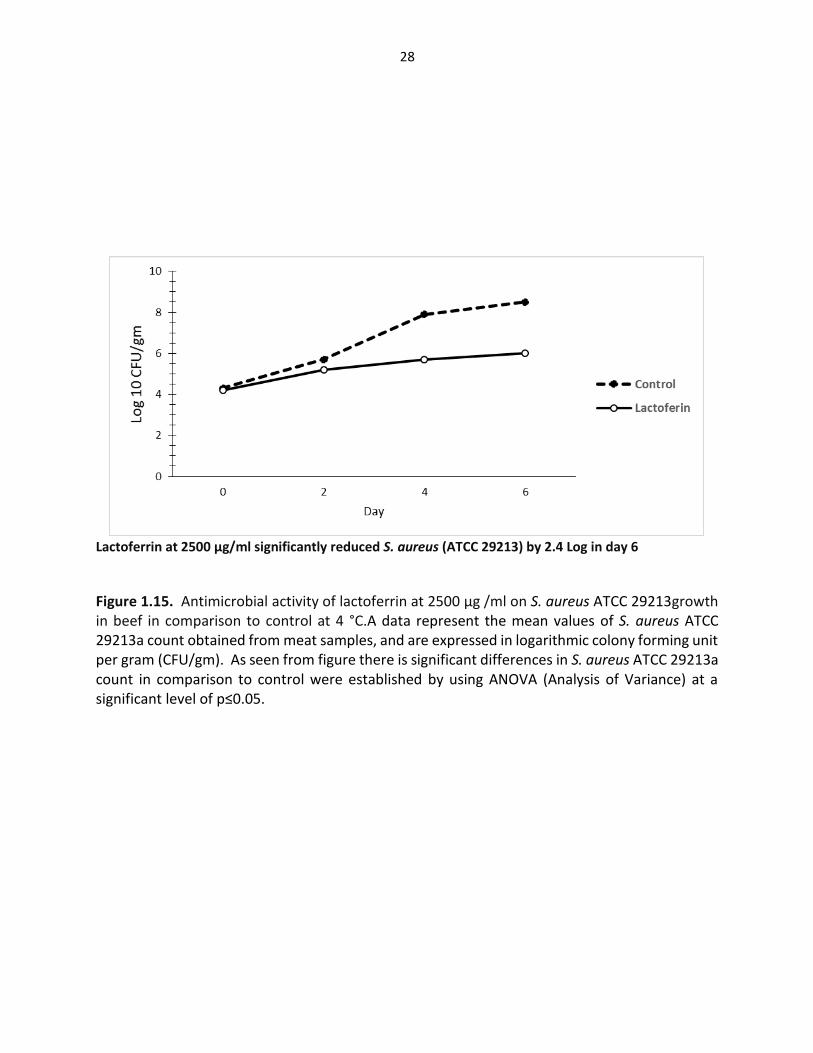
Lactoferrin at 2500 µg/ml significantly reduced S. aureus (ATCC 29213) by 2.4 Log in day 6
Figure 1.15. Antimicrobial activity of lactoferrin at 2500 µg /ml on S. aureus ATCC 29213growth in beef in comparison to control at 4 °C.A data represent the mean values of S. aureus ATCC 29213a count obtained from meat samples, and are expressed in logarithmic colony forming unit per gram (CFU/gm). As seen from figure there is significant differences in S. aureus ATCC 29213a count in comparison to control were established by using ANOVA (Analysis of Variance) at a significant level of p≤0.05.

29
Lactoferrin at 2500 µg/ml significantly reduced E. coli (ATCC 25922) by 1.6 Log in day 6
Figure 1.16. Antimicrobial activity of lactoferrin at 2500 µg /ml on E. coli ATCC 25922 growth in beef in comparison to control at 4 °C.A data represent the mean values of E. coli ATCC 25922 a count obtained from meat samples, and are expressed in logarithmic colony forming unit per gram (CFU/gm). As seen from figure there is significant differences in E. coli ATCC 25922 a count in comparison to control were established by using ANOVA (Analysis of Variance) at a significant level of p≤0.05.

30
Nisin at 625 µg/ml and Lactoferrin at 2500 µg/ml significantly reduced L.monocytogens (ATCC 19114) 3.2 Log in day 6
Figure 1.17. Antimicrobial activity of nisin at 625 µg /ml and lactoferrin at 2500 µg/ml on L. monocytogens ATCC 19114 growth in beef in comparison to control at 4 °C. A data represent the mean values of L. monocytogenes ATCC 19114 a count obtained from meat samples, and are expressed in logarithmic colony forming unit per gram (CFU/gm). As seen from figure there is significant differences in L. monocytogenes a count in comparison to control were established by using ANOVA (Analysis of Variance) at a significant level of p≤0.05.

31
Nisin at 625 µg/ml and lactoferrin at 2500 µg/ml significantly reduced S. aureus by 3.4 Log in day 6 Figure 1.18. Antimicrobial activity of nisin at 625 µg /ml and lactoferrin at 2500 µg /ml on S. aureus ATCC 29213growth in beef in comparison to control at 4 °C.A data represent the mean values of S. aureus ATCC 29213a count obtained from meat samples, and are expressed in logarithmic colony forming unit per gram (CFU/gm). As seen from figure there is significant differences in S. aureus count in comparison to control were established by using ANOVA (Analysis of Variance) at a significant level of p≤0.05.
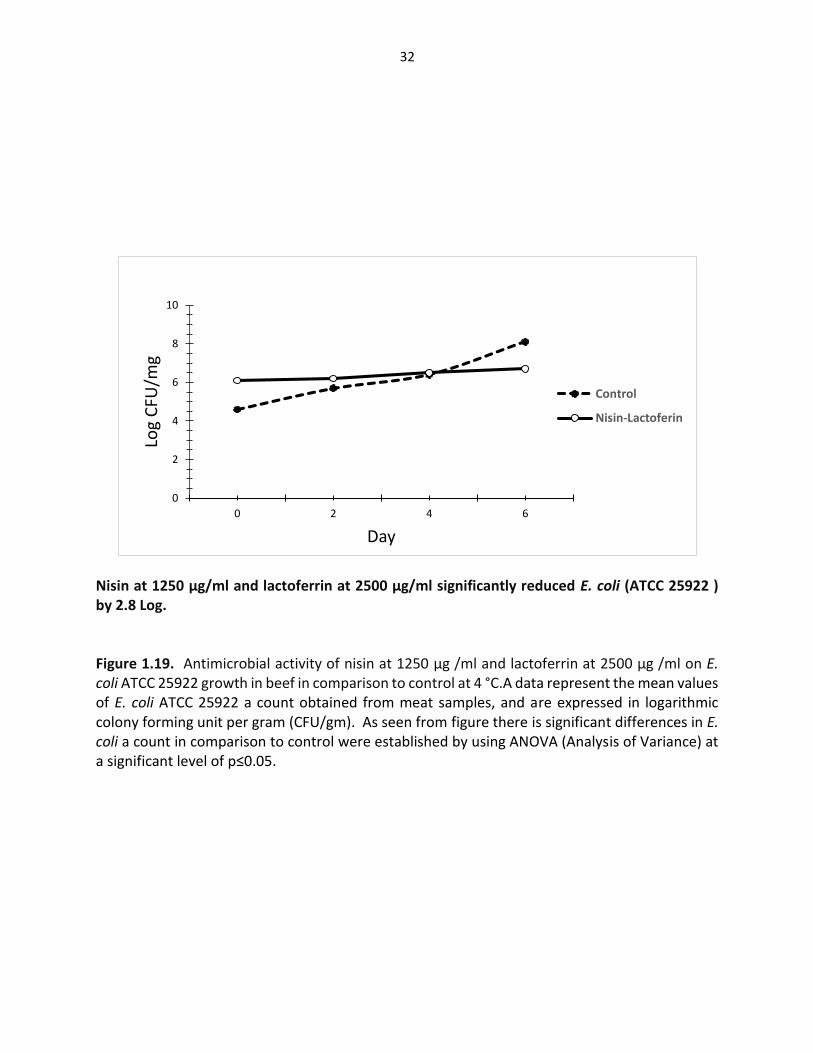
32
Nisin at 1250 µg/ml and lactoferrin at 2500 µg/ml significantly reduced E. coli (ATCC 25922 ) by 2.8 Log. Figure 1.19. Antimicrobial activity of nisin at 1250 µg /ml and lactoferrin at 2500 µg /ml on E. coli ATCC 25922 growth in beef in comparison to control at 4 °C.A data represent the mean values of E. coli ATCC 25922 a count obtained from meat samples, and are expressed in logarithmic colony forming unit per gram (CFU/gm). As seen from figure there is significant differences in E. coli a count in comparison to control were established by using ANOVA (Analysis of Variance) at a significant level of p≤0.05.
0
2
4
6
8
10
0 2 4 6
Log
CFU
/mg
Day
Control
Nisin-Lactoferin

33
Lysozyme at 1250 µg/ml and Lactoferrin at 2500 µg/ml significantly reduced S. aureus (ATCC 29213) by 3.3 Log in day 6
Figure 1.20. Antimicrobial activity of lysozyme at 1250 µg /ml and lactoferrin at 2500 µg /ml on S. aureus ATCC 29213 growth in beef in comparison to control at 4 °C.A data represent the mean values of S. aureus ATCC 29213 a count obtained from meat samples, and are expressed in logarithmic colony forming unit per gram (CFU/gm). As seen from figure there is significant differences in S. aureus ATCC 29213 a count in comparison to control were established by using ANOVA (Analysis of Variance) at a significant level of p≤0.05.

34
Lysozyme at 2500 µg/ml and Lactoferrin at 2500 µg/ml significantly reduced E. coli (ATCC 25922) by 2.5 Log in day 6
Figure 1.21. Antimicrobial activity of lysozyme at 2500 µg /ml and lactoferrin at 2500 µg /ml on E. coli ATCC 25922 growth in beef in comparison to control at 4 °C. A data represent the mean values of E. coli ATCC 25922 a count obtained from meat samples, and are expressed in logarithmic colony forming unit per gram (CFU/gm). As seen from figure there is significant differences in E. coli ATCC 25922 a count in comparison to control were established by using ANOVA (Analysis of Variance) at a significant level of p≤0.05.

35
Lysozyme at 1250 µg/ml and Lactoferrin at 2500 µg/ml significantly reduced L. monocytogenes (ATCC 19114) by 2.8 Log in day 6
Figure 1.22. Antimicrobial activity of lysozyme at 1250 µg /ml and lactoferrin at 2500 µg /ml on L. monocytogens ATCC 19114 growth in beef in comparison to control at 4 °C. A data represent the mean values of L. monocytogenes ATCC 19114 a count obtained from meat samples, and are expressed in logarithmic colony forming unit per gram (CFU/gm). As seen from figure there is significant differences in L. monocytogenes a count in comparison to control were established by using ANOVA (Analysis of Variance) at a significant level of p≤0.05.

36
Nisin at 625 µg/ml and Lysozyme at 1250 µg/ml significantly reduced L. monocytogenes ATCC 19114 by 2.9 Log in day 6
Figure 1.23. Antimicrobial effect of nisin at 625 µg /ml and lysozyme at 1250 µg /ml on L. monocytogens ATCC 19114 growth in beef in comparison to control at 4 °C.A data represent the mean values of L. monocytogenes ATCC 19114 a count obtained from meat samples, and are expressed in logarithmic colony forming unit per gram (CFU/gm). As seen from figure there is significant differences in L. monocytogenes a count in comparison to control were established by using ANOVA (Analysis of Variance) at a significant level of p≤0.05.

37
Nisin at 625 µg/ml and lysozyme at 1250 µg/ml significantly reduced S. aureus (ATCC 29213) by 3 Log in day 6.
Figure 1.24. Antimicrobial effect of nisin at 625 µg /ml and lysozyme at 1250 µg /ml on S. aureus ATCC 29213growth in beef in comparison to control at 4 °C.A data represent the mean values of S. aureus ATCC 29213 a count obtained from meat samples, and are expressed in logarithmic colony forming unit per gram (CFU/gm). As seen from figure there is significant differences in S. aureus ATCC29213 a count in comparison to control were established by using ANOVA (Analysis of Variance) at a significant level of p≤0.05.

38
Nisin at 1250 µg/ml and lysozyme at 2500 µg/ml significantly reduced E. coli (ATTCC 25922) by 1.9 Log in day 6
Figure 1.25. Antimicrobial effect of nisin at 1250 µg /ml and lysozyme at 2500 µg /ml on E. coli ATCC 25922 growth in beef in comparison to control at 4 °C. A data represent the mean values of E. coli ATCC 25922 a count obtained from meat samples, and are expressed in logarithmic colony forming unit per gram (CFU/gm). As seen from figure there is significant differences in E. coli ATCC 25922 a count in comparison to control were established by using ANOVA (Analysis of Variance) at a significant level of p≤0.05.

39
Results and discussion
The use of natural antimicrobial preservatives has been preferred in the food industry
because of consumers’ demands (Dufour et al. 2003). Lactoferrin, lysozyme and nisin are three
natural compounds that have received considerable attention in recent years (Murdock and
Matthews, 2002). Properties of these three sources of natural antimicrobials can be used to
improve microbial safety of foods. Combining these natural antimicrobials could possibly
increase the effectiveness of the antimicrobials proving to be better than if they were used alone
against foodborne pathogens.
Antimicrobial activity of lactoferrin, lysozyme and nisin in-vitro
Using antimicrobial combinations provide different effects against foodborne pathogens.
Synergistic effect when combined effect is greater than the sum of the effects with two agents
independently (Barry, 1976). Additive effect is when the combined effect is equal to the sum of
the individual effects while antagonism is when the effect of one antimicrobial is reduced in the
presence of another antimicrobial.
Minimal inhibitory concentration (MIC) for individual antimicrobial, MIC for combinations
and the fractional inhibitory concentration (FIC) were measured to evaluate type of combination
effect in-vitro (synergistic, additive, indifference and antagonism).
Minimal inhibitory concentrations (MIC) of natural antimicrobials nisin, lysozyme and
lactoferrin against tasted bacteria in cation-adjusted Mueller-Hinton II broth (CAMHB) (in-vitro)
were shown in table (1-1). Nisin, lysozyme and lactoferrin showed different antimicrobial
activities against the tested strains based on calculated MICs. MICs for nisin were the lowest
compare to other antimicrobials where MICs against L. monocytogenes, E. coli, S. aureus and

40
Salmonella typhimurium were (312, 625, 312 and 1250 µg /ml) respectively. Antimicrobial
activity of nisin is due to its ability to bind the cytoplasmic membrane and form pores that
damage the membrane ( Kuwano et al., 2005) causing cell death due to loss different important
cell compounds such as ATP, some ions like K+, and the proton motive force (Millette et al., 2004).
Also, many studies have shown that the antimicrobial actions of nisin may be attributed to
interfere with cell wall biosynthesis by binding with lipid II, which is important compound in a
peptidoglycan layer (Bauer and Dicks, 2005).
Lysozyme’s MICs were relatively less against tested bacteria compare to nisin where MICs
for lysozyme against L. monocytogenes, E. coli, S. aureus and Salmonella typhimurium were (625,
1250, 625 and 2500 µg /ml) respectively. Antimicrobial activity of lysozyme is based on the
hydrolysis of the β 1-4 glycosidic linkages between N-acetylmuramic acid and N-acetyl
glucosamine in bacterial peptidoglycan, Peptidoglycan is the major component of the cell wall of
both Gram positive and Gram negative bacteria (Cunningham et al., 1991).
Lactoferrin had highest MICs among the other antimicrobials. However, using it in
different combinations with another antimicrobial, such as nisin and lysozyme, lactoferrin as
general chelator that has the ability to release lipopolysaccharide (LPS) and permeabilize the
gram-negative cell wall, nisin and lysozyme could then have access to the inner membrane thus
providing a novel system for control of gram-negative pathogens, such as E. coli (Ellison,
1994); (Branen and Davidson, 2004). In the other hand, although lactoferrin had highest MIC
among the other antimicrobials in the present study, this finding was agreement with previous
studies for gram-positive bacteria while for gram-negative some studies have reported that
lactoferrin MIC against E. coli O157:H7 was higher (Murdock and Matthews 2002). This may be

41
attributed to composition of media where in most previous studies a typical medium (TSB) was
used, which contains high levels of divalent cations. TSB can reduce or eliminate the inhibitory
activity of lactoferrin (Bellamy et al. 1992) (Jones et al. 1994). In addition, divalent cations may
be impaired the ability of lactoferrin to permeabilize the gram-negative cell wall by binding to
the area of the lactoferrin molecule associated with the antimicrobial activity;( Dionysius and
Milne, 1997) ; (Branen and Davidson, 2000).
Different combinations between lactoferrin with nisin, lactoferrin with lysozyme and
lysozyme with nisin and their fractional inhibitory concentration (FIC) against tested bacteria in
cation-adjusted Mueller-Hinton II broth (CAMHB) (in-vitro) were shown in table (1-2). Five
combinations exhibited synergistic effect as following (nisin with lactoferrin) against L.
monocytogenes, E. coli and S. aureus, and (lysozyme with lactoferrin) against E. coli and S. aureus.
The FIC for these combinations were less than 0.5 which indicated that were synergy
(Amsterdam, 1996). In addition, four combinations showed additive effect as following (nisin
with lysozyme) against L. monocytogenes, E. coli, and S. aureus and (lysozyme with lactoferrin)
against L. monocytogenes. The FIC for these combinations were between (0.5–1.0) which
indicated that were additive effect (Amsterdam, 1996).
Using specific combinations such as nisin with lactoferrin, lysozyme with lactoferrin and
nisin with lysozyme against tested pathogens bacteria demonstrated improved minimal
inhibitory concentrations (MIC), compared to the parent compounds. Three combinations
showed indifference effect against Salmonella typhimurium where FIC for all combinations were
between (1.24-1.50) which indicate that were indifferent effect. Another studies showed that
combination between lactoferrin and nisin did not inhibit growth of Salmonella Stanley (Murdock

42
et al, 2006). The differences in activity of these combinations against negative bacteria may be
attributed to differences in outer membrane or LPS structure in cell wall of bacteria (Branen and
Davidson, 2004). No combination showed antagonism against tested strains.
Antimicrobial activity of lactoferrin, lysozyme and nisin in food model-meat (in-vivo)
To evaluate antimicrobial activity of lactoferrin, lysozyme and nisin against tested bacteria in
food model (in-vivo), combinations that exhibited synergistic and additive effect were selected
to treat beef samples. Antimicrobial activity of these antimicrobial individually and their
combinations against tested bacteria in food model were shown in Figures (1-7)-(1-25).
Our results in food model showed that lactoferrin, lysozyme and nisin individually had
significant effect (p<0.01) on growth of gram-postive bacteria (L. monocytogenes and S. aureus)
compared to control. Lactoferrin, lysozyme and nisin individually were effective in reducing
count of L. monocytogenes by (2, 2.7 and 2.2) Log CFU/gm respectively, while for S. aureus by
(2.4, 2.4, and 2.6) Log CFU/respectively. This finding was in general agreement with previous
studies (Cleveland et al. 2001); (Murdok et al, 2006). In addition, combinations of (nisin with
lactoferrin) and (lysozyme with lactoferrin) had significant effect (p<0.01) on growth of gram-
postive bacteria. Combinations of (nisin with Lactoferrin) and (lysozyme with lactoferrin) were
effective in reducing a count of L. monocytogenes by (3.2, 2.8) Log CFU/gm respectively (Figure s
1.17, 1.22) and they effect in reducing a count of S. aureus by (3.4, 3.3) log CFU/gm respectively,
(Figure s 1.18, 1.20).This consistent with in-vitro results which were showed synergistic effect for
these combinations against L. monocytogenes and S. aureus (Table 1-2). This finding also is
agreement with previous studies, (Branen and Davidson, 2004) reported that lactoferrin
43
enhanced the activity of nisin against L. monocytogenes, when combined with lactoferrin, 50%
less nisin was required to totally inhibit L. monocytogenes.
In the other hand, nisin and lysozyme individually had less effect on the growth of gram-
negative bacteria S. typhimurium and E. coli as shown in Figure s 1.9, 1.10 and 1.13. This may be
attributed to the outer membrane barrier that surrounds and protects the peptidoglycan layer
(McKenzie and White, 1991). However, when nisin or lysozyme used in combination with
lactoferrin can be an effective approach to control gram-negative bacteria. The susceptibility of
gram-negative organisms to lysis by lysozyme or nisin can be increased by the use of detergents
and chelators (Shively and Hartse, 1964). In the presence of lactoferrin as general chelator that
has the ability to release lipopolysaccharide (LPS) and permeabilize the gram-negative cell wall,
nisin and lysozyme could then have access to the inner membrane thus providing a novel system
for control of gram-negative pathogens, such as E. coli (Ellison, 1994) ; (Branen and Davidson
2004).
These data support the hypothesis that lactoferrin and nisin or lysozyme can
synergistically function to inhibit the growth of foodborne pathogens. Our results indicated that
Using combinations ( nisin, lactoferrin),(lysozyme, lactoferrin) and (nisin, lysozyme) against
foodborne pathogens in meat industry may be a novel system to control foodborne pathogens
and offer unique properties such as increase the effectiveness of the antimicrobials proving to
be better than if they were used alone against foodborne pathogens and thereby decrease the
amounts and cost of each antimicrobial treatment and eliminate the harmful chemical effects
while improving the antimicrobial efficiency.

44
REFERENCES
Abee, T., Krockel, L., and Hill, C. 1995. Bacteriocins: modes of action and potentials in food
preservation and control of food poisoning. Int J Food Microbiol. 28: 169-185.
AL-NABULSI, A.A. and HOLLEY, R.A. 2006. Enhancing the antimicrobial effects of bovine
lactoferrin against E. coli O157:H7 by cation chelation NaCl and temperature. J. Appl.
Microbiol. 100, 244–255.
Alvarado, C.M., Richards, S. O'Keefe, H. Wang 2007.The effect of blood removal on
oxidation and shelf life of broiler breast meat.Poultryscience,86(1) (2007),pp.156-161.
Anonymous (2000) Federal Register. 65, 3121–3123
APHA; American Public Health Association (1992): Compendium of Methods for the
Microbiological Examination of Foods, 3rd ed. APHA, Washington, DC, USA.
Bailey, F.J. and Hurst, A. 1971. Preparation of a highly active form of nisin from
Streptococcus lactis. Can. J. Microbiol. 17:61-67
Bauer, R., and Dicks, L.M. 2005.Mode of action of lipid II-targeting lantibiotics. Int. J. Food
Microbiol. 101:201-216
Bellamy, W.R., Wakabayashi, H., Takase, M., Kawase, K., Shimamura, S. and Tomita,
M. (1993) Role of cell-binding in the antibacterial mechanism of lactoferricin B. J Appl.
Bacteriol 75, 478–484
Branen, J.K. and Davidson, P.M. (2004) Enhancement of nisin, lysozyme, and monolaurin
antimicrobial activities by ethylene diamine tetra acetic acid and lactoferrin. Int J Food
Microbiol 90, 63–74.
45
Brotz, H. Josten, M. Wiedemann, I. Schneider, U. . Gotz, F. Bierbaum, G. Sah., H.G. 1998
Role of lipid-bound peptidoglycan precursors in the formation of pores by nisin,
epidermin and other lantibiotics. Mol. Microbiol, 30 (1998), pp. 317-327.
Bruno, M. E. and Montville, T. J.1993. Common mechanistic action of bacteriocins from
lactic Acid bacteria. Appl Environ Microbiol. 59:3003-10
Chantaysakorn, P. and Richter, R.L. (2000) Antimicrobial properties of pepsin-digested
lactoferrin added to carrot juice and fltrates of carrot juice. J Food Prot. 63, 376–380.
Chandrapati, S. O'Sullivan, D.J. 1998.Procedure for quantifiable assessment of nutritional
parameters influencing Nisin production by Lactococcus lactis subsp. Lactis. Journal of
Biotechnology, 63 (1998), pp. 229-233
Chang, K.Y. Carr, C.W. 1971. Studies on the structure and function of lysozyme: I. The
effect of PH and cation concentration on lysozyme activity. Biochim. Biophys. Acta, 229
(1971), pp.469-503.
Cheeseman, G. C. and Berridge, N. J. 1957. An improved method of preparing nisin.
Biochem. J. 65:603-608.
Cleveland, J., Montville, T.J., Nes, I.F. and Chikindas, M.L. (2001) Bacteriocins: safe, natural
antimicrobials for food preservation. Int J Food Micro. Anonymous (2000) Federal
Register. 65, 3121–3123.obiol 71, 1–20.
Cunningham. F.E, Proctor. V.A, Goetsch.S.J.1991. Egg-white lysozyme as a food
preservative: an overview World's Poult. Sci. J., 47 (1991), pp. 141–163
Davies, R.C. Neuberger, A. Wilson, B.M. 1969. The dependence of lysozyme activity on PH
and ionic strength. Biochim. Biophys. Acta. 178 (1969), pp.294-305.
46
Delves-Broughton. J, Blackburn P, Evans. R.J, Hugenholtz.J.1996. Applications of the
bacteriocin, nisin Antonie van Leeuwenhoek, 69 (1996), pp. 193–202
Delves-Broughton. J, Blackburn P, Evans. R. J, Hugenholtz.J.1996. Applications of the
bacteriocin, nisin Antonie van Leeuwenhoek, 69 (1996), pp. 193–202
De Vuyst, L. Vandamme, E.J. 1992.Influence of the carbon source on nisin production
in Lactococcus lactis subsp. Lactis batch fermentations. Journal of General
Microbiology, 138, pp. 571-578
Dionysius, D.A. and Milne, J.M. (1997) Antibacterial peptides of bovine lactoferrin:
Purification and characterization. Journal of Dairy Science 80, 667–674.
Dufour, M., Simmonds, R.S. and Bremer, P.J. 2003 .Development of a method to quantify
in vitro the synergistic activity of natural antimicrobials .Int. J. Food Microbiol. 85, 249–
258.
Eliasi, J.R., Dwyer, J.T., 2002. Kosher and halal: religious observances affecting dietary
intakes. J. Am. Diet. Assoc. 101:911–913.
Ellison, R.T. 1994.The effects of lactoferrin on gram-negative bacteria. Adv. Exp. Med
Biol. 357, 71–90.
Farnaud, S. and Evans, R.W. 2003. Lactoferrin – a multifunctional protein with
antimicrobial properties. Mol. Immunol. 40, 395–405.
Gabig and Babior.1981.The killing of pathogens by phagocytes. Annual Review of
Medicine, 32 (1) (1981), pp. 313–326.
47
Grandin, T., Regenstein, J.M., 1994. Religious slaughter and animal welfare: a discussion
for meat scientists. Meat Focus International. CAB Intern., Wallingford, Oxon, UK, pp 115-
123.
Holzapfel, W.H., Geisen, R., Schillinger, U., 1995. Biological preservation of foods with
reference to protective cultures, bacteriocins and food-grade enzymes. Int. J. Food
Microbiol. 24, 343–362
IUCCI, Patrignani, L., Vallicelli, F., Guerzoni, M., and Lanciotti, R. 2007. Effects of high
pressure homogenization on the activity of lysozyme and lactoferrin against Listeria
monocytogenes. Food Control 18, 558–565.
Jorgensen, J.H.1993. Methods for dilution antimicrobial susceptibility tests for bacteria
that grow aerobically: approved standard: NCCLS document M7-A3.NCCLS; 1993.
Jones, E.M., Smart, A., Bloomberg, G., Burgess, L. and Millar, M.R. (1994) Lactoferricin, a
new antimicrobial peptide. J Appl Bacteriol 77, 208–214
Juncioni de Arauz L, Faustino Jozala A, Gava Mazzola P, and Vessoni penna Ch. Nisin
biotechnological production and application: A review. Food Science & Technology 2009;
1-9.
Kim J.S, Kim Y.2007.The inhibitory effect of natural bioactives on the growth of pathogenic
bacteria. Nutrition research and practice 2007, 1:273-278.
Kuwano, K., Tanaka, N., Shimizu, T., Nagatoshi, K., Nou, S., and Sonomoto, K. 2005. Dual
antibacterial mechanisms of nisin Z against gram positive and gram-negative bacteria. Int.
J. Antimicrob Agents. 26:396-402.

48
Lee, S. H., and Kim, H. U. 1985. Studies on the antibiotic nisin produced by Streptococcus
lactis IFO12007. Korean J. Anim. Sci. 27:480-483.
Magnus, P., 1981. Meat Composition. Food Science and Technology, 4th edition.
Gohumunary Pub. London. Pp-108-215.
Makenzie, H.A. White, F.H.1991. Lysozyme and alpha-lactlbumin: structure, function and
interrelationships. Adv. Prot.Chem.41:173-315.
Mantovani, H.C., and Russell, J.B. 2001. Nisin resistance of Streptococcus bovis. Appl.
Environ. Microbiol. 67:808–813
Masschalck, B., Van houdt, R. and Michiels, C.W. 2001.High pressure increases
bactericidal activity and spectrum of lactoferrin, lacto- ferricin and nisin. Int. J. Food
Microbiol. 64, 325–332.
Mead, P.S.; Slutsker, L.; Dietz, V.; McCaig, L.F.; Bresee, J.S.; Shapiro, C.; Griffin, P.M.;
Tauxe, R.V. Food-Related Illness and Death in the United States. Emerg. Infect. Dis. 1999,
5, 607–625.
Millette, M, Smoragiewicz, W., and Lacroix, M. 2004.Antimicrobial potential of
immobilized Lactococcus lactis subsp. lactis ATCC11454 against selected bacteria. J. Food
Prot. 67:1184-1189.
Moody, J.1992. Synergism testing: broth microdilution checkerboard and broth
macrodilution methods. Clinical microbiology procedures handbook Washington, DC:
American Society for Microbiology, 5:22.
49
Murdock, J., Cleveland, K.R., Matthews, M.L., Chikindas.2006. The synergistic effect of
nisin and lactoferrin on the inhibition of Listeria monocytogenes and Escherichia
coli O157:H7
Murdock, C.A. and Matthews, K.R. 2002.Antibacterial activity of pepsin digested
lactoferrin on food borne pathogens in buffered broth systems and ultrahigh temperature
milk with EDTA. J. Appl. Microbiol.
Nakyinsige, K., Fatimah, A.B., Aghwan, Z.A., Zulkifli, I., Goh, Y.M., Sazili, A.Q. 2014.
Bleeding Efficiency and Meat Oxidative Stability and Microbiological Quality of New
Zealand White Rabbits Subjected to Halal Slaughter without Stunning and Gas Stun-killing.
Asian-Australas J. Anim. Sci.; 27 (3):406-13.
Odell, E.W., Sarra, R., Foxworthy, M., Chapple, D.S. and Evans, R.W. (1996) Antibacterial
activity of peptides homologous to a loop region in human lactoferrin. FEBS Lett 382, 175–
178
Proctor .V.A and Cunningham. F.E, 1988 V.1988.The chemistry of lysozyme and its use as
a food preservative and a pharmaceutical Crit. Rev. Food Sci. Nutr., 26 (1988), pp. 359–
395
Reunanen, J. and Saris, P.E.F. 2004. Bioassay for nisin in sausage: A shelf life study of nisin
in cooked sausage. Meat Sci. 66, 515– 518.
Roberts, D. and M. Greenwood, 2003.Practical Food Microbiology.3rd Edn., Blackwell
Publishing Ltd., Oxford, UK

50
Sahl, H.G. 1991. Pore formation in bacterial membranes by cationic lantibiotics. In Nisin
and Novel Lantibiotics, Jung, G. and Sahl, H.G., Eds., Escom, Leiden. The Netherlands. 347-
358.
Samelis, J., Bedie, G.K., Sofos, J.N., Belk, K.E., Scanga, J.A. and Smith, G.C. 2005.
Combinations of nisin with organic acids or salts to control L. monocytogenes on sliced
pork bologna stored at 4°C in vacuum packages. Lebensm.-Wiss. Technol. 38, 21–28.
Schelz Z, Molnar J, Hohmann, J.2006 Antimicrobial and antiplasmid activities of essential
oils. Fitoterapia, 77:279-285.
Shimazaki, K. 2000. Lactoferrin: A marvelous protein in milk. Anim. Sci. J. 71, 329–347.
Shelef LA, Seiter J (1993) Enhancement of the activity of novobiocin against Escherichia
coli by lactoferrin. J Dairy Sci. 82:492–499
Shively JM, Hartsell SE (1964) Bacteriolysis of the Pseudomonads: I. Agents potentiating
lysis. Can J Microbiol 10:905–909
Urbain, W. M, and J .F. Campbell. 1987. Meat Preservation. In the Science of Meat and
Meat Products. 3rd Edn. (J.F. Price, and B.S. Schweigert, Eds) pp. 371-412. Food and
Nutrition Press, Inc. Westport, CN.
Warriss, P. W. 2001 Postmortem changes in muscles and its convection into meat. Meat
science, an introductory text, pp. 100 – 161. CABI Publishing, Wallingford, UK
Ye, X.Y., Wang, H.X., Liu, F. and Ng, T.B. (2000) Ribonuclease, cell-free translation-
inhibitory and superoxide radical scavenging activities of the iron-binding protein
lactoferrin from bovine milk. Int J Biochem C. Biol. 32, 235–241.

51
CHAPTER 2: MOLECULAR CHARACTERIZATION OF TOXIN GENES AND ANTIBIOTIC RESISTANCE
OF STAPHYLOCOCCUS AUREUS ISOLATES FROM MEAT
Abstract
Staphylococcal heat-stable enterotoxins and antibiotic resistance are important public health
issues in the world. The aim of this research is to investigate the presence and characterization
of staphylococcal enterotoxin genes by polymerase chain reaction and test the antibiotic
susceptibility of the Staphylococcus aureus isolates from meat. 96 and 63 positive
Staphylococcus aureus isolates were recovered from 142 meat samples and were subjected to
prevalence of the enterotoxin genes and antimicrobial susceptibility tests against fourteen
antibiotics. Our study indicated that 61 (42.9%) meat samples were positive and confirmed to
be S. aureus by genotypic and biochemical identification. Enterotoxin genes profile indicated
that 80.9% of the tested strains contained either one or more enterotoxin genes. A high percent
(60.3%) of SEA gene was detected. The most commonly combinations detected were sea sei, sei
she, sea she and sea sei she with 23.8, 17.4, 14.2 and 11.11% respectively. No isolates harbored
three SE genes, that is, seb, sec, or see. Mec A gene was positive in 71.4% of S. aureus isolates.
All isolates carrying the mec A gene showed positive MRSA phenotypes. Antibiotic resistance
profile indicated that some isolates showed high resistance to specific antibiotic such as penicillin
(71.8%), ampicillin (70.8%), tetracycline (36.4%) amoxicillin (35.4%) and oxacillin (26%). There
was no apparent resistance to some antibiotic such as nitrofurantoin, vancomycin and
ciprofloxacin. A small percentage of the isolates demonstrated resistance to rifampicin, amikacin
and chloramphenicol (2%) for each, gentamycin and clindamycin (3.1%) for each and
erythromycin (7.2%). High percentage of multidrug resistant S. aureus (48.9%) was detected.
52
Results from this research indicate that high levels of staphylococcal enterotoxin genes, antibiotic
resistance and multidrug resistant were detected in meat. Therefore, these findings are alarming
and require the need to prevent the presence of S. aureus strains and SEs production in meat.
Introduction
Toxigenic Staphylococcus aureus contamination in meat is a major problem in public
health due to the production of heat-stable enterotoxins as well as It expresses many array of
virulence factors contribute to the ability of S. aureus to cause infection include various enzymes,
adhesion proteins, cell-surface proteins, factors that help the bacteria to evade the innate
immune defense, and antibiotic resistance mediate survival of the bacteria and tissue invasion at
the site of infection (Zecconi and Scali, 2013).
S. aureus has the ability to grow, and produce staphylococcal enterotoxins (SE), the
causative agent of staphylococcal food poisoning (SFP), over an extensive range of temperature,
pH, sodium chloride concentration and water activity (Adams and Moss, 2008).The bacteria can
be killed through heat treatment of the food, but the enterotoxins are very heat resistant. Thus,
although the bacteria are eliminated, the toxins will remain and can cause SFP (Le et al, 2003).
The consumption of chicken and beef meat was implicated in a large number of outbreaks of
staphylococcal food poisoning in humans in different countries (Argudı´n et al., 2010). However,
the real incidence of SFP is underestimated (Smyth et al., 2004). According to Centers for Disease
Control (CDC) on food-borne diseases is that SEs affect approximately 80 million individuals in
the US, alone, resulting in 325,000 hospitalizations and more than 5,000 deaths (Mead et al,
1999). The genes encoding the different enterotoxins are carried and disseminated by different
mobile genetic elements, i.e., prophages, plasmids, pathogenicity islands (SaPIs), enterotoxin

53
gene cluster (egc) and the staphylococcal cassette chromosome (SCC) (Altboum et al, 1985).
Staphylococcal enterotoxin SE toxins have been identified on the basis of the antigenic type,
which include the classical SEs (SEA, SEB, SEC, SED, SEE), newer SEs (SEG, SEH, SEI, and SEJ), and
more recent ones (SEK, SEL, SEM, SEN, SEO, SEP, SEQ, SER, SEU and SEV). Enterotoxin genes are
not distributed uniformly among different S. aureus strains in different areas. Genetic variation
among enterotoxin genes occurs in these strains (18).
Antibiotic resistance is an important public health issue in many countries because of the
extended use and misuse of antibiotics in different fields such as agriculture, stock-farming and
in the treatment of human disease, therefore, the number of bacteria that are resistant to
antimicrobial agents is rapidly increasing. Isolates from food have shown a considerable increase
in resistance against most antibiotics (Valsangiacomo et al, 2000).
Meat is an important vector for the transfer of antibiotic resistances from animals to
humans where many Isolates from meat have shown a considerable increase in resistance against
most antibiotics (Yu¨cel et al, 2005) and against methicillin (Kitai et al., 2005). S. aureus has been
reported to frequently show multiple antimicrobial resistance patterns (Enright, 2003) and
produce of heat-stable enterotoxins (Zecconi and Scali, 2013). Therefore, the aim of this chapter
is to investigate the presence and characterization of staphylococcal enterotoxin genes by
polymerase chain reaction and test the antibiotic susceptibility of the Staphylococcus aureus
isolates from meat.
Staphylococcus aureus
Staphylococcus aureus are gram-positive of approximately 1 clusters, non-sporeforming,
catalase-positive, oxidase-negative, and non-motile cocci. It is a facultative anaerobe forming

54
yellow colonies on rich medium and causing a hemolysis on blood agar plates (Morandi et al,
2009). Optimum growth of S. aureus occurs when the water activity (aw) is above 0.99 (Huang et
al., 2001); (Portocarrero et al., 2002). It is mesophilic, which generally can grow from 7˚C to
47.8˚C, with 35-37˚C being the optimal temperature for growth (FDA, 2012); (Notermans and
Heuvelman, 1983) and at pH values ranging from 4.2 to 9.3 (Narmanno et al, 2005). S. aureus
belongs to the genus of Staphylococcus which includes more than 30 species. S. aureus can be
differed from other species of Staphylococcus by various biochemical characteristics, such as the
production of coagulase, heat-resistance nuclease (TNase) and hemolysis (Arbuthnott et al.,
1990). It expresses many array of virulence factors contribute to the ability of S. aureus to cause
infection include various enzymes, toxins, adhesion proteins, cell-surface proteins, factors that
help the bacteria to evade the innate immune defense, and antibiotic resistance mediate survival
of the bacteria and tissue invasion at the site of infection (Zecconi and Scali, 2013). Moreover,
certain toxins can cause specific disease entities. The chief function of these enzymes is to turn
host components into nutrients that the bacteria may use for growth.
Figure 2.1. Virulence factors of S. aureus
55
The primary habitat of this microorganism is the mucosa of the nasopharynx and the skin
of humans and animals (da Silva, 2010) Despite its pathogenicity, S. aureus is also harbored in the
nares of about 20 to 30% of healthy people, while about 60% of the population harbors the
microorganism intermittently (Normanno, 2007).
S. aureus has the ability to grow, and produce staphylococcal enterotoxins (SE), the
causative agent of staphylococcal food poisoning (SFP), over an extensive range of temperature,
pH, sodium chloride concentration and water activity (Adams and Moss 2008).The bacteria can
be killed through heat treatment of the food, but the enterotoxins are very heat resistant. Thus,
although the bacteria are eliminated, the toxins will remain and can cause SFP (Le et al,
2003).These toxins are for the most part produced by S. aureus although other species have also
been shown to be enterotoxigenic. It has been reported that the levels of S. aureus usually need
to reach 5 - 6 log CFU/g in food to produce detectable amount of enterotoxin (Castillejo-
Rodriguez et al., 2002); (Fujikawa and Morozumi, 2006). The threshold amount of enterotoxin
for causing illness in humans is not known. However, information from food poisoning outbreaks
(Bergdoll,1990);(Evenson et al,1988) and human challenge studies (Dangerfield,1973) indicates
that individuals experiencing illness probably consumed at least 100 ng of enterotoxin A, the
serotype most frequently involved in foodborne staphylococcal illness (Casman et al,1969).
Staphylococcal food poisoning is an acute intoxication resulting from the ingestion of food
containing the enterotoxin produced by certain strains of S. aureus. It has a short incubation
period that The illness starts suddenly, 2-6 h after eating the contaminated food, with major
symptoms of acute nausea, vomiting and abdominal pain often followed by diarrhea (Gilbert,
1974). The severity of the illness depends on the amount of food ingested, the amount of toxin

56
in the ingested food and the general health of the victim (Smyth et al, 2004).The high incidence
of staphylococcal food poisoning is due to the insufficient pasteurization/decontamination of
originally contaminated product source (Scherrer et al, 2004) or its contamination during
preparation and handling by individuals who are carriers of the organism. Also, since S. aureus
grows over a wide range of temperatures and pH, the bacteria may grow in a wide assortment of
foods.
Staphylococcal enterotoxins
Exotoxins produced by staphylococcus include staphylococcal enterotoxins (SEs), toxic
shock syndrome toxin 1 (TSST-1), exfoliative toxins (ETs), and an alpha-toxin. Staphylococcal
enterotoxins are short, water-soluble, single-chain proteins with molecular weights of 26,000 to
29,000. They are very stable and are resistant to heat and proteolytic enzymes, such as trypsin
and pepsin, which allows them to transit intact through the digestive tract (Bennett, 2001). They
are pyrogenic and share some other important properties that include the ability to induce
emesis and gastroenteritis as well as their noted super antigenicity. The different SE serotypes
are similar in composition and biological activity but are different in antigenicity and identified
serologically as separate proteins (Bennett, 2001).
According to Centers for Disease Control (CDC) on food-borne diseases is that SEs affect
approximately 80 million individuals in the US, alone, resulting in 325,000 hospitalizations and
more than 5,000 deaths (Mead et al, 1999). At least 20 serologically distinct staphylococcal super
antigens have been described that include SEs (A through V) and toxic shock syndrome toxin-1
(TSST-1). SEA, SED, and SEE share 70–90% sequence homology, while only 40–60% with SEB, SEC,
and TSST-1 (Al-Daccak et al, 1998) (Balaban et al, 2000). Toxin formation is not likely at
57
temperatures lower than 10˚C or at water activities below 0.85 (FDA, 2011). Therefore, exposure
of food products contaminated with S. aureus to temperatures between 10°C and 21.1°C for
more than 12 hours or above 21.1°C for more than 3 hours could result in enterotoxin formation
in the products (FDA, 2011). The genes encoding the different enterotoxins are carried and
disseminated by different mobile genetic elements, i.e., prophages, plasmids, pathogenicity
islands (SaPIs), enterotoxin gene cluster (egc) and the staphylococcal cassette chromosome (SCC)
(Altboum et al, 1985).
Staphylococcal enterotoxin (SE toxins) have been identified on the basis of the antigenic
type, which include the classical SEs (SEA, SEB, SEC, SED, SEE ), newer SEs (SEG, SEH, SEI, and SEJ),
and more recent ones (SEK, SEL, SEM, SEN, SEO, SEP, SEQ, SER, SEU and SEV) (Thomas et al., 2006,
2007); (Ono et al., 2008), have been designated members of the SE family on the basis of their
sequence similarity to classical SEs (Jarraud et al , 2001). In addition, some of strains of S. aureus
produce one or both of two immunologically distinct ETs, A (ETA) or B (ETB). These toxins are
associated with impetiginous staphylococcal scalded skin syndrome and exhibit unique super
antigenic activity (Monday et al, 1999).
Staphylococcal enterotoxin (SEA) is one of the most important gastroenteritis causing
agents. In some areas, more than 50% of food poisoning (FP) is caused by staphylococcal
enterotoxin A (SEA) (Di Giannatale et al, 2001). SEA is responsible for approximately 80% of the
cases of food poisoning outbreaks in the USA. SEB, while it is associated with food poisoning, has
been studied for potential use as an inhaled bioweapon (Ler et al, 2006). Because it can easily
be aerosolized; it is very stable; and it can cause widespread systemic damage, multi organ
system failure, and even shock and death when inhaled at very high dosages. SEB is responsible

58
for 10% of the cases (Atanassova et al, 2001). SED is the second most common staphylococcal
toxin associated with food poisoning worldwide, and only very small amounts of this toxin were
needed to induce food poisoning (Bergdoll et al, 1981). SEF staphylococcal toxin was discovered
in 1980. This toxin was renamed TSST-1 because of a lack of evidence of emetic activity in
monkeys (Su et al, 1997).TSST-1 causes toxic shock syndrome. TSST-1 is exhibited super antigenic
activity
Antibiotic resistance of staphylococcus aureus
Antibiotic resistance is a significant problem and a major public health concern because
of its effect on the rapid spread of threatening diseases and infections and the inability to control
them, whereas bacteria evolves and forms ways of counteracting the antibiotics, the antibiotics
become ineffective and harmful and fatal bacteria is able to thrive in multiple environments.
There has been amerced increase in the number of species that have acquired resistance to
antibiotics, as well as an increase in the kinds of antibiotics (Alalem, 2008). S. aureus is perhaps
the pathogen of greatest concern because of its intrinsic virulence, its ability to cause a diverse
array of life-threatening infections, and its capacity to adapt to different environmental
conditions (Lowy, 1998) ;( Waldvogel, 2000). The mortality of S. aureus bacteremia remains
approximately 20–40% despite the availability of effective antimicrobials (Mylotte, 1987). S.
aureus is now the leading overall cause of nosocomial infections and, as more patients are
treated outside the hospital setting, is an increasing concern in the community (CDC NNIS System,
2001); (Diekema et al, 1999).
Before the advent of antibiotics, invasive S. aureus disease was a significant cause of
mortality; however penicillin was used to treat S. aureus infections initially. shortly afterwards,

59
resistance emerged when strains acquired a genetic element coding for β-lactamase production,
and now more than 80 % of all S. aureus strains are resistant to penicillin. Staphylococcal
resistance to penicillin is mediated by blaZ, the gene that encodes β-lactamase. This
predominantly extracellular enzyme, synthesized when staphylococci are exposed to β-lactam
antibiotics, hydrolyzes the β-lactam ring, rendering the β-lactam inactive. BlaZ is under the
control of two adjacent regulatory genes, the antirepressor blaR1 and the
repressor blaI (Kernodle, 2000).The posterior drug to be introduced for treating infections with
S. aureus was the semisynthetic, penicillinase-resistant penicillin named oxacillin or methicillin,
but shortly after its introduction the first isolate with resistance was detected (Winn Washington,
2006). Methicillin resistance requires the presence of the chromosomally localized mec A gene
(Kernodle, 2000); (Chambers, 1997). Mec A is responsible for synthesis of penicillin-binding
protein 2a (PBP2a) (Hartman and Tomasz, 1984); (Song et al, 1987). PBPs are membrane-bound
enzymes that catalyze the transpeptidation reaction that is necessary for cross-linkage of
peptidoglycan chains (Ghuysen, 1994). PBP2a substitutes for the other PBPs and because of its
low affinity for all β-lactam antibiotics, enables staphylococci to survive exposure to high
concentrations of these agents. Thus, resistance to methicillin confers resistance to all β-lactam
agents, including cephalosporin.
With the emergence of resistance to the penicillinase-resistant penicillin, the
glucopeptide agent vancomycin became the treatment of choice for infections with MRSA, and
in 1996 the first isolate with intermediate vancomycin resistance was detected in Japan (Winn
Washington, 2006). So far, this has not emerged to be a major concern, but the resistance has
been detected in different parts of the world and needs to be monitored. MRSA is now a leading

60
cause of nosocomial infections worldwide and has emerged as a community-associated pathogen
(Chambers and Deleo, 2009). MRSA strains are inherently cross-resistant to virtually all beta-
lactam antibiotics, the most effective and widely used class of antimicrobials.
Bacteria interactions with antibiotics are depend on the structure of the cell itself.
Staphylococcus aureus contains a thick cell wall made up of peptidoglycan and in this case are 50
percent by weight. The peptidoglycan is made up of both N-acetyl glucosamine and N-
acetylmuramic acid, which are linked with tetrapeptide chains. The cell wall of S. aureus was
found to contain peptidoglycan along with teichoic acids and proteins (Umeda et al, 1987).
Teichoic acids are bound to the peptidoglycan through phosphodiester bonds. The acids then
extend out where proteins are bound and form the outer most layer of the cell. Antibiotics work
by binding to the proteins and inhibiting cell wall formation by inhibiting the cell enzyme. In this
case, Staphylococcus aureus contains β-lactamase enzyme and β-lactam antibiotics such as
penicillin (e.g. penicillin G, ampicillin and methicillin), cephalosporin and carbapenems, as well as
monolactams and β-lactamase inhibitors are able to bind to this enzyme. Some antibiotic have
an antibacterial effect by inhibiting protein synthesis. Representatives of this group include the
aminoglycosides, tetracycline, macrolides and chloramphenicol which interfere with ribosome
function. Also, there are antibiotics that inhibit DNA synthesis, including quinolones,
fluoroquinolones and sulfonamides. The cell itself contains prophages, plasmids,
and transposons all within a 2800 bp circular chromosome (Lowy and Franklin, 1998). This is
where mechanisms of antibiotic resistance are found and transferred between cells through
horizontal gene transfer.
Resistance Mechanisms

61
Mechanisms of antimicrobial resistance can be divided into four general categories
(Quale et al, 2003) (Figure s, 2.2. and 2.3.):
1. Enzymes that destroy or modify the antimicrobial substrate
2. Target site alteration like alteration of DNA gyrase, a target of fluoroquinolones.
3. Bypass pathways that substitute for a metabolic pathway.
4. Barrier to penetration or efflux pumps that exclude the agent.
Figure 2.2.Mechanisms of antimicrobial resistance

62
Figure 2.3. Biochemical Mechanisms of antimicrobial resistance
Materials and methods
Meat Sample Collection
Samples of raw meat (beef, lamb and chicken) were collected from different places in
Michigan. The collected samples were immediately transported in insulated ice containers to the
laboratory for microbial analysis.
Isolation and identification of S. aureus
Meat samples were added to 10 ml of buffered peptone water (BPW) in sterile plastic
bags. 10 mL was then transferred from the bag and added to 10 mL of enrichment broth of
Trypticase Soy Broth (Merck, Darmstadt, Germany) with 10% sodium chloride and 1% sodium
pyruvate, then incubated at 37 °C for 24 h. The enrichment broth was streaked onto Baird-Parker
agar plates (Merck, Darmstadt, Germany) containing an egg-yolk tellurite emulsion (Merck,
Darmstadt, Germany), then incubated at 37°C for 24 to 48 h (Pu et al., 2009). Colonies exhibiting
characteristic morphology of S. aureus (black colonies surrounded by 2 to 5 mm clear zones) were

63
randomly selected and subjected to gram stain, tests for catalase reaction, coagulase enzymes,
DNase activity and finally genotypic confirmation through PCR detection of S. aureus 16s rRNA
(Staphylococcus genus-specific, 228 bp) (Lovseth et al, 2004) and nuc (S. aureus species-specific,
279 bp) genes (Brakstad et al., 1992). All isolates were stored at - 80C in TSB plus 20% (v/v)
glycerol for further use. Working cultures were prepared by streaking directly from the cryo vials
onto Try tone Soy Broth (TSB) and incubating at 37.
DNA extraction
Extraction of DNA was done using Qiagen DNeasy blood &tissue kit. Extraction was
completed according to manufacture protocol.
Identification of S. aureus by PCR (Nuc gene test)
Following the DNA extraction, presumptive S. aureus isolates were identified to the
species level by polymerase chain reaction (PCR) detection of thermonuclease gene (nuc, S.
aureus specific) ( Sharma et al. (2000). Each polymerase chain reaction (PCR) contained 5μL PCR
Buffer 10x ,4μL MgCl2 50 mM, 1 μM dNTP mix 10 mM , 1 U Taq DNA Polymerase ,10 pmol of
each primer, and 1μL DNA. The final volume was adjusted to 16μL by adding 3.5μL sterile ultra-
pure water. The mixes were submitted to a program performed on a thermo cycler with an initial
denaturation step at 94°C for 4 min, 35 amplification cycles each with 20 seconds at 94°C; 30
seconds at 62°C; 20 seconds at 72°C followed by an additional extension step of 5 minutes at
72°C. Positive and negative controls were included in each PCR run. Then all isolated strains
were identified by PCR were visualized after electrophoresis on 2% agarose gel and the product
size was estimated using a DNA ladder.
Detection of enterotoxin genes

64
The primers used to detect enterotoxin genes and 16s rRNA were described by (Johnson
et al. 1991) and (Monday and Bohach, 1999) and are listed in table (2.2). The PCR reaction
mixture contained 20 ng of template DNA, 1 U of Taq DNA polymerase, 250 µM of each dNTP, 10
mM Tris-HCl (pH 9.0), 40 mM KCl, and 1.5 mM MgCl2. The mixes were submitted to a program
performed on a thermo cycler with an initial denaturation step at 95°C for 5 min, 30 amplification
cycles each with 1 min. at 95°C; 1 min. at 53°C; 2 min. at 72°C followed by an additional extension
step of 5 min. at 72°C. Then all isolated strains were identified by PCR were visualized after
electrophoresis on 2% agarose gel and the product size was estimated using DNA molecular
weight ladder.
Detection of MEC A gene
The primer used to detect the mec A gene was described by (Vannuffel et al, 1995) and is
listed in (table2.2). PCR amplification was performed on a thermo cycler with an initial
denaturation step at 94°C for 5 min, 30 amplification cycles each with 30 sec. at 94°C; 30 sec. at
60°C; 30 sec. at 72°C followed by an additional extension step of 5 min. at 72°C. PCR products
were visualized after electrophoresis on 2% agarose gel and the product size was estimated using
DNA molecular weight ladder.
Antimicrobial susceptibility testing
Antimicrobial susceptibility tests for S. aureus were performed using agar dilution method
described in the guidelines of the Clinical and Laboratory Standards Institute (CLSI, 2007).
Suspensions in sterile Ringer’s solution equivalent to 0.5 McFarland Standard were prepared
from an overnight culture on TSA plates (sigma), then cultured on Muller Hinton Agar (MHA)
(sigma) and incubated at 35 °C for 18–24h. The isolates were tested with a panel of fourteen

65
antimicrobials: penicillin, ampicillin, vancomycin, nitrofurantoin, erythromycin, chloramphenicol
(Sigma) and oxacillin, rifampicin, gentamicin, tetracycline, amikacin, clindamycin, amoxicillin, and
ciprofloxacin. The MIC was determined in Muller Hinton agar (MHA) (sigma) plus 2% w/v of NaCl
in the case of oxacillin, in cation-adjusted MH for penicillin and ampicillin and in MH to test the
other antibiotics investigated. Inhibition zones were measured and interpreted as recommended
by the guidelines of the Clinical and Laboratory Standards Institute (CLSI 2010). S. aureus ATCC
29213 was plated as a control. For each antibiotic susceptibility determination, at least two
independent experiments were performed.
Statistical analysis
A chi-square test (IBM SPSS Statistics 23) was used to compare the prevalence of each gene
among S. aureus isolates between different types of meat
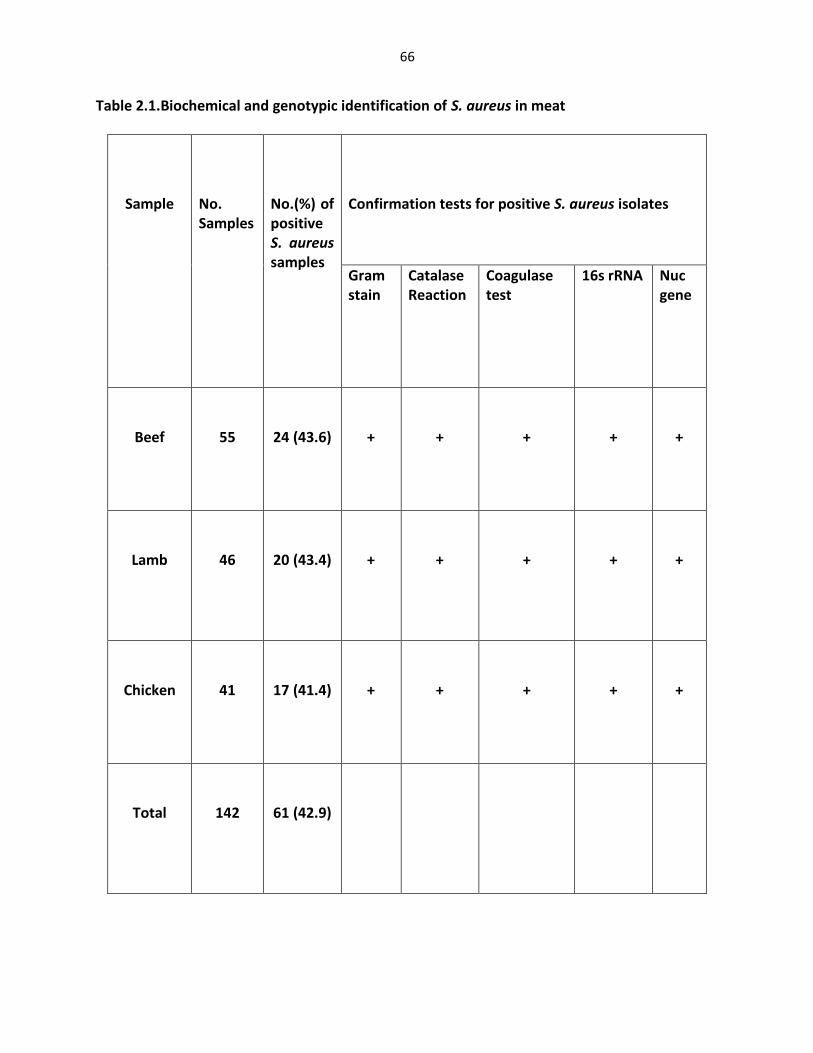
66
Table 2.1.Biochemical and genotypic identification of S. aureus in meat
Sample
No. Samples
No.(%) of positive S. aureus samples
Confirmation tests for positive S. aureus isolates
Gram stain
Catalase Reaction
Coagulase test
16s rRNA Nuc gene
Beef
55
24 (43.6)
+
+
+
+
+
Lamb
46
20 (43.4)
+
+
+
+
+
Chicken
41
17 (41.4)
+
+
+
+
+
Total
142
61 (42.9)
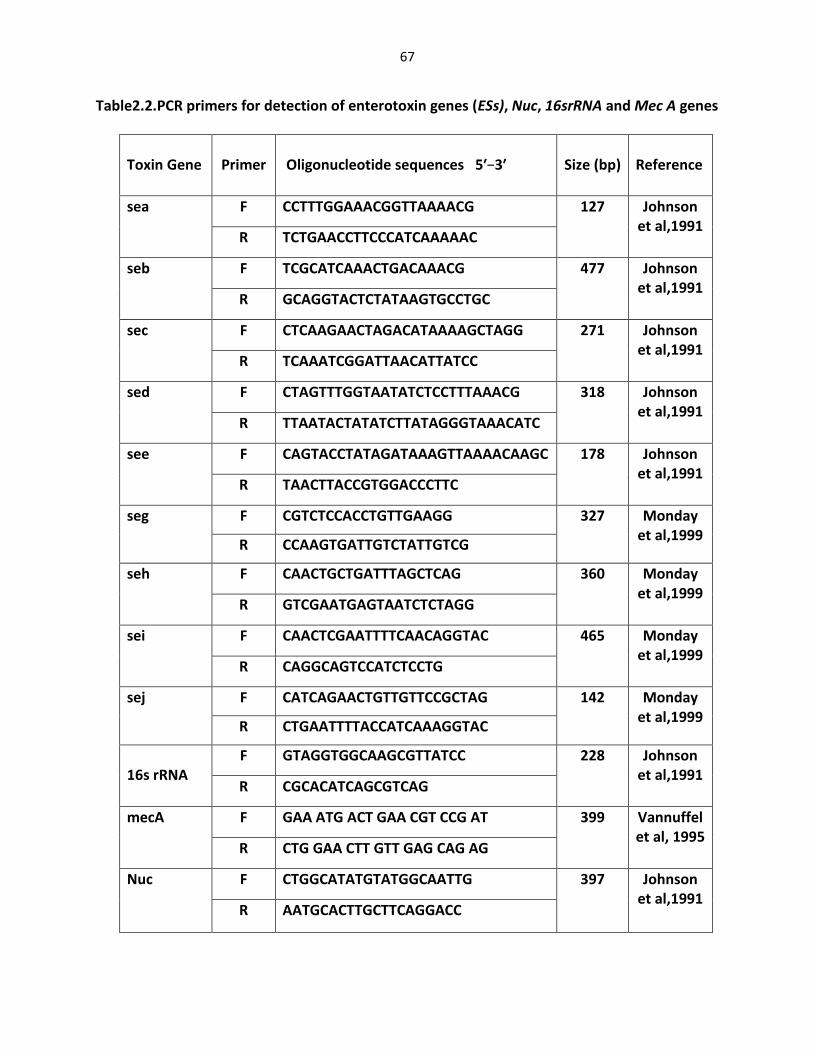
67
Table2.2.PCR primers for detection of enterotoxin genes (ESs), Nuc, 16srRNA and Mec A genes
Toxin Gene
Primer
Oligonucleotide sequences 5′−3′
Size (bp)
Reference
sea F CCTTTGGAAACGGTTAAAACG 127 Johnson et al,1991
R TCTGAACCTTCCCATCAAAAAC
seb F TCGCATCAAACTGACAAACG 477 Johnson et al,1991
R GCAGGTACTCTATAAGTGCCTGC
sec F CTCAAGAACTAGACATAAAAGCTAGG 271 Johnson et al,1991
R TCAAATCGGATTAACATTATCC
sed F CTAGTTTGGTAATATCTCCTTTAAACG 318 Johnson et al,1991
R TTAATACTATATCTTATAGGGTAAACATC
see F CAGTACCTATAGATAAAGTTAAAACAAGC 178 Johnson et al,1991
R TAACTTACCGTGGACCCTTC
seg F CGTCTCCACCTGTTGAAGG 327 Monday et al,1999
R CCAAGTGATTGTCTATTGTCG
seh F CAACTGCTGATTTAGCTCAG 360 Monday et al,1999
R GTCGAATGAGTAATCTCTAGG
sei F CAACTCGAATTTTCAACAGGTAC 465 Monday et al,1999
R CAGGCAGTCCATCTCCTG
sej F CATCAGAACTGTTGTTCCGCTAG 142 Monday et al,1999
R CTGAATTTTACCATCAAAGGTAC
16s rRNA
F GTAGGTGGCAAGCGTTATCC 228 Johnson et al,1991
R CGCACATCAGCGTCAG
mecA F GAA ATG ACT GAA CGT CCG AT 399 Vannuffel et al, 1995
R CTG GAA CTT GTT GAG CAG AG
Nuc F CTGGCATATGTATGGCAATTG 397 Johnson et al,1991
R AATGCACTTGCTTCAGGACC
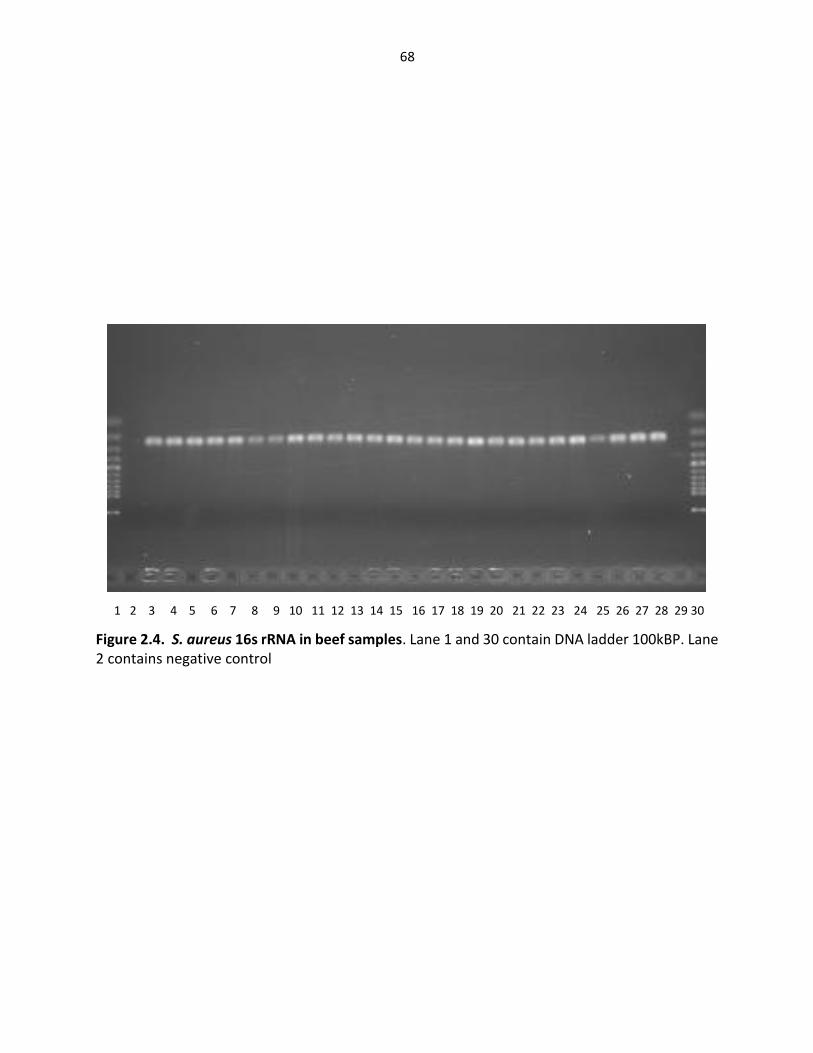
68
1 2 3 4 5 6 7 8 9 10 11 12 13 14 15 16 17 18 19 20 21 22 23 24 25 26 27 28 29 30
Figure 2.4. S. aureus 16s rRNA in beef samples. Lane 1 and 30 contain DNA ladder 100kBP. Lane 2 contains negative control

69
1 2 3 4 5 6 7 8 9 10 11 12 13 14 15 16 17 18 19 20 21 22 23 24 25 26 27 28 29 30
Figure 2.5. S. aureus16s rRNA in chicken samples. Lane 1 and 30 contain DNA 100kBP ladder. Lane 2 contains negative control. Lane 29 contains NUC gene as positive (+) control.
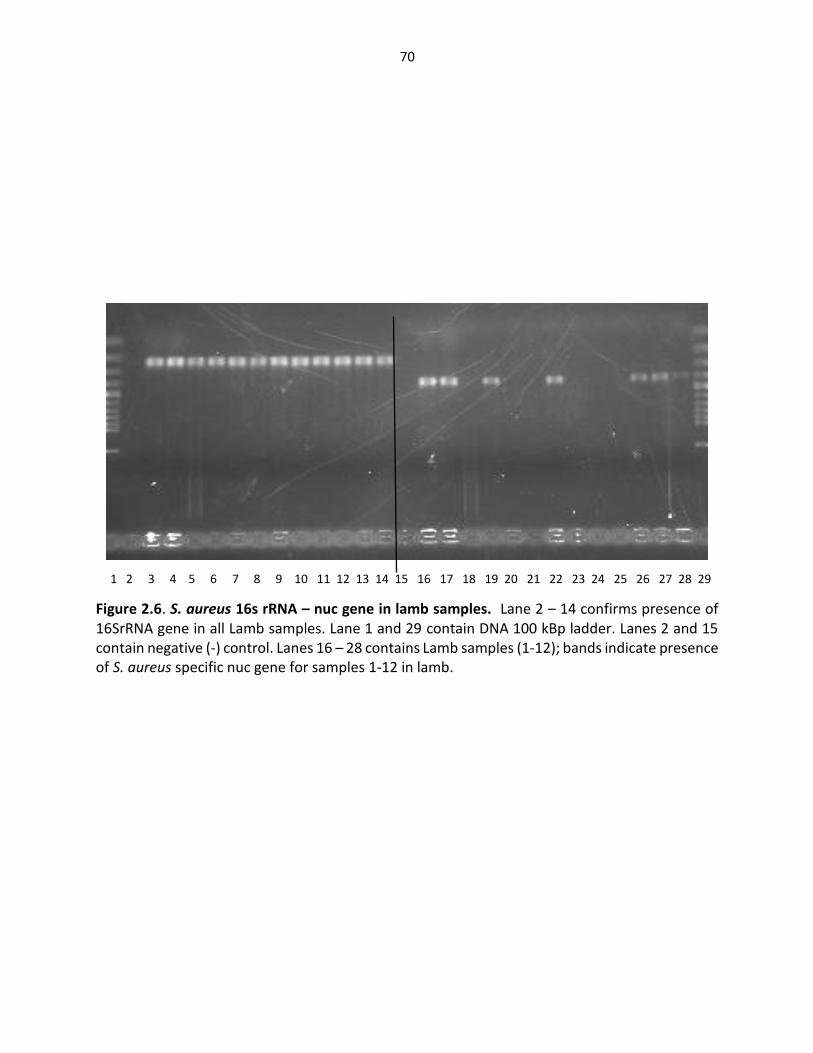
70
1 2 3 4 5 6 7 8 9 10 11 12 13 14 15 16 17 18 19 20 21 22 23 24 25 26 27 28 29
Figure 2.6. S. aureus 16s rRNA – nuc gene in lamb samples. Lane 2 – 14 confirms presence of 16SrRNA gene in all Lamb samples. Lane 1 and 29 contain DNA 100 kBp ladder. Lanes 2 and 15 contain negative (-) control. Lanes 16 – 28 contains Lamb samples (1-12); bands indicate presence of S. aureus specific nuc gene for samples 1-12 in lamb.
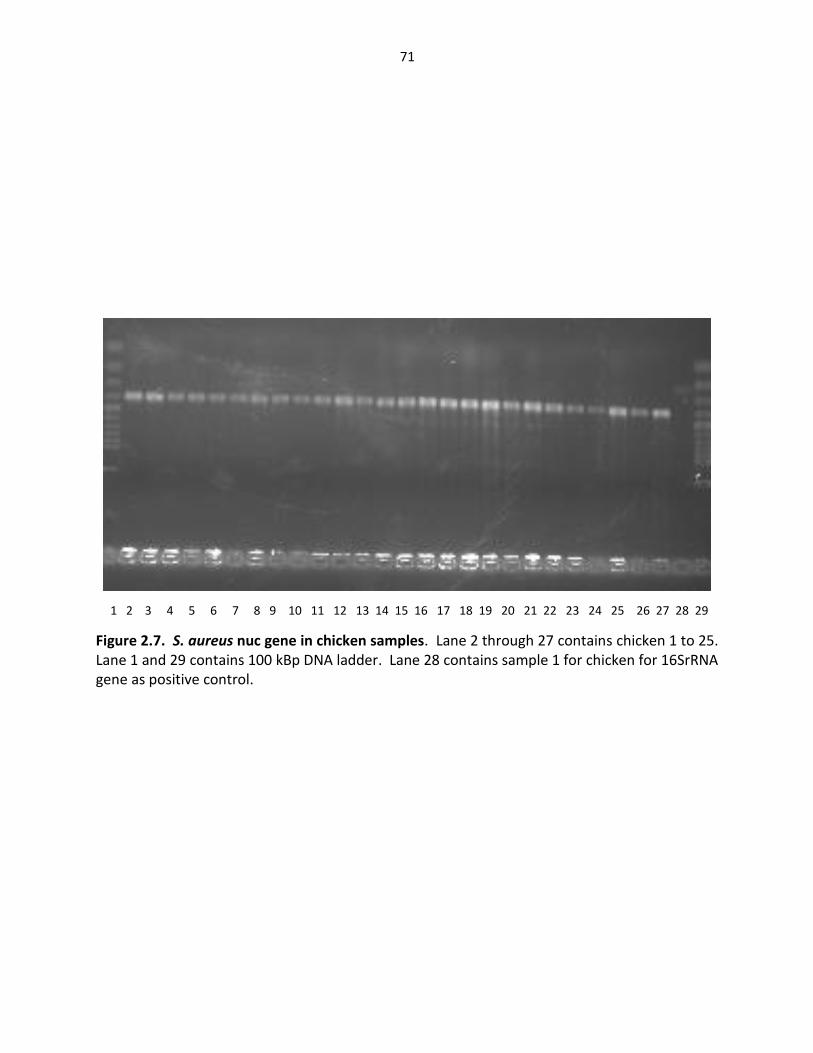
71
1 2 3 4 5 6 7 8 9 10 11 12 13 14 15 16 17 18 19 20 21 22 23 24 25 26 27 28 29
Figure 2.7. S. aureus nuc gene in chicken samples. Lane 2 through 27 contains chicken 1 to 25. Lane 1 and 29 contains 100 kBp DNA ladder. Lane 28 contains sample 1 for chicken for 16SrRNA gene as positive control.
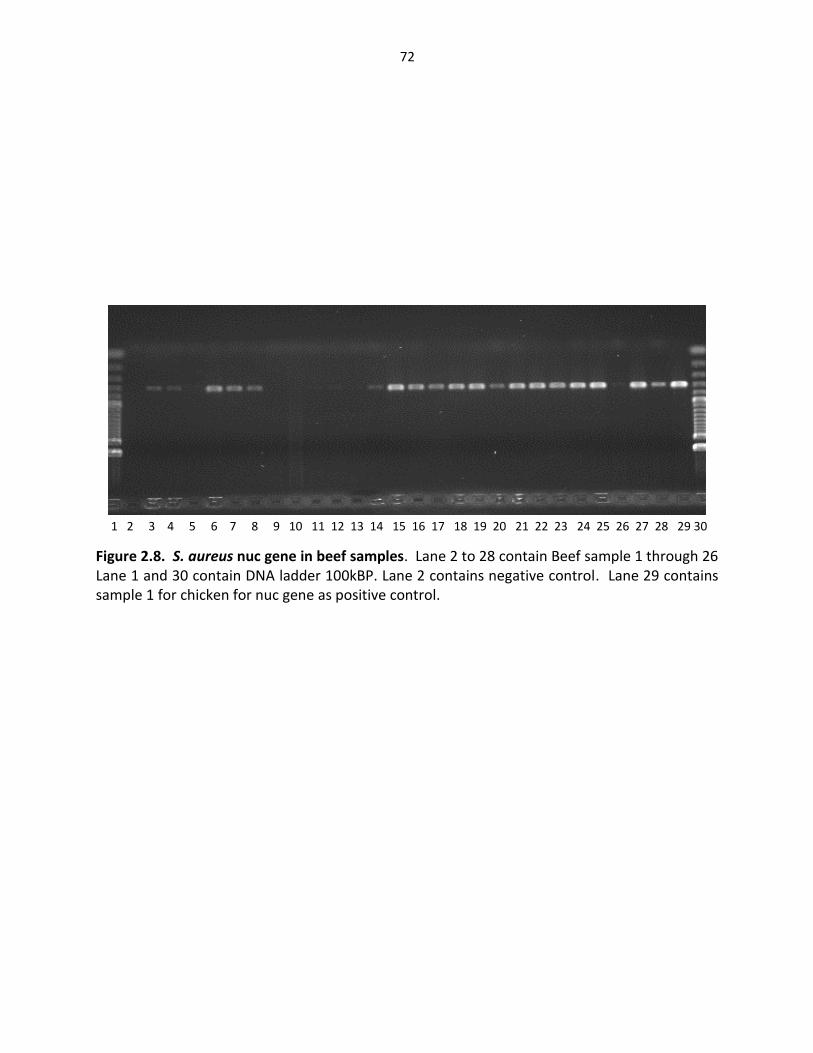
72
1 2 3 4 5 6 7 8 9 10 11 12 13 14 15 16 17 18 19 20 21 22 23 24 25 26 27 28 29 30
Figure 2.8. S. aureus nuc gene in beef samples. Lane 2 to 28 contain Beef sample 1 through 26 Lane 1 and 30 contain DNA ladder 100kBP. Lane 2 contains negative control. Lane 29 contains sample 1 for chicken for nuc gene as positive control.

73
1 2 3 4 5 6 7 8 9 10 11 12 13 14 15 16 17 18 19 20 21 22 23 24 25 26 27 28 29 30
Figure 2.9. S. aureus MecA gene in chicken sample 1 to 25. Lanes 3 through 27 contains chicken samples. Lane 1 and 29 contains 100 kBp DNA ladder. Lane 2 contains negative control and land 28 contains positive control with sample no.1 of chicken for 16SrRNA gene. * Bands indicate presence of MecA gene in each sample
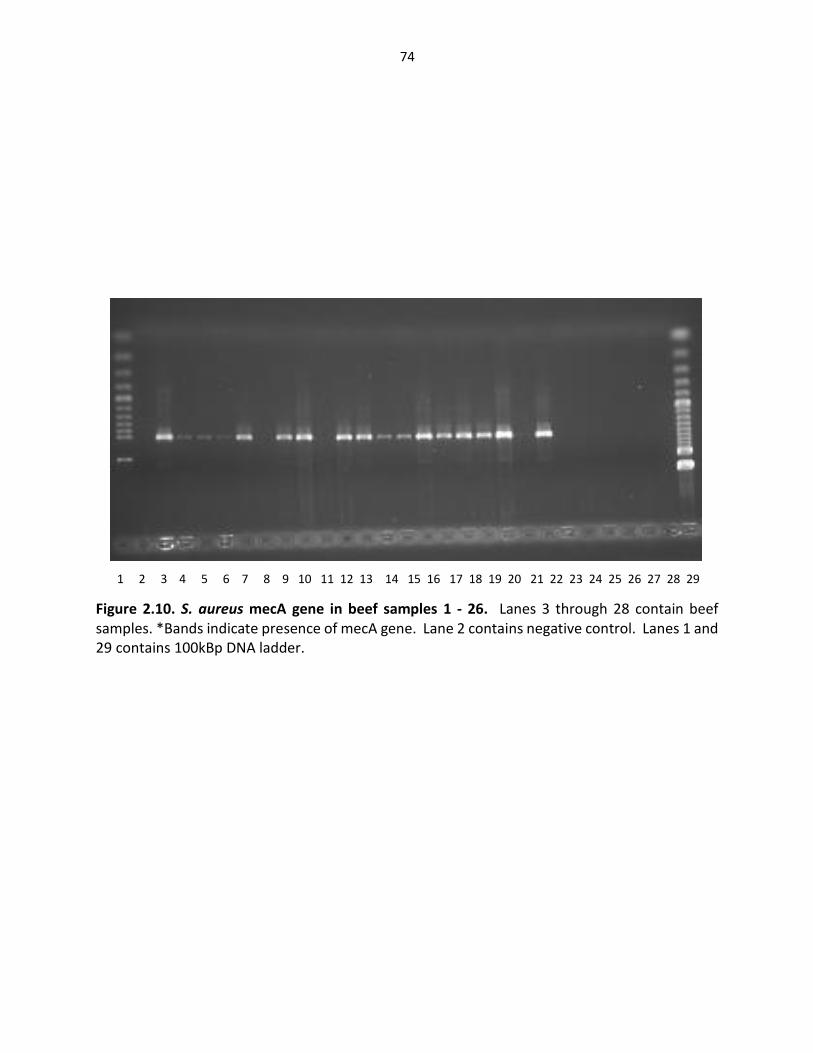
74
1 2 3 4 5 6 7 8 9 10 11 12 13 14 15 16 17 18 19 20 21 22 23 24 25 26 27 28 29
Figure 2.10. S. aureus mecA gene in beef samples 1 - 26. Lanes 3 through 28 contain beef samples. *Bands indicate presence of mecA gene. Lane 2 contains negative control. Lanes 1 and 29 contains 100kBp DNA ladder.
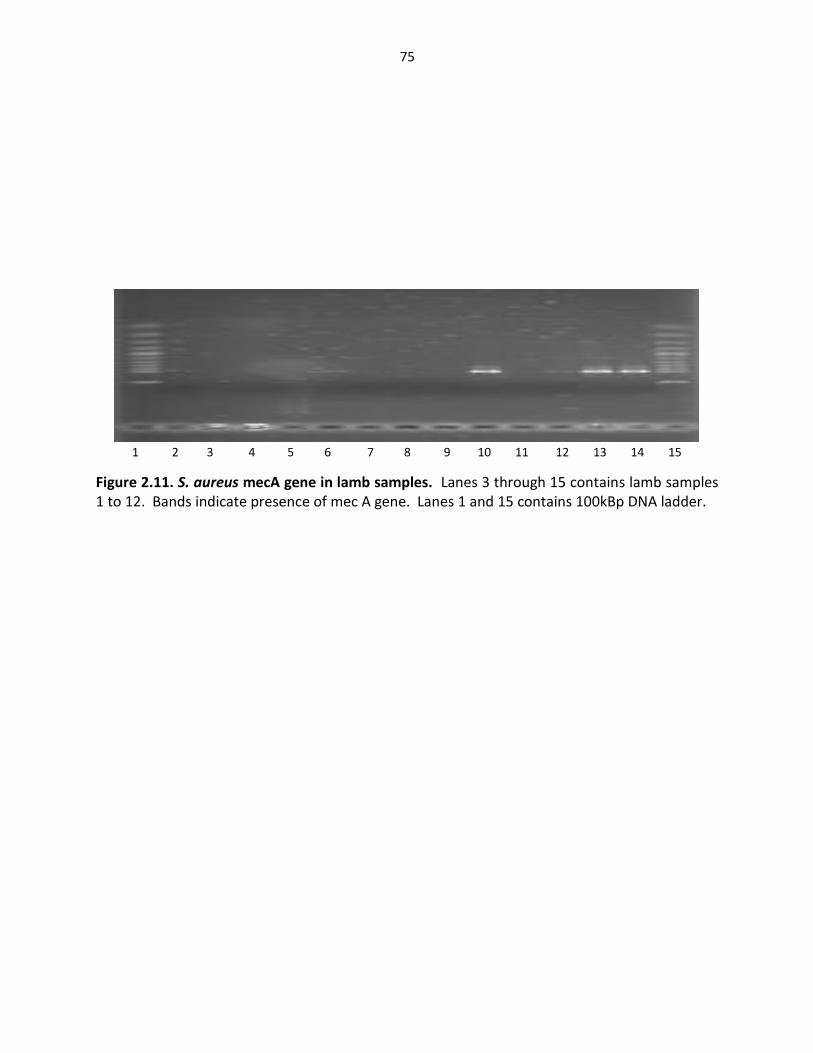
75
1 2 3 4 5 6 7 8 9 10 11 12 13 14 15
Figure 2.11. S. aureus mecA gene in lamb samples. Lanes 3 through 15 contains lamb samples 1 to 12. Bands indicate presence of mec A gene. Lanes 1 and 15 contains 100kBp DNA ladder.
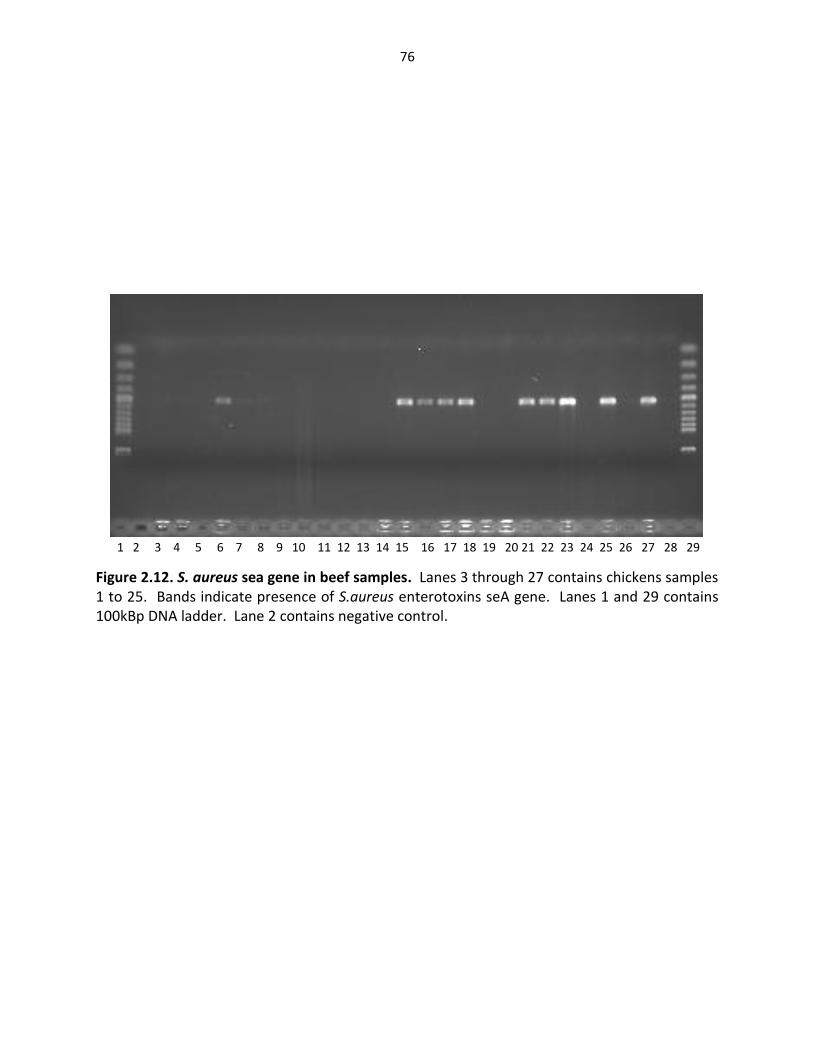
76
1 2 3 4 5 6 7 8 9 10 11 12 13 14 15 16 17 18 19 20 21 22 23 24 25 26 27 28 29
Figure 2.12. S. aureus sea gene in beef samples. Lanes 3 through 27 contains chickens samples 1 to 25. Bands indicate presence of S.aureus enterotoxins seA gene. Lanes 1 and 29 contains 100kBp DNA ladder. Lane 2 contains negative control.
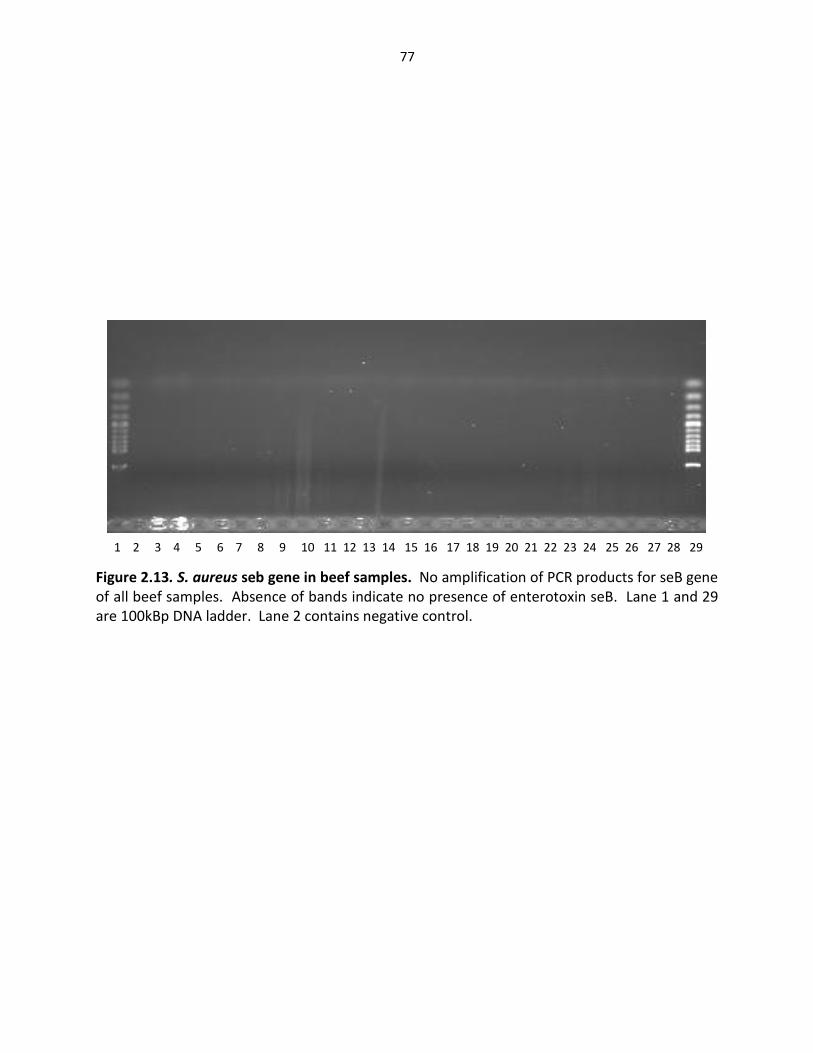
77
1 2 3 4 5 6 7 8 9 10 11 12 13 14 15 16 17 18 19 20 21 22 23 24 25 26 27 28 29
Figure 2.13. S. aureus seb gene in beef samples. No amplification of PCR products for seB gene of all beef samples. Absence of bands indicate no presence of enterotoxin seB. Lane 1 and 29 are 100kBp DNA ladder. Lane 2 contains negative control.

78
1 2 3 4 5 6 7 8 9 10 11 12 13 14 15 16 17 18 19 20 21 22 23 24 25 26 27 28 29
Figure 2.14. S. aureus sec gene in beef samples. No amplification of PCR products for seC gene of all beef samples. Absence of bands indicate no presence of enterotoxin seC. Lane 1 and 29 are 100kBp DNA ladder. Lane 2 contains negative control.

79
1 2 3 4 5 6 7 8 9 10 11 12 13 14 15 16 17 18 19 20 21 22 23 24 25 26 27 28 29
Figure 2.15. S. aureus sed gene in beef samples. No amplification of PCR products for seD gene of all beef samples. Absence of bands indicate no presence of enterotoxin seD. Lane 1 and 29 are 100kBp DNA ladder. Lane 2 contains negative control.

80
1 2 3 4 5 6 7 8 9 10 11 12 13 14 15 16 17 18 19 20 21 22 23 24 25 26 27 28 29 30
Figure 2.16. S. aureus see gene in beef samples. Lane 1 and 30 contains 100kBp DNA ladder. Lane 29 contains beef sample 1 for 16srRNA gene as positive control and lane 2 contians negative control. Absence of bands indicate no presence of enterotoxin seE.
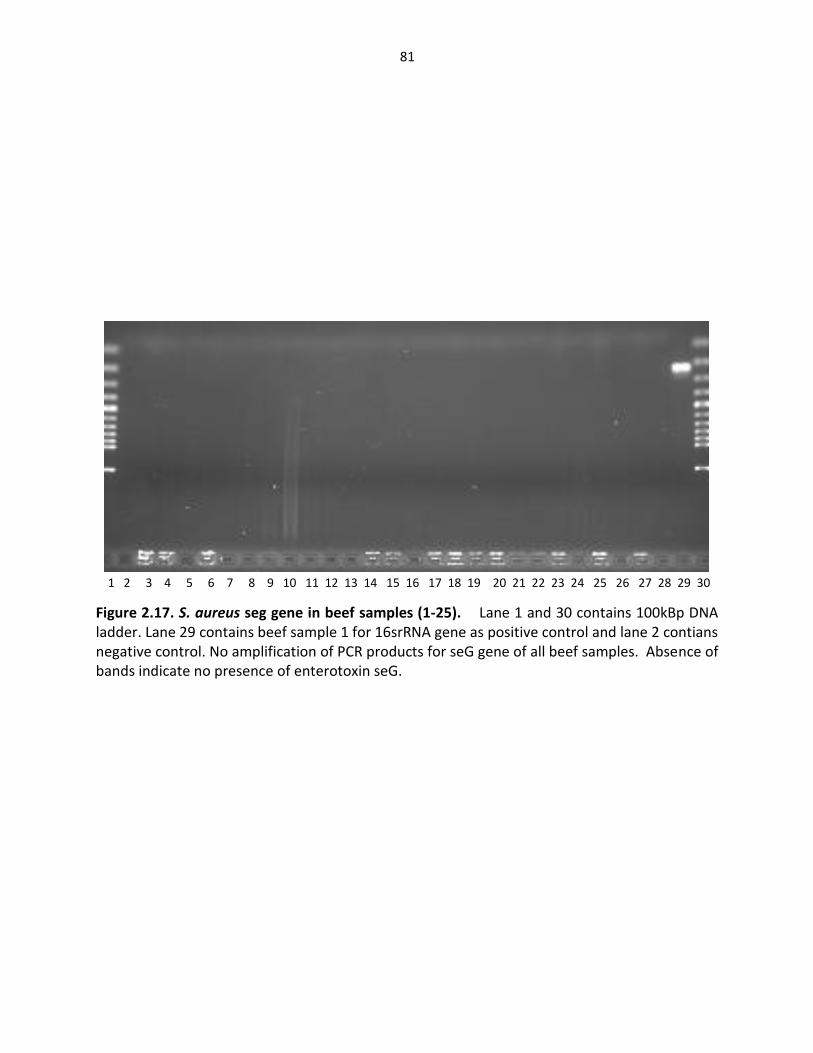
81
1 2 3 4 5 6 7 8 9 10 11 12 13 14 15 16 17 18 19 20 21 22 23 24 25 26 27 28 29 30
Figure 2.17. S. aureus seg gene in beef samples (1-25). Lane 1 and 30 contains 100kBp DNA ladder. Lane 29 contains beef sample 1 for 16srRNA gene as positive control and lane 2 contians negative control. No amplification of PCR products for seG gene of all beef samples. Absence of bands indicate no presence of enterotoxin seG.

82
1 2 3 4 5 6 7 8 9 10 11 12 13 14 15 16 17 18 19 20 21 22 23 24 25 26 27 28 29 30
Figure 2.18. S. aureus seh gene in beef samples. Lane 3 through 28 contain amplified PCR products for beef samples 1 to 26. Band indicates presense of seH gene. Lane 2 contains negative control and lane 29 contains amplified beef sample 1 for 16SrRNA gene as positive control. Lande 1 and 30 contain 100kBp DNA ladder.
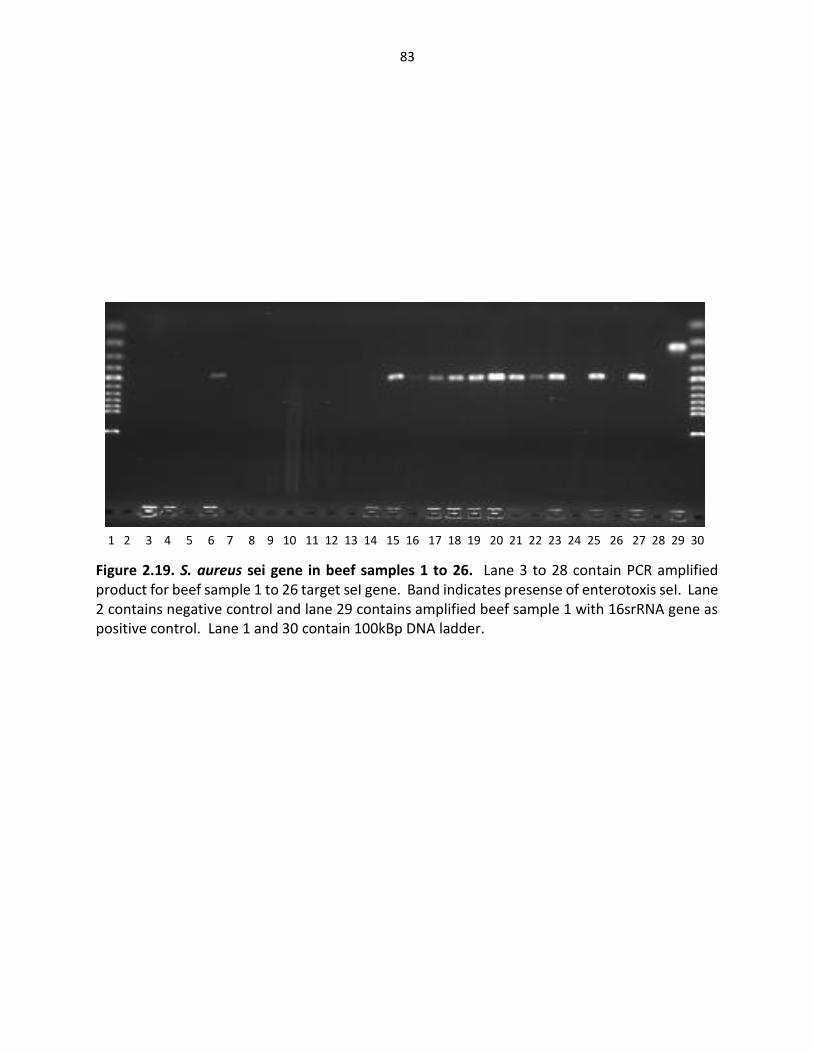
83
1 2 3 4 5 6 7 8 9 10 11 12 13 14 15 16 17 18 19 20 21 22 23 24 25 26 27 28 29 30
Figure 2.19. S. aureus sei gene in beef samples 1 to 26. Lane 3 to 28 contain PCR amplified product for beef sample 1 to 26 target seI gene. Band indicates presense of enterotoxis seI. Lane 2 contains negative control and lane 29 contains amplified beef sample 1 with 16srRNA gene as positive control. Lane 1 and 30 contain 100kBp DNA ladder.
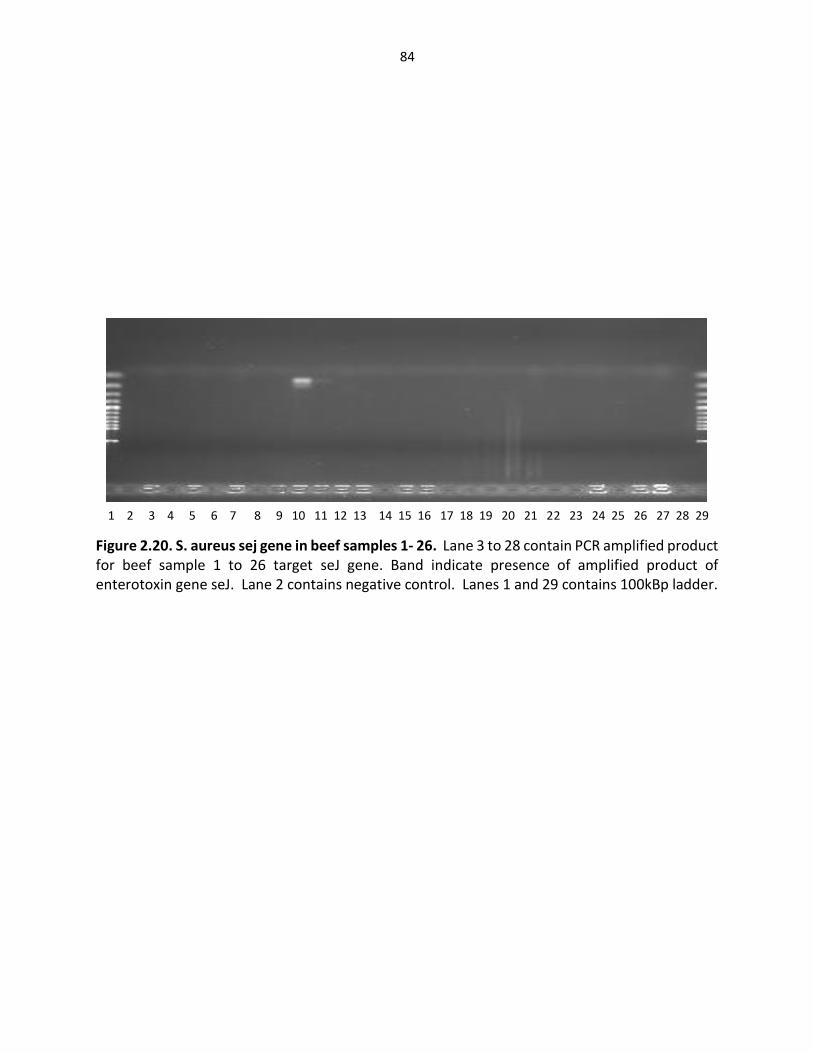
84
1 2 3 4 5 6 7 8 9 10 11 12 13 14 15 16 17 18 19 20 21 22 23 24 25 26 27 28 29
Figure 2.20. S. aureus sej gene in beef samples 1- 26. Lane 3 to 28 contain PCR amplified product for beef sample 1 to 26 target seJ gene. Band indicate presence of amplified product of enterotoxin gene seJ. Lane 2 contains negative control. Lanes 1 and 29 contains 100kBp ladder.

85
1 2 3 4 5 6 7 8 9 10 11 12 13 14 15
Figure 2.21. S. aureus sea gene in lamb samples. Lane 3 through 14 contains PCR amplified product of lamb samples 1 – 12 for target seA gene. Band indicates the presence of enterotoxin gene seA. Lane 1 and 29 contain 100kBp DNA ladder. Lane 2 contains negative control.

86
1 2 3 4 5 6 7 8 9 10 11 12 13 14 15 16 17 18 19 20 21 22 23 24 25 26 27 28 29
Figure 2.22. S. aureus seb gene 1-12 (left), sec gene (right) 1-12 in lamb samples. Lanes 2 through 14 contains PCR amplified products for lamb samples 1 to 12 target gene seB. Lanes 16 through 27 contain PCR amplified products for lamb samples 1 to 12 target gene seC. No band indicates absence of enterotoxin gene seB. Lanes 1 and 28 contain 100kBp DNA ladder. Lane 2 contains negative control and lane 29 contain PCR amiplified product of lamb sample 1 for nuc gene as positive control.
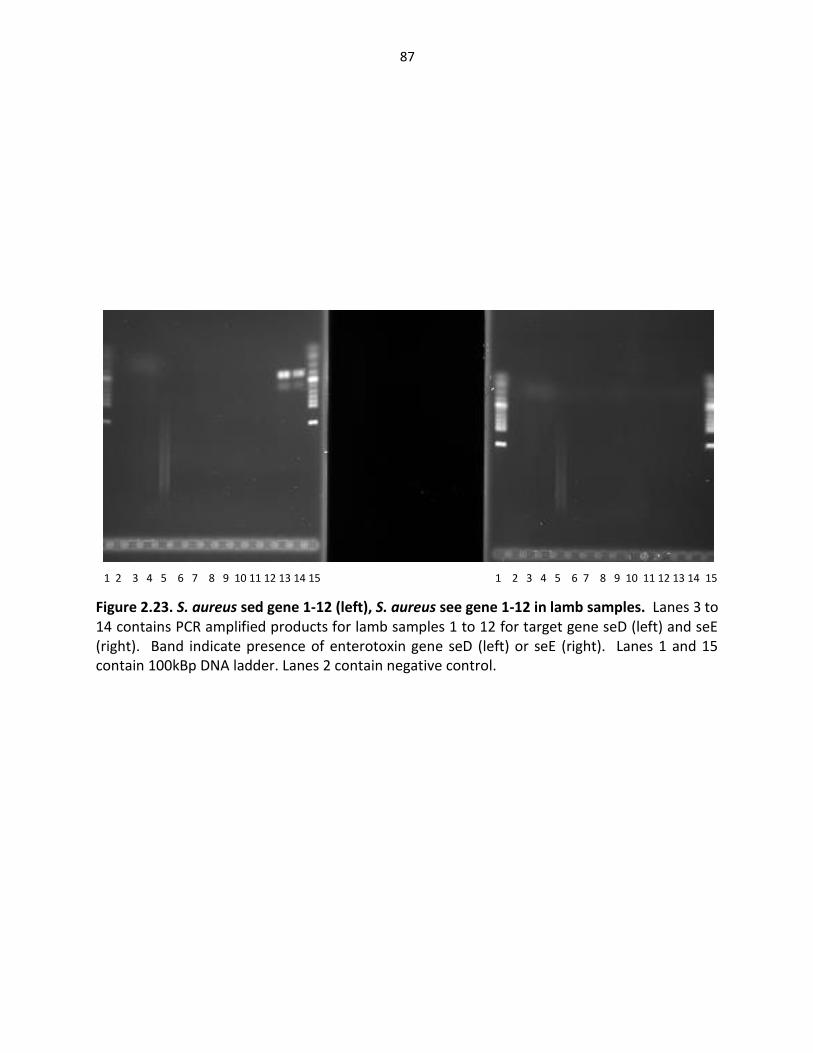
87
1 2 3 4 5 6 7 8 9 10 11 12 13 14 15 1 2 3 4 5 6 7 8 9 10 11 12 13 14 15
Figure 2.23. S. aureus sed gene 1-12 (left), S. aureus see gene 1-12 in lamb samples. Lanes 3 to 14 contains PCR amplified products for lamb samples 1 to 12 for target gene seD (left) and seE (right). Band indicate presence of enterotoxin gene seD (left) or seE (right). Lanes 1 and 15 contain 100kBp DNA ladder. Lanes 2 contain negative control.
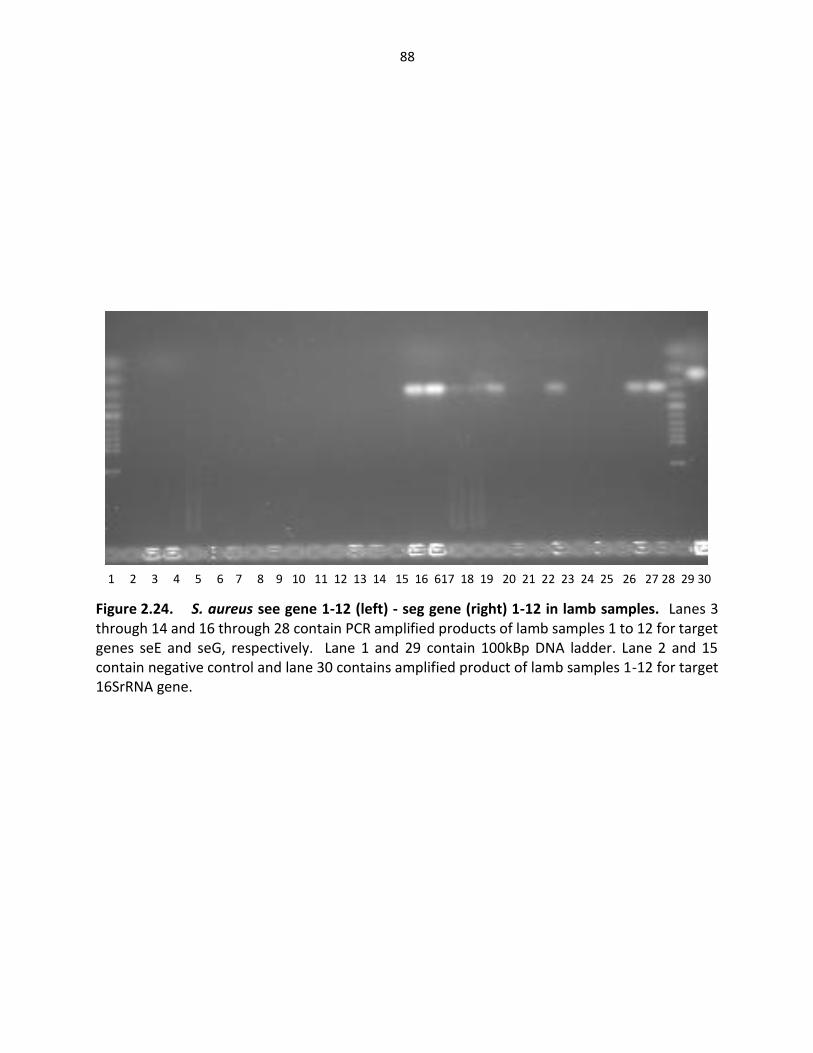
88
1 2 3 4 5 6 7 8 9 10 11 12 13 14 15 16 617 18 19 20 21 22 23 24 25 26 27 28 29 30
Figure 2.24. S. aureus see gene 1-12 (left) - seg gene (right) 1-12 in lamb samples. Lanes 3 through 14 and 16 through 28 contain PCR amplified products of lamb samples 1 to 12 for target genes seE and seG, respectively. Lane 1 and 29 contain 100kBp DNA ladder. Lane 2 and 15 contain negative control and lane 30 contains amplified product of lamb samples 1-12 for target 16SrRNA gene.
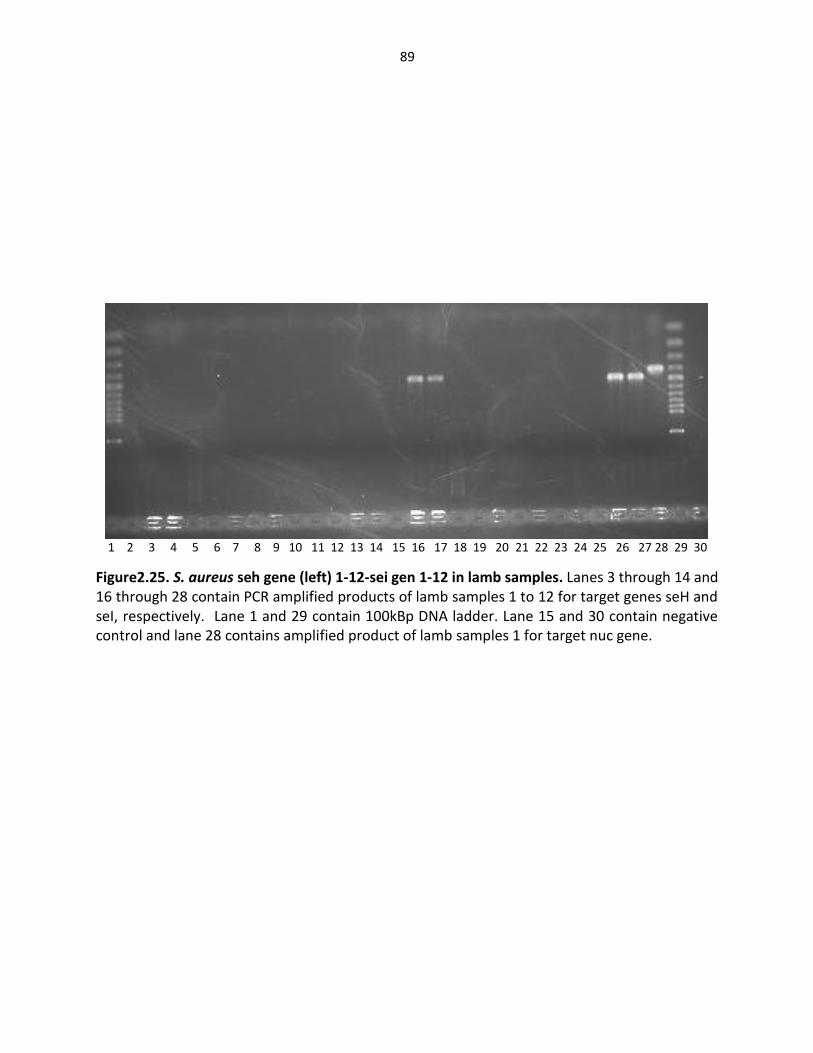
89
1 2 3 4 5 6 7 8 9 10 11 12 13 14 15 16 17 18 19 20 21 22 23 24 25 26 27 28 29 30
Figure2.25. S. aureus seh gene (left) 1-12-sei gen 1-12 in lamb samples. Lanes 3 through 14 and 16 through 28 contain PCR amplified products of lamb samples 1 to 12 for target genes seH and seI, respectively. Lane 1 and 29 contain 100kBp DNA ladder. Lane 15 and 30 contain negative control and lane 28 contains amplified product of lamb samples 1 for target nuc gene.

90
1 2 3 4 5 6 7 8 9 10 11 12 13 14 15
Figure 2.26. S. aureus sej gene in lamb samples. Lanes 3 through 14 contain amplified PCR product for lamb samples 1 to 12 for target seJ gene. Band indicates presence of enterotoxin seJ in specific samples. Lane 1 contains 100kBp DNA ladder. Lane 2 contains negative control and lane 15 contains amplified PCR product of lamb sample 1 for target nuc gene.

91
1 2 3 4 5 6 7 8 9 10 11 12 13 14 15 16 17 18 19 20 21 22 23 24 25 26 27 28 29
Figure 2.27. S. aureus sea gene in chicken samples. Lanes 2 through 26 contain amplified PCR product of chicken samples 1 to 25 and target seA gene. Band indicates presence of enterotoxin gene seA in specific samples. Lanes 1 and 28 contain 100kBP DNA ladder. Lane 29 contains negative control and lane 27 contains amplified PCR product of chicken sample 1 to 25 and target seA gene.
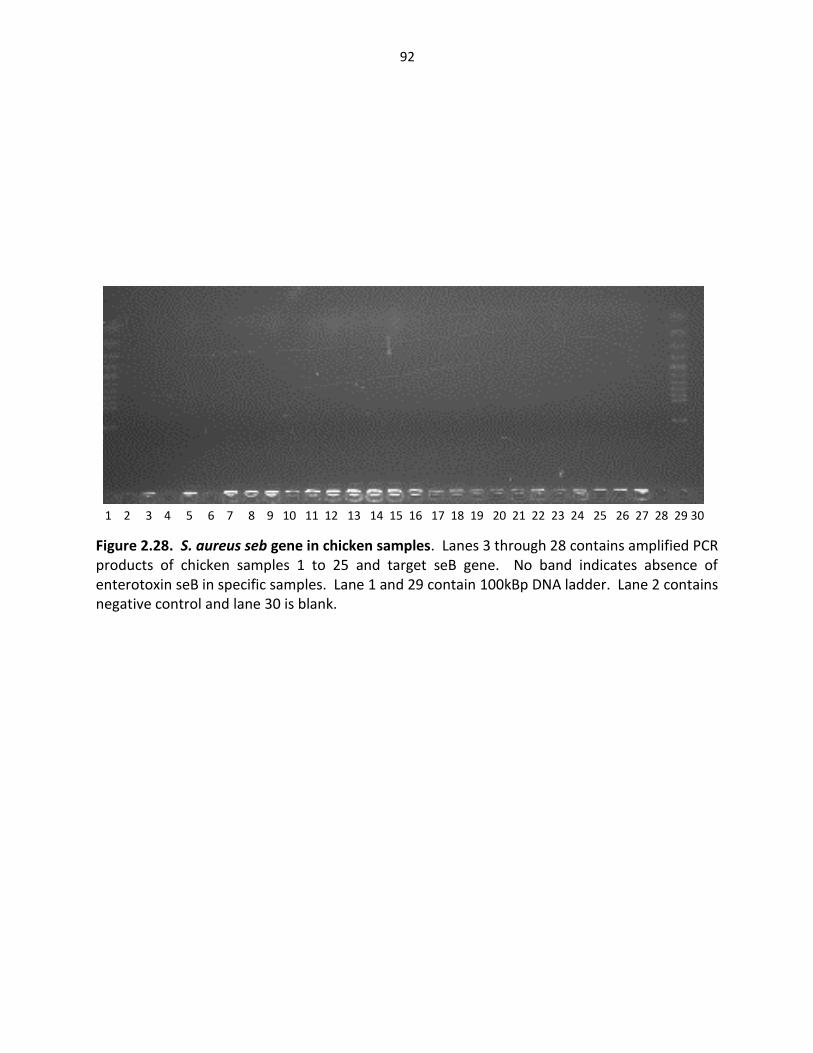
92
1 2 3 4 5 6 7 8 9 10 11 12 13 14 15 16 17 18 19 20 21 22 23 24 25 26 27 28 29 30
Figure 2.28. S. aureus seb gene in chicken samples. Lanes 3 through 28 contains amplified PCR products of chicken samples 1 to 25 and target seB gene. No band indicates absence of enterotoxin seB in specific samples. Lane 1 and 29 contain 100kBp DNA ladder. Lane 2 contains negative control and lane 30 is blank.
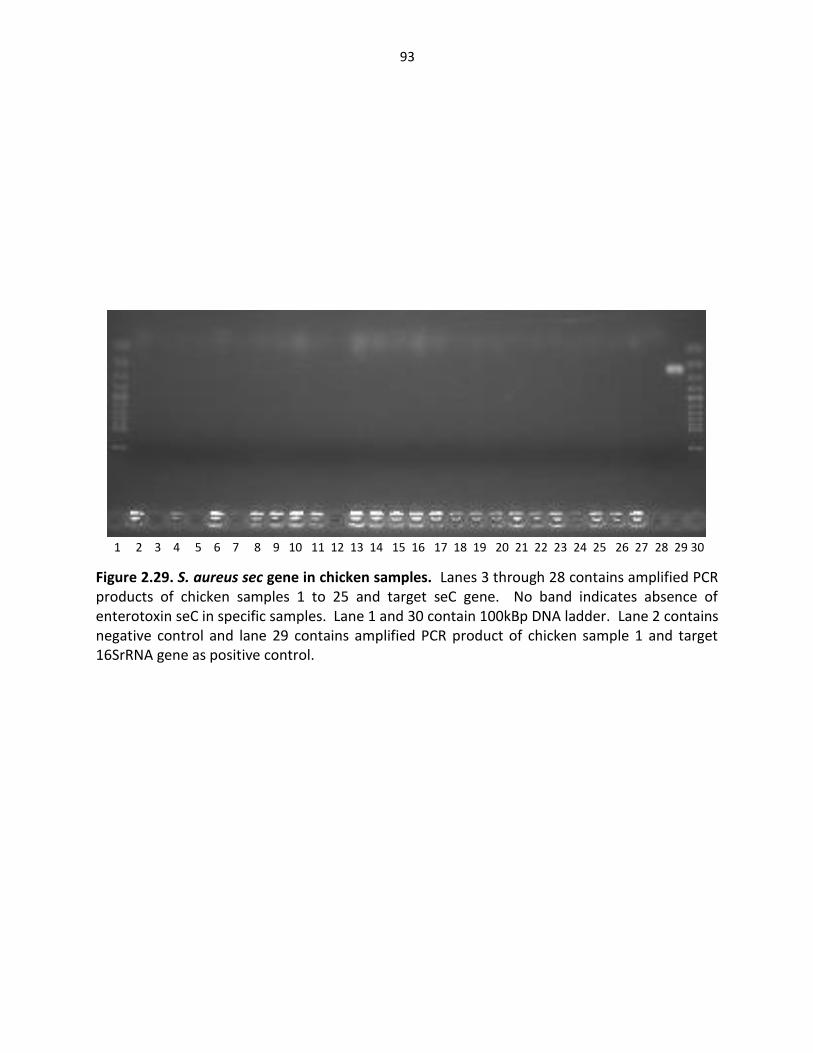
93
1 2 3 4 5 6 7 8 9 10 11 12 13 14 15 16 17 18 19 20 21 22 23 24 25 26 27 28 29 30
Figure 2.29. S. aureus sec gene in chicken samples. Lanes 3 through 28 contains amplified PCR products of chicken samples 1 to 25 and target seC gene. No band indicates absence of enterotoxin seC in specific samples. Lane 1 and 30 contain 100kBp DNA ladder. Lane 2 contains negative control and lane 29 contains amplified PCR product of chicken sample 1 and target 16SrRNA gene as positive control.
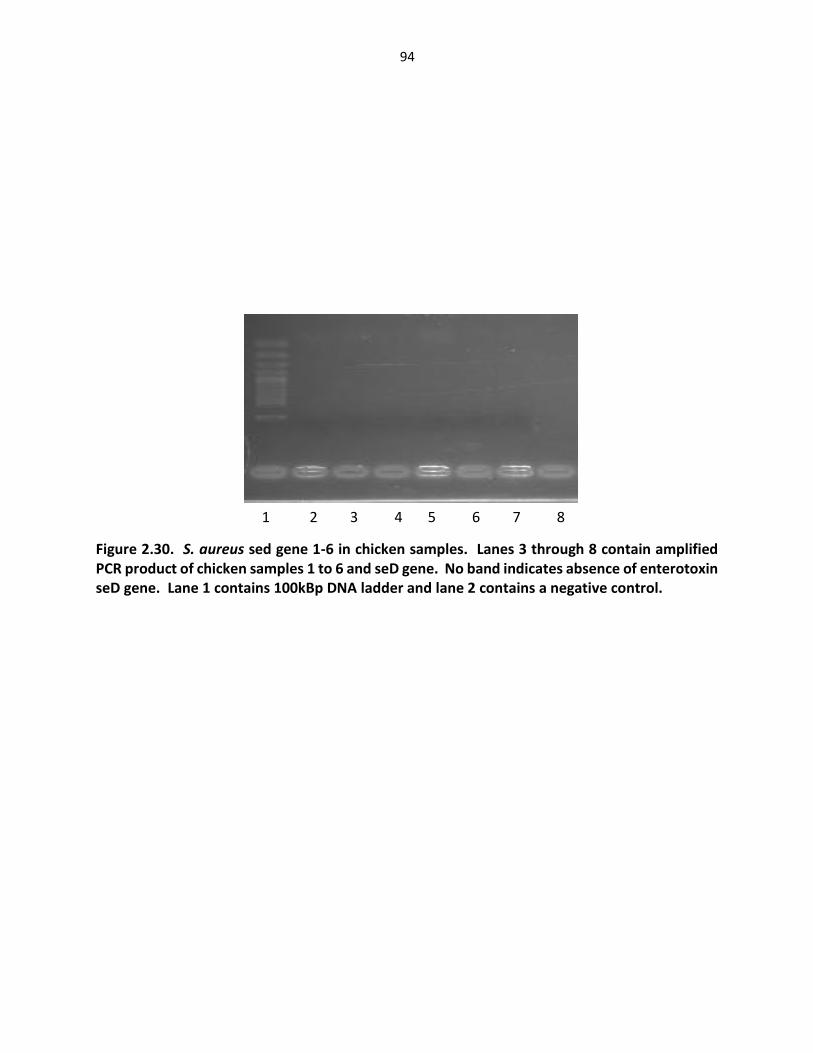
94
1 2 3 4 5 6 7 8
Figure 2.30. S. aureus sed gene 1-6 in chicken samples. Lanes 3 through 8 contain amplified PCR product of chicken samples 1 to 6 and seD gene. No band indicates absence of enterotoxin seD gene. Lane 1 contains 100kBp DNA ladder and lane 2 contains a negative control.
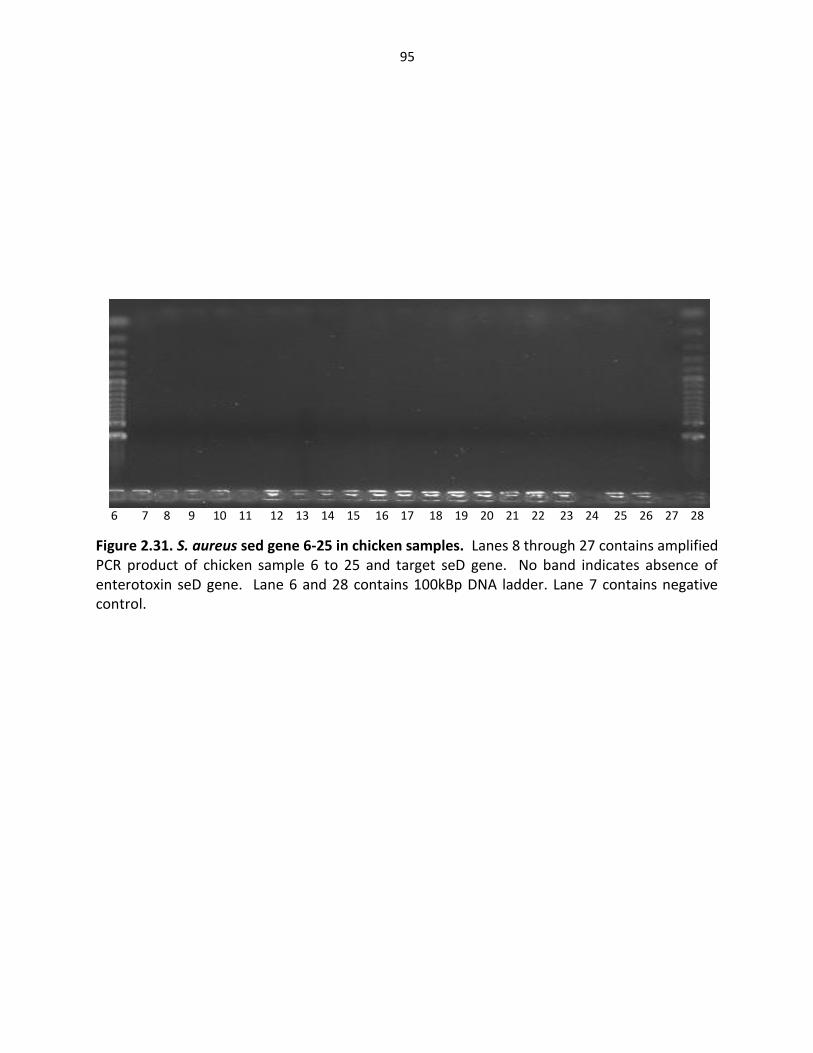
95
6 7 8 9 10 11 12 13 14 15 16 17 18 19 20 21 22 23 24 25 26 27 28
Figure 2.31. S. aureus sed gene 6-25 in chicken samples. Lanes 8 through 27 contains amplified PCR product of chicken sample 6 to 25 and target seD gene. No band indicates absence of enterotoxin seD gene. Lane 6 and 28 contains 100kBp DNA ladder. Lane 7 contains negative control.

96
1 2 3 4 5 6 7 8 9 10 11 12 13 14 15 16 17 18 19 20 21 22 23 24 25 26 27 28 29 30
Figure 2.32. S. aureus see gene in chicken samples. Lane 3 through 28 contains amplified PCR product of chicken samples 1 to 25 and target seE gene. No band indicated absence of enterotoxin seE in specific samples. Lane 1 and 30 contians 100kBp DNA ladder. Lane 2 contians negative control and lane 29 contains amplified PCR product of chicken sample 1 and target 16SrRNA gene as positive control.
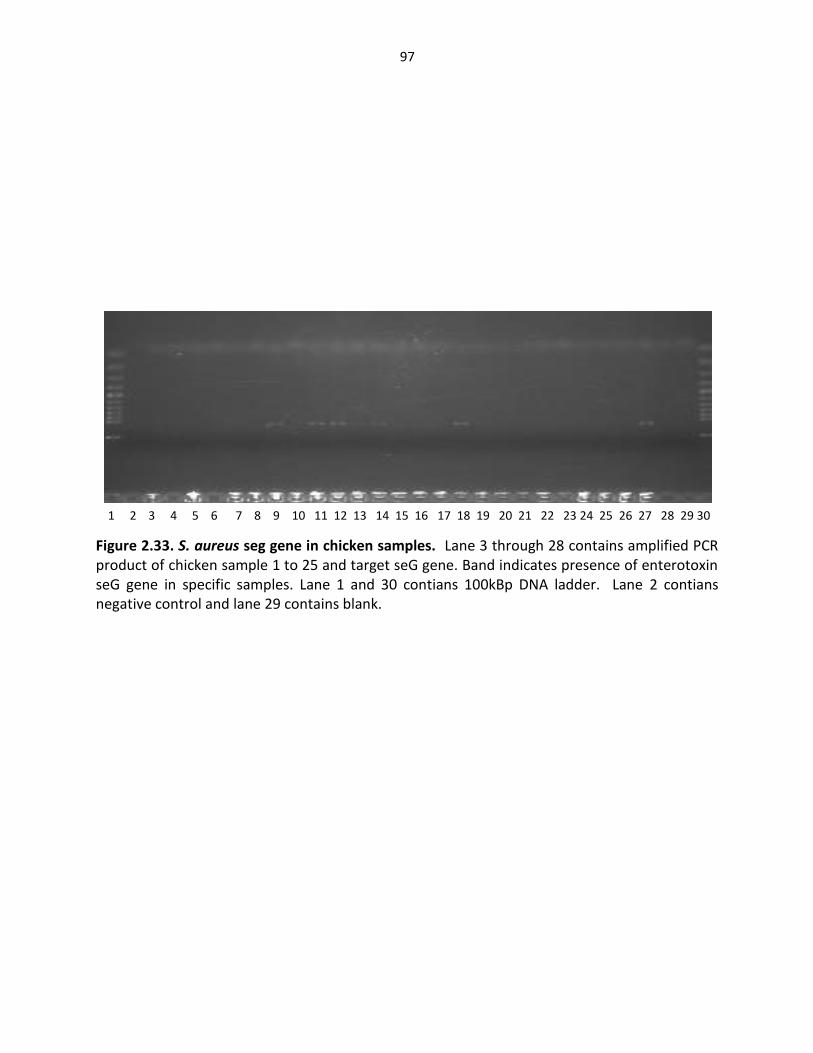
97
1 2 3 4 5 6 7 8 9 10 11 12 13 14 15 16 17 18 19 20 21 22 23 24 25 26 27 28 29 30
Figure 2.33. S. aureus seg gene in chicken samples. Lane 3 through 28 contains amplified PCR product of chicken sample 1 to 25 and target seG gene. Band indicates presence of enterotoxin seG gene in specific samples. Lane 1 and 30 contians 100kBp DNA ladder. Lane 2 contians negative control and lane 29 contains blank.

98
1 2 3 4 5 6 7 8 9 10 11 12 13 14 15 16 17 18 19 20 21 22 23 24 25 26 27 28 29 30
Figure 2.34. S. aureus seh gene in chicken samples. Lane 3 through 28 contains amplified PCR product of chicken samples 1 to 25 and target seH gene. No band indicated absence of enterotoxin seH in specific samples. Lane 1 and 30 contians 100kBp DNA ladder. Lane 2 contians negative control and lane 29 contains amplified PCR product of chicken sample 1 and target 16SrRNA gene as positive control.

99
1 2 3 4 5 6 7 8 9 10 11 12 13 14 15 16 17 18 19 20 21 22 23 24 25 26 27 28 29 30
Figure 2.35. S. aureus sei gene in chicken samples. Lanes 3 through 28 contains amplified PCR products of chicken samples 1 to 25 and target seI gene. Band indicates presence of enterotoxin seI in specific samples. Lane 1 and 30 contain 100kBp DNA ladder. Lane 2 contains negative control and lane 29 contains amplified PCR product of chicken sample 1 and target nuc gene as positive control.

100
1 2 3 4 5 6 7 8 9 10 11 12 13 14 15 16 17 18 19 20 21 22 23 24 25 26 27 28 29 30
Figure 2.36. S. aureus sej gene in chicken samples. Lane 3 through 28 contains amplified PCR product of chicken samples 1 to 25 and target seJ gene. No band indicated absence of enterotoxin seJ in specific samples. Lane 1 and 30 contians 100kBp DNA ladder. Lane 2 contians negative control and lane 29 contains blank.

101
Table2.3.Distribution of enterotoxin genes among S. aureus isolates from meat.
Gene
No.(%) of S. aureus isolates n=63
Total
S.aureus isolates
(beef) n=26
S.aureus isolates
(lamb) n=12
S.aureus isolates
(Chicken) n=25
Sea 10 (15.5%) 4 (6.3%) 25(39.6%) 39 (61.9%)
Seb 0 0 0 0
Sec 0 0 0 0
Sed 0 2 (3.1%) 0 2 (3.1%)
See 0 0 0 0
Seg 0 6 (9.5%) 0 6 (9.5%)
Seh 17 (26.9%) 4 (6.3%) 0 21 (33.3%)
Sei 11 (17.4%) 0 8 (12.6%) 19 (30.1%)
Sej 0 2 (3.1%) 0 2 (3.1%)
Sea + sei 7 (11.1%) 0 8 (12.6%) 15 (23.8%)
Sej + seh 0 2 (3.1%) 0 2 (3.1%)
Sei + seh 11 (17.4%) 0 0 11 (17.4%)
Sed + seg 0 2 (3.1%) 0 2 (3.1%)
Sea + seh 9 (14.2%) 0 0 9 (14.2%)
Sed + seh 0 2 (3.1%) 0 2 (3.1%)
Sed + sej 0 2 (3.1%) 0 2 (3.1%)
Sea+ sei + seh 7 (11.1%) 0 0 7 (11.11%)
Sed + seg + sej + seh
0 2 (3.1%) 0 2 (3.1%)

102
Table2.4. Antimicrobial resistance of S. aureus isolates from meat.
Antibiotic
No.(%) of S. aureus isolates n=96
Beef n=33
Lamb n=35 Chicken n=28 Total
Ampicillin 23 (69.6%) 26 (74.2%) 19 (67.8%) 68 (70.8%)
Gentamicin 2 (6%) 0 1 (3.5%) 3 (3.1%)
penicillin 25 (75.7%) 23 (65.7%) 21 (75%) 69 (71.8%)
Oxacillin 7 (21.2%) 11 (31.4%) 7 (25%) 25 (26%)
Ciprofloxacin 0 0 0 0
Erythromycin 3 (9%) 2 (5.7%) 2 (7.1%) 7 (7.2%)
Tetracycline 14 (42.4%) 12 (34.2%) 9 (32.1%) 35 (36.4%)
Chloramphenicol 1 (3%) 0 1 (3.5%) 2 (2%)
Rifampicin 1 (3%) 0 1 (3.5%) 2 (2%)
Vancomycin 0 0 0 0
Amikacin 1 (3%) 1 (2.8%) 0 2 (2%)
Amoxicillin 4 (12.1%) 6 (17.1%) 4 (14.2%) 34 (35.4%)
Clindamycin 1 (3%) 1 (2.8%) 1 (3.5%) 3 (3.1%)
Nitrofurantoin 0 0 0 0
Multidrug resistance
15 (48.4%) 19 (54.2%) 13 (46.4%) 47 (48.9%)

103
Results and discussion
1-Prevalence of S. aureus in different types of meat
Previous studies showed that S. aureus is the most important Staphylococcus species
causing food-borne illness (Jablonski & Bohach, 2001). Prevalence of S. aureus in meat samples
were shown in table (2.1), Our results showed that of the 142 samples, 61 (42.9%) samples were
positive for S. aureus were confirmed to be S. aureus by genotypic identification when the
gene nuc and the target 16s rRNA were observed, and by biochemical identification when gram
stain, catalase reaction, coagulase test were positive. 63 S. aureus isolates were recovered from
the 61 S. aureus –positive samples (1–2 isolates per sample) for enterotoxin genes detection.
Also, a total 96 S. aureus isolates including (33), (35) and (28) from beef, lamb and chicken,
respectively were used for antibiotic resistance test. The presence of S. aureus in foods
commonly indicates contamination that may be directly introduced into the food by workers who
have skin lesions containing S. aureus, or by sneezing or coughing (Jay, 1986). Other
contamination sources of S. aureus are soil, water, dust and air (Arbuthnott, 1990).
Previous studies showed that S. aureus is the most important Staphylococcus species causing
food-borne illness (Jablonski & Bohach, 2001). Our study showed that prevalence of S.
aureus (42.9%) in the meat samples was high. (Waters et al, 2011) reported that prevalence of
S. aureus in meat samples in five cities in USA was (47%). In contrast, much lower prevalence of
S. aureus was also reported, such as (8%) in Korea (Heo et al., 2008). Beef samples showed the
highest prevalence (41.1%) of S. aureus contamination while in chicken samples showed the
lowest prevalence (27.4%) table (2.1.).

104
2-Enterotoxin genes of S. aureus in meat
Staphylococcal food Poisoning (SFP) is one of the most common causes of food-borne
illness due to the widespread occurrence of S. aureus and to the ability of many strains to produce
one or more Staphylococcal enterotoxin (SEs). The heat stable toxins produced by bacterial
pathogens do not lose their biological activity by cooking and their presence in meat at elevated
levels is a food safety concern (Le Loir et al., 2003). A genotyping by PCR was performed to detect
classical enterotoxin genes (sea to see) and newly enterotoxin genes (seg to sej) for total of 63 S.
aureus isolates were recovered from the 61 S. aureus –positive samples (1–2 isolates per
sample), including (12,26,25) isolates from lamb, beef and chicken respectively. Our results
showed that 80.9% of the tested strains contained either one or more enterotoxin genes, which
is agreement with (85%) reported in USA (Pu et al, 2011).However, it was lower than 59.8%
reported in an Italy (Normanno et al., 2007) and 62% reported in Korea (Oh et al., 2007),In
addition, the percent of S. aureus isolates that harbored two to four SE genes in the present study
was 36.5%, which is lower than 66% reported in USA (Pu et al, 2011) and agreement with 25.6%
reported in an Italy (Normanno et al., 2007).A high percent of beef isolates (60%) contained
enterotoxigenic S. aureus than that of chicken and lamb. Our study showed that the two most
commonly detected Es genes in meat were sea (61.9%) and seh (33.3%) followed by sei (30.1),
seg (9.5%), sed and sej (3.17% each). No isolates harbored three other SE genes, that is, seb, sec,
or see. A high percent of sea gene was detected in present study was consistent with reports
that sea gene is the most common enterotoxin found during food and food poisoning outbreaks
worldwide(Balaban and Rassoly, 2000); ( Choi, 2000).The most commonly SE gene combination
was (sea- sei) occurring in (23.8%) of S. aureus isolates followed by (sei, seh), (sea, seh), and (sea,
105
sei, he) were occurring in (17.4),(14.2),and (11.11) respectively. Mec A gene was positive in 71.4
of S. aureus isolates. All isolates containing the mec A Agene showed positive MRSA phenotypes.
Results from this research indicate that high levels of staphylococcal enterotoxin genes were
detected in meat. Therefore, these findings are alarming and require the need to prevent the
presence of S. aureus strains and SEs production in meat.
3- Antibiotic resistance of S. aureus isolates from different types of meat
Food is an important factor for the transfer of antibiotic resistances. Such transfer can
occur by means of antibiotic residues in food, through the transfer of resistant food-borne
pathogens or through the ingestion of resistant strains of the original food microflora and
resistance transfer to pathogenic microorganisms (Khan et al., 2000); (Pesavento et al., 2007). S.
aureus strains are known to be frequently resistant to antibiotic therapy due to their capacity to
produce an exopolysaccharide barrier and because of their location within micro abscesses,
which limit the action of drugs (Gundogan et al., 2006). Antimicrobial susceptibility tests for S.
aureus isolates against different antibiotics are shown in table (2.4). Our results indicated that S.
aureus isolates showed different antimicrobial resistance levels where the percent of resistance
for a total of (96) S. aureus isolates to fourteen antimicrobials were as follow: ampicillin (70.8%),
penicillin (71.8%), tetracycline (36.4%), amoxicillin(35.4%),oxacillin (26%), erythromycin (7.2%),
clindamycin (3.1%), gentamycin (3.1%), Chloramphenicol(2%), amikacin (2%), rifampin(2%)
,vancomycin (0%), ciprofloxacin (0%), and nitrofurantoin (0%) . Our results showed that there
are three groups of isolates based on resistance to antibiotic where some isolates showed high
resistant to specific antibiotic specially the ones that are generally used as initial line of treatment
such as penicillin 69 (71.8%), ampicillin 68 (70.8%), tetracycline 35 (36.4%) and amoxicillin 34
106
(35.4%). Another group was showed that no resistance to some antibiotic such as nitrofurantoin,
vancomycin and ciprofloxacin, they are susceptible, thus giving us some way of treating any
infection caused by the same strains of the S. aureus isolates. A small percentage of the isolates
demonstrated resistance to rifampicin, amikacin and chloramphenicol (2%) for each, to
gentamycin and clindamycin were (3.1%) for each and to erythromycin was (7.2%). The isolates
were collected from lamb samples demonstrated the most sensitive to the tested antibiotics
among tested samples.
Multidrug resistant strains of S. aureus are a risk factor for the public health. A methicillin
susceptibility test showed that (26%) S. aureus isolates were resistant to methicillin. The percent
of multidrug resistance of S. aureus isolates (resistance to three or more classes) were (48.9%)
(Table2.2). A high percent of multidrug resistant S. aureus was detected in our study is alarming.
It raises concerns about inappropriate practices including the use of antimicrobials as growth
promotors in food animal production and the frequent use of antimicrobials in poultry
husbandry. Genes coding for antimicrobial resistance can move through horizontal gene transfer
to clinical pathogenic strains and contribute to the creation of superbugs. Results from this
research indicated that high levels of staphylococcal enterotoxin genes, antibiotic resistance and
multidrug resistant were detected in meat. Therefore, these findings are alarming and require
the need to prevent the presence of S. aureus strains and SEs production in meat.

107
REFERENCES
Akineden, O., C. Annemu¨ller, A. A. Hassan, C. La¨mmler, W. Wolter, and M. Zscho¨ck.
2001. Toxin genes and other characteristics of Staphylococcus aureus isolates from milk
of cow with mastitis. Clin. Diagn. Lab. Immunol. 8:959–964.
Altboum Z, Hertman I, Sarid S. Penicillinase plasmidlinked genetic determinants for
enterotoxins B and C1 production in Staphylococcus aureus. Infect Immun. 1985; 47:514–
521.
Al-Daccak, R.; Mehindate, K.; Damdoumi, F.; Etongue-Mayer, P.; Nilsson, H.; Antonsson,
P.; Sundstrom, M.; Dohlsten, M.; Sekaly, R.P.; Mourad, W. Staphylococcal Enterotoxin D
Is a Promiscuous Superantigen Offering Multiple Modes of Interactions with the MHC
Class II Receptors. J. Immunol. 1998, 160, 225–232.
Arbuthnott, J., Coleman, D., & Azavedo, J. S. d. (1990). Staphylococcal toxins in human
disease. Journal of Applied Microbiology, 69(S19), 101S-107S.
Argudín, M.A.; Mendoza, M.C.; Rodicio, M.R. Food poisoning and Staphylococcus aureus
enterotoxins. Toxins 2010, 2, 1751–1773.
Atanassova, V.; Meindl, A.; Ring, C. Prevalence of Staphylococcus aureus and
Staphylococcal Enterotoxins in Raw Pork and Uncooked Smoked Ham—a Comparison of
Classical Culturing Detection and RFLP-PCR. Int. J. Food Microbiol. 2001, 68, 105–113.
Toxins 2010, 2 21928.
Balaban, N.; Rasooly, A. Staphylococcal Enterotoxins. Int. J. Food Microbiol. 2000, 61, 1–
10
108
Bennett, R. W. 2001. Staphylococcus aureus, p 201-220. Ronald G. Labbe and Santos
Garcia. Guide to Foodborne Pathogens, John Wiley and Sons, Inc, New York, NY.
Bergdoll, M.S.; Crass, B.A.; Reiser, R.F.; Robbins, R.N.; Davis, J.P A New Staphylococcal
Enterotoxin, Enterotoxin F, Associated with Toxic-Shock-Syndrome Staphylococcus
aureus Isolates. Lancet 1981, 1, 1017–1021.
Bergdoll, M.S. 1990. Staphylococcal food poisoning. In Foodborne Diseases. D.O. Cliver
(Ed.) Academic Press, Inc. San Diego, CA. p. 86-106.
Brakstad, O.G.; Aasbakk, K.; Maeland, J.A. Detection of Staphylococcus aureus by
polymerase chain reaction amplification of the nuc gene. J. Clin. Microbiol. 1992, 30,
1654–1660
Castillejo-Rodriguez AM, Gimeno RM, Cosano GZ, Alcala EB, Perez MR. Assessment of
mathematical models for predicting Staphylococcus aureus growth in cooked meat
products. J Food Prot. 2002; 65:659 – 665.
Casman, E.P., R.W. Bennett, A.E. Dorsey, and J.A. Issa. 1967. Identification of a fourth
staphylococcal enterotoxin – enterotoxin D. J. Bacteriol. 94:1875-1882
CDC NNIS System: National Nosocomial Infections Surveillance (NNIS) system report, data
summary from January 1992–April 2001, issued August 2001. Am. J. Infect. Control. 2001;
29: 400–421.
Chambers HF. Methicillin resistance in staphylococci: molecular and biochemical basis
and clinical implications. Clin. Microbiol. Rev. 1997;10:781–791
Chambers, H.F., Deleo, F.R., 2009. Waves of resistance: Staphylococcus aureus in the
antibiotic era. Nat Rev Microbiol 7, 629-641.

109
CLSI, Clinical and Laboratory Standards Institute, 2007. Performance Standards for
Antimicrobial Susceptibility Testing; Fifteenth Informational Supplement. CLSI
document M100-S15. Clinical and Laboratory Standards Institute, Wayne, PA.
Dangerfield, H.G. 1973. Effects of enterotoxins after ingestion by humans. Presented at
the 73 rd Annual Meeting of the American Society for Microbiology. May 6-11, Miami
Beach, FL.
Da Silva MP, dos Passos C, Casarin LS, Serraglio L, Tondo EC. Evaluation of growth and
transfer of Staphylococcus aureus from poultry meat to surfaces of stainless steel and
polyethylene and their disinfection. Food Control. 2010; 21 (3):298–301.
Diekema DJ, et al. Survey of infections due to Staphylococcus species: frequency of
occurrence and antimicrobial susceptibility of isolates collected in the United States,
Canada, Latin America, Europe, and the Western Pacific region for the SENTRY
Antimicrobial Surveillance Program, 1997–1999. Clin. Infect. Dis.2001;32(Suppl. 2):S114–
S132
Di Giannatale E, Prencipe V, Tonelli A, Marfoglia C, Migliorati G. Characterisation of
Staphylococcus aureus strains isolated from food for human consumption. Vet Ital. 2011;
47 (2):165–73.
Enright, M.C. 2003. The evolution of resistant pathogen – the case of MRSA.Curr. Opin.
Pharmacol., 3 (2003), pp. 474-479
Evenson, M.L., M.W. Hinds, R.S. Berstein, and M.S. Bergdoll. 1988. Estimation of human
dose of staphylococcal enterotoxin A from a large outbreak in staphylococcal food
poisoning involving chocolate milk. Int. J. Food Microbiol.7:311-316.
110
FDA. (2011). Fish and Fishery Products Hazards and Controls Guidance. Center for Food
Safety&AppliedNutrition
http://www.fda.gov/food/guidanceregulation/guidancedocumentsregulatoryinformatio
n/seafood/ucm2018426.htm.Accessed:October 20, 2013
FDA. (2012).Bad Bug Book: Foodborne Pathogenic Microorganisms and Natural Toxins (2
ed.). Rockville, MD. http:// www.fda.gov/download/Food/Foodborne illness
contamination/UCM297627.Pdf. Adams MR, Moss MO. Bacterial agents of foodborne
illness—Staphylococcus aureus. Food Microbiology. Cambridge: Royal Society of
Chemistry; 2008.
Fujikawa H, Morozumi S. Modeling Staphylococcus aureus growth and enterotoxin
production in milk. Food Microbiol. 2006; 23:260 –267. Doi: 10.1016/j.fm.2005.04.005.
Gilbert, R. (1974). Staphylococcal food poisoning and botulism. Postgraduate Medical
Journal, 50(588), 603-611.
Ghuysen JM. Molecular structures of penicillin-binding proteins and beta-
lactamases. Trends Microbiol.1994;2:372–380
Gundog˘an, N., Citak, S., Turan, E., 2006. Slime production, DNAse activity and antibiotic
resistance of Staphylococcus aureus isolated from raw milk, pasteurized milk and ice
cream samples. Food Control 17, 389–392.
Gundogan, N., Citak, S., Yucel, N., Devren, A., 2005. A note on the incidence and the
antibiotic resistance of Staphylococcus aureus isolated from meat and chicken samples.
Meat Sci. 69, 807–810.

111
Hartman BJ, Tomasz A. Low-affinity penicillin-binding protein associated with beta-lactam
resistance in Staphylococcus aureus. J. Bacteriol. 1984;158: 513–516.
Heo, H. J., B. K. Kyung, D. H. Bae, C. K. Park, and Y. Ju Lee. 2008. Antimicrobial resistance
of Staphylococcus aureus isolated from domestic and imported raw meat in Korea.
Korean J Vet Res. 48:75-81
Huang, S. L., Weng, Y. M., & Chiou, R. Y. Y. (2001). Survival of Staphylococcus aureus and
Escherichia coli as affected by ethanol and NaCl. Journal of Food Protection, 174, 64(4),
546-550.
Iandolo, J. J. 1989. Genetic analysis of extracellular toxins of Staphylococcus aureus. Annu.
Rev. Microbiol. 43:375–402.
Jablonski LM, Bohach GA (2001) Staphylococcus aureus. In: Doyle MP, Beuchat LR,
Montville TJ (eds) Food Microbiology: Fundamentals and Frontiers, 2nd edn. ASM Press,
Washington, pp 411–434
Jarraud, S., M. A. Peyrat, A. Lim, A. Tristan, M. Bes, C. Mougel, J. Etienne, F. Vandenesch,
M. Bonneville, and G. Lina. 2001. Egc, a highly prevalent operon of enterotoxin gene,
forms a putative nursery of superantigens in Staphylococcus aureus. J. Immunol. 166:
669–677.
Kernodle, D.S. 2000. Mechanisms of resistance to β-lactam antibiotics. In Gram-positive
pathogens. V.A. Fischetti, R.P. Novick, J.J. Ferretti, D.A. Portnoy, and J.I. Rood, editors.
American Society for Microbiology. Washington, DC, USA. 609–620.

112
Kerouanton A, Hennekinne JA, Letertre C, Petit L, Chesneau O, Brisabois A, and De Buyser
ML. Characterization of Staphylococcus aureus strains associated with food poisoning
outbreaks in France. Int J Food Microbiol 2007; 115:369–375.
Khan, S.A., Nawaz, M.S., Khan, A.A., Cerniglia, C.E., 2000. Transfer of erythromycin
resistance from poultry to human clinical strains of Staphylococcus aureus. J. Clin.
Microbiol. 38, 1832–1838
Kitai, S. Shimizu,A. Kawano,J. Sato,E. Nakano, C. Uji, T. Kitagawa,H. Characterization of
methicillin-resistant Staphylococcus aureus isolated from retail raw chicken meat in
Japan.Journal of Veterinary and Medical Science, 67 (2005), pp. 107-110
Ler, S.G.; Lee, F.K.; Gopalakrishnakone, P. Trends in Detection of Warfare Agents.
Detection Methods for Ricin, Staphylococcal Enterotoxin B and T-2 Toxin. J. Chromatogr.
A 2006, 1133, 1–12.
Le Loir Y, Baron F, Gautier M. Staphylococcus aureus and food poisoning. Genet Mol Res.
2003;2: 63–76.
Lovseth, A.; Loncarevic, S.; Berdal, K.G. Modified multiplex PCR method for detection of
pyrogenic exotoxin genes in staphylococcal isolates. J. Clin. Microbiol. 2004, 42, 3869–
3872.
Lowy, F.D.(1998). Staphylococcus aureus infections. N Engl J Med; 339:520-32.
Mead, P.S.; Slutsker, L.; Dietz, V.; McCaig, L.F.; Bresee, J.S.; Shapiro, C.; Griffin, P.M.;
Tauxe, R.V. Food-Related Illness and Death in the United States. Emerg. Infect. Dis. 1999,
5, 607–625.

113
Monday, S. R., G. M. Vah, W. A. Ferens, C. D. Deobald, J. V. Rago, P. J. Gahr, D. D. Monie,
J. J. - Iandolo, S. K. Chapes, W. C. Davis, D. H. Ohlendorf, P. M. Schlievert, and G. A. Bohach.
1999. Unique superantigen activity of staphylococcal exfoliative toxins. J. Immunol.
Morandi, S.; Brasca, M.; Andrighetto, C.; Lombardi, A.; Lodi, R. Phenotypic and Genotypic
Characterization of Staphylococcus Aureus Strains from Italian Dairy Products. Int. J.
Microbiol. 2009, 501362:1–501362:7, doi: 10.1155 /2009/501362.
Mylotte JM, McDermott C, Spooner JA. Prospective study of 114 consecutive episodes
of Staphylococcus aureus bacteremia. Rev. Infect. Dis. 1987;9:891–907
Narmanno, G., A. Firinu, G. Virgilio, G. Mula, A. Dambrosio, A. Poggiu, L. Decastelli, R.
Mioni, A. Scuota, G. Bolzoni, E. Di Giannatale, A. P. Salinetti, G. La Salandra, M. Bartoli, F.
Zuccon, T. Pirino, S. Sias, A. Parisi, N. C. Quaglia, and G. V. Celano. 2005. Coagulase-
positive staphylococci and Staphylococcus aureus in food products marketed in Italy. Int.
J. Food Microbiol. 98:73–79.
Normanno G, La Salandra G, Dambrosio A, Quaglia NC, Corrente M, Parisi A, et al.
Occurrence, characterization and antimicrobial resistance of enterotoxigenic
Staphylococcus aureus isolated from meat and dairy products. Int J Food Microbiol. 2007;
115 (3):290–6.
Notermans, S., & Heuvelman, C. J. (1983). Combined effect of water activity, pH and sub-
optimal temperature on growth and enterotoxin production of Staphylococcus aureus.
Journal of Food Science, 48(6), 1832-1835.

114
Ono HK, Omoe K, Imanishi K, Iwakabe Y, Hu DL, Kato H, Saito N, Nakane A, Uchiyama T,
and Shinagawa K. Identification and characterization of two novel staphylococcal
enterotoxins, types S and T. Infect Immun 2008;76:4999–5005
Pesavento, G., Ducci, B., Comodo, N., Nostro, A.L., 2007. Antimicrobial resistance profile
of Staphylococcus aureus isolated from raw meat: a research for methicillin resistant
Staphylococcus aureus (MRSA). Food Control 18, 196–200.
Portocarrero, S. M., Newman, M., & Mikel, B.(2002). Staphylococcus aureus survival,
staphylococcal enterotoxin production and shelf stability of country-cured hams
manufactured under different processing procedures. Meat Science, 62(2), 267-273.
Pu, S.; Wang, F.; Ge, B. Isolation and characterization of methicillin-resistant
Staphylococcus aureus strains from Louisiana retail meats. Appl. Environ. Microb. 2009,
75, 265–267.
Quale J, Bratu S, Landman D, Heddurshetti R. Molecualr epidemiology and mechanisms
of carbapenem resistance in Acinetobacter baumannii endemic in New York City Clin
Infect Dis 2003;37:214-20.
Scherrer, D.; Corti, S.; Muehlherr, J.E.; Zweifel, C.; Stephan, R. Phenotypic and Genotypic
Characteristics of Staphylococcus Aureus Isolates From Raw Bulk-Tank Milk Samples of
Goats and Sheep. Vet. Microbiol. 2004, 101, 101–107.
Sharma NK, Rees CE, Dodd CE. Development of a single-reaction multiplex PCR toxin
typing assay for Staphylococcus aureus strains. Appl Environ Microbiol. 2000; 66
(4):1347–53.
115
Smyth CJ, Smyth DS, Kennedy J, Twohig J, Bolton DJ. Staphylococcus aureus: from man or
animal—an enterotoxin iceberg? In: Maunsell B, Sheridan J, Bolton DJ, editors. EU-RAIN
.Padua, Italy: Teagasc— The National Food Centre; 2004.
Song MD, Wachi M, Doi M, Ishino F, Matsuhashi M. Evolution of an inducible penicillin-
target protein in methicillin-resistant Staphylococcus aureus by gene fusion. FEBS
Lett. 1987;221:167–171
Su, Y. C. and A. C. L. Wong. 1997. Current perspective on detection of staphylococcal
enterotoxins. J. Food Prot. 60:195–202.
Thomas D, Chou S, Dauwalder O, and Lina G. Diversity in Staphylococcus aureus
enterotoxins. Chem Immunol Allergy 2007; 93:24–41.
Thomas DY, Jarraud S, Lemercier B, Cozon G, Echasserieau K, Etienne J, Gougeon ML, Lina
G, and Vandenesch F. Staphylococcal enterotoxin- like toxins U2 and V, two new
staphylococcal superantigens arising from recombination within the enterotoxin gene
cluster. Infect Immun 2006; 74:4724–4734.
Vannuffe, P.1995. Specific detection of methicillinresistant Staphylococcus species by
multiplex PCR. J. Clin. Microbiol. 33, 2864–2867 (1995).
Valsangiacomo C, Dolina M, Peduzzi R, Jaggli M (2000). Antimicrobial susceptibility of
Staphylococcus aureus isolates from hospitalized patients and dairy food (fresh cheese):
a survey over a decade in southern Switzerland. Clin. Microbiol. Infect. 6(7):395-396
Vasconcelos, N. G. Staphylococcal enterotoxins: molecular aspects and detection
methods. Journal of Public Health and Epidemiology 2, 29–42 (2010). 62:4550–4559.
116
Umeda, A, Y Ueki, and K Amako. “Structure of the Staphylococcus Aureus Cell Wall
Determined by the Freeze-Substitution Method.” Journal of Bacteriology 169.6 (1987):
2482–2487
Waldvogel, F.A. 2000. Staphylococcus aureus (including staphylococcal toxic shock).
In Principles and practice of infectious diseases. G.L. Mandell, J.E. Bennett, and R. Dolin,
editors. Churchill Livingstone. Philadelphia, Pennsylvania, USA. 2069–2092.
Waters AE, Contente-Cuomo T, Buchhagen J, Liu CM, Watson L, Pearce K, et al. Multidrug-
Resistant Staphylococcus aureus in US Meat and Poultry. Clin Infect Dis. 2011; 52
(10):1227–30.
Winn Washington, A.S., Janda, W. Koneman, E. Procop, G. Schreckenberger, P. Woods,
G. 2006. Koneman's Color Atlas and Textbook of Diagnostic Microbiology Lippincott
Williams & Wilkins, Philadelphia
Yucel N, Citak S, Onder M (2005). Prevalence and antibiotic resistance of Listeria species
in meat products in Ankara, Turkey. Food Microbiol .22:241-245
Zecconi, A., Scali, F., 2013. Staphylococcus aureus virulence factors in evasion from innate
immune defenses in human and animal diseases. Immunol Lett 150, 12-22.
117
CHAPTER 3: EFFECT OF MEAT PRODUCTION METHOD ON MICROBIAL CONTENT AND PHYSIOCHEMICAL QUALITY INDICATORS IN FRESH MEAT Abstract
There are different types of meat based on the method of animal slaughter and
processing. Halal meat is produced without stunning prior to slaughter, resulting in a rapid and
complete bleeding of animals. Studies have shown that halal slaughter results in significantly
lower residual hemoglobin than conventional slaughter with stunning (non-halal).The aim of this
chapter is to evaluate the microbial content and quality indicators differences between fresh
halal and non-halal beef. Meat samples were collected from different slaughter houses in
Michigan. Microbiological analyses of meat samples showed that halal meat samples had
significantly lower (P < 0.05) microbial count than non-halal meat. This includes APC (aerobic
plate count), Psychrotrophic bacteria, total coliform, Pseudomonas spp., and
Enterobacteriaceae. However, no significance differences were observed for E. coli, Yeast and
mold, staphylococcus aureus, and fecal coliform. Physiochemical analyses showed that quality
indicators for meat such as lipid oxidation, drip loss, and Heme iron content were significantly
lower (P < 0.05) in halal meat than non-halal meat. However, no significant differences were
observed for PH and thaw loss. Results from this research indicate that slaughter method
significantly affects the meat quality. We show that halal meat processing may be advantageous
in reducing bacterial colonization, increasing the usable shelf life, and improving the quality of
the meat.
118
Introduction
Halal food market is increasing and its consumers are estimated at 1.5 billion (Riaz and
Chaudry, 2004). The amount of money spent on halal food and drinks represents 16.6% of the
global expenditure on food and drinks. This equates to approximately $1.1 trillion and it is
estimated that by the year 2018, the value could reach $1.6 trillion (Thomson Reuters and Dinar
Standard, 2013). Due to the apparent economic benefits of the halal market, many food
businesses in the west have entered into the trade of halal food products. Nestle, one of the
world's major food manufacturers now holds halal certification for an estimated 150
manufacturing sites globally (Thomson Reuters and Dinar Standard, 2013).
Meat is one of the most easily spoiled foods because it contains a lot of nutrient, high
water content with dissolved substances and appropriate PH needed to encourage the growth of
different microorganisms. Some of meat spoilage symptoms come from the growth of
microorganisms to unacceptable levels while the other due to the chemical changes such as
physical damage, lipid oxidation and color change. There are different types of meat based on
the method of animal slaughter and processing. Halal meat is produced without stunning prior
to slaughter, resulting in a rapid and complete bleeding of animals (Eliasi and Dwyer, 2002;
Grandin and Regenstein, 1994). Studies have shown that halal slaughter results in significantly
lower residual hemoglobin than conventional slaughter with stunning (non-halal) (Nakyinsige et
al, 2014).There is a correlation between meat quality and blood. The more blood retained, the
poorer the meat quality (Gregory, 2008; Strappini et al, 2009). Residual blood left in the carcass
because of improper bleeding may decrease the shelf life and hence the quality of the meat
product because hemoglobin which is an important component of blood is a powerful promoter

119
of lipid oxidation and growth of microorganisms (Alvarado et al, 2007). Also, glucose in the blood
serves as substrate favorable for microbial growth such as Pseudomonas bacteria (Warriss,
2001). In addition, blood also contains a large number of white blood cells that produce hydroxyl
radicals, superoxides, and hydrogen peroxide that enhance lipid oxidation (Gabig & Babior,
1981).
This approach may improve the quality and extend the shelf life of meat. Halal and non
halal meat studies involved goat, chicken and rabbit, no data have been published on the
differences between microbial content and physiochemical characteristics in beef. Therefore,
the objective of this chapter is to evaluate the microbiological and physiochemical differences
between fresh halal and non-halal beef.
Microorganism in meat
A-Pseudomonas
Pseudomonads are gram-negative rods, strict aerobes and use glucose as primary
substrate for growth. Erichsen and Molin (1981) reported that Pseudomonas species were the
dominant bacteria group on normal and high pH beef as well as in some cases, Pseudomonas can
constitute up to 96% of the population (Asensio et al, 1988).Pseudomonas is the primary genus
involved in the spoilage of refrigerated meats that are stored in air (Bailey et al, 1979) where
there are three major species of pseudomonas (Ps. fragi, Ps. fluorescens and Ps. lundensis)
isolated from fresh and spoiled meat (Liao, 2006). When the glucose is available as substrate for
growth, pseudomonas will consume it first without produce offensive byproducts. But when the
glucose fails, the pseudomonads turn to protein degradation (Young et al, 1988) and evolution
of ammonia by de-amination of amino acids under aerobic conditions. Most of species of

120
pseudomonas are produced bacterial enzymes like proteases and lipases therefore the spoilage
caused by pseudomonas when growth in meat slimy, putrid odors and breakdown of animal
tissues (Liao, 2006).
B-Lactic acid bacteria
Lactic acid bacteria are gram-postive organisms, strictly fermentative where they
produce lactic acid as a result of glucose fermentation, facultative anaerobic and non-spore
forming bacteria (Stanbridge & Davies, 1998). Although many species of lactic acid bacteria are
spread in meat include Lactobacillus, Lactococcus, Leuconostoc, Carnobacterium, and Weissella
(Schillinger & Holzapfel, 2006). But some of these such as Lactobacillus spp., Carnobacterium
spp. and Leuconostoc spp have significant role in the spoilage of refrigerated raw meat (Labadie,
1999) Symptoms of meat spoilage by these bacteria are slime formation, discolorations, sour
flavor and off odor, (Schillinger & Holzapfel, 2006), but they do not produce malodourous
substances (Dainty et al, 1975).
C-Enterobacteriaceae
Enterobacteriaceae is large family consist of about 150 species (Baylis, 2006),
gram-negative, facultative anaerobic, rod shaped and non-spore forming bacteria. They use
glucose as substrate for growth and produce some deleterious compound (Gill, 1986) ;( Lambert
et al, 1991). There are different genera of the Enterobacteriaceae such as Klebsiella,
Enterobacter, Citrobacter, Hafnia, Kluyera (less commonly), Serratia, Proteus have found on raw
beef, lamb, pork, and poultry products(Garcia-Lopez et al, 1998). But the most important species
of the Enterobacteriaceae that responsible of the meat spoilage are Serratia liquefaciens, Hafnia
alvei and Enterobacter (Pantoea) agglomerans (Samelis, 2006). Stanbridge & Davies (1998)

121
indicated that H. alvei and S. liquefaciens grown in meat produce malodorous diamines as well
as they cause a green discoloration because of the growth these two bacteria.
D-Escherichia coli
Escherichia coli are a gram-negative, non-spore forming, motile or stationary
straight rod (1-4 µm). It is a mesophilic, facultative anaerobe that is normally inhabitant in the
intestines of humans and other warm-blooded animals, mammals and birds. E. coli is an indicator
organism and its presence in food or water is generally indicative of fecal contamination. E. coli
strains that produce Shiga toxin are called Shiga toxin-producing E. coli (STEC) because of the
strong similarity between the toxin they produce and the toxin produced by Shigella dysenteriae
type 1 (Calderwood et al., 1996).
E-Total coliforms
Coliforms are gram-negative, rod-shaped facultative anaerobic bacteria. Identification
criteria used are production of gas from glucose (and other sugars) and fermentation of lactose
to acid and gas within 48 h at 35°C (Hitchins et al., 1998). One of the most common applications
of coliform bacteria as indicator organisms is in their association with hygienic conditions and
overall quality, especially concerning heat processed foods. Coliforms at normal levels found in
foods are killed by most heat processing conditions therefore their presence in a food generally
indicates an inadequate heat process or post-processing contamination.
F-Fecal coliforms
Fecal coliforms are coliforms that ferment lactose with gas production within 48 h
at 45.5°C. This test was developed to differentiate between fecal and non-fecal contamination.

122
Fecal coliforms are considered more directly associated with fecal contamination from warm-
blooded vertebrates than are other members of the coliforms.
Physiochemical quality indicators of meat
1-Lipid oxidation
Lipid oxidation is one of the major causes of quality deterioration in raw and
cooked meat products during refrigeration and storage (Raharjo and Sofos, 1993). The free
radical intermediate from lipid oxidation can decompose Heme, causing loss of color. Buckley et
al., 1989, reported that an increase of lipid oxidation would cause a decrease of flavor, color,
texture, nutritional value and acceptability in meat as well as sometimes formation of
carcinogenic substances (Ahn, 1992) ;( Shahidi, 1994). Malonaldehyde, which is a degradation
product of lipid oxidation, has been criticized as a carcinogenic factor in food (Kurechi, 1980).
There is also increasing evidence to indicate that lipid oxidation takes place primarily at the
cellular membrane level and not in the triglyceride fraction. Therefore, lipid oxidation has been
reported in both lean and fatty meat (Thanonkaew et al, 2006).Most researchers believe that the
presence of transition metals, notably iron, is pivotal in the generation of species capable of
abstracting a proton from an unsaturated fatty acid (Kanner, 1994).Ferrous ion will cause fission
of O-O bonds to form very active alkoxy radicals for the propagation reaction, whereas the ferric
ion can form both peroxy and alkoxy radicals (Ingold, 1962). There are three steps of lipid
oxidation processing consists of initiation, propagation, and termination and these steps are
usually used to explain the autoxidation system: initiation is the formation of free alkyl radicals;
propagation is the chain reaction of free alkyl radicals and peroxy radicals; and termination is the
formation of nonradical products (Min, 1998)

123
.
Figure 3.1. Autoxidation of lipid
RH=Unsaturated fatty acid; R. =Alkyl radical; ROO. =Peroxy radical; RO. =Alkoxy radical; ROOH
= Hydroperoxide.
Studies have shown that halal slaughter without stunning resulted in significant lower
residual hemoglobin than non-halal slaughter with stunning (K. Nakyinsige et al, 2014); (Griffith’s
et al, 1985). Residual blood left in the carcass as a result of improper bleeding may decrease the
shelf life and hence the quality of the meat product because hemoglobin which is an important
component of blood is a powerful promoter of lipid oxidation (Alvarado et al, 2007). Blood also
contains a large number of white blood cells that produce hydroxyl radicals, superoxides, and
hydrogen peroxide that enhance lipid oxidation (Gabig & Babior, 1981).
2-Heme iron in beef
There are two forms of iron can be found in meat, Heme iron as a component of
myoglobin and hemoglobin in the muscle and non-heme iron. Heme iron is absorbed by the
enterocyte as an intact molecule and has few factors that interfere with its absorption in the

124
intestinal lumen (Wheby, 1981), therefore, it is highly bioavailable and significantly than non-
heme iron (Hallberg, 1981). Myoglobin, a heme-protein, gives red color to fresh beef. In an
aerobic condition deoxygenated redox form of Mb (deoxymyoglobin, DMb) with heme iron
present in the ferrous state (Fe2+) binds with oxygen to form oxymyoglobin (OMB). Oxidation
of (OMb) or deoxymyoglobin (DMb) results in the formation of metmyoglobin (MMb) with
concomitant oxidation of heme iron from ferrous (Fe2+) to ferric redox state (Fe3+). Increasing
of MMb results in meat discoloration, which effects on meat quality (Mohan et al, 2009).
Hemoglobin is a globular protein and consists of four subunits, as shown in Figure 3.2. Each
protein subunit is an individual molecule that joins to its neighboring subunits through
intermolecular interactions. In hemoglobin, each subunit contains a heme group, which is
displayed using the ball-and-stick representation in Figure 3.2 each heme group contains an iron
atom that is able to bind to one oxygen (O2) molecule. Therefore, each hemoglobin protein can
bind four oxygen molecules.
Figure 3.2. Hemoglobin molecule

125
Studies have shown that halal slaughter results in significantly lower residual hemoglobin than
conventional slaughter with stunning non-Halal (Nakyinsige et al, 2014).
Figure 3.3. Effect of slaughter method on hemoglobin content
Red meat and processed meat intake is associated with a risk of colorectal cancer, a major
cause of death in affluent countries. Epidemiological and experimental evidence supports the
hypothesis that heme iron present in meat promotes colorectal cancer. This meta-analysis of
prospective cohort studies of colon cancer reporting heme intake included 566,607 individuals
and 4,734 cases of colon cancer (Nadia et al, 2011).
Materials and methods
1. Sample collection:
Meat samples were collected from different slaughter houses in Michigan. The collected
samples were immediately transport in insulated ice containers to the laboratory for
microbiological and physiochemical analyses.
126
2. Microbiological analysis
Samples (25 g) of beef were weighed aseptically, added to (225mL) of 0.1% sterilized
peptone water and homogenized in a stomacher for 60 s at room temperature. Decimal dilutions
in 0.1% sterilized peptone water were prepared and duplicate 1mL samples of appropriate
dilutions were poured on Petri dish then added the specific media for each type of bacteria for
the following tests (APHA,1992):-
a) Aerobic plate Count
Pouring method was carried out according to APHA (1992) where 1 ml of the selected
dilutions were added onto duplicate sterile Petri dish plates then added plate count agar ( Sigma-
Aldrich) and incubate at 35°C for 48 hr. Colonies between “25-250” were counted and the total
aerobic colony counts were then expressed as log CFU/ gram.
b) Psychrotrophic bacteria
Psychrotrophic bacteria determination were carried out plate count agar (Sigma-Aldrich) and
then incubated at 7°C for 7 days.
c) Staphylococcus aureus
Baird-Parker agar plates (Merk, Germany) were incubated for 48h at 35°C. Typical S. aureus
colonies (Black colonies with white margins surrounded by clear zones) were counted.
d) Total coliform and fecal coliform bacteria
Violet red bile lactose agar (Sigma-Aldrich) was poured into 1ml of inoculum. The plates were
then incubated at 35°C for count of total coliforms and at 44°C for count of fecal coliforms for 48
h. All typical colonies (red colonies) were counted.
e) Total yeast and mold
127
Total yeast and mold were counted on Potato dextrose agar(Sigma-Aldrich) , acidified with
tartaric acid to pH 3.5 and incubated at 25°C for 5 d. Yellowish-white colonies were identified as
yeasts, whereas mold growth were recognized by its mycelial appearance.
f) Lactic acid bacteria
Lactic Acid Bacteria (LAB) counts were determined using the double-layer deMan Rogosa Sharpe
(MRS) agar (Sigma-Aldrich) and then incubated at 30°C for 72 h.
g) Enterobacteriaceae
Violet Red Bile Glucose agar (VRBG) (Oxoid, Basingstoke, UK) were used for the enumeration of
Enterobacteriaceae, overlaid with the same medium and then incubated at 37 ˚C for 24 h.
h) Escherichia coli
Escherichia coli bacteria were enumerated using Eosin Methylene Blue (EMB) agar (Sigma-
Aldrich) and then incubated at (37°C for 24h). Colonies of E. coli on EMB agar were round with a
typical metallic sheen.
i) Pseudomonas spp.
Pseudomonas spp. were determined on pseudomonas agar base (Oxoid, Basingstoke,UK)
supplemented with Pseudomonas CFC supplement (Oxoid, Basingstoke,UK) and then incubated
at 25°C for 48 h.
j) Listeria monocytogenes
Pre-enrichment were carried out in ( Buffered listeria enrichment broth base) supplemented with
(Listeria selective enrichment supplement) and incubated at 30°C for 7 days followed by
inoculation onto (Oxford agar) supplemented with (Oxford listeria selective supplement) then
incubated at 37°C for 48h.
128
k) Presumptive salmonella spp.
(25g) of beef were added to (225ml) of (Buffered peptone water) and incubate overnight
at 37°C then 1ml of this suspension were inoculated into (Tetrathionate Broth). The TET tubes
then were incubated at 37°C for 24 h and after incubation the samples were streaked onto
(Xylose Lysine Tergitol (XLT4) agar) and then incubated under the same conditions. Suspected
colonies were passed onto (Tryptic Soy Agar) and incubated under the same conditions.
3. Physiochemical analysis
a) Determination of Heme iron content
Heme iron content of meat was determined according to the method of Cheng &
Ockerman (2004). Ground sample (2g) was mixed with 9ml of acid acetone (90% acetone,
8% deionized water and 2% HCl v/v/v). The mixture was mashed with a glass rod and allowed
to stand for 1h at room temperature. The mixture was filtered with a Whatman No. 42 filter
paper and the absorbance of the filtrate was read at 640nm against an acid acetone used as
blank. Heme iron content was calculated as follows;
Heme iron content (ppm) = Total pigment (ppm) X 0.0822
Where total heme pigment (ppm) = A640 X 680
The heme iron content was expressed as mg/100g of wet sample.
b) pH measurement
PH of meat samples were measured according to (Naveena and Mendiratta, 2001) meat
samples (10 gram) were homogenized with 50 ml of distilled water then filtered through
whatman No.1 filter paper. The PH of filtrate samples were measured using digital PH meter
(WtW 2f40-11420D.Germany) calibrated at pH 4.0and 7.0 equipped with a pH electrode.

129
c) Thaw loss Percentage
Thaw loss was calculated as [weight of sample before freezing minus sample weight after
thawing] x 100/ sample weight before freezing.
d) Drip loss
Drip loss was calculated as [sample weight minus sample weight after 24 hours
refrigeration] x 100/ sample weight.
e) Lipid oxidation measurement
Thiobarbituric acid reactive substances (TBARS) were determinate according to the
method of Schmedes and Holmer (1989). Ground meat samples (10 g) were mixed with 25
ml of trichloroacetic acid (TCA) solution (200 g/l of TCA in 135 ml/l phosphoric acid solution)
and homogenized in a blender for 30 s. After filtration, 2 ml of the filtrate were mixed with
equal amount of aqueous solution of TBA (3 g/l) in a test tube. The tubes were incubated at
room temperature in the dark for 20 h; then the absorbance was measured at 532 nm using
UV-vis spectrophotometer (model UV-1200, Shimadzu, Kyoto, Japan). Lipid oxidation was
expressed as thiobarbituric acid reactive substances (TBARS) expressed as mg
Malonaldehyde/kg sample.
4. Statistical analysis
Data were represented the means of experiments. The means were compared using
Student T test (IBM SPSS statistics 23)

130
Figure 3.4. Aerobic plate count in fresh halal and non-halal beef. A data represent the mean values obtained from fresh halal and non-halal beef samples, and are expressed in logarithmic colony forming unit per gram (CFU/g). As seen from the figure there is significant differences in aerobic plate count were established by using independent measures t-tests at a significance level of p≤0.05.
0
1
2
3
4
5
6
Non-Halal Halal
Aerobic Plate Count
*
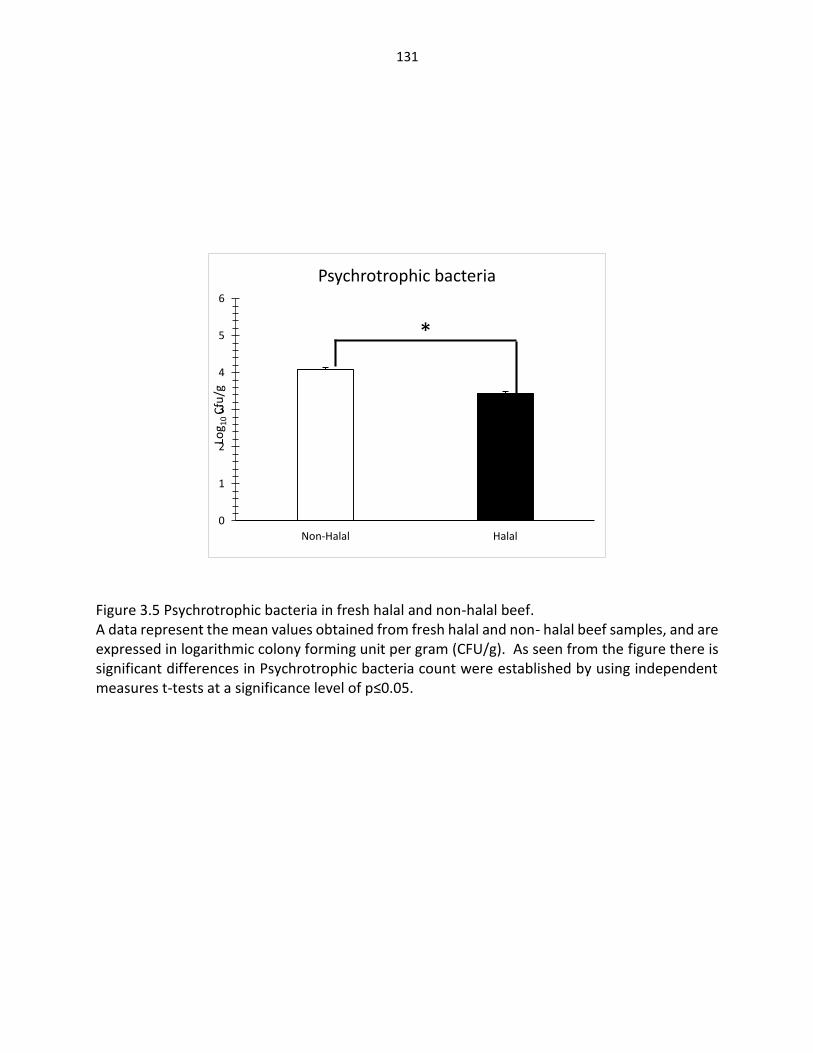
131
Figure 3.5 Psychrotrophic bacteria in fresh halal and non-halal beef. A data represent the mean values obtained from fresh halal and non- halal beef samples, and are expressed in logarithmic colony forming unit per gram (CFU/g). As seen from the figure there is significant differences in Psychrotrophic bacteria count were established by using independent measures t-tests at a significance level of p≤0.05.
0
1
2
3
4
5
6
Non-Halal Halal
Log 1
0 C
fu/g
Psychrotrophic bacteria
*
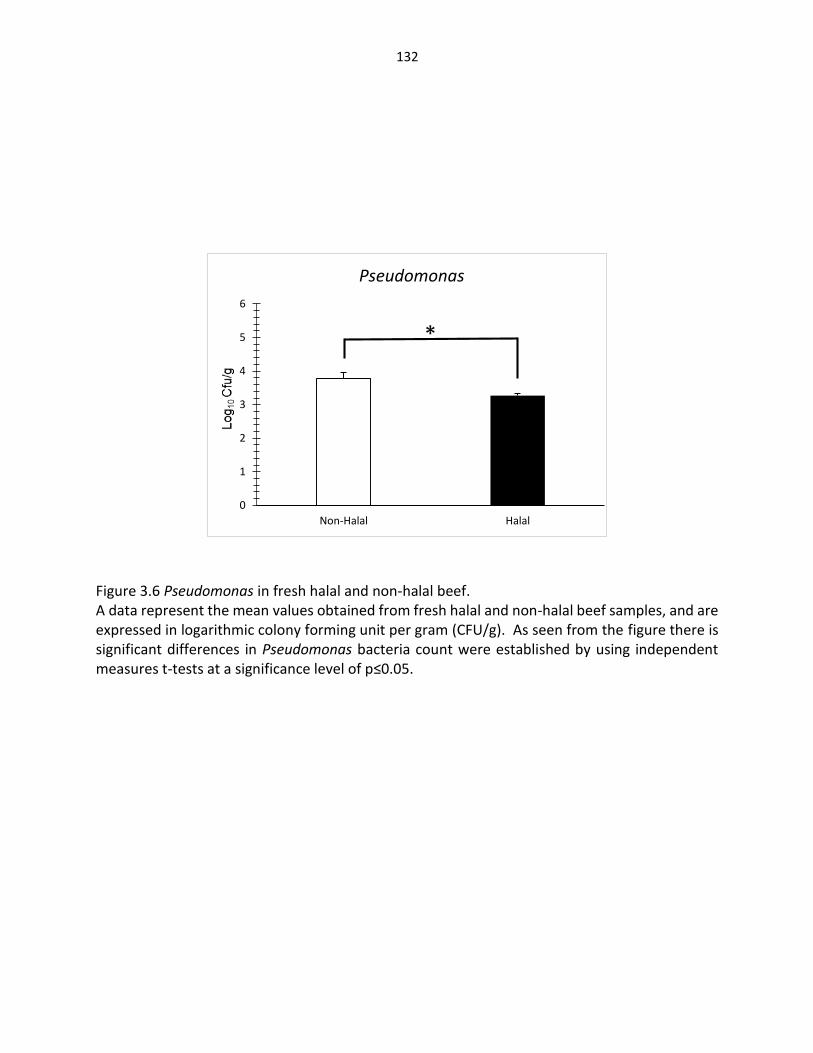
132
Figure 3.6 Pseudomonas in fresh halal and non-halal beef. A data represent the mean values obtained from fresh halal and non-halal beef samples, and are expressed in logarithmic colony forming unit per gram (CFU/g). As seen from the figure there is significant differences in Pseudomonas bacteria count were established by using independent measures t-tests at a significance level of p≤0.05.
0
1
2
3
4
5
6
Non-Halal Halal
Pseudomonas

133
Figure 3.7. S. aureus bacteria in fresh halal and non-halal beef. A data represent the mean values obtained from fresh halal and non-halal beef samples, and are expressed in logarithmic colony forming unit per gram (CFU/g). As seen from the figure there is no significant differences in S. aureus bacteria count were established by using independent measures t-tests at a significance level of p≤0.05.
0
1
2
3
4
5
6
Non-Halal Halal
Log 1
0 C
fu/g
Staphylococcus aureus
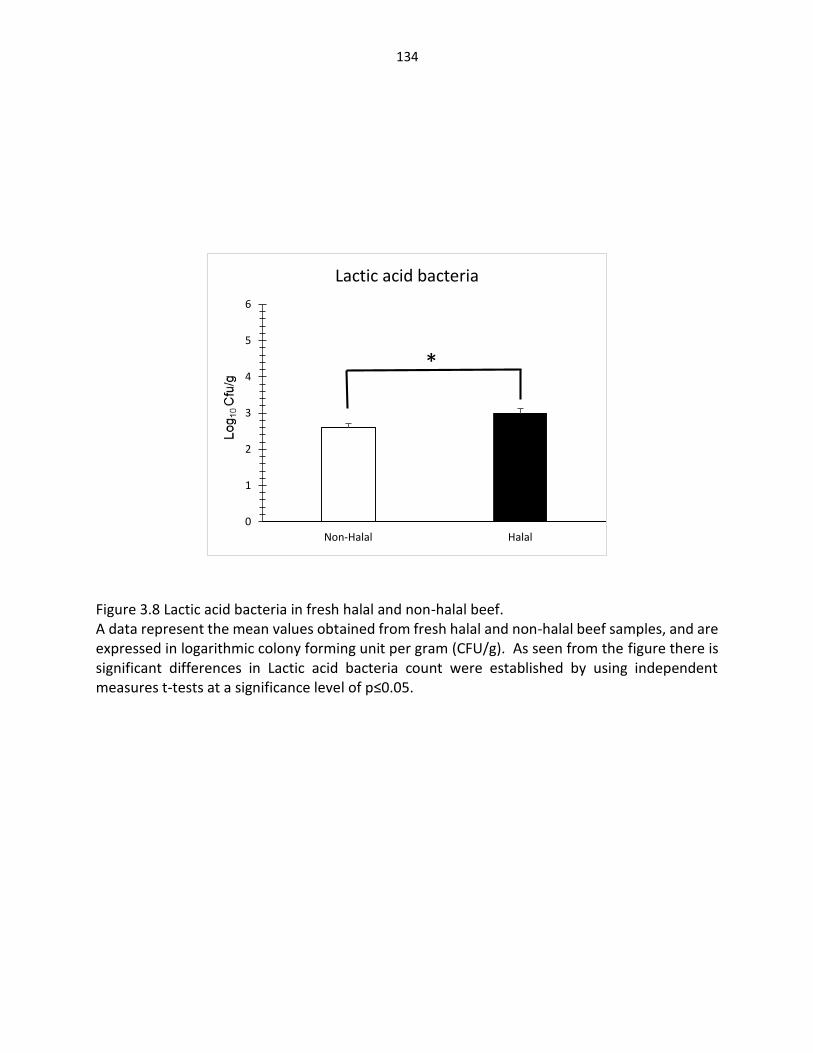
134
Figure 3.8 Lactic acid bacteria in fresh halal and non-halal beef. A data represent the mean values obtained from fresh halal and non-halal beef samples, and are expressed in logarithmic colony forming unit per gram (CFU/g). As seen from the figure there is significant differences in Lactic acid bacteria count were established by using independent measures t-tests at a significance level of p≤0.05.
0
1
2
3
4
5
6
Non-Halal Halal
Lactic acid bacteria
*

135
Figure 3.9 Enterobacteriaceae in fresh halal and non-halal beef. A data represent the mean values obtained from fresh halal and non-halal beef samples, and are expressed in logarithmic colony forming unit per gram (CFU/g). As seen from the figure there is significant differences in Enterobacteriaceae were established by using independent measures t-tests at a significance level of p≤0.05.
0
1
2
3
4
5
6
Non-Halal Halal
Log 1
0 C
fu/g
Enterobacteriaceae
*
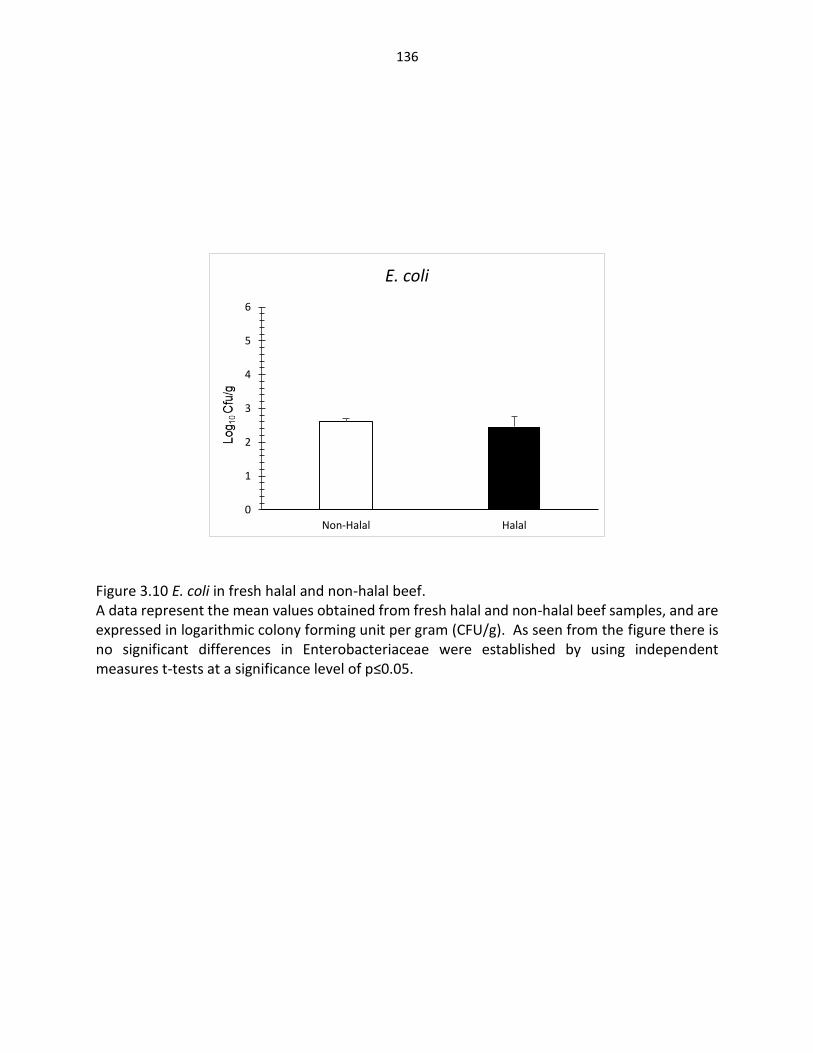
136
Figure 3.10 E. coli in fresh halal and non-halal beef. A data represent the mean values obtained from fresh halal and non-halal beef samples, and are expressed in logarithmic colony forming unit per gram (CFU/g). As seen from the figure there is no significant differences in Enterobacteriaceae were established by using independent measures t-tests at a significance level of p≤0.05.
0
1
2
3
4
5
6
Non-Halal Halal
E. coli
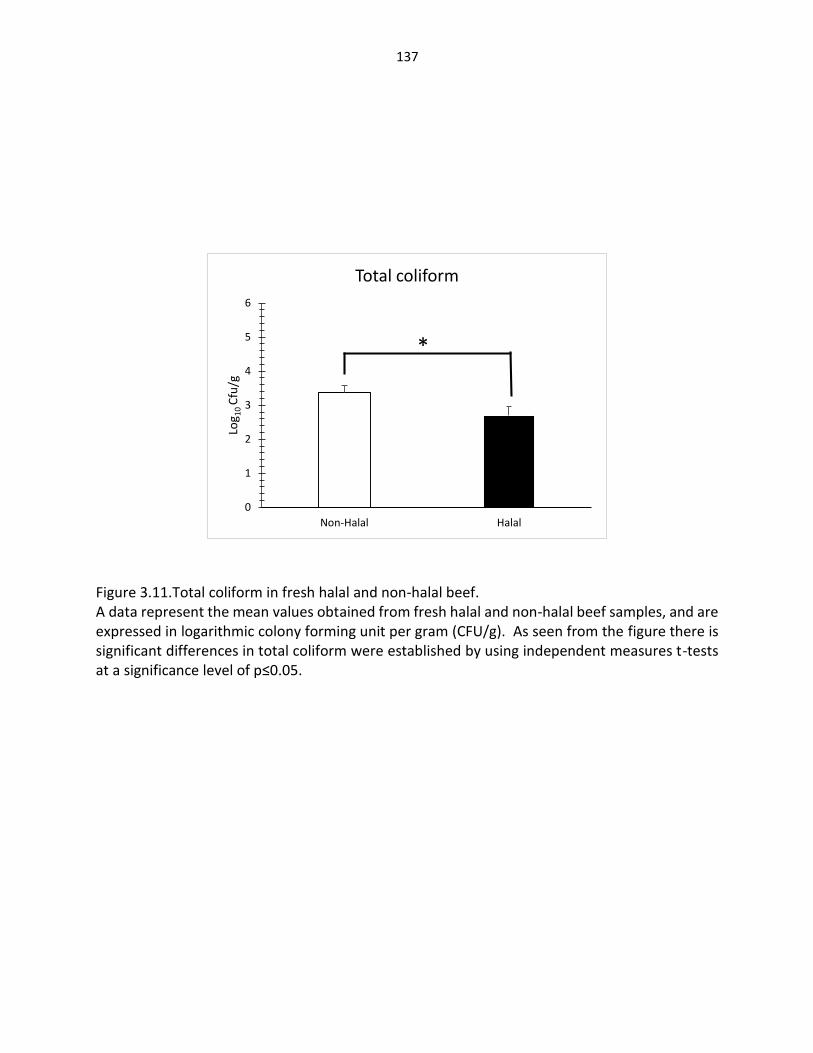
137
Figure 3.11.Total coliform in fresh halal and non-halal beef. A data represent the mean values obtained from fresh halal and non-halal beef samples, and are expressed in logarithmic colony forming unit per gram (CFU/g). As seen from the figure there is significant differences in total coliform were established by using independent measures t-tests at a significance level of p≤0.05.
0
1
2
3
4
5
6
Non-Halal Halal
Log 1
0 C
fu/g
Total coliform
*

138
Figure 3.12. Fecal coliform in fresh halal and non-halal beef. A data represent the mean values obtained from fresh halal and non-halal beef samples, and are expressed in logarithmic colony forming unit per gram (CFU/g). As seen from the figure there is no significant differences in fecal coliform were established by using independent measures t-tests at a significance level of p≤0.05.
0
1
2
3
4
5
6
Non-Halal Halal
Log 1
0 C
fu/g
Fecal coliform

139
Figure 3.13 Yeast and mold in fresh halal and non-halal beef. A data represent the mean values obtained from fresh halal and non-halal beef samples, and are expressed in logarithmic colony forming unit per gram (CFU/g). As seen from the figure there is no significant differences in yeast and mold were established by using independent measures t-tests at a significance level of p≤0.05.
0
1
2
3
4
5
6
Non-Halal Halal
Log 1
0 C
fu/g
Yeast and mold
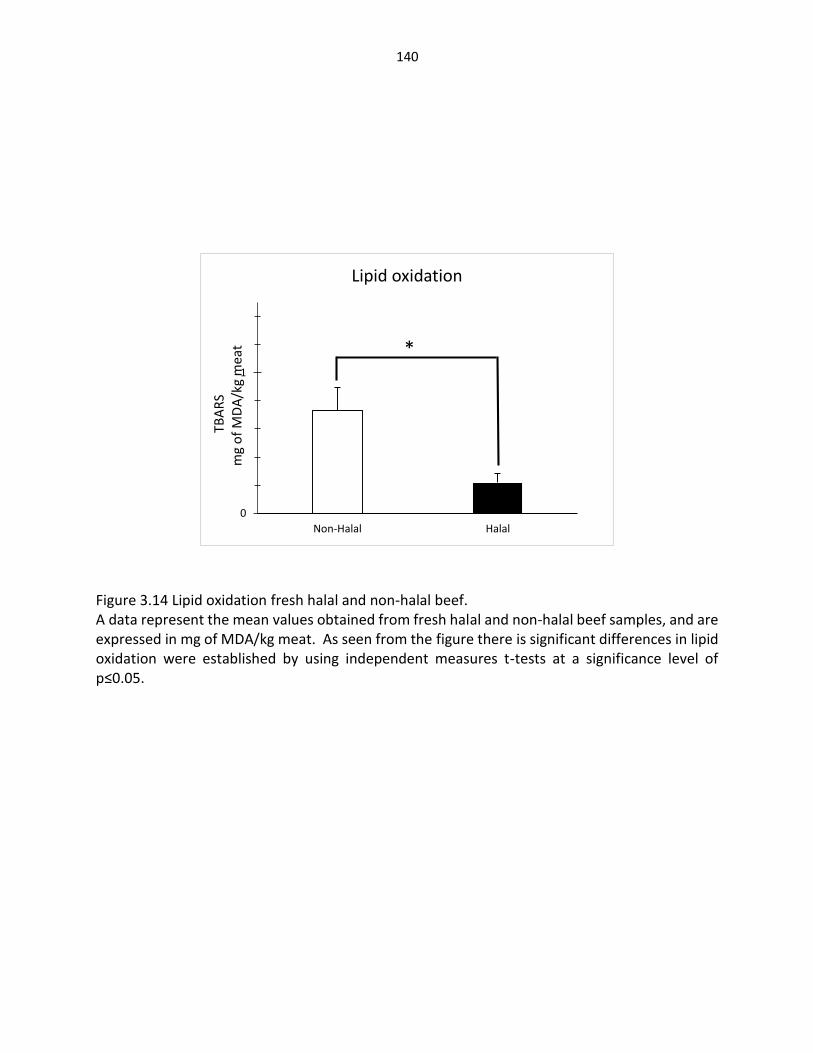
140
Figure 3.14 Lipid oxidation fresh halal and non-halal beef. A data represent the mean values obtained from fresh halal and non-halal beef samples, and are expressed in mg of MDA/kg meat. As seen from the figure there is significant differences in lipid oxidation were established by using independent measures t-tests at a significance level of p≤0.05.
0
1
Non-Halal Halal
Lipid oxidation
TBA
RS
mg
of
MD
A/k
g m
eat *
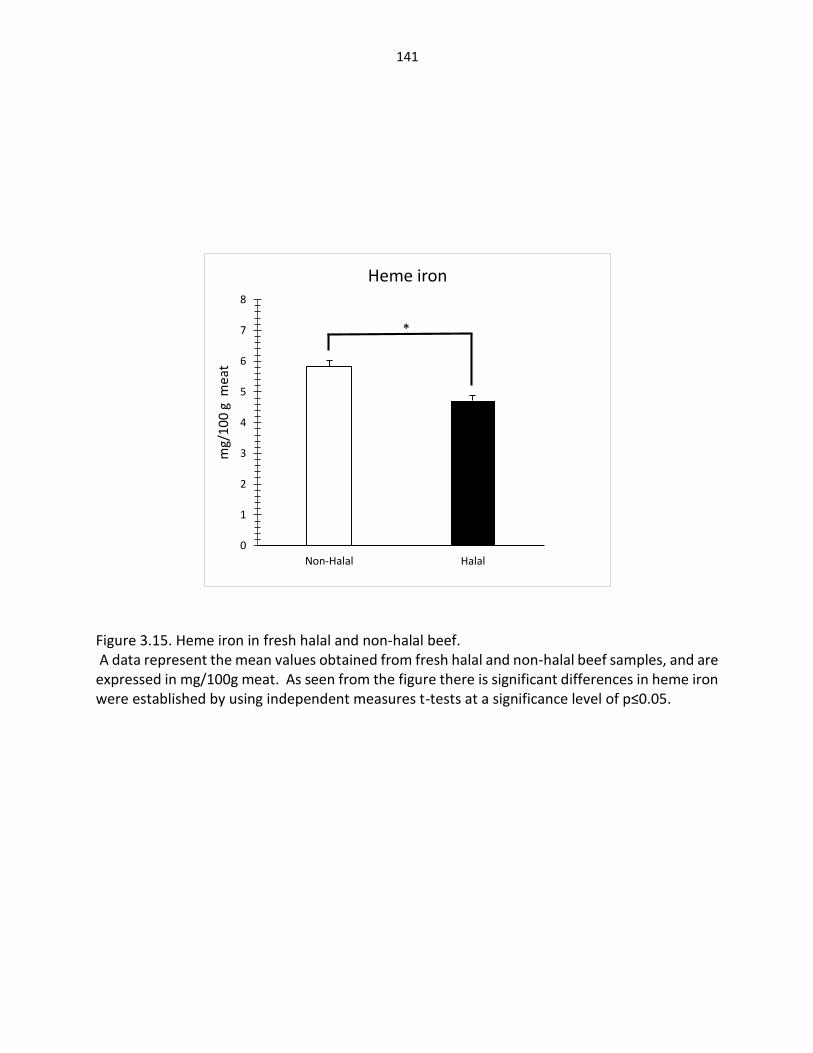
141
Figure 3.15. Heme iron in fresh halal and non-halal beef. A data represent the mean values obtained from fresh halal and non-halal beef samples, and are expressed in mg/100g meat. As seen from the figure there is significant differences in heme iron were established by using independent measures t-tests at a significance level of p≤0.05.
0
1
2
3
4
5
6
7
8
Non-Halal Halal
Heme iron
*
mg/
10
0 g
mea
t
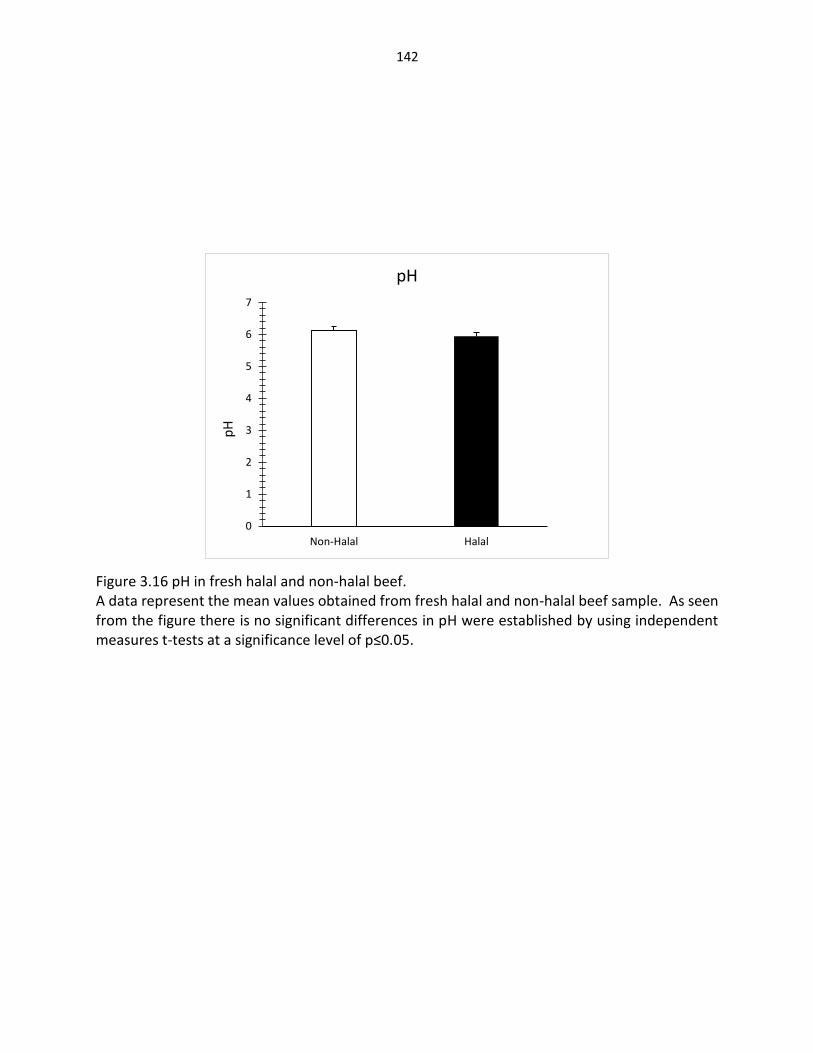
142
Figure 3.16 pH in fresh halal and non-halal beef. A data represent the mean values obtained from fresh halal and non-halal beef sample. As seen from the figure there is no significant differences in pH were established by using independent measures t-tests at a significance level of p≤0.05.
0
1
2
3
4
5
6
7
Non-Halal Halal
pH
pH

143
Figure 3.17 Thaw loss in fresh halal and non-halal beef. A data represent the mean values obtained from fresh halal and non-halal beef samples, and are expressed in thaw loss%. As seen from the figure there is no significant differences in lipid oxidation were established by using independent measures t-tests at a significance level of p≤0.05.
0
1
2
3
Non-Halal Halal
Thaw Loss
Thaw
Lo
ss %
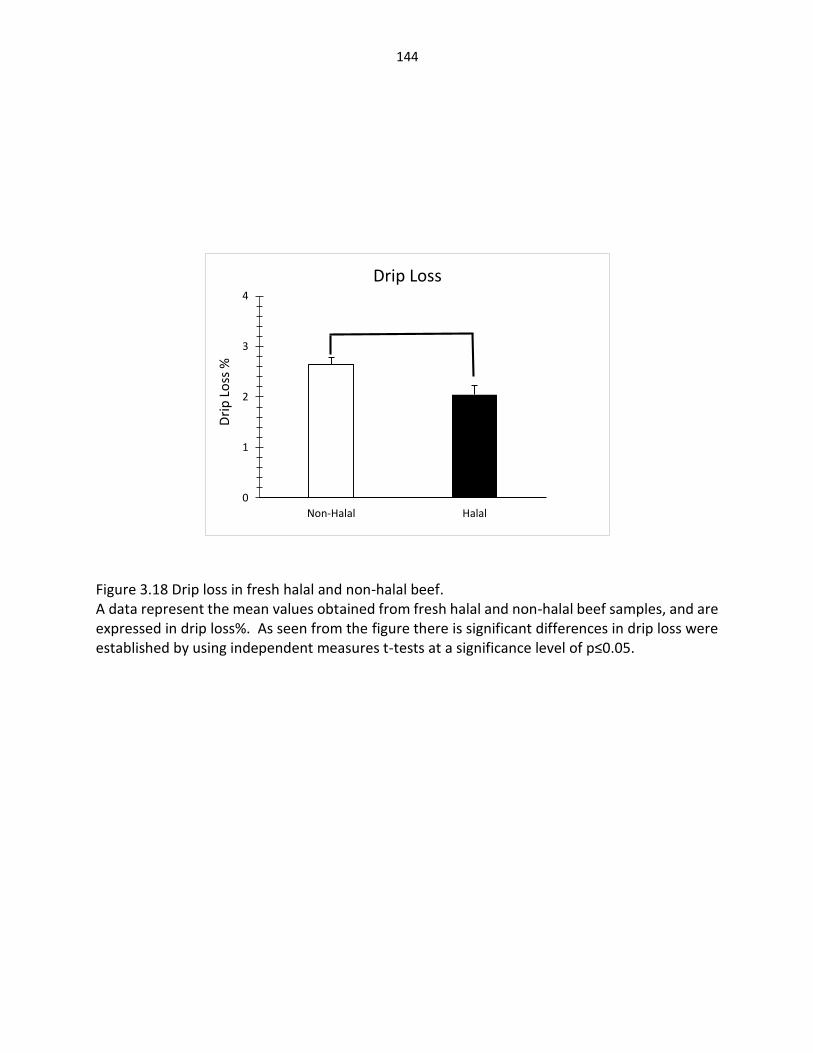
144
Figure 3.18 Drip loss in fresh halal and non-halal beef. A data represent the mean values obtained from fresh halal and non-halal beef samples, and are expressed in drip loss%. As seen from the figure there is significant differences in drip loss were established by using independent measures t-tests at a significance level of p≤0.05.
0
1
2
3
4
Non-Halal Halal
Drip Loss
Dri
p L
oss
%
145
Results and discussion
1. Bacterial content in fresh halal and non-halal beef
a) Aerobic plate count
Aerobic plate counts are a widely accepted measure of the general degree of microbial
contamination and the hygienic conditions of processing plants (DAAHP).The aerobic plate count
in fresh halal and non-halal beef were shown in (Fig. 3.4). Fresh halal beef that was produced
without stunning resulted in significantly lower (P < 0.05) aerobic plate count than non-halal beef.
Comparatively, the aerobic plate count in halal and non-halal beef were 3.59, 4.19 respectively.
The lower microbial content in the halal beef could be attributed to the high blood loss because
of method of slaughter. Many researchers reported a correlation between meat quality and
blood. The more blood retained, the poorer the meat quality (Gregory, 2008; Strappini et al,
2009). The high nutritive value of blood and suitable temperature, pH, water activity and relative
humidity influence the degree of deterioration in meat (Lerner, 2009). De Oliveira Roca (2002)
showed that bleeding should be efficient to guarantee meat quality. In turn, this reduces the risk
of carcass contamination with blood, which serves as a perfect medium for bacteria growth
(RMAA, 2011). The level of aerobic plate count in halal and non-halal beef at week 0 was
acceptable as indicated by (Insausti et al. 2001) and (Jeremiah, 2001), that spoilage occurs when
the level of total viable count reach 7–8 log Cfu/g. These findings are in agreement with the
findings of (Addeen et al, 2014) and (Mustafa et al, 2014) in chicken who found that aerobic plate
count of broiler chicken was significantly higher in non-halal than halal meat.
In general, aerobic plat count in halal and non-halal beef was consistent with the results
obtained by (Hinton et al, 1998) in England, (McEvoya et al, 2004) and (Gill et al, 1998)where they
146
found the mean of APC in beef ranged from log 2·45 to 4·29, log 2.8 – 4.30and log0.9- 4.9 Cfu
cm(2) respectively. And slightly higher than (Vanderlinde et al, 1998) in Australia where they
found the mean of the APC was log 3.13 CFU/cm2.
b) Psychrotrophic bacteria
Psychrotrophic bacteria have ability to grow at low temperatures but have optimal and
maximal growth temperatures above 15 and 20 °C, respectively (Moyer and Morita, 2007).
Bacteria developing on meat at chill temperatures are regarded as psychrotrophic. Some
psychrotrophic bacteria are gram-postive, such as lactic acid bacteria, and the other are gram-
negative bacteria, such as pseudomonas and Enterobacteriaceae (Gill and Newton, 1978).
Species of pseudomonas are especially responsible for the spoilage of meat stored at chill
temperatures (Jay et al, 2003). In this study, we compared between account of psychrotrophic
bacteria in fresh halal and non-halal beef as shown in (Fig. 3.5). Fresh halal beef that was
produced without stunning resulted in significantly lower (P < 0.05) psychrotrophic bacteria than
non-halal beef. The count of Psychrotrophic in fresh halal and non-halal beef were log 3.4, log
4.07 respectively. The development of organoleptic spoilage is related to microbial consumption
of meat nutrients, such as sugars and free amino acids and the release of undesired volatile
metabolites (Ercolini et al, 2009). In chill-stored meat these activities may be performed at low
temperatures by psychrotrophic bacteria, compromising the sole effect of temperature as
affecting preservation. This characteristic makes these microbes especially significant with
regard to meat spoilage and safety, given that the storage of meat at cold temperatures is a
routine practice during production, transportation, processing and post-purchase (Beales, 2004),
(Russel, 2002).
147
c) Pseudomonas
Pseudomonas species were the dominant bacteria group on normal and high pH beef
(Erichsen and Molin, 1981) as well as in some cases, Pseudomonas can constitute up to 96% of
the population (Asensio et al, 1988). (Fig. 3.6) shows the count of pseudomonas bacteria in fresh
halal and non-halal beef. Fresh halal beef that was produced without stunning resulted in
significantly lower (P < 0.05) pseudomonas bacteria than non-halal beef. The count of
pseudomonas in fresh halal and non-halal beef were log 3.27, log 3.79 respectively. This may be
due to ability of pseudomonas bacteria to use glucose in the blood as substrate for microbial
growth (Warriss, 2001). Studies have shown that halal slaughter without stunning resulted in
significantly higher blood loss than non- halal slaughter with stunning ( Nakyinsige et al, 2014).
In general, pseudomonas bacteria count in beef that produced in both slaughters are in line with
the report of (Nel et al,2004) which indicated that count of pseudomonas in beef from the
deboning room was log 4.0 Cfu/g and (Goulas et al ,2005) which reported that Pseudomonas in
beef was Log 3.5 Cfu/g.
d) Staphylococcus aureus
Staphylococcus aureus produces a heat-stable toxin in foods and causes staphylococcal
food poisoning (SFP) by ingesting food that contains staphylococcal enterotoxin. Staphylococcal
food poisoning (SFP) is responsible for a third of the foodborne diseases worldwide (Normanno,
et al., 2007). The effect of slaughter methods on prevalence of S. aureus bacteria in beef were
shown in (Fig. 3.7). The count of S. aureus bacteria in halal and non-halal beef were log 2.81, log
2.79 respectively. There were no significant differences for S. aureus between fresh halal and
non-halal beef. S. aureus bacteria count in beef that produced in both slaughters in this study
148
were less than the results that obtained by (Nela et al, 2004) which indicated that count of S.
aureus in beef from the deboning room was log 3.7 Cfu/g and higher than the results that
obtained by (Goulas et al, 2005) which reported that S. aureus in beef trimmings at United States
and Canada was log 1.0 Cfu/g.
e) Lactic acid bacteria
Lactic acid bacteria are produced lactic acid for of glucose fermentation and some species
have significant role in the spoilage of refrigerated raw meat (Labadie 1999). The spoilage
characteristics are slime formation, discolorations, sour flavor and off odor, (Schillinger &
Holzapfel 2006). Halal meat samples had significantly higher lactic acid bacteria count than non-
Halal meat (P < 0.05) as shown in (Fig.3.8). Lactic acid bacteria count in fresh halal and non-halal
beef were log 3.53, log 2.59 respectively. Lactic acid bacteria count in beef that produced in both
slaughters in this study were higher than the results that obtained by (Goulas et al, 2005) which
indicated that count of lactic acid bacteria in beef was log 2.2 Cfu/g, and less than the results that
obtained by (Katikou et al. (2005), Serdengecti et al, 2006) where they reported that count of
lactic acid bacteria of beef samples varied from log 4.72 to log 5.63 Cfu/cm2 with average of log
5.19. However, the levels of lactic acid bacteria for fresh beef samples in both slaughters were
acceptable as indicated by (Nortjé and Shaw, 1989), that spoilage occurs when the lactic acid
bacteria count reaches log 7 Cfu/g.
f) Enterobacteriaceae
Enterobacteriaceae bacteria are used glucose as substrate for growth and produce
some deleterious compound (Gill, 1986); Lambert et al., 1991). Some species such as H. alvei and
S. liquefaciens produce malodorous diamines as well as they cause a green discoloration when

149
they grow in meat (Stanbridge & Davies, 1998).The Enterobacteriaceae count in fresh halal and
non-halal beef were shown in fig. 3.9. Fresh halal beef that was produced without stunning
resulted in significantly lower (P < 0.05) Enterobacteriaceae than non-halal beef. Comparatively,
the Enterobacteriaceae in halal and non-halal beef were log 3.03, log3.68 respectively. This may
be attributed to ability of Enterobacteriaceae bacteria to use glucose in the blood as substrate
for microbial growth (Warriss, 2001). Studies have shown that halal slaughter without stunning
resulted in significantly higher residual blood loss than non halal slaughter with stunning (K.
Nakyinsige et al., 2014). The levels of Enterobacteriaceae for fresh beef samples in both
slaughters were acceptable as indicated by Insausti et al. (2001) and Jeremiah (2001), that
spoilage occurs when the levels of Enterobacteriaceae count reach 7–8 log Cfu/g.
Enterobacteriacea count in beef that produced in both slaughters in this study within the range
that obtained by (McEvoya et al,2004 who found that Enterobacteriaceae counts on beef
carcasses after different stages of processing ranged ( log 1.48-4.25 ), however, less than those
that obtained by (Nel et al,2004) who reported that count of Enterobacteriaceae in meat from
the deboning room was Log 5.6.
g) E. coli
The effect of slaughter methods on prevalence of E. coli bacteria in beef was
shown in (Fig 3.10). The count of E. coli bacteria in halal and non-halal beef were log 2.81,
log 2.79 respectively. There were no significant differences for E. coli between fresh halal
and non-halal beef. This could be due to apply the same procedures to control these
bacteria during handling the meat as well as following the hygiene practice by workers.
E. coli bacteria count in beef that produced in both slaughters in this study were less than

150
the results that obtained by (Nela et al, 2004) which indicated that count of E. coli in beef
from the deboning room was log 3.6 Cfu/g and higher than the results that obtained by
(Scanga et al,2000) which reported that E. coli in beef trimmings at United States and
Canada was log 1.2 Cfu/g, and within the range that obtained by (Eisel et al, 1997) who
found that E. coli counts on beef carcasses after different stages of processing ranged log
1.0 - 3.21 Cfu/g
h) Total coliform
Total coliform in fresh halal and non-halal beef were shown in (Fig.3.11). Fresh halal beef
that was produced without stunning resulted in significantly lower (P < 0.05) coliform than non-
halal beef. Comparatively, the coliform in halal and non-halal beef were log 2.7, log 3.38
respectively. These findings are in agreement with the findings of (Mustafa et al, 2014) in chicken
who found that coliform count of broiler chicken was significantly higher in non-halal than halal
meat. Coliform count in beef that produced in this study were higher than the results that
obtained by (Stopforth et al, 2006) which indicated that count of coliform bacteria in beef was
ranged from log 1.1 to 1.8 Cfu/g, and within range that obtained by (McEvoya et al, 2004) which
reported that total coliform count from sites on beef carcasses after different stages of
processing were ranged from log 1.81-4.93.
i) Fecal coliform
In this study also we evaluated the effect of slaughter method on prevalence of fecal
coliform in beef. (Fig. 3.12) shows the count of fecal coliform bacteria in fresh halal and non-
halal beef. Fecal coliform in halal and non-halal beef were log 2.01, log 2.88 respectively. There
were no significant differences for fecal coliform between fresh halal and non-halal beef. This
151
could be due to apply the same procedures to control these bacteria during handling the meat
as well as following the hygiene practice by workers.
j) Yeast and mold
The effect of slaughter methods on prevalence of yeast and mold in beef was shown in
(Fig. 3.13). The count of yeast and mold in halal and non-halal beef were log 2.87, log 2.92
respectively. There were no significant differences for yeast and mold between fresh halal and
non-halal beef. This could be due to apply the same procedures in environment of slaughter such
as ventilation where spores of yeast and mold can be spread through the air.
K) L. monocytogenes and Salmonella
The results of present study indicated that we did not detect salmonella and L.
monocytogenes bacteria in halal and non-halal beef samples. Paul et al, 1998 reported that a
small percentage (0.59%) of Australian beef carcasses were found positive for L. monocytogenes,
0.22% were positive for Salmonella spp.
2. Physiochemical analyses
a) Lipid oxidation
Lipid oxidation is one of the major causes of quality deterioration in raw and cooked meat
products during refrigeration and storage (Raharjo and Sofos, 1993). Lipid oxidation is
measured as malondialdehyde which is formed by oxidation of polyunsaturated fatty acids
with two or more double bonds. MDA-induced DNA damage is mutagenic in bacterial,
mammalian, and human cells (Nadia et al, 2011). The effect of slaughter methods on lipid
oxidation in beef was shown in (Fig. 3.14). The lipid oxidation in halal and non-halal beef
were 0.73, 0.22 mg/MDA respectively. There were significant differences for lipid oxidation
152
between fresh halal and non-halal beef. This could be due to halal slaughter without stunning
resulted in significant lower residual hemoglobin than non-halal slaughter with stunning
(Nakyinsige et al, 2014); (Griffiths et al, 1985). Residual blood left in the carcass because of
improper bleeding may decrease the shelf life and hence the quality of the meat product
because hemoglobin which is an important component of blood is a powerful promoter of
lipid oxidation (Alvarado et al., 2007). Blood also contains a large number of white blood cells
that produce hydroxyl radicals, superoxides, and hydrogen peroxide that enhance lipid
oxidation (Gabig & Babior, 1981). These values were consistent with the results for heme
iron in this study where were (4.72), (5.82) mg for halal and non-halal beef respectively.
Transition metal ions, primarily Fe serve as key catalysts for lipid oxidation in muscle (Kanner,
1994).
b) Heme iron
Heme iron content in fresh halal and non-halal beef were shown in Figure (3.15). Fresh
halal beef that was produced without stunning resulted in significantly lower (P < 0.05) heme iron
than non-halal beef. Comparatively, heme iron in halal and non-halal beef were (4.72), (5.82)
respectively. This could be due to halal slaughter without stunning resulted in significant lower
residual hemoglobin than non-halal slaughter with stunning (Nakyinsige et al, 2014); (Griffiths et
al, 1985). These values were consistent with the results for lipid oxidation and some of
microbiological analyses such as aerobic plate count, psychrotrophic bacteria, pseudomonas,
lactic acid bacteria , coliform and Enterobacteriaceae. Hemoglobin which is an important
component of blood is a powerful promoter of lipid oxidation and growth of microorganisms
(Alvarado et al, 2007).

153
Red meat and processed meat intake is associated with a risk of colorectal cancer, a major
cause of death in affluent countries. Epidemiological and experimental evidence supports the
hypothesis that heme iron present in meat promotes colorectal cancer. This meta-analysis of
prospective cohort studies of colon cancer reporting heme intake included 566,607 individuals
and 4,734 cases of colon cancer (Nadia et al, 2011). Therefore, halal slaughter could lower heme
iron and hence improve the quality of meat and avoid health problems such as colorectal cancer.
c) PH
The effect of slaughter methods on pH in beef were shown in (Fig. 3.16). The pH of halal
and non-halal beef were 5.94 and 6.12 respectively. There were no significant differences for pH
between fresh halal and non-halal beef. This could be due to use same treatment with animals
before slaughtering.
d) Thaw loss
The effect of slaughter methods on thaw loss in beef was shown in (Fig. 3.17). The thaw
loss in halal and non-halal beef were (1.06), (1.14) respectively. There were no significant
differences for thaw loss between fresh halal and non-halal beef.
e) Drip loss
Drip loss in fresh halal and non-halal beef were shown in (Fig. 3.18). Fresh halal beef that
was produced without stunning resulted in significantly lower (P < 0.05) drip loss than non-halal
beef. Comparatively, the drip loss in halal and non-halal beef was (0.22), (0.73) respectively.
These findings are in agreement with the findings of (D’Agata et al, 2010) who found that meat
from beef slaughtered by conventional method (non-halal) showed significantly higher drip loss
than those from halal method.
154
REFERENCES
Addeen, A., Benjakul, S., Wattanachant, S., Maqsood, S. 2014.Effect of Islamic
slaughtering on chemical compositions and post-mortem quality changes of broiler
chicken meat. International Food Research Journal 21(3): 897-907
Ahn, D.W., Wolf, F.H., Sim, J.S., Kim, D.H. (1992) Packaging cooked turkey meat patties
while hot reduces lipid oxidation. J Food Sci Publ Inst Food Technol 57: 1075-1077.
Alvarado, C.M., Richards, S. O'Keefe, H. Wang 2007.The effect of blood removal on
oxidation and shelf life of broiler breast meat.Poultryscience,86(1) (2007),pp.156-161.
APHA; American Public Health Association (1992): Compendium of Methods for the
Microbiological Examination of Foods, 3rd ed. APHA, Washington, DC, USA.
Asensio, M.A., Ordóñez, J. A., Sanz, B. 1988. Effect of carbon dioxide and oxygen enriched
atmospheres on the shelf-life of refrigerated pork packed in plastic bagsJ. Food Protect.,
51 (1988), pp. 356-360
Bailey, J.S., Reagan, J.O., Carpenter, J.A. and Schuler, G.A. (1979a). Microbiological
condition of broilers as influenced by vacuum and carbon dioxide in bulk shipping packs.
Journal of Food Science. 44: 134-136
Baylis, C. L. (2006). Enterobacteriaceae. In Food spoilage microorganisms, pp. 213-286.
Edited by C. de W. Blackburn. Cambridge: Woodhead Publishing Limited, Abington Hall,
Abington
Beales, N. (2004) Adaptation of microorganisms to cold temperatures, weak acid
preservatives, low pH, and osmotic stress: a review. Compr Rev Food Sci F 3:1–20.

155
Buckley, D.J, Gray, J.I., Ashgar, A., Price, J.F., Crackel, R.L. (1989) (Effects of dietary
antioxidants and oxidized oil on membral lipid stability and pork product quality. J Food
Sci 2 Publ Inst Food Technol 54: 1193-1197.
Calderwood,S.B., Acheson, D.W.K., Keusch, G.T., Barrett,T.J.,Griffin,P.M., Strockbine,N.A.,
Swaminathan,B., Kaper,J.B., Levine,M.M., Kaplan,B., Karch,H., OBrien, A.D.,Ohrig,T.G.,
Carolina, V., Daniel, L., Manuel, O., María, M., Fernando, P. 200. Total Iron and Heme Iron
Content and their Distribution in Beef Meat and Viscera. Biol Trace Elem Res (2009)
132:103–111.
Carrasco, E., Morales-Rueda, A., García-Gimeno, R. M. (2012). Crosscontamination and
recontamination by Salmonella in foods: A review. Food Research International, 45(2),
545-556. doi: 10.1016/j.foodres.2011.11.004
Cheng, J.H., Ockerman, H.W.2004. Effect of ascorbic acid with tumbling on lipid oxidation
of precooked roast beef.J.Muscle Food.15:83-93.
Dainty, R. H., Shaw, B. G., de Boer, K. A., Scheps, E. S. J. (1975). Protein changes caused by
bacterial growth on beef. J Appl Bacteriol 39, 73-81.
D’Agata, M., Russo, C., Preziuso, G. 2010. Effect of Islamic ritual slaughter on beef quality.
Italian Journal Animal.Sci. vol. 8 (Suppl. 2), 489-491.
De Oliveira Roca, 2002. Humane slaughter of bovine. Embrapa: First virtual global
conference on organic beef–cattle production. (2002) (September, 02 to October 15,
2002)
Department of Agriculture, Animal Health and Product. 2004. Animal and animal origin
foods. No. 624-04. Off. Bull. 5214:727–745.

156
Eisel W. G., Linton R. H., Muriana P. M.: A survey of microbial levels for incoming raw beef,
environmental sources, and ground beef in a red meat processing plant. Food Microbiol.
1997, 14, 273-282.
Eliasi, J.R., Dwyer, J.T., 2002. Kosher and halal: religious observances affecting dietary
intakes. J. Am. Diet. Assoc. 101:911–913.
Ercolini D., Russo, F., Nasi, A., Ferranti, P., and Villani, F., 2009. Mesophilic and
psychrotrophic bacteria from meat and their spoilage potential in vitro and in beef.
Erichsen, I., Molin, G.1981. Microbial flora of normal and high pH beef stored at 4 °C in
different gas environmentsJ. Food Prot., 44 (1981), pp. 866-869
Gabig and Babior.1981.The killing of pathogens by phagocytes.Annual Review of
Medicine, 32 (1) (1981), pp. 313–326.
Garcia-Lopez, M. L., Prieto, M., Otero, A. (1998). The physiological attributes of
Gramnegative bacteria associated with spoilage of meat and meat products. In The
Microbiology of Meat and Poultry, pp. 1-34. Edited by A. Davies, R., Board. London:
Blackie Academic and Professional
Gardner, G.A., A.W. Carson, A.W., Patton, J. 1967. Bacteriology of prepackaged pork with
reference to the gas composition within the pack. J. Appl. Bacteriol.
Gill,C.O. Newton, K.G. 1978.The ecology of bacterial spoilage of fresh meat at chill
temperatures.Meat Science, 14 (1978), pp. 43–60
Gill, C.O., Newton, K.G. 1978.The ecology of bacterial spoilage of fresh meat at chill
temperatures. Meat Science, 14 (1978), pp. 43–60
157
Gill, C. O. (1986). The control of microbial spoilage in fresh meats. In Advances in Meat
Research, Meat and Poultry Microbiology, pp. 49-88. Edited by A. M. Pearson, T. R.
Dutson, Westport: AVI Publishing Company Inc.
Gill, C. O. (1998). Microbiological contamination of meat during slaughter and butchering
of cattle, sheep and pigs. In The microbiology of meat and poultry, pp. 118-157. Edited by
A. Davies, R. Board, London: Blackie academic and professional.
Goulas, A.E. Chouliara, I. Nessi, E. Kontominas.M.G. Savvaidis, I.N. 2005. Microbiological,
biochemical and sensory assessment of mussels (Mytilus galloprovincialis) stored under
modified atmosphere packaging.Journal of Applied Microbiology, 98 (2005), pp. 752-760
Grandin, T., Regenstein, J.M., 1994. Religious slaughter and animal welfare: a discussion
for meat scientists.Meat Focus International. CAB Intern., Wallingford, Oxon, UK, pp 115-
123.
Gregory, N. G. (2008). Animal welfare at markets and during transport and slaughter.
Meat Science, 80(1), 2–11.
Griffiths, GL., McGrath. M., Softly, A., jones, C. 1985 Blood content of breiler chicken
carcases prepared by different slaughtermethods. The VeterinaryRecord II 7: 382-385
Hallberg, L. 1981. Bioavailability of dietary iron in man. Ann. Rev. Nutr. 1:123
Hafiz, A., Hassan, Z., Abdul Manap, M. 2015. Effect of Slaughtering Methods on Meat
Quality Indicators, Chemical Changes and Microbiological Quality of Broiler Chicken Meat
during Refrigerated Storage. Journal of Agriculture and Veterinary Science: pp12-17.

158
Hinton, M.H., Hudson, W.r., Mead, G.C. 1998.The bacteriological quality of British beef 1.
Carcasses sampled prior to chilling. Meat science.Vol.50, Issue2, October 1998, Pages
265-271.
Hitchins, A.D., Feng, P., Watkins, W.D., Rippey, S.R., Chandler, L.A.1998. E.coli and the
coliform bacteria in : FDA bacterio-logical Analytical Manual,eighth ed.,Revision A.AOAC
International,Gaithersburg,MD,pp.4.01-4.29
Holzapfel, G. 1998.The Gram-positive bacteria associated with meat and meat products.
The Microbiology of Meat and Poultry, Blackie Academic and Professional, London (1998),
pp. 35–84.
Ingold, K. V. (1962). Metal catalysis. In Symposium on Foods: Lipids and their Oxidation.
Ed. H. W. Schultz, E. A. Day & R. O. Sinnhuber. AVI, Westport, CT, p. 93.
Insausti, K,.Breiain,M.J.,Purroy,A.,Alberti,P.,Gorraiz,C.,Alzueta,M.J.,Shelf life of beef from
local Spanish cattle breeds stored under modified atmosphere.Meat sci.2001;57:273-281
Jay, J. M., Vilai, J.P., Hughes, M.E. 2003. Profile and activity of the bacterial biota of ground
beef held from freshness to spoilage at 5-7°C. Int. J. Food Microbiol. 81:105-111
Jeremiah, L.E. 2001. Packaging alternatives to deliver fresh meats using short- or long-
term distribution. Food Res Int. 2001; 34:749–772.
Kanner, J. (1994). Oxidative processes in meat & meat products: Quality implications.
Meat Science, 36(1), 169–189.
Katikou, P., Ambrosiadis, I., Georgantelis, D., Koidis, P., Georgakis, S.A. (2005). Effect of
Lactobacillus-protective cultures with bacteriocinlike inhibitory substances’ producing
159
ability on microbiological, chemical and sensory changes during storage of refrigerated
vacuum-packaged sliced beef. J. Appl. Microbiol., 99, 1303-1313.
Kurechi, T., Kikugawa, K., Ozawa, M. (1980). Effect of malondialdehyde on nitrosamine
formation. Food Cosmet Toxicol 18: 119-122. 6. Pearson AM, Gray JI, Wolzak AM,
Horenstein NA (1983) Safety
Labadie, J., 1999. Consequences of packaging on bacterial growth. Meat is an ecological
niche. Meat Sci. 52, 299-305.
Lambert,A.D., Smith,J.P., Dodds,K.L.1991.Shelf life extension and microbiological safety
of fresh meat - a review.Food Microbiology, 8 (1991), pp. 267–297
Lerner, P.T. 2009. Evaluation of haemoglobin and myoglobin in Poultry slaughtered by
stunning and kosher slaughter. Folia Vet. 2009; 53:25–27.
Liao, C. H. (2006). 19-Pseudomonas and related genera. In C.d. W. Blackburn (Ed.), Food
spoilage microorganisms (pp. 507e540). Woodhead Publishing.
McEvoy, J.M., Sheridan, J.J., Blair, I.S., McDowell, D.A., 2004. Microbiol contamination of
beef carcasses in relation to hygiene assessment based on criteria used in EU Decision
2001/47/EC. Int. J. Food Microbiol.
Min, D.B. (1998) Food Lipid. A course note. Food Science & Technology, Ohio State
University, Columbus, OH, p: 57-71.Gill and Newton, 1978
Mohan, A.Hunt, M.C.Barstow, T.J.Houser, T.A. Bopp,C. Hueber,D.M. Effects of fibre
orientation, myoglobin redox form, and postmortem storage on NIR tissue oximeter
measurements of beef longissimus muscle. Meat Sci. 87(11), 3751–3763 (2009)

160
Molla, B., Alemayehu, D., Salah, W. 2003. Sources and distribution of Salmonella
serotypes isolated from food animals, slaughterhouse personnel and retail meat products
in Ethiopia: 1997-2002. Ethiopian Journal of Health Development 17: 63-70.
Moyer, C.L., Morita, R.Y. (2007) Psychrophiles and psychrotrophs. In: Morita RY (ed.)
Encyclopedia of Life Sciences. John Wiley & Sons Ltd, Chichester.pp1–6.
Mustafa, I.S.M., Abdelgadir, M.A., Sulieman, A.E.2014. Impact of Halal and Non-halal
Slaughtering on the Microbiological Characteristics of Broiler Chicken Meat and Sausages.
Food and Public Health 2014, 4(5): 223-228.
Nadia, M., Bastide, F. H., Pierre, F., Denis, E.C.2011.Heme Iron from Meat and Risk of
Colorectal Cancer: A Meta-analysis and a Review of the Mechanisms Involved.Cancer
prevention research. 4(2).2011.
Nakyinsige, K., Fatimah, A.B., Aghwan, Z.A., Zulkifli,I., Goh, Y.M., Sazili, A.Q. 2014. Bleeding
Efficiency and Meat Oxidative Stability and Microbiological Quality of New Zealand White
Rabbits Subjected to Halal Slaughter without Stunning and Gas Stun-killing. Asian-
Australas J Anim Sci.; 27 (3):406-13.
Naveena, B. M., Mendiratta, S.K. 2001.Tenderization of spent hen meat using ginger
extract. British Poultry Science, 42, 344–350.
Nel,S., Lues, J.F.R., Buys, E.M., P Venter,P. 2004.Bacterial populations associated with
meat from the deboning room of a high throughput red meat abattoir.Meat science
vol.66.Issue 3.pages 667-674
Normanno,G.,Corrente,M.,Salandra,G., Dambrosio,A., Parisi,A., Greco,G., Bellacicco,A.L., Celan
o,G.V.2007. Methicillin-resistant Staphylococcus aureus (MRSA) in foods of animal origin product

161
in Italy of food .International journal of food microbiology.Volume 117.Issue 2, 30 June, pages
219-222
Nortje, G.L., Shaw, B.G. 1989. The effect of ageing treatment on the microbiology and
storage characteristics of beef in modified atmosphere packs containing 25% CO2 plus
75% O2. Meat Science, 25 (1) (1989), pp. 43–58
Raharjo, S., Sofos, J. N.1993.Methodology for measuring malonaldehyde as a product of
lipid peroxidation in muscle tissues: a review. Meat Sci. 1993, 35, 145-169.
Red Meat Abattoir Association (RMAA), 2011. Animal handling practical guidelines for
abattoirs.
http://www.rmaa.co.za/2011/conference/AnimalHandlingSPCAforCongress201105.05.2
011 (2011) (Accessed 25 April 2015)
Riaz, M.N., Chaudry, M.M. (2004). Halal food production. Boca Raton, Florida: CRC Press.
Rodriguez, P., Velarde, A., Dalmau, A., Llonch, P. (2012). Assessment of unconsciousness
during slaughter without stunning in lambs. Animal Welfare, 21(S2), 75–80.
Russell, N.J. (2002) Bacterial membranes: the effects of chill storage and food processing.
An overview. Int J Food Microbiol 79:27–34.
Samelis, J. (2006). Managing microbial spoilage in meat industry. In Food spoilage
microorganisms, pp. 213-286. Edited by C. de W. Blackburn, Cambridge: Woodhead
Publishing Limited
Scanga,J.A., Grona,A.D., Belk,K.E., Sofos,J.N., Bellinger,G.R., G.C Smith,G.C.2000.
Microbiological contamination of raw beef trimmings and ground beef.Meat science
volume 56.Issue 2. October 2000.pages145-152
162
Schillinger, U., Holzapfel, W. H. (2006). Lactic acid bacteria. In Food spoilage
microorganisms, pp. 213-286. Edited by C. de W. Blackburn, Cambridge: Woodhead
Publishing Limited.
Schmedes, A, Holmer, G. A. 1989. New thiobarbituric acid (TBA) method for
determination of free malonaldehyde (MDA) and hydroperoxides selectivity as a measure
of lipid peroxidation. Journal of American Oil Chemistry Society.1989; 66:813–817
Serdengecti, N., Ibrahim, Y., Gokoglu, N. (2006). Effects of sodium lactate, sodium acetate
and sodium diacetate on microbiological quality of vacuum-packed beef during
refrigerated storage. J. Food Saf.2, 62-71. 24. Stiles, M.E. (1996).
Shahidi F (1994) Assessment of lipid oxidation and flavor development in meat and meat
products. In “Flavor of meat and meat products”, Shahidi, F (Eds). Blackie Academic &
Professional, Landon, UK, p: 253.
Stanbridge, L.H., Davies, A.R.1998. The microbiology of chill stored meat. The
microbiology of Meat and Poultry, Blackie Academic and Professional, London
(1998),pp.174-219
Stopforth, J.P.Lopes, M.Shultz, J.E. Samadpour, M.2006. Microbiological status of fresh
beef cuts. J Food Prot 2006 Jun;69(6):1456-9
Strappini, A. C., Metz, J. H. M., Gallo, C. B., Kemp, B. (2009). Origin and assessment of
bruises in beef cattle at slaughter. Animal, 3(05), 728–736.
Takeda, Y., Tarr, P. I.Wachsmuth, I.K. 1996. Proposed new nomenclature for SLT (VT)
familyAmerican Society for Microbiology News, 62 (1996), pp. 118–119
163
Thanonkaew,S.,Benjakul,W.,Visessanguan,E.A.,Decker.The effect of metal ions on lipid
oxidation,colour and physiochemical properties of cuttlefish (Sepia pharaonis) subjected
to multiple freeze-thaw cycles .Food Chemistry,95(2006)pp.591-599
Thomson Reuters & Dinar Standard (2013). State of the global Islamic economy. http://
www.dinarstandard.com/state-global-islamic-economy-report-2013 (accessed, 24/
02/2016).
Vanderlinde, P.B., Murray, J., Shay, B.1998. Microbiological quality of Australian beef
carcass meat and frozen bulk packed beef .Journal of food protection. 61(4):437-43
Warriss, P. W. 2001 Postmortem changes in muscles and its convection into meat. Meat
science, an introductory text, pp. 100 – 161. CABI Publishing, Wallingford, UK
Wheby, M.S., Spyker, D.A. (1981) Hemoglobin iron absorption kinetics in the iron decient
dog. American Journal of Clinical Nutrition 34, 1686 ± 1693.
Young, L.L., Reviere, R. D., Cole. A. B 1988. Fresh red meats: A place to apply modified
atmospheres. Food Technol. 42(9) :6
164
CHAPTER 4: EFFECT OF MEAT PRODUCTION METHOD ON SHELF LIFE OF MEAT DURING REFRIGERATED STORAGE Abstract
Storage of meat is critical because during storage even with proper refrigeration, the
meat ultimately undergoes deteriorative changes including microbial spoilage, oxidative
changes. There are different types of meat based on the method of animal slaughter and
processing. Halal meat is produced without stunning prior to slaughter, resulting in a rapid and
complete bleeding of animals. The aim of this research is to determine the effect of type of
slaughter (halal and non- halal) on microbiological, physiochemical characteristics and shelf life
of beef during storage. Microbiological analyses of beef samples during storage showed that
halal beef had significantly lower (P < 0.05) microbial count than non-halal meat. This includes
APC (aerobic plate count), psychrotrophic bacteria, S. aureus, pseudomonas, lactic acid bacteria,
and Enterobacteriaceae. However, no significance differences were observed for yeast and mold,
E. coli, total coliform and fecal coliform. Physiochemical analyses showed that quality indicators
for meat such as lipid oxidation, drip loss, and heme iron content were significantly lower
(P < 0.05) in halal meat than non-halal meat. However, no significant differences were observed
for thaw loss and pH. Results from this research indicate that slaughter method significantly
affects the meat quality during storage. We show that halal meat processing may be
advantageous in reducing bacterial colonization, increasing the usable shelf life, and improving
the quality of the meat.
Introduction
Storage of meat is critical because it is highly perishable food since it contains sufficient
nutrient needed to support the growth of microorganisms. The growth of spoilage bacteria

165
reduces shelf-life of meat and the annual economic loss from spoilage of fresh meat and meat
products in the United States is estimated at approximately 5 billion dollars (Ray et al. 1992). In
addition, high initial bacterial loads in fresh meat indicate lower standards of slaughter and plant
hygiene. Despite proper refrigeration, meat ultimately undergoes deteriorative changes upon
long-term storage (Urbain and Campbell, 1987). Some of meat spoilage symptoms from growth
of microorganisms to unacceptable levels while the other due to the chemical changes such as
physical damage, lipid oxidation and color change. The different microbial groups that will
potentially contribute to meat spoilage depend on the storage conditions applied and their
competition. The development of such microbial association is reported to significantly affect
the type of spoilage (Agapi et al, 2012). Many researchers reported a correlation between meat
quality and blood. The more blood retained, the poorer the meat quality (Gregory, 2008);
(Strappini et al, 2009). The shelf-life of meat depends on the numbers and types of
microorganisms mainly bacteria, initially present and their subsequent growth as well as residual
blood left in the meat. Decreasing the initial numbers of the bacteria which grow during storage
to form the spoilage flora will extend the time required before they reach numbers sufficient to
cause spoilage (Gill,1996).There are different types of meat based on the method of animal
slaughter and processing. Halal meat is produced without stunning prior to slaughter, resulting
in a rapid and complete bleeding of animals (Eliasi and Dwyer, 2002); (Grandin and Regenstein,
1994). Residual blood left in the carcass as a result of improper bleeding may decrease the shelf
life and hence the quality of the meat product because hemoglobin which is an important
component of blood is a powerful promoter of lipid oxidation and growth of microorganisms
(Alvarado et al, 2007). Studies have shown that halal slaughter results in significantly lower
166
residual hemoglobin than conventional slaughter with stunning (non-halal) (Nakyinsige et al,
2014). Therefore, choosing the proper meat processing may be increasing the usable shelf life
and improve the quality of meat during storage.
This chapter was aimed to determine the effect of meat production method (halal and non-halal)
on shelf life, microbiological and physiochemical quality indicators of beef during refrigerated
storage for three weeks.
Shelf life of meat
Shelf life is the period between packaging of the product and its use that the product
properties remain acceptable to the product user, with shelf life properties being appearance,
texture, flavor, color, and nutritive value (Singh & Singh, 2005).The point of spoilage may be
defined by a certain maximum acceptable bacterial Ievel, or an unacceptable off-odor or
appearance. The shelf-life depends on the numbers and types of microorganisms, mainly
bacteria, initially present and their subsequent growth (Elisabeth et al,1996).The shelf life of fresh
beef is highly depended on many factors such as pH, water activity, microbial contamination
including pathogens, lipid oxidation and color changes which if they controlled, potential shelf
life can be achieved (McMillin, 2008).
Even with proper refrigeration, the meat ultimately undergoes deteriorative changes
including microbial spoilage, oxidative changes in pigments and lipids, and weight loss (Urbain
and Campbell, 1987). The shelf life of fresh meats (non-vacuum) is therefore, approximately 14
days (Huffman, 1974), with only 3-6 days retail life (Bartkowski et al., 1982). The number of
bacteria and the composition of the microflora will determine the shelf-life of the product
(Gustavsson and Borch, 1993). As storage time continues, the number of bacteria increases and

167
the nature of the dominant bacteria is determined by storage temperature. On meat stored at
20°C, Pseudomonas species still dominated the microflora but when the temperature was
increased to 30°C Acinetobacter and Enterobacteriaceae dominated the microflora (Gill and
Newton, 1980). Decreasing the initial numbers of the bacteria which grow during storage to form
the spoilage flora will extend the time required before they reach numbers sufficient to cause
spoilage and, as growth is exponential, that exponential decreases are required for incremental
increases in the storage life (Gill, 1996).The rate of spoilage varies according to the species of
microflora present, the characteristics of the meat, processing methods, product
composition, and the environment in which the meat is stored (Ellis et al., 2002); (Nychas et al.,
2008).Most spoilage bacteria found in meat are saprophytic Gram-negative and include aerobic
and facultative anaerobic psychrotrophic strains (Pseudomonas and related genera), while Gram-
positive (LAB, Micrococcus) can also be found in high numbers (Samelis, 2006). However, few
species dominated spoilage.
Spoilage of meat
Food spoilage usually refers to the deterioration of quality in food products due to the
growth of contaminating microorganisms, although non-microbial activity, such as the activity of
endogenous enzymes, can also contribute to food spoilage. The main defects of spoilage are
sensory changes, such as off-odors and off-flavors, slime production, texture change,
discoloration and gas production. Food spoilage processes determine the shelf life of food
products, as the products can only be stored until a maximum unacceptable level of off-odor/off-
flavors develop (Borch et al., 1996).

168
The spoilage process is complicated as it involves many bacteria species and during the
development of a microbial population there is a succession process occurring (Ingram, 1962).
Deteriorative changes during meat storage are affected by metabolic reactions from biological
membrane disruption (Stanley, 1991) and biochemical oxidative processes (Xiong & Decker,
1995). Deterioration of quality may include discoloration, off-flavor and off-odor development,
nutrient loss, texture changes, pathogenicity, and progression of spoilage factors (Skibsted et al.,
1994). Despite the heterogeneity of the initial contaminating microbial flora, aerobic refrigerated
meat storage selects Pseudomonas spp., particularly P. fluorescens, P. putida and P. fragi, as the
dominant spoilage flora in proteinaceous raw foods (Ternstrom et al., 1993). Pseudomonas fragi
is recognized as one of the principal agents of meat spoilage (Labadie, 1999) and very frequently
isolated from fresh and spoiled meat products (Ercolini et al., 2007); (Ercolini et al., 2009).
Holzapfel, 1998, reported that a shift of the microbial populations has been observed under
different storage temperatures. Psychrotrophic bacteria which belong to microbial genera of
both Gram positive, such as LAB, and Gram negative bacteria, such as Pseudomonas spp.
and Enterobacteriaceae could be developing in meat at chill temperatures. It is generally agreed
that spoilage defects in meat become evident when the surface spoilage bacteria reach
approximately 7 log CFU/cm2 (Ingram and Simonsen, 1980); (ICMSF, 1998). Off-odors are first
detected during aerobic spoilage when populations reach approximately7 log CFU/cm2 and
muscle tissue surface becomes sticky at 8 log CFU/cm2 which is indicative of early slime
formation (Ingram and Dainty, 1971).
Spoilage of chilled fresh meats can also be caused by breakdown of proteins during
bacterial growth. Psychrotrophic Pseudomonas spp. cause protein degradation (Young et al.,

169
1988), and evolution of ammonia by de-amination of amino acids under aerobic conditions
(Gardner, 1985). Certain Enterobacteriaceae are also capable of decarboxylating amino acids
and produce putrid odors (Gill and Harrison, 1988). Discoloration of meat can also be due to the
growth of hydrogen sulfide-producing bacteria. Hydrogen sulfide reacts with myoglobin to form
sulfmyoglobin and choleglobin which cause surface greening (Fernandez and Pierson, 1985).
Halal meat is produced without stunning prior to slaughter, resulting in a rapid and
complete bleeding of animals (Eliasi and Dwyer, 2002); (Grandin and Regenstein, 1994). As
improved bleeding can improve the quality of the meat during storage (Ali et al., 2007).This
approach may improve the quality of fresh and extend the shelf life of meat during storage.
Materials and methods
1. Sample collection:
Meat samples were collected from different slaughter houses in Michigan. The collected
samples were immediately transport in insulated ice containers to the laboratory for
microbiological and physiochemical analyses.
2. Microbiological analysis
Samples (25 g) of beef were weighted aseptically, added to (225mL) of 0.1% sterilized
peptone water and homogenized in a stomacher for 60 s at room temperature. Decimal dilutions
in 0.1% sterilized peptone water were prepared and duplicate 1mL samples of appropriate
dilutions were poured on Petri dish then added the specific media for each type of bacteria for
the following tests (APHA, 1992):-
a) Aerobic plate Count

170
Pouring method was carried out according to APHA (1992)where 1 ml of the selected
dilutions were added onto duplicate sterile Petri dish plates then added plate count agar ( Sigma-
Aldrich) and incubate at 35°C for 48 hr. Colonies between “25-250” were counted and the total
aerobic colony counts were then expressed as log CFU/ gram.
b) Psychrotrophic bacteria
Psychrotrophic bacteria determination were carried out plate count agar (Sigma-Aldrich) and
then incubated at 7°C for 7 days.
c) Staphylococcus aureus
Baird-Parker agar plates (Merk, Germany) were incubated for 48h at 35°C. Typical S. aureus
colonies (Black colonies with white margins surrounded by clear zones) were counted.
d) Total coliform and fecal coliform bacteria
Violet red bile lactose agar (Sigma-Aldrich) was poured into 1ml of inoculum. The plates were
then incubated at 35°C for count of total coliforms and at 44°C for count of fecal coliforms for 48
h. All typical colonies (red colonies) were counted.
e) Total yeast and mold
Total yeast and mold were counted on Potato dextrose agar(Sigma-Aldrich) , acidified with
tartaric acid to pH 3.5 and incubated at 25°C for 5 d. Yellowish-white colonies were identified as
yeasts, whereas mold growth were recognized by its mycelial appearance.
f) Lactic acid bacteria
Lactic Acid Bacteria (LAB) counts were determined using the double-layer deMan Rogosa Sharpe
(MRS) agar (Sigma-Aldrich) and then incubated at 30°C for 72 h.
g) Enterobacteriaceae

171
Violet Red Bile Glucose agar (VRBG) (Oxoid, Basingstoke, UK) were used for the enumeration of
Enterobacteriaceae, overlaid with the same medium and then incubated at 37 ˚C for 24 h.
h) Escherichia coli
Escherichia coli bacteria were enumerated using Eosin Methylene Blue (EMB) agar (Sigma-
Aldrich) and then incubated at (37°C for 24h). Colonies of E. coli on EMB agar were round with a
typical metallic sheen.
i) Pseudomonas spp.
Pseudomonas spp. were determined on pseudomonas agar base (Oxoid, Basingstoke,UK)
supplemented with Pseudomonas CFC supplement (Oxoid, Basingstoke,UK) and then incubated
at 25°C for 48 h.
3. Physiochemical analysis
a) pH measurement
The pH of meat samples were measured according to (Naveena and Mendiratta, 2001)
meat samples (10 gram) were homogenized with 50 ml of distilled water then filtered through
whatman No.1 filter paper. The pH of filtrate samples were measured using digital pH meter
(WtW 2f40-11420D.Germany) calibrated at pH 4.0and 7.0 equipped with a pH electrode.
b) Thaw loss Percentage
Thaw loss was calculated as [weight of sample before freezing minus sample weight after
thawing] x 100/ sample weight before freezing.
c) Drip loss
Drip loss was calculated as [sample weight minus sample weight after 24 hours refrigeration] x
100/ sample weight.
172
d) Determination of Heme iron content
Heme iron content of meat was determined according to the method of Cheng &
Ockerman (2004). Ground sample (2g) was mixed with 9ml of acid acetone (90% acetone, 8%
deionized water and 2% HCl v/v/v). The mixture was mashed with a glass rod and allowed to
stand for 1h at room temperature. The mixture was filtered with a Whatman No. 42 filter paper
and the absorbance of the filtrate was read at 640nm against an acid acetone used as blank.
Heme iron content was calculated as follows;
Heme iron content (ppm) = Total pigment (ppm) X 0.0822
Where total heme pigment (ppm) = A640 X 680
The heme iron content was expressed as mg/100g of wet sample.
e) Lipid oxidation measurement
Thiobarbituric acid reactive substances (TBARS) were determinate according to the
method of Schmedes and Holmer (1989). Ground meat samples (10 g) were mixed with 25 ml of
trichloroacetic acid (TCA) solution (200 g/l of TCA in 135 ml/l phosphoric acid solution) and
homogenized in a blender for 30 s. After filtration, 2 ml of the filtrate were mixed with equal
amount of aqueous solution of TBA (3 g/l) in a test tube. The tubes were incubated at room
temperature in the dark for 20 h; then the absorbance was measured at 532 nm using UV-vis
spectrophotometer (model UV-1200, Shimadzu, Kyoto, Japan). Lipid oxidation was expressed as
thiobarbituric acid reactive substances (TBARS) expressed as mg Malonaldehyde/kg sample.
4. Statistical analysis
Data were represented the means of experiments. The means were compared using
student T test (IBM SPSS statistics 23).
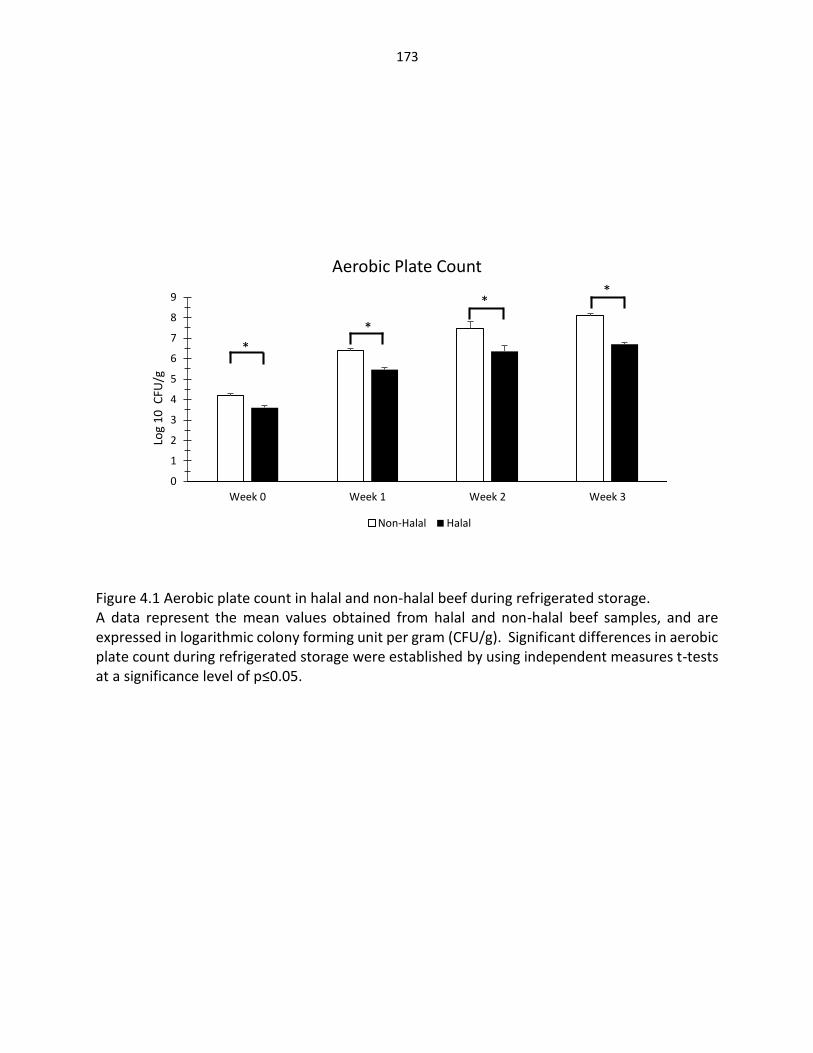
173
Figure 4.1 Aerobic plate count in halal and non-halal beef during refrigerated storage. A data represent the mean values obtained from halal and non-halal beef samples, and are expressed in logarithmic colony forming unit per gram (CFU/g). Significant differences in aerobic plate count during refrigerated storage were established by using independent measures t-tests at a significance level of p≤0.05.
0
1
2
3
4
5
6
7
8
9
Week 0 Week 1 Week 2 Week 3
Log
10
CFU
/g
Aerobic Plate Count
Non-Halal Halal
**
*
*

174
Figure 4.2 Psychrotrophic bacteria in halal and non-halal beef during refrigerated storage. A data represent the mean values obtained from halal and non-halal beef samples, and are expressed in logarithmic colony forming unit per gram (CFU/g). Significant differences in psychrotrophic bacteria during refrigerated storage for three weeks were established by using independent measures t-tests at a significance level of p≤0.05.
0
1
2
3
4
5
6
7
8
9
Week 0 Week 1 Week 2 Week 3
Log
10
CFU
/g
Psychrotrophic
Non-Halal Halal
**
**

175
Figure 4.3 E. coli bacteria in halal and non-halal beef during refrigerated storage. A data represent the mean values obtained from halal and non-halal beef samples, and are expressed in logarithmic colony forming unit per gram (CFU/g). No Significant differences in E. coli bacteria during refrigerated storage for three weeks were established by using independent measures t-tests at a significance level of p≤0.05.
0
1
2
3
4
5
6
Week 0 Week 1 Week 2 Week 3
Log
10
CFU
/g
E.Coli
Non-Halal Halal
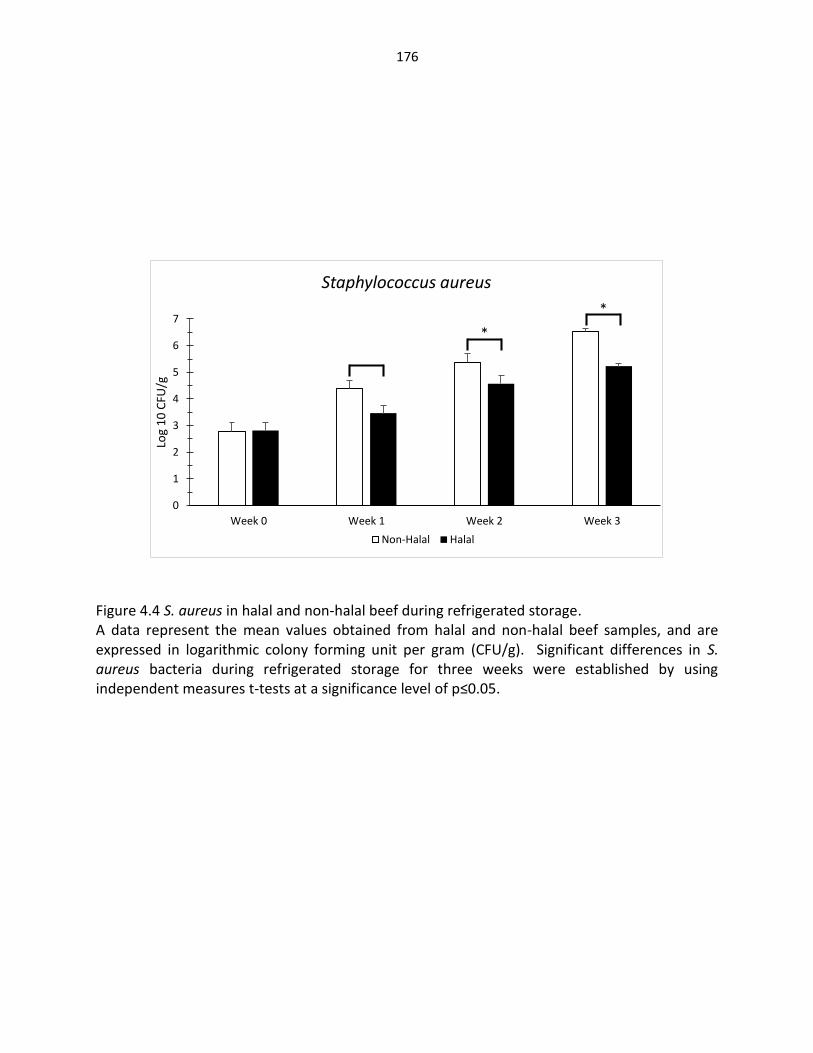
176
Figure 4.4 S. aureus in halal and non-halal beef during refrigerated storage. A data represent the mean values obtained from halal and non-halal beef samples, and are expressed in logarithmic colony forming unit per gram (CFU/g). Significant differences in S. aureus bacteria during refrigerated storage for three weeks were established by using independent measures t-tests at a significance level of p≤0.05.
0
1
2
3
4
5
6
7
Week 0 Week 1 Week 2 Week 3
Log
10
CFU
/g
Staphylococcus aureus
Non-Halal Halal
*
*

177
Figure 4.5 Pseudomonas bacteria in halal and non-halal beef during refrigerated storage. A data represent the mean values obtained from halal and non-halal beef samples, and are expressed in logarithmic colony forming unit per gram (CFU/g). Significant differences in pseudomonas bacteria during refrigerated storage for three weeks were established by using independent measures t-tests at a significance level of p≤0.05.
0
1
2
3
4
5
6
7
8
9
Week 0 Week 1 Week 2 Week 3
Log
10
CFU
/mg
Pseudomonas
Non-Halal Halal
*
*
* *
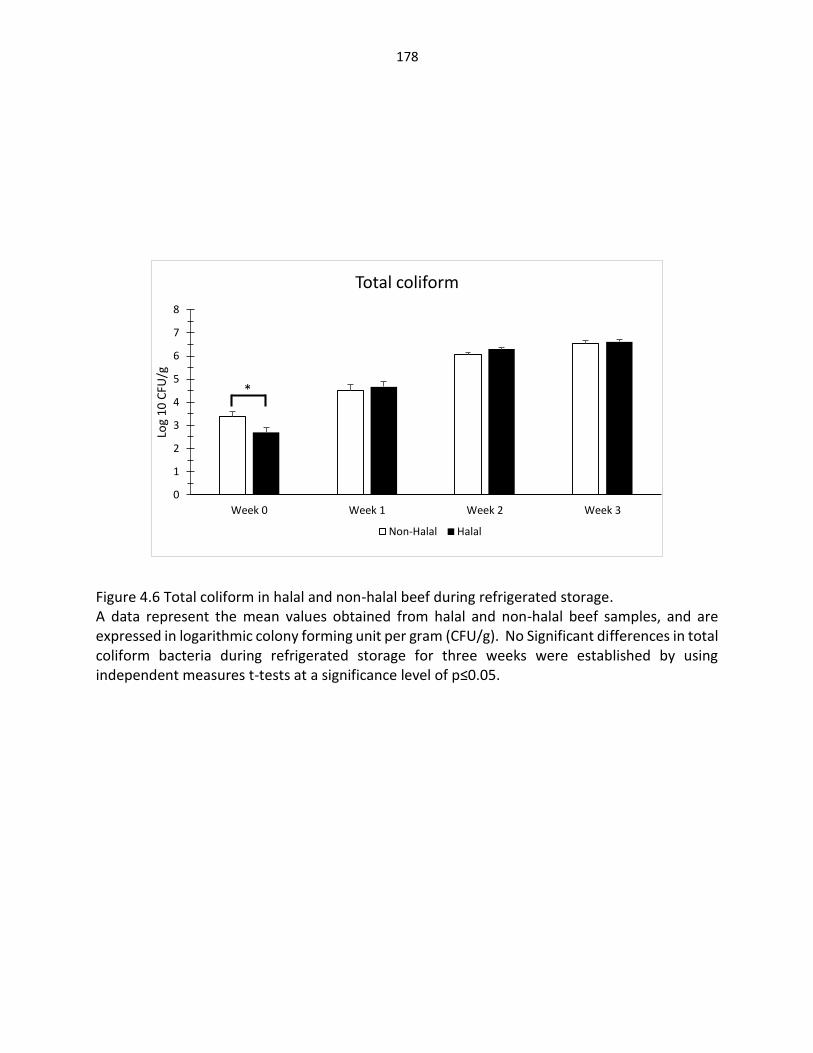
178
Figure 4.6 Total coliform in halal and non-halal beef during refrigerated storage. A data represent the mean values obtained from halal and non-halal beef samples, and are expressed in logarithmic colony forming unit per gram (CFU/g). No Significant differences in total coliform bacteria during refrigerated storage for three weeks were established by using independent measures t-tests at a significance level of p≤0.05.
0
1
2
3
4
5
6
7
8
Week 0 Week 1 Week 2 Week 3
Log
10
CFU
/g
Total coliform
Non-Halal Halal
*

179
Figure 4.7 Lactic acid bacteria in halal and non-halal beef during refrigerated storage. A data represent the mean values obtained from halal and non-halal beef samples, and are expressed in logarithmic colony forming unit per gram (CFU/g). Significant differences in Lactic acid bacteria during refrigerated storage for three weeks were established by using independent measures t-tests at a significance level of p≤0.05.
0
1
2
3
4
5
6
Week 0 Week 1 Week 2 Week 3
Log
10
CFU
/g
Lactic acid bacteria
Non-Halal Halal
*
*
*
*

180
Figure 4.8 Enterobacteriaceae bacteria in halal and non-halal beef during refrigerated storage. A data represent the mean values obtained from halal and non-halal beef samples, and are expressed in logarithmic colony forming unit per gram (CFU/g). Significant differences in Enterobacteriaceae bacteria during refrigerated storage for three weeks were established by using independent measures t-tests at a significance level of p≤0.05.
0
1
2
3
4
5
6
7
8
Week 0 Week 1 Week 2 Week 3
Log
10
CFU
/g
Enterobacteriaceae
Non-Halal Halal
**
*

181
Figure 4.9 Fecal coliform bacteria in halal and non-halal beef during refrigerated storage. A data represent the mean values obtained from halal and non-halal beef samples, and are expressed in logarithmic colony forming unit per gram (CFU/g). No Significant differences in fecal coliform bacteria during refrigerated storage for three weeks were established by using independent measures t-tests at a significance level of p≤0.05.
0
1
2
3
4
5
Week 0 Week 1 Week 2 Week 3
Log
10
CFU
/g
Fecal coliform
Non-Halal Halal
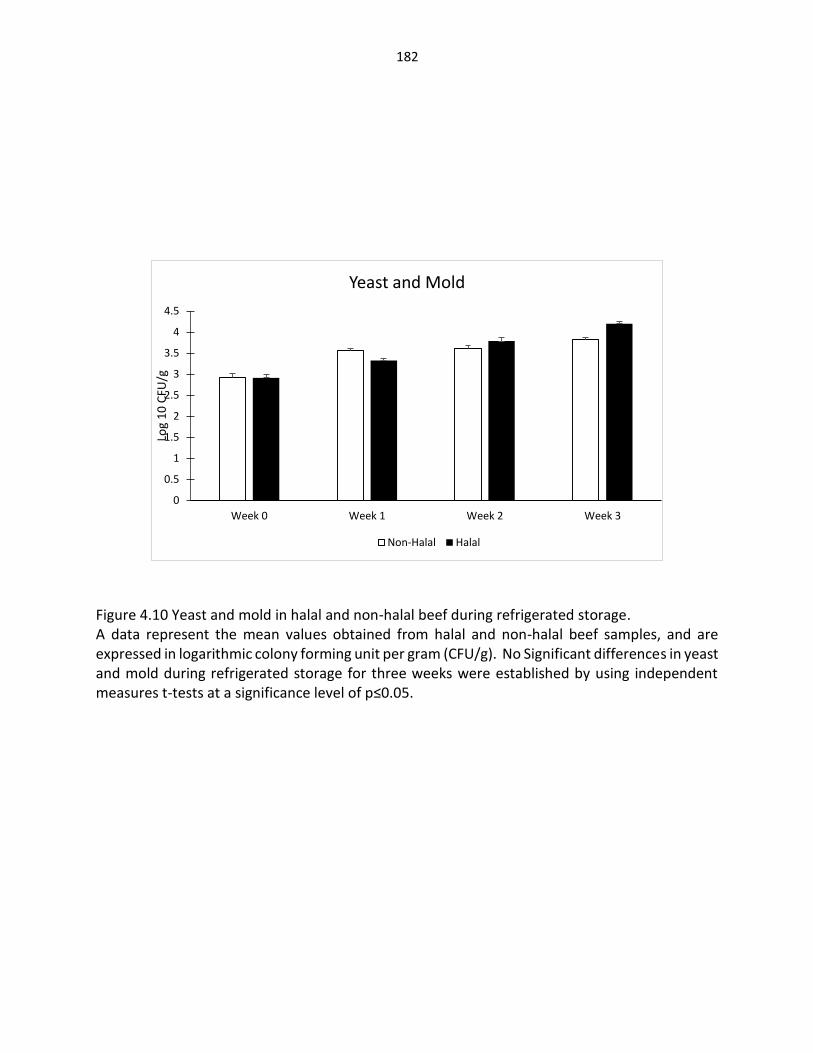
182
Figure 4.10 Yeast and mold in halal and non-halal beef during refrigerated storage. A data represent the mean values obtained from halal and non-halal beef samples, and are expressed in logarithmic colony forming unit per gram (CFU/g). No Significant differences in yeast and mold during refrigerated storage for three weeks were established by using independent measures t-tests at a significance level of p≤0.05.
0
0.5
1
1.5
2
2.5
3
3.5
4
4.5
Week 0 Week 1 Week 2 Week 3
Log
10
CFU
/g
Yeast and Mold
Non-Halal Halal

183
Figure 4.11 Lipid oxidation in halal and non-halal beef during refrigerated storage. A data represent the mean values obtained from halal and non-halal beef samples, and are expressed in (mg of MDA/kg meat). Significant differences in lipid oxidation during refrigerated storage for three weeks were established by using independent measures t-tests at a significance level of p≤0.05.
0
1
2
3
4
Week 0 Week 1 Week 2 Week 3
TBA
RS
mg
of
MD
A /
kg
mea
t
Lipid Oxidation
Non-Halal Halal
*
*
*
*

184
Figure 4.12 Heme iron in halal and non-halal beef during refrigerated storage. A data represent the mean values obtained from halal and non-halal beef samples, and are expressed in (mg/100g) meat. Significant differences in heme iron content during refrigerated storage for three weeks were established by using independent measures t-tests at a significance level of p≤0.05.
0
1
2
3
Week 0 Week 1 Week 2 Week 3
mg
/ 1
00
g m
eat
Heme iron
Non-Halal Halal
**
*

185
Figure 4.13 pH in halal and non-halal beef during refrigerated storage. A data represent the mean values obtained from halal and non-halal beef samples. No significant differences in pH during refrigerated storage for three weeks were established by using independent measures t-tests at a significance level of p≤0.05.
0
1
2
3
4
5
6
7
Week 0 Week 1 Week 2 Week 3
pH
pH
Non-Halal Halal

186
Figure 4.14 Thaw loss in halal and non-halal beef during refrigerated storage. A data represent the mean values obtained from halal and non-halal beef samples, and are expressed in (Thaw loss). No Significant differences in thaw loss during refrigerated storage for three weeks were established by using independent measures t-tests at a significance level of p≤0.05.
0
0.5
1
1.5
2
Week 0 Week 1 Week 2 Week 3
Thaw
loss
%
Thaw Loss
Non-Halal Halal
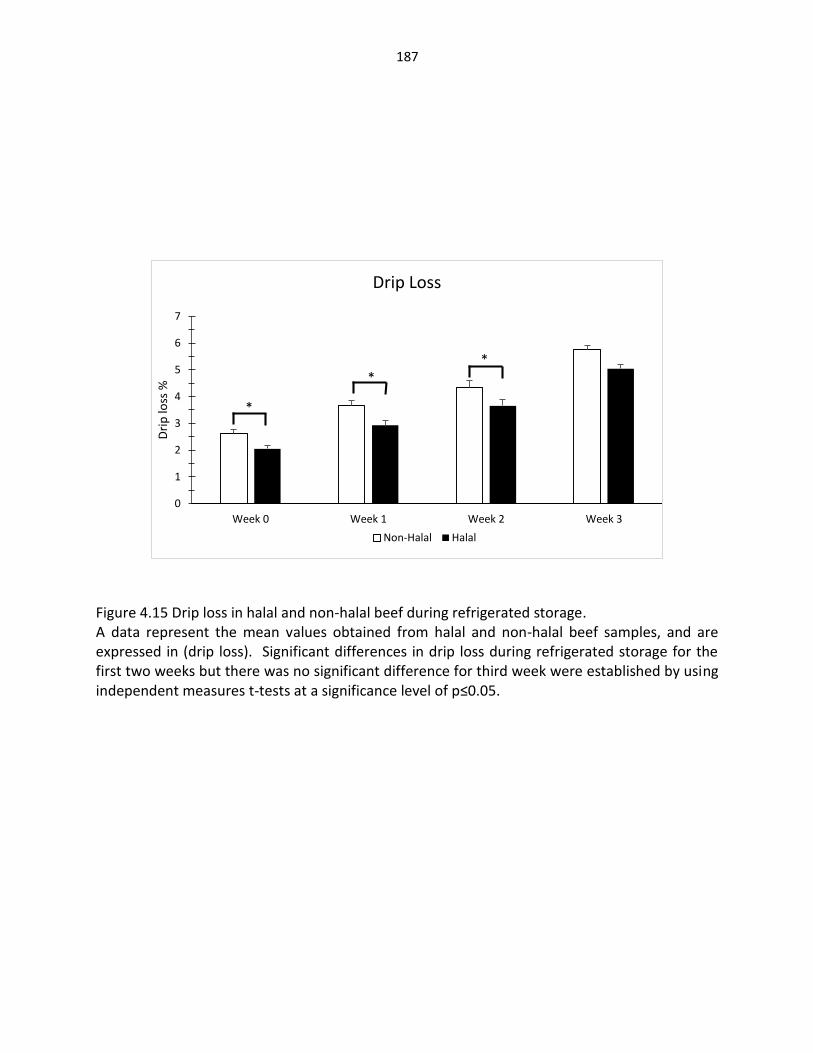
187
Figure 4.15 Drip loss in halal and non-halal beef during refrigerated storage. A data represent the mean values obtained from halal and non-halal beef samples, and are expressed in (drip loss). Significant differences in drip loss during refrigerated storage for the first two weeks but there was no significant difference for third week were established by using independent measures t-tests at a significance level of p≤0.05.
0
1
2
3
4
5
6
7
Week 0 Week 1 Week 2 Week 3
Dri
p lo
ss %
Drip Loss
Non-Halal Halal
*
**
188
Results and discussion
1. Bacterial content in halal and non-halal beef during refrigerated storage
a) Aerobic plate count
Aerobic plate counts are a widely accepted measure of the general degree of microbial
contamination and the hygienic conditions of processing plants (DAAHP).The aerobic plate count
in halal and non-halal beef during refrigerated storage for three weeks were shown in Figure
(4.1). The aerobic plate count in halal and non-halal beef were for first, second and third week
were (5.46, 6.41), (6.35, 7.48), (6.70, 8.10) respectively. Halal beef that was produced without
stunning resulted in significantly lower (P < 0.05) aerobic plate count than non-halal beef during
refrigerated storage three weeks. The lower aerobic plate count in the Halal beef could be
attributed to the high blood loss because of method of slaughter. Many researchers reported a
correlation between meat quality and blood. The more blood retained, the poorer the meat
quality (Gregory, 2008); (Strappini, et al, 2009). Aerobic plate count in both halal and non-halal
were increased during refrigerated storage at all three weeks. This may be attributed to high
nutritive value of blood, suitable temperature, pH, and water activity of meat and relative
humidity influence the degree of deterioration in meat (Lerner, 2009). The level of aerobic plate
count in halal beef at week 3 was acceptable as indicated by (Insausti et al., 2001) and (Jeremiah,
2001), that spoilage occurs when the level of total viable count reach 7–8 log Cfu/g. Therefore,
choosing the proper meat processing may be increasing the usable shelf life and improve the
quality of meat during storage. These findings are in agreement with the findings of (Addeen et
al., 2014) and (Mustafa et al, 2014) in chicken who found that APC of broiler chicken was
significantly higher in non-halal than halal meat during storage.

189
b) Psychrotrophic bacteria
Psychrotrophic bacteria have ability to grow at low temperatures but have optimal
and maximal growth temperatures above 15 and 20 °C, respectively (Moyer and Morita,
2007). Bacteria developing on meat at chill temperatures are regarded as psychrotrophic.
Some psychrotrophic bacteria are gram-positive such as lactic acid bacteria, and the other
are gram-negative bacteria, such as Pseudomonas spp. and Enterobacteriaceae (Gill and
Newton, 1978). Species of Pseudomonas are especially responsible for the spoilage of
meat stored at chill temperatures (Jay et al, 2003). The psychrotrophic bacteria in halal
and non-halal beef during refrigerated storage for three weeks were shown in Figure
(4.2). Non-Halal beef was significantly higher (P < 0.05) psychrotrophic bacteria than halal
beef during refrigerated storage for three weeks. The higher psychrotrophic bacteria in
non-halal beef could be attributed to the low blood loss because of method of slaughter
where in some cases, Pseudomonas can constitute up to 96% of the population (Asensio
et al, 1988). Pseudomonas has ability to use glucose in the blood as substrate for
microbial growth (Warriss, 2001). Also, as storage time increases, the psychrotrophic
count also increased for both slaughter methods. This showed preference of bacteria to
grow at low temperature. The increase in the psychrotrophic count for both methods of
slaughter may be due to a shift of the microbial populations during storage period. A shift
of the microbial populations has been observed under different storage temperatures.
Psychrotrophic bacteria which belong to microbial genera of both gram-postive, such as
LAB, and gram-negative bacteria, such as Pseudomonas spp.
and Enterobacteriaceae could be developing in meat at chill temperatures (Gill and

190
Newton, 1978) and (Holzapfel, 1998). More accurately, species of Pseudomonas are
particularly involved in the spoilage of meat stored at chill temperatures (Ercolini et al.,
2007).
c) E. coli
The effect of slaughter methods on prevalence of E. coli bacteria in beef during
refrigerated storage were shown in Figure (4.3). There were no significant differences in E. coli
between halal and non-halal beef during refrigerated storage for all three weeks. This could be
due to apply the same procedures in both slaughters to control this bacteria during handling the
meat as well as following the hygiene practice by workers. The count of E. coli bacteria in halal
and non-halal beef for first, second and third week were (3.48, 3.73), (4.50, 4.70), (5.16, 5.27)
respectively. As storage time increases, the E. coli count also increased for both slaughter
methods for three weeks. This may be due to content of meat of sufficient nutrient needed to
support the growth of microorganisms (Magnus, 1981).
d) Staphylococcus aureus
Staphylococcus aureus produces a heat-stable toxin in foods and causes staphylococcal
food poisoning (SFP) by ingesting food that contains staphylococcal enterotoxin. Staphylococcal
food poisoning (SFP) is responsible for a third of the foodborne diseases worldwide (Normanno,
et al., 2007). Figure (4.4) shows the effect of slaughter methods on prevalence of S. aureus
bacteria in beef during refrigerated storage for three weeks. The S. aureus in halal and non-halal
beef for first, second and third week were (3.46, 4.40), (4.57, 5.38), (5.23, 6.52) respectively. At
week 0, S. aureus was not significantly different for the two slaughter methods. However, at
weeks 1, 2, and 3 of refrigerated storage, halal beef had lower (p < 0.05) growth of S. aureus than

191
non-halal beef. In general, increased growth of S. aureus with storage time was observed in meat
samples from both slaughters. This increase in count was due to slow adaptation for growth
by S. aureus at lower temperature (Kneepan et al, 2013). Results from present study were
agreement with (Nakyinsige et al, 2014) who observed that lower amount of residual blood in
the carcass of rabbits subjected to halal slaughter caused lower bacteria count. In chicken, (Ali
et al, 2011) also reported that higher blood loss in halal slaughter was associated with lower
bacteria count in minced meat at 48 h postmortem. Therefore, choosing the proper meat
processing such as halal beef may be increasing the usable shelf life and improve the quality of
meat during storage.
e) Pseudomonas
Pseudomonas species were the dominant bacteria group on normal and high pH beef
(Erichsen and Molin, 1981) as well as in some cases, Pseudomonas can constitute up to 96% of
the population (Asensio et al, 1988). Figure (4.5) shows the count of pseudomonas bacteria in
halal and non-halal beef during refrigerated storage for three weeks. Halal beef had significantly
lower (P < 0.05) pseudomonas bacteria than non-halal beef during refrigerated storage at all
three weeks. This may be attributed to high amount of blood in non-halal beef and ability of
pseudomonas bacteria to use glucose in the blood as substrate for microbial growth (Warriss,
2001). The pseudomonas bacteria in halal and non-halal beef were for first, second and third
week were (6.17, 6.76), (7.32, 8.04), (7.48, 8.21) respectively. Like aerobic plat count and
psychrotrophic, as storage time increases, the pseudomonas count also increased for both
slaughter methods for three weeks. This may be due to content of meat of sufficient nutrient
needed to support the growth of microorganisms (Magnus, 1981). Species of Pseudomonas are

192
particularly involved in the spoilage of meat stored at chill temperatures (Ercolini et al., 2007).
Therefore, choosing the proper meat processing may be increasing the usable shelf life and
improve the quality of meat during storage.
f) Total coliform
Total coliform in halal and non-halal beef during refrigerated storage for three weeks
were shown in Figure (4.6).Total coliform in halal and non-halal beef for first, second and third
week were (4.66, 4.52),(6.30, 6.04), (6.61, 6.54) respectively. Halal beef that was produced
without stunning resulted in significantly lower (P < 0.05) coliform than non-halal beef during
refrigerated storage for three weeks. The lower total count in the halal beef could be attributed
to the high blood loss because of method of slaughter. Many researchers reported a correlation
between meat quality and blood. The more blood retained, the poorer the meat quality
(Gregory, 2008); (Strappini et al, 2009). Total coliform in both halal and non-halal were increased
during refrigerated storage for all three weeks. This may be due to content of meat of sufficient
nutrient needed to support the growth of microorganisms (Magnus, 1981).
g) Lactic acid bacteria
Lactic acid bacteria are produced lactic acid because of glucose fermentation and some
species have significant role in the spoilage of refrigerated raw meat (Labadie 1999). The spoilage
characteristics are slime formation, discolorations, sour flavor and off odor, (Schillinger
&Holzapfel, 2006). Lactic acid bacteria in halal and non-halal beef during refrigerated storage for
three weeks were shown in Figure (4.7). At week 0, halal beef was significantly higher (P < 0.05)
growth of lactic acid bacteria. However, at weeks 1, 2, and 3 of refrigerated storage, halal beef
had lower (p < 0.05) growth of lactic acid than non-halal beef. The lower lactic acid bacteria in
193
the halal beef could be attributed to the high blood loss as a result of method of slaughter. Many
researchers reported a correlation between meat quality and blood. The more blood retained,
the poorer the meat quality (Gregory, 2008); (Strappini, Metz et al, 2009). In general, increased
growth of lactic acid bacteria with storage for three weeks was observed in meat samples from
both slaughters. This may be attributed to high nutritive value of blood, suitable temperature,
pH, and water activity of meat and relative humidity influence the degree of deterioration in
meat (Lerner, 2009). Increase growth of lactic acid bacteria can explain pH decrease during
storage period. The level of lactic acid bacteria in halal and non-halal beef at all three weeks was
acceptable as indicated by (Insausti et al. 2001) and Jeremiah (2001), that spoilage occurs when
the level of lactic acid bacteria reach 7 log Cfu/g.
h) Enterobacteriaceae
Enterobacteriaceae bacteria are used glucose as substrate for growth and produce
some deleterious compound (Gill, 1986), (Lambert et al., 1991). Some species such as H. alvei
and S. liquefaciens produce malodorous diamines and cause a green discoloration when they
grow in meat (Stanbridge & Davies, 1998). Enterobacteriaceae bacteria in halal and non-halal
beef during refrigerated storage for three weeks were shown in Figure (4.8). Non-halal beef that
was resulted in significantly higher (P < 0.05) Enterobacteriaceae bacteria than halal beef during
refrigerated storage for all three weeks. The Enterobacteriaceae bacteria in halal and non-halal
beef for first, second and third week were (4.31, 5.40), (4.82, 5.84), (6.10, 6.69) respectively. The
higher Enterobacteriaceae in the non-halal beef could be attributed to high amount of blood in
non-halal beef and ability of Enterobacteriaceae bacteria to use glucose in the blood as substrate
for microbial growth (Warriss, 2001). Many researchers reported a correlation between meat

194
quality and blood. The more blood retained, the poorer the meat quality (Gregory, 2008);
(Strappini et al, 2009). Enterobacteriaceae bacteria in both halal and non-halal were increased
during refrigerated storage at all weeks. This may be attributed to content of meat of sufficient
nutrient needed to support the growth of microorganisms (Magnus, 1981). The level of
Enterobacteriaceae bacteria in halal and non-halal beef at all three weeks was acceptable as
indicated by (Insausti et al., 2001) and (Jeremiah, 2001), that spoilage occurs when the level of
total viable count reach 7–8 log Cfu/g. Therefore, choosing the proper meat processing may be
increasing the usable shelf life and improve the quality of meat during storage.
i) Fecal coliform
In this study also we evaluated the effect of slaughter method on prevalence of fecal
coliform in beef. Figure (4.9) shows the count of fecal coliform bacteria in halal and non-halal
beef during refrigerated storage for three weeks. There were no significant differences for fecal
coliform between halal and non-halal beef during storage period. This could be due to apply the
same procedures to control this bacteria during handling the meat as well as following the
hygiene practice by workers (Grohs et al, 2000).
j) Yeast and mold
The effect of slaughter methods on prevalence of yeast and mold in beef during
refrigerated storage for three weeks was shown in fig. (4.10). There were no significant
differences in yeast and mold between halal and non-halal beef during refrigerated storage for
all three weeks. This may be due to apply the same procedures in environment of slaughter such
as ventilation where spores of yeast and mold can be spread through the air. Also, as storage

195
time increases, the yeast and mold count also increased for both slaughter methods during
storage for three weeks.
2- Physiochemical analysis
a) Lipid oxidation
Lipid oxidation is one of the major causes of quality deterioration in raw and cooked meat
products during refrigeration and storage (Raharjo and Sofos, 1993). Lipid oxidation is measured
as malondialdehyde (MDA) which is formed by oxidation of polyunsaturated fatty acids with 2 or
more double bonds. MDA-induced DNA damage is mutagenic in bacterial, mammalian, and
human cells (Nadia et al, 2011). The effect of slaughter methods on lipid oxidation in beef was
shown in fig. (4.11). Halal beef that was produced without stunning resulted in significantly lower
(P < 0.05) lipid oxidation than non-halal beef during refrigerated storage for three weeks. This
could be due to halal slaughter without stunning resulted in significant lower residual hemoglobin
than non-halal slaughter with stunning (Nakyinsige et al, 2014); (Griffiths et al, 1985). Residual
blood left in the carcass because of improper bleeding may decrease the shelf life and hence the
quality of the meat product because hemoglobin which is an important component of blood is a
powerful promoter of lipid oxidation (Alvarado et al, 2007). Also, Blood also contains a large
number of white blood cells that produce hydroxyl radicals, superoxides, and hydrogen peroxide
that enhance lipid oxidation (Gabig & Babior, 1981). Lipid oxidation in both slaughters was
increased during refrigerated storage at all three weeks. This may be due to heme breakdown
during storage and hence the released non-heme iron can catalyze lipid oxidation. These values
were consistent with the results for heme iron content in this study where were (1.36, 2.05),

196
(1.15, 1.72), (1.02, 1.43) for halal and non-halal beef respectively. Transition metal ions, primarily
Fe serve as key catalysts for lipid oxidation in muscle (Kanner, 1994).
b) Heme iron
Heme iron content in halal and non-halal beef were shown in Figure (4.12). Halal beef
that was produced without stunning resulted in significantly lower (P < 0.05) heme iron than non-
halal beef. This could be due to halal slaughter without stunning resulted in significant lower
residual hemoglobin than non-halal slaughter with stunning (Nakyinsige et al, 2014); (Griffiths et
al, 1985). Also, as storage time increases, the heme iron was decreased for both slaughter
methods for three weeks. This could be due to breakdown of heme and release non-heme iron
(Benjakul and Bauer, 2011) and hence it can catalyze lipid oxidation during the storage.
Transition metal ions, primarily Fe serve as key catalysts for lipid oxidation in muscle (Kanner,
1994). These values were consistent with the results for lipid oxidation and some of
microbiological analyses such as aerobic plate count, psychrotrophic bacteria, pseudomonas ,
lactic acid bacteria , coliform and Enterobacteriaceae.
Red meat and processed meat intake is associated with a risk of colorectal cancer, a major
cause of death in affluent countries. Epidemiological and experimental evidence supports the
hypothesis that heme iron present in meat promotes colorectal cancer. This meta-analysis of
prospective cohort studies of colon cancer reporting heme intake included 566,607 individuals
and 4,734 cases of colon cancer (Nadia et al 2011). Therefore, halal slaughter could lower heme
iron and hence improve the quality of meat and avoid health problems such as colorectal cancer.
c) pH
197
The effect of slaughter methods on pH in beef was shown in Fig (4.13). There were no
significant differences for pH between halal and non-halal beef during refrigerated storage for
three weeks. This could be due to use same treatment with animals before slaughtering. Also,
as storage time increases, the pH was decreased for both slaughter methods for three weeks.
This could be due to increase growth of lactic acid bacteria during storage period and produce
lactic acid.
d) Thaw loss
The effect of slaughter methods on thaw loss in beef was shown in Figure (4.14). There
were no significant differences for thaw loss between halal and non-halal beef during
refrigerated storage for three weeks. In addition, as storage time increases, the thaw loss was
slightly increased for both slaughter methods for three weeks.
e) Drip loss
Drip loss results in an unsightly appearance and tougher, drier meat. Exudate water
contains ca. two-thirds of the protein concentration of whole meat, so drip loss is a costly waste
of animal protein (van Laack and Solomon, 1994). Drip loss in halal and non-halal beef was shown
in Figure (4.15). At week 1and 2, halal beef that was produced without stunning resulted in
significantly lower (P < 0.05) drip loss than non-halal beef while there was no significant different
at week 3. As storage time increases, the drip loss increases for both slaughter methods. The
increase in drip loss with storage time may be attributed to degradation of muscle proteins
caused by the spoilage mechanisms. These findings are in agreement with the findings of
(Addeen et al. 2014) in chicken, and (DAgata et al, 2010) in beef who found that drip loss was
significantly higher in non-halal than halal meat during storage.
198
REFERENCES
Alvarado, C., Richards, M., O'Keefe, S., Wang, H. 2007.The effect of blood removal on
oxidation and shelf life of broiler breast meat. Poultry Science, 86 (1) (2007), pp. 156–161.
Ali, A. S. A., Lawson, M.A., Tauson, A., Jensen, J.F., and Chwalibog, A. 2007. Influence of
electrical stunning voltages on bleed out and carcass quality of broiler chickens. Arch.
Geflügelk. 71:35-40.
Ali, A.M., Abdalla, H.O., Mahgoub, I.M. 2011. Effect of slaughtering method on the
keeping quality of broiler chickens'meat. Egypt Poultry Science, 31 (2011), pp. 727–736
Asensio, M.A., Ordóñez, J.A., Sanz, B. 1988. Effect of carbon dioxide and oxygen enriched
atmospheres on the shelf-life of refrigerated pork packed in plastic bags J. Food Protect.,
51 (1988), pp. 356-360
Addeen, A., Benjakul, S., Wattanachant, S., Maqsood, S. 2014.Effect of Islamic
slaughtering on chemical compositions and post-mortem quality changes of broiler
chicken meat. International Food Research Journal 21(3): 897-907
Agapi I. Doulgeraki a , Danilo Ercolini b, Francesco Villani b , George-John E. Nychas
Spoilage microbiota associated to the storage of raw meat in different conditions
International Journal of Food Microbiology.
APHA; American Public Health Association (1992): Compendium of Methods for the
Microbiological Examination of Foods, 3rd ed. APHA, Washington, DC, USA.
Bartkowski, L, F.D. Dryden, and J.A. Marchello. 1982. Quality changes of beef steaks
stored in controlled gas atmospheres containing high and low levels of oxygen. J. Food
Prot. 45:41.

199
Benjakul, S. and Bauer, F. 2011. Biochemical and physicochemical changes in catfish
(Silurus granis Linne) muscle as influenced by different freeze-thaw cycles. Food
Chemistry 72: 207-217.
Borch, E. Kant- Muemans, M.L. Blixt, Y. 1996.Bacterial spoilage of meat and cured meat
products. International Journal of Food Microbiology, 33 , pp. 103-120
Cheng, J.H. and Ockerman, H.W.2004. Effect of ascorbic acid with tumbling on lipid
oxidation of precooked roast beef. J. Muscle Food.15:83-93.
Department of Agriculture, Animal Health and Product. 2004. Animal and animal origin
foods. No. 624-04. Off. Bull. 5214:727–745.
D’Agata, M., Russo, C., Preziuso, G. 2010. Effect of Islamic ritual slaughter on beef quality.
Italian Journal Animal. Sci. vol. 8 (Suppl. 2), 489-491
Ercolini D., Russo, F., Nasi, A., Ferranti, P., and Villani, F., 2009. Mesophilic and
psychrotrophic bacteria from meat and their spoilage potential in vitro and in beef.
Elisabethm B., Kant-Muermans, M-L.and Blixt, Y., 1996. Bacterial spoilage of meat and
cured meat product. Int. J. Food Microbiol. 33, 103-120
Ellis, D. I., D. Broadhurst, D. B. Kell, J. J. Rowland, and R. Goodacre. 2002. Rapid and
quantitative detection of the microbial spoilage of meat by Fourier Transform Infrared
Spectroscopy and machine learning. J. Appl. Envron. Microbiol. 68:2822-2828.
Eliasi, J.R., Dwyer, J.T., 2002. Kosher and halal: religious observances affecting dietary
intakes. J. Am. Diet. Assoc. 101:911–913.
Erichsen,I., Molin,G.1981.Microbial flora of normal and high pH beef stored at 4 °C in
different gas environments J. Food Prot., 44 (1981), pp. 866-869
200
Ercolini, D., Russo, F., Blaiotta, G., Pepe, O., Mauriello, G., and Villani, F., 2007.
Simultaneous detection of Pseudomonas fragi, P. lundensis and P. putida from meat by a
multiplex PCR assay targeting the car A gene. Appl Environ Microbiol 73:2354-2359
Fernandez, C.F., and M.D. Pierson. 1985. Enumeration of hydrogen sulfideproducing
bacteria from anaerobically packaged pork. J. Food Prot. 48: 982.
Gabig and Babior.1981.The killing of pathogens by phagocytes.Annual Review of
Medicine, 32 (1) (1981), pp. 313–326.
Gill, C .O. Extending the Storage Life of Raw Chilled Meats .1996. Agriculture and Agri-
Food Canada Research Centre, 6000 C and E, Trail Lacombe Alberta, Canada
Gill, C.O., and Harrison, J.C.L. 1989. The storage life of chilled pork packaged under carbon
dioxide. Meat Sci. 26:313.
Grandin, T., Regenstein, J.M., 1994. Religious slaughter and animal welfare: a discussion
for meat scientists. Meat Focus International. CAB Intern., Wallingford, Oxon, UK, pp 115-
123.
Grohs, B.M, Kliegel, N. Kunz B (2000) Bacteria grow slower: Effects of spice mixtures on
extension of shelf life of pork. Fleischwirtschaft 80(9):61–63
Gill, C.O., Newton, K.G.1978.The ecology of bacterial spoilage of fresh meat at chill
temperatures. Meat Science, 14 (1978), pp. 43–60
Gill, CO. and Newton, K, G, (1980). Growth of bacteria on meat at room temperatures.
Journal of Applied Bacteriology. 49:315-323.
Gregory, N. G. (2008). Animal welfare at markets and during transport and slaughter.
Meat Science, 80(1), 2–11.
201
Griffiths, GL., McGrath. M., Softly, A., jones, C. 1985 Blood content of breiler chicken
carcasses prepared by different slaughter methods. The Veterinary Record II 7: 382-385
Gustavsson, P, and Borch, E, (1993), Contamination of beef carcasses by psychrotrophic
Pseudomonas and Enterobacteriaceae at different stages along the processing line.
International Journal of Food Microbiology. 20: 67-83
Huffman, D.L. 1974. Effect of gas atmosphere on microbial quality of pork. J. Food Sci.
39:723.
Holzapfel, 1998.The Gram-positive bacteria associated with meat and meat products. The
Microbiology of Meat and Poultry, Blackie Academic and Professional, London (1998), pp.
35–84.
Ingram, M., and Simonsen, B. 1980. Meat and meat products. In Microbial Ecology of
Foods. Vol 2 (J.H. Si Hiker, Chairman) p. 333. Academic Press, New York, NY.
Ingram, M. (1962), Microbiological principles in pre-packaged meats. Journal of Applied
Microbiology. 25: 259- 281
Ingram, M. and Dainty, R.H. 1971. Changes caused by microbes in spoilage of meats. J.
Appl. Bacteriol. 34:2.
Insausti, K,.Breiain,M.J.,Purroy,A.,Alberti,P.,Gorraiz,C.,Alzueta,M.J.,Shelf life of beef from
local Spanish cattle breeds stored under modified atmosphere. Meat sci.2001;57:273-281
ICMSF, International Commission on Microbiological Specification of Foods. 1998.
Microorganisms in foods: Microbial ecology of food commodities. Blackie Academic and
Professional, London, England.

202
Jay, J. M., Vilai, J.P., Hughes, M.E. 2003. Profile and activity of the bacterial biota of ground
beef held from freshness to spoilage at 5-7°C. Int. J. Food Microbiol. 81:105-111
Jeremiah, L.E. 2001. Packaging alternatives to deliver fresh meats using short- or long-
term distribution. Food Res Int. 2001; 34:749–772.
Kandeepan,G.,Anjaneyulu,A.S.R.,Kondaiah,N.,Mendiratta,S.K.,Rajkuma,R.S.2013.Evaluat
ion of quality and shelf life of buffalo meat keema at refrigerated storage. Journal of
Food Science and Technology . December 2013, Volume 50, Issue 6, pp 1069–1078
Kanner, J. (1994). Oxidative processes in meat & meat products: Quality implications.
Meat Science, 36(1), 169–189
Labadie, J., 1999. Consequences of packaging on bacterial growth. Meat is an ecological
niche. Meat Sci. 52, 299-305
Lambert, A.D., Smith, J.P., Dodds, K.L.1991.Shelf life extension and microbiological safety
of fresh meat - a review. Food Microbiology, 8 (1991), pp. 267–297
Lerner, P.T. 2009. Evaluation of hemoglobin and myoglobin in Poultry slaughtered by
stunning and kosher slaughter. Folia Vet. 2009; 53:25–27.
Magnus, P., 1981. Meat Composition. Food Science and Technology, 4th edition.
Gohumunary Pub. London. Pp-108-215.
Maria D’Agata, Claudia Russo, Giovanna Preziuso. 2010. Effect of Islamic ritual slaughter
on beef quality. Italian Journal of Animal Science · January 2010. vol. 8 (Suppl. 2), 489-
491,
Moyer, C.L., Morita, R.Y. (2007) Psychrophiles and psychrotrophs. In: Morita RY (ed.)
Encyclopedia of Life Sciences. John Wiley & Sons Ltd, Chichester. pp1– 6.
203
McMillin, K.W., 2008. Where is MAP Going? A review and future potential of modified
atmosphere packaging for meat. Meat. Sci. 80, 43-65
Mustafa, I.S.M., Abdelgadir, M.A., Sulieman, A.E.2014. Impact of Halal and Non-halal
Slaughtering on the Microbiological Characteristics of Broiler Chicken Meat and Sausages.
Food and Public Health 2014, 4(5): 223-228
Nadia, M., Bastide, F. H., Pierre, F., Denis, E.C.2011.Heme Iron from Meat and Risk of
Colorectal Cancer: A Meta-analysis and a Review of the Mechanisms Involved. Cancer
prevention research. 4(2).2011.
Nychas, G. E., Skandamis, P.N., Tassou, C.C., and Koutsoumanis, K.P. 2008. Meat spoilage
during distribution. Meat Sci. 78:77-89.
Normanno, G., Corrente, M., Salandra, G., Dambrosio, A., Parisi, A., Greco, G., Bellacicco,
A.L., Celano,G.V.2007. Methicillin-resistant Staphylococcus aureus (MRSA) in foods of
animal origin product in Italy of food .International journal of food microbiology. Volume
117.Issue 2, 30 June, pages 219-222
Nakyinsige K, Fatimah AB, Aghwan ZA, Zulkifli I, Goh YM, Sazili AQ. 2014. Bleeding
Efficiency and Meat Oxidative Stability and Microbiological Quality of New Zealand White
Rabbits Subjected to Halal Slaughter without Stunning and Gas Stun-killing. Asian-
Australas J Anim Sci.; 27 (3):406-13.
Naveena, B. M. and Mendiratta, S.K. 2001.Tenderization of spent hen meat using ginger
extract. British Poultry Science, 42, 344–350.
Ray, B., Kalchayanand, N. and Field, R.A. (1992) Meat spoilage bacteria: are we prepared
to control them? National Provisioner. 206, 22.

204
Raharjo, S., Sofos, J. N.1993.Methodology for measuring malonaldehyde as a product of
lipid peroxidation in muscle tissues: a review. Meat Sci. 1993, 35, 145-169.
Riette L.J .M. van Laack, M. Solomon, B. 1994.Biochemistry of Lean Muscle Tissue as
Related to Water-Holding Capacity. Reciprocal Meat Conference Proceedings, Volume 47,
1994.
Singh, R. K., & Singh, N., 2005. Quality of packaged foods. In J. H. Han (Ed.), Innovations in
food packaging (pp. 24– 44). Amsterdam: Elsevier Academic Press.1-39.
Samelis, J. (2006). Managing microbial spoilage in meat industry. In Food spoilage
microorganisms, pp. 213-286. Edited by C. de W. Blackburn, Cambridge: Woodhead
Publishing Limited.
Schillinger, U., Holzapfel, W. H. (2006). Lactic acid bacteria. In Food spoilage
microorganisms, pp. 213-286. Edited by C. de W. Blackburn, Cambridge: Woodhead
Publishing Limited
Stanbridge, L.H., Davies, A. R. 1998. The microbiology of chill stored meat. The
microbiology of Meat and Poultry, Blackie Academic and Professional, London
(1998),pp.174-219
Schmedes, A., Holmer, G. A. new thiobarbituric acid (TBA) method for determination of
free malonaldehyde(MDA) and hydroperoxides selectivity as a measure of lipid
peroxidation. Journal of American Oil Chemistry Society.1989; 66:813–817.
Strappini, A. C., Metz, J. H. M., Gallo, C. B., & Kemp, B. (2009). Origin and assessment of
bruises in beef cattle at slaughter. Animal, 3(05), 728–736.
Stanley, D. W., 1991. Biological membrane deterioration and associated quality losses in

205
Skibsted, L. H., Bertelsen, G., & Qvist, S., 1994. Quality changes during storage of meat
and slightly preserved meat products. In Proceedings 40th international congress of meat
science and technology (S-II.MP1 pp. 1–10). 28 August-2 September 1994, The Hague,
Netherlands.
Ternstrom, A., Lindberg, A.M. and Molin, G., 1993.Classification of the spoilage flora of
raw and pasteurized bovine milk with special reference to Pseudomonas and Bacillus. J
Appl Bacteriol 75, 25-34.
Urbain, W. M, and J .F. Campbell. 1987. Meat Preservation. In the Science of Meat and
Meat Products. 3rd Edn. (J.F. Price, and B.S. Schweigert, Eds) pp. 371-412. Food and
Nutrition Press, Inc. Westport, CN.
Van Laack, R.L.J.M., and Solomon, M.B. 1994. Biochemistry of lean muscle tissue as
related to water-holding capacity. Reciprocal Meat Conf. Proc. 47: 91-97.
Warriss, P. W. 2001 Postmortem changes in muscles and its convection into meat. Meat
science, an introductory text, pp. 100 – 161. CABI Publishing, Wallingford, UK
Xiong, Y. L., & Decker, E. A., 1995. Alterations in muscle protein functionality by oxidative
and antioxidative processes. Journal of Muscle Foods, 6, 139–160.
Young, L. L., R.D. Reviere, and A.B. Cole. 1988. Fresh red meats: A place to apply modified
atmospheres. Food Technol. 42(9):65.

206
ABSTRACT
SYNERGISTIC EFFECT OF NATURAL ANTIMICROBIALS PRODUCED FROM
FOOD ON FOODBORNE PATHOGENS AND EFFECT OF MEAT PRODUCTION
METHOD ON QUALITY AND SHELF LIFE OF MEAT
by
MAHDI HASSAN HUSSAIN AL-ALI
December 2017
Advisor: Dr. Ahmad R. Heydari
Major: Nutrition and Food Science
Degree: Doctor of Philosophy
Meat is highly perishable food since it contains sufficient nutrients needed to support the
growth of microorganisms which is effect of nutritional value and spoilage of meat. There are
many methods are available to control food pathogens in meat. Using natural antimicrobial may
be is a good option because it is provide many benefits. This study showed the synergistic effect
of individual and combinations of lactoferrin, lysozyme and nisin in-vitro and in-vivo (in meat)
had significant effect (P < 0.05) on reducing the number of foodborne pathogens in meat.
Toxigenic Staphylococcus aureus contamination in meat is a major problem in public health due
to the production of heat-stable enterotoxins. Also, S.aureus expresses an many array of
virulence factors contribute to the ability of S. aureus to cause infection, our results showed that
high percentage (42.9) of S. aureus in meat and 80.9 % of S. aureus isolates contained at least
one enterotoxin gene. The three most common enterotoxin genes in meat were sea gene (61.9%)
followed by seh gene (33.3%) and sei gene (30.1). Some of S. aureus isolates contained more than
one enterotoxin gene. In addition, our results indicated that S. aureus isolates from meat showed
different antimicrobial resistance levels against fourteen antibiotics. Also, S. aureus multidrug
207
resistant were high in meat. There are different types of meat based on the meat production
method. Halal meat is produced without stunning prior to slaughter, resulting in a rapid and
complete bleeding of animals. Our results showed that halal meat production method resulted
in significantly lower residual heme iron than conventional method with stunning (non-halal
method). Microbiological analyses of fresh meat samples showed that halal meat production
method had significantly lower (P < 0.05) microbial count than non-halal meat method. Storage
of meat is critical because during storage even with proper refrigeration, the meat ultimately
undergoes deteriorative changes including microbial spoilage, oxidative changes. Our results
indicated that meat production method significantly affects the meat quality not only for fresh
meat but also during storage. Microbiological analyses of meat samples during storage for three
weeks at 4°C showed that halal meat method had significantly lower (P < 0.05) microbial count
than non-halal meat. Physiochemical analyses showed that quality indicators for meat such as
lipid oxidation, drip loss, pH, and heme iron content were significantly lower (P < 0.05) in halal
meat than non-halal meat during storage. Halal meat processing may be advantageous in
reducing bacterial colonization, increasing the usable shelf life, and improving the quality of the
fresh and stored meat.
208
AUTOBIOGRAPHICAL STATEMENT
Mahdi Al-Ali
I received my Bachelor’s degree in Food Technology in 1985 from Baghdad University, Iraq.
My rank was the first student in the department and the fifth student in college. I earned my
Master’s degree in Food Science and Biotechnology in 1989 at Baghdad University. I started
working in Babylon University, as a lecturer. I taught many undergraduate courses for seven years
then I transferred to Al-qassim green university, as lecturer, where I still faculty member till now.
In 2012 I joined the PhD program in Dr. Ahmad Heydari’s lab, Department of Nutrition and Food
Science at Wayne State University. I published many publications and presentations. Recently I
participated in the following graduate research symposiums
1- Graduate and postdoctoral research symposium, Wayne state University, March 8,2017
2- Midwest graduate research symposium, Toledo University, March 25,2017