synergies in wireless telephony: evidence from the
TRANSCRIPT
Journal of Economics and Management Strategy, 6:3, 497-527, 1997
Synergies in Wireless Telephony: Evidence from the Broadband PCS Auctions*
Lawrence M. Ausubel, Peter Cramton, R. Preston McAfee, and John McMillan
Abstract
We examine bid data from the first two broadband PCS spectrum auctions for evidence of value
synergies. First, we estimate a benchmark regression for the determinants of final auction prices.
Then, we include variables reflecting the extent to which bidders ultimately won or already owned
the adjacent wireless properties. Consistent with geographic synergies in an ascending-bid
auction, prices were higher when the highest-losing bidder had adjacent licenses. The footprints of
winning bidders suggest that they were often successful in realizing these synergies.
JEL No.: D44 (Auctions), L96 (Telecommunications)
Keywords: Auctions, Multi-Object Auctions, Spectrum Auctions, Synergies, PCS
Send comments to:
Prof. Lawrence M. Ausubel
Department of Economics
University of Maryland
College Park, MD 20742-7211
Prof. Peter Cramton
Department of Economics
University of Maryland
College Park, MD 20742-7211
Prof. R. Preston McAfee
Department of Economics
University of Texas
Austin, TX 78712-1173
Prof. John McMillan
School of Intl Rel & Pac Studs
Univ of California San Diego
La Jolla, CA 92093
(301) 405-3495
(301) 405-6987
(512) 475-8533
(619) 534-5967
*We thank Ronald Harstad, Michael Rothkopf, and three referees for helpful comments, and the National
Science Foundation for support. The authors advised various bidding firms and the FCC during the
auctions; the views expressed are our own and not those of the companies we advised, nor of the FCC. We
are grateful to Neile J. Quintero for expert research assistance.

Synergies in Wireless Telephony: Evidence from the MTA Auction
Lawrence M. Ausubel, Peter Cramton, R. Preston McAfee, and John McMillan
Bidders are likely to be willing to pay more for two geographically contiguous PCS
licenses than two equivalent non-contiguous licenses, and a single bidder may be
willing to pay more for two licenses than would two separate bidders.
– FCC SECOND REPORT AND ORDER (1994, ¶91)
1 Introduction
A contentious issue in the design of the Federal Communications Commission (FCC) auctions of
personal communications services (PCS) licenses concerned the importance of synergies. If large synergies
are prevalent among the licenses being offered, then the simultaneous ascending auction mechanism the
FCC adopted, which does not permit all-or-nothing bids on sets of licenses, might be expected to perform
poorly. Bidders who must purchase multiple licenses to achieve value are exposed to the risk of ending up
with an incomplete aggregation, and thus will be hesitant to bid aggressively. Such hesitation could result in
low prices and an inefficient assignment of licenses. This article investigates the importance of local
geographic synergies in the first two broadband PCS auctions.1 We find evidence that local synergies did
affect the bidding, but no evidence that synergies failed to be achieved.
Synergies (or complementarities) among licenses may be conveniently classified as local or global.2 We
define local synergies as those gains in value that specifically arise from obtaining two or more
geographically neighboring licenses. We define global synergies as those gains in value which accrue from
obtaining increased numbers of licenses or markets: economies of scale or scope among multiple licenses
which arise irrespective of their geographic locations.3
1On the form of the auctions, see Cramton (1997) and McAfee and McMillan (1996). The AB auction, which began on December
5, 1994 and ended on March 13, 1995, offered two 30 MHz licenses (blocks A and B) in each of 51 geographic areas known as major
trading areas, or MTAs, minus three licenses already awarded under a pioneer preference, for a total of 99 licenses for sale. The
geographical extent of the MTAs is shown in Figure 1. In the C auction, which began on December 18, 1995 and ended on May 6,
1996, one 30 MHz license (block C) was auctioned in each of 493 basic trading areas (BTAs). Each MTA consists of about 10 BTAs.
2Theoretical treatments of synergies in auctions include Bernheim and Whinston (1986), Gale (1990), Bykowsky, Cull, and
Ledyard (1995), Jehiel, Moldovanu, and Stacchetti (1996), Krishna and Rosenthal (1997), Rosenthal and Wang (1995),
Bikhchandani and Mamer (1995), Rothkopf, Pekec, and Harstad (1995), and Branco (1996).
3Our dichotomy between local and global is not meant to cover all synergies. Synergies also arise from a bidder's existing
infrastructure. For example, a bidder may provide local telephone service in two nonadjacent regions and have a fiber-optic cable that

2
Local synergies might be present for three reasons. First, consumers desire “seamless roaming,”
permitting them to use their telephones away from their home base. While seamless roaming can be
arranged by contracts between independent providers, such contracts require coordination on a given
technology and some management efforts. Second, there is a problem of boundary interference, requiring
coordination of distinct PCS providers at the borders of their territories. Third, there may be local
advertising and management economies of scale, in that advertisements may spill over license boundaries,
and the efficient scale of regional management might be larger than a single license. Finally, local synergies
may stem from increased market power.
Global synergies might occur because of scale economies in the deployment of PCS technology or in
management of the network, or because consumers obtain higher values from PCS phones the more places
their phones can be used. In addition, improved coordination in the pricing of the final services through
multimarket contact (Parker and Roller 1996) might provide another source of global synergies. The
apparent desire of three firms to provide a nationwide wireless service (see section 2, below) suggests that
global synergies in PCS may exist (although it might simply be that local synergies are pervasive, and thus
can only be fully achieved by a nationwide network). We examine global synergies by assessing whether
firms with larger PCS winnings were willing to bid higher. However, our primary focus in this article is on
local synergies.
The FCC's choice of auction form was controversial. Bykowsky et al. (1995, p. 5), for example,
asserted that an “important feature of the PCS bidding environment is the existence of synergies from
owning specific combinations of licenses. Because of these synergies, the value a bidder places on a
particular PCS license will depend upon what other, for instance, geographically adjacent spectrum license
it owns.” They argued that the auction mechanism the FCC chose, with license-by-license bidding, could
generate low revenue and an inefficient allocation. A bidder attempting to assemble a set of licenses might
find that a single, critical license is necessary not only for its desired aggregation, but also for another firm's.
In attempting to acquire this essential license, both firms are willing to pay more than the license's
stand-alone, or individual, value. If synergies are large, the loser of a contest to acquire a critical license may
find itself holding other licenses which, because the set is incomplete, are priced at more than their value.
The risk of this ruinous outcome will make the bidders hesitant to bid aggressively to assemble their desired
aggregation, and can lead to an inefficient allocation. Bykowsky et al. dubbed this phenomenon “mutually
destructive bidding”; it is also referred to less dramatically as the “exposure problem.” To prevent this, they
suggested the FCC should have permitted package bidding (also known as combinational or combinatorial
connects the two regions. In this case, the bidder may value the two regions together at more than the sum of the individual
valuations.

3
bidding), where bidders can submit all-or-nothing bids for sets of licenses. In contrast, other commentators
argued that local synergies would be realized by license-by-license bidding, and that the synergies were not
so extreme and heterogeneous to warrant the added complexity of package bidding.
Synergies, therefore, have major implications for the design of spectrum-license and other
multiple-object auctions. If synergies are extreme, package bidding may be warranted in order to overcome
the exposure problem. But if synergies are modest, auctions with package bidding offer little advantage, and
given the complexity of these auctions, the simultaneous ascending auction is probably the more practical
design.4
Local synergies are arguably more important for the auction design than global synergies, because
global synergies would seem less likely to give rise to an exposure problem. With local synergies, specific
licenses are needed to make up complete license bundles; whereas with global synergies, the value of a
license bundle reflects variables like the total population covered by the licenses in the bundle. Typically,
realization of global synergies does not require a firm to acquire some other specific license, and thus the
substitution possibilities available with global synergies are greater than with local synergies. The
discontinuities in license values that give rise to the exposure problem therefore appear less severe with
global synergies than with local synergies.5
In this article, we examine the auction prices for evidence of local synergies. Suppose that a bidder was
expecting to realize greater value from a given license, because the bidder was also expecting to win a
geographically adjacent license. The heightened willingness to pay would then be likely to be reflected in an
unexplained high price, until the local synergy is controlled for. Thus, one hypothesis might be that the final
prices of licenses would reflect the extent to which the winning bidders own or win geographically adjacent
wireless properties. However, given the ascending-bid nature of the auction, the final price ought to reflect
the value of the last bidder to drop out in the market. This marginal bidder would be willing to bid higher for
the license if it expected to win adjacent licenses and if synergies were important. Hence, a second (and
ultimately preferable) hypothesis might be that the final prices of licenses would reflect the extent to which
the marginal (i.e., highest losing) bidders own or win adjacent properties.
In what follows, we first examine the determinants of the PCS auction prices using non-synergistic
variables. We find that a simple model with six market variables provides a parsimonious account of the
determinants of PCS prices. All of the variables have the predicted signs, and they explain a large portion of
4On the FCC's selection of licenses-by-license bidding over package bidding, see McMillan (1994). For a different situation – the
scheduling of railroads – in which synergies are clearly so important that package bidding is needed, see Brewer and Plott (1996).
5On the other hand, if bidders were to view the acquisition of Los Angeles or New York as critical for offering “nationwide”
service, then it would be possible for these to nevertheless give rise to an exposure problem.

4
the variation in realized prices. We then introduce several distinct formulations of how local synergies might
enter into the final auction price. In all of these formulations, a bidder holding an adjacent license is
modeled as being willing to pay more for a given license. We construct variables associated with the extent
to which the winning bidders hold neighboring licenses and the extent to which the marginal bidders hold
neighboring licenses. The winning-bidder measures of synergy are found to be statistically insignificant.
However, all of the marginal-bidder measures of synergy have the predicted positive sign and are
statistically significant in both auctions. Therefore, it appears that local synergies are a significant factor in
determining PCS prices.
Although local synergies are seen in the data, there is reason to expect that the synergies are modest,
especially in the AB auction with MTA licenses.6 First, a bound on their importance is the cost of
coordinating via contracts rather than operating adjacent regions within a single firm, and it would be
surprising if this cost (which involves not only contracting costs but possibly lost scale economies) were
very large for the MTAs. Second, the MTAs by design are large enough to minimize many of the local
synergies. The MTA boundaries were drawn by Rand McNally (1994) to capture trading synergies. Thus,
their very size and design insures that boundary interference problems usually arise in areas of low
population density, and that there are few marketing spillovers across MTAs. The choice of MTAs by the
FCC for the AB auction was in fact made in order that the license regions encompass local synergies.
With the much smaller BTA licenses offered in the C auction, one might have expected local synergies
to be more important than in the AB auction. However, this is not found in our analysis of the auction
prices. Firms were again willing to bid more when holding adjacent licenses, but the effect is no stronger
than in the AB auction.
In a complementary article, Moreton and Spiller (1996) also empirically examine license
interdependencies in the AB and C auctions. Similar to our findings, they conclude that auction
participants were willing to bid more for a license “if it was adjacent to another license that they
ultimately won in the auction, indicating the presence of local synergies between licenses” (Moreton and
Spiller 1996, p. 2). They also report that a marginal bidder in the C auction tended to bid more when
facing a winning bidder with nearby PCS acquisitions, and tended to bid less when facing a bidder with
nearby cellular holdings. Taken together, our article and theirs provide good robustness checks on one
another, as the explanatory variables in the two studies are defined somewhat differently, generated from
different sources and analyzed differently, yet the two approaches reach similar conclusions. In
6Paul Milgrom and Robert Wilson, for example, in the Reply Comments of Pacific Bell to the FCC during the auction-design
process, were notably skeptical of claims that local synergies would be so large as to generate severe exposure problems in the
bidding.
5
particular, our demographic variables are probably superior in that we include a variable representing the
number of microwave incumbents requiring relocation, and we utilize the likely buildout area (as
opposed to the gross land area) in calculating population density. Meanwhile, Moreton and Spiller's
cellular synergy variables are probably superior, as they are constructed using county-level data (whereas
ours are constructed using BTA-level data, and cellular boundaries do not coincide with BTA
boundaries). Finally, the greatest divergence between the articles is the initial focus of Moreton and
Spiller on attempting to explain the auction prices using various political economy variables, such as the
political-party affiliations of the PUC commissioners in the relevant states. Our interpretation – although
not necessarily theirs – of their regression results is that the political economy variables pale in
significance to the demographic and synergy variables, and that political economy factors can be fairly
said to have not played a major role in determining license prices.
A related empirical investigation of synergies is Gandal's (1995) study of the sequential auction of
Israeli cable television licenses. Gandal finds evidence of local synergies for these licenses. However, these
licenses cover regions that are only a tiny fraction of the size of BTAs. Moreover, the license boundaries in
the Israeli auctions cross densely populated regions.
In the next section, we describe the bid data. The third section provides the benchmark model. The
fourth tests for local synergies, and the fifth concludes.
2 The Bid Data
The details of the auctions are provided in Cramton (1997) and McAfee and McMillan (1996). We
confine ourselves here to a discussion of the features of the auction outcomes salient for our investigation of
local synergies.
In the AB auction, many bidders were ineligible to bid in certain regions because of cellular operations;
the FCC forbade companies with cellular licenses in a given region from bidding for 30 MHz PCS licenses
in that region. This restriction created significant variation in competition across MTAs. In particular, with
one exception, the Bell Operating Companies held cellular licenses in the areas of their wireline operations,
and thus were ineligible to bid for PCS licenses in their home bases.
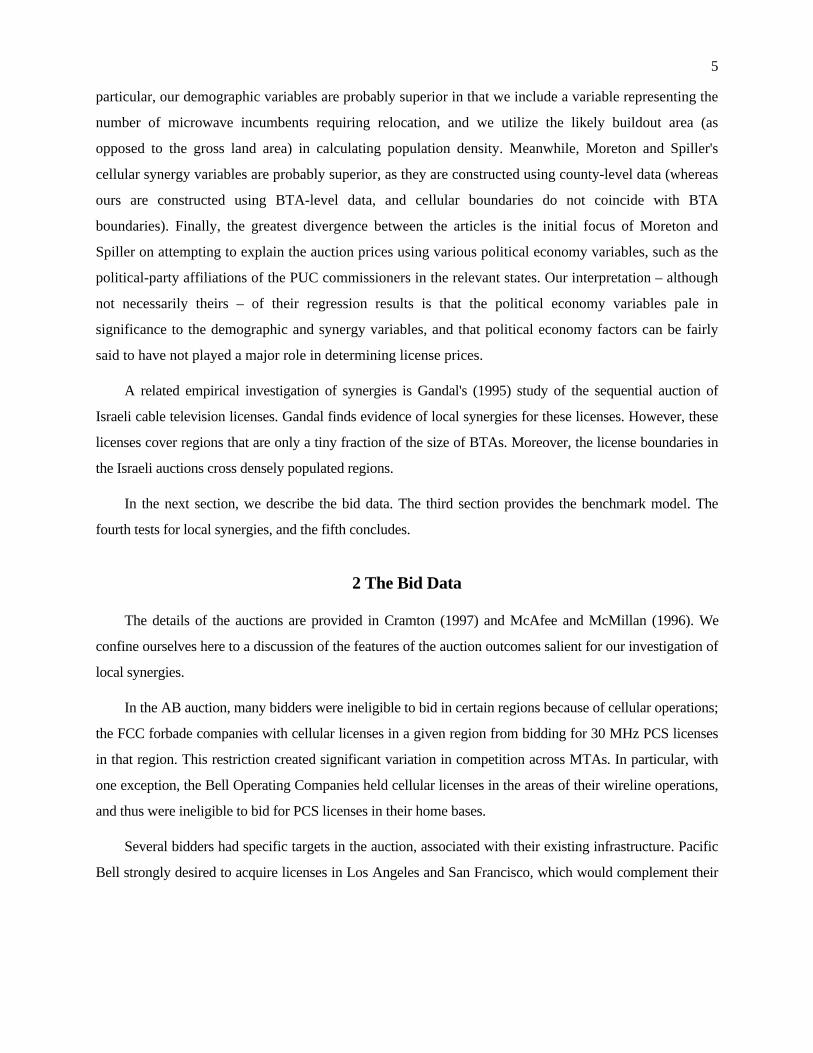
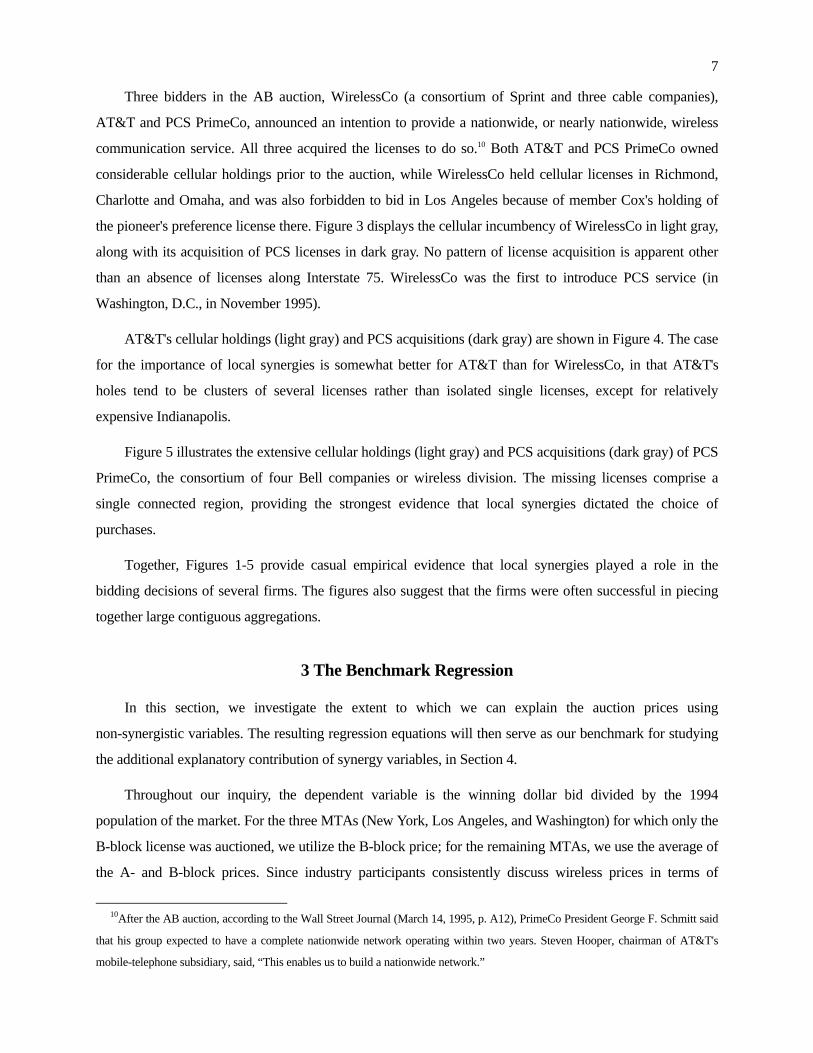
Several bidders had specific targets in the auction, associated with their existing infrastructure. Pacific
Bell strongly desired to acquire licenses in Los Angeles and San Francisco, which would complement their

6
existing wireline network in these regions.7 Ameritech and Bell South apparently desired PCS licenses in
the neighborhood of their cellular and wireline operations. Powertel, which acquired licenses in Memphis,
Birmingham, Jacksonville, appears to have followed a regional strategy consistent with the existence of
local synergies.
Figure 1 shows the winning bidders in the AB auction. In addition, it shows the cellular/PCS footprints
of three particular bidders: Ameritech, Western PCS, and American Portable. Ameritech's PCS winnings
(dark red) clearly complement its cellular licenses (light red). Western PCS acquired licenses (dark yellow)
adjacent to its cellular licenses (light yellow) in the West. In contrast, American Portable won licenses (dark
green) that are disjoint, although three of the five licenses that American Portable won are adjacent to its
cellular footprint (light green).
American Portable is a good example of a second group of bidders that did not appear to follow any
particular geographically based strategy, nor were they seeking nationwide coverage. For American
Portable, it does not appear that local synergies played a significant role in the acquisitions.
Figure 2 shows the footprints of the top-ten winners in the C auction. In the C auction, only small firms
were eligible to participate. Hence, none of the C-block bidders had sizable cellular holdings; most were
new entrants into the wireless communications business.8
Competition was much more intense in the C auction, presumably increasing the exposure problem.
Nonetheless, several firms did acquire clusters of adjacent licenses in the C auction. The final footprints
provide evidence that local synergies mattered and were often obtained. However, the bidding of the largest
bidder, NextWave, suggests that local synergies were not overly decisive. NextWave pursued a strategy of
acquiring major markets around the United States. Spending nearly $5 billion, it possessed the resources to
instead acquire large contiguous regions in a few parts of the country, but it chose not to do so. NextWave's
strategy would not make sense if local synergies were large at the BTA level.9
7Pacific Bell was the only Bell Operating Company eligible to buy licenses in its wireline area, a consequence of the spinoff of its
wireless division, AirTouch Communications, which joined with Bell Atlantic, Nynex and U.S. West to form PCS PrimeCo.
8Some of the bidders have ties to firms that do have cellular holdings. However, we do not have any way to assess the strength of
these ties, and so ignore them. The auction rules explicitly exclude a cellular incumbent from exercising control of a bidder in the C
auction.
9However, NextWave's ability to pursue a strategy of a few large regional clusters may have been hampered by the restriction that
no bidder can hold more than 98 C and F block licenses. Since NextWave was near this constraint, each license had a constant
opportunity cost reflecting the FCC constraint. This may have discouraged NextWave from acquiring the small neighbors of its major
markets.
7
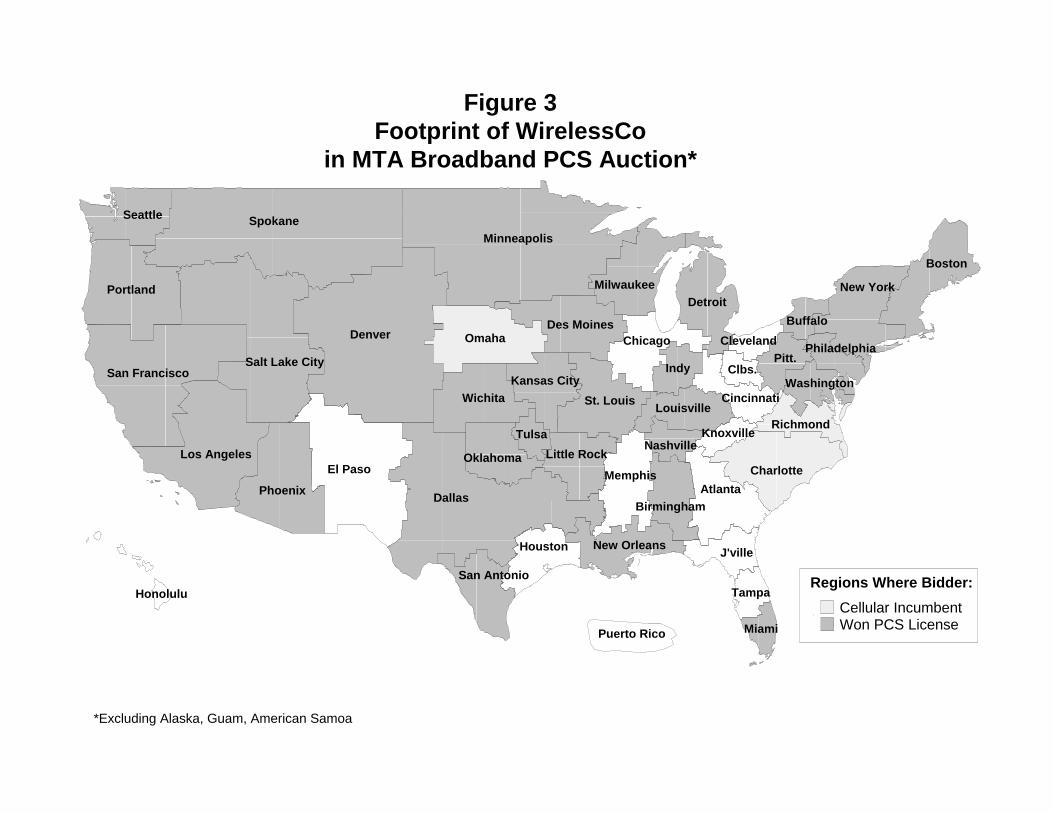
Three bidders in the AB auction, WirelessCo (a consortium of Sprint and three cable companies),
AT&T and PCS PrimeCo, announced an intention to provide a nationwide, or nearly nationwide, wireless
communication service. All three acquired the licenses to do so.10 Both AT&T and PCS PrimeCo owned
considerable cellular holdings prior to the auction, while WirelessCo held cellular licenses in Richmond,
Charlotte and Omaha, and was also forbidden to bid in Los Angeles because of member Cox's holding of
the pioneer's preference license there. Figure 3 displays the cellular incumbency of WirelessCo in light gray,
along with its acquisition of PCS licenses in dark gray. No pattern of license acquisition is apparent other
than an absence of licenses along Interstate 75. WirelessCo was the first to introduce PCS service (in
Washington, D.C., in November 1995).
AT&T's cellular holdings (light gray) and PCS acquisitions (dark gray) are shown in Figure 4. The case
for the importance of local synergies is somewhat better for AT&T than for WirelessCo, in that AT&T's
holes tend to be clusters of several licenses rather than isolated single licenses, except for relatively
expensive Indianapolis.
Figure 5 illustrates the extensive cellular holdings (light gray) and PCS acquisitions (dark gray) of PCS
PrimeCo, the consortium of four Bell companies or wireless division. The missing licenses comprise a
single connected region, providing the strongest evidence that local synergies dictated the choice of
purchases.
Together, Figures 1-5 provide casual empirical evidence that local synergies played a role in the
bidding decisions of several firms. The figures also suggest that the firms were often successful in piecing
together large contiguous aggregations.
3 The Benchmark Regression
In this section, we investigate the extent to which we can explain the auction prices using
non-synergistic variables. The resulting regression equations will then serve as our benchmark for studying
the additional explanatory contribution of synergy variables, in Section 4.
Throughout our inquiry, the dependent variable is the winning dollar bid divided by the 1994
population of the market. For the three MTAs (New York, Los Angeles, and Washington) for which only the
B-block license was auctioned, we utilize the B-block price; for the remaining MTAs, we use the average of
the A- and B-block prices. Since industry participants consistently discuss wireless prices in terms of
10After the AB auction, according to the Wall Street Journal (March 14, 1995, p. A12), PrimeCo President George F. Schmitt said
that his group expected to have a complete nationwide network operating within two years. Steven Hooper, chairman of AT&T's
mobile-telephone subsidiary, said, “This enables us to build a nationwide network.”
8
“$/pop” (i.e., the dollar bid of the region divided by its population) – and since there are good reasons to
believe that, ceteris paribus, the value of a license should be roughly proportional to the population it serves
– we divide the final dollar bids by the estimated 1994 population. Empirically, the AB prices ranged from
$0.60/pop in Guam to $30.39/pop in Chicago. The C prices (net of the 25% bidding credit) ranged from
$1.42 in Pittsburg, KS to $74.85 in the US Virgin Islands. Because Alaska, Guam, and American Samoa are
outliers in a number of dimensions, we drop them from our benchmark analysis, bringing the sample size to
48 in the AB auction and 487 in the C auction.
An alternative to our use of the winning bid as the dependent variable is to instead use the highest-
losing bid. Given the ascending auction design, the marginal bidder with private values should be willing to
bid up to its value before dropping out. Hence, absent jump bidding, the highest-losing bid should be no
more than two bid increments below the marginal bidder’s value and no greater than the marginal bidder’s
value. The winning bid should be no more than one bid increment below the marginal bidder’s value and no
greater than one bid increment above. Thus, the winning bid is a closer approximation to the marginal
bidder’s value.
The large discrepancy in prices between the AB and the C auctions suggests that the prices in these
auctions do not reflect bidder values. However, what is important in our analysis is not whether prices match
values in absolute terms, but in relative terms. The auction design encourages bidders to shift to licenses that
represent better values. This tendency, which was clearly observed in the bidding, is likely to produce
relative prices in line with relative valuations, even if budget constraints or a lack of competition prevent
prices from matching true values.
Six variables were found to be useful for explaining prices in the AB and C auctions. The first of these
variables represents the degree of competitiveness of the bidding for the particular license; the other five
measure determinants of the inherent value of the license area to bidders. Several of the variables have
enormous variation, suggesting a nonlinear relationship, so we use the logarithms of these variables in the
benchmark regression (and all subsequent regressions). The explanatory variables are discussed below.
• Eligibility. As discussed earlier, telecommunications companies with significant cellular holdings in an
MTA were ineligible to bid on the PCS licenses. The competitiveness of the bidding (and the ensuing
price) for a particular MTA would be expected to depend on how many bidders were eligible; more than
the raw number of eligible bidders, what would seem most important is the size of eligible bidders.
Utilizing the upfront payment submitted by each bidder as a measure of size, we compute our
explanatory variable by summing the upfront payments of all bidders who were eligible to bid on a
9
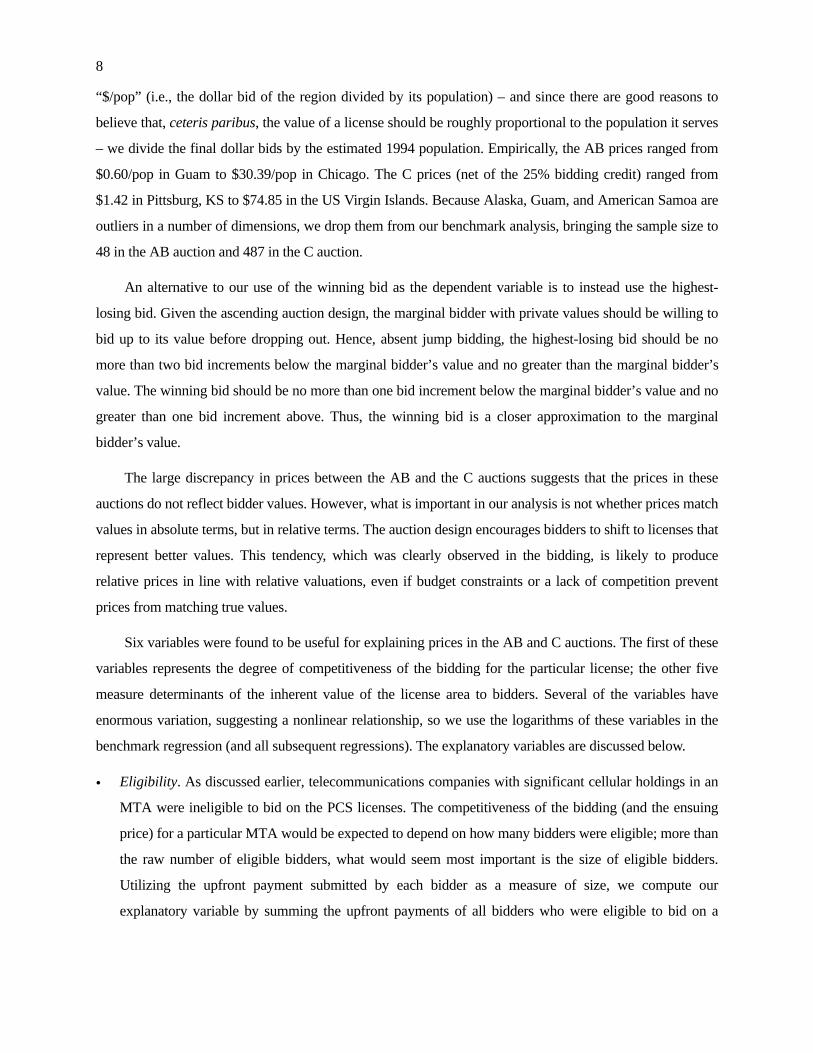
particular MTA, and dividing this by the total upfront payments of all bidders in the auction.11 Observe
that this variable was public information at the start of each auction and – as indicated in Table 1 – it
varied from 0.305 to 0.809 in the AB auction. Because C-block bidders did not have significant cellular
holdings, there were few instances of ineligibility in the C auction. Hence, for the C auction, this
measure has a standard deviation only one-fifth as large as in the AB auction (ranging from .597 to
.860) and is likely to be less important.
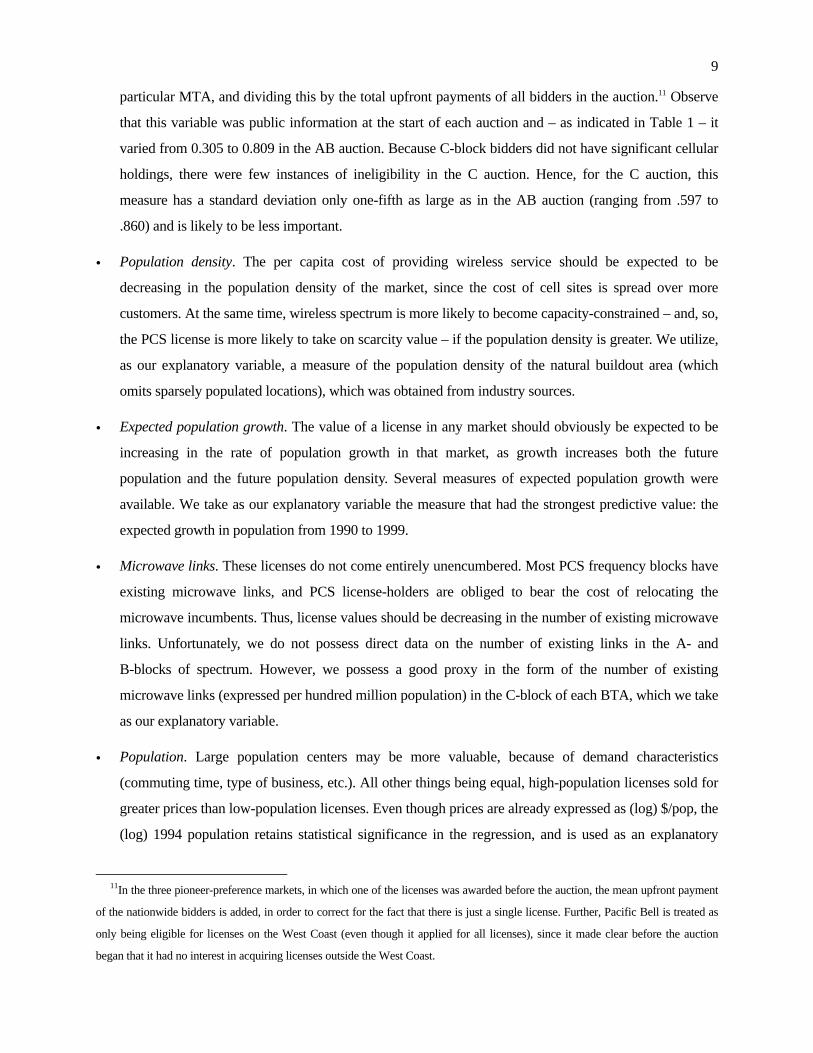
• Population density. The per capita cost of providing wireless service should be expected to be
decreasing in the population density of the market, since the cost of cell sites is spread over more
customers. At the same time, wireless spectrum is more likely to become capacity-constrained – and, so,
the PCS license is more likely to take on scarcity value – if the population density is greater. We utilize,
as our explanatory variable, a measure of the population density of the natural buildout area (which
omits sparsely populated locations), which was obtained from industry sources.
• Expected population growth. The value of a license in any market should obviously be expected to be
increasing in the rate of population growth in that market, as growth increases both the future
population and the future population density. Several measures of expected population growth were
available. We take as our explanatory variable the measure that had the strongest predictive value: the
expected growth in population from 1990 to 1999.
• Microwave links. These licenses do not come entirely unencumbered. Most PCS frequency blocks have
existing microwave links, and PCS license-holders are obliged to bear the cost of relocating the
microwave incumbents. Thus, license values should be decreasing in the number of existing microwave
links. Unfortunately, we do not possess direct data on the number of existing links in the A- and
B-blocks of spectrum. However, we possess a good proxy in the form of the number of existing
microwave links (expressed per hundred million population) in the C-block of each BTA, which we take
as our explanatory variable.
• Population. Large population centers may be more valuable, because of demand characteristics
(commuting time, type of business, etc.). All other things being equal, high-population licenses sold for
greater prices than low-population licenses. Even though prices are already expressed as (log) $/pop, the
(log) 1994 population retains statistical significance in the regression, and is used as an explanatory
11In the three pioneer-preference markets, in which one of the licenses was awarded before the auction, the mean upfront payment
of the nationwide bidders is added, in order to correct for the fact that there is just a single license. Further, Pacific Bell is treated as
only being eligible for licenses on the West Coast (even though it applied for all licenses), since it made clear before the auction
began that it had no interest in acquiring licenses outside the West Coast.
10
variable.
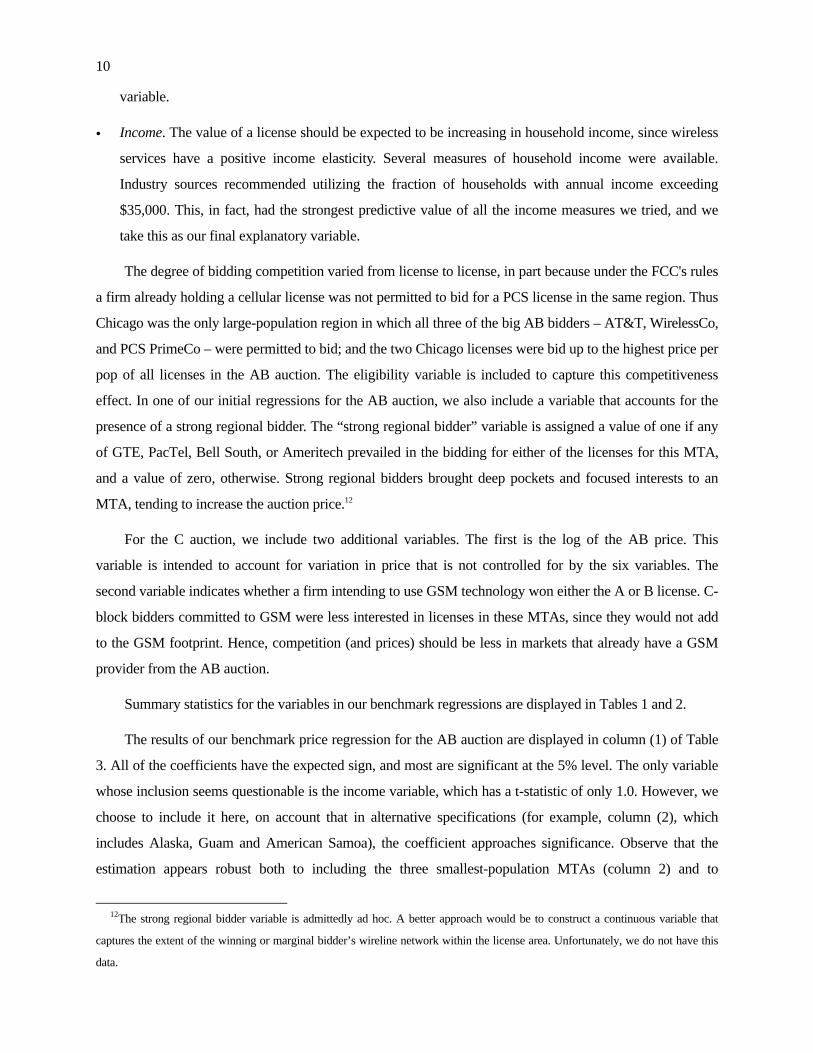
• Income. The value of a license should be expected to be increasing in household income, since wireless
services have a positive income elasticity. Several measures of household income were available.
Industry sources recommended utilizing the fraction of households with annual income exceeding
$35,000. This, in fact, had the strongest predictive value of all the income measures we tried, and we
take this as our final explanatory variable.
The degree of bidding competition varied from license to license, in part because under the FCC's rules
a firm already holding a cellular license was not permitted to bid for a PCS license in the same region. Thus
Chicago was the only large-population region in which all three of the big AB bidders – AT&T, WirelessCo,
and PCS PrimeCo – were permitted to bid; and the two Chicago licenses were bid up to the highest price per
pop of all licenses in the AB auction. The eligibility variable is included to capture this competitiveness
effect. In one of our initial regressions for the AB auction, we also include a variable that accounts for the
presence of a strong regional bidder. The “strong regional bidder” variable is assigned a value of one if any
of GTE, PacTel, Bell South, or Ameritech prevailed in the bidding for either of the licenses for this MTA,
and a value of zero, otherwise. Strong regional bidders brought deep pockets and focused interests to an
MTA, tending to increase the auction price.12
For the C auction, we include two additional variables. The first is the log of the AB price. This
variable is intended to account for variation in price that is not controlled for by the six variables. The
second variable indicates whether a firm intending to use GSM technology won either the A or B license. C-
block bidders committed to GSM were less interested in licenses in these MTAs, since they would not add
to the GSM footprint. Hence, competition (and prices) should be less in markets that already have a GSM
provider from the AB auction.
Summary statistics for the variables in our benchmark regressions are displayed in Tables 1 and 2.
The results of our benchmark price regression for the AB auction are displayed in column (1) of Table
3. All of the coefficients have the expected sign, and most are significant at the 5% level. The only variable
whose inclusion seems questionable is the income variable, which has a t-statistic of only 1.0. However, we
choose to include it here, on account that in alternative specifications (for example, column (2), which
includes Alaska, Guam and American Samoa), the coefficient approaches significance. Observe that the
estimation appears robust both to including the three smallest-population MTAs (column 2) and to
12The strong regional bidder variable is admittedly ad hoc. A better approach would be to construct a continuous variable that
captures the extent of the winning or marginal bidder’s wireline network within the license area. Unfortunately, we do not have this
data.
11
weighting the observations by (log of) 1994 population (column 3). If strong regional winner is added to the
regression equation, its coefficient is positive and is also significant at the 5% level (column 4).
Moreover, the six basic explanatory variables go a long way toward explaining the variation in prices.
The baseline regression of column (1) has an adjusted R2 of 0.60. The adjusted R2 for the variations on the
regression in columns (2)-(5) attain values as high as 0.74. Without inclusion of any variables to account for
geographic synergies, we gain a great deal of insight into the determination of AB prices.13
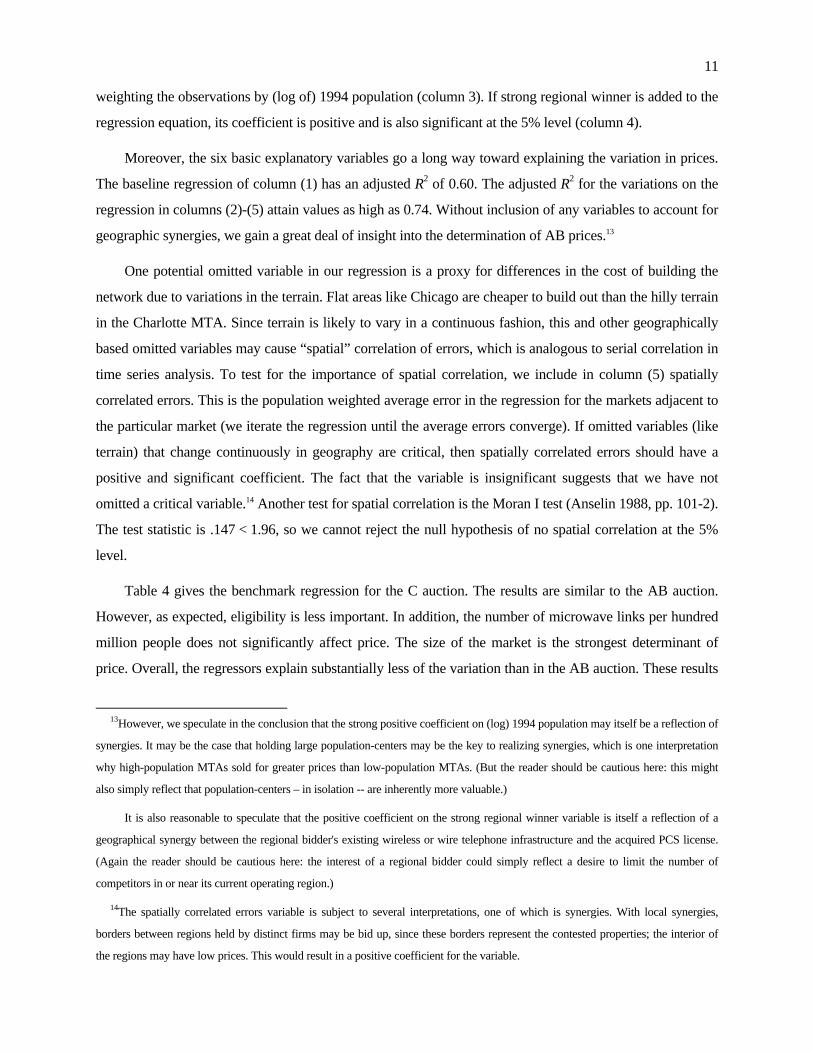
One potential omitted variable in our regression is a proxy for differences in the cost of building the
network due to variations in the terrain. Flat areas like Chicago are cheaper to build out than the hilly terrain
in the Charlotte MTA. Since terrain is likely to vary in a continuous fashion, this and other geographically
based omitted variables may cause “spatial” correlation of errors, which is analogous to serial correlation in
time series analysis. To test for the importance of spatial correlation, we include in column (5) spatially
correlated errors. This is the population weighted average error in the regression for the markets adjacent to
the particular market (we iterate the regression until the average errors converge). If omitted variables (like
terrain) that change continuously in geography are critical, then spatially correlated errors should have a
positive and significant coefficient. The fact that the variable is insignificant suggests that we have not
omitted a critical variable.14 Another test for spatial correlation is the Moran I test (Anselin 1988, pp. 101-2).
The test statistic is .147 < 1.96, so we cannot reject the null hypothesis of no spatial correlation at the 5%
level.
Table 4 gives the benchmark regression for the C auction. The results are similar to the AB auction.
However, as expected, eligibility is less important. In addition, the number of microwave links per hundred
million people does not significantly affect price. The size of the market is the strongest determinant of
price. Overall, the regressors explain substantially less of the variation than in the AB auction. These results
13However, we speculate in the conclusion that the strong positive coefficient on (log) 1994 population may itself be a reflection of
synergies. It may be the case that holding large population-centers may be the key to realizing synergies, which is one interpretation
why high-population MTAs sold for greater prices than low-population MTAs. (But the reader should be cautious here: this might
also simply reflect that population-centers – in isolation -- are inherently more valuable.)
It is also reasonable to speculate that the positive coefficient on the strong regional winner variable is itself a reflection of a
geographical synergy between the regional bidder's existing wireless or wire telephone infrastructure and the acquired PCS license.
(Again the reader should be cautious here: the interest of a regional bidder could simply reflect a desire to limit the number of
competitors in or near its current operating region.)
14The spatially correlated errors variable is subject to several interpretations, one of which is synergies. With local synergies,
borders between regions held by distinct firms may be bid up, since these borders represent the contested properties; the interior of
the regions may have low prices. This would result in a positive coefficient for the variable.
12
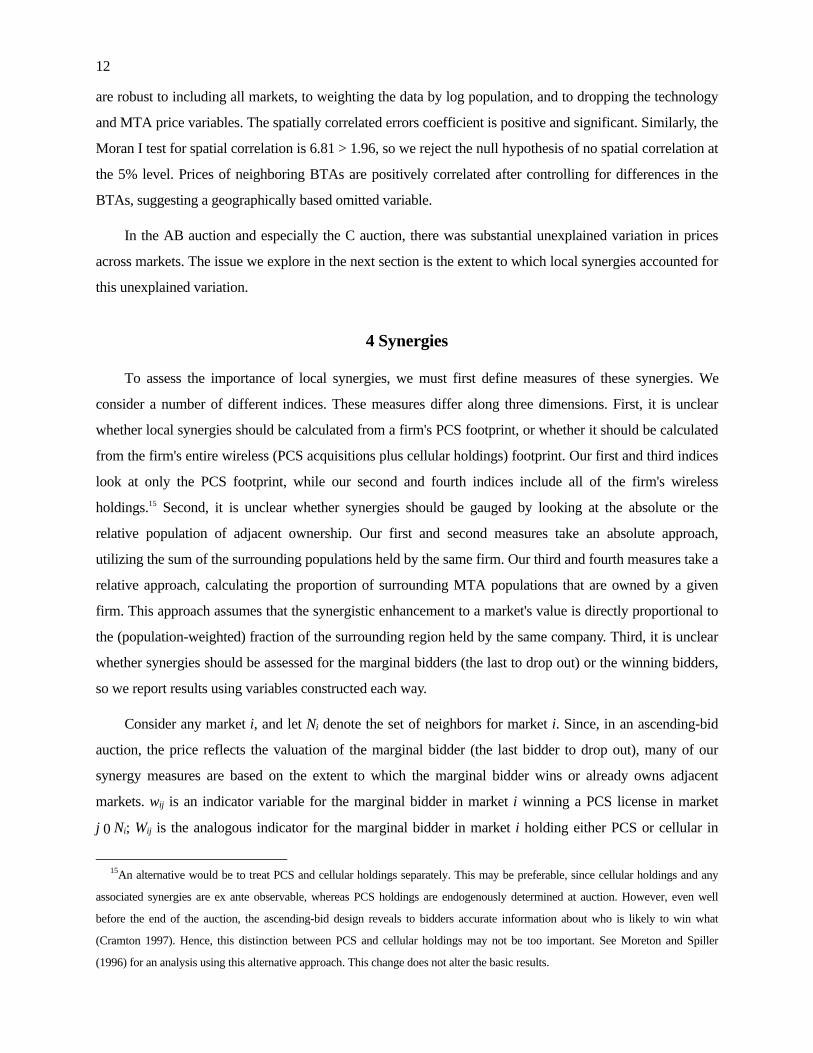
are robust to including all markets, to weighting the data by log population, and to dropping the technology
and MTA price variables. The spatially correlated errors coefficient is positive and significant. Similarly, the
Moran I test for spatial correlation is 6.81 > 1.96, so we reject the null hypothesis of no spatial correlation at
the 5% level. Prices of neighboring BTAs are positively correlated after controlling for differences in the
BTAs, suggesting a geographically based omitted variable.
In the AB auction and especially the C auction, there was substantial unexplained variation in prices
across markets. The issue we explore in the next section is the extent to which local synergies accounted for
this unexplained variation.
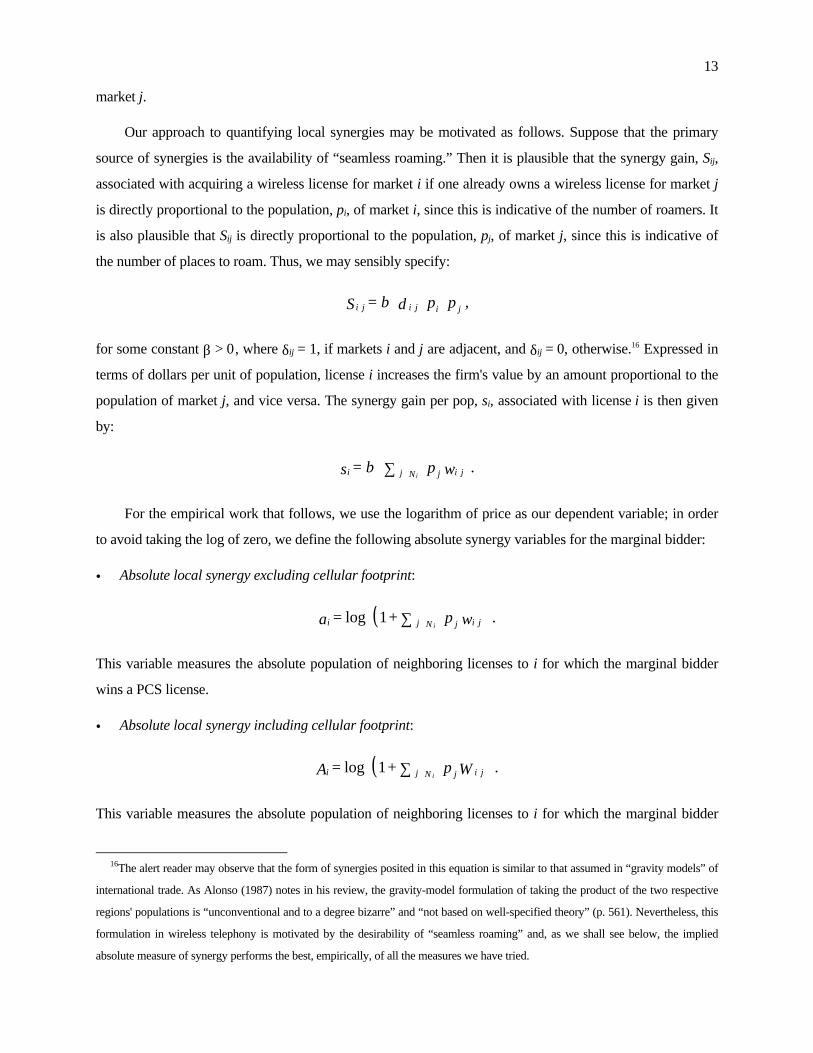
4 Synergies
To assess the importance of local synergies, we must first define measures of these synergies. We
consider a number of different indices. These measures differ along three dimensions. First, it is unclear
whether local synergies should be calculated from a firm's PCS footprint, or whether it should be calculated
from the firm's entire wireless (PCS acquisitions plus cellular holdings) footprint. Our first and third indices
look at only the PCS footprint, while our second and fourth indices include all of the firm's wireless
holdings.15 Second, it is unclear whether synergies should be gauged by looking at the absolute or the
relative population of adjacent ownership. Our first and second measures take an absolute approach,
utilizing the sum of the surrounding populations held by the same firm. Our third and fourth measures take a
relative approach, calculating the proportion of surrounding MTA populations that are owned by a given
firm. This approach assumes that the synergistic enhancement to a market's value is directly proportional to
the (population-weighted) fraction of the surrounding region held by the same company. Third, it is unclear
whether synergies should be assessed for the marginal bidders (the last to drop out) or the winning bidders,
so we report results using variables constructed each way.
Consider any market i, and let Ni denote the set of neighbors for market i. Since, in an ascending-bid
auction, the price reflects the valuation of the marginal bidder (the last bidder to drop out), many of our
synergy measures are based on the extent to which the marginal bidder wins or already owns adjacent
markets. wij is an indicator variable for the marginal bidder in market i winning a PCS license in market
j 0 Ni; Wij is the analogous indicator for the marginal bidder in market i holding either PCS or cellular in
15An alternative would be to treat PCS and cellular holdings separately. This may be preferable, since cellular holdings and any
associated synergies are ex ante observable, whereas PCS holdings are endogenously determined at auction. However, even well
before the end of the auction, the ascending-bid design reveals to bidders accurate information about who is likely to win what
(Cramton 1997). Hence, this distinction between PCS and cellular holdings may not be too important. See Moreton and Spiller
(1996) for an analysis using this alternative approach. This change does not alter the basic results.
13
market j.
Our approach to quantifying local synergies may be motivated as follows. Suppose that the primary
source of synergies is the availability of “seamless roaming.” Then it is plausible that the synergy gain, Sij,
associated with acquiring a wireless license for market i if one already owns a wireless license for market j
is directly proportional to the population, pi, of market i, since this is indicative of the number of roamers. It
is also plausible that Sij is directly proportional to the population, pj, of market j, since this is indicative of
the number of places to roam. Thus, we may sensibly specify:
for some constant β > 0, where δij = 1, if markets i and j are adjacent, and δij = 0, otherwise.16 Expressed in
terms of dollars per unit of population, license i increases the firm's value by an amount proportional to the
population of market j, and vice versa. The synergy gain per pop, si, associated with license i is then given
by:
For the empirical work that follows, we use the logarithm of price as our dependent variable; in order
to avoid taking the log of zero, we define the following absolute synergy variables for the marginal bidder:
• Absolute local synergy excluding cellular footprint:
This variable measures the absolute population of neighboring licenses to i for which the marginal bidder
wins a PCS license.
• Absolute local synergy including cellular footprint:
This variable measures the absolute population of neighboring licenses to i for which the marginal bidder
16The alert reader may observe that the form of synergies posited in this equation is similar to that assumed in “gravity models” of
international trade. As Alonso (1987) notes in his review, the gravity-model formulation of taking the product of the two respective
regions' populations is “unconventional and to a degree bizarre” and “not based on well-specified theory” (p. 561). Nevertheless, this
formulation in wireless telephony is motivated by the desirability of “seamless roaming” and, as we shall see below, the implied
absolute measure of synergy performs the best, empirically, of all the measures we have tried.
,p p = S jij ij i δβ
. w p = s j ijNj i i∑ ∈β
( ). w p + = a j ijNj i i∑ ∈1log
( ). W p + = A j ijNj i i∑ ∈1log

14
either already owns a cellular license or wins a PCS license.
An alternative measure of synergies is “relative”: the population-weighted proportion of surrounding
regions in which the marginal bidder wins or already owns licenses.
• Relative local synergy excluding cellular footprint:
This variable measures the percentage of the population of neighboring licenses to i for which the marginal
bidder wins a PCS license.
• Relative local synergy including cellular footprint:
This variable measures the percentage of the population of neighboring licenses to i for which the marginal
bidder either already owns a cellular license or wins a PCS license.
Each of these measures is likely to be larger when the marginal bidder is larger (wins more PCS or
holds more cellular licenses). Hence, it is possible that the local synergy variable is picking up global
synergies. To avoid this problem, we also include the total dollar winnings of the marginal bidder as a
measure of global synergies.
Analogous measures of synergies can also be defined with reference to the winning bidders, as opposed
to the marginal bidders. However, given the ascending-bid auction design, the final price should reflect the
valuation (including any synergies) of the marginal bidder. Hence, the synergy measure based on the
marginal bidder is preferred. Nonetheless, the measure based on the winning bidder is of interest, because it
tells us the extent to which the winner had to pay a premium to secure a package of adjacent licenses.
Table 5 provides summary statistics for each of our synergy variables.
Table 6 gives the price regressions in the AB auction when the various synergy variables are included.
Column (1) repeats the benchmark model without any synergy variables. The next four columns add one
synergy variable at a time to the regression equation. All four of the synergy variables based on the marginal
bidder are positive and significant.17 From this table, we conclude that the marginal bidder pushed prices
17As a further test of the robustness of these results we looked at two other measures of synergies. The simplest was an indicator
. p w p
= rjNj
j ijNj i
i
i
∑
∑
∈
∈
. p W p
= RjNj
j ijNj i
i
i
∑
∑
∈
∈

15
higher in situations where the marginal bidder held or ultimately won adjacent properties. This is strong
evidence of local synergies. When we base the local synergy measure on whether the winning bidder held or
won adjacent licenses (columns 6-7), we get a negative and insignificant coefficient. Hence, despite the
presence of local synergies, the winning bidders did not have to pay a premium to acquire adjacent licenses,
unless the marginal bidder would also have realized synergies.
Our measure of global PCS synergies is the dollar winnings of the marginal bidder. Contrary to the
presence of global synergies, this coefficient is negative (though borderline insignificant) in all
specifications. However, one must be careful in interpreting this coefficient. Ausubel and Cramton (1996)
show that large bidders have the greatest incentive to strategically reduce demand in order to keep prices
low. Thus, large bidders might empirically drop out early, despite global synergies. Indeed, Moreton and
Spiller (1996) find significant global synergies from cellular holdings. (A firm's pre-auction holdings should
not give rise to the incentive to strategically reduce demand.)
Table 7 presents the price regressions in the C auction including synergy variables. Since none of the
bidders in the C auction are significant cellular incumbents, there are just two measures of synergies for a
marginal bidder. Both synergy measures enter positive and significant (columns 2-3), suggesting local
synergies. However, the estimated coefficient (.016) on the absolute synergy variable is smaller than the
comparable estimates (.030 and .033) from the AB auction. Similarly, the coefficient (.385) on the relative
synergy measure is smaller than the comparable estimates (.886 and .679) from the AB auction. In the C
auction, there is evidence of local synergies, but the evidence is not as strong as in the AB auction. When
synergies are measured by the winning bidder (columns 4-5), there is at best a borderline-significant effect.
As in the AB auction, prices were increased by the extent to which the marginal bidders had adjacent
properties, but not by the extent to which the winning bidders had adjacent properties. Finally, the
coefficient on the dollar winnings of the marginal bidder is statistically insignificant, as well as much
smaller in magnitude than the corresponding coefficient from the AB auction, providing no evidence that
large bidders tended to drop out early or late (i.e., there is no evidence from the regressions that demand
reduction dominated global synergies – or the reverse – in the C auction).
5 Conclusion
We find synergies deriving from geographic adjacency in the first two broadband PCS auctions.
equal to 1 if the marginal bidder held or won an adjacent license. The results were similar but slightly weaker with this coarser
measure. The second attempted to refine the measure by basing it on the population near the border of the market. Specifically, we
counted population of all cities over 50 thousand within 100 miles of the market border. The results were similar.
16
Explanatory variables embodying auction competitiveness, population, expected population growth,
population density, and incumbent microwave users are strongly significant and have coefficients of the
expected signs. The preferred local-synergy variables were also significant in all specifications. The
marginal bidder bid higher in situations where it held or ultimately won licenses in adjacent markets.
We obtained two other results consistent with the existence of local synergies in a limited sense. First,
the “strong regional bidder” variable, when added to the benchmark regression in the AB auction, had a
strong and significant positive coefficient. One interpretation of this result is that regional bidders realized
synergies by acquiring properties near to their existing local service areas. But note that, for PacTel, the
existing local service was conventional landline – as opposed to wireless – and the same was, in part, true
for Ameritech and Bell South. Second, even though population has been divided out of the dependent price
variable, population remains borderline-significant in the AB auction and highly significant in the C auction.
One interpretation of this result is that bidders derive positive synergies from serving large population areas:
large markets are the keys to realizing synergies. But this empirical finding might also merely reflect that
large population centers are inherently more valuable, even if held on their own.
Surprisingly, local synergies do not appear to be stronger in the C auction than in the AB auction. Since
the BTAs in the C auction are only about one-tenth the size of the MTAs in the AB auction, BTA boundaries
are more apt to cross high-population areas and divide common media markets (such as the Washington and
Baltimore BTAs). Hence, one would have expected geographic synergies to be stronger between BTA than
MTA markets. One explanation is that the C block bidders were less willing to bid for synergies, since they
faced a more severe exposure problem, due to the much greater competition and smaller markets in the C
auction. However, this seems implausible given that prices in the C auction were about 80% higher than in
the AB auction, netting out the value of bidding credits and installment payments. An alternative
interpretation is that our functional forms are imperfectly capturing local synergies, especially in the C
auction.
From a policy perspective, our analysis suggests that the FCC made the right choice of auction
mechanism in adopting license-by-license bidding rather than package bidding. Bidders in the AB and C
auctions had local synergies and bid for them. Judging from the footprints, they were often successful.
Apparently, the local synergies were not so large that bidders faced a serious exposure problem. This is
further supported by the absence of bid withdrawals intended to back out of failed aggregations.
On the other hand, some small companies may have been discouraged from bidding in the AB auction
because of the large size of the MTAs. This was the motivation for auctioning the second half of the
broadband PCS spectrum as BTAs. Certainly, competition in the first BTA auction was much more intense
than in the MTA auction. However, the small bidders were attracted to the C auction not only by the small

17
license size, but also by favorable installment payment terms and the fact that large firms were excluded
from bidding.18 Indeed, competition in the second BTA auction for blocks D, E, and F was similar to the AB
auction, rather than the C auction. Market size alone cannot explain the differences in competition.
We conclude that local synergies were a significant determinant of prices in the AB and C auctions.
The bidding data show (1) bidders believed that local synergies were present, (2) bidders were willing to
pay more for them, and (3) synergies were reflected in price to the extent that the marginal – not the winning
– bidder would realize them.
References
Alonso, William (1987), “Gravity Models,” in John Eatwell et al. (eds.), The New Palgrave: A Dictionary inEconomics, New York: Stockton Press, 2, 561-562.
Anselin, Luc (1988), Spatial Econometrics: Methods and Models, London: Kluwer Academic.
Ausubel, Lawrence M. and Peter C. Cramton (1996), “Demand Reduction and Inefficiency in Multi-Unit Auctions,”Working Paper No. 96-07, University of Maryland.
Bernheim, B. Douglas and Michael D. Whinston (1986), “Menu Auctions, Resource Allocation and EconomicInfluence,” Quarterly Journal of Economics, 101, 1-31.
Bikhchandani, Sushil and John W. Mamer (1996), “Competitive Equilibrium in an Exchange Economy withIndivisibilities,” Working Paper, UCLA.
Branco, Fernando (1996), “Multi-Object Auctions with Synergies,” Working Paper, Universidade CatolicaPortuguesa.
Brewer, Paul and Charles R. Plott (1996), “A Binary Conflict Ascending Price Mechanism for the DecentralizedAllocation of the Right to Use Railroad Tracks,” International Journal of Industrial Organization,forthcoming.
Bykowsky, Mark M., Robert J. Cull, and John O. Ledyard (1995), “Mutually Destructive Bidding: The FCC AuctionDesign Problem,” Working Paper, CalTech.
Cramton, Peter (1997), “The FCC Spectrum Auctions: An Early Assessment,” Journal of Economics andManagement Strategy, forthcoming.
Federal Communications Commission (1994), Second Report and Order, FCC 94-61, Washington, DC.
Gale, Ian (1990), “A Multi-Object Auction with Superadditive Values,” Economic Letters, 34, 323-328.
Gandal, Neil (1997), “Sequential Auctions of Interdependent Objects: Israeli Cable Television Licenses,” Journal ofIndustrial Economics, forthcoming.
Jehiel, Philippe, Benny Moldovanu and Ennio Stacchetti (1996), “Multidimensional Mechanism Design for Auctionswith Externalities,” Working Paper, University of Michigan.
Krishna, Vijay and Robert Rosenthal (1997), “Simultaneous Auctions with Synergies,” Games and EconomicBehavior, forthcoming.
18Recent theoretical work on multi-object auctions makes clear the importance of demand reduction by large bidders in the
determination of auction outcomes (Ausubel and Cramton 1996). Thus, the participation of many small bidders could have a dramatic
effect in increasing auction revenues.
18
McAfee, R. Preston and John McMillan (1996), “Analyzing the Airwaves Auction,” Journal of EconomicPerspectives, 10, 159-176.
McMillan, John (1994), “Selling Spectrum Rights,” Journal of Economic Perspectives, 8, 145-162.
Moreton, Patrick S. and Pablo T. Spiller (1996), “What's in the Air? Interlicense Synergies and Their Impact on theFCC's Broadband PCS License Auctions,” Working Paper, UC Berkeley.
Parker, Philip and Lars-Hendrick Roller (1996), “Collusive Conduct in Duopolies: Multimarket Contact and Cross-Ownership in the Mobile Telephone Industry,” Working Paper, INSEAD.
Rand McNally Inc. (1994), Commercial Atlas and Marketing Guide, Chicago: Rand McNally.
Rosenthal, Robert W. and Ruqu Wang (1995), “Simultaneous Auctions with Synergies and Common Values,”Working Paper, Boston University.
Rothkopf, Michael H., Aleksandar Pekec, and Ronald M. Harstad (1995), “Computationally ManageableCombinatorial Auctions,” Working Paper, Rutgers University.
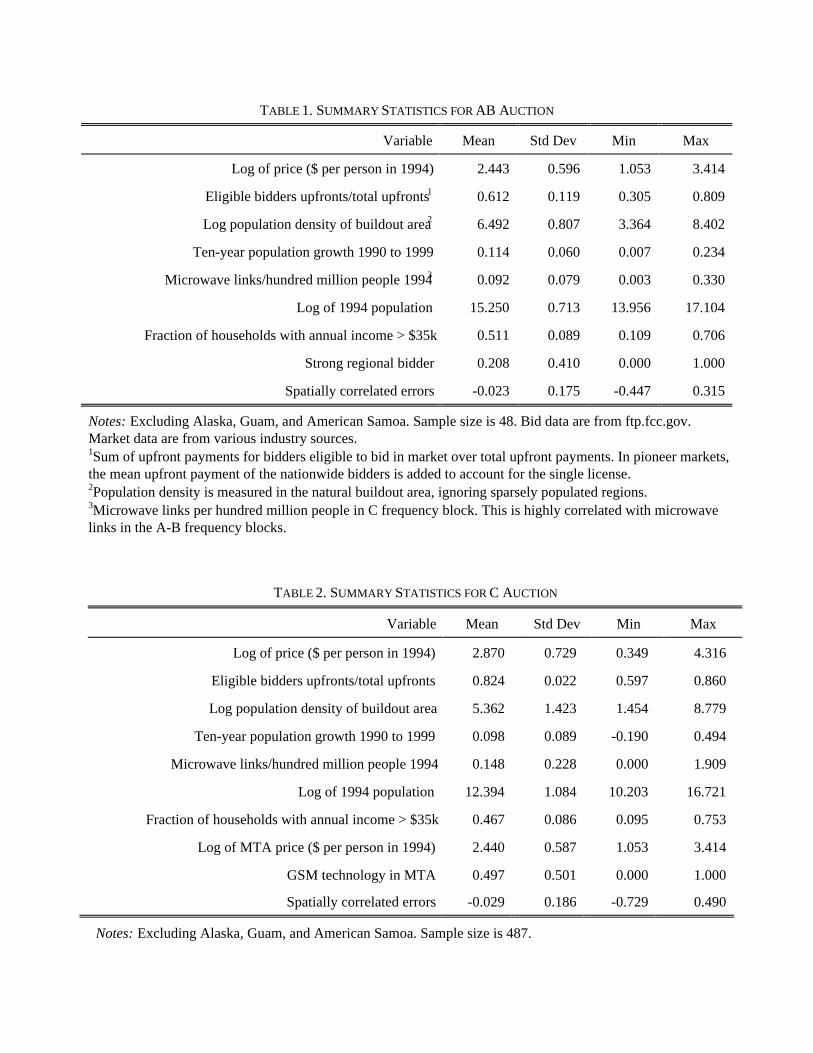
TABLE 1. SUMMARY STATISTICS FOR AB AUCTION
Variable Mean Std Dev Min Max
Log of price ($ per person in 1994) 2.443 0.596 1.053 3.414
Eligible bidders upfronts/total upfronts1 0.612 0.119 0.305 0.809
Log population density of buildout area2 6.492 0.807 3.364 8.402
Ten-year population growth 1990 to 1999 0.114 0.060 0.007 0.234
Microwave links/hundred million people 19943 0.092 0.079 0.003 0.330
Log of 1994 population 15.250 0.713 13.956 17.104
Fraction of households with annual income > $35k 0.511 0.089 0.109 0.706
Strong regional bidder 0.208 0.410 0.000 1.000
Spatially correlated errors -0.023 0.175 -0.447 0.315
Notes: Excluding Alaska, Guam, and American Samoa. Sample size is 48. Bid data are from ftp.fcc.gov.Market data are from various industry sources.1Sum of upfront payments for bidders eligible to bid in market over total upfront payments. In pioneer markets,the mean upfront payment of the nationwide bidders is added to account for the single license.2Population density is measured in the natural buildout area, ignoring sparsely populated regions.3Microwave links per hundred million people in C frequency block. This is highly correlated with microwavelinks in the A-B frequency blocks.
TABLE 2. SUMMARY STATISTICS FOR C AUCTION
Variable Mean Std Dev Min Max
Log of price ($ per person in 1994) 2.870 0.729 0.349 4.316
Eligible bidders upfronts/total upfronts 0.824 0.022 0.597 0.860
Log population density of buildout area 5.362 1.423 1.454 8.779
Ten-year population growth 1990 to 1999 0.098 0.089 -0.190 0.494
Microwave links/hundred million people 1994 0.148 0.228 0.000 1.909
Log of 1994 population 12.394 1.084 10.203 16.721
Fraction of households with annual income > $35k 0.467 0.086 0.095 0.753
Log of MTA price ($ per person in 1994) 2.440 0.587 1.053 3.414
GSM technology in MTA 0.497 0.501 0.000 1.000
Spatially correlated errors -0.029 0.186 -0.729 0.490
Notes: Excluding Alaska, Guam, and American Samoa. Sample size is 487.
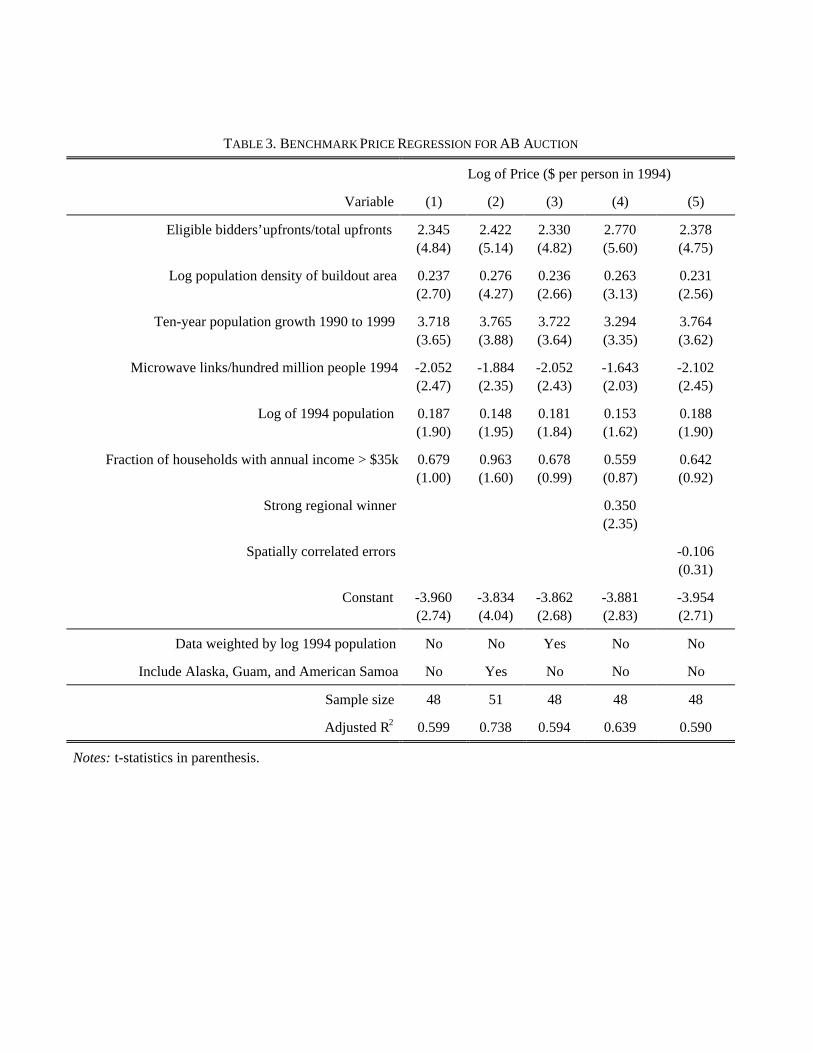
TABLE 3. BENCHMARK PRICE REGRESSION FOR AB AUCTION
Log of Price ($ per person in 1994)
Variable (1) (2) (3) (4) (5)
Eligible bidders’ upfronts/total upfronts 2.345(4.84)
2.422(5.14)
2.330(4.82)
2.770(5.60)
2.378(4.75)
Log population density of buildout area 0.237(2.70)
0.276(4.27)
0.236(2.66)
0.263(3.13)
0.231(2.56)
Ten-year population growth 1990 to 1999 3.718(3.65)
3.765(3.88)
3.722(3.64)
3.294(3.35)
3.764(3.62)
Microwave links/hundred million people 1994 -2.052(2.47)
-1.884(2.35)
-2.052(2.43)
-1.643(2.03)
-2.102(2.45)
Log of 1994 population 0.187(1.90)
0.148(1.95)
0.181(1.84)
0.153(1.62)
0.188(1.90)
Fraction of households with annual income > $35k 0.679(1.00)
0.963(1.60)
0.678(0.99)
0.559(0.87)
0.642(0.92)
Strong regional winner 0.350(2.35)
Spatially correlated errors -0.106(0.31)
Constant -3.960(2.74)
-3.834(4.04)
-3.862(2.68)
-3.881(2.83)
-3.954(2.71)
Data weighted by log 1994 population No No Yes No No
Include Alaska, Guam, and American Samoa No Yes No No No
Sample size 48 51 48 48 48
Adjusted R2 0.599 0.738 0.594 0.639 0.590
Notes: t-statistics in parenthesis.

TABLE 4. BENCHMARK PRICE REGRESSION FOR C AUCTION
Log of Price ($ per person in 1994)
Variable (1) (2) (3) (4) (5)
Eligible bidders’ upfronts/total upfronts 1.564(1.38)
1.456(1.32)
1.849(1.76)
1.852(1.65)
1.562(1.39)
Log population density of buildout area 0.124(5.27)
0.135(6.31)
0.125(5.36)
0.141(6.11)
0.128(5.47)
Ten-year population growth 1990 to 1999 1.581(5.85)
1.554(5.84)
1.579(5.95)
1.648(6.18)
1.613(6.01)
Microwave links/hundred million people 1994 0.009(0.08)
0.006(0.05)
-0.020(0.17)
-0.003(0.03)
0.006(0.05)
Log of 1994 population 0.251(8.40)
0.246(8.41)
0.250(8.61)
0.247(8.22)
0.245(8.24)
Fraction of households with annual income > $35k 1.179(3.71)
1.043(3.66)
1.168(3.81)
1.173(3.68)
1.255(3.97)
Log of MTA price ($ per person in 1994) 0.116(2.79)
0.116(3.00)
0.119(2.90)
0.115(2.78)
GSM technology in MTA -0.066(1.41)
-0.065(1.40)
-0.063(1.37)
-0.067(1.45)
Spatially correlated errors 0.361(2.96)
Constant -3.152(2.87)
-2.990(2.83)
-3.388(3.26)
-3.181(2.94)
-3.121(2.87)
Data weighted by log 1994 population No No Yes No No
Include Alaska, Guam, and American Samoa No Yes No No No
Sample size 487 493 487 487 487
Adjusted R2 0.531 0.535 0.551 0.523 0.538
Notes: t-statistics in parenthesis.
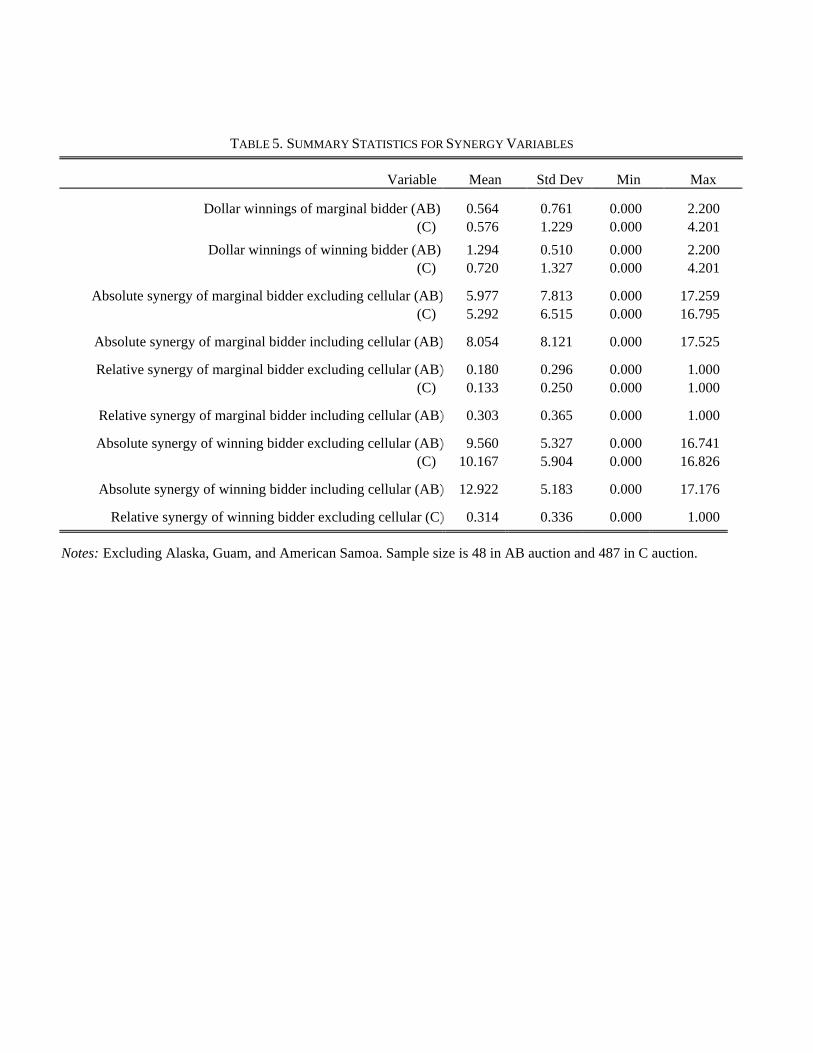
TABLE 5. SUMMARY STATISTICS FOR SYNERGY VARIABLES
Variable Mean Std Dev Min Max
Dollar winnings of marginal bidder (AB)(C)
0.5640.576
0.7611.229
0.0000.000
2.2004.201
Dollar winnings of winning bidder (AB)(C)
1.2940.720
0.5101.327
0.0000.000
2.2004.201
Absolute synergy of marginal bidder excluding cellular (AB)(C)
5.9775.292
7.8136.515
0.0000.000
17.25916.795
Absolute synergy of marginal bidder including cellular (AB) 8.054 8.121 0.000 17.525
Relative synergy of marginal bidder excluding cellular (AB)(C)
0.1800.133
0.2960.250
0.0000.000
1.0001.000
Relative synergy of marginal bidder including cellular (AB) 0.303 0.365 0.000 1.000
Absolute synergy of winning bidder excluding cellular (AB)(C)
9.56010.167
5.3275.904
0.0000.000
16.74116.826
Absolute synergy of winning bidder including cellular (AB) 12.922 5.183 0.000 17.176
Relative synergy of winning bidder excluding cellular (C) 0.314 0.336 0.000 1.000
Notes: Excluding Alaska, Guam, and American Samoa. Sample size is 48 in AB auction and 487 in C auction.

TABLE 6. PRICE REGRESSION INCLUDING SYNERGIES FOR AB AUCTION
Log of Price ($ per person in 1994)
Variable (1) (2) (3) (4) (5) (6) (7)
Eligible bidders’ upfronts/total upfronts 2.345(4.84)
1.994(4.37)
1.812(4.19)
2.139(4.41)
1.777(3.62)
2.502(5.10)
2.422(5.04)
Log population density of buildout area 0.237(2.70)
0.241(3.20)
0.258(3.64)
0.252(3.13)
0.204(2.55)
0.278(3.01)
0.273(3.04)
Ten-year population growth 1990 to1999
3.718(3.65)
3.353(3.78)
2.139(2.42)
3.644(3.85)
2.264(2.24)
3.866(3.77)
3.716(3.71)
Microwave links/hundred million people1994
-0.021(2.47)
-2.375(3.16)
-1.857(2.67)
-2.605(3.14)
-2.133(2.73)
-1.694(2.00)
-1.507(1.81)
Log of 1994 population 0.187(1.90)
0.131(1.54)
0.135(1.70)
0.109(1.17)
0.162(1.82)
0.202(2.06)
0.226(2.34)
Fraction of households with annualincome > $35k
0.679(1.00)
0.542(0.93)
0.479(0.87)
0.544(0.87)
0.639(1.04)
0.278(0.34)
0.349(0.49)
Dollar winnings of marginal bidder -0.100(1.22)
-0.098(1.32)
-0.218(1.82)
-0.130(1.38)
Dollar winnings of winning bidder 0.193(1.54)
0.216(1.76)
Absolute synergy of marginal bidder(excluding cellular)
0.030(4.01)
Absolute synergy of marginal bidder(including cellular)
0.033(4.85)
Relative synergy of marginal bidder(excluding cellular)
0.886(3.03)
Relative synergy of marginal bidder(including cellular)
0.679(3.33)
Absolute synergy of winning bidder(excluding cellular)
-0.009(0.81)
Absolute synergy of winning bidder(including cellular)
-0.019(1.68)
Constant -3.960(2.74)
-2.899(2.30)
-2.931(2.49)
-2.657(1.92)
-2.952(2.22)
-4.554(3.10)
-4.761(3.32)
Adjusted R2 0.599 0.706 0.741 0.664 0.677 0.610 0.630
Notes: Excluding Alaska, Guam and American Samoa. Sample size is 48. t-statistics in parenthesis.
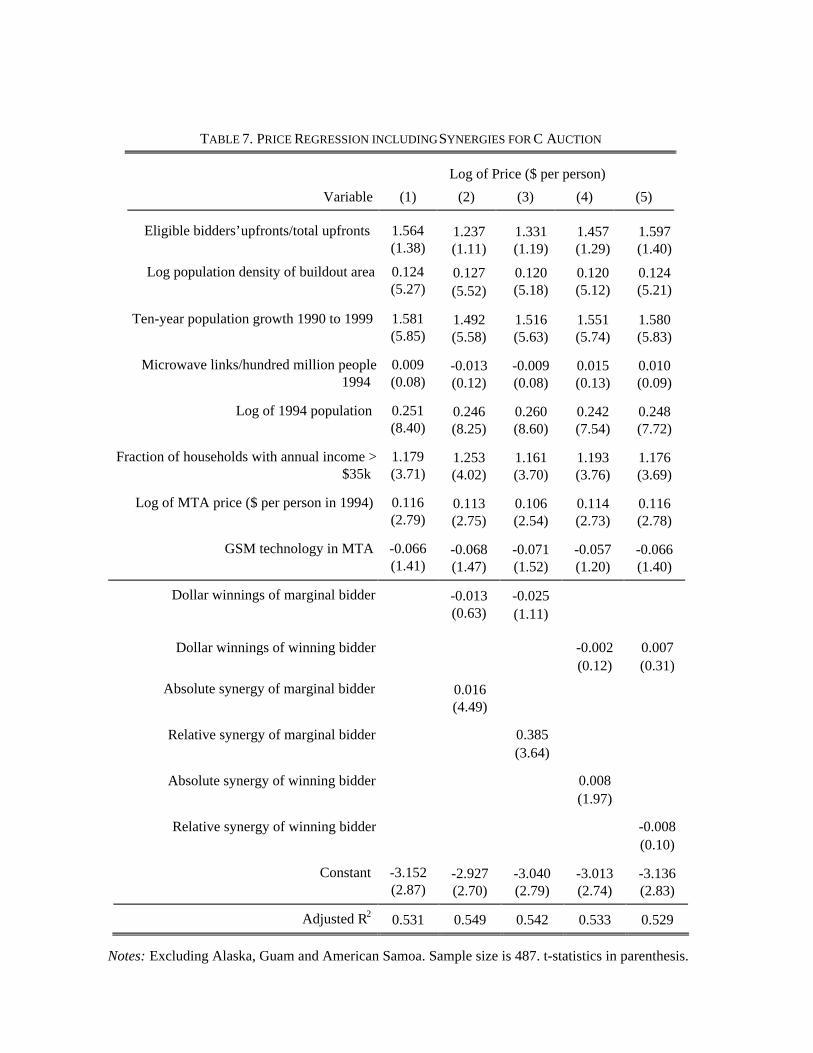
TABLE 7. PRICE REGRESSION INCLUDING SYNERGIES FOR C AUCTION
Log of Price ($ per person)
Variable (1) (2) (3) (4) (5)
Eligible bidders’ upfronts/total upfronts 1.564(1.38)
1.237(1.11)
1.331(1.19)
1.457(1.29)
1.597(1.40)
Log population density of buildout area 0.124(5.27)
0.127(5.52)
0.120(5.18)
0.120(5.12)
0.124(5.21)
Ten-year population growth 1990 to 1999 1.581(5.85)
1.492(5.58)
1.516(5.63)
1.551(5.74)
1.580(5.83)
Microwave links/hundred million people1994
0.009(0.08)
-0.013(0.12)
-0.009(0.08)
0.015(0.13)
0.010(0.09)
Log of 1994 population 0.251(8.40)
0.246(8.25)
0.260(8.60)
0.242(7.54)
0.248(7.72)
Fraction of households with annual income >$35k
1.179(3.71)
1.253(4.02)
1.161(3.70)
1.193(3.76)
1.176(3.69)
Log of MTA price ($ per person in 1994) 0.116(2.79)
0.113(2.75)
0.106(2.54)
0.114(2.73)
0.116(2.78)
GSM technology in MTA -0.066(1.41)
-0.068(1.47)
-0.071(1.52)
-0.057(1.20)
-0.066(1.40)
Dollar winnings of marginal bidder -0.013(0.63)
-0.025(1.11)
Dollar winnings of winning bidder -0.002(0.12)
0.007(0.31)
Absolute synergy of marginal bidder 0.016(4.49)
Relative synergy of marginal bidder 0.385(3.64)
Absolute synergy of winning bidder 0.008(1.97)
Relative synergy of winning bidder -0.008(0.10)
Constant -3.152(2.87)
-2.927(2.70)
-3.040(2.79)
-3.013(2.74)
-3.136(2.83)
Adjusted R2 0.531 0.549 0.542 0.533 0.529
Notes: Excluding Alaska, Guam and American Samoa. Sample size is 487. t-statistics in parenthesis.

AmeritechCellular Incumbent
American Portable:Won PCS License
Cellular IncumbentWestern PCS
Won PCS License
Cellular IncumbentWon PCS License
*Ameritech Cell. Incum.**AmerPort Cell. Incum.***Western Cell. Incum.
AmeritechCellular Incumbent
American Portable:Won PCS License
Cellular IncumbentWestern PCS
Won PCS License
Cellular IncumbentWon PCS License
*Ameritech Cell. Incum.**AmerPort Cell. Incum.***Western Cell. Incum.
Des Moines
Tulsa
Oklahoma
Detroit
Milwaukee
Columbus
Cleveland
Indianapolis
Louisville
Pittsburgh
Knoxville
Richmond
CincinnatiSt. Louis
Chicago
Kansas City
Wichita
Little Rock Charlotte
Minneapolis
Buffalo
Nashville
Washington
Memphis
Houston New Orleans
Dallas Birmingham
Phoenix
Los Angeles
Portland
Seattle
Spokane
Salt Lake CitySan Francisco
Philadelphia
New York
Boston
Jacksonville
San Antonio
Puerto Rico
Western
SWBell
Western
WirelessCo
Ameritech
AT&T
WirelessCo
WirelessCo
AT&TAT&T
AT&T
AT&TAT&T
WirelessCoAT&T
WirelessCo
AT&TWirelessCo
AT&T
WirelessCo
AT&T
WirelessCo
SWBell AT&T
PrimeCo
Western
AT&TWirelessCo
PowertelAT&T
WirelessCo
Western
GTE
Poka
WesternAT&T
AmerPort WirelessCoPowertel
AmerPortWirelessCo
Western
AT&TWirelessCo
AT&T
WirelessCo
WirelessCo
WirelessCo
PrimeCo
AmeritechAmerPort AmerPort
WirelessCoGTE
PrimeCo
PrimeCoAT&T
Cox
AmerPortWirelessCo
GTE
WirelessCo
BellSouth
AmerPort
AT&T
AT&T
AT&T
WirelessCoWirelessCo
WirelessCo
AT&T
PowertelGTE
BellSouthSWBell
WirelessCo
PacTel
PacTel
WirelessCo
WirelessCo
WirelessCo
WirelessCo
WirelessCo
WirelessCo
WirelessCo
PrimeCo PrimeCo PrimeCo
PrimeCoPrimeCoPrimeCo
Centen PrimeCo
Atlanta
Denver
El Paso
Honolulu
Miami
Omaha
Tampa
Figure 1Winning Bidders and Sample Footprints
in MTA Broadband PCS Auction*
*Excluding Alaska, Guam, American Samoa
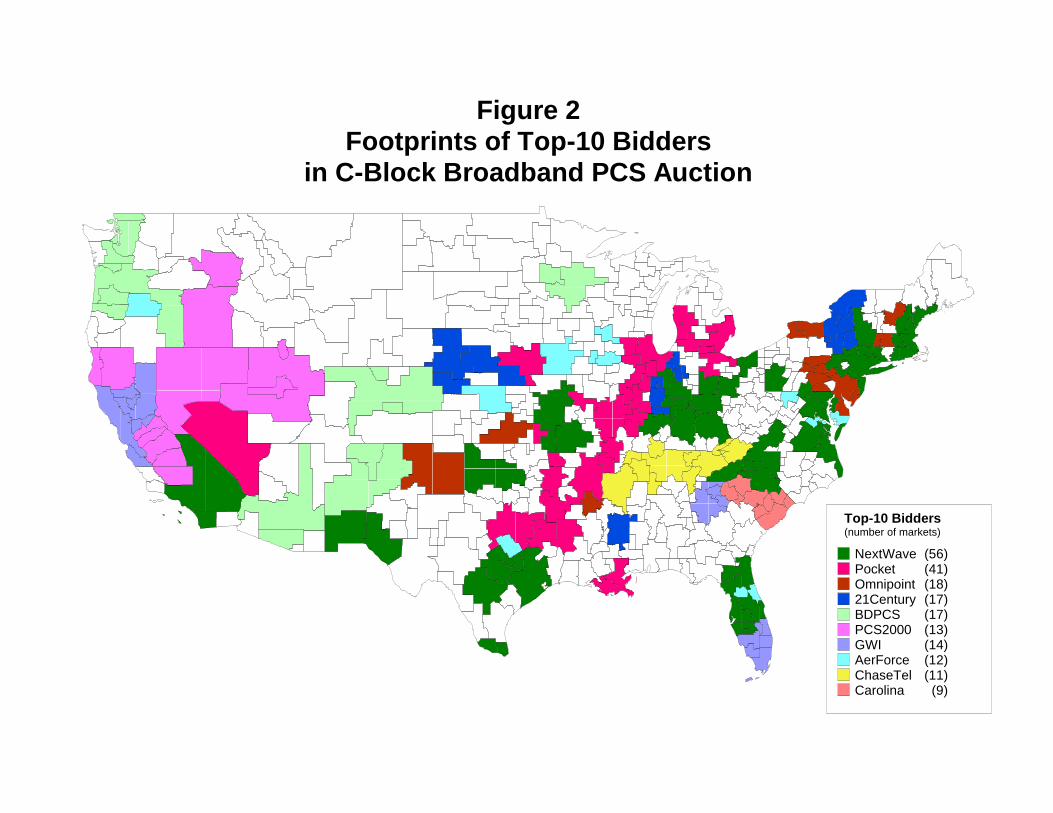
Top-10 Bidders(number of markets)
NextWave (56)Pocket (41)Omnipoint (18)21Century (17)BDPCS (17)PCS2000 (13)GWI (14)AerForce (12)ChaseTel (11)Carolina (9)
Figure 2Footprints of Top-10 Bidders
in C-Block Broadband PCS Auction
PhiladelphiaClevelandPitt.
Buffalo
Washington
San Antonio
Houston
Miami
AtlantaBirmingham
New Orleans J'ville
NashvilleLittle Rock
MemphisOklahoma
Dallas
Indy Clbs.
Detroit
Des MoinesChicago
St. Louis
Kansas CityCincinnati
New YorkMilwaukee
Los Angeles
Phoenix
Boston
Knoxville
Salt Lake CitySan Francisco
Seattle SpokaneMinneapolis
Charlotte
Denver
El Paso
Honolulu
Louisville
Omaha
Portland
Richmond
Tampa
Tulsa
Wichita
Puerto Rico
Figure 3Footprint of WirelessCo
in MTA Broadband PCS Auction*
*Excluding Alaska, Guam, American Samoa
Regions Where Bidder:
Cellular IncumbentWon PCS License

Buffalo
PhiladelphiaClevelandPitt.
New York
Clbs.
ChicagoDes Moines
Detroit
Indy
Nashville
WashingtonCincinnati
BostonMilwaukee
MemphisLittle Rock
Birmingham
Oklahoma
Kansas City
St. Louis
Miami
J'villeNew OrleansHouston
San Antonio
Atlanta
Salt Lake CitySan Francisco
Phoenix
Los AngelesKnoxville
Seattle SpokaneMinneapolis
Dallas
Charlotte
Denver
El Paso
Honolulu
Louisville
Omaha
Portland
Richmond
Tampa
Tulsa
Wichita
Puerto Rico
Figure 4Footprint of AT&T
in MTA Broadband PCS Auction*
*Excluding Alaska, Guam, American Samoa
Regions Where Bidder:
Cellular IncumbentWon PCS License

Seattle
Oklahoma Little Rock
Dallas
St. Louis
Kansas City
PhiladelphiaPitt.
Washington
Cleveland
Buffalo
Clbs.
Cincinnati
MemphisAtlanta
Birmingham
J'ville
Miami
San Antonio
Houston
Des MoinesChicago
Milwaukee
DetroitNew York
Indy
KnoxvilleNashville
Minneapolis
Phoenix
Los Angeles
Salt Lake CitySan Francisco
Spokane
Boston
Charlotte
Denver
El Paso
Honolulu
Louisville
New Orleans
Omaha
Portland
Richmond
Tampa
Tulsa
Wichita
Puerto Rico
Figure 5Footprint of PCS PrimeCo
in MTA Broadband PCS Auction*
*Excluding Alaska, Guam, American Samoa
Regions Where Bidder:
Cellular IncumbentWon PCS License