syndromicn surveillance discussion paper - public · pdf filepidac: syndromic surveillance...
TRANSCRIPT

Syndromic Surveillance Discussion Paper Provincial Infectious Diseases Advisory Committee (PIDAC) August 2012

PIDAC: Syndromic Surveillance Discussion Paper | August 2012 i
The Ontario Agency for Health Protection and Promotion (Public Health Ontario) is a Crown corporation dedicated to protecting and promoting the health of all Ontarians and reducing inequities in health. As a hub organization, Public Health Ontario links public health practitioners, front-line health workers and researchers to the best scientific intelligence and knowledge from around the world. Public Health Ontario provides expert scientific and technical support relating to communicable and infectious diseases; surveillance and epidemiology; immunization; health promotion, chronic disease and injury prevention; environmental and occupational health; health emergency preparedness; and public health laboratory services to support health providers, the public health system and partner ministries in making informed decisions and taking informed action to improve the health and security of Ontarians. The Provincial Infectious Diseases Advisory Committee on Surveillance (PIDAC-S) was established to advise Public Health Ontario on the surveillance of infectious diseases and other microorganisms of epidemiologic significance to the health of Ontarians. The committee draws on the dedication of health care practitioners with expertise in infectious disease; infection prevention and control; epidemiology; and public health.
Disclaimer for Best Practice Documents This document was developed by the Provincial Infectious Diseases Advisory Committee on Surveillance. PIDAC-S is a multidisciplinary scientific advisory body that provides evidence-based advice to Public Health Ontario regarding multiple aspects of infectious disease identification, prevention and control. The work of PIDAC-S is guided by the best available evidence and updated as required. Best practice documents and tools produced by PIDAC-S reflect consensus positions on what the committee deems prudent practice and are made available as a resource to public health and health care providers. Suggested Citation Ontario Agency for Health Protection and Promotion, Provincial Infectious Diseases Advisory Committee. Syndromic Surveillance Discussion Paper. Toronto, ON: Queen’s Printer for Ontario; 2012.
NOTES
This document is intended to provide best practices only. Health care settings are encouraged to work towards these best practices in an effort to improve quality of care.
Provincial Infectious Diseases Advisory Committee (PIDAC)
Ontario Agency for Health Protection and Promotion
www.oahpp.ca
Tel: 647-260-7100
Email: [email protected]
All or part of this report may be reproduced for educational purposes only without permission.
© Queen’s Printer for Ontario, 2012
ISBN: 978-1-4606-0494-6

PIDAC: Syndromic Surveillance Discussion Paper | August 2012 ii
PIDAC-S would like to acknowledge the contribution and expertise of the following individuals who participated in the development this document: PIDAC-S Members
Sandra Callery, Chair Director, Infection Prevention and Control Sunnybrook Health Sciences Centre
Dr. Kieran Moore Associate Medical Officer of Health KFL&A Public Health
Effie Gournis Manager, Communicable Disease Surveillance Unit Toronto Public Health
Dr. Chris O’Callaghan Project Coordinator NCIC Clinical Trials Group Queen’s University
Faron Kolbe Manager, Health Informatics Communicable Disease Control Program Toronto Public Health
Dr. Dick Zoutman Office of the Chief of Staff Quinte Health Care Corporation Belleville, ON
Ex-officio Members
Dr. Natasha Crowcroft Chief, Infectious Diseases Public Health Ontario, Toronto
Colleen Nisbet Director, Clinical Service Simcoe Muskoka District Health Unit
Jason Garay Director, Communicable Disease Prevention and Control Public Health Ontario, Toronto
Public Health Ontario Staff
Rachel Savage Epidemiologist, Surveillance Services Public Health Ontario, Toronto
Karen Johnson Senior Epidemiologist, Surveillance Services, Public Health Ontario, Toronto Caitlin Johnson Epidemiology Practicum Student, Surveillance Services Public Health Ontario, Toronto
Anne-Luise Winter Manager(A) Surveillance Services Communicable Disease Prevention and Control Public Health Ontario, Toronto Technical Writer
Victoria Williams Infection Prevention and Control Coordinator Sunnybrook Health Sciences Centre, Toronto

PIDAC: Syndromic Surveillance Discussion Paper | August 2012 iii
Purpose of the Document ...................................................................................................... 1
Background ........................................................................................................................... 2
Methodology ......................................................................................................................... 4
Search methodology ................................................................................................................................ 4
Data collection and analysis ..................................................................................................................... 4
Results .................................................................................................................................. 6
Description of studies .............................................................................................................................. 6
Syndromic surveillance data sources ....................................................................................................... 6
Discussion ........................................................................................................................... 19
Limitations .............................................................................................................................................. 19
Overall recommendations ..................................................................................................................... 19
Tables and Figures ............................................................................................................... 22
Appendix 1: Quality Assessment Tool for Syndromic Surveillance Publications ..................... 56
Appendix 2: Data Extraction Tool ......................................................................................... 59
References .......................................................................................................................... 63

PIDAC: Syndromic Surveillance Discussion Paper | August 2012 1
Purpose of the Document This report describes sources of syndromic surveillance data, along with their applications and attributes, and it summarizes the published evidence related to their effectiveness as part of a public health surveillance system. In this report, the use of such data will be described in the context of infectious diseases surveillance only. Syndromic data used for other purposes, such as bioterrorism preparedness or detection of heat-related illnesses, will not be addressed. We will also outline relevant characteristics of syndromic surveillance systems, such as timeliness and automation, as they inform recommendations for implementation in Ontario.
PIDAC: Syndromic Surveillance Discussion Paper | August 2012 2
Background Public health surveillance is the ongoing systematic collection, analysis, interpretation and dissemination of data for use in public health action to reduce morbidity and mortality and to improve health.1 Surveillance of health-related events, including those related to infectious diseases, are used to measure the burden of illness, monitor trends, evaluate interventions and guide public health action. Surveillance also functions as a tool to help formulate hypotheses for further research. Clinical and laboratory diagnostic methods have long been the gold standard for communicable infectious disease surveillance and the primary sources of information for traditional surveillance systems. However, there are many instances in which this information is neither complete nor timely enough to allow for the most effective public health intervention efforts. For example, most individuals with symptoms of influenza-like illness (ILI) often do not present for medical care, and thus are not eligible for laboratory testing or clinician diagnosis. In an attempt to enhance the comprehensiveness of disease surveillance and timeliness of outbreak detection, many public health jurisdictions have begun monitoring a variety of syndromic surveillance data sources in the past decade. For the purposes of this paper, the term syndromic surveillance applies to surveillance activities that use existing health-related data that are independent of a confirmed diagnosis and can signal a sufficient probability of risk to warrant further public health investigation. These data capture individual behaviours that occur following the onset of disease symptoms, such as absences from work or school, the purchase of over-the-counter (OTC) medication or calls to health telephone help lines. Preliminary contact with a health care provider, including sentinel community physicians and emergency departments (EDs), are also valuable sources of syndromic surveillance data. One goal of syndromic surveillance is to detect clusters of syndromes such as ILI and other respiratory or gastrointestinal (GI) illness, beyond what would normally be expected in a certain population for a certain period of time. The perceived advantage of focusing on syndromes rather than on clinical or laboratory diagnoses is increased sensitivity: the ability to detect actual cases or outbreaks of a disease when they occur. However, this increase in sensitivity usually comes at the cost of decreased specificity: the ability to recognize when alerts are not related to specific disease events. If a syndromic surveillance system is highly sensitive but not very specific, it will repeatedly trigger public health authorities to false-positive signals, resulting in a waste of resources to investigate the alarm. Conversely, if a system is not sensitive enough, it will not alert public health authorities to significant events and will lose utility. Thus, the validity and perceived usefulness of a syndromic surveillance system relies on the ability to discern between true-positive and false-positive alerts found as a consequence of a system with high sensitivity but low specificity. In the wake of the 2001 terrorist attacks in the United States and the subsequent anthrax outbreak, the development and use of syndromic surveillance data increased, initially as a tool to detect bioterrorism threats.2 Since there has been no known bioterrorism attack since 2001, the evaluation of many syndromic surveillance systems now focuses on their utility beyond that of bioterrorism preparedness. In the last decade, public health agencies have utilized a variety of syndromic surveillance data sources to monitor infectious disease activity. In Ontario, daily calls to Telehealth are monitored provincially, and ED syndromic surveillance systems have been deployed in over 70 hospitals in 18 health units.3,4 In addition, various other syndromic surveillance data sources, such as school absenteeism, are being monitored in several Ontario health units.5

PIDAC: Syndromic Surveillance Discussion Paper | August 2012 3
The greatest perceived benefit of syndromic surveillance systems may be their posited ability to detect infectious disease outbreaks earlier than traditional systems. An additional benefit may be heightened situational awareness during outbreaks or periods of perceived elevated risk. Syndromic surveillance has been recognized as a tool that can signify the start and/or end of an influenza season; provide descriptions of the potential burden of disease beyond traditional methods; or provide reassurance of no effect during a state of perceived increased risk. There may be added benefit in using syndromic data in conjunction with traditional surveillance data or combining multiple syndromic data sources to monitor a given syndrome. While the potential benefits of syndromic surveillance systems are documented in the scientific literature, there are costs associated with setting up such systems. It is necessary to determine whether detection methods based on syndromic data actually translate into earlier responses or other public health actions. While the value of syndromic surveillance is being evaluated around the world, its use is growing, especially in the wake of public health emergencies such as the recent H1N1 influenza pandemic, where situational awareness was crucial. As these systems expand, local public health departments are looking towards centralized support and standards for these systems.6 It is therefore important to describe the types of syndromic surveillance data already in use, consider how they are being applied, and assess whether they are effective in achieving their intended purpose.

PIDAC: Syndromic Surveillance Discussion Paper | August 2012 4
Methodology Search methodology A literature search of the electronic database MEDLINE was performed using the following search terms:
Syndromic AND (Sentinel Surveillance[MeSH] OR Population Surveillance[MeSH:noexp] OR Surveillance[tiab] OR Models, Statistical[MeSH] OR Disease Outbreaks[MeSH] OR "Influenza A Virus, H1N1 Subtype"[MeSH]) AND "humans"[MeSH Terms]
Inclusion/exclusion criteria:
Publication dates limited to January 1, 2003, to April 30, 2011 English-language publications only Exclusion of literature pertaining to bioterrorism published in the wake of the
September 11, 2001 terror attack Exclusion of publications identified as “letter” or “editorial”
Data collection and analysis
SELECTION OF STUDIES
The titles and abstracts of all studies identified by the search strategy were reviewed by members of the Provincial Infectious Diseases Advisory Committee on Surveillance (PIDAC-S) to ensure adherence to the inclusion and exclusion criteria. For example, non-infectious disease events (e.g. extreme heat, injury) were excluded. A study deemed to be relevant by at least one PIDAC-S member was subjected to further methodological assessment.
DATA EXTRACTION AND ANALYSIS
A quality assessment tool (QAT) was developed to permit an objective assessment of the studies determined to be of relevance and provide a measure of quality (the “score”) (Appendix 1). Articles were assessed and graded on six dimensions, for a maximum score of 35 points:
Relevance to the Ontario context Study design Publication/peer review Economic assessment Data collection Data analysis
The QAT also allowed for the inclusion of a component representing the subjective opinion of the reviewer (the “grade”). The QAT was validated prior to use via the assessment of 17 randomly selected studies by a pair of PIDAC-S reviewers and a third (trainee) reviewer. The validity of the tool was determined by the agreement between reviewers and was based solely on the overall scores assigned.

PIDAC: Syndromic Surveillance Discussion Paper | August 2012 5
Following validation of the tool, all publications were reviewed independently by paired PIDAC-S reviewers; approximately equal numbers of publications were reviewed by each pair of reviewers. Studies retained for inclusion required a quality assessment score of >18 from at least one PIDAC-S reviewer and/or a subjective grade of “A” by at least one reviewer and/or a subjective grade of “B” by both reviewers. A standardized, web-based data abstraction tool (Appendix 2) was developed in Fluid Survey and pilot tested by two PIDAC-S reviewers on two randomly selected studies and refined accordingly. Eight PIDAC-S members (five of whom reviewed the publications) extracted information from the included studies on: the data source, uses of the data, sensitivity/specificity, considerations for adopting syndromic surveillance, and recommendations and/or conclusions. All information was then exported to Microsoft Excel for analysis. The abstraction process identified nine themes of syndromic surveillance data sources. Six PIDAC-S members involved in the review and/or data abstraction were assigned to one or more categories and asked to summarize relevant abstracted data using a standardized framework. This framework outlined five key areas for summary: potential uses of the data, described benefits, data or system limitations, circumstances or situations required to make the data source beneficial and whether the data source should be recommended for investment. To ensure a consistent approach to the summary of benefits and limitations, prompts were included on whether the data or system provided early warning of an aberrant event, if there was high sensitivity and/or specificity, if the early warning generated prompt action or earlier response, and whether there were cost benefit and/or resource implications. Each summary was presented at a PIDAC-S committee meeting where feedback was received; summaries were then revised as necessary. Using the CDC evaluation framework136 as a guide only, the same six PIDAC-S members who summarized abstracted data were asked to comment on whether the studies in each category described evidence of specific syndromic surveillance data characteristics. This assessment was performed to help support and inform recommendations and to identify gaps in the literature.

PIDAC: Syndromic Surveillance Discussion Paper | August 2012 6
Results Description of studies The search strategy identified 320 potentially relevant studies. Following a review of titles and abstracts, 130 studies were excluded during the preliminary screening. The full-text versions of 190 studies were reviewed and scored, resulting in a further 65 being excluded based on the assigned score or grade. Next, 125 studies were abstracted, assigned to one or more of ten themes according to surveillance data source and summarized for inclusion in the report (Figure 1). A complete list of all 125 included studies by theme can be found in Table 1. Just under half of the included articles were published in 2009 onwards (Figure 2). Articles most frequently originated from the United States (48%), followed by Australia (10%), Canada (9%) and the United Kingdom (9%). Over one third of articles (35%) described the use of emergency department chief complaints for syndromic surveillance (Figure 3 and Table 3). The second most frequently described syndromic data source was health records other than from emergency departments (20%), followed by telephone help lines (11%) and pharmacy sales (10%). Any evidence of specific syndromic surveillance data characteristics found in the studies by the reviewer were captured in Table 2. There was sufficient evidence in the literature that timeliness was present for all data sources with the exception of sentinel community health care providers and pharmacy sales. Attributes of acceptability, simplicity, positive predictive value and sensitivity were also demonstrated for the majority of data sources (5/9). System flexibility and stability was not described for four and three data sources respectively. Examination of system attributes by data source revealed that there was only evidence of one attribute in the literature on emergency medical services (timeliness) and pharmacy sales (simplicity). Three attributes for employee absenteeism were demonstrated: simplicity, sensitivity and timeliness. By contrast, all other data sources demonstrated four or more of the nine attributes assessed.
Syndromic surveillance data sources
ABSENTEEISM: EMPLOYEE
Employee absenteeism as a source of syndromic surveillance data involves the monitoring of employees reporting an absence from their workplace—either all-cause or syndrome-specific absences.
Uses
Employee absenteeism data have been suggested as a useful source for the early detection of outbreaks or disease clusters and for identifying the start and end of seasonal pathogen circulation, such as influenza and norovirus.
Advantages
The main advantage attributed to the use of employee absenteeism for syndromic surveillance is the timeliness of the data. In the Netherlands, surveillance of employee absenteeism signalled the start of seasonal spread of respiratory syncytial virus (RSV) and influenza 2 and 4–5 weeks earlier than laboratory confirmation, respectively.7,8

PIDAC: Syndromic Surveillance Discussion Paper | August 2012 7
Disadvantages
Numerous disadvantages are associated with employee absenteeism as a source of syndromic surveillance data, including the lack of readily available data. Available data are typically not cause-specific and may capture seasonal aspects of absenteeism that are not related to communicable disease activity.8 Overall, employee absenteeism is a source of syndromic surveillance data with low specificity.
Recommendation
Given the scant evidence on employee absenteeism, an evaluation of its potential utility as a syndromic surveillance data source cannot be provided. Therefore, its adoption in Ontario is not recommended at this time.
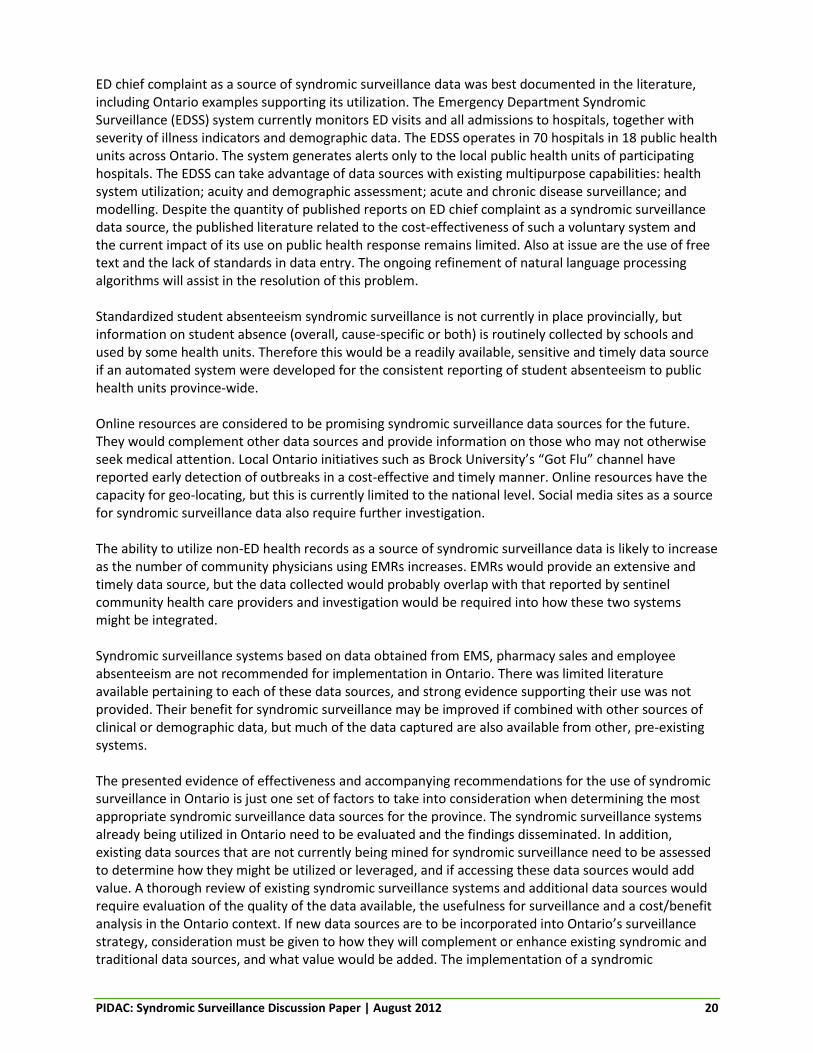
ABSENTEEISM: SCHOOL
School absenteeism as a data source for syndromic surveillance involves the use of school records to identify student absence—either all-cause or syndrome-specific absences.
Uses
School absenteeism data have been shown to be effective in the early detection of outbreaks. Records of student absences can be helpful in contributing to the understanding of the epidemiology of influenza in the community setting by monitoring trends over time, and by identifying activity specific to a grade, school or district.9 In pandemic situations, such as during the H1N1 pandemic, school absenteeism data have also been utilized to determine when influenza assessment centres should be opened, what to advise community providers and when an outbreak has terminated.10
Advantages
One advantage of syndromic surveillance systems utilizing school absenteeism data is improved timeliness and early detection. One system monitoring university student absenteeism in Canada detected an outbreak of influenza 1 week prior to other surveillance systems, as did a Japanese surveillance model based on student absenteeism.10,11 School absenteeism has also been shown to correlate with other traditional data sources, such as laboratory confirmation of respiratory pathogens.12 As a source of data for characterizing the epidemiology of disease in a targeted population, the advantages associated with school absenteeism records include the ability to combine the data with clinical information about student illness to inform decisions regarding disease control measures, suspension of classes, school closures and communication with parents.9 If automated, monitoring of school absenteeism is a simple surveillance method that requires minimal human resources for maintenance and allows public health officials to use limited resources efficiently.9 Automated self-reporting of illness and absenteeism in university students has also been shown to provide an opportunity to disseminate information about self-care and appropriate timing for return to school, as well as generate a medical note, thereby saving human resources.10
PIDAC: Syndromic Surveillance Discussion Paper | August 2012 8
Given that some jurisdictions have a legal requirement to record student absences at the school level, data would be complete and a denominator of children at risk would be available, permitting the calculation of population-based prevalence rates.12
Disadvantages
Although reporting of school absenteeism may be mandatory in some areas, it may be inconsistent by some schools, participation may vary from week to week and the criteria for defining a student absence may differ.9 A significant disadvantage is that data are not available for weekends and extended school holidays.12 School absenteeism as a data source has low specificity, as schools do not routinely collect information on the reason for student absence.9,12 Reacting to every signal would result in an unacceptable number of false positives and inefficient use of public health resources.9
Recommendation
If data collection and analysis are automated and consistent reporting by schools using common criteria for absences is encouraged provincially, an investment in school absenteeism as a syndromic surveillance data source would be recommended. In Ontario, the requirement for schools to record data on student absenteeism and report quarterly to the Ministry of Education provides a basic system that could be mined for syndromic surveillance purposes, although more frequent reporting would be required to make this a timely data source for syndromic surveillance. Cause-specific data for school absenteeism that differentiate between respiratory and GI illness would be ideal.
EMERGENCY DEPARTMENT CHIEF COMPLAINT
ED chief complaints are records of patient-reported signs and symptoms of illness at presentation.13 Each chief complaint generally consists of a concise statement entered into an electronic system in short free-text phrases.7
Uses
ED chief complaint data have been used in the early detection of disease clusters or outbreaks,14-17 and in the identification of the start or end of the season for pathogens such as influenza.18,19 Surveillance systems based on ED chief complaint data have also been utilized during mass gatherings such as the Major League Baseball World Series, the Olympic Winter Games and NASCAR Winston Cup Series events20,21; in the identification and monitoring of novel threats such as anthrax utilized as a bioterrorism agent; and during public health emergencies such as severe acute respiratory syndrome (SARS).22,23 During situations of heightened alert, ED data have also been used to provide public reassurance (e.g. after the terror attacks on September 11, 2001)24, identify when ED services are being overwhelmed, inform the timely mobilization of public health interventions (e.g. the opening of mass influenza assessment centres during the H1N1 pandemic) and measure their impact.14 ED chief complaint data can also be used to supplement surveillance data from other sources, such as sentinel physician consults and laboratory testing.25
Advantages
One of the main reported benefits of ED-based syndromic surveillance systems is the improved timeliness of the detection of outbreaks or events, as data are collected in real time, 24 hours a day, 7 days a week. Demographic data such as age and sex, as well as spatial analytics, have the potential to provide real-time epidemiological analysis. In simulation models, syndromic
PIDAC: Syndromic Surveillance Discussion Paper | August 2012 9
surveillance data detected 51 to 59 per cent of outbreaks before clinical case findings (mean detection benefit of 1 day), based on simulated laboratory cultures with a set specificity of 90 per cent.22 In a retrospective comparison of ED chief complaint data with positive influenza laboratory results, a detection benefit of 3 days (5 year average; annual range 3 to 18 days) was reported.17 The onset of seasonal activity for infectious diseases, specifically influenza, was also reported to be detected earlier as compared to other surveillance data sources.18,19 For example, ED data flagged the start of influenza season 2 to 3 weeks earlier than Centers for Disease Control sentinel ILI consult data in 2 of 3 eligible years examined.18 . Earlier detection of influenza activity was also found when ED chief complaint data were compared to sentinel physician reporting and laboratory results.16 During the H1N1 pandemic, alerts based on ED data occurred 7 days prior to laboratory confirmation.28 One study also noted the benefits of early detection of non-reportable respiratory infections such as RSV.26 Another feature described was the ability for multiple hospitals to connect through a common database for real-time results.27 The timeliness of ED systems could not be assessed in several other studies, as no outbreaks were detected to enable a comparison.15,20,24 While not abundant in the literature, several examples were described of how earlier detection led to an improved public health response. These actions included early detection of a cluster of meningococcemia, which enabled health department staff to deliver timely post-exposure prophylaxis to identified close contacts29; early alert to the medical community of community-wide increases in GI and respiratory illness consistent with seasonal pathogens16 (e.g. norovirus, rotavirus and influenza); and timely mobilization of public health interventions during the H1N1 pandemic.14 Earlier detection also assisted with the identification of priority populations for treatment (e.g. pregnant women, select age groups), development of modified laboratory testing algorithms that focused on high-risk groups, cancellation of elective surgeries and assessment of the severity of illness.30
Another advantage is that in the absence of laboratory confirmation, ED chief complaint data can be used to track transmission of diseases such as influenza, particularly in smaller, more isolated populations where the number of laboratory-confirmed cases is low.25
Disadvantages
One disadvantage of ED-based syndromic surveillance systems is that not all patients visit an ED as their first step towards treatment. For example, a survey of initial behaviour during ILI found that only 3 per cent of respondents visited the ED as their first course of action; respondents were more likely to first purchase OTC medication (37 per cent) or miss work/school (30 per cent).32 Therefore, ED data may not be as timely as other syndromic data sources, but it is more specific, which improves usefulness. Another disadvantage is the method by which ED chief complaint data are captured. Data entry for ED chief complaints is often unstructured, in free-text format, which reduces opportunities for automation to improve timeliness and efficiency. Computer algorithms for the classification, normalization and cleaning of ED data have reported differing levels of success, but increasing structure poses maintenance issues.29,33-38 This process is also hampered by the absence of national standards for the classification of ED chief complaints.36 Without such standards, the probability that a given syndrome detects true cases can be variable. For example, one study reported that the positive predictive value (PPV) of case definitions of 13 syndromes ranged from 20 to 99.3 per cent when compared to medical records and subsequent hospitalizations; half of the definitions had a PPV over 90 per cent, while sepsis, neurological/meningitis and coma were below 50 per cent.31

PIDAC: Syndromic Surveillance Discussion Paper | August 2012 10
The detection algorithms used and type of event can also impose challenges for ED syndromic surveillance. Buckeridge et al found that the ability of an ED chief complaint syndromic surveillance system to detect outbreaks or the start of a seasonal pathogen was reliant on the sensitivity and specificity of the system and the number of cases involved.22 Lastly, there was some literature on the economic implications of the use of ED syndromic surveillance, albeit limited. Significant start-up costs were described, along with widely varying annual expenditure estimates, ranging from $75,000 USD to $280,000 USD.15,40-42 However, the more automated the system, the less labour-intensive and the lower the annual operating costs.
Comparison of ED chief complaint to hospital discharge data When compared to hospital discharge data, ED chief complaint data have a number of advantages and disadvantages for syndromic surveillance. ED chief complaint data have been shown to better capture illnesses for which non-specific symptoms are the most important feature, but they are less useful at tracking illnesses that can be identified after a brief ED clinical evaluation and testing (i.e. sepsis and neurological syndromes).20,25,43 For example, syndromes such as gastroenteritis (where the signs, symptoms and exposure history provide immediate diagnostic implications) fit this surveillance system better than others such as hemorrhagic diarrhea (where symptoms are not evident and a more precise diagnosis is needed).31 The level of agreement between ED chief complaint and discharge data varies by syndrome, with poorer correlation observed for GI syndrome (r=0.48).20 Moderate agreement between the two data sources suggests frequent misclassification, which was more prevalent in paediatric cases or persons presenting with multiple symptoms.19,20 ED chief complaint data are often available earlier than discharge data; one study reported that 89 per cent of ED chief complaints were available to the syndromic surveillance system within 24 hours, compared to only 12 per cent of visits with at least one diagnosis code.44
Recommendations
Demonstrated benefits of ED chief complaint–based syndromic surveillance systems are evidenced in the literature, particularly their utility for early detection of outbreaks and seasonal pathogens. A few studies described the cost-effectiveness of these systems and whether earlier detection translated into more effective public health responses. Recommendations to minimize costs include the automation of systems to decrease annual staff time spent monitoring the system and investigating alerts. As well, improving or optimizing detection algorithms for specific data sources to improve the balance of sensitivity and specificity could result in decreased time spent investigating false positives.18,45,46 To further improve the PPV and utility of ED chief complaint surveillance data, linkages to laboratory and radiographic results are recommended.43, 44 Creating standards for how free-text chief complaints are captured and categorized into syndromes will similarly improve PPV. Additionally, the creation of a public health dashboard that allows for the visualization of ED visit trends, in conjunction with other data streams, would be a more practical and meaningful approach, and may help reduce ambiguity in results and permit linkage to public health response.14,15 If systems can be optimized to improve PPV, minimize cost and maximize influence on public health action, an investment in ED chief complaints as a data source for syndromic surveillance would be recommended.

PIDAC: Syndromic Surveillance Discussion Paper | August 2012 11
EMERGENCY MEDICAL SERVICES, 911 CALLS AND EMERGENCY PREPAREDNESS
Syndromic surveillance data from emergency systems include assessment by emergency medical service (EMS) personnel, dispatch codes from 911 calls, and signs and symptoms recorded in response to patient calls to emergency services.13
Uses
Data from 911 calls and EMS first responders are most frequently used for surveillance during mass gatherings and to provide assistance during novel threats, emergencies or natural disasters. Surveillance data from these sources can be utilized to identify the start or end of circulation of a seasonal pathogen, provide early outbreak detection or describe the nature of an infectious illness.
Advantages
Agreement between EMS data and other syndromic surveillance data sources has been reported.9,30 For example, ambulance dispatch data have been shown to demonstrate trends similar to sentinel ILI data during influenza season.47 An enhanced surveillance system initiated as part of the emergency preparedness plan associated with the 2006 World Cup in Germany detected 77 per cent of infectious disease events related to the World Cup, compared to only 44 per cent detected by the routine surveillance system.48
Disadvantages
One study found that the use of ambulance dispatch data for ILI surveillance introduced some biases compared with surveillance of all ED visits: those who used EMS were older and more likely to complain of chest pain and shortness of breath.49 Low sensitivity (58 per cent) and specificity (64 per cent) were also attributed to EMS and 911 calls as a data source in comparison to ED screening for ILI.49
Recommendation
A few articles were available regarding the use of 911 calls and EMS data for syndromic surveillance, but they were disparate in their description of the type of data collected, the use and analysis of the data, and the overall quality. As a result, this source of syndromic surveillance data cannot be recommended.
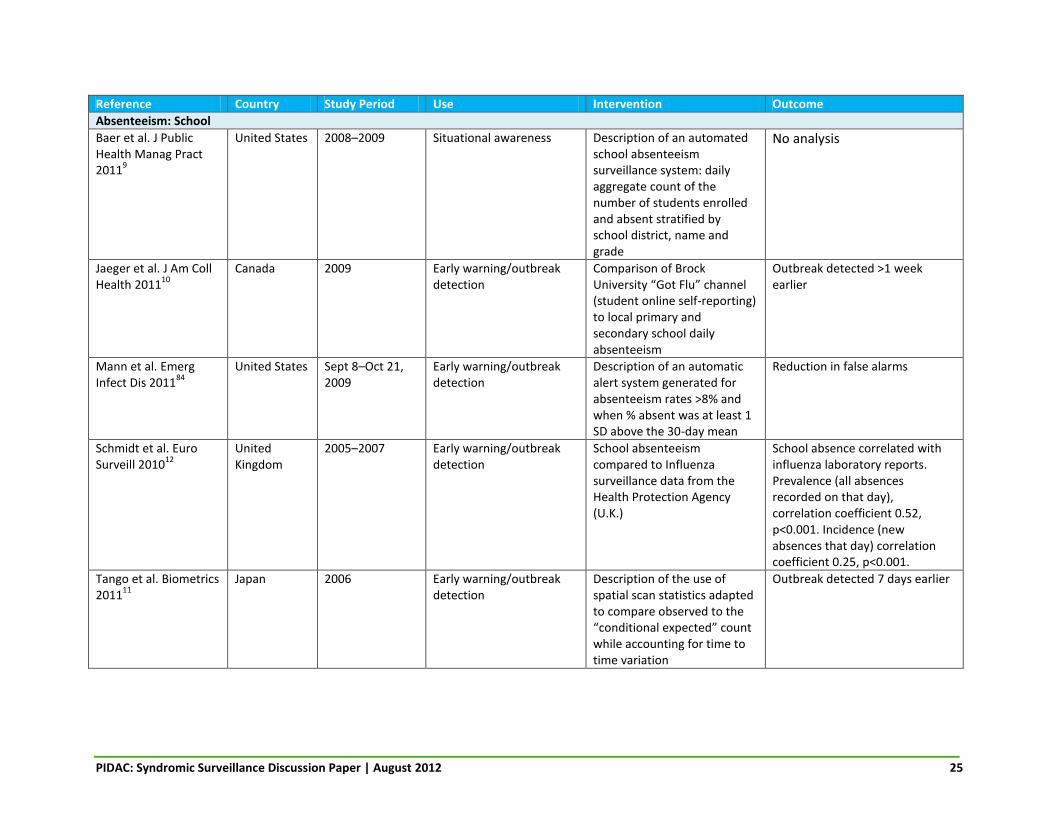
NON–EMERGENCY DEPARTMENT HEALTH RECORDS
Syndromic surveillance systems based on health records are usually coded using the International Classification of Diseases (ICD), which allows for the assignment of codes to diagnoses and procedures.13 These data may be retrieved from a variety of sources, including visits to community physicians; military clinics, travel clinics, influenza clinics and women’s groups; community physician billing data; health care management organizations; and health plan, hospital discharge and mortality data.
Uses
Syndromic surveillance systems utilizing data obtained from community sources beyond sentinel health care providers and EDs can be used for the early detection of disease transmission, the identification of outbreaks and the detection of the start of circulation of seasonal pathogens. Syndromic surveillance data obtained from community health care sources can complement other surveillance data by providing an assessment of illnesses that do not require hospital admission or identification of an etiologic agent and demonstrate the extent of an outbreak

PIDAC: Syndromic Surveillance Discussion Paper | August 2012 12
beyond cases identified through laboratory confirmation.50,51 Epidemiologically significant information, including the burden of disease and identification of shifts in virulence, can be identified by monitoring surveillance trends from hospitalization and mortality data.30,52 The increased level of information available when syndromic surveillance data are obtained from a variety of community health care sources can be used in planning the diagnostic capacity required for testing symptomatic persons.52 A surveillance system that incorporates reporting from community health care sources can facilitate communication with the public and provide reassurance by quantifying the effect of disease transmission on the population, including mortality, and it can prevent unnecessary precautions from being taken.53
Advantages
Early detection of a number of outbreaks has been reported in the literature, including a retrospective review of hospital data for lower respiratory tract infections that identified an outbreak of Legionnaires’ disease 4 days earlier.121 Similarly, a retrospective investigation of lower respiratory tract infections, hepatitis and/or endocarditis in hospital medical records detected clusters of disease that could be plausibly attributed to unrecognized Q fever before the first known outbreak was reported.52 Syndromic surveillance data from military health care providers triggered the declaration of a dengue fever outbreak 3 to 4 weeks prior to laboratory confirmation.54 Review of physician billing claims has also demonstrated that visits to outpatient clinics for ILI tend to increase in frequency up to 2 weeks earlier than visits to EDs.55 Monitoring syndromic surveillance data obtained from community health care sources can also assist in the identification of the start of influenza season (at least 1 week earlier in 5 out of 6 influenza seasons in Ireland) or pandemic events (detection of an increase in community H1N1 1 week earlier) and indicate when the management strategy for controlling disease transmission should be enhanced or altered.56-58 The quantity of data available is increased with the use of a surveillance system that includes health records and a variety of community health care sources. Hospital ED data are reflective of the more severe cases of disease, and surveillance limited to this level may miss cases that are not severe enough to warrant laboratory testing or a hospital visit.50,56 Syndromic surveillance data obtained from community health records may also identify disease transmission earlier, as those in the early stages of illness may exhibit milder symptoms that require community-based rather than ED care.55 In some settings, depending on the organization of the health care system, primary care physicians may act as the patient’s first contact or “gatekeeper” and may therefore be able to provide the earliest case report.59 Complete health data records, as opposed to a reporting of only the chief complaint or discharge diagnosis, may also provide additional information pertinent to the investigation of disease transmission, such as duration of symptoms or travel history.60 The greater availability of postal codes may improve geographic accuracy and spatial analysis of disease activity, which is critical for tracking the spread of disease and identifying “hotspots” of community transmission.50,56,61
Disadvantages
A number of limitations are associated with syndromic surveillance data from non-ED community sources and health data records. No system is currently available to continuously monitor medical records from community health care providers in real time in Ontario.

PIDAC: Syndromic Surveillance Discussion Paper | August 2012 13
Information may be more easily obtained from other surveillance systems, such as those using ED data.55 The ability of community health care providers to capture cases is limited by disease presentation: those with severe symptoms are more likely to visit an ED, while those with milder, self-limiting symptoms are less likely to seek medical advice; therefore, the ability to detect an outbreak is diminished.62,63 The number of participating community health care providers must be large enough and have sufficient geographic coverage to have a high degree of sensitivity for disease detection; they must also be representative of the whole population while providing reliable information at the local level.7,50 The accuracy of syndromic surveillance data obtained from health records and community health care providers can vary. The lack of data standards and differences in the coding of symptoms and diagnoses by physicians and hospitals, as well as coding errors, can result in false alarms or repression of signals of disease transmission.7,50,62,63 Although health data records provide a greater quantity of surveillance data, the usefulness of the data for describing the epidemiology of a disease and tracking the spread of an outbreak can be questionable (e.g. the relevance of a case patient’s home postal code for spatial analysis as opposed to the location of his/her workplace).62,63 Similar to other syndromic surveillance systems, data obtained from health records and community health care providers is sensitive to outside influences, such as increased publicity surrounding infectious disease activity and public health recommendations to seek health care.51,56
Recommendation
The increased use of electronic medical records (EMRs) by community health care providers could provide an extensive and timely data source for syndromic surveillance, but would likely be associated with initial organizational and ongoing administrative costs. Data linkage and the use of multiple data sources for syndromic surveillance would allow for the coverage of the spectrum of disease morbidity from mild to severe, but sufficient information must be available to effectively verify signals.7 As with other syndromic surveillance systems, data standards and common definitions would be required. Although not recommended for immediate use, it is recommended that the adoption of EMR systems by physicians in the province be monitored and opportunities to leverage this type of syndromic surveillance data be investigated when EMR systems are more fully implemented.
ONLINE RESOURCES
Syndromic surveillance systems based on online data utilize information obtained from the monitoring of online search trends and Internet-based self-reporting illness tools. Analysis of online search trends provides an estimate of disease activity via the aggregation of search engine queries and demands for health information (e.g. Google Flu Trends).
Uses
The primary use of syndromic surveillance data from online data sources has been early warning of disease transmission and outbreak detection.10,64 Internet-based data can also be used to signify the start or end of transmission of seasonal pathogens.65 Online data sources have also been used to provide situational awareness, aid in the epidemiologic description of a disease and perform surveillance during a mass gathering such as the G8 summit.66

PIDAC: Syndromic Surveillance Discussion Paper | August 2012 14
Advantages
One advantage of syndromic surveillance data obtained from online resources is earlier detection of infectious disease activity. In Canada and the United States, online resources have detected influenza activity 7 to 10 days earlier as compared to surveillance systems that rely on laboratory confirmation of ILI.64,67 An Internet self-reporting system for influenza in Australia demonstrated an ability to detect the peak in influenza activity that coincided with traditional syndromic and laboratory-based surveillance.65 Syndromic surveillance systems relying on online data sources are most useful in geographic areas where Internet access is readily available and among populations where Internet use is prevalent. In these settings, online data sources can complement traditional surveillance systems and laboratory data. Search trends for health information are highly correlated with ILI surveillance in Canada (r=0.91), Sweden (r=0.89 to 0.90) and Europe (r=0.72 to 0.94).67,68,69 The operational costs for surveillance systems that collect data from online sources can be low, and these systems have the ability to track illness in real time. Furthermore, this source of data captures information on those who may not otherwise seek medical attention. Additionally, the completeness of online tools for the self-reporting of illness may exceed that of more traditional methods, such as phone reporting directly to public health departments.70
Disadvantages
The relevance of online syndromic surveillance data collected by tracking influenza-related online searches can be influenced by sex (female), age and search trends.67 Also, Internet usage may be decreased during illness. Generally, geographic data from online sources can be analyzed only at a national level, as opposed to local information on disease transmission, unless Internet service provider–specific information is collected.67
Recommendation
Online resources remain in their adolescence as a tool for syndromic surveillance, and the current evidence does not provide collective support for any particular aspect of online surveillance. Monitoring of online search trends and the use of online self-reporting illness tools appear to have potential for supporting and enhancing traditional syndromic surveillance systems, but at this time they would be limited to national monitoring. Additional evidence is required focusing on ease and equity of access to the Internet, methods to entice people to self-report illness online and the cost-effectiveness of an Internet-based surveillance system. At the current time, a moderate investment in this type of surveillance would be recommended until the Internet is more representative and accessible, and until better geo-locator information accompanies these data.
PHARMACY SALES
Syndromic surveillance systems utilizing pharmacy sales monitor the dispensing of OTC and/or prescription medications that are used to treat certain illnesses or syndromes such as ILI or GI illness.13
Uses
Syndromic surveillance systems based on pharmacy sales have been used in the early detection of outbreaks.7,8,75,71,99,125-127 the identification of the start of a pathogen’s seasonal transmission in routine surveillance programs,72,74 and health-system planning and disease burden assessment during emergencies.85

PIDAC: Syndromic Surveillance Discussion Paper | August 2012 15
Advantages
Pharmacy sales data can be rapidly transferred to public health authorities, leading to more timely alerts and potential gains in lead time for outbreak response. Pharmacy sales data have been shown to be congruent with other syndromic surveillance data sources. In comparison to physician insurance claims, peaks in OTC sales of influenza remedies occurred 2.8 days earlier than patient-physician encounters.71 The incidence of ILI based on sentinel general practice physicians has also been shown to correlate well with pharmacy sales (r=0.85–0.96), as has physician diagnosis of acute respiratory conditions and OTC sales of influenza remedies.72,73 For GI illnesses, the temporal patterns of OTC sales of diarrheal remedies were most closely related to laboratory-confirmed norovirus infection (r=0.44).74
Disadvantages
The usefulness of pharmaceutical sales as a syndromic surveillance source appeared to differ based on the type of infectious syndrome. Several studies reported early detection of respiratory outbreaks and high correlation with the diagnosis of respiratory infection, but the sales records for OTC diarrhea remedy sales had a sensitivity of only 4–14 per cent in the detection of GI outbreaks and individual cases.75 The specificity of surveillance systems utilizing data from pharmacy sales is low and is influenced by seasonal trends, retail sales and the location of purchase. Prescription sales data are likely more specific than OTC sales, although this does not account for off-label use for multiple conditions. Misleading clustering may be reported based on purchasing trends that reflect locations other than the customers’ place of residence.75 Little assessment is available as to the cost/benefits or resource requirements of syndromic surveillance systems that employ pharmacy sales data.
Recommendation
Investment in pharmacy-based syndromic surveillance systems is not recommended at this time, as the evidence of the timeliness of the data, the sensitivity and specificity of the system and the economic costs are not well established. Pharmacy sales data could be a useful source of syndromic surveillance data if combined with clinical and/or demographic data to further characterize cases, and if used in conjunction with other traditional surveillance data sources to detect concurrent signals. Further research is required to determine appropriate public health responses to detected alerts from pharmacy sales and assess public health significance.
SENTINEL COMMUNITY HEALTH CARE PROVIDERS
A syndromic surveillance system based on sentinel community health care providers involves monitoring and analyzing counts or rates of new cases of illness identified during the routine delivery of health care by primary care practitioners (physicians and nurse practitioners) who volunteer to be part of a surveillance network.62 Electronic medical records from primary care practitioners and outpatient clinics may be utilized.
Uses
Surveillance data from sentinel community health care providers may increase situational awareness and have been shown to be of use in the monitoring of trends in disease transmission and early identification of outbreaks of infectious diseases.8,76 In simulation

PIDAC: Syndromic Surveillance Discussion Paper | August 2012 16
models, data on ILI from sentinel health care providers have demonstrated the ability to detect large-scale outbreaks (i.e. pandemics).76
Advantages
Sentinel community health care providers as a source of syndromic surveillance data may provide data on a large number of people, in real time, if EMRs can be assessed.62 In terms of human resources and financial costs, the maintenance of a sentinel health care provider syndromic surveillance system for ILI is inexpensive, although resources are required for the initial system development and ongoing recruitment of health care providers.77
Disadvantages
If access to EMRs is not available, receipt of surveillance data from sentinel community health care providers is not timely, although this may be improved with the use of automated data submission, including Web-based reporting.77 Those not ill enough to seek medical attention will be missed. A level of extra alertness by clinicians may render the data unreliable for surveillance purposes. The quality of surveillance data obtained from sentinel community health care providers may also vary by patient age. For example, the elderly, who are more likely to experience severe ILI symptoms, may bypass their community health care provider and visit the hospital directly, resulting in an inaccurate assessment of disease burden in this age group.8 The value of surveillance data from sentinel community health care providers may also vary by specific respiratory virus, with the monitoring of the circulation of certain viruses (i.e. influenza A and B, RSV) being superior to others.8 Syndromic surveillance systems based on data from community health care providers are associated with low sensitivity, even when a standardized case definition is utilized.62,77 Attempts to increase the sensitivity of the surveillance system may compromise the specificity, although this can be ameliorated by encouraging community health care providers to obtain specimens for respiratory viruses from symptomatic patients and combining the resulting reports of laboratory-confirmed influenza with sentinel syndromic surveillance data.77
Recommendation
Based on the available evidence, sentinel community health care providers as a source of syndromic surveillance data would be recommended at a provincial level for ILI, assuming the availability of a common electronic system with common definitions and data standards. A similar system would not be recommended for use at the local level, as the small number of sentinel health care providers would result in unstable rates of disease (although this would be dependent on the geographic coverage of sentinel sites). The use of EMRs should be investigated further, after data-mining issues (e.g. case definitions, data entry discipline, automated data export analysis) are resolved. The incorporation of sentinel EDs reporting surveillance data specific to non-admitted patients may enhance the syndromic surveillance system, as EDs are representative of the community, provide year-round 24/7 access and are staffed by health care workers familiar with obtaining specimens for respiratory viruses.
TELEPHONE HELP LINES
Telephone help lines are services where the general public can access a qualified health professional at any time to receive health advice or general health information via telephone. Most help lines collect demographic information, assess symptoms and provide advice on what additional health care should be sought. The degree of integration with the health care system differs between countries.

PIDAC: Syndromic Surveillance Discussion Paper | August 2012 17
Uses
Syndromic surveillance data obtained from telephone help lines can be utilized in the detection of outbreaks and early warning of disease clusters, as well as identifying the start of seasonal pathogen detection (e.g. influenza). Once infectious disease transmission has been reported, telephone help lines can also be useful in tracking the spread of disease and identifying the areas affected. During the H1N1 influenza pandemic, the deputizing service in Australia was able to confirm the peak of ILI in various areas. Analysis of calls to the United Kingdom’s National Health Service (NHS) Direct line was able to assist in the identification of the geographic boundaries of a cryptosporidium outbreak.51,78
Advantages
Syndromic surveillance systems based on data from telephone help lines may detect outbreaks and infectious disease transmission in advance of other data sources. Ontario’s Telehealth system detected the peak in the influenza season 2 weeks earlier in the 2004–2005 season and 1 week earlier in 2005–2006 season, compared to official laboratory-based reports from the Public Health Agency of Canada.27 Retrospective review of NHS Direct surveillance data identified seasonal influenza activity 2 weeks in advance of general practitioner (GP) consultation data in 3 of 4 seasons and 6 days’ advance warning in a prospective evaluation in the 2006–2007 influenza season.79 Similarly, Ireland’s Out of Office Hours automated GP consultation service detected a peak in influenza-related calls 1 week prior to the national ILI consultation data.57 Prospectively, in 2009, calls to NHS Direct exhibited an increase in H1N1 activity 1 week prior to GP consultation data, and these data informed public health professionals about the degree of community transmission, resulting in the move from the containment to the mitigation phase of the pandemic response.56 Similar advance warning was not identified for GI illness, although 2009 Ontario Telehealth data documented an increase in GI illness–related calls simultaneously with ED visits.80 Syndromic surveillance data from telephone help lines also fill a gap left by other surveillance sources. Telephone help lines are generally available for long periods of time (e.g. Telehealth is available 24 hours a day, 365 days a year) when GP offices are closed, and although emergency room data would identify cases during evenings, weekends and holidays, these cases are likely to be only those of severe illness.57,81 Telephone help lines may be particularly useful when a predominating influenza strain does not initially cause significant levels of illness, so that neither GP nor ED data would capture meaningful information.82 Telephone help line data may also permit improved surveillance in underserviced areas such as northern Ontario, communities that are not integrated with routine surveillance systems (such as First Nations communities) and areas with limited access to emergency facilities and family physicians.81 The potential for the linkage of demographic information from calls to telephone help lines would improve geographic accuracy and allow for spatial analysis of disease transmission. For example, data from NHS Direct were used to map the geographic spread of the H1N1 outbreak in the U.K. in order to monitor transmission.56,57
Disadvantages
Poor population representation is one limitation of syndromic surveillance systems based on data from telephone help lines. If the system is not centralized, patterns of use will not be equal in a population and thus not representative on a national scale.62 The Out of Office System in Ireland is a voluntary subscription service for GPs, so not all physician practices are associated,

PIDAC: Syndromic Surveillance Discussion Paper | August 2012 18
and therefore patients of practices not affiliated with the system are not represented.57,78 There is an age and sex bias seen in both the U.K. NHS Direct and Ontario systems. The highest call rates are related to young children and are lowest for those over 65 years of age.81-83 In addition, women are more likely than men to use these systems.81-83 The accuracy of information obtained via telephone help lines is also questionable. Cases of illness captured by help line systems are self-reported and thus not as reliable as traditional laboratory-based methods or physician assessment of clinical syndromes.57 The volume of calls to a telephone help line is also likely influenced in circumstances where there is publicity surrounding an incident.51 A non-specific case definition may also capture cases that are not related to each other in any meaningful way.51,57
Recommendations
Syndromic surveillance utilizing telephone help lines could be improved with the addition of a clear and working link between those administering the telephone help line and those analyzing the data for potential public health action. This would assure a systematic and consistent approach to how this data source would inform when public health action should be taken.57,83 The inclusion of spatio-temporal analysis would help identify subregional variation of disease rates.51 Given the availability of data in Ontario (Telehealth), the use of telephone help lines for syndromic surveillance would be recommended. There appears to be great potential to use this source of information in a meaningful way, especially in the early identification of widespread acute illnesses, such as influenza. However, telephone help line surveillance requires more evaluation and statistical validation. Benefitting from the Ontario Telehealth system will also require a centralized approach in an overall surveillance strategy that provides recommendations for its use at the provincial and local levels.
PIDAC: Syndromic Surveillance Discussion Paper | August 2012 19
Discussion Limitations There were limitations identified in the search strategy utilized. The source material was limited to findings published in peer-reviewed scientific literature; reports in the grey literature and unpublished research known to the committee were excluded. As a result, much of the existing information pertaining to the use of syndromic surveillance in Ontario was not included. Other research on systems based in Ontario and Canada as a whole did not meet the scoring/grading quality criteria. As the literature regarding syndromic surveillance in Canada was limited, the applicability of data from other jurisdictions needs to be taken into account; those locations with a similar health care system would be the most generalizable to the Ontario setting. In addition to the absence of material specific to Ontario, the available literature was also limited for certain syndromic surveillance data sources, thus hampering the ability to make informed recommendations. The majority of the literature that met the inclusion criteria examined infectious disease detection capabilities through retrospective or mathematical model-based approaches that limited the ability to assess the utilization of syndromic surveillance to prospectively inform public health action. Finally, very few of the papers reviewed described the cost benefits of syndromic surveillance related to public health intervention and public health significance, making it difficult to evaluate the data sources in this context.
Overall recommendations PIDAC-S recommends the following regarding syndromic surveillance data sources for Ontario (summarized in Table 3). Sentinel community health care providers, telephone help lines and ED chief complaint are already in use as sources of syndromic surveillance data in Ontario, and their continued use is recommended with ongoing evaluation, validation and cost-benefit analysis. Infrastructure and reporting strategies are in place across the province for the reporting of ILI by sentinel community health care providers, and with the exception of ongoing recruitment, the maintenance of the system is not difficult or costly. The timeliness of the data may be an issue, as submission is currently done on a weekly basis, delaying analysis. In addition, although data provided by sentinel community health care providers are a valuable resource for surveillance at the provincial level, the number of sentinels and their geographic distribution prevent data interpretation at the local level. Recruitment of additional sentinel sites may increase the applicability and acceptability of this form of syndromic surveillance to public health at the local level. Telehealth Ontario collects a large volume of data, categorizes calls based on specific symptom-based criteria and has an existing reporting structure. Monitoring for significant changes in the volume of calls due to a syndrome of interest (e.g. ILI) allows for the possible early detection of outbreaks or clusters of infectious diseases and the quantification of the burden of disease; the collection of postal code data permits geographic analysis of disease transmission. Daily monitoring of Telehealth calls for several years has so far demonstrated utility only in identifying the start of respiratory infection season. It is recommended that work continue on improving the quality and validation of Telehealth data.
PIDAC: Syndromic Surveillance Discussion Paper | August 2012 20
ED chief complaint as a source of syndromic surveillance data was best documented in the literature, including Ontario examples supporting its utilization. The Emergency Department Syndromic Surveillance (EDSS) system currently monitors ED visits and all admissions to hospitals, together with severity of illness indicators and demographic data. The EDSS operates in 70 hospitals in 18 public health units across Ontario. The system generates alerts only to the local public health units of participating hospitals. The EDSS can take advantage of data sources with existing multipurpose capabilities: health system utilization; acuity and demographic assessment; acute and chronic disease surveillance; and modelling. Despite the quantity of published reports on ED chief complaint as a syndromic surveillance data source, the published literature related to the cost-effectiveness of such a voluntary system and the current impact of its use on public health response remains limited. Also at issue are the use of free text and the lack of standards in data entry. The ongoing refinement of natural language processing algorithms will assist in the resolution of this problem. Standardized student absenteeism syndromic surveillance is not currently in place provincially, but information on student absence (overall, cause-specific or both) is routinely collected by schools and used by some health units. Therefore this would be a readily available, sensitive and timely data source if an automated system were developed for the consistent reporting of student absenteeism to public health units province-wide. Online resources are considered to be promising syndromic surveillance data sources for the future. They would complement other data sources and provide information on those who may not otherwise seek medical attention. Local Ontario initiatives such as Brock University’s “Got Flu” channel have reported early detection of outbreaks in a cost-effective and timely manner. Online resources have the capacity for geo-locating, but this is currently limited to the national level. Social media sites as a source for syndromic surveillance data also require further investigation. The ability to utilize non-ED health records as a source of syndromic surveillance data is likely to increase as the number of community physicians using EMRs increases. EMRs would provide an extensive and timely data source, but the data collected would probably overlap with that reported by sentinel community health care providers and investigation would be required into how these two systems might be integrated. Syndromic surveillance systems based on data obtained from EMS, pharmacy sales and employee absenteeism are not recommended for implementation in Ontario. There was limited literature available pertaining to each of these data sources, and strong evidence supporting their use was not provided. Their benefit for syndromic surveillance may be improved if combined with other sources of clinical or demographic data, but much of the data captured are also available from other, pre-existing systems. The presented evidence of effectiveness and accompanying recommendations for the use of syndromic surveillance in Ontario is just one set of factors to take into consideration when determining the most appropriate syndromic surveillance data sources for the province. The syndromic surveillance systems already being utilized in Ontario need to be evaluated and the findings disseminated. In addition, existing data sources that are not currently being mined for syndromic surveillance need to be assessed to determine how they might be utilized or leveraged, and if accessing these data sources would add value. A thorough review of existing syndromic surveillance systems and additional data sources would require evaluation of the quality of the data available, the usefulness for surveillance and a cost/benefit analysis in the Ontario context. If new data sources are to be incorporated into Ontario’s surveillance strategy, consideration must be given to how they will complement or enhance existing syndromic and traditional data sources, and what value would be added. The implementation of a syndromic

PIDAC: Syndromic Surveillance Discussion Paper | August 2012 21
surveillance system must consider the infrastructure and resources required to respond to signals generated by the surveillance data collected. This includes the requirement to analyze and interpret the data, the cost of investigating and responding to alerts, the liability associated with failure to respond, and the method of providing feedback to those with the ability to affect change and implement appropriate public health interventions.

PIDAC: Syndromic Surveillance Discussion Paper | August 2012 22
Tables and Figures
320
Unique records
identified by search
strategy
52
Article rejected based
on score/grade
138
Articles Abstracted
190
Full-text articles
scored/graded
130
Records rejected
based on preliminary
screening
Figure 1: Flowchart of Study Selection Process
65 Articles rejected
based on score/grade
125 Articles
abstracted

PIDAC: Syndromic Surveillance Discussion Paper | August 2012 23
Figure 2: Frequency of included articles by publication year, N=125.
Figure 3: Frequency of included articles by syndromic data source described, N=150*. ED, emergency department; HCP, health care provider. *20 publications described more than one data source, therefore, the number of articles totals to 150, not 125.
0
5
10
15
20
25
30
2003 2004 2005 2006 2007 2008 2009 2010 2011(up to
Apr 30)
Nu
mb
er
of
Incl
ud
ed
Art
icle
s
Year of Publication
0 10 20 30 40 50 60
Employee Absenteeism
School Absenteeism
Emergency Medical Services
Online Resources
Sentinel Community HCP
Pharmacy Sales
Telephone Help Lines
Non–ED Health Records
ED Chief Complaint
Number of Included Articles
Syn
dro
mic
Dat
a So
urc
e

PIDAC: Syndromic Surveillance Discussion Paper | August 2012 24
TABLE 1: DESCRIPTION OF INCLUDED STUDIES
Reference Country Study Period Use Intervention Outcome
Absenteeism: Employee Marx et al. Am J Public Health 2006
85 United States Aug 16–18, 2003 Assistance during novel
threats/emergencies/ natural disasters
Description of the detection of risk factors for diarrheal illness during a power outage
No analysis
Van den Wijngaard et al. Euro Surveill 2011
7
Netherlands 2002–2003 Early warning/outbreak detection Monitoring disease burden
Syndromic surveillance data compared to laboratory-confirmed respiratory pathogens
Winter peaks concurrent with peaks in influenza virus, RSV and other respiratory pathogens 68% of variations explained by respiratory pathogens Alert 2 weeks ahead of RSV, 4–5 weeks ahead of influenza
PIDAC: Syndromic Surveillance Discussion Paper | August 2012 25
Reference Country Study Period Use Intervention Outcome
Absenteeism: School Baer et al. J Public Health Manag Pract 2011
9
United States 2008–2009 Situational awareness Description of an automated school absenteeism surveillance system: daily aggregate count of the number of students enrolled and absent stratified by school district, name and grade
No analysis
Jaeger et al. J Am Coll Health 2011
10 Canada 2009 Early warning/outbreak
detection Comparison of Brock University “Got Flu” channel (student online self-reporting) to local primary and secondary school daily absenteeism
Outbreak detected >1 week earlier
Mann et al. Emerg Infect Dis 2011
84 United States Sept 8–Oct 21,
2009 Early warning/outbreak detection
Description of an automatic alert system generated for absenteeism rates >8% and when % absent was at least 1 SD above the 30-day mean
Reduction in false alarms
Schmidt et al. Euro Surveill 2010
12 United Kingdom
2005–2007 Early warning/outbreak detection
School absenteeism compared to Influenza surveillance data from the Health Protection Agency (U.K.)
School absence correlated with influenza laboratory reports. Prevalence (all absences recorded on that day), correlation coefficient 0.52, p<0.001. Incidence (new absences that day) correlation coefficient 0.25, p<0.001.
Tango et al. Biometrics 2011
11 Japan 2006 Early warning/outbreak
detection Description of the use of spatial scan statistics adapted to compare observed to the “conditional expected” count while accounting for time to time variation
Outbreak detected 7 days earlier

PIDAC: Syndromic Surveillance Discussion Paper | August 2012 26
Reference Country Study Period Use Intervention Outcome
Emergency Department Chief Complaint Ansaldi et al. J Prev Med Hyg 2008
86 Italy 2007–2008 Early warning/outbreak
detection
Comparison of ED chief complaint to influenza surveillance network and regional reference laboratory data
Alerting parameters used a 5-day moving average of 1.6 cases per day, resulting in a sensitivity and specificity of 72.9% and 90.3%, respectively Alert 2.5 days earlier
Baer. J Public Health Manag Pract 2011
9 United States Dec 15–24, 2006 Surveillances during a
mass gathering/unique event
Comparison of EMS assessment for carbon monoxide poisoning to ED chief complaint during a power outage
79% cases were exactly identified in the syndromic data, 8% were likely matches, 6% were possible matches and 8% could not be matched
Begier et al. Emerg Infect Dis 2003
43 United States Dec 2001 Situational awareness Comparison of ED chief
complaint to discharge diagnosis
Good agreement between data sources (kappa=0.639), with variability by syndrome
Bellazzini et al. Am J Emerg Med 2011
28 United States 2008–2009 Early warning/outbreak
detection
Comparison of detection of ILI by ED syndromic surveillance and laboratory confirmation
ILI alerts from ED data occurred 7 days prior to first confirmed cases of H1N1
Buckeridge et al. Emerg Infect Dis 2006
22
United States 2006 Early warning/outbreak detection
Development of a model comparing identification of anthrax via ED chief complaint with simulated clinical case finding (positive blood cultures)
When specificity was set at 90%, syndromic surveillance detected 51–59% of outbreaks before clinical case finding: the mean detection benefit was 1.0–1.1 days. When specificity was set at 97.5%, syndromic surveillance detected 19–28% of outbreaks before clinical case finding: the mean detection benefit was about 8 hours A specificity of 90% resulted in 1 false alarm every 10 days, while a specificity of 97.5% resulted in 1 false alarm every 40 days

PIDAC: Syndromic Surveillance Discussion Paper | August 2012 27
Reference Country Study Period Use Intervention Outcome
Burr et al. BMC Medical Inform Decis Mak 2006
87
United States 1994–2003 Signify start/end of seasonal pathogen
Real and synthetic data (where there was not sufficient historical information) to evaluate if each year’s seasonal peak had the same onset, duration and magnitude
No analysis
Chan et al. PLoS One 2010
88 Taiwan 2006–2008 Early warning/outbreak
detection
Development of a model for influenza surveillance and validated with historical ILI data
Model able to detect signals 1–2 days prior to the rise in ILI visits
Choi et al. BMC Public Health 2010
89
Hong Kong Sep 12–Oct 14, 2005
Early warning/outbreak detection
Description of a system for investigating the geographic distribution of ILI cases based on demographic data, provisional diagnosis, temperature at presentation to ED and residential location
40 case clusters detected: 25 had 2 or more patients living in the same building block, 18 were from residential care homes for elderly
Craigmile et al. BMC Med Inform Decis Mak 2007
45
United States 2003–2004 Early warning/outbreak detection
Development of a statistical model for outbreak detection based on ED visit counts and chest radiography Evaluation of the model in detecting a simulated anthrax attack
No analysis
Dafni et al. MMWR Morb Mort Wkly Rep 2004
46
Greece 2002–2003 Surveillance during a mass gathering/unique event
Evaluation of an aberration detection method (Pulsar) using surveillance data of ED chief complaint and comparison to other simulation approaches
Sensitivity higher than other methods (p<0.001)

PIDAC: Syndromic Surveillance Discussion Paper | August 2012 28
Reference Country Study Period Use Intervention Outcome
Das et al. J Urban Health 2003
24
United States 2001 Early warning/outbreak detection
Description of a system implemented following Sept 11, 2001, to ensure early recognition of an increase or clustering of disease and based on data collected at ED, translated into syndromes and analyzed for aberrations in space and time within 24 hours
No outbreaks detected Citywide temporal alarms occurred 8 times for 3 bioterrorism-related syndromes Spatial clustering alarms occurred 16 times
Day et al. Ann Emerg Med 2004
33
United States 2003-4 Systems evaluation Description of the use of computer algorithms to classify free-text ED chief complaints into reason-for-visit categories
20 categories mapped to 77% of all patient visits in database 1 and 67% in database 2
Fan. Can J Public Health 2010
14
Canada 2009 Early warning/outbreak detection Situational awareness
Comparison of Alberta Real Time Syndromic Surveillance Net (including calls to Health Link Alberta) to traditional paper-based surveillance methods
No analysis
Fleischauser et al. Acad Emerg Med 2004
20
United States Oct–Nov 2001 Surveillance during a mass gathering/unique event
Comparison of a surveillance system in which trained hospital care providers completed a surveillance form on all patients presenting to the ED to capture whether an event was attended (Major League Baseball World Series and NASCAR Winston Cup Series) and their primary condition to ED chief complaint and ED discharge diagnosis
No outbreaks detected Level of agreement was higher with ED discharge diagnoses (K=0.55) for all syndromes except GI relative to ED chief complaints (K=0.48)

PIDAC: Syndromic Surveillance Discussion Paper | August 2012 29
Reference Country Study Period Use Intervention Outcome
Foldy et al. J Public Health Manag Pract 2004
15
United States Jun 25–Jul 22, 2002
Early warning/outbreak detection
Description of a syndromic surveillance system based on ED chief complaint in addition to lab reports, hospital ED diversions, medical examiner reports, poison control and nursing hotline call volumes to detect outbreaks
No outbreaks detected
Gangnon et al. WMJ 2009
90
United States 2007–2008 Early warning/outbreak detection
Comparison of ED chief complaint (fever and ILI) to ICD-9 discharge codes
True detection rates were substantially higher for methods based on longer baseline periods
Gesteland et al. J Am Med Inform Assoc 2003
21
United States Feb 8–Mar 16, 2002
Early warning/outbreak detection Surveillance during a mass gathering/unique event
Description of the implementation of a surveillance system during the Olympic Winter Games that compared current counts to expected counts computed by the system from historic data and triggered when current exceeded 95% CI of predicted
No outbreaks detected
Griffin et al. BMC Public Health 2009
18
United States 2002–2006 Signify start/end of seasonal pathogen
Comparison of ED chief complaint to sentinel physician data (proportion of patients with ILI)
26 days earlier in 2002 and 20 days earlier in 2005; ambiguous in 2003 and 2006; same time in 2004
Guasticchi et al. Epidemiol Infect 2009
31
Italy 2004 System evaluation Evaluation of case definitions of 13 syndromes in a surveillance system based on an ED online database Comparison to subsequent hospitalization
PPV ranged from 20–99.3%. Sensitivity ranged from 22–90%

PIDAC: Syndromic Surveillance Discussion Paper | August 2012 30
Reference Country Study Period Use Intervention Outcome
Hafen et al. BMC Med Inform Decis Mak 2009
91
United States 2004–2008 Early warning/ outbreak detection
Comparison of a new simulation model method (STL) to 4 known methods for detection of ILI and gastroenteritis outbreaks
STL out performed all other methods by 10% STL required only 90 days of historical data
Heffernan et al. Emerg Infect Dis 2004
16
United States 2001–2002 Signify start/end of seasonal pathogen
Comparison of ED chief complaint to influenza laboratory isolates and sentinel physician reporting
Influenza season detected 2 weeks earlier than laboratory data and 3 weeks earlier than sentinel physicians
Hope et al. Commun Dis Intell 2010
39
Australia 2008 Early warning/outbreak detection Surveillance during a mass gathering/unique event Signify start/end of seasonal pathogen Assistance during novel threats/emergencies/ natural disasters
Comparison of ED chief complaint to notifiable diseases, FoodNet data and institutional outbreak data
38% of signals were investigated to the subgroup level with an internal investigation for 3% and an external investigation of 0.6% 14% of signals related to a syndrome of public health interest
Jossernan et al. PLoS One 2010
40
France Jun–Aug 2006 Surveillance during a mass gathering/unique event
Evaluation of a system for monitoring heat-related illness using ED data
For overall ED visits, sensitivity was highest for the elderly (0.38) Among the elderly, sensitivities for specific syndromes were malaise (0.85), dehydration (0.77) and hyponatremia (0.77)
Kirkwood et al. J Public Health Manag Pract 2007
42
United States 2003–2005 System evaluation Economic evaluation of a syndromic surveillance system based on ED chief complaint data
Total cost $422,899 US (development and implementation) and $196,302 US (yearly operating)

PIDAC: Syndromic Surveillance Discussion Paper | August 2012 31
Reference Country Study Period Use Intervention Outcome
Kwan-Gett et al. Disaster Med Public Health Prep 2009
92
United States 2009 Signify start/end of seasonal pathogen
Comparison of ED chief complaint (ILI) and influenza data from sentinel providers and laboratory results during H1N1 outbreak
Identification 2 weeks prior to sentinel and 3 weeks prior to laboratory testing
Lemay et al. Biosecur Bioterror 2008
93
Canada 1998–2003 Early warning/outbreak detection Signify start/end of season pathogen
Comparison of ED chief complaint to laboratory confirmation of influenza
Identification 3–4 weeks prior to laboratory confirmation, primarily in children ≤5 years
Lober et al. J Urban Health 2003
95
United States 1999–2002 Assistance during novel threats/emergencies/ natural disasters
Description of a surveillance system using patient visits to EDs and primary care clinics to identify bioterrorist attacks
No analysis
Lu et al. Int J Med Inform 2009
96
Taiwan 2004–2005 System evaluation Description of a system for extracting phrases from Chinese chief complaints and translating into English (MIM) and comparing to 2 other translation programs (Google translation and a bilingual dictionary)
Sensitivity ranged from 77%–97%, depending on syndrome Specificity of MIM (97%–99%) was similar to Google translation and the bilingual dictionary, with the exception of the GI syndrome, which had higher specificity in MIM (98%) than the bilingual dictionary (70%)
Marx et al. Am J Public Health 2006
85
United States Aug 16–18, 2003
Assistance during novel threats/emergencies/ natural disasters
Detection of risk factors for diarrheal illness during a power outage
No analysis

PIDAC: Syndromic Surveillance Discussion Paper | August 2012 32
Reference Country Study Period Use Intervention Outcome
May et al. West J Emerg Med 2010
19
United States 2005–2006 Signify start/end of seasonal pathogen
ED chief complaint and diagnosis data categorized into 3 syndromes (viral, upper respiratory infection, pneumonia) compared to sentinel physician consultation data for influenza
Only upper respiratory infection complaints flagged at the beginning of the influenza outbreak in winter 2006 With syndromes combined, the diagnosis data flagged earlier than sentinel physicians. Discharge diagnosis flagged at the same time as sentinel physicians 29% of presenting patients had a different discharge diagnosis than chief complaint
McLeod et al. Aust NZ J Public Health 2009
97
New Zealand 2005 Signify start/end of seasonal pathogen
Comparison of ED chief complaint data to school absenteeism
Alerted 9 days before school notification
Metzger et al. MMWR Morb Mortal Wkly Rep 2004
32
United States 2003 Situational awareness Comparison of ED visits for ILI and diarrheal illness to a telephone survey asking about ILI and diarrheal illness to estimate numbers of citywide illness represented by each ED visit
Every ED visit for ILI represented 60 community illnesses and every ED visit for diarrheal disease represented 251 community illnesses
Meurer et al. J Am Geriatr Soc 2009
98
United States 2007 Early warning/outbreak detection
Description of a search algorithm to scan the ED census for patients with 2+ systemic inflammatory response syndrome criteria and comparison to discharge diagnosis
Identification via the algorithm had a 1.63 relative risk of infection (95% CI 1.09–2.44). Sensitivity: 14% Specificity: 98%
Mikosz et al. MMWR Morb Mortal Wkly Rep 2004
34
United States Jan–Jun 2002 System evaluation Comparison of 2 free-text ED chief complaint coding systems for agreement
Kappa = 0.614 Agreement was best for the rash syndrome (0.711), followed by the respiratory syndrome (0.594), constitutional (0.419) and GI (0.270)

PIDAC: Syndromic Surveillance Discussion Paper | August 2012 33
Reference Country Study Period Use Intervention Outcome
Neill. Int J Health Geogr 2009
99
United States 2008-9 Early warning/outbreak detection
Comparison of 12 spatial scan methods for the detection of synthetic outbreaks
No analysis
New South Wales. Euro Surveill 2006
30
Australia 2009 Assistance during novel threats/emergencies/ natural disasters
Description of the H1N1 outbreak in New South Wales
No analysis
O’Connell et al. Emerg Infect Dis 2010
29
United States Mar–Dec 2008 Early warning/outbreak detection
Description of the implementation of new queries of Electronic Surveillance System for the Early Notification of Community Based Epidemics (ESSENCE), which categorized ED chief data into 11 syndromes and comparison to historical query system
Cluster of meningococcemia cases detected that would have been missed by existing queries
Ozonoff et al. MMWR Morb Mortal Wkly Rep 2004
100
United States 1996–2000 System evaluation Description of statistical tests using temporal and spatial data for the identification of clusters
Increased detection power
Schindeler et al. BMC Infect Dis 2009
26
Australia 2001–2006 Signify start/end of seasonal pathogen Early warning/outbreak detection
Comparison of ED visits to laboratory-confirmed RSV and influenza cases by week
All acute respiratory syndrome and all respiratory syndrome definitions of ED data peaked weeks before laboratory confirmation for influenza

PIDAC: Syndromic Surveillance Discussion Paper | August 2012 34
Reference Country Study Period Use Intervention Outcome
Shapiro. MMWR Morb Mortal Wkly Rep 2004
35
United States — System evaluation Description of automated approach to improving ED chief complaint free-text entry (correction of spelling and typographic errors, use of ICD-9 codes for mining)
Text normalization simultaneously reduced the number of false positives and false negatives in syndrome classification, compared with commonly used methods based on word stems. In approximately 25% of instances, using text normalization to detect lower respiratory syndrome would have improved the sensitivity of current word stem approaches by approximately 10%–20%
Shih et al. Infect Control Hosp Epidemiol 2007
23
Taiwan 2003 Assistance during novel threats/emergencies/ natural disasters
Survey of health care workers regarding the use of syndromic surveillance system during SARS
Atypical clinical presentation was identified as the most common surveillance problem
Silka et al. Am J Emerg Med 2003
101
United States 1997–2000 Signify start/end of seasonal pathogen Situational awareness
Comparison of patients presenting with ED chief complaint categorized as fever/infection versus respiratory
No analysis

PIDAC: Syndromic Surveillance Discussion Paper | August 2012 35
Reference Country Study Period Use Intervention Outcome
South et al. AMIA Annu Symp Proc 2008
102
United States Oct 2003–Mar 2004
System evaluation Determination of the best sources of ED data (chief complaint text, ED visit notes and triage notes) for ILI surveillance and comparison to the complete electronic medical record data
Sensitivity was highest (89%) when the text classifier was based on the full note corpus (all notes combined) and lowest (4%) when nurse triage notes were used PPVs were highest when the text classifier was applied to the chief complaint, ED and combined surveillance document sources. PPV based on all combined surveillance document sources (27%) was higher than for the full note corpus and had a sensitivity of 75% and high specificity 96%
Townes et al. J Public Health Manag Pract 2004
41
United States 2001 Situational awareness Comparison of ED data to chart review and hospital discharge diagnosis for surveillance of respiratory syndrome for bioterrorism
Sensitivity 68% (versus chart review) and 62% (versus hospital discharge diagnosis) Specificity 98% with chart review or hospital discharge diagnosis as the gold standard PPV 91% (versus chart review) and 59% (versus hospital discharge diagnosis)
Travers et al. Acad Emerg Med 2006
36
United States 2000–2001 System evaluation Description of the standardization of ED chief complaint data
After cleaning, 82% of chief complaints matched a Unified Medical Language System concept

PIDAC: Syndromic Surveillance Discussion Paper | August 2012 36
Reference Country Study Period Use Intervention Outcome
Travers et al. AMIA Annu Symp Proc 2006
44
United States Dec 1, 2005 System evaluation Comparison of the timeliness of ED diagnosis versus chief complaint for syndromic surveillance
After 12 hours, 60% of the visits and chief complaints had been transmitted, compared to almost no diagnoses. At 24 hours, 89% of the visits/chief complaints had been sent, and 12% of visits had at least one diagnosis code. By the end of 2 weeks, all chief complaints were available, compared to 64% of visits who had a diagnosis. After 12 weeks, 86% of visits had one or more diagnoses
Travers et al. AMIA Annu Symp Proc 2007
37
United States 2004–2005 System evaluation Description of the text processing of ED chief complaint data using a query processor and validation against clinical experts
Sensitivity: 23% Specificity: 97%
Turner et al. Commun Dis Intell 2006
25
Australia 2004 Supplement influenza surveillance
Reporting on ILI consultation rates and performing point of care influenza testing
53 patients met case definition for ILI; 76% tested and no positives for influenza
Van Dijk et al. Emerg Infect Dis 2009
27
Canada 2004–2006 Early warning/outbreak detection
Comparison of ED chief complaint data to Telehealth calls and NACRS for monitoring of respiratory disease trends
Correlation coefficient 0.91 (Telehealth) and 0.98 (NACRS)
Wallace et al. Am J Emerg Med 2009
103
United States Jan 19, 2005 Early warning/outbreak detection
Description of a field simulation to detect a cluster of febrile respiratory illness
No signal was detected
Wang et al. Emerg Med J 2006
104
Taiwan Mar–Jun 2003 Assistance during novel threats/emergencies/ natural disasters
Description of an ED scoring tool to properly screen and isolate patients during SARS
With a 1-point cut-off Sensitivity: 81.8% Specificity: 73.6% With a 3-point cut-off Sensitivity: 95.5% Specificity: 87.2%

PIDAC: Syndromic Surveillance Discussion Paper | August 2012 37
Reference Country Study Period Use Intervention Outcome
Yli-Hietanen et al. Int J Med Inform 2009
38
United States — System evaluation Description of a model to normalize free text from hospital ED chief complaint data
86% of the chief complaints were completely normalized, and 99% were correctly normalized without adding in approximate matching. When this matching was introduced, the percentage normalized increased to 89%, while the proportion correctly normalized decreased slightly, to 98%
Zheng et al. BMC Public Health 2007
17
Australia 2001–2005 Early warning/outbreak detection
Comparison of diagnosis of influenza in ED to laboratory influenza test results to detect changes in influenza activity
Alert 3 days earlier (5 year average) Annual range of 3–18 days

PIDAC: Syndromic Surveillance Discussion Paper | August 2012 38
Reference Country Study Period Use Intervention Outcome
Emergency Medical Services, 911 Calls and Emergency Preparedness
Baer. Disaster Med Public Health Prep 2011
105
United States Dec 15–24, 2006 Surveillance during a mass gathering/unique event
Comparison of emergency medical services assessment for carbon monoxide poisoning to ED chief complaint during a power outage
79% were exactly identified in the syndromic data, 8% were likely matches, 6% were possible matches and 8% could not be matched
Coory et al. J Public Health 2009
47
Australia 1997–2005 Early warning/outbreak detection Situational awareness
Comparison of ambulance dispatch data to community sentinel ILI rates
During influenza season, ambulance dispatch data demonstrated similar trends to sentinel ILI data sources
Greenko et al. J Urban Health 2003
49
United States Jan 19, 1999 Situational awareness Comparison of 911 dispatch codes to ED visit data for ILI
Sensitivity: 58% Specificity: 64%
Murray et al. Public Health Rep 2009
106
United States Sept 3–19, 2005 Early warning/outbreak detection Surveillance during a mass gathering/unique event
Description of a system for daily monitoring for GI and respiratory symptoms
No analysis
New South Wales. Euro Surveill 2006
30
Australia 2009 Assistance during novel threats/emergencies/ natural disasters
— No analysis
Williams et al. Epidemiol Infect 2009
48
Germany 2006 Surveillance during a mass gathering/unique event Situational awareness
Comparison of enhanced system during a mass event to the routine surveillance system
Median interval from date of onset to report being received at the national surveillance centre fell from 17 in 2005 to 12 in 2006. Detection of World Cup–related events was 44% (8/18) in the routine surveillance and 77% (14/18) in supplemental reports
Zielinski et al. Przegl Epidemiol 2009
107
— — Surveillance during a mass gathering/unique event
— No analysis

PIDAC: Syndromic Surveillance Discussion Paper | August 2012 39
Reference Country Study Period Use Intervention Outcome
Non–Emergency Department Health Records
Bellika et al. Int J Med Inform 2007
59
Norway — Situational awareness Simulation testing of the use of electronic GP visit data for syndromic surveillance
No analysis
Brabazon et al. Euro Surveill 2010
57
Ireland 2003–2009 Signify start/end of seasonal pathogen
Comparison of calls to one centre covering two GP services to national ILI rates
Peaks in influenza-related calls to out-of-hours service detected at least 1 week earlier in 5 of 6 influenza seasons
Burkom et al. Stat Med 2007
108
United States — System evaluation Comparison of 3 forecast methods using data from military clinic visit diagnoses and prescriptions and civilian office visits for respiratory and GI illness to standard alerting algorithms
Questionable practical use at time of study without reliable data classification methods.
Cadieux et al. BMC Public Health 2011
109
Canada 2005–2007 Situational awareness Assessment of the accuracy of syndrome definitions based on diagnostic codes from a representative sample of physician claims in community settings
Low sensitivity: 0.11 for fever to 0.44 for respiratory PPV: 0.59 for fever to 0.85 for respiratory
CDC. MMWR Morb Mortal Wkly Rep 2011
110
United States 2009 Early warning/outbreak detection
Comparison of the Electronic Surveillance System for the Early Notification of Community Based Epidemics (ESSENCE) to medical charts and laboratory results for ILI
Sensitivity: 71.4% for medical charts and 78.6% for laboratory-confirmed infections PPV: 31.8% for medical charts and 49.5% for laboratory-confirmed infections
Chan et al. J Biomed Inform 2011
55
Canada 1998–2003 Early warning/outbreak detection
Comparison of outpatient physician billing data for ILI to viral isolate data and hospital admission records
Alert 2 weeks earlier Increases in ILI visits by children provided the earliest signal of an epidemic

PIDAC: Syndromic Surveillance Discussion Paper | August 2012 40
Reference Country Study Period Use Intervention Outcome
Chen et al. Ann Acad Med Singapore 2006
111
Singapore 2002 Early warning/outbreak detection
Comparison of primary care consults for ILI in an army medical centre to real SARS laboratory data
Sensitivity exceeded 90% to detect outbreak sizes of 20 or more cases (provided 80% of cases report their illness to primary care). A sensitivity of 100% was only achieved for outbreak sizes of 30 or more
Deepa. Natl Med J India 2008
112
India May–Jun 2005 System evaluation Description of a weekly reporting system for health events and syndromes involving women’s self-help groups and local community groups Comparison of reporting completeness to existing disease surveillance systems
Completeness of reporting was better achieved by women’s self-help groups (91.6%) than members of Panchayati raj institutions (66.6%) Data capture was more complete compared to the existing disease surveillance system
Flamand et al. Euro Surveill 2008
50
France 2005–2006 Early warning/outbreak detection Signify start/end of seasonal pathogen
Comparison of GP house calls to national sentinel surveillance network
Correlation coefficient: 0.92
Freedman et al. N Engl J Med 2010
113
Worldwide 1996–2004 Geo-sentinel surveillance
Description of the occurrence of specific diagnoses among ill returning travellers visiting travel/tropical medicine clinics
No analysis
Hall et al. Epidemiol Infect 2010
114
Australia, Canada, United States
2000–2002 System evaluation Description of a telephone survey that used a case definition of gastroenteritis that excluded cases with concurrent respiratory symptoms
Excluding GI cases with respiratory symptoms decreased the incidence of GI disease by 10–50%
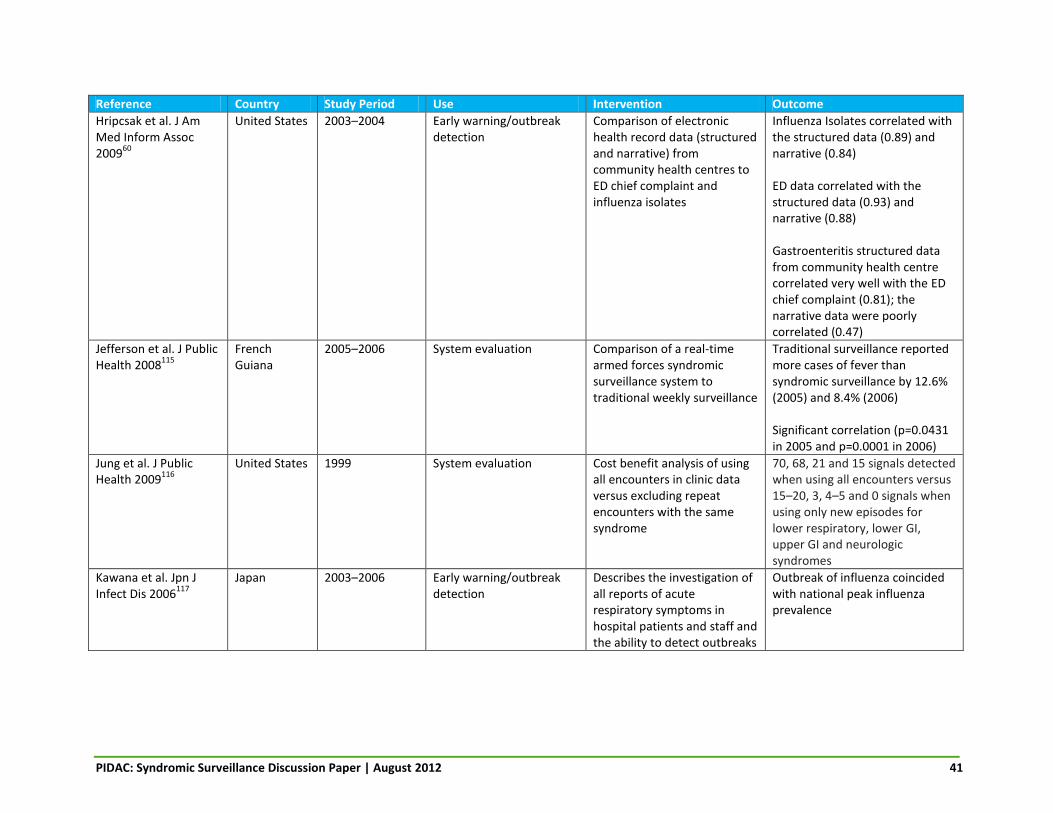
PIDAC: Syndromic Surveillance Discussion Paper | August 2012 41
Reference Country Study Period Use Intervention Outcome
Hripcsak et al. J Am Med Inform Assoc 2009
60
United States 2003–2004 Early warning/outbreak detection
Comparison of electronic health record data (structured and narrative) from community health centres to ED chief complaint and influenza isolates
Influenza Isolates correlated with the structured data (0.89) and narrative (0.84) ED data correlated with the structured data (0.93) and narrative (0.88) Gastroenteritis structured data from community health centre correlated very well with the ED chief complaint (0.81); the narrative data were poorly correlated (0.47)
Jefferson et al. J Public Health 2008
115
French Guiana
2005–2006 System evaluation Comparison of a real-time armed forces syndromic surveillance system to traditional weekly surveillance
Traditional surveillance reported more cases of fever than syndromic surveillance by 12.6% (2005) and 8.4% (2006) Significant correlation (p=0.0431 in 2005 and p=0.0001 in 2006)
Jung et al. J Public Health 2009
116
United States 1999 System evaluation Cost benefit analysis of using all encounters in clinic data versus excluding repeat encounters with the same syndrome
70, 68, 21 and 15 signals detected when using all encounters versus 15–20, 3, 4–5 and 0 signals when using only new episodes for lower respiratory, lower GI, upper GI and neurologic syndromes
Kawana et al. Jpn J Infect Dis 2006
117
Japan 2003–2006 Early warning/outbreak detection
Describes the investigation of all reports of acute respiratory symptoms in hospital patients and staff and the ability to detect outbreaks
Outbreak of influenza coincided with national peak influenza prevalence

PIDAC: Syndromic Surveillance Discussion Paper | August 2012 42
Reference Country Study Period Use Intervention Outcome
Lober et al. J Urban Health 2003
95
United States — Assistance during novel threats/emergencies/ natural disasters
Description of a surveillance system to detect bioterrorism attacks and disease outbreaks through automatic data collection of discharge diagnosis and data mining of records of EDs, urgent care departments and primary care clinics
No analysis
Meynard. Med Inform Decis Mak 2008
54
Guiana 2006 Early warning/outbreak detection
Comparison of military nurse and GP syndromic surveillance to civilian clinical and laboratory surveillance
Detected dengue outbreak 3–4 weeks earlier
Najmi et al. BMC Med Inform Decis Mak 2009
118
United States — — — No analysis
New South Wales. Euro Surveill 2006
30
Australia 2009 Assistance during novel threats/emergencies/ natural disasters
— No analysis
Nordin et al. J Infect Dis 2004
119
United States 1994–1998 Situational awareness Description of surveillance system based on database searches at a managed care organization for cases of measles-like illness and comparison to traditional public health surveillance
PPV (ICD-9): 0.3% PPV (combined ICD-9 and text string search): 13.5% Measles incidence (medical records): 0.5 cases/100,000 Measles incidence (public health surveillance data): 0.61/100,000
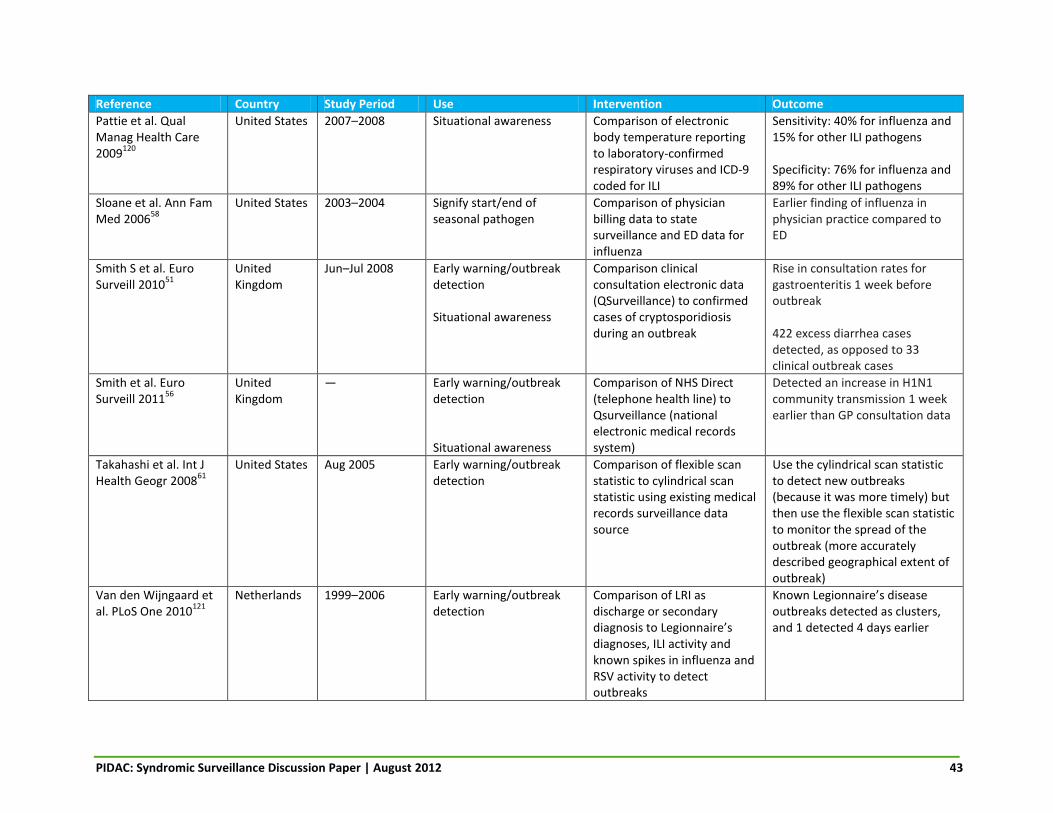
PIDAC: Syndromic Surveillance Discussion Paper | August 2012 43
Reference Country Study Period Use Intervention Outcome
Pattie et al. Qual Manag Health Care 2009
120
United States 2007–2008 Situational awareness Comparison of electronic body temperature reporting to laboratory-confirmed respiratory viruses and ICD-9 coded for ILI
Sensitivity: 40% for influenza and 15% for other ILI pathogens Specificity: 76% for influenza and 89% for other ILI pathogens
Sloane et al. Ann Fam Med 2006
58
United States 2003–2004 Signify start/end of seasonal pathogen
Comparison of physician billing data to state surveillance and ED data for influenza
Earlier finding of influenza in physician practice compared to ED
Smith S et al. Euro Surveill 2010
51
United Kingdom
Jun–Jul 2008 Early warning/outbreak detection Situational awareness
Comparison clinical consultation electronic data (QSurveillance) to confirmed cases of cryptosporidiosis during an outbreak
Rise in consultation rates for gastroenteritis 1 week before outbreak 422 excess diarrhea cases detected, as opposed to 33 clinical outbreak cases
Smith et al. Euro Surveill 2011
56
United Kingdom
— Early warning/outbreak detection Situational awareness
Comparison of NHS Direct (telephone health line) to Qsurveillance (national electronic medical records system)
Detected an increase in H1N1 community transmission 1 week earlier than GP consultation data
Takahashi et al. Int J Health Geogr 2008
61
United States Aug 2005 Early warning/outbreak detection
Comparison of flexible scan statistic to cylindrical scan statistic using existing medical records surveillance data source
Use the cylindrical scan statistic to detect new outbreaks (because it was more timely) but then use the flexible scan statistic to monitor the spread of the outbreak (more accurately described geographical extent of outbreak)
Van den Wijngaard et al. PLoS One 2010
121
Netherlands 1999–2006 Early warning/outbreak detection
Comparison of LRI as discharge or secondary diagnosis to Legionnaire’s diagnoses, ILI activity and known spikes in influenza and RSV activity to detect outbreaks
Known Legionnaire’s disease outbreaks detected as clusters, and 1 detected 4 days earlier

PIDAC: Syndromic Surveillance Discussion Paper | August 2012 44
Reference Country Study Period Use Intervention Outcome
Van den Wijngaard et al. Epidemiol Infect 2011
52
Netherlands 2007–2009 Early warning/outbreak detection
Comparison of hospitalization data for syndromes indicative of Q fever to voluntarily reported Q fever–related abortion data and outbreaks on human Q fever illness
Timing of cluster detection using hospitalization data corresponded to timing of known outbreak; was 6 weeks earlier than positive isolation of etiologic agent; and was 3 months to 2 years before known outbreak was detected
Van den Wijngaard et al. Euro Surveill 2011
7
Netherlands 2002–2003 Early warning/outbreak detection Monitoring disease burden
Syndromic surveillance data compared to laboratory confirmed respiratory pathogens
Winter peaks concurrent with peaks in influenza virus, RSV and other respiratory pathogens; 68% of variations explained by respiratory pathogens Alert 2 weeks ahead of RSV, 4–5 weeks ahead of influenza
Yih et al. MMWR Morb Mortal Wkly Rep 2005
62
United States 2001–2002 Early warning/outbreak detection
Comparison ambulatory care data to department of health data for detecting of GI outbreaks
No previously known outbreaks of GI illness were detected
Yih et al. Public Health Rep 2010
63
United States 2007–2008 Early warning/outbreak detection
Comparison of electronic medical records as a syndromic surveillance source to traditional public health surveillance systems
Outbreaks detected by traditional surveillance were not detected by electronic medical records Electronic medical records did detect 2 clusters of varicella

PIDAC: Syndromic Surveillance Discussion Paper | August 2012 45
Reference Country Study Period Use Intervention Outcome
Online Resources
Carlson et al. Commun Dis Intell 2009
122
Australia 2007 Early warning/outbreak detection Monitoring disease burden
Comparison of Flutracking (Internet-based community ILI syndromic surveillance system) to laboratory-confirmed influenza
Correlation coefficient: 0.44 to 0.65 for unvaccinated respondents
Carneiro et al. Commun Infect Dis 2009
64
United States — Early warning/outbreak detection
Comparison of Google Flu Trends to unspecified CDC surveillance data
Detected regional outbreaks of influenza 7–10 days earlier
Dalton et al. Commun Dis Intell 2006
65
Australia 2006–2008 Situational awareness Early warning/outbreak detection
Comparison of Internet self-reported illness (Flutracking) to other traditional syndromic and laboratory-based surveillance systems for influenza
Peak on influenza activity in 2008 coincided
Eysenbach. AMIA Annu Symp Proc 2006
67
Canada 2004–2005 Early warning/outbreak detection
Comparison of keyword triggered link in Google Adsense to PHAC Fluwatch numbers of ILI
Predicted flu events by approximately 1 week Correlation coefficient: 0.91 If a threshold of 150 clicks per week were used as a trigger, all 11 weeks with ≥524 flu cases could be predicted with 100% sensitivity and specificity
Goel et al. Proc Natl Acad Sci USA 2010
123
United States — Situational awareness — No analysis
Hulth et al. PloS One 2009
68
Sweden 2005–2007 Signify start/end of seasonal pathogen
Comparison of queries to a medical web site on ILI versus laboratory-diagnosed influenza and ILI sentinel system
R2: 0.89 (sentinel data)
R2: 0.90 (laboratory data)

PIDAC: Syndromic Surveillance Discussion Paper | August 2012 46
Reference Country Study Period Use Intervention Outcome
Jaeger et al. J Am Coll Health 2011
10
Canada 2009 Early warning/outbreak detection
Brock University GotFlu channel (student online self-reporting) versus local primary and secondary school daily absenteeism
Outbreak detected >1 week earlier
Pattie et al. Qual Manag Health Care 2009
120
United States 2007–2008 Situational awareness Comparison of electronic body temperature reporting to laboratory-confirmed respiratory viruses and ICD-9 coded for ILI
Sensitivity: 40% for influenza and 15% for other ILI pathogens Specificity: 76% for influenza and 89% for other ILI pathogens
Sugiura et al. Epidemiol Infect 2010
66
Japan July 2008 Early warning/outbreak detection Surveillance during a mass gathering/unique event
Comparison of a Web-based daily health questionnaire to existing outpatient syndromic surveillance sources
Sensitivity/specificity respectively for the verification experiment in Izumo (non-G8 data) were as follows: fever (0.43, 0.88), coughing (0.16, 0.80), diarrhea (0.68, 0.77), vomiting (0.55, 0.80), rashes (0.00, 0.89), convulsions (0.00, 0.92) During G8, when examining all symptoms, 13 alerts were reported by the Web-based system. A comparison with the sentinel surveillance system revealed that 12 were false-positive alerts
Valdivia et al. Euro Surveill 2010
69
Europe 2009–2010 Situational awareness Comparison of Google Flu Trends to sentinel physician network data
Correlation: 0.72 to 0.94
Wethington et al. Environ Health 2006
124
United States 2002–2004 Early warning/outbreak detection
Comparison of RUSick2 (an Internet forum for individuals with sudden onset of diarrhea or vomiting to compare information on what they had eaten prior to becoming ill) to telephone reports made to public health department
No analysis
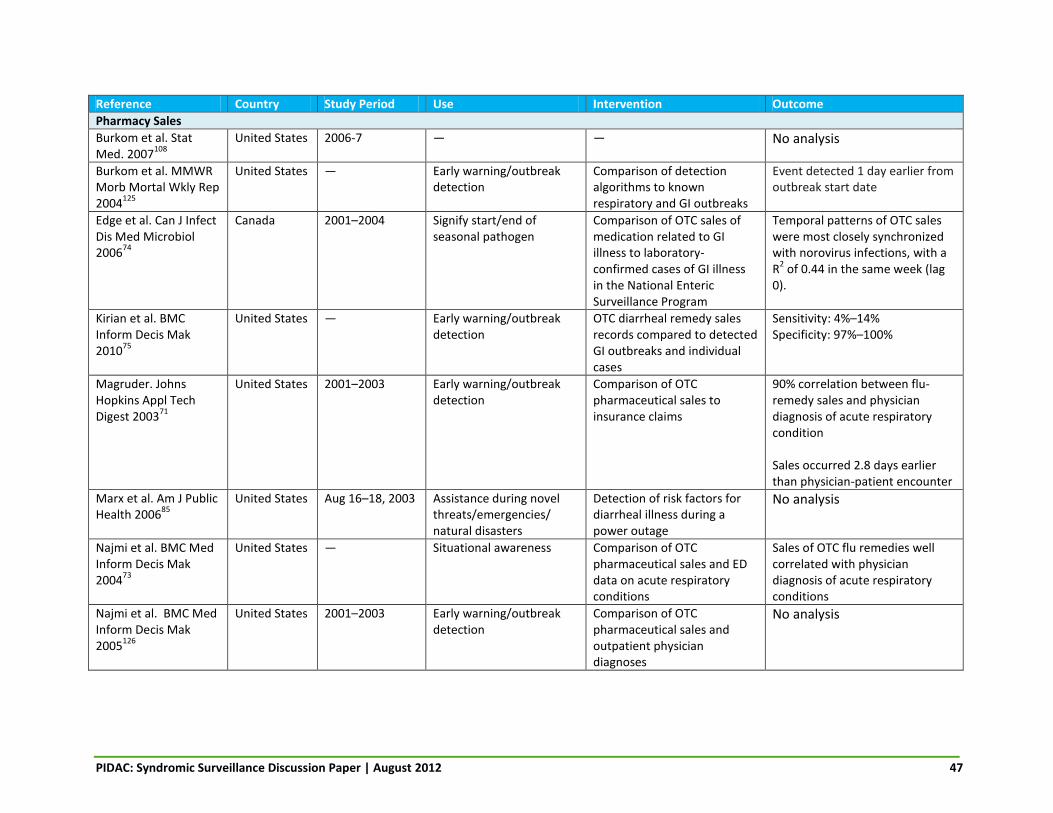
PIDAC: Syndromic Surveillance Discussion Paper | August 2012 47
Reference Country Study Period Use Intervention Outcome
Pharmacy Sales
Burkom et al. Stat Med. 2007
108
United States 2006-7 — — No analysis
Burkom et al. MMWR Morb Mortal Wkly Rep 2004
125
United States — Early warning/outbreak detection
Comparison of detection algorithms to known respiratory and GI outbreaks
Event detected 1 day earlier from outbreak start date
Edge et al. Can J Infect Dis Med Microbiol 2006
74
Canada 2001–2004 Signify start/end of seasonal pathogen
Comparison of OTC sales of medication related to GI illness to laboratory-confirmed cases of GI illness in the National Enteric Surveillance Program
Temporal patterns of OTC sales were most closely synchronized with norovirus infections, with a R
2 of 0.44 in the same week (lag
0).
Kirian et al. BMC Inform Decis Mak 2010
75
United States — Early warning/outbreak detection
OTC diarrheal remedy sales records compared to detected GI outbreaks and individual cases
Sensitivity: 4%–14% Specificity: 97%–100%
Magruder. Johns Hopkins Appl Tech Digest 2003
71
United States 2001–2003 Early warning/outbreak detection
Comparison of OTC pharmaceutical sales to insurance claims
90% correlation between flu-remedy sales and physician diagnosis of acute respiratory condition Sales occurred 2.8 days earlier than physician-patient encounter
Marx et al. Am J Public Health 2006
85
United States Aug 16–18, 2003 Assistance during novel threats/emergencies/ natural disasters
Detection of risk factors for diarrheal illness during a power outage
No analysis
Najmi et al. BMC Med Inform Decis Mak 2004
73
United States — Situational awareness Comparison of OTC pharmaceutical sales and ED data on acute respiratory conditions
Sales of OTC flu remedies well correlated with physician diagnosis of acute respiratory conditions
Najmi et al. BMC Med Inform Decis Mak 2005
126
United States 2001–2003 Early warning/outbreak detection
Comparison of OTC pharmaceutical sales and outpatient physician diagnoses
No analysis

PIDAC: Syndromic Surveillance Discussion Paper | August 2012 48
Reference Country Study Period Use Intervention Outcome
Najmi et al. BMC Med Inform Decis Mak 2009
118
United States — — — No analysis
Neill. Int J Health Geogr 2009
99
— — Early warning/outbreak detection
— No analysis
Sokolow et al. MMWR Morb Mortal Wkly Rep 2005
127
United States Jun–Nov 2004 Early warning/outbreak detection
Use of CDC’s Biointelligence Center in monitoring syndromic surveillance data and detecting anomalies
No analysis
Van den Wijngaard et al. Emerg Infectious Dis 2008
8
Netherlands 2002–2003 Early warning/outbreak detection Signify start/end of seasonal pathogen
Syndromic surveillance data compared to laboratory-confirmed respiratory pathogens
Strong correlation between respiratory syndromic data sources and seasonal increases in several respiratory pathogen peaks
Van den Wijngaard et al. Euro Surveill 2011
7
Netherlands 2002–2003 Early warning/outbreak detection Monitoring disease burden
Syndromic surveillance data compared to laboratory-confirmed respiratory pathogens
Winter peaks concurrent with peaks in influenza virus, RSV and other respiratory pathogens; 68% of variations explained by respiratory pathogens Alert 2 weeks ahead of RSV, 4–5 weeks ahead of influenza
Vergu et al. Emerg Infect Dis 2006
72
France 2000–2004 Signify start/end of seasonal pathogen
Comparing medical sales to ILI incidence reported by sentinel network of GPs
Correlation between ILI incidence and the forecast was 0.85-0.96
Way et al. Commun Dis Intell 2010
128
Australia July 15–Aug 28 2009
Assistance during novel threats/emergencies/ natural disasters
Assess spread and burden of ILIs through antiviral distribution data
No analysis

PIDAC: Syndromic Surveillance Discussion Paper | August 2012 49
Reference Country Study Period Use Intervention Outcome
Sentinel Community Health Care Providers
Burkom et al. MMWR Morb Mortal Wkly Rep 2004
125
United States — Early warning/outbreak detection
Comparison of detection algorithms to known respiratory and GI outbreaks
Event detected 1 day earlier from outbreak start date
Clothier et al. Commun Dis Intell 2005
77
Australia 2002–2004 System evaluation Evaluation of Australian Sentinel Practice Research Network for ILI surveillance and comparison to ILI data from other influenza surveillance systems
No analysis
Coory et al. Euro Surveill 2009
78
Australia 1999–2008 Situational awareness Comparison of an out-of-hours service for GP consultation in the home to ILI data from sentinel physicians
Close agreement between the systems during higher-than-expected seasonal activity (ROC AUC 0.91, 95% CI 0.83–0.98)
Flahault et al. Stat Methods Med Res 2006
129
France — Situational awareness Description of weekly data reported on 12 conditions, including acute diarrhea and ILI
No analysis
Gault et al. J Public Health 2009
130
France — Signifying the start/end of a seasonal pathogen
Comparison of the ability to identify ILI outbreaks by SOS Medecins (a network of GPs responding to private house calls 24/7) versus sentinel network (1200 physicians)
Epidemic periods identified 2.5 weeks earlier Sensitivity and specificity of 93% at a threshold of 230 weekly visits Correlation coefficient: 0.87
New South Wales. Euro Surveill 2006
30
Australia 2009 Assistance during novel threats/emergencies/ natural disasters
— No analysis
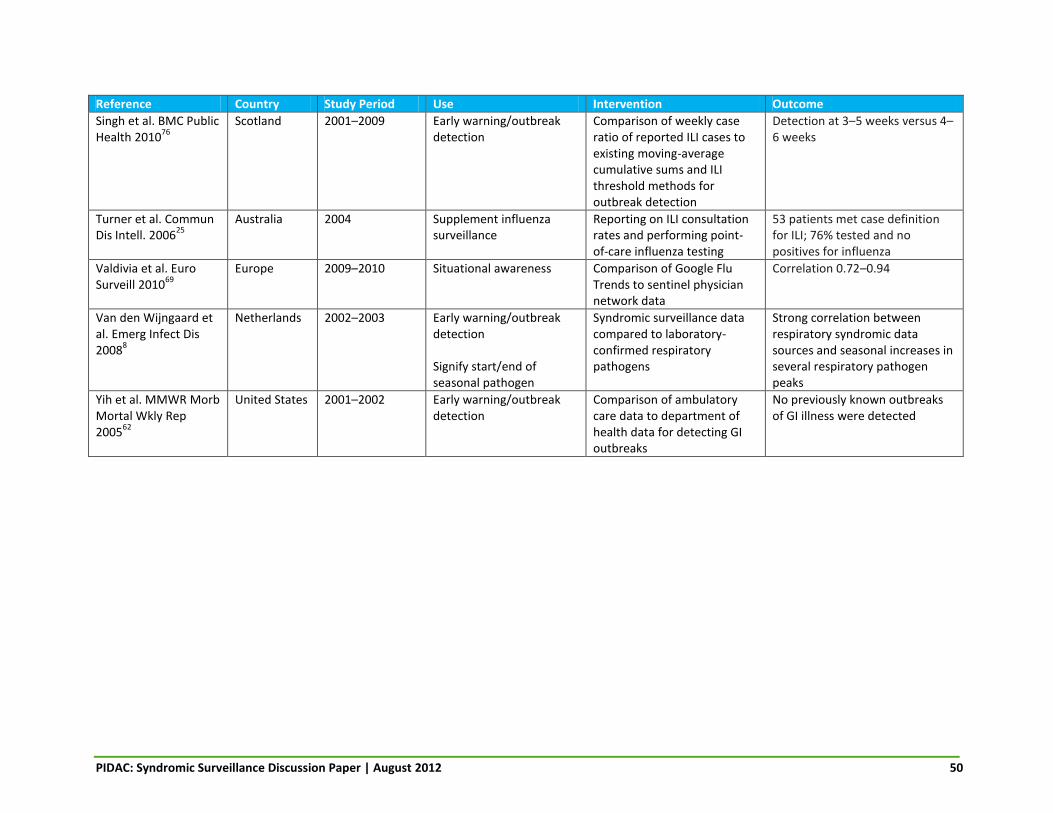
PIDAC: Syndromic Surveillance Discussion Paper | August 2012 50
Reference Country Study Period Use Intervention Outcome
Singh et al. BMC Public Health 2010
76
Scotland 2001–2009 Early warning/outbreak detection
Comparison of weekly case ratio of reported ILI cases to existing moving-average cumulative sums and ILI threshold methods for outbreak detection
Detection at 3–5 weeks versus 4–6 weeks
Turner et al. Commun Dis Intell. 2006
25
Australia 2004 Supplement influenza surveillance
Reporting on ILI consultation rates and performing point-of-care influenza testing
53 patients met case definition for ILI; 76% tested and no positives for influenza
Valdivia et al. Euro Surveill 2010
69
Europe 2009–2010 Situational awareness Comparison of Google Flu Trends to sentinel physician network data
Correlation 0.72–0.94
Van den Wijngaard et al. Emerg Infect Dis 2008
8
Netherlands 2002–2003 Early warning/outbreak detection Signify start/end of seasonal pathogen
Syndromic surveillance data compared to laboratory-confirmed respiratory pathogens
Strong correlation between respiratory syndromic data sources and seasonal increases in several respiratory pathogen peaks
Yih et al. MMWR Morb Mortal Wkly Rep 2005
62
United States 2001–2002 Early warning/outbreak detection
Comparison of ambulatory care data to department of health data for detecting GI outbreaks
No previously known outbreaks of GI illness were detected

PIDAC: Syndromic Surveillance Discussion Paper | August 2012 51
Reference Country Study Period Use Intervention Outcome
Telephone Help Lines
Brabazon et al. Euro Surveill 2010
57
Ireland 2003–2009 Signify start/end of seasonal pathogen
Comparison of calls to one centre covering two GP services to national ILI rates
Peaks in influenza-related calls to out-of-hours service detected at least 1 week earlier in 5 of 6 influenza seasons
Caudle et al. Can J Public Health 2009
80
Canada 2004–2006 Early warning/outbreak detection
Comparison of calls to Telehealth to NACRS ED discharge data for GI illness
r=0.90
Cooper et al. BMC Med 2008
79
England 2005–2006 Early warning/outbreak detection Situational awareness
Comparison of calls to the NHS Direct telehealth database to laboratory and clinical data
Alert up to 2 weeks prior to ILI consultation rates Correlation between fever calls and increases to a national influenza B outbreak. No apparent spatial correlation between vomiting calls and norovirus activity
Cooper et al. Epidemiol Infect 2006
131
England 1997 Early warning/outbreak detection
Comparison of diarrheal calls to NHS Direct health helpline to laboratory-confirmed outbreak of cryptosporidiosis
Outbreak not detected
Cooper et al. Epidemiol Infect 2008
132
England 2004–2005 Early warning/outbreak detection
Comparison of respiratory virus self-sampling among callers with cold and flu symptoms to NHS Direct to existing syndromic surveillance
Positivity rate of NHS Direct samples (16%) lower than established virological surveillance scheme (26%) Peak positivity coincided
Cooper et al. J Infect 2007
82
England 2002–2004 Situational awareness Comparison of calls to NHS Direct to laboratory-confirmed respiratory viruses/bacteria
Respiratory viruses responsible for 50% of seasonal variation in NHS Direct respiratory calls
Cooper et al. J Public Health 2007
133
England 2002–2007 Early warning/outbreak detection
Comparison of calls to NHS Direct to community sentinel ILI reports and laboratory data
2 weeks’ advance warning of seasonal influenza activity during 3 of 4 winters (retrospective) and 6 days during prospective evaluation (2006–2007)

PIDAC: Syndromic Surveillance Discussion Paper | August 2012 52
Reference Country Study Period Use Intervention Outcome
Coory et al. Euro Surveill 2009
78
Australia 1999–2008 Situational awareness Comparison of an out-of-hours service for GP consultation in the home to ILI data from sentinel physicians
Close agreement between the systems during higher-than-expected seasonal activity (ROC AUC 0.91, 95% CI 0.83–0.98)
Derby et al. MMWR Morb Mortal Wkly Rep 2005
134
United States Jan 1–Mar 31, 2000
Early warning/outbreak detection
Comparison of calls to poison control for foodborne illness to laboratory-confirmed cases
1 of 77 laboratory-confirmed cases were a potential match for poison control data 50 of 58 calls that were consistent with the syndrome definition were coded as unintentional food poisoning by poison control centre staff (sensitivity: 86%) 248 of 249 calls that were not consistent with the syndrome definition were also not coded as unintentional food poisoning (specificity: 99.6%)
Elliot et al. Euro Surveill 2010
135
United Kingdom
2010 Assistance during novel threats/emergencies/ natural disasters
Description of the use of telephone health advice call data during the Icelandic volcanic ash plume
No analysis
Fan. Can J Public Health 2010
14
Canada 2009 Early warning/outbreak detection Situational awareness
Comparison of Alberta Real Time Syndromic Surveillance Net, including calls to Health Link Alberta, to traditional paper-based surveillance methods
No analysis
Rolland et al. BMC Health Serv Res 2006
81
Canada — Early warning/outbreak detection Situational awareness
Comparison of Ontario’s Telehealth to traditional surveillance systems
No analysis

PIDAC: Syndromic Surveillance Discussion Paper | August 2012 53
Reference Country Study Period Use Intervention Outcome
Smith et al. Euro Surveill 2006
83
United Kingdom
— Early warning/outbreak detection Surveillance during a mass gathering/unique event
Comparison of calls to a telephone hotline (NHS Direct) to clinical and laboratory indicators for influenza
Early indication of national increase in fever calls in school-aged children
Smith et al. Euro Surveill 2010
51
United Kingdom
Jun–Jul 2008 Early warning/outbreak detection Situational awareness
Comparison clinical consultation electronic data (QSurveillance) to confirmed cases of cryptosporidiosis during an outbreak
Rise in consultation rates for gastroenteritis 1 week before outbreak 422 excess diarrheal cases detected as opposed to 33 clinical outbreak cases
Smith et al. Euro Surveill 2011
56
United Kingdom
— Early warning/outbreak detection Situational awareness
Comparison of NHS Direct (telephone health line) to Qsurveillance (national electronic medical records system)
Detected an increase in H1N1 community transmission 1 week earlier than GP consultation data
Yih et al. MMWR Morb Mortal Wkly Rep 2005
62
United States 2001–2002 Early warning/outbreak detection
Comparison ambulatory care data to department of health data for detecting of GI outbreaks
No previously known outbreaks of GI illness were detected
AUC, area under the curve; CDC, Centers for Disease Control; CI, confidence interval; ED, emergency department; EMS, emergency medical service; GI, gastrointestinal; GP, general practitioner; ICD-9, International Classification of Diseases, 9th edition; ILI, influenza-like illness; LRI, lower respiratory tract infection; NACRS, National Ambulatory Care Reporting System; NHS, National Health Service; OTC, over-the-counter; PHAC, Public Health Agency of Canada; PPV, positive predictive value; ROC, receiver operating characteristic; RSV, respiratory syncytial virus; SARS, severe acute respiratory syndrome; SD, standard deviation.

PIDAC: Syndromic Surveillance Discussion Paper | August 2012 53
TABLE 2: QUALITATIVE ASSESSMENT (USING THE CDC FRAMEWORK136) OF SYNDROMIC SURVEILLANCE DATA CHARACTERISTICS INDENTIFIED IN THE SELECTED LITERATURE
Data Source
Surveillance Characteristic
Acc
ep
tab
ility
Sim
plic
ity
Fle
xib
ility
Dat
a Q
ual
ity
Po
siti
ve P
red
icti
ve
Val
ue
Sen
siti
vity
Re
pre
sen
tati
ven
ess
Tim
elin
ess
Stab
ility
Absenteeism: Employee
U Y U N U Y N Y U
Absenteeism: School
Y S (if auto-mated)
U N Y Y N Y S (not
opera-tional on
week-ends,
holidays) Emergency Department Chief Complaint
Y Y Y S (need for standard
case defini-tions)
S (best if
combined with
laboratory data)
S (varies by
syndrome)
S (possible under-
reporting)
Y S
Emergency Medical Services, 911 Calls and Emergency Preparedness
S S S S N N N Y S
Non–Emergency Department Health Records
S (need for systems capital-izing on existing
data)
N (lack of
EMR standard
s)
Y
S
Y (for ILI only)
Y (for ILI;
unknown for other
syndromes)
U
Y (time to
response or action not described)
U
Online Resources
Y S (low
opera-tional costs)
S Y Y Y S (limited to those with
access)
Y S
Pharmacy Sales
S (electronic collection
and transfer of
data; implied
agreement to share
data)
Y S (possible inclusion of addi-tional data
fields)
N N S S (voluntary enrolment)
U U
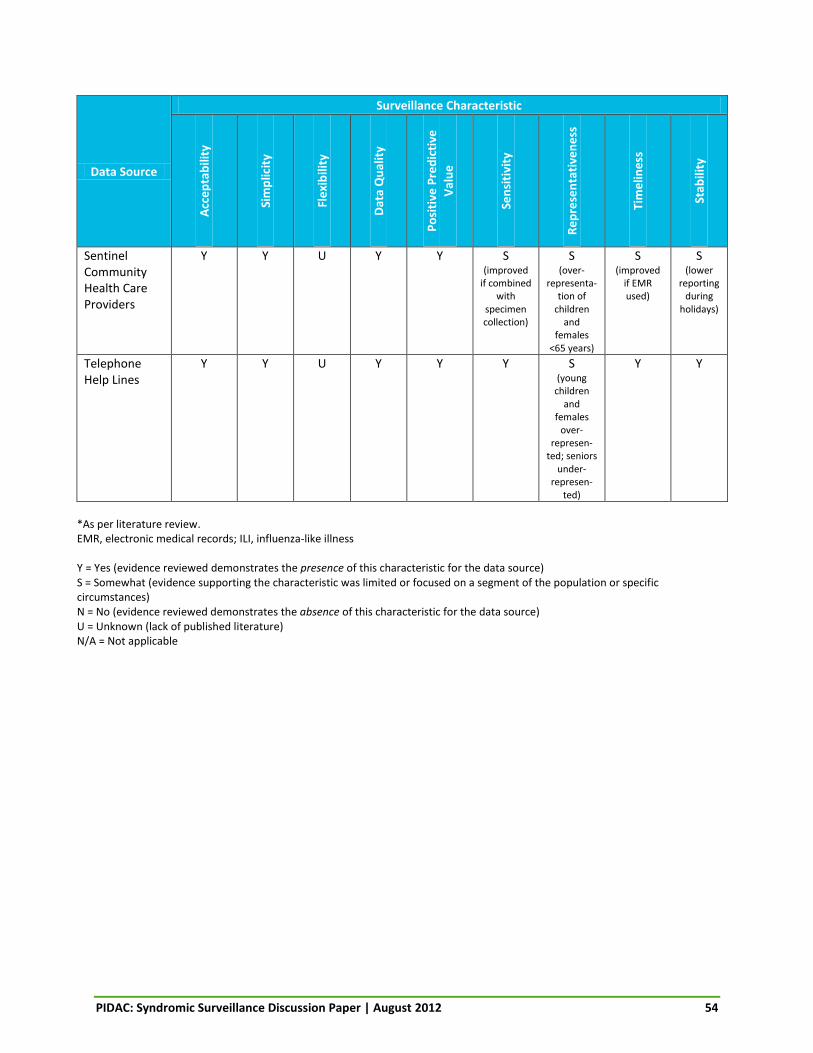
PIDAC: Syndromic Surveillance Discussion Paper | August 2012 54
Data Source
Surveillance Characteristic
Acc
ep
tab
ility
Sim
plic
ity
Fle
xib
ility
Dat
a Q
ual
ity
Po
siti
ve P
red
icti
ve
Val
ue
Sen
siti
vity
Re
pre
sen
tati
ven
ess
Tim
elin
ess
Stab
ility
Sentinel Community Health Care Providers
Y Y U Y Y S (improved
if combined with
specimen collection)
S (over-
representa-tion of
children and
females <65 years)
S (improved
if EMR used)
S (lower
reporting during
holidays)
Telephone Help Lines
Y Y U Y Y Y S (young
children and
females over-
represen-ted; seniors
under-represen-
ted)
Y Y
*As per literature review. EMR, electronic medical records; ILI, influenza-like illness Y = Yes (evidence reviewed demonstrates the presence of this characteristic for the data source) S = Somewhat (evidence supporting the characteristic was limited or focused on a segment of the population or specific circumstances) N = No (evidence reviewed demonstrates the absence of this characteristic for the data source) U = Unknown (lack of published literature) N/A = Not applicable

PIDAC: Syndromic Surveillance Discussion Paper | August 2012 55
TABLE 3: RECOMMENDATIONS FOR SYNDROMIC SURVEILLANCE IN ONTARIO
Syndromic Surveillance Data Source
Number of Articles Included in the Review*
Currently in Use in Ontario (Yes/No)
Recommendation*
Absenteeism: Employee 2 Yes
(very limited local) Not recommended at this time
Absenteeism: School 5 Yes
(local) Implement
Emergency Department Chief Complaint
53 Yes
(provincial) Continue with modification
Emergency Medical Services, 911 Calls and Emergency Preparedness
7 No Not recommended at this time
Non–Emergency Department Health Records
30 No Investigate further
Online Resources 11 No Investigate further
Pharmacy Sales 15 No Not recommended at this time
Sentinel Community Health Care Providers
11 Yes
(provincial) Continue with modification
Telephone Help Lines 16 Yes
(provincial) Continue with modification
*20 publications described more than one data source, therefore, the number of articles totals to 150, not 125.
PIDAC: Syndromic Surveillance Discussion Paper | August 2012 56
Appendix 1: Quality Assessment Tool for Syndromic Surveillance Publications INTRODUCTION & BACKGROUND
The purpose of this tool is to assess the methodological quality of scholarly articles/publications reporting on some aspect of syndromic surveillance as identified by a keyword search of appropriate databases. The tool is applied as the second step in an assessment process to articles, which were determined in an initial screening step to be “relevant to the control of infectious diseases in Ontario.” Relevance was based on consideration of three perspectives:
Scientific Contextual Generalizable
The abstracts or summaries of all articles identified by initial and expanded search criteria were considered jointly by members of the Provincial Infectious Diseases Advisory Committee on Surveillance (PIDAC-S) at its meetings. A determination by any one member of the PIDAC-S that a publication was relevant from any one of these perspectives was the criteria for subjecting it to fuller methodological assessment using this quality assessment tool.
USE OF THE TOOL
Each of two raters drawn from the PIDAC-S membership will independently assess the quality of each study/publication and complete this tool. When each rater is finished, the individual ratings will be compared. While it is not necessary for reviewers to achieve a consensus on each item, the overall difference between the two rater’s Global Total Score must not be greater than 5 points. The final score allocated to the study/publication will be the sum of the two reviewers’ scores. In cases where the difference in Global Total Score between the two reviewers is greater than 5 points, a third PIDAC-S member will be asked to assess the study, and the final two scores that are closest will be summed to determine the final score. NOTE: Final selection of a minimum Global Total Score threshold will include consideration of the distribution of scores (i.e. inspect for natural cut points), consensus of what are “reasonable” articles and workload, and whether one or more reviewers gave the paper a Global Rating of “A” (very valuable) despite a low score.
INSTRUCTIONS FOR COMPLETION
Circle the appropriate response in each component section (A–F) and complete the Global Rating. Calculate the total summary score from each component sections and record it in the corresponding box. Calculate the Global Total Score by summing each component score. After each individual rater has completed the form, both reviewers must compare their ratings to determine whether a third review is required.

PIDAC: Syndromic Surveillance Discussion Paper | August 2012 57
QUALITY ASSESSMENT TOOL FOR SYNDROMIC SURVEILLANCE
Component Ratings A) Representativeness
Are the surveillance systems, data, setting, or populations in the study likely to represent those found in Ontario? (Circle the appropriate score.)
B) Study design
Indicate the study design
Review article/meta-analysis score 10
Randomized, controlled trial score 10
Prospective validation study score 9
Mixed (prospective/retrospective) validation study score 9
Retrospective validation study score 8
Prospective descriptive study score 8
Retrospective descriptive study score 7
Case control study score 6
Relevant survey score 6
Ecological/cross-sectional study score 5
Simulation/mathematical modelling score 4
Expert group opinion score 3
Demonstration project/case study score 1
Single expert opinion score 0
STUDY DESIGN total score = _______
C) Publication/peer review ***Librarian to complete this section for all***
Was the study/article subject to peer review? Was it published in a reputable journal?
Published in peer reviewed journal of high impact/reputation score 5
Published in peer reviewed journal of lesser impact/reputation score 3
Not subject to peer review score 1
PUBLICATION/PEER REVIEW total score = _______
The system/data/setting/population studied is very similar to that of Ontario score 5
The system/data/setting/population studied is somewhat similar to that of Ontario score 3
The system/data/setting/population studied is different from that of Ontario, but may represent future trends
score 2
The system/data/setting/population studied is very different from that of Ontario score 0
REPRESENTATIVENESS total score = _______
Ref ID: _____
Author: _____
Year: __________________
Reviewer: _____

PIDAC: Syndromic Surveillance Discussion Paper | August 2012 58
D) Economic assessment
Did the study/article include a quantitative economic assessment? Cost-effectiveness analysis? etc.
Economic or cost-effectiveness analysis incorporated score 5
Some costing considerations noted score 3
No economic/cost-effectiveness analysis included score 0
ECONOMIC ASSESSMENT total score = _______ E) Data collection methods
Are the data collection tools/methods adequately described? Valid? Reliable?
Methods are comprehensively described and appear valid and reliable score 5
Description of methods is not comprehensive, but methods appear reliable score 3
Methods inadequately described/difficult to assess accuracy score 1
Methods as described are neither valid nor reliable score 0
DATA COLLECTION METHODS total score = _______
F) Analyses
Are the unit of analysis, the statistical or mathematical methodology and the approach to assessing any intervention, confounding, etc. appropriate and accurate for the study design and conclusions?
Analyses are comprehensively described and appear appropriate and accurate score 5
Description of analyses is not comprehensive, but analyses appear appropriate and accurate
score 3
Analyses are inadequately described/difficult to assess appropriateness and accuracy
score 1
Analyses are either inappropriate or inaccurate score 0
ANALYSES total score = _______
Global Rating Very valuable study grade A Valuable study grade B Not a useful study grade C Brief Rationale for Global Rating:
Global Total Score
TOTAL SCORE = _______ GLOBAL RATING GRADE = _______
Agreement Between Reviewers
Is the overall difference between the two rater’s Global Total Scores less than or equal to 5 points? No Yes If YES, study/publication must be assessed by a third reviewer.
PIDAC: Syndromic Surveillance Discussion Paper | August 2012 59
Appendix 2: Data Extraction Tool PIDAC-S ABSTRACTION Article abstraction tool for syndromic surveillance literature review. Article Information Abstractor Name ______________________ Article Title ______________________ Article Authors (e.g. Savage R, Gournis E, Winter A et al.) ______________________ Year of Publication ______________________ Journal Name ______________________ Volume, Issue, Page Numbers ______________________ Question 1 Which type(s) of syndromic/proxy data does this article cover (or make significant mention)? Please check all that apply. School Absenteeism Employee Absenteeism Emergency department chief complaint data EMS assessment data 911 call dispatch codes Telephone health line Pharmacy sales Sentinel community HCPs Online search trends (e.g. Google Flu Trends). Specify name: __________________________ Online media sources or bulletin boards (e.g. GPHIN, PROMED). Specify name: __________________________ Internet-based self-reported illness tools. Specify name: __________________________ Social media monitoring (e.g. Twitter, Facebook). Specify name: __________________________ Other. Specify name: __________________________ Question 2 Which of these potential uses of syndromic surveillance does the article cover (or make significant mention)? Please check all that apply. Early warning/outbreak detection (real prospective event, not simulation) Early warning/outbreak detection (simulation models) Surveillance during a mass gathering/unique event Ability to signify start/end of seasonal pathogen (e.g. flu or norovirus) Situational awareness Assistance during novel threats/emergencies/natural disasters (e.g. pandemic, SARS) Other, please specify: __________________________ *NEW* Early warning/outbreak detection (real retrospective) Early warning/outbreak detection (prospective) (q2a) You selected “early warning (prospective)”; please enter the following information. What was the gold standard the syndromic data was compared to? ______________________ Was an event detected earlier in the syndromic data? (Y/N) ______________________ If yes, what was the time difference? ______________________ Did earlier detection result in any public health action? Briefly describe. ______________________ Please capture any additional relevant information here. ______________________

PIDAC: Syndromic Surveillance Discussion Paper | August 2012 60
Early warning/outbreak detection (simulation) (q2b) You selected “early warning (simulation)”; please enter the following information. What was the gold standard the syndromic data was compared to? ______________________ Was an event detected earlier in the syndromic data? (Y/N) ______________________ If yes, what was the time difference? ______________________ Did earlier detection result in any public health action? Briefly describe. ______________________ Please capture any additional relevant information here. ______________________ Mass gathering/unique event (q2c) You selected “mass gathering/unique event”; please enter the following information. Briefly describe the system (e.g. new or existing, syndromes monitored). ______________________ Was the system able to detect a known event—prospectively or retrospectively? ______________________ If prospective, was any public health action taken? Briefly describe action. ______________________ Please capture any additional relevant information here. ______________________ Signify start or end of season (q2d) You selected “signify start or end of season”; please enter the following information. What was the gold standard the syndromic data was compared to? ______________________ Was the start/end of season detected earlier in the syndromic data? (Y/N) ______________________ If yes, what was the time difference? ______________________ Did earlier detection result in any public health action? Briefly describe action. ______________________ Please capture any additional relevant information here. ______________________ Situational awareness (q2e) You selected “situational awareness”; please enter the following information. Do the authors define situational awareness? (Y/N)___________________ If yes, provide definition.___________________ Are specific situations described where the syndromic data provided situational awareness? (Y/N)___________________ If yes, please briefly describe.___________________ If no, please describe generally how the data provided situational awareness (e.g. used in conjunction with traditional systems). ___________________ Please capture any additional relevant information here.___________________ Novel threats/emergencies/natural disasters (q2f) You selected “novel threats, etc”; please enter the following information. What was the threat? (name)__________________ Was the data used to monitor the situation including health service impact (in lieu of or in absence of existing infrastructure)? (Y/N)__________________ If yes, please describe__________________ Was the data used to inform decisions? (Y/N)__________________ If yes, please describe (including which decisions).__________________ Was the data used for a different purpose? (Y/N)__________________ If yes, please describe.__________________ Please capture any additional relevant information here.__________________ Other (q2g) Please enter any relevant information here, focusing on how syndromic surveillance was used. _____________________________________________________________ _____________________________________________________________ _____________________________________________________________ Early warning/outbreak detection (real retrospective) (q2h) You selected “early warning (retrospective)”; please enter the following information. What was the gold standard the syndromic data was compared to? ______________________ Was an event detected earlier in the syndromic data? (Y/N) ______________________ If yes, what was the time difference? ______________________ Please capture any additional relevant information here. ______________________

PIDAC: Syndromic Surveillance Discussion Paper | August 2012 61
Question 3 Which of these considerations for adopting syndromic surveillance does this article cover? Please check all that apply. Economic implications Automation (of analysis, data collection) Sensitivity and/or specificity Aberration detection algorithms (or other analytic tools) Level of public health response and when to trigger it Other, please specify: __________________________ Economic implications (q3a) You selected “economic implications”; please enter the following information. Briefly describe the resources used. ______________________ Automation (q3b) You selected “automation”; please enter the following information. What is automated: data collection, analysis or both? ______________________ Briefly describe automation. ______________________ Describe any impact of the automation (improvement in timeliness or efficiency)? ______________________ Please include any additional relevant information here. ______________________ Sensitivity/specificity (q3c) You selected “sensitivity/specificity”; please enter the following information. What was the gold standard the syndromic data was compared to?________________ Briefly describe its sensitivity (ability to detect true events—true positives).________________ Briefly describe its specificity (are syndromes monitored specific to the disease of interest or could it also represent other diseases—false positives).________________ Please include any additional relevant information here.________________ Aberration detection algorithms (q3d) You selected “aberration dection algorithms”; please enter the following information. How was the syndromic data analysed (describe approach including algorithms used)? ______________________ Was the approach validated? (Y/N) ______________________ If yes, please briefly describe the validation. ______________________ Please include any additional relevant information here. ______________________ Public health response (q3e) You selected “public health response”; please enter the following information. Was there a threshold for alerting or a trigger for investigation based on the analysis? (Y/N) ______________________ If yes, please briefly describe. ______________________ Briefly describe the process for investigating alerts if stated. ______________________ Briefly describe the public health response taken (including the time between alert and response) if stated. ________________ Was a protocol in place to guide the response? (Y/N) ______________________ If yes, please briefly describe. ______________________ Please include any additional relevant information here. ______________________ Other (q3f) You selected “other”; please include any relevant information here. _____________________________________________________________ _____________________________________________________________ _____________________________________________________________

PIDAC: Syndromic Surveillance Discussion Paper | August 2012 62
Question 4 Does the article list any recommendations for the future of syndromic surveillance? Please enter in the text box provided below. _____________________________________________________________ _____________________________________________________________ _____________________________________________________________ Question 5 List any other topics or discussion points mentioned in the article that might be of use to the review. _____________________________________________________________ _____________________________________________________________ _____________________________________________________________ This is the end of the abstraction tool. Please ensure you double-check your responses before clicking “Submit” (by selecting the “Back” button). You can also review your responses by selecting “Review Responses” at the bottom left. This will open your responses in a PDF file, which you can review. You may wish to save the final PDF so you have a back-up copy for your records. Thank you!

PIDAC: Syndromic Surveillance Discussion Paper | August 2012 63
References 1. German RR, Lee LM, Horan JM, Milstein RL, Pertowski CA, Waller MN; Guidelines Working Group Centers for Disease Control and Prevention (CDC). Updated guidelines for evaluating public health surveillance systems: recommendations from the Guidelines Working Group. MMWR Recomm Rep. 2001 Jul 27;50(RR-13):1-35.
2. Buehler JW, Hopkins RS, Overhage JM, Sosin DM, Tong V; CDC Working Group. Framework for evaluating public health surveillance systems for early detection of outbreaks: recommendations from the CDC Working Group. MMWR Recomm Rep. 2004;53(RR-5):1-11.
3. Queen’s University Emergency Syndromic Surveillance Team (QUEST) [homepage on the Internet]. Kingston: KFL&A Public Health Staff; c2011. Emergency Department Syndromic Surveillance (EDSS); 2011 [cited 2012 Oct 25]. Available from: http://www.quesst.ca/edss.asp.
4. Davies R, University of Ottawa Heart Institute. Advanced Syndromic Surveillance and Emergency Triage (ASSET): Establishing Syndromic Surveillance in Ottawa. Presented at: Syndromic Surveillance in Ontario: Current Initiatives and Future Directions Workshop. 2009 Mar 30; Toronto, ON. [cited 2012 Oct 25] Available from: http://www.oahpp.ca/resources/documents/presentations/2009mar30/OAHPP%20Syndromic%20Surveillance%20Workshop%20Mar%2009%20-%20Richard%20Davies.pdf
5. Garay J, York Region Community and Health Services. Exploring the use of school absenteeism data for the early detection of outbreaks in the community. Syndromic Surveillance in Ontario: Current Initiatives and Future Directions Workshop. 2009 Mar 30; Toronto, ON. [cited 2012 Oct 25] Available from: http://www.oahpp.ca/resources/documents/presentations/2009mar30/OAHPP%20Syndromic%20Surveillance%20Workshop%20Mar%2009%20-%20Jason%20Garay.pdf
6. Ontario Agency for Health Protection and Promotion (OAHPP). Syndromic surveillance in Ontario: Current initiatives and future directions workshop proceedings: Objective 5 – To define what the role of the OAHPP should be in this domain. [cited 2012 Oct 25] Available from: http://www.oahpp.ca/resources/documents/presentations/2009mar30/OAHPP%20Syndromic%20Surveillance%20Workshop%20Mar%2009%20-%20Final%20Report.pdf
7. Van den Wijngaard CC, van Pelt W, Nagelkerke NJD, Kretzschmar M, Koopmans MP. Evaluation of syndromic surveillance in the Netherlands: its added value and recommendations for implementation. Euro Surveill. 2011;16(9):17-24.
8. Van den Wijngaard CC, van Asten L, Meijer A, van Pelt W, Nagelkerke NJD, Verheij R, et al. Validation of syndromic surveillance for respiratory pathogen activity. Emerg Infect Dis. 2008;14(6):917-25.
9. Baer A, Rodriguez CV, Duchin JS. An automated system for public health surveillance of school absenteeism. J Public Health Manag Pract. 2011;17(1):59-64.
10. Jaeger V, Shick-Porter M, Moore D, Grant D, Wolfe V. GotFlu Channel: An online syndromic surveillance tool supporting college health practice and public health work. J Am Coll Health. 2011;59(5):415-8.
11. Tango T, Takahashi K, Kohriyama K. A space-time scan statistic for detecting emerging outbreaks. Biometrics. 2011;67(1):106-15.
12. Schmidt WP, Peabody R, Mangtani P. School absence data for influenza surveillance: a pilot study in the United Kingdom. Euro Surveill. 2010;15(3):4-9.

PIDAC: Syndromic Surveillance Discussion Paper | August 2012 64
13. Chen H, Zeng D, Yan P. Syndromic surveillance data sources and collection strategies. Infect Dis Inform. 2010;21(1):33-48.
14. Fan S, Blair C, Brown A, Gabos S, Honish L, Hughes T, et al. A multi-function public health surveillance system and the lessons learned in its development: The Alberta Real Time Syndromic Surveillance Net. Can J Public Health. 2010 Nov-Dec;101(6):454-8.
15. Foldy SL, Biedrzycki PA, Baker BK, Swain GR, Howe DS, Ciervn D, et al. The public health dashboard: A surveillance model for bioterrorism preparedness. J Public Health Manag Pract. 2004;10(3):234-40.
16. Heffernan R, Mostashari F, Das D, Karpati A, Kulldorff M, Weiss D. Syndromic surveillance in public health practice, New York City. Emerg Infect Dis. 2004;10(5):858-64.
17. Zheng W, Aitken R, Muscatello DJ, Churches T. Potential for early warning of viral influenza activity in the community by monitoring clinical diagnoses of influenza in hospital emergency departments. BMC Public Health. 2007;7:250.
18. Griffin BA, Jain AK, Davies-Cole J, Glymph C, Lum G, Washington SC, et al. Early detection of influenza outbreaks using the DC Department of Health’s syndromic surveillance system. BMC Public Health. 2009;9:483.
19. May LS, Griffin BA, Bauers NM, Jain A, Mitchum M, Sikka N, et al. Emergency department chief complaint and diagnosis data to detect influenza-like illness with an electronic medical record. West J Emerg Med. 2010;11(1):1-9.
20. Fleischauer AT, Silk BJ, Schumacher M, Komatsu K, Santana S, Vaz V, et al. The validity of chief complaint and discharge diagnosis in emergency department-based syndromic surveillance. Acad Emerg Med. 2004;11(12):1262-7.
21. Gestland PH, Gardner RM, Tsi FC, Espino JU, Rolfs RT, James BC, et al. Automated syndromic surveillance for the 2002 Winter Olympics. J Am Med Inform Assoc. 2003;10(6):547-54.
22. Buckeridge DL, Owens DK, Switzer P, Frank J, Musen MA. Evaluating detection of an inhalation anthrax outbreak. Emerg Infect Dis. 2006;12(12):1942-9.
23. Shih FY, Yen MY, Wu JS, Chang FK, Lin LW, Ho MS, et al. Challenges faced by hospital healthcare workers using a syndrome-based surveillance system during the 2003 outbreak of severe acute respiratory syndrome in Taiwan. Infect Control Hosp Epidemiol. 2007;28(3):354-7.
24. Das D, Weiss D, Mostashari F, Treadwell T, McQuiston J, Hutwagner L, et al. Enhanced drop-in syndromic surveillance in New York City following September 11, 2001. J Urban Health. 2003 Jun;80(2 Suppl 1):76-88.
25. Turner KS, Shaw KA, Coleman DJ, Misrachi A. Augmentation of influenza surveillance with rapid antigen detection at the point-of-care: results of a pilot study in Tasmania, 2004. Commun Dis Intell. 2006;30(2):201-4.
26. Schindeler SK, Muscatello DJ, Ferson MJ, Rogers KD, Grant P, Churches T. Evaluation of alternative respiratory syndromes for specific syndromic surveillance of influenza and respiratory syncytial virus: a time series analysis. BMC Infect Dis. 2009;9:190.
27. Van Dijk A, Aramini J, Edge G, Moore KM. Real-time surveillance for respiratory disease outbreaks, Ontario, Canada. Emerg Infect Dis. 2009;15(5):799-801.
28. Bellazzini MA, Minor KD. ED syndromic surveillance for novel H1N1 spring 2009. Am J Emerg Med. 2011;29(01):70-4.

PIDAC: Syndromic Surveillance Discussion Paper | August 2012 65
29. O’Connell EK, Zhang G, Leguen F, Llau A, Rico E. Innovative uses for syndromic surveillance. Emerg Infect Dis. 2010;16(4):669-71.
30. New South Wales Public Health Network. Progression and impact of the first winter wave of the 2009 pandemic H1N1 influenza in New South Wales, Australia. Euro Surveill. 2009;14(42):28-36.
31. Guasticchi G, Giorgi Rossi P, Lori G, Genio S, Biagetti F, Gabriele S, et al. Syndromic surveillance: sensitivity and positive predictive value of the case definitions. Epidemiol Infect. 2009;137(5):662-71.
32. Metzger KB, Hajat A, Crawford M, Mostashari F. How many illnesses does one emergency department visit represent? Using a population-based telephone survey to estimate the syndromic multiplier. MMWR Morb Mortal Wkly Rep. 2004;53 Suppl:106-11.
33. Day FC, Schriger DL, La M. Automated linking of free-text complaints to reason-for-visit categories and International Clasification of Diseases diagnoses in emergency department patient record databases. Ann Emerg Med. 2004;43(3):401-9.
34. Mikosz CA, Silva J, Black S, Gibbs G, Cardenas I. Comparison of two major emergency department-based free-text chief-complaint coding systems. MMWR Morb Mortal Wkly Rep. 2004;53 Suppl:101-5.
35. Shapiro AR. Taming variability in free text: application to health surveillance. MMWR Morb Mortal Wkyly Rep. 2004;53 Suppl:95-100.
36. Travers DA, Haas SW. Unified medical language system coverage of emergency-medicine chief complaints. Acad Emerg Med. 2006;13(12):1319-23.
37. Travers D, Wu S, Scholer M, Westlake M, Waller A, McCalla AL, et al. Evaluation of a chief complaint pre-processor for biosurveillance. AMIA Annu Symp Proc. 2007;736-40.
38. Yli-Hietanen J, Niiranen S, Aswell M, Nathanson L. Domain-specific analytical language modeling— the chief complaint as a case study. Int J Med Inform. 2009 Dec;78(12):e27-30.
39. Hope K, Merritt T, Eastwood K, Main K, Durrheim DN, Muscatello D, et al. The public health value of emergency department syndromic surveillance following a natural disaster. Commun Dis Intell. 2008;32(1):92-4.
40. Josseran L, Fouillet A, Caillere N, Brun-Ney D, Ilef D, Brucker G, et al. Assessment of a syndromic surveillance system based on morbidity data: Results from the Oscour® network during a heat wave. PLoS One. 2010;5(8):e11984.
41. Townes JM, Kohn MA, Southwick KL, Bangs CA, Zechnich AD, Magnuson JA, et al. Investigation of an electronic emergency department information system as a data source for respiratory syndrome surveillance. J Public Health Manag Pract. 2004;10(4):299-307.
42. Kirkwood A, Guenther E, Fleischauer AT, Gunn J, Hutwagner L, Barry MA. Direct cost associated with the development and implementation of a local syndromic surveillance system. J Public Health Manag Pract. 2007;13(2):194-9.
43. Begier EM, Sockwell D, Branch LM, Davies-Cole JO, Jones LH, Edwards L, et al. The national capital region’s emergency department syndromic surveillance system: do chief complaint and discharge diagnosis yield different results? Emerg Infect Dis. 2003;9(3):393-6.
44. Travers D, Barnett C, Ising A, Waller A. Timeliness of emergency department diagnoses for syndromic surveillance. AMIA Annu Symp Proc. 2006:769-73.
45. Craigmile PF, Kim N, Fernandez SA, Bonsu BK. Modeling and detection of respiratory-related outbreak signatures. BMC Med Inform Decis Mak. 2007;7:28.
PIDAC: Syndromic Surveillance Discussion Paper | August 2012 66
46. Dafni UG, Tsiodras S, Panagiotakos D, Gkolfinopoulou K, Kouvatseas G, Tsourti Z, et al. Algorithm for statistical detection of peaks—syndromic surveillance system for the Athens 2004 Olympic Games. MMWR Morb Mortal Wkly Rep. 2004;53(Suppl):86-94.
47. Coory MD, Kelly H, Tippett V. Assessment of ambulance dispatch data for surveillance of influenza-like illness in Melbourne Australia. J Public Health. 2009;123(2):163-8.
48. Williams CJ, Schenkel K, Eckmanns T, Altmann D, Krause G. FIFA World Cup 2006 in Germany: enhanced surveillance improved timeliness and detection. Epidemiol Infect. 2009;137(4):597-605.
49. Greenko J, Mostashari F, Fine A, Layton M. Clinical evaluation of the emergency medical services (EMS) ambulance dispatch-based syndromic surveillance system, New York City. J Urban Health. 2003;80(2 Suppl 1):i50-6.
50. Flamand C, Larrieu S, Couvy F, Jouves B, Josseran L, Filleul L. Validation of a syndromic surveillance system using a general practitioner house call network, Bordeaux, France. Euro Surveill. 2008;13(25).
51. Smith S, Elliot AJ, Mallaghan C, Modha D, Hippisleu-Cox J, Large S, et al. Value of syndromic surveillance in monitoring a focal waterborne outbreak due to an unusual Cryptosporidium genotype in Northamptonshire, United Kingdom, June–July 2008. Euro Surveill. 2010;15(33):14-22.
52. Van den Wijngaard CC, Dijkstra F, van Pelt W , van Asten L, Kretzschmar M, Schimmer B, et al. In search of hidden Q-fever outbreaks: linking syndromic hospital clusters to infected goat farms. Epidemiol Infect. 2011; 139(1):19-26.
53. Van den Wijngaard CC, van Asten L, Meijer A, van Pelt W, Nagelkerke NJD, Donker GA, et al. Detection of excess influenza severity: associating respiratory hospitalization and mortality data with reports of influenza-like illness by primary care physicians. Am J Public Health. 2010;100(11):2248-54.
54. Meynard JB, Chaudet H, Texier G, Ardillon V, Ravachol F, Deparis X, et al. Value of syndromic surveillance within the Armed Forces for early warning during a dengue fever outbreak in French Guiana in 2006. BMC Med Inform Decis Mak. 2008;8:29.
55. Chan EH, Tamblyn R, Charland KML, Buckeridge DL. Outpatient physician billing data for age and setting specific syndromic surveillance of influenza-like illnesses. J Biomed Inform. 2011;44(2):221-8.
56. Smith S, Smith GE, Olowokure B, Ibbotson S, Foord D, Maguire H, et al. Early spread of the 2009 influenza A (H1N1) pandemic in the United Kingdom—use of local syndromic data, May-August 2009. Euro Surveill. 2011;16(3):8-16.
57. Brabazon ED, Carton MW, Murray C, Hederman L, Bedford D. General practice out-of-hours service in Ireland provides a new source of syndromic surveillance data on influenza. Euro Surveill. 2010;15(31):16-22.
58. Sloane PD, MacFarquhar JK, Sickbert-Bennett E, Mitchell CM, Akers R, Weber DJ, et al. Syndromic surveillance for emerging infections in office practice using billing data. Ann Fam Med. 2006;4(4):351-8.
59. Bellika JG, Hasvold T, Hartvigsen G. Propagation of program control: a tool for distributed disease surveillance. Int J Med Inform. 2007;76(4):313-29.
60. Hripcsak G, Soulakis ND, Li L, Morrison FP, Lai AM, Friedman C, et al. Syndromic surveillance using ambulatory electronic health records. J Am Med Inform Assoc. 2009;16(3):354-61.
61. Takahashi K, Kulldorff M, Tango T, Yih K. A flexibly shaped space-time scan statistic for disease outbreak detection and monitoring. Int J Health Geogr. 2008;7:14.

PIDAC: Syndromic Surveillance Discussion Paper | August 2012 67
62. Yih K, Abrams A, Danila R, Green K, Kleinman K, Kulldorff M, et al. Ambulatory-care diagnoses as potential indicators of outbreaks of gastrointestinal illness—Minnesota. MMWR Morb Mortal Wkly Rep. 2005;54 Suppl:157-62.
63. Yih K, Deshpande S, Fuller C, Heisey-Grove D, Hsu J, Kruskal BA, et al. Evaluating real-time syndromic surveillance signals from ambulatory care data in four states. Public Health Rep. 2010;125(1):111-20.
64. Carneiro HA, Mylonakis E. Google Trends: a web-based tool for real-time surveillance of disease outbreaks. Clin Infect Dis. 2009;49(10):1557-64.
65. Dalton C, Durrheim D, Fejsa J, Francis L, Carlson S, d’Espaignet ET, et al. Flutracking: A weekly Australian community online survey of influenza-like illness in 2006, 2007 and 2008. Commun Dis Intell. 2009;33(3):316-22.
66. Sugiura H, Ohkusa Y, Akahane M, Sugahara T, Okabe N, Imamura T. Construction of syndromic surveillance using a web-based daily questionnaire for health and its application at the G8 Hokkaido Toyako Summit meeting. Epidemiol infect. 2010;138(10):1493-502.
67. Eysenbach G. Infodemiology: Tracking flu-related searches on the web for syndromic surveillance. AMIA Annu Symp Proc. 2006:244-8.
68. Hulth A, Rydevik G, Linde A. Web queries as a source for syndromic surveillance. PLoS One. 2009;4(2):e4378
69. Valdivia A, Lopez-Alcalde J, Vicente M, Pichule M, Ruiz M, Ordobas M. Monitoring influenza activity in Europe with Google Flu Trends: comparison with the findings of sentinel physician networks—results for 2009–10. Euro Surveill. 2010;15(29):2-7.
70. Wethington H, Bartlett P. The RUsick2 foodborne disease forum for syndromic surveillance. Emerg Infect Dis. 2004;10(3):401-5.
71. Margruder SF. Evaluation of over-the-counter pharmaceutical sales as a possible early warning indicator of human disease. Johns Hopkins Appl Tech Digest. 2003;24(4):349-53.
72. Vergu E, Grais RF, Sarter H, Fagot JP, Lambert B, Valleron AJ, et al. Medication sales and syndromic surveillance, France. Emerg Infect Dis. 2006;12(3):416-21.
73. Najmi AH, Magruder SF. Estimation of hospital emergency room data using otc pharmaceutical sales and least mean square filters. BMC Med Inform Decis Mak. 2004;4:5.
74. Edge VL, Pollari F, Ng LK, Michel P, McEwen SA, Wilson JB, et al. Syndromic surveillance of Norovirus using over-the-counter sales of medications related to gastrointestinal illness. Can J Infect Dis Med Microbiol. 2006;17(4):235-41.
75. Kirian ML, Weintraub JM. Prediction of gastrointestinal disease with over-the-counter diarrheal remedy sales records in the San Francisco Bay area. BMC Med Inform Decis Mak. 2010;10:39.
76. Singh BK, Savill NJ, Ferguson NM, Robertson C, Woolhouse MEJ. Rapid detection of pandemic influenza in the presence of seasonal influenza. BMC Public Health. 2010;10:726.
77. Clothier HJ, Fielding JE, Kelly HA. An evaluation of the Australian Sentinel Practice Research Network (ASPREN) surveillance for influenza-like illness. Commun Dis Intell. 2005;29(3):231-47.
78. Coory M, Grant K, Kelly H. Influenza-like illness surveillance using a deputising medical service corresponds to surveillance from sentinel general practices. Euro Surveill. 2009;14(44):37-40.
79. Cooper DL, Smith GE, Regan M, Large S, Groenewegen PP. Tracking the spatial diffusion of influenza and norovirus using telehealth data: A spatiotemporal analysis of syndromic data. BMC Med. 2008;6:16.

PIDAC: Syndromic Surveillance Discussion Paper | August 2012 68
80. Caudle JM, van Dijk A, Rolland E, Moore KM. Telehealth Ontario detection of gastrointestinal illness outbreaks. Can J Public Health. 2009;100(4):253-7.
81. Rolland E, Moore KM, Robinson VA, McGuinness D. Using Ontario’s “Telehealth” health telephone helpline as an early-warning system: a study protocol. BMC Health Serv Res. 2006;6:10.
82. Cooper DL, Smith GE, Edmunds WJ, Joseph C, Gerard E, George RC. The contribution of respiratory pathogens to the seasonality of NHS Direct calls. J Infect. 2007;55(3):240-8.
83. Smith GE, Cooper DL, Loveridge P, Chinemana F, Gerard E, Verlander N. A national syndromic surveillance system for England and Wales using calls to a telephone helpline. Euro Surveill. 2006;11(12):220-4.
84. Mann P, O’Connell E, Zhang G, Llau A, Rico E, Leguen FC. Alert system to detect possible school-based outbreaks of influenza-like illness. Emerg Infect Dis. 2011;17(2):262-4.
85. Marx MA, Rodriguez CV, Greenko J, Das D, Heffernan R, Karpati AM, et al. Diarrheal illness detected through syndromic surveillance after a massive power outage: New York City, August 2003. Am J Public Health. 2006;96(3):547-53.
86. Ansaldi F, Orsi A, Altomonte F, Bertone G, Parodi V, Carloni R et al. Emergency department syndromic surveillance system for early detection of 5 syndromes: a pilot project in a reference teaching hospital in Genoa, Italy. J Prev Med Hyg. 2008;49(4):131-5.
87. Burr T, Graves T, Klamann R, Michalak S, Picard R, Hengartner N. Accounting for seasonal patterns in syndromic surveillance data for outbreak detection. BMC Med Inform Decis Mak. 2006;6:40.
88. Chan TC, King CC, Yen MY, Chiang PH, Huang CS, Hsiao CK. Probabilistic daily ILI syndromic surveillance with a spatio-temporal Baysian hierarchical model. PLoS One. 2010;5(7):e11626.
89. Choi KW, Wong NS, Lee LY, Lee SS. Surveillance of febrile patients in a district and evaluation of their spatiotemporal associations: a pilot study. BMC Public Health. 2010;10:84.
90. Gangnon R, Bellazzini M, Minor K, Johnson M. Syndromic surveillance: early results from the MARISSA project. WMJ. 2009;108(5):256-8.
91. Hafen RP, Anderson DE, Cleveland WS, Maciejewski R, Ebert DS, Abusalah A, et al. Syndromic surveillance: STL for modeling, visualizing, and monitoring disease counts. BMC Med Inform Decis Mak. 2009;9:21.
92. Kwan-Gett TS, Baer A, Duchin JS. Spring 2009 H1N1 influenza outbreak in King County, Washington. Disaster Med Public Health Prep. 2009;3 Suppl 2:S109-16.
93. Lemay R, Mawudeku A, Shi Y, Ruben M, Achonu C. Syndromic surveillance for influenza like illness. Biosecur Bioterror. 2008;6(2):161-70.
94. Lewis MD, Pavlin JA, Mansfield JL, O’Brien S, Boomsma LG, Elbert Y, et al. Disease outbreak detection system using syndromic data in the Greater Washington DC area. Am J Prev Med. 2002;23(3):180-6.
95. Lober WB, Trigg LJ, Karras BT, Bliss D, Ciliberti J, Stewart L, et al. Syndromic surveillance using automated collection of computerized discharge diagnoses. J Urban Health. 2003;80(2 Suppl 1):97-106.
96. Lu HN, Chen H, Zeng D, King CC, Shih FY, Wu TS, et al. Multilingual chief complaint classification for syndromic surveillance: an experience with Chinese chief complaints. Int J Med Inform. 2009;78(5):308-20.
97. McLeod M, Mason K, White P, Read D. The 2005 Wellington influenza outbreak: syndromic surveillance of Wellington Hospital emergency department activity may have provided early warning. Aust N Z J Public Health. 2009;33(3):289-94.

PIDAC: Syndromic Surveillance Discussion Paper | August 2012 69
98. Meurer WJ, Smith BL, Losman ED, Sherman D, Yaksich JD, Jared JD, et al. Real-time identification of serious infection in geriatric patients using clinical information system surveillance. J Am Geriatr Soc. 2009;57(1):40-5.
99. Neill DB. An empirical comparison of spatial scan statistics for outbreak detection. Int J Health Geogr. 2009;8:20.
100. Ozonoff A, Forsberg L, Bonelli M, Pagano M. Bivariate method for spatio-temporal syndromic surveillance. MMWR Morb Mortal Wkly Rep. 2004;53 Suppl:59-66.
101. Silka PA, Geiderman JM, Goldberg JB, Kim LP. Demand on ED resources during periods of widespread influenza activity. Am J Emerg Med. 2003;21(7):534-9.
102. South BR, Chapman WW, Delisle S, Shen S, Kalp E, Perl T, Samore MH, et al. Optimizing a syndromic surveillance text classifier for influenza-like illness: does document source matter? AMIA Annu Symp Proc. 2008;692-6.
103. Wallace DJ, Arquilla B, Heffernan R, Kramer M, Anderson T, Bernstein D, et al. A test of syndromic surveillance using a severe acute respiratory syndrome model. Am J Emerg Med. 2009;27(4):419-23.
104. Wang LM, Chen YC, Tung SP, Chen CY, Chang SC, Chiang SC, et al. The rationale of fever surveillance to identify patients with severe acute respiratory syndrome in Taiwan. Emerg Med J. 2006;23(3):202-5.
105. Baer A, Elbert Y, Burkom HS, Holtry R, Lombardo JS, Duchin JS. Usefulness of syndromic surveillance data sources for investigating morbidity resulting from a severe weather event. Disaster Med Public Health Prep. 2011;5(1):37-45.
106. Murray KO, Kilborn C, DesVignes-Kendrick M, Koers E, Page V, Selwyn BJ, et al. Emerging disease syndromic surveillance for hurricane Katrina evacuees seeking shelter in Houston’s Astrodome and Reliant Park Complex. Public Health Rep. 2009;124(3):364-71.
107. Zielinski A. Evidence for excessive incidence of infectious diseases at mass gathering with special reference to sporting events. Przeql Epidemiol. 2009;63(3):343-51.
108. Burkom HS, Murphy SP, Shmueli G. Automated time series forecasting for biosurveillance. Stat Med. 2007;26(22):4202-18.
109. Cadieux G, Buckeridge DL, Jacques A, Libman M, Dendukuri N, Tamblyn R. Accuracy of syndrome definitions based on diagnoses in physician claims. BMC Public Health. 2011;11:17.
110. Centers for Disease Control and Prevention. Assessment of ESSENCE performance for influenza-like illness surveillance after an influenza outbreak—U.S. Air Force Academy, Colorado, 2009. MMWR Morb Mortal Wkly Rep. 2011;60(13):406-9.
111. Chen MIC, Tan IBH, Ng YY. Modelling the utility of body temperature readings from primary care consults for SARS surveillance in an army medical centre. Ann Acad Med Singapore. 2006;35(4):236-41.
112. Deepa TM, Rao EV, Patil RR, Samuel R. Operational feasibility of establishing community reporting systems. Natl Med J India. 2008;21(4):166-70.
113. Freedman DO, Weld LH, Kozarsky PE, Fisk T, Robins R, von Sonnenburg F, et al. Spectrum of disease and relation to place of exposure among ill returned travelers. N Engl J Med. 2006;354(2):119-30.
114. Hall G, McDonald L, Majowicz SE, Scallan E, Kirk M, Sockett P, et al. Respiratory symptoms and the case definition of gastroenteritis: an international analysis of the potential impact on burden estimates. Epidemiol Infect. 2010;138(1):117-23.

PIDAC: Syndromic Surveillance Discussion Paper | August 2012 70
115. Jefferson H, Dupuy B, Chaudet H, Texier G, Green A, Barnish G, et al. Evaluation of a syndromic surveillance for the early detection of outbreaks among military personnel in a tropical country. J Public Health. 2008;30(4):375-83.
116. Jung I, Kulldorff M, Kleinman KP, Yih WK, Platt R. Using encounters versus episodes in syndromic surveillance. J Public Health. 2009;31(4):566-72.
117. Kawana A, Teruya K, Kirikae T, Sekiguchi JI, Kato Y, Kurodo E, et al. “Syndromic surveillance within a hospital” for the early detection of a nosocomial outbreak of acute respiratory infection. Jpn J Infect Dis. 2006;59(6):377-9.
118. Najmi AH, Burkom H. Recursive least squares background prediction of univariate syndromic surveillance data. BMC Med Inform Decis Mak. 2009;9:4.
119. Nordin JD, Harpaz R, Harper P, Rush W. Syndromic surveillance for measleslike illness in a managed care setting. J Infect Dis. 2004;189 Suppl 1:S222-6.
120. Pattie DC, Atherton MJ, Cox KL. Electronic influenza monitoring: evaluation of body temperature to classify influenza-like illness in a syndromic surveillance system. Qual Manag Health Care. 2009;18(2):91-102.
121. Van den Wijngaard CC, van Asten L, van Pelt W, Doornbos G, Nagelkerke NJD, Donker GA, et al. Syndromic surveillance for local outbreaks of lower respiratory infections: would it work? PLoS One. 2010;5(4):e10406.
122. Carlson SJ, Dalton CB, Tuyl FA, Durrheim DN, Fejsa J, Muscatello DJ et al. Flutracking surveillance: comparing 2007 New South Wales results with laboratory confirmed influenza notifications. Commun Dis Intell. 2009;33(3):323-7.
123. Goel S, Hofman JM, Lahaie S, Pennock DM, Watts DJ. Predicting consumer behaviour with web search. Proc Natl Acad Sci USA. 2010;107(41):17486-90.
124. Wethington H, Bartlett P. Usage and data collection patterns for a novel web-based foodborne-disease surveillance system. J Environ Health. 2006;68(7):25-9.
125. Burkom HS, Elbert Y, Feldman A, Lin J. Role of data aggregation in biosurveillance detection strategies with applications from ESSENCE. MMWR Morb Mortal Wkly Rep. 2004;53 Suppl:67-73.
126. Najmi AH, Magruder SF. An Adaptive prediction and detection algorithm for multistream syndromic surveillance. BMC Med Inform Decis Mak. 2005;5:33.
127. Sokolow LZ, Grady N, Rolka H, Walker D, McMurray P, English-Bullard R, et al. Deciphering data anomalies in BioSense. MMWR Morb Mortal Wkly Rep. 2005;54 Suppl:133-9.
128. Way ASC, Durrheim DN, Merritt T, Vally H. Antiviral distribution data—a potential syndromic surveillance system to assist pandemic health service operational planning. Commun Dis Intell. 2010;34(3):303-9.
129. Flahault A, Blanchon T, Dorleans Y, Toubiana L, Vibert JF, Valleron AJ. Virtual surveillance of communicable diseases: a 20-year experience in France. Stats Methods Med Res. 2006;15(5):413-21.
130. Gault G, Larrieu S, Durand C, Josseran L, Jouves B, Filleul L. Performance of a syndromic systems for influenza based on the activity of general practitioners, France. J Public Health. 2009;31(2):286-92.
131. Cooper DL, Verlander NQ, Smith GE, Charlett A, Gerard E, Willocks L, et al. Can syndromic surveillance data detect local outbreaks of communicable disease? A model using a historical cryptosporidiosis outbreak. Epidemiol Infect. 2006;134(1):13-20.
PIDAC: Syndromic Surveillance Discussion Paper | August 2012 71
132. Cooper DL, Smith GE, Chinemana F, Joseph C, Loveridge P, Sebastionpillai P, et al. Linking syndromic surveillance with virological self-sampling. Epidemiol Infect. 2008;136(2):222-4.
133. Cooper DL, Verlander NQ, Elliot AJ, Joseph CA, Smith GE. Can syndromic thresholds provide early warning of national influenza outbreaks? J Public Health. 2009;31(1):17-25.
134. Derby MP, McNally J, Ranger-Moore J, Hulette L, Villar R, Hysong T, et al. Poison control center-based syndromic surveillance for foodborne illness. MMWR Morb Mortal Wkly Rep. 2005;54 Suppl:35-40.
135. Elliot AJ, Singh N, Loveridge P, Harcourt S, Smith S, Pnaiser R, et al. Syndromic surveillance to assess the potential public health impact of the Icelandic volcanic ash plume across the united Kingdom, April 2010. Euro Surveill. 2010;15(23):6-9.
136. Buehler James W., Hopkins Richard S. et al. Framework for evaluating public health surveillance systems for early detection of outbreaks. MMWR Morb Mortal Wkly Rep. 2004; 53(RR05): 1-11.

480 University Avenue, Suite 300, Toronto, Ontario M5G 1V2
647 260 7246 www.oahpp.ca