syndicate capital briefing - lloyd's of london/media/files/the-market/...6 successful...
TRANSCRIPT

Syndicate Capital Briefing23/01/2017
© Lloyd’s

222
Agenda Capital reviews 2016
Lloyd’s capital review process
Looking forward – March and beyond
Capital results for 2017 YoA
Questions
© Lloyd’s

333
Capital reviews 2016 – How did it go?
© Lloyd’s

444
New Lloyd’s Actuary
Richard Rodriguez started in March 2016
No July submission of LCR
Following feedback from the market
Major model change
Reviewed through the year
More changes next year
© Lloyd’s
Year of transition

555
Capital reviews 2016 – Objectives
© Lloyd’s

666
Successful transition to one submission format
Major model change submissions
Link with SCR reviews
Key review period: September to November
CPG aims to:
offer a joined up review process with clear points of contact
ensure CEOs of MAs are clear on Lloyd’s view throughout
use “virtual teams” (MRC lead team on capital)
provide written feedback at specified points during the review
ensure consistency with PRA Guidance; risk margin and contract boundaries adjustment
initiate early awareness and approval of model development through major model change submissions
© Lloyd’s
What were the key objectives for 2017 YOA?

777
Generally positive feedback Peter Montanaro (CPG Chair) has written to all MAs
Great buy in from the market on the process
No major changes to the quantitative requirements
Value of early engagement
More efficient and effective process
© Lloyd’s
Overall it went well…

888
Many resubmissions this year More information to look at in the same timeframe
Major model change applications through the year Not always time/resource efficient
RI contract boundary adjustment was done on old/new basis 2018 YoA only on new basis
Heavy burden on MAs and centre
Reviewing process for 2018 YoA Same objectives
© Lloyd’s
Room for improvement?

999
The reviews sit alongside the SAG process:Similar to last year
Standards Assurance Group (SAG) assesses agents’ regulatory compliance
Capital and Planning Group (CPG) oversees Lloyd’s capital setting and syndicate business planning processes
CPG will make decision on prudential measures based on SAG input:
Capital loadings
Business plan restrictions
© Lloyd’s
Agent contact
RISK
ASSURANCE
FUNCTION
technical
review
TEAMS
Oversight and
decision making
Review work & agent
interaction
SAG
Terms of Reference:
• “Assess MA compliance with Lloyd's Standards”
• “Assess compliance with SII internal model tests and standards”
• “Authorise the use of syndicate internal models for capital setting & provide input to CPG”
• “Authorise syndicate major model changes”
CPG
Terms of Reference:
• “Approve all Business plans & Syndicate capital requirements”
• “Approve any Franchise Guideline dispensations”
MRC
Technical
Committee

101010
Additional Features of the review process
Second pair of eyes, SCR review for each syndicate was peer reviewed by another actuary
MRC technical committee, every peer reviewed CPG paper was discussed in detail by a panel of actuaries before CPG discussion
This ensured consistency in SCR/validation reviews
© Lloyd’s
Agent contact
RISK
ASSURANCE
FUNCTION
technical
review
TEAMS
Oversight and
decision making
Review work & agent
interaction
SAG
Terms of Reference:
• “Assess MA compliance with Lloyd's Standards”
• “Assess compliance with SII internal model tests and standards”
• “Authorise the use of syndicate internal models for capital setting & provide input to CPG”
• “Authorise syndicate major model changes”
CPG
Terms of Reference:
• “Approve all Business plans & Syndicate capital requirements”
• “Approve any Franchise Guideline dispensations”
MRC
Technical
Committee

111111
Where are we on validation?
Validation reports used to aid capital reviews
MAs faced challenge in validating the final number, due to time constraints
Validation reports followed a good structure
Board report covered key findings
Technical report/appendices covered
Feedback has now been sent to the market
© Lloyd’s

121212
Common validation issues
One year risk: Validation has improved, but not yet adequate in some cases
Quantitative tests can be included
Sensitivity tests
Scenario tests
Reverse stress tests
Alternatives considered
Comparison with Standard Formula
Qualitative assessment adds value too
More importantly, One year SCR often not highlighted in the Board report
© Lloyd’s

131313
Common validation issues
Reverse stress tests: Inconsistency in the test definition and design
Challenges are:
Quantifying ORSA scenarios
Determining return period for the combined scenarios
Selection of the collar of simulations around expert’s return period
Uses are:
Validation of the final distribution
Consideration of all the underlying dependencies
© Lloyd’s

141414
Common issues - Dependency
Parameterisation
Correlation coefficient/drivers/dependency structure
Expert judgement unavoidable
Rationale should be explained clearly
Validation
Expert judgements are often justified, not validated
Purpose of different validation tests Sensitivity/stress tests…how bad can it get?
Scenario test…when will it fail?
Reverse stress test…how does all the dependency structures work together?
Alternative assumptions…should be modelled, explanation not enough
Joint exceedance probabilities…explain the outcome
Input v output correlation…consider dampening effect in output correlation matrix
Difficulty in applying dependencies where distributions sparse (e.g. RI credit risk defaults)
© Lloyd’s

151515
Common issues - Dependency
Possible alternatives
Aggregate data, model and compare…this may not necessarily pick up tail dependency
Backtest…group data for similar pairs to increase data points
Compare dependency at the tail and also the body of distribution
Explain association through clarification of drivers
Diversification benefits – are pre / post diversification contributions consistent with the intended dependency structure?
Example: Consider what parts (percentiles) of the stand-alone distributions contribute to the combined 99.5th (or other) percentile
May indicate where the key considerations for correlations are (i.e. is it in extreme tail or other parts of the distribution )
Clearly this might be affected by the way the dependency structure has been modelled
Consider what dependency you expect to see at different parts of the distribution to inform the decision on appropriate copula
Might be interesting to see how this changes if different copulas are used…
© Lloyd’s

161616
RI contract boundaries
© Lloyd’s
Q2 TPs
SCR
ECU
Previously
Contract boundaries
change
TPs increase, SCRs and ECU
reduction
Impact reversed by adding back the difference:
1.35SCR –Q2TPs
Adjusted position
This has been sufficiently discussed!

171717
Lloyd’s process
© Lloyd’s

181818
Lloyd’s review process
Analysis of Change
© Lloyd’s
EXAMPLE…

191919© Lloyd’s
2016 Sep 2016 Mar Significant movements between 2016 Sep and 2016 Mar
LCR edition 1 5 £ change % change
Exposure and Risk Margin
Premium 1 [Note 1] 75.9 85.7 -9.8 -11%Premium 2 [Note 2] 92.6 84.2 8.4 10%Reserves 1 [Note 3] 185.6 209.1 -23.5 -11%Reserves 2 [Note 4] 173.4 185.6 -12.2 -7%Premium 1 + 1/2 * Reserves 1 168.7 190.3 -21.6 -11%Premium 2 + 1/2 * Reserves 2 179.3 177.0 2.3 1%Risk margin (RM) 19.8 25.7 -5.9 -23%1:200 gross claims less 1:200 net claims [Note 5] 114.0 124.6 -10.6 -9%Available assets [Note 6] 278.4 303.8 -25.4 -8%
SCR
Mean -15.7 -12.5 -3.2 26% SCR (submitted) 62.4 58.9 3.5 6%Undiversified 75.1 74.3 0.8 1%Diversification credit (£) 12.7 15.4 -2.7 -18%Diversification credit (%) 16.9% 20.7% 0.0 -18%Loading [Note 7] 0.0 0.0 0.0SCR (agreed) 62.4 58.9 3.5 6%SCR (agreed) + RM 82.2 84.6 -2.4 -3%Mean vs. Premium 1 + 1/2 * Reserves 1 -9.3% -6.6% 42% Mean vs. exposure has increased by more than 5%SCR (agreed) + RM vs. Premium 1 + 1/2 * Reserves 1 48.7% 44.5% 10% 1:200 has increased by more than 5%SCR (agreed) + RM vs. Premium 2 + 1/2 * Reserves 2 45.8% 47.8% -4%
Insurance risk
Mean -11.2 -9.6 -1.6 17% The 1:200 has decreased but the mean profit has not1:200 48.8 57.3 -8.5 -15%1:200 undiversified 54.9 71.2 -16.3 -23%Diversification credit (£) 6.1 13.9 -7.8 -56%Diversification credit (%) 11.1% 19.5% -43% 1:200 + RM 68.6 83.0 -14.4 -17%Mean vs. Premium 1 + 1/2 * Reserves 1 -6.6% -5.0% 32% Mean vs. exposure has increased by more than 5%1:200 + RM vs. Premium 1 + 1/2 Reserves 1 40.7% 43.6% -7% 1:200 has decreased by more than 5%1:200 + RM vs. Premium 2 + 1/2 Reserves 2 38.3% 46.9% -18%
Premium risk
Mean -4.9 -6.3 1.4 -22%
1:200 48.2 32.9 15.3 47%
Mean vs. Premium 1 -6.5% -7.4% -12% Mean vs. exposure has decreased by more than 5%1:200 vs. Premium 1 63.5% 38.4% 65% 1:200 has increased by more than 5%1:200 vs. Premium 2 52.1% 39.1% 33%
Reserve risk
Mean -19.8 -25.7 5.9 -23% 1:200 24.4 19.5 4.9 25%1:200 + Risk margin 44.2 45.2 -1.0 -2%Mean vs. Reserves 1 -10.7% -12.3% -13% Mean vs. exposure has decreased by more than 5%1:200 vs. Reserves 1 13.1% 9.3% 41%1:200 + RM vs. Reserves 1 23.8% 21.6% 10% 1:200 has increased by more than 5%1:200 + RM vs. Reserves 2 25.5% 24.4% 5%
2016 Sep vs. 2016 Mar
A. EXPOSURE & RISK MARGIN
B. ULTIMATE RISK

202020
Mean 50th 75th 90th 95th 99.5th
A 50.0 29.0 Y 58% 39% 60% 75% 85% 92%
B 12.0 9.0 Y 75% 57% 65% 74% 79% 95%
C 1.4 0.9 N 63% 36% 78% 149% 227% 436%
D 77.0 56.0 N 73% 64% 75% 86% 93% 114%
E 4.0 1.0 Y 25% 26% 32% 45% 48% 55%
F 23.0 11.3 Y 49% 54% 66% 77% 85% 106%
G 2.9 1.6 Y 55% 65% 75% 78% 81% 85%
H 1.1 0.9 N 82% 72% 92% 113% 126% 165%
I 15.0 11.5 N 77% 87% 95% 120% 132% 177%
J 8.0 4.3 Y 54% 73% 83% 93% 100% 118%
K 9.9 7.3 Y 74% 78% 89% 102% 113% 189%
L 0.9 0.3 Y 28% 58% 68% 79% 88% 124%
All other
Total 205.2 133.1 65% 74% 88% 91% 99% 103%
Class Name Net PremiumMean Net
Claims
CAT
Exposed
ULRs including Catastrophe
Supplementary Questionnaire
© Lloyd’s

212121
Lloyd’s review process
Analysis of Change
Supplementary Questionnaire
Documentation
Validation report
Discussion with the agent
Challenges
Documentation – often incomplete
Sign posting – risk of missing out on key details
Documentation structure - pack doesn’t need to be updated annually, but details are still required
© Lloyd’s

222222
What happens in March & beyond?
© Lloyd’s

232323
Specific re-submissions in March
For a number of agents the CPG or SAG feedback was to require a resubmission in March
either a material point to resolve; or
agent proposed as work not complete
not every case was where a capital loading applied
we are currently working with agents on these
For everyone else MB Y5013 applies:
If circumstances change, leading to a material change in SBF and/or uSCR, by the end of February 2017, then a resubmission of relevant returns must be made
by 02 March 2017.
© Lloyd’s

242424
High level principles of the March reassessments
Highlights of SCR Re-assessments:
Resubmissions for material (greater than 10%) movements excluding FX/risk
in the SCR to ultimate. Also resubmit the revised one-year SCR
For any SAG related issues you may wish to make a resubmission – this is
fine but please contact us if planning on doing this
Resubmissions must be made at the year-end exchange rates (US$:GBP rate
was 1.24), see MB Y5053 for all currencies
LCRs should be re-submitted by 1pm, 2 March 2017
Where no resubmission is required and the current SCR is still valid, agents
should confirm this to Lloyd’s via QMC form 990
© Lloyd’s
Remember: We will adjust ECAs for year end exchange rates, movements in risk margins and RI CB changes for mid-year CiL

252525
Our mutual interest
Similar review process
Business as usual/live SII environment
Less time spent reviewing/addressing feedback
Fewer model changes or CPG loadings
Revised major model change process
Guidance amended to ensure an efficient process
Feedback from January workshop to be considered
No major changes in LCR submission planned
© Lloyd’s

262626
A way forward?
Deep dive reviews
To allow better understanding of agent model
Faster and more efficient review in September
More quantitative information on case-by-case basis
Syndicate capability oversight team to allow better engagement
No relaxation of regulatory requirement planned
BAU validation – 3 year plan for deep dive validation
Commerciality of the market will continue be the focus
Model drift
Lloyd’s Internal Model (LIM)
Syndicate specific information
LIM validation
© Lloyd’s

272727
Capital Results for 2017 YOA
© Lloyd’s

282828
Capital vs. exposure has increased
© Lloyd’s
2006 2007 2008 2009 2010 2011 2012 2013 2014 2015 2016 2017
Economic Capital Assessment vs Gross Premium
Notes:For Active Syndicates ONLYGP: Gross Written Premium net of Special Purpose Arrangement premium.ECA: Excludes the reserve margin credits allowed in 2010/2011/2012.2009 / 2015/ 2016 YOA: GGP & ECA is as at mid-year coming into line (CIL)
Year of Account
ECA as a Percentage of
GP

292929
…and CPG loadings have increased
© Lloyd’s
YoA YoA
281
218
255
282
219
119
92
143
0
50
100
150
200
250
300
2010 2011 2012 2013 2014 2015 2016 2017
£m Ultimate Loading
23
12
17
33
26
19
17
21
-
5
10
15
20
25
30
35
2010 2011 2012 2013 2014 2015 2016 2017
No. of Syndicates

303030
Drivers of the movements
Review process: revised SCRs based on feedback on
Soft market/lower profitability
FX rate
Vendor model updates
Exposure change/other:
Mostly RI contract boundary change and changes to plan or RI (FX excluded)
CPG loadings/ULR loading:
Operational risk loadings relating to risk management and non modelling issues
Premium and reserve risk issues
ULR difference with plan
Other (late plan changes, model validation, etc.)
© Lloyd’s

313131
Detailed results
© Lloyd’s
323232
Results for 2017 YOA: user beware
LCR risks vs. exposure: an update from last year
Based on November 2016 CiL and November 2017 CiL data
Keep in mind the caveats / limitations
this is a partial selection of metrics
the exposure measures are not optimal
gaps/jumps may occur near the percentiles shown
excludes new syndicates
means are volume weighted
© Lloyd’s

333333
Results for 2017 YOA: user beware
Remember:
distance from the market mean is not a validation test
Common theme for 2017 YoA vs. 2016 YoA:
means / lower percentiles mostly stable
upper percentiles have increased for most cases
© Lloyd’s

343434
Ultimate SCR vs. net premium
© Lloyd’s
Ult SCR: F309
Net PI: F313 table 1 col D row 1

353535
Ultimate SCR vs. exposure (net premium + ½ net reserves)
© Lloyd’s
Ult SCR: F309
Exposure: Net PI + 0.5*Net Reserves

363636
Premium risk vs. net premium
© Lloyd’s
Ult premium risk (pre diversification): F309
Net PI: F313 table 1 col D row 1

373737
Reserve risk + risk margin vs. reserves
© Lloyd’s
Reserve risk (pre Diversification) F309
Risk margin: F312 col P total
Net Reserves: F312 cols H+I-J Total less Proposed YOA
383838
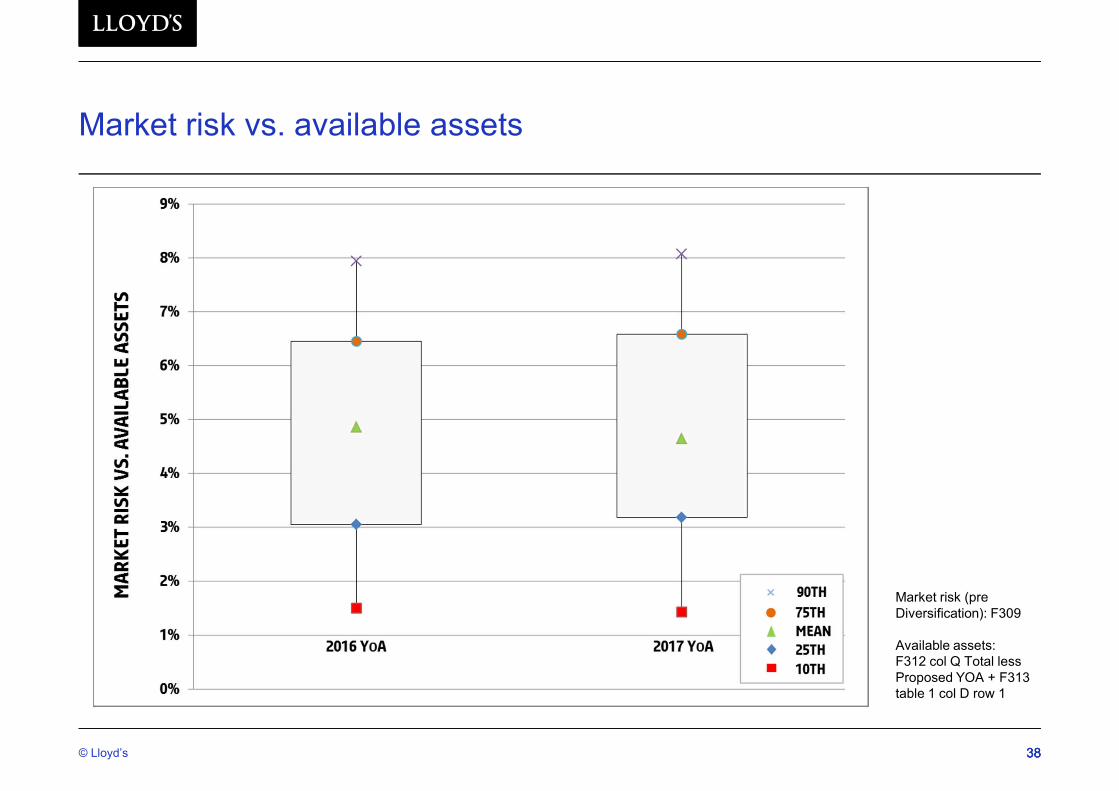
Market risk vs. available assets
© Lloyd’s
Market risk (pre Diversification): F309
Available assets: F312 col Q Total less Proposed YOA + F313 table 1 col D row 1

393939
RI credit risk vs. 1:200 recoveries
© Lloyd’s
RI credit risk (pre Diversification): F309
1:200 Recoveries (approximated): F311 table 1 col G row 4 less row 3

404040
Operational risk vs. net premium
© Lloyd’s
Operational risk (pre Diversification): F309
Net PI: F313 table 1 col D row 1

414141
SCR(1) vs. SCR(U) + RM
© Lloyd’s
Ult SCR and one year SCR: F309
Risk margin: F312 col P total

424242
0%
20%
40%
60%
80%
100%
120%
140%
On
e y
ea
r S
CR
/ (
Ult
ima
te S
CR
+ r
isk
ma
rgin
)
Syndicates
Market average
SCR(1) vs. SCR(U) + RM
© Lloyd’s
Expect morescrutiny here

434343
SCR(1) vs. SCR(U) + RM
© Lloyd’s
Note that the sample of syndicates for this graph is the submitted LCR, so excludes any syndicates based on the Lloyd’s syndicate benchmark model.
0%
20%
40%
60%
80%
100%
120%
140%
On
e y
ea
r S
CR
/ (
Ult
ima
te S
CR
+ r
isk
ma
rgin
)
Syndicates
Market average
2017 YoA
2016 YoA

444444
One year emergence
Greater scrutiny continued in 2016
CPG loadings: £178m one year vs. £143m ultimate (approx)
RI contract boundaries did not impact one year SCR
PRA continues to give close scrutiny
Lloyd’s approach on emergence patterns:
Mechanical approaches (high or low) not advisable
Provide justification if <70% or >90%
This is a challenging area…and an important one
© Lloyd’s

454545
Questions
© Lloyd’s

464646
This information is not intended for distribution to, or use by, any person or entity in any jurisdiction or country where such distribution or use would be contrary to local law or regulation. It is the responsibility of any person publishing or communicating the contents of this document or communication, or any part thereof, to ensure compliance with all applicable legal and regulatory requirements.
The content of this presentation does not represent a prospectus or invitation in connection with any solicitation of capital. Nor does it constitute an offer to sell securities or insurance, a solicitation or an offer to buy securities or insurance, or a distribution of securities in the United States or to a U.S. person, or in any other jurisdiction where it is contrary to local law. Such persons should inform themselves about and observe any applicable legal requirement.
© Lloyd’s
