synchronization of multi-user event media (sem) at mediaeval 2014: task description, datasets, and...
TRANSCRIPT

SYNCRHONIZATION OF MULTI-USER EVENT MEDIA (SEM) Nicola Conci (Univ. of Trento)
Vasileios Mezaris (ITI – CERTH)
Francesco G.B. De Natale (Univ. of Trento)

Motivation
Content creation is a collective experience

Motivation• People collect and share dozens of media through social
networks, cloud services, Internet• Having access to all this data, users can create their own
version of the event:• Summaries• Stories• Personalized albums• Photobooks

But…• … such a large amount of data is largely unstructured and
heterogeneous• Subject to high variability in terms of:
• Naming• Archiving strategy• Timestamp of acquisition

Organize the available data• Need to arrange and present contents in an efficient way
• Need to cope with the differences in terms of location and time of acquisition
• Information may be wrong, non unique, or missing

The synchronization task• Assuming a multi-users scenario (10+), each collecting a
certain number of pictures, the goal is to align them along a common timeline (sync)
• Detect the significant sub-events in the entire gallery (clustering)
Given N image collections (galleries) taken by different users/devices at the same event, find the best (relative)
time alignment among them and detect the significant sub-events over the whole gallery

Datasets• We have provided 2 different datasets, related to:
• London Olympics 2012 • Vancouver Winter Olympics 2010• Soon available at http://mmlab.disi.unitn.it/MediaEvalSEM2014/
n. pictures n. galleries n. events
Vancouver 2010 1351 35 89
London 2012 2124 37 238

Metrics for evaluation• For the synchronization the goal is to maximize the number of
galleries, for which the synchronization error is below a predefined threshold with respect to a reference gallery
• For clustering we use three metrics:
• Rand Index
• Jaccard Index
• F1

Team scores (London)
Team Precision Accuracy
ITI-CERTH 0,6389 0,7299
ATU 0,4722 0,8746
MMLAB-IU 0,25 0,8914
JRS 0,1667 0,9444
ITI-CERTH ATU JRS MMLAB-IU
RI 0,9910 0,9842 0,9775 0,9852
JI 0,5614 0,3540 0,1538 0,1287
F1 0,3596 0,2614 0,1333 0,1140
Synchronization
Clustering

Team scores (Vancouver)
Team Precision Accuracy
ATU 0,9412 0,7919
ITI-CERTH 0,9118 0,7375
MMLAB-IU 0,3529 0,8582
JRS 0,0588 0,65
ITI-CERTH ATU JRS MMLAB-IU
RI 0,9656 0,9787 0,9633 0,9749
JI 0,2861 0,1126 0,1869 0,1673
F1 0,2225 0,1012 0,1574 0,1433
Synchronization
ClusteringBest RI
Best JI
Best F1

Conclusions and Future Task!• Brave new task 4 teams submitted their runs• Very good results obtained especially in synchronization
• Next steps include:• Extend dataset with additional media (video, audio)• Focus on different types of (less structured) events
• Comments and suggestions?

SEM beyond MediaEval 2014• We would like to have SEM as part of MediaEval 2015!
• We will continue to have project support• Don’t expect to change the main idea of SEM
• Realistic challenges, no extensive training data; development dataset & ground truth available (including this year’s dev. and train. datasets)
• May further evolve its exact definition and objectives• Datasets: further increase in size, diversity. Include videos, audio?• Runs: define more than one required runs? (e.g. one using only, or not using at
all, visual similarity?)• Runs: have two-phase submission process? (first synchronization, then clustering)
– this would allow to try also clustering on GT-synchronization data• Runs: introduce summarization as a third objective? How to evaluate?• Results: ask participants to report processing times? Evaluate them?

Backup
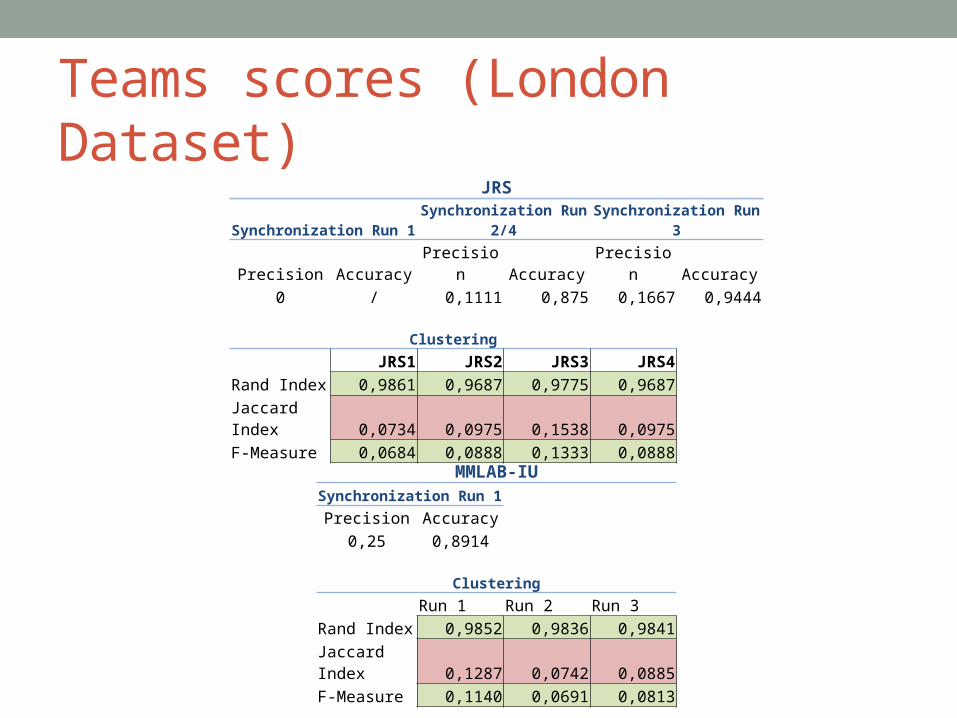
Teams scores (London Dataset)JRS
Synchronization Run 1 Synchronization Run 2/4 Synchronization Run 3Precision Accuracy Precision Accuracy Precision Accuracy
0 / 0,1111 0,875 0,1667 0,9444
ClusteringJRS1 JRS2 JRS3 JRS4
Rand Index 0,9861 0,9687 0,9775 0,9687Jaccard Index 0,0734 0,0975 0,1538 0,0975F-Measure 0,0684 0,0888 0,1333 0,0888
MMLAB-IUSynchronization Run 1
Precision Accuracy0,25 0,8914
ClusteringRun 1 Run 2 Run 3
Rand Index 0,9852 0,9836 0,9841Jaccard Index 0,1287 0,0742 0,0885F-Measure 0,1140 0,0691 0,0813
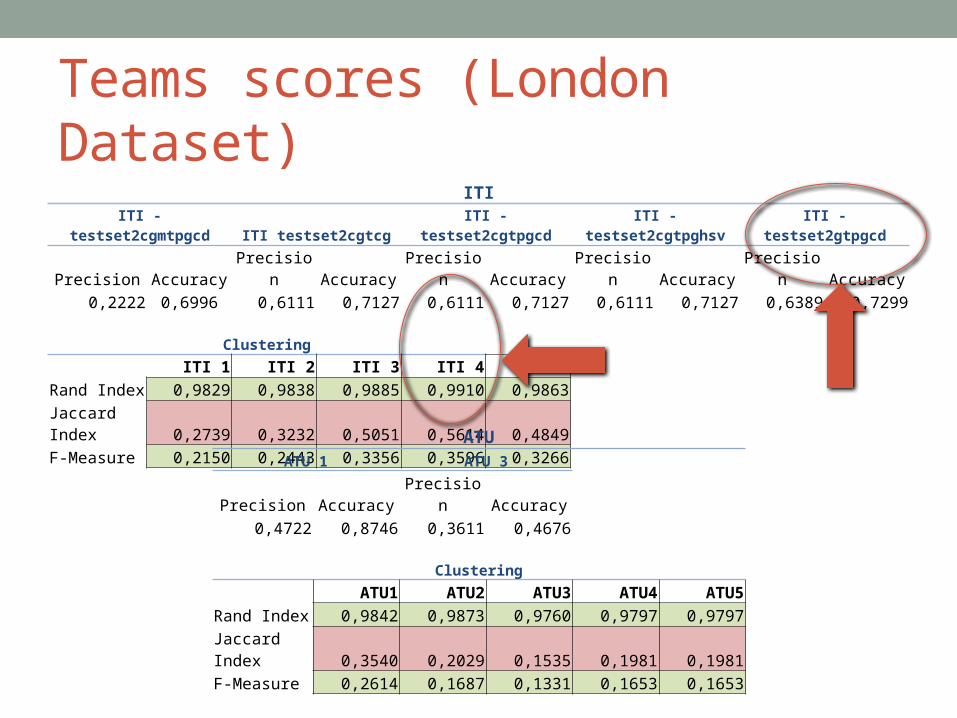
Teams scores (London Dataset)ITI
ITI - testset2cgmtpgcd ITI testset2cgtcg ITI - testset2cgtpgcd ITI - testset2cgtpghsv ITI - testset2gtpgcdPrecision Accuracy Precision Accuracy Precision Accuracy Precision Accuracy Precision Accuracy
0,2222 0,6996 0,6111 0,7127 0,6111 0,7127 0,6111 0,7127 0,6389 0,7299
ClusteringITI 1 ITI 2 ITI 3 ITI 4 ITI 5
Rand Index 0,9829 0,9838 0,9885 0,9910 0,9863Jaccard Index 0,2739 0,3232 0,5051 0,5614 0,4849F-Measure 0,2150 0,2443 0,3356 0,3596 0,3266
ATUATU 1 ATU 3
Precision Accuracy Precision Accuracy0,4722 0,8746 0,3611 0,4676
ClusteringATU1 ATU2 ATU3 ATU4 ATU5
Rand Index 0,9842 0,9873 0,9760 0,9797 0,9797Jaccard Index 0,3540 0,2029 0,1535 0,1981 0,1981F-Measure 0,2614 0,1687 0,1331 0,1653 0,1653
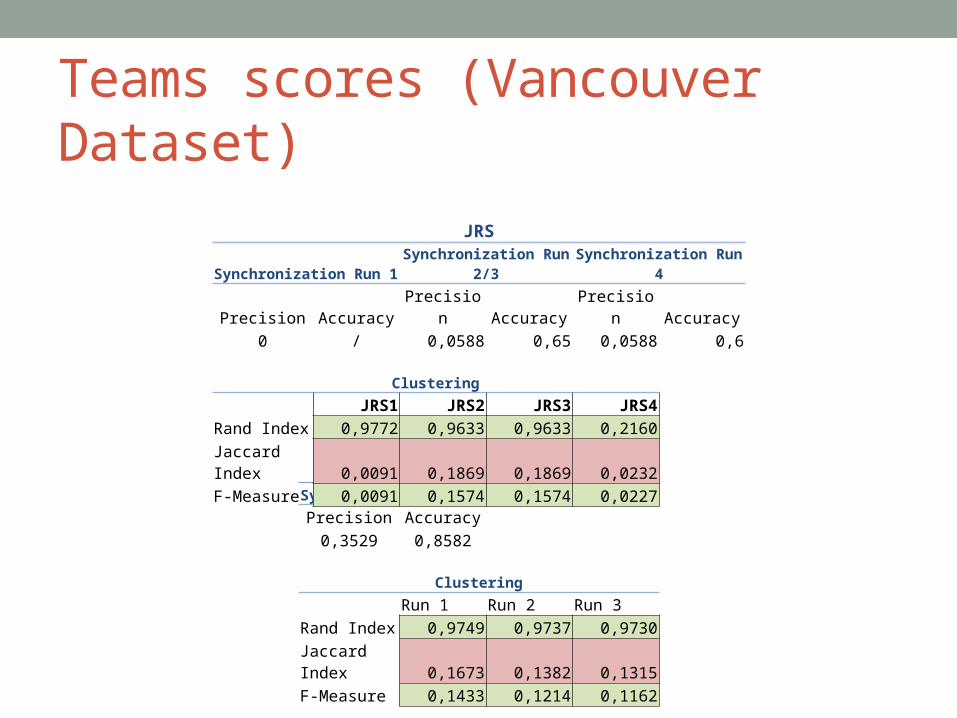
Teams scores (Vancouver Dataset)
MMLAB-IUSynchronization Run 1
Precision Accuracy0,3529 0,8582
ClusteringRun 1 Run 2 Run 3
Rand Index 0,9749 0,9737 0,9730Jaccard Index 0,1673 0,1382 0,1315F-Measure 0,1433 0,1214 0,1162
JRSSynchronization Run 1 Synchronization Run 2/3 Synchronization Run 4
Precision Accuracy Precision Accuracy Precision Accuracy0 / 0,0588 0,65 0,0588 0,6
ClusteringJRS1 JRS2 JRS3 JRS4
Rand Index 0,9772 0,9633 0,9633 0,2160Jaccard Index 0,0091 0,1869 0,1869 0,0232F-Measure 0,0091 0,1574 0,1574 0,0227

Teams scores (Vancouver Dataset)
ATUATU 1 ATU 3
Precision Accuracy Precision Accuracy0,9412 0,7919 0,5882 0,5701
ClusteringATU1 ATU2 ATU3 ATU4 ATU5
Rand Index 0,9787 0,9782 0,9610 0,9687 0,9727Jaccard Index 0,1126 0,0532 0,1220 0,0977 0,1210F-Measure 0,1012 0,0505 0,1087 0,0890 0,1079
ITIITI - testset2cgmtpgcd ITI testset2cgtcg ITI - testset2cgtpgcd ITI - testset2cgtpghsv ITI - testset2gtpgcd
Precision Accuracy Precision Accuracy Precision Accuracy Precision Accuracy Precision Accuracy0,5294 0,7014 0,9118 0,7375 0,9118 0,7375 0,9118 0,7375 0,9118 0,7279
ClusteringITI 1 ITI 2 ITI 3 ITI 4 ITI 5
Rand Index 0,9601 0,9526 0,9770 0,9734 0,9656Jaccard Index 0,1782 0,2856 0,2581 0,2315 0,2861F-Measure 0,1512 0,2222 0,2052 0,1880 0,2225
Best F1
Best JI
Best RI