symbol addition by monkeys normalized quantity coding pnas.201404208
TRANSCRIPT

PNAS proofEmbargoed
until 3PM ET Monday publication weekof
Symbol addition by monkeys provides evidence fornormalized quantity codingMargaret S. Livingstonea,1, Warren W. Pettinea,2, Krishna Srihasama, Brandon Moorea,3, Istvan A. Moroczb,and Daeyeol Leec
aDepartment of Neurobiology, Harvard Medical School, Boston, MA 02115; bDepartment of Radiology, Brigham and Women’s Hospital, Harvard MedicalSchool, Boston, MA 02116; and cDepartment of Neurobiology, Yale University School of Medicine, New Haven, CT 06510
Edited* by Jon H. Kaas, Vanderbilt University, Nashville, TN, and approved March 28, 2014 (received for review March 4, 2014)
Weber’s law can be explained either by a compressive scaling ofsensory response with stimulus magnitude or by a proportionalscaling of response variability. These two mechanisms can be dis-tinguished by asking how quantities are added or subtracted. Wetrained Rhesus monkeys to associate 26 distinct symbols with 0–25drops of reward, and then tested how they combine, or add, sym-bolically represented reward magnitude. We found that they couldcombine symbolically represented magnitudes, and they trans-ferred this ability to a novel symbol set, indicating that they wereperforming a calculation, not just memorizing the value of eachcombination. The way they combined pairs of symbols indicatedneither a linear nor a compressed scale, but rather a dynamicallyshifting, relative scaling.
macaque | normalization | number sense | value coding
Animals and humans can estimate the number of variousitems, and the precision of this approximate number sense
decreases with magnitude. For example, although it is easy torecognize the difference between 2 and 4 items, it is more dif-ficult to distinguish 22 from 24 items. This dependence of ac-curacy on magnitude is a property that the approximate numbersense shares with more basic sensory processes. Weber (1) ob-served that in general, across many sensory modalities, the justnoticeable difference between two stimuli is proportional to theirmagnitude. Fechner (2) proposed that Weber’s observationcould be explained if sensations were physiologically encoded asa logarithmic function of stimulus magnitude, but Stevens (3)argued instead that sensations obey a power law, with perceptualmagnitude being proportional to a power function of thestimulus magnitude, with the power usually less than 1. Botha logarithmic and a power-less-than-one relationship betweenstimulus and internal coding are compressive, with the samephysical difference between stimuli producing incrementallysmaller internal differences between successively larger pairs ofexternal stimuli. Any kind of compressive scaling would explaina decrease in discriminability with increasing magnitude if thenoise in the internal representation is constant.However, an alternative possibility is that variability in encoding
might increase with stimulus magnitude. In fact, the variability inthe firing rates of cortical neurons tends to increase with firing rate(4–6). Therefore, to the extent that a stimulus parameter isencoded by the rate of neural firing, an increase in perceptualvariability with stimulus magnitude may not require compressivescaling; it is also consistent with a linear neuronal representationwith magnitude-dependent variability (7–10).Neurons that are tuned to numerosity have been recorded in
monkey posterior parietal and lateral prefrontal cortex (11–13).The width and asymmetry of such tuning is consistent with acompressed scaling (14). However, neurons tuned to particularnumerosities, or numerosity ranges, represent a labeled-linecode and therefore are not, themselves, scaled to numerosity, inthe sense that either Fechner, or Stevens, meant when theyproposed a logarithmic, or power, scale for the sensory responseto a graded physical stimulus. What is explicit in Fechner’smodel, and implicit in models of tuned units, is a stage where
sensory response increases with stimulus magnitude. Indeed, neu-rons whose firing rate depends monotonically on the number ofitems in an array have been reported in macaque lateral intra-parietal area (LIP) (15), but the results do not distinguish betweena linear or a logarithmic coding.Stevens asserted that the only behavioral test that can distin-
guish linear from logarithmic sensory coding is how sensorymagnitudes are added or subtracted (16). Specifically, he pointedout that addition and subtraction can be performed accuratelyonly on linear representations, whereas a compressive repre-sentation allows only multiplication and division. If magnitudesare combined at a stage of labeled line coding, as proposed byDehaene (17), the way magnitudes are combined would notnecessarily reflect scaling. However, if magnitudes are combinedat a stage where they actually are coded according to a linear orlogarithmic scale, then the scale can be distinguished by exam-ining how magnitudes are added or subtracted. If the underlyingscale is logarithmic, or otherwise compressed, the combinationof two magnitudes should be superadditive (expansive). For ex-ample, in a compressed scale, the internal representation of “3”will be more than half the internal representation of “6,” socombining two 3s should correspond to more than 6.Studies in which rats, mice, or pigeons must estimate the time
remaining (10, 18) or the number of pecks remaining (9) findthat these animals show linear subtraction behavior, consistentwith a linear internal scale. However, the concern has beenraised that these animals simply learned the correct response forevery possible condition (17). Here we ask how monkeys com-bine pairs of symbols or pairs of dot arrays representing a largerange of quantities, from 0 to 25, a range large enough thatmemorization of all possible pairwise combinations should beprohibitively difficult. Cantlon and Brannon (19) previouslyshowed that monkeys can sum sequentially presented dot arrays,and one chimpanzee has demonstrated the ability to sum Arabicnumerals up to a total of 4 (20), but the nature of the internalrepresentation was not explored in either of these studies.
Significance
Symbol-literate monkeys can be trained to combine, or add,pairs of large numbers. They transfer to a novel symbol set,ruling out memorization of each symbol pair. Their additionbehavior indicates an underlying relative scaling of magnitude.
Author contributions: M.S.L. and W.W.P. designed research; M.S.L. performed research;I.A.M. contributed new reagents/analytic tools; M.S.L., W.W.P., K.S., B.M., and D.L. ana-lyzed data; and M.S.L. and D.L. wrote the paper.
The authors declare no conflict of interest.
*This Direct Submission article had a prearranged editor.
Freely available online through the PNAS open access option.1To whom correspondence should be addressed. E-mail: [email protected].
2Present address: Colorado University School of Medicine, Aurora, CO 80045.3Present address: Vanderbilt Brain Institute, Nashville, TN 37235.
www.pnas.org/cgi/doi/10.1073/pnas.1404208111 PNAS Early Edition | 1 of 6
NEU
ROSC
IENCE

PNAS proofEmbargoed
until 3PM ET Monday publication weekof
Results and DiscussionTo determine how monkeys sum quantities, we taught symbol-literate monkeys (21) an addition task using dots and two distinctsymbol sets presented on a touchscreen in their home cage. Threeyoung adult male macaque monkeys had been trained extensively,as juveniles, using a pairwise choice task to associate 26 distinctsymbols or up to 25 dots in an array with reward values of 0–25drops of liquid (Fig. 1, Upper). In symbol set 1 Arabic numerals0–9 represented 0–9 drops, and the letters X Y W C H U T F KL N R M E A J represented 10–25 drops. Symbol set 2, whichwas learned after the monkeys had mastered addition usingsymbol set 1, was made by filling 4–5 squares in a 3 × 3 squarearray: 0–25 drops were represented by the symbols:
. The firstthree plots in Fig. 1 (Lower) show the monkeys’ choice behaviorin each pairwise comparison task. Although the monkeys wererewarded appropriately no matter which side they chose, aftertraining, in all three pairwise comparison tasks, they almost in-variably chose the larger option; they were highly accurate atdiscriminating the stimuli in the pairwise task, especially withsymbol set 1, with which they had had several years of experience(21, 22), and were less accurate for symbol set 2, with which theyhad had less experience.To investigate how the monkeys combined values, we gave
them an addition task, first using dots, then the well-learnedsymbol set 1. For the dots addition task, the monkeys werepresented with two vertically separated dot arrays each insidea circle on one side of the screen, comprising the “sum,” anda single dot array on the other side of the screen, the “singleton.”Whichever side of the screen he touched, the monkey wasrewarded with the number of drops of liquid corresponding to thevalue (sum or singleton) on that side. Although we made it as clearas possible, using discrete drops accompanied by discrete beeps,that each symbol represented a distinct number of drops, wecannot assume that the monkeys interpreted these symbols asrepresenting numerosity, rather than quantity or hedonic value.The last three plots in Fig. 1 (Lower) show the fraction of
times the monkeys chose the sum for each singleton–sum com-bination for the different tasks. The choice data show that themonkeys usually picked the larger of the two, sum or singleton,except when the sum and the singleton were close in value, when
their behavior approached chance. Fig. 2A shows that the aver-age percent-correct (larger) choices averaged over all threemonkeys were well above chance (50%) for each day of the dotsaddition task and the two symbol addition tasks.Our question is not, however, whether the monkeys can per-
form above chance on a difficult addition task, but how themonkeys combine quantities. To answer this, we first calculatedthe singleton-equivalent value of each sum magnitude (averagedover all addend combinations) by fitting a logistic function to thechoice ratios using maximum likelihood, as shown in Fig. 2D forthe data from the last month of symbol set 1 addition. The pointof subjective equality between each sum and all singletons withwhich it was paired was taken as the singleton-equivalent valueof each sum. Fig. 2E plots the singleton-equivalent values foreach sum magnitude for the last 30 d of the dots addition task(black), the first 10 d (red) and the last 30 d (blue) of symbol set1 addition, and the first 10 d of symbol set 2 addition (green).After learning the dots addition task the monkeys valued two setsof dots presented together as equivalent to the numerical sum ofthe two (Fig. 2E, black). When first presented with the symbolset 1 addition task the monkeys on average undervalued the sumof two symbols, compared with the singleton (Fig. 2E, red). In-deed, their behavior is roughly equivalent to the choice ratio ifthey just chose the largest value symbol on the screen, ignoringthe smaller value symbol entirely (dotted black line).We then calculated the contribution of the larger and the
smaller addends to the subjective value of the sum separately(Fig. 2 F and G). In the dots addition task, both addends con-tributed significantly to the value of the sum (P < 10−10), al-though the contribution of the smaller addend was less than thatof the larger addend (larger addend weight = 1.03; smaller ad-dend weight = 0.64). Thus, the monkeys combined the magnitudesof the two dot arrays on the sum side, but undervalued the smalleraddends relative to the larger ones. Although this shows that theycombined the two addend dot arrays to arrive at an approximatelycorrect sum, we cannot tell whether they first evaluated themagnitude of each addend array and then added them or whetherthey simply evaluated how many dots in total were on the sumside. On the other hand, they cannot evaluate the sum magnitudedirectly for the symbols.
Fig. 1. Tasks. (Upper) A monkey performing each of the six tasks. Dots comparison task: The monkey has chosen 11 dots rather than 4 dots and is receiving 11drops of reward through a stainless steel tube. Symbol set 1 comparison task: The monkey is about to touch the symbol 8 rather than 4. Symbol set 2comparison task: The monkey is touching the symbol (worth 21 drops) rather than the symbol (worth 3 drops). Dots addition task: The monkey ischoosing 8 dots rather than 6 plus 1 dots. Addition with symbol set 1: The monkey has chosen 3 plus 6 instead of 9 (the two choices give equivalent rewards).Addition with symbol set 2: The monkey is about to touch plus (worth 9 +1 3 = 22 drops) rather than (worth 19 drops). (Lower) Average choice matricesfor each task over a 2-mo period; number of trials indicated above each plot. For the comparison tasks the plot shows the average choice ratio for everypossible choice pair. The horizontal and vertical position of each square in the matrix indicates the two choices that were presented, and the color of eachsquare in the matrix indicates the percentage of trials when the monkey chose the vertical option over the horizontal. The choice matrices for the threeaddition tasks show the average behavior of the same three monkeys over the last 1-mo period on each task for every possible sum and singleton combi-nation. The vertical position of each square represents the value of the singleton option and the horizontal position represents the sum value; the color ofeach square indicates the percentage of trials when the monkey chose the sum over the singleton.
2 of 6 | www.pnas.org/cgi/doi/10.1073/pnas.1404208111 Livingstone et al.

PNAS proofEmbargoed
until 3PM ET Monday publication weekof
For the first 10 d of symbol set 1 addition (Fig. 2G, red), thesingleton-equivalent value of the smaller addend was close tozero. The logistic regression model yielded a small-addendweight of 0.10, which was smaller than the large addend weight(0.89) (Fig. 2F) but still significantly different from zero (P =0.003), indicating that when the monkeys were first presentedwith the addition task, they mostly chose the largest element onthe screen, and valued the smaller addend at only 1/10th of itsactual value. This is not surprising, because they had been ex-tensively trained on a paired comparison task with the samesymbols, in which the optimal strategy was to choose the larger ofthe two presented options. After 4 mo of training on the symbolset 1 addition task, however, their valuation of the sum of twosymbols (Fig. 2E, blue) increased, although not quite to the fullvalue of the sum of the two symbol magnitudes.Thus, the monkeys learned that two symbols on one side of the
screen together represent a larger reward than the previouslylearned value of either symbol alone. They could be performinga calculation; i.e., evaluating the sum as a combination of bothaddend values, or they could be performing a simpler operation,like valuing two symbols together as “somewhat larger” than thevalue of the larger symbol alone, or they could have learned thevalue of each 2-symbol combination (351 position-specific com-binations). To decide if, and, if so, how the monkeys werecombining the two addends, we calculated the singleton-equiv-alent value of the smaller and larger addends separately (Fig. 2 Fand G, blue circles). Their valuation of the smaller addend in-creased after 4 mo of training, such that for the fifth month ofsymbol set 1 addition the logistic regression model gave theweight of 0.34 (1.01) for the smaller (larger) addend, both ofwhich were significantly larger than zero.
This increase in valuation of the smaller addends supports ourconclusion that after 4 mo of daily exposure to symbol set 1addition, the monkeys learned that the value represented on thesum side was larger than the value represented by either of thetwo addend symbols alone. Their behavior at the end of the 5-moperiod could no longer be explained by a choose-the-largest-symbol strategy (because both the larger and the smaller addendcontributed significantly to the behavioral value of the sum), orby any strategy based only on the value of the larger addend,such as simply incrementing it by a fixed amount (because theirvaluation of the sum depended significantly on the magnitudes ofboth addends). Furthermore, as with the dots addition task, al-though their performance approximated addition, the monkeyssystematically undervalued the smaller of the two addends. Notethat symbols 1–12 can be either the larger or the smaller addend,and that the subjective value of these symbols differed strikingly,by a factor of 3, depending on whether they were presented asthe larger or the smaller of the two addends (compare Fig. 2 Fand G).It is still possible that the monkeys’ final improved perfor-
mance on symbol set 1 addition was achieved by learning thevalue of every possible addend–addend combination (351 differentposition-specific combinations), choosing on the basis of mem-orized value, rather than performing a calculation. To distinguishbetween memorization, however unlikely, and calculation, weasked whether the monkeys would perform addition with a sec-ond symbol set, reasoning that if they performed addition ona second symbol set without extensive training, then they couldnot be relying on memorized values of each addend–addendcombination, but rather had learned to combine the twoaddends—a calculation. The monkeys learned symbol set 2 usingthe original two-symbol comparison task for 3 1/2 mo, by the end
Fig. 2. Behavioral results. (A) Percent-correct (larger) choices each day for each task averaged over all three monkeys. (B) Percent-correct (larger) choices eachday for each task for each monkey (indicated by different line types) for all mandatory calculation combinations (when the sum is larger but neither addend islarger than the singleton). (C) Percent-correct (larger) choices ± SEM for the first six trials of each addend combination for the two symbol addition tasks foreach monkey for all mandatory calculation combinations. (D) Fit of a logistic function to the fraction of singleton choices as a function of singleton mag-nitude, for each sum value for symbol set 1 addition task, last 30 d; the 50% choice point is taken as the singleton-equivalent value of the sum. (E) Singleton-equivalent value (calculated as in D) of each sum magnitude for each task. Dotted black line indicates predicted singleton-equivalent sum value if themonkeys simply chose the largest item on the screen. (F) Singleton-equivalent value of only the larger of the two addends for each task. (G) Singleton-equivalent value of only the smaller of the two addends for each task. (H) Singleton-equivalent value of each addend calculated separately for every otheraddend magnitude with which it was paired, for symbol set 1 addition task, last month of data.
Livingstone et al. PNAS Early Edition | 3 of 6
NEU
ROSC
IENCE
PNAS proofEmbargoed
until 3PM ET Monday publication weekof
of which they chose the larger symbol 87% of the time, over allpossible symbol pair combinations (Fig. 1). The monkeys thenalternated for 1 mo between symbol set 1 addition and the two-symbol comparison task with symbol set 2. Finally, they werepresented with the addition task using symbol set 2.From the first day of testing with symbol set 2 addition, the
monkeys chose the larger side more often than they did duringthe early days of symbol set 1 addition (Fig. 2 A and B), and theirperformance reached a stable asymptote within 10 d, rather thanthe 50 d it took to reach asymptote for symbol set 1 addition.Their final accuracy in the symbol set 2 addition task was lowerthan that for symbol set 1 addition, presumably because they hadhad much less experience (in the comparison task) with thissymbol set. Nevertheless, the small addend valuation plot duringthe first 10 d on symbol set 2 addition (Fig. 2G, green) shows thatthe monkeys valued the smaller addends at 20% of their actualvalue. Similarly, the smaller addend weight estimated from thelogistic regression model during the first 10 d of symbol set 2addition was 0.2, and was significantly larger than zero (P <10−18). This indicates that the monkeys transferred the additiontask to a novel symbol set, even though they experienced each ofthe 351 possible position-dependent addend combinations onaverage less than twice per day.As a further test of whether the monkeys transferred the
ability to combine symbols, we define “mandatory calculation” asthose trials in which the sum is bigger than the singleton, but thesingleton is larger than both addends (i.e., “choose the largest”strategy always gives the incorrect answer). The daily percent-correct (larger) choices for mandatory calculation trials for thefirst 10 d of symbol set 2 addition were significantly higher than thefirst 10 d with symbol set 1 addition (χ2-test, P < 10−14); this wastrue for each monkey individually (Fig. 2B) whether calculated forthe first 10 d (χ2-test, P < 10−7) or the first 200 or 500 mandatorytrials (χ2-test, P < 10−7). To still further ascertain whether thisbehavior represents true transfer, we looked at their behavior asa function of trial number for each of the possible 132 differentaddend–addend combinations for all mandatory calculation con-ditions for the two symbol sets. Fig. 2C confirms the transfer ofaddition behavior, in that the average percent correct over allpossible addend–addend combinations was larger for symbol set 2than for symbol set 1 for the first through the sixth time eachaddend–addend combination was presented for each monkeyindividually.We conclude from the results so far that the monkeys learned to
combine pairs of symbols in such a way that the combination wasvalued at more than the magnitude of either individual addend,but less than the numerical sum of the two symbols. Because themonkeys transferred the task to a novel symbol set, we concludethat they did not simply memorize the value of every possible pairof symbols, but rather performed some kind of calculation. Be-cause both the large and the small addends contributed signifi-cantly to the singleton-equivalent value of the sum, we concludethat the calculation was not simply “choose the largest,” or “valuethe larger addend at some fixed increment or fraction of itsmagnitude,” but rather to combine the two addends. Therefore,we sought to characterize the nature of internal representationused for the calculation by using a maximum likelihood method tofind for various models of how the monkeys might represent thesum values the Bayesian information criterion (BIC). For thispurpose, the data from the last 30 d of symbol set 1 addition wereused because that is the data set where the monkeys were mostclearly performing addition.In the linear model, the sum of the two addends was compared
with the value of the singleton. In the logarithmic model, which isbased on Fechner’s original proposal (2) that sensory magnitudesare represented internally by the log of the stimulus magnitude,the internal representation of each addend or singleton magni-tude is given by the log of the magnitude +1 (to avoid taking thelog of 0). The square root model is another proposed com-pressed scale that can account for Weber’s law (14, 16). In thismodel, the internal representation is simply the square root of
the stimulus magnitude. We also tested a max model, in whichthe monkeys simply choose the largest option on the screen. Forall these models, the only free parameter in the model is theslope of the probit psychometric function fit to the choice prob-ability for each addend–addend–singleton combination (Experi-mental Procedures). To test whether the best-fitting scale is indeedcompressive, we compared the two compressed scales (log andsquare root) to both a linear model and a power model. For thepower model, a best-fitting value for the exponent that is less(greater) than 1 indicates that the internal representation is com-pressive (expansive). Accordingly, the free parameters of the powermodel were the exponent and the slope of the probit function.The predicted internal representation for each addend or
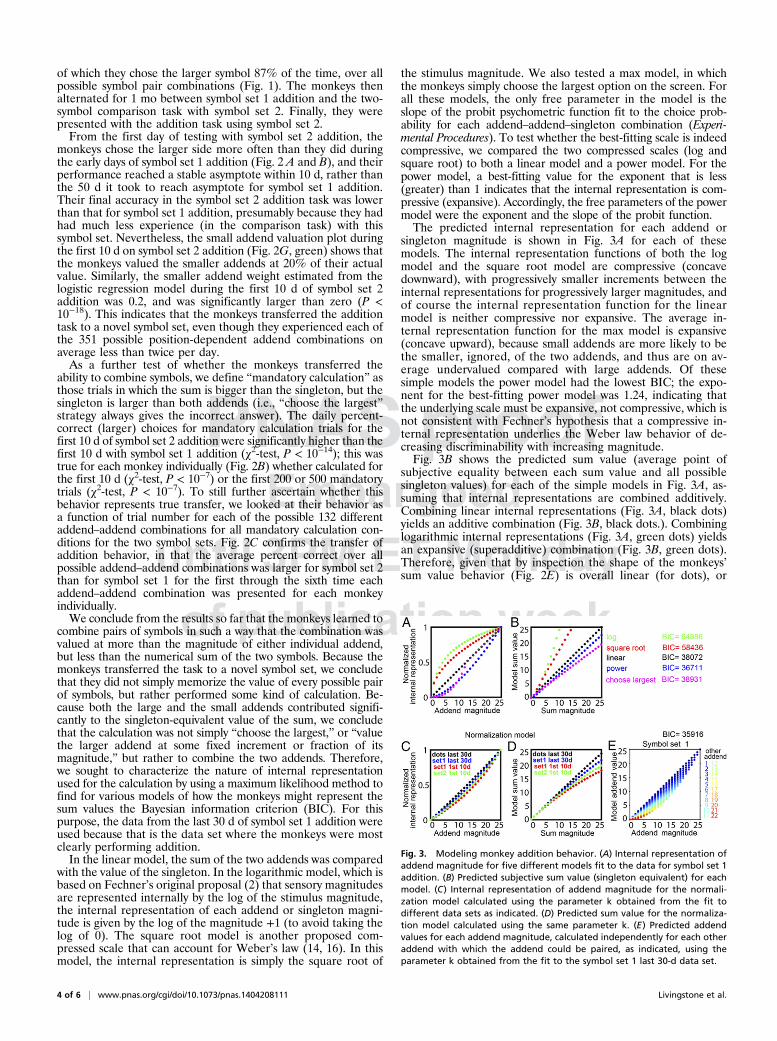
singleton magnitude is shown in Fig. 3A for each of thesemodels. The internal representation functions of both the logmodel and the square root model are compressive (concavedownward), with progressively smaller increments between theinternal representations for progressively larger magnitudes, andof course the internal representation function for the linearmodel is neither compressive nor expansive. The average in-ternal representation function for the max model is expansive(concave upward), because small addends are more likely to bethe smaller, ignored, of the two addends, and thus are on av-erage undervalued compared with large addends. Of thesesimple models the power model had the lowest BIC; the expo-nent for the best-fitting power model was 1.24, indicating thatthe underlying scale must be expansive, not compressive, which isnot consistent with Fechner’s hypothesis that a compressive in-ternal representation underlies the Weber law behavior of de-creasing discriminability with increasing magnitude.Fig. 3B shows the predicted sum value (average point of
subjective equality between each sum value and all possiblesingleton values) for each of the simple models in Fig. 3A, as-suming that internal representations are combined additively.Combining linear internal representations (Fig. 3A, black dots)yields an additive combination (Fig. 3B, black dots.). Combininglogarithmic internal representations (Fig. 3A, green dots) yieldsan expansive (superadditive) combination (Fig. 3B, green dots).Therefore, given that by inspection the shape of the monkeys’sum value behavior (Fig. 2E) is overall linear (for dots), or
Fig. 3. Modeling monkey addition behavior. (A) Internal representation ofaddend magnitude for five different models fit to the data for symbol set 1addition. (B) Predicted subjective sum value (singleton equivalent) for eachmodel. (C) Internal representation of addend magnitude for the normali-zation model calculated using the parameter k obtained from the fit todifferent data sets as indicated. (D) Predicted sum value for the normaliza-tion model calculated using the same parameter k. (E) Predicted addendvalues for each addend magnitude, calculated independently for each otheraddend with which the addend could be paired, as indicated, using theparameter k obtained from the fit to the symbol set 1 last 30-d data set.
4 of 6 | www.pnas.org/cgi/doi/10.1073/pnas.1404208111 Livingstone et al.

PNAS proofEmbargoed
until 3PM ET Monday publication weekof
slightly concave downward (for symbol set 1 addition), we con-clude that the underlying internal representation of dots must beapproximately linear, and for symbols must be slightly expansive,not compressive, consistent with the best-fitting exponent for thepower model being greater than 1. One could argue that by re-warding the sum as the linear addition of the two addends, wetaught the monkeys to do linear addition, rather than teachingthem that the combination of two symbols should be super-additive. Because their initial behavior on the symbol additiontask, their persistent behavior over time on the symbol additiontask, and their initial behavior on a second symbol set additiontask all showed subadditive valuation of the sum, we are inclinedto think that superadditive combining would not be expectedeven if it were rewarded as such.Although the monkeys’ valuation of the sums was a function of
both addends, they clearly did not perform accurate addition,because they systematically undervalued the smaller addends.This cannot be explained simply by always undervaluing thesymbols representing small rewards, because the same symbolcould show a subjective value close to its actual value when it wasthe larger of the two addends, but a subjective value that wasa fraction of its actual value when it was the smaller of the twoaddends. That is, the monkeys’ subjective valuation of eachsymbol was context dependent, as has been previously describedfor value coding in midbrain dopamine neurons (23), orbito-frontal cortex neurons (24, 25), LIP neurons (26), and for monkeybehavioral value choices (27). This suggests a relative valuation, ornormalization. Fig. 2H shows the singleton-equivalent value ofeach symbol set 1 addend (last 30 d) separately for every otheraddend it could be combined with to give a sum ≤ 25; this plotshows that the monkeys’ valuation of each addend is systematicallyreduced by the increasing magnitude of the other addend. Thismeans the monkeys are basing their valuation of each symbol onits relative value compared with the other symbol simultaneouslypresented on the same side, not its absolute value.To model a representation in which the value of an addend
depends on the magnitude of the other addend, we used nor-malization, for which biologically plausible mechanisms havebeen proposed (28). We first fit the symbol set 1 addition data(last 30 d) with a full normalization model in which the internalrepresentation of each quantity is weighted by a hyperbolicfunction of the p norm of the remaining two quantities (Experi-mental Procedures). The value of the power in the best-fittingmodel was large (>1011), suggesting that the normalization waseffectively accomplished by a maximum. Therefore, we useda simpler model in which each quantity was weighted by a hy-perbolic function of the maximum of the other two quantities.The most parsimonious model was obtained when the weight forthe singleton was set a priori to 1, resulting in a value of BIC =35,916, which is smaller than any of the models without nor-malization (Fig. 3B). Fig. 3C shows the calculated internal rep-resentation for each addend using the parameter k obtained byfitting this model to each data set as indicated, and Fig. 3D showsthe calculated sum value. Fig. 3E shows that the predicted ad-dend values are reduced by increasing the other addend ina manner similar to the monkey behavior (compare Fig. 2H).Reference-dependent discriminability is a long-established
principle in psychophysics (1), economics (29), and neural coding(30, 31) that could be explained by compressive scaling (loga-rithmic or power-less-than-one). A century of psychophysics hasamassed evidence for a compressive relationship between manykinds of sensory stimuli and perceived sensation, but neuro-physiology has shown that although neuronal signaling might becompressed relative to stimulus magnitude, in general the com-pression of neuronal responsiveness is a dynamic process, in-volving mechanisms like adaptation, lateral inhibition, and gaincontrol (5, 32). A normalization process could account for theapparent compressed scaling observed in many behavioralstudies, as well as the ability to discriminate proportionately overa range of magnitudes (25, 28). In this study, we used additionbehavior to ask whether the relative sensitivity, the scaling of just
noticeable difference with magnitude, of symbolically representedreward is better explained by a logarithmic, or other compressiveinternal scale, compared with scalar variability. Instead we founda dynamically shifting, relative scaling. Our result brings thecoding of symbolically represented magnitude into agreementwith direct measurements of neuronal coding of value.
Experimental ProceduresTouch-Screen Task. The three monkeys were housed in one quad cage witha computer-driven touch screen (Elo TouchSystems) mounted in one quad-rant. Software for stimulus presentation, reward delivery, data collection,and data analysis was written in MATLAB (MathWorks). Each monkey spent2–4 h per day alone, with food, in the training cage, 7 d per week. They wereallowed to work to satiety each day, usually performing >500 trials per day.During training/testing the monkey was presented with two options on thetwo sides of the touch screen; the monkey touched the screen and wasrewarded with a number of liquid drops corresponding to the magnituderepresented on whichever side of the screen he touched. The liquid wasdelivered via a stainless steel tube mounted in front of the screen. To makethe numerosity of each symbol-associated reward as clear as possible, theliquid was dispensed in discrete drops at 4 Hz by the opening of a computer-driven solenoid, and each drop was accompanied by a beep.Dots comparison task. Two sets of dots were presented on either side of thescreen; each set of dots was enclosed in a 9-cm-diameter circle. The dots wereplaced at random positions within the circle, and they were of random sizeand color. When two dots overlapped, the smaller dot always occluded thelarger, not vice versa, and the two were constrained to be different colors.Symbol comparison task. We used two distinct symbol sets of 26 symbols each,5 cm in height, each set representing 0–25 drops In symbol set 1 Arabic numerals0–9 represented 0–9 drops, and the letters X Y W C H U T F K L N R M E A Jrepresented 10–25 drops. Symbol set 2 was generated by filling 4–5 squaresin a 3 × 3 square array: 0–25 drops were represented by the symbols
.For a given symbol set, two symbols were presented simultaneously on ei-ther side of the touch screen, and the monkey was rewarded with thenumber of drops corresponding to the symbol value on whichever side ofthe screen the monkey first touched. Except for the symbols representingzero, the monkey would be rewarded no matter which side he touched, butthe monkeys much more often chose the larger of the two options.
Addition Task. Two values between 0 and 25 were chosen by a randomnumber generator; the side that would represent the singleton was chosenrandomly, and for the other side, two addends were chosen randomly fromall possible combinations that could represent the sum.Dots addition task. The monkeys were presented with one set of dots on oneside of the screen (the singleton) and two sets of dots on the other side (thesum, made up of two “addends”).Symbol addition task. The monkeys were presented with two symbols on oneside of the screen (the sum side) and one symbol on the other side (thesingleton). In the symbol addition task, the two addend symbols on the sumsidewere always contained within a single oval, to encourage themonkeys torecognize the two-symbol combination as a single choice option. Themonkeys first learned the dots comparison task, then symbol set 1 comparisontask, then dots addition, then symbol set 1 addition, followed by symbol set 2comparison, and lastly symbol set 2 addition.
Analysis of Behavioral Data. Although the monkeys were rewarded no matterwhich side of the screen they touched (except for value zero), they usuallychose the larger side; we therefore will refer to larger choices as “correct.”We also calculated percent correct for the situations we defined as “man-datory calculation” conditions, for those conditions when the sum was largerthan the singleton, but neither addend was larger than the singleton.
To find the subjective value (singleton-equivalent value) of each addend–addend sum (averaged over all addend combinations) we fit a logistic psy-chometric function (with a lapse rate, gamma) to the choice ratios; theparameters (slope, mu, and gamma) were estimated using maximum likeli-hood, as shown in Fig. 2D. The point of subjective equality between eachsum and all singletons with which it was paired was taken as the singleton-equivalent value of each sum.
To quantify the contribution of the small and large addends to the sumvalue, for each addend magnitude individually, we fit a logistic function to thedifference between the singleton and the other addendmagnitude.We also fitthe following logistic regression model to the probability of choosing thesingleton, p(single). Logit p(single) = a0 + a1 Xsingle + a2 Xsmall + a3 Xlarge, where
Livingstone et al. PNAS Early Edition | 5 of 6
NEU
ROSC
IENCE
PNAS proofEmbargoed
until 3PM ET Monday publication weekof
Xsingle, Xsmall, and Xlarge denote the magnitude of the singleton, smaller ad-dend, and larger addend, respectively, and a0–a3 the corresponding regressioncoefficients. From this model, the relative contribution of small and largeaddend in the unit of singleton (referred to as small and large addendweights) can be estimated as −a2/a1 and −a3/a1, respectively.
Modeling Choice Behavior. To identify the nature of the internal represen-tation most consistent with the observed addition behaviors, we calculatedthe BIC for a probit psychometric function combined with several possiblefunctions. Representing the singleton, small addend, large addend as Xsingle,Xsmall, and Xlarge, respectively, and the internal representations of singletonand sum as Ysingle and Ysum, respectively, we first considered the followingfive simple models for the monkeys’ internal representation of presentedaddend and singleton magnitudes:Log model:
Ysingle = ln�Xsingle + 1
� vs: Ysum = lnðXsmall + 1Þ+ ln
�Xlarge +1
�,
Square root model:
Ysingle =X1=2single vs: Ysum =X1=2
small +X1=2large,
Linear model:
Ysingle =Xsingle vs: Ysum = Xsmall +Xlarge,
Power model:
Ysingle =Xαsingle vs: Ysum =Xα
small +Xαlarge,
Max model:
Ysingle =Xsingle vs: Ysum =max�Xsmall,Xlarge
�:
For each of these models, the probability of choosing the singleton was givenby the normal cumulative distribution function, i.e., p(singleton) = normcdf{β(Ysingle−Ysum)}. All model parameters were estimated using the fminsearchfunction in MATLAB (MathWorks Inc.).
We also tested several different normalization models in which the internalrepresentation of each quantity was normalized by a function of the two otherquantities. We used the p norm to investigate systematically how this nor-malization process was influenced by the two other quantities. In other words,
Ysingle = kS·Xsingle, & Ysum ≡Ysmall +Ylarge = k1·Xsmall + k2·Xlarge,
where ksingle, k1, and k2 are given by the hyperbolic function of the p norm
of the other two magnitudes, namely, kS = 1=�1+ k
�Xzsmall +Xz
large
�1=z�, k1 =
1=�1+ k
�Xzsingle +Xz
large
�1=z�, k2 = 1=
�1+ k
�Xzsingle +Xz
small
�1=z�: Therefore, the
free parameters of this full normalization model were k and z in addition tothe slope parameter β in the probit function. The BIC for this model was35,971, but it gave a large value of z (>1011), indicating that the p normeffectively performed a max operation. We therefore fit a simpler model inwhich normalization is accomplished by the maximum of the remainingmagnitude, to the same data. Namely,
kS = 1��
1+ k·max�Xsingle, Xlarge
��, k1 = 1
��1+ k·max
�Xsingle, Xlarge
��,
k2 = 1��
1+ k·max�Xsingle, Xsmall
��:
The best fit for this model gave a BIC = 35,961, a better fit, with onefewer parameter.
We found an even better fit using a simpler model in which only theaddends are normalized by each other’s magnitude, namely, by setting kS = 1(i.e., Ysingle = Xsingle). This model gave a BIC = 35,916.
ACKNOWLEDGMENTS. This work was supported by National Institutes ofHealth Grants EY16187 and DA029330.
1. Weber EH (1834) De Pulsu, Resorptione, Auditu et Tactu Annotationes Anatomicae etPhysiologicae (CF Koehler, Leipzig, Germany).
2. Fechner GT (1860) Elemente der Psychophysik (Breitkopf und Hèartel, Leipzig, Germany).3. Stevens SS (1961) To honor Fechner and repeal his law: A power function, not a log
function, describes the operating characteristic of a sensory system. Science 133(3446):80–86.
4. Dean AF (1981) The variability of discharge of simple cells in the cat striate cortex. ExpBrain Res 44(4):437–440.
5. Barlow HB (1965) Optic nerve impulses and Weber’s law. Cold Spring Harb SympQuant Biol 30:539–546.
6. Lee D, Port NL, Kruse W, Georgopoulos AP (1998) Variability and correlated noise inthe discharge of neurons in motor and parietal areas of the primate cortex. J Neurosci18(3):1161–1170.
7. Cantlon JF, Cordes S, Libertus ME, Brannon EM (2009) Comment on “Log or linear?Distinct intuitions of the number scale in Western and Amazonian indigene cultures”.Science 323(5910):38, author reply 38.
8. Whalen J, Gallistel C, Gelman R (1999) Nonverbal counting in humans: The psycho-physics of number representation. Psychol Sci 10(2):130–137.
9. Brannon EM, Wusthoff CJ, Gallistel CR, Gibbon J (2001) Numerical subtraction in thepigeon: Evidence for a linear subjective number scale. Psychol Sci 12(3):238–243.
10. Gibbon J (1977) Scalar expectancy theory and Weber’s law in animal timing. PsycholRev 84:279–325.
11. Nieder A, Diester I, Tudusciuc O (2006) Temporal and spatial enumeration processes inthe primate parietal cortex. Science 313(5792):1431–1435.
12. Nieder A, Freedman DJ, Miller EK (2002) Representation of the quantity of visualitems in the primate prefrontal cortex. Science 297(5587):1708–1711.
13. Nieder A, Miller EK (2004) A parieto-frontal network for visual numerical informationin the monkey. Proc Natl Acad Sci USA 101(19):7457–7462.
14. Nieder A, Miller EK (2003) Coding of cognitive magnitude: Compressed scaling ofnumerical information in the primate prefrontal cortex. Neuron 37(1):149–157.
15. Roitman JD, Brannon EM, Platt ML (2007) Monotonic coding of numerosity in macaquelateral intraparietal area. PLoS Biol 5(8):e208.
16. Stevens SS (1961) The psychophysics of sensory function. Sensory Communication, edRosenblith WA (MIT Press, Cambridge, MA).
17. Dehaene S (2001) Subtracting pigeons: Logarithmic or linear? Psychol Sci 12(3):244–246, discussion 247.
18. Cordes S, King AP, Gallistel CR (2007) Time left in the mouse. Behav Processes 74(2):142–151.
19. Cantlon JF, Brannon EM (2007) Basic math in monkeys and college students. PLoS Biol5(12):e328.
20. Boysen ST, Berntson GG (1989) Numerical competence in a chimpanzee (Pan troglo-dytes). J Comp Psychol 103(1):23–31.
21. Livingstone MS, Srihasam K, Morocz IA (2010) The benefit of symbols: Monkeys showlinear, human-like, accuracy when using symbols to represent scalar value. Anim Cogn13(5):711–719.
22. Srihasam K, Mandeville JB, Morocz IA, Sullivan KJ, Livingstone MS (2012) Behavioraland anatomical consequences of early versus late symbol training in macaques.Neuron 73(3):608–619.
23. Tobler PN, Fiorillo CD, Schultz W (2005) Adaptive coding of reward value by dopa-mine neurons. Science 307(5715):1642–1645.
24. Kobayashi S, Pinto de Carvalho O, Schultz W (2010) Adaptation of reward sensitivityin orbitofrontal neurons. J Neurosci 30(2):534–544.
25. Padoa-Schioppa C (2009) Range-adapting representation of economic value in theorbitofrontal cortex. J Neurosci 29(44):14004–14014.
26. Louie K, Grattan LE, Glimcher PW (2011) Reward value-based gain control: Divisivenormalization in parietal cortex. J Neurosci 31(29):10627–10639.
27. Louie K, KhawMW, Glimcher PW (2013) Normalization is a general neural mechanismfor context-dependent decision making. Proc Natl Acad Sci USA 110(15):6139–6144.
28. Carandini M, Heeger DJ (2012) Normalization as a canonical neural computation. NatRev Neurosci 13(1):51–62.
29. Kahneman D, Tversky A (1979) Prospect theory: An analysis of decision under risk.Econometrica 47(2):263–292.
30. Hartline HK, Wagner HG, MacNichol EF, Jr. (1952) The peripheral origin of nervousactivity in the visual system. Cold Spring Harb Symp Quant Biol 17:125–141.
31. Kuffler SW (1953) Discharge patterns and functional organization of mammalianretina. J Neurophysiol 16(1):37–68.
32. Uttal WR (1973) The Psychobiology of Sensory Coding (Harper & Row, New York),p xvi.
6 of 6 | www.pnas.org/cgi/doi/10.1073/pnas.1404208111 Livingstone et al.