syllable frequency in lexical decision and naming of...
TRANSCRIPT
Running head: SYLLABLE FREQUENCY IN ENGLISH In press, Reading & Writing (accepted July 2006)
Syllable Frequency in Lexical Decision and Naming of English Words
Pedro Macizo1 & Cyma Van Petten2
Department of Psychology, University of Arizona
1. Current address: Pedro Macizo, Departamento de Psicología Experimental y Fisiología del
Comportamiento. Facultad de Psicología. Campus de Cartuja s/n, 18070, Granada, SPAIN.
Email: [email protected]
2. Manuscript correspondence: Cyma Van Petten, Department of Psychology, University of
Arizona, Tucson, AZ, 85721, USA. Email: [email protected]
Abstract The importance of phonological syllables in recognition and pronunciation of visual words has been demonstrated in languages with a high degree of spelling-sound correspondence. In Spanish, multisyllabic words with frequent first syllables are named more quickly than those with less frequent first syllables, but receive slower lexical decisions. The latter effect is attributed to lexical competition from other words beginning with the same syllable. We examined syllable frequency effects on naming and lexical decision for 3,029 visually-presented words in English, a language with a high degree of irregularity in spelling/sound relationships, and in which phonological syllables are less clearly marked in printed words. The results showed facilitative effects of syllable frequency in both tasks, and these were stronger when syllables were defined orthographically than phonologically. The results suggest that activation of lexical candidates based on a syllabic code does not occur rapidly enough to interfere with lexical decision in English. Keywords: Syllable; Syllable frequency; Orthography; Phonology; Neighborhood; Similarity; Orthographic syllable
2
The nature of the sublexical representations that allow people to recognize and name words continue to be debated (e.g., Schiller, 2000), including the possibility that these may differ across languages. Although early studies suggested that phonological syllables were relevant to visual recognition of English words (Spoehr & Smith, 1973, 1975), further research rejected this idea and instead argued for the orthographic and morphological nature of visual lexical access (e.g., Taft, 1979; see Taft, 1991 for review). However, several studies in Spanish — a language with a shallow orthography -- have shown that syllables can function as sublexical units in both visual word perception and word production (e.g., Carreiras, Álvarez, & de Vega, 1993; Ferrand, Segui, & Grainger, 1996). Recent studies in French and German support this view (Conrad & Jacobs, 2004; Mathey & Zagar, 2002). The basic methodology of the European studies has been to demonstrate influences of syllable frequency independent of whole-word frequency. In contrast, the reliability of syllable-frequency effects has received less attention in languages with a large degree of irregularity in the correspondence between spelling and pronunciation, such as English. Before proceeding to the current analyses of syllable frequency in English, we review results from other languages, and then extant data from English. Syllable frequency in word recognition tasks without production demands The impact of syllable frequency in Spanish visual word recognition is inhibitory,1 consisting of slower reaction times and/or higher error rates for words with high-frequency syllables as compared to those with low-frequency syllables, independent of whole-word frequency. One of the earliest reports, using a task of self-paced reading, determined that it was positional frequency of the first syllable that slowed reading time rather than the total frequency of all syllables in a word (de Vega, Carreiras, Gutiérrez, & Alonso, 1990). In other words, the probability of occurrence of a given syllable in word-initial position (as compared to all word-initial syllables) was relevant, rather than the summed frequency of all syllables in the word. Other studies from the same research group corroborated the inhibitory effect of Spanish first-syllable frequency across other measures that do not involve speeded production. These include lexical decision latencies for words and pseudowords, lexical decision latency in a priming paradigm in which the context and target share initial syllables, and the masking level at which a word can first be identified in a progressive demasking paradigm (Álvarez, Carreiras, & de Vega, 2000; Carreiras et al., 1993; de Vega & Carreiras, 1989; Perea & Carreiras, 1995, 1998). Moreover, words with frequent first syllables also elicit a larger N400 component in recordings of electrical brain activity as compared to words with less frequent first syllables (Barber, Vergara, & Carreiras, 2004). This last finding is of interest because whole-word frequency routinely produces the reverse effect – a larger N400 for rare words as compared to common words (Van Petten, 1995). Studies conducted in French and German have paralleled the results from Spanish. In German, Conrad and Jacobs (2004) manipulated syllable frequency in a lexical decision experiment and in a perceptual identification experiment in which participants were asked to recognize fragmented words. The results of both experiments showed worse performance for words with high-frequency first syllables. In a lexical decision task performed by German-speakers, Hutzler and colleagues also observed an inhibitory effect of syllable frequency on eye-movement measures (number of fixations, duration of the first fixation and gaze duration; Hutzler, Conrad, & Jacobs, 2005). Finally, electrophysiological evidence of the inhibitory effect has been also obtained with German-speakers (Hutzler et al., 2004). In French, Mathey and Zagar (2002) compared targets with few versus many syllabic neighbors that were also of higher word frequency than the target itself, and observed slower lexical decision times for those with more syllabic neighbors. Although the French study did not manipulate syllable frequency per se, it seems likely that sharing a syllable with a greater number of other words entails higher syllable frequency.
3
The negative impact of frequent first syllables on performance has been interpreted as a lexical competition effect, namely that initial syllables suggest candidate words beginning with that syllable, and that a large number of candidates leads to slower responses. This interpretation suggests, of course, that the syllable is a functional unit in visual word recognition. It is thus important to consider whether the apparent impact of syllable frequency could be confounded with orthographic and/or morphemic factors. For example, Seidenberg (1987) noted that bigram frequencies tend to vary across the word, and these frequencies tend to be higher within syllables. Thus, the syllable effect could be due to greater orthographic redundancy at the level of letter combinations. In addition, it has been found that in compound words, the frequency of first constituent morphemes influenced lexical decision times to visually presented English compounds (Taft & Forster, 1976). However, neither orthographic nor morphemic factors provide good accounts of the syllable frequency effects in Spanish. The syllable effect remains significant after controlling orthographic redundancy (Carreiras et al., 1993; Rapp, 1992). Álvarez et al. (2000), using a regression approach, showed that the syllable frequency effect could not be explained by bigram frequency. Finally, Álvarez, Carreiras, and Taft (2001) observed the inhibitory effect of syllable frequency when the frequency of morphologically defined syllables (BOSS; Taft, 1979) was controlled. Thus, the impact of phonological syllable frequency seems to be reliable after potentially confounding factors have been controlled. Syllable Frequency in Word Naming
Overall, the inhibitory effect of syllable frequency in visual word recognition is a very consistent finding in Spanish, with supportive results from a smaller number of studies in French and German. However, in Spanish word production, the opposite effect of syllable frequency has been found: words with high-frequency syllables are named faster than words with low-frequency syllables. This facilitative effect of syllable frequency has been observed when participants named Spanish words, nonwords, or both (Dominguez, Cuetos, & de Vega, 1993; Perea & Carreiras, 1996, 1998). For example, Carreiras & Perea (2004) observed that after controlling a number of potential confounds (initial phoneme, orthographic neighborhood, bigram frequency, etc.), disyllabic pseudowords with high-frequency first syllables were named faster than those with low-frequency first syllables. This facilitative effect of syllable frequency in production tasks has been corroborated in languages other than Spanish. Simpson and Kang (2004) explored whether the syllable had a special status in naming printed Korean stimuli (hangeul alphabet). They manipulated syllable frequency while word frequency, bigram frequency, initial phoneme, and number of graphemes per syllable were controlled. The results showed a facilitative effect of high-frequency syllables (27 ms) on hangeul syllable naming. Levelt and Wheeldon (1994) examined the effect of syllable frequency in Dutch speech production. The authors found that the latency to produce words from previously learned symbolic cues (e.g., participants learned to associate symbol strings like “&&&&&&” to a particular vocal response) was faster for disyllabic words with high frequency second syllables than for those words containing lower-frequency second syllables. This effect was orthogonal to the effect of word frequency. In a more recent study using a similar method but nonword stimuli, a facilitative influence from frequent first, but not second, syllables was observed (Cholin, Levelt, & Schiller, 2006).2 Finally, Aichert and Ziegler (2004) explored the influence of syllable frequency and syllable structure on word repetition on ten German-speakers with apraxia of speech. They found that the most frequent syllables were relatively preserved while infrequent syllables were more prone to error.
The facilitative influence of syllable frequency on naming latency has different accounts in different models of speech production. Following Crompton (1981), Levelt and colleagues propose a mental syllabary containing pre-compiled motor programs for the articulators (Cholin et al., 2006; Levelt, Roelofs, & Meyer, 1999). More frequent syllables are represented by more well-learned motor programs that can be retrieved and initiated more quickly than less
4
frequently used motor routines. Other models include a syllabic level in the representation of word forms, and would suggest that syllable frequency exerts its effect at a processing level that is prior to and more abstract than motor-articulatory programming (Dell, 1986, 1988).
Whatever model one adopts to explain syllable frequency effects in naming, it is rare to find a factor with opposite influences on naming and lexical decision RT. However, the idea that syllable frequency acts at two distinct levels of processing offers a unifying account. Lexical decision RTs might be dominated by competition between similar-sounding words at a lexical level and thus slower for words with many syllabic neighbors, whereas naming RT might be dominated by processes that are specific to speaking – processes that result in benefits for words with common syllables. The dual-but-opposing-influences account suggests that the facilitative influences of syllable frequency should be strongest in naming tasks that minimize lexical influences, consistent with observations of particularly strong influences of syllable frequency for nonwords (Carreiras & Perea, 2004; Cholin et al.,2006; Dominguez, deVega, & Cuetos, 1993), and when naming is triggered by an arbitrary nonalphabetic cue (Cholin et al., 2006; Levelt & Wheeldon, 1994). In contrast, inhibitory influences should be largest in tasks and measures that strongly rely on lexical processing. One diagnostic criterion for such measures is sensitivity to whole-word frequency. Both eye fixation and electrophysiological measures meet this criterion, and yield inhibitory influences of syllable frequency (Barber et al., 2004; Hutzler et al., 2004, 2005).
Syllable frequency in English
The largest number of studies examining syllable frequency have been conducted in Spanish, so that it is instructive to consider why syllables might be a useful sublexical code for lexical access in this language, as compared to English. In Spanish, (a) the syllable is the most stable phonological unit (i.e., coarticulation makes phonemes more context-dependent than syllables; Cutler, Mehler, Norris, & Segui, 1986); (b) there is a very close correspondence between graphemes and phonemes, so that phonological syllables are spelled in much the same way across words; (c) syllable boundaries are well-defined; (d) phonological variability across syllables is relatively low (70% of written syllables have a VC or CVC structure, Dominguez et al., 1997); and (e) the total number of syllables is also relatively low (Spanish contains about 2,000 different syllables as compared to about 8,000 in English, Katz & Frost, 1992). In contrast, the degree to which the syllable is a functional English unit is still debated for both visual word recognition and word production (Jared & Seidenberg, 1990; Schiller, 2000). Some of this controversy stems from theoretical considerations of how useful such a unit might be, including: (a) high variability in the mapping of spelling to sound, so that a single phonological syllable receives multiple printed instantiations; (b) high variability across English syllabic structures (V, CV, VC, CVV, VCC, CVC, CCV, CVCC, CVCCC, CCVCC, CCCVCC are legal, at least), which will also increase the difficulty of spotting syllables in print; and (c) boundaries between syllables are not always well-defined, even in speech, given the prevalence of ambisyllabicity (Dominguez et al., 1997; Selkirk, 1982; Ziegler, Stone, & Jacobs, 1997).
Differences between Spanish and English raise the possibility that the syllable may not be a functional prelexical unit in English, even if this is the case in some other languages. The role of syllables during English speech production has been a topic of some debate. Some studies have showed reliable effect of syllables in English naming tasks. For example, Ferrand, Segui, and Humphreys (1997) reported shorter naming latencies when targets were preceded by a visual prime specifying the first syllable (bal%%%%-BALCONY, “%” was used to indicate missing letters), as compared with a condition where prime and target shared a string of letters of equal length that was either shorter or longer than the first syllable (bal&&&&-BALANCE). However, attempts to replicate this effect in English (Schiller, 1999, 2000) and in French (Brand, Rey, & Peereman, 2003) have been unsuccessful. Schiller did not observe any facilitative effect of primes with the same length that the first syllable of target words across a series of
5
experiments with different syllable structures and target words. Instead, in all experiments, priming effects increased when the overlap between prime and target was increased (segmental overlap effect, with faster response times for longer CVC overlap than shorter CV overlap). Brand et al. also failed to replicate the syllabic priming effects in French using the same procedure and stimuli as Ferrand et al. (1996).
Empirical work on the role of phonological syllables in visual word recognition (without naming) has also produced mixed results in English. Prinzmetal, Treiman, and Rho (1986) asked participants to identify the color of letters embedded in disyllabic words. When the color of a letter was different from that of the other letters in the same syllable, participants frequently made the error of reporting the color of the rest of the syllable. This result suggests that participants perceived the syllable as a unit, in agreement with Spoehr and Smith’s early studies (1973, 1975). However, many studies have provided strong evidence that apparent syllabic effects in English can be accounted by orthographic and morphological factors. Taft (1979, 1991), for example, has suggested that visual word recognition may utilize a syllable-like unit, but one defined as the first part of a word’s stem, up to and including all the consonants following the first vowel. The basic orthographic syllable unit (BOSS) will sometimes consist of the same letters that a phonologically-based division would suggest (e.g., FIN is both the BOSS and the first syllable of FINISH), so that an influence of this orthographic code may masquerade as a syllabic effect. However, the orthographic and phonological definitions will conflict for many words (e.g., FIN vs FI for FINITE). When conflicting words are physically split at the border defined by the BOSS, lexical decision latencies are generally faster than when words are split at the phonologically-defined syllable boundary (Taft, 2001, 2002; but see also Rapp, 1992). These results suggest that readers may use sublexical units during English word recognition, but that the units do not correspond to syllables.
Surprisingly, there has been very little effort to determine whether visual word recognition or naming tasks show syllable frequency effects in English. Just as lexical (whole-word) frequency effects are usually interpreted as evidence that a particular task tapped a word-level representation, the presence or absence of a syllable frequency effect may suggest whether or not syllables are a functional unit for readers. To our knowledge, there has been only one such study, in nine English-speaking aphasics repeating spoken words. Although the total number of phonemes influenced the accuracy of production, frequency of the syllables had a very negligible effect (Nickels & Howard, 2004). Because English has a more opaque mapping between orthography and phonology than any language in which syllable frequency has yet been investigated (Borgwaldt, Hellwig, & de Groot, 2005), influences of phonologically-defined syllables on measures of visual word recognition may well be different than in languages with a shallow orthography, particularly Spanish.
The Present Study
We used existing data to obtain a first view of the role of syllable frequency in English, rather than conducting new experiments. Specifically, we used an on-line corpus of words accompanied by behavioral measures collected from English-speakers at multiple American universities (Balota et al., 2002). There are several advantages associated with the use of this corpus. First, it includes measures from both visual lexical decision and naming tasks on the same words, so that it is possible to determine whether the two tasks produce opposing effects of syllable frequency, as shown in other languages. More importantly, the corpus contains such behavioral measures for a very large number of words, together with a variety of lexical characteristics. Although analyzing these existing data sacrifices the benefit of a within-subject design, it thus offers the benefit of a much larger number of items than would be feasible for a within-subject design. The large stimulus set affords considerable power to detect potentially subtle effects, and additionally offers some protection against stimulus-selection biases that can influence results from smaller stimulus sets (Forster, 2000). If results in English parallel those of
6
the other languages studied thus far, we should find that words composed of frequent syllables (especially initial syllables) receive slower lexical decisions, but faster naming responses than words composed of less-frequent syllables. To anticipate the results, influences of syllable frequency were observed, so that we considered the possibility that these phonological measures were serving as surrogates for underlying orthographic variables. To some degree, common phonological patterns are mirrored by common orthographic patterns. One measure of the degree of orthographic similarity among words is Coltheart’s N (Coltheart, Davelaar, Jonasson, & Besner, 1977): the number of other words that can be formed by changing one letter of the target word. As defined by this measure, English words with more orthographic neighbors receive faster lexical decisions than words with fewer neighbors (Andrews, 1989, 1992, 1997; Buchanan, Westbury, & Burgess, 2001; Forster & Shen, 1996; Holcomb, Grainger, & O’Rourke, 2002; Huntsman & Lima, 2002; Spieler & Balota, 2000). Orthographic neighborhoods, as conventionally defined, were thus included in the current statistical analyses. We also derived new measures of orthographic syllable frequency that more closely parallel the measures of phonological syllable frequency, as described below. Orthographic syllable boundaries correspond to where a hyphen would be placed if a word were broken up between printed lines, and are the boundaries listed in most dictionaries. In cases where the first vowel of a word is long, this usually corresponds to the phonological syllable boundary (e.g., PU-TRID, DE-MON). In other cases, however, the initial orthographic syllable includes the first consonant or consonant cluster after the first vowel, whereas the most conventional definition of initial phonological syllable ends at the first vowel (e.g., LEM-ON versus LE-MON). The contrast between DEMON and LEMON illustrates that the hyphen rule for defining orthographic syllables is influenced by phonology, particularly vowel length (short “e” in LEMON versus long “e” in DEMON). To some degree, what we will call “phonological” versus “orthographic” syllables simply reflect different weightings of multiple principles for syllabification when these conflict. Proposed principles include legality (that the onset of a syllable should be legal as a word onset), maximum onset (that a syllable onset should include as many consonants as possible), and an ideal sonority contour of each syllable, which may account for the influence of vowel length (see Treiman & Zukowski, 1990 for review). The alternative syllabifications of LEMON thus reflect different weightings of the maximum onset principle (favoring LE-MON) and the influence of initial vowel length (favoring LEM-ON). Some reports indicate that preference for different syllabification rules is influenced by learning to read in children and by level of reading ability in adults (Taft, 2001; Treiman, Bowey, & Bourassa, 2002). A full discussion of syllabification rules is outside the scope of the current study, but it is clear that different syllabifications will influence the computation of syllable frequency. Applying the most conventional phonological definition (one favoring the maximum onset principle) yields no shared syllable for DAMAGE, FORAGE, MANAGE, SAVAGE, and VOYAGE, while applying the hyphen rule yields a shared second syllable of –AGE.3 A second difference between phonologically- and orthographically-defined syllables is of greater interest for understanding how sublexical structure may influence English word recognition. The high degree of irregularity in mapping sound to spelling in English leads to sets of words that share phonological but not orthographic syllables, and vice versa. For instance, while SERVICE, SIRLOIN, CIRCUS, and SURGEON share an initial phonological syllable and contribute to the frequency measure for that syllable (/s3:/), their initial orthographic syllables are distinct. Conversely, ACORN and ACUTE share initial orthographic syllables, but not phonological syllables. As described in the Methods section below, syllable frequency measures based on phonological versus orthographic definitions are strongly correlated with one another (r = .67 for first syllables, r = .69 for second syllables in the current stimulus set). However, determining whether these somewhat different definitions of “syllable” have differential influences on performance is of great enough interest that we thus conduct two parallel sets of
7
analyses to determine the respective influences of phonological and orthographic syllable frequency in English.
METHODS Stimuli
We began with all the two-syllable words in the corpus of Balota et al. (2002), (N = 15,848), and then excluded those: 1) that contained suffixes or prefixes, or which were compound words,4 2) with two pronunciations in American English (e.g., ABUSE when used as a noun versus a verb), 3) lacking phonemic transcriptions in the CELEX database (Baayen, Piepenbrock, & Gulikers, 1995), and 4) with fewer than ten observations for the lexical decision or naming tasks. This resulted in a set of 3,029 words, with a mean of 28.4 lexical decision observations (range 10 to 36) and 25.5 naming observations (range 10 to 29). The CELEX database was used to find the positional5 frequency of the first and second phonological syllables of each word — the number of times the syllable appeared in that position across all of the words in CELEX (expressed as instances per million). Because syllable frequency may not be intuitive, Table 1 includes examples of words with common and uncommon syllables. In the Results, the first and second phonological syllables are referred to as P1 and P2, respectively.
__________________________________ Insert Table 1 about here
___________________________________ The phonological and orthographic conventions for locating the syllable boundary
agreed for 79% of the set of disyllabic words used here; for the other 21%, the orthographically-defined first syllables included extra letters/phonemes. In the Results, we report supplementary analyses conducted on the subset of items (2,389 words) for which the two definitions agreed on the boundary position. Positional orthographic syllable frequency was calculated by looking up all words in the CELEX database (Baayen et al., 1995) sharing syllables with the target words in the designated positions, summing their frequencies of usage, and dividing by 17.9 to normalize the measure to reflect frequency per million (CELEX word frequencies are based on a corpus of 17.9 million words). Examples of words with common and uncommon orthographic syllables are in Table 1. In the Results, the first and second orthographic syllables are referred to as O1 and O2, respectively. Descriptive statistics for the stimulus set are shown in Table 2, as well as mean lexical decision and naming RTs and accuracies. Table 2 includes a number of other variables that are likely to influence lexical decision and naming performance. Word frequency (Kucera & Francis, 1967), word length, and positional bigram frequency were gathered from the Balota et al. (2002) database. In addition to the syllable-frequency measures, additional variables were added to index global similarity between the target words and other words. These included three measures of a word’s orthographic neighborhood: number of words that can be formed by substituting one letter of a target word (Coltheart’s “N” ), the mean word frequency of those neighbors, and the number of neighbors of higher word frequency (orthographic neighbors gathered from Balota et al., 2002). Although raw frequencies are shown in Table 2, all of the frequency variables (word, bigram, neighborhood and syllable) were subject to a natural log transform prior to analysis.
_____________________________ Insert Table 2 about here
_____________________________ Table 2 shows one immediately obvious difference between the phonologically and
orthographically defined syllables, that syllables contain more letters than they do phonemes (orthographic length longer than phonological length, F(1,3028) = 3974.4, p < .001). Additionally, the second syllables are longer than the first syllables (main effect of position,
8
F(1,3028) = 570.5, p < .001). The positional length difference is greater for phonologically-defined than orthographically-defined syllables (phono/ortho definition x position, F(1,3028) = 117.6, p < .001), but significant for orthographic syllables as well (F(1,3028) = 197.2, p < .001).
RESULTS
The results are presented in four main sections: 1) exploratory analyses to describe the relationships among the stimulus characteristics and the dependent measures; 2) regression analyses to determine the impact of phonological syllable frequency in lexical decision and naming; 3) regression analyses to determine the impact of orthographic syllable frequency in lexical decision and naming; and 4) followup analyses using ANOVAs to examine the relative impact of phonological and orthographic syllable frequency.
Correlations among stimulus characteristics and lexical decision and naming performance
Table 3 shows simple correlations between the dependent variables of lexical decision RT, naming RT, and lexical decision accuracy. Naming accuracy was not analyzed because the 95% mean accuracy rate leaves little variance to be explained. All 11 of the stimulus characteristics are significantly associated with speed and/or accuracy of performance. Longer length and orthographic neighbors of higher word frequency were associated with slower reaction times. All of the frequency variables — word frequency, mean neighborhood frequency, syllable frequency — yielded negative correlations with speed, and positive correlations with accuracy, such that higher frequency was associated with better performance. Similarly, a large number of orthographic neighbors was associated with faster RTs and higher accuracies. Of course, this does not mean that all of the variables made unique contributions to predicting performance, because the stimulus characteristics are themselves correlated, a point we return to below.
_____________________________ Insert Table 3 about here
_____________________________ The exploratory correlations were useful in reducing the set of variables. Length-in-letters and length-in-phonemes are highly correlated with one another and likely to be redundant variables. Length-in-letters was selected for subsequent analyses because of its stronger correlations with the performance measures. Because number-of-orthographic-neighbors and mean-frequency-of-neighbors both yielded negative correlations with reaction time, these were combined into a single variable of summed neighborhood frequency (number of neighbors multiplied by their mean frequency). An additional motivation for this metric of neighborhood density is that it parallels the syllabic frequency measures of structural similiarity among words (i.e., both the neighborhood and syllabic frequency measures boil down to the summed frequency with which similar words appear in a corpus, with different definitions of “similar”). Table 4 shows that frequencies of both the first and second syllables – by either the phonological or orthographic definitions – are significantly correlated with most of the other stimulus characteristics. The patterns of correlation were generally similar for the four syllable-frequency measures, with the notable exception that second-syllable frequency (by either definition) was much more strongly related to number and frequency of neighboring words.
___________________________ Insert Table 4 about here
___________________________ The significant correlations between syllable frequency and other variables raise the possibility that syllable frequency has little variation independent of other lexical characteristics. We thus conducted simultaneous multiple regressions on the syllable frequency measures to determine the degree to which they could be predicted from the nonsyllabic measures plus
9
frequency of the other syllable (i.e., second-syllable frequency was included as a predictor for first-syllable frequency, and vice-versa). Given the clear overlap between the phonological and orthographic measures of syllable frequency, the analyses excluded orthographic frequency when phonological frequency was the dependent measure, and vice-versa. The R2s for the four regressions were .27 (P1), .40 (P2), .28 (O1), and .39 (O2), and all probability levels less than .001 (Fs(9, 3019) > 121.0). These results indicate that syllable frequency is associated with other lexical characteristics, but also shows substantial fluctuation that cannot be predicted from other variables. Specifically, more than 60% of the variance in syllable frequency is unassociated with word frequency, length, bigram frequency, the neighborhood measures, and frequency of the other syllable. This relative independence of syllable frequencies from other characteristics of English words suggests that it is worthwhile to examine their impact on lexical decision and naming times. Plan of the regression analyses. Given the dense pattern of relationships among the various characteristics of the stimulus words, the primary analyses used to examine the influence of syllable frequency were stepwise regressions. These allow the most dominant determinants of lexical decision and naming performance (e.g., word frequency) to account for all the variance they can before new variables are evaluated. Two stepwise regressions were conducted for each of the three dependent variables of lexical decision RT, naming RT, and lexical decision accuracy. The criterion for entry of a predictor variable into a regression equation was set at p = .01. The first set of analyses examined phonological syllable-frequency by including the potential predictor variables: frequency of the first phonological syllable, frequency of the second phonological syllable, word frequency, length, positional bigram frequency, summed frequency of orthographic neighbors, and number of orthographic neighbors of higher frequency. In the second set of analyses, orthographic syllable frequencies were added to the set of potential predictor variables.
Regressions with phonological syllable frequency The top half of Table 5 shows the regression results for lexical decision RT, accounting for roughly 36% of the overall variance across the 3,029 words. As expected, word frequency was the strongest predictor, accounting for some 32% of the variance, and four additional variables accounted for an additional 4%. For variables that have been examined in previous work, their influence was in the expected direction: longer length slowed RT, and residing in a dense orthographic neighborhood speeded RT. Finally, one of the predictors that made a small but significant contribution to the explained variance was the frequency of the second phonological syllable (P2-frequency). P1-frequency was not significant, in contrast to previous work in other languages. Moreover, the influence of P2-frequency on lexical decision RT was facilitative, rather than inhibitory as would have been predicted by previous studies in other languages.
_________________________________ Insert Tables 5 and 6 about here
_________________________________ The bottom half of Table 5 shows very similar results for naming latencies, albeit with a weaker impact of word frequency than for lexical decision RT (as suggested in previous work, see Balota & Chumbley, 1984, 1985; Paap, McDonald, Schvaneveldt, & Noel, 1987). Among the minor predictors for naming latency (after word frequency and length) were both P1 and P2-frequency, both showing a facilitatory influence. Finally, Table 6 shows the regression results for lexical decision accuracy, for which only word frequency was a significant predictor.
10
Regressions with orthographic syllable frequencies The second set of stepwise regressions included natural log frequency of the first and second orthographic syllables in addition to the previous variables in the pool of potential predictors. Given the correlations between the orthographic and phonological syllable frequencies, we expected that the orthographic and phonological syllable frequencies would compete to enter the equation. The critical question was whether the orthographic frequencies would supercede the phonological, and if so, whether the final regressions would account for more of the variance in lexical decision and/or naming performance. The top half of Table 7 shows the regression results for lexical decision RT. These are nearly identical to those of the initial analysis shown in Table 5, except that O2-frequency has replaced P2-frequency. The increase in variance-accounted-for (R2 change) due to the entry of O2-frequency was somewhat higher than for P2-frequency in the previous analysis (1.4% vs 0.9%). The two overall R2 results were, however, so close as to be non-significantly different.6 The bottom half of Table 7 shows the parallel analysis for naming latency. Frequencies of the first and second orthographic syllables entered the equation and jointly accounted for 3.0% of the variance, as compared to 1.7% for phonological syllable frequencies.7 Like the analyses of lexical decision RT, the difference between the overall R2s for two regressions on naming latency was too small to be statistically significant. Table 8 shows the results for lexical decision accuracy. High orthographic syllable frequency had a beneficial effect on accuracy (in contrast to the null results of phonological syllable frequency in Table 6), but once again there was no significant difference between the total variance-accounted-for in the pair of regressions.
_________________________________ Insert Tables 7 and 8 about here
_________________________________ Phonological versus orthographic syllable definitions As described in the Introduction, what we have called “phonological” and “orthographic” syllable frequencies can differ for two reasons: different placement of the syllable boundary, and different sets of words sharing a given syllable due to the highly variable relationship of spelling and pronunciation in English. The analyses above suggest that orthographic frequencies are slightly more potent influences on performance than phonological frequencies, so that it would be useful to know which of the two factors is responsible. We thus repeated the regression analyses on the subset of words (N = 2389) for which the phonological and orthographic definitions identified the same syllable boundary. The results were very similar to those for the full stimulus set. When only phonological frequencies were included as potential predictor variables, P2 frequency entered the equation, but when orthographic frequencies were allowed to compete, only the orthographic measures entered the equation, and accounted for more variance than the phonological measures in the parallel analysis. Table 9 shows that O2 frequency accounted for 2.4% of the variance in lexical decision RT (as compared to 2.0% for P2 in a model using only phonological syllable frequencies). For naming latency, orthographic syllable frequencies accounted for 2.9% of the variance, as compared to 1.6% when the regression included only phonological syllable frequencies. Finally, orthographic syllable frequencies had a combined R2 of 0.6% for lexical decision accuracy, but phonological syllable frequencies did not meet the minimum criterion for entering the regression equation in the model with only phonological frequencies. To the extent that orthographically-defined syllable frequency has a stronger impact on visual word recognition than the other measure of syllable frequency, this is more likely to reflect spelling/sound inconsistencies than different rules for syllabification.
________________________________ Insert Table 9 about here
_________________________________
11
Followup analyses using an ANOVA approach The results above lend little support to the hypothesis that phonological syllables play a unique role in lexical decision or naming of English words. However, all of the regression results did suggest that the frequency of sublexical structures influence both tasks because some syllabic frequency measure was significant in each analysis.8 Collectively, the analyses suggest two preliminary conclusions. First, it may not matter much if sublexical structures are defined by orthographic or phonological criteria, given the statistical equivalence of the pairs of regressions using one or the other definition (although orthographically-defined syllable frequencies accounted for numerically more variance). Second, the frequency of the final syllable of two-syllable words may be more important than the initial syllable because second-syllable-frequency always accounted for more variance than first-syllable-frequency. Syllable frequency accounted for rather small amounts of the variance in the three dependent measures, ranging from 0.6% for lexical decision accuracy to 3.0% for naming RT. It is important to remember, however, that R2 indexes the “noisiness” of an effect, not its magnitude, which is indexed by the coefficient for that variable in the regression equation. For O2-frequency (the most reliable of the syllabic frequency measures), the coefficients predict that four natural log units of frequency would translate to about an 19 ms difference in lexical decision or naming RT, an effect that would probably be considered respectable in, for instance, a study of semantic priming.
The advantage of the regression approach is that it allows the possibility of teasing out the influence of a single variable despite correlations between that variable and other influential variables. However, regression analyses of lexical decision and naming data are uncommon in the psycholinguistic literature (see Balota, Cortese, Sergent-Marshall, Spieler, & Yap, 2004, for a recent exception), so that one might be skeptical that regression coefficients really provide good estimates of the magnitude of an effect. We thus pursued the results above via more conventional designs, namely, creating sets of words that vary in syllable-frequency but are matched on word frequency and length, the two strongest determinants of performance in the regression analyses. We focused on O2-frequency because it was the strongest of the syllabic frequency measures to emerge from the regressions, and P1-frequency because of its demonstrated importance in other languages. These analyses included word frequency as a factor, so that the magnitude of the syllable-frequency effects could be compared to a well known effect. Frequency of the second orthographic syllable
From the total pool of 3,029 words, four subsets were selected to cross the factors of word frequency (high vs. low) and O2-frequency (high vs. low) while matching length across the four subsets. Given the multiple constraints on stimulus selection, it was possible to include 1,840 items from the original word pool in this analysis. Table 10 shows characteristics of the words in the four conditions.
For lexical decision RT, an ANOVA with factors of word frequency and O2-frequency showed a 78 ms effect of word frequency (F(1,1836) = 456.6, p < .001), a 20 ms effect of O2-frequency (F(1,1836) = 28.4, p < .001), and no interaction (F(1,1836) = 0.85). The high- and low-O2 conditions differed by 3.59 log units of frequency, for which the regression using all the stimuli (Table 7) would have predicted a 17.2 ms effect.
For naming latency, a parallel ANOVA showed a 46 ms effect of word frequency (F(1,1836) = 225.7, p < .001), a 22 ms effect of O2-frequency (F(1,1836) = 53.4, p < .001), and no interaction (F(1,1836) = 0.74). Lexical decisions were 16% more accurate for the high-frequency words than for the low-frequency (F(1,1836) = 519.9, p < .001), while O2-frequency had a very small (1.5%) and marginally significant influence (F(1,1836) = 4.34, p < .05). The regression analysis using all the stimuli would have predicted a 2.5% accuracy effect.
12
___________________________________ Insert Table 10 about here
___________________________________ Frequency of the first phonological syllable
Four subsets of words were selected to cross the factors of word frequency and P1-frequency, while matching for length and O2-frequency. The multiple constraints on stimulus construction allowed 1550 words to participate, whose characteristics are shown in Table 11. For lexical decision RT, an ANOVA showed a 78 ms benefit for high-frequency words over low-frequency (F(1,1836) = 368.1, p < .001), no significant impact of P1-frequency (F(1,1836) = 0.41), and no interaction (F < 1). For naming RT, a 42 ms impact of word frequency was observed (F(1,1836) = 175.6, p < .001), no impact of P1-frequency (F < 1), and no interaction (F < 1). The same pattern of results held for lexical decision accuracy (word frequency, F(1,1836) = 43,3, p < .001; P1-frequency, F < 1; interaction, F < 1). The results for the two reaction time measures are in accord with the regression analyses in showing no significant impact of P1 frequency, after word frequency, length, and O2 frequency are controlled.
_______________________________ Insert Table 11 about here
_______________________________
DISCUSSION The impact of syllable frequency on the two most common measures of word processing – lexical decision and naming – was examined here with an unconventional approach. Rather than attempting to create new sets of stimuli matched on all factors except syllable frequency and collecting new data from our local participant pool, we began with existing databases that included lexical decision and naming results and a large corpus of English words (the English Lexicon Project, Balota et al., 2002; CELEX, Baayen et al., 1995), and then used regressions to identify the contributions of syllable frequency. This approach may offer the benefit of generalizability of the results because it was possible to analyze a very large set of stimulus items together with dependent measures drawn from participants with a broad geographic distribution across the United States. The results themselves offer a confirmation of the validity of the approach, in that the regressions yielded the expected results for variables that have already been studied in English: large effects of word frequency and smaller but significant effects of word length and orthographic neighborhood density. A similar regression approach has been applied to lexical decision and naming latencies for monosyllabic words by Balota and colleagues (2004). Those results suggested that word frequency accounted for about 7% of the variance in naming RT and about 25% of the variance in lexical decision RT when the Kucera and Francis (1967) corpus was used to estimate word frequency (as in the current study). For a stimulus set that included both mono- and disyllabic English words, de Groot and colleagues found that word frequency accounted for 50% of the variance in lexical decision, and 16% in speeded naming for Dutch/English bilinguals (de Groot, Borgwaldt, Bos, & van den Eijnden, 2002). For the current set of disyllabic words only, our estimates of the naming effect was similar de Groot et al.’s: 19%. The frequency effect for lexical decision – 33% -- fell midway between that of Balota et al. (2004) and de Groot et al. (2002), as did our estimates of the impact of word length in the two tasks. Our results concur with de Groot et al.’s in showing that length has a substantially greater impact on speeded naming than lexical decision times (8% vs 2%, Table 7). In the current results, followup analyses using ANOVAs yielded very similar outcomes when applied to sets of words matched on the most critical variables identified in the regressions. Overall, it appears that the unconventional experimental method is a viable one that can likely be applied to other questions about single word processing.
13
The results indicated that sublexical structure influences both lexical decision and naming latency for visually-presented English words. Printed English words with high-frequency syllables were pronounced more quickly than those with lower-frequency syllables. This result parallels that observed in Spanish (Dominguez et al., 1993; Perea & Carreiras, 1996, 1998), but the current results have little to say about the processing origin of this facilitatory effect: it may arise from faster identification of words with high-frequency units, and/or from faster access to the articulatory program for well-practiced speech units. In other languages, some contribution from the latter process is suggested by facilitatory frequency effects when pronouncing nonwords (Carreiras, Álvarez, & de Vega, 1993; Cholin et al., 2006; Dominguez et al., 1993), which were not examined here. The observation of a facilitatory influence of syllable frequency on lexical decision times is of greater interest because it cannot be attributed to motor programming and is the opposite of the inhibitory effects reported for Spanish (Carreiras et al., 1993; Carreiras & Perea, 2004; Dominguez et al., 1993, 1997; Perea & Carreiras, 1998). In lexical decision, there was no sign of slowed responses due to the presence of similar-sounding words; instead, responses were faster and more accurate when words contained frequent syllables as compared to less-frequent syllables, whether syllables were defined phonologically or orthographically. When the phonologically and orthographically-defined measures of syllable frequency were allowed to compete for entry to the regression models, the orthographic measures won, suggesting that the origin of the syllable frequency effects is likely to be orthographic. The high correlation between the orthographically- and phonologically-defined frequency measures in the current stimulus set left only a small amount of leeway for teasing them apart; this issue might be pursued by examining a stimulus set in which inconsistency between the phonological and orthographic definitions is deliberately maximized. Additionally, frequency of the second syllable explained greater variance in reaction time and accuracy than did frequency of the first syllable; this latter finding is not especially consistent with the emphasis on initial syllables in other languages. When subsets of words matched on O2 frequency were compared in an ANOVA, no remaining effect of initial phonological syllable frequency could be detected. Below we discuss the facilitative nature of the syllable frequency effect in English, why second syllables appeared to be more important than first syllables, and finally return to the question of why English and Spanish show opposite effects of syllable frequency in visual lexical decision. Syllable frequency as a metric of similarity among words Syllable frequency is, a priori, a measure of the similarity between the target and other words in the language. High-frequency syllables are those shared by many other words, weighted by the probability with which those words are used. The current observation of a facilitative influence of frequent syllables joins numerous other observations that English words with a high degree of similarity to other words tend to receive faster and more accurate responses. Orthographic neighborhood density is one such measure, for which similarity is computed across the entire word rather than across part of a word as for syllable frequency. Nearly all reports concur that English words with more orthographic neighbors elicit faster lexical decisions and faster naming latencies than words with fewer orthographic neighbors (see Buchanan et al., 2001; Holcomb et al., 2002; Huntsman & Lima, 2002; Spieler & Balota, 2000, for recent studies, and Andrews, 1997, for review of earlier studies). In the current data, a measure of orthographic neighborhood density weighted by the frequency of those neighbors was also associated with faster reaction times in both tasks. For English, a larger number of phonological neighbors is also reported to contribute to faster lexical decisions for visual words (Yates, Locker, & Simpson, 2004), and faster production in a picture naming task (Vitevitch, 2002; Vitevitch & Sommers, 2003). Finally, large numbers of semantic neighbors are also reported to speed responses in both tasks (Buchanan et al., 2001).
14
The current results suggest that syllable frequency can be added to the list of useful methods for computing the similarity among words. The regression results indicate that syllable frequency accounts for more of the variance in word identification times than whole-word similarity as assessed by orthographic neighborhood density. This observation is not surprising given that multisyllabic words, in general, have relatively few neighbors as compared to the monosyllabic words that have monopolized research on neighborhood effects. In the current set of 3,029 disyllabic words, nearly half (1,455) have zero neighbors.9 Among those with zero neighbors are pairs with a clear orthographic resemblance to one another, such as DAMAGE and MANAGE. For multisyllabic words, the traditional “N” neighborhood measure is likely to underestimate the degree of similarity among words, such that syllable-frequency provides a supplementary – and stronger – measure of similarity. First versus second syllables For the large set of morphologically simple, disyllabic words examined here, the frequency of the second syllable had a larger impact on lexical decision and naming than did first-syllable frequency. For lexical decision RT, the frequency of the second orthographic syllable (O2) was the only syllable-frequency measure to make a significant contribution to the regression analysis. For naming RT, both O2 and O1 frequencies were significant, but O2-frequency accounted for substantially more variance (2.7% vs. 0.3%). The stronger influence of second-syllable frequency was unanticipated, and is subject to a wide variety of post-hoc interpretations. The most mundane explanation for the dominance of second syllables over first syllables is simply that the second syllables were – on average – longer than the first syllables and thus contained more information about the identity of their words (Table 2). To examine this possibility, we conducted regressions on two subsets of stimuli: those with second syllables that contained more letters than their first syllables (N = 1,355), and those with the opposite length profile (N = 847). For those with longer second syllables, word frequency, word length, and O2-frequency jointly accounted for 40% of the variance in lexical decision RT, and no other variables entered the equation. For words with longer first syllables, word frequency, summed frequency of orthographic neighbors, number of higher-frequency neighbors, and O1-frequency jointly accounted for 33% of the variance in lexical decision RT. For the items with longer first syllables, second-syllable frequency did not contribute to the regression. For lexical decision RT, syllable length thus offers the simplest account of which syllable proves most influential. However, parallel analyses of naming latency were less clear in suggesting that longer syllables are always more influential. For words with longer second syllables, both O2- and O1-frequency contributed significantly to the regression for naming latency (along with word frequency, word length, and bigram frequency, total R2 = .31, p < .001). For words with longer first syllables, both O2-frequency and P2-frequency contributed to the regression on naming latency (together with word frequency, word length, summed frequency of orthographic neighbors, and number of higher-frequency orthographic neighbors, total R2 = .30, p < .001), but first-syllable frequency did not. It thus appears that length alone may not be the only reason that second-syllable frequency has a greater impact on response times than first-syllable frequency. A number of other factors differentiate the two syllables of English disyllabic words. These include stress pattern. In the large set of words examined here, primary lexical stress fell on the first syllable for the majority (77%) of the items (assessed by the phonetic transcriptions in the CELEX database; Baayen et al., 1995). This trochaic stress pattern is typical of disyllabic English nouns (Kelly & Bock, 1988), which exist in larger numbers than disyllabic English verbs and were thus over-represented in the current stimulus set as well. It seems implausible, however, that unstressed second syllables would prove more influential than stressed initial syllables. The dominance of second-syllable over first-syllable frequency in naming RT may
15
reflect factors not investigated here, such as potential differences in the consistency of orthographic-phonological mappings for the two syllables. Why language-specific effects of syllable-frequency?
A full set of cross-linguistic results on the effects of inter-word similarity across different tasks performed on both printed and spoken words does not currently exist. However, the emerging picture is that the direction of the effects depends on both input modality and language. Above, we noted that English words that are similar to many other words – by several definitions of “similar” – tend to elicit faster responses. The current observation of facilitatory syllable-frequency effects adds one new result to this list. The exception to the general scenario that “similarity breeds speed” for English speakers is that the presence of many phonological neighbors leads to slower lexical decision and naming (shadowing) latencies when the stimulus words are spoken rather than printed (Goldinger, Luce, & Pisoni, 1989; Luce & Pisoni, 1998). (Phonological neighbors are defined much like orthographic neighbors: other words that can be formed by the substitution, addition, or deletion of a single phoneme). Similar effects of phonological neighborhood density have been reported for French (Ziegler, Muneaux, & Grainger, 2003). The standard account of the inhibitory influence of phonological neighbors is much like the account of inhibitory syllable-frequency effects in Spanish lexical decision: competition among active lexical candidates, a process incorporated in several models of spoken word recognition (Luce & Pisoni, 1998; McClelland & Elman, 1986; Norris, 1994).
For spoken words, the existence of similar-sounding neighbors thus appears to slow word recognition across languages, as assessed thus far. In Spanish, which contains a fairly transparent mapping between orthography and phonology, the inhibitory effect of phonological similarity is evident in visual word recognition as well.10 Syllable frequency may be a particularly good measure of phonological similarity in Spanish because of its well-defined syllabic boundaries and relatively small set of syllables. These factors ensure that Spanish readers can readily identify the initial syllables of printed words, compute their pronunciation, and activate other words with similar onsets. The inhibitory influence of syllable frequency in Spanish suggests that these processes occur quickly enough for visual lexical decision to show a pattern of inhibition from similar-sounding competitors that is more like auditory lexical decision in English. The situation of the English reader differs in two ways: 1) phonological syllable boundaries are difficult to identify in printed words, given the higher variability of English syllable structure, larger set of syllables, and the frequency of ambisyllabicity even in spoken forms; and 2) spellings and pronunciations have quite variable and opaque relationships for English words in general. These facts may ensure that phonological codes are accessed more slowly and do not lead to the activation of similar-sounding competitors quickly enough to interfere with visual lexical decision.
What remains to be considered is why a facilitatory influence of syllable frequency on lexical decision was observed rather than no influence at all. Above, we have argued that the syllable frequency effect here reflects orthographic similarity among words, so that this question is parallel to that of why orthographic neighbors speed visual lexical decision, despite the fact that phonological neighbors slow auditory lexical decision. Two other groups of investigators have recently pondered much the same issue, but concluded with somewhat different proposals. After observing that even phonological neighborhood density speeds lexical decision on printed English words, Yates et al. (2004) suggest that lexical decisions may be made on the basis of different sorts of information during visual versus auditory presentation. Specifically, they suggest that the extended timecourse of auditory input favors the sequential elimination of lexical candidates as the input continues, and that lexical decisions are made at the end of this process, such that the final RT will reflect the degree of lexical competition prior to that point. In contrast, the simultaneous availability of an entire word in the visual modality might lead to at least partial reliance on a more global “wordness” criterion, such that the decision for a given
16
target word benefits from the activation of other real words that are structurally-similar (see Grainger & Jacobs, 1996 for a more detailed version of the latter part of this proposal, and Holcomb et al., 2002 for supportive evidence from English).
Across a series of papers, Ziegler, Grainger and colleagues also suggest that facilitation due to orthographic similarity in visual lexical decision arises from an earlier stage of processing than the inhibitory influence of phonological similarity in auditory lexical decision (Grainger, Muneaux, Farioli, & Ziegler, 2005; Ziegler & Perry, 1998; Ziegler et al., 2003). However, these authors suggest that the early stage of processing is one in which relationships between orthography and phonology are established. They argue that words with a high degree of orthographic similarity to other words also tend to have common (i.e., consistent) spelling/pronunciation relationships, and that it is this factor which speeds lexical decision. Grainger et al. (2005) present persuasive evidence from French that orthographic similarity facilitates lexical decision only when a word is also phonologically similar to many other words, and that mismatches between orthographic and phonological neighborhood density – a situation that will arise when a word exemplifies an unusual spelling/sound relationship – lead to slower lexical decisions. Visual words with consistent (i.e., common in the language) mappings between their orthography and their pronunciation also yield faster RTs than inconsistent words in English (Lacruz & Folk, 2004), so that this account of the facilitatory influence of orthographic similarity may well apply across languages varying in the transparency of the phonology/orthography relationship. This account of how orthographic similarity speeds lexical decision could be applied to syllable frequency if it proved true that more frequently used orthographic syllables also have more consistent pronunciations than less frequent orthographic syllables. The relationship between syllable frequency and orthographic/phonological similarity at the whole-word level remains to be explored in more detail.
The origin of the facilitative influence of orthographic similarity on visual lexical decision is likely to generate continued discussion, given that both of the scenarios described above are plausible and consistent with extant data. What remains true, however, is that the other effect of inter-word similarity – slowed responses due to similar-sounding neighbors – has yet to be observed when English words are presented visually. In the current analyses, we investigated whether syllable-frequency effects parallel to those observed in Spanish would appear in English. However, we found no evidence that the presence of other words sharing initial syllables with the target word led to slower lexical decisions. Instead, words with frequent syllables received faster lexical decisions and naming responses. The most parsimonious interpretation of these results is that poorly-marked syllable boundaries, and poor correspondence between spelling and sound patterns in English preclude the activation of similar-sounding lexical items before a target can be recognized as a word based on its spelling.
17
FOOTNOTES 1. Like other authors (e.g., Perea & Carreiras, 1998), we will use “inhibitory” to refer to those results where high-frequency units (words or syllables) produce worse performance (i.e., longer RTs and higher percentage of errors) than low-frequency units. We label effects as “facilitative” when high-frequency units produce better performance (i.e., faster RTs and lower percentage of errors) than low-frequency units. These terms make no reference to the underlying mechanisms of the effects. 2. After the de Vega et al. (1990) report that first syllable positional frequency influenced reaction times but total syllable frequency did not, the large majority of studies have manipulated only first syllable frequency (raw or positional, which tend to be strongly correlated). Three exceptions are: 1) Carreiras and Perea (2004) who report a facilitative naming effect for first but not second syllable frequency (Spanish); 2) the Levelt and Wheeldon (1994) result of a facilitative naming effect dependent on second syllable frequency accompanied by a null effect of first syllable frequency (Dutch); and 3) Cholin et al. (2006) who report a facilitative effect of first syllable frequency and a null effect of second syllable frequency. Finally, Álvarez et al. (2000, Spanish) reported consistent inhibitory effects of first-syllable frequency for words across three experiments, but variable results of second-syllable frequency across experiments: a nonsignificant inhibitory effect in standard lexical decision, a null effect in one experiment using first or second syllables as primes for target words, and a facilitative effect in a second priming experiment, but only when first syllables were low-frequency. Overall, the impact of non-initial syllable frequency has been less well-studied than initial frequency, and has yielded inconsistent results.
3. Using the hyphen rule to define orthographic syllables leads to initial orthographic syllables that are similar, but not identical, to Taft’s definition of the BOSS, largely because the purely orthographic definition does not take morphology into account (e.g., the BOSS of CONCENTRATE is “cent”, but its initial orthographic syllable is “con”). The morphological component of the BOSS’s definition makes it very difficult to compute BOSS frequency as compared to orthographic syllable frequency. 4. Some of the selected stimulus words (N = 84) were coded as having two morphemes in the Balota et al. (2002) database. We included these because either 1) the stems are not free-standing words in English (e.g., PERCEIVE, SURVIVE, INDUCE, PICTURE), or 2) the words appear (to us) to be monomorphemic (e.g., FICTION, GENIUS, LARVA). 5. For the initial phonological syllables of the stimulus words, we also examined total syllable frequency (in any position), and found that positional and total frequency were correlated at r = .94, so that there is likely to be little difference between results based on the two measures in English.
6. Pairs of regression models were compared using the method described by Graybill and Iyer (1994) for nonnested models. This involves forming a ratio for the error of the two models (1.0 if the models predict the dependent variable with exactly equal error), and then computing a confidence limit around the ratio. If the confidence limit includes 1.0, there is no statistical reason to prefer one model over the other. We computed the 96% confidence intervals; all three intervals included 1.0, indicating no significant differences in the degree of variance explained. 7. In additional analyses, we examined whether the number of words sharing an orthographic syllable – without consideration of their frequency of usage – influenced the dependent measures of lexical decision RT, naming RT, or naming accuracy. When these alternate
18
measures of O1 and O2 frequency were included in the set of potential predictor variables instead of the frequency-weighted measures, they did not meet the minimum criterion (p = .01) to enter the regression equations. The contrast between these null results and the significant effects of the more standard measures (weighted by frequency of usage) suggest that amount of exposure to a given syllable is responsible for the syllable frequency effects observed. 8. Additional regressions examined halves of the stimulus set divided by word frequency (natural log greater or lesser than 1.5), and number of orthographic neighbors (zero or more than zero, the latter with a mean of 2.3). These results were much the same as those reported for the full stimulus set. 9. A search of the Balota et al. (2002) database for morphologically simple words yielded a mean of 6.44 orthographic neighbors (sd = 5.1) for single-syllable items but a mean of only 0.79 (sd = 1.50) for words of two to six syllables.
10. It is noteworthy that one of the very few reports of slower lexical decision times for visual words with many orthographic neighbors was also conducted in Spanish (Carreiras, Perea, & Grainger, 1997). Phonological similarity was not computed in this study, but the regularity of the mapping between Spanish orthography and phonology suggests that a large number of the orthographic neighbors were likely to be phonological neighbors as well.
19
ACKNOWLEDGEMENTS The first author was supported by a postdoctoral fellowship from the Spanish Ministry of Education, Culture, and Sports (EX2003-1137).
20
REFERENCES Aichert, I., & Ziegler, W. (2004). Syllable frequency and syllable structure in apraxia of speech.
Brain and Language, 88, 148-159. Álvarez, C. J., Carreiras, M., & de Vega, M. (2000). Syllable-frequency effect in visual word
recognition: Evidence of sequential-type processing. Psicológica, 21, 341-374. Álvarez, C. J., Carreiras, M., & Taft, M. (2001). Syllables and morphemes: Contrasting
frequency effects in Spanish. Journal of Experimental Psychology: Learning, Memory, and Cognition, 27, 545-555.
Andrews, S. (1989). Frequency and neighborhood effects on lexical access: Activation or search? Journal of Experimental Psychology: Learning, Memory, and Cognition, 15, 802-814.
Andrews, S. (1992). Frequency and neighborhood effects on lexical access: Lexical similarity or orthographic redundancy? Journal of Experimental Psychology: Learning, Memory, and Cognition, 18, 234-254.
Andrews, S. (1997). The effect of orthographic similarity on lexical retrieval: Resolving neighborhood conflicts. Psychonomic Bulletin and Review, 4, 439-461.
Baayen, R. H., Piepenbrock, R., & Gulikers, L. (1995). The CELEX Lexical Database (English Version 2.5) [CD-ROM]. Philadelphia, PA: Linguistic Data Consortium, University of Pennsylvania.
Balota, D. A., & Chumbley, J. I. (1984). Are lexical decisions a good measure of lexical access? The role of word frequency in the neglected decision stage. Journal of Experimental Psychology: Human Perception and Performance, 10, 340-357.
Balota, D. A., & Chumbley, J. I. (1985). The locus of word-frequency effects in the pronunciation task: Lexical access and/or production frequency. Journal of Verbal Learning and Verbal Behavior, 24, 89-106.
Balota, D. A., Cortese, M. J., Hutchison, K. A., Neely, J. H., Nelson, D., Simpson, G. B., Treiman, R. (2002). The English Lexicon Project: A web-based repository of descriptive and behavioral measures for 40,481 English words and nonwords. http://elexicon.wustl.edu/, Washington University.
Balota, D. A., Cortese, M. J., Sergent-Marshall, S. D., Spieler, D. H., & Yap, M. J. (2004). Visual word recognition of single-syllable words. Journal of Experimental Psychology: General, 133, 283-316.
Barber, H., Vergara, M., & Carreiras, M. (2004). Syllable-frequency effects in visual word recognition: Evidence from ERPs. Neuroreport, 15, 545-548.
Borgwaldt, S. R., Hellwig, F. M., & de Groot, A. M. B. (2005). Onset entropy matters – Letter-to-phoneme mappings in seven languages. Reading and Writing, 18, 211-229.
Brand, M., Rey, A., & Peereman, R. (2003). Where is the syllable priming effect in visual word recognition? Journal of Memory and Language, 48, 435-443.
Buchanan, L., Westbury, C., & Burgess, C. (2001). Characterizing semantic space: Neighborhood effects in word recognition. Psychonomic Bulletin and Review, 8, 531-544.
Carreiras, M., Álvarez, C. J., & de Vega, M. (1993). Syllable frequency and visual word recognition in Spanish. Journal of Memory and Language, 32, 766-780.
Carreiras, M., & Perea, M. (2004). Naming pseudowords in Spanish: Effects of syllable frequency. Brain and Language, 90, 393-400.
Carreiras, M., Perea, M., & Grainger, J. (1997). Orthographic neighborhood effects on visual word recognition in Spanish: Cross-task comparisons. Journal of Experimental Psychology: Learning, Memory, and Cognition, 23, 857-871.
Cholin, J., Levelt, W. J. M., & Schiller, N. O. (2006). Effects of syllable frequency in speech production. Cognition, 99, 205-235.
Coltheart, M., Davelaar, E., Jonasson, J. T., & Besner, D. (1977). Access to the internal lexicon. In S. Dornic (Ed.), Attention and Performance VI (pp. 535-555). London: Academic Press.
21
Conrad, M., & Jacobs, A. M. (2004). Replicating syllable-frequency effects in Spanish in German: One more challenge to computational models of visual word recognition. Journal of Language and Cognitive Processes, 19, 369–390.
Crompton, A. (1981). Syllables and segments in speech production. Linguistics, 19, 663-716. Cutler, A., Mehler, J., Norris, D., & Segui, J. (1986). The syllable’s differing role in the
segmentation of French and English. Journal of Memory and Language, 25, 385-400. de Groot, A. M. B., Borgwaldt, S., Bos, M., & van den Eijnden, E. (2002). Lexical decision and
word naming in bilinguals: Language effects and task effects. Journal of Memory and Language, 47, 91-124.
Dell, G. S. (1986). A spreading-activation theory of retrieval in sentence production. Psychological Review, 93, 283–321.
Dell, G. S. (1988). The retrieval of phonological forms in production: Tests of predictions from a connectionist model. Journal of Memory and Language, 27, 124-142.
de Vega, M. & Carreiras, M. (1989). The role of graphemic frequency in visual word processing. Paper presented at the 3rd European Conference for Learning and Instruction, Madrid, Spain.
de Vega, M., Carreiras, M., Gutiérrez, M., & Alonso, M. L. (1990). Lectura y comprensión: Una perspectiva cognitiva [Reading and comprehension: A cognitive perspective]. Madrid: Alianza Editorial.
Dominguez, A., Cuetos, F., & de Vega, M. (1993). Efectos diferenciales de la frecuencia silábica: Dependencia del tipo de prueba y características de los estímulos [Differential effects of syllabic frequency: Task and stimulus type dependency]. Estudios de Psicología, 50, 5–31.
Dominguez, A., de Vega, M., & Cuetos, F. (1997). Lexical inhibition from syllabic units in visual word recognition. Language & Cognitive Processes, 12, 401-422.
Ferrand, L., Segui, J., & Grainger, J. (1996). Masked priming of words and picture naming: The role of syllabic units. Journal of Memory and Language, 35, 708-723.
Ferrand, L., Segui, J., & Humphreys, G. W. (1997). The syllable’s role in word naming. Memory & Cognition, 25, 458-470.
Forster, K. I (2000). The potential for experimenter bias effects in word recognition experiments. Memory and Cognition, 28, 1109-1115.
Forster, K. I., & Shen, D. (1996). No enemies in the neighborhood: Absence of inhibitory neighborhood effects in lexical decision and semantic categorization. Journal of Experimental Psychology: Learning, Memory, and Cognition, 22, 696-713.
Goldinger, S. D., Luce, P. A., & Pisoni, D. B. (1989). Priming lexical neighbors of spoken words: Effects of competition and inhibition. Journal of Memory and Language, 28, 501-518.
Grainger, J., & Jacobs, A. M. (1996). Orthographic processing in visual word recognition: A multiple read-out model. Psychological Review, 103, 518-565.
Grainger, J., Muneaux, M., Farioli, F., & Ziegler, J. C. (2005). Effects of phonological and orthographic neighbourhood density interact in visual word recognition. The Quarterly Journal of Experimental Psychology, 58A, 981-998.
Graybill, F. A., & Iyer, H. K. (1994). Regression analysis: Concepts and applications. Belmont, CA: Wadsworth.
Holcomb, P. J., Grainger, J., & O’Rourke, T. (2002). An electrophysiological study of the effects of orthographic neighborhood size on printed word perception. Journal of Cognitive Neuroscience, 14, 938-950.
Huntsman, L. A., & Lima, S. D. (2002). Orthographic neighbors and visual word recognition. Journal of Psycholinguistic Research, 31, 289-306.
Hutzler, F., Bergmann, J., Conrad, M., Kronbichler, M., Stenneken, P., & Jacobs, A. M. (2004). Inhibitory effects of first syllable-frequency in lexical decision: An event-related potential study. Neuroscience Letters, 372, 179-184.
22
Hutzler, F., Conrad, M., & Jacobs, A. M. (2005). Effects of syllable-frequency in lexical decision and naming: An eye-movement study. Brain and Language, 92, 138-152.
Jared, D., & Seidenberg, M. S. (1990). Naming multisyllabic words. Journal of Experimental Psychology: Human Perception and Performance, 16, 92–105.
Katz, L., & Frost, R. (1992). Reading in different orthographics: The orthographic depth hypothesis. In R. Frost & L. Katz (Eds.), Orthography, phonology, morphology and meaning (pp. 67-84). Amsterdam: North-Holland.
Kelly, M. H, & Bock, J. K. (1988). Stress in time. Journal of Experimental Psychology: Human Perception and Performance, 14, 389-403.
Kucera, H., & Francis, W. N. (Eds.). (1967). Computational analysis of present day American English. Providence, RI: Brown UniversityPress.
Lacruz, I., & Folk, J. R. (2004). Feedforward and feedback consistency effects for high- and low-frequency words in lexical decision and naming. The Quarterly Journal of Experimental Psychology, 57A, 1261-1284.
Levelt, W. J. M., Roelofs, A., & Meyer, A. S. (1999). A theory of lexical access in speech production. Behavioral and Brain Sciences, 22, 1–38.
Levelt, W. J. M., & Wheeldon, L. (1994). Do speakers have access to a mental syllabary? Cognition, 50, 239–269.
Luce, P. A., & Pisoni, D. B. (1998). Recognizing spoken words: The neighborhood activation model. Ear and Hearing, 19, 1-36.
Mathey, S., & Zagar, D. (2002). Lexical similarity in visual word recognition: The effect of sublexical units in French. Current Psychology Letters, 8, 107-121.
McClelland, J. L., & Elman, J. L. (1986). The TRACE model of speech perception. Cognitive Psychology, 18, 1-86.
Nickels, L, & Howard, D. (2004). Dissociating effects of number of phonemes, number of syllables, and syllabic complexity on word production un aphasia: It’s the number of phonemes that counts. Cognitive Neuropsychology, 21, 57-78.
Norris, D. (1994). SHORTLIST: A connectionist model of continuous speech recognition. Cognition, 52, 189-234.
Paap, K. R., McDonald, J. E., Schvaneveldt, R. W., & Noel, R. W. (1987). Frequency and pronounceability in visually presented naming and lexical decision tasks. In M. Coltheart (Ed.), Attention and performance XII. The Psychology of reading (pp. 221-243). Hillsdale, NJ: Erlbaum.
Perea, M., & Carreiras, M. (1995). Efectos de frecuencia silábica en tareas de identificación [Syllable frequency effects in identification tasks]. Psicológica, 16, 483-496.
Perea, M., & Carreiras, M. (1996). Efectos de vecindad ortográfica y silábica en la tarea de pronunciación mixta [Effects of orthographic and syllabic neighborhood in mixed pronunciation tasks]. Psicológica, 17, 425-440.
Perea, M., & Carreiras, M. (1998). Effects of frequency and syllable neighbourhood frequency in visual word recognition. Journal of Experimental Psychology: Human, Perception, and Performance, 24, 134-144.
Prinzmetal, W., Treiman, R., & Rho, S. H. (1986). How to see a reading unit. Journal of Memory and Language, 25, 461–475.
Rapp, B. C. (1992). The nature of sublexical orthographic organization: The bigram trough hypothesis examined. Journal of Memory and Language, 31, 33–53.
Schiller, N. O. (1999). Masked syllable priming of English nouns. Brain and Language, 68, 300-305.
Schiller, N. O. (2000). Single word production in English: The role of subsyllabic units during phonological encoding. Journal of Experimental Psychology; Learning, Memory, and Cognition, 26, 512-528.
23
Seidenberg, M. S. (1987). Sublexical structures in visual word recognition: Access units or orthographic redundancy? In M. Coltheart (Ed.), Attention and performance XII: The psychology of reading (pp. 245-263). Hillsdale, NJ: Erlbaum.
Selkirk, E. O. (1982). Syllables. In H. van der Hulst & N. Smith (Eds.) The structure of phonological representations (Part II) (pp. 337-383). Dordrecht: Foris.
Simpson, G. B., & Kang, H. (2004). Syllable processing in alphabetic Korean. Reading and Writing, 17, 137-151.
Spieler, D. H., & Balota, D. A. (2000). Factors influencing word naming in younger and older adults. Psychology and Aging, 15, 225-231.
Spoehr, K. T., & Smith, E. E. (1973). The role of syllables in perceptual processing. Cognitive Psychology, 5, 71–89.
Spoehr, K. T., & Smith, E. E. (1975). The role of orthographic and phonotactic rules in perceiving letter patterns. Journal of Experimental Psychology: Human Perception and Performance, 104, 21–34.
Taft, M. (1979). Lexical access via an orthographic code: The basic orthographic syllabic structure (BOSS). Journal of Verbal Learning & Verbal Behavior, 18, 21-39.
Taft, M. (Ed.). (1991). Reading and the mental lexicon. Hove, England: Erlbaum. Taft, M. (2001). Processing of orthographic structure by adults of different reading ability.
Language and Speech, 41, 351-376. Taft, M. (2002). Orthographic processing of polysyllabic words by native and nonnative English
speakers. Brain & Language, 81, 532-544. Taft, M., & Forster, K. I. (1976). Lexical storage and retrieval of polymorphemes and polysyllabic
words. Journal of Verbal Learning and Verbal Behavior, 15, 607-620. Treiman, R., Bowey, J. A., & Bourassa, D. (2002). Segmentation of spoken words in syllables
by English-speaking children as compared to adults. Journal of Experimental Child Psychology, 83, 213-238.
Treiman, R., & Zukowski, A. (1990). Toward an understanding of English syllabification. Journal of Memory and Language, 29, 66-85.
Van Petten, C. (1995). Words and sentences: Event-related brain potential measures. Psychophysiology, 32, 511-525.
Vitevitch, M. S. (2002). The influence of phonological similarity neighborhoods on speech production. Journal of Experimental Psychology: Learning, Memory, and Cognition, 28, 735-747.
Vitevich, M. S., & Sommers, M. S. (2003). The facilitative influence of phonological similarity and neighborhood frequency in speech production in younger and older adults. Memory and Cognition, 31, 491-504.
Yates, M., Locker, L., Jr., & Simpson, G. B. (2004). The influence of phonological neighborhood on visual word perception. Psychonomic Bulletin and Review, 11, 452-457.
Ziegler, J. C., Muneaux, M., & Grainger, J. (2003). Neighborhood effects in auditory word recognition: Phonological competition and orthographic facilitation. Journal of Memory and Language, 48, 779-793.
Ziegler, J. C., & Perry, C. (1998). No more problems in Coltheart’s neighborhood: Resolving neighborhood conflicts in the lexical decision task. Cognition, 68, B53-B62.
Ziegler, J. C., Stone, G. O., & Jacobs, A. M. (1997). What’s the pronunciation for -OUGH and the spelling for /u/? A database for computing feedforward and feedback inconsistency in English. Behavior Research Methods, Instruments, & Computers, 29, 600–618.
24
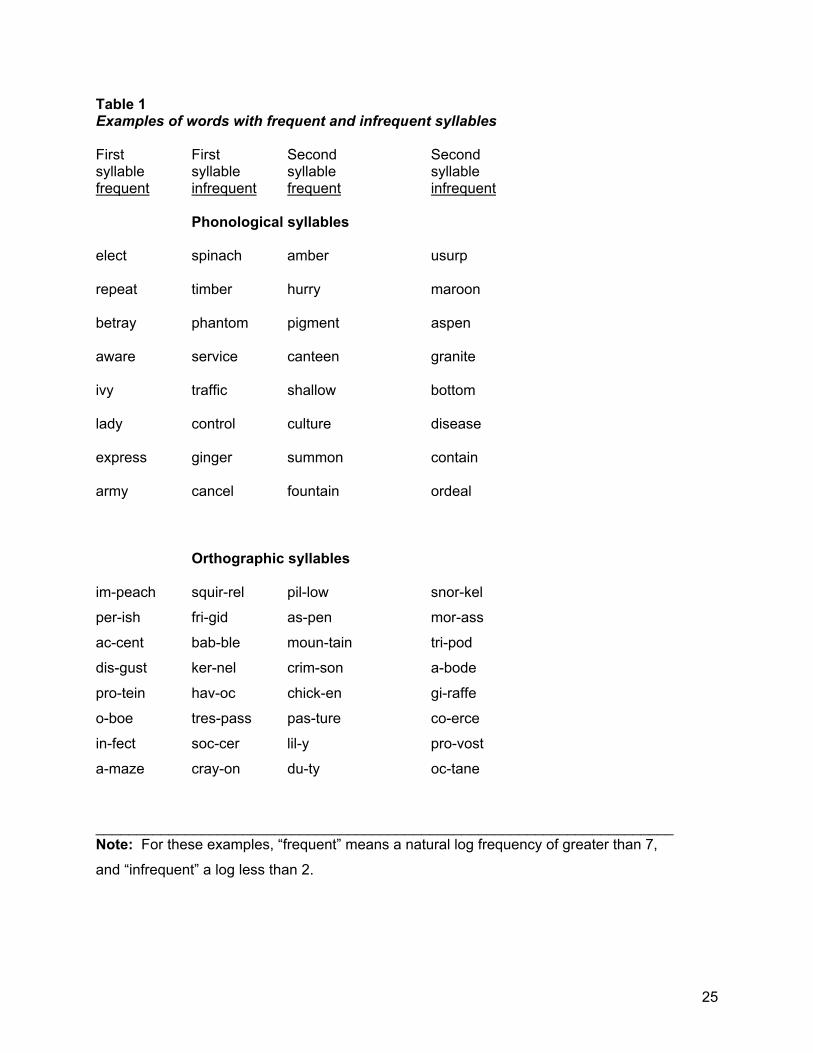
Table 1 Examples of words with frequent and infrequent syllables First First Second Second syllable syllable syllable syllable frequent infrequent frequent infrequent Phonological syllables elect spinach amber usurp
repeat timber hurry maroon
betray phantom pigment aspen
aware service canteen granite
ivy traffic shallow bottom
lady control culture disease
express ginger summon contain
army cancel fountain ordeal
Orthographic syllables
im-peach squir-rel pil-low snor-kel
per-ish fri-gid as-pen mor-ass
ac-cent bab-ble moun-tain tri-pod
dis-gust ker-nel crim-son a-bode
pro-tein hav-oc chick-en gi-raffe
o-boe tres-pass pas-ture co-erce
in-fect soc-cer lil-y pro-vost
a-maze cray-on du-ty oc-tane
_______________________________________________________________________ Note: For these examples, “frequent” means a natural log frequency of greater than 7,
and “infrequent” a log less than 2.
25
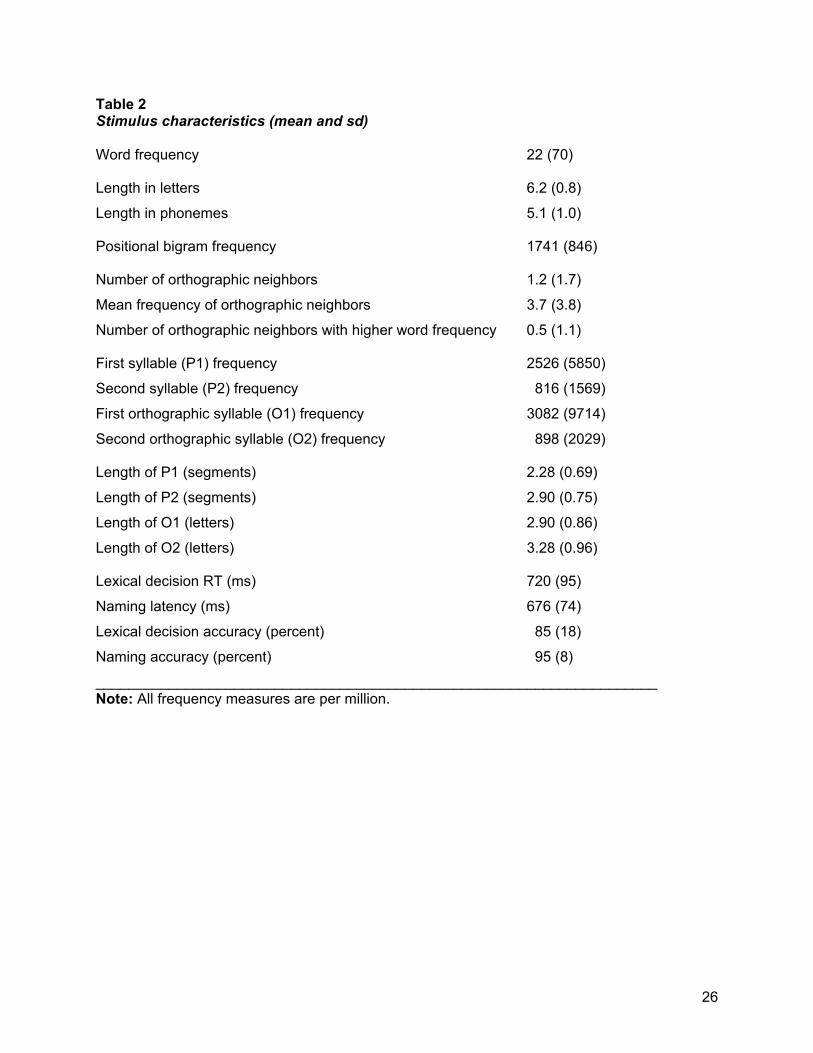
Table 2 Stimulus characteristics (mean and sd) Word frequency 22 (70)
Length in letters 6.2 (0.8)
Length in phonemes 5.1 (1.0)
Positional bigram frequency 1741 (846)
Number of orthographic neighbors 1.2 (1.7)
Mean frequency of orthographic neighbors 3.7 (3.8)
Number of orthographic neighbors with higher word frequency 0.5 (1.1)
First syllable (P1) frequency 2526 (5850)
Second syllable (P2) frequency 816 (1569)
First orthographic syllable (O1) frequency 3082 (9714)
Second orthographic syllable (O2) frequency 898 (2029)
Length of P1 (segments) 2.28 (0.69)
Length of P2 (segments) 2.90 (0.75)
Length of O1 (letters) 2.90 (0.86)
Length of O2 (letters) 3.28 (0.96)
Lexical decision RT (ms) 720 (95)
Naming latency (ms) 676 (74)
Lexical decision accuracy (percent) 85 (18)
Naming accuracy (percent) 95 (8)
_____________________________________________________________________ Note: All frequency measures are per million.
26
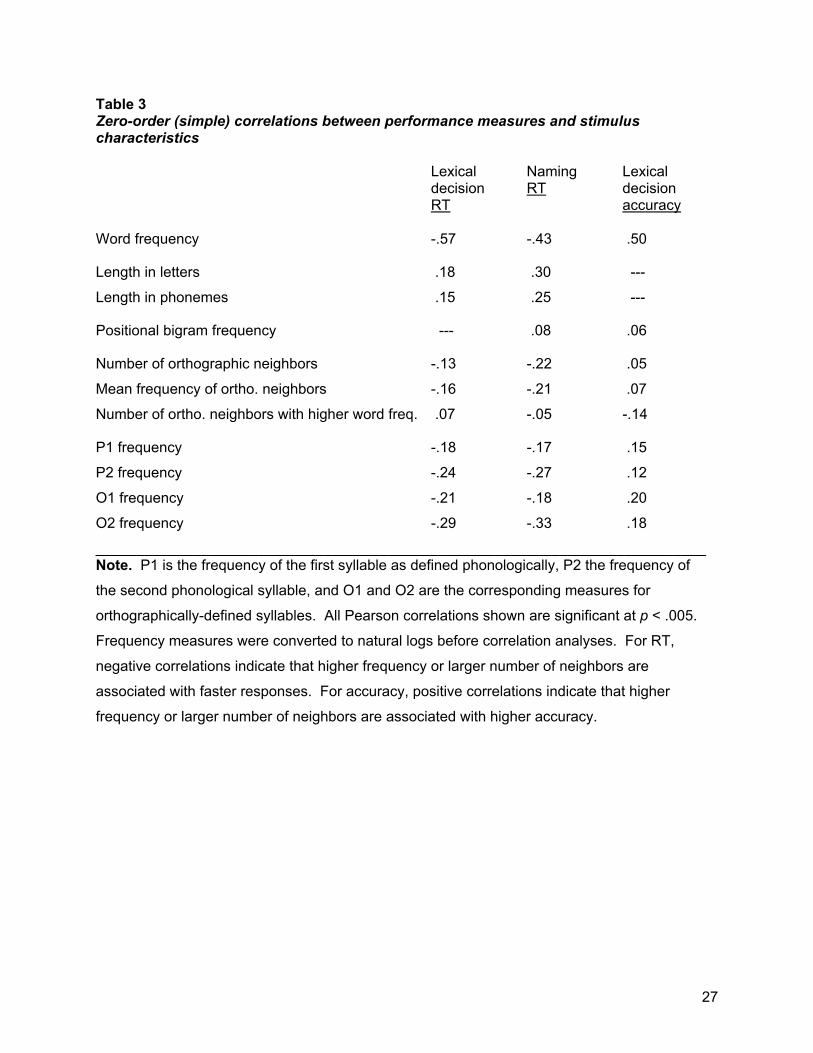
Table 3 Zero-order (simple) correlations between performance measures and stimulus characteristics Lexical Naming Lexical decision RT decision RT accuracy Word frequency -.57 -.43 .50
Length in letters .18 .30 ---
Length in phonemes .15 .25 ---
Positional bigram frequency --- .08 .06
Number of orthographic neighbors -.13 -.22 .05
Mean frequency of ortho. neighbors -.16 -.21 .07
Number of ortho. neighbors with higher word freq. .07 -.05 -.14
P1 frequency -.18 -.17 .15
P2 frequency -.24 -.27 .12
O1 frequency -.21 -.18 .20
O2 frequency -.29 -.33 .18
___________________________________________________________________________ Note. P1 is the frequency of the first syllable as defined phonologically, P2 the frequency of
the second phonological syllable, and O1 and O2 are the corresponding measures for
orthographically-defined syllables. All Pearson correlations shown are significant at p < .005.
Frequency measures were converted to natural logs before correlation analyses. For RT,
negative correlations indicate that higher frequency or larger number of neighbors are
associated with faster responses. For accuracy, positive correlations indicate that higher
frequency or larger number of neighbors are associated with higher accuracy.
27
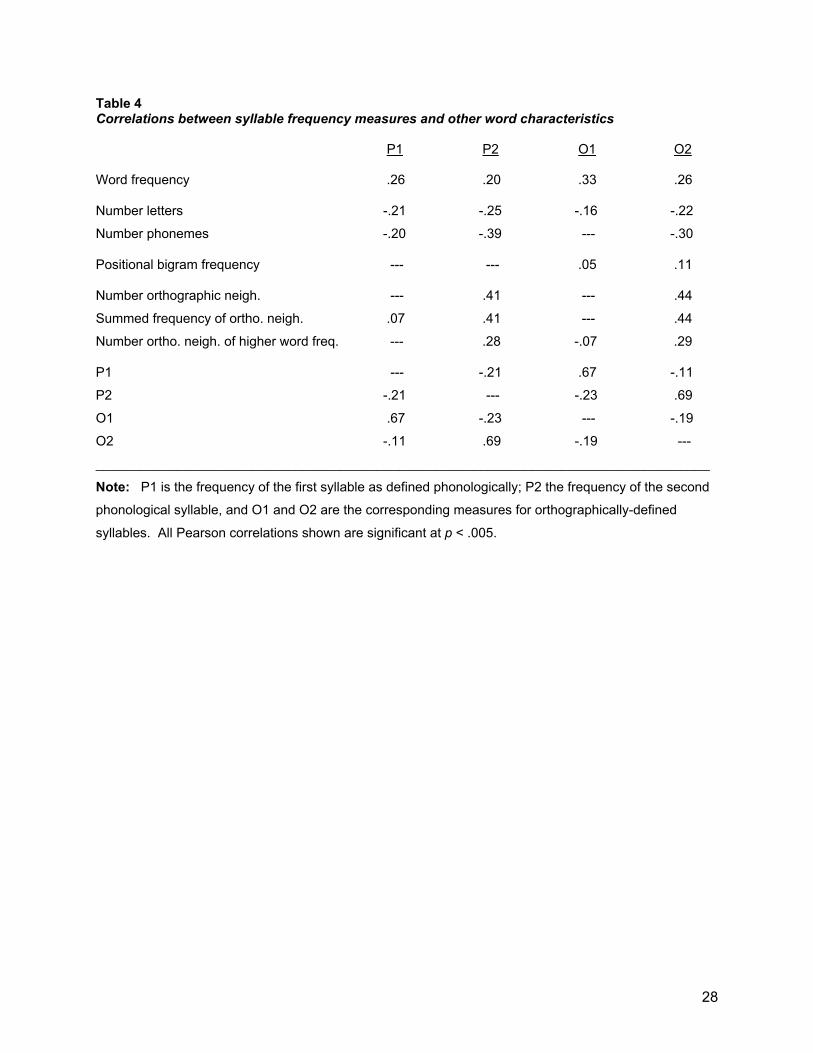
Table 4 Correlations between syllable frequency measures and other word characteristics P1 P2 O1 O2 Word frequency .26 .20 .33 .26
Number letters -.21 -.25 -.16 -.22
Number phonemes -.20 -.39 --- -.30
Positional bigram frequency --- --- .05 .11
Number orthographic neigh. --- .41 --- .44
Summed frequency of ortho. neigh. .07 .41 --- .44
Number ortho. neigh. of higher word freq. --- .28 -.07 .29
P1 --- -.21 .67 -.11
P2 -.21 --- -.23 .69
O1 .67 -.23 --- -.19
O2 -.11 .69 -.19 ---
___________________________________________________________________________________
Note: P1 is the frequency of the first syllable as defined phonologically; P2 the frequency of the second
phonological syllable, and O1 and O2 are the corresponding measures for orthographically-defined
syllables. All Pearson correlations shown are significant at p < .005.
28
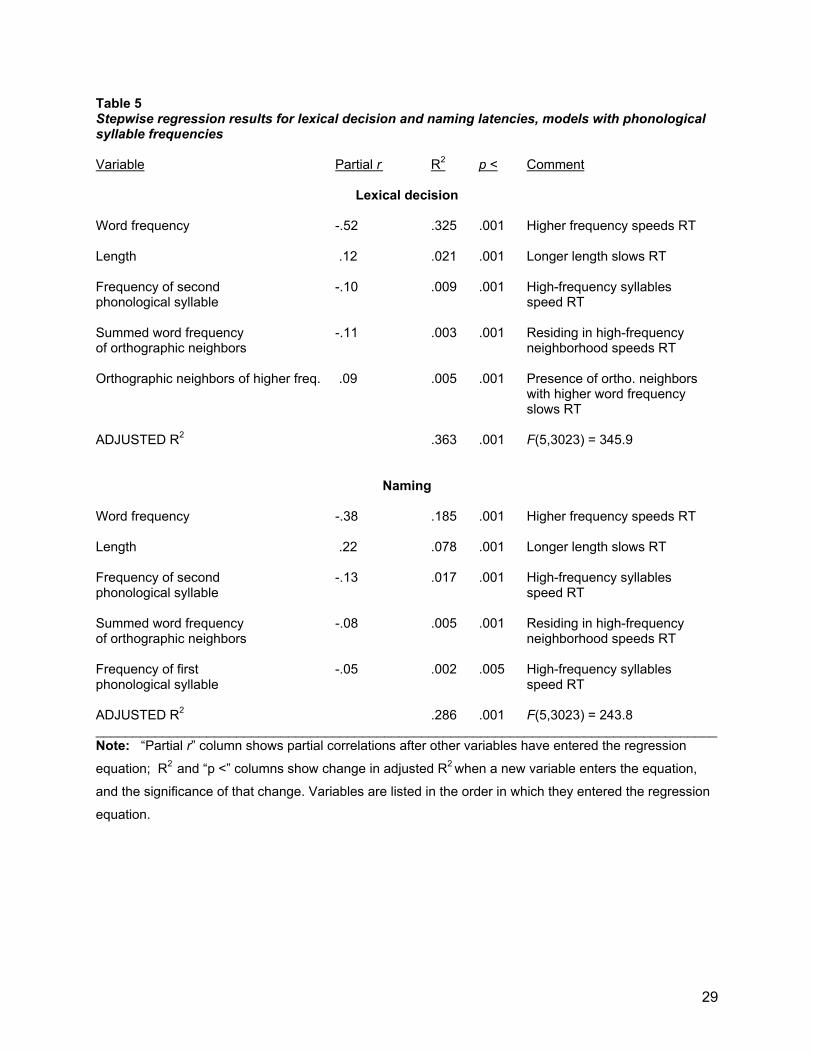
Table 5 Stepwise regression results for lexical decision and naming latencies, models with phonological syllable frequencies Variable Partial r R2 p < Comment
Lexical decision Word frequency -.52 .325 .001 Higher frequency speeds RT Length .12 .021 .001 Longer length slows RT Frequency of second -.10 .009 .001 High-frequency syllables phonological syllable speed RT Summed word frequency -.11 .003 .001 Residing in high-frequency of orthographic neighbors neighborhood speeds RT Orthographic neighbors of higher freq. .09 .005 .001 Presence of ortho. neighbors with higher word frequency slows RT ADJUSTED R2 .363 .001 F(5,3023) = 345.9
Naming
Word frequency -.38 .185 .001 Higher frequency speeds RT Length .22 .078 .001 Longer length slows RT Frequency of second -.13 .017 .001 High-frequency syllables phonological syllable speed RT Summed word frequency -.08 .005 .001 Residing in high-frequency of orthographic neighbors neighborhood speeds RT Frequency of first -.05 .002 .005 High-frequency syllables phonological syllable speed RT ADJUSTED R2 .286 .001 F(5,3023) = 243.8 ____________________________________________________________________________________ Note: “Partial r” column shows partial correlations after other variables have entered the regression
equation; R2 and “p <” columns show change in adjusted R2 when a new variable enters the equation,
and the significance of that change. Variables are listed in the order in which they entered the regression
equation.
29
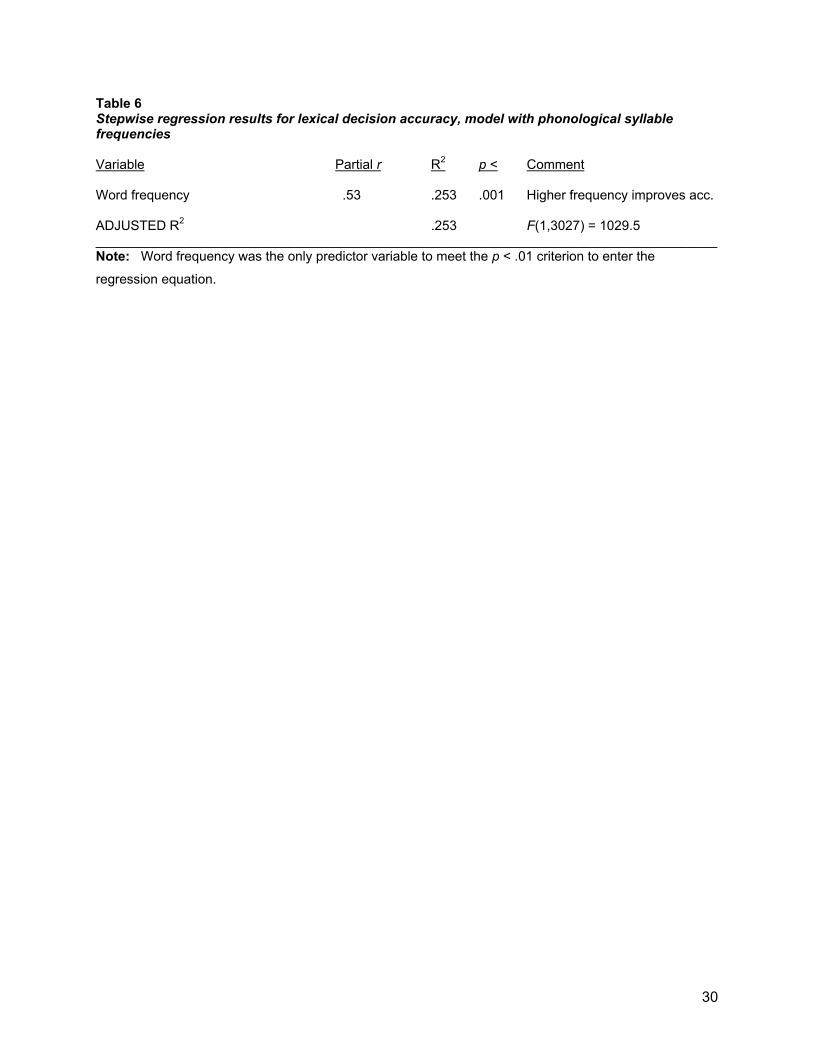
Table 6 Stepwise regression results for lexical decision accuracy, model with phonological syllable frequencies Variable Partial r R2 p < Comment Word frequency .53 .253 .001 Higher frequency improves acc. ADJUSTED R2 .253 F(1,3027) = 1029.5 ____________________________________________________________________________________ Note: Word frequency was the only predictor variable to meet the p < .01 criterion to enter the
regression equation.
30
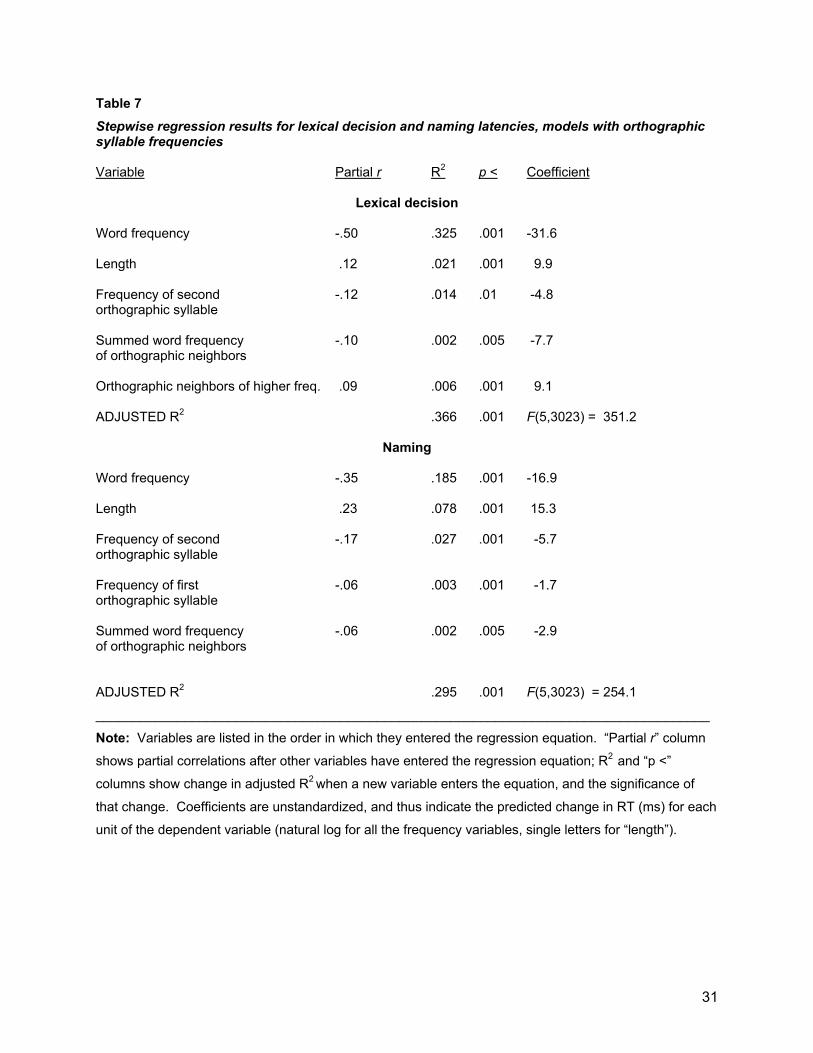
Table 7 Stepwise regression results for lexical decision and naming latencies, models with orthographic syllable frequencies Variable Partial r R2 p < Coefficient
Lexical decision Word frequency -.50 .325 .001 -31.6 Length .12 .021 .001 9.9 Frequency of second -.12 .014 .01 -4.8 orthographic syllable Summed word frequency -.10 .002 .005 -7.7 of orthographic neighbors Orthographic neighbors of higher freq. .09 .006 .001 9.1 ADJUSTED R2 .366 .001 F(5,3023) = 351.2
Naming Word frequency -.35 .185 .001 -16.9 Length .23 .078 .001 15.3 Frequency of second -.17 .027 .001 -5.7 orthographic syllable Frequency of first -.06 .003 .001 -1.7 orthographic syllable Summed word frequency -.06 .002 .005 -2.9 of orthographic neighbors ADJUSTED R2 .295 .001 F(5,3023) = 254.1
___________________________________________________________________________________
Note: Variables are listed in the order in which they entered the regression equation. “Partial r” column
shows partial correlations after other variables have entered the regression equation; R2 and “p <”
columns show change in adjusted R2 when a new variable enters the equation, and the significance of
that change. Coefficients are unstandardized, and thus indicate the predicted change in RT (ms) for each
unit of the dependent variable (natural log for all the frequency variables, single letters for “length”).
31
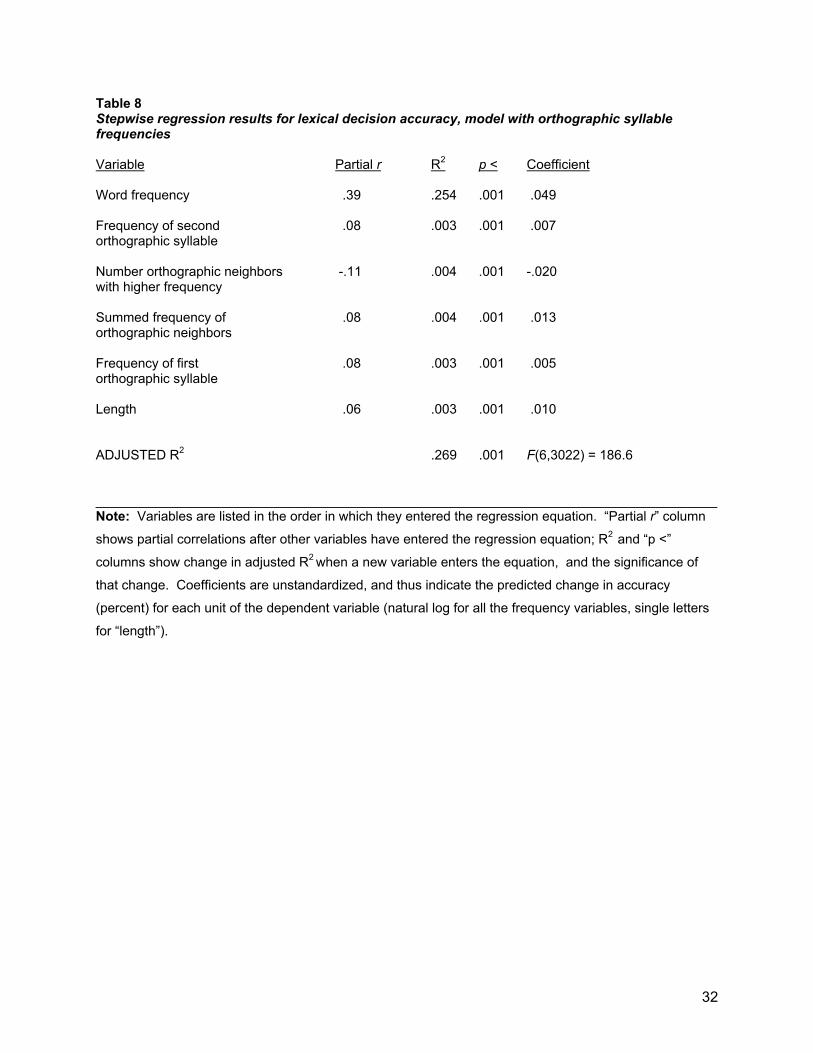
Table 8 Stepwise regression results for lexical decision accuracy, model with orthographic syllable frequencies Variable Partial r R2 p < Coefficient Word frequency .39 .254 .001 .049 Frequency of second .08 .003 .001 .007 orthographic syllable Number orthographic neighbors -.11 .004 .001 -.020 with higher frequency Summed frequency of .08 .004 .001 .013 orthographic neighbors Frequency of first .08 .003 .001 .005 orthographic syllable Length .06 .003 .001 .010 ADJUSTED R2 .269 .001 F(6,3022) = 186.6 ____________________________________________________________________________________ Note: Variables are listed in the order in which they entered the regression equation. “Partial r” column
shows partial correlations after other variables have entered the regression equation; R2 and “p <”
columns show change in adjusted R2 when a new variable enters the equation, and the significance of
that change. Coefficients are unstandardized, and thus indicate the predicted change in accuracy
(percent) for each unit of the dependent variable (natural log for all the frequency variables, single letters
for “length”).
32
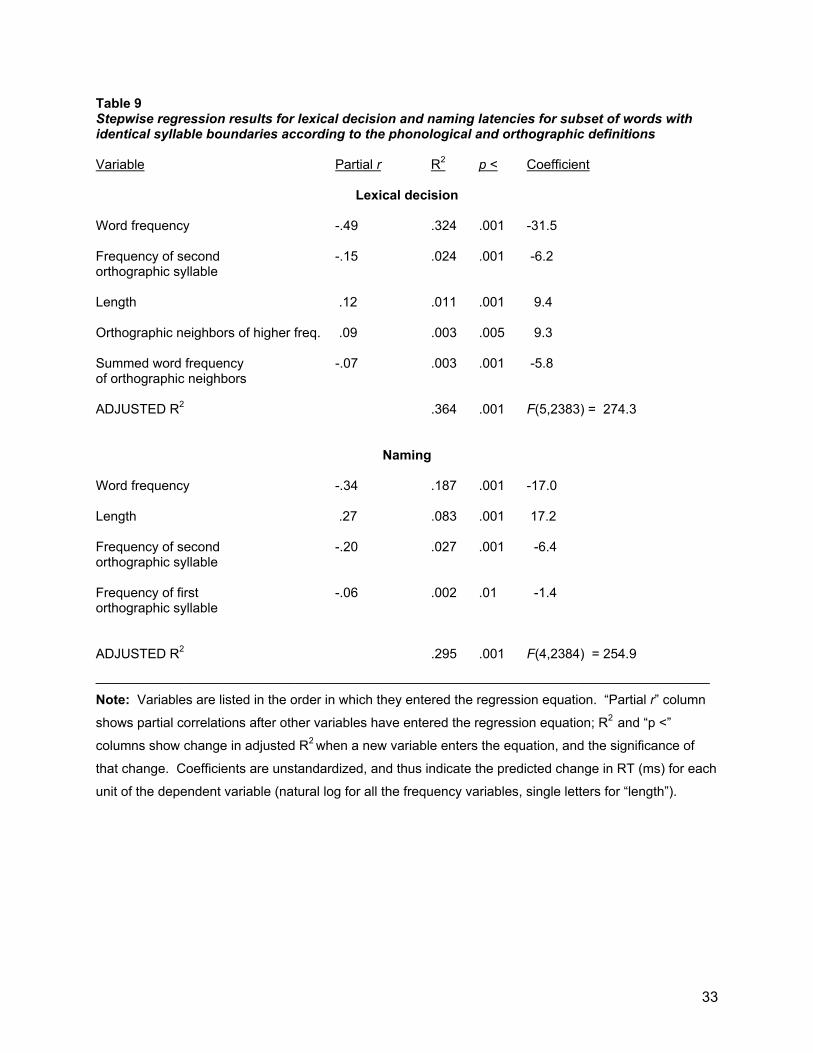
Table 9 Stepwise regression results for lexical decision and naming latencies for subset of words with identical syllable boundaries according to the phonological and orthographic definitions Variable Partial r R2 p < Coefficient
Lexical decision Word frequency -.49 .324 .001 -31.5 Frequency of second -.15 .024 .001 -6.2 orthographic syllable Length .12 .011 .001 9.4 Orthographic neighbors of higher freq. .09 .003 .005 9.3 Summed word frequency -.07 .003 .001 -5.8 of orthographic neighbors ADJUSTED R2 .364 .001 F(5,2383) = 274.3
Naming Word frequency -.34 .187 .001 -17.0 Length .27 .083 .001 17.2 Frequency of second -.20 .027 .001 -6.4 orthographic syllable Frequency of first -.06 .002 .01 -1.4 orthographic syllable ADJUSTED R2 .295 .001 F(4,2384) = 254.9
___________________________________________________________________________________
Note: Variables are listed in the order in which they entered the regression equation. “Partial r” column
shows partial correlations after other variables have entered the regression equation; R2 and “p <”
columns show change in adjusted R2 when a new variable enters the equation, and the significance of
that change. Coefficients are unstandardized, and thus indicate the predicted change in RT (ms) for each
unit of the dependent variable (natural log for all the frequency variables, single letters for “length”).
33
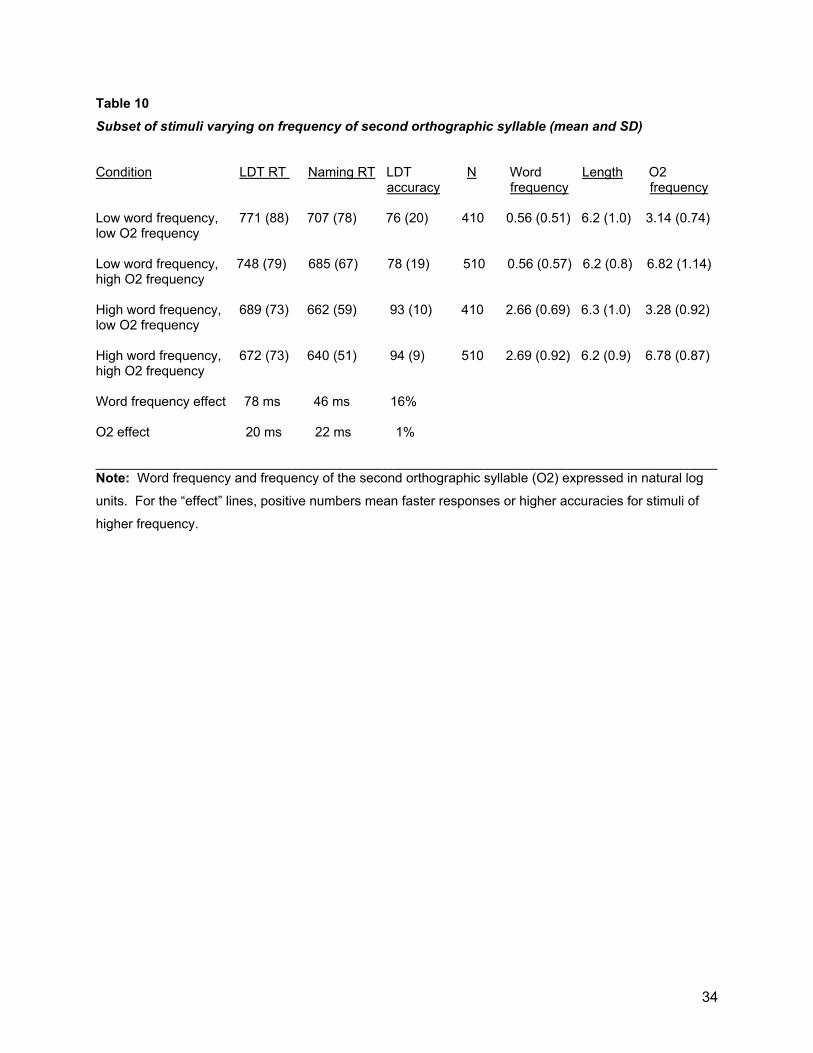
Table 10 Subset of stimuli varying on frequency of second orthographic syllable (mean and SD) Condition LDT RT Naming RT LDT N Word Length O2 accuracy frequency frequency Low word frequency, 771 (88) 707 (78) 76 (20) 410 0.56 (0.51) 6.2 (1.0) 3.14 (0.74) low O2 frequency Low word frequency, 748 (79) 685 (67) 78 (19) 510 0.56 (0.57) 6.2 (0.8) 6.82 (1.14) high O2 frequency High word frequency, 689 (73) 662 (59) 93 (10) 410 2.66 (0.69) 6.3 (1.0) 3.28 (0.92) low O2 frequency High word frequency, 672 (73) 640 (51) 94 (9) 510 2.69 (0.92) 6.2 (0.9) 6.78 (0.87) high O2 frequency Word frequency effect 78 ms 46 ms 16% O2 effect 20 ms 22 ms 1% ____________________________________________________________________________________ Note: Word frequency and frequency of the second orthographic syllable (O2) expressed in natural log
units. For the “effect” lines, positive numbers mean faster responses or higher accuracies for stimuli of
higher frequency.
34
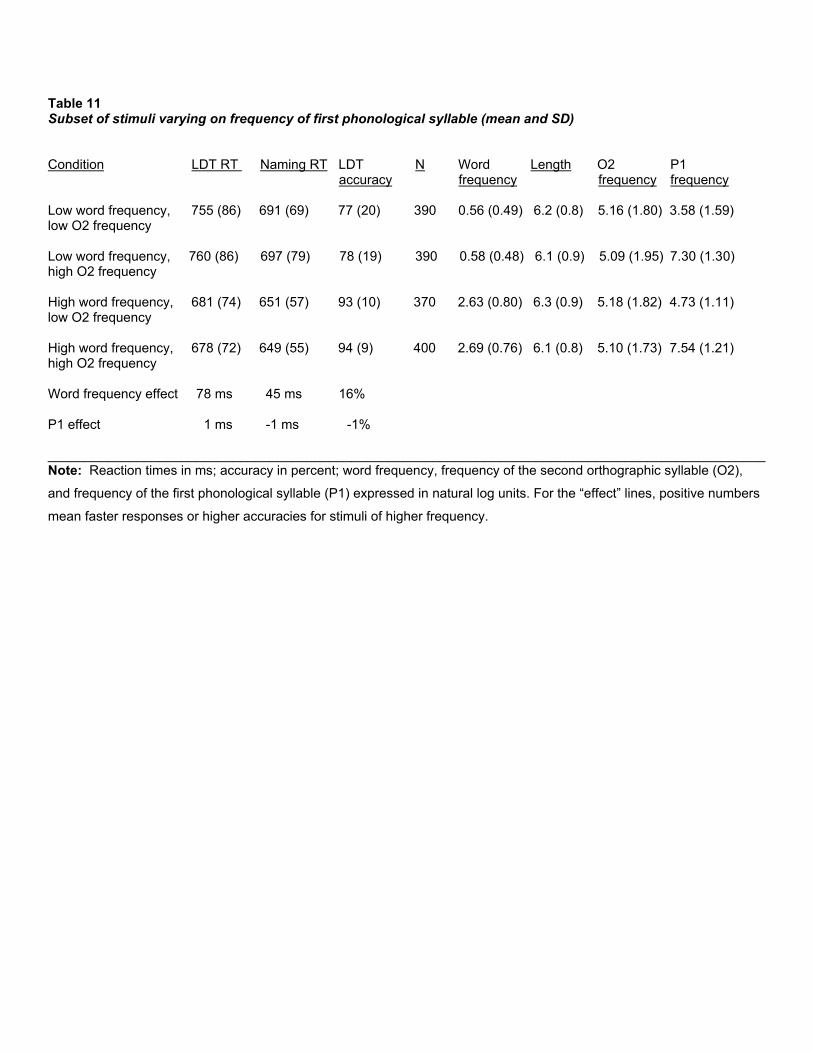
Table 11 Subset of stimuli varying on frequency of first phonological syllable (mean and SD) Condition LDT RT Naming RT LDT N Word Length O2 P1 accuracy frequency frequency frequency Low word frequency, 755 (86) 691 (69) 77 (20) 390 0.56 (0.49) 6.2 (0.8) 5.16 (1.80) 3.58 (1.59) low O2 frequency Low word frequency, 760 (86) 697 (79) 78 (19) 390 0.58 (0.48) 6.1 (0.9) 5.09 (1.95) 7.30 (1.30) high O2 frequency High word frequency, 681 (74) 651 (57) 93 (10) 370 2.63 (0.80) 6.3 (0.9) 5.18 (1.82) 4.73 (1.11) low O2 frequency High word frequency, 678 (72) 649 (55) 94 (9) 400 2.69 (0.76) 6.1 (0.8) 5.10 (1.73) 7.54 (1.21) high O2 frequency Word frequency effect 78 ms 45 ms 16% P1 effect 1 ms -1 ms -1% _________________________________________________________________________________________________ Note: Reaction times in ms; accuracy in percent; word frequency, frequency of the second orthographic syllable (O2),
and frequency of the first phonological syllable (P1) expressed in natural log units. For the “effect” lines, positive numbers
mean faster responses or higher accuracies for stimuli of higher frequency.