switchable charged surfaces to regulate bacterial...
TRANSCRIPT

Switchable charged surfaces to
regulate bacterial adhesion
by Alice Pranzetti
A thesis submitted to The University of Birmingham
for the Degree of DOCTOR OF PHILOSOPHY
School of Chemical Engineering
College of Physical Sciences and Engineering
The University of Birmingham
December 2013

University of Birmingham Research Archive
e-theses repository This unpublished thesis/dissertation is copyright of the author and/or third parties. The intellectual property rights of the author or third parties in respect of this work are as defined by The Copyright Designs and Patents Act 1988 or as modified by any successor legislation. Any use made of information contained in this thesis/dissertation must be in accordance with that legislation and must be properly acknowledged. Further distribution or reproduction in any format is prohibited without the permission of the copyright holder.
ABSTRACT
The studies of biointerfaces, interfaces between synthetic materials and biological
systems, such as bacteria, represent, by definition, a highly interdisciplinary field
spanning across the disciplines of physics, materials science, engineering, chemistry,
biology, bioinformatics and medicine. The main approach in biointerfacial science
involves the preparation and characterisation of functional surfaces for specific
interactions with bio-systems, and studies of the molecular and kinetic processes
occurring at such interfaces, ranging from small molecules and biomolecular
interactions, to cell and bacteria adhesion. Advanced material engineering techniques,
such as self-assembly can structure surfaces that allow dynamic tuning of their
properties (i.e. wettability and superficial charge). Recently, switchable surfaces able
to undergo conformational switching in response to an applied external stimulus were
shown to be suitable platforms for controlling cellular responses.
In this context, the design and fabrication of a two-component electrical
switchable SAM able to undergo conformational reorientation upon an applied
electrical stimulus will be described. This dynamic platform will be used for the first
time to gain new insights on the non-specific bacterial adhesion to surfaces in real-
time.
An overview of the thesis layout is given in Figure I.

Figure I Schematic representation of the thesis layout. The numbers shown in the scheme refer to the number of the chapter.
Chapter 1 – Introduction on Bacterial Adhesion and Self-Assembled Monolayers.
This chapter presents an:
a) Introduction on bacterial adhesion to man-made surfaces and brief description of
the biofouling process.
b) Introduction to SAM fabrication and their role in the study of bacterial adhesion. The
improvements made with the introduction of stimuli-responsive SAMs will be discussed
along with examples.
Chapter 2 – Surface characterisation techniques. Presents the surface
characterisation techniques employed in this Thesis.

Chapter 3 – Monitoring bacterial adhesion on one−component SAMs by Surface
Plasmon Resonance. This chapter describes the bacterial adhesion process
measured by Surface plasmon resonance (SPR), occurring on surfaces with different
wettabilities and different surface charges. In addition, an evaluation of the role of
extracellular polymeric substances (EPS) in bacterial adhesion will be discussed.
Chapter 4 – Fabrication and characterisation of two−component switchable
SAMs. On the basis of the results obtained in Chapter 3, this chapter describes the
fabrication and characterisation of an electrically switchable SAM having the
characteristics to both attract and repel bacterial cells.
Chapter 5 – Probing electrochemical switching by Sum−Frequency Generation.
The chapter describes the use of SFG for probing the conformational switching ability,
upon applying an electric potential, to a model electrically switchable.
Chapter 6 – Monitoring Bacterial adhesion on electrically switchable
two−component SAMs by Surface Plasmon Resonance. This chapter investigates
the bacterial adhesion on the surface fabricated in Chapter 4, as function of applied
potential, as measured by SPR. In addition, a discussion on the difference between
the early adhesion stage and the involvement of EPS in bacterial attachment will be
presented.
Chapter 7 – Experimental procedures, protocols and synthesis. Describes the
details of experimental procedures employed during the investigations performed in
this thesis.

Chapter 8 – Conclusions and future work
Chapter 9 – References

ACKNOWLEDGMENT
This thesis is the outcome of three years research carried out partly at the School of
Chemical Engineering, the School of Chemistry and the School of Bioscience of the
University of Birmingham and partly at the NESAC Bio Department of the University of
Washington.
This work would have not been possible without the great supervision and support of
Prof P. M. Mendes and Prof J. A. Preece who I would like to thank first.
Prof Paula M. Mendes has been untiring in her work on guiding me through my PhD
and her energy and her encouragements have helped me to achieve the most from my
research. She has been there for me every time I needed even during her maternity
leave. With her optimism she was able to ease all the difficult moments during my
research; in fact, she was always able to turn the unsuccessful research experiences
in opportunity to improve my work and she has been inspirational as both researcher
and woman. Thanks Paula.
Prof Jon A. Preece has been an important driver for the progress of the research during
the past three years. His thoroughness and astonishing carefulness for details has
been an inspiration that has not only improved this work, but also taught me valuable
lessons for my actual job. His realistic and always sensible reasoning has been of great
importance to keep progressing. Most of all I would like to thank Jon for giving me the

opportunity to work at the University of Birmingham and introducing me to his great
group and to Paula.
Special thanks go to Prof James Callow and Dr Maureen Callow for their guidance
through the “biofouling world”. They gave me the opportunity to create an excellent
research network and they promote my research every time they had the opportunity
to do so. It was a pleasure to collaborate with you throughout my PhD. Thank you so
much Jim and Maureen.
Thanks must go to Prof Patrick Koelsch for hosting me a month and a half at the
University of Washington. It has been a unique experience and together we have made
a good piece of research. Patrick, I will never forget your hospitality and your good
mood.
I would also like to thank the Post Doc researchers who helped me during my PhD. In
particular, thanks to Dr Stephanie Salaun and Dr Sophie Mieszkin who thought me
how “to deal” with marine bacteria and collaborate with me for the production of my
first two papers. Thanks must go to Dr Parvez Iqbal, Dr Frankie Rawson and Dr Cheng
Yeung who supported me with the chemistry synthesis, the electrochemistry and the
surface chemistry, respectively. Your constant teachings have helped me to progress
quickly and smoothly.
Thanks must also go to the members of both the Preece and Mendes group past and
present, namely Dr. James Bowen, Alex Stevenson- Brown, Marzena Allen, Dr Oliver
Curnick, Minhaj Lashkor, Vivek Davda, Dr Cait Costello, Rachel Allen, Bhoomi Savla,
Nga Yip, Jill Newton and Zarrar Hussein. I would also like to thank the many students,

researchers, academics and many more people besides who have given me so much
support and confidence throughout the duration of this project. These include Dr Alex
Cremonesi, Dr Renate Gleixner, Dr Parmjit Heer and Dr Peter Jervis.
Thanks as well to all the members of the Seacoat consortium. I was extremely lucky
to meet you and we really had a great time together.
Many thanks also to all the staff of “The centre for Chemical and Biochemical Analysis”,
in particular to Mr P. R. Ashton, Dr. N. Spencer, Mr N. G. May and Mr G. D. Burns.
Finally, I would like to thank my family, Romolo, Loriana and Michela and my partner,
Max for their support and encouragements during my studies and my friend Jessie
Mercedes Venegas Garcia for her irreplaceable company and friendship.

TABLE OF CONTENTS
1.0 CHAPTER 1 1
INTRODUCTION ON BACTERIAL ADHESION AND SELF-ASSEMBLED
MONOLAYERS 1
1.1 Bacterial biofouling: Introduction 1
1.2 Bacteria adhesion mechanism 2
1.2.1 Bacteria classification: Gram positive and Gram negative 5
1.3 Organic thin films 9
1.3.1 Self−assembled monolayers (SAMs) 10
1.3.1.1 Surfactant 11
1.3.1.2 Substrate 13
1.3.2 SAMs formation (thiol−gold) 14
1.3.3 SAMs classification 17
1.3.3.1 Static SAMs 17
1.3.3.1.1 Multicomponent static SAMs 18
1.3.3.2 Bacterial adhesion on static SAMs 22
1.3.4 Dynamic SAMs 27
1.3.4.1 Electrically−Controlled Switchable SAMs 29
1.4 Concluding remarks 35
1.5 PhD Aim and Objectives 36
2.0 CHAPTER 2 40
SURFACE CHARACTERISATION TECHNIQUES 40
2.1 Contact angle measurements 40
2.2 X−ray photoelectron spectroscopy (XPS) 44
2.3 Infrared Spectroscopy 46

2.3.1 FT−IRRAS 47
2.4 Ellipsometry 50
2.5 Surface plasmon resonance (SPR) 53
2.6 Sum−frequency generation spectroscopy 62
2.7 Electrochemical techniques 66
2.7.1 Chronoamperometry 66
2.7.2 Linear sweep voltammetry 67
2.7.3 Cyclic Voltammetry 70
2.8 Fluorescent microscopy techniques 77
2.8.1 Conventional fluorescence microscope 77
2.8.2 Scanning Confocal Laser Microscopy (SCLM) 79
3.0 CHAPTER 3 81
MONITORING BACTERIAL ADHESION ON ONE−COMPONENT SAMS BY
SURFACE PLASMON RESONANCE 81
3.1 Background 82
3.2 Methods used for the study of the bacterial adhesion process 83
3.2.1 Plate counting 84
3.2.2 Staining 86
3.2.3 Concluding remarks on bacterial detection techniques 88
3.3 Aim 89
3.4 Objectives 90
3.5 Results and discussion 94
3.5.1 Fabrication of one−component SAMs 94
3.5.2 Characterisation of one−component SAMs 96
3.5.3 SPR Bacterial adhesion on SAMs (SPR assay 1) 98
3.5.3.1 SPR assay 0 98
3.5.3.1.1 Standard adhesion assay 103
3.5.3.2 SPR assay 1a 106

3.5.3.3 SPR assays 1b 108
3.5.3.4 SPR assay 2 110
3.6 Conclusions 117
4.0 CHAPTER 4 119
FABRICATION AND CHARACTERISATION OF TWO−COMPONENT
SWITCHABLE SAMS 119
4.1 Background 119
4.2 Aim 126
4.3 Objectives 127
4.4 Results and discussion 128
4.4.1 Surfactant Synthesis 128
4.4.1.1 Synthesis of dialkyl disulphide 3 128
4.4.1.2 Synthesis of fluorine dendron 6 130
4.4.1.3 Synthesis of fluorine dendron dialkyl disulphide 7 132
4.4.2 SAM formation 134
4.4.1.4 Fluorine dendron dialkyl disulphide SAM characterisation 135
4.5 Conclusion 138
5.0 CHAPTER 5 139
PROBING ELECTROCHEMICAL SWITCHING BY SUM−FREQUENCY
GENERATION 139
5.1 Background 140
5.2 Aim 142
5.3 Objectives 144
5.4 SAM fabrication 146
5.5 Investigation of biotin−KKKKC and biotin−KKKKC:TEGTby SFG 149
5.6 Electrochemical SFG 151

5.7 Reversibility of the switching proven by SFG 156
5.8 Conclusion 160
6.0 CHAPTER 6 161
MONITORING BACTERIAL ADHESION ON ELECTRICALLY SWITCHABLE
TWO−COMPONENT SAMS BY SURFACE PLASMON RESONANCE 161
6.1 Background 162
6.2 Aim 166
6.3 Objectives 167
6.4 Bacterial adhesion on switchable MUA–MET SAMs at fixed potential (+0.25
V; OC and – 0.25 V) 170
6.4.1 Validation of the experimental parameters 170
6.4.2 Bacterial adhesion e–SPR assay 175
6.5 Bacterial adhesion to switchable MUA–MET SAMs 180
6.5.1 Controls on MUA and MET one–component SAMs under electrical
stimulation 189
6.6 Bacterial adhesion to switchable MUA–MET SAMs in presence of EPS 191
6.6.1 Effect of EPS concentration for 20 min of conditioning time 192
6.6.2 Effect of conditioning time by using EPS T20 196
6.7 Conclusions 199
7.0 CHAPTER 7 200
EXPERIMENTAL PROCEDURES, PROTOCOLS AND SYNTHESIS 200
7.1 Experimental 200
7.1.1 Material 200
7.1.1.1 Glass substrate 200
7.1.1.2 Gold substrates 201
7.1.2 Chemicals 201

7.1.3 Analytical chemistry techniques 203
7.1.4 Synthesis 205
7.1.4.1 Synthesis of dialkyl disulphide 3 206
7.1.4.2 Synthesis of fluorine dendron 6 207
7.1.4.3 Synthesis of compound dendron dialkyl disulphide 7 208
7.1.5 Surface preparation 209
7.1.5.1 Cleaning of glassware 209
7.1.5.2 Cleaning of gold surfaces 209
7.1.5.3 One component SAMs fabrication 210
7.1.5.4 MUA−MET switchable SAMs fabrication 210
7.1.5.5 Biotin−KKKKC, TEGT, Biotin−KKKKC:TEGT SAMs fabrication 211
7.1.5.6 SAM formation on the gold coated CAF2 prism 211
7.1.6 Surface characterisation 212
7.1.6.1 Contact angle measurements 212
7.1.6.2 Ellipsometry measurement 212
7.1.6.3 X−ray Photoelectron Spectroscopy (XPS) 213
7.1.6.4 Electrochemical Sum Frequency Generation (SFG) 214
7.1.6.5 Zeta potential measurement 215
7.1.7 Bacterial assays 215
7.1.7.1 Marine bacterial strains and growth conditions 215
7.1.7.2 Bacterial adhesion by standard method 216
7.1.7.3 Bacterial adhesion measurements by SPR 217
7.1.7.4 EPS adhesion measurements by SPR 218
7.1.7.5 EPS−bacterial adhesion measurements by SPR 218
7.1.7.6 Viability of M. hydrocarbonoclasticus and C. marina at different
potentials applied 219
7.1.7.7 Bacterial adhesion to MUA−MET SAMs monitored by e−SPR 220
8.0 CHAPTER 8 222
CONCLUSIONS AND FUTURE WORK 222

8.1 Conclusions 222
8.2 Future work 226
9.0 REFERENCES 228

Chapter 1 Page 1
1.0 CHAPTER 1
Introduction on Bacterial Adhesion and Self-Assembled Monolayers
Part of this chapter is reproduced from the book chapter entitled “Stimuli−responsive
surfaces in biomedical applications”, Pranzetti, A., Preece, J. A. and Mendes, P. M.
contained in the book “Intelligent stimuli−responsive materials from well−defined
nanostructures to applications”, Li, Q, Wiley, Kent, USA, 2013.
Abstract: This chapter will provide background information on both the bacterial
adhesion mechanism and the role of self−assembled monolayers (SAMs) for
studying this process. The description of the PhD aim and objectives will follow this
introduction part.
1.1 Bacterial biofouling: Introduction
Artificial and natural surfaces in marine and freshwater environments suffer from the
problem of biofouling, which is defined as the unwanted aggregation of
microorganisms (bacteria), algae and invertebrate animals on the surface.1 Even
though the adhesion process is very important in the life−cycle of organisms, the
uncontrolled adhesion on man−made surfaces can have a number of adverse
consequences.1-2 The adhesion of bacterial cells on biomedical devices for instance,
could lead to infections and implants rejection, while settlement of marine bacteria on
ship's keels promote the adhesion of bigger organisms, such as algae and shells
Chapter 1 Page 2
responsible of leading to increased hydrodynamic drag.1-2 Traditionally, the problem of
biofouling has been tackled by trying to kill or repel the “infesting” micro and macro
organisms. Although these methods have been effective, their negative environmental
impact has led to the research of alternative solutions. For this reason, recently,
researchers3 have focused their effort in achieving a clear understanding of the
adhesion process by studying various organisms in relation with a number of different
surfaces with the ultimate aim of preventing biofouling.
1.2 Bacteria adhesion mechanism
A surface immersed in fresh or seawater becomes “conditioned” through the
adsorption of macromolecules2 which within few hours can determine the adhesion of
bacteria and unicellular algae. These early attached microorganisms aggregate
together to form a biofilm, which is often referred to as microfouling or slime.2 The
advantage of biofilm formation for bacteria is their protection against several external
stresses, such as antibiotics, changes in temperature, dehydration or detergents.4
Several factors are involved in the biofilm formation, including the cell wall properties3
and the external conditions (temperature, pH, shear stresses etc.).5
The formation of biofilm can be described in 4 steps as is depicted in Figure 1.

Chapter 1 Page 3
Figure 1 Schematic model of the phases involved in biofilm formation and bacterial adhesion to a surface.
Step I − Bacteria transport near the surface
Bacteria are passively, (through Brownian and gravitational forces), and/or actively,(i.e.
through the use of flagella), transported in the vicinity of the surface.6 Here, the bacteria
are in the “planktonic” state (in green, Figure 1) and are therefore unable to produce
extracellular polymeric substances (EPS).7
Step II − Adhesion of bacteria on the surface
This step consists in two separate stages.
1) The bacteria reversibly attach to the surface through nonspecific/reversible
adhesion by the means of weak and reversible physico−chemical interactions
(i.e. van der Waals and electrostatic interactions).8-9
2) Subsequently, a specific/irreversible adhesion takes place.

Chapter 1 Page 4
Step III − Biofilm formation
The bacteria start to proliferate and secrete a substance with remarkable adhesives
properties, the extracellular polymeric substances (EPS). The EPS enable the
organisms to firmly attach to the surfaces and quickly embeds the bacteria in a three
dimensional (3D) matrix forming the biofilm. The content of EPS secreted by the
bacteria includes water and many kinds of mostly polyanionic macromolecules, such
as polysaccharides, proteins, humic substances, nucleic acids and lipids. At this stage,
the adhesion of bacteria is based on the hydrophobic and electrostatic interactions
between the carbohydrate and protein components in the EPS and the substrate.10-11
Step IV − Maturation of the biofilm and detachment/migration
After biofilm establishment, both non−adherent and some adherent cells escape from
the slime layer, either by switching off slime production through a mechanism of
phenotypic modulation, or by exhaustion conditions that support slime production.
Once free, these cells can repeat the colonisation process on other sites of the surface
(Figure 1).12
These 4 steps describing the microbial adhesion interactions are also illustrated by two
main physico−chemical theories: the thermodynamic approach and the DLVO
(Derjaguin, Landau, Verwey, Overbeek) theory.13 The thermodynamic approach is
based on the differences in surface free energy, (ΔG), between the solid−bacteria and
the bacteria−liquid interface, without taking into account any possible electrostatic
interactions.14 The adhesion will successfully occur only if the ΔG of the solid−bacteria
system is lower than the individual ΔG of the bacteria and solid entity. Alternatively,
the classical DLVO theory of colloid stability describes the bacteria−solid interactions

Chapter 1 Page 5
on the basis of van der Waals and electrostatic interactions (Coulombic forces) taking
also into account their decay with increasing distance between the bacteria and the
substrate.15 Van der Waals forces are always attractive and strong at shorter distances
between neutral stable molecules while Coulombic electrostatic interaction forces
could be attractive or repulsive depending on the surface charge of the interacting
particles. An improvement of this theory has been achieved with the extended DLVO
model. This approach considers also the acid−base interactions and involves the
electron donating−accepting abilities of the different adhering materials.16-18
1.2.1 Bacteria classification: Gram positive and Gram negative
In all the theories described in the previous paragraph, bacteria are highly
simplified and often regarded as spherical particles while the real envelope of bacteria
is elastic and porous and may change in terms of its protein composition.19
Bacteria can be divided in two main types based on the structural differences in their
cell walls surrounding the cytoplasmic membrane.20-21 In particular, bacteria having a
thick external layer of peptidoglycan are called Gram positive bacteria while bacteria
having a thinner peptidoglycan layer are called Gram negative bacteria (Figure 2).

Chapter 1 Page 6
Figure 2 Gram positive and Gram negative bacteria. A Gram positive bacterium has a thick layer of peptidoglycan while a Gram negative bacterium has a thin peptidoglycan layer and an outer membrane.
The Gram positive cell wall may also include other components such as teichoic and
lipoteichoic acids and complex polysaccharides (usually called C polysaccharides).
These molecules are common surface antigens that distinguish bacterial serotypes
and promote attachment to other bacteria as well as to specific receptors on
mammalian cell surfaces (adherence promoter). Teichoic acids are also important
factors in virulence. Lipoteichoic acids are shed into the media and host and, although
weaker, can initiate endotoxic-like activities.
For the Gram negative bacteria, on the contrary there are no teichoic or lipoteichoic
acids in the cell wall. External to the peptidoglycan layer is the outer membrane, which
is unique to Gram negative bacteria. The area between the external surface of the
cytoplasmic membrane and the internal surface of the outer membrane is referred to
as the periplasmic space. This space is actually a compartment containing a variety of
hydrolytic enzymes, which are important to the cell for the breakdown of large

Chapter 1 Page 7
macromolecules for metabolism. These enzymes typically include proteases,
phosphatases, lipases, nucleases, and carbohydrate-degrading enzymes. In the case
of pathogenic Gram negative species, many of the lytic virulence factors such as
collagenases, hyaluronidases, proteases, and beta-lactamase are in the periplasmic
space. This space also contains components of the sugar transport systems and other
binding proteins able to facilitate the uptake of different metabolites and other
compounds. Some binding proteins, can be components of a chemotaxis system,
which senses the external environment of the cell and promote the adhesion to
surfaces.22
There are two major classes of protein adhesins: the non-fimbrial adhesins consisting
of a single protein of homotrimers and the fimbrial adhesins with pili composed of
hetero-polymers of several subunits. The assembly of fimbrial as well as non-fimbrial
adhesins involves the function of different secretion systems, and for several adhesins,
specific branches of common secretion pathways evolved.23 Some of the most
common binding proteins present in both Gram positive and Gram negative bacteria
are called biofilm-associated protein or Bap proteins which are implicated in the
mechanism of biofilm formation.24 Other adhesive proteins, known as MSCRAMMs
(microbial surface components recognising adhesive matrix molecules), anchored by
a specific enzyme called sortase in Gram positive bacteria, for instance, are able to
target the host's extracellular matrix proteins (ECM) like collagen, fibrinogen and
fibronectin promoting the Gram positive attachment.22
Bacterial cells have also various appendages, like pili, curli, etc. which are
responsible for bacterial movements, and may specifically interact with the surface.
These appendages have the role to enter in contact with the surface to be colonised

Chapter 1 Page 8
and establish non covalent and hydrophobic interactions in Gram negative bacteria
and covalent linkages in Gram positive bacteria.
Further, the cell shape varies depending on bacterial species, strains and
growth phase, thus adding to the complexity of the mechanisms through which bacteria
attach to a surface.18, 25 Moreover, these theories do not consider the capability of
bacteria to sense the surface and change the metabolism, in response to the contact
with the substrate.26 These specific modifications are still not fully understood and,
hence, can hardly be described in the above theories of bacterial adhesion.13
In addition to the bacteria characteristics, the physicochemical properties of a
surface including surface chemistry, charge, surface roughness and wettability are
generally believed to be closely involved in influencing the bacterial adhesion
process.27-28 Nevertheless, many aspects of the competing mechanisms that regulate
such adhesion remain unclear, in particular, those related to the role of extracellular
polymeric substances (EPS) in the initial adhesion stage.29 EPS are subdivided into
‘planktonic’ or ‘bound’, depending on whether the polymeric material is released into
the surrounding medium, or remains in close association with the bacterial cell
surface.29 Although it has been suggested that the presence of a layer of EPS on a
surface facilitates, or is required for the initial adhesion of bacteria,30-32 this has been
insufficiently examined to date. This incomplete examination is in part due to the lack
of suitable tools that can quantify EPS adsorbed onto surfaces and account for its
impact on bacterial adhesion.33
To conclude this short overview on bacterial adhesion, the rate of the fouling
process, the composition of the biofilm and the adhesion strength are strongly

Chapter 1 Page 9
influenced by the type of bacteria as well as from the physical and chemical
characteristics of the surface.10 The simplest approach to study the adhesion process
consists in being able to fabricate surfaces with controllable properties. Even though
this is a challenging task the development of easy to assemble, homogeneous and
well−defined substrates such as organic thin films have been achieved. In particular,
the successful fabrication and employment of SAMs in many other fields have
encouraged their use as ideal platforms to investigate the adhesion phenomena
between the bacterial cells and these substrates.34
1.3 Organic thin films
Thin films of organic molecules on inorganic substrates have attracted considerable
attention for the past 30 years. Due to their versatility these structures are potentially
useful for a number of new applications, such as coating technology, optoelectronics,
sensors, and bio−medical devices.35 The main and appealing characteristic of organic
thin films is the possibility of obtaining the desired surface properties by attaching the
appropriate tail functional groups to a substrate. This adaptability have promoted their
main usage in the fabrication of electronic devices such as organic light emitting
devices (OLEDs) and organic thin−film transistors (OTFTs).36-37
Besides their versatility, the easiness of fabrication of organic thin films has been
crucial for their wide use and fast development. Their production entails the utilisation
of two techniques: the Langmuir−Blodgett technique and the self−assembly technique.
The former permit to produce physisorbed multilayers while the latter chemisorbed
monolayers38-39 of one or more surfactants. These techniques have been widely used

Chapter 1 Page 10
to create surfaces with a number of different characteristics. Details of the two different
fabrication methods have been extensively explained in numerous excellent reviews
and books.40-41 For the purpose of this work only the self−assembly technique will be
further discussed.
1.3.1 Self−assembled monolayers (SAMs)
In 1946, Bigelow et al.42 observed that molecules of hexadecane could reversibly
adsorb on platinum or glass substrates leading to smoother surfaces. They concluded
that these long−chain molecules were densely packed and therefore able to hide the
roughness of the underlying substrate. Only almost 20 years later SAMs started to be
commonly used for the modification of different substrates.43 For instance in 1983,
Nuzzo and Allara prepared the first thiolate−based SAM on a gold substrate,44
promoting the investigations of SAMs on gold substrates until today.39 SAMs have
been employed for a number of applications due to the ability of modifying the
substrates properties such as hydrophobicity, charge and biocompatibility.45 The
self−assembly technique is a spontaneous process based on the affinity between the
head group of a surfactant and a substrate. These two entities must have peculiar
characteristics in order to allow the spontaneous formation of a chemical bond. The
next two paragraphs describe the main characteristics that surfactants and substrates
must have for the self−assembly process to happen along with the different types of
surfactant/substrate chemical interactions commonly performed.

Chapter 1 Page 11
1.3.1.1 Surfactant
A surfactant molecule can be divided, from an energetic point of view, into three main
parts (Figure 3).41
Figure 3 General scheme of the structure of a surfactant molecule composed by a head group, a backbone and an end group.
The head group, is the portion which provides the most exothermic process: the
chemisorption of the surfactant on the substrate surface. This is due to the very strong
molecule−substrate interactions which results in an apparent pinning of the head group
to a specific site on the surface through a chemical bond. There are different head
groups that can be used to achieve the spontaneous chemisorption of a surfactant on
different substrates. The most commons are the covalent Si−O bond between the
alkyltrichlorosilanes and hydroxylated surfaces, the covalent slightly polar, Au−S bond
in the case of alkanethiols on gold (Au); or an ionic −CO2−Ag+ bond in the case of
carboxylic acids on AgO/Ag surfaces. As a result of the exothermic head
group−substrate interactions, the surfactant molecules tend to occupy all the available
binding sites on the surface. During this process, the molecules that have already been

Chapter 1 Page 12
chemisorbed are pushed away from the new arriving surfactants determining the
formation of crystalline molecular assemblies.39
The second molecular part is the backbone, which can be either
hydrophobic/hydrophilic46 or alkyl/aromatic.47 The nature of the backbone depends
upon the target SAM and its application. The backbone is the most important portion
in the chemisorption process. Most of the alkylic backbones sit at a precise tilt angle
normal to the plane of the substrate. Further to this tilt, there is a twist along the axis
of the backbone.39 Moreover, the length of the backbone is determining of a good
molecular ordering. Fourier transform infrared and electron diffraction studies suggest
that alkanethiols on Au have crystal−like periodicity, provided the backbone has a
chain length ≥ 10 carbon units.48 This crystal−like intermolecular order is a
manifestation of exothermic intermolecular forces acting between the surfactant
backbones. Van der Waals forces are typically the most common and most important
of these intermolecular interactions. Other intermolecular forces (electrostatics, π−π
interactions), may be present, depending on the nature of the backbone.39 Ordering
can also be influenced by heating of the monolayer which can result in a destabilising
effect.41
The third part is the end group, which, in the case of a simple alkyl chain, is a
methyl (CH3) group. This domain of the surfactant is the main responsible to the SAM
surface properties such as wettability (hydrophilic/hydrophobic end groups),49 charge
(i.e. NH3+ and COO− end groups), corrosion susceptibility, friction/lubrication50 and
bio−molecule immobilisation (bioactive end groups, i.e. biotin).48

Chapter 1 Page 13
1.3.1.2 Substrate
SAMs can be formed by using a number of different surfactants and substrates.
However, the most commonly used include organosilanes on hydroxylated surfaces
(SiO2 on Si, Al2O3 on Al, glass, etc.); alkanethiols on gold, silver and copper; dialkyl
sulfides on gold; alcohols and amines on platinum and carboxylic acids on aluminium
oxide, silver and indium tin oxide (ITO).41 In this section only the three most important
head group−substrate SAMs systems will be described.
Thiol−gold: Even though sulphur compounds have been found to bind strongly to Au,
Ag, Cu and Pt substrates, Au has received the most attention since SAMs on Au are
highly organised, easy to prepare and analyse. The main advantage of SAMs on Au,
compared to other substrates, is that oxide layers can form on the other metal
substrates, thus complicating SAM preparation on such surfaces. Furthermore, smooth
surfaces can be easily prepared on gold substrates, allowing a vast number of
analytical techniques to be used without the interference of the surface roughness.51
Self−assembly of thiols on gold is easy to achieve and can be carried out from vapours
and solutions, the latter one being the most popular due to simplicity and accessibility
in most laboratories.52
Silane–SiO2: Silane compounds form a strong bond with hydroxylated surfaces. The
most widely studied system is silanes on SiO2, since it represents the base material of
the microelectronics industry, a major driving force of early SAMs research. Silane
SAMs on SiO2 are less ordered than thiols on Au. Despite this loss of order, silane
SAMs on SiO2 are more chemically, thermally and mechanically stable (except in
presence of an aqueous base).53 Increased stability allows for extensive synthetic

Chapter 1 Page 14
modification post SAM formation.54 On the other hand, the formation of silane SAMs is
complicated by the inherent instability of silanes. In fact, silanes are much more
reactive than sulphur compounds. Furthermore, (trihydrolisable) silanes are prone to
water induced polymerisation, thus making the preparation of silane SAMs harder than
thiol SAMs.55-56
Silane–TCO: Interest in transparent conducting oxides (TCOs) as SAM substrates is
due mainly to their electrical conductivity and transparency.57 Within the TCO
substrates, the indium tin oxide (ITO) is the most widely studied. Despite our
knowledge of the bulk structure, the surface chemistry is poorly understood. The
systematic study of functionalised ITO surfaces is complicated by the large variation in
the topology of commercially available substrates from batch to batch, independent of
supplier. However, ITO has found many applications as a SAM substrate, namely on
organic opto−electronic devices, biosensors, solar cells, electro chromic windows, flat
panel displays, photovoltaic and probing cell−substrate interactions.58-59
For the purpose of this thesis, only thiol−gold SAMs will be further discussed.
1.3.2 SAMs formation (thiol−gold)
Self−assembly is initiated by the absorption of one or more type of surfactants onto the
substrate surface. The common way to produce SAMs is to put the cleaned substrate
in ethanolic solution of the corresponding thiols for approximately 24 h.60 Besides the
preparation in solution, gas phase deposition of alkanethiols can be also performed.61-
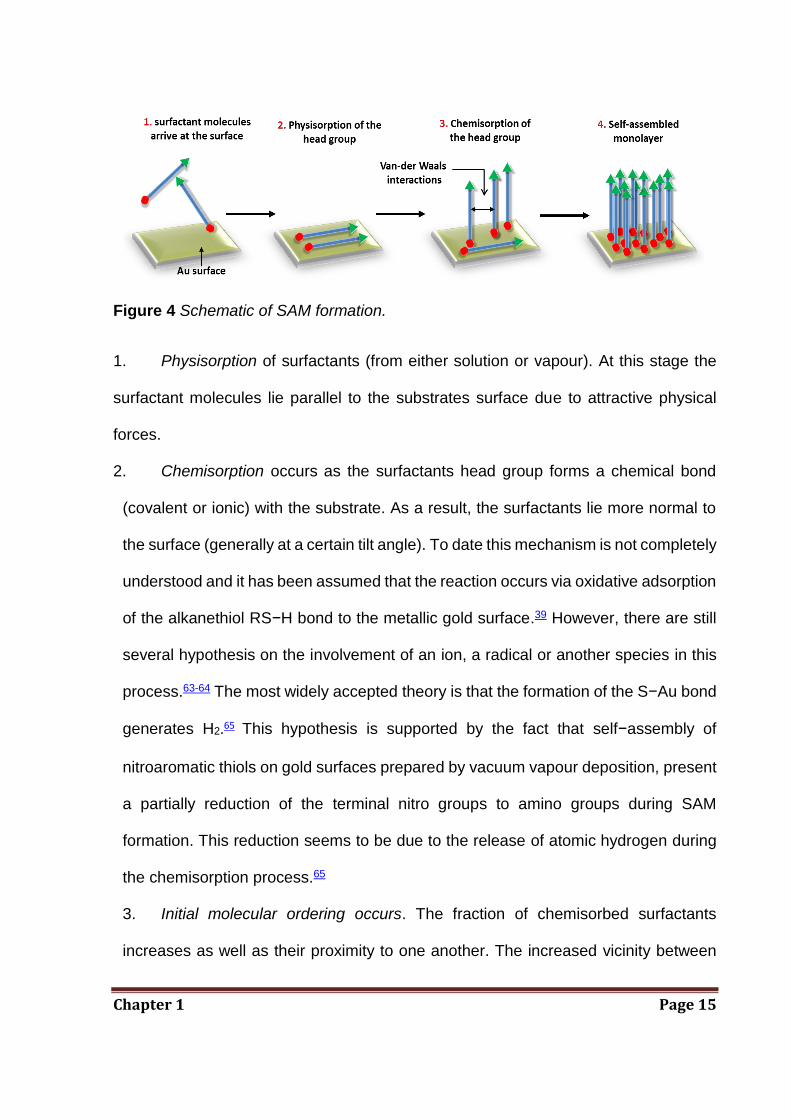
62 SAMs formation involves a four steps process (Figure 4).39
Chapter 1 Page 15
Figure 4 Schematic of SAM formation.
1. Physisorption of surfactants (from either solution or vapour). At this stage the
surfactant molecules lie parallel to the substrates surface due to attractive physical
forces.
2. Chemisorption occurs as the surfactants head group forms a chemical bond
(covalent or ionic) with the substrate. As a result, the surfactants lie more normal to
the surface (generally at a certain tilt angle). To date this mechanism is not completely
understood and it has been assumed that the reaction occurs via oxidative adsorption
of the alkanethiol RS−H bond to the metallic gold surface.39 However, there are still
several hypothesis on the involvement of an ion, a radical or another species in this
process.63-64 The most widely accepted theory is that the formation of the S−Au bond
generates H2.65 This hypothesis is supported by the fact that self−assembly of
nitroaromatic thiols on gold surfaces prepared by vacuum vapour deposition, present
a partially reduction of the terminal nitro groups to amino groups during SAM
formation. This reduction seems to be due to the release of atomic hydrogen during
the chemisorption process.65
3. Initial molecular ordering occurs. The fraction of chemisorbed surfactants
increases as well as their proximity to one another. The increased vicinity between

Chapter 1 Page 16
chemisorbed surfactants allows the formation of intermolecular forces between the
backbones chains of the surfactants. These exothermic intermolecular forces provide
the SAM with quasi−crystalline order.66 The completion of this process can take
several hours, depending on the nature of the backbone. For instance, it has been
reported that shorter chain alkanethiols adsorb faster than those with longer chains,67
as well as alkanethiols with small end groups adsorb faster than those carrying bulky
groups due to steric hindrance.67
4. Definitive molecular ordering. After the initial formation of the SAM more
ordering may take place after few hours to typically 24 h.39 However, not all the SAMs
are able to form a well ordered dense monolayers on Au (111) surfaces.68 It has been
shown that it needs at least a backbone of 10 C to achieve a crystalline−like
structure.39, 69 In this case, when maximum coverage is achieved the arrangement of
alkanethiolates on the Au (111) lattice form a (√3 x √3)R30° structure where the sulfur
atoms (orange circles, Figure 5a) are positioned in the 3−fold hollows of the gold
lattice. In this structure the distance between each pinning site is about 0.497 nm,
resulting in an area of each molecule of 0.214 nm2 (dashed line circles).39 Since the
cross−sectional area of the alkane chain is 0.184 nm2, this difference in density
requires that the alkyl chains tilt by an angle α=30−35° with respect to the surface
normal of the gold (Figure 5b).39, 70 This angle (α) provides the parameter to
maximise the van der Waals chain−chain interactions, leading to effective close
packed monolayers.39

Chapter 1 Page 17
Figure 5 Schematic representation of the arrangement of decanethiolates on Au (111) lattice when maximum coverage is achieved. (a) Structural model of the overlay structure formed by thiols on the gold lattice showing a (√3x√3)R30° structure. (b) Cross−section of the SAM formed from decanethiol showing the alkane chains tilting in the direction of their next−nearest neighbours.
1.3.3 SAMS classification
SAMs can be classified into static and dynamic by looking at their ability to change
their surface properties in response to an external stimulus applied. Below the two
different type of SAMs will be described.
1.3.3.1 Static SAMs
Static SAMs can be formed by either only one (one−component SAMs) or more
surfactants (mixed SAMs, i.e. two−component SAMs).

Chapter 1 Page 18
1.3.3.1.1 Multicomponent static SAMs
Formation of multicomponent SAMs is more complicated than single component
SAMs. Multicomponent SAMs can be formed by either selectively changing the end
group functionality, after one−component SAMs formation using a number of different
patterning methods (e.g., UV photolithography,71-72 electron−beam lithography73 and
micro−contact printing),74 or by co−adsorbing two or more species onto the substrate
during SAM formation.75-76 The latter is the route generally employed even though the
composition of co−adsorbed SAMs does not reflect the relative surfactant
concentrations in solution. Rather, the composition of mixed SAMs depends on both
adsorbate–solvent and backbone interactions that occur during SAMs formation.76
Furthermore, the formation of two−component SAMs has been reported to lead to
phase segregated mixed SAMs.77 Despite these difficulties, the fabrication of
two−component static SAMs have led to the achievement of highly engineered
surfaces.
The aim of building multicomponent SAMs is to present surfactants carrying an active
group/biomolecule spaced from inert surfactants. This spacing is crucial especially in
the biological environment, where the interaction of large molecules, such as proteins,
with specific ligands on the surface are dictated by both the shape of the molecule and
the binding orientation. In order to obtain such optimally spaced assembly several
methods have been implemented. It is noteworthy, for instance, the use of rotaxanes78
and cyclodextrin79 bulky groups to form complexes with the end−groups of surfactants
in order to ensure the correct spacing. However, these complexes formations have
been proven difficult to demonstrate by using the routine chemical analysis (i.e. proton

Chapter 1 Page 19
nuclear magnetic resonance, 1H−NMR, infrared spectroscopy, IR, and mass
spectroscopy, MS), therefore better spacing methods have been explored. For
instance, the introduction of highly branched 3D macromolecules,80 called dendrons,
which are able to be introduced and removed on demand to leave the desired space
on the surface have been described. In 2003, Hong et al.81.were able to create
well−defined monolayers by coupling a dendron with nine free carboxylic acid end
groups and a carboxybenzyl (CBZ) group at the apex to an aminosilane surface. The
CBZ group was then deprotected leading to an amino terminated monolayer. The
successfully removal of the protecting group was demonstrated by the reaction of the
amino group with 9−anthraldehyde to form an imine.81 In 2009, Tokuhisa et al.82
attempted to use dendrons in a mixed monolayer system to fabricate well defined and
optimally spaced monolayers. In this study, a dendron was attached to an anchor
molecule, (thioctic acid), that was able to be immobilised onto a gold surface via an
ester linkage. The spacing between the surfactants was controlled by the size of the
dendron used. The dendrons were then cleaved via hydrolysis, leaving behind spaces
between the acid−terminated chemisorbed components. Simultaneously, the space
provided by the dendrons removal, was filled with an inert backfiller, hydroxyl hexane
thiol. The carboxylic acid was then available to react with a
3,6−Dioxa−8−amino−octane−1−N−biotinamide (NH2EG−biotin) to produce an
optimally spaced and well−defined surface which could be used for biological
applications (Figure 6).

Chapter 1 Page 20
Figure 6 a) Fabrication of a dendrimer monolayer. b) Removal of dendron spacers and introduction of a matrix molecule–6−hydroxy−1−hexanethiol. c) Modification of the mixed SAM with a probe molecule−biotin.
The following paragraphs aim to give an overview on the use of one and multiple SAMs
for studying the bacterial adhesion process. In the work presented in this thesis, that
was developed within the European project SEACOAT, two marine bacteria, Cobetia
marina ATCC 2537,83 (C. marina, Cm), (Figure 7 a−b) and Marinobacter
hydrocarbonoclasticus, ATCC 49840,84 (M. hydrocarbonoclasticus, Mh), (Figure 7
c−d) have been chosen for performing the bacterial adhesion assays since they are
two of the most representative marine microfoulant bacterial species.

Chapter 1 Page 21
Figure 7 a) Optical and b) holographic microscopy images of C. marina; c) Optical and d) holographic images of M. hydrocarbonocalsticus.
These Gram−negative bacteria differ both in terms of wettability properties and EPS
productioncharacteristics. C. marina is a hydrophilic marine bacterium with a contact
angle of 15.5°, whereas M. hydrocarbonoclasticus is a hydrophobic marine bacterium
with a contact angle of 81.5°.85 Furthermore, C. marina produces large quantities of
extracellular polymeric substances which are rich in uronic acids,86 whereas the EPS
of M. hydrocarbonoclasticus is more enriched in lipids than carbohydrates, as well as
containing substantial proportions of waxy esters and sulphates.87-88 Even if both
species have extensively been used as model bacteria for studying the performance
of putative antifouling coatings suitable for the marine environment,85 the process, the
quantity and the effect of EPS on biofilm formation is still unclear.
Chapter 1 Page 22
In general, it is though that the ability of bacteria to colonise surfaces depends by a
mechanism named quorum sensing. This mechanism is directly correlated to the
bacterial population density and it is able to coordinate their gene expression for the
EPS production. A variety of different molecules can be used as signals. Common
classes of signaling molecules are oligopeptides, in Gram positive bacteria, N-Acyl
Homoserine Lactones (AHL) in Gram negative bacteria, and a family of autoinducers
known as autoinducer-2 (AI-2) in both Gram negative and Gram-positive bacteria.89
The pathogen Gram positive Staphylococcus aureus uses, for instance, quorum
sensing to coordinate several functions such as the formation of biofilms, swarming
motility, EPS production, virulence, and cell aggregation.90
The brief literature review on bacterial adhesion on SAMs, presented in the next
paragraph, mainly focuses on the bacteria used during the research work reported
herein.
1.3.3.2 Bacterial adhesion on static SAMs
The influence of surface chemistry is the most frequent topic of articles concerning the
study of bacterial adhesion. For instance, among the various types of surface coatings,
surfaces of ethylene glycol based coatings such as poly(ethylene oxide) (PEO),
poly(ethylene glycol) (PEG) and oligo(ethylene glycol) OEG coated surfaces are one
of the most widely studied, well characterised non-fouling systems which have been
shown to be effective in reducing protein adsorption,91 bacterial attachment,92 and in
vivo leukocyte attachment.93 The exact mechanism by which these surfaces resist non-
specific adsorption still remains unclear, but there are few speculations based on

Chapter 1 Page 23
detailed experimental and theoretical studies. DeGennes94 argued that when a protein
molecule approaches a surface coated with PEG chains, the water molecules bound
to the PEG through hydrogen bonding have to be expelled due to compression. Since
expulsion of bound water molecules is energetically unfavourable, the PEG molecules
do not allow the protein/cells to reach the substrate. Although this model was partly
successful in explaining systems with high molecular weight PEG, it could not explain
the results of studies using oligo(ethylene glycol) (OEG) (n<6) based SAM.95
Whitesides et al. studied OEG systems, alkane thiol SAMs with various hydrophobic
and hydrophilic end groups. Based on their studies they concluded that inertness of a
surface is not only the property of hydrated polymeric layers but this could also be due
to the structured water layer.96 The structured water layer could be formed due to
orientation of water molecules by dipole moments (extending over 3-4 layers of water
molecules) from hydration layer at interface as suggested by Grunze et.al. based on
computer simulations.97 They also experimentally showed that the conformation of
OEG was a very important structural aspect responsible for resistance towards protein
adsorption. The OEG SAMs formed on Au were protein resistant, while on Ag surface
the SAM was not resistant to protein adsorption. The constrained OEG molecules in
SAMs formed on Ag, due to higher packing density could not attain a helical
conformation, whereas the OEG molecules on Au could attain helical conformation and
hence protein resistance.98 The helical conformation enables the hydrogen bonding of
water molecule with oxygen atom of polyether chain. Despite all the efforts to ascertain
the precise mechanisms of such coatings, a universal explanation of the antifouling
properties of nonionic coatings is still the subject of much conjecture and research

Chapter 1 Page 24
effort. In addition, translating the theoretical findings into experimental coatings,
including stability issues, has proved challenging to surface science.
Other than the antifouling properties of glycol-based surfaces other
one−component SAMs have been widely used to observe the effect of wettability10, 99-
103 and charge104-105 when in contact with a bacterial suspension. For instance, Ista et
al.106 studied C. marina adhesion on SAMs terminating with hexa(ethylene glycol)
(CH2OH), methyl (–CH3), carboxylic acid (–COO−) and fluorocarbon groups (–
OC7F10CF3) and found that SAMs formed from hexa(ethylene glycol) were uniformly
resistant to bacterial attachment, with a 99.7% adhesion reduction when compared
with the other three surfaces examined. Similarly, Arpa–Sancet et al.107 quantified the
accumulation of C. marina on chemically different SAMs, terminating with methyl,
amino (–NH3+), and fluorocarbon groups. However, in this study, the preferences of
the bacterium for the surfaces were observed by measuring the degree of detachment
rather than the degree of adhesion. In fact, the bacteria were firstly adhered to the
surfaces and subsequently their detachment by shear stress was evaluated. Despite
without any shear stress the higher number of bacteria was found on the positive
surface, (i.e. NH3+), when the shear stress was applied, the higher number of bacterium
remained on the most hydrophobic surface (i.e. OC7F10CF3). In order to achieve further
insights on the link between wettability and bacterial adhesion, Ista et al. investigated
the effect of varying the chemical composition of mixed monolayers on microbial
attachment.108 In this work, two series of mixed monolayers were produced, consisting
of methyl− and hydroxyl− terminated and methyl−and carboxylic acid−terminated
SAMs with almost identical contact angles. The attachment of C. marina and algal
spores was then tested on each series. C. marina attached in increasing numbers to

Chapter 1 Page 25
SAMs with decreasing advancing water contact angles independently from the charge
of the surface (i.e. neutral (OH) or negatively charged (COO−)).
Despite the link between surface wettability and bacterial adhesion has been confirmed
by a number of published works, (being it marine bacteria or not), recently, contrasting
outcomes have been presented.109 For instance, Ederth et al. have studied C. marina
and M. hydrocarbonoclasticus adhesion to different galactoside−terminated SAMs,
(Figure 8). 110
Figure 8 Chemical structures of the three galactoside−terminated thiols (1−3) forming the single−component SAMs and hydroxylated (4a) and methylated (4b) alkylthiols forming a mixed monolayer in a ratio of 1:3, respectively.
In contrast with previous publications,85, 111 both bacteria were found to adhere in
higher number to the hydrophilic surfaces (1 and 4, Figure 8). Furthermore, when
surfaces with increasing contact angle were compared, it was not possible to relate the
extent of bacterial attachment to the decrease in surface wettability emphasising a
probable main role of surface chemistry in favour of wettability, for these surfaces. The
authors also suggested that wetting behaviour is a poor determinant for attachment of

Chapter 1 Page 26
marine organisms, and that water adsorption or uptake in the layer emerge as much
more likely candidates for determining the different adhesion on these molecular films.
Likewise, the authors highlighted the importance of the media ingredients (rich or poor
in nutrients) and the bacteria strain in playing a crucial role in the bacterial adhesion
differences.110
As mentioned at the beginning of this section, surface charge also seems to
strongly influence bacterial adhesion. Several research groups have investigated the
impact of charged one−component SAMs on bacterial adhesion.10, 112-113 Positively
charged surfaces, for instance, appear to promote bacterial adhesion, owing to the
attractive electrostatic interactions with the negatively charged bacterium surface.114
However, some literature reports claim that bacteria preferentially adhere on surfaces
with a similar zeta potential to the one of the external bacteria membrane (or wall).115
As in the case of studies on surface wettability, many attempts to associate cell surface
charge with cellular adhesive behaviour have been made. To date, no general
agreement exists since studies that support and oppose the existence of a correlation
between cell surface charge and cellular adhesive behaviour have been reported.10
In summary, a general initial bacterial adhesion profile valid for each and every
bacterial strain and surface has not yet been established. In contrast, the literature
available on this topic has shown that it is necessary to treat the bacterial adhesion
process as a complex process involving many different interactions.
1.3.4 Dynamic SAMs
In the past decade, SAMs have been developed with switchable/dynamic moieties (i.e.
end group and backbone). These smart substrates present modulatable surface

Chapter 1 Page 27
properties that are able to respond to external chemical/biochemical,116-120 thermal,121-
123 electrical51, 124-127 and optical stimuli.128-138 Dynamic switching may be achieved by
either changing the molecular ordering of the tuneable moieties or by changing their
chemical nature (Figure 9).51
Figure 9 a) Chemical switch: the chemical structure of the monolayer changes after an external stimulus is applied, (e.g., optical switch, UV light). b) Conformational switch: the chemical structure of the monolayer is still the same while its conformation has changed allowing the exposure of moieties different from the terminal functionality, (e.g., electrical switch, potential applied).
Due to their dynamic properties, switchable surfaces are playing an increasingly
important part in the development of highly sensitive biosensors,139-140 novel drug
delivery systems141 and highly functional microfluidic,142 bioanalysis,143 and
bioseparation144 systems. Additionally, dynamic synthetic surfaces that can control the
presentation of regulatory signals145-146 to a cell, are expected to have a significant
impact in tissue engineering147 and regenerative medicine,148 and to provide

Chapter 1 Page 28
unprecedented opportunities in fundamental studies of cell biology. Progress to date
has led to control over biomolecule activity149 and immobilisation of a diverse array of
proteins, including enzymes150 and antibodies.151 These earlier achievements have
encouraged researchers to take the challenge of using dynamic surfaces to modulate
larger and more complex systems such as bacteria152 and mammalian cells.153
Spacing is of crucial importance in switchable SAMs for ensuring the
effectiveness of the switch. In fact, conventional SAMs are too dense to allow
conformational transitions and consequently no switching can occur. In order to
explore SAMs as a model system for switching, sufficient spatial freedom must be
established for each molecule.61 Once a low density SAM (LD−SAM) is created,
preferential exposure of either the end group or the backbone to the surrounding
medium could be exploited for the switching of macroscopic surface properties.154-155
An excellent example of this concept is illustrated by Lahann et al. who reported the
design of SAM surfaces which exhibit dynamic changes in interfacial properties in
response to the application of an electrical potential (Figure 10).51 In this work, the
fabrication of carboxyl−terminated LD−SAMs, as mercaptohexadecanoic acid (MHA)
monolayers, is ensured by using a dendron bulky end group (precursor, Figure 10).
This end group acts as a spacer and allows the correct distribution of the molecules
on the surface. The subsequent hydrolysis of the precursor leads to the exposure of a
charged hydrophilic acidic moiety (MHA, Figure 10b). By applying a positive voltage
to the gold surface the acidic end group is attracted towards the surface and the
hydrophobic methylene backbone is exposed, (Figure 10c). As a result, an overall
change in surface wettability (from hydrophilic to hydrophobic) is observed.

Chapter 1 Page 29
Figure 10 Illustration of the preparation and switching of a LD−SAM of MHA on gold. The switch is due to the application of a negative or positive potential to the gold surface, which leads to a transition between straight (hydrophilic) and bent (hydrophobic) molecular conformations.
The literature available on switchable surfaces is vast and there are numerous
excellent reviews that can give to the reader detailed information on this topic.156 For
the scope of this thesis, only examples of the conformational switching due to electrical
stimulus will be given below. Since the study of the bacterial adhesion process, by
using these switchable SAMs is the main topic of this work, the literature examples
given in the following sections will be mainly focused on the SAMs capable to
dynamically interact with cells. Few significant examples of switchable surfaces able
to control biomolecular interactions will be also discussed.
1.3.4.1 Electrically−Controlled Switchable SAMs
SAMs with a number of different electroactive groups have been successfully
employed to switch on functionalities in situ, offering an unprecedented ability to
manipulate the interactions of peptides,157-162 DNA,163-165 proteins,166 and cells157-161
with surfaces. Based on the active manipulation of surface–confined DNA molecules,
an elegant biosensing method to quantify the binding kinetics (kon, koff rate constants),

Chapter 1 Page 30
the dissociation constants (KD in the picomolar regime), and the influence of
competitive binders (EC50 values) of proteins on an electrically switchable surface has
been described.167 In this system, the double DNA strand was bound to the gold
substrate on one side while the surface DNA distal end strands were bound to a
cyanine (Cy3) dye and to a histidine specific oligonucleotide sequence. When a
positive potential (+ 0.3 V) was applied to the surface, the DNA lied on the gold. In this
state, the fluorescence emission from Cy3 dyes attached at the surface−distal DNA
ends was low, owing to a proximity quenching effect of the metal substrate. On the
other hand, when the electrode potential was switched to a negative potential (−0.5 V),
the negatively charged DNA was repelled from the surface and pushed upward by
virtue of the strong electric field developed. Simultaneously, an increase in the
fluorescence emission was observed as the Cy3 dyes moved away from the quenching
surface (Figure 11).

Chapter 1 Page 31
Figure 11 Schematic representation of the DNA lever; a) Lying on the surface at positive potentials (+ 0.3 V), the DNA is repelled after switching to negative potentials (− 0.5 V). b) If a protein is bound to a ligand attached to the DNA’s top end, the upward motion at negative potential is slowed and lags behind the bare lever. The green circle symbolizes the Cy3 fluorophore, whose emission is quenched close to the surface while the yellow circle represents the fluorophore when the emission is not quenched due to the increased distance from the surface.
The fluorescence emission effectively reported the distance of the DNA’s top end to
the gold surface. The protein bound DNA lever showed to clearly lag behind the
dynamics of the bare lever as a consequence of the additional hydrodynamic drag that
occurs when the protein binds to the DNA’s top end. By comparing the time−resolved
upward dynamics, the diameter of the protein could be determined with angstrom
resolution. Furthermore, avidity effects were also measured since analytes with one or
more binding sites could be discriminated.
The possibility to engineer the surface to create low density SAMs51, 82 onto different
metal substrates led to an increased use of finely organised SAMs for controlling

Chapter 1 Page 32
protein adsorption and release under electrical modulation.168-169 These surfaces have
the ability to modulate the reversible conformational transition of surface confined
molecules in response to an applied potential. This change in molecular conformation
have been proven by different techniques such as sum−frequency generation (SFG)
and recently also by atomic force microscopy (AFM).170 Following the work introduced
by Lahann et al.,51 Liu et al.168 generated SAMs of loosely packed
carboxylic−terminated and amino−terminated SAMs able to undergo conformational
switch in response to an electrical potential applied.168 These low density SAMs have
been successfully integrated in microfluidic chips to reversibly control the assembly of
two proteins (avidin and streptavidin) with different isoelectric points.
Electrically controlled switching has also been applied by our research group to
regulate the conformational changes of modified positively charged oligolysine
peptides tethered to a gold surface,149 such that bioactive molecular moieties (biotin)
incorporated on the oligolysines could be reversibly exposed (bio−active state) or
concealed (bio−inactive state) on demand, as a function of surface potential (Figure
12). In order to allow the switching, the positively charged biotin−oligolysine peptides
were separated by shorter neutral triethylen(glycol) thiol (TEGT).

Chapter 1 Page 33
Figure 12 Schematic representation of the switching of mixed TEGT−biotinylated peptide SAMs between a bio−active and bio−inactive state. Depending on the electrical potential applied, the peptide can expose (+ 0.3 V) or conceal (− 0.4 V) the biotin site and regulate its binding to neutravidin.
The dynamics of the switching and the biological properties of the surface were studied
by observing the binding events between biotin and fluorescently labelled neutravidin.
Fluorescence microscope images and electrical-surface plasmon resonance (e-SPR)
spectral data clearly revealed opposite binding behaviours when + 0.3 V or − 0.4 V
were applied to the surface. High fluorescence intensities were observed for an applied
positive potential, while minimal fluorescence was detected for an applied negative
potential. SPR has further shown that these responsive surfaces can control binding
ability to greater than 90%. Following this work by us,149 Gooding and co−workers145
have extended the concept of molecular mechanical motions of surface−bound
electro−switchable molecules to control cell adhesion. The two−component SAMs
comprised a protein−resistant hexa(ethylene glycol) (EG6) chain, which contained a
charged moiety on its distal end, and a terminated RGD component on which cellular
adhesion receptors, integrins, can bind (Figure 13).
++
++
++ + + + +
Biotin concealed Biotin exposed
Fluorophore
Neutravidin
ON-Bio-Active State OFF-Bio-Inactive State
+ 0.3 V
- 0.4 VTEGT

Chapter 1 Page 34
Figure 13 Schematic representation of the switchable patterned surface. The “grey” portion of the surface is composed by an RGD and EG6−sulfonate mixed SAM while the “orange” portion is composed by an RGD and EG6−ammonium mixed SAM. The two portions are able to switch from cell adhering to cell repellent in response to a potential applied. A negative potential of −0.3 V will determine the attachment of cells in the orange portion while a positive potential of + 0.3 V will determine the adhesion of cells on the grey portion.
Two SAM surfaces were prepared with different EG6 molecules, one with a sulfonate
(anionic) distal moiety and the other with an ammonium (cationic) distal moiety. If the
electrode possesses a potential of the same polarity as the charged moiety, the EG6
molecules project out from the surface and conceal the RGD peptides from the cells,
hence resisting cell adhesion. Switching the potential to the opposite polarity causes
the EG6 molecules to flip towards the surface and exposing the RGD peptides, thus
allowing cells to adhere.145

Chapter 1 Page 35
1.4 Concluding remarks
Stimuli−responsive surfaces that are capable of modulating their properties in
response to diverse external stimuli, such as chemical, biochemical, thermal, electrical
and optical, are of growing interest for numerous biological applications. The recent
development of switchable substrates able to offer new insights on cell−surface
interactions are of crucial importance for understanding complex processes such as
bioadhesion and biofouling. In contrast, with the available standard assay, these
surfaces should be able to more closely capture the properties of the natural
mechanisms171 and be applied for addressing basic problems in biology. It is
anticipated that a wider range of applications will be unveiled as the field of switchable
surfaces matures, and the full potential of surfaces with dynamic properties is realised.
The potential of this exciting research field is enormous, but it will certainly
require concerted efforts from scientists in a variety of disciplines. Only with
collaborative efforts of chemists, physicists, material scientists, engineers, clinicians
and biologists it will be possible to fully explore the potential of switchable surfaces for
biological applications.

Chapter 1 Page 36
1.5 PhD Aim and Objectives
The aim of my PhD is to design and fabricate an electrical switchable SAM able to
selectively control, in real−time, the adhesion of two among the most representative
marine microfoulant bacterial species, C. marina and M. hydrocarbonoclasticus by
changing the surface properties in response to an applied potential.
The following objectives are required to achieve this aim:
i) The fabrication of one−component SAMs with different end groups for
performing bacterial adhesion studies. In order to fulfil this objective, firstly,
the preferences of the two bacteria (Figure 14a) towards various
one−component SAMs, (Figure 14b), were assessed. The bacterial
adhesion assay were performed and followed in real−time by using Surface
Plasmon Resonance (SPR) (Figure 14c). As control study, a standard
adhesion assay was also performed. (Figure 14d).

Chapter 1 Page 37
Figure 14 a) Bacteria used during the bacterial adhesion assay. b) Schematic representation of the 6 different SAMs used during the bacterial adhesion assay. c) SPR bacterial adhesion assay d) Standard adhesion assay.
ii) The properties of the surfactants forming the most attractive and the most
repellent SAMs studied in step (i), were used to fabricate a two−component
switchable SAM with both attractive and repellent characteristics. A modified
literature procedure was used to ensure the correct spacing between the two
surfactants (surfactant 1 and 2, Figure 15). The obtained surface was fully
characterised.

Chapter 1 Page 38
Figure 15 Schematic representation of the procedure used to fabricate a well-spaced two−component switchable SAM.
iii) The verification of the molecular conformational changes occurring at the
surface of the two−components SAMs in response to an external electrical
stimulus was verified by electrochemical−SFG using an already exploited
electrically switchable surface (Figure 16). The use of this particular surface
was due to the need of studying the electrochemical switching phenomenon
by observing the NH stretching of an end group with characteristic features
such as those of the biotin group. This necessity came from the difficulties
in the interpretation of the SFG spectra in the CH region.

Chapter 1 Page 39
Figure 16 Schematic representation of a model switchable SAM where the main surfactant has a biotin end−group (in green) and a positively charged polylisine backbone (in blue) and the backfiller is a triethylen(glycol) thiol (in grey).
iv) In real−time electrochemical SPR adhesion assay of C. marina and M.
hydrocarbonoclasticus onto the switchable SAMs built in step (ii) were
performed (Figure 17).
Figure 17 Schematic representation of the electrochemical SPR adhesion assay set up for studying the adhesion of C. marina and M. hydrocarbonoclasticus.

Chapter 2 Page 40
2.0 CHAPTER 2
Surface Characterisation Techniques
Abstract: The use of SAMs for studying biological processes such as bacterial
adhesion has led to build surfaces with very sophisticated properties. In order to
achieve such level of surface organisation, a very precise physico−chemical
characterisation of the surfaces is crucial. This characterisation is often the result of
the information coming from a range of different techniques, each of which
contributes to the surface description. A number of different surface sensitive
techniques has been developed over the years to achieve this aim. Some examples
include contact angle measurements, X−ray photoelectron spectroscopy (XPS),
Fourier Transformed Infrared Reflection Absorption Spectroscopy (FT−IRRAS),
ellipsometry, Surface Plasmon Resonance (SPR), Sum Frequency Generation
(SFG), Cyclic Voltammetry (CV) and Fluorescent microscopy. Below, these
techniques are briefly described since they have been used in this research to
characterise the SAMs produced.
2.1 Contact angle measurements
The contact angle technique allows the evaluation of the hydrophilic/hydrophobic
character of the surface, the calculation of surface energies and the critical surface
tension of solids. This technique is based on the fact that a liquid in contact with a
Chapter 2 Page 41
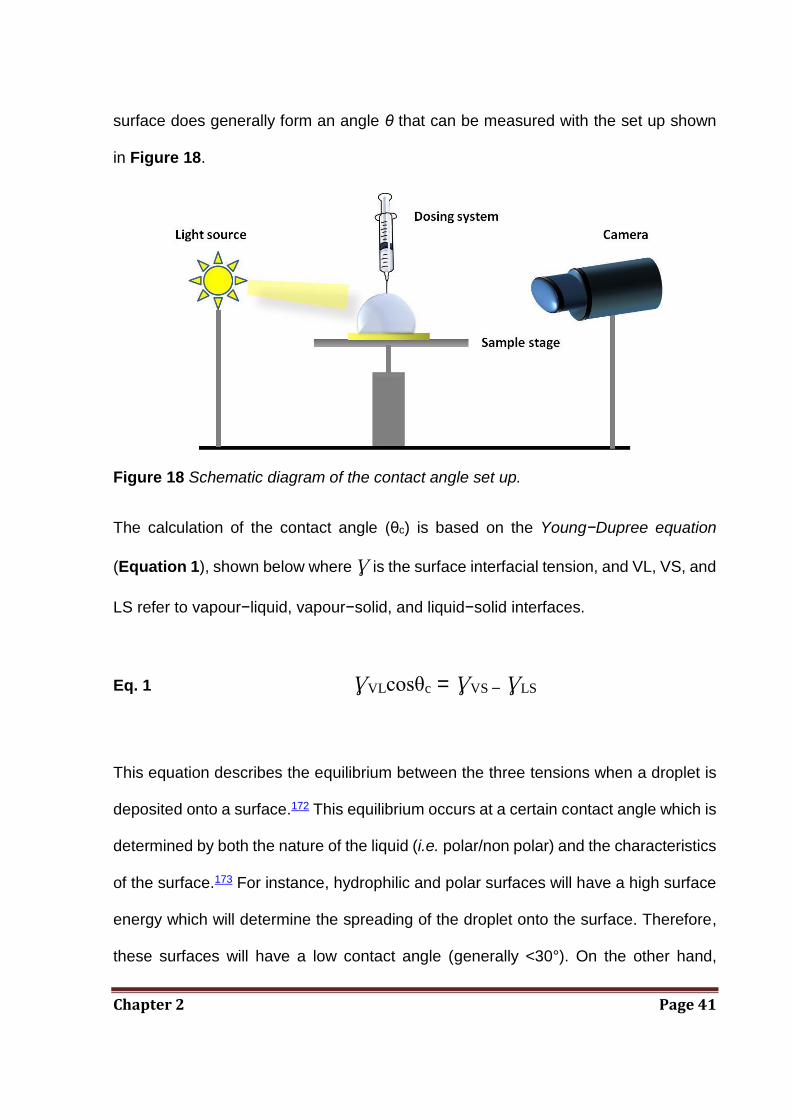
surface does generally form an angle θ that can be measured with the set up shown
in Figure 18.
Figure 18 Schematic diagram of the contact angle set up.
The calculation of the contact angle (θc) is based on the Young−Dupree equation
(Equation 1), shown below where Ɣ is the surface interfacial tension, and VL, VS, and
LS refer to vapour−liquid, vapour−solid, and liquid−solid interfaces.
Eq. 1 ƔVLcosθc = ƔVS – ƔLS
This equation describes the equilibrium between the three tensions when a droplet is
deposited onto a surface.172 This equilibrium occurs at a certain contact angle which is
determined by both the nature of the liquid (i.e. polar/non polar) and the characteristics
of the surface.173 For instance, hydrophilic and polar surfaces will have a high surface
energy which will determine the spreading of the droplet onto the surface. Therefore,
these surfaces will have a low contact angle (generally <30°). On the other hand,

Chapter 2 Page 42
hydrophobic surfaces will have a lower surface energy, leading to contact angles
generally above 90° (Figure 19).68
Figure 19 Illustration of contact angles formed by sessile liquid drops on a smooth homogeneous solid surface. a) Identify a hydrophilic surface while b) identify a hydrophobic surface.
Two main methods of measuring the contact angle have been described:
a) Static contact angle measurement: a droplet of liquid of volume x (Vx) is deposited
onto a surface and the contact angle is measured. In this method, Vx remains constant
during the measurement (Figure 20).
Figure 20 Schematic representation of the measurement of a static contact angle.
b) Dynamic contact angle measurement: a small droplet is deposited onto the surface
(Vx) and its volume is first increased (Va) and then decreased (Vr) to measure two

Chapter 2 Page 43
different angles, the advancing (θa) and receding angle (θr), respectively. The
difference between the advancing and receding angles (θa−θr), gives the contact angle
hysteresis (θh) (Figure 21). A small hysteresis (< 5°) is an indication of a homogenous,
smooth, well ordered surface, whereas a large hysteresis suggests the surface is
contaminated, non−homogenous and/or relatively rough.174
Figure 21 Schematic representation of a dynamic contact angle measurement.
Other traditional contact angle methods used to achieve information about the
wettability of surfaces have been described such as tilting plate and captive bubble
methods.175-176 Most recently, important advancement have been represented by the
measurement of ultrasmall droplets by combining the classic contact angle technique
with atomic force microscopy (AFM)177 and environmental scanning electron
microscopy (ESEM).178

Chapter 2 Page 44
2.2 X−ray photoelectron spectroscopy (XPS)
XPS is a quantitative spectroscopic technique, developed in the mid ‘60s by K.
Siegbahn179 and his research group, that measures the elemental composition,
empirical formula, chemical state and electronic state of the elements in a material.
This technique consists in irradiating a material with a beam of X−rays in an ultra−high
vacuum (UHV) environment while simultaneously measuring the kinetic energy and
the number of electrons that escape from the top 1 to 10 nm of the material being
analysed.180 XPS instruments consist of an X−ray source, an energy analyser for the
photoelectrons, and an electron detector. The analysis and detection of photoelectrons
requires the sample to be placed in a high−vacuum chamber. Since the photoelectron
energy depends on X−ray energy, the excitation source must be monochromatic. The
energy of the photoelectrons is analysed by an electrostatic analyser, and the
photoelectrons are detected by an electron multiplier tube or a multichannel detector
such as a microchannel plate (Figure 22).181
Figure 22 Basic components of a monochromatic XPS system.

Chapter 2 Page 45
A number of different monochromatic sources can be used to irradiate the surface.
Some of the most common are Mg Kα and Al Kα X−rays.182 The X−ray beam is able
to penetrate the sample up to 10 nm in depth and excite the electrons from the inner
shells orbital of the surface atoms as it is shown in Figure 23.183
Figure 23 Schematic diagram of a photoelectron emitted from the core energy level.
For the photoelectron to escape from the orbital, the kinetic energy (KE) must be higher
that the binding energy, BE, which is the energy that keeps the electron within its
orbital. Only if this constraint is observed the photoelectron will be able to escape from
the top 1 to 10 nm of the material being analysed. The KE of each ejected
photoelectron can then be measured using an electron spectrometer and can be
converted in BE by using Equation 2:
Eq. 2 BE = hv – KE – W

Chapter 2 Page 46
Equation 2 describe the relationship between BE (binding energy) of the electron, hv
(the energy of the X−ray), KE (kinetic energy) of the emitted electron and W
(spectrometer work function).184
Since each atom produces a set of XPS peaks at characteristic BE values it is possible
to directly identify each element that exist in or on the surface of the material being
analysed. These characteristic XPS peaks are directly linked to the electron
configuration of the electrons within the atoms, e.g., 1s, 2s, 2p, 3s, etc. Furthermore,
the number of detected electrons in each of the characteristic peaks is directly related
to the amount of the element within the area (volume) irradiated.185
XPS is a destructive technique therefore, once a sample has been analysed it is
unsuitable for analysis by other methods.186 However, variation of this technique such
as the angle resolved XPS (ARXPS) could be considered non-destructive. The main
difference between the conventional XPS and the ARXPS consists in the possibility to
analyse ultra−thin film without sputtering. In fact, by tilting the sample stage, the angle
between the axis of the photoelectron analyser and the normal to the sample surface,
(the photoemission angle θ), decrease substantially, limiting the damage to the surface
and enhancing at the same time the relatively weak signal of some elements such as
nitrogen (N) and sulphur (S).187 In addition, information about the surface thickness
can be also obtained.
2.3 Infrared Spectroscopy
Infrared spectroscopy has been used for over seventy years for the analysis and
characterisation of materials. Infrared spectroscopy is based on the passage of IR

Chapter 2 Page 47
radiation through a sample. When this occurs some of the infrared radiation is
absorbed by the sample and some of it is passed through (transmitted) depending on
the molecular composition of the sample. The resulting IR spectrum, representing the
molecular absorption and transmission, is the unique molecular fingerprint of the
sample.188 Infrared spectroscopy can either result in a qualitative analysis or
quantitative analysis since the size of the peaks in the spectrum gives a direct
indication of the amount of material present in the sample.189
2.3.1 FT−IRRAS
Fourier Transform Infrared (FT−IR) spectroscopy was developed by Digilab which
pioneered the world's first commercial FTIR spectrometer in 1969. This technique is
able to determine qualitative and quantitative features of IR−active molecules in
organic or inorganic solid, liquid or gas samples.190 FTIR have been developed in order
to overcome the limitations encountered with the antecedent dispersive instruments.191
In fact, in dispersive IR instruments the dispersing element was a prism made from a
single crystal of rock−salt (i.e. sodium chloride, potassium bromide, caesium iodide)
which becomes opaque at wavelengths longer than 50 μm and had a slow scanning
process. For these reasons, the use of a simple optical device called interferometer
able to measure all of the infrared frequencies simultaneously, rather than individually,
was promoted. The interferometer is able to produce one signal which contain all the
infrared frequencies needed during the analysis and allows at the same time to obtain
measurements in the order of ~one second.192
Most interferometers employ a beamsplitter which takes the incoming infrared
beam and divides it into two optical beams. One beam reflects off of a flat mirror which

Chapter 2 Page 48
is fixed in place. The other beam reflects off of a flat mirror which is on a mechanism
which allows this mirror to move a very short distance (typically a few millimeters) away
from the beamsplitter. The two beams are then recombined at the beamsplitter.
However, because the path that one beam travels is a fixed length and the other is
constantly changing as its mirror moves, the signal which exits at the interferometer is
the result of these two beams “interfering” with each other. The resulting signal is called
an interferogram. The interferogram has the unique property that every data point
which makes up the signal, (a function of the moving mirror position), has information
about every infrared frequency which comes from the source. This means that as the
interferogram is measured, all frequencies are being measured simultaneously. Thus,
the use of the interferometer results in extremely fast measurements. Because the
analyst requires a frequency spectrum, (a plot of the intensity at each individual
frequency), in order to make an identification, the measured interferogram signal
cannot be interpreted directly. A means of “decoding” the individual frequencies is
required and can be accomplished via a well−known mathematical technique called
the Fourier transformation. This transformation is performed by the computer which
then presents the user with the desired spectral information for analysis. Figure 24
shows the FTIR instrumental process.193

Chapter 2 Page 49
Figure 24 The normal instrumental process is as follows: the Infrared beam enters the interferometer where the “spectral encoding” takes place. Secondly the beam hit the sample where it is transmitted through or reflected off of the surface, depending on the type of analysis being accomplished. This is where specific frequencies of energy, which are uniquely characteristic of the sample, are absorbed. The beam finally passes to the detector for final measurement of the interferogram signal. The measured signal is sent to the computer where the Fourier transformation takes place and the final infrared spectrum is obtained.

Chapter 2 Page 50
2.4 Ellipsometry
The technique of ellipsometry was pioneered by Drude in 1887 who used it to
determine the dielectric function of various metals and dielectrics.194 Ellipsometry, is a
non−destructive optical technique that calculate, in−situ and in real−time, the change
in polarisation of light upon reflection, to probe the dielectric properties of a sample
including morphology and thicknesses up to 1000 Å.195 During the ellipsometry
measurement the linearly polarised monochromatic beam hit the sample surface and
gets reflected as an elliptically polarised light. This latter beam can be sent through an
optical compensator in order to change the phase of the reflected wave, delaying one
of the two orthogonal light constituents. The resulting light beam can be measured with
an analyser (Figure 25).
Figure 25 Schematic drawing of an ellipsometer.

Chapter 2 Page 51
To explain how polarisation occurs we can refer to Maxwell model in which the light is
formed by two perpendicular vectors; represented by the amplitude of electric field (E)
and the amplitude of magnetic field (B). These two vectors are perpendicular to each
other and also to the direction of the propagation of light. For a non−polarised light, E
and B oscillate in random directions (oscillation in numerous planes), however when
the light is polarised, for instance by using a polariser, E oscillates in the direction of
the B (oscillation in one plane), (Figure 26).196
Figure 26 Schematic representation of unpolarised and polarised light.
The two vectors E and B are each one formed from a parallel (s) and perpendicular (p)
components. In ellipsometry when the polarised light interact with a specular surface
at an angle, changes occurs into the parallel (s−polarised) and perpendicular
(p−polarised) components of E (Figure 27).197

Chapter 2 Page 52
Figure 27 Incident linearly polarised light is reflected from the surface and elliptically polarised. p and s identify the linear polarisation directions parallel and perpendicular to the plane of incidence and form a right handed system with the direction of propagation; θ is the angle of incidence.
This polarisation change allows the calculation of the reflection coefficient, ρ, which is
equal to the ratio between the reflection coefficients of the p− and s− polarised light
and can also be expressed in terms of the amplitude ratio, (Ψ), and the phase
difference, (Δ) as depicted in Equation 3.198
Eq. 3
Since ellipsometry is an indirect method, the measured parameter such as Ψ and Δ
cannot be converted directly into the optical constants of the sample. Therefore, a layer
model which take into account the refractive index and thickness parameters of all
individual layers forming the sample, including the correct layer sequence, is needed.
By using the model and by applying an iterative procedure (least−squares
minimisation) the unknown optical constants and/or thickness parameters are varied,
and Ψ and Δ values are calculated using the Fresnel equations. The calculated Ψ and
Δ values which match the experimental data best provide the optical constants and
thickness parameters of the sample. In SAMs the thickness is calculated on the base

Chapter 2 Page 53
of the model Air/SAM/Solid, in which SAMs are assumed to be defect free
(homogenous) and with a refractive index of 1.50.196 This model is based on the
Cauchy equation, which considers the SAMs as a transparent layer. The fitting is done
using multi−guess iterations which provides a thickness result with the lowest Ӽ2
(chi−square distribution) between the measured and calculated values of the
ellipsometric parameters (Ψ and Δ).
2.5 Surface plasmon resonance (SPR)
In 1902, Woods199-200 observed for the first time that the irradiation of a polarised light
on a mirror determined the appearance of dark and light bands in the reflected light.
This phenomena was later explained from Otto,201 Kretschmann202 and Raether203 with
the description of the excited surface plasmon.
Surface Plasmon occurs when a p−polarised light beam of a given wavelength
hit at a certain angle (θsp) a thin conducting metal surface, (generally 50 nm), at the
interface of a glass sensor with high Refractive Index (RI) and an external medium (gas
or liquid) with low RI (Figure 28).

Chapter 2 Page 54
Figure 28 Kretschmann geometry of the SP excitation in the attenuated total reflection regime using a high-refractive-index prism and a thin metal film. k0 and kp are wave vectors in free space and in the prism. kx is the surface plasmon (SP) wave vector. θsp is the angle of incidence at the prism/metal/ dielectric interface that corresponds to the resonant excitation of the SP. θp is the angle at the base of the prism and θext is the external angle that is determined by θsp and by the prism material and shape. Upon proper choice of the metal film thickness d, the resonance reflectivity approaches zero and the off-resonance reflectivity approaches unity.
The incident light wave vector is indicated from the Equation 4:
Eq. 4
Where np is the refractive index of the prism and kp and k0 indicated the wave vectors
in the prism and in the free space.
The interaction between the light and the free electrons of the metal surface
generates photon–plasmon surface electromagnetic waves (surface plasmon
polaritons) at the metal/dielectric interface. The plasmon wave vector kx is indicated by
the following equation, Equation 5:
Eq. 5

Chapter 2 Page 55
Where ɛm and ɛd are the complex dielectric permittivities of the metal and of the
dielectric.
The resonance conditions impose that:
Eq. 6
Therefore the resonant angle, θsp, will be indicated by the Equation 7:
Eq. 7
The resonant angle always exceeds the critical angle, (angle at which the refraction
angle is 90°):
Eq. 8 By applying the Snell’s law and by using the external angle θext (Figure 28), we obtain
Equation 9:
Eq. 9
This equation describe the refraction of surface plasmon polaritons at an
interface between two metals. The propagation of the surface plasmon wave is parallel
to the metal dielectric interface and the associated optical electric field decays
exponentially away from the surface with a typical decay length of 200 nm (Figure
29).204
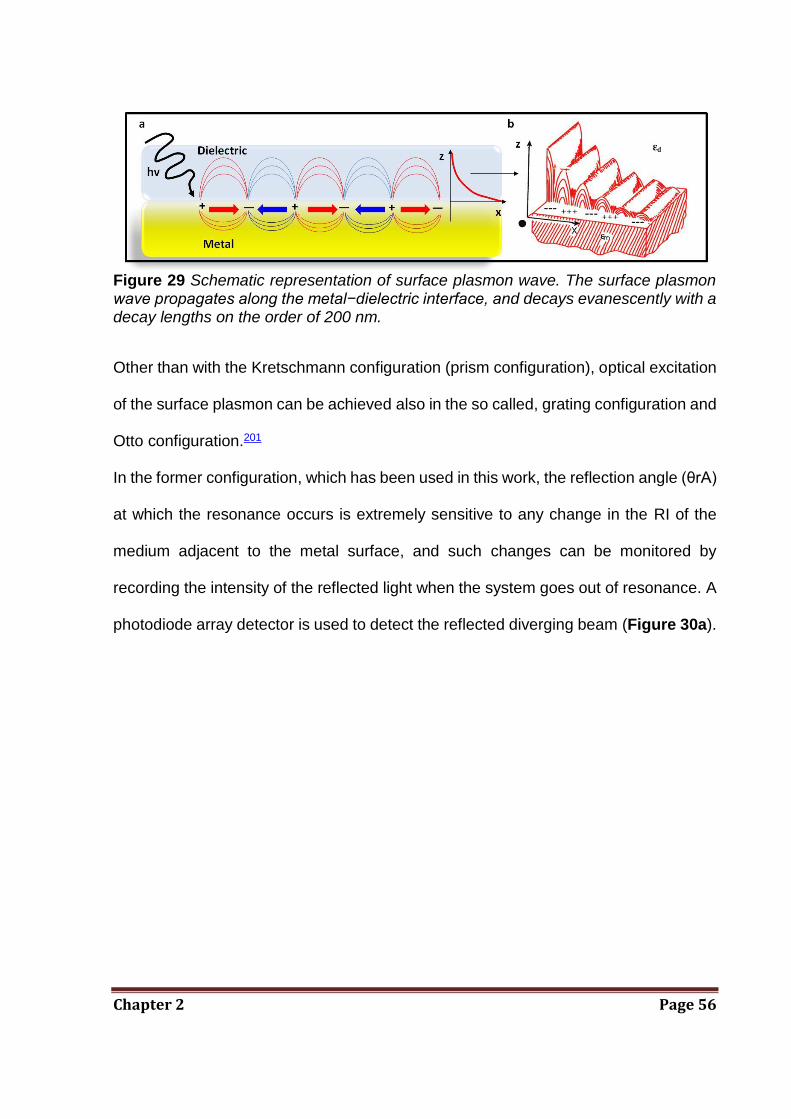
Chapter 2 Page 56
Figure 29 Schematic representation of surface plasmon wave. The surface plasmon wave propagates along the metal−dielectric interface, and decays evanescently with a decay lengths on the order of 200 nm.
Other than with the Kretschmann configuration (prism configuration), optical excitation
of the surface plasmon can be achieved also in the so called, grating configuration and
Otto configuration.201
In the former configuration, which has been used in this work, the reflection angle (θrA)
at which the resonance occurs is extremely sensitive to any change in the RI of the
medium adjacent to the metal surface, and such changes can be monitored by
recording the intensity of the reflected light when the system goes out of resonance. A
photodiode array detector is used to detect the reflected diverging beam (Figure 30a).

Chapter 2 Page 57
Figure 30 The principle of SPR detection using the conventional Kretschmann optical configuration. a) The SPR detects changes in the refractive index in the immediate vicinity of the sensor surface. b) When a solution containing the analyte come into contact with the surface a sharp dip (c) in the intensity of the reflected light occurs. The dip is associated with a certain angle θrA dependent on the mass of molecules on the surface. The SPR angle shifts to θrB when molecules bind to the surface and mass on the surface is changed. d) The change is monitored by plotting the resonance angle signal versus time in a so called sensorgram.
Each change of RI on the gold films causes an angle shift (θrA to θrB) of the reflected
light intensity minimum (Figure 30a−b). The measurement of this refractive angle
change (Δθ) can be used to detect in real−time the binding of analyte molecules to the
surface upon injection into the instrument. This binding is plotted as Response Unit
(RU) against time (Figure 30c) which in turn translates into the mass of adsorbed
material on the surface.
Thus, SPR−based instruments are able to measure the change in RI within ~200 nm
from the sensor surface immersed in a solution to monitor the kinetics of adsorption of

Chapter 2 Page 58
target molecules.205 However, it is unable to discriminate between the types of
interaction occurring at the surface (i.e. specific/non−specific). This means that any
changes to the RI in the evanescent field will result in a change in reflected signal
independently from the origin of the changes.
Other than the light beam and the configuration with which it interacts with the sample,
SPR are also equipped with liquid handling systems called flow channels (Figure 31).
A peristaltic or syringe pumps are generally used to pump the liquid onto the sensor
surface. The flow channels are formed when microfluidic channels are pressed against
the sensor chip. The planar flow channels which are mostly employed in SPR
instruments are comprised of a single broad channel with an inlet and outlet, from
which liquid flows and interacts with the sensor surface.
Figure 31 Schematic diagram of the SPR microfluidic flow−cell setup.
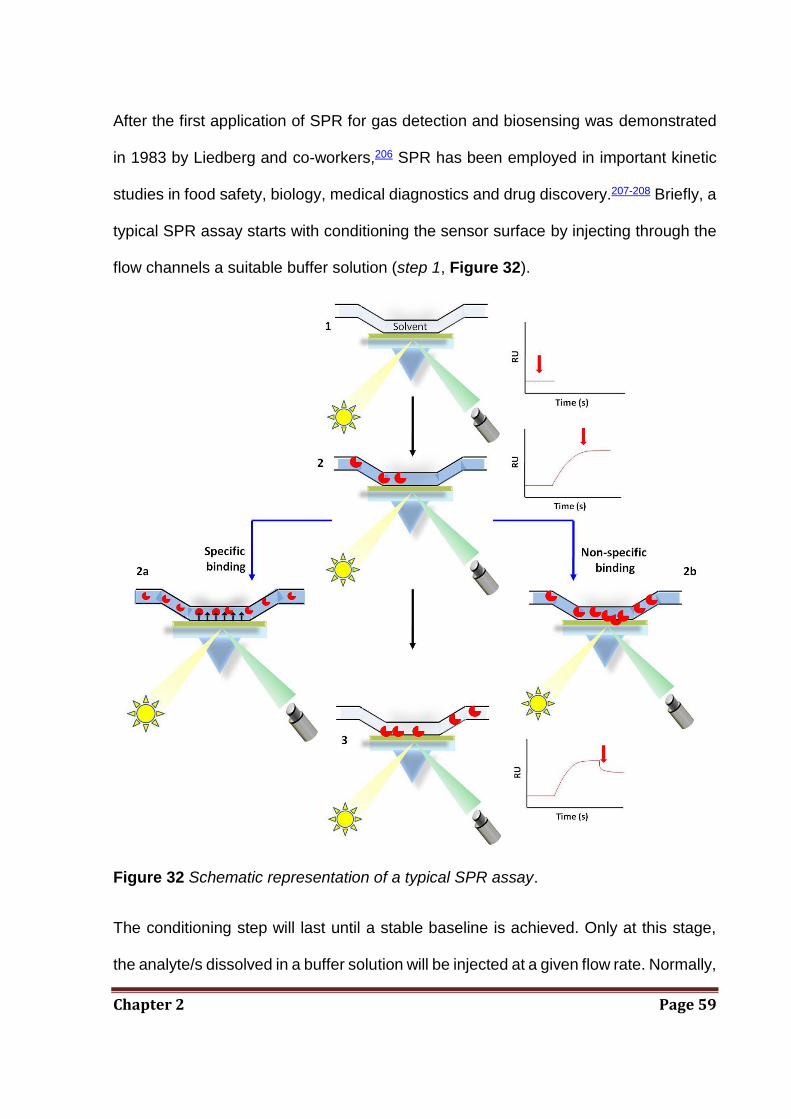
Chapter 2 Page 59
After the first application of SPR for gas detection and biosensing was demonstrated
in 1983 by Liedberg and co-workers,206 SPR has been employed in important kinetic
studies in food safety, biology, medical diagnostics and drug discovery.207-208 Briefly, a
typical SPR assay starts with conditioning the sensor surface by injecting through the
flow channels a suitable buffer solution (step 1, Figure 32).
Figure 32 Schematic representation of a typical SPR assay.
The conditioning step will last until a stable baseline is achieved. Only at this stage,
the analyte/s dissolved in a buffer solution will be injected at a given flow rate. Normally,

Chapter 2 Page 60
the baseline buffer is the same as the buffer used for analyte dilution. The analyte/s
must be soluble in the buffer solution in order to avoid precipitation and also for
controlling its concentration. Following step 1, the analyte/s is injected (step 2, Figure
32) at a defined flow rate. The interaction of the analyte with the SAM could be either
specific or non−specific (step 2a−2b, Figure 32), depending from either the SAM
characteristics or the nature of the analyte.
Specific binding (step 2a, Figure 32): Numerous assays have been performed to study
the specific binding between different biomolecules (e.g. antibody−antigen binding and
biotin−neutravidin binding). For this kind of assays, the surface, for instance a SAM, is
generally modified with a specific ligand (e.g. biotin) and a solution containing the
specific analyte (e.g. neutravidin) is injected. The analyte molecules (neutravidin) are
captured on the surface via the active ligands (biotin). Next, buffer solution is injected
over the surface, to remove any unbound molecules (step 3, Figure 32). If the
interaction between the ligand and the analyte is reversible, the original surface can
be regenerate. The steps here described are identified from a series of refractive index
changes that are translated into the sensorgram showed in Figure 32. In particular,
when the analyte solution flows on the sample an increase in the refractive index can
be measured in real−time. On the contrary when the surface is washed off with the
buffer solution a drop in refractive index will occur. If the nature of the interaction is
known like in the example given above, the amount of neutravidin bound to the biotin
surface can be calculated through the change of the SPR response units (ΔRU), while
the analysis of the sensorgram can give information about the kinetic aspect of the
interaction.

Chapter 2 Page 61
Non−specific binding (step 2b, Figure 32): Although a number of diverse surfaces have
been designed in order to discriminate the non−specific from the specific binding, even
when a precise interaction between the ligand and the analyte are predicted other
components of the sample might adhere on the surface non−specifically. With the
exception of this unwanted phenomena, non−specific binding have become of interest
since SPR have been used for monitoring more complex interactions such as the ones
of cells with surfaces.209-210 The SPR technique provides in fact a non−invasive method
in order to investigate cellular responses in living cells in real−time. In 2002, Hide et al.
suggested that SPR might have the capacity to detect a variety of cellular responses.211
Since then, several applications have been introduced where SPR have been used to
examine a diverse array of cellular processes with various cell types.212-213 In those
applications, the cells were cultured directly on the gold sensor chip and stimulated
with different external agents (i.e. endotoxins) that were injected by SPR. The
morphological changes, such as a cell contraction and spreading which occurs at the
basal portion (<200 nm) of the cell, were then observed. In other approaches, an
analyte has been immobilised on the gold sensor chip while a suspension of intact cells
is introduced on the surface.214 A similar approach to the latter has been used in this
work. The SPR assay is identical to the one described for the specific binding except
for the fact that only qualitative kinetic studies can be performed (Figure 32, step 2b).
The limitation of the SPR for the detection of cells is that the SPR response is not
directly proportional to the whole cell volume since only a part of the cell can be
detected. This is due to the amplitude of the surface plasmon evanescent wave (i.e.
200 nm) as it is shown in Figure 33.

Chapter 2 Page 62
Figure 33 Schematic representation of a SPR bacterial cell adhesion assay on gold. The red dotted line delimitates the amplitude of the surface plasmon evanescent wave which determine as well the detection limit of the SPR.
The direct consequence of this limitation is the impossibility of correlating the SPR
response units with the concentration of attached cells, therefore exact quantitative
studies cannot be performed with cells.
2.6 Sum−frequency generation spectroscopy
Sum−frequency generation spectroscopy (SFG) is a second order nonlinear optical
technique developed in 1987, that has been used to deduce the composition,
orientation, distributions, and some structural information of molecules at gas−solid,
gas−liquid and liquid−solid interfaces.215 SFG vibrational spectroscopy is a particularly
powerful technique due to its inherent sensitivity to non−centrosymmetric regions
including boundaries, interfaces, and surfaces while remaining insensitive to regions
of centrosymmetry including most bulk solids, liquids, and gases. SFG provides a
vibrational spectrum similar to those collected using Fourier transform infrared

Chapter 2 Page 63
(FTIR),216 but differing in the fact that the SFG spectrum is obtained specifically from
the functional groups at the interface. In a typical SFG setup, a fixed visible (Vis) and
a tuneable infrared beam (IR) overlap, temporally and spatially at a surface, at a certain
angle to the surface normal, generating an output beam with a frequency equal to the
sum of the two input frequencies. The sum frequency signal from the surface is
collected by a photomultiplier tube and processed with a gated integrator. Two
photodiodes are used to monitor the input Vis beam and IR beam powers by collecting
the back reflections of these two beams. At the same time, they also eliminate possible
artefacts in the SFG signal. Surface vibrational spectra are obtained by measuring the
SFG signal as a function of the input IR frequency. SFG spectra with different
polarisation combinations including ssp (s−polarised sum frequency output,
s−polarised visible input, and p−polarised infrared input), ppp, pss, and sps, can be
collected to probe orientation of surface’s groups. Figure 34 shows a schematic
representation of the SFG setup.
Figure 34 Schematic representation of the SFG experimental setup.

Chapter 2 Page 64
The theory behind the SFG is based, like for the other optical techniques described
here, on the electromagnetic nature of the light. At low intensities, the polarisation of
light has a linear relation to the electric field, setting the basics for linear optics. On the
other hand at higher intensities and for nonlinear medium the polarisation will be
expressed by Equation 10:
Eq. 10 P = χ(1)E1+ χ(2) E1E2+ χ(i) E1E2Ei
Here, P is the polarisation vector, χ(1) and χ(2) are the first, and second−order electric
susceptibility tensors of the medium and E1 and E2 are the electric fields of the two
laser beams.216 To obtain this non−linear polarisation, the two IR and Vis lasers have
to be pulsed lasers and have to overlap both temporally and spatially. When this
occurs, the two beams mixing process takes place and a third beam with a frequency
equal to the sum of the input frequencies is created (Figure 35).
Figure 35 a) Schematic representation of the SFG beam formation; b) Energy diagram of the SFG process. The mixing of the two incoming beams excites the molecules and a third beam with a frequency equal to the sum of the first two beams is created.

Chapter 2 Page 65
This phenomenon can be described from the following Equation 11:
Eq.11 I (ω3 = ω1 +ω2) ∝|χ(2)eff|2 I (ω1)I (ω2)
Where Iωi, (with i=1,2,3…) is the intensity of a beam at frequency ωi (e.g. ωIR, Figure
36) and χ(2)eff is an effective, second−order, nonlinear susceptibility of the interface.217
A common experimental set−up for probing the solid/liquid interface is to let the
incoming IR and Vis beams undergo total internal reflection in a prism (Figure 36). In
this configuration an evanescent field similar to the one described for SPR can be
formed leading to an enhancement of the SFG signal.
Figure 36 Experimental set−up for SFG measurement at the solid liquid interface. The incoming beams overlap and ordered molecules within the evanescent field will yield an SFG signal.
During scanning, the Vis laser is usually fixed while the IR−frequencies are changed
leading as output to vibrational spectra. It is worth mentioning that randomly distributed
orientations of a vibrational mode will not yield a net signal, making it possible to
specifically investigate ordered structures. Contributions from isotropic (disordered)

Chapter 2 Page 66
bulk material can often be viewed as negligible compared to interfacial anisotropic
(ordered) contributions. This characteristic is of crucial importance for the analysis of
molecules and fragments of molecules orientation (e.g., methyl groups, carbonyl
groups, etc.) at the surface.218
To date, SFG has been used to study the arrangement of molecules on a wide range
of systems, including polymer surfaces,219 biomolecules (i.e. proteins220 and DNA221),
self−assembled monolayers,222 and living cells.223
2.7 Electrochemical techniques
The electrochemical techniques give information on the processes taking place when
an electric potential is applied to a sample. Herein, three types of voltammetry will be
briefly discussed: chronoamperometry, linear sweep voltammetry and cyclic
voltammetry.
2.7.1 Chronoamperometry
In this technique, the working electrode potential (V), is rapidly changed from V1
(potential value at which the electrode is usually in the equilibrium state) to V2 and it is
held at this value for a certain amount of time. The resulting current variation is
recorded as a function of time.224 Figure 37a shows the potential stepping in
chronoamperometry while Figure 37b shows the resulting current variation with time.

Chapter 2 Page 67
Figure 37 a) Schematic illustration of the potential stepping in chronoamperometry, b) The resulting current variation with time.
2.7.2 Linear sweep voltammetry
In general, in linear sweep voltammetry the current at a working electrode is measured
while the potential range between the reference and working electrode is swept linearly
with time.225 The voltage applied is always scanned from a lower limit (V1), where no
electrochemical reaction occurs to an upper limit (V2), (Figure 38).
Figure 38 Linear increase of the potential versus time.
Towards V2, the oxidation (A to A+ in Equation 12a) or reduction (A to A− in Equation
12b) of species in contact or in the vicinity of the electrode occurs.

Chapter 2 Page 68
Eq. 12
The reduction and oxidation processes can be explained through the electrochemistry
equilibrium described by Nernst equation (Equation 13):
Eq 13
This equation illustrate the relationship between concentration of the electroactive
species and the voltage changes, (E0 = V2−V1), while E represent the standard
electrode potential. R is the universal gas constant: R = 8.314 J K−1 mol−1, T is the
absolute temperature, F is the Faraday constant, the number of coulombs per mole of
electrons: F = 9.648 53×104 C mol−1, n is the number of moles of electrons transferred
in the cell reaction or half-reaction and Q is the thermodynamic reaction quotient.
As the voltage is swept from V1 to V2, the position of the equilibrium described in
Equation 13, shifts from no conversion at V1, to full conversion of the electroactive
species at V2. This voltage behaviour is based on the assumption that the active redox
couple is irreversible. Concerning the current generation, when V1 is applied, no
electron transfer is induced and as a result, the current does not pass through the
system. However, at values closer to V2 electron transfer occurs on the electrode
surface and a rise in current values is observed along with a higher conversion of the
reactant. The current increases exponentially until a maximum is reached at the redox

Chapter 2 Page 69
peak potential (Vp). After the peak has occurred, the diffusion layer has grown
sufficiently above the electrode so that the flux of reactant to the electrode is not fast
enough to satisfy that required by the Nernst equation. In this situation, towards V2,
(Figure 39), the current begins to drop due to the depletion of the reactant at the
electrode surface.226
Figure 39 Schematic of a) Reduction processes on the surface b) Corresponding current responses for an irreversible electron transfer reaction and current peak occurring at the redox peak potential (Vp).
In linear sweep voltammetry the voltammogram can be recorded at a single scan rate
or at different scan rates obtaining a series of linear sweep voltammograms as shown
in Figure 40.
Figure 40 a) Series of linear increase of the potential versus time and b) Series of current responses for increasing scan rates.

Chapter 2 Page 70
2.7.3 Cyclic Voltammetry
Cyclic voltammetry (CV) is a type of linear sweep voltammetry that have been
developed by Julian Millar and colleagues in the early 1980s.227 CV is used for acquiring
qualitative and quantitative information about electrochemical reactions. Since linear
sweep voltammetry can only separately measure the reduction or the oxidation
process of a system this technique has been improved so that a potential could sweep
reversibly between V1 and V2, resulting in a triangular potential cycle as shown in
Figure 41.
Figure 41 Voltage as a function of time.
This improvement achieved in CV allows the measurements of reduction and oxidation
of the system sequentially.225 In the case of CV the voltage is swept between two
values (V1 and V2) at a fixed rate, however, now when the voltage reaches V2 (forward
scan) the scan is reversed and the voltage is swept back to V1 (reverse scan). A typical
cyclic voltammogram obtained for a reversible single electrode transfer reaction is
shown below (Figure 42).

Chapter 2 Page 71
Figure 42 Cyclic sweep voltammetry: the reversible sweep of an applied potential as a function of time.
In the example above, it is assumed that the solution contains only a single
electrochemical reactant. The forward sweep produces an identical response to that
seen for the LSV experiment with a current peak for any analyte that can be reduced
(or oxidised depending on the initial scan direction) within the range of the potential
scanned. In Figure 42 the potential applied (V1) is initially positive to ensure that the
species of interest are completely oxidised to begin with (A). V1 is then swept to lower
and lower values and as the potential reaches the reduction potential (−Vredp) of A, the
current will increase until a maximum value (−iredp) which correspond to the reduction
of A to A−. After the reduction step has occurred the current will falls off as the
concentration of A is depleted close to the electrode surface (V2). If the redox couple
is reversible then when the applied potential is reversed (increased to positive values),

Chapter 2 Page 72
it will reach the oxidation potential (Voxp) that will reoxidise A− to A, and produce a
current of reverse polarity from the forward scan (ioxp). This oxidation peak will usually
have a similar shape to the reduction peak. As a result, information about the redox
potential and electrochemical reaction rates of the compounds is obtained.
Even if generally, electrochemistry analysis is performed on SAMs modified with
a number of different electroactive molecules such as ferrocene,228 ubiquinone229 and
aromatic groups,230 an electroactive “tag” is not always necessary to perform CV
studies on SAMs. For instance, in surface analysis, the use of CVs has allowed gaining
important information on SAMs surface coverage and monolayer defects. In fact, in
well packed SAMs charge transfer is not possible because ions in the electrolyte are
shielded from the densely assembled molecules and cannot reach the metal
surface.231-232 However, when defects are present or when we are analysing a low
density monolayer the ions can penetrate and come into contact with the surface
generating a voltage−current curve.231-232
The generation of a current in the absence of a redox couple is possible due to
the presence of an electrical double layers on the surface which behaves like a
capacitor, Figure 43.

Chapter 2 Page 73
Figure 43 Schematic representation of the electrical double layer. The ions form a compact monolayer on the surface at a distance of about 1 nm. This distance depends both on the ion size and on the voltage.
This simple model, proposed by Helmholtz in 1879,233 shows the spatial charge
distribution at a metal−electrolyte interface. In this theory it is hypothesised that the
surface charge is neutralised by opposite sign counterions placed at distance, d, away
from the surface. The surface charge potential is linearly dissipated from the surface
to the counterions satisfying the charge.
In an improvement of the above described theory, Gouy and Chapman,
(1913),234-235 took into account more physical phenomena such as thermal and
Brownian motion occurring in solution. They suggested that ions behave like point
charges and that interfacial potential at the charged surface could be attributed to the
presence of a number of ions of given sign attached to its surface, and to an equal
number of ions of opposite charge in the solution. In other words, counter ions are not
rigidly held, but tend to diffuse into the liquid phase until the counter potential set up by

Chapter 2 Page 74
their departure restricts this tendency. Within this diffusion layer, the counteracting
charge ion density decreases as the distance from the electrode surface increases,
causing an inversely exponential potential drop across the diffusion layer as shown in
Figure 44. In the Gouy−Chapman model the change in concentration of the counter
ions near a charged surface follows the Poisson-Boltzmann distribution, (Equation
14).
Eq. 14 n = n0exp(−zeΨ/kBT)
Where n0 is the bulk concentration, z is the charge on the ion, e is the charge on a
proton kB is the Boltzmann constant and T is the temperature and Ψ is the electrostatic
potential.
Figure 44 Schematic representation of the Gouy−Chapman model of electrical “double layer” along with the potential drop across the diffusion layer.

Chapter 2 Page 75
Stern236 and Grahame237 further developed the previous two models in 1924 and 1947,
respectively. They combined the two preceding theories, with some of the ions almost
adhering to the electrode as suggested by Helmholtz and some forming a
Gouy−Chapman type diffuse layer. This theory states that ions have finite size and
cannot approach the surface closer than few nm (therefore they cannot adhere
completely as in Helmholtz theory). However, at higher distances the potential and
concentration of the diffuse part of the layer is low enough to justify treating the ions
as point charges (as in Gouy−Chapman model). Stern also assumed that it is possible
that some of the ions are specifically adsorbed by the surface and proposed the
coexistence of three regions (Figure 45). First, the inner Helmholtz plane (IHP) which
extends from the electrode to a plane passing through the centres of the specifically
adsorbed ions (dehydrated). Second, the outer Helmholtz plane (OHP) which passes
through the centres of hydrated ions at their distance of closest approach to the
electrode. Third, the diffuse layer i.e. the region that lies beyond the OHP. Potential
changes occur linearly with distance up to the outer Helmholtz plane and then
exponentially through the diffuse double layer region. Diffuse double layer effects
decrease with increasing concentration in solution.

Chapter 2 Page 76
Figure 45 Schematic representation of the three electrode/electrolyte interface regions: the so called IHP (with dehydrated ions), the OHP (with partially hydrated ions) and the Gouy−Chapman diffusion layer (with fully hydrated ions).
The "thickness" of this charged layer depending on the size, the movement and on the
concentration of the ions can range from 0.1 to 10 nm it is called Debye length and can
be calculated by using Equation 15.
Eq. 15
Where I is the ionic strength of the electrolyte, ε0 is the permittivity of free space, εr is
the dielectric constant, kB is the Boltzmann constant, T is the absolute temperature in
Kelvins, NA is the Avogadro number and e is the elementary charge.

Chapter 2 Page 77
2.8 Fluorescent microscopy techniques
2.8.1 Conventional fluorescence microscope
A fluorescence microscope is an optical microscope that uses fluorescence and
phosphorescence instead of, or in addition to, reflection and absorption to study
properties of organic or inorganic substances.238 Compared to a conventional light
microscope, a fluorescence microscope can use a much higher intensity light source
which excites a fluorescent species (i.e. fluorophore) in a sample of interest. This
fluorescent species in turn emits a lower energy, longer wavelength light that can be
separated from the surrounding radiation with filters designed for that specific
wavelength.239 As a result, only wavelengths matching the fluorescing material will be
selected (Figure 46).
Figure 46 Showing the general setup for a fluorescent microscope.

Chapter 2 Page 78
Most of the fluorescence microscopes used in biology today are epifluorescence
microscopes, meaning that both the excitation and the observation of the fluorescence
occur above the sample.240
Fluorescent microscopy is often used to image specific features of small specimens
such as microbes and to visually enhance 3D features at small scales. This can be
accomplished by using fluorescent tags which are typically aromatic hydrocarbons,
and some amino acids that can be attached to specific parts of the specimen or used
to stain the sample. Numerous fluorescence assays are carried out by chemically
modifying with a fluorescent dye monoclonal antibodies and antibody fragments,241
peptides, and labelled small molecules.242 This kind of assays are called direct
fluorescent assay. On the other hand, in the indirect method the target molecules are
unlabelled but they can specifically interact with a second molecule tagged with the
fluorescent dye.
Other than small molecules, cells can also been fluorescently tagged (stained) in order
to enhance the contrast in the microscopic image. This procedure involves adding a
class−specific (DNA, proteins, lipids, carbohydrates) dye to the cell in order to qualify
or quantify the presence of a specific compound. These specific fluorescent probes
are able to target for instance specific cellular and sub−cellular organelles and
molecules. However, cell−dyes can be also non−specific and target the whole cell.
These latter kind of dyes are generally incorporated into cell membranes.243
The refinement of epifluorescent microscopes and advent of more powerful focused
light sources, such as lasers, has led to more technically advanced scopes such as
the scanning confocal laser microscopes (SCLM).

Chapter 2 Page 79
2.8.2 Scanning Confocal Laser Microscopy (SCLM)
Since the development and patent of the confocal microscope by Marvin Minky in
1957,244 confocal fluorescent microscopy have been extensively used to accentuate
the three dimensional nature of samples. This is achieved by using powerful light
sources, such as lasers, that can be focused to a pinpoint. This focusing is done
repeatedly throughout one level of a specimen after another. Most often an image
reconstruction program pieces the multilevel image data together into a 3D
reconstruction of the targeted sample. SCLMs are invaluable tools for producing high
resolution 3D images of subsurfaces in specimens such as microbes. Their advantage
is that they are able to produce sharp images of thick samples at various depths by
taking images point by point and reconstructing them with a computer rather than
viewing whole images through an eyepiece. A schematic example of a SCLMs setup
is given in Figure 47.

Chapter 2 Page 80
Figure 47 Schematic representation of the confocal microscope setup.
In contrast to conventional microscopes, the illumination in a confocal microscope is
achieved by scanning one or more focused laser beams of light through a pinhole
across the sample. The image produced is called an optical section.245 The pinhole
can be adjusted in order to focus more directly to specific regions of the sample, and
minimises photobleaching at the same time. Similarly, the emitted light passes through
a secondary pinhole towards a low noise photomultiplier. This in turn produces a signal
that is directly proportional to the brightness of the light. The signal produced from the
photomultiplier is processed via an imaging system, that allows the reconstruction of
3D data.245

Chapter 3 Page 81
2.0 CHAPTER 3
Monitoring Bacterial Adhesion on One−Component SAMs
by Surface Plasmon Resonance
This chapter is based on the manuscript, ”Probe Marine Bacterial Adhesion Kinetics
by Surface Plasmon Resonance” Pranzetti, A., Salaün, S., Mieszkin, S., Callow, M. E.,
Callow, J. A., Preece, J. A., Mendes, P. M., Adv Funct Mater, 2012, 22, 3672−3681.
Abstract: Understanding how bacteria adhere to a surface is a critical step in the
development of novel materials and coatings to prevent bacteria forming biofilms.
Here, Surface Plasmon resonance (SPR) spectroscopy, in combination with
self−assembled monolayers (SAMs) that have different backbone structures and/or
functional groups, is used for the first time to study the initial stages of bacterial
adhesion to surfaces (i.e., initial interaction of cells with a surface, a process
governed by van der Waals, electrostatic, and hydrophobic interactions). The work
presented in this chapter highlights SPR spectroscopy as a powerful and unique
approach to probe bacterial adhesion in real−time. SPR spectral data reveal different
kinetics of adhesion for the interaction of two marine bacteria species (M.
hydrocarbonoclasticus and C. marina) to a range of organosulfur SAMs.
Furthermore, the extent of adhesion is dependent on the backbone structures and
functional groups of the SAMs. The role of extracellular polymeric substances (EPS)
in bacterial adhesion is also investigated. Pre−conditioning experiments with

Chapter 3 Page 82
cell−free culture supernatants, containing planktonic EPS, allow quantification of the
amount adsorbed onto surfaces and directly account for the impact of EPS
adsorption on bacterial adhesion in the assay. While the physicochemical
characteristics of the surfaces play a significant role in determining bacterial cell
adhesion for low levels of conditioning by planktonic EPS, greater levels of
conditioning by EPS reduce the difference between surfaces.
3.1 Background
Research on bacterial adhesion is a field covering a number of different areas, such
as marine science, soil and plant ecology, food safety, and the biomedical field.246 As
an integral part of their survival mechanism, bacteria have a natural tendency to adhere
to surfaces. Surface−attached bacterial cells may develop into biofilms, which can
have beneficial or adverse effects on such surface, depending on whether their
formation within a specific system is intentional or not.246 For instance, bacterial
biofilms are of great practical importance for technologies such as wastewater
treatment and bioremediation of groundwater and soil. In other settings, long−term
adhesion and the development of bacterial colonies or biofilms are responsible for
biofouling in marine and industrial systems, a wide variety of microbial infections in the
human body, and many other expensive and life−threatening situations.247 As a result,
knowledge of bacterial adhesion to surfaces is essential for promoting or preventing
biofilm formation, as well as for understanding bacterial ecology. The nature of the
surface as well as the type of bacteria may dictate whether or not cells will adhere at
an interface, therefore efforts have been made to modify the interfacial properties to

Chapter 3 Page 83
understand bacterial adhesion process.18, 25 Such efforts have triggered the need for
experimental approaches to quantify the adhesion of bacteria on artificial surfaces.
3.2 Methods used for the study of the bacterial adhesion process
To date, bacterial adhesion assays have been developed using enzyme−linked
immunosorbent assay (ELISA),248 radiolabeling,249 plate counting250 and various types
of staining such as the use of nucleic acid−binding fluorochromes (e.g. SYTO®13),251
or more general stains such as the Gram stain,252 followed by either direct microscope
counting (with or without image analysis) or by dye extraction,253 or in the case of
SYTO®13, by the direct use of a fluorescence plate reader. Figure 48 shows an
overview of the main methods listed above.
Figure 48 Schematic view of the main methods used to monitor bacterial interactions. A brief description (in red) and the limitations of each technique (in green) are also listed. Furthermore, a summary of the main characteristics that the ideal method should have, (in purple), is also given.

Chapter 3 Page 84
For the purpose of this thesis only the plate counting and staining methods will be
discussed in the next paragraphs.
3.2.1 Plate counting
One of the most common methods of determining cells number is the viable plate
count. A sample to be counted is diluted in a solution that will not harm the microbe,
yet does not support its growth (so the total number of cells does not change during
the analysis).254 In most cases, a portion of the sample is diluted 10−fold into a buffer
and mixed thoroughly and subsequently a 0.1−1.0 ml portion of this first dilution is then
diluted a further 10−fold, giving a total dilution of 100−fold. This process is repeated
until a concentration that is estimated to be about 1000 cells /ml is reached.255 There
are two main plate counting methods:256
1) Spread plate: A high diluted bacterial suspension is taken and spread onto a solid
medium that will support the growth of the microbe (Figure 49a). The colonies formed
are then counted.
2) Pour plate: The bacterial suspension is firstly mixed with an agar solution and poured
into a petri dish (Figure 49b).

Chapter 3 Page 85
Figure 49 Schematic representation of a) Spread plate method and b) Pour plate method.
In either cases, sample dilution is high enough that individual cells are deposited on
the agar and these give rise to colonies. By counting each colony, the total number of
colony forming units (CFUs) on the plate is determined. By multiplying this count by
the total dilution of the solution, it is possible to find the total number of CFUs in the
original sample. One major disadvantage of the viable plate count is the assumption
that each colony arises from one cell. In species where cells grow together in clusters,
a gross underestimation of the true population occurs.256 Furthermore, the rate at
which bacteria give rise to an observable colony can also vary. If the incubation time
is too short, some colonies may be missed. The temperature of incubation and medium
conditions must also be optimised to achieve the largest colonies possible so that they
are easily counted. Finally, this technique takes time. This time can vary from one day
to several weeks depending from the bacteria analysed.257 However, despite its
shortcomings, the viable plate count is a popular method for determining cell numbers
because of its sensitivity, low costs and the capability of only counting living bacteria.

Chapter 3 Page 86
3.2.2 Staining
Since bacteria have nearly the same refractive index of water, when they have to be
observed with a microscope they are opaque and almost invisible. For this reason,
stains, with their ability to colour and improve the contrast of bacteria, are among the
most used methods to examine microbes. Basic stains, due to their positive charge will
bind electrostatically to the generally negatively charged molecules such as
polysaccharides, proteins and nucleic acids present either on the external membranes
or inside the bacteria.258 Some commonly encountered basic (positively charged)
stains are crystal violet,259 safranin (a red dye),260 and methylene blue.261 However,
the binding between a stain and a nucleic acid could be due to more specific
interactions than the electrostatic ones. This is true, for instance, for the cell-permeant
nucleic acid stain SYTO®13.262 These stains can give both quantitative and qualitative
information (Figure 50a-b), such as the shape of the bacteria.
Figure 50 a) Epifluorescence image revealing the rod−shape of M. hydrocarbonocalsticus. b) Epifluorescence image revealing the spherical−shape of C. marina.

Chapter 3 Page 87
Basic stains may be used alone (a simple stain) or in combination (differential stain)
depending on the experiment involved.258 Other than shape and quantity, stains can
be used to determine the bacterial type like in the Gram staining assay (Figure 51).263
By this technique, Gram positive bacteria stain purple and gram negative stain red.
Gram positive bacteria, which have multiple layers of peptidoglycan, retain the crystal
violet, while it is quickly rinsed out of Gram negative bacteria because their
peptidoglycan is a single layer thick. The bacteria are stained a second time (counter
stained) with the dye safranin which will not show up on the already purple Gram
positive but will stain the decolourised Gram negative bacteria in red.263
Figure 51 Schematic representation of the GRAM staining assay.
Another often used differential bacterial stain assay is the so called viability assay.
They are mostly based on controlling the integrity of the bacterial membrane in order
to check whether the microbe is dead or alive.264 For instance, the dyes used in this
work, commercially called LIVE/DEAD BacLight Bacterial Viability Kits, use mixtures
of SYTO®9 green−fluorescent nucleic acid stain and the red−fluorescent nucleic acid
stain, propidium iodide. These stains, differ both in their spectral characteristics and in
their ability to penetrate healthy bacterial cells. When used alone, the SYTO®9 stain
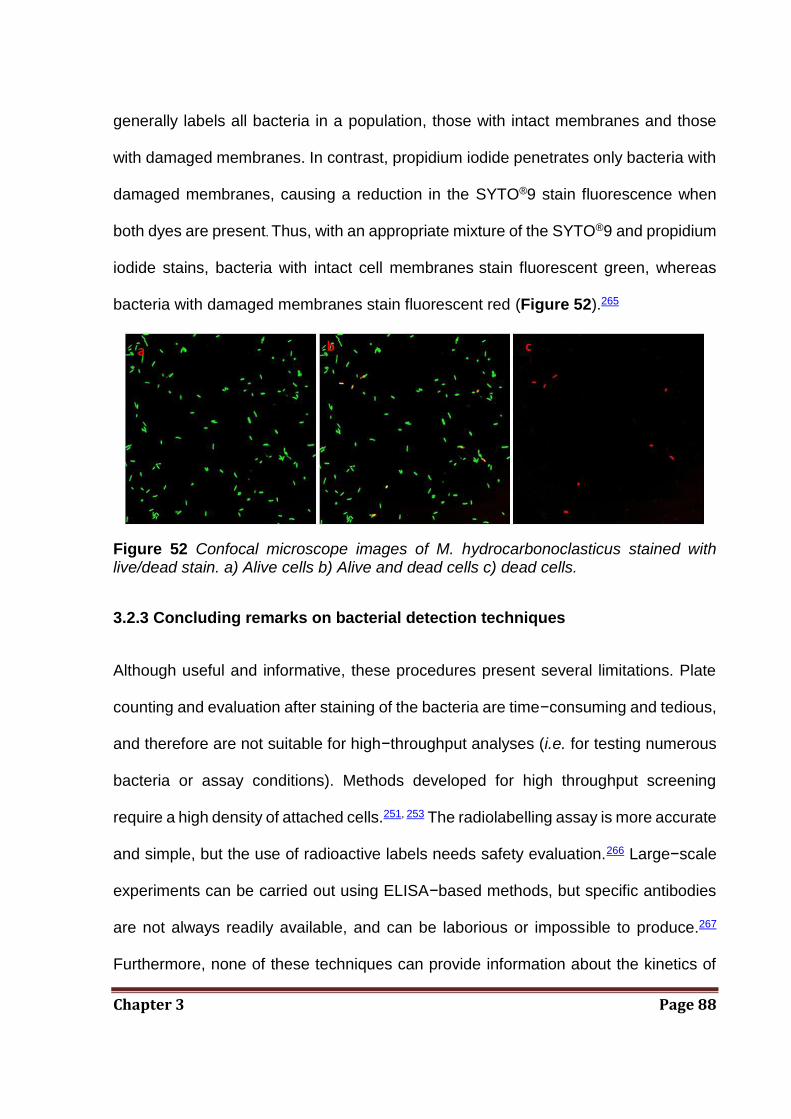
Chapter 3 Page 88
generally labels all bacteria in a population, those with intact membranes and those
with damaged membranes. In contrast, propidium iodide penetrates only bacteria with
damaged membranes, causing a reduction in the SYTO®9 stain fluorescence when
both dyes are present. Thus, with an appropriate mixture of the SYTO®9 and propidium
iodide stains, bacteria with intact cell membranes stain fluorescent green, whereas
bacteria with damaged membranes stain fluorescent red (Figure 52).265
Figure 52 Confocal microscope images of M. hydrocarbonoclasticus stained with live/dead stain. a) Alive cells b) Alive and dead cells c) dead cells.
3.2.3 Concluding remarks on bacterial detection techniques
Although useful and informative, these procedures present several limitations. Plate
counting and evaluation after staining of the bacteria are time−consuming and tedious,
and therefore are not suitable for high−throughput analyses (i.e. for testing numerous
bacteria or assay conditions). Methods developed for high throughput screening
require a high density of attached cells.251, 253 The radiolabelling assay is more accurate
and simple, but the use of radioactive labels needs safety evaluation.266 Large−scale
experiments can be carried out using ELISA−based methods, but specific antibodies
are not always readily available, and can be laborious or impossible to produce.267
Furthermore, none of these techniques can provide information about the kinetics of

Chapter 3 Page 89
adhesion in real−time. Noting these issues, there remains a need for antibody−free
and label−free assays that enable real−time monitoring of bacterial adhesion to
surfaces without secondary agents.
3.3 Aim
SPR is a powerful optical technique that detects molecular interactions on a metal
surface in real−time in a label−free environment. It has been widely used for the
quantification and kinetic analysis of receptor–ligand interactions,149, 166 but so far SPR
has only been of limited268 use in the analysis of bacterial interactions. Previous studies
have been mainly concentrated on the sensing performance (i.e. sensitivity and
selectivity) of the SPR to detect bacterial cells,268 and detection limits as low as 102−106
cells/ml have been reported.269 A few other studies have applied the SPR technique to
discriminate between wild−type and mutant bacterial strains,270 to analyse the affinity
of bacteria for surface immobilised host components, including proteins271 and
glycolipids272 and to evaluate the inhibitory potency of multivalent galabiose derivatives
on bacterial adhesion.273 With its ability to monitor, in real−time, interactions occurring
in the vicinity of a metal surface (usually within 200 nm),274 the SPR technique is,
hence, advantageous for the investigation of the initial stages of bacterial adhesion at
interfaces.
This chapter aims to present the investigation of the initial stage of bacterial
adhesion to surfaces by SPR spectroscopy, in combination with one−component static
SAMs having different backbone structures and/or functional groups. The present work
highlights SPR spectroscopy as a powerful and unique approach to probe bacterial

Chapter 3 Page 90
adhesion in real−time. The ability of SPR spectral data to reveal different kinetics of
adhesion for the interaction of two marine bacteria (M. hydrocarbonoclasticus and C.
marina) to a range of commonly used organosulfur SAMs was demonstrated.
3.4 Objectives
The discussion is articulated in two main objectives.
Objective 1:
The first objective was to fabricate and characterise six different one−component static
SAMs by contact angle, ellipsometry and XPS (Figure 53). The SAMs chosen
presented different characteristics in terms of wettability, charge and backbone
structure.
Figure 53 Schematic representation of the six one−component SAMs used in this work along with an indication of their wettability and charge.
Objective 2:

Chapter 3 Page 91
The second objective was to perform a series of SPR assays intended to elucidate the
first steps of bacterial adhesion and the effect of EPS secretion. An overview of these
assays is shown in Figure 54.
Figure 54 Schematic showing the bacterial adhesion assays performed using SPR. SPR assay 0: organosulfur SAMs on gold were exposed to a freshly prepared suspension of Mh and Cm (0 minutes, T0). SPR assay 1a: organosulfur SAMs were exposed to soluble EPS solutions collected after different ageing times, (0, 20, 60 and 120 minutes, T0−T120). SPR assay 1b: organosulfur SAMs were exposed differently aged bacterial (Mh, Cm) suspension, T0−T120. SPR assay 2: organosulfur SAMs on gold were exposed to soluble EPS solutions collected after different ageing time, T0−T120 (1st SPR Injection) prior to be exposed to a freshly prepared bacterial suspension (T0) (2nd SPR Injection). Soluble EPS was collected by filtration from bacterial suspensions after 0 (T0), 20 (T20), 60 (T60) and 120 (T120) min of bacterial ageing in ASW. SPR assay 0: The six SAMs fabricated in Objective 1 were exposed to fresh (collected
and readily used, T0) M. hydrocarbonoclasticus and C. marina suspensions (Figure
55). The extent of bacterial adhesion was measured by SPR and the role played by
the SAM backbone structure and functional group in the bacterial adhesion analysed.

Chapter 3 Page 92
Figure 55 Schematic representation of the procedure followed for performing SPR assay 0.
In this section, the SPR adhesion assay was also compared with a standard staining
adhesion assay in order to demonstrate the reliability of the former technique.
SPR assay 1a: SPR was employed to monitor the adsorption of EPS, which was
collected by filtration from M. hydrocarbonoclasticus and C. marina suspensions after
0 (T0), 20 (T20), 60 (T60), and 120 (T120) min of bacterial ageing in artificial sea water
(ASW). The six SAMs fabricated in Objective 1 were exposed to those suspensions
and the EPS adhesion was then monitored by SPR (Figure 56).
Figure 56 Schematic representation of the procedure followed for performing SPR assay 1a.
SPR assay 1b: SPR was employed to monitor the adsorption of M.
hydrocarbonoclasticus and C. marina suspensions collected after 0 (T0), 20 (T20), 60
(T60), and 120 (T120) min of bacterial ageing in artificial sea water (ASW). The six
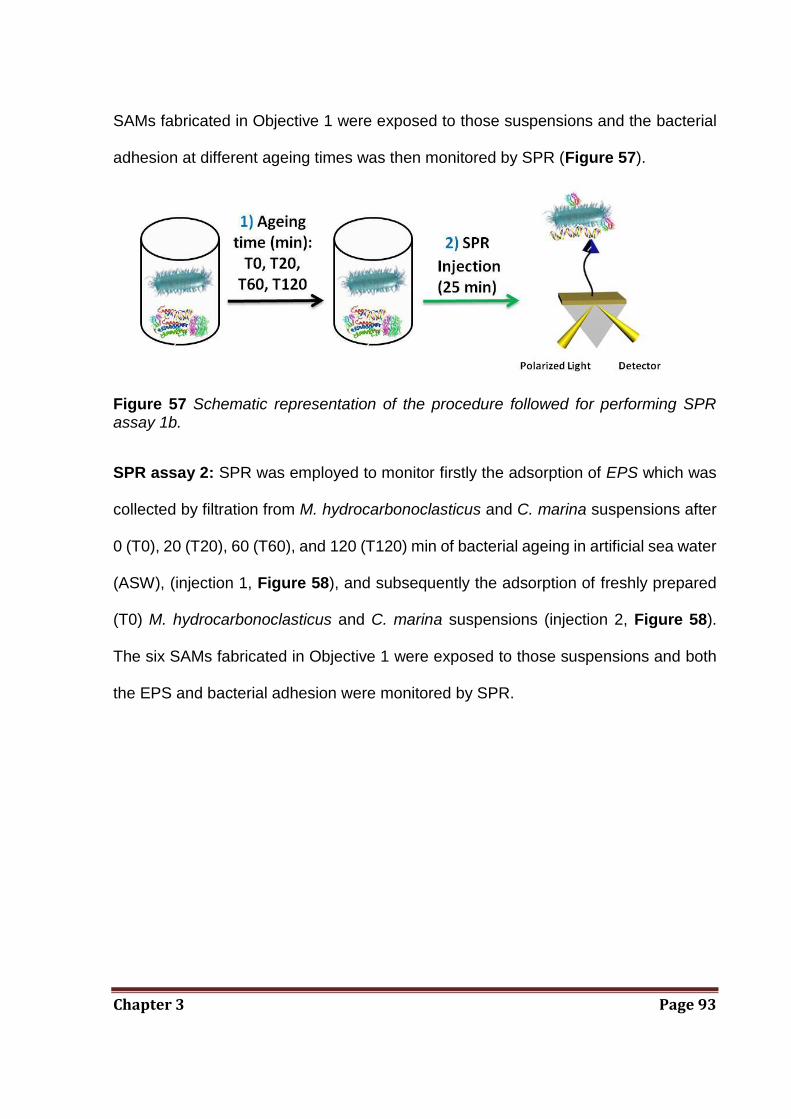
Chapter 3 Page 93
SAMs fabricated in Objective 1 were exposed to those suspensions and the bacterial
adhesion at different ageing times was then monitored by SPR (Figure 57).
Figure 57 Schematic representation of the procedure followed for performing SPR assay 1b.
SPR assay 2: SPR was employed to monitor firstly the adsorption of EPS which was
collected by filtration from M. hydrocarbonoclasticus and C. marina suspensions after
0 (T0), 20 (T20), 60 (T60), and 120 (T120) min of bacterial ageing in artificial sea water
(ASW), (injection 1, Figure 58), and subsequently the adsorption of freshly prepared
(T0) M. hydrocarbonoclasticus and C. marina suspensions (injection 2, Figure 58).
The six SAMs fabricated in Objective 1 were exposed to those suspensions and both
the EPS and bacterial adhesion were monitored by SPR.

Chapter 3 Page 94
Figure 58 Schematic representation of the procedure followed for performing SPR assay 2.
3.5 Results and discussion
3.5.1 Fabrication of one−component SAMs
One−component static SAMs have been extensively used for studying bacterial
interaction with surfaces. In this work, six different organosulfur SAMs have been
fabricated and characterised. The six SAMs were chosen for their different terminal
functional groups (hydrophilic, hydrophobic, positively charged, negatively charged
and neutral) and backbone (i.e. hydrophilic and hydrophobic). The organosulfur
compounds selected to carry out this assay are shown in Figure 59.

Chapter 3 Page 95
Figure 59 Chemical structures of the organosulfur compounds used for SAM preparation.
The SAMs were formed on gold surfaces by using the experimental procedure reported
in Chapter 7. It is worth noting that SAMs terminated with charged groups such as
MHA, AUT and EG7−COOH were prepared in a manner such that hydrogen bonding
could be avoided. Acid or basic terminal groups could form interplane hydrogen bonds
with other free thiols in the bulk solution leading to the formation of a double layer.275
For this reason, a small volume of trifluoroacetic acid (TFA) and triethylamine (TEA)
was used in the solution of the carboxylic acid−terminated and amino−terminated
thiols, respectively. TFA and TEA are able to disrupt the hydrogen bonds between the
bound and bulk thiol molecules by forming hydrogen bonds with the end groups of both
bound thiolate on the surface and free thiols in the bulk. Then the residual TFA and
TEA remaining on the SAM surface are washed away by rinsing the SAM surface with
an ethanolic solution of ammonium hydroxide and acetic acid, respectively.276
In this work, MHA, AUT and EG7−COOH SAMs were chosen because they are
charged at the pH used for performing the bacterial adhesion assays (i.e. 8.1−8.2 −
pH of the Artificial Sea Water, ASW, used in this study). For instance, the surface pKa
of MHA and AUT have been reported to be 7.9277-284 and 7.5,285-286 (Figure 60)

Chapter 3 Page 96
respectively, indicating that at pH of 8.1−8.2 the MHA SAM is partially deprotonated277-
284 (negatively charged) and AUT partially protonated285-286 (positively charged).
EG7−COOH SAM is expected to have a similar pKa to MHA,277-284 and thus it also
carries a partial negative charge at the pH studied. Concerning HDT, EG6−OH and
MUT, their pKa values are too high (pKa HDT > 35, pKa EG6−OH and MUT ≥ 19−20287)
to carry any charge at the pH of the ASW, and therefore, in this study, they will be
considered as neutral SAMs.
Figure 60 Representation of the six SAMs along with their wettability, charge and pka characteristics.
3.5.2 Characterisation of one−component SAMs
The fabricated SAMs were characterised by dynamic contact angle and ellipsometry
and the values obtained are reported in Figure 61.

Chapter 3 Page 97
The contact angle values obtained are in good agreement with literature data.98, 288
EG6−OH and MUT had the lowest advancing contact angles (25o±3 and 28o±2,
respectively). The lowest contact angle of the carboxylic acid−terminated SAMs was
found for the one containing a hydrophilic backbone (EG7−COOH, 41o±2), with a
slightly higher contact angle for the carboxylic acid−terminated SAM containing a
hydrophobic backbone (MHA, 49o±2). The advancing contact angle for the
amino−terminated SAM, (AUT, 60o±2) was higher in accordance with the lower surface
energy reported for this surface.289-290 The highest advancing contact angle was
observed for HDT SAM (105o±4) as a result of both the higher hydrophobicity of the
backbone and the end group. The thickness of the SAMs was measured by
ellipsometry and the values reported in Figure 61 were in agreement with the
theoretical calculations (Chem 3D Software) and literature data reported for similar
monolayers.76
Figure 61 Advancing and receding water contact angles and experimental and theoretical ellipsometric thickness values for the different organosulfur SAMs.

Chapter 3 Page 98
3.5.3 SPR Bacterial adhesion on SAMs (SPR assay 1)
Following characterisation of the SAMs, SPR was used to investigate the initial stages
of bacterial adhesion as a function of SAM type (i.e. with differences in charge,
wettability and packing of the SAMs). M. hydrocarbonoclasticus and C. marina
suspensions were prepared by choosing the bacteria colonies from a culture dish and
by incubating them in a rich medium of culture for 48 (M. hydrocarbonoclasticus) or 24
(C. marina) hours. When they reached the exponential phase, they were centrifuged,
washed with ASW and resuspended in ASW to obtain an optical density (OD600) of 1.
3.5.3.1 SPR assay 0
In SPR assay 0 (Figure 62), the organosulfur SAMs on gold were exposed to freshly
prepared M. hydrocarbonoclasticus and C. marina bacterial suspensions, (ageing
time=0, T0). Firstly, the SAMs were exposed to a flow of ASW, to establish the
baseline, followed by an injection of bacteria in ASW at an OD600=1 into the SPR flow
cell at the rate of 25 μl/min, for 25 min. The SPR flow cell was then flushed with ASW
to leave only the irreversibly adhered bacteria on the SAM. The amount of bacterial
adhesion is defined as the difference in the SPR response units between the beginning
of injection of bacteria and the end of the wash with ASW. It can be inferred from the
curves (Figures 62a and b, SPR assay 0) that the amount of bacterial adhesion for
both species is dependent upon the physicochemical nature of the surfaces.

Chapter 3 Page 99
Figure 62 Sensorgram traces obtained from the SPR a) M. hydrocarbonoclasticus (Mh) and b) C. marina (Cm) adhesion assays (SPR assay 0; ageing time=0 min, T0) performed on SAMs of the indicated organosulfur compounds.(refer to Fig. 59):
The results suggest that electrostatic interactions play an important role in the initial
bacterial adhesion process. Bacteria attached preferentially to charged surfaces
(negative: EG7−COOH and MHA; positive: AUT) rather than neutral surfaces (HDT,
EG6−OH, MUT). However, internal hydrophilicity and a lower packing density,291
significantly favoured resistance to bacterial adhesion. For instance, negatively
charged SAMs with an oligo(ethylene glycol) interior (EG7−COOH) showed higher
resistance to adhesion of both M. hydrocarbonoclasticus and C. marina than negatively
charged SAMs with a reported high packing density68 and hydrophobic backbone
(MHA). On the other hand, SPR data showed that the overall hydrophobicity of the
SAMs appears not to influence appreciably the adhesion process of both bacteria since
the HDT (most hydrophobic SAM) and the EG6−OH (one of the most hydrophilic
surfaces) SAMs are the most antifouling surfaces.
For each surface, SPR−assay experiments were performed in triplicate and
similar SPR curves and final responses were obtained demonstrating the
reproducibility of our SPR−based assays (Figure 63).

Chapter 3 Page 100
Figure 63 Three repeats of the SPR bacterial adhesion assay 0; ageing time=0 min, T0 (refer to Figure 62 for related sensorgrams), for a) M. hydrocarbonoclasticus and b) C. marina onto SAMs of the indicated organosulfur compound (see Figure 59 for
abbreviations). The error bars are the mean standard deviation of those measurements.
Zeta potential studies were carried out in ASW in order to establish the charge on the
bacteria. Both bacteria were found to be negatively charged (C. marina= −33.1±0.3
mV; M. hydrocarbonoclasticus= −15.9±0.5 mV, Figure 64), which may explain the
highest adhesion of both bacteria to the partially positively charged SAM, AUT.
Figure 64 Zeta potential values of a) M. hydrocarbonoclasticus and C. marina in ASW.
However, the presence of positive domains292 on the external membrane of the
bacteria could also explain the high adhesion to negatively charged SAMs (i.e. MHA).
Furthermore, surprisingly, bacteria with hydrophobic characteristics (M.
hydrocarbonoclasticus) showed the lowest adhesion on the most hydrophobic surface
(HDT) and that bacteria with hydrophilic characteristics (C. marina) adhered to the

Chapter 3 Page 101
lowest extent on the most hydrophilic surface (EG6−OH). We imputed this behaviour,
different from a big portion of the available literature, to the way we grow the bacteria.
In fact, compared to other literature reports our bacteria were kept in a minimal medium
(in absence of nutrients) therefore their adhesion characteristics could have changed
in comparison to those bacteria kept in a reach medium. In a previous report, C. marina
showed a similar trend to the one obtained in this study whereas M.
hydrocarbonoclasticus exhibited an opposite effect by preferring hydrophobic
surfaces.109 However the surfaces described in this earlier report, the were very
different to those used jn tis thesis being based on poly(dimethylsiloxane) (PDMS)
coatings (hydrophobic surfaces) and PDMS treated with plasma (hydrophilic
surfaces).109 Similarly, in another study, employing galactoside−terminated alkanethiol
SAMs, both C. marina and M. hydrocarbonoclasticus preferentially adhere to the most
hydrophilic SAMs, but in this case there are more adhesive properties other than the
hydrophilicities, that can play a role in bacterial adhesion.293 The observed inconsistent
patterns between bacterial adhesion and wettability suggest that the effect of the
hydrophobicity of bacteria on bacterial adhesion to a surface is determined by not only
surface wettability, but also by the backbone and terminal functional groups and its
surface density. This suggestion is also in line with the observation that SAMs with
similar wettabilities (EG6−OH and MUT) but different backbone structures and packing
density led to considerably different bacterial adhesion (Figure 62). These findings are
also in agreement with previous literature in which protein294 and algal cells295
adhesion was found to be dependent on the internal and terminal hydrophilicity and
packing density of the SAM. However, in these studies protein− and algae−adhesion
resistance was favoured by both internal and terminal hydrophilicity of the SAMs.

Chapter 3 Page 102
Although such studies have shown a correlation between the adsorption of proteins
and cell adhesion on SAMs, other studies found little or no evidence to support the
generalisation that SAMs exhibiting optimal protein−resistance properties also make
them ideal candidates to prevent bacterial and mammalian cells adhesion.293, 296
Subsequent to the SPR analysis, the colonised gold surfaces were chemically
fixed with glutaraldehyde, stained with SYTO®13 and examined by epifluorescence
microscopy. The images (Figure 65) qualitatively demonstrate the similarities in the
colonisation by the two bacteria on the various modified gold surfaces which are in
agreement with the SPR spectral data (i.e. neutral SAMs have relatively little bacterial
adhesion while the charged SAMs have more bacterial adhesion).
Figure 65 Images obtained by epifluorescence microscopy of the colonised gold SPR chips chemically fixed with glutaraldehyde and stained with SYTO®13. For both bacteria strains, neutral SAMs showed to be more bacteria repellent compared to charged SAMs, independently of the wettability of the surfaces.
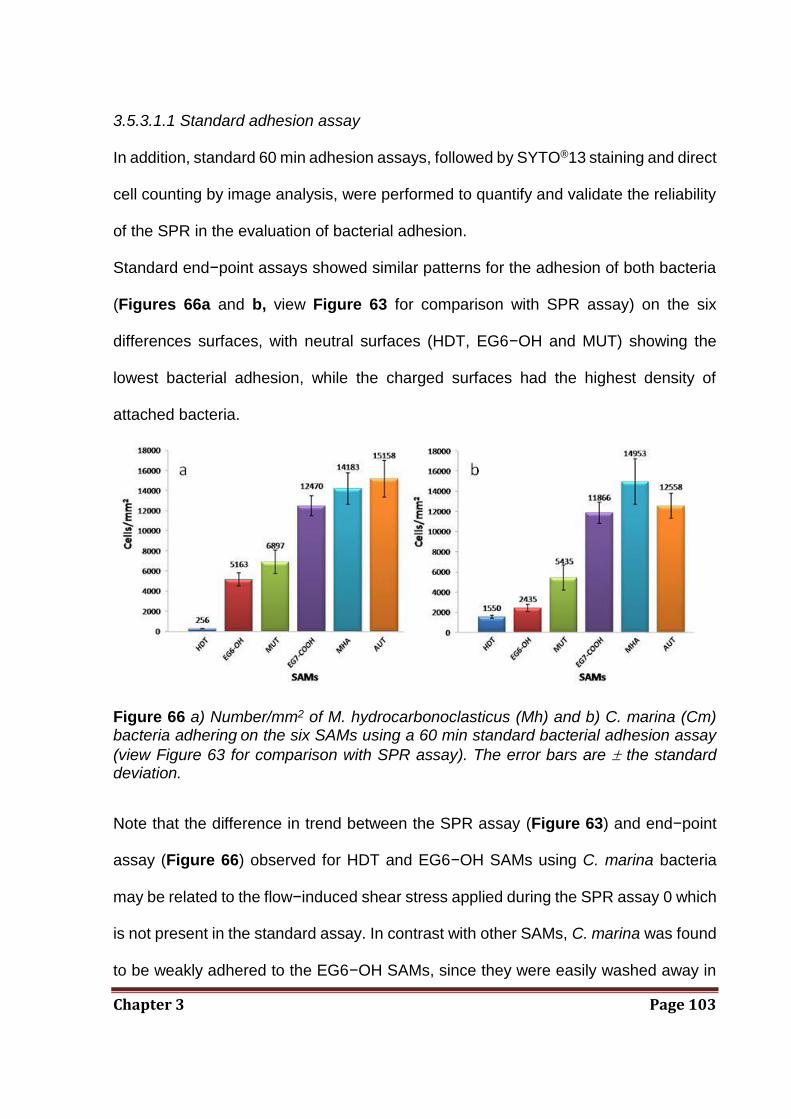
Chapter 3 Page 103
3.5.3.1.1 Standard adhesion assay
In addition, standard 60 min adhesion assays, followed by SYTO®13 staining and direct
cell counting by image analysis, were performed to quantify and validate the reliability
of the SPR in the evaluation of bacterial adhesion.
Standard end−point assays showed similar patterns for the adhesion of both bacteria
(Figures 66a and b, view Figure 63 for comparison with SPR assay) on the six
differences surfaces, with neutral surfaces (HDT, EG6−OH and MUT) showing the
lowest bacterial adhesion, while the charged surfaces had the highest density of
attached bacteria.
Figure 66 a) Number/mm2 of M. hydrocarbonoclasticus (Mh) and b) C. marina (Cm) bacteria adhering on the six SAMs using a 60 min standard bacterial adhesion assay
(view Figure 63 for comparison with SPR assay). The error bars are the standard deviation.
Note that the difference in trend between the SPR assay (Figure 63) and end−point
assay (Figure 66) observed for HDT and EG6−OH SAMs using C. marina bacteria
may be related to the flow−induced shear stress applied during the SPR assay 0 which
is not present in the standard assay. In contrast with other SAMs, C. marina was found
to be weakly adhered to the EG6−OH SAMs, since they were easily washed away in

Chapter 3 Page 104
the rinsing process, indicating that flow−induced shear stress may play a role on
preventing attachment or washing off already bound bacteria on EG6−OH SAMs.
Despite the use of different conditions on both assays (i.e. SPR assay 0: OD600=1, time
of adhesion = 25 min and continuous flow−induced shear stress; standard assay:
OD600=0.1, time of adhesion = 1 h and shaking−induced shear stress), the overall high
degree of correlation was reassuring and indicated that both assays generate similar
results. These results demonstrate that SPR can be used as a reliable and rapid assay
to evaluate initial stages of bacterial adhesion. Furthermore, compared with the
standard adhesion assays, the SPR assay has the advantage of monitoring the
adhesion of bacteria on surfaces in real−time, thus allowing the interpretation of kinetic
information on bacterial adhesion and interaction mechanisms.
Measurement of the attachment of M. hydrocarbonoclasticus by SPR gave a
characteristic series of similar curves (Figure 62, for convenience, this figure is shown
again below), differing only in the rate at which bacterial adhesion occurs on the
different surfaces.
Figure 62 Sensorgram traces obtained from the SPR a) M. hydrocarbonoclasticus (Mh) and b) C. marina (Cm) adhesion assays (SPR assay 0; ageing time=0 min, T0) performed on SAMs of the indicated organosulfur compounds.

Chapter 3 Page 105
A higher rate of bacterial adhesion was observed for surfaces that can interact
electrostatically with bacteria (EG7−COOH, MHA and AUT), in contrast to the neutrally
charged surfaces (HDT, EG6−OH, MUT). Indeed, during the 25 min time frame of the
flow of bacteria over the charged SAMs (AUT, MHA, EG7−COOH), the response units
did not reach the plateau. Upon washing of all the surfaces with ASW there was a small
drop in the SPR response units, indicating that most of the bacteria were well adhered.
It is believed that the increase in the SPR response is due solely to bacteria deposition
on the surface and not to cell division, as the cell suspension concentration remained
constant over 120 min in the ASW minimal medium and microscopy observation
revealed no division of cells on the surfaces. Although, no substantial differences in
the relative density of adhered cells (Figures 66a and b) between the two bacteria on
the various SAMs could be detected in standard end−point adhesion assays (with
exception of HDT and EG6−OH for C. marina), clear differences in the kinetics of
bacterial adhesion were observed by SPR. For M. hydrocarbonoclasticus, the surfaces
that exhibited the fastest rate of adhesion had the highest bacterial adhesion upon
washing (Figure 62a). However, for C. marina this direct relationship between rate of
adhesion and final bacterial adhesion was not observed (Figure 62b). For instance,
although MUT and MHA SAMs exhibited faster rates of adhesion than AUT SAMs, the
AUT SAMs showed the highest final number of adhered C. marina cells. Actually, the
shape of the SPR curve for C. marina (Figure 62b) was dependent upon the surface
analysed, with some SPR sensorgrams saturating after 8−12 min (EG6−OH, MUT and
MHA) of exposure to bacteria. Bacterial equilibrium adhesion values were dependent
on the chemical properties of the SAM. The lowest number of cells of C. marina
adhering at equilibrium was found with EG6−OH SAMs. When ASW replaced the cell

Chapter 3 Page 106
suspension, the SPR signal dropped back close to baseline levels, which suggests that
on EG6−OH surfaces most bacteria adhered weakly and were easily washed away. It
is interesting to note the significance of the oligo(ethylene glycol) backbone of the
EG6−OH SAM in reducing the degree of adhesion since a SAM with a similar end
group, but with a hydrophobic backbone (MUT), gave intermediate final numbers of
adhering bacteria (Figure 62b). The maximum final number of adhered cells of C.
marina was obtained with charged SAMs with hydrophobic backbones (MHA and
AUT), (Figure 62b). These data show not only that the end group of the SAM is critical
in influencing initial attachment, but also that the backbone functionality influences the
strength of adhesion.
3.5.3.2 SPR assay 1a
The SPR signals obtained in these experiments will be composed of contributions not
only from the binding of the cells, but also from the physisorption of EPS, either present
in the experimental cultures at time zero, and/or which is secreted by the bacteria
during the period of measurements (up to 40 min).
SPR assays 1a were carried out using cell−free supernatant (EPS) derived from
filtered bacterial cultures aged in ASW for 0−120 min. The suspensions of C. marina
and M. hydrocarbonocalsticus were filtered through a 0.22 µm membrane filter after 0
(T0), 20 (T20), 60 (T60) and 120 (T120) min ageing in ASW. The resulting
EPS−containing supernatants were introduced into the SPR flow cell at a flow rate of
25 μl/min for 25 min after which, the surfaces were rinsed with ASW. Overall, SPR
sensorgrams demonstrated (Figure 67) that EPS adsorbed in higher amounts with

Chapter 3 Page 107
longer times of cell ageing (T60−T120). For instance, HDT SAMs exposed to a solution
of cell−free, EPS−containing supernatant of C. marina prepared at T0 showed only a
small SPR response (~100 response units), but this response was progressively
greater for supernatants collected at T20, T60 and T120 (Figure 67).
Figure 67 Sensorgram traces obtained from the adhesion of EPS on HDT SAMs collected by filtration at 0 (T0), 20 (T20), 60 (T60) and 120 (T120) min of C. marina bacterial suspension ageing time (SPR Assay 1a).
Evidence of the dependence of the SPR responses on the EPS concentration was
demonstrated by challenging HDT SAMs with a range of EPS dilutions. An undiluted
EPS solution collected from a C. marina culture aged in ASW for 180 min and EPS
solutions diluted with ASW to 25, 50, 60, 65, 75, 80, and 100% (v/v) were introduced
into the SPR flow cell at a flow rate of 25 μ L min− 1 for 25 min, after which the surfaces
were rinsed with ASW. The SPR response decreases linearly with increasing dilution
of EPS (Figure 68), confirming that the higher SPR responses in Figure 67a are due
to the higher concentrations of EPS in the injected solution.

Chapter 3 Page 108
Figure 68 SPR response unit values obtained from the adhesion of different EPS dilutions on HDT SAMs. An undiluted EPS solution as well as diluted solutions with ASW to 25, 50, 60, 65, 75, 80 and 100% (v/v) were introduced into the SPR flow cell at a flow rate of 25 μl/min for 25 min after which, the surfaces were rinsed with ASW to remove any unbound material.
3.5.3.3 SPR assays 1b
In the same fashion as SPR assays 1a and with the aim of verifying the trend obtained
with the EPS adsorption, SPR assays 1b (Figure 57) were conducted with both marine
bacteria using a freshly prepared bacterial suspension (T0), and cells aged for 20
(T20), 60 (T60) and 120 (T120) min in ASW. The SPR baseline for the SAM−modified
gold chip was established using ASW, following which the bacterial suspensions in
ASW at an OD600=1 were introduced into the SPR flow cell at the rate of 25 μl/min
(Figure 69).

Chapter 3 Page 109
Figure 69 Sensorgram traces obtained from the adhesion of C. marina (Cm) on HDT SAMs at 0 (T0), 20 (T20), 60 (T60) and 120 (T120) min of bacterial suspension ageing time (SPR Assay 1b).
Data were collected for 25 min, followed by washing with ASW. In general, the results
showed that cells aged for longer times displayed higher SPR responses. For instance,
for the HDT SAM exposed to a suspension of C. marina aged for 120 min in ASW, the
SPR signal increased by ~700 response units (Figure 69). Since the cells did not
divide in ASW up to T120 min, these results suggest that the higher SPR response
with cells aged in the minimal medium (ASW) was due to an increased physisorption
of EPS progressively secreted by the bacteria with time. Evidence of the “non-
proliferating” behaviour of cells in minimal medium during 120 min were found by
measuring a constant optical density in this time interval. Comparison of Figures 67
and 69 enables an estimation of the relative contributions of EPS and cells to the SPR
signal. On the HDT SAM, for example, after rinsing the SPR sensor chip with ASW,
the residual signal for the T0 cell−free supernatant was ~100 response units (Figure
67) and for the freshly prepared bacterial suspension (T0) was ~1000 response units,

Chapter 3 Page 110
indicating that EPS contributes to ca. 10% of the signal for the complete culture. This
rose to ca. 50% for cells that had been aged for 120 min.
3.5.3.4 SPR assay 2
In an effort to further delineate the effects of surface conditioning by EPS on adhesion
of bacteria, SPR assay 2 was carried out by pre−conditioning the SAMs with
EPS−containing bacteria−free filtrates collected from cells aged in ASW for 0 (T0), 20
(T20), 60 (T60) and 120 (T120) min (SPR assay 2 − 1st SPR Injection, Figure 58). The
resulting surfaces were then immediately challenged (SPR assay 2 – 2nd SPR
Injection, Figure 58) with freshly prepared bacterial suspensions (OD600=1). As for the
previous assays, the baseline for the SAM−modified gold chip was established using
ASW, following which the bacteria−free filtrate (EPS T0, T20, T60 and T120) was
introduced at a flow rate of 25 μl/min. Data were collected for 25 min, under continuous
flow after which a freshly prepared bacterial suspension, M. hydrocarbonoclasticus and
C. marina (EPS T0) in ASW (OD600=1), was introduced into the SPR flow cell at the
rate of 25 μl/min. The sensor chip was not rinsed with ASW between the two injections.
The flow of bacteria was carried out for a further 25 min after which the SPR flow cell
was flushed with ASW to remove any loosely bound or unbound bacteria. An example
of a SPR sensorgram, together with an illustration on how the response signals were
obtained, is provided in Figure 70.

Chapter 3 Page 111
Figure 70 SPR responses to C. marina (Cm), following pre−conditioning of the MHA SAM with cell−free, EPS−containing culture filtrate collected from bacteria aged in ASW for 20 min (SPR assay 2). The black arrow indicates the value shown in the histogram in Figure 71 as EPS T20. The pre−conditioned chip was then incubated, under flow, with fresh bacterial suspensions for 25 min and washed. The red arrow indicates the value shown in the histogram in Figure 71 as Cm (T0) T20 while the green arrow indicates the amount of bacteria removed during the ASW washing step.
The SPR responses obtained following subsequent EPS pre−conditioning (SPR Assay
2 – 1st Injection) and exposure to bacterial suspensions (SPR Assay 2 – 2nd Injection)
are summarised in Figures 71a (M. hydrocarbonoclasticus) and 71b (C. marina).

Chapter 3 Page 112
Figure 71 SPR responses to bacteria a) M. hydrocarbonoclasticus (Mh), b) C. marina (Cm) following pre−conditioning of a range of organosulfur SAMs with cell−free, EPS−containing culture filtrates. The gold−coated SPR chips derivatised with SAMs were pre−conditioned for 25 min with cell−free culture filtrates (EPS) collected from bacteria aged in ASW for 0 (T0), 20 (T20), 60 (T60) and 120 (T120) min (SPR Assay

Chapter 3 Page 113
2 – 1st SPR Injection). The SPR signal after 25 min is shown on the histogram as EPS T0, T20, T60 and T120. The pre−conditioned chips were then incubated, under flow, with fresh bacterial suspensions for 25 min and washed (SPR Assay 2 – 2nd SPR Injection). The drop in the SPR response units due to the washing step is indicated by the black segment in the histogram. The amount of bacterial adhesion shown on the histogram as Mh (or Cm) T0 was determined by the difference between the signal at the injection of the bacteria and the signal after washing.
For each SAM, two set of response signals are obtained for T0, T20, T60 and T120.
The first set of responses named “EPS” in the graphs corresponds to the difference in
the SPR response units between the beginning and end of injection of EPS collected
from cells aged in ASW for 0 (T0), 20 (T20), 60 (T60) and 120 (T120) min (SPR Assay
2 – 1st Injection). Following pre−conditioning of the SAM with these EPS−containing
culture filtrate (EPS T0−T120), the second set of responses named either “Mh (T0)” or
“Cm (T0)” corresponds to the difference in the SPR response units between the
beginning of injection of freshly prepared bacterial suspension, M.
hydrocarbonoclasticus and C. marina (T0), and the end of the wash with ASW (SPR
Assay 2−2nd Injection). The drop in the SPR response units due to the washing step is
indicated by the black segment in the histograms of the second set of responses
named either “Mh (T0)” or “Cm (T0)” (Figure 71).
Considering first the response signals to the pre−conditioning EPS treatments (“EPS”
in Figures 71a and b), longer periods of ageing of the bacterial suspension from which
the EPS was derived, progressively increased the signal, presumably due to higher
concentration of EPS. For instance, while EPS binding was almost negligible for all the
SAMs studied at EPS T0, SPR responses as high as 2000 response units were
obtained if EPS was collected from bacteria aged for 120 min (EPS 120) in ASW (e.g.
AUT SAM). It is noteworthy that for EPS collected at T0 and T20, the comparative

Chapter 3 Page 114
resistance of the different surfaces to EPS adsorption did not correlate with their
comparative resistance to adhesion of bacterial cells. However, for longer ageing times
(EPS T60−EPS T120) the trend of EPS adsorption was similar to that observed for
bacterial cell adhesion. In other words, for EPS collected at T60 and EPS T120, charge
seems to play a dominant role rather than surface hydrophilicity.
Considering now the response of bacteria to the pre−conditioned surfaces (“Mh (T0)”
or “Cm (T0)” in Figures 71a and b), the extent of pre−conditioning influenced the
subsequent extent of bacterial adhesion. It is important to note that rinsing did not
cause any significant drop in the SPR response units, indicating that the bacteria are
retained on the SAM−modified surfaces with EPS and not washed off by rinsing.
In general, the results showed a promoting effect on bacterial adhesion between
pre−conditioning the surfaces with EPS collected from cells aged in ASW for T0 and
T60 min. For instance, the charged surfaces, in particular MHA and AUT, had shown
an increase of C. marina adhesion when pre−conditioned with EPS obtained from
bacteria aged in ASW for T0−T60 min. M. hydrocarbonoclasticus showed a similar
trend with the exception for EG7−COOH. The difference in trend observed for
EG7−COOH might be due to the presence of an oligo(ethylene glycol) backbone,
which could affect the packing of the SAM, and thus its adhesion properties. The
responses obtained, by exposure of the fresh bacteria suspension to pre−conditioned
MHA and AUT SAMs, showed a clear increase in the amount of bacteria adhered to
the surfaces, with over 1000 response units for M. hydrocarbonoclasticus on the AUT
SAM. For both bacteria, the increase in adhesion is less pronounced at T60 compared
to T20 on the charged surfaces. Overall the responses obtained from C. marina

Chapter 3 Page 115
adhesion on the six SAMs were lower compared to M. hydrocarbonoclasticus,
indicating that EPS effect is dependent on the type of bacteria.
When compared with charged SAMs, bacterial adhesion was not substantially
affected on all neutral SAMs (HDT, EG6−OH and MUT) pre−conditioned with bacterial
supernatants (EPS) obtained from bacterial suspension aged in ASW for T0−T60 min.
Despite a substantial increase of the amount of EPS attached to these neutral surfaces
for longer ageing times (EPS T20−T60), the quantity of bacteria detected by SPR did
not change drastically for both bacteria. For these neutral surfaces, a small promoting
effect on bacterial adhesion was observed between pre−conditioning the surfaces with
EPS collected from cells aged in ASW for T20 and T60 min. In particular, comparing
the amount of M. hydrocarbonoclasticus and C. marina (Figures 71a and b) attached
to the neutral surfaces, a maximum difference of 500 response units was observed for
HDT and EG6−OH SAMs. Also, the adhesion preferences of M. hydrocarbonoclasticus
and C. marina noted in the previous experiments (Figures 63a and b) were
maintained. These results suggest that for the levels of conditioning achieved with EPS
collected from cells aged in ASW for T0, T20 and T60 min, the physicochemical
characteristics of the surfaces played a significant role in determining bacterial cell
adhesion.
Pre−conditioning with EPS from bacteria aged for T120 min, and therefore containing
higher levels of EPS, substantially reduced the subsequent adhesion of bacteria and
the trends in surface preference were less distinct. Since the difference in SPR signal
before and after the ASW rinse was minimal for all the surfaces, the reduced bacterial
adhesion may be due to phenotypic changes that occur in the cells when left in a
minimal medium (ASW) for T120 min including changes in EPS composition and

Chapter 3 Page 116
properties. For instance, the EPS could become toxic or less reach of the substances
that promote bacterial adhesion after 120 minutes of incubation. Furthermore,
prolonged period of starvation affect the motility and the chemotactic responsiveness
of the bacteria. In order to establish whether the SPR responses accurately reflected
cells adhesion, the pre−conditioned AUT SAMs challenged with M.
hydrocarbonoclasticus and C. marina were visualised under epifluorescence
microscopy and cell counting was performed. The density of bacteria for both M.
hydrocarbonoclasticus and C. marina was in agreement with the trends obtained from
the SPR sensorgrams (Figure 72b).
Figure 72 a) Fluorescence images of gold−coated SPR chips derivatised with AUT SAMs after SPR−assay 2 with M. hydrocarbonoclasticus (Mh) were performed as described in Figure 74. b) The corresponding number of cells of M. hydrocarbonoclasticus (Mh) and C. marina (Cm) adhered per mm2.

Chapter 3 Page 117
3.6 Conclusions
Here, SPR has been employed as a reliable and rapid tool to evaluate initial stages of
bacterial adhesion. The specific contributions of charge and wettability to bacterial
adhesion were elucidated by employing SAMs with different characteristics. These
studies have shown that electrostatic interactions play an important role in the initial
bacterial adhesion process of both bacteria studied. In comparison with a standard
adhesion assay, the SPR assay has the advantage of monitoring the adhesion of
bacteria and other analytes on surfaces in real−time, giving insights into the kinetics of
adhesion. Since marine bacteria were used in our assays, we also showed that SPR
is a suitable technique to work with complex media such as ASW which contains a
number of different electrolytes at a pH of 8.1−8.2. Furthermore, we were able to
demonstrate that SPR is able to discriminate between signals derived from different
analytes such as EPS and whole cells such as bacteria, allowing us to describe in
some details the effect of EPS on bacterial adhesion in a single assay. These single
assays demonstrated that in circumstances where the level of conditioning of surfaces
by EPS is likely to be small, it facilitates the initial adhesion of bacteria. However, the
enhancement in bacterial adhesion is more pronounced in charged than in neutral
SAMs, suggesting that, for such levels of EPS conditioning, the physicochemical
characteristics of the surfaces strongly influence bacterial adhesion (Figure 73).

Chapter 3 Page 118
Figure 73 Schematic showing that higher amounts of EPS are adsorbed on the SAMs exposed to EPS derived from longer periods of ageing of the bacterial suspension, presumably due to higher amounts of EPS secreted with time. This behaviour is independent of SAM type (i.e. with differences in charge, wettability and packing). Following EPS pre−conditioning, the enhancement in bacterial adhesion is more pronounced in charged than in neutral SAMs. However, for both bacterial species a threshold effect was observed in that bacterial adhesion was inhibited substantially by pre−conditioning the SAM surfaces with EPS from bacteria aged for T120 min possibly due to changes in the EPS properties for longer periods of cell ageing.
On the other hand, greater levels of conditioning by EPS diminished the influence of
the original surface properties. For both bacterial species studied, with the present
experimental approach, the time at which the bacterial adhesion starts to become
independent of the underlying surface properties is approximately 2 hours of EPS
secretion.

Chapter 4 Page 119
4.0 CHAPTER 4
Fabrication and Characterisation of Two−Component Switchable
SAMs
Abstract: Controlling surface properties by the mean of finely engineered surfaces is
crucial for the fabrication of “smart” SAMs. Surfaces that are optimally spaced and
well defined, with respect to their molecular components can enable, for instance,
efficient molecule binding with a specific target. Furthermore, the progress achieved
in the past decade in the use of switchable surfaces, and in particular of those
capable to undergo conformational switching, has boosted the need of controlling the
molecular distribution on the surface. Here a simple and reliable method for obtaining
a well-spaced two−component switchable SAMs is presented. Control over the
spacing is achieved through the use of labile dendron spacers that can be
subsequently detached, leaving an optimal spacing between the negatively charged
end groups of 11−mercaptoudecanoic acid (MUA). This space enables the MUA
molecules to undergo conformational switching when positive and negative electrical
potentials are applied to the gold surface.
4.1 Background
The ability of SAMs to generate tailored well−spaced functional surfaces has
offered new insights in the study of several biological interactions.156, 297-298 In fact, an
optimal surface density is of crucial importance for avoiding steric hindrance between

Chapter 4 Page 120
neighbouring probe molecules,299-300 and making them available for performing
interactions. The simplest approach to ensure the correct surface spacing and
therefore molecular recognition consists in the use of mixed monolayers. Mixed SAMs
allow the tailoring of selected chemical functional groups on the surface, controlling the
surface physico−chemical properties such as wettability, friction and adhesion and
eventually controlling the density of biomolecules in biochips, biosensors and medical
electronic devices.301-306
The preparation of mixed SAMs is based on immersing the substrate in a solution of
two or more molecular compounds with different end group functionalities. Despite its
easiness, this process has several limitations. In theory, the surfactant ratio in solution
should allow the surfactants to bind to the surface in a specific distribution. However,
it has been found that ratio of the two compounds in the monolayer is rarely identical
to their ratio in the solution.307 This deviation occurs because of a preferential
adsorption of one of the surfactants compared to the others. This preferential
adsorption can lead both to a scarce control over the density but also over the non-
homogeneous distribution of the functional groups on the surface.307 A further
disadvantage of the fabrication of mixed SAMs concern phase separation which occurs
spontaneously within a mixed solution of surfactants.308 Studies have demonstrated
that surfactants, can phase separate into discrete molecular domains on the
nanometer scale.308 As a result of the formation of these molecular domains, the
desired distribution of surfactants cannot be achieved and therefore the mixed
monolayer will not be ideally ordered or have the desired density.
In the effort of overcoming these limitations, several research groups have explored
new and clever methods to achieve and control the correct arrangement at molecular

Chapter 4 Page 121
scale, leading to the fabrication of a new class of surface materials with designed and
tailored physical and chemical properties. Below, some of the most relevant examples
of these methods are described.
Spacing between active molecules has been crucial in the fabrication of switchable
surfaces. In 2007, LD−SAMs have been integrated in microfluidic chips in the attempt
to reversibly control the adhesion of two proteins, avidin and streptavidin (Figure
74).169 The surface density was controlled by the formation of a “host−guest”
interaction between the charged end group of the surfactants and a ß−cyclodextrine
(ß−CD). The surfactants involved were negatively charged carboxylate and positively
charged ammonium terminated alkanethiol compounds (Figure 74b−c). By firstly
chemisorbing the organosulfur−ß−CD molecules on the surface and successively by
removing the ß−CD from the SAM through washing with absolute ethanol, a
well−spaced LD−SAMs was obtained (Figure 74b-c).
The switching performance of the LD−SAMS was proven by in turn applying a negative
and positive potential. At a negative potential, the carboxylate end groups are exposed
resulting in capturing the positively charged avidin (Figure 74b). Upon the application
of a positive potential, the carboxylate terminal groups are attracted towards the
surface, resulting in avidin being released from the surface (Figure 74b). In contrast,
positively charged ammonium groups are repelled and exposed from the surface when
positive potentials are applied onto the surface, resulting in the adhesion of the
negatively charged streptavidin (Figure 74c). When the applied potential switches
from positive to negative, the ammonium groups are attracted towards the surface,
resulting in streptavidin being released from the surface (Figure 74c).169

Chapter 4 Page 122
Figure 74 Illustration of a) LD−SAMs on microfluidic chips to control the adhesion and release of avidin and streptavidin upon the application of electrical potentials. b) The application of a negative potential on the surface causes the carboxylate groups to electrostatically repel from the surface, leading to the capture of the positively charged avidin. The switching of the potential from negative to positive on the surface attracted the carboxylate groups towards the surface, causing the release of avidin from the surface. c) The application of a positive potential on surface causes the ammonium groups to electrostatically repel from the surface, leading to the capture of the negatively charged streptavidin. The switching of the potential from positive to negative induces the attraction of the ammonium groups towards the surface, resulting in the release of the negatively charged streptavidin.
In 2004, Park and co−workers have reported a strategy based on using dendrons to
control the surface density in order to optimise the specific binding of oligonucleotides
and proteins.299, 309 In these studies, a conical−shaped dendron was attached to each
probe molecule (i.e. biotin), and the dendron was subsequently adsorbed to the

Chapter 4 Page 123
surface of interest, with the dendron providing the spacing between the probe
molecules (Figure 75).
Figure 75 a) Molecular structure of the dendron used in this study and b) A schematic representation of the biotinylated dendron monolayer.
When modified with biotin, the dendron−probe surface showed good binding efficiency
towards streptavidin. This procedure has been later (2009) improved by Tokuhisa et
al.82 who used an “inverse” approach by employing covalent interactions between
dendrons and the organosulfur end group. In Tokuisha’s approach, the dendron is
hydrolysed after SAM formation.

Chapter 4 Page 124
Recently, dendrons have been used to control surface density by interacting with the
end group through noncovalent interactions.310 In this work, performed in our research
group, a host−guest inclusion complex is formed between a poly(aryl ether)
dendron−containing dibenzo[24]crown−8 (DB24C8) and a dibenzylammonium (DBA)
thread with a fluorine functional end group and a thiol surface−active head group for
strong anchoring onto the gold surface upon SAM formation (Figure 81). The
dendron−DB24C8 is released after SAM formation simply by switching off the
noncovalent interactions with DBA upon raising the pH. Removal of the noncovalently
bound dendron−DB24C8 spacing groups will expose functional groups on the surface
(Figure 76). 305
Figure 76 Schematic representation of the strategy for controlling the density and spatial distribution of functional groups on surfaces. The strategy involves three main steps: (1) self−assembly of pH−switchable supramolecular systems comprising a polyaryl dendron−containing dibenzo[24]crown−8 (DB24C8) and a dibenzylammonium (DBA) thread with a fluorine end functional group and a thiol surface−active head group; (2) SAM formation of the pH−switchable supramolecular systems on gold surfaces; (3) Simultaneous decomplexation of the DB24C8−functionalised dendrons from the SAM on addition of a base and self−assembly of a second component (i.e. ClPrSH) on the vacant space previously occupied by the dendrons. G1 and G2 indicate a first and second generation dendron respectively.

Chapter 4 Page 125
In this chapter, a strategy is described that can control the space around individual
probe molecules of 11−mercaptoundecanoic acid (MUA) using fluorine dendron
(F−dendron) spacers (Figure 77).
Figure 77 Scheme of the fabrication of a homogeneous two−component dynamic SAM.
First, a fluorine dendron, (F−dendron), is focally substituted with an anchor molecule,
MUA (Figure 77a) through a bond that is labile to external stimuli (in this case, alkali
solution), (Figure 77b). The anchor molecule is bifunctional in that it contains one
carboxylate functionality, and a second functionality that serves to chemically adsorb
the molecule to a substrate (thiol group). Second, a self−assembled monolayer of the
MUA−F−dendron is formed (Figure 77c). The packing of the monolayer is dictated by
the steric of the F−dendron spacers, and chemisorption to the substrate is controlled
by the bifunctional anchor molecule. Third, the F−dendron spacers are removed by an
external trigger (i.e. pH changes) (Figure 77c). The dissociated F−dendron is removed
from the surface, leaving behind individual anchor molecules chemisorbed to the

Chapter 4 Page 126
substrate. Simultaneously, a second “inert” surfactant, mercaptoethanol (MET), is
chemisorbed to the surface in order to fill the empty spaces between molecules and
ensure the preservation of the correct distance between the MUA molecules (Figure
77d).
4.2 Aim
In the previous chapter, we have explored the adhesion of two marine bacteria to
one−component SAMs with different surface properties. We have also studied the
effect of the EPS on bacterial adhesion and how time and EPS concentration can
influence the response of bacteria adhesion to the different one−component SAMs.
With the aim to achieve even more detailed information on the bacterial
adhesion process, here a well−spaced two−component switchable SAMs that is able
to undergo conformational switching under application of an electrical potential was
fabricated. In fact, from the previous work, we were able to learn that the hydrophobic
marine bacteria M. hydrocarbonoclasticus and C. marina exhibited the lowest adhesion
on the hydrophobic surfaces. On the other hand, these bacteria were found to readily
and firmly attach to both positively and negatively charged surfaces (e.g. –COO−).
Based on this previous study, we have devised and fabricated a switchable surface
that could expose, under potential control, either negatively charged (straight chains
with carboxylate anions exposed at the surface) or hydrophobic moieties (bent chains
with greasy alkyl chains exposed at the surface) to promote or inhibit bacterial
adhesion, respectively (Figure 78).

Chapter 4 Page 127
Figure 78 Schematic representation of an electrically switchable two−component SAM (MUA−MET SAMs) that is able to reversibly and rapidly switch its molecular conformation in response to an applied potential.
4.3 Objectives
The main objective of this chapter was to create a well−spaced two−component
switchable SAM. In this system, MUA molecules were separated from each other using
a second shorter neutral surfactant, mercaptoethanol (MET), in order to form a
homogeneous two−component dynamic SAM.82
Two main steps were performed for the fabrication of the MUA−MET SAM:
a) In first instance, the synthesis of MUA−F−dendron surfactant was accomplished. A
scheme of the synthesis strategy is shown in Chapter 7.
b) MUA F dendron was then used to fabricate the F−dendron SAM (Figure 79). The
F−dendron was successively removed by alkaline hydrolysis (potassium hydroxide,
KOH, 1M in EtOH/H2O) allowing the simultaneous insertion of a shorter backfiller,
MET, (Figure 79).

Chapter 4 Page 128
Figure 79 Schematic representation of the fabrication of the two−component switchable SAMs: F−dendron SAMs loose the F−dendron end−group upon alkaline hydrolysis while the space between the MUA moieties is simultaneously backfilled with MET.
4.4 Results and discussion
4.4.1 Surfactant Synthesis
4.4.1.1 Synthesis of dialkyl disulphide 3
The dialkyl disulphide 3 was synthesised via two steps synthetic route (Figure 80).

Chapter 4 Page 129
Figure 80 Overall synthesis of disulphide 3.
Each reaction step is discussed below.
Step 1
The synthesis of 2 was initiated with the oxidation of the sulfhydryl (−SH) groups of
MUA due to the interaction with iodine (I2), as shown in Figure 81. This reaction is
thought to proceed via sulfenic acid (RSOH) intermediates releasing the desired
disulphide and hydroiodic acid (HI).
Figure 81 General mechanism of oxidation of a sulfhydryl group with the production of sulfenic acid intermediates.
The release of HI, the excess of Ethanol (EtOH) and the elevate temperature (80°C,
reflux) afforded the ethyl ester protection of the carboxylic acid MUA end group (Figure
82).

Chapter 4 Page 130
Figure 82 Scheme showing the synthesis of disulphide MUA ethyl ester 2.
Step 2
Hydrolysis of the ethyl ester group was carried out via the addition of potassium
hydroxide (KOH) in a solution of tetrahydrofuran (THF), EtOH and water (H2O),
followed by treatment with a concentrated acidic solution to give 3 (Figure 83).
Figure 83 Scheme showing the synthesis of MUA disulphide 3.
4.4.1.2 Synthesis of fluorine dendron 6
Ether formation between 3,5−dihydroxybenzyl alcohol (4) and
4−(trifluoromethyl)benzyl bromide (5) was achieved via Williamson synthesis. This
reaction involves treatment of an alcohol with a strong base to form the alkoxide anion,
followed by addition of an appropriate aliphatic compound bearing a suitable leaving
group (R−X). Suitable leaving groups (X) include iodide, bromide, or sulphonates. It is
important to note that this method does not work if R is aromatic like in bromobenzene

Chapter 4 Page 131
(Br−C6H5). However, if the leaving group is separated by at least one carbon from the
benzene, the reaction can proceed (as for benzyl bromide, Br−CH2−C6H5, 5).
Firstly, the carbonate base (potassium carbonate, K2CO3) deprotonates both hydroxyl
groups of compound 4, forming 4’. This acts as a nucleophile and attacks the carbon
adjacent to the X group (i.e., the CH2 next to the bromide in 5) to form the ether 6,
Figure 84.
Figure 84 Scheme showing the synthesis of fluorine dendron 6.
Phase transfer catalysts like 18−crown−6−ether, can be used to improve the reaction
yield and the solubility of the alkoxide by offering a softer counter−ion.311
Figure 85 shows the crown ether used in this work (18−crown−6−ether).
Figure 85 Chemical structure of 18−crown−6−ether.

Chapter 4 Page 132
The crown ether central cavity is electronegative and attracts cations. Furthermore,
complexes between crown ethers and ionic salts (Figure 86) are soluble in nonpolar
organic solvents. When inorganic salts dissolve in organic solvents the anion is left
undissociated, enhancing the reactivity.
Figure 86 K2CO3 solvated by 18−crown−6−ether.
4.4.1.3 Synthesis of fluorine dendron dialkyl disulphide 7
The F−dendron dialkyl disulphide 7 was synthesised via a Steglich esterification
(Figure 87).
Figure 87 Scheme showing the synthesis of F−dendron dialkyl disulphide 7.
The general reaction mechanism is discussed in detail below (Figure 93−94).312-313

Chapter 4 Page 133
DCC (dicyclohexylcarbodiimide) and carboxylic acid form an O−acylisourea
intermediate, (Figure 88).
Figure 88 General scheme of O−acylisourea formation.
The reaction proceed with the addition of the alcohol to the activated carboxylic acid
to form the stable dicyclohexylurea (DHU) and the desired ester (Figure 89):
Figure 89 General scheme of ester bond formation.
The addition of approximately 5 mol% of 4−N,N−dimethylaminopyridine (DMAP),
(Figure 90), is crucial for the efficient formation of esters. In fact strong bases and
nucleophiles such such as amines can react readily with the O-acylisourea avoiding
the formation of side products such as N-acylurea.

Chapter 4 Page 134
A common explanation for this reaction rate acceleration is that DMAP, as a stronger
nucleophile than the alcohol, reacts with the O−acylisourea leading to a reactive amide
("active ester"). This intermediate cannot form intramolecular side products but reacts
rapidly with alcohols. In this way, DMAP acts as an acyl transfer reagent, and
subsequent reaction with the alcohol gives the ester (Figure 91). This process is
known as nucleophilic catalysis.
Figure 91 General scheme of the DMAP catalytic mechanism.
4.4.2 SAM formation
The SAM fabrication procedure is described in detail in Chapter 7.
Figure 90 Chemical structure of 4−N,N−dimethylaminopyridine.

Chapter 4 Page 135
4.4.2.1 Fluorine dendron dialkyl disulphide SAM characterisation
After SAMs formation, carried out in 1 mM dichloromethane (DCM) solution of the
F−dendron dialkyl disulphide for 48 h at room temperature, the surface was treated
with KOH ethanolic solution (pH=9) and the hydrolysis of the F−dendron end group
was monitored by the means of contact angle, ellipsometry and XPS (Table 2).
Table 2 Characterisation of the F−dendron SAM before and after hydrolysis: thickness measurement (nm); advancing and receding contact angle (°) and XPS element atomic ratio (X/S).
The drop in the contact angle values after the alkaline hydrolysis as well as the reduced
thickness observed by ellipsometry (reduced by ~ 50%) provided evidence for the
removal of the hydrophobic F−dendron end group.
The desired well−spaced MUA/MET SAM was confirmed by analysis of the XPS data.
By integrating and comparing the area of the F (1s) and S (2p) peaks for the F−dendron
SAM before hydrolysis, (F−dendron SAM contains 6 F and 1 S) we were able to confirm
the chemisorption of the pure F−dendron dialkyl disulphide (compound 7) onto the gold
substrate. By repeating the XPS analysis, after KOH hydrolysis and backfilling with
MET, we were able to assess the F−dendron removal. In fact, No F (1s) peak was

Chapter 4 Page 136
detected after exposure to the ethanolic KOH solution while three peaks were
observed for C (1s) each of which indicates a different bond of the C atom. In particular,
the peak at 284 eV indicate the CH2−CH2 belonging to the alkyl chain of MUA and
MET; the shoulder at 285.5 eV represent the CH2−OH belonging to MET while the
peak at 287 eV indicate the CH2−COOH belonging to MUA. By integrating the S (2p)
peak and the C (1s) peak engaged in the carbonyl bond, a ratio of 1 MUA: 3 MET was
found (Figure 92).
Figure 92 a) XPS spectra of the F (1s) region before the KOH hydrolysis: The F (1s) peak was detected at 688.7. b) XPS spectra of the F (1s) and the C (1s) regions after KOH hydrolysis and backfilling with MET.
The successfully completion of the hydrolysis process was also confirmed by SFG
spectroscopy (Figure 93). Two wavelength regions have been analysed: the C−H
Binding Energy (eV)
690 688 686
F1speak
MUAMET
No F1speak
Arb
itra
ry U
nits
Binding Energy (eV)
690 685 680 288 286 282284
C1speaks
Beforehydrolysis
Afterhydrolysis
Ratio surfactant 1/3 found 1:3Ratio S/F found 1:6
Arb
itra
ry U
nits
C=O
a b
Ratio S/C=O found 4:1

Chapter 4 Page 137
region at around 2900 cm−1 and the C−F region at around 1300 cm−1. In particular,
before hydrolysis, was possible to observe the C−H stretching band at 2950 cm−1 with
three distinctive peaks and the C−F stretching which appear as a shoulder on the right
side of the Gaussian curve (at ~1350 cm−1). After hydrolysis the peaks present on the
C−H region increased in intensity highlighting the change in orientation of the
molecules in the monolayer caused by the loss of the F−dendron moieties and the
introduction of the second surfactant. Analysis of the C−F region after hydrolysis
showed that the C−F stretching is no more visible (disappearance of the shoulder).
These evidences further confirm the successful completeness of the hydrolysis
process and the F−dendrons loss.
Figure 93 SFG spectra of F−dendron SAM (before hydrolysis) and MUA−MET SAM (after hydrolysis) detected for the CH region and C−F regions.

Chapter 4 Page 138
4.5 Conclusion
A strategy to develop a two−component dynamic SAM has been described. A
well−spaced MUA−MET SAM has been fabricated and fully characterised by using
different optical and spectroscopic techniques. Hydrolysis of the terminal F−dendron
moiety in the F−dendron SAM as well as the backfilling with MET was proven by SFG
and XPS. In particular, XPS studies revealed a ratio of 1 MUA to 3 MET. This ratio will
prevent steric hindrance between MUA molecules and will allow the switching to occur.

Chapter 5 Page 139
5.0 CHAPTER 5
Probing Electrochemical Switching by Sum−Frequency Generation
This chapter is based on the paper “Direct Observation of Reversible Biomolecule
Switching Controlled by Electrical Stimulus”, Alice Pranzetti, Matthew Davis, Chun L.
Yeung, Jon A. Preece, Patrick Koelsch, Paula M. Mendes, Adv Mater Interfaces,
DOI:10.1002/admi.201400026.
Abstract: Control and reversibility of biomolecular interactions at engineered
interfaces presents opportunities to develop highly efficient substrates and
devices for a wide range of biomedical applications. A major challenge
nowadays in the field of stimuli−responsive interfaces is to acquire a molecular
understanding of the changes occurring at the biointerface upon external
stimulation. Herein, we used in situ sum−frequency generation (SFG)
spectroscopy to study changes in molecular orientations in charged
biofunctionalised self−assembled monolayers (SAMs), in response to an
applied electrical potential. The bioactivity of a mixed SAM on gold consisting
of a biotin−terminated positively charged oligopeptide (biotin−KKKKC) and a
tri(ethylene glycol)−terminated thiol is shown to be related to a switch between
upward exposure and random orientation of the biotin group in response to
positive and negative applied potentials, respectively. The findings reported
here support the mechanism by which charged biomolecules control

Chapter 5 Page 140
biomolecular interactions, e.g. protein binding affinities, and lay the foundation
for future studies aiming to explore molecular conformational changes in
response to electrical stimuli.
5.1 Background
Electrically switchable SAMs have been demonstrated to modulate the interactions of
surfaces with proteins,149, 314 DNA,164, 315 mammalian145 and bacterial305 cells. Despite
the fact that these “smart” platforms have been successfully used for the wide range
of scopes mentioned above, relatively few data are available concerning the molecular
orientation changes occurring during the switching. This difficulty in collecting data is
due in part to the lack of appropriate and available characterisation techniques. For
this reason, the conformational alterations which follow an electrochemical stimulus
have been generally only discussed a posteriori as a hypothesis to explain the
macroscopic surface properties changes (e.g. wettability) or the difference in binding
affinity for a specific targets. As a result, the mechanistic principles underpinning these
electrically−driven systems are neither fully experimentally proven nor theoretically
understood and without such proven mechanistic details, designing novel biologically
relevant surfaces, and understanding the potential and limitations of present ones is
haphazard at best.
In the past decade, SFG spectroscopy has been widely used for studying SAM
interfaces mainly for understanding the influence of polar and non−polar solvents on
the molecular assembly process.316-318 More recently, this technique has been used for

Chapter 5 Page 141
studying the specific biomolecular interactions (e.g. biotin−streptavidin interaction)
occurring at the interface319 and investigating the switching behaviour of SAMs.320 For
instance, SFG has been employed to monitor the behaviours of cis−trans
photoswitchable surfaces, such as azobenzene−functionalised SAMs,321 as well as the
reversible photoinduced spiro→merocyanine isomerisation of SAMs.322
While photoswitching has been extensively monitored by SFG, the investigation of the
electrochemical switching leading to molecular conformational changes has been less
intensively studied. Since the first attempt of Lahann et al.51 who elucidated the
conformational switching of a low density carboxylic acid−terminated SAM under
electrochemical stimulation, there have been no similar reports describing the
reversible reorientation of molecules at the SAM surface upon application of an
electrical potential.
In Lahann et al.51 work, a surface similar to the one described in this thesis (Chapter
4) was fabricated and exposed to positive and negative potentials. The carboxylate
negatively charged end group was attracted towards the gold surface at positive
potential while it was repelled at negative potential. As a result of this conformational
alteration, the wettability of the surface changed from hydrophilic, (at negative
potential), to hydrophobic, (at positive potential). SFG was used to monitor in real−time
this phenomenon by investigating the changes occurring in the CH region (2800−3000
cm−1) of the IR spectra (Figure 94). In particular, the peaks at 2855 and 2925 cm−1
corresponding to the methylene (−CH2) stretching of MHA chain were monitored. When
the SFG spectra was recorded at OC or negative potential, the SFG spectra were
featureless in the range between 2820 and 2940 cm−1, signifying straight molecular
conformations and all−trans orientation. Slightly positive polarisation of the gold

Chapter 5 Page 142
surfaces (+ 0.25 mV), however, initiated simultaneous switching of the molecules
indicated by characteristic methylene modes at wavelengths of 2855 and 2925 cm−1.
The presence of gauche conformations in the molecules implies that the molecules
bend their negatively charged end groups toward the positively charged gold surface
Figure 94 a) Schematic representation of the transition between straight, (hydrophilic), and bent, (hydrophobic), molecular conformations of LD−SAMs in response to an applied potential. b) Relative SFG intensities (peak areas) of the methylene modes at wavelengths of 2855 cm−1 (solid symbols) and 2925 cm−1 (open symbols) are shown for the LD−MHA SAMs measured when a potential of + 0.25 V was repeatedly applied to the system (on).
5.2 Aim
The findings presented in this chapter unravel the mechanism by which charged
biomolecules control biomolecular interactions, e.g. protein binding affinities, and lay
the foundation for future studies aiming to explore conformational changes in response
to electrical stimuli. In particular, this work address for the first time the use of in situ
SFG spectroscopy to investigate changes in molecular orientations in charged
biofunctionalised SAMs, in response to an applied electrical potential.
Taking inspiration by Lahann work we wanted to make further improvements in the
elucidation of the conformational changes occurring at an electrical switchable surface.
However, attempts to demonstrate the change in structure orientation in the switchable

Chapter 5 Page 143
SAM fabricated in Chapter 4 gave us similar information compared to those reported
in Lahann work. Furthermore, the interpretation of the CH region was difficult and did
not provide clear information about the real molecular conformation alteration (i.e.
stretching and/or bending) and the chemical groups involved in this alteration.
We therefore decided to study the conformational changes of a well characterised
electrically switchable two−component SAM previously fabricated in our research
group and described in Chapter 1 of this thesis. The switching of positively charged
custom synthesised oligopeptide, biotin−Lys−Lys−Lys−Lys−Cys, (biotin−KKKKC)
separated a shorter tri(ethylene glycol)−terminated thiol (TEGT), (Figure 95), was
formerly demonstrated by e−SPR in our group. 149 In this chapter, we aim to study the
changes occurring in the SFG spectra of the biotin moiety which could give us the
opportunity to investigate the orientation of the end group during switching without
incurring in the problems of CH region interpretation.
Figure 95 Schematic representation of the biotin−KKKKC:TEGT SAM and chemical structure of the biotin−KKKKC oligopeptide and TEGT.

Chapter 5 Page 144
Furthermore, we aimed to improve the SFG−electrochemistry experimental set up by
assembling a purpose built electrochemical cell which eases the acquisition of SFG
spectra in real−time therefore improving the reliability of the measurements.
5.3 Objectives
This chapter is arranged in three main objectives.
1) Biotin−KKKKC:TEGT mixed SAM (Figure 96a) and biotin−KKKKC (Figure 96b)
were fabricated and characterised by the means of ellipsometry, contact angle
FT−IRRAS and SFG.
Figure 96 a) Schematic representations of the biotin−KKKKC:TEGT SAM, and b) biotin−KKKKC SAM.
2) Biotin−KKKKC:TEGT SAMs were exposed to negative and positive potentials, and
the molecular conformational changes were observed in real−time using in situ SFG
spectroscopy together with a purpose built electrochemical cell. The conformational

Chapter 5 Page 145
changes of the biotin−KKKKC:TEGT SAMs observed by SFG at negative and positive
potential (Figure 97) were compared to the SFG spectra of densely packed
biotin−KKKKC SAMs acquired in the same conditions. The switching experiment along
with the control study was performed also by e−SPR.
Figure 97 Schematic representation of the conformational changes of the biotin−KKKKC:TEGT in response to: a) A negative electrical potential and b) A positive electrical potential
3) Finally, the reversibility of the conformational changes occurring for the
biotin−KKKKC:TEGT SAMs was verified by SFG (Figure 98).

Chapter 5 Page 146
Figure 98 Schematic representation of the biotin−KKKKC:TEGT switching reversibility.
5.4 SAM fabrication
The fabrication of the SAMs is described in detail in Chapter 7. The formation of pure
biotin−KKKKC, pure TEGT and mixed biotin−KKKKC:TEGT SAMs was studied by
means of contact angle and ellipsometry (Table 3) and FT−IRRAS. As expected, the
water advancing and receding contact angles for the pure TEGT SAM revealed a
hydrophilic monolayer. The pure biotin−KKKKC SAM formed a less hydrophilic
surface, with biotin−KKKKC:TEGT SAM exhibiting contact angles in between those
observed for pure monolayers of either components. These intermediates contact
angles values obtained supported the formation of the mixed SAM. Ellipsometry
analysis of the three surfaces showed the formation of monolayers after 12 h
immersion time with thickness values close to the theoretical measurements (obtained
from Chem 3D software). In particular, the thickness values observed for the
biotin−KKKKC:TEGT SAMs were closer to those found for the TEGT SAMs revealing

Chapter 5 Page 147
a higher concentration of TEGT compared to biotin−KKKKC on the surface.
Furthermore, the mixed biotin−KKKKC:TEGT SAM has been previously149
characterised by XPS and an average ratio on the surface of 1 (biotin−KKKKC) to 16
(TEGT) ± 4 was observed.
Table 3 Advancing and receding water contact angles as well as theoretical and experimental ellipsometric thicknesses for the different SAMs: biotin−KKKKC, biotin−KKKKC:TEGT and TEGT formed for 12 h. In the table a) indicates the molecular length obtained from Chem 3D software; b) indicates the SAM thickness obtained from experimental ellipsometry measurements.
FT−IRRAS analysis of the modified gold surfaces was also performed and the
characteristic peaks for each of the three SAMs are highlighted in Figure 99.
SAM Contact Angle (o) Thickness (nm)
Advancing Receding Theoreticala Experimentalb
biotin-KKKKC 40 ± 2 35 ± 3 5.1 2.23 ± 0.19
biotin-
KKKKC:TEGT
1:40 (open circuit
condition)
34 ± 3 32 ± 2 1.8 1.33 ± 0.13
TEGT 30 ± 2 27± 2 1.6 1.17 ± 0.11

Chapter 5 Page 148
Figure 99 FT−IRRAS spectra of biotin−KKKKC, biotin−KKKKC:TEGT and TEGT.
All the SAM surfaces presented peaks in the CH region between 2800−3000 cm−1. In
particular, three peaks for the biotin−KKKKC SAM and the biotin−KKKKC:TEGT SAM
and two peaks for the TEGT SAM were observed. In addition, the biotin−KKKKC SAM
displayed a band at ~1675 cm−1 which was readily assigned to the amide band of the
peptide groups.323-324 This strong band in the amide region (1600−1700 cm−1) was not
found in the biotin−KKKKC:TEGT SAM. The absence of the amide peak in this latter
surface is probably due to the scarce concentration of the biotin−KKKKC peptide
compared to the backfiller TEGT. Furthermore, it is important to notice that the bands
between 3200−3300 cm−1 presented in the biotin−KKKKC and biotin−KKKKC:TEGT
SAM are shifted compared to the broad hydroxyl band at ~3350 cm−1 displayed in the
TEGT SAM.325

Chapter 5 Page 149
5.5 Investigation of biotin−KKKKC and biotin−KKKKC:TEGT by SFG
SFG spectra of the biotin−KKKKC SAMs and biotin−KKKKC:TEGT SAMs were
acquired under in situ air conditions in order to monitor the spectral regions previously
assessed by FT−IRRAS. SFG signals of molecules on gold substrates can have two
contributions: 1) A nonresonant contribution emanating from electronic transitions
within the gold layer. 2) A resonant contribution that are originating from vibrational
transitions within molecules at the interface. In a SFG spectra, the slope of the
nonresonant gold signal is depending on changes in Fresnel coefficients with
frequency and can be, therefore, often found to be non−zero while typically,
narrowband resonant signals, appear as dips or peaks on the nonresonant signal.
Figure 100 is showing SFG spectra of SAMs of biotin−KKKKC and mixed
biotin−KKKKC:TEGT on gold wafers in air. A control study with a bare gold surface
was also performed and the absence of peaks was observed.
Figure 100 a) SFG spectra of biotin−KKKKC and biotin−KKKKC:TEGT SAMs at OC and in air conditions, b) SFG spectra of gold at OC and air conditions.

Chapter 5 Page 150
Both spectra showed resonant signals in the CH stretching frequency region between
2800 and 3000 cm−1. In particular, for the biotin−KKKKC SAM the spectrum showed
resonances for the CH2 symmetric stretch mode, (2858 cm−1), and for the CH2
asymmetric stretch modes at 2890 cm−1, while the two peaks at 2946 and 2975 cm−1
were assigned to the stretching vibrations of the single CH2 group pertaining to the
ureido bicycle of the biotin end−group.326 The presence of the additional small and
sharp band between 3200 cm−1 and 3250 cm−1 could be associated to a Fermi
resonance−enhanced overtone coming from the amide II entities327 as well as the NH3+
stretching of the oligolylisine backbone of biotin−KKKKC. However, available literature
have reported these stretching at higher frequencies (~3300 cm−1).328,329-330 The fact
that this contribution is appearing as a dip on the nonresonant signal is indicative of an
orientation of the transition dipole moment (TDM) away from the surface. Within the
mixed SAM, features in these spectral regions are less pronounced and of more
difficult interpretation. However, a small peak in the region between 3200 and 3250
cm−1 could still be observed. The differences between the SFG spectra of
biotin−KKKKC and biotin−KKKKC:TEGT could be mainly imputed to the lower surface
density for the latter surface and the higher rate of disorder of the molecules which can
arrange in a greater variety of conformations. As a result, the sum of TDM from this
more isotropic system is lower in comparison to an ordered system such as the
biotin−KKKKC SAM in air. Therefore, as the strength of SFG signals depends on both
density and order, the intensity is less pronounced in the case of the mixed SAM.
Furthermore, this SAM might not be uniformly mixed throughout the sample area and
domains of either biotin−KKKKC or TEGT may be present on the surface.

Chapter 5 Page 151
5.6 Electrochemical SFG
The switching properties of the mixed SAMs were investigated by applying an electrical
potential as an external stimulus. SAMs of biotin−KKKKC:TEGT were formed directly
onto a 15 nm gold coated side of a CaF prism (size 25 mm). The detailed description
of the SAM preparation on the CaF prism is given in Chapter 7. The prism was then
placed onto a purpose built Teflon electrochemical cell (Figure 101) containing PBS
buffer (pH=7.4).
Figure 101 Schematic representation of the spectro−electrochemical cell.
The electro−induced conformational changes of the biotin−KKKKC:TEGT SAMs were
monitored under in situ conditions by SFG spectroscopy. Applied potentials were
measured versus an Ag/AgCl reference electrode (FLEXREF, WPI, USA). Further
details on the picosecond SFG setup (EKSPLA, Lithuania) can be found in Chapter 7.
After immersion of the modified CaF2 prism into the purpose built electrochemical cell,
static potentials were applied to the gold surface. First, a potential of + 0.3 V was
applied to the biotin−KKKKC:TEGT SAM and the corresponding SFG spectra was
SAMs on Au
Reference electrode
Counter electrode
Visible beam
IR beamSFG beam
Working electrode
PBSRubber ring
CaF prism
Teflon support

Chapter 5 Page 152
recorded. Subsequently, a potential of − 0.4 V was applied to the same substrate while
the SFG setup was left unchanged. The corresponding spectra (normalised to the IR
and visible intensities of the incoming beams) are shown in Figure 102 for the region
between 3150 and 3350 cm−1. While changing the potential from positive to negative
values, SFG signals nearly overlap, except for spectral contributions between
3200−3250 cm−1. As NH vibrations of the peptide are occurring at frequencies centred
above 3280 cm−1 329 and CH vibrations are significantly lower (below 3000 cm−1), the
peak in the region of 3200−3250 cm−1 could be attributed to molecular vibrations within
the heterocyclic imidazole moiety of the biotin group.331
Figure 102 SFG spectra biotin−KKKKC:TEGT at + 0.3 V and – 0.4 V. Differences between the spectra are marked in green. The illustrations are interpretations of the corresponding molecular arrangement at positive and negative surface potentials.

Chapter 5 Page 153
Besides the narrow band visible in Figure 102, a rather steep incline in the overall
spectral shape was observable that is associated to non−resonant signals from
electronic transitions within the Au substrate, Fresnel coefficients that change with
frequency, and typically broad OH contributions from water.332 An analysis of the
relative phase in between the resonant and non−resonant signals can retain
information on the orientation of this particular group. A dip in the spectrum is related
to a mean orientation of the corresponding transition dipole moment (TDM) away from
the substrate (destructive interference), while a peak is indicating an orientation
towards the substrate (constructive interference). Applied to the spectra in this present
research, the biotin moiety contributing in this spectral region had its mean TDM
orientation pointing away from the substrate at positive potential resulting in a dip in
the spectrum. In this scenario, the positively charged peptide chain was prone to adopt
a conformation that would extend itself away from the substrate due to electrostatic
repulsion resulting in an anisotropic upright orientation of the biotin group. On the other
hand, at negative potential, the peptide chains were likely to adopt a collapsed folded
conformation due to electrostatic attraction between the negative potential of the
surface and the positive charges on the peptide backbone, which appears to have
resulted in a disordered biotin group since the SFG signal was no longer visible
(isotropic molecular ordering cannot generate SFG signals), Figure 102.
SFG control studies performed with the single component biotin−KKKKC SAM showed
that no switching occurs, presumably due to the high level of packing of the oligolysine
chains that are constrained in one conformation. In fact, The SFG experiment
described above was performed on the biotin−KKKKC SAM in order to prove that
switching was only possible due to the space between the peptide moieties provided

Chapter 5 Page 154
in the biotin−KKKKC:TEGT SAM. Figure 103a shows the overlapping of the
biotin−KKKKC SFG spectra recorded at positive and negative potential.
Figure 103 a) SFG spectra of biotin KKKKC at + 0.3 V and – 0.4 V. Differences between the spectra are marked in green. b) SPR sensorgram traces showing the binding of neutravidin (37 μg mL−1) to the biotin−KKKKC SAMs under an applied positive (+ 0.3 V) and negative (− 0.4 V) potential. After neutravidin binding for 30 min, the surfaces were washed with PBS for 20 min to remove any non−specifically adsorbed neutravidin.
Further evidence of this non−switching behaviour were provided by electrochemical
SPR (Figure 103b). Both the SFG spectra and the SPR results showed that there were
no significant changes in the film between positive and negative potential applied.
Isotropic arrangement largely remains for the biotin−KKKKC SAM due to steric
hindrance, therefore no detectable reorientations for the biotin occurs as opposed to
the biotin−KKKKC:TEGT film, in which the peptides have sufficiently space to
reconfigure towards a random orientation. In particular, the SFG spectra at positive

Chapter 5 Page 155
and negative potential are almost completely overlapping and the peak between 3200
and 3250 cm−1 is not present suggesting a higher disorder rate of the surfactant
molecules compared to the same surface analysed in air (Figure 100). Figure 103b
shows the RU found by electrochemical SPR analysis for biotin−KKKKC SAMs. The
difference between the sensorgrams obtained at the two potentials is less than 100
RU and the affinity of the biotin group for the neutravidin is still high in both cases,
indicating that the interaction biotin−neutravidin is independent from the alignment of
the biotin groups. Figure 104 shows the proposed model for the different molecular
conformations in OC (in air) and under electrochemical stimulation (in solution).

Chapter 5 Page 156
Figure 104 Model showing the different orientation of the biotin−KKKKC when a) Densely packed and aligned in air at OC and b) Misaligned in solution and under electrochemical stimulation. Model showing the different orientation of the biotin−KKKKC:TEGT when c) Aligned but weakly concentrated in air at OC and d) Aligned at positively potential and randomly oriented at negative potential in solution.
5.7 Reversibility of the switching proven by SFG
In situ SFG spectra of biomolecules at surfaces are rather complex and relatively weak
due to the isotropic nature coming with a less tightly packed arrangement of molecules.
As it was proven by XPS the mixed biotin−KKKKC:TEGT SAM used in this study has
an average ratio on the surface of 1:16 ± 4. It is remarkable that at such a small surface
coverage, SFG signals of biomolecules in solution still deliver a significant contribution
a b
c d

Chapter 5 Page 157
above the noise ratio. So, our experiments are highlighting the importance of following
changes in SFG spectra while changing external parameters such as surface
potentials. In this respect, the combination of electrochemistry and SFG, as applied in
this study, provides a powerful platform when it comes to in situ spectral analysis in
the context of biointerfaces.
The applied potential was switched back and forth to reproducibly cycle between the
two spectral states. The observed spectral features were found to be only slightly
above noise level, but the reproducibility strengthened the evidence and provided
statistical means to an otherwise only singular event. Cycling the external parameter
also allowed the investigation of the reversibility of molecular conformations. Figure
105a shows baseline corrected normalised SFG spectra that have been recorded at +
0.3 V, − 0.4 V, and back to + 0.3 V applied potential.

Chapter 5 Page 158
Figure 105 a) Normalised and baseline corrected SFG spectra of the biotin−KKKKC:TEGT SAM (grey lines) and their corresponding fits (purple lines) for + 0.3 V, – 0.4V, and returning to + 0.3 V. b) Sum of the fitted resonant SFG intensity (represented through amplitude divided by width) at switching surface potentials. c) SPR sensorgram traces showing the binding of neutravidin (37 μg mL−1) to the biotin−KKKKC:TEGT mixed SAMs at a solution ratio under an applied positive (+ 0.3 V) and negative (− 0.4 V) potential. After neutravidin binding for 30 min, the surfaces were washed with PBS for 20 min to remove any non−specifically adsorbed neutravidin.
The ability to turn on and off the upwards orientation with the applied potential allowed
us to monitor the molecular reorientation of the biotin group. The reappearance of biotin
peaks at positive potential showed that the biotin group can be reversibly switched
from being isotropically oriented at negative potential towards an anisotropic
orientation at positive potential.35 The corresponding fitted intensities for the spectra
shown in Figure 105a can be found in Figure 105b. Positive and negative potentials
are clearly separated demonstrating that the identification of 2 states (upright and
3150 3200 3250 3300 0.3 -0.4 0.3 0 1500 3000
0.0
0.5
1.0
1.5
2.0
2.5
3.0
3.5
4.0 (c)(b)
0.3 V
-0.4 V
No
rm
ali
ze
d S
FG
sig
na
ls /
a.u
.
I R Frequency / cm-1
0.3 V
(a)
Fit
ted
SF
G I
nte
nsi
ty /
a.u
.
Applied Potential / V
Reversible Switching SPR
+0.3 V
-0.4 V
Re
lati
ve
Re
spo
nse
Un
its
/ x
10
00
T ime / sec.
Neutravidin
PBS Wash
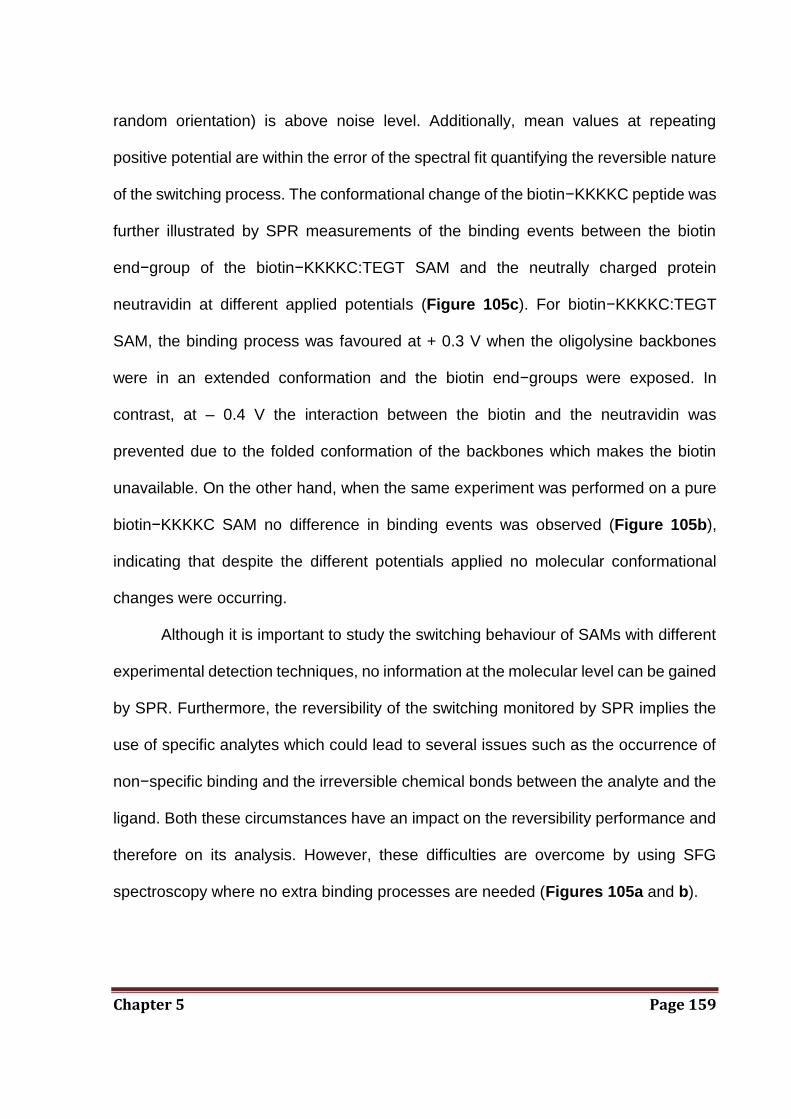
Chapter 5 Page 159
random orientation) is above noise level. Additionally, mean values at repeating
positive potential are within the error of the spectral fit quantifying the reversible nature
of the switching process. The conformational change of the biotin−KKKKC peptide was
further illustrated by SPR measurements of the binding events between the biotin
end−group of the biotin−KKKKC:TEGT SAM and the neutrally charged protein
neutravidin at different applied potentials (Figure 105c). For biotin−KKKKC:TEGT
SAM, the binding process was favoured at + 0.3 V when the oligolysine backbones
were in an extended conformation and the biotin end−groups were exposed. In
contrast, at – 0.4 V the interaction between the biotin and the neutravidin was
prevented due to the folded conformation of the backbones which makes the biotin
unavailable. On the other hand, when the same experiment was performed on a pure
biotin−KKKKC SAM no difference in binding events was observed (Figure 105b),
indicating that despite the different potentials applied no molecular conformational
changes were occurring.
Although it is important to study the switching behaviour of SAMs with different
experimental detection techniques, no information at the molecular level can be gained
by SPR. Furthermore, the reversibility of the switching monitored by SPR implies the
use of specific analytes which could lead to several issues such as the occurrence of
non−specific binding and the irreversible chemical bonds between the analyte and the
ligand. Both these circumstances have an impact on the reversibility performance and
therefore on its analysis. However, these difficulties are overcome by using SFG
spectroscopy where no extra binding processes are needed (Figures 105a and b).

Chapter 5 Page 160
5.8 Conclusion
We have demonstrated that SFG spectroscopy is a highly sensitive tool able to
provide an in depth characterisation of the reversibility of electrically switchable
biotin−KKKKC:TEGT SAMs. In particular, the orientation of the biotin end−group under
electro−induced switching was ascertained. The switchable process and its
reversibility were assessed by repeatedly switching between positive and negative
surface potentials. Single component biotin−KKKKC SAMs exhibited no
conformational changes upon the application of an electrical potential, indicating that
due to the high level of packing the oligolysine chains are constrained to one extended
conformation (anisotropic molecular ordering). On the contrary, when a negative
potential of – 0.4 V was applied to the mixed biotin−KKKKC:TEGT SAM, a change in
conformation occurred owing to the presence of the spacer, TEGT, presumably
allowing the folding of the oligolysine backbones (isotropic molecular ordering).
Furthermore, the reverse phase of the SFG signal in the region between 3200−3250
cm−1 at – 0.4 V suggest that the biotin end group is facing in the opposite direction
compared to the initial measurement (+ 0.3 V). Such information has the potential to
positively impact the field of biosensors as well as surface engineering where the direct
knowledge of the structure and the orientation of the molecules at interfaces are vitally
important.

Chapter 6 Page 161
6.0 CHAPTER 6
Monitoring Bacterial Adhesion on Electrically Switchable
Two−Component SAMs by Surface Plasmon Resonance
This chapter is based on the manuscript “An Electrically Reversible Switchable Surface
to Control and Study Early Bacterial Adhesion Dynamics in Real–Time”, Pranzetti, A.,
Mieszkin, S., Iqbal, P., Rawson, F. J., Callow, M. E., Callow, J. A., Koelsch, P., Preece,
J. A. and Mendes, P. M., Adv Mater, 2013, 25, 2181–2185.
Abstract: Advanced material engineering techniques, such as self–assembly can
structure surfaces that allow dynamic tuning of their properties (i.e. wettability). This
versatility has allowed the use of switchable SAMs for controlling a number of
different biological interactions. Here we present a system based upon the
conformational switching of negatively charged 11–mercaptoundecanoic acid
tethered to a gold surface in response to an applied electrical potential.
Electrochemical Surface Plasmon Resonance (e–SPR) has been used to monitor in
real–time the adhesion of two marine bacteria M. hydrocarbonoclasticus (Mh) and C.
marina (Cm) to the switchable SAMs. When combined with e–SPR, this dynamic
surface become powerful for monitoring and analysing the passage between
reversible and non–reversible bacterial adhesion, opening new opportunities to
advance our understanding of cell adhesion processes.

Chapter 6 Page 162
6.1 Background
Nature provides cleverly concerted mechanisms which are able to control specific and
non–specific interactions between cells and biological surfaces in a dynamic
environment.156, 333 The successful imitation of this ability is of crucial importance for
the understanding of cell adhesion to man–made surfaces,334-335 and will aid in making
significant impact in the future development and fabrication of new, functional
biomaterials,336 long–term antifouling surfaces337-338 and novel in vitro diagnostic
tools.171, 339 Researchers have previously fabricated surfaces, typically using SAMs,39,
340 in an attempt to control and understand cell adhesion, via the introduction of specific
terminal moieties to the SAM to elicit specific surface properties.341-343 However,
despite the advancements achieved by investigating the interface as a ‘static’
environment, the mechanism behind the cell adhesion process remain unclear344
representing one of the biggest challenges for many scientific areas ranging from
tissue engineering,345 medicine,346 cell biology,347 immunology348 and marine
biofouling.349 In particular, researchers have tended to use cells to classify surfaces
(i.e., bactericidal, repellent) while the ideal approach would be using the surface to
understand cell behaviour. Towards this aim, scientists have discovered the possibility
to control surface properties by switching their characteristics in response to particular
needs.156, 350 Surfaces presenting tuneable moieties have been widely used in the
study of specific protein–repellent/adhesion phenomena.149, 166, 351-353 However, there
are only a few reports on the control of non–specific cell adhesion354 due to the lack of
specific targeting on the cell surface, and the difficulties encountered in the
interpretation of the outcome of end–point assays.355-356 To date, dynamic control over

Chapter 6 Page 163
cell adhesion has been achieved by using “smart” surfaces mostly formed by stimuli–
responsive polymers.357-358 For instance, the thermo–responsive polymer poly(N–
isopropylacrylamide) and other closely related polyacrylamides have been widely
investigated for preparing biologically relevant switchable surfaces,359 as well as
polymeric materials that can tune their properties from bacteriostatic to non–fouling
and antimicrobial.360-362 Jiang et al.363 fabricated gold coated zwitterionic, (ZI),
carboxybetaine (CB) derivative surfaces that could be reversibly switched between an
open carboxylate form (CB–O–) and a six membered lactone ring (CB–Ring) in
response to a change in pH values.364 This pH switchable substrate was used to control
bacterial adhesion, through pH tuneable antimicrobial and antifouling properties. Here,
the equilibrium between the positively charged CB–Ring and the ZI CB–O– was used
to achieve bacterial attacking and defending functions in a controlled manner (Figure
106). The CB–Ring surface was able to kill over 99.9% of Escherichia coli attached on
it under dry conditions while in neutral or basic aqueous environments, CB–Ring was
hydrolysed to CB–O– leading to the release of dead bacteria. Furthermore, the CB–O–
surface was shown to resist bacteria adhesion in aqueous media. Finally, CB–O– could
also be converted back to CB–Ring under acidic conditions, thereby regenerating the
bacteria killing function.360
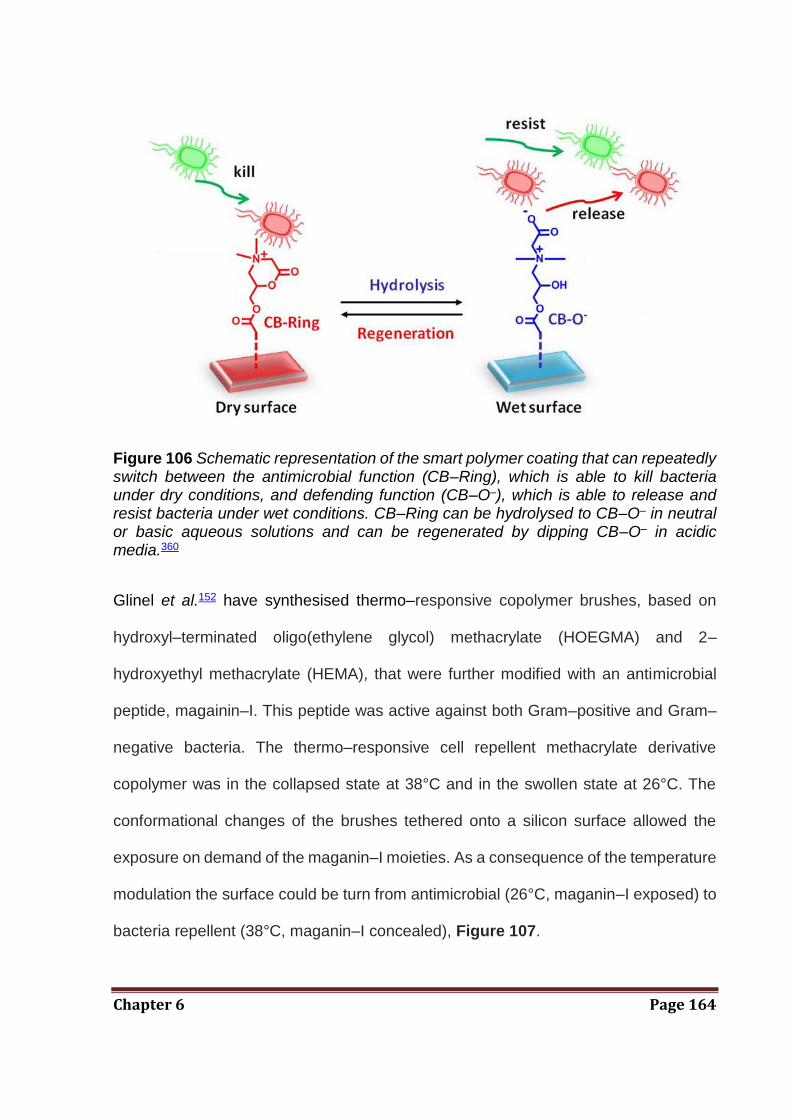
Chapter 6 Page 164
Figure 106 Schematic representation of the smart polymer coating that can repeatedly switch between the antimicrobial function (CB–Ring), which is able to kill bacteria under dry conditions, and defending function (CB–O–), which is able to release and resist bacteria under wet conditions. CB–Ring can be hydrolysed to CB–O– in neutral or basic aqueous solutions and can be regenerated by dipping CB–O– in acidic media.360
Glinel et al.152 have synthesised thermo–responsive copolymer brushes, based on
hydroxyl–terminated oligo(ethylene glycol) methacrylate (HOEGMA) and 2–
hydroxyethyl methacrylate (HEMA), that were further modified with an antimicrobial
peptide, magainin–I. This peptide was active against both Gram–positive and Gram–
negative bacteria. The thermo–responsive cell repellent methacrylate derivative
copolymer was in the collapsed state at 38°C and in the swollen state at 26°C. The
conformational changes of the brushes tethered onto a silicon surface allowed the
exposure on demand of the maganin–I moieties. As a consequence of the temperature
modulation the surface could be turn from antimicrobial (26°C, maganin–I exposed) to
bacteria repellent (38°C, maganin–I concealed), Figure 107.

Chapter 6 Page 165
Figure 107 Schematic representation of the thermoresposive polymer which expose the bactericidal magainin–I–peptide at 26°C and conceal it at 38°C. As a results bacteria are killed at 26°C (bacteria stain red with live dead stain) and are repelled at 38°C.
However, compared to the described polymer systems, SAMs are expected to allow
higher precision of distribution and faster changes in surface properties.365-366
Therefore, utilising such dynamic SAMs, the possibility exists to monitor the first
interaction between a cell and a surface in real–time. Additionally, the passage
between reversible and non–reversible cell adhesion can be ascertained. SAMs with
stimuli–responsive characteristics have been used for the adhesion of smaller analytes
such as proteins,149, 166, 351, 367 and DNA, and control specific interactions with cell

Chapter 6 Page 166
surface receptors145 but there has been no attempt to study non–specific cell adhesion
on such smart surfaces.368 In this context, the development of a reversible and fast
electrochemical switchable surface, based on homogeneously distributed two–
component SAMs represents a promising tool for studying cell–surface interactions in
vitro and in real–time, and is a significant step forward for the fabrication of similar
systems in vivo. The use of an electrical potential for changing the surface properties
will allow the study of bacterial interactions without perturbing their natural
environment, and therefore their viability (as it may happen by changing the pH and
temperature).
6.2 Aim
One of the major challenges in the field of switchable biological surfaces today is the
possibility to reversibly interact with cells. In this context this chapter reports significant
advances towards such surfaces.
This chapter aims to use the two−component SAMs fabricated in Chapter 4 to
control the early stages of bacterial cell adhesion by switching between an attractive
and a repellent state. This reversibility is achieved by controlling the exposure or
concealment of the MUA carboxylate negatively charged end group, via an electrical
potential applied to the gold surface. It is thought that during the first step of bacterial
adhesion the reversible interaction is possible by the formation and breakage of weak
electrostatic forces between the bacteria and the SAMs end group. Electrochemical
SPR is the technique of choice used to monitor, in real–time, this process, (Figure
108).

Chapter 6 Page 167
Figure 108 Schematic representation of an electrically switchable two–component SAM that is able to reversibly and rapidly switch its molecular conformation in response to an applied electrical potential. The change in molecular conformation which should induce either bacterial adhesion (anionic head group exposed) or repellence (anionic head group concealed) is monitored by electrochemical SPR.
6.3 Objectives
This chapter is divided into three main objectives.
1) Firstly, the switchable SAMs were exposed to a fixed negative (– 0.25 V) or positive
(+ 0.25 V) potential for 45 minutes while being challenged with a bacterial suspension
of either M. hydrocarbonoclasticus or C. marina, (Figure 109). The bacterial adhesion
to the surface at – 0.25 V and + 0.25 V was evaluated first by e−SPR and then further
demonstrated by confocal microscopy.

Chapter 6 Page 168
Figure 109 Schematic representation of the MUA–MET SAMs at OC and positive (+ 0.25 V) potential along with the relative bacterial repelling surface properties.
2) Secondly, the switchable SAM was exposed to one or more potential cycles
(potential cycle= +0.25 V;–0.25 V; +0.25 V) while exposed to a bacterial suspension of
either M. hydrocarbonoclasticus or C. marina (Figure 110). The bacterial adhesion
was evaluated by SPR and then further demonstrated by confocal microscopy. The
potential cycle was applied for different times to different surfaces in order to evaluate
the influence, on the switching performance, of the contact time (T=3, 5, 10, 20
minutes) between the bacteria and the surface.
Figure 110 Schematic representation of one switching cycle along with the different intervals of time between each change of potential (3, 5, 10 and 20 minutes

Chapter 6 Page 169
3) Thirdly, the switchable SAMs were conditioned either with:
− Different concentrated EPS solutions (collected after 0, 20 and 60 minutes from
bacterial suspension preparation) for 20 minutes, (Figure111a), or
− EPS (collected after 20 minutes from bacterial preparation) for 3 and 10 minutes,
(Figure 111b).
The influence of both, EPS concentration and conditioning time on the switching
performance was then evaluated (Figure 111c).
Figure 111 Schematic representation of a) EPS conditioning (20 minutes) using different concentrations of EPS collected after 0, 20 and 60 minutes from bacterial suspension preparation. b) EPS conditioning (3 and 10 minutes) with EPS collected after 20 minutes from bacterial suspension preparation. c) Performance of switching cycles (3 min) after the conditioning step.

Chapter 6 Page 170
6.4 Bacterial adhesion on switchable MUA–MET SAMs at fixed potential
(+0.25 V; OC and – 0.25 V)
6.4.1 Validation of the experimental parameters
Prior to performing bacterial adhesion studies, it was important to show that the
SAM surfaces were stable. Previous studies have reported the use of potential
between + 0.3 V and – 0.4 V.149 To this aim a range of fixed potentials from + 0.3 V to
– 0.3 V was applied for 45 min to the SAM–modified Au surfaces. The surfaces were
subsequently analysed by XPS and the ratio between the gold and sulphur atoms
presented on the surface was compared to one obtained for surfaces that were not
exposed to any potential. The results confirmed that the SAMs were stable as the Au/S
ratio remained constant throughout the three surfaces analysed (Figure 112).
Figure 112 XPS spectra of the S (2p) region observed for MUA–MET SAMs exposed to – 0.3 V, OC and + 0.3 V for 45 min. The presence of the two distinctive S (2p) peaks and the similar ratio Au/S found indicate the stability of the monolayer after the treatment. The small differences between the Au/S ratios in the 3 different surfaces are negligible (variation between Au/S ratios of the same surface at OC ± 3.2).

Chapter 6 Page 171
Furthermore, in contrast with previous literature,369-371 where electrical potentials have
been used to kill and remove bacteria from surfaces, it is important that our surface
technology allows the study of bacterial interactions without perturbing their viability.
Thus, in order to demonstrate that the bacteria were viable during our switching
experiments, we have conducted LIVE/DEAD bacteria staining assays on MET, MUA
SAMs after they have been exposed to + 0.3 V, OC and – 0.3 V for 45 minutes.
Electrical potentials between ± 0.25 V did not affect the cell integrity for the entire
period of the assay as both M. hydrocarbonoclasticus and C. marina cells stained
green for all the surfaces and for all the potentials applied. However, at potentials of ±
0.3 V all the bacterial cells stained red indicating the loss of their viability (Figure 113).
We excluded a priori the phenomenon of electroporation of the bacterial cells at the
electrical potentials used because most bacteria needs a potential of at least 0.5 V to
increase the permeability of the cell plasma membrane.372 However, to our knowledge,
the potential values at which electroporation occurs in C. marina and M.
hydrocarbonoclasticus are still unknown.

Chapter 6 Page 172
Figure 113 Micrographs obtained from confocal scanning laser microscopy showing the adhesion and the viability of M. hydrocarbonoclasticus and C. marina at different applied electrical potentials (– 0.3 V, – 0.25 V; OC; + 0.25 V and + 0.3 V) on (a–c) MUA, (b–d) MET one−component SAMs. The micrographs obtained show that all M. hydrocarbonoclasticus and C. marina cells were alive (stained green) in the range of ± 0.25 V while they are dead at ± 0.3 V.
Furthermore, aware of the fact that ASW is an environment with a high ionic strength,
we performed an experiment to demonstrate that this high salt concentration would not
affect the switching performance. In fact, ASW ionic strength is high due to the
presence of high concentration of NaCl (~27%). It is understood that with increased
ionic strength the distance at which the applied potential can be felt from the electrode
surface becomes smaller, this distance is termed the Debye length. The Debye length

Chapter 6 Page 173
value of the ASW used in this work was calculated to be ~ 0.6 nm.373 Since MUA is
expected to have a thickness of ~ 1 nm on the gold surface we hypothesised that if
this were the case then the likelihood of switching would be reduced as the potential
would not be felt at the upper end of the MUA molecules. Therefore, we wished to
establish the effect of the Debye length and its implication for the switching mechanism
proposed. Consequently, we performed cyclic voltammetric (CV) analysis on a SAM of
11–Ferroceneundecanethiol, (11–FUT), which has a very similar length to MUA
(Figure 120a). The experiment was conducted in ASW with a start potential of –0.2 V,
a switching potential of 0.8V and an end potential of –0.2 V. The purpose built
electrochemical Teflon cell shown in Figure 120b was used in order to perform the
essay.
Figure 114 Schematic representation of a) MUA–MET and 11–FUT SAMs at an ASW interface along with the Debye length equation (described in Chapter 2). The dotted line shows the thickness of the calculated Debye length (DL). b) The electrochemical cell set up used to perform the CV experiment.
The ASW Debye length of ~ 0.6 nm would have not provided the ferrocene end group
of 11–FUT with sufficient thermodynamic driving force via the potential to be oxidised
and reduced during the cyclic voltammetry scan. However, on the contrary when
performing a cyclic voltammogram using the 11–FUT surface in ASW a reversible

Chapter 6 Page 174
redox couple was observed, with anodic (current at 0.488 V) and a cathodic (current
at 0.481 V) peaks (Figure 115).
Figure 115 Typical cyclic voltammograms obtained for 11−FUT and control DDT SAM surfaces in ASW. Scan were performed at a start potential of + 0.2 V, switching the potential at +0.8 V and an end potential of −0.2 V at a scan rate of 0.1 V s−1.
We postulated that the reason for this deviation from the Debye length theory was
because of the tilt structure of SAM, meaning that its actual distance from the gold
surface was lower than 1 nm and thus the potential was sufficient to be felt over the
length of the molecule. This could then be translated to the MUA−MET switchable SAM
and we concluded that the potential could also be felt over the full length of the MUA
molecule.
In order to further prove our point, we performed a control cyclic voltammogram using
dodecanethiol (DDT)–SAM surface and no such redox couple was observed (Figure
115). Therefore, we concluded that the redox couple observed for 11–FTU occurred
as a consequence of the ferrocene moiety. Additionally, it is evident by the peak
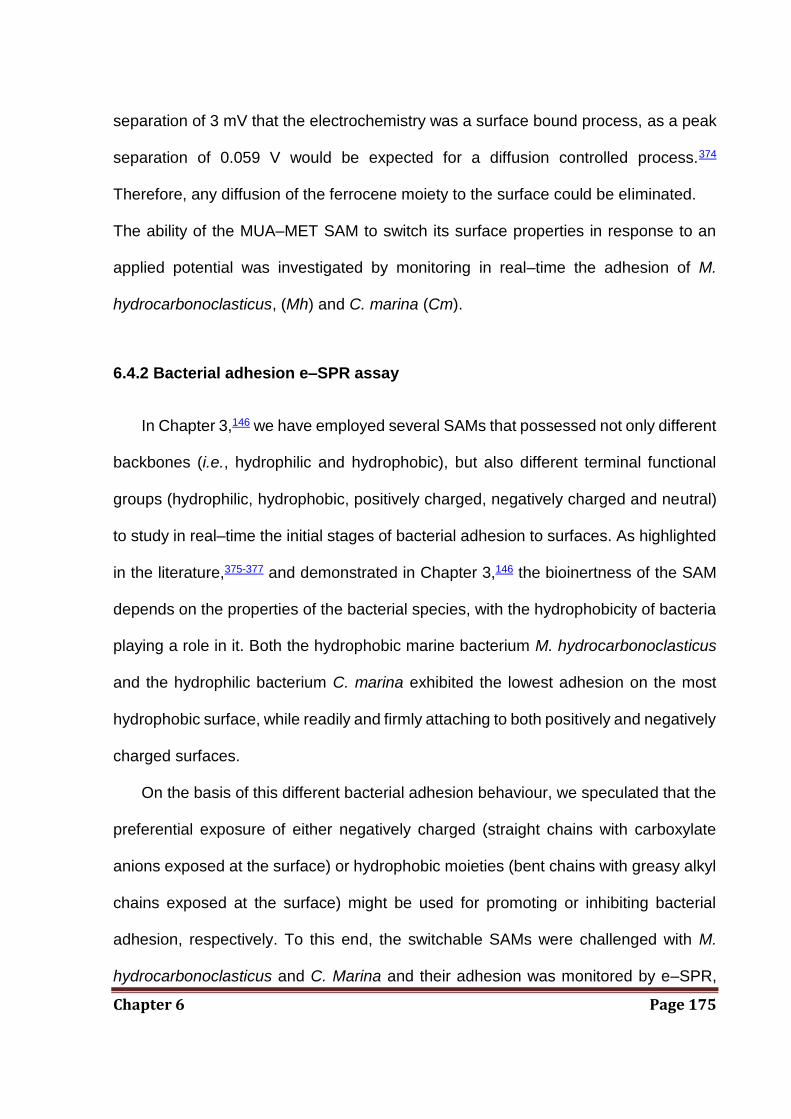
Chapter 6 Page 175
separation of 3 mV that the electrochemistry was a surface bound process, as a peak
separation of 0.059 V would be expected for a diffusion controlled process.374
Therefore, any diffusion of the ferrocene moiety to the surface could be eliminated.
The ability of the MUA–MET SAM to switch its surface properties in response to an
applied potential was investigated by monitoring in real–time the adhesion of M.
hydrocarbonoclasticus, (Mh) and C. marina (Cm).
6.4.2 Bacterial adhesion e–SPR assay
In Chapter 3,146 we have employed several SAMs that possessed not only different
backbones (i.e., hydrophilic and hydrophobic), but also different terminal functional
groups (hydrophilic, hydrophobic, positively charged, negatively charged and neutral)
to study in real–time the initial stages of bacterial adhesion to surfaces. As highlighted
in the literature,375-377 and demonstrated in Chapter 3,146 the bioinertness of the SAM
depends on the properties of the bacterial species, with the hydrophobicity of bacteria
playing a role in it. Both the hydrophobic marine bacterium M. hydrocarbonoclasticus
and the hydrophilic bacterium C. marina exhibited the lowest adhesion on the most
hydrophobic surface, while readily and firmly attaching to both positively and negatively
charged surfaces.
On the basis of this different bacterial adhesion behaviour, we speculated that the
preferential exposure of either negatively charged (straight chains with carboxylate
anions exposed at the surface) or hydrophobic moieties (bent chains with greasy alkyl
chains exposed at the surface) might be used for promoting or inhibiting bacterial
adhesion, respectively. To this end, the switchable SAMs were challenged with M.
hydrocarbonoclasticus and C. Marina and their adhesion was monitored by e–SPR,

Chapter 6 Page 176
(Figure 116). The bacteria were prepared as described in Chapter 7 and re–
suspended in freshly filtered artificial sea water, (ASW, pH = 8.2) to obtain a bacterial
suspension with OD=1.
The adhesion of the bacteria to the switchable SAMs was performed at open
circuit (OC) conditions and applied positive (+ 0.25 V) and negative (– 0.25 V)
potentials for a period of 45 min, (30 min of bacterial adhesion plus 15 minutes of
rinsing step).
As shown in Figure 116a and b, a high bacterial adsorption (~3000 RU for Mh and
~2000 RU for Cm) was observed at OC and – 0.25 V, i.e. when the negatively charged
end groups were exposed. On the contrary, when a positive potential was applied to
the gold electrode and the charged end–groups were therefore concealed, fewer
bacteria adhered to the surface (~800 RU for Mh and ~600 RU for Cm), Figure 116a
and b. These findings confirmed that the conformational changes occurred at the gold
surface, and that the bacteria sensed the presence or the absence of the carboxylate
anionic head group.

Chapter 6 Page 177
Figure 116 a–b) SPR sensorgram traces showing adhesion of M. hydrocarbonoclasticus (Mh) and C. marina (Cm) to MUA–MET switchable SAMs and at three different applied electrical potentials (– 0.25 V, OC and +0.25 V); Confocal microscope micrographs of the SPR chips after the adhesion assays has been performed. All the cells are green confirming their viability. c–d) Cell count of MUA–MET SAMs SPR chips that were taken at the end of the 45 min e–SPR adhesion assay. The error bars indicated are the standard errors.
The SPR chips were also analysed by confocal microscopy at the end of the
experiments and enumeration of cells confirmed the results observed by e–SPR
(Figure 116c–d). The experiment was performed in triplicate and consistent results
were obtained for the three potentials applied. Furthermore, control samples formed
by one–component monolayers of MUA and MET (Figure 117a–b) exhibited no
changes in bacterial adhesion when different potentials were applied to the gold
electrodes.

Chapter 6 Page 178
One–component SAMs of MUA and MET were exposed to a fresh bacterial
suspensions of M. hydocarbonoclasticus (Mh) and C. marina (Cm) while different
potentials (– 0.25 V, OC, + 0.25 V) were applied to the gold electrode for 45 min (30
min of bacterial adhesion plus 15 minutes of rinsing step). Adhered bacteria were fixed,
stained, with SYTO®13 stain, observed with an epifluorescence microscope and
counted as described in Chapter 7. Even if small differences in the kinetic of C. marina
adhesion were observed for the MUA SAMs, the end point RU values were similar for
the different potentials applied as shown in Figure 118.

Chapter 6 Page 179
Figure 117 SPR sensorgram traces showing the binding of a) Mh and b) Cm to one–component monolayers of MUA and MET at different applied potentials (–0.25 V, OC and + 0.25 V). Besides the SPR charts, confocal microscope images of the SPR chips, observed soon after the e–SPR experiments, are shown. Both bacteria adhered to the surface in the same number at the different applied potentials.

Chapter 6 Page 180
The control experiments were repeated three times and both the SPR sensorgrams
and the epifluorescence micrographs obtained revealed a similar amount of cells
attached to the SPR chips at the different applied potentials (–0.25 V, OC and + 0.25
V) (Figure 117 a–b). Bacterial count confirmed these findings revealing a small
variability in the cell number detected on the MUA and MET surfaces exposed to the
three different applied potentials (Figure 118).
Figure 118 Number of M. hydrocarbonoclasticus (Mh) cells and C. marina (Cm) cells attached to MET and MUA one-component SAMs when different potentials (– 0.25 V; OC; + 0.25 V) were applied to the surfaces. The error bars indicated are the standard errors.
6.5 Bacterial adhesion to switchable MUA–MET SAMs
The switching of MUA–MET SAMs was further proved through the adhesion of M.
hydrocarbonoclasticus and C. marina to the switchable SAMs while applying firstly a
positive potential (+ 0.25 V) for 20 minutes, followed by an ASW rinse (10 min) and

Chapter 6 Page 181
subsequently a negative potential (– 0.25 V) for further 20 minutes followed by an ASW
rinse (10 min).
As shown in Figure 119, a low bacterial adsorption (~500 RU) was observed at – 0.25
V, i.e. when the negatively charged end groups were concealed. After an ASW rinse
(10 minutes), which removed only few bacterial cells attached to the surface, a positive
potential was applied to the gold electrode and the charged end–groups were therefore
exposed to the bacterial suspensions. Both the adhesion of M. hydrocarbonoclasticus
and C. marina rose dramatically. In particular, M. hydrocarbonocalsticus adhered to
the surface up to ~2500 RU (Figure 119a) while C. marina reached ~1800 RU, (Figure
119b). These findings confirmed that the same surface was able to switch between
bacterial repellent and bacterial attractive upon an applied potential.
Figure 119 SPR sensorgram traces showing the binding of a) Mh and b) Cm to MUA–MET switchable SAMs at positive applied potential (+ 0.25 V) for 20 minutes followed by an ASW rinse and subsequently at negative applied potential (– 0.25 V) for 20 minutes followed by an ASW rinse.
However, when the same experiment was performed by applying a negative potential
first and afterwards a positive potential, no changes in the sensorgrams were
observed. We hypothesised that at negative potential, (bacteria attractive surface), the

Chapter 6 Page 182
bacterial cells became strongly attached due to the copious secretion of EPS during
the adhesion time (20 minutes). This strong adherence impeded to reverse the
adhesion tendency when a positive potential was applied.
The impossibility to perform a switch between the bacterial attractive and the bacterial
repellent status led us to further investigate the switching process by performing a
kinetic study. In particular, the switchable MUA–MET SAMs were exposed to several
switching cycles where positive and negative potentials were alternated each 3, (3 min
switching), 5, (5 min switching), 10, (10 min switching) and 20, (20 min switching)
minutes. This experiment was performed in order to evaluate the effect of adhesion
time on the reversibility.
For both bacteria, the switching was found to be reversible up to three times within
the first 20 min of bacterial adhesion after alternating the potential from negative (–
0.25 V) to positive (+ 0.25 V) (switching cycle) every 3 minutes (Figure 120a and e).
However, a decreased ability to switch was observed by increasing the length of
exposure between the bacteria and the surface at – 0.25 V. When switching was
performed every 5 min during bacterial adhesion, the loss of one switching cycle was
observed for both M. hydrocarbonocalsticus and C. marina (Figure 120b and f), while
for adhesion periods as long as 10 min only one switching cycle was accomplished
(Figure 120c and g). Ultimately, for switching carried out every 20 min no drops in the
sensorgram traces following a change of applied potential were detected, suggesting
that the attachment of both bacteria became irreversible (Figure 120d and h).

Chapter 6 Page 183
Figure 120 SPR sensorgrams traces showing the binding of Mh and Cm to the switchable surface when opposite potential changes (from – 0.25 V; to + 0.25 V and back to – 0.25 V, switching cycle) are applied every a–e) 3 min, b–f) 5 min, c–g) 10 min and d–h) 20 min. As the switching cycles became prolonged the possibility to observe the reversible bacterial adhesion is decreased with 20 min being the limit after which no switch is observed.

Chapter 6 Page 184
Observation of the SPR traces obtained also suggested that the adhesion process was
not fully reversible even during the first switching cycle after 3 min (Figure 120a, 83%
RU drop for Mh and 94% for Cm) and 5 min (Figure 120b, 74% RU drop for Mh and
70% for Cm) of M. hydrocarbonoclasticus and C. marina adhesion. The % of M.
hydrocarbonoclasticus and C. marina cells removed during the switching cycles
correspond to the drop in RU observed in the SPR sensorgrams when a positive
potential was applied. An explanation of the % calculation is given below. M.
hydrocarbonoclasticus is taken as model to show how these % were calculated.
For the 3, 5 and 10 minutes switching experiment the maximum number of M.
hydrocarbonoclasticus adhered, in the first switching cycle, corresponded to the RU at
~ 3, 5 and 10 min from bacteria injection (Figure 121a, b and c, bold arrows); therefore,
the values found at these points were considered as 100%.

Chapter 6 Page 185
On the other hand, the % of M. hydrocarbonoclasticus cells removed after the change
of potential applied (i.e. from – 0.25 V to + 0.25 V) were calculated using the RU values
recorded at ~ 6, 10 and 20 minutes from bacterial injection, (Figure 121a, b and c,
empty arrows).
The following equation shows the calculations used for obtaining the % of cells removal
after switch (Equation 16).
Eq. 16
The same calculation procedure was applied for each of the switching cycle observed
(i.e., 2nd and 3rd cycles for Figure 121a). The histogram in Figure 122a represents the
Figure 121 SPR charts showing the switching cycles obtained every a) 3, b) 5, c) 10 and d) 20 min. The bold arrows indicate the RU values observed just before changing the potential from – 0.25 V to + 0.25 V. The empty arrows represent the RU values observed just before changing the potential from + 0.25 V to – 0.25 V.

Chapter 6 Page 186
RU drops expressed in % observed between the RU values recorded at 3, 9 and 15
min and those recorded at 6, 12 and 18 min from M. hydrocarbonoclasticus injection
during the 3 min switching. An identical procedure was followed for the 5 min switching
(Figure 122b) and for the 10 min switching (Figure 122c).
Figure 122 a) For the 3 minutes switching cycles experiment (view Figure 121a): Histogram representing the drop in RU (expressed as % of initial RU i.e. before 1st switch) observed at the end of each switching cycle at 6 min (1st switching cycle), 12 min (second switching cycle) and 18 min (3rd switching cycle). b) For the 5 minutes switching cycles experiment (view Figure 121b): Histogram representing the drop in RU (express in %) observed at the end of each switching cycle at 10 (1st switching cycle) and 20 min (2nd switching cycle) and c) For the 10 minutes switching cycles experiment (view Figure 121c): Histogram representing the drop in RU (express in %) observed at the end of each switching cycle at 20 min (1st switching cycle).
The best switching performance was observed for the 5 min switching assay, where
the removal of cells between the first and the second cycle was reduced by only 11 %

Chapter 6 Page 187
(Figure 122b). Concerning the 3 min switching (Figure 122a) a reduction in switching
performance of 23% was observed between the first and the second switching cycle,
while a decrease in switching performance of 35% was shown between the second
and the third switching cycle. The least removal was observed for the switching
performed every 10 min with only 54% of the cells detached upon application of the
positive potential (Figure 122c) during the only switching cycle achieved. The overall
M. hydrocarbonoclasticus adhesion after 45 min was consistent through all the
switching experiments performed with a final RU of ~ 2000 ± 200 RU (Figure 120a−d).
However, the kinetic of adhesion was perturbed when subsequent short switching
cycles were applied (e.g. 3 minutes switching versus 20 minutes switching).
Furthermore, no substantial drop in the sensorgram traces was observed after the
ASW rinse, indicating a strong non–reversible attachment of the bacteria.
The same analysis was performed for C. marina where the % measurements revealed
results similar to those obtained for M. hydrocarbonoclasticus. However, for C. marina
the best switching performance was observed for the 3 min switching assay, where the
removal of cells between the first and the second cycle was reduced by only 8 %
(Figure 120e) while a decrease in switching performance of 25% was shown between
the second and the third switching cycle. Concerning the 5 min switching (Figure 120f)
a reduction in switching performance of 15% was observed between the first and the
second switching cycle. As well as for M. hydrocarbonocalsticus, the least removal was
observed for the switching performed every 10 min with only 20% of the cells detached
upon application of the positive potential (Figure 120g) during the only switching cycle
achieved. As per M. hydrocarbonoclasticus no switching was observed for the C.
marina 20 min switching.

Chapter 6 Page 188
The overall C. marina adhesion after 45 min was consistent through all the switching
experiments performed with a final RU of ~ 1800 ± 200 RU (Figure 120e−h).
Furthermore, no substantial drop in the sensorgram traces was observed after the
ASW rinse, indicating a strong non–reversible attachment of the bacteria.
Microscope observation of the SPR chips after the e–SPR experiments revealed
that the % RU drop observed during the switching corresponded to the % of cells
removed (Figure 123a-b).
To this end two independent e–SPR experiments, were carried out in order to obtain
an estimation of the difference in adhered cells on the sensor chips after 3 min of
adhesion (at an potential applied of – 0.25 V) and also after 6 min (3 min at – 0.25 V
and then 3 min at + 0.25 V, switching cycle). The SPR chips were collected after 3 min
and the adhered bacteria were fixed, stained and counted as described in Chapter 7.
The same procedure was repeated and the chips collected 6 min after M.
hydrocarbonoclasticus injection (3 min at – 0.25 V and then 3 min at + 0.25 V, switching
cycle). The results in Figure 123a showed a decrease in number of attached cells of
~ 86%, in accordance to the result previously found by SPR (Figure 122a, 1st switching
cycle). Figure 123b shows the outcome of the same experiment performed with C.
marina. Here, a drop of 92% in attached cells during the first switching cycle was
observed. This result was consistent with the trend of the SPR sensorgram obtained
after the first switching cycle.

Chapter 6 Page 189
Figure 123 a) Histogram representing the numbers of M. hydrocarbonoclasticus cells counted on the two components MUA/MET switchable SAMs after 3 min at an potential applied of – 0.25 V and after a 6 min switch cycle (3 min at – 0.25 V and then 3 min at + 0.25 V). As expected after 3 min of adhesion at – 0.25 V the number of cells found was high (~ a tenth of the cells adhered to the switchable SAM after 25 min of adhesion in the same potential conditions) while after 6 min switch, the number of cells adhered to the switchable SAMs was reduced of 86%. b) Histogram representing the numbers of C. marina cells counted on the two components MUA/MET switchable SAMs after 3 min at an potential applied of – 0.25 V and after a 6 min switch cycle (3 min at – 0.25 V and then 3 min at + 0.25 V). Similarly to M. hydrocarbonoclasticus, after 3 min of adhesion at – 0.25 V the number of cells found was high while after 6 min switch, the number of cells adhered to the switchable SAMs was reduced of 92%.
6.5.1 Controls on MUA and MET one–component SAMs under electrical
stimulation
In order to demonstrate that the switching performance was only due to the MUA–MET
SAM conformational changes, the adhesion of M. hydrocarbonoclasticus and C.
marina was monitored by e–SPR on one–component MUA SAMs and one–component
MET SAMs while alternating electrical potentials (–0.25 V and + 0.25 V) were applied.
Three minutes switching cycles (3 min at – 0.25 V and then 3 min at + 0.25 V) were
applied for 45 min. The sensorgrams obtained from the experiments showed that no
changes in bacterial adhesion occurred during the modification of potential applied

Chapter 6 Page 190
demonstrating that alterations in the sensorgram trend observed on MUA–MET SAMs
were only due to the conformational changes of the switchable SAMs (Figure 124).
Figure 124 Sensograms traces showing the absence of any reversible response for the two control surfaces, a) one–component MUA SAMs and b) one–component MET SAM. No reversal of bacterial adhesion on the sensor chips was seen when several three minutes switching cycles were applied (3 min at an potential applied of – 0.25 V and then 3 min at an potential applied + 0.25 V).
Comparing these sensorgrams with those obtained in Figure 117 for the same
surfaces, we noticed small differences in the kinetic of adhesion on both MUA and MET
SAMs with an overall lower bacterial adhesion compared to the same substrate at OC
(in red in Figure 117). These differences seems to suggest that repeated applicatyions
of electrical potential slightly perturb the bacterial adhesion on the two one-component
SAMs.

Chapter 6 Page 191
6.6 Bacterial adhesion to switchable MUA–MET SAMs in presence of EPS
Previous studies have highlighted the stepwise process of bacterial attachment378-379
and have measured increased bacterial adhesion strength with time.380 Furthermore,
the hypothesis of an increased production of the extracellular polymeric substances
(EPS), secreted by the bacterial cells during the adhesion process have been also
reported.381 The EPS are able to form an adhesive layer on the surface and around
the cells promoting the formation of the so–called biofilm. Evidence supporting this
hypothesis was demonstrated by collecting EPS from bacterial suspension aged in
ASW for 0 (T0), 10 (T10), 20 (T20), and 60 (T60) min and evaluating the EPS
adsorption on the MUA–MET SAMs for 40 min by SPR (Figure 125).
Figure 125 SPR responses to cell–free, EPS–containing, culture filtrates. The gold–coated SPR chips derivatised with MUA–MET SAMs were conditioned for 30 min with cell–free culture filtrates (EPS) collected from bacteria aged in ASW for 0 (T0), 10 (T10), 20 (T20), and 60 (T60) min, following by washing with filtered ASW for 10 min. The values in the chart represent the RU detected after the washing step and represent the EPS that is strongly attached to the SAMs. The values displayed are the average of three independent experiments and the error bars indicated are the standard errors.

Chapter 6 Page 192
EPS T0 supernatant showed only a small SPR response (~ 40 RU), but this response
was progressively greater for supernatants collected at T10, T20, and T60. This data
suggests that at T0 the EPS amount is almost negligible, thus unlikely to stop the
switching performance. On the other hand, at T20, when we observed the irreversible
bacterial adhesion, the value of EPS detected was ~5 times higher. Therefore, we
believed that the increased EPS secretion with time, might have been responsible for
the progressive conditioning of the surface and the subsequent decrease in switching
efficiency. We also hypothesised that the production and adhesion of EPS to the
surface may represent the key feature in the passage between the reversible and non–
reversible adhesion of cells.
On the basis of the observations made during the switching cycle experiments in the
previous paragraph, two different experiments aimed to clarify the EPS effect on the
switching performance were carried out. In particular, EPS solutions were collected
from M. hydrocarbonocalsticus and C. marina suspensions after different ageing times
(0 (T0), 20 (T20) and 60 (T60) minutes). These EPS solutions were used to condition
the MUA–MET switchable SAMs and evaluate the following two effects:
a) The effect of EPS concentration (EPS collected at different ageing time T0, T20,
T60) for a fixed time of conditioning (20 minutes).
b) The effect of conditioning time (3 and 10 minutes) for a fixed EPS concentration
(EPS collected at T20).
6.6.1 Effect of EPS concentration for 20 min of conditioning time
MUA–MET SAMs were exposed for 20 minutes to an EPS solution collected soon after
bacterial preparation (T0). After this conditioning step the surface was challenged with

Chapter 6 Page 193
a freshly prepared M. hydrocarbonocalsticus and C. marina suspension while
subsequent switching potential cycles were applied. Figure 126 shows the
sensorgrams obtained in which the EPS T0 and the bacterial injection are clearly
illustrated. A small response due to the EPS adhesion to the surface was visible for
both bacteria. In particular, the adhesion of EPS seemed to be higher for M.
hydrocarbonoclasticus (~50 RU) than for C. marina (~30 RU). After the EPS
conditioning step, a freshly prepared bacterial suspension was injected and the
application of multiple, 3 minutes, opposite potential cycles (– 0.25 V; + 0.25 V) was
performed. Two switching cycles were clearly visible for both M. hydrocarbonoclasticus
and C. marina (Figure 126a–b). However, comparing these results with those obtained
in Figure 120, when the surface was not pre–conditioned with EPS, we could notice
the loss of one switching cycle. Furthermore, the switching cycles observed after
conditioning were less defined with a decreased difference between the attractive and
repellent status which was quickly and progressively lost when the third potential cycle
was applied. Observation of Figure 126a suggested that M. hydrocarbonoclasticus
adhered to the surface with a kinetic similar to the 5 min switching observed in Figure
120b. On the other hand, for C. marina, the kinetic of adhesion and the RU values
recorded at the end of the assay are more similar to the 10 min switching observed in
Figure 120g.

Chapter 6 Page 194
Figure 126 SPR sensorgrams traces showing the EPS T0 conditioning step for 20 min (at open circuit) and the subsequent injection and binding of a) M. hydrocarbonoclasticus and b) C. marina to the switchable surface when opposite potential changes (from – 0.25 V; to + 0.25 V and back to – 0.25 V, switching cycle) are applied every 3 min. Only two switching cycles are visible after which no switching is observed.
The experiment performed with EPS T0 was repeated with an EPS solution collected
after 20 minutes ageing time (T20). MUA–MET SAMs were conditioned for 20 minutes
with the EPS T20 solution. After this conditioning step, the surface was challenged with
either a freshly prepared M. hydrocarbonocasticus or C. marina suspension and
exposed to 3 minutes switching potential cycles. Figure 127 shows the sensorgrams
obtained in which the EPS T20 and the bacterial injection are clearly illustrated. A
bigger EPS adsorption response was observed for the EPS T20 conditioning step
when compared to the one obtained for EPS T0. This time, the adhesion of EPS for M.
hydrocarbonoclasticus and C. marina were comparable, i.e. ~ 200 RU. After the EPS
conditioning step, a freshly prepared bacterial suspension was injected and the
application of multiple, 3 minutes, opposite potential cycles (– 0.25 V; + 0.25 V) was
performed. In contrast with the previous experiment (performed with EPS T0), no
switching cycles were observed for both M. hydrocarbonoclasticus and C. marina
(Figure 127a–b). These results indicate that the EPS layer was thick and adherent to

Chapter 6 Page 195
the switchable MUA–MET SAMs, enough to impede the conformational changes of the
MUA moieties in response to the applied potential.
Figure 127 SPR sensorgrams traces showing the EPS T20 conditioning step for 20 min (at open circuit) and the subsequent injection and binding of a) M. hydrocarbonoclasticus and b) C. marina to the switchable surface when opposite potential changes (from – 0.25 V; to + 0.25 V and back to – 0.25 V, switching cycle) are applied every 3 min. No switch is observed.
In order to confirm these results, EPS was collected after 60 minutes ageing time.
MUA–MET SAMs were conditioned for 20 minutes with the EPS T60 solution. After
this conditioning step, the surface was challenged with either a freshly prepared M.
hydrocarbonocasticus or C. marina suspension and exposed to 3 minutes switching
potential cycles. Figure 128 shows the sensorgrams obtained in which the EPS T60
and the bacterial injection are clearly illustrated. EPS responses as high as ~ 500 for
C. marina and ~ 400 for M. hydrocarbonoclasticus were obtained. After the EPS
conditioning step, a freshly prepared bacterial suspension was injected and the
application of multiple, 3 minutes, opposite potential cycles (– 0.25 V; + 0.25 V) was
performed. No switching cycles were observed for both M. hydrocarbonoclasticus and
C. marina (Figure 128a–b). These results are similar to those obtained when EPS T20

Chapter 6 Page 196
was used for conditioning the surface prior to the switching step; therefore these
findings further confirm that the EPS layer was responsible for the lack of switching.
Figure 128 SPR sensorgrams traces showing the EPS T60 conditioning step for 20 min (at open circuit) and the subsequent injection and binding of a) M. hydrocarbonoclasticus and b) C. marina to the switchable surface when opposite potential changes (from – 0.25 V; to + 0.25 V and back to – 0.25 V, switching cycle) are applied every 3 min. No switch is observed.
6.6.2 Effect of conditioning time by using EPS T20
MUA–MET SAMs were exposed for 3 minutes to an EPS solution collected after 20
minutes ageing time (T20). After this conditioning step, the surface was challenged
with either a freshly prepared M. hydrocarbonocasticus or C. marina suspension and
exposed to 3 minutes switching potential cycles. Figure 129 shows the sensorgrams
obtained in which the EPS T20 and the bacterial injection are clearly illustrated. A small
response due to the EPS adhesion to the surface was visible for both bacteria. In
particular, the adhesion of EPS seems to be higher for C. marina (~100 RU) than for
M. hydrocarbonoclasticus (~50 RU). After the EPS conditioning step and following
exposure to bacterial suspension and multiple opposite potentials cycles, two switching
cycles were clearly visible for M. hydrocarbonoclasticus while only one was observed
for C. marina (Figure 129). This different behaviour between the two bacteria could be

Chapter 6 Page 197
due to the higher amount of EPS T20 collected from the C. marina suspension
compared to those collected from M. hydrocarbonoclasticus. The results obtained in
these experiments showed how even a small EPS T20 conditioning time such as 3
minutes could interfere with the switching performance. By comparing these results
with those obtained in Figure 126 when the surface was pre−conditioned with EPS T0
for 20 minutes, we could appreciate a similar trend for M. hydrocarbonoclasticus. The
switching cycles observed after conditioning were less defined with a decreased
difference between the attractive and repellent status which was quickly and
progressively lost when the third potential cycle was applied. On the contrary, for C.
marina the difference between the two experiments (Figure 126 and Figure 129) is
significant with the sensorgrams showing the loss of one switch in the latter
experiment. These results highlighted the importance of the EPS concentration in
influencing the switching performance even after a very short conditioning time (i.e. 3
minutes).
Figure 129 SPR sensorgram traces showing the EPS T20 conditioning step for 3 min (at open circuit) and the subsequent injection and binding of a) M. hydrocarbonoclasticus and b) C. marina to the switchable surface when opposite potential changes (from – 0.25 V; to + 0.25 V and back to – 0.25 V, switching cycle) are applied every 3 min. Two switching cycles are visible for M. hydrocarbonoclasticus and only one was observed for C. marina after which no switching was detected.

Chapter 6 Page 198
In order to further investigate the effect of conditioning time, MUA–MET SAMs were
exposed for 10 minutes to an EPS solution collected after 20 minutes ageing time
(T20). After this conditioning step, the surface was challenged with either a freshly
prepared M. hydrocarbonocasticus or C. marina suspension and exposed to 3 minutes
switching potential cycles. Figure 130 shows the sensorgrams obtained in which the
EPS T20 and the bacterial injection are clearly illustrated. A response due to the EPS
adhesion to the surface was visible for both bacteria. In particular, the adhesion of EPS
seems to be higher for C. marina (~180 RU) than for M. hydrocarbonoclasticus (~120
RU). After the EPS conditioning step and following exposure to bacterial suspension
and multiple opposite potentials cycles, no switching cycles were observed for both
bacteria (Figure 130a–b). The results obtained in these experiments once more
confirmed the influence of conditioning time on the switching performance.
Figure 130 SPR sensorgram30 traces showing the EPS T20 conditioning step for 10 min (at open circuit) and the subsequent injection and binding of a) M. hydrocarbonoclasticus and b) C. marina to the switchable surface when opposite potential changes (from – 0.25 V; to + 0.25 V and back to – 0.25 V, switching cycle) are applied every 3 min. No switching was detected.

Chapter 6 Page 199
6.7 Conclusions
In conclusion, we have demonstrated in real–time the passage between
reversible and non–reversible non–specific cell attachment using electrochemical
responsive SAMs. The adhesion of the bacteria M. hydrocarbonoclasticus and C.
marina to the SAMs was reversible up to 3 times in the first 20 min of adhesion, after
which a constant increasing in bacterial adhesion was observed. The measurement
was performed by e–SPR using a purpose–built electrochemical cell. When the time
interval between each switching cycle was increased the switching performance was
progressively lost and any evidence of the switching could be observed for 20 minutes
switching cycles. We speculated that this decreased ability of switch was due to the
increased presence of EPS in the bacterial suspension. On the basis of this hypothesis
we have carried out kinetic studies in order to highlight the influence of EPS exposure
and concentration associated with the loss of switching capability. The results obtained
in these assays clearly showed that surfaces conditioned with EPS collected after 20
minutes of bacterial suspension ageing time and exposed to the surface for at least 20
minutes did not switch.
Non–specific cell adhesion represents the first step towards the colonisation of
a surface, therefore devices that monitor changes in real–time and are able to elucidate
the progression of cell adhesion are highly desirable for a number of biomedical
applications which range from diagnostic, genetic expression and biomaterials fouling
control.375, 382
Chapter 7 Page 200
7.0 CHAPTER 7
Experimental Procedures, Protocols and Synthesis
Abstract: This chapter describes the experimental techniques used during the
investigations performed throughout the work described in this thesis. Experimental
protocols and data analysis by various equipment have been described.
7.1 Experimental
7.1.1 Material
7.1.1.1 Glass substrate
Glass cover slips were purchased from VWR international. www.uk.vwr.com and were
the type:
Borosilicate glass
22 x 32 mm
Thickness: No.1

Chapter 7 Page 201
7.1.1.2 Gold substrates
Polycrystalline gold substrates were purchased from George Albert PVD, Germany
and consisted of a 50 nm gold layer deposited onto glass covered with a thin layer (5
nm) of chromium as the adhesion layer. Polycrystalline gold substrates employed in
SPR were purchased from Reichert Technologies, USA, consisted of 49 nm gold with
1 nm chromium.
7.1.2 Chemicals
The commercially available chemicals and solvents listed below were purchased from
Aldrich Chemicals and Fisher Chemicals and were used as received:
- 1−hexadecanethiol (HDT, 99%), 16−mercaptohexadecanoic acid (MHA, 99%),
11−aminoundecanethiol hydrochloride (AUT, 99%),
11−mercapto−1−undecanol (MUT, 99%),
O−(2−Carboxyethyl)−O′−(2−mercaptoethyl)heptaethylene glycol (EG7−COOH,
95%), (11−mercaptoundecyl)hexa(ethylene glycol)(EG6−OH, 90%), HPLC
EtOH, triethylamine (N(CH2CH3)3, 99.5%), trifluoroacetic acid (CF3COOH,
99%), (11−mercaptoundecanoic acid (MUA), mercaptoethanol (MET),
4−(trifluoromethyl)benzyl bromide, K2CO3, [18]−crown 6, 3,5−dihydroxybenzyl
alcohol, 4−dimethyl−aminopyridine,
1−(3−dimethylaminopropyl)−3−ethyl−carbodiimide hydrochloride iodine)
dichloromethane(DCM), tetrahydrofuran (THF), acetone, dimethylformaldehyde
(DMF).

Chapter 7 Page 202
-
UHQ (ultra−high quality) H2O (resistivity >18 Ω cm−1, TOC reading of < 3 ppb) was
purified by using a Millipore−Q Integral 5 water purification system, Oligopeptides
(Biotin−KKKKC and KKKKC) were synthesised by Peptide Protein Research Ltd.
(Wickham, UK) to > 95 % purity and verified by HPLC and mass spectrometry.
Neutravidin was purchased from Invitrogen. Phosphate buffered saline (PBS) solution
was prepared from a 10× concentrate PBS solution (1.37 M sodium chloride, 0.027 M
potassium chloride, and 0.119 M phosphate buffer) from Fisher BioReagents. TEGT
was synthesised by Dr. Parvez Iqbal, School of Chemistry, University of Birmingham,
through a multistep route (Figure 131). The commercially available triethylene glycol
(1) was alkylated with allyl bromide at reflux in basic conditions to obtain 2 (Figure
131). 2 was converted to 3 (Figure 131) in the presence of thioacetic acid and
Azobisisobutyronitrile (AIBN) heated at reflux for 1 hour (hr). Deprotection of 3 was
performed in mild acidic conditions at reflux for 4 h to obtain TEGT (4).
Figure 131Synthesis of TEGT.

Chapter 7 Page 203
7.1.3 Analytical chemistry techniques
Thin layer chromatography (TLC): Macherey Nagel silica gel 60F254 analytical plates
(aluminium support) which were developed using standard visualising agents: UV
fluorescence (254 and 366 nm), potassium permanganate/Δ.
Column chromatographic separations: were performed using silica gel 120 (ICN
Chrom 32 − 63, 60 Å).
Low and high resolution MS and HRMS (EI): VG ProSpec or VG−ZabSpec at 70 eV.
High resolution EI spectra were measured using perfluorokerosene (PFK) as an
internal calibrant.
Low and high resolution MS and HRMS (ES): Micromass LCT using a methanol mobile
phase. HRMS was obtained using a lock−mass to adjust the calibrated mass scale.
MS data are reported as m/z (relative intensity).
NMR: Spectra were recorded on Bruker AC300 (1H = 300 MHz, 13C = 75.5 MHz),
Bruker AV300 (1H = 300 MHz, 13C = 75.5 MHz), and Bruker AV400 (1H = 400 MHz,
13C = 101 MHz) in the solvents indicated; Chemical shifts (δ) are given in ppm relative
to TMS. The solvent signals were used as references and the chemical shifts converted
to the TMS scale (CDCl3: δC = 77.0 ppm; residual CHCl3 in CDCl3: δH = 7.26 ppm;
DMSO−d6: δC = 39.52 ppm; residual DMSO−d5 in DMSO−d6: δH = 2.50 ppm).
Coupling constants (J) are reported in Hz. Multiplicity is denoted in 1H NMR by: s
(singlet), d (doublet), t (triplet), q (quadruplet), m (multiplet). 1D 13C NMR spectra were
recorded using the PENDANT pulse sequence from the Bruker standard pulse
program library

Chapter 7 Page 204
Elemental Analysis. Elemental analysis was carried out on a Carlo Erba EA 1110 (C H
N) instrument
Infrared Spectroscopy (IR). The IR spectra were recorded as thin solid films on NaCl
discs using a Perkin Elmer 1600 FT−IR.

Chapter 7 Page 205
7.1.4 Synthesis
Figure 132 Synthetic route for the preparation of dendron dialkyl disulphide 7.

Chapter 7 Page 206
7.1.4.1 Synthesis of dialkyl disulphide 3
Compound 2. To a solution of 11−mercaptoundecanoic acid 1 (1.00 g, 4.90 mmol) in
EtOH (20 mL) heated under reflux a solution of iodine (0.50. g, 1.97 mmol) in EtOH (5
mL) was added. Heating was continued for 12 h after which the reaction was allowed
to cool to room temperature and washed with a saturated aqueous solution of Na2S2O3
(20 mL). The product was extracted with DCM (3×20 mL). The combined organic layers
were dried (MgSO4), filtered and the solvent was removed in vacuo. The residue was
purified by recrystallisation from DCM/hexane. The feathery white crystals were filtered
from the mother liquor through suction filtration, washed with ice−cold hexane and
dried under high vacuum to afford disulphide MUA ethyl ester 2 (1.97 g, 82%). m/z
(ESMS) 513 [M+Na]+; δH (300 MHz, CDCl3) 4.10 (4 H, q, J = 7.1 Hz), 2.65 (4 H, t, J =
7.4 Hz), 2.26 (4 H, t, J = 7.5 Hz), 1.73−1.58 (8 H, m), 1.30−1.25 (30 H, m); δC (400
MHz, CDCl3) 173.9, 60.1, 39.1, 34.4, 29.3, 29.2, 28.5, 24.9, 14.2. Elemental analysis
of C26H50O4S2 requires C 63.67%, H 10.20%. Elemental analysis found C 63.52%, H
10.48%.
Compound 3. To a vigorously stirred solution of 2 (1.97 g , 4.02 mM) in THF (100mL)
was added a solution of potassium hydroxide (0.67 g, 12.06 mM) in H2O/ EtOH (1:1,
10mL). The reaction was stirred for 12 h, and acidified with HCl (aq, 2 M, 10mL) upon
which a white solid precipitated. The solid was filtered off, washed with H2O (50mL),

Chapter 7 Page 207
cold EtOH (100 mL) and dried in vacuo affording MUA disulphide as white plate−like
crystals (1.73 g, 99%). m/z (ESMS) 457 [M+Na]+; δH (300 MHz, CDCl3) 3.5 (2H, br, s),
2.68 (4 H, t, J = 7.2 Hz), 2.33 (4 H, t, J = 7.2 Hz), 1.73−1.62 (4 H, m), 1.43−1.31 (28
H, m); δC (400 MHz, CDCl3) 174.5, 38.0, 33.7, 28.9, 28.8, 28.6, 28.6, 27.8, 24.5.
Elemental analysis of C22H42O4S2 requires C 60.82%, H 9.67%. Elemental analysis
found C 60.78%, H 9.70%.
7.1.4.2 Synthesis of fluorine dendron 6
To a solution of 3,5−dihydroxybenzyl alcohol 4 (1.00 g, 7.14 mmol) and [18]crown−6
(0.18 g, 0.71 mmol) in acetone, 4−(trifluoromethyl)benzyl bromide 5 (3.53 g, 14.99
mmol) and K2CO3 (2.96 g, 21.42 mmol) were added. After stirring at reflux for 24 h, the
insoluble materials were filtrated while the solvent was removed in vacuo. The residue
was obtained and subsequently purified by column chromatography (hexane−EtOAc,
75−25%) affording a white solid 6 (2.96 g, 91%). m/z (ESMS) 513 [M+Na]+; δH (300
MHz, CDCl3) 7.57 (4 H, d, J = 8.2 Hz), 7.46 (4 H, d, J = 8.2 Hz), 6.56 (2 H, d, J = 2.2
Hz), 6.45 (1 H, t, J = 2.2 Hz), 5.03 (4 H, s), 4.57 (2 H, s); δC (400 MHz, CDCl3) 159.8,
143.4, 140.8, 130.4, 127.4, 125.6, 105.4, 101.4, 69.2, 65.1. Elemental analysis of
C22H42O4S2 requires C 60.53%, H 3.98%. Elemental analysis found C 60.55%, H
4.00%.

Chapter 7 Page 208
7.1.4.3 Synthesis of compound dendron dialkyl disulphide 7
To a solution of 3 (1.31 g, 3.01 mmol) in dry THF (10 mL) cooled to 0° C under an N2
atmosphere was added N,N′−dicyclohexylcarbodiimide (DCC) (1.86 g, 9.03 mmol) and
catalytic amount of 4−dimethyl−aminopyridine. The mixture was stirred for 30 min and
6 (2.00 g, 6.32 mmol) was added over 10 min, followed by further stirring for 24 h under
an N2 atmosphere at room temperature. The white precipitate was filtered and the
filtrate was diluted with DCM (30 mL) and washed with H2O (3×20 mL), followed by
10% aqueous NaHCO3 (10 mL) and saturated (aqueous) NaCl (5 mL). The organic
phase was dried (MgSO4), filtered and the filtrate evaporated to dryness under reduced
pressure. The residue was purified by silica gel column chromatography
(hexane/EtOAc, 90:10%) to yield 7 (0.96 g, 25%) as a white solid. m/z (ESMS) 1333.46
[M+Na]+; δH (300 MHz, CDCl3) 7.64 (8 H, d, J = 8.1 Hz), 7.53 (8 H, d, J = 8.1 Hz), 6.60
(4 H, d, J = 2.2 Hz), 6.54 (2 H, t, J = 2.2 Hz), 5.10 (8 H, s,), 5.04 (4 H, s), 2.66 (4 H, t,
J = 10.5 Hz), 2.34 (4 H, t, J = 9 Hz), 1.70−1.55 (12 H, m), 1.41−1.23 (20 H, m); δC (400
MHz, CDCl3) 173.9, 159.5, 140.7, 138.9, 127.5, 125.9, 107.4, 101.9, 68.9, 65.7, 60.3,
39.1, 34.2, 29.2, 28.4, 24.7. Elemental analysis of C22H42O4S2 requires C 62.28%, H
5.69%. Elemental analysis found C 62.64%, H 5.79%.

Chapter 7 Page 209
7.1.5 Surface preparation
7.1.5.1 Cleaning of glassware
All organic contaminants were removed from glassware prior to use via a set cleaning
procedure.383 Glassware was immersed in piranha solution (70% H2SO4, 30% H2O2)
for 30 minutes, rinsed and then sonicated in UHQ H2O (resistivity 18Ω cm−1), followed
by oven drying at 127 °C for 30 min. Finally the glassware was rinsed, and then
sonicated in ethanol (EtOH) for 30 min before being dried in the oven for 24 h prior
use. (Caution: Piranha solution is a very strong oxidant and reacts violently with many
organic compound. It should be handled with extreme care).
7.1.5.2 Cleaning of gold surfaces
Au substrates were cut to a square size approximately 1cm x 1cm using a diamond
tipped scriber. The substrates were rinsed with HPLC ethanol to clear the surface of
any particles that were produced from the cutting process. All organic contaminants
were removed from gold surfaces by exposing them to ultraviolet/ozone (UVO)
treatment for 1 hour and copiously rinsing them with UHP water and HPLC EtOH prior
to use.
Chapter 7 Page 210
7.1.5.3 One component SAMs fabrication
For the preparation of one−component SAMs the clean gold substrates were immersed
for 24 h in an ethanolic 1 mM solution of either: HDT, MHA, AUT, MUT, EG7−COOH
or EG6−OH in ETOH at room temperature. Upon removal from the solution, the
substrates were rinsed with HPLC EtOH and dried with a stream of N2. Note that the
NH2−terminated SAMs were deposited in the presence of HPLC EtOH containing 3%
(v/v) N(CH2CH3)3 to prevent the formation of hydrogen bonds between the NH2
functional groups of the bound thiol on Au surface and that of free thiol in the bulk
solution.384 Upon SAM formation, the NH2−terminated SAMs were rinsed in the
presence of an ethanolic solution containing 10% (v/v) CF3COOH. On the other hand,
COOH−terminated SAMs were formed in the presence of HPLC EtOH containing 3%
(v/v) CF3COOH and then rinsed with an ethanolic solution of N(CH2CH3)3 in order to
prevent hydrogen bonds between COOH−terminated bound thiols and
COOH−terminated thiols in solution.
7.1.5.4 MUA−MET switchable SAMs fabrication
For the preparation of MUA− MET switchable SAMs, clean Au−coated Reichert sensor
chips were immersed in a 0.1 mM CH2Cl2 solution of the dendron dialkyl disulphide
(compound 7) in for 48 h at room temperature, followed by copious washing with
CH2Cl2, and dried under a stream of N2. The dendron end−groups were then removed
by hydrolysing the ester bond in ethanolic 0.5 M KOH containing 1 mM MET as
backfiller molecule for further 24 h, followed by copious washing with ethanol, CH2Cl2,
water, and then dried under a stream of N2.82

Chapter 7 Page 211
7.1.5.5 Biotin−KKKKC, TEGT, Biotin−KKKKC:TEGT SAMs fabrication
For the preparation of the pure biotin−KKKKC and TEGT SAMs, the clean gold
substrates were immersed for 12 h in ethanolic 0.1 mM solution of biotin−KKKKC
containing 3% (v/v) N(CH2CH3)3 and 0.1 mM solution of TEGT, respectively. For the
preparation of the mixed biotin−KKKKC:TEGT SAMs, solutions of the oligopeptide
biotin−KKKKC (0.1 mM ) and TEGT (0.1 mM ) were prepared in HPLC EtOH containing
3% (v/v) N(CH2CH3)3, and mixed at the volume ratio of 1:40. Subsequently, the clean
gold substrates were immersed in the mixed solution for 12 h to form the mixed SAMs
on the gold surfaces. The substrates were rinsed with HPLC EtOH, an ethanolic
solution containing 10% (v/v) CH3COOH, and UHP H2O and dried under a stream of
N2. Note that the mixed SAMs were deposited in the presence of N(CH2CH3)3 to
prevent the formation of hydrogen bonds between the NH2 functional groups of the
bound thiolate peptide on Au surface and that of free thiol peptide in the bulk solution.[1]
7.1.5.6 SAM formation on the gold coated CAF2 prism
CaF2 prisms were coated on one side with a 15 nm thick Au layer by chemical vapour
deposition. As the previous gold surfaces the Au−coated prisms were cleaned by
exposure to UV light for 20 min and immediately rinsed with UHP H2O, followed by
HPLC grade ethanol for 1 min and UHP. The prisms were then immersed into either a
solution of biotin−KKKKC or biotin−KKKKC:TEGT prepared as described in Section
2−SAM preparation. In order to avoid the solvent evaporation, the procedure described
was carried out in a purpose built chamber. The substrates were rinsed with HPLC

Chapter 7 Page 212
EtOH, an ethanolic solution containing 10% (v/v) CH3COOH, and UHP H2O and dried
under a stream of N2.
7.1.6 Surface characterisation
7.1.6.1 Contact angle measurements
Contact angles were determined using a home−built contact angle apparatus,
equipped with a charged coupled device (CCD) KP−M1E/K camera (Hitachi) that was
attached to a personal computer for video capture. The dynamic contact angles were
recorded as a micro−syringe was used to quasi−statically add liquid to or remove liquid
from the drop. The drop was shown as a live video image on the PC screen and the
acquisition rate was 4 frames per second. FTA Video Analysis software v1.96 (First
Ten Angstroms) was used for the analysis of the contact angle of a droplet of UHP
H2O at the three−phase intersection. The averages and standard errors of contact
angles were determined from five different measurements made for each type of SAM
(in triplicate). All measurements were done on 50 nm gold substrates.
7.1.6.2 Ellipsometry measurement
The thickness of the deposited monolayers was determined by spectroscopic
ellipsometry. A Jobin−Yvon UVISEL ellipsometer with a xenon light source was used
for the measurements. The angle of incidence was fixed at 70⁰. A wavelength range of
280–820 nm was used. The DeltaPsi software was employed to determine the
thickness values and the calculations were based on a three−phase ambient/SAM/Au

Chapter 7 Page 213
model, in which the SAM was assumed to be isotropic and assigned a refractive index
of 1.50. The thickness reported is the average of six measurements taken on each
SAM (in triplicate). The errors reported for the ellipsometry measurements are
standard errors. All measurements were done on 100 nm gold substrates.
7.1.6.3 X−ray Photoelectron Spectroscopy (XPS)
Elemental composition of the SAMs were analysed using an Escalab 250 system
(Thermo VG Scientific) operating with Avantage v1.85 software under a pressure of ~
5 x 10⁻⁹ mbar. An Al Kα X−ray source was used, which provided a monochromatic
X−ray beam with incident energy of 1486.68 eV. A circular spot size of ~ 0.2 mm2 was
employed. The samples were attached onto a stainless steel holder using
double−sided carbon sticky tape (Shintron tape). In order to minimise charge retention
on the sample, the samples were clipped onto the holder using stainless steel or Cu
clips. The clips provided a link between the sample and the sample holder for electrons
to flow, which the glass substrate inhibits. Low resolution survey spectra were obtained
using a pass energy of 150 eV over a binding energy range of 210 eV to 1200 eV
obtained using 1 eV increments. The spectra recorded were an average of 3 scans.
The high resolution spectra were obtained using a pass energy of 20 eV and 0.1 eV
increments over a binding energy range of 20 – 30 eV, centred on the binding energy
of the electron environment being studied. A dwell time of 20 ms was employed
between each binding energy increment. Sensitivity factors used in this study were: S
(2p), 2.08; Au (4f 7/2), 9.58; Au (4f 5/2), 7.54, C (1s), 1, F (1s) 5.1.

Chapter 7 Page 214
7.1.6.4 Electrochemical Sum Frequency Generation (SFG)
The SFG spectra have been acquired with a picosecond Nd:YAG laser (PL2241,
EKSPLA). The beams have a pulse duration of 35 ps at a repetition rate of 50 Hz. The
beam diameter at the sample stage was about 2 mm to avoid ablation of the 15 nm Au
film on the CaF2 prism. Tuneable IR pulses (about 200 µJ) are overlapped at the
sample interface with a beam of visible (532 nm, 200 µJ) light to produce the output
SFG light. The substrate films prepared onto one side of an equilateral CaF2 prism, as
described above, were in contact with the sample solution in a Teflon liquid cell. After
immersion of the modified CaF2 prism into the purpose built electrochemical cell, a
positive potential of + 0.3 V was applied. The laser beams were then directed through
the backside of the prism to probe the substrate−solution interface in situ in near−total
internal reflection geometry. The visible and IR beams were overlapped at the sample
spatially and temporally with incidence angles of 67o and 55o, respectively. All beams
(SFG, VIS, and IR) were p−polarised. The potential was applied during all the spectral
acquisition (~40 minutes) and was inverted (to −0.4 V) at the end of it. A further SFG
spectral acquisition at −0.4 V was then performed (~40 minutes). A maximum of three
consecutive SFG runs in presence of a potential applied have been accomplished. The
stability of the SAMs during the electrochemical stimulation has previously been
proven by us.1

Chapter 7 Page 215
7.1.6.5 Zeta potential measurement
Measurements of the overall surface charge of the bacterial cells in ASW were
performed with a Malvern Zetasizer 4, using the ZET 5104 cell. The tests were
performed at 25oC and the measurement of each bacterium was repeated 3 times.
7.1.7 Bacterial assays
7.1.7.1 Marine bacterial strains and growth conditions
Cobetia marina ATCC 25374T 385-386 and Marinobacter hydrocarbonoclasticus ATCC
49840T,385-386 (DSMZ, Germany) were revived from the original lyophilate and stored
as frozen stock aliquots in liquid ZoBell medium (5 g of Bacteriological peptone (Oxoid)
and 1 g of yeast extract (Merck) in 800 ml of artificial seawater (ASW) filtrated through
0.22 µm membrane filters (500 ml bottle top filter, Corning Incorporated) and 200 ml of
deionised water) + 20% glycerol at −8 °C. ASW was prepared from Tropical Marin®
marine salt (33.33 g marine salt, 1 l deionised water, pH 8.2). Experimental stock
cultures were maintained on ZoBell Agar Petri dish and were stored at 4˚C for up to 4
weeks. Bacterial pre−cultures were prepared from several Colony Forming Units (CFU)
in ZoBell Agar Petri dish suspended in 25 ml of liquid ZoBell medium for 24 h and 36
h at 18°C with shaking (150 rpm), respectively for C. marina and M.
hydrocarbonoclasticus. Sub−cultures containing 50 ml of liquid ZoBell medium were
prepared from the pre−cultures to obtain an OD600 of 0.1 and were grown for 6 h and
10 h, respectively for C. marina and M. hydrocarbonoclasticus at 18°C with shaking
(150 rpm).

Chapter 7 Page 216
7.1.7.2 Bacterial adhesion by standard method
Bacterial sub−cultures in logarithmic phase were centrifuged (1 min, 8000 rpm), and
the pellets were washed with filtered ASW and centrifuged. The pellets were
re−suspended in filtrated ASW and if necessary diluted with filtrated ASW in order to
obtain an OD600 of 0.1, corresponding to a concentration of 4 x 10⁻⁷ cells/ml. The
concentration of the bacteria was determined by flow cytometer. The bacterial
suspension was then used immediately for bacterial adhesion assays. The SAMs on
gold (three replicates for each SAMs) were placed into individual compartments of
polystyrene 4−compartment plates (‘QuadriPerm’ dishes, Greiner Bio−One Ltd), and
10 ml of bacterial suspension were added to fully immerse the SAMs. An additional
slide was immersed with ASW only for checking possible contamination of ASW. The
dishes were placed on a rotary shaker at room temperature for 1 h at 50 rpm. The
bacterial suspensions were then removed and 10 ml of filtered ASW were added for 1
min at 50 rpm to remove any suspended cells. After the removal of filtrated ASW, 10
ml of a solution of glutaraldehyde at 2.5% in ASW was added for 20 min at room
temperature to fix adhered bacterial cells. SAMs were then rinsed once with 10 ml of
H2O mQ/ASW (v/v) before drying overnight at room temperature. Adhered bacterial
cells were observed by staining with 5 µM SYTO®13 (Invitrogen, Molecular Probes) (λ
excitation and emission: 488 and 509 nm, respectively), and covered with a glass cover
slip (22 x 64 mm, VWR International). Slides were then immediately removed from light
for 10 min, before observation (Figure 133). The density of bacterial cells was
determined using AxioVision 4 image analysis system attached to a Zeiss

Chapter 7 Page 217
epifluorescence microscope and a video camera. A total of 30 fields of view were
counted for each of the three SAM replicates.
Figure 133 Scheme of the protocol followed to perform the standard adhesion assays on SAMs. Bacteria colonies are chosen from a Petri dish and incubated in a rich medium of culture (flask 1) for X hours (depending on the bacteria strain). When they reach the exponential phase (flask 2), they are centrifuged, washed with ASW and resuspended in ASW to obtain an OD600=0.1 (flask 3). Four replicates of each surface were placed in a separate compartment of a Quadriperm dish to which the bacteria suspensions were added. After 60 min, the slides were rinsed with ASW, fixed with glutaraldehyde, coloured with SYTO® 13 and the total bacterial count measured with epifluorescence microscopy.
7.1.7.3 Bacterial adhesion measurements by SPR
All SPR measurements were performed on a Reichert SR7000DC Dual Channel
Spectrometer (Buffalo, NY, USA) at 25 °C. A two−channel flow cell with two
independent parallel flow channels was used to carry out the bioadhesion experiments.
A gold−coated SPR chip, derivatised with SAMs, was deposited on the base of the

Chapter 7 Page 218
prism using index−matching oil. After a baseline signal was established by allowing
degassed ASW to flow at a rate of 100 µL/min through the sensor, a diluted prepared
suspension of bacteria in filtered ASW (OD600=1) was allowed to flow over the surface
for 25 min at a flow rate of 25 µL/min, followed by washing with filtered ASW for 10 min
to remove unbound or loosely attached bacteria.
7.1.7.4 EPS adhesion measurements by SPR
For EPS adhesion assays, a freshly prepared bacterial suspension in ASW (OD600=1)
was filtered through a 0.22 µm membrane filters in order to remove all the bacterial
cells. The procedure was repeated after 10, 20, 60 and 120 min after preparation of
the bacterial suspension. For each time point, OD600 was checked in order to confirm
that it was constant and that cells were not dividing in suspension during the whole
experiment time. The filtrate was allowed to flow over the surface for 25 min at a flow
rate of 25 µL/min, after which, the surface was washed with filtered (0.22 µm) ASW for
10 min to remove unbound or loosely attached EPS components.
7.1.7.5 EPS−bacterial adhesion measurements by SPR
For the EPS adhesion assays followed by bacterial adhesion the EPS
deposition for 25 min at a flow rate of 25 µL/min, (described in 7.1.7.4 but without the
final washing step), was immediately followed by the injection of a freshly prepared
bacterial suspension after which the surface was washed with filtered ASW for 10 min
to remove unbound or weakly attached bacteria.

Chapter 7 Page 219
7.1.7.6 Viability of M. hydrocarbonoclasticus and C. marina at different potentials
applied
Potential studies were performed using a Gamry PCI4/G300 with a custom−designed
Teflon cell, equipped with the functionalised Au substrate as the working electrode
(respectively MUA, MET and MUA−MET SAMs), a Pt wire as the counter electrode,
and a standard calomel electrode (SCE) as the reference electrode. The planar gold
working electrode exposes a circular geometric area of 75.2 mm2 to the bacterial
suspension. Electrical potentials of + 0.25 V and − 0.25 V were applied for 45 min to
the two−component MUA−MET SAMs exposed to the bacterial suspension (M.
hydrocarbonoclasticus in filter−sterilised ASW at OD600nm= 1). Subsequently, the
mixed SAMs were removed from the bacterial suspension, rinsed with
filtered−sterilised ASW for 1 min and then stained with the LIVE/DEAD® stain (mixture
of two nucleic acid stains: green fluorescent SYTO®9 stain (3.34 mM) and
red−fluorescent propidium iodide stain (20 mM)) for 15 min in darkness. Bacterial cells
were observed with a Leica SPE confocal scanning laser microscope (CLSM; 60
objective, λ excitation and emission: 488 and 405 nm, respectively). Micrographs were
acquired using software remote capture with identical exposure parameters and
analysed using Image J 1.40 g (NIH) to obtain composite micrographs for the
visualisation of both dead (in red) and live (in green) bacterial cells. A total of thirty
fields of view were obtained for each of the three SAMs replicate. For each surface the
experiment was performed in triplicate.

Chapter 7 Page 220
7.1.7.7 Bacterial adhesion to MUA−MET SAMs monitored by e−SPR
All SPR experiments were performed with a Reichert SR7000DC dual channel
spectrometer (Buffalo, NY, USA) at 25 °C using a three−electrode electrochemical cell
and a Gamry PCI4/G300 potentiostat. A two channel flow cell with two independent
parallel flow channels was used to perform the bacterial adhesion assays. The
two−component SAMs (MUA−MET SAMs) were prepared on Reichert Au sensor chips
and were deposited on the base of the prism using index matching oil and served as
the working electrode. The counter electrode was a Pt wire, and a SCE was used as
the reference electrode. Prior to the M. hydrocarbonoclasticus (Mh) binding adhesion
assays, the sensor chips were equilibrated with filter−sterilised ASW, followed by
application of either + 0.25 V, − 0.25 V or OC conditions for 10 min while passing
filter−sterilised ASW through the electrochemical cell at a flow rate of 100 µL min − 1.
The flow rate was then reduced to 20 µL min–1 and a suspension of M.
hydrocarbonoclasticus (OD600nm=1) was injected over the sensor chip surface for 25
minutes at a flow rate of 20 µL min – 1 while still applying a potential. In order to remove
any loosely bound bacteria, the sensor chips were washed with filter−sterilised ASW
for 10 minutes while still applying a potential to the surface. After each applied voltage
and rinsing step, sensor chips were removed from the base of the prism to quantify the
number of adhered bacterial cells. Bacterial cells were then fixed with 10 mL of a 2.5%
solution of glutaraldehyde in filter−sterilised ASW for 20 min at room temperature.
Sensor chips were then rinsed once with 10 mL of Milli−Q H2O/ASW (v/v) before being
air−dried at room temperature. Adhered bacterial cells were stained with 5 µM
SYTO®13, and covered with a glass coverslip (22 mm ×22 mm, VWR International).

Chapter 7 Page 221
After 10 min in darkness, the density of bacterial cells was determined using an
AxioVision 4 image analysis system attached to a Zeiss epifluorescence microscope
(40 × objective, λ excitation and emission: 450/490 and 515/565 nm, respectively) and
a video camera. A total of thirty fields of view were obtained and counted for each of
the three replicate sensor chips.

Chapter 8 Page 222
8.0 CHAPTER 8
Conclusions and Future Work
8.1 Conclusions
The work performed in this thesis has described the fabrication and utilisation of two–
component electrically switchable SAMs for controlling bacterial adhesion. The
fabrication of such biological surfaces has provided a platform to explore how bacteria
adhere to adhesive and repellent surfaces during the first stage of bacterial adhesion,
when only non−specific interactions are occurring. In particular, the adhesion of two
marine bacteria, M. hydrocarbonoclasticus and C. marina has been studied. Firstly,
the adhesion preferences of the two bacteria were established via adhesion to six
different one–component SAMs: 16−mercaptohexadecanoic acid (MHA),
1−hexadecanethiol (HDT), 11−aminoundecanethiol hydrochloride (AUT),
11−mercapto−1−undecanol (MUT), (11−mercaptoundecyl)hexa(ethylene glycol)
(EG6−OH), O−(2−carboxyethyl)−O′−(2−mercaptoethyl)heptaethylene glycol
(EG7−COOH). The bacterial attachment was monitored by SPR. Once the most
adhesives (the charged AUT and MHA SAMs) and repellent (the neutral, HDT SAMs)
surfaces were identified a strategy to fabricate a two–component switchable SAM was
defined. An electrically switchable SAM, (MUA–mercaptoethanol (MET) SAM) with the
desired characteristics, (bacteria attracting charges end group and neutral greasy
backbone), was fabricated and characterised. The switching ability of the electrical

Chapter 8 Page 223
switchable surface was proved by using an electro–switchable peptide (biotin–KKKKC)
of which functional groups could be clearly visualised by SFG spectroscopy. Finally,
two–component switchable SAMs were used to control, for the first time, reversible
bacterial adhesion. The role of EPS in influencing the passage between nonspecific
(reversible) and specific (non–reversible) adhesion was also investigated.
Briefly:
Chapter 3 described the adhesion of two marine bacteria, M. hydrocarbonocalsticus
and C. marina, to six different one–component SAMs in order to elucidate the specific
contributions of charge and wettability to bacterial adhesion. SPR was used to monitor,
in real–time, the amount of bacteria adhered to each substrate. When compared to
standard methods, SPR provided insights into the kinetics of adhesion. Both bacteria
were found to adhere preferentially to charged rather than neutral surfaces
(independently from their wettability). Furthermore, SPR was successfully used to
evaluate the effect of EPS on bacterial adhesion. EPS secretion was found to linearly
increase with time. Different one–component SAMs were conditioned with different
amounts of EPS and subsequently challenged with bacterial suspensions. The
experiment was monitored in real−time by SPR. These assays demonstrated that, in
circumstances where the level of conditioning of surfaces by EPS was likely to be
small, it facilitates the initial adhesion of bacteria. On the other hand, greater levels of
conditioning by EPS progressively diminished the influence of the original surface
properties.

Chapter 8 Page 224
Chapter 4 described a strategy to develop a well–spaced two–component switchable
SAM. Such surface was fabricated on the basis of the results obtained in Chapter 3.
Therefore, a switchable surface that could expose, under potential control, either
negatively charged (straight chains with carboxylate anions exposed at the surface) or
hydrophobic moieties (bent chains with greasy alkyl chains exposed at the surface) in
turn, to promote or inhibit bacterial adhesion, was designed. By employing MUA
molecules modified with a dendron end–group we were able to control the space
around individual MUA probe molecules. The hydrolysis of the dendron end group and
the simultaneous chemisorption of a second shorter neutral surfactant (MET) allowed
the formation of the MUA–MET switchable SAM. Full characterisation of the surface
was performed by using different optical and spectroscopic techniques which
confirmed the successful formation of the desired SAM.
Chapter 5 probed the conformational changes of switchable SAMs under electrical
stimulation. A model surface, (biotin–KKKKC:TEGT SAM), previously characterised by
e–SPR was used for this purpose. By studying the orientation of the SFG peaks that
are characteristics for the biotin end–group, we were able to ascertain the structural
orientation of the SAM molecules when exposed either to a positive or negative
potential. The switchable process and its reversibility were assessed by repeatedly
switching between positive and negative surface potentials. Control surfaces made out
of only biotin–KKKKC and TEGT were used to prove the experiment reliability. These
monolayers exhibited no conformational changes upon application of opposite
electrical potentials. The one–component biotin–KKKKC SAM was not able to undergo
conformational changes due to the high level of packing that constrained oligolysine

Chapter 8 Page 225
chains to one extended conformation. On the contrary, when potential changes were
applied to the mixed biotin–KKKKC:TEGT SAM, a change in conformation occurred
owing to the presence of the spacer, TEGT. It presumably allowed both the
folding/stretching of the oligolysine backbones and the biotin end–group facing in
opposite directions at opposite potentials.
Chapter 6 demonstrates the passage in real–time between reversible and non–
reversible non–specific cell attachment using the electrochemical MUA–MET
responsive SAMs. The experiment was carried out by e–SPR and the adhesion of the
bacteria M. hydrocarbonoclasticus and C. marina to the switchable SAMs was found
to be reversible up to 3 times in the first 20 min of adhesion, after which a constant
increasing in bacterial adhesion was observed. The switching ability was found to
progressively decline by increasing the interval between each potential change. When
this interval became 20 minutes the switching performance was completely lost. We
speculated that this decreased ability of switch was due to the increased presence of
EPS in the bacterial suspension and we proved this hypothesis by conditioning the
switchable SAMs with either different concentration of EPS for a fixed amount of time
(20 min) or with the same EPS concentration (EPS T20) for different amounts of time.
The results obtained in these assays clearly showed that surfaces conditioned with
EPS collected after 20 minutes of bacterial suspension ageing time and exposed to
the surface for at least 10 minutes did not switch.

Chapter 8 Page 226
8.2 Future work
The work carried out in this thesis represents the first attempt in controlling bacterial
adhesion and detachment with electrical switchable SAMs. In this thesis, it has been
shown that a fully reversible switching is not achievable due to the difficulties in
controlling both the bacteria and the EPS adhesion at the same time. However,
substantial progresses have been done towards the discrimination of reversible and
non-reversible bacterial adhesion.
In order to overcome the limitations highlighted in this study, it would be of crucial
importance to increase our knowledge on both the bacteria adhesion process and the
switching surface properties.
For this reason, the next stage of this project is to investigate cell adhesion and
detachment of other bacterial types by using the switchable SAMs presented in this
research. For instance, it would be interesting to monitor the reversible bacterial
adhesion of Gram positive bacteria and evaluate the similarities/differences between
these bacteria and the bacteria studied herein.
Furthermore, the possibility to reversibly control bacterial interaction would be of crucial
interest in the biomedical field, and thus, the use of bacteria commonly responsible for
implant rejection and infection could be investigated.
The switchable SAMs presented in this thesis could also be modified with a positively
charged end group (i.e. NH3+) and similar studies to those carried out in this work could
be performed.
In addition to the proposed follow up, the switchable SAMs could be used to monitor
gene expression in adherent and non–adherent cells. Compared to traditional

Chapter 8 Page 227
techniques, the switchable platform could simultaneously attract and release the same
cell during the first stages of bacterial adhesion. This capability would allow
investigating which adhesion proteins complexes are activated and which gene are
expressed during the reversible cell attachment.
Lastly, the verified possibility to monitor the surface changes in real–time indirectly (by
e–SPR) but also directly (by e–SFG) should encourage the fabrication of more
complex tailored switchable systems capable of mimicking the dynamic properties of
biological systems.

Chapter 9 Page 228
9.0 REFERENCES
1. Callow, M. E.; Callow, J. A., Biologist 2002, 49, 10. 2. Rosenhahn A.; Ederth T.; Pettitt M. E., Biointerphases 2008, 3, 1. 3. An, Y. H.; Friedman, R. J., J Biomed Mater Res 1998, 43, 338. 4. Anselme, K.; Davidson, P.; Popa, A. M.; Giazzon, M.; Liley, M.; Ploux, L., Acta Biomater 2010, 6, 3824. 5. Barth, K. A.; Coullerez, G.; Nilsson, L. M.; Castelli, R.; Seeberger, P. H.; Vogel, V.; Textor, M., Adv Funct Mater 2008, 18, 1459. 6. Dunne, W. M., Clin Microbiol Rev 2002, 15, 155. 7. O'Toole, G. A.; Stewart, P. S., Nat Biotechnol 2005, 23, 1378. 8. An, Y. H.; Friedman, R. J., J Biomed Mater Res (Appl Biomater) 1998, 43, 338. 9. Busscher, H. J.; Norde, W.; Van der Mei, H. C., Appl Environ Microb 2008, 74, 2559. 10. Loosdrecht, V.; Lyklema, J.; Norde, W.; Schraa, G.; Zehnder, A., Appl Environ Microbiol 1987, 53, 1898. 11. Breur, R. Fouling and Bioprotection of Metals: Monitoring and control of deposition processes in aqueous environment. Technical University Delft, The Netherlands, 2001. 12. Flemming, H. C.; Wingender, J., Water Sci Technol 2001, 43, 1. 13. Hori, K.; Matsumoto, S., Biochem Eng J 2010, 48, 424. 14. Hiemenz, P. C.; Rajagopalan, R., Principles of colloid and surface chemistry. New York, 1997. 15. Vilinska, A.; Hanumantha Rao, K., Miner Metall Proc 2011, 28, 151. 16. Van Oss, C. J., Colloid Surface B 2007, 54, 2. 17. Harkes, G.; Feijen, J.; Dankert, J., Biomaterials 1991, 12, 853. 18. Hermansson, M., Colloid Surface B 1999, 14, 105. 19. Nikaido, H.; Vaara, M., Microbiol Rev 1985, 49, 1. 20. Vengadesan, K.; Narayana, S. V. L., Protein Sci 2011, 20, 759. 21. Zav'yalov, V.; Zavialov, A.; Zav'yalova, G.; Korpela, T., Fems Microbiol Rev 2010, 34, 317. 22. Krishnan, V.; Narayana, S. V. L., Crystallography of Gram-Positive Bacterial Adhesins. In Bacterial Adhesion: Chemistry, Biology and Physics, Linke, D.; Goldman, A., Eds. 2011; Vol. 715, pp 175. 23. Gerlach, R. G.; Hensel, M., Int J Med Microbiol 2007, 297, 401. 24. Tormo, M. A.; Knecht, E.; Gotz, F.; Lasa, M.; Penades, J. R., Microbiol-Sgm 2005, 151, 2465. 25. Chapman, R. G.; Ostuni, E.; Liang, M. N.; Meluleni, G.; Kim, E.; Yan, L.; Pier, G.; Warren, H. S.; Whitesides, G. M., Langmuir 2001, 17, 1225. 26. Van Loosdrecht, M. C. M.; Lyklema, J.; Norde, W.; Schraa, G.; Zehnder, A. J. B., Appl Environ Microb 1987, 53, 1893. 27. Lichter, J. A.; Thompson, M. T.; Delgadillo, M.; Nishikawa, T.; Rubner, M. F.; Van Vliet, K. J., Biomacromolecules 2008, 9, 1571.

Chapter 9 Page 229
28. Rosenhahn, A.; Schilp, S.; Kreuzer, H. J.; Grunze, M., Phys Chem Chem Phys 2010, 12, 4275. 29. Sheng, G. P.; Yu, H. Q.; Li, X. Y., Biotechnol Adv 2010, 28, 882. 30. van der Aa, B. C.; Dufrene, Y. F., Colloid Surface B 2002, 23, 173. 31. Ofek, I.; Doyle, R. J., Bacterial Adhesion To Cells And Tissues. Chapman & Hall: New York, 1994. 32. Donlan, R. M., Emerg Infect Dis 2002, 8, 881. 33. Vu, B.; Chen, M.; Crawford, R. J.; Ivanova, E. P., Molecules 2009, 14, 2535. 34. WIencek K. M.; Fletcher M., J Bacteriol 1995, 177, 1959. 35. Newman, C. R.; Frisbie, D.; da Silva Filho, D. A.; Brédas, J. L.; Ewbank, P. C.; Mann, K. R., Chem Mater 2004, 16, 4436. 36. Lima, S. C.; Kima, S. H.; Chua, H. Y.; Leea, J. H.; Leea, J. I.; Oha, J. Y.; Kimb, D., Synthetic Met 2005, 151, 3197. 37. C. Yu; T. Lei; Liao, J.; , J. Y.; J. Ho, J Display Technol 2009, 5, 198. 38. Ostuni, E.; Whitesides, G. M.; Ingber, D. E.; Chen, C. S., Methods Mol Biol 2009, 522, 183. 39. Ulman, A., Chem Rev 1996, 96, 1533. 40. Davis, F.; Higson, S. P. J., Biosens Bioelectron 2005, 21, 1. 41. Ulman, A., An introduction to ultrathin organic films - from langmuir-blodgett to self-assembly 1991; Vol. 354, p 120. 42. Bigelow, W. C.; Pickett, D. L.; Zisman, W. A., J Colloid Sci 1946, 1, 513. 43. Sagiv, J., J Am Chem Soc 1980, 102, 92. 44. Nuzzo, R. G.; Allara, D. L., J Am Chem Soc 1983, 105, 4481. 45. Lee, S. H.; Ishizaki, T.; Saito, N.; Takai, O., Appl Surf Sci 2008, 254, 7453. 46. Mendes, P. M.; Belloni, M.; Ashworth, M.; Hardy, C.; Nikitin, K.; Fitzmaurice, D.; Critchley, K.; Evans, S.; Preece, J. A., Chemphyschem 2003, 4, 884. 47. Basch, H.; Ratner, M. A., J Chem Phys 2004, 120, 5771. 48. Tillman, N.; Ulman, A.; Schildkraut, J. S.; Renner, T. L., J Am Chem Soc 1988, 110, 6136. 49. Wang, Q.; Geil, P.; Padua, G., J Polym Environ 2004, 12, 197. 50. Bowlin, G. L., Encyclopedia of Biomaterials and Biomedical Engineering,. Second Edition ed.; 2008. 51. Lahann, J.; Mitragotri, S.; Tran, T. N.; Kaido, H.; Sundaram, J.; Choi, I. S.; Hoffer, S.; Somorjai, G. A.; Langer, R., Science 2003, 299, 371. 52. Love, J. C.; Estroff, L. A.; Kriebel, J. K.; Nuzzo, R. G.; Whitesides, G. M., Chem Rev 2005, 105, 1103. 53. Iqbal, P.; Critchley, K.; Attwood, D.; Tunnicliffe, D.; Evans, S. D.; Preece, J. A., Langmuir 2008, 24, 13969. 54. Laibiris, P. E.; Whiteside, G. M., J Am Chem Soc 1992, 114, 9022. 55. Beulen, M. W. J.; Huisman, B. H.; Van der Heijden, P. A.; Van Veggel, F. C. M.; Simons, M. G.; Biemond, M. E. F.; De Lange, P. J.; Reihoudt, D. N., Langmuir 1996, 12, 6170. 56. Chen, C. S.; Hutchison, J. E.; Postlethwaite, T. A.; Richardson, J. N.; Murray, R. W., Langmuir 1994, 10, 3332. 57. Li, M.; Dai, M.; Chabal, Y. J., Langmuir 2009, 25, 1911. 58. Hillebrandt, H.; Tanaka, M., J Phys Chem B 2001, 105, 4270. 59. Mrksich, M., Chem Soc Rev 2000, 29, 267.

Chapter 9 Page 230
60. Onclin, S.; Ravoo, B. J.; Reinhoudt, D. N., Angew Chem Int Ed 2005, 44, 6282. 61. Schreiber, F., J Phys: Condens Matter 2004, 16, R881. 62. Kondoh, H.; Kondama, C.; Sumida, H.; Nozoye, H., J Chem Phys 1999, 111, 1175. 63. Hara, M.; Tamada, K.; Hahn, C.; Nishida, N.; Knoll, W., Supramol Sci 1996, 3, 103. 64. Cometto, F. P.; Paredes-Olivera, P.; Macagno, V. A.; Patrito, E. M., J Phys Chem B 2005, 109, 21737. 65. Kankate, L.; Turchanin, A.; Golzhauser, A., Langmuir 2009, 25, 10435. 66. Rhodesia, C. L.; Brewera, S. H.; Folmera, J.; Franzen, S., Thin Solid Film 2006, 516, 1838. 67. Zuo, X. L.; Song, S. P.; Zhang, J.; Pan, D.; Wang, L. H.; Fan, C. H., J Am Chem Soc 2007, 129, 1042. 68. Bowen, J.; Pettitt, M. E.; Kendall, K.; Leggett, G. J.; Preece, J. A.; Callow, M. E.; Callow, J. A., J R Soc Interface 2007, 4, 473. 69. Munuera, C.; Barrena, E.; Ocal, C., Langmuir 2005, 21, 8270. 70. Nuzzo, R. G.; R., Z. B.; Dubois, H., J Am Chem Soc 1987, 109, 733. 71. Schreiber, F., Prog Surf Sci 2000, 65, 151. 72. Wollman, E. W.; Frisbie, C. D.; Wrighton, M. S., Langmuir 1993, 9, 1517. 73. Lopez, G. P.; Biebuyck, H. A.; Whitesides, G. M., Langmuir 1996, 10, 1498. 74. Gillen, G.; Wright, S.; Bennett, J.; Tarlov, M. J., Appl Phys Lett 1994, 65, 534. 75. Tan, J. L.; Tien, J.; Chen, C. S., Langmuir 2002, 18, 519. 76. Bain, C. D.; Troughton, E. B.; Tao, Y. T.; Evall, J.; Whitesides, G. M.; Nuzzo, R. G., J Am Chem Soc 1989, 111, 321. 77. Xinga, Y. F.; Lia, S. F. Y.; Laub, A. K. H.; O’Sheab, S. J., J Electroanal Chem 2005, 583, 124. 78. Jang, Y. H.; Jang, S. S.; Goddard, W. A., J Am Chem Soc 2005, 127, 4959. 79. Wenz, G.; Han, B. H.; Muller, A., Chem Rev 2006, 106, 782. 80. Diederich, F.; Echegoyen, L.; Lopez, M. G.; Kessinger, R.; Stoddart, J. F., J Chem Soc 1999, 2, 1577. 81. Hong, B. J.; Shim, J. Y.; Oh, S. J.; Park, J. W., Langmuir 2003, 19, 2357. 82. Tokuhisa, H.; Liu, J.; Omori, K.; Kanesato, M.; Hiratani, K.; Baker, L. A., Langmuir 2009, 25, 1633. 83. Cobet, A. B.; Wirsen, C. J.; Jones, G. E., J Gen Microbiol 1970, 62, 159. 84. Gauthier, M. J.; Lafay, B.; Christen, R.; Fernandez, L.; Acquaviva, M.; Bonin, P.; Bertrand, J.-C., Int J Syst Evol Microbiol 1992, 42, 568. 85. Akesso, L.; Pettitt, M. E.; Callow, J. A.; Callow, M. E.; Stallard, J.; Teer, D.; Liu, C.; Wang, S.; Zhao, Q.; D'Souza, F.; Willemsen, P. R.; Donnelly, G. T.; Donik, C.; Kocijan, A.; Jenko, M.; Jones, L. A.; Guinaldo, P. C., Biofouling 2009, 25, 55. 86. Shea, C.; Nunley, J. W.; Williamson, J. C.; Smithsomerville, H. E., Appl Environ Microbiol 1991, 57, 3107. 87. Bhaskar, P. V.; Grossart, H. P.; Bhosle, N. B.; Simon, M., Fems Microbiol Ecol 2005, 53, 255. 88. Klein, B.; Grossi, V.; Bouriat, P.; Goulas, P.; Grimaud, R., Research in Microbiology 2008, 159, 137. 89. Miller, M. B.; Bassler, B. L., Annu Rev Microbiol 2001, 55, 165.
Chapter 9 Page 231
90. Yarwood, J. M.; Bartels, D. J.; Volper, E. M.; Greenberg, E. P., J Bacteriol 2004, 186, 1838. 91. Kingshott, P.; Thissen, H.; Griesser, H. J., Biomaterials 2002, 23, 2043. 92. Nejadnik, M. R.; van der Mei, H. C.; Norde, W.; Busscher, H. J., Biomaterials 2008, 29, 4117. 93. Bridges, A. W.; Singh, N.; Burns, K. L.; Babensee, J. E.; Lyon, L. A.; Garcia, A. J., Biomaterials 2008, 29, 4605. 94. Degennes, P. G., Adv Colloid Interfac 1987, 27, 189. 95. Harder, P.; Grunze, M.; Dahint, R.; Whitesides, G. M.; Laibinis, P. E., J Phys Chem B 1998, 102, 426. 96. Ostuni, E.; Chapman, R. G.; Holmlin, R. E.; Takayama, S.; Whitesides, G. M., Langmuir 2001, 17, 5605. 97. Pertsin, A. J.; Grunze, M., Langmuir 2000, 16, 8829. 98. Harder, P.; Grunze, M.; Dahint, R.; Whitesides, G. M.; Laibinis, P. E., J Phys Chem B 1998, 102. 99. Bruinsma, G. M.; van der Mei, H. C.; Busscher, H. J., Biomaterials 2001, 22, 3217. 100. Cerca, N.; Pier, G. B.; Vilanova, M.; Oliveira, R.; Azeredo, J., Res Microbiol 2005, 156, 506. 101. Boks, N. P.; Kaper, H. J.; Norde, W.; van der Mei, H. C.; Busscher, H. J., J Colloid Interf Sci 2009, 331, 60. 102. Wiencek, K. M.; Fletcher., M., Biofouling 1997, 11, 293. 103. Gallardo-Moreno, A. M.; Navarro-Pérez, M. L.; Vadillo-Rodriguez, V.; Bruque, J. M.; Gonzélez-Martin, M. L., Colloid Surface B 2011, 88, 373. 104. Gottenbos, B.; van der Mei, H. C.; Busscher, H. J., Models for studying initial adhesion and surface growth in biofilm formation on surfaces. Academic Press: 1999; Vol. 310, p 523. 105. Gottenbos, B.; Grijpma, D. W.; Van der Mei, H. C.; Feijen, J.; Busscher, H. J., J Antimicrob Chemoth 2001, 48, 7. 106. Ista, L. K.; Fan, H. Y.; Baca, O.; Lopez, G. P., Fems Microbiol Lett 1996, 142, 59. 107. Arpa-Sancet, M. P.; Christophis, C.; Rosenhahn, A., Biointerphases 2012, 7, 1. 108. Ista, L. K.; Callow, M. E.; Finlay, J. A.; Coleman, S. E.; Nolasco, A. C.; Simons, R. H.; Callow, J. A.; Lopez, G. P., Appl Environ Microbiol 2004, 70, 4151. 109. Cordeiro, A. L.; Nitschke, M.; Janke, A.; Helbig, R.; D'Souza, F.; Donnelly, G. T.; Willemsen, P. R.; Werner, C., Express Polym Lett 2009, 3, 70. 110. Ederth, T.; Ekblad, T.; Pettitt, M. E.; Conlan, S. L.; Du, C. X.; Callow, M. E.; Callow, J. A.; Mutton, R.; Clare, A. S.; D'Souza, F.; Donnelly, G.; Bruin, A.; Willemsen, P. R.; Su, X. J. J.; Wang, S.; Zhao, Q.; Hederos, M.; Konradsson, P.; Liedberg, B., ACS Appl Mater Interfaces 2011, 3, 3890. 111. Bakker, D. P.; Huijs, F. M.; de Vries, J.; Klijnstra, J. W.; Busscher, H. J.; van der Mei, H. C., Colloid Surface B 2003, 32, 179. 112. Terada, A.; Yuasa, A.; Kushimoto, T.; Tsuneda, S.; Katakai, A.; Tamada, M., Microbiology 2006, 152, 3575. 113. Diaz, C.; Salvarezza, R. C.; Fernandez Lorenzo de Mele, M. A.; Schilardi, P. L., ACS Appl Mater Interfaces 2010, 2. 114. Van der Mei, H. C.; Busscher, H. J., Appl Environ Microbiol 2001, 67, 491.

Chapter 9 Page 232
115. Komaromy, A.; Boysen, R. I.; Zhang, H.; McKinnon, I.; Fulga, F.; Hearn, M. T. W.; Nicolau, D. V., Microelectron Eng 2009, 86, 1431. 116. Wilson, M. D.; Whitesides, G. M., J Am Chem Soc 1988, 110, 8718. 117. Zhao, B.; Brittain, W. J.; Zhou, W. S.; Cheng, S. Z. D., J Am Chem Soc 2000, 122, 2407. 118. Julthongpiput, D.; Lin, Y. H.; Teng, J.; Zubarev, E. R.; Tsukruk, V. V., J Am Chem Soc 2003, 125, 15912. 119. Julthongpiput, D.; Lin, Y. H.; Teng, J.; Zubarev, E. R.; Tsukruk, V. V., Langmuir 2003, 19, 7832. 120. Motornov, M.; Minko, S.; Eichhorn, K. J.; Nitschke, M.; Simon, F.; Stamm, M., Langmuir 2003, 19, 8077. 121. Takei, Y. G.; Aoki, T.; Sanui, K.; Ogata, N.; Sakurai, Y.; Okano, T., Macromolecules 1994, 27, 6163. 122. Crevoisier, G. B.; Fabre, P.; Corpart, J. M.; Leibler, L., Science 1999, 285, 1246. 123. Sun, T. L.; Wang, G. J.; Feng, L.; Liu, B. Q.; Ma, Y. M.; Jiang, L.; Zhu, D. B., Angew Chem Int Ed 2004, 43, 357. 124. Abbott, N. L.; Whitesides, G. M., Langmuir 1994, 10, 1493. 125. Sondaghuethorst, J. A. M.; Fokkink, L. G. J., Langmuir 1994, 10, 4380. 126. Wang, X. M.; Kharitonov, A. B.; Katz, E.; Willner, I., Chem Commun 2003, 1542. 127. Katz, E.; Lioubashevsky, O.; Willner, I., J Am Chem Soc 2004, 126, 15520. 128. Ichimura, K.; Oh, S. K.; Nakagawa, M., Science 2000, 288, 1624. 129. Feng, C. L.; Jin, J.; Zhang, Y. J.; Song, Y. L.; Xie, L. Y.; Qu, G. R.; Xu, Y.; Jiang, L., Surf Interf Anal 2001, 32, 121. 130. Feng, C. L.; Zhang, Y. J.; Jin, J.; Song, Y. L.; Xie, L. Y.; Qu, G. R.; Jiang, L.; Zhu, D. B., Langmuir 2001, 17, 4593. 131. Raduge, C.; Papastavrou, G.; Kurth, D. G.; Motschmann, H., Eur Phys J E 2003, 10, 103. 132. Cooper, C. G. F.; MacDonald, J. C.; Soto, E.; McGimpsey, W. G., J Am Chem Soc 2004, 126, 1032. 133. Hamelmamm, F.; Heinzmann, U.; Siemling, U.; Bretthauer, F.; der Bruggen, J. V., Appl Surf Sci 2004, 222, 1. 134. Rosario, R.; Gust, D.; Garcia, A. A.; Hayes, M.; Taraci, J. L.; Clement, T.; Dailey, J. W.; Picraux, S. T., J Phys Chem B 2004, 108, 12640. 135. Berna, J.; Leigh, D. A.; Lubomska, M.; Mendoza, S. M.; Perez, E. M.; Rudolf, P.; Teobaldi, G.; Zerbetto, F., Nat Mater 2005, 4, 704. 136. Delorme, N.; Bardeau, J. F.; Bulou, A.; Poncin-Epaillard, F., Langmuir 2005, 21, 12278. 137. Jiang, W. H.; Wang, G. J.; He, Y. N.; Wang, X. G.; An, Y. L.; Song, Y. L.; Jiang, L., Chem Commun 2005, 3550. 138. Lake, N.; Ralston, J.; Reynolds, G., Langmuir 2005, 21, 11922. 139. Gerard, M.; Chaubey, A.; Malhotra, B. D., Biosens Bioelectron 2002, 17, 345. 140. Yin, B. C.; Guan, Y. M.; Ye, B. C., Chem Commun 2012, 48, 4208. 141. Popat, A.; Liu, J.; Lu, G. Q.; Qiao, S. Z., J Mater Chem 2012, 22, 11173. 142. Cheng, Y.; Luo, X. L.; Tsao, C. Y.; Wu, H. C.; Betz, J.; Payne, G. F.; Bentley, W. E.; Rubloff, G. W., Lab Chip 2011, 11, 2316. 143. Ebara, M.; Hoffman, J. M.; Hoffman, A. S.; Stayton, P. S., Lab Chip 2006, 6, 843.

Chapter 9 Page 233
144. Nagase, K.; Kobayashi, J.; Kikuchi, A. I.; Akiyama, Y.; Kanazawa, H.; Okano, T., Langmuir 2008, 24, 511. 145. Ng, C. C. A.; Magenau, A.; Ngalim, S. H.; Ciampi, S.; Chockalingham, M.; Harper, J. B.; Gaus, K.; Gooding, J. J., Angew Chem Int Ed 2012, 51, 1. 146. Pranzetti, A.; Salaün, S.; Mieszkin, S.; Callow, M. E.; Callow, J. A.; Preece, J. A.; Mendes, P. M., Adv Funct Mater 2012, 22, 3672. 147. Takahashi, H.; Matsuzaka, N.; Nakayama, M.; Kikuchi, A.; Yamato, M.; Okano, T., Biomacromolecules 2012, 13, 253. 148. Inaba, R.; Khademhosseini, A.; Suzuki, H.; Fukuda, J., Biomaterials 2009, 30, 3573. 149. Yeung, C. L.; Iqbal, P.; Allan, M.; Lashkor, M.; Preece, J. A.; Mendes, P. M., Adv Funct Mater 2010, 20, 2657. 150. Todd, S. J.; Scurr, D. J.; Gough, J. E.; Alexander, M. R.; Ulijn, R. V., Langmuir 2009, 25, 7533. 151. Huang, R.; Mah, K. Z.; Malta, M.; Kostanski, L. K.; Filipe, C. D. M.; Ghosh, R., J Memb Sci 2009, 345, 177. 152. Laloyaux, X.; Fautre, E.; Blin, T.; Purohit, V.; Leprince, J.; Jouenne, T.; Jonas, A. M.; Glinel, K., Adv Mater 2010, 22, 5024. 153. Cole , M. A.; Voelcker, N. H.; Thissen, H.; Griesser, H. J., Biomaterials 2009, 30, 1827. 154. Göpel, W.; Heiduschka, P., Biosens Bioelectron 1995, 10, 853. 155. Kim, K.; Yang, H.; Jon, S.; Kim, E.; Kwak, J., J Am Chem Soc 2004, 126, 15368. 156. Mendes, P. M., Chem Soc Rev 2008, 37, 2512. 157. Yousaf, M. N.; Houseman, B. T.; Mrksich, M., Angew Chem Int Ed 2001, 40, 1093. 158. Yeo, W. S.; Hodneland, C. D.; Mrksich, M., Chem Bio Chem 2001, 2, 590. 159. Yousaf, M. N.; Houseman, B. T.; Mrksich, M., Proc Natl Acad Sci USA 2001, 98, 5992. 160. Yeo, W. S.; Yousaf, M. N.; Mrksich, M., J Am Chem Soc 2003, 125, 14994. 161. Yeo, W. S.; Mrksich, M., Langmuir 2006, 22, 10816. 162. Chan, E. W. L.; Yousaf, M. N., J Am Chem Soc 2006, 128, 15542. 163. Lee, C. S.; Baker, S. E.; Marcus, M. S.; Yang, W. S.; Eriksson, M. A.; Hamers, R. J., Nano Lett 2004, 4, 1713. 164. Curreli, M.; Li, C.; Sun, Y. H.; Lei, B.; Gundersen, M. A.; Thompson, M. E.; Zhou, C. W., J Am Chem Soc 2005, 127, 6922. 165. Yang, W. S.; Baker, S. E.; Butler, J. E.; Lee, C. S.; Russell, J. N.; Shang, L.; Sun, B.; Hamers, R. J., Chem Mater 2005, 17, 938. 166. Mendes, P. M.; Christman, K. L.; Parthasarathy, P.; Schopf, E.; Ouyang, J.; Yang, Y.; Preece, J. A.; Maynard, H. D.; Y., C.; Stoddart, J. F., Bioconjugate Chem 2007, 18, 1919. 167. Knezevic, J.; Langer, A.; Hampel, P. A.; Kaiser, W.; Strasser, R.; Rant, U., J Am Chem Soc 2012, 19, 15225. 168. Liu, Y.; Mu, L.; Liu, B. H.; Zhang, S.; Yang, P. Y.; Kong, J. L., Chem Commun 2004, 1194. 169. Mu, L.; Liu, Y.; Cai, S. Y.; Kong, J. L., Chem-Eur J 2007, 13, 5113. 170. Josephs, E. A.; Ye, T., J Am Chem Soc 2012, 134, 10021.

Chapter 9 Page 234
171. Ho Kim, D.; Lee, H.; Lee, Y. K.; Nam, J. M.; Levchenko, A., Adv Mater 2010, 22, 4551. 172. Bonn, D.; Eggers, J.; Indekeu, J.; Meunier, J.; Rolley, E., Rev Mod Phys 2009, 81, 739. 173. Feng, B.; Weng, J.; Yang, B. C.; Qu, S. X.; Zhang, X. D., Biomaterials 2003, 24, 4663. 174. Chen W.; F. A. Y.; Hsieh M C.; Oner D.; Youngblood J., Langmuir 1999, 15, 3395. 175. Zhang, W.; Wahlgren, M.; Sivik, B., Desalination 1989, 72, 263. 176. Bezuglyi, B. A.; Tarasov, O. A.; Fedorets, A. A., Colloid J 2001, 63, 668. 177. Grimoldi, E.; Zanini, S.; Siliprandi, R. A.; Riccardi, C., Eur Phys JD 2009, 54, 165. 178. Boguslavsky, Y.; Fadida, T.; Talyosef, Y.; Lellouche, J. P., J Mater Chem 2011, 21, 10304. 179. Siegbahn, K.; Nordling, C.; Fahalman, A.; Nordberg, R.; Hamrin, K.; Hedman, J.; Johansson, J.; Bergmark, T.; Karllson, S. E.; Lindgren, I.; Lindberg, B., ESCA-Atomic molecular and Solid State Structure Studied by Means of Electron Spectroscopy. Nova Acta Regiae Soc.Sci.: Uppsala, 1967; Vol. 20. 180. Seah, M. P., Vacuum 1984, 34, 463. 181. Moulder, J. F.; Stickle, W. F.; Sobol, P. E.; Bomben, K. D., Handbook of X-ray Photoelectron Spectroscopy. Physical Electronics: USA, 1995. 182. Moulder, J., Handbook of X-ray Photoelectron Spectroscopy. 1992. 183. Seah, M. P., Vacuum 1984, 34, 463. 184. Huang, J.; Hemminger, J. C., J Am Chem Soc 1993, 115, 3342. 185. Moulder, J. F.; Stickle, W. F.; Sobol, P. E.; Bomben, K. D., Handbook of X-Ray Photoelectron Spectroscopy: A Reference Book of Standard Spectra for Identification and References. Minnesota, 1972. 186. Benito, N.; Galindo, R. E.; Rubio-Zuazo, J.; Castro, G. R.; Palacio, C., J Phys D Appl Phys 2013, 46, 65310. 187. Perruchot C.; Lowe C.; White, R. G.; Cumpson P. J., Surf Interface Anal 2002, 33, 869. 188. Mirabella, F. M., Principles, Theory, and Practice of Internal Reflection Spectroscopy. New York, 1993. 189. Coates, J. P., Appl Spectroscop Rev 1996, 31, 179. 190. Schmid, L. S., Spectroscopy 2009, 24, 38. 191. Smith, B., Fundamentals of Fourier Transform Infrared Spectroscopy. FL CRC Press: Boca Raton (FL), USA, 1996. 192. Griffiths, P.; Haseth, J. A., Fourier Transform Infrared Spectroscopy. Wiley: NJ, 2007. 193. Newport Corporation Introduction to FTIR Spectroscopy. (accessed 08 August). 194. Hoffmann, D., Ann Phys 2006, 15, 449 195. Theeten, J. B.; Aspnes, D. E., Annu Rev Mater Sci 1981, 11, 97. 196. Goncalves, D.; Irene, E. A., Quimica Nova 2002, 25, 794. 197. Schubert, M., Thin Solid Films 1998, 313, 323. 198. Schubert, M., Annalen Der Physik 2006, 15, 480. 199. Wood, R. W., Philos Mag 1902, 4, 396. 200. Wood, R. W., Philos Mag 1912, 23, 310.

Chapter 9 Page 235
201. Otto, A., Z Phys 1968, 216, 398. 202. Kretschmann, E., Z Phys 1971, 241, 313. 203. Kretschmann, E.; Raether, H., Z Naturforsch A 1968, 23, 2135. 204. Frutos, A. G.; Corn, R. M., Anal Chem 1998, 70, 449A. 205. Patskovsky, S.; Jacquemart, R.; Meunier, M.; De Crescenzo, G.; Kabashin, A. V., Sensor Actuat B-Chem 2008, 133, 628. 206. Liedberg, B.; Nylander, C.; Lundströöm, I., Sensor Actuator 1983, 4, 299. 207. Homola, J., Surface plasmon resonance based sensors. In Springer Series on Chemical Sensors and Biosensors. Berlin, 2006; Vol. 4. 208. Cooper, M. A., Nat Rev Drug Discov 2002, 1, 515. 209. Michaelis, S.; Wegener, J.; Robelek, R., Biosens Bioelectron 2013, 49, 63. 210. Tawil, N.; Mouawad, F.; Levesque, S.; Sacher, E.; Mandeville, R.; Meunier, M., Biosens Bioelectron 2013, 49, 334. 211. Hide, M.; Tsutsui, T.; Sato, H.; Nishimura, T.; Morimoto, K.; Yamamoto, S.; Yoshizato, K., Anal Biochem 2002, 302, 28. 212. Chabot, V.; Cuerrier, C. M.; Escher, E.; Aimez, V.; Grandbois, M.; Charette, P. G., Biosens Bioelectron 2009, 24, 1667. 213. Chen, W. T.; Singer, S. J., J Cell Biol 1982, 95, 205. 214. Mizuguchi, T.; Uchimura, H.; Kataoka, H.; Akaji, K.; Kiso, Y.; Saito, K., Anal Biochem 2012, 420, 185. 215. Shen, Y., Nature 1989, 337, 519. 216. Vidal, F.; Tadjeddine, A., Rep Prog Phys 2005, 68, 1095. 217. Fu, L.; Wang, Z. G.; Yan, E. C. Y., Int J Mol Sci 2011, 12, 9404. 218. Reiser, K. M.; McCourt, A. B.; Yankelevich, D. R.; Knoesen, A., Biophys J 2012, 103, 2177. 219. Leng, C.; Liu, Y. W.; Jenkins, C.; Meredith, H.; Wilker, J. J.; Chen, Z., Langmuir 2013, 29, 6659. 220. Chen X; Wang J; Sniadecki JJ; Even MA; Z, C., Langmuir 2005, 21, 2662. 221. Howell, C.; Hamoudi, H.; Heissler, S.; Koelsch, P.; Zharnikov, M., Chem Phys Lett 2011, 513, 267. 222. Howell, C.; Maul, R.; Wenzel, W.; Koelsch, P., Chem Phys Lett 2010, 494, 193. 223. Segawa, H.; Okuno, M.; Kano, H.; Leproux, P.; Couderc, V.; Hamaguchi, H., Opt Express 2012, 20, 9551. 224. Brett, C. M. A.; Fisher, A. C.; Compton, R. G., J electroanal chem 1992, 334, 57. 225. Fisher, A. C., Electrode dynamics Oxford, 1996. 226. Nahir, T. M.; Clark, R. A.; Bowden, E. F., Abstr Pap Am Chem S 1994, 208, 189. 227. Millar, J.; Stamford, J. A.; Kruk, Z. L.; Wightman, R. M., Eur J Pharmacol 1985, 109, 341. 228. Hirata, N.; Shibuta, M.; Eguchi, T.; Nakajima, A., Chem Phys Lett 2013, 561, 131. 229. Trammell, S. A.; Moore, M.; Schull, T. L.; Lebedev, N., J Electroanal Chem 2009, 628, 125. 230. Reese, S.; Fox, M. A., J Phys Chem B 1998, 102, 9820. 231. Luo, M. X.; Frechette, J., J Phys Chem C 2010, 114, 20167. 232. Lee, L. Y. S.; Lennox, R. B., Phys Chem Chem Phys 2007, 9, 1013.

Chapter 9 Page 236
233. von Helmholtz, H. L. F., Ann Physik 1879, 7, 337. 234. de Levie, R., J Electroanal Chem 1990, 278, 17. 235. Chapman, D. L., Phil Mag 1913, 25, 475. 236. Stern, O., Electrochem 1924, 30, 508. 237. Grahame, D. C., Chem Rev 1947, 41, 441. 238. Ghiran, I. C., Methods Mol Biol 2011, 689, 93. 239. Lichtman, J. W.; Conchello, J. A., Nat Methods 2005, 2, 910. 240. Wolf, D. E., Fundamentals of Fluorescence and Fluorescence Microscopy. In Digital Microscopy, 4th Edition, Sluder, G.; Wolf, D. E., Eds. 2013; Vol. 114, pp 69. 241. Heaton, N. S.; Leyva-Grado, V. H.; Tan, G. S.; Eggink, D.; Hai, R.; Palese, P., J Virol 2013, 87, 8272. 242. Kerppola, T. K., Chem Soc Rev 2009, 38, 2876. 243. Larrosa, M.; Truchado, P.; Espin, J. C.; Tomas-Barberan, F. A.; Allende, A.; Garcia-Conesa, M. T., Mol Cell Probe 2012, 26, 121. 244. Minsky, M., Scanning 1988, 10, 128. 245. Paddock, S. W., Mol Biotechnol 2000, 16, 127. 246. Pace, J. L.; Rupp, M.; Finch, R. G., Biofilms, Infection, and Antimicrobial Therapy. CRC Press, Taylor & Francis Group: Boca Raton, Florida, 2005. 247. Bryers, J. D., Colloid Surface B 1994, 2, 9. 248. Ofek, I.; Courtney, H. S.; Schifferli, D. M.; Beachey, E. H., J Clin Microbiol 1986, 24, 512. 249. Tuomola, E. M.; Salminen, S. J., Int J Food Microbiol 1998, 41, 45. 250. Gristina, A. G.; Jennings, R. A.; Naylor, P. T.; Myrvik, Q. N.; Webb, L. X., Antimicrob Agents Chemother 1989, 33, 813. 251. D'Souza, F.; Bruin, A.; Biersteker, R.; Donnelly, G.; Klijnstra, J.; Rentrop, C.; Willemsen, P., J Ind Microbiol Biotechnol 2009, 9, 681. 252. Durtschi, J. D.; Erali, M.; Bromley, L. K.; Herrmann, M. G.; Petti, C. A.; Smith, R. E.; Voelkerding, K. V., J Med Microbiol 2005, 54, 843. 253. Stafslien, S.; Daniels, J.; Chisholm, B.; Christainson, D., Biofouling 2007, 23, 37. 254. Rizvi, S.; Mora, P. T., Nature 1963, 200, 1324. 255. Holms, W. H., J Gen Microbiol 1968, 54, 255. 256. Ochei, J.; Kolhatkar, A., Medical Laboratory Science : Theory And Practice. 2000. 257. Hazan, R.; Que, Y. A.; Maura, D.; Rahme, L. G., BMC Microbiol 2012, 12, 259. 258. Madison, B. M., Biotech Histochem 2001, 76, 119. 259. Yang, Y.; Jung, D. W.; Bai, D. G.; Yoo, G. S.; Choi, J. K., Electrophoresis 2001, 22, 855. 260. Visvesvara, G. S.; Moura, H.; KovacsNace, E.; Wallace, S.; Eberhard, M. L., J Clin Microbiol 1997, 35, 730. 261. Berra, C. M.; de Oliveira, C. S.; Garcia, C. C. M.; Rocha, C. R. R.; Lerner, L. K.; Lima, L. C. D.; Baptista, M. D.; Menck, C. F. M., Free Radical Bio Med 2013, 61, 343. 262. Ullal, A. J.; Pisetsky, D. S.; Reich, C. F., Cytom Part A 2010, 77A, 294. 263. Beveridge, T. J., Biotech Histochem 2001, 76, 111. 264. Lindner, B.; Seydel, U., J Gen Microbiol 1983, 129, 51. 265. Berney, M.; Hammes, F.; Bosshard, F.; Weilenmann, H. U.; Egli, T., Appl Environ Microb 2007, 73, 3283.

Chapter 9 Page 237
266. An, Y. H.; Friedman, R. J., Handbook of bacterial adhesion. Humana Press Ink.: Totowa (NJ), 2000; p 260. 267. Vogel, H. G., Drug Discovery and Evaluation: Pharmacological Assays. 3rd ed.; Springer-Verlag Berlin Heidelberg New York: 2008; Vol. 1, p 120. 268. Taylor, A. D.; Ladd, J.; Homola, J.; Jiang, S., In In Principles of Bacterial Detection: Biosensors, Recognition Receptors and Microsystems, Zourob, M.; Elwary, S.; Turner, A., Eds. Springer New York: New York, 2008. 269. Oh, B. K.; Lee, W.; Lee, W. H.; Choi, J. W., Biotechnol Bioproc E 2003, 8, 227. 270. Jenkins, A. T. A.; Buckling, A.; McGhee, M.; Ffrench-Constant, R. H., J R Soc Interface 2005, 2, 255. 271. Oli, M. W.; McArthur, W. P.; Brady, L. J., J Microbiol Methods 2006, 65, 503. 272. Pourshafie, M. R.; Marklund, B. I.; Ohlson, S., J Microbiol Methods 2004, 58, 313. 273. Salminen, A.; Loimaranta, V.; Joosten, J. A. F.; Khan, A. S.; Hacker, J.; Pieters, R. J.; Finne, J., J Antimicrob Chemother 2007, 60, 495. 274. Lundstrom, I., Biosens Bioelectron 1994, 9, 725. 275. Myrskog, A.; Anderson, H.; Aastrup, T.; Ingemarsson, B.; Liedberg, B., Langmuir 2010, 26, 821. 276. Wang, H.; Chen, S. F.; Li, L. Y.; Jiang, S. Y., Langmuir 2005, 21, 2633. 277. Dai, Z.; Ju, H. X., Phys Chem Chem Phys 2001, 3, 3769. 278. Godınez, L. A.; Castro, R.; Kaifer, A. E., Langmuir 1996, 12, 5087. 279. Hu, K.; Bard, A. J., Langmuir 1997, 13, 5114. 280. Kokkoli, E.; Zukosk, C. F., Langmuir 2000, 6029. 281. Lee, T. R.; Carey , R. I.; Biebuyck, H. A.; Whitesides, G. M., Langmuir 1994, 10, 741. 282. Schweiss, R.; Welzel, P. B.; Werner, C.; Knoll, W., Langmuir 2001, 17, 4304. 283. Sugihara, K.; Shimazu, K., Langmuir 2000, 16, 7101. 284. White, H. S.; Peterson, J. D.; Cui, Q.; Stevenson, K. J., J Phys Chem B 1998, 102, 2930. 285. Campin, J. M.; Martins, A.; Silva, F., J Phys Chem C 2007, 111, 5351. 286. Garrett, D. J.; Flavel, B. S.; Shapter, J. G.; Baronian, K. H. R.; Downard, A. J., Langmuir 2010, 26, 1848. 287. Melzak, K.; Ralph, E.; Gizeli, E., Langmuir 2001, 17, 1594. 288. Zheng, Z. K.; Yang, M. L.; Liu, Y. Q.; Zhang, B. L., Nanotechnology 2006, 5378. 289. Thomas, R. T.; Houston, J. E.; Crooks, R. M.; Kim, T.; Michalske, T. A., J Am Chem Soc 1995, 117. 290. Chen, Y.; Nguyen, A.; Niu, L.; Corn, R. M., Langmuir 2009, 25, 5054. 291. Schilp, S.; Rosenhahn, A.; Pettitt, M. E.; Bowen, J.; Callow, M. E.; Callow, J. A.; Grunze, M., Langmuir 2009, 25, 10077. 292. Bogdanov, M.; Xie, J.; Heacock, P.; Dowhan, W., J Cell Biol 2008, 182, 925. 293. Ederth, T.; Ekblad, T.; Pettitt, M. E.; Conlan, S. L.; Du, C.-X.; Callow, M. E.; Callow, J. A.; Mutton, R.; Clare, A. S.; D’Souza, F.; Donnelly, G.; Bruin, A.; Willemsen, P. R.; Su, X. J.; Wang, S.; Zhao, Q.; Hederos, M.; Konradsson, P.; Liedberg, B., ACS Appl Mater Interfaces 2011, 3, 3890. 294. Herrwerth, S.; Eck, W.; Reinhardt, S.; Grunze, M., J Am Chem Soc 2003, 125, 9359.

Chapter 9 Page 238
295. Schilp, S.; Kueller, A.; Rosenhahn, A.; Grunze, M.; Pettitt, M. E.; Callow, M. E.; Callow, J. A., Biointerphases 2007, 2, 143. 296. Ostuni, E.; Chapman, R. G.; Liang, M. N.; Meluleni, G.; Pier, G.; Ingber, D. E.; Whitesides, G. M., Langmuir 2001, 17, 6336. 297. Demidov, V. V., Expert Rev Mol Diagn 2004, 4, 267. 298. Niemeyer, C. M.; Mirkin, C. A., Nanobiotechnology. Wiley-VCH Verlag GmbH & Co. KGaA: Weinheim, 2004. 299. Choi, Y. S.; Yoon, C. W.; Lee, H. D.; Park, M.; Park, J. W., Chem Commun 2004, 1316. 300. Peterson, A. W.; Heaton, R. J.; Georgiadis, R. M., Nucleic Acids Res 2001, 29, 5163. 301. Lahiri, J.; Isaacs, L.; Tien, J.; Whitesides, G. M., Anal Chem 1999, 71, 777. 302. Mendes, P. M.; Yeung, C. L.; Preece, J. A., Nanoscale Res Lett 2007, 2, 373. 303. Mrksich, M., MRS Bulletin 2005, 30, 180. 304. Mrksich, M., Curr Opin Chem Biol 2002, 6, 794. 305. Pranzetti, A.; Mieszkin, S.; Iqbal, P.; Rawson, F. J.; Callow, M. E.; Callow, J. A.; Koelsch, P.; Preece, J. A.; Mendes, P. M., Adv Mater 2013, 25, 2181. 306. Leung, K. C.-F.; Xuan, S.; Lo, C.-M., ACS Appl Mater Interfaces 2009, 1, 2005. 307. Laibinis, P. E.; Fox, M. A.; Folkers, J. P.; Whitesides, G. M., Langmuir 1991, 7, 3167. 308. Smith, R. K.; Reed, S. M.; Lewis, P. A.; Monnell, J. D.; Clegg, R. S.; Kelly, K. F.; Bumm, L. A.; Hutchison, J. E.; Weiss, P. S., J Phys Chem B 2001, 105, 1119. 309. Oh, S. J.; Ju, J.; Kim, B. C.; Ko, E.; Hong, B. J.; Park, J. G.; Park, J. W.; Choi, K. Y., Nucleic Acids Res 2005, 33, e90. 310. Iqbal, P.; Rawson, F. J.; Ho, W. K.; Lee, S. F.; Leung, K. C.; Wang, X.; Beri, A.; Preece, J. A.; Ma, J.; Mendes, P. M., ACS Appl Mater Interfaces 2014. 311. Huang, B. H.; Parquette, J. R., Org Lett 2000, 2, 239. 312. Fritz, M. G.; Seebach, D., Helv Chim Acta 1998, 81, 2414. 313. Hajyehia, A. I.; Benet, L. Z., J Chromatogr A 1996, 724, 107. 314. Mu, L.; Liu, Y.; Zhang, S.; Liu, B. H.; Kong, J., New J Chem 2005, 29, 847. 315. Yang, W.; E.Baker, S.; Butler, J. E.; Lee, C.-S.; Russell, J. N.; Shang, L.; Sun, B.; Hamers, R. J., Chem Mater 2005, 17, 938. 316. Weidner, T.; Apte, J. S.; Gamble, L. J.; Castner, D. G., Langmuir 2010, 26, 3433. 317. Hopkins, A. J.; Richmond, G. L., Appl Spectrosc 2013, 67, 261. 318. Darwish, N.; Eggers, P. K.; Ciampi, S.; Tong, Y. J.; Ye, S.; Paddon-Row, M. N.; Gooding, J. J., J Am Chem Soc 2012, 134, 18401. 319. Dreesen, L.; Sartenaer, Y.; Humbert, C.; Mani, A. A.; Lemaire, J. J.; Methivier, C.; Pradier, C. M.; Thiry, P. A.; Peremans, A., Thin Solid Films 2004, 464, 373. 320. Tegeder, P., J Phys-Condens Mat 2012, 24. 321. Valley, D.; Benderskii, A. V., Abstr Pap Am Chem S 2012, 244. 322. Darwish, T. A.; Tong, Y. J.; James, M.; Hanley, T. L.; Peng, Q. L.; Ye, S., Langmuir 2012, 28, 13852. 323. Clegg, R. S.; Hutchison, J. E., Langmuir 1996, 12, 5239. 324. Valiokas, R.; Svedhem, S.; Svensson, S. C. T.; Liedberg, B., Langmuir 1999, 15, 3390. 325. Jo, S.; Engel, P. S.; Mikos, A. G., Polymer 2000, 41, 7595.

Chapter 9 Page 239
326. Tourillon, G.; Dreesen, L.; Volcke, C.; Sartenaer, Y.; Thiry, P.; Peremans, A., J Mater sci 2009, 44, 6805. 327. Lin-Vien D; Colthup NB; Fateley WG; JG, G., The handbook of infrared and raman characteristic frequencies of organic molecules. Academic Press,: San Diego, CA, 1991. 328. Mermut, O.; Phillips, D. C.; Roger L. York; McCrea, K. R.; Ward, R. S.; Somorjai, G. A., J Am Chem Soc 2006 128, 3598. 329. Weidner, T.; Breen, N. F.; Drobny, G. P.; Castner, D. G., J Phys Chem B 2009, 113, 15423. 330. Nidumolu, B. G.; Urbina, M. C.; Hormes, J.; Kumar, C.; Monroe, W. T., Biotechnol Progr 2006, 22, 91. 331. Bellamy, L. J., The infrared spectra of complex molecules. 3rd ed.; Chapman & Hall: London, 1975. 332. Backus, E. H. G.; Garcia-Araez, N.; Bonn, M.; Bakker, H. J., J Phys chem C 2012, 116, 23351. 333. Stuart, M. A. C.; Huck, W. T. S.; Genzer, J.; Müller, M.; Ober, C.; Stamm, M.; Sukhorukov, G. B.; Szleifer, I.; Sukruk, T. V. V.; Urban, M.; Winnik, F.; Zauscher, S.; luzinov, I.; Minko, S., Nature Mater 2010, 9, 101. 334. Roach, P.; Parker, T.; Gadegaard, N.; Alexander, M. R., Surf Sci Rep 2010, 65, 145. 335. Janshoffa, A.; Kunzeb, A.; Michaelisc, S.; Heitmannd, V.; Reisse, B.; Wegenerf, J., J Adhes Sci Technol 2010, 24, 2079. 336. Sakiyama-Elbert, S. E.; Hubbell, J. A., Annu Rev Mater Res 2001, 31, 183. 337. Banerjee, I.; Pangule, R. C.; Kane, R. S., Adv Mater 2011, 23, 690. 338. Yua, Q.; Zhanga, Y.; Wanga, H.; Brasha, J.; Chena, H., Acta Biomater 2010, 7 1550. 339. Zhoua, T.; Marxa, K. A.; Dewildec, A. H.; McIntoshc, D.; Braunhutc, S. J., Anal Biochem 2012, 421, 164. 340. Whitesides, G. M.; Kriebel, J. K.; Love, J. C., Sci Prog 2005, 88, 17. 341. FIinlay, J. A.; Callow, M. E.; Ista, L. K.; Lopez, G. P.; Callow, J. A., Integr Comp Biol 2002, 42, 1116. 342. Costello, C.; Kreft, J.-U.; Thomas, C. M.; Mendes, P. M., Protein Nanoarrays for High-Resolution Patterning of Bacteria on Gold Surfaces. In Nanoproteomics:Methods and Protocols, Toms, S. A.; Weil, R. J., Eds. Humana Press Inc, 999 Riverview Dr, Ste 208, Totowa, Nj 07512-1165 USA: 2011; Vol. 790, pp 191. 343. Costello, C. M.; Kreft, J.-U.; Thomas, C. M.; Hammes, D. M.; Bao, P.; Evans, S. D.; Mendes, P. M., Soft Matter 2012, 8, 9147. 344. Yoon, S. H.; Chang, J.; Lin, L.; Mofrad, M. R., Lab Chip 2011, 11, 13555. 345. Chang, H.-I.; Wang, Y., Cell Responses to Surface and Architecture of Tissue Engineering Scaffolds. 1st ed.; InTech,: Rijeka, Croatia, 2011; Vol. 1, p 569. 346. Parsons, T. J.; Horwitz, A. R.; Schwartz, M. A., Nat Rev Mol Cell Bio 2010, 11, 633. 347. Abedin, M.; King, N., Trends Cell Biol 2010, 20, 734. 348. Cannons, J. L.; Qi, H.; K.T., L.; Dutta, M.; Gomez-Rodriguez, J.; Cheng, J.; Wakeland E.K.; Germain, R. N.; Schwartzberg, P. L., Immunity 2010, 32, 253. 349. Callow, J. A.; Callow, M. E., Nat Commun 2011, 2, 1. 350. Robertus, J.; Browne, W. R.; Feringa, B. L., Chem Soc Rev 2010, 39, 354.

Chapter 9 Page 240
351. Liu, Y.; Mu, L.; Liu, B.; Zhang, S.; Yang, P.; Kong, J., Chem Commun 2004, 1194. 352. Zareie, H. M.; Boyer, C.; Bulmus, V.; Nateghi, E.; Davis, T. P., ACS Nano 2008, 2, 757. 353. Wischerhoff, E.; Badi, N.; Lutz, J.-F.; Laschewsky, A., Soft Matter 2010, 6, 705. 354. Wischerhoff, E.; Uhlig, K.; Lankenau, A.; Borner, H. G.; Laschewsky, A.; Duschl, C.; Lutz, J., Angew Chem Int Ed 2008, 47, 5666 355. Mager, M. D.; LaPointe, V.; Stevens, M. M., Nat Chem 2011, 3, 582. 356. Sackmann, E.; Bruinsma, R. F., Chemphyschem 2002, 12, 262. 357. Cabane, E.; Zhang, X.; Langowska, K.; Palivan, C. G.; Meier, W., Biointerphases 2012, 7, 1. 358. Zapotoczny, S., Methods Mol Biol 2012, 811, 51. 359. Ista, L. K.; Mendez, S.; Lopez, G. P., Biofouling 2010, 26, 111. 360. Cao, Z.; Mi, L.; Mendiola, J.; Ella-Menye, J.-R.; Zhang, L.; Xue, H.; Jiang, S., Angew Chem Int Ed 2012, 51, 2602 361. Cheng, G.; Xue, H.; Zhang, Z.; Chen, S.; Jiang, S., Angew Chem Int Ed 2008, 47, 8831 362. Laloyaux, X.; Fautré, E.; Blin, T.; Purohit, V.; Leprince, J.; Jouenne, T.; Jonas, A. M.; Glinel, K., Adv Mater 2010, 22, 5024. 363. Zhang, Z.; Vaisocherova, H.; Cheng, G.; Yang, W.; Xue, H.; Jiang, S., Biomacromolecules 2008, 9, 2686. 364. Cao, Z.; Brault, N.; Xue, H.; Keefe, A.; Jiang, S., Angew Chem Int Ed 2011, 50, 6102 365. Raynor, J. E.; Petrie, T. A.; Garcia, A. J.; Collard, D. M., Adv Mater 2007, 19, 1724. 366. Howse, J. R.; Topham, P.; Crook, C. J.; Gleeson, A. J.; Bras, W.; Jones, R. A. L.; Ryan, A. J., Nano Lett 2006, 6, 73. 367. Zareie, H.; Boyer, C.; Bulmus, V.; Nateghi, E.; Davis, T., ACS Nano 2008, 2, 757. 368. Tan, J. L.; Tien, J.; Pirone, D. M.; Gray, D. S.; Bhadriraju, K.; Chen, C. S., Proc Natl Acad Sci USA 2003, 100, 1484. 369. Mohn, D.; Zehnder, M.; Stark, W. J.; Imfeld, T., Implantologie 2011, 19, 151. 370. Li, X. Y.; Ding, F.; Lo, P. S. Y.; Sin, S. H. P., J Envirn Eng-Asce 2002, 128, 697. 371. Nakasono, S.; Burgess, J. G.; Takahashi, K.; Koike, M.; Murayama, C.; Nakamura, S.; Matsunaga, T., Appl Environ Microb 1993, 59, 3757. 372. Weaver, J. C., J Cell Biochem 1993, 51, 426. 373. Marshall, K. C.; Stout, R.; Mitchell, R., Microbiology 1971, 68, 337. 374. Neghmouche, N. S.; Lanez, T., Recent Trends in Physical Chemistry: An International Journal 2013, 1, 1. 375. Renner, L. D.; Weibel, D. B., MRS Bull 2011, 36, 347. 376. Bazaka, K.; Jacob, M. V.; Crawford, R. J.; Ivanova, E. P., Appl Microbiol Biot 2012, 95, 299. 377. Glinel, K.; Thebault, P.; Humblot, V.; Pradier, C. M.; Jouenne, T., Acta Biomater 2012, 8, 1670. 378. Beloin, C.; Houry, A.; Froment, M.; Ghigo, J.-M.; Henry, N., PLOS Biology 2008, 6, 1549.

Chapter 9 Page 241
379. Van Loosdrecht, M. C. M.; Norde, W.; Zehnder, A. J. B., J Biomater Appl 1990, 5, 91. 380. Razatos, A.; Ong, Y.-L.; Sharma, M. M.; Georgeou, G., Proc Natl Acad Sci USA 1998, 95, 11059. 381. Van der Mei, H. C.; Rustema-Abbing, M.; de Vries, J.; Busscher, H. J., Appl Environ Microbiol 2008, 74, 5511. 382. Wang, X.; Chen, X.; Yang, Y., Nat Methods 2012, 9, 266. 383. Mendes, P. M.; Susanne, J.; Critchley, K.; Plaza, J.; Y., C.; Nikitin, K.; Palmer, R. E.; Preece, J. A.; Evans, S. D.; Fitzmaurice, D., Langmuir 2004, 20, 3766. 384. Wang, H.; Chen, S. F.; Li, L. Y.; Jiang, S. Y., Langmuir 2005, 21, 2633. 385. Gauthier, M. J.; Lafay, B.; Christen, R.; Fernandez, L.; Acquaviva, M.; Bonin, P.; Bertrand, J. C., Int J Syst Evol Microbiol 1992, 42, 568. 386. Marquez, M. C.; Ventosa, A., Int J Syst Evol Microbiol 2005, 55, 1349.