swire pacific limited announces 2012 annual results
TRANSCRIPT

For immediate release 14th March 2013
Swire Pacific Limited Announces 2012 Annual Results
Swire Pacific Limited‟s consolidated profit attributable to shareholders for 2012 was HK$17,484
million, compared to HK$32,210 million in 2011. Underlying profit attributable to shareholders,
which principally adjusts for changes in the valuation of investment properties, decreased by
HK$8,948 million to HK$8,344 million. Adjusted to exclude the effect of non-recurring items (the
most significant being the HK$8,615 million profit on disposal of Festival Walk in 2011),
underlying profit decreased by HK$818 million or 9% to HK$7,910 million.
The decrease in adjusted underlying profit reflects significantly lower profit from the Cathay
Pacific group and lower profits from the Beverages and Trading & Industrial Divisions. There
were higher profits from the Property and Marine Services Divisions and from the Hong Kong
Aircraft Engineering Company Limited (“HAECO”) group.
Below is a summary of the 2012 results:
2012 Results Summary
2012
HK$M
2011
HK$M
Change
%
Turnover 43,859 36,286 +20.9%
Profit attributable to the Company‟s shareholders 17,484 32,210 -45.7%
Underlying profit attributable to the Company‟s
shareholders 8,344 17,292 -51.7%
Underlying profit excluding profit on sale of Festival
Walk 8,344 8,677 -3.8%
Adjusted underlying profit 7,910 8,728 -9.4%
HK$ HK$ Change %
Earnings per share
„A‟ Share 11.62 21.41 -45.7%
„B‟ Share 2.32 4.28
Underlying earnings per share
„A‟ Share 5.55 11.49 -51.7%
„B‟ Share 1.11 2.30
HK$ HK$ Change %
Full Year dividends per share
„A‟ Share 3.500 3.500* -
„B‟ Share 0.700 0.700*
* Excluding the special interim dividends of HK$3.00 per „A‟ Share and HK$0.60 per „B‟ Share paid in 2011
following the sale of Festival Walk.
… / Page 2

/ …2
Division Highlights:
Property Division
Reduction in Swire Pacific‟s interest in Swire Properties from 100% to 82% as a result of
the listing of Swire Properties in January 2012.
Excluding revaluation gains and non-recurring items (most notably the HK$8,615 million
profit on disposal of Festival Walk), adjusted underlying profit increased by HK$1,432
million to HK$5,545 million.
The increase in profit principally reflects a significant trading profit of HK$1,534 million on
sale of 98 units at the AZURA residential development in Hong Kong.
Profit from property investment decreased, reflecting the reduction in Swire Pacific‟s
interest in Swire Properties and the loss of rental income from Festival Walk following its
sale in August 2011.
Aviation Division
The attributable profit of the Aviation Division was HK$1,050 million in 2012, compared to
a profit of HK$2,999 million in 2011.
The Cathay Pacific group‟s attributable profit was HK$412 million compared to a profit of
HK$2,405 million in 2011.
There was pressure on passenger yields and demand for cargo services was weak. The
high price of jet fuel had a major impact on operating results.
Cathay Pacific took measures to reduce costs by reducing capacity and accelerating
retirement of less fuel-efficient aircraft but the reductions were not enough.
The HAECO group‟s attributable profit was HK$659 million in 2012, 7% higher than in
2011.
Demand for HAECO‟s airframe maintenance services in Hong Kong was strong, but
HAECO was not able to meet this demand in the second half because of a shortage of
skilled and semi-skilled labour.
Beverages Division
Attributable profit was HK$542 million, a decrease of 18% from 2011.
Sales volume in Mainland China declined slightly. Good volume growth in inland
territories was not enough to offset volume decreases in southern and eastern markets.
The Mainland China business was also affected by a less favourable sales mix and
higher operating costs.
Overall sales declined by 0.5% to 990 million unit cases. Volume grew in the USA and
Hong Kong but declined in Taiwan.
… / Page 3

/ …3
Marine Services Division
Attributable profit was HK$975 million, a 13% increase from 2011.
Swire Pacific Offshore (“SPO”)‟s overall average fleet utilisation and charter hire rates
increased by 4% points and 10% respectively.
SPO benefited from the additional contribution from new vessels that commenced
operations in 2012 and from two new businesses acquired in early 2012.
Total operating costs increased by 9% excluding the impact of the inclusion of costs from
the two newly acquired businesses.
Trading & Industrial Division
Excluding the gain of HK$148 million on disposal of the Group‟s interest in PUMA in
January 2011, attributable profit of the Trading & Industrial Division decreased by 9% to
HK$247 million.
The decrease reflected weaker results from Swire Resources and Taikoo Motors,
increased losses from Campbell Swire and costs associated with new business
development.
- End -
For further information, please contact:
Cindy Cheung, Senior Manager Group Public Affairs, Swire Pacific Limited
Tel : (852) 2840 8091 / (852) 9038 8495 Email : [email protected]
Visit Swire Pacific‟s website at www.swirepacific.com

Hong Kong Exchanges and Clearing Limited and The Stock Exchange of Hong Kong Limited take no
responsibility for the contents of this announcement, make no representation as to its accuracy or
completeness and expressly disclaim any liability whatsoever for any loss howsoever arising from or in
reliance upon the whole or any part of the contents of this announcement.
- 0 -
SWIRE PACIFIC LIMITED
(Incorporated in Hong Kong with limited liability)
(Stock Codes: 00019 and 00087)
2012 Final Results

2012 FINAL RESULTS
- 1 -
2012 Final Results
Note 2012 2011
HK$M HK$M %
Turnover 43,859 36,286 +20.9 %
Operating profit 23,287 31,424 -25.9 %
Profit attributable to the
Company's shareholders 17,484 32,210 -45.7 %
Cash generated from operations 10,186 9,204 +10.7 %
Net cash (outflow)/inflow before financing (2,288) 15,968 N/A
Total equity (including non-controlling interests) 249,334 232,476 +7.3 %
Net debt 44,418 35,679 +24.5 %
HK$ HK$
Earnings per share (a)
'A' share 11.62 21.41
'B' share 2.32 4.28
Dividends per share
'A' share 3.500 6.500
'B' share 0.700 1.300
Equity attributable to the Company's
shareholders per share
'A' share 139.33 151.24
'B' share 27.87 30.25
Underlying Profit and Equity
HK$M HK$M %
Underlying profit attributable to the Company's
shareholders (b) 8,344 17,292 -51.7 %
HK$ HK$
Underlying earnings per share (a)
'A' share 5.55 11.49
'B' share 1.11 2.30
Underlying equity attributable to the
Company's shareholders per share (b)
'A' share 142.55 154.73
'B' share 28.51 30.95
Change
Change
-51.7
-7.9
-45.7
-46.2
-7.9
%
%
%
%
%
Notes:
(a) Refer to note 7 in the accounts for the weighted average number of shares.
(b) A reconciliation between the reported and underlying profit and equity attributable to the Company's
shareholders is provided on page 56.

2012 FINAL RESULTS
- 2 -
Chairman’s Statement Our consolidated profit attributable to shareholders for 2012 was HK$17,484 million, HK$14,726 million lower than in 2011. Underlying profit attributable to shareholders, which principally adjusts for changes in the valuation of investment properties, decreased by HK$8,948 million to HK$8,344 million. Adjusted to exclude the effect of non-recurring items (the most significant being the HK$8,615 million profit on disposal of Festival Walk in 2011), underlying profit decreased by HK$818 million or 9% to HK$7,910 million. This decrease in adjusted underlying profit reflects significantly lower profit from the Cathay Pacific group and lower profits from the Beverages and Trading & Industrial Divisions. There were higher profits from the Property and Marine Services Divisions and from the Hong Kong Aircraft Engineering Company Limited (“HAECO”) group. Listing of Swire Properties In January 2012, the shares in Swire Properties were listed on The Stock Exchange of Hong Kong Limited. The listing was achieved through a distribution in specie by Swire Pacific of 18% of the shares in Swire Properties. Following the listing, Swire Pacific’s shareholding in Swire Properties was reduced to 82%. The Economic Background in 2012 World economic conditions were subject to considerable uncertainties in 2012. The airline industry was significantly affected by this. Global economic uncertainties had less of an impact within Hong Kong. However, in the Hong Kong property market, measures introduced by the government towards the end of the year reduced demand for luxury residential properties. There was a slowdown in the growth of the Mainland China economy, particularly in coastal provinces. This adversely affected consumer confidence and expenditure. The high price of oil adversely affected our airlines but also resulted in increased exploration and production by oil companies, which benefited our Marine Services Division. Operating Performance The attributable adjusted underlying profit from the Property Division increased by HK$1,432 million to HK$5,545 million. This was achieved despite the reduction in Swire Pacific’s interest in Swire Properties from 100% to 82% as a result of the listing of Swire Properties. The increase principally reflects a significant trading profit of HK$1,534 million on the sale of 98 units in the AZURA residential development in Hong Kong. Profit from property investment decreased, reflecting the reduction in Swire Pacific’s interest in Swire Properties and the loss of rental income from Festival Walk following its sale in August 2011, partially offset by positive rental reversions from the Hong Kong portfolio, the first full year contribution from TaiKoo Hui in Guangzhou and a better performance at Sanlitun Village. The Property Division’s net investment property valuation gain in 2012, before deferred tax in Mainland China, was HK$12,751 million, compared to a net gain in 2011 of HK$20,899 million. The Aviation Division recorded an attributable profit of HK$1,050 million in 2012, compared to a profit of HK$2,999 million in 2011. Cathay Pacific was affected by the difficult conditions in the airline industry. The Cathay Pacific group contributed a profit of HK$412 million, compared with a profit of HK$2,405 million in 2011. There was pressure on passenger yields and demand for cargo services was weak. The high price of jet fuel had a major impact on operating results. In May 2012, Cathay Pacific announced measures designed to protect its business in an environment of high fuel prices and weak revenues. By the end of the year costs had been reduced significantly as a result of reduced capacity and early retirement of less fuel-efficient aircraft. However, the reductions were not enough to offset in full the effects of high fuel prices and weak revenues.

2012 FINAL RESULTS
- 3 -
Chairman’s Statement (continued) The HAECO group’s profit attributable to shareholders in 2012 was HK$659 million, an increase of 7% compared to the corresponding figure in 2011 of HK$615 million. Demand for HAECO’s airframe maintenance services in Hong Kong was strong, but HAECO was not able to meet this demand in the second half because of a shortage of skilled and semi-skilled labour. HAECO’s line maintenance business in Hong Kong benefited from an increase in aircraft movements at Hong Kong International Airport. Results from TAECO were adversely affected by exchange rate and deferred tax movements. HAESL performed well. The operating results of HAECO’s joint ventures in Mainland China improved, but losses continued to be incurred because of under-utilisation of facilities. The Beverages Division recorded an attributable profit of HK$542 million in 2012, a decrease of 18% compared to 2011. The decrease principally reflected a weak performance in Mainland China, higher taxes in the USA and higher operating costs in all territories. Overall sales volume fell by 0.5% to 990 million unit cases, compared with growth of 8% in 2011. Volume grew in the USA and Hong Kong but declined in Mainland China and Taiwan. The Marine Services Division reported an attributable profit of HK$975 million, an increase of 13% compared to 2011. At Swire Pacific Offshore (“SPO”), there was an increase in fleet utilisation and charter hire rates. However, this was partially offset by an increase in operating costs. The results of SPO benefited from the additional contribution from new vessels that commenced operations in 2012. Attributable profit from the Trading & Industrial Division in 2012 decreased by 41% to HK$247 million. Excluding the gain of HK$148 million on disposal of the Group’s interest in PUMA in January 2011, attributable profit decreased by HK$23 million. The decrease reflected weaker results from Swire Resources and Taikoo Motors, increased losses from Campbell Swire and costs associated with new business development. Economic Outlook We are cautiously optimistic about economic prospects. Growth in the USA may be restricted by fiscal tightening and in Europe by the continuing problems of the Eurozone. The outlook for the Asian region is better. It appears that the Mainland China economy is returning to more robust growth. Hong Kong is likely to benefit from this. Prospects Demand from financial services companies for office space in the Central district of Hong Kong is likely to remain soft. However, occupancy at Pacific Place is high and there are no major leases expiring until the latter part of 2013. Rents are therefore expected to be fairly resilient in 2013. Our new development at 28 Hennessy Road is attracting interest from smaller businesses. At Island East, rents are expected to remain robust owing to high occupancy levels. In Mainland China, demand for office space and rental rates are expected to remain stable. Demand for retail space in Hong Kong continues to be strong. Rents are expected to continue to increase. In Mainland China, retailers of internationally branded goods in high quality shopping malls remain popular. Retail rents are expected to be steady in 2013. Profits from property trading are expected to be lower in 2013 than in 2012, but nevertheless significant, with the completion of the ARGENTA development and the expected sale of the remaining units at the AZURA development. The effect of substantial increases and other changes in Hong Kong stamp duty on demand for luxury residential properties is uncertain.

2012 FINAL RESULTS
- 4 -
Chairman’s Statement (continued)
The Cathay Pacific group operates in a volatile and challenging industry, one that will always be highly
susceptible to external factors that remain largely beyond its control. The cost of fuel remains the
biggest challenge, particularly for an airline where long-haul operations form a significant part of the
business. The group‟s focus will remain on protecting the business and managing short-term difficulties
while remaining committed to its long-term strategy. Its financial position remains strong and it will
continue to invest in the future.
The HAECO group expects to do less airframe maintenance work in Hong Kong in 2013 than in 2012,
with labour shortages restricting manhours expected to be sold in the first half to 1.2 million compared
with 1.6 million in the first half of 2012. Although these labour shortages may ease in the second half of
2013, the first half shortfall is likely to have a material adverse effect on HAECO‟s overall turnover and
profit for the full year.
Swire Beverages is cautiously optimistic about 2013. In Mainland China there are indications that the
pace of economic growth will resume. Following completion of its reorganisation, the business in
Taiwan is in a good position. The Hong Kong and USA businesses are doing well and should continue
to benefit from their strong market positions.
The price of oil is expected to remain high in 2013, leading to a further increase in offshore exploration
and production commitments by energy companies. In turn, demand for offshore support vessels is
expected to improve, but the over-supply of tonnage in the industry will continue to restrict charter hire
rates until it has been absorbed by the market.
The performance of the Trading & Industrial Division will depend on economic conditions in the markets
in which it operates. But the results of the division in 2013 are likely in any event to continue to be
affected by the cost of new business development.
Finance
In 2012, we raised HK$21,577 million of new finance. This principally comprised issues of HK dollar
and US dollar denominated medium-term notes under the Group‟s medium-term note programmes. The
remaining finance raised mainly consists of HK dollar and US dollar loans.
Net debt at 31st December 2012 was HK$44,418 million, an increase of HK$8,739 million since 31st
December 2011. The increase principally reflects investments in property projects in Mainland China
and Hong Kong and in new vessels at SPO. Gearing increased by 2.4 percentage points to 17.8%. Cash
and undrawn committed facilities totalled HK$22,459 million at 31st December 2012, compared with
HK$20,339 million at 31st December 2011.
Sustainable Development
Sustainability is integral to Swire Pacific‟s long-term approach to business. We wish to protect the
environment we work in. Our ultimate goal is for our operating companies to achieve zero net impact on
the environment. We try to conduct our operations in a manner which safeguards the health and safety of
our employees, those with whom we do business, our visitors and the communities in which we operate.
We work hard to recruit and retain employees and to develop their potential. We support the
communities in which we operate with charitable donations from the Swire Group Charitable Trust
(which we fund) and by supporting the community initiatives of our staff. We share values and
knowledge with those with whom we deal and encourage them to adopt similar ethical standards and
sustainability practices.

2012 FINAL RESULTS
- 5 -
Chairman’s Statement (continued)
In 2012, we held our first energy conference and established a carbon desk. We introduced quarterly
reporting on health and safety performance and developed a staff transportation safety policy. We held
our second sustainable development forum. The Swire Group Charitable Trust‟s donations in 2012
included one to Xiamen University to assist it to develop a marine research centre. We made progress in
extending our purchases of sustainable seafood and other certified products.
Dividends
The Directors have declared second interim dividends of HK$2.50 per „A‟ share and HK$0.50 per „B‟
share which, together with the first interim dividends of HK$1.00 per „A‟ share and HK$0.20 per „B‟
share paid in October 2012, amount to full year dividends of HK$3.50 per „A‟ share and HK$0.70 per
„B‟ share, the same as those paid in respect of 2011 (disregarding the special interim dividends of
HK$3.00 per „A‟ share and HK$0.60 per „B‟ share paid in 2011). The second interim dividends, which
total HK$3,761 million (2011: HK$3,536 million), will be paid on 3rd May 2013 to shareholders
registered at the close of business on the record date, being Friday, 12th April 2013. Shares of the
Company will be traded ex-dividend from Wednesday, 10th April 2013.
____________________________________________________________________________________
The commitment and hard work of employees of the Group and its jointly controlled and associated
companies are central to our continuing success. I take this opportunity to thank them.
By Order of the Board
SWIRE PACIFIC LIMITED
Christopher Pratt
Chairman
Hong Kong, 14th March 2013

2012 FINAL RESULTS
- 6 -
REVIEW OF OPERATIONS
PROPERTY DIVISION
OVERVIEW OF THE BUSINESS
Swire Properties is a leading developer, owner and operator of mixed-use, principally
commercial properties in Hong Kong and Mainland China, with a well-established
record of creating long-term value by transforming urban areas. Swire Properties‟
business comprises three main areas:
Property Investment:
Swire Properties‟ property investment portfolio in Hong Kong comprises Grade A
office and retail premises in prime locations, serviced apartments and other luxury
residential accommodation. The completed portfolio in Hong Kong totals 14.1 million
square feet of gross floor area. In Mainland China, Swire Properties has interests in
major commercial mixed-use developments in Guangzhou, Beijing, Shanghai and
Chengdu, which will total 8.8 million square feet on completion. Of this, 6.3 million
square feet has already been completed. In the United States, Swire Properties is the
primary developer in an equity partnership undertaking a mixed-use commercial
development at Brickell CityCentre in Miami, Florida. On completion after two
phases of development, Brickell CityCentre is expected to comprise approximately
2.9 million square feet (5.4 million square feet including car park and circulation
areas). Swire Properties was responsible for the redevelopment of OPUS HONG KONG
at 53 Stubbs Road, which is owned by Swire Pacific Limited. Swire Properties is
responsible for the leasing and management of the property.
Hotel Investment:
Swire Properties wholly-owns and manages, through Swire Hotels, two hotels in Hong
Kong, The Upper House at Pacific Place and EAST Hong Kong at Island East. Swire
Properties has a 20% interest in each of the JW Marriott, Conrad Hong Kong and
Island Shangri-La hotels at Pacific Place and in the Novotel Citygate in Tung Chung.
In Mainland China, Swire Hotels manages two hotels, The Opposite House at Sanlitun
Village in Beijing, which is wholly-owned by Swire Properties, and EAST Beijing at
INDIGO in the Jiangtai area of Beijing, in which Swire Properties owns a 50% interest.
At TaiKoo Hui in Guangzhou, Swire Properties owns a 97% interest in the Mandarin
Oriental, Guangzhou, which opened in January 2013. In the United Kingdom, Swire
Properties wholly-owns four hotels, in Cheltenham, Bristol, Brighton and Exeter. In the
United States, Swire Properties owns a 75% interest in the Mandarin Oriental Hotel in
Miami.
Property Trading:
Swire Properties‟ trading portfolio comprises six luxury residential projects under
development in Hong Kong (four on Hong Kong Island, one in Kowloon and one on
Lantau Island), a residential complex under development at Brickell CityCentre in
Miami, an office property under development as part of the Daci Temple project in
Chengdu, and the remaining units at the completed ASIA development in Miami and
at the completed developments at AZURA and 5 Star Street in Hong Kong. There are
also land banks in Miami and Fort Lauderdale in Florida in the United States.

2012 FINAL RESULTS
- 7 -
Principal Property Investment Portfolio – Gross Floor Area („000 Square Feet)
At 31st
December 2011
Location Offices Retail Hotels Residential Total Total
Completed
Pacific Place 2,186 711 496 443 3,836 3,836
TaiKoo Place 6,180 * - - - 6,180 6,180
Cityplaza 1,633 1,105 200 - 2,938 2,938
Others 410 608 47 98 1,163 1,029
- Hong Kong 10,409 2,424 743 541 14,117 13,983
Sanlitun Village - 1,296 169 - 1,465 1,465
TaiKoo Hui 1,732 1,473 584 52 3,841 3,208
INDIGO 298 470 179 - 947 298
Others - 91 - - 91 91
- Mainland China 2,030 3,330 932 52 6,344 5,062
- United States - - 259 - 259 259
- United Kingdom - - 208 - 208 196
Total completed 12,439 5,754 2,142 593 20,928 19,500
- Hong Kong (28) ** 12 - 63 47 220
- Mainland China 922 1,111 354 41 2,428 3,728
- United States 982 505 218 102 1,807 1,791
Total 14,315 7,382 2,714 799 25,210 25,239
Under and pending
development
At 31st December 2012
Gross floor area represents 100% of space owned by Group companies and the Group‟s
attributable share of space owned by jointly controlled and associated companies.
* Includes 1.8 million square feet at three techno-centres (Somerset House, Warwick House and
Cornwall House).
** Somerset House is due to be demolished for development in 2013. Once complete, the total
gross floor area will be approximately 28,000 square feet lower than it is currently.
STRATEGY:
The strategic objective of Swire Properties (as a listed company in its own right) is
sustainable growth in shareholder value over the long-term as a leading developer,
owner and operator of mixed-use commercial properties in Hong Kong and
Mainland China. The strategies employed in order to achieve this objective are
these:
The creation of long-term value through conceiving, designing, developing,
owning and managing transformational mixed-use and other projects in urban
areas.
Maximisation of the earnings and value of its completed properties through active
asset management, including reinforcing its assets through enhancement,
redevelopment and new additions.
Continuing to expand its luxury residential property activities.
Remaining focused principally on Hong Kong and Mainland China.
Conservative management of its capital base.

2012 FINAL RESULTS
- 8 -
IMPLEMENTING STRATEGIES:
New Projects – Swire Properties designs projects which it believes will
have the necessary scale, mix of uses and transport links to become key
commercial destinations and to transform the areas in which they are
situated. Swire Properties‟ experience and record of success as a
developer of major commercial projects gives it a strong competitive
advantage in securing new projects. In Hong Kong suitable
development sites of significant size are not easy to obtain due to
strong competition and the limited amount of suitable undeveloped
land. The progress and cost of developments can be adversely
affected by a number of different factors. In Mainland China, Swire
Properties aims to replicate the success which it has experienced in
Hong Kong. It intends to take a measured approach to land purchases.
Swire Properties will focus on developments where it can secure sites
through early engagement with local governments who recognise its
strengths in developing large-scale mixed-use projects.
Rental Income – Swire Properties actively manages its completed
property developments (including by optimising the mix of retail tenants
and negotiations with office tenants about early renewal). Its long-term
aim is to maintain consistently high levels of service and to enhance
and reinforce its assets. By doing so, Swire Properties expects to
maximise the occupancy and earnings potential of its properties.
Notwithstanding Swire Properties‟ active management of its
developments, the growth of rental income principally depends on the
performance of the real estate markets in Hong Kong and Mainland
China (in the latter in particular in Beijing and Guangzhou). Any real
estate market downturn in these areas could affect Swire Properties‟
rental income.
Trading Profit – A key objective of Swire Properties is to expand its luxury
residential property activities through acquiring appropriate sites for the
development of luxury residential projects.
Capital Base – Swire Properties aims to maintain a strong capital base
by investing in and financing projects in a disciplined and targeted
manner. Its aim in managing its capital base is to safeguard its ability to
operate as a going concern and to have access to finance at a
reasonable cost. In monitoring its capital structure, Swire Properties
considers (among other things) its gearing ratio, its cash interest cover
and the return cycle of its various investments.
Sustainability – Tenants increasingly scrutinise the sustainability
credentials of landlords and buildings. Swire Properties aims to be at
the forefront of sustainable development by designing energy efficient
buildings through the innovative use of design, materials and new
technology.
2012
PERFORMANCE:
Capital
Expenditure:
HK$3.8bn
Capital
Commitments at
Year-end:
HK$15.9bn
Gross Rental
Income (HK):
2% decrease*
Gross Rental
Income
(Mainland
China):
75% increase
Property Trading-
Operating Profit:
+HK$2.4bn
Units Closed:
115
Gearing:
-0.7% pts
Return on Equity:
9%
Energy
Consumption:**
11% decrease
Water
Consumption:
1% increase**
* Disregarding the gross rental income from Festival Walk in 2011, the gross rental income in Hong Kong in 2012
grew by 7%.
** The size of the completed property portfolio grew by 7% in the same period.

2012 FINAL RESULTS
- 9 -
2012 PERFORMANCE
Property Division – Financial Highlights
2012 2011
HK$M HK$M
Turnover
Gross rental income derived from
Offices 5,008 4,537
Retail 3,675 3,710
Residential 332 310
Other revenue * 108 94
Property investment 9,123 8,651
Property trading 4,147 213
Hotels 782 717
Total turnover 14,052 9,581
Operating profit/(loss) derived from
Property investment 6,861 6,143
Valuation gains on investment properties 12,159 20,179
Sale of investment properties 12 638
Property trading 2,395 (50)
Hotels (39) (93)
Total operating profit 21,388 26,817
Share of post-tax profits from
jointly controlled and associated companies
821
1,007
Attributable profit 18,647 24,999
Swire Pacific share of attributable profit
15,290
24,999
* Other revenue is mainly estate management fees.

2012 FINAL RESULTS
- 10 -
Additional information is provided below to reconcile reported and underlying profit
attributable to shareholders. These reconciling items principally adjust for net revaluation
movements on investment properties and the associated deferred tax in Mainland China
and for other deferred tax provisions in relation to investment properties.
2012 2011
Note HK$M HK$M
Reported attributable profit 18,647 24,999
Adjustments re investment properties:
Revaluation of investment properties (a) (12,751) (20,899)
Deferred tax on investment properties (b) 661 523
Realised profit on sale of investment properties (c) 176 7,977
Depreciation of investment properties occupied by
the Group
(d) 20 27
Non-controlling interests‟ share of revaluation
movements less deferred tax
17
46
Underlying attributable profit 6,770 12,673
Swire Pacific share of underlying attributable profit 5,551 12,673
Notes:
(a) This represents the Group‟s net revaluation movements and the Group‟s share of net
revaluation movements of jointly controlled and associated companies.
(b) This represents deferred tax movements on the Group‟s investment properties and the
Group‟s share of deferred tax movements on investment properties held by jointly
controlled and associated companies. These comprise deferred tax on revaluation
movements on investment properties in Mainland China and deferred tax provisions made
in respect of investment properties held for the long-term where it is considered that the
liability will not reverse for some considerable time.
(c) Prior to the implementation of HKAS 40, changes in the fair value of investment properties
were recorded in the revaluation reserve rather than the income statement. On sale, the
revaluation gains were transferred from the revaluation reserve to the income statement.
(d) Prior to the implementation of HKAS 40, no depreciation was charged on investment
properties occupied by the Group.

2012 FINAL RESULTS
- 11 -
PROPERTY INDUSTRY BACKGROUND
Office and Retail Markets:
Hong Kong:
Office – Global economic
uncertainties continued to affect
demand for office space in 2012,
particularly from financial institutions.
Rents in Central came under pressure.
However, rents outside Central
remained robust. This reflected high
occupancy rates and the fact that
tenants are continuing to relocate
from Central.
Retail – Growth in the local economy
and in tourist arrivals continued to
underpin demand for retail space in
the first half of 2012, resulting in higher
rents. Retail sales growth weakened in
the second half, but demand for retail
space remained robust.
Mainland China:
Office – Demand for office space
weakened in 2012 in line with slowing
economic growth. However, rents
remained steady.
Retail – The retail market continued to
grow in 2012, but more slowly towards
the end of the year. Rents in major
cities grew modestly.
Hotel Industry:
Hong Kong – Hotels in Hong Kong did
well in 2012. There were more visitors
from Mainland China despite slowing
economic growth there.
Mainland China – Trading conditions
weakened in the second half of 2012
as economic growth slowed. New
supply is expected to increase in 2013,
putting pressure on rates and
occupancy.
UK – Trading conditions were
challenging in 2012 in unfavourable
economic conditions.
Property Sales Markets:
Hong Kong – Sales of residential
properties in Hong Kong were strong
for much of 2012. But they were
adversely affected in the last quarter
by government administrative
measures. The effect of substantial
increases and other changes in Hong
Kong stamp duty on demand for luxury
residential properties is uncertain.
USA – Sales of residential properties in
urban Miami continued to improve
with most of the excess condominium
inventory having been absorbed.
Average prices for new and resale
units increased by approximately 12%
in 2012.
2012 RESULTS SUMMARY
Attributable profit from the Property
Division for the year was HK$15,290
million compared to HK$24,999 million
in 2011. These figures include net
property valuation gains, before
deferred tax in Mainland China, of
HK$12,751 million and HK$20,899 million
in 2012 and 2011 respectively.
Underlying profit, which principally
adjusts for changes in the valuation of
investment properties, decreased by
HK$7,122 million to HK$5,551 million.
Excluding the underlying profit of
HK$8,615 million on the disposal of
Festival Walk in 2011 and other non-
recurring items, adjusted underlying
profit increased by HK$1,432 million to
HK$5,545 million in 2012.
This was achieved despite a reduction
in Swire Pacific‟s interest in Swire
Properties from 100% to 82% as a result
of the listing of Swire Properties. The
increase principally reflects a
significant trading profit of HK$1,534
million on completion of the sale of 98
units at the AZURA development in
Hong Kong in the last quarter of 2012.

2012 FINAL RESULTS
- 12 -
Adjusted underlying profit from
property investment decreased. This
reflected the reduction in Swire
Pacific‟s interest in Swire Properties and
the loss of rental income from Festival
Walk following its sale in August 2011,
partially offset by positive rental
reversions from the Hong Kong
portfolio, the first full year contribution
from TaiKoo Hui in Guangzhou and a
better performance at Sanlitun Village.
There were better performances in
2012 from the three managed hotels,
The Upper House and EAST in Hong
Kong and The Opposite House in
Beijing. However, this was more than
offset by pre-opening expenses at the
Mandarin Oriental hotel in TaiKoo Hui
and EAST in Beijing.
INVESTMENT PROPERTIES
Hong Kong
Offices
Swire Properties‟ completed office
portfolio comprises 10.4 million square
feet of space in Hong Kong, including
2.2 million square feet at Pacific Place
in Admiralty, 1.6 million square feet at
Cityplaza in Island East and 6.2 million
square feet at TaiKoo Place in Island
East.
Swire Properties has office tenants in
Hong Kong operating in different
sectors. The top ten office tenants
occupied approximately 21% of the
office space in Hong Kong at 31st
December 2012. Approximately one-
third of the office space in Hong Kong
is occupied by companies operating
in the financial services sector.
The Hong Kong office portfolio did well
in 2012. Demand for space was strong
in the first half, both from new tenants
and from existing tenants wanting
more space. Demand slowed in the
second half but growth in rental
income continued as a result of
reversionary rent increases on tenancy
renewals and rent reviews.
Occupancy rates at Pacific Place and
Island East remained high throughout
the year.
28 Hennessy Road, a 145,390 square
foot office building, was completed in
the second half of 2012. Two of the 24
floors have been leased. The property
continues to attract interest from
smaller businesses currently based in
Central.
At 31st December 2012, the office
occupancy rate (excluding Somerset
House which is scheduled to be
demolished for development in 2013
and the newly opened 28 Hennessy
Road) was 98%.
Retail
Swire Properties manages three retail
malls in Hong Kong: The Mall at Pacific
Place, comprising 0.7 million square
feet; Cityplaza in Island East,
comprising 1.1 million square feet; and
Citygate Outlets at Tung Chung,
comprising 0.5 million square feet. The
malls are wholly-owned by Swire
Properties, except for Citygate Outlets,
in which it has a 20% interest. There
are other minor retail interests in Hong
Kong.
Rental income from the retail portfolio
in Hong Kong improved in 2012. Rental
reversions were positive. This reflected
strong demand for space and a lack
of supply.
The Group‟s wholly-owned malls were
effectively fully let throughout the year.
Retail sales growth in The Mall at
Pacific Place was 0.3% and same store
retail sales growth was 3% (after
excluding major shops which were
closed or fitted out in 2011 and 2012).
Retail sales at the Cityplaza and
Citygate malls were 6% and 21% higher
respectively in 2012 than in 2011.

2012 FINAL RESULTS
- 13 -
Residential The completed residential portfolio comprises Pacific Place Apartments, the recently completed luxury OPUS HONG KONG development (owned by Swire Pacific) and a small number of luxury houses and apartments. Rental income from the residential portfolio continued to improve in 2012. But demand for space at Pacific Place Apartments softened in the fourth quarter of 2012. Two units at OPUS HONG KONG were sold. Occupancy at the residential portfolio was approximately 86% at 31st December 2012 (excluding OPUS HONG KONG). Investment Properties under Construction In 2012, improvement works continued at the Mall at Pacific Place. The space previously occupied by a department store has been reconfigured. New stores have opened. A beauty gallery has been created for retailers of high quality cosmetic and skin care brands. An additional arcade has linked the two sides of the Mall in order to improve the flow of pedestrian traffic. Refurbishment of the external façade is scheduled to be completed in the first half of 2013. Swire Properties has leased the whole of 8 Queen’s Road East, a 19-storey commercial building with 81,346 square feet of space, for a ten year term. Refurbishment of the building is scheduled to be completed later in the first half of 2013.
The property at 23 Tong Chong Street, which is being redeveloped into serviced apartments with a total area of approximately 75,000 square feet, is scheduled to be completed in 2014. In March 2013, the company which owns the existing Citygate Outlets development at Tung Chung in Hong Kong (in which Swire Properties Limited
has a 20% equity interest) won a tender to develop an adjacent commercial site. Mainland China Swire Properties owns and manages one retail centre and two mixed-use developments in Mainland China. Sanlitun Village comprises two neighbouring sites in the Chaoyang district of Beijing, Village South (0.8 million square feet of retail space) and Village North (0.5 million square feet of retail space). Retail tenants in Sanlitun Village sell internationally branded goods. Village South focuses on global mid-market brands, with tenants including the largest Adidas store in the world and the largest Apple store in Mainland China. Tenants at Village North are principally retailers of international and local designer fashion brands. The Opposite House hotel (see below under “Hotels – Mainland China”) is also at Sanlitun Village. Gateway China Fund I, a fund managed by Gaw Capital Partners, owns 20% of the Sanlitun Village development (except the Opposite House, which is wholly-owned by Swire Properties). The fund has an option to sell its 20% interest to Swire Properties before the end of 2013. TaiKoo Hui is a mixed-use development in the Tianhe central business district of Guangzhou with a total area of 3.8 milllion square feet. The development comprises a premium shopping mall, two Grade A office towers, a cultural centre and a Mandarin Oriental hotel with serviced apartments, together with approximately 700 car parking spaces, all of which are interconnected. The shopping mall opened in September 2011, with tenants including retailers of major international brands. The hotel and serviced apartments opened in January 2013.

2012 FINAL RESULTS
- 14 -
INDIGO is a 1.9 million square foot
mixed-use development at Jiangtai in
the Chaoyang district of Beijing,
comprising a retail mall, a Grade A
office tower - ONE INDIGO, and a 369-
room hotel operated by EAST, which
opened in September 2012.
Offices
Gross rental income from the office
portfolio in Mainland China grew
strongly in 2012, reflecting a full-year
contribution from the office towers at
TaiKoo Hui.
At TaiKoo Hui, some of the remaining
office space was taken up during the
year. At 31st December 2012, tenants
(including those who had signed letters
of intent) had committed to take 79%
of the office space at TaiKoo Hui. The
corresponding figure at 31st
December 2011 was 68%. Further
vacant office space at TaiKoo Hui is
expected to be leased in 2013.
The occupancy rate at the offices at
ONE INDIGO was 95% at 31st
December 2012. The corresponding
figure at 31st December 2011 was 46%.
Retail
Gross rental income from the retail
portfolio in Mainland China improved
significantly in 2012. This reflected a full
year of operation in 2012 of the
shopping mall at TaiKoo Hui and better
rental performance at Sanlitun Village.
Retail sales at the shopping mall at
TaiKoo Hui have been encouraging
since it opened in September 2011.
The mall was 99% leased at 31st
December 2012.
At Sanlitun Village, retail sales
increased strongly in 2012 compared
with 2011. At 31st December 2012,
occupancy rates were 97% at Village
South and 90% at Village North.
The shopping mall at INDIGO in Beijing
opened gradually from March 2012. At
31st December 2012, tenants
(including those who had signed letters
of intent) had committed to take 84%
of the space at the mall.
The put option in respect of the non-
controlling interest in Sanlitun Village is
recognised in the accounts. The
movement in its fair value during the
year resulted in a finance charge of
HK$175 million, compared to HK$259
million in 2011.
Investment Properties under
Construction
Site clearance and resettlement works
at the Dazhongli project in Shanghai
have largely been completed. Upon its
scheduled completion in phases from
2016 onwards, the Dazhongli
development will consist of a retail mall,
two office towers and three hotels. The
project will be linked to the Nanjing
West Road Station of Metro Line 13,
which is expected to open at the end
of 2015.
The site is being prepared at the Daci
Temple project in Chengdu. Site
excavation and piling are close to
completion. This mixed-use
development will comprise a street
style retail complex, an office tower, a
boutique hotel and serviced
apartments. The office tower, to be
called “Pinnacle One”, is intended to
be developed for trading purposes.
The project is scheduled to be
completed from 2013 and to open in
phases from 2014 onwards.
In January 2012, Swire Properties
entered into an agreement with Sino-
Ocean Land Limited to fund the whole
of the remaining land premium (and
associated taxes) payable in respect
of the Daci Temple project and certain
working capital requirements in an
aggregate amount of US$230 million.
Following this transaction, Swire
Properties‟ interest in the project was
increased to 81%, reflecting its
contribution to the overall funding of

2012 FINAL RESULTS
- 15 -
the project. Sino-Ocean Land had a
call option, exercisable for one year
commencing from the date of the
agreement, to purchase Swire
Properties‟ additional interest in the
project for an amount equal to one
half of the additional funding plus
interest at the rate of 10% per year.
Swire Properties had the right,
exercisable for one year commencing
one week before the end of the call
option period, to require Sino-Ocean
Land to purchase Swire Properties‟
additional interest in the project on the
same terms as those described above.
In January 2013, the above
arrangements were amended. Sino-
Ocean Land purchased part of Swire
Properties‟ additional interest in the
project and the options in respect of
the remaining part of the additional
interest were extended for a further
year. The effect of the amended
arrangements was to reduce Swire
Properties‟ interest in the project to
63% and to increase Sino-Ocean
Land‟s interest in the project to 37%.
Until the extended options described
above are exercised or lapse, Swire
Properties‟ remaining additional
interest in the project will be
accounted for as a secured loan and
Swire Properties‟ existing interest will
continue to be accounted for as a
50% interest in a jointly controlled entity.
USA
Swire Properties owns 100% of the
office, hotel and residential portions,
and 87.5% of the retail portion, of the
mixed-use development at Brickell
CityCentre located in the financial
district in Miami, with a site area of
393,678 square feet. Construction work
began in June 2012. Phase 1 of the
development, comprising a shopping
centre, a hotel, serviced apartments,
two office buildings and two residential
towers, is scheduled to be completed
in 2015.
Singapore
In December 2012, Swire Properties
agreed to acquire eight residential
units at Hampton Court, 2 Draycott
Park in Singapore as investment
properties.
Valuation of Investment Properties
The portfolio of investment properties
was valued at 31st December 2012
(96% by value having been valued by
DTZ Debenham Tie Leung) on the basis
of open market value. The amount of
this valuation, before associated
deferred tax in Mainland China, was
HK$205,273 million compared to
HK$191,515 million at 31st December
2011 and HK$199,300 million at 30th
June 2012.
The change in the valuation of the
investment property portfolio since 31st
December 2011 principally reflects
increased rental income.
Under HKAS 40, hotel properties are not
accounted for as investment
properties but are included within
property, plant and equipment at cost
less accumulated depreciation and
any provision for impairment losses.
Hong Kong Lease Expiry Profile - at 31st December 2012
% of the total rental income attributable to the Group 2015 and
for the month ended 31st December 2012 2013 2014 beyond
Office 17% 19% 64%
Retail 15% 21% 64%

2012 FINAL RESULTS
- 16 -
Audited financial information Company
Investment Properties Under
Completed Construction Total Total
HK$M HK$M HK$M HK$M
At 1st January 2012 174,130 17,385 191,515 5,266
Translation differences 190 - 190 -
Additions 465 1,812 2,277 73
Disposals (931) (2) (933) (931)
Transfer upon completion 7,391 (7,391) - -
Other net transfers from property, -
plant and equipment 72 5 77 -
Fair value gains 11,674 473 12,147 (12)
192,991 12,282 205,273 4,396
Add: Initial leasing costs 315 - 315 -
At 31st December 2012 193,306 12,282 205,588 4,396
Group
At 1st January 2011 160,763 19,485 180,248 2,295
Translation differences 374 421 795 -
Change in composition of the Group (18,090) - (18,090) -
Additions 141 5,084 5,225 303
Transfer upon completion 11,142 (11,142) - -
Other net transfers from property,
plant and equipment 175 38 213 -
Other net transfers from property
held for development 104 249 353 -
Fair value gains 19,521 3,250 22,771 2,668
174,130 17,385 191,515 5,266
Add: Initial leasing costs 290 - 290 -
At 31st December 2011 174,420 17,385 191,805 5,266
Geographical Analysis of
Investment Properties
2012 2011 2012 2011
HK$M HK$M HK$M HK$M
Held in Hong Kong
On medium-term leases
(10 to 50 years) 25,342 25,143 - -
On long-term leases
(over 50 years) 156,272 144,751 4,396 5,266
181,614 169,894 4,396 5,266
Held in Mainland China
On medium-term leases
(10 to 50 years) 23,105 21,230
Held in USA
Freehold 554 391
205,273 191,515
Group Company
Note:
The Group figures in the table above comprise investment properties owned by Swire
Properties and a small number of properties owned by Swire Pacific Limited which are
managed by Swire Properties. The Company figures represent those investment properties
owned directly by Swire Pacific Limited.

2012 FINAL RESULTS
- 17 -
HOTELS
Hong Kong
Swire Properties wholly-owns Swire
Hotels, which manages two hotels in
Hong Kong, The Upper House, a 117-
room luxury hotel at Pacific Place and
EAST Hong Kong, a 345-room hotel at
Cityplaza. Swire Properties has a 20%
interest in each of the JW Marriott,
Conrad Hong Kong and Island Shangri-
La hotels at Pacific Place and in the
Novotel Citygate in Tung Chung.
The performance of the wholly-owned
and managed hotels improved in 2012.
At The Upper House, revenue per
available room increased by 9% from
2011. At EAST, Hong Kong, revenue
per available room increased by 5%.
The performance of the non-managed
hotels also improved in 2012.
Mainland China
Swire Hotels manages two hotels in
Mainland China, The Opposite House,
a 99-room luxury hotel at Sanlitun
Village, Beijing, and EAST, a 369-room
hotel located at INDIGO, Beijing. Swire
Properties owns the whole of The
Opposite House and 50% of EAST.
Swire Properties owns 97% of, but does
not manage, the Mandarin Oriental at
TaiKoo Hui, which has 263 rooms and
24 serviced apartments.
The accommodation, restaurant and
bar businesses at The Opposite House
continued to improve in 2012.
Revenue per available room increased
by 3% from 2011. EAST, Beijing, opened
in September 2012. The Mandarin
Oriental at TaiKoo Hui opened in
January 2013.
USA
Swire Properties has a 75% interest in
the 326-room Mandarin Oriental Hotel
in Miami. Results in 2012 improved
from 2011 levels. Higher room rates
were partially offset by lower
occupancy rates in the second half.
United Kingdom
Swire Properties wholly-owns four hotels
in the United Kingdom, one each in
Cheltenham, Bristol, Brighton and
Exeter. The hotel in Exeter, The
Magdalen Chapter, re-opened in June
2012 after a major refurbishment.
Although occupancy and room rates
improved in 2012, trading conditions
remained challenging.
CAPITAL EXPENDITURE AND
COMMITMENTS FOR INVESTMENT
PROPERTIES AND HOTELS
Capital expenditure in 2012 on Hong
Kong investment properties and hotels,
including completed projects, was
HK$1,828 million (2011: HK$3,104 million).
Outstanding capital commitments at
31st December 2012 were HK$5,405
million (31st December 2011: HK$6,740
million).
Capital expenditure in 2012 on
Mainland China investment properties
and hotels, including the Group's share
of the capital expenditure of jointly
controlled companies, was HK$1,776
million (2011: HK$3,180 million).
Outstanding capital commitments at
31st December 2012 were HK$7,546
million (2011: HK$8,430 million),
including the Group‟s share of the
capital commitments of jointly
controlled companies of HK$6,620
million (2011: HK$7,101 million). The
Group is committed to funding HK$818
million (31st December 2011: HK$1,828
million) of the capital commitments of
jointly controlled companies in
Mainland China.
Capital expenditure in 2012 on USA, UK
and Singapore investment properties
and hotels was HK$239 million (2011:
HK$102 million). Outstanding capital
commitments at 31st December 2012
were HK$2,963 million (2011: HK$2,510
million).

2012 FINAL RESULTS
- 18 -
Profile of Capital Commitments for Investment Properties and Hotels
(HK$M) Expenditure Commitments *
2016 &
2012 2013 2014 2015 beyond At 31st Dec 2012
Hong Kong 1,828 879 548 606 3,372 5,405
Mainland China 1,776 3,680 2,361 831 674 7,546
USA and others 239 1,360 1,603 - - 2,963
Total 3,843 5,919 4,512 1,437 4,046 15,914
Forecast year of expenditure
* The capital commitments represent the Group's capital commitments plus the Group's share of the
capital commitments of jointly controlled companies. The Group is committed to funding HK$818 million
of the capital commitments of jointly controlled companies.
PROPERTY TRADING
Audited financial information
Property Trading Portfolio at Cost
2012 2011
HK$M HK$M
Properties held for development
Freehold land 188 124
Properties for sale
Completed properties - development costs 401 270
Completed properties - freehold land 4 7
Completed properties - leasehold land 145 4
Properties under development - development costs 1,762 1,329
Freehold land under development for sale 175 175
Leasehold land under development for sale 4,423 5,025
6,910 6,810
Group
Hong Kong
The AZURA development on Seymour
Road was completed in the second
half of 2012. Sales of 98 out of the total
126 units were completed in 2012. A
further 13 units have been sold since
the end of 2012. Swire Properties has
an 87.5% interest in this development.
Superstructure work at the 75,805
square foot residential development at
ARGENTA is progressing on schedule,
with completion and handover to
purchasers expected in 2013. Six of
the total 30 units in the development
have been pre-sold.
Superstructure work at the 151,954
square foot residential development
known as MOUNT PARKER RESIDENCES
(formerly known as Sai Wan Terrace), in
which Swire Properties has an 80%
interest, is progressing on schedule,
with completion expected in 2013 and
handover to purchasers expected in
2014.

2012 FINAL RESULTS
- 19 -
Construction work at the 165,792
square foot Phase 1 of the residential
development at 33 Seymour Road is
progressing on schedule, with
completion expected in 2014 and
handover to purchasers expected in
2015. Foundation work is progressing
at the adjacent Phase 2 of this
residential development. The Phase 2
site is to be redeveloped into a 195,531
square foot residential development,
with completion expected in 2016 and
handover to purchasers expected in
2017.
Superstructure work is progressing at
the 88,555 square foot residential
development known as DUNBAR
PLACE (formerly known as 148 Argyle
Street). Completion of this 50% joint
venture project is expected in 2013
with handover to purchasers expected
in 2014.
Two sites at Cheung Sha, Lantau Island,
are being redeveloped into detached
houses, providing an aggregate GFA
of 64,412 square feet. Completion of
this development and handover to
purchasers is expected in 2015.
USA
Sales of 16 units were closed at the
ASIA residential development in Miami
in 2012. Of the 123 units at ASIA, 109
units had been sold and three units
had been leased at 31st December
2012.
The residential portion of Brickell
CityCentre in Miami, which is intended
to be developed for trading purposes,
is expected to be completed in 2015.
OUTLOOK
Office and Retail:
Hong Kong:
Office – Swire Properties is cautious
about the outlook for 2013. Demand
from financial services companies for
office space in Central is likely to
remain soft. However, occupancy at
Pacific Place is high and there are no
major leases expiring until the latter
part of 2013. Rents are therefore
expected to be fairly resilient in 2013.
At Island East, rents are expected to
remain robust owing to high
occupancy. Somerset House, one of
the techno-centres at Island East, is
scheduled to be demolished for
redevelopment in August 2013, with
completion of an office tower
expected in 2017.
Office tenancies accounting for
approximately 17% of rental income in
the month of December 2012 are due
to expire in 2013 with no committed
renewals or new lettings, with a further
19% due to expire in 2014.
Retail – Despite slower growth in sales
towards the end of 2012, the Hong
Kong retail market is expected to
continue to benefit from local
economic growth and from tourists
from Mainland China. Demand for
retail space, particularly at prime
locations, continues to be strong.
Rents are expected to continue to
increase.
Retail tenancies accounting for
approximately 15% of rental income in
the month of December 2012 are due
to expire in 2013 with no committed
renewals or new lettings, with a further
21% due to expire in 2014.
Mainland China:
Office – Demand for office space and
rental rates is expected to remain
stable in 2013.

2012 FINAL RESULTS
- 20 -
Retail – There has been some reduction in consumer confidence and spending in Mainland China. However, retailers of internationally branded goods in the few high quality shopping malls remain popular. Retail rents are expected to be steady in 2013. Hotels: Results in 2013 from the hotel portfolio will benefit from the fact that EAST, Beijing, will be in operation for its first full year and from a contribution from the Mandarin Oriental in TaiKoo Hui.
Property Trading: Hong Kong: Profits from property trading are expected to be lower in 2013 than in 2012, but nevertheless significant, with the completion of the ARGENTA development and the expected sale of the remaining units at the AZURA development. The effect of substantial increases and other changes in Hong Kong stamp duty on demand for luxury residential properties is uncertain. USA: The residential market in downtown Miami is expected to continue to improve gradually in 2013. Excess condominium supply has been largely absorbed and new condominium developments are being built. Martin Cubbon

2012 FINAL RESULTS
- 21 -
REVIEW OF OPERATIONS
AVIATION DIVISION
OVERVIEW OF THE BUSINESS
The Aviation Division comprises significant investments in the Cathay Pacific group and the
Hong Kong Aircraft Engineering ("HAECO") group.
The Cathay Pacific Group:
The Cathay Pacific group includes Cathay Pacific Airways ("Cathay Pacific"), its wholly-owned
subsidiary Hong Kong Dragon Airlines ("Dragonair"), its 60%-owned subsidiary AHK Air Hong
Kong ("AHK"), an associate interest in Air China and an interest in the Air China Cargo jointly
controlled entity. In addition, Cathay Pacific has interests in companies providing flight
catering and ramp and cargo handling services and in an inventory technical management
joint venture with HAECO. Cathay Pacific is listed on the Hong Kong Stock Exchange.
Cathay Pacific offers scheduled passenger and cargo services to 172 destinations in 39
countries and territories. At 31st December 2012, it operated 138 aircraft and had 92 new
aircraft due for delivery up to 2020. It recently completed the building of its own cargo
terminal in Hong Kong.
Dragonair is a regional airline based in Hong Kong. It operates 38 aircraft on scheduled
services to 44 destinations in Mainland China and elsewhere in Asia.
Cathay Pacific owns 19.57% of Air China, the national flag carrier and a leading provider of
passenger, cargo and other airline-related services in Mainland China. Air China serves 96
domestic and 49 international, including regional, destinations. Cathay Pacific also has a
cargo joint venture with Air China, which operates 11 Boeing 747-400F freighters and carries
cargo in the bellies of the Air China passenger fleet.
AHK, a 60%-owned subsidiary of Cathay Pacific, operates express cargo services for DHL
Express, the remaining 40% shareholder, to 12 Asian cities with a fleet of eight Airbus A300-600F
freighters, three Boeing 747-400BCF freighters dry-leased from Cathay Pacific and one wet-
leased Boeing 727 freighter. In January 2013, the wet-leased Boeing 727 freighter was
replaced by an Airbus A300-600F freighter.
Cathay Pacific and its subsidiaries employ some 29,900 people worldwide (more than 22,800
of them in Hong Kong).
The HAECO Group:
The HAECO group provides aviation maintenance and repair services. Its primary activities
are aircraft maintenance and modification work in Hong Kong (by HAECO) and in Xiamen (by
HAECO’s subsidiary company, Taikoo (Xiamen) Aircraft Engineering Company Limited
("TAECO")).
Engine overhaul work is performed by HAECO's jointly controlled company Hong Kong Aero
Engine Services Limited ("HAESL") and by HAESL's jointly controlled company Singapore Aero
Engine Services Pte. Limited ("SAESL"). The HAECO group has other subsidiaries and jointly
controlled companies in Mainland China, which offer a range of aircraft engineering services.
HAECO is listed on the Hong Kong Stock Exchange.

2012 FINAL RESULTS
- 22 -
STRATEGY:
The strategic objective of Cathay Pacific and HAECO (as listed companies in their own
right) is sustainable growth in shareholder value over the long-term. The strategies
employed in order to achieve this objective are these:
The development and strengthening of Hong Kong as a centre for aviation services,
including passenger, cargo and aircraft engineering services.
The development and strengthening of the airline (Cathay Pacific and Dragonair) and
aircraft engineering (HAECO) brands.
Developing the airlines’ fleets (by investing in modern fuel efficient aircraft) with a view to
their becoming one of the youngest, most fuel efficient fleets in the world.
Maintaining and enhancing high standards of service to passenger, cargo and aircraft
engineering customers.
Strengthening the airlines’ passenger and cargo networks and improving what they do
on the ground and in the air.
Continuing to build the strategic relationship with Air China.
Increasing the range and depth of aircraft engineering services offered by HAECO.
Endeavouring to minimise the impact of the airlines on the environment.
IMPLEMENTING STRATEGIES:
Turnover – Changes in turnover are determined by changes in capacity, load factors and
yields. Capacity is determined by the size and composition of the fleets and by the
intensity of their usage. Load factors are determined by economic conditions,
competition, the routes on which the airlines fly, flight schedules, pricing and standards of
service. Yields depend on pricing and, in the case of passenger services, the split between
premium and economy class passengers. To the extent that these factors are within the
control of the airlines, they do their best to ensure that they result in increased turnover.
However, factors which are not within the control of the airlines, in particular economic
conditions, cause fluctuations in turnover.
HAECO tries to increase turnover by expanding and improving the range of aircraft
engineering services the HAECO group can offer to customers. Where possible, HAECO will
increase prices to generate increased revenue. HAECO’s ability to expand services in
Hong Kong, which is its most important area of operations, can be constrained by labour
shortages.
Operating Costs – Managing operating costs is important for the Cathay Pacific group and
the HAECO group. Fuel is the Cathay Pacific group’s biggest single cost and high fuel
prices have a significant adverse effect on operating results. Managing the risk associated
with changing fuel prices is a high priority. To this end, Cathay Pacific hedges some of its
fuel costs. Investing in a younger, more fuel efficient fleet helps to control fuel costs (and to
reduce the Cathay Pacific group’s environmental impact). The Cathay Pacific group is
vigilant in managing other operating costs but aims to ensure that this does not
compromise the quality of its products and services or the long-term strategic investment in
its business.

2012 FINAL RESULTS
- 23 -
Employee costs make up over 45% of HAECO’s operating expenses. Managing these costs
whilst retaining a highly skilled workforce is a key challenge for HAECO.
Investments – The Cathay Pacific group invests in new aircraft, new facilities and new
services. Investing in new aircraft and facilities can expand capacity and control
operating costs. Investing in new facilities is intended to attract and retain customers.
The HAECO group invests in order to expand its facilities and technical capabilities and to
improve and widen the range of services it can offer to customers. By doing so, HAECO
aims to set itself apart from competitors and to attract and retain new customers.
Sustainability – The Cathay Pacific group and the HAECO group endeavour to minimise
their impact on the environment. The Cathay Pacific group invests in fuel efficient aircraft
and tries to fly the shortest practicable distances between airports and to reduce the
weight of its aircraft. The HAECO group tries to minimise the effect of effluents on the
environment.
The HAECO group conducts business in a manner intended to protect the health and
safety of its employees, its customers, those with whom it does business and the public.
There is safety training and there are safety audits. Safety is of course a core commitment
of the airlines.
Both groups recognise that the development of their staff is key to the sustainable
development of their businesses and accordingly place great emphasis on supporting,
rewarding, motivating and training staff.
Aviation Division – 2012 Performance
Cathay Pacific and Dragonair
2012 2011 Change
Available tonne kilometres ("ATK") Million 26,250 26,383 -0.5%
Available seat kilometres ("ASK") Million 129,595 126,340 +2.6%
Passenger revenue HK$m 70,133 67,778 +3.5%
Revenue passenger kilometres ("RPK") Million 103,837 101,536 +2.3%
Revenue passengers carried '000 28,961 27,581 +5.0%
Passenger load factor % 80.1 80.4 -0.3%pt
Passenger yield HK¢ 67.3 66.5 +1.2%
Cargo revenue – Group HK$m 24,555 25,980 -5.5%
Cargo revenue – Cathay Pacific and
Dragonair
HK$m
21,601
23,335
-7.4%
Cargo and mail carried Tonnes '000 1,563 1,649 -5.2%
Cargo and mail load factor % 64.2 67.2 -3.0%pt
Cargo and mail yield HK$ 2.42 2.42 -
Cost per ATK HK$ 3.64 3.45 +5.5%
Cost per ATK without fuel HK$ 2.13 2.01 +6.0%
Aircraft utilisation Hours per day 12.0 12.3 -2.4%

2012 FINAL RESULTS
- 24 -
On-time performance % 77.4 82.0 -4.6%pt
Average age of fleet Years 10.1 10.6 -4.7%
Number of destinations at year end Destinations 179 167 +7.2%
Fuel consumption – Group Barrels (million) 40.1 40.4 -0.7%
GHG emissions per ATK Tonnes of CO2e
(million)
600 601 -0.2%
Lost time injury rate – Cathay Pacific Per 100 full-time
equivalent
employees
5.3 5.3 -
Lost time injury rate – Dragonair Per 100 full-time
equivalent
employees
4.2 5.0 -16%
HAECO group 2012 2011 Change
Revenue HK$m 5,830 5,171 +13%
Operating costs HK$m 5,328 4,670 +14%
Airframe maintenance manhours sold –
HAECO
Million 2.96 3.00 -1%
Airframe maintenance manhours sold –
TAECO
Million 3.42 3.42 -
Line maintenance movements handled –
HAECO
Average per day 320 306 +5%
Average hours of training per employee Hours 61.0 60.9 +0.2%
Lost time injury rate Number of injuries
per 100 full-time
equivalent
employees
1.76 2.18 -19%
Fleet Profile
At 31st December 2012, the total number of aircraft in the Cathay Pacific and Dragonair fleets
was 176, an increase of 12 since 31st December 2011.
In January 2012, Cathay Pacific ordered six Airbus A350-900s. In August, Cathay Pacific
ordered ten Airbus A350-1000s and converted an existing order for 16 Airbus A350-900s into an
order for 16 Airbus A350-1000s.
In 2012, Cathay Pacific took delivery of 15 new aircraft: five Boeing 777-300ERs, six Airbus A330-
300s and four Boeing 747-8F freighters. Dragonair took delivery of four new Airbus A320-200s.
In response to the high cost of jet fuel, Cathay Pacific is accelerating the retirement of its older,
less fuel-efficient Boeing 747-400 passenger aircraft. Three were retired from the fleet in the
second half of 2012. As at 31 December 2012, there were 18 747-400s in the passenger fleet.
By the end of 2013, this number will be reduced to 12. One more 747-400 will be retired in 2014.

2012 FINAL RESULTS
- 25 -
The introduction of new Boeing 747-8F freighters has resulted in a significant improvement in
the operating economics of Cathay Pacific’s ultra-long-haul cargo services. Two more
aircraft of this type will be delivered in 2013. In addition, three more Boeing 747-8F freighters
will be delivered in 2013 as a result of the agreements with The Boeing Company referred to
below. By the end of 2013, 13 Boeing 747-8F freighters will be in operation.
One Boeing 747-400BCF converted freighter was retired from the fleet and scrapped in 2012.
A further four Boeing 747-400BCF converted freighters were withdrawn from service in 2012
and early 2013 and were sold to The Boeing Company as part of the agreements referred to
below. The third of four Boeing 747-400BCF converted freighters being sold to the cargo joint
venture with Air China was delivered in July 2012 and the final one was sold in March 2013.
The remaining two of the four Airbus A340-300s parked by Cathay Pacific during the financial
crisis of 2008 and 2009 had been returned to their lessors by February 2012. In February 2013,
agreements to lease two new Airbus A321-200 aircraft were entered into. These aircraft will
be delivered in February and October 2014.
In March 2013, the Cathay Pacific group entered into agreements with The Boeing Company
under which the Cathay Pacific group agreed to buy three Boeing 747-8F freighter aircraft
and the agreement to purchase eight Boeing 777-200F freighters entered into in August 2011
was cancelled. Pre-delivery payments already made in respect of the eight Boeing 777-200F
freighters (which were scheduled to be delivered from 2014 to 2016), will be credited to the
consideration for the purchase of the three Boeing 747-8F freighters (which are scheduled to
be delivered in 2013). Under the agreements, Cathay Pacific also acquired options to
purchase five Boeing 777-200F freighters and The Boeing Company agreed to purchase four
Boeing 747-400BCF converted freighters, which were taken out of service in 2012 and early
2013. The transaction is part of a package of transactions between The Boeing Company (on
the one hand) and the Cathay Pacific group, Air China Cargo and Air China (on the other
hand).
At 31st December 2012, the Cathay Pacific group had a total of 92 aircraft on firm order, of
which 16 will arrive in 2013. Including the trade-in deal, 19 aircraft will be delivered in 2013.
2012 FINAL RESULTS
- 26 -
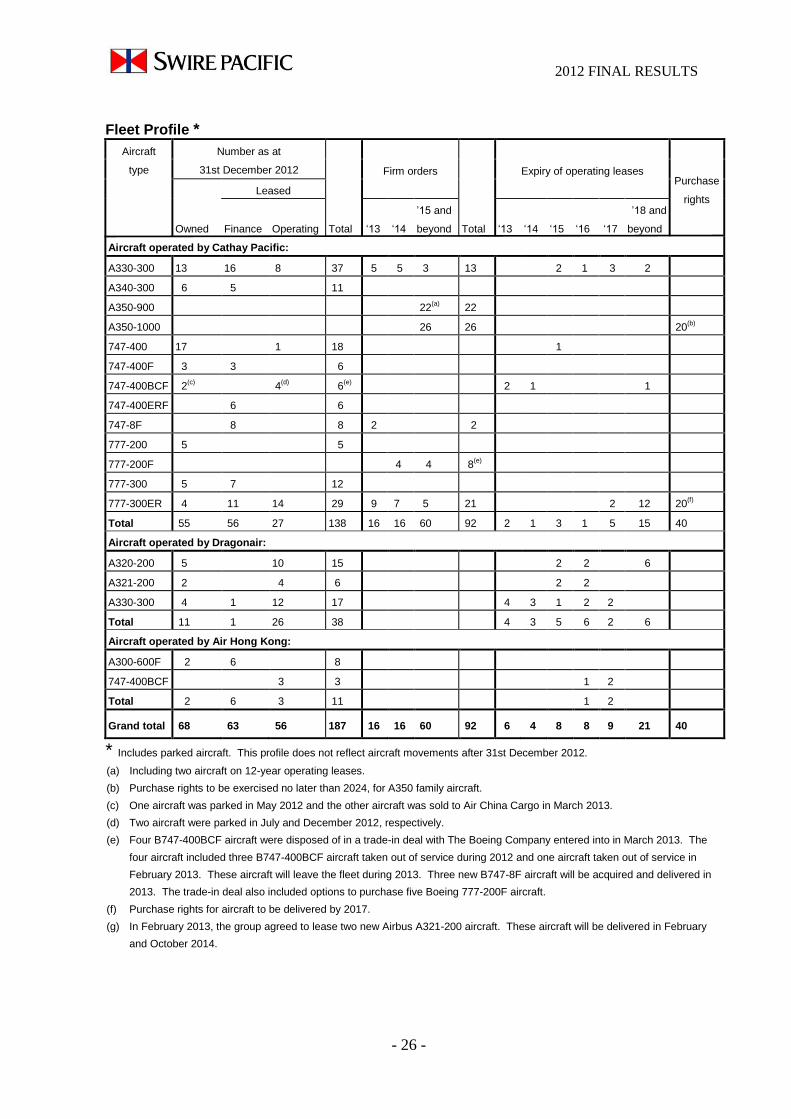
Fleet Profile *
Aircraft
type
Number as at
31st December 2012
Firm orders
Expiry of operating leases Purchase
rights
Leased
Owned
Finance
Operating
Total
‘13
‘14
’15 and
beyond
Total
‘13
‘14
‘15
‘16
‘17
’18 and
beyond
Aircraft operated by Cathay Pacific:
A330-300 13 16 8 37 5 5 3 13 2 1 3 2
A340-300 6 5 11
A350-900 22(a)
22
A350-1000 26 26 20(b)
747-400 17 1 18 1
747-400F 3 3 6
747-400BCF 2(c)
4(d)
6(e)
2 1 1
747-400ERF 6 6
747-8F 8 8 2 2
777-200 5 5
777-200F 4 4 8(e)
777-300 5 7 12
777-300ER 4 11 14 29 9 7 5 21 2 12 20(f)
Total 55 56 27 138 16 16 60 92 2 1 3 1 5 15 40
Aircraft operated by Dragonair:
A320-200 5 10 15 2 2 6
A321-200 2 4 6 2 2
A330-300 4 1 12 17 4 3 1 2 2
Total 11 1 26 38 4 3 5 6 2 6
Aircraft operated by Air Hong Kong:
A300-600F 2 6 8
747-400BCF 3 3 1 2
Total 2 6 3 11 1 2
Grand total 68 63 56 187 16 16 60 92 6 4 8 8 9 21 40
* Includes parked aircraft. This profile does not reflect aircraft movements after 31st December 2012.
(a) Including two aircraft on 12-year operating leases.
(b) Purchase rights to be exercised no later than 2024, for A350 family aircraft.
(c) One aircraft was parked in May 2012 and the other aircraft was sold to Air China Cargo in March 2013.
(d) Two aircraft were parked in July and December 2012, respectively.
(e) Four B747-400BCF aircraft were disposed of in a trade-in deal with The Boeing Company entered into in March 2013. The
four aircraft included three B747-400BCF aircraft taken out of service during 2012 and one aircraft taken out of service in
February 2013. These aircraft will leave the fleet during 2013. Three new B747-8F aircraft will be acquired and delivered in
2013. The trade-in deal also included options to purchase five Boeing 777-200F aircraft.
(f) Purchase rights for aircraft to be delivered by 2017.
(g) In February 2013, the group agreed to lease two new Airbus A321-200 aircraft. These aircraft will be delivered in February
and October 2014.

2012 FINAL RESULTS
- 27 -
Aviation Division – Financial Highlights
2012 2011
HK$M HK$M
HAECO group
Turnover 5,830 5,171
Operating profit 494 532
Attributable profit 659 615
Share of post-tax profits from associated companies
Cathay Pacific group 412 2,405
Attributable profit 1,050 2,999
Accounting for the Cathay Pacific group
The group accounts for its associate interest in the Cathay Pacific group using the equity method of accounting. The Group
recognises its share of net profit or loss as a single line-item in the consolidated income statement.
Cathay Pacific Group
AIRLINE INDUSTRY BACKGROUND
In 2012, the airline industry was
significantly affected by the high price of
jet fuel, pressure on passenger yields and
weak air cargo demand. Economic
uncertainty, particularly in the Eurozone
countries, and an increasingly
competitive environment increased
these difficulties. It was a challenging
year.
2012 RESULTS SUMMARY
The Cathay Pacific group’s attributable
profit on a 100% basis was HK$916 million
in 2012, compared to a profit of HK$5,501
million in 2011.
In May 2012, Cathay Pacific announced
measures designed to protect the
business in an environment of high fuel
prices and weak revenues. The
retirement of less fuel-efficient Boeing
747-400 passenger aircraft was
accelerated. Three of these aircraft had
left the fleet by November. Four Boeing
747-400 BCF converted freighters were
withdrawn from service. Schedules were
changed and capacity was reduced on
some long-haul routes. Inessential
recruitment of ground staff was stopped.
Voluntary unpaid leave was introduced
for cabin crew. By the end of the year,
costs, particularly of aircraft
maintenance and fuel, had been reduced
significantly from what they would
otherwise have been as a result of
reduced capacity and early retirement of
aircraft. However, the reductions were not
enough to offset in full the effects of high
fuel prices and weak revenues.
Passenger revenue in 2012 was HK$70,133
million, an increase of 3.5% compared with
2011. Capacity increased by 2.6%. 29
million passengers were carried, a rise of
5.0% compared to the previous year. The
passenger load factor fell by 0.3
percentage points. Yield increased by
1.2% to HK67.3 cents, largely due to higher
fuel surcharges consequent upon a 1.7%
increase in average fuel prices.
The group’s cargo revenue in 2012 was
HK$24,555 million, a decrease of 5.5%
compared to 2011. Capacity on Cathay
Pacific and Dragonair was down by 3.1%.
The cargo load factor was down by 3.0
percentage points to 64.2%. Yield was the
same as in 2011 at HK$2.42. The tonnage
carried in 2012 fell by 5.2% to 1.6 million
tonnes by comparison with 2011.

2012 FINAL RESULTS
- 28 -
Fuel is the airline’s most significant cost.
The high jet fuel price had a major
impact on operating results in 2012.
Disregarding the effect of fuel hedging,
the group’s fuel costs increased by
HK$323 million (or 0.8%) in 2012. The
increase reflected higher fuel prices
despite a 0.7% decrease in fuel
consumption. Cathay Pacific hedges
some of its fuel costs in an effort to
manage the risk associated with
changing fuel prices. In 2012, a profit of
HK$544 million was recognised from fuel
hedging activities.
Cathay Pacific remains the subject of
antitrust proceedings in various
jurisdictions and continues to defend
itself vigorously. The outcomes are
subject to uncertainties. Cathay Pacific
is not in a position to assess the full
potential liabilities but makes provisions
based on relevant facts and
circumstances.
Passenger Services
Uncertain economic conditions and
strong competition on key routes put
pressure on passenger yields. Premium
class revenues were weak, including
during what is normally the peak period
for corporate travel after the summer.
The numbers of passengers travelling in
the premium classes and premium class
yields were affected by economic
weakness in major economies and travel
restrictions imposed by corporations.
High fuel prices significantly affected the
profitability of passenger services,
particularly on long-haul routes operated
by older, less fuel-efficient aircraft.
Cathay Pacific started flying to
Hyderabad in India in December. In
response to generally robust travel
demand in Asia, Cathay Pacific
increased frequencies on the Bangkok,
Ho Chi Minh City, Kuala Lumpur, Penang,
Chennai and Singapore routes. Four
more flights per week were added to the
Los Angeles route in March 2012.
However, from September 2012, the
frequency of flights on the Los Angeles,
New York and Toronto routes was reduced.
This enabled fuel-efficient Boeing 777-
300ER aircraft to operate on the London,
Paris and San Francisco routes and
reduced the number of services operated
by older, less fuel-efficient Boeing 747-400
aircraft.
In 2012, Dragonair introduced or resumed
flights to eight destinations – Chiang Mai,
Clark, Guilin, Haikou, Jeju, Kolkata,
Taichung and Xi’an. Dragonair added
more flights on two secondary routes in
Mainland China, Ningbo and Qingdao,
increased its Okinawa service from two to
four flights a week and used larger aircraft
for some flights on the Guangzhou,
Kunming and Xiamen routes. The number
of flights per week to Cambodia was
increased from seven to ten in October. In
January 2013, Dragonair added three more
destinations: Wenzhou, Yangon and
Zhengzhou. It will introduce a service to Da
Nang in March 2013.
Cargo Services
Demand for air cargo shipments from the
two key markets, Hong Kong and
Mainland China, was well below
expectations, although there were short
term upturns in March and in the last
quarter reflecting launches of new
consumer electronics products. Capacity
was adjusted in line with demand. New
routes were opened where demand was
robust. Freighter services were introduced
to Zhengzhou in March 2012, to
Hyderabad in May and to Colombo in
December. The service to Zaragoza was
suspended in November. The high price of
fuel made it difficult to operate profitably
on European routes. However, the new
Boeing 747-8F freighters helped to improve
the operating economics of the business.
AHK Air Hong Kong (“AHK”)
AHK recorded a higher profit compared
with 2011. Capacity increased by 11% in
2012 and yield improved by 7%, but the
load factor fell by four percentage points.

2012 FINAL RESULTS
- 29 -
Air China
The Cathay Pacific group’s share of Air
China’s profit is based on accounts
drawn up three months in arrear.
Consequently the 2012 results include Air
China’s results for the twelve months
ended 30th September 2012, with
account being taken of any significant
events or transactions for the period from
1st October 2012 to 31st December 2012.
The Cathay Pacific group recorded a
decrease in profit from Air China in 2012.
This primarily reflected reduced
demand, increased fuel costs and
unfavourable exchange rate
movements.
Air China Cargo Joint Venture (“Air
China Cargo”)
The Cathay Pacific group recorded an
increased loss from Air China Cargo’s
results in 2012 owing to weak demand in
air cargo markets.
Shanghai International Airport Services
Co., Limited
In March 2012, Cathay Pacific
announced the formation of a new
ground handling company, Shanghai
International Airport Services Co.,
Limited. This joint venture between
Cathay Pacific, Air China, the Shanghai
Airport Authority and Shanghai
International Airport Co., Ltd. provides
airport ground handling services at
Shanghai Pudong International Airport
and Shanghai Hongqiao International
Airport.
Inventory Technical Management
In September 2012, HAECO and Cathay
Pacific announced the formation of a joint
venture to undertake inventory technical
management. The joint venture started
operations on 1st November 2012. It is
conducted through HAECO ITM Limited, a
company incorporated in Hong Kong
owned as to 70% by HAECO and 30% by
Cathay Pacific.
Cargo Terminal
Cathay Pacific Services Limited, a wholly
owned subsidiary of Cathay Pacific,
established to design, build and operate
the new Cathay Pacific cargo terminal at
Hong Kong International Airport,
commenced operations at its new HK$5.9
billion facility in February 2013. To ensure a
smooth transition from the current cargo
operations, a staged transition of
operations has been adopted for the
opening of the terminal. The terminal will
be fully operational in the latter half of
2013. When fully operational, the terminal
will have an annual capacity of 2.6 million
tonnes and will employ more than 1,800
staff. It will be one of the biggest and most
sophisticated facilities of its kind in the
world. It will significantly reduce the time it
takes to process and ship cargo in Hong
Kong.
Other Operations
Cathay Pacific Catering Services group
(“CPCS”)
CPCS, a wholly-owned subsidiary of
Cathay Pacific, is the principal flight
kitchen in Hong Kong. CPCS reported an
increase in profit in 2012 compared to 2011
mainly due to growth in the number of
meals produced. Outside Hong Kong,
profits increased in Taipei and Canada
and fell in Ho Chi Minh City and Cebu.

2012 FINAL RESULTS
- 30 -
Hong Kong Airport Services (“HAS”)
HAS, a wholly-owned subsidiary of
Cathay Pacific, provides ramp and
passenger handling and related services
at Hong Kong International Airport.
The 2012 results of HAS were lower than
expected. This reflected high operating
costs and manpower shortages at Hong
Kong International Airport.
Outlook
The Cathay Pacific group operates in a
volatile and challenging industry, one that
will always be highly susceptible to external
factors that remain largely beyond its
control. The cost of fuel remains the biggest
challenge, particularly for an airline where
long-haul operations form a significant part
of the business. The group’s focus will
remain on protecting the business and
managing short-term volatility while
remaining committed to its long-term
strategy. Its financial position remains strong
and it will continue to invest in the future.
The group’s core strengths remain the same
as ever: a superb team, a strong
international network, exceptional
standards of customer service, a strong
relationship with Air China and its position in
Hong Kong. These will help to ensure the
success of the Cathay Pacific group in the
long term.
John R Slosar
Cathay Pacific Group - Fuel Price and Consumption
2003 2004 2005 2006 2007 2008 2009 2010 2011 2012
Fuel Price
(before hedging)
US$ per barrel
(jet fuel) 38.09 52.46 72.52 85.83 91.48 131.95 73.46 94.02 129.47 131.71
Fuel Price
(after hedging)
US$ per barrel
(jet fuel) 35.07 47.42 71.38 84.11 88.14 158.68 63.16 94.15 123.98 129.96
Fuel consumption millions of barrels 20.64 24.86 27.62 30.48 35.82 38.28 35.29 38.66 40.36 40.13
Cathay Pacific and Dragonair - Passenger and Cargo Services Data
2003 2004 2005 2006 2007 2008 2009 2010 2011 2012
Passenger load factor % 72.2 77.3 78.7 79.5 79.8 78.8 80.5 83.4 80.4 80.1
Passenger yield HK¢ 43.9 46.7 48.9 52.9 60.4 63.5 51.1 61.2 66.5 67.3
Cargo load factor % 68.7 68.7 67.0 68.6 66.7 65.9 70.8 75.7 67.2 64.2
Cargo yield HK¢ 193.0 202.0 219.0 225.0 226.0 254.0 186.0 233.0 242.0 242.0
ASK millions 59,280 74,062 82,766 91,769 102,462 115,478 111,167 115,748 126,340 129,595
ATK millions 13,355 15,794 17,751 19,684 23,077 24,410 22,249 24,461 26,383 26,250

2012 FINAL RESULTS
- 31 -
Hong Kong Aircraft Engineering Company (“HAECO”) Group
HAECO Group – Financial Highlights
2012 2011 Change
HK$M HK$M %
Turnover
HAECO 3,421 3,307 +3%TAECO 1,668 1,581 +6%Others 741 283 +162%
Net operating profit 477 525 -9%
Profit attributable to the Company's shareholders
HAECO 329 381 -14%TAECO 70 98 -29%
Share of profit/(loss) of:
HAESL and SAESL 531 415 +28%Other subsidiary and jointly controlled companies (54) (73) +26%
Total 876 821 +7%
Swire Pacific share 659 615 +7%
AVIATION MAINTENANCE AND REPAIR
INDUSTRY BACKGROUND
The aviation industry was affected by
instability and uncertainty in the world’s
major economies in 2012. Despite this,
airlines increased the size of their fleets.
There were more passenger flights than in
2011 but fewer cargo flights. Demand for
HAECO’s aviation maintenance services
in Hong Kong was firm. Demand for
TAECO’s aviation maintenance services in
Mainland China was similar to that in 2011.
2012 RESULTS SUMMARY
The HAECO group’s profit attributable to
shareholders in 2012 on a 100% basis was
HK$876 million, an increase of 7%
compared to the corresponding figure in
2011 of HK$821 million. Demand for
HAECO’s airframe maintenance services
in Hong Kong was strong throughout 2012,
but HAECO was not able to meet this
demand in the second half because of a
shortage of skilled and semi-skilled labour.
This was reflected in the results of the
group for the second half, when profit
attributable to shareholders was HK$394
million, compared with HK$482 million in
the first half of 2012 and HK$396 million in
the second half of 2011. HAECO’s line
maintenance business in Hong Kong
benefited from an increase in aircraft
movements at Hong Kong International
Airport.
Results from TAECO were adversely
affected by exchange rate and deferred
tax movements.
HAESL performed well, with an increase in
engine output and the amount of work
done per engine. The operating results of
the group’s joint ventures in Mainland
China improved. Output was higher, but
losses continued because of under-
utilisation of facilities.
HAECO
Manhours sold by HAECO for airframe
maintenance decreased from 3.00 million
in 2011 to 2.96 million in 2012. Demand for
airframe maintenance remained firm.
Approximately 76% of the work was for
airlines based outside Hong Kong. Line
maintenance aircraft movements
increased by 5% compared with 2011,
with an average of 320 aircraft handled
per day. This reflected growth in air traffic.
HAECO’s operating expenses increased
by 5% to HK$3,062 million reflecting higher
wage costs.

2012 FINAL RESULTS
- 32 -
TAECO
TAECO recorded a 29% decrease in
attributable profit in 2012 to HK$70 million.
Manhours sold by TAECO for airframe
maintenance were 3.42 million in 2012,
the same as in 2011. Five passenger to
freighter conversions took place in 2012,
in line with 2011. Results from TAECO were
adversely affected by exchange rate
differences on forward foreign exchange
contracts and a write-off of deferred tax
assets as a result of a change in the
applicable tax rate from 25% to 15%.
HAESL and SAESL
HAESL recorded a 26% increase in profit to
HK$973 million in 2012. Engine output was
220, compared with 194 in 2011. The
HAECO group’s share of the after-tax
profit of HAESL, including that derived
from HAESL’s interest in SAESL, increased
by 28% in 2012 to HK$531 million.
General
The group continued to invest in Hong
Kong and Mainland China in order to
expand its facilities and technical
capabilities and so to improve and widen
the range of services it can offer to
customers.
In September 2012, HAECO and Cathay
Pacific announced the formation of a
joint venture to undertake inventory
technical management for Cathay
Pacific and other airlines. The joint
venture is conducted through HAECO ITM
Limited, a company incorporated in Hong
Kong owned as to 70% by HAECO and
30% by Cathay Pacific.
TAECO improved its operational
efficiency and developed its capacity for
cabin modification and cabin completion
services.
Taikoo Engine Services (Xiamen)
Company Limited completed 18 quick
turn repairs and six performance
restorations for GE engines. There will be
further investment in equipment to
support this capability.
There was a fire at Taikoo (Xiamen)
Landing Gear Services Company Limited
(“TALSCO”)’s premises in November 2012.
No work has been done by TALSCO at the
premises since then. The recovery of
operations following the fire is likely to
take more than nine months. Provisions of
HK$4 million have been made for possible
uninsured losses.
Outlook
HAECO expects to do less airframe
maintenance work in Hong Kong in 2013
than in 2012, with labour shortages
restricting manhours expected to be sold
in the first half to 1.2 million compared
with 1.6 million in the first half of 2012.
Although these labour shortages may
ease in the second half of 2013, the first
half shortfall is likely to have a material
adverse effect on overall group turnover
and profits for the full year. Line
maintenance services in Hong Kong are
expected to remain stable in 2013.
TAECO’s airframe maintenance business is
expected to improve slightly in 2013,
assisted by its first Airbus corporate jet
cabin completion.
HAESL’s performance in 2013 is expected
to be adversely affected by the early
retirement of some of Cathay Pacific’s
Boeing 747-400 aircraft and by a
reduction in the required frequency of
scheduled maintenance on Trent 700
engines, which power the Airbus A330
aircraft.
The joint ventures in Mainland China are
expected to continue to be affected by
underutilisation of facilities.
The HAECO group will continue to take
measures to improve productivity in order
to mitigate the effect of cost increases.
Augustus Tang

2012 FINAL RESULTS
- 33 -
HAECO Group Key Operating Highlights (2003 – 2012)
YEAR 2003 2004 2005 2006 2007 2008 2009 2010 2011 2012
Airframe
maintenance
manhours sold -
HAECO million 1.35 1.42 1.64 1.85 2.53 2.65 2.39 2.74 3.00 2.96
Airframe
maintenance
manhours sold -
TAECO million 1.70 2.11 2.50 3.58 3.87 4.07 2.98 2.52 3.42 3.42
Line maintenance
movements
handled - HAECO
Average
per day 177 223 253 250 266 274 249 278 306 320

2012 FINAL RESULTS
- 34 -
REVIEW OF OPERATIONS
BEVERAGES DIVISION
OVERVIEW OF THE BUSINESS
Swire Beverages has the exclusive right to manufacture, market and distribute products of
The Coca-Cola Company (“TCCC”) in Hong Kong, Taiwan, seven provinces in Mainland
China and an extensive area of the western USA.
Swire Beverages has two wholly-owned franchise businesses, in Taiwan and the USA, and
two majority owned franchise businesses, in Hong Kong and Fujian province in Mainland
China. It has jointly controlled interests in six other franchises in Mainland China and an
associate interest in a manufacturing company, Coca-Cola Bottlers Manufacturing
Holdings Limited, which supplies still beverages to all Coca-Cola franchises in Mainland
China.
Swire Beverages manufactures over 63 beverage brands and distributes them to a
franchise population of over 440 million people.
The Beverages Supply Chain :
Concentrate Plants – TCCC manufactures concentrated beverage base which it distributes
to its bottlers, including Swire Beverages.
Bottlers – As a Coca-Cola bottler, Swire Beverages converts concentrated beverage base
into ready-to-drink packaged beverages at its 16 bottling plants.
Sales and Distribution – Swire Beverages sells and distributes ready-to-drink packaged
beverages to customers in its franchise territories.
Marketing – Swire Beverages markets the brands it distributes in accordance with plans
developed in conjunction with TCCC.
Potential Environmental Impacts – Swire Beverages consumes water, energy and
packaging materials. It affects the atmosphere and produces waste.
FRANCHISE TERRITORIES
GDP Sales Sales
per volume volume Per capita Per capita
Population capita (million unit (million unit consumption* consumption*
(millions) (US$) cases) cases) (8 oz servings) (8 oz servings)
2012 2002 2012 2002
Mainland China
Guangdong 77.1 10,392 191 60 59 25
Zhejiang 50.2 9,844 149 41 71 23
Anhui 59.9 5,017 71 11 29 4
Jiangsu 54.9 8,940 118 33 52 15
Fujian 37.4 8,442 82 20 52 14
Shaanxi 37.5 5,461 55 17 35 11
Henan 94.0 5,123 117 17 30 4
Hong Kong 7.1 35,596 65 45 219 158
Taiwan 23.3 20,694 58 45 60 49
USA 6.2 42,028 84 79 325 333
* Per capita consumption of all TCCC beverages

2012 FINAL RESULTS
- 35 -
STRATEGY:
The strategic objective of Swire Beverages is to build a world-class bottling system which is
recognised as a first class employer, a first class entity with which to do business and a first class
corporate citizen in all territories where it does business. The strategies employed in order to
achieve this objective are:
An uncompromising commitment to safety and quality.
A commitment to work with TCCC to improve our understanding of our customers’
businesses, and to use that understanding to create value for our customers and
consumers.
A focus on market execution in sales outlets, recognising that our business depends
critically on selling to millions of consumers through such outlets in our franchise territories
every day.
Effective revenue management, through volume growth and optimisation of pricing and
product mix.
Effective management of costs, through improvements in productivity and efficiency in
our supply chain and in sales and distribution.
A commitment to sustainability, by seeking to reduce the environmental impact of our
operations, with a particular focus on water conservation, and by engaging with the
communities in which we operate.
IMPLEMENTING STRATEGIES:
Sales Volume – Swire Beverages aims to increase volume and to do so profitably. This can be
achieved by making its beverages available in more places, by improving market execution and
by selling more brands of beverages and more categories of beverages within brands.
Turnover – Swire Beverages aims to ensure that sales volume growth is translated into revenue
growth. This can be achieved by maintaining or increasing sales prices and by improving the
sales mix. The extent to which this is possible depends on the state of the economies in which it
operates, consumer habits, competition and resistance by consumers to price increases.
Cost of Sales – Swire Beverages aims to reduce the costs associated with the manufacturing and
distribution of its beverage products and at the same time to ensure that high quality goods and
services are provided to customers in a cost efficient and effective manner. Swire Beverages
seeks to minimise overheads by improving productivity and efficiency.
Sustainability – Swire Beverages is committed to the sustainable development of the business, in
particular by reducing consumption of water and energy and by adopting safe working
practices.

2012 FINAL RESULTS
- 36 -
Beverages Division – 2012 Performance
Mainland
China Hong Kong Taiwan USA
Safety Lost Time Injury Rate -1.3% -23.5% -75.3% +78.4%
Quality Production Quality Index +1.7% +2.1% +1.0% -0.4%
Customers Active Outlets +0.9% -3.0% -8.8% +5.9%
Revenue Sales Volume -0.5% +0.3% -5.7% +3.0%
Management Revenue * -3.7% +3.7% +1.1% +0.3%
Cost Gross Margin * +1.7% +6.0% +4.7% +1.8%
Management Operating Profit -21.1% +9.6% -11.9% -9.0%
Water Consumption -0.6% -1.2% +3.2% +1.2%
Energy Consumption -4.2% 0.0% -3.6% 0.0%
Percentage Change
Sustainability
* Per unit case
2012 PERFORMANCE
Beverages Division – Financial Highlights
2012 2011
HK$M HK$M
(Restated)
Turnover 9,216 9,223
Operating profit 483 537
Share of post-tax profits from jointly controlled and associated
companies
323 362
Attributable profit 542 657
Beverages Division – Segment information
2012 2011 2012 2011
HK$M HK$M HK$M HK$M
Mainland China 1,769 1,854 207 265
Hong Kong 2,123 2,046 178 164
Taiwan 1,500 1,600 14 18
USA 3,824 3,723 165 223
Central costs - - (22) (13)
Swire Beverages 9,216 9,223 542 657
Turnover Attributable Profit / (Loss)
Accounting for the Beverages Division
The four wholly-owned and majority-owned franchise businesses (in Hong Kong, Taiwan and the USA and in Fujian province in
Mainland China) are accounted for as subsidiaries and fully consolidated in the financial statements of Swire Pacific. Turnover and
operating profit shown above, therefore, are attributable to these franchise businesses only. The division’s jointly control led interests
in six other franchises in Mainland China and its associate interest in Coca-Cola Bottlers Manufacturing Holdings Limited are
accounted for using the equity method of accounting. Swire Pacific recognises its share of net profit or loss from each of these
companies as a single line-item in the consolidated income statement.
For reference, the total turnover from the jointly controlled interests in six franchises in Mainland China was HK$14,503 million (2011:
HK$14,911 million). The turnover of Coca-Cola Bottlers Manufacturing Holdings Limited, excluding sales to the seven franchises, was
HK$4,763 million (2011: HK$5,659 million).
Note: The results of the Campbell Swire joint venture (which were previously included in the results of the Beverages Division) have
been included in the results of the Trading & Industrial Division from 2012. As a result, the 2011 comparative results for the division
have been restated from those in the Group’s 2011 statutory accounts.

2012 FINAL RESULTS
- 37 -
BEVERAGE INDUSTRY BACKGROUND
The volume of non-alcoholic ready-to-
drink beverages in Mainland China grew
by 10% in 2012. The volume of sparkling
beverages declined by 2%; that of juice
and juice drinks grew by 10%; that of tea
declined by 9%; that of packaged water
grew by 18%; and that of bulk water grew
by 16%. A slowdown in the growth of the
Mainland China economy and
population shifts away from the export-
oriented coastal provinces adversely
affected beverage sales, especially in the
south and east of the country. A number
of successful new products, especially
new juices and juice drinks with perceived
health and other benefits and ready-to-
drink packaged milk tea, gained
significant market share at the expense of
sparkling beverages and other juice and
tea products. Health and safety
concerns, and a desire for products which
are perceived to deliver specific benefits,
are becoming increasingly important to
consumers.
The Taiwanese beverage market grew by
2% in 2012 reflecting strong growth in sales
of tea.
The Hong Kong beverage market grew by
2% in 2012. Sparkling soft drinks volume
decreased by 6%. Still drinks volume grew
by 3%.
The USA beverage market was solid in
2012. Total volumes increased by 1%.
2012 RESULTS SUMMARY
Swire Beverages made an attributable
profit of HK$542 million in 2012, an 18%
decrease from 2011. The decrease
principally reflected a weak performance
in Mainland China, higher taxes in the USA
and higher operating costs in all territories.
Overall sales volume declined by 0.5% to
990 million unit cases, compared with
growth of 8% in 2011. Volume grew in the
USA and Hong Kong but declined in
Mainland China and Taiwan.
Mainland China
Attributable profit from Mainland China
was HK$207 million, a 22% decrease from
2011.
The decrease in profit principally reflected
lower sales volume, a less favourable sales
mix and higher operating costs.
Sales volume was adversely affected by
the slowdown in economic growth,
particularly in the export-oriented
provinces of southern and eastern China.
Volumes grew strongly in inland territories
(for example Henan and Anhui), but not
enough to offset volume reductions in the
southern and eastern markets (for
example Guangdong and Zhejiang).
Successful introductions by competitors of
new juice and tea products also
adversely affected sales volumes. Low-
margin water sales volume increased by
48%. Juice sales volumes declined by 18%.
Notwithstanding a decrease in sales
volumes and an unfavorable change in
sales mix, gross margin increased due to
lower raw material costs. However,
operating profit decreased by 21% due to
a significant increase in operating costs,
particularly staff costs (which increased
by 11%) and IT costs (due to the
introduction of a new Enterprise Resource
Planning system).
Hong Kong
Attributable profit from the Hong Kong
operation was HK$178 million, a 9%
increase from 2011.
Sales volume increased by 0.3%
compared with 2011. Sparkling sales
volume increased by 0.6%, reflecting
strong growth in sales of the Schweppes
brand. Still sales volume was in line with
2011.

2012 FINAL RESULTS
- 38 -
Raw material costs increased by 2% per
unit case. This increase was more than
offset by the favourable effect of
improvements in the sales mix and higher
prices, resulting in a 6% improvement in
margin per unit case.
Taiwan
Attributable profit from Taiwan was HK$14
million, a 22% decrease from 2011.
Sales volume fell by 6% compared with
2011, reflecting generally weak retail
sales. Sparkling and still sales volumes fell
by 7% and 3% respectively. Increased
competition and the generally weak retail
background restricted the scope for
increasing prices, but margins benefited
from a 1% per unit case reduction in raw
material costs. Profit in 2012 was
adversely affected by restructuring costs
of HK$32 million (2011: HK$24 million).
Restructuring is designed to improve the
competitiveness of the Taiwan operations.
USA
Attributable profit from the USA was
HK$165 million, a 26% decrease from 2011.
Sales volume increased by 3%. Sparkling
sales volume increased by 2%. Still sales
volume increased by 7%. Sales of tea
and energy drinks increased significantly.
Revenues benefited from price increases
averaging 0.3%. Margins improved by 2%
per unit case compared with 2011,
reflecting price increases, changes in the
sales mix and lower raw material costs.
Profits were adversely affected by higher
fuel, healthcare and retirement benefit
costs and by a withholding tax of HK$29
million paid on a dividend.
A project to expand warehousing
capacity in Salt Lake City (including
installation of an automated case picking
system) was completed in the second half
of 2012. The total investment was HK$329
million and will improve efficiency.
OUTLOOK
Swire Beverages is cautiously optimistic
about 2013. In Mainland China there are
indications that the pace of economic
growth will resume. This should benefit the
business in Mainland China.
Following completion of its reorganisation,
the business in Taiwan is in a good position
to reinforce its leading position in the
sparkling category and to compete
effectively in other categories, especially
tea, where there are plans to introduce
new products.
The Hong Kong and USA businesses are
doing well and should continue to benefit
from their strong market positions.
Cost inflation will continue to put pressure
on margins in all areas in which Swire
Beverages operates. This is especially true
of staff costs and distribution costs in
Mainland China, which continue to rise.
Swire Beverages is reorganising its
operations to improve productivity and
efficiency so as to offset the effect of
increasing costs. The introduction of new
products, both within categories in which
we currently compete and in new
categories, is also a priority.
P Healy

2012 FINAL RESULTS
- 39 -
Sales Volume
(million unit cases) 2003 2004 2005 2006 2007 2008 2009 2010 2011 2012
Mainland China 237 287 348 415 500 600 700 719 788 783
USA 79 77 79 84 86 86 82 82 81 84
Taiwan 45 46 44 41 46 58 61 62 61 58
Hong Kong 46 46 48 50 55 57 61 60 65 65
407 456 519 590 687 801 904 923 995 990
Capital Expenditure
by Operation (HK$M) 2003 2004 2005 2006 2007 2008 2009 2010 2011 2012
Mainland China 129 176 265 343 464 924 758 1,060 577 831
USA 100 100 89 121 126 147 154 141 334 248
Taiwan 44 64 40 34 50 50 44 48 31 34
Hong Kong 39 36 45 59 64 51 56 76 51 97
312 376 439 557 704 1,172 1,012 1,325 993 1,210
Breakdown of Total Volume by Channel
Mainland
China HK Taiwan USA Total
2012 2012 2012 2012 2012
Modern Trade 23% 37% 74% 67% 31%
General Trade 25% 11% 23% 7% 22%
Other channels 52% 52% 3% 26% 47%
100% 100% 100% 100% 100%
Breakdown of Total Volume by Category
2012 2011
Sparkling 59% 60%
Juice 16% 19%
Tea 3% 4%
Other still (excluding water) 3% 4%
Water 19% 13%
100% 100%

2012 FINAL RESULTS
- 40 -
REVIEW OF OPERATIONS
MARINE SERVICES DIVISION
OVERVIEW OF THE BUSINESS
The Marine Services Division, through the Swire Pacific Offshore group ("SPO"), operates a
fleet of offshore support vessels servicing the energy industry in every major offshore
production and exploration region outside the Americas. The division also has jointly
controlled interests in ship repair and harbour towage services in Hong Kong through the
Hongkong United Dockyards (“HUD”) group.
SPO:
SPO’s Fleet:
At 31 December 2012, SPO was operating a fleet of 80 offshore support vessels. SPO’s
expansion plan involves building larger, more highly specialised vessels capable of
operating in deeper waters, where demand for offshore services is expected to be greatest.
The fleet comprises three main segments, being anchor handling tug supply vessels (“AHTS”),
platform supply vessels (“PSVs”) and construction and specialist vessels (“CSVs”). The CSVs
include inspection, maintenance and repair vessels (“IMRs”), seismic survey vessels, wind
farm installation vessels and accommodation barges.
SPO can support drilling, production, exploration, pipe-laying, subsea construction and
floating production storage and offloading operations. SPO and its subsidiaries can also
carry out seismic survey support, marine salvage, oil spill preparedness and response,
offshore wind farm construction and servicing, oil rig decommissioning, subsea remotely
operated vehicle support and supply base logistics.
Except for vessels committed to long-term charters, SPO’s operating fleet can be easily
relocated from one operating region to another to take advantage of more attractive
employment opportunities.
2012 % 2011 %
Asia 24 30% 20 26%
Australia/New Zealand 9 11% 15 19%
Middle East 19 24% 19 25%
North Sea and West Africa 28 35% 23 30%
Total 80 100% 77 100%

2012 FINAL RESULTS
- 41 -
Four older vessels were sold in 2012 and SPO took delivery of seven new vessels. There were
80 vessels in the fleet as at 31st December 2012 and there are another 26 new vessels on
order or under construction.
SPO – Fleet Size Growth
Additions DisposalsYear-
end
Vessel class 2011 2013 2014 2015
Anchor Handling Tug Supply Vessels 51 - 4 47 - - -
Large Anchor Handling Tug Supply Vessels 15 - - 15 5 4 -
Platform Supply Vessels 8 - - 8 - 2 4
Large Platform Supply Vessels 1 2 - 3 1 6 2
Construction and Specialist Vessels 2 5 - 7 2 - -
77 7 4 80 8 12 6
* SPO's fleet includes one PSV and one CSV chartered from external parties.
2012
Vessels expected
to be received in:
In January 2012, SPO acquired a 70% controlling interest in Altus Logistics Pte Ltd (“Altus
Logistics”), a Singapore-based logistics group working in the oil and gas industry. In
February 2012, SPO acquired a 100% interest in Seabed AS. This company, which has been
renamed Swire Seabed AS (“Swire Seabed”), owned an IMR vessel. In May 2012, Swire
Seabed chartered a second IMR vessel from a third party for five years. In November 2012,
Swire Seabed committed to purchase a third IMR vessel, which is expected to be delivered
in the second quarter of 2013.
In March 2012, SPO exercised an option to purchase a Large PSV which was previously
chartered from a third party and at the same time purchased a sister vessel, which had
recently been built at the same shipyard. Another sister vessel was purchased in the
second half of the year and a fourth sister vessel was delivered in January 2013.
In June 2012, SPO acquired the 19.9% interest in Lamor Swire Environmental Solutions Pte Ltd
that it did not already own. This company has been renamed Swire Emergency Response
Services Pte Ltd.
In the second half of 2012, SPO took delivery of two wind farm installation vessels and one
accommodation barge.
SPO’s Geographical Distribution:
SPO is headquartered in Singapore, with shore support for its vessels provided by outport
offices in Angola, Australia, Brazil, Brunei, Cameroon, Denmark, Equatorial Guinea, Ghana,
India, Indonesia, Malaysia, New Zealand, Norway, Qatar, Philippines, Russia, Scotland and
the United Arab Emirates. Altus Logistics provides logistics to customers from offices in
Australia, Indonesia, Malaysia, Norway, Singapore, the USA and Vietnam.

2012 FINAL RESULTS
- 42 -
SPO’s Competitors and Customers:
Competitors:
The industry has approximately 1,300
offshore support vessel owners. The main
operators are:
SPO’s Principal Customers:
- Tidewater Marine
- Bourbon
- Edison Chouest
- Gulfmark Offshore
- Maersk
- Farstad Shipping
- Oil Majors (ENI, ExxonMobil, Shell,
Total, BP, Chevron, ConocoPhillips)
- National oil companies (PTSC,
Petronas, Petrobras, PTTEP)
- Independent exploration companies
(Anadarko, Apache, Cairn Newfield,
Pioneer)
- Construction and subsea companies
(Leighton Contractors, McDermott,
Saipem, Subsea 7)
- Seismic and survey companies
(WesternGeco, CGG)
HUD:
HUD, a joint venture between Hutchison Whampoa and Swire Pacific, is a leading provider
of ship repair, harbour towage and salvage services from its facilities on Tsing Yi Island in
Hong Kong. HUD has two main business units:
- Ship Repair – HUD provides 24-hour ship repair from a floating dock.
- Salvage and Towage – Hongkong Salvage & Towage (“HKST”) is the largest towage
operator in Hong Kong, operating 15 tugs and providing 24-hour service in Hong
Kong. HKST manages six container vessels which are on long-term contracts to
transport refuse for the Hong Kong Government.
STRATEGY:
The principal strategic objective of the Marine Services Division is to maintain and
strengthen SPO’s position as a leader in the offshore energy supply industry. The strategies
employed in order to achieve this objective are these:
Substantial and continuous investment by SPO in new vessels, especially those designed
to operate in deeper waters, where the fastest growth in oil and gas exploration is
expected.
Selective investment in the provision of complementary marine services with a view to
increasing both the range of services offered to customers and the scope of
opportunities to utilise assets and resources.
A commitment to operational excellence and to maintaining and enhancing high
standards of service to customers, including by placing major emphasis on safety and
training.
Strengthening the global and local network of SPO, both by entry into new areas and
by developing the network in existing areas.
Doing business through operating commercial joint ventures where necessary or
appropriate.
Diversifying into the servicing of offshore wind farm developments (as an end in itself
and as a contribution to the development of sustainable energy).

2012 FINAL RESULTS
- 43 -
IMPLEMENTING STRATEGIES:
Fleet – The key objective is to strengthen SPO’s fleet by making it more
diverse and reducing the average age of the vessels. A more diverse
and younger fleet helps SPO to meet the needs of its customers by
offering modern vessels capable of providing a wide range of offshore
support services. Increased investment in vessels designed to operate
in deeper waters means that SPO is well placed in the market where
the fastest growth in oil and gas exploration is expected. Customers
expect a modern, reliable fleet. SPO’s investments in new vessels and
the retiring of older vessels has reduced the average age of its
tonnage by over a third in the past ten years.
Charter hire revenue – SPO aims to maximise its charter hire revenue,
which is its primary source of revenue. Charter hire revenue depends
on demand for and supply of tonnage and on utilisation and current
charter hire rates (which are themselves a product of demand and
supply but also vary significantly between vessel classes and operating
regions). SPO aims to deploy its vessels where demand and charter
hire rates are expected to be strongest and to offer specialised
offshore services in order to maximise its revenue.
Fleet utilisation – SPO aims to maintain a high fleet utilisation rate by
reducing the number of days that vessels are unavailable. Low
utilisation rates can occur as a result of a lack of demand or because
vessels are unavailable due to repairs and maintenance (a modern
fleet helps in this regard).
Operating costs – While SPO seeks to maximise its revenues, it is also
important that operating costs are kept low to maintain margins. SPO’s
principal operating costs are manning costs, repair and maintenance
costs and depreciation of vessels.
Health and Safety – Customers are increasingly risk averse and
demand high standards of health and safety and operational
excellence. SPO already has a strong reputation in the market for
being a safe and reliable operator, but it constantly seeks to do more
and places great emphasis on safety and training.
2012
PERFORMANCE:
Capital
Expenditure:
HK$5.6bn
Fleet Size:
4% growth
Average Age of
Vessels at Year-
end:
8.5 years
Charter Hire
Revenue:
18% growth
(10% growth
excluding new
acquisitions)
Average Charter
Hire Rates:
+USD1,773 per
day
Average
Utilisation Rate:
+4% pts
Operating Costs:
40% increase
(9% increase
excluding new
acquisitions)
Lost Time Injury
Rate:
10% increase
Average Training
Hours:*
8% increase
* Average training hours represents seafarer health and safety training hours per year.

2012 FINAL RESULTS
- 44 -
2012 PERFORMANCE
Marine Services Division – Financial Highlights
2012 2011
HK$M HK$M
Swire Pacific Offshore group
Charter hire revenue 3,870 3,291
Non-charter hire revenue 994 214
Turnover 4,864 3,505
Charter hire related operating profit 665 642
Non-charter hire related operating profit 325 177
Operating profit 990 819
Attributable profit 917 785
Share of post-tax profits from jointly controlled companies
HUD group 58 78
Attributable profit 975 863
Marine Services Division – Fleet Size 2012 2011
Fleet size (number of vessels)
Swire Pacific Offshore group 80 77
HUD group - Hongkong Salvage & Towage 21 19
Total 101 96

2012 FINAL RESULTS
- 45 -
Swire Pacific Offshore Group
OFFSHORE EXPLORATION AND
PRODUCTION INDUSTRY BACKGROUND
Exploration and production spending
increased by an average of 13% per
annum in 2011 and 2012 as oil companies,
against a background of rising oil prices,
increased exploration and production
activity. As a result, demand for offshore
services increased in 2012 and this was
reflected in higher utilisation of vessels.
However, the over-supply of tonnage
entering the industry continued to restrict
the recovery in charter hire rates.
The move by energy companies towards
exploration in deeper waters continued in
2012, as did demands by national
governments for local participation in
offshore supply vessel contracts. Brazil
and West Africa continued to be
important growth areas.
2012 RESULTS SUMMARY
SPO reported an attributable profit of
HK$917 million in 2012, an increase of 17%
compared to 2011. Excluding the profit of
HK$79 million on disposal of seven vessels
in 2011 and the profit of HK$23 million on
disposal of four vessels in 2012, the
attributable profit increased by 27%
compared to 2011.
Charter hire revenue increased by 18% to
HK$3,870 million in 2012. Of the increase,
HK$343 million was contributed by new
vessels delivered in 2011 and 2012, and
HK$230 million was contributed by Swire
Seabed, acquired in 2012. Fleet utilisation
improved by four percentage points to
90% and average charter hire rates rose
by 10% to USD19,800 per day.
Non-charter hire income increased by
HK$780 million to HK$994 million, of which
HK$601 million was due to the inclusion of
revenue from Altus Logistics, acquired in
2012. HK$77 million was due to higher
revenue from SPO’s salvage business,
which carried out a number of
challenging salvage operations in 2012.
Total operating costs increased by
HK$1,105 million, mainly due to the
inclusion of costs from Swire Seabed and
Altus Logistics, which accounted for 77%
of the increase. Excluding the effect on
operating profit from the two new
acquisitions, the operating profit margin
would have increased by 1.5 percentage
points.
FLEET EXPANSION
Total capital expenditure on new vessels
and other fixed assets in 2012 was
HK$5,583 million, compared to HK$2,992
million in 2011. The main expenditure was
on the two wind farm installation vessels
which were delivered during the year.
SPO committed to purchase 27 vessels in
2011. The commitment to acquire ten
PSVs was converted to an order for six
PSVs and two Large PSVs. One of the
Large PSVs was delivered in 2012 and the
other is expected to be delivered in 2013.
The six smaller PSVs will be delivered in
2014 and 2015.
The shipyard with which SPO contracted
to build three Large AHTS vessels could
not perform the contracts. SPO has
entered into a contract with another
shipyard to complete the first such vessel,
which is expected to be delivered in 2013.
SPO intends to include the remaining two
vessels in a later newbuilding programme.
SPO took delivery of two wind farm
installation vessels and the first of two
accommodation barges in the second
half of 2012. The second
accommodation barge was delivered in
January 2013. SPO has committed to
purchase an additional IMR vessel of a
similar size to the existing IMR vessels,
which is expected to be delivered in 2013.
At 31st December 2012, SPO had total
capital expenditure commitments of
HK$10,301 million (31st December 2011:
HK$13,469 million).

2012 FINAL RESULTS
- 46 -
These commitments reflect SPO’s strategy
of focusing a large part of its new building
programme on vessels capable of
operating in deeper waters where
demand is expected to be greatest and
in improving the balance of PSVs to AHTS
vessels within its fleet.
OUTLOOK
The price of oil is expected to remain high
in 2013 leading to a further increase in
exploration and production commitments
by energy companies. In turn, demand
for offshore support vessels is expected to
improve, but the over-supply of tonnage
in the industry will continue to restrict
charter hire rates until it has been
absorbed by the market.
In the longer-term, depletion of reserves
and increasing consumption of oil and
gas are expected to intensify the trend to
increased exploration by energy
companies in deeper waters. Brazil and
West Africa are expected to be growth
areas, as are Mexico, Australia, China
and the Philippines. Barriers to entry to
certain markets may increase as national
governments demand more local
participation.
To address these industry trends, SPO has
taken steps to develop a fleet which is
balanced, flexible and supported by a
strong network of regional offices and
complementary businesses. The two wind
farm installation vessels will begin their first
projects in Europe and are contracted for
the balance of 2013. The IMR business will
continue to expand with the delivery of a
third IMR vessel and SPO will have two
accommodation barges providing
floating hotel services to those working on
offshore projects. An additional five
Large AHTS vessels, capable of operating
in deep water, are expected to be
delivered in 2013. Together these vessels
represent a significant development in
SPO’s fleet, which was previously
characterised by small and medium AHTS
vessels, and give SPO the capability and
capacity to strengthen its position as a
leader in the offshore marine support
industry.
SPO - Profile of Capital Commitments (HK$M)
Expenditure Commitments
2012 2013 2014 2015 2016 at 31st Dec 2012
Anchor Handling Tug Supply Vessels
and Platform Supply Vessels
2,855
4,835
2,957
1,490
42
9,324
Construction and Specialist Vessels 2,647 741 - - - 741
Other fixed assets 81 187 38 10 1 236
Total 5,583 5,763 2,995 1,500 43 10,301

2012 FINAL RESULTS
- 47 -
1. SPO – Fleet Size and Average Age of Vessels*
Year Dec Dec Dec Dec Dec Dec Dec Dec Dec Dec Dec Dec Dec Dec
category 2003 2004 2005 2006 2007 2008 2009 2010 2011 2012 2013 2014 2015 2016
0-5 18 17 19 28 33 33 27 29 27 30 31 39 39 31
6-10 6 9 10 10 10 15 18 19 29 25 26 28 31 29
11-15 - - - - - 3 8 10 10 15 18 16 19 29
16-20 4 2 2 1 1 - - 2 2 5 6 10 10 10
21-25 26 24 23 14 11 3 2 1 - - - - - -
26-30 1 2 2 9 8 14 14 14 5 1 - - - -
31-35 - - - - - 1 1 1 4 4 2 1 - -
36-40 - - - - - - - - - - 1 1 1 1
Total 55 54 56 62 63 69 70 76 77 80 84 95 100 100
Average
age 13.9 13.9 14.0 12.4 11.0 10.4 10.8 11.1 9.2 8.5 7.9 7.6 7.9 8.9
* Includes two vessels chartered from external parties.
2. SPO – Charter Hire Revenue by Vessel Class
2012 2012 2011 2011
Vessel Class HK$M % HK$M %
Anchor Handling Tug Supply Vessels 1,717 44% 1,615 49%
Large Anchor Handling Tug Supply Vessels 993 26% 946 29%
Platform Supply Vessels 607 16% 580 18%
Large Platform Supply Vessels 165 4% 15 0%
Construction and Specialist Vessels 388 10% 135 4%
Total 3,870 100% 3,291 100%
3. SPO – Lost Time Injury Rate (2003 – 2012)
YEAR 2003 2004 2005 2006 2007 2008 2009 2010 2011 2012
SPO LTIR 0.32 0.19 0.09 0.06 0.11 0.27 0.14 0.14 0.15 0.16
ISOA LTIR 0.24 0.20 0.14 0.14 0.29 0.23 0.10 0.11 0.12 N.A.
(2012 data not available)
4. SPO – Average Utilisation Rates (2003 – 2012)
YEAR 2003 2004 2005 2006 2007 2008 2009 2010 2011 2012
Average utilisation rate 86% 88% 91% 94% 92% 91% 89% 80% 86% 90%

2012 FINAL RESULTS
- 48 -
Hongkong United Dockyards
("HUD") Group
INDUSTRY BACKGROUND
Over supply of tonnage continued to
depress the shipping industry in 2012.
Larger generation container ships are
being launched which HUD’s dockyard is
too small to handle. Hong Kong is still a
major regional container port. But some
Mainland China container ports are
starting to handle more cargo than Hong
Kong.
2012 RESULTS SUMMARY
The attributable profit of the HUD group
for 2012 was HK$58 million compared to
HK$78 million in 2011.
The ship repair division recorded a loss
(before tax and interest and on a 100%
basis) for 2012 of HK$61 million, compared
with a loss of HK$5 million in 2011.
Demand for ship repair services was weak,
reflecting the weakness of the shipping
industry. The division was unable to
handle the new larger generation
container ships. Operating costs
increased because of a shortage of
skilled labour in Hong Kong.
In 2012, HKST’s profit (before tax and
interest and on a 100% basis) was HK$187
million, compared with the corresponding
2011 figure of HK$210 million. Against a
weak shipping industry background, there
were 9% fewer tug moves in 2012 than in
2011.
The final two (of an order of four) 5,000
bhp tugs were delivered during the year
and became operational by July 2012.
OUTLOOK
The ship repair division will continue to be
affected by the weakness of the shipping
industry, by its inability to handle the new
larger generation container ships and by
high operating costs caused by labour
shortages. The results of the ship repair
division are not expected to improve in
2013. HKST expects to maintain its market
share in 2013 and to increase its revenues
from work generated by infrastructure
projects in Hong Kong and from ocean
going work.
J B Rae-Smith

2012 FINAL RESULTS
- 49 -
REVIEW OF OPERATIONS
TRADING & INDUSTRIAL DIVISION
OVERVIEW OF THE BUSINESS
The Trading & Industrial Division has interests in the following wholly-owned companies
and jointly controlled companies:
Swire Resources group – distribution and retailing of sports and casual footwear and
apparel in Hong Kong and Mainland China
Taikoo Motors group – distribution and retailing of motor vehicles in Taiwan and Hong
Kong
Swire Foods:
(i) Taikoo Sugar – packaging and selling sugar in Hong Kong and Mainland China
(ii) Campbell Swire – manufacture and distribution of soup and broth products in
Mainland China
Swire Pacific Cold Storage group – provision of cold storage and warehousing
services in Mainland China
Akzo Nobel Swire Paints – manufacture and distribution of paint in Mainland China
and Hong Kong
Swire Resources Group:
Swire Resources retails and distributes sports and casual footwear, apparel and related
accessories. It operates 175 retail outlets in Hong Kong and 134 retail outlets in Mainland
China. There are 215 single brand outlets and 94 multi-brand outlets, the latter operating
under the Marathon Sports, GigaSports, Catalog, d2r and Actif names.
Swire Resources distributes the following brands of sports and casual footwear, apparel and related accessories: Aerosoles, Arena, Cath Kidston, Chevignon, Columbia, DKNY,
Jockey, Montrail, Mountain Hardwear, Penguin, Repetto, Rockport, Sorel, Speedo, Surf-
Siders, Teva and UGG.
Taikoo Motors Group:
Taikoo Motors sells passenger cars, commercial vehicles, motorcycles and scooters. It is
the principal distributor in Taiwan for Volkswagen and Škoda cars, Volkswagen light
commercial vehicles, Volvo trucks and buses, Harley-Davidson motorcycles and Vespa
scooters. In Hong Kong and Macau, it is the principal importer and distributor of FIAT and
Alfa Romeo passenger cars, and Volvo, UD and Renault trucks.
Swire Foods:
(i) Taikoo Sugar:
Taikoo Sugar packages and sells sugar in Hong Kong and Mainland China under the
Taikoo Sugar brand. It is the market leader in packaged sugar in the retail, catering
and industrial sectors in Hong Kong. In Mainland China, it operates two packaging
plants. It also exports sugar to Southeast Asia, the Middle East and North America,
and sells tea, coffee, salt and pepper in Hong Kong and Mainland China.
(ii) Campbell Swire:
Campbell Swire is a joint venture with The Campbell Soup Company which
manufactures and distributes soup and broth products in Mainland China. The joint
venture has a manufacturing plant in Xiamen. Swire Foods has a 40% interest in the
venture.

2012 FINAL RESULTS
- 50 -
Swire Pacific Cold Storage Group:
Swire Pacific Cold Storage was established in 2010. A 60% equity interest in a company
which operates a cold storage facility in Guangzhou was acquired in September 2012
from John Swire & Sons Pty Ltd, a wholly-owned subsidiary of John Swire & Sons Limited,
the ultimate holding company of the Company. In the second half of 2012, land was
acquired in Shanghai and Hebei on which cold storage facilities will be built. In the first
quarter of 2013, two more sites were acquired (in Nanjing and Ningbo) on which cold
storage facilities will be built. These four cold storage facilities are expected to open in
2014.
Akzo Nobel Swire Paints:
Akzo Nobel Swire Paints is a joint venture with Akzo Nobel which manufactures and
distributes decorative paints, primarily under the Dulux brand, in Mainland China and
Hong Kong. The joint venture has manufacturing plants in Guangzhou, Shanghai and
Hebei.
STRATEGY:
The strategic objective of the Trading & Industrial Division is to develop and strengthen the
trading and industrial businesses which it operates. The strategies employed in order to
achieve this objective are these:
Strengthening the capability of Swire Resources in branded sports and apparel goods,
particularly in the Greater China region and including by expanding the range and
quality of those branded goods and by increasing the number of retail outlets operated
by Swire Resources.
Strengthening the capability of Taikoo Motors in the import and distribution of motor
vehicles, including by selective additions to the portfolio of brands represented.
Expanding Taikoo Motors’ capability into other motor-related businesses and into other
parts of Asia.
Increasing the volume and broadening the range of products sold by Swire Foods.
Establishing a network of cold storage and logistics businesses in Mainland China.
Expanding the distribution network of Akzo Nobel Swire Paints in smaller cities and towns
in Mainland China.
IMPLEMENTING STRATEGIES:
Distribution – A key objective of each business in the Trading & Industrial
Division is to strengthen its distribution capability so as to make its
products available to more people. Swire Resources aims to open new
retail outlets, particularly in Mainland China, where there are greater
opportunities for growth than in Hong Kong. Swire Resources and Taikoo
Motors aim to increase the number of brands which they distribute.
Taikoo Sugar and Akzo Nobel Swire Paints aim to distribute their products
in more cities in Mainland China.
2012
PERFORMANCE:
Number of
Retail Outlets:
+40
Number of New
Brands Sold:
+1
Expansion Into
New Cities:
+14

2012 FINAL RESULTS
- 51 -
Turnover – Strengthening the distribution capability of each business is
expected to lead to sales volume growth. The extent to which sales
volume growth is translated into revenue growth will depend on the
ability of each business to raise prices, reduce discounting and sell a
higher proportion of more expensive goods. The extent to which this is
possible depends largely on the state of the economies in which the
businesses operate, consumer habits, competition and resistance by
consumers to price increases.
Cost of Sales – The businesses of the Trading & Industrial Division aim to
reduce the costs of selling their products. Taikoo Sugar aims to ensure
that suppliers of sugar provide a high quality product in a cost efficient
manner. Swire Resources aims to minimise costs associated with renting
premises.
People – Employees are key to the businesses of the Trading & Industrial
Division. The Trading & Industrial Division believes that proper treatment
of employees is an essential part of conducting a sustainable business.
The businesses of the Trading & Industrial Division aim to build highly-
trained teams, keep staff motivated, reduce staff turnover and adopt
safe working practices.
Vehicles Sold:
10% growth
Sugar Sold:
1% growth
Revenue:
12% growth
Gross Margin:
1% pt increase
Operating
Costs:
20% increase
Average
Training Hours:*
25% decrease
Staff Turnover:
1% pt increase
* Average training hours represents training hours per employee per year.

2012 FINAL RESULTS
- 52 -
2012 PERFORMANCE
Trading & Industrial Division - Financial Highlights
2012 2011
HK$M HK$M
(Restated)
Turnover
Swire Resources group 3,584 2,914
Taikoo Motors group 5,763 5,336
Taikoo Sugar 738 732
Other subsidiary companies 3 -
10,088 8,982
Operating profits/(losses)
Swire Resources group 182 192
Taikoo Motors group 120 121
Taikoo Sugar 7 (2)
Swire Pacific Cold Storage group (24) (17)
Other subsidiary companies and central costs (14) (16)
271 278
Attributable profits/(losses)
Swire Resources group* 143 149
Taikoo Motors group 87 93
Taikoo Sugar 3 (3)
Swire Pacific Cold Storage group^ (22) (18)
Other subsidiary companies and central costs (14) (12)
197 209
* Including post-tax profits from a jointly controlled company within the Swire Resources group
shown below.
^ Including post-tax profits from a jointly controlled company within the Swire Pacific Cold Storage
group shown below.
Share of post-tax profits/(losses) from jointly controlled companies
Swire Resources group 3 2
Campbell Swire (82) (69)
Swire Pacific Cold Storage group 3 -
Akzo Nobel Swire Paints
Other jointly controlled companies
138
(6)
130
-
56 63
Attributable profit (excluding profit on sale of interest in
PUMA)
Profit on sale of interest in PUMA
247
-
270
148
Attributable profit
247 418
2,135 Note: The results of the Campbell Swire joint venture (which were previously included in the results
of the Beverages Division) have been included in the results of the Trading & Industrial
Division from 2012. As a result, the 2011 comparative results for the division have been
restated from those in the Group’s 2011 statutory accounts.

2012 FINAL RESULTS
- 53 -
INDUSTRY BACKGROUND
Retailing in Mainland China and Hong
Kong – The growth of retail sales slowed in
Hong Kong and Mainland China in 2012.
More visitors came to Hong Kong from
Mainland China but they spent less. The
slowdown in Mainland China was in line
with the Mainland China economy
generally.
Car sales in Taiwan and Hong Kong – Car
registrations in Taiwan decreased by 4%
to 360,481 units in 2012. Car registrations
in Hong Kong increased by 3% to 36,837
units in 2012.
Sugar sales in Mainland China and Hong
Kong – The total amount of sugar sold in
Mainland China increased by 3% to
30,864 million pounds in 2012. Sugar sales
in Hong Kong in 2012 were little changed,
at approximately 331 million pounds.
Soup market in Mainland China – Ready
to consume soups and broths are a new
concept in Mainland China, which has
high consumption per capita of home-
made soup. The Trading & Industrial
Division is investing in this industry as it
believes that the development of a
commercial soup market in Mainland
China represents a good business
opportunity.
Cold storage in Mainland China – There
are concerns about the safety and
quality of food in Mainland China.
Foreign investment in the cold storage
industry is welcomed. The Trading &
Industrial Division is investing in this industry
accordingly.
Paint market in Mainland China and Hong
Kong – Total sales of decorative paints in
Mainland China increased by 2% to 2,636
million litres in 2012, reflecting a small
increase in residential property
construction and in demand for
decorative paints. In Hong Kong,
decorative paint sales fell 11% to 12
million litres in 2012, reflecting a reduction
in residential property construction.
2012 RESULTS SUMMARY
Attributable profit from the Trading &
Industrial Division in 2012 decreased by
41% to HK$247 million. Excluding the gain
of HK$148 million on disposal of the
Group’s interest in PUMA in January 2011,
attributable profit decreased by 9% or
HK$23 million. The decrease principally
reflected weaker results from Swire
Resources and Taikoo Motors, increased
losses from Campbell Swire and costs
associated with new business
development.
Swire Resources Group
Excluding the gain on disposal of the
Group’s interest in PUMA in 2011,
attributable profit decreased by 4% in
2012 to HK$143 million. Results from the
distribution of Columbia products were
good. However, the effect of this was
more than offset by expenditure on
developing the new Chevignon business
and higher occupancy and staff costs.
Turnover in Hong Kong was 22% higher
than in 2011. Retail sales benefited from
demand from visitors from Mainland
China and the new Chevignon business.
Gross margins remained broadly the
same as in 2011. Higher occupancy and
staff costs reduced net margins.
Turnover increased by 31% in Mainland
China. This principally reflected increased
sales of Columbia and Chevignon
products. Gross margins declined
because lower margin wholesale sales
accounted for a higher proportion of total
sales and there were more promotions
and discounting.

2012 FINAL RESULTS
- 54 -
Taikoo Motors Group
Attributable profit in 2012 was HK$87
million, compared to HK$93 million in 2011.
This decrease in attributable profit
reflected weaker results from the retail
business and the costs of developing a
new commercial vehicles business in
Hong Kong and a new dealership
business in Mainland China.
Turnover increased by 8% in 2012. This
principally reflected higher sales of cars
and commercial vehicles, particularly in
Taiwan. The FIAT and Alfa Romeo
businesses in Hong Kong did well. Gross
margins improved because of a
favourable product mix.
Taikoo Motors sold 17,441 cars and
commercial vehicles in 2012, 8% more
than in 2011.
Volkswagen passenger car sales in
Taiwan increased by 2% in 2012 to 10,547
units.
1,943 Škoda cars were sold in Taiwan in
2012, compared with 2,047 in 2011.
Taikoo Motors took responsibility for sales
of FIAT and Alfa Romeo passenger cars in
Hong Kong in the second half of 2011.
236 cars were sold in that year. 687 cars
were sold in 2012.
2,401 Volkswagen light commercial
vehicles were sold in Taiwan in 2012, 16%
more than in 2011.
Sales of Volvo commercial vehicles in
Taiwan increased by 46% compared to
2011. 362 Volvo trucks and buses were
sold in the year.
In April 2012, Taikoo Motors started to
assemble Volvo trucks in Taiwan. 220
Volvo trucks were assembled in the year.
Sales of Volvo trucks started in Hong Kong
in June 2012. 132 Volvo trucks were sold
in the year.
Sales of Harley-Davidson motorcycles
continued to grow. 504 motorcycles were
sold in Taiwan in 2012, an increase of 1%
from 2011.
Sales of Vespa scooters started in Taiwan
in April 2011. 1,507 scooters were sold in
that year. In 2012 1,886 scooters were
sold.
At the end of 2012, Taikoo Motors
operated 22 showrooms and 16 service
centres in Taiwan and two showrooms
and two service centres in Hong Kong.
Swire Foods
Taikoo Sugar
Taikoo Sugar reported an attributable
profit of HK$3 million in 2012, compared
with a loss of HK$3 million in 2011.
Taikoo Sugar sold 17.2 million pounds of
sugar to retail and catering users in Hong
Kong, an increase of 6% compared with
2011. In Mainland China, Taikoo Sugar
sold 28.1 million pounds of sugar in 2012,
an increase of 8% compared with 2011.
The increase reflected expansion of the
distribution network in Mainland China.
Turnover in Mainland China was 24%
higher than in 2011, reflecting both
volume and price increases. Margins
benefited from a decrease in average
sugar costs. Taikoo Sugar sold sugar in
102 cities in Mainland China at the end of
2012. In order to expand the business in
Mainland China, a third plant (in
Chengdu) will start operations shortly.
Campbell Swire
The joint venture with The Campbell Soup
Company manufactures, sells and
distributes soup and broth products in
Mainland China under the Campbell’s
and Swanson brands. Initial volume
growth has been slow, as might be
expected for what is a new concept in
Mainland China. An attributable loss of
HK$82 million was recorded in 2012. This
was in line with expectations.

2012 FINAL RESULTS
- 55 -
Cold Storage
Swire Pacific Cold Storage recorded an
attributable loss of HK$22 million in 2012
compared to a loss of HK$18 million in
2011. This principally reflected the costs of
developing new cold stores in Shanghai
and Hebei. These costs were partly offset
by an attributable profit of HK$3 million
from the 60% interest in Guangdong Swire
Cold Chain Logistics Co. Ltd. which was
acquired in September 2012.
Akzo Nobel Swire Paints
Attributable profit for 2012 was HK$138
million, compared to HK$130 million in
2011.
Sales volume in Mainland China grew by
12% from 2011. Lower average material
costs resulted in increased gross margins.
But the beneficial effect of this was
partially offset by higher operating costs,
in particular, staff and selling and
distribution costs. Akzo Nobel Swire Paints
distributed paint in 603 cities in Mainland
China at the end of 2012.
OUTLOOK
The outlook for Swire Resources in 2013
depends principally on the growth of
retail sales in Hong Kong and the
performance of the Columbia wholesale
business in Mainland China. The outlook
for retail sales in Hong Kong will depend
on the growth in the number of visitors to
Hong Kong from Mainland China. In any
event, increased staff and rental costs are
likely to put pressure on profit margins.
The outlook for Taikoo Motors depends
principally on the economic outlook for
Taiwan and its effect on the sales of cars
and commercial vehicles. The
Volkswagen group plans to set up a
national sales company in Taiwan. There
will be a transitional period up to the end
of 2014 (subject to fulfilment of certain
conditions) for Taikoo Motors to cease to
be the Volkswagen importer in Taiwan.
Taikoo Motors will focus on the
development of its dealer network and
other motor-related businesses in Taiwan
and elsewhere in Asia. It will also
continue to seek to broaden its
geographical coverage by developing
businesses in Mainland China and
Malaysia. The costs of developing sales
and of expanding showrooms are
expected to increase.
Swire Foods intends to start selling hot
cereals and dried fruits.
Taikoo Sugar is increasing the number of
cities in which it sells its products in
Mainland China and expects to increase
the volume of sales in 2013.
Campbell Swire will increase the number
of products which it sells and expects solid
but gradual growth in retail and catering
sales.
Swire Pacific Cold Storage will be
principally engaged in constructing its
four new cold stores in Mainland China
and in acquiring suitable sites for more
cold stores in Mainland China.
Akzo Nobel Swire Paints expects to
continue to expand its network in
Mainland China in 2013.
The results of the division as a whole are
likely to continue to be affected by the
cost of new business development.
J B Rae-Smith

2012 FINAL RESULTS
- 56 -
FINANCIAL REVIEW
Additional information is provided below to reconcile reported and underlying profit and
equity attributable to the Company’s shareholders. The reconciling items principally adjust
for net revaluation movements on investment properties and the associated deferred tax in
Mainland China and for other deferred tax provisions in relation to investment properties.
There is also an analysis of the effect of other significant non-recurring items.
Underlying profit 2012 2011
Note HK$M HK$M
Profit attributable to the Company's shareholders per accounts 17,484 32,210
Adjustments re investment properties:
Revaluation of investment properties (a) (12,739) (23,491)
Deferred tax on investment properties (b) 661 523
Realised profit on sale of investment properties (c) 763 7,977
Depreciation of investment properties occupied by the Group (d) 20 27
Non-controlling interests' share of adjustments 2,155 46
Underlying profit attributable to the Company's shareholders 8,344 17,292
Other significant items:
Profit on sale of interest in Festival Walk - (8,615)
Profit on sale of investment properties (651) -
Profit on sale of interest in PUMA - (148)
Loss/(profit) on sale of property, plant and equipment and other investments 135 (91)
Net impairment of property, plant and equipment, leasehold land and
intangible assets 82 290
Adjusted underlying profit 7,910 8,728
Underlying equity
Equity attributable to the Company's shareholders per accounts 208,738 227,559
Deferred tax on investment properties 3,236 3,284
Unrecognised valuation gains on hotels held as part of mixed-use
developments (e) 1,423 912
Revaluation of investment properties occupied by the Group 1,036 997
Cumulative depreciation of investment properties occupied by the Group 58 63
Underlying equity attributable to the Company's shareholders 214,491 232,815
Underlying non-controlling interests 40,961 4,961
Underlying equity 255,452 237,776
Notes:
(a) This represents the net revaluation movements as shown in the consolidated income statement plus the Group's share of net
revaluation movements of jointly controlled and associated companies.
(b) This represents deferred tax movements on the Group’s investment properties and the Group’s share of deferred tax movements
on investment properties held by jointly controlled and associated companies. These comprise deferred tax on revaluation
movements on investment properties in Mainland China and deferred tax provisions made in respect of investment properties
held for the long-term where it is considered that the liability will not reverse for some considerable time.
(c) Prior to the implementation of HKAS 40, changes in the fair value of investment properties were recorded in the revaluation
reserve rather than the consolidated income statement. On sale, the revaluation gains were transferred from the revaluation
reserve to the consolidated income statement.
(d) Prior to the implementation of HKAS 40, no depreciation was charged on investment properties occupied by the Group.
(e) Under HKAS 40, hotel properties are stated in the accounts at cost less accumulated depreciation and any provision for
impairment losses, rather than at fair value. If HKAS 40 did not apply, those hotel properties owned by subsidiary and jointly
controlled companies and held for the long-term as part of mixed-use property developments would be accounted for as
investment properties. Accordingly, any increase or write-down in their value would be recorded in the revaluation reserve
rather than the consolidated income statement.

2012 FINAL RESULTS
- 6 -
Consolidated Income Statement
For the year ended 31st December 2012
2012 2011
Note HK$M HK$M
Turnover 2 43,859 36,286
Cost of sales (24,923) (21,359)
Gross profit 18,936 14,927
Distribution costs (4,406) (3,959)
Administrative expenses (3,236) (3,084)
Other operating expenses (348) (250)
Profit on sale of interests in associated and
jointly controlled companies - 149
Other net gains 194 870
Change in fair value of investment properties 12,147 22,771
Operating profit 3 23,287 31,424
Finance charges (1,988) (1,687)
Finance income 191 77
Net finance charges 4 (1,797) (1,610)
Share of profits less losses of jointly controlled companies 1,647 1,801
Share of profits less losses of associated companies 607 2,570
Profit before taxation 23,744 34,185
Taxation 5 (2,289) (1,630)
Profit for the year 21,455 32,555
Profit for the year attributable to:
The Company's shareholders 17,484 32,210
Non-controlling interests 3,971 345
21,455 32,555
Cash dividends
First Interim - paid 1,505 1,730
Special Interim - paid - 4,514
Second Interim - declared/paid 3,761 3,536
Special interim dividend by way of a distribution in specie 31,589 -
6 36,855 9,780
HK$ HK$
Earnings per share for profit attributable to
the Company's shareholders (basic and diluted) 7
'A' shares 11.62 21.41
'B' shares 2.32 4.28
- 57 -

2012 FINAL RESULTS
- 7 -
Consolidated Statement of Comprehensive Income
For the year ended 31st December 2012
2012 2011
HK$M HK$M
Profit for the year 21,455 32,555
Other comprehensive income
Cash flow hedges
- gains recognised during the year 86 88
- transferred to net finance charges (19) 5
- transferred to operating profit - exchange differences 33 -
- transferred to initial cost of non-financial assets (56) 1
- deferred tax 13 (46)
Net fair value changes on available-for-sale assets
- gains/(losses) recognised during the year 153 (100)
- transferred to operating profit - (3)
Revaluation of property previously occupied by the Group
- gains recognised during the year 54 188
- deferred tax (9) -
Share of other comprehensive income of jointly controlled
and associated companies 860 208
Net translation differences on foreign operations 215 698
Other comprehensive income for the year, net of tax 1,330 1,039
Total comprehensive income for the year 22,785 33,594
Total comprehensive income attributable to:
The Company's shareholders 18,767 33,142
Non-controlling interests 4,018 452
22,785 33,594
- 58 -

2012 FINAL RESULTS
- 8 -
Consolidated Statement of Financial Position
at 31st December 2012 2012 2011
Note HK$M HK$M
ASSETS AND LIABILITIES
Non-current assets
Property, plant and equipment 33,641 27,288
Investment properties 205,588 191,805
Leasehold land and land use rights 998 969
Intangible assets 4,509 4,270
Properties held for development 188 124
Jointly controlled companies 20,969 18,866
Associated companies 27,946 27,145
Available-for-sale assets 340 188
Long-term other receivables 17 6
Derivative financial instruments 643 785
Deferred tax assets 338 305
Retirement benefit assets 637 600
295,814 272,351
Current assets
Properties for sale 6,910 6,810
Stocks and work in progress 3,860 3,287
Trade and other receivables 8 8,835 6,275
Derivative financial instruments 31 18
Cash and cash equivalents 5,888 3,707
Short-term deposits 310 215
25,834 20,312
Current liabilities
Trade and other payables 9 14,376 14,179
Taxation payable 873 557
Derivative financial instruments 49 207
Bank overdrafts and short-term loans 1,918 1,333
Long-term loans and bonds due within one year 5,508 8,750
22,724 25,026
Net current assets/(liabilities) 3,110 (4,714)
Total assets less current liabilities 298,924 267,637
Non-current liabilities
Perpetual capital securities 2,325 2,331
Long-term loans and bonds 40,917 27,237
Receipt in advance from an associated company 48 58
Derivative financial instruments 125 119
Deferred tax liabilities 5,757 5,050
Deferred profit 114 108
Retirement benefit liabilities 304 258
49,590 35,161
NET ASSETS 249,334 232,476
EQUITY
Share capital 10 903 903
Reserves 11 208,738 226,656
Equity attributable to the Company's shareholders 209,641 227,559
Non-controlling interests 39,693 4,917
TOTAL EQUITY 249,334 232,476
- 59 -

2012 FINAL RESULTS
- 9 -
Consolidated Statement of Cash Flow
For the year ended 31st December 2012 2012 2011
HK$M HK$M
Operating activities
Cash generated from operations 10,186 9,204
Interest paid (2,053) (1,690)
Interest received 101 88
Tax paid (1,290) (913)
6,944 6,689
Dividends received from jointly controlled and associated companies and
available-for-sale assets 1,337 2,859
Net cash generated from operating activities 8,281 9,548
Investing activities
Purchase of property, plant and equipment (7,183) (4,735)
Additions of investment properties (2,616) (4,993)
Purchase of intangible assets (19) (28)
Proceeds from disposals of property, plant and equipment 100 84
Proceeds from disposals of vessels 49 86
Proceeds from disposals of investment properties 995 -
Proceeds from disposal of Festival Walk - 18,305
Net cash outflow on disposal of subsidiary companies - (6)
Purchase of shares in subsidiary companies (220) (39)
Purchase of shares in jointly controlled companies (296) (77)
Purchase of shares in associated companies (63) (1,299)
Purchase of available-for-sale assets - (3)
Proceeds from disposal of interest in a jointly controlled company - 2
Proceeds from disposal of interest in an associated company - 413
Proceeds from disposals of available-for-sale assets - 22
Loans to jointly controlled companies (1,426) (2,339)
Repayment of loans by jointly controlled companies 293 1,169
Net loans from/to associated companies 66 15
Net (increase)/decrease in deposits maturing after more than three months (134) 36
Initial leasing costs incurred (115) (193)
Net cash (used in)/generated from investing activities (10,569) 6,420
Net cash (outflow)/inflow before financing (2,288) 15,968
Financing activities
Loans drawn and refinancing 19,455 6,998
Repayment of loans and bonds (9,129) (13,078)
10,326 (6,080)
Security deposits uplifted 42 170
Capital contribution from non-controlling interests 97 24
Dividends paid to the Company's shareholders (5,041) (10,005)
Dividends paid to non-controlling interests (954) (146)
Net cash generated from/(used in) financing activities 4,470 (16,037)
Increase/(decrease) in cash and cash equivalents 2,182 (69)
Cash and cash equivalents at 1st January 3,706 3,790
Currency adjustment (4) (15)
Cash and cash equivalents at 31st December 5,884 3,706
Represented by:
Bank balances and short-term deposits maturing within three months 5,888 3,707
Bank overdrafts (4) (1)
5,884 3,706
- 60 -

2012 FINAL RESULTS
- 61 -
1. Segment information
(a) Information about reportable segments – Analysis of Consolidated Income Statement Share of profits less
Inter- Share of profits less losses of Tax Profit attributable Depreciation and
External segment Operating Finance Finance losses of jointly associated (charge)/ Profit for to the Company's amortisation charged
Year ended 31st December 2012 turnover turnover profit charges income controlled companies companies credit the year shareholders to operating profit
HK$M HK$M HK$M HK$M HK$M HK$M HK$M HK$M HK$M HK$M HK$M
Property
Property investment 9,060 63 6,873 (1,443) 113 146 - (770) 4,919 4,019 (177)
Change in fair value of investment properties - - 12,159 - - 568 1 (638) 12,090 9,900 -
Property trading 4,147 - 2,395 - 3 (14) - (422) 1,962 1,360 (20)
Hotels 781 1 (39) (40) - (40) 160 (29) 12 11 (123)
13,988 64 21,388 (1,483) 116 660 161 (1,859) 18,983 15,290 (320)
Aviation
Cathay Pacific group - - - - - - 412 - 412 412 -
HAECO group 5,830 - 494 (35) 18 564 - (132) 909 659 (443)
Others - - (52) - - 6 - - (46) (21) (52)
5,830 - 442 (35) 18 570 412 (132) 1,275 1,050 (495)
Beverages
Mainland China 1,769 - (1) (54) 15 290 33 (46) 237 207 (95)
Hong Kong 2,122 1 217 - - - - (20) 197 178 (70)
Taiwan 1,500 - 25 (7) - - - (4) 14 14 (59)
USA 3,824 - 264 - 1 - - (100) 165 165 (146)
Central costs - - (22) - - - - - (22) (22) -
9,215 1 483 (61) 16 290 33 (170) 591 542 (370)
Marine Services
Swire Pacific Offshore group 4,864 - 990 (24) 4 - 1 (42) 929 917 (590)
HUD group - - - - - 58 - - 58 58 -
4,864 - 990 (24) 4 58 1 (42) 987 975 (590)
Trading & Industrial
Swire Resources group 3,584 - 182 - 3 3 - (53) 135 143 (22)
Taikoo Motors group 5,763 - 120 (8) 2 - - (27) 87 87 (55)
Taikoo Sugar 606 132 7 - - - - (4) 3 3 (2)
Campbell Swire - - - (6) - (76) - - (82) (82) -
Swire Pacific Cold Storage - - (24) - - 3 - (1) (22) (22) -
Akzo Nobel Swire Paints - - - - - 145 - (7) 138 138 -
Other activities 3 - (14) - - (6) - - (20) (20) (1)
9,956 132 271 (14) 5 69 - (92) 239 247 (80)
Head Office
Net income/(expenses) 6 42 (275) (1,414) 1,075 - - 6 (608) (608) (2)
Change in fair value of investment properties - - (12) - - - - - (12) (12) -
6 42 (287) (1,414) 1,075 - - 6 (620) (620) (2)
Inter-segment elimination - (239) - 1,043 (1,043) - - - - - -
Total 43,859 - 23,287 (1,988) 191 1,647 607 (2,289) 21,455 17,484 (1,857)
Notes: Sales between business segments are accounted for at competitive market prices charged to unaffiliated customers for similar goods and services. Interest charged by Head Office to the business segments is based on market interest rates and the Group‟s cost of debt.

2012 FINAL RESULTS
- 62 -
1. Segment information (continued)
(a) Information about reportable segments – Analysis of Consolidated Income Statement (continued) Inter- Share of profits less Share of profits less Tax Profit attributable Depreciation and
External segment Operating Finance Finance losses of jointly losses of associated (charge)/ Profit for to the Company's amortisation charged
turnover turnover profit charges income controlled companies companies credit the year shareholders to operating profit
Year ended 31st December 2011
Property
HK$M HK$M HK$M HK$M HK$M HK$M HK$M HK$M HK$M HK$M HK$M
Property investment 8,591 60 6,781 (1,464) 24 123 - (759) 4,705 4,695 (170)
Change in fair value of investment properties - - 20,179 - - 676 1 (480) 20,376 20,330 -
Property trading 210 3 (50) (5) 3 59 - (3) 4 7 (9)
Hotels 717 - (93) (35) - (7) 155 (53) (33) (33) (121)
9,518 63 26,817 (1,504) 27 851 156 (1,295) 25,052 24,999 (300)
Aviation
Cathay Pacific group - - - - - - 2,405 - 2,405 2,405 -
HAECO group 5,171 - 532 (25) 18 435 - (84) 876 615 (421)
Others - - (52) - - 4 - - (48) (21) (52)
5,171 - 480 (25) 18 439 2,405 (84) 3,233 2,999 (473)
Beverages
Mainland China 1,854 - 22 (48) 8 355 7 (43) 301 265 (95)
Hong Kong 2,045 1 197 - - - - (16) 181 164 (64)
Taiwan 1,600 - 28 (6) - - - (4) 18 18 (59)
USA 3,723 - 303 - 3 - - (83) 223 223 (136)
Central costs - - (13) - - - - - (13) (13) -
9,222 1 537 (54) 11 355 7 (146) 710 657 (354)
Marine Services
Swire Pacific Offshore group 3,505 - 819 (5) 2 - 2 (26) 792 785 (479)
HUD group - - - - - 78 - - 78 78 -
3,505 - 819 (5) 2 78 2 (26) 870 863 (479)
Trading & Industrial
Swire Resources group 2,914 - 192 - 3 2 - (50) 147 149 (20)
Taikoo Motors group 5,336 - 121 (2) 2 - - (28) 93 93 (38)
Taikoo Sugar 612 120 (2) (1) - - - - (3) (3) (1)
Campbell Swire* - - (4) (5) - (60) - - (69) (69) -
Swire Pacific Cold Storage - - (17) - - - - (1) (18) (18) -
Akzo Nobel Swire Paints - - - - - 136 - (6) 130 130 -
Sale of interest in PUMA - - 148 - - - - - 148 148 -
Other activities - - (12) - - - - - (12) (12) (1)
8,862 120 426 (8) 5 78 - (85) 416 418 (60)
Head Office
Net income/(expenses) 8 40 (247) (1,245) 1,168 - - 6 (318) (318) (1)
Change in fair value of investment properties - - 2,592 - - - - - 2,592 2,592 -
8 40 2,345 (1,245) 1,168 - - 6 2,274 2,274 (1)
Inter-segment elimination - (224) - 1,154 (1,154) - - - - - -
Total 36,286 - 31,424 (1,687) 77 1,801 2,570 (1,630) 32,555 32,210 (1,667)
Notes: Sales between business segments are accounted for at competitive market prices charged to unaffiliated customers for similar goods and services. Interest charged by Head Office to the business segments is based on market interest rates and the Group‟s cost of debt.
* Campbell Swire has been accounted for under the Trading & Industrial Division rather than the Beverages Division to reflect the basis on which the Group‟s internal segment reports are prepared.

2012 FINAL RESULTS
- 63 -
1. Segment information (continued)
(a) Information about reportable segments (continued)
Analysis of total assets of the Group At 31st December 2012
Jointly Bank deposits Additions to
Segment controlled Associated and Total non-current
assets companies companies securities assets assets (note)
HK$M HK$M HK$M HK$M HK$M HK$M
Property
Property investment 206,004 12,737 55 1,529 220,325 2,396
Property trading and development 7,272 1,063 - 345 8,680 66
Hotels 5,532 1,078 666 66 7,342 414
218,808 14,878 721 1,940 236,347 2,876
Aviation
Cathay Pacific group - - 26,233 - 26,233 -
HAECO group 8,074 1,171 - 1,423 10,668 349
Others 4,727 2,821 - - 7,548 -
12,801 3,992 26,233 1,423 44,449 349
Beverages
Swire Beverages 6,011 1,427 981 756 9,175 489
Marine Services
Swire Pacific Offshore group 19,433 2 11 251 19,697 6,170
HUD group - 55 - - 55 -
19,433 57 11 251 19,752 6,170
Trading & Industrial
Swire Resources group 855 18 - 364 1,237 28
Taikoo Motors group 2,750 - - 14 2,764 186
Taikoo Sugar 139 - - 50 189 2
Campbell Swire - (55) - - (55) -
Swire Pacific Cold Storage 81 255 - 33 369 -
Akzo Nobel Swire Paints - 395 - - 395 -
Other activities 143 2 - 78 223 59
3,968 615 - 539 5,122 275
Head Office 5,462 - - 1,341 6,803 73
266,483 20,969 27,946 6,250 321,648 10,232
At 31st December 2011
Jointly Bank deposits Additions to
Segment controlled Associated and Total non-current
assets companies companies securities assets assets (note)
HK$M HK$M HK$M HK$M HK$M HK$M
Property
Property investment 190,072 11,303 55 1,003 202,433 5,117
Property trading and development 7,479 842 - 76 8,397 2
Hotels 5,165 855 584 101 6,705 586
202,716 13,000 639 1,180 217,535 5,705
Aviation
Cathay Pacific group - - 25,596 - 25,596 -
HAECO group 7,663 1,100 - 1,345 10,108 608
Others 4,778 2,817 - - 7,595 -
12,441 3,917 25,596 1,345 43,299 608
Beverages
Swire Beverages 5,419 1,551 899 696 8,565 495
Marine Services
Swire Pacific Offshore group 12,597 - 11 386 12,994 2,968
HUD group - (2) - - (2) -
12,597 (2) 11 386 12,992 2,968
Trading & Industrial
Swire Resources group 854 15 - 188 1,057 53
Taikoo Motors group 2,057 - - 17 2,074 158
Taikoo Sugar 160 - - 41 201 3
Campbell Swire * - 4 - - 4 -
Akzo Nobel Swire Paints - 381 - - 381 -
Other activities 6 - - 18 24 2
3,077 400 - 264 3,741 216
Head Office 6,430 - - 101 6,531 380
242,680 18,866 27,145 3,972 292,663 10,372
Note: In this analysis, additions to non-current assets during the year exclude financial instruments (which include jointly controlled and
associated companies), deferred tax assets and retirement benefit assets.
* Campbell Swire has been accounted for under the Trading & Industrial Division rather than the Beverages Division to reflect the basis on
which the Group's internal segment reports are prepared.

2012 FINAL RESULTS
- 64 -
1. Segment information (continued)
(a) Information about reportable segments (continued)
Analysis of total liabilities and non-controlling interests of the Group At 31st December 2012
Current and Inter-segment
Segment deferred tax borrowings/ External Total Non-controlling
liabilities liabilities (advances) borrowings liabilities interests
HK$M HK$M HK$M HK$M HK$M HK$M
Property
Property investment 6,435 5,224 10,999 14,483 37,141 33,425
Property trading and development 557 469 4,265 423 5,714 604
Hotels 165 - - 691 856 1,167
7,157 5,693 15,264 15,597 43,711 35,196
Aviation
HAECO group 1,643 368 - 1,664 3,675 3,968
Beverages
Swire Beverages 2,095 341 1,395 109 3,940 500
Marine Services
Swire Pacific Offshore group 1,772 55 6,816 102 8,745 15
Trading & Industrial
Swire Resources group 716 14 (30) - 700 14
Taikoo Motors group 972 25 - 470 1,467 -
Taikoo Sugar 82 2 - - 84 -
Campbell Swire - - 144 - 144 -
Swire Pacific Cold Storage 1 - - - 1 -
Other activities 27 12 - - 39 -
1,798 53 114 470 2,435 14
Head Office 551 120 (23,589) 32,726 9,808 -
15,016 6,630 - 50,668 72,314 39,693
At 31st December 2011
Current and Inter-segment
Segment deferred tax borrowings/ External Total Non-controlling
liabilities liabilities (advances) borrowings liabilities interests
HK$M HK$M HK$M HK$M HK$M HK$M
Property
Property investment 6,085 4,664 16,411 6,440 33,600 532
Property trading and development 1,721 19 5,003 406 7,149 -
Hotels 183 - - 619 802 -
7,989 4,683 21,414 7,465 41,551 532
Aviation
HAECO group 1,216 354 - 1,447 3,017 3,929
Beverages
Swire Beverages 2,046 317 1,349 144 3,856 448
Marine Services
Swire Pacific Offshore group 1,265 72 1,740 42 3,119 (2)
Trading & Industrial
Swire Resources group 714 17 (24) - 707 10
Taikoo Motors group 964 26 - 13 1,003 -
Taikoo Sugar 80 - - - 80 -
Campbell Swire * - - 125 - 125 -
Other activities 24 5 - - 29 -
1,782 48 101 13 1,944 10
Head Office 631 133 (24,604) 30,540 6,700 -
14,929 5,607 - 39,651 60,187 4,917
* Campbell Swire has been accounted for under the Trading & Industrial Division rather than the Beverages Division to reflect the basis on
which the Group's internal segment reports are prepared.

2012 FINAL RESULTS
- 65 -
1. Segment information (continued)
(a) Information about reportable segments (continued)
The Swire Pacific Group is organised on a divisional basis: Property, Aviation, Beverages, Marine
Services and Trading & Industrial.
The reportable segments within each of the five divisions are classified according to the nature of the
business. The Head Office is also considered to be a reportable segment as discrete financial
information is available for the Head Office activities and regularly provided to the executive directors
of the Board.
The Beverages Division is considered to be a single reportable segment as the nature of its operations
in different geographical locations is similar. The analysis of the consolidated income statement in
note 1(a) presents the results of the Beverages Division by geographical location in order to provide
further information to the user of this analysis.
(b) Information about geographical areas
The activities of the Group are principally based in Hong Kong. Ship owning and operating activities
are carried out internationally and cannot be attributed to specific geographical areas.
An analysis of turnover and non-current assets of the Group by principal markets is outlined below:
2012 2011 2012 2011
HK$M HK$M HK$M HK$M
Hong Kong 20,329 15,794 193,002 181,374
Asia (excluding Hong Kong) 15,090 13,004 31,886 29,514
United States of America 4,039 3,872 1,907 1,555
United Kingdom 132 111 566 517
Ship owning and operating activities 4,269 3,505 17,563 11,496
43,859 36,286 244,924 224,456
Turnover Non-current assets*
* In this analysis, the total of non-current assets excludes financial instruments (which include jointly controlled and
associated companies), deferred tax assets and retirement benefit assets.
2. Turnover
Turnover represents sales by the Company and its subsidiary companies to external customers and
comprises revenue from:
2012 2011
HK$M HK$M
Gross rental income from investment properties 8,954 8,502
Property trading 4,147 210
Hotels 781 717
Aircraft and engine maintenance services 5,603 5,034
Sales of goods 19,266 18,107
Charter hire 3,870 3,291
Rendering of other services 1,238 425
43,859 36,286

2012 FINAL RESULTS
- 66 -
3. Operating profit
2012 2011
HK$M HK$M
Operating profit has been arrived at after charging:
Depreciation of property, plant and equipment 1,689 1,527
Amortisation of leasehold land and land use rights 28 27
Amortisation of intangible assets 51 48
Amortisation of initial leasing costs 89 65
And after crediting:
Profit on sale of interest in Festival Walk - 638
Profit on sale of available-for-sale assets - 7
Profit on sale of investment properties 66 -
Profit on sale of property, plant and equipment 24 82
4. Net finance charges
HK$M HK$M HK$M HK$M
Interest charged on:
Bank loans and overdrafts (708) (566)
Other loans, bonds and perpetual capital securities:
Wholly repayable within five years (572) (391)
Not wholly repayable within five years (806) (743)
(1,378) (1,134)
Fair value gains/(losses) on derivative instruments:
Interest rate swaps: cash flow hedges, transferred
from other comprehensive income 19 (5)
Interest rate swaps: fair value hedges - (3)
19 (8)
Adjustments to financial liabilities - fair value hedges - 13
Amortised loan fees - loans at amortised cost (67) (66)
Fair value loss on put option over non-controlling interest
in Sanlitun Village (175) (259)
Other financing costs (116) (58)
Capitalised on:
Investment properties 95 197
Properties for sale 244 155
Hotel and other properties 43 24
Vessels 55 15
437 391
(1,988) (1,687)
Interest income on:
Short-term deposits and bank balances 44 40
Other loans 147 37
191 77
Net finance charges (1,797) (1,610)
2012 2011

2012 FINAL RESULTS
- 67 -
5. Taxation
HK$M HK$M HK$M HK$M
Current taxation:
Hong Kong profits tax (1,240) (711)
Overseas taxation (364) (256)
(Under)/over-provisions in prior years (2) 23
(1,606) (944)
Deferred taxation:
Changes in fair value of investment properties in Mainland China (249) (384)
Origination and reversal of temporary differences (434) (302)
(683) (686)
(2,289) (1,630)
2012 2011
Hong Kong profits tax is calculated at 16.5% (2011: 16.5%) on the estimated assessable profits for the
year. Overseas tax is calculated at tax rates applicable in jurisdictions in which the Group is assessable
for tax.
6. Dividends
Company
2012 2011
HK$M HK$M
Cash dividends
First Interim dividend paid on 5th October 2012 of HK¢100.0 per 'A' share
and HK¢20.0 per 'B' share (2011: HK¢115.0 and HK¢23.0) 1,505 1,730
2011 Special interim dividend paid on 4th October 2011 of HK¢300.0 per
'A' share and HK¢60.0 per 'B' share - 4,514
Second interim dividend declared on 14th March 2013 of
HK¢250 per 'A' share and HK¢50 per 'B' share
(2011 actual dividend paid: HK¢235.0 and HK¢47.0) 3,761 3,536
Special interim dividend by way of a distribution in specie 31,589 -
36,855 9,780
The second interim dividend is not accounted for in 2012 because it had not been declared at the year end
date. The actual amount payable in respect of 2012 will be accounted for as an appropriation of the
revenue reserve in the year ending 31st December 2013.
The Directors have declared second interim dividends of HK$2.50 per „A‟ share and HK$0.50 per „B‟
share which, together with the first interim dividends of HK$1.00 per „A‟ share and HK$0.20 per „B‟
share paid in October 2012, amount to full year dividends of HK$3.50 per „A‟ share and HK$0.70 per
„B‟ share, compared to full year dividends of HK$6.50 per „A‟ share and HK$1.30 per „B‟ share in
respect of 2011. The second interim dividends will be paid on 3rd May 2013 to shareholders registered
at the close of business on the record date, being Friday, 12th April 2013. Shares of the Company will
be traded ex-dividend from Wednesday, 10th April 2013.

2012 FINAL RESULTS
- 68 -
The register of members will be closed on Friday, 12th April 2013, during which day no transfer of
shares will be effected. In order to qualify for entitlement to the second interim dividends, all transfer
forms, accompanied by the relevant share certificates, must be lodged with the Company‟s share
registrars, Computershare Hong Kong Investor Services Limited, 17th Floor, Hopewell Centre, 183
Queen‟s Road East, Hong Kong, for registration not later than 4:30 p.m. on Thursday, 11th April 2013.
To facilitate the processing of proxy voting for the annual general meeting to be held on 9th May 2013,
the register of members will be closed from 6th May 2013 to 9th May 2013, both days inclusive, during
which period no transfer of shares will be effected. In order to be entitled to attend and vote at the
annual general meeting, all transfer forms accompanied by the relevant share certificates must be lodged
with the Company‟s share registrars, Computershare Hong Kong Investor Services Limited, 17th Floor,
Hopewell Centre, 183 Queen‟s Road East, Hong Kong, for registration not later than 4:30 p.m. on
Friday, 3rd May 2013.
On 7th October 2011, the Company submitted a spin-off proposal to The Stock Exchange of Hong Kong
Limited (the “Stock Exchange”) pursuant to Practice Note 15 of the Rules Governing the Listing of
Securities on The Stock Exchange of Hong Kong Limited (“Listing Rules”) in relation to the proposed
spin-off of Swire Properties Limited (“Swire Properties”) by way of a separate listing of the ordinary
shares of HK$1.00 each of Swire Properties (“Swire Properties Shares”) on the Main Board of the Stock
Exchange.
On 27th October 2011, Swire Properties submitted a listing application form (Form A1) to the Stock
Exchange in order to apply for the listing of, and permission to deal in, the Swire Properties Shares on the
Main Board of the Stock Exchange. The listing of the Swire Properties Shares would be by way of
introduction achieved by a distribution in specie by the Company of 18% of the Swire Properties Shares.
On 21st December 2011, the Board declared conditional special interim dividends (the “Conditional
Dividend”) for the year ended 31st December 2011 of 7 Swire Properties Shares for every 10 „A‟ shares
held in the Company and 7 Swire Properties Shares for every 50 „B‟ Shares held in the Company to
shareholders on the register of members as at the close of business on 6th January 2012. Fractional
entitlements were disregarded. The Conditional Dividend became unconditional upon the listing of the
Swire Properties Shares under stock code 1972 on the Main Board of the Stock Exchange on 18th
January 2012 and was satisfied wholly by way of a distribution in specie of an aggregate of
1,053,234,165 Swire Properties Shares, representing 18% of the total of 5,850,000,000 Swire Properties
Shares in issue, on 18th January 2012.
The net assets attributable to the distribution in specie of an aggregate of 1,053,234,165 Swire Properties
Shares were HK$31,589 million.
In the light of applicable laws and regulations of Australia, Canada, Malaysia and the United States (the
“Excluded Territories”), shareholders whose addresses on one or both of the registers of members of the
Company on 6th January 2012 were in the Excluded Territories were entitled to the Conditional Dividend
but did not receive Swire Properties Shares. Instead, the 567,053 Swire Properties Shares which they
would otherwise receive pursuant to the Conditional Dividend were sold on their behalf on the Stock
Exchange on 18th January 2012 at an average price of HK$18.4486 per share for a gross amount of
HK$10,461,333.98 and the net proceeds, after deducting stamp duty and expenses, totalling
HK$10,423,876.69 (equivalent to approximately HK$18.38 per Swire Properties Share) were distributed
to them on 1st February 2012.

2012 FINAL RESULTS
- 69 -
With respect to the shares of the Company held under the Central Clearing and Settlement System
(“CCASS”) established and operated by Hong Kong Securities Clearing Company Limited, the
Company sent a letter to CCASS Participants (other than CCASS Investor Participants) on 11th January
2012 notifying them that in the light of applicable laws and regulations of the Excluded Territories, to the
extent they held any shares of the Company on behalf of any underlying shareholders with addresses in
one of the Excluded Territories (“Underlying Overseas Shareholders”) on 6th January 2012, they should
sell the Swire Properties Shares pursuant to the Conditional Dividend which they received on behalf of
the Underlying Overseas Shareholders and should pay the net proceeds of such sale to such Underlying
Overseas Shareholders.
7. Earnings per share (basic and diluted)
Earnings per share are calculated by dividing the profit attributable to the Company's shareholders of
HK$17,484 million (2011: HK$32,210 million) by the weighted average number of 905,578,500 'A'
shares and 2,995,220,000 'B' shares in issue during 2012 and 2011 in the proportion five to one.
8. Trade and other receivables
2012 2011
HK$M HK$M
Trade debtors 3,045 2,610
Amounts due from fellow subsidiary companies - 4
Amounts due from jointly controlled companies 419 330
Amounts due from associated companies 439 185
Prepayments and accrued income 1,674 1,309
Other receivables 3,258 1,837
8,835 6,275
The analysis of the age of trade debtors at year-end (based on the invoice date) is as follows:
2012 2011
HK$M HK$M
Under three months 2,889 2,488
Between three and six months 110 99
Over six months 46 23
3,045 2,610
The various Group companies have different credit policies, depending on the requirements of their
markets and the businesses in which they operate. Analyses of the age of debtors are prepared and
closely monitored with a view to minimising credit risk associated with receivables.

2012 FINAL RESULTS
- 70 -
9. Trade and other payables
2012 2011
HK$M HK$M
Trade creditors 2,754 3,576
Amounts due to immediate holding company 253 149
Amounts due to jointly controlled companies 134 81
Amounts due to associated companies 134 19
Interest-bearing advances from jointly controlled companies
at 1.58% (2011: 1.55%) 377 244
Interest-bearing advances from associated companies (2011: 1.83%) - 24
Advances from non-controlling interests 365 383
Rental deposits from tenants 1,953 1,780
Put option over non-controlling interest in Sanlitun Village 1,112 937
Put option over non-controlling interests in subsidiary companies 211 -
Accrued capital expenditure 1,235 1,484
Other accruals 3,833 3,247
Other payables 2,015 2,255
14,376 14,179
The analysis of the age of trade creditors at year-end is as follows:
2012 2011
HK$M HK$M
Under three months 2,518 3,161
Between three and six months 200 403
Over six months 36 12
2,754 3,576
10. Share capital
'A' shares 'B' shares Total
HK$M HK$M HK$M
Authorised:
At 31st December 2012 and 2011 684 432 1,116
Issued and fully paid:
At 31st December 2012 and 2011 543 360 903905,578,500 2,995,220,000
Company
'A' shares of 'B' shares of
HK$0.60 each HK$0.12 each
1,140,000,000 3,600,000,000
During the year, the Company did not purchase, sell or redeem any of its shares.
Except for voting rights, which are equal, the entitlements of 'A' and 'B' shareholders are in the
proportion five to one.

2012 FINAL RESULTS
- 71 -
11. Reserves
Share Capital Properties Investment Cash flow
Revenue premium redemption revaluation revaluation hedge Translation
reserve account reserve reserve reserve reserve reserve Total
HK$M HK$M HK$M HK$M HK$M HK$M HK$M HK$M
Group
At 1st January 2011 199,044 342 49 1,462 635 (455) 2,472 203,549
Profit for the year 32,210 - - - - - - 32,210
Other comprehensive income
Cash flow hedges
- recognised during the year - - - - - 88 - 88
- transferred to net finance charges - - - - - 5 - 5
- transferred to operating profit - exchange differences - - - - - 4 - 4
- transferred to initial cost of non-financial assets - - - - - 1 - 1
- deferred tax - - - - - (46) - (46)
Net fair value changes on available-for-sale assets
- net losses recognised during the year - - - - (100) - - (100)
- net gains transferred to operating profit - - - - (3) - - (3)
Revaluation of property previously occupied by the Group
- gain recognised during the year - - - 188 - - - 188
Share of other comprehensive income of jointly
controlled and associated companies (10) - - - (97) (303) 614 204
Net translation differences on foreign operations - - - - - - 591 591
Total comprehensive income for the year 32,200 - - 188 (200) (251) 1,205 33,142
Changes in tax treatment for retirement benefits (30) - - - - - - (30)
2010 final dividend (3,761) - - - - - - (3,761)
2011 first interim dividend (note 6) (1,730) - - - - - - (1,730)
2011 special interim dividend (note 6) (4,514) - - - - - - (4,514)
At 31st December 2011 221,209 342 49 1,650 435 (706) 3,677 226,656
At 1st January 2012 221,209 342 49 1,650 435 (706) 3,677 226,656
Profit for the year 17,484 - - - - - - 17,484
Other comprehensive income
Cash flow hedges
- recognised during the year - - - - - 101 - 101
- transferred to net finance charges - - - - - (19) - (19)
- transferred to operating profit - exchange differences - - - - - 33 - 33
- transferred to initial cost of non-financial assets - - - - - (56) - (56)
- deferred tax - - - - - 10 - 10
Net fair value changes on available-for-sale assets
- net gains recognised during the year - - - - 153 - - 153
Revaluation of property previously occupied by the Group
- gain recognised during the year - - - 44 - - - 44
- deferred tax - - - (8) - - - (8)
Share of other comprehensive income of jointly
controlled and associated companies (1) - - - 17 742 93 851
Net translation differences on foreign operations - - - - - - 174 174
Total comprehensive income for the year 17,483 - - 36 170 811 267 18,767
Change in composition of the Group 3 - - - - - - 3
Recognition of put options in respect of non-controlling
interests in subsidiary companies (58) - - - - - - (58)
2011 second interim dividend (note 6) (3,536) - - - - - - (3,536)
2012 first interim dividend (note 6) (1,505) - - - - - - (1,505)
Special interim dividend by way of a distribution in specie (note 6) (31,589) - - - - - - (31,589)
At 31st December 2012 202,007 342 49 1,686 605 105 3,944 208,738

2012 FINAL RESULTS
- 72 -
12. Changes in accounting standards
(a) The following relevant amendments were required to be adopted by the Group effective from 1st January 2012:
HKAS 12 (Amendment) Income taxes HKFRS 7 (Amendment) Disclosures – Transfers of Financial Assets
The Group early adopted the amendment to HKAS 12 in 2010. HKFRS 7 (Amendment) introduces new disclosure requirements on transfers of financial assets.
Disclosure is required (by class of asset) of the nature and carrying amount of, and a description
of the risks and rewards of, financial assets that have been transferred to another party yet
remain on the entity‟s balance sheet. The gain or loss on the transferred assets and any retained
interest in those assets must be disclosed. In addition, other disclosures must enable users to
understand the amount of any associated liabilities, and the relationship between the financial
assets and associated liabilities. The disclosures must be presented by type of involvement. For
example, the retained exposure could be presented by type of financial instrument (such as
guarantees, call or put options), or by type of transfer (such as factoring of receivables,
securitisations or securities lending). It also introduces new disclosures in respect of risk
exposures arising from transferred financial assets that are either fully derecognised or
derecognised but not in their entirety, yet the entity still has continuing involvement in them.
The amendment has had no significant impact on the results and financial position of the Group.
(b) The following amended HKFRS is effective but not relevant to the Group's operations:
HKFRS 1 (Amendment), Severe Hyperinflation and Removal of Fixed Dates for First-Time
Adopters, is effective but not relevant to the Group‟s operations because the Group is not a
first-time adopter.
(c) The Group has not early adopted the following relevant new and revised standards and amendments that have been issued but are not yet effective:
HKFRSs (Amendment) Annual Improvements to HKFRSs 2009-2011 Cycle
1
HKAS 1 (Amendment) Presentation of Financial Statements1
HKAS 19 (revised 2011) Employee Benefits1
HKAS 28 (revised 2011) Investments in Associates and Joint Ventures1
HKAS 32 (Amendment) Presentation – Offsetting Financial Assets and Financial Liabilities
2
HKFRS 7 (Amendment) Disclosures – Offsetting Financial Assets and Financial Liabilities
1
HKFRS 9 Financial Instruments3
HKFRS 10 Consolidated Financial Statements
1
HKFRS 11 Joint Arrangements1
HKFRS 12 Disclosure of Interests in Other Entities1
HKFRS 13 Fair Value Measurements1
Amendments to HKFRS10, Consolidated Financial Statements, Joint Arrangements HKFRS 11 and HKFRS 12 and Disclosure of Interests in Other Entities: Transition Guidance
1
1 To be applied by the Group from 1st January 2013.
2 To be applied by the Group from 1st January 2014.
3 To be applied by the Group from 1st January 2015.

2012 FINAL RESULTS
- 73 -
12. Changes in accounting standards (continued)
The improvements to HKFRSs 2009 to 2011 cycles consist of six amendments to five
existing standards. It is not expected that these amendments will have a significant impact on
the results and financial position of the Group.
The amendment to HKAS 1 focuses on improving the presentation of components of other
comprehensive income items. It requires items presented in other comprehensive income to
be grouped on the basis of whether they are potentially reclassifiable to the profit or loss
account subsequently or not. It is not expected that this amendment will have a significant
impact on the results and financial position of the Group.
HKAS 19 was amended in 2011. The impact on the Group‟s defined benefit plans and post
employment benefits will be as follows: to immediately recognise all past service costs; and
to replace interest cost and expected return on plan assets with a net interest amount that is
calculated by applying the discount rate to the net defined benefit liability. In addition, it will
remove the accounting policy choice that currently permits only the recognition of actuarial
gains and losses outside the 10% „corridor‟ to be recognised in the Income Statement. Instead
all such remeasurements will be required to be recognised in other comprehensive income,
when they occur. The above change is required to be applied retrospectively. Had the
standard been applied in 2012, profits for the year would have been lower by approximately
HK$120 million, other comprehensive income would have been higher by approximately
HK$111 million, and net retirement benefit assets and associated companies at 31 December
2012 would have been lower by approximately HK$939 million and HK$506 million
respectively.
HKAS 28 (revised 2011) includes the requirements for joint ventures, as well as associates, to
be equity accounted following the issue of HKFRS 11. It is not expected that this amendment
will have a significant impact on the results and financial position of the Group.
The amendment to HKAS 32 clarifies some of the requirements for offsetting financial assets
and financial liabilities on the balance sheet. Specifically, the amendments clarify the
meaning of “currently has a legally enforceable right of set-off” and “simultaneous realisation
and settlement”. It is not expected that this amendment will have a significant impact on the
results and financial position of the Group.
The amendment to HKFRS 7 requires entities to disclose quantitative information about
financial assets and financial liabilities that are offset in the statement of financial position or
subject to enforceable master netting agreement or similar arrangement. It is not expected that
this amendment will have a significant impact on the results and financial position of the
Group.

2012 FINAL RESULTS
- 74 -
12. Changes in accounting standards (continued)
HKFRS 9 addresses the classification, measurement and recognition of financial assets and
financial liabilities. It replaces the parts of HKAS 39 that relate to the classification and
measurement of financial instruments. HKFRS 9 requires financial assets to be classified into
two measurement categories: those measured at fair value and those measured at amortised
cost. The determination is made at initial recognition. The classification depends on the
entity‟s business model for managing its financial instruments and the contractual cash flow
characteristics of the instrument. For financial liabilities, the standard retains most of the
HKAS 39 requirements. The main change is that, in cases where the fair value option is
taken for financial liabilities, the part of a fair value change due to an entity‟s own credit risk
is recorded in other comprehensive income rather than the income statement, unless this
creates an accounting mismatch. The Group has yet to assess the full impact of the new
standard.
HKFRS 10 builds on existing principles by identifying the concept of control as the
determining factor in whether an entity should be included within the consolidated financial
statements of the parent company. The standard provides additional guidance to assist in the
determination of control where this is difficult to assess. The Group has considered whether
to consolidate Cathay Pacific Airways Limited (“Cathay Pacific”) as a subsidiary in its
accounts from 2013 in light of the provisions of HKFRS 10 and has concluded that because it
does not have unilateral control of Cathay Pacific it should not consolidate it from 2013 but
should continue to account for its interest in Cathay Pacific as an associate interest.
HKFRS 11 provides guidance on what constitutes a joint arrangement by focusing on the
rights and obligations of the arrangement, rather than its legal form. There are two types of
joint arrangements: joint operations and joint ventures. Joint operations arise where a joint
operator has rights to the assets and obligations relating to the arrangement and hence
accounts for its interest in assets, liabilities, revenue and expenses. Joint ventures arise where
the joint operator has rights to the net assets of the arrangement and hence equity accounts for
its interest. Proportional consolidation of joint ventures is no longer allowed. It is not
expected that this new standard will have a significant impact on the results and financial
position of the Group.
HKFRS 12 includes the disclosure requirements for all forms of interests in other entities,
including joint arrangements, associates, special purpose vehicles and other off balance sheet
vehicles. It is not expected that this new standard will have a significant impact on the results
and financial position of the Group.
HKFRS 13 aims to improve consistency and reduce complexity by providing a precise
definition of fair value and a single source of fair value measurement and disclosure
requirements for use in all relevant HKFRSs. The requirements do not extend the use of fair
value accounting but provide guidance on how fair value should be measured where its use is
already required or permitted by other standards in HKFRSs. It also provides new disclosure
requirements. It is not expected that this new standard will have a significant impact on the
results and financial position of the Group.
The amendments to HKFRSs 10, 11 and 12 provide additional transition relief, limiting the
requirement to provide adjusted comparative information to only the preceding comparative
period. It is not expected that these amendments will have a significant impact on the results
and financial position of the Group.

2012 FINAL RESULTS
- 75 -
12. Changes in accounting standards (continued)
(d) The following revised standards and amendments have been issued which are not yet effective
and are not relevant to the Group‟s operations:
HKAS 27 (revised) Separate Financial Statements
HKFRS 1 First-time Adoption of Hong Kong Financial Reporting
Standards – Government Loans
HKFRS 10, HKFRS 12 Investment Entities
and HKAS 27
(Amendment)
HK(IFRIC) - Int 20 Stripping Costs in the Production Phase of a Surface Mine
13. Events after the reporting period
(a) In January 2012, Swire Properties entered into an agreement with Sino-Ocean Land Limited to fund
the whole of the remaining land premium (and associated taxes) payable in respect of the Daci
Temple project and certain working capital requirements in an aggregate amount of US$230 million.
Following this transaction, the Swire Properties‟ interest in the project was increased to 81%,
reflecting its contribution to the overall funding of the project. Sino-Ocean Land had a call option,
exercisable for one year commencing from the date of the agreement, to purchase the Swire
Properties‟ additional interest in the project for an amount equal to one half of the additional funding
plus interest at the rate of 10% per year. Swire Properties had the right, exercisable for one year
commencing one week before the end of the call option period, to require Sino-Ocean Land to
purchase Swire Properties‟ additional interest in the project for an amount equal to one half of the
above additional funding plus interest at the rate of 10% per year. In January 2013, the above
arrangements were amended. Sino-Ocean Land purchased part of Swire Properties‟ additional
interest in the project and the options in respect of the remaining part of the additional interest were
extended for a further year. The effect of the amended arrangements was to reduce Swire Properties‟
interest in the project to 63% and to increase Sino-Ocean Land‟s interest in the project to 37%. Until
the extended options described above are exercised or lapse, Swire Properties‟ remaining additional
interest in the project will be accounted for as a secured loan and Swire Properties‟ existing interest
will continue to be accounted for as a 50% interest in a jointly controlled entity.
(b) In January 2013, Swire Properties and Bal Harbour Shops entered into an agreement in respect of
the joint venture which is to develop the retail component of Brickell CityCentre in Miami, Florida,
USA. Swire Properties‟ holds an 87.5% interest in the joint venture and will remain the primary
developer while Bal Harbour Shops will contribute equity and its retail expertise as co-developer.
(c) In March 2013, the company which owns the existing Citygate Outlets development at Tung Chung
in Hong Kong (in which Swire Properties Limited has a 20% equity interest) won a tender to
develop an adjacent commercial site.
(d) In March 2013, the Cathay Pacific group entered into agreements with The Boeing Company under
which the Cathay Pacific group agreed to buy three Boeing 747-8F freighter aircraft and the
agreement to purchase eight Boeing 777-200F freighters entered into in August 2011 was cancelled.
Pre-delivery payments already made in respect of the eight Boeing 777-200F freighters (which were
scheduled to be delivered from 2014 to 2016), will be credited to the consideration for the purchase
of the three Boeing 747-8F freighters (which are scheduled to be delivered in 2013). Under the
agreements, Cathay Pacific also acquired options to purchase five Boeing 777-200F freighters and
The Boeing Company agreed to purchase four Boeing 747-400BCF converted freighters, which were
taken out of service in 2012 and early 2013. The transaction is part of a package of transactions
between The Boeing Company (on the one hand) and the Cathay Pacific group, Air China Cargo and
Air China (on the other hand).

2012 FINAL RESULTS
- 76 -
Sources of finance
At 31st December 2012, committed loan facilities and debt securities amounted to HK$64,591 million,
of which HK$16,261 million (25%) remained undrawn. In addition, the Group had undrawn
uncommitted facilities totalling HK$6,965 million. Sources of funds at 31st December 2012 comprised:
Undrawn Undrawn
expiring within expiring beyond
Available Drawn one year one year
HK$M HK$M HK$M HK$M
Committed facilities
Loans and bonds
Fixed/floating rate bonds 26,629 26,629 - -
Bank loans, overdrafts and other loans 35,637 19,376 2,093 14,168
Perpetual capital securities 2,325 2,325 - -
Total committed facilities 64,591 48,330 2,093 14,168
Uncommitted facilities
Bank loans, overdrafts and other loans 9,590 2,625 6,823 142
Total 74,181 50,955 8,916 14,310
At 31st December 2012, 57% of the Group‟s gross borrowings were on a fixed rate basis and 43% were
on a floating rate basis (2011: 59% and 41% respectively).
Corporate Governance
The Company has complied with all the code provisions set out in the Code on Corporate Governance
Practices (the “CG Code”) contained in Appendix 14 of the Rules Governing the Listing of Securities
(the “Listing Rules”) on The Stock Exchange of Hong Kong Limited (the “Stock Exchange”) for the
year.
The Company has adopted codes of conduct regarding securities transactions by Directors and by
relevant employees (as defined in the CG Code) on terms no less exacting than the required standard set
out in the Model Code for Securities Transactions by Directors of Listed Issuers (the “Model Code”)
contained in Appendix 10 of the Listing Rules.
On specific enquiries made, all Directors have confirmed that, in respect of the accounting period
covered by the annual report, they have complied with the required standard set out in the Model Code
and the Company‟s code of conduct regarding Directors‟ securities transactions.
The annual results have been reviewed by the Audit Committee of the Company.

2012 FINAL RESULTS
- 77 -
Annual Report
The 2012 Annual Report containing all the information required by the Listing Rules will be published
on the Stock Exchange website and the Group website www.swirepacific.com. Printed copies will be
available to shareholders on 9th April 2013.
List of Directors
As at the date of this announcement, the Directors of the Company are:
Executive Directors: C D Pratt (Chairman), M Cubbon, P A Kilgour, J B Rae-Smith, I S C Shiu,
J R Slosar, A K W Tang
Non-Executive Directors: Baroness Dunn, J W J Hughes-Hallett, P A Johansen, M B Swire
Independent Non-Executive Directors: T G Freshwater, C K M Kwok, C Lee, R W M Lee, M C C Sze,
M M T Yang,