swine model: a pilot study hhs public access …
TRANSCRIPT

EFFECT OF RENAL SHOCK WAVE LITHOTRIPSY ON THE DEVELOPMENT OF METABOLIC SYNDROME IN A JUVENILE SWINE MODEL: A PILOT STUDY
Rajash K. Handa*, Ziyue Liu†, Bret A. Connors*, Andrew P. Evan*, James E. Lingeman¶, David P. Basile‡, and Johnathan D. Tune‡
*Department of Anatomy & Cell Biology, Indiana University School of Medicine, Indianapolis, IN
†Department of Biostatistics, Indiana University School of Medicine, Indianapolis, IN
‡Department of Cellular & Integrative Physiology, Indiana University School of Medicine, Indianapolis, IN
¶Kidney Stone Institute of Indiana University Health Methodist Hospital, Indianapolis, IN
Abstract
Purpose—A pilot study was conducted to assess whether renal shock wave lithotripsy (SWL)
influences the onset and severity of metabolic syndrome (MetS).
Materials and Methods—Three-month-old juvenile female Ossabaw miniature pigs were
treated with SWL (2000 SWs, 24 kV, 120 SWs/min using the HM3 lithotripter; n=2) or sham-
SWL (no SWs; n=2). SWs were targeted to the upper pole of the left kidney so as to model
treatment that would also expose the pancreatic tail to SWs. Pigs were then instrumented for direct
measurement of arterial blood pressure via an implanted radiotelemetry device, and later fed a
hypercaloric atherogenic diet for ~7 months. The development of MetS was assessed from
intravenous glucose tolerance tests (IVGTTs).
Results—The progression and severity of MetS was similar in the sham-treated and SWL-treated
groups. The only exception was with respect to arterial blood pressure, which remained relatively
constant in the sham-treated pigs but began to rise at ~2 months towards hypertensive levels in
SW-treated pigs. Metabolic data from both groups were pooled to provide a more complete
assessment of the development and progression of MetS in this juvenile pig model. IVGTTs
revealed substantial insulin resistance with impaired glucose tolerance within 2 months on the
hypercaloric atherogenic diet with signs of further metabolic impairment at 7 months.
Conclusions—These preliminary results suggest that renal SWL is not a risk factor for
worsening of glucose tolerance or the onset of diabetes mellitus, but does appear to be a risk factor
for early onset hypertension in MetS.
Keywords
Swine; shock wave lithotripsy; hypertension; metabolic syndrome; kidney
Correspondence: Rajash K. Handa, Ph.D., [email protected].
HHS Public AccessAuthor manuscriptJ Urol. Author manuscript; available in PMC 2016 April 01.
Published in final edited form as:J Urol. 2015 April ; 193(4): 1409–1416. doi:10.1016/j.juro.2014.09.037.
Author M
anuscriptA
uthor Manuscript
Author M
anuscriptA
uthor Manuscript

Introduction
Shock wave lithotripsy (SWL) has become the standard of care for uncomplicated adult and
pediatric kidney stones,1,2 largely because SWL is effective, noninvasive and typically is
performed on an outpatient basis. However, most patients that undergo SWL show some
degree of acute renal trauma3,4 that in ~0.5% of cases will result in clinically significant
hematomas.5,6 The long-term implication of acute SWL-induced tissue injury are less clear
with conflicting clinical reports of reduced renal function,7,8 higher rates of
hypertension7–12 and diabetes.9,12
In 2006, Krambeck and colleagues from the Mayo Clinic published the results of a 19-year
follow-up study of SWL-treated adults and reported an increased risk of developing
hypertension and diabetes.9 They argued that SWL-induced damage to the kidney and
adjacent pancreas might be responsible for the development of these complications. Due to
limitations of their study and subsequent clinical reports failing to uncover such
associations,10,12,13 the urological community has been highly critical of the view that renal
SWL can give rise to diabetes in adults, including those patients with predisposing risk
factors such as obesity.
The pediatric population in SWL is understudied, and the literature on the long-term
complications in this cohort is limited.2 The lithotripter focal zone has a fixed dimension
and a greater fraction of a child’s small kidney and surrounding organs will be exposed to
SWs compared to an adult.14 Therefore, it is conceivable that SWL-treatment of pediatric
stone patients could place them at a greater risk of complications—one example being
diabetes given the increasing prevalence of kidney stone disease in the pediatric
population15 and the alarming rise in childhood obesity, MetS and diabetes.16–18 We tested
this possibility in an Ossabaw miniature swine model that develops similar features of
human MetS19—a cluster of conditions that includes central (intra-abdominal) obesity,
insulin resistance, impaired glucose tolerance, dyslipidemia and hypertension, and their
presence increases the risk for diabetes, cardiovascular disease and death.20
Materials and Methods
Studies were conducted in accordance with the NIH Guide for the Care and Use of
Laboratory Animals and were approved by the Institutional Animal Care and Use
Committees of Indiana University School of Medicine (IUSM) and Methodist Hospital.
Three-month-old female Ossabaw pigs were obtained from the IUSM and Purdue University
breeding colony (West Lafayette, IN). Pigs were anesthetized (induction with ketamine [20
mg/kg] and xylazine [2 mg/ml]; maintenance with 1–3% isoflurane) and the left kidney
urinary collecting system visualized using contrast medium (injected into a ureteral catheter)
and X-ray fluoroscopy. SWs were targeted to the upper-pole calyx and delivered at 2000
SWs (24 kV, 120 SWs/min) with X-ray verification of SW targeting done every 500 SWs,
and with SW treatment paused every 1000 SWs to replace the electrode and check targeting
(~1 minute). In the sham-SWL treated group, the lithotripter was not fired.
Handa et al. Page 2
J Urol. Author manuscript; available in PMC 2016 April 01.
Author M
anuscriptA
uthor Manuscript
Author M
anuscriptA
uthor Manuscript

Magnetic Resonance Imaging (MRI)
Pigs underwent MRI before and after SW treatment. This was done to determine the
anatomy of the kidney and pancreas so as to identify targeting of the upper pole calyx of the
left kidney that would also target the pancreatic tail, and to assess whether SWL treatment
resulted in injury to the kidney and pancreas.
Radiotelemetry instrumentation
Radiotelemetry transmitters were chronically implanted in pigs with arterial blood pressure
measurements taken from a catheter introduced into the femoral artery and advanced
towards the aorta. A receiver was placed in the pig’s cage with continuous recordings taken
weekly (Friday afternoon to Monday morning)—a period of minimal disturbance. Animal
rooms had a 12 h light: 12 h dark cycle with pigs housed in individual cages and access to
play toys, ad libitum water intake and a fixed daily food intake.
Intravenous Glucose Tolerance Test (IVGTT)
Pigs were prepared for IVGTTs as previously described,21 and performed a few days before
SWL or sham-SWL and then at monthly intervals after beginning the hypercaloric
atherogenic (HA) diet. Fasted, conscious pigs were restrained in a low-stress body sling and
blood samples taken from a jugular vein catheter immediately before and at 5, 10, 20, 30,
40, 50 and 60 min after an intravenous bolus of sterile glucose solution (dextrose, 1 g/kg).
Blood samples were assayed for plasma glucose and insulin.
Renal and Pancreas histology
At the time of animal euthanasia, kidneys and pancreas were perfusion fixed in situ with
10% phosphate buffered formalin, harvested, and processed separately for light
microscopy.14,21
Calculations
Insulin sensitivity and beta cell function was evaluated from fasting plasma values of
glucose and insulin measured on the day of the IVGTT using the equations, QUICKI = 1/
(log glucose0 min + log insulin0 min), and HOMA-%BCF = (360 × insulin0 min)/(glucose0 min
− 63). From IVGTT we calculated: glucose and insulin AUC; AIRG = insulin5 min −
insulin0 min; KG = −slope of ln(glucose)5–20 min × 100); BCF = AIRG/(glucose5 min −
glucose0 min); S2 = KG/((AUCinsulin(0 – 20 min)/20 min) × Vd) where Vd = injected glucose
dose/(glucose peak × body weight); DI = AIRG × S2.21
Statistical analysis
IVGTT measurements were summarized by means (standard deviations) along time for each
time point. For each outcome, a linear mixed effect model was fitted with random intercepts
for subjects and time treated as a categorical variable to account for potential nonlinear
effects. Based on these models, measurements at month 1–7 were compared to the baseline
values. No multiple comparison adjustments were used. For MABP, a linear change point
model was fitted for each subject. Both the location of the change point and the necessity of
the change point compared to a simple linear regression were selected by Akaike
Handa et al. Page 3
J Urol. Author manuscript; available in PMC 2016 April 01.
Author M
anuscriptA
uthor Manuscript
Author M
anuscriptA
uthor Manuscript

Information Criterion. A two-sided P-value <0.05 was considered significant. All analyses
were performed using SAS 9.3 (SAS Institute Inc., Cary, NC, USA).
Results
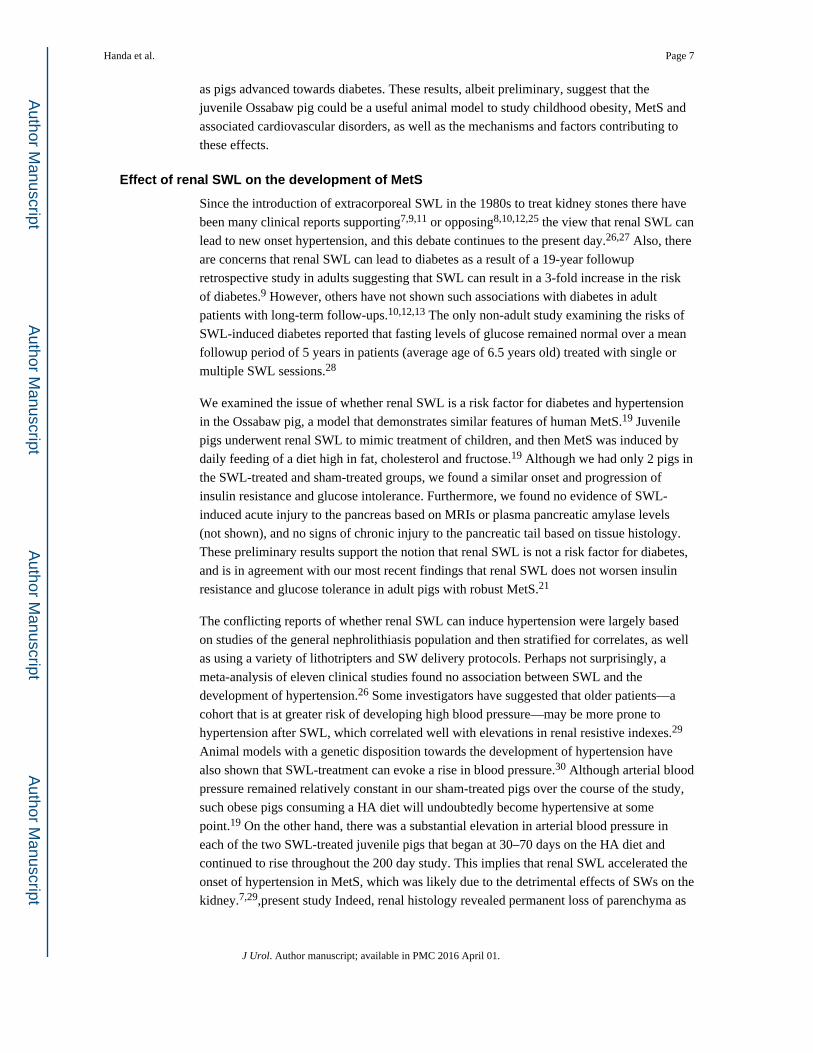
The experimental timeline is shown in Figure 1.
Abdominal anatomy of the pig
An abdomical MRI (Figure 2A) shows the normal anatomical location of the pancreas to the
left kidney in a juvenile Ossabaw pig—the tail of the pancreas lying on the anterior surface
of the kidney’s upper pole (panel 2A). SWs were targeted to the left kidney upper pole calyx
that was closest to the pancreatic tail. An MRI taken several days after SWL shows evidence
of subcapsular and intraparenchymal hemorrhage in the upper pole of the SW-treated kidney
with no readily apparent trauma to the pancreas (Figure 2B).
Blood chemistry and caloric intake
Figure 3 shows body weight and daily caloric intake. Pigs were on a lean diet with a caloric
intake of 1250 kCal/day prior to being fed the HA diet19—the daily HA diet intake was
increased over the course of the study to drive robust MetS. Body weight gain over the first
2 months on the HA diet was normal and thereafter increased substantially compared to
juvenile Ossabaw pigs fed a lean diet (not shown). Body weights and fasting blood
chemistries taken at the end of the study established that the pigs were obese (86 ± 5 kg),
hyperinsulinemic (18 ± 3 µU/ml) and dyslipidemic (cholesterol = 999 ± 222 mg/dL;
triglycerides = 69 ± 34 mg/dL), i.e. they had robust MetS.21
IVGTT
Initially, most of the juvenile pigs could not tolerate ingesting the pure HA diet for more
than one week—resulting in all pigs being returned to the lean diet for ~9 days before
placing them on a food intake schedule that consisted of increasing amounts of HA diet
mixed with lean diet. This mixed diet was given until pigs could tolerate the complete HA
diet by the end of the first month. Therefore, the first data points shown for pigs on the HA
diet is at 2-months (Table 1). Metrics of insulin resistance and glucose tolerance during the
progression of diet-induced MetS were essentially identical in the sham-treated and SWL-
treated pigs. Therefore, we combined the data sets to gain some insight into the progression
of MetS in this juvenile swine model. Measurements of fasting plasma glucose and insulin
levels indicated that pigs remained normoglycemic with a trend towards hyperinsulinemia at
≥ 5 months on the HA diet (Table 1). Analysis of monthly IVGTTs revealed substantial falls
in glucose tolerance (KG), insulin sensitivity index (S2) and disposition index (DI) over the
first 2 months on the HA diet—indices that reflect a rise in insulin resistance and impaired
glucose tolerance. Thereafter, there was a gradual decrease in S2, whereas KG and DI
remained constant until the seventh month on the diet when further decreases were noted
(Table 1). Calculation of beta cell function from fasting plasma glucose and insulin and
IVGTTs indicated that pancreatic insulin function progressively increased over the course of
the study, which likely accounted for the pigs remaining normoglycemic (Table 1).
Handa et al. Page 4
J Urol. Author manuscript; available in PMC 2016 April 01.
Author M
anuscriptA
uthor Manuscript
Author M
anuscriptA
uthor Manuscript

Blood Pressure Radiotelemetry
Mean arterial blood pressure (MABP) data for all 4 pig subjects is shown in Figure 4.
Sham-treatment, Subject 1—This pig had consumed the HA diet for a total of 139 days
before dying during the initiation of isoflurane anesthesia for a non-surgical procedure.
Inspection of the heart revealed substantial atherosclerosis. MABP initially fell during the
first 30 days on the diet and then began to rise slowly over the next 100 days. The slope of
the MABP rise was shallow with a value of only 0.059 mm Hg/day (P = 0.0062). The
calculated rise in MABP would have been 10 mm Hg if the slope of blood pressure rise
remained unchanged and the pig had consumed the HA diet for 200 days—ending MABP
would have been ~100 mm Hg.
Sham-treatment, Subject 2—MABP was relatively constant during the first 154 days on
the HA diet and measured 90–95 mm Hg. Thereafter there was a sudden step-wise fall in
MABP of ~30 mm Hg—we suspect a blood clot, but the exact reason is unknown. MABP
remained low during the next 17 days (these data points were not used in statistical analysis)
at which time telemetry signals were lost.
SWL-treatment, Subject 3—There was a fall in MABP during the first 45 days on the
HA diet and then progressively increased with a slope of 0.154 mm Hg/day (P < 0.0001).
The calculated rise in MABP after consuming the HA diet for 200 days was 24 mm Hg
relative to the lowest pressure at day 45. MABP at the end of the study was ~119 mmHg.
SWL-treatment, Subject 4—MABP decreased during the first 70 days on the HA diet
and progressively increased thereafter with a slope of 0.182 mm Hg/day (P < 0.0001). The
calculated rise in MABP after consuming the HA diet for 200 days was 24 mm Hg relative
to the lowest pressure recorded at day 70. MABP at the end of the study was ~124 mmHg.
Renal and Pancreas histology
Chronic SWL-induced tissue injury was noted in treated kidneys as fibrotic lesions/bands
that extended from the renal capsule to the inner medulla with varying lengths and widths
(Figure 5A). Much of the cortex was normal. Sites of cortical damage (arrow, Figure 5A;
Figure 5B) possessed sclerotic glomeruli, both atrophic and dilated tubular segments, and
interstitial fibrosis. Injured papillae were always associated with regions of cortical damage
and the changes varied from sparse regions of interstitial fibrosis with minimal tubular
damage to widespread interstitial fibrosis and extensive tubules changes (rectangle, Figure
5A). Tubular changes in the severely damaged papilla included extensively dilated outer and
inner medullary collecting ducts while other tubular segments were atrophic (Figure 5C and
D). Some dilated collecting ducts showed epithelial in-foldings and polypoid configurations,
which is indicative of cell proliferation, i.e. nephron structure remodeling (Figure 5D).
There was no evidence of tissue injury and minimal tubule dilation in kidneys from sham-
treated MetS pigs (not shown).
Handa et al. Page 5
J Urol. Author manuscript; available in PMC 2016 April 01.
Author M
anuscriptA
uthor Manuscript
Author M
anuscriptA
uthor Manuscript

There were no obvious signs of tissue injury in the pancreatic tails from SWL-treated or
sham-SWL-treated pigs. That is, pancreas histology appeared normal in both groups (not
shown).
Discussion
Herein, we report results from a pilot study on the development of MetS in a juvenile
Ossabaw pig model, and the effect of renal SWL on the progression of MetS towards
diabetes.
Induction and progression of MetS in a juvenile swine model
Adulthood obesity and associated co-morbidities have reached epidemic proportions in the
USA.22 New data from the National Health and Nutrition Examination Survey (NHANES)
also shows alarming rates of overweight and obesity in the US pediatric population of 32%
and 17%, respectively,18 and annually at least 3700 youth are diagnosed with type 2 diabetes
in the USA.16 Alterations in glucose metabolism have been documented in overweight/
obese children and adolescents,17 but there is little information on the onset and progression
of MetS in such cohorts.
We provide preliminary data on the onset and progression of insulin resistance and glucose
tolerance in a juvenile Ossabaw female pig model that could be used to investigate
childhood and adolescent obesity and MetS. We found that pigs had profound increases in
insulin resistance and decreases in glucose tolerance within a relatively short period (2-
month) of consuming the HA diet. Our study did not include control pigs on a lean diet and
therefore age cannot be excluded from contributing to these early metabolic abnormalities.
There are a small number of reports in the published literature that have used a juvenile
swine model to explore the effects of an obesogenic diet in children. One study showed that
feeding 2-month-old Göttigen pigs a high-energy diet for only 2-weeks resulted in
substantial insulin resistance and impaired glucose tolerance compared to age-matched pigs
fed a low-energy diet as measured by oral glucose tolerance tests.23 These early impairments
in glucose and insulin metabolism were associated with an increase in the percentage of
body fat.23 A second study fed a diet high in fat and sucrose to 3–4 month-old Chinese
Guizhou minipigs and compared their findings to age-matched pigs on a normal control diet.
Based on fasting blood glucose and insulin levels, only pigs consuming the high fat/sucrose
diet for 2-months or longer were hyperglycemic and insulin resistant.24 Therefore, we
assume that the dramatic abnormalities in glucose and insulin metabolism observed in the
first 2-months of our study were likely a result of consuming the HA diet.
Our study provides new information on the temporal progression of MetS following this
early metabolic impairment. There was a shallow decrease in insulin sensitivity over the
course of the study—that is, a slow progressive increase in insulin resistance. Despite
substantial step-wise increases in daily caloric intake and ever-increasing obesity, there was
a plateau in impaired glucose metabolism that was likely due to the adaptive response of the
pancreas to continuously increase beta cell insulin function. However, beta cell insulin
function at 7 months appeared to be insufficient to compensate for the decrease in insulin
sensitivity and led to further impairment in glucose tolerance (lower DI and decreased KG)
Handa et al. Page 6
J Urol. Author manuscript; available in PMC 2016 April 01.
Author M
anuscriptA
uthor Manuscript
Author M
anuscriptA
uthor Manuscript
as pigs advanced towards diabetes. These results, albeit preliminary, suggest that the
juvenile Ossabaw pig could be a useful animal model to study childhood obesity, MetS and
associated cardiovascular disorders, as well as the mechanisms and factors contributing to
these effects.
Effect of renal SWL on the development of MetS
Since the introduction of extracorporeal SWL in the 1980s to treat kidney stones there have
been many clinical reports supporting7,9,11 or opposing8,10,12,25 the view that renal SWL can
lead to new onset hypertension, and this debate continues to the present day.26,27 Also, there
are concerns that renal SWL can lead to diabetes as a result of a 19-year followup
retrospective study in adults suggesting that SWL can result in a 3-fold increase in the risk
of diabetes.9 However, others have not shown such associations with diabetes in adult
patients with long-term follow-ups.10,12,13 The only non-adult study examining the risks of
SWL-induced diabetes reported that fasting levels of glucose remained normal over a mean
followup period of 5 years in patients (average age of 6.5 years old) treated with single or
multiple SWL sessions.28
We examined the issue of whether renal SWL is a risk factor for diabetes and hypertension
in the Ossabaw pig, a model that demonstrates similar features of human MetS.19 Juvenile
pigs underwent renal SWL to mimic treatment of children, and then MetS was induced by
daily feeding of a diet high in fat, cholesterol and fructose.19 Although we had only 2 pigs in
the SWL-treated and sham-treated groups, we found a similar onset and progression of
insulin resistance and glucose intolerance. Furthermore, we found no evidence of SWL-
induced acute injury to the pancreas based on MRIs or plasma pancreatic amylase levels
(not shown), and no signs of chronic injury to the pancreatic tail based on tissue histology.
These preliminary results support the notion that renal SWL is not a risk factor for diabetes,
and is in agreement with our most recent findings that renal SWL does not worsen insulin
resistance and glucose tolerance in adult pigs with robust MetS.21
The conflicting reports of whether renal SWL can induce hypertension were largely based
on studies of the general nephrolithiasis population and then stratified for correlates, as well
as using a variety of lithotripters and SW delivery protocols. Perhaps not surprisingly, a
meta-analysis of eleven clinical studies found no association between SWL and the
development of hypertension.26 Some investigators have suggested that older patients—a
cohort that is at greater risk of developing high blood pressure—may be more prone to
hypertension after SWL, which correlated well with elevations in renal resistive indexes.29
Animal models with a genetic disposition towards the development of hypertension have
also shown that SWL-treatment can evoke a rise in blood pressure.30 Although arterial blood
pressure remained relatively constant in our sham-treated pigs over the course of the study,
such obese pigs consuming a HA diet will undoubtedly become hypertensive at some
point.19 On the other hand, there was a substantial elevation in arterial blood pressure in
each of the two SWL-treated juvenile pigs that began at 30–70 days on the HA diet and
continued to rise throughout the 200 day study. This implies that renal SWL accelerated the
onset of hypertension in MetS, which was likely due to the detrimental effects of SWs on the
kidney.7,29,present study Indeed, renal histology revealed permanent loss of parenchyma as
Handa et al. Page 7
J Urol. Author manuscript; available in PMC 2016 April 01.
Author M
anuscriptA
uthor Manuscript
Author M
anuscriptA
uthor Manuscript

well as structural abnormalities seven months after SWL treatment. Therefore, our
preliminary findings are in agreement with those clinical and animal studies that implicate
renal SWL as a risk factor for elevating blood pressure—the onset being accelerated in those
predisposed towards hypertension.
Limitations of this pilot study include: the small number of pigs in each group; the early
death of a control (sham-SWL) pig; and the study was not powered to detect significance
between groups. Therefore, our results should be viewed as exploratory in nature.
Acknowledgments
This work was supported by a Showalter grant (RKH) and PHS grant P01-DK43881.
Abbreviations and Acronyms
SW shock wave
SWL SW lithotripsy
MetS metabolic syndrome
MRI magnetic resonance imaging
IVGTT intravenous glucose tolerance test
MABP mean arterial blood pressure
HA diet hypercaloric atherogenic diet
AIRG acute insulin response to glucose
KG glucose tolerance
S2 insulin sensitivity index
AUC area under curve
BCF beta cell function
HOMA-%BCF homeostasis model assessment of steady state BCF
QUICKI quantitative insulin sensitivity check index
DI disposition index
References
1. Gerber GS. Trends in Endourological practice: Management of lower-pole caliceal stones. J Endourol. 2003; 17:501. [PubMed: 14565883]
2. Nelson CP. Extracorporeal shock wave lithotripsy in the pediatric population. Urol Res. 2010; 38:327. [PubMed: 20625893]
3. Kaude JV, Williams CM, Millner MR, et al. Renal morphology and function immediately after extracorporeal shock wave lithotripsy. AJR. 1985; 145:305. [PubMed: 3875231]
4. Baumgartner BR, Dickey KW, Ambrose SS, et al. Kidney changes after extracorporeal shock wave lithotripsy: appearance on MR imaging. Radiology. 1987; 163:531. [PubMed: 3562837]
Handa et al. Page 8
J Urol. Author manuscript; available in PMC 2016 April 01.
Author M
anuscriptA
uthor Manuscript
Author M
anuscriptA
uthor Manuscript

5. Dhar NB, Thornton J, Karafa MT, et al. A multivariate analysis of risk factors associated with subcapsular hematoma formation following electromagnetic shock wave lithotripsy. J Urology. 2004; 172:2271.
6. Razvi H, Fuller A, Nott L, et al. Risk factors for perinephric hematoma formation after shockwave lithotripsy: A matched case-control analysis. J Endourology. 2012; 26:1478.
7. Williams CM, Thomas WC. Permanently decreased renal blood flow and hypertension after lithotripsy. NEJM. 1989; 321:1269. [PubMed: 2797093]
8. Eassa WA, Sheir KZ, Gad HM, et al. Prospective study of the long-term effects of shock wave lithotripsy on renal function and blood pressure. J Urol. 2008; 179:964. [PubMed: 18207167]
9. Krambeck AE, Gettman MT, Rohlinger AL, et al. Diabetes mellitus and hypertension associated with shock wave lithotripsy of renal and proximal ureteral stones at 19 years of followup. J Urol. 2006; 175:1742. [PubMed: 16600747]
10. Sato Y, Tanda H, Kato S, et al. Shock wave lithotripsy for renal stones is not associated with hypertension and diabetes mellitus. Urol. 2008; 71:586. [PubMed: 18387387]
11. Barbosa PV, Makhlouf AA, Thorner D, et al. Shockwave lithotripsy associated with greater prevalence of hypertension. Urology. 2011; 78:22. [PubMed: 21256538]
12. Chew BH, Zavaglia B, Sutton C, et al. Twenty-year prevalence of diabetes mellitus and hypertension in patients receiving shock-wave lithotripsy for urolithiasis. BJU Int. 2012; 109:444. [PubMed: 21635683]
13. de Cógáin M, Krambeck AE, Rule AD, et al. Shock wave lithotripsy and diabetes mellitus: a population-based cohort study. Urol. 2012; 79:298. [PubMed: 22088569]
14. Willis LR, Evan AP, Connors BA, et al. Relationship between kidney size, renal injury, and renal impairment induced by shock wave lithotripsy. JASN. 1999; 10:1753. [PubMed: 10446943]
15. Sas DJ. An update on the changing epidemiology and metabolic risk factors in pediatric kidney stone disease. Clin J Am Soc Nephrol. 2011; 6:2062. [PubMed: 21737846]
16. Writing Group for the SEARCH for Diabetes in Youth Study Group. The burden of diabetes mellitus among US youth: Prevalence estimates from the SEARCH for diabetes in Youth Study. Pediatrics. 2006; 118:1511.
17. Brufani C, Ciampalini P, Grossi A, et al. Glucose tolerance status in 510 children and adolescents attending an obesity clinic in Central Italy. Pediatric Diabetes. 2010; 11:47. [PubMed: 19460122]
18. Ogden CL, Carroll MD, Kit BK, et al. Prevalence of obesity and trends in body mass index among US children and adolescents, 1999–2010. JAMA. 2012; 307:483. [PubMed: 22253364]
19. Lee L, Alloosh M, Saxena R, et al. Nutritional model of steatohepatitis and metabolic syndrome in the Ossabaw miniature swine. Hepatology. 2009; 50:56. [PubMed: 19434740]
20. Ford ES. Risks for all-cause mortality, cardiovascular disease, and diabetes associated with the metabolic syndrome. Diabetes Care. 2005; 28:1769. [PubMed: 15983333]
21. Handa RK, Evan AP, Connors BA, et al. Shock wave lithotripsy targeting of the kidney and pancreas does not increase the severity of metabolic syndrome in a porcine model. J Urol. 2014
22. Flegal KM, Carroll MD, Kit BK, et al. Prevalence of obesity and trends in the distribution of body mass index among US adults, 1999–2010. JAMA. 2012; 307:491. [PubMed: 22253363]
23. Christoffersen B, Golozoubova V, Pacini G, et al. The young Gottingen minipig as a model of childhood and adolescent obesity: Influence of diet and gender. Obesity. 2013; 21:149. [PubMed: 23505180]
24. Xi S, Yin W, Wang Z, et al. A minipig model of high-fat/high-sucrose diet-induced diabetes and atherosclerosis. Int J Exp Path. 2004; 85:223. [PubMed: 15312127]
25. Krambeck AE, Rule AD, Li X, et al. Shock wave lithotripsy is not predictive of hypertension among community stone formers at long-term followup. J Urol. 2011; 185:164. [PubMed: 21074794]
26. Yu C, Longfei L, Long W, et al. A systemic review and meta-analysis of new onset hypertension after extracorporeal shock wave lithotripsy. Int Urol Nephrol. 2014; 46:719. [PubMed: 24162890]
27. Eterovic D, Situm M, Markovic V, et al. Are we estimating the adverse effects of shock-wave lithotripsy on a faulty scale? Med Hypotheses. 2014 http://dx.doi.org/10.1016/j.mehy.2014.03.005.
Handa et al. Page 9
J Urol. Author manuscript; available in PMC 2016 April 01.
Author M
anuscriptA
uthor Manuscript
Author M
anuscriptA
uthor Manuscript

28. El-Nahas RA, Awad BA, El-Assmy AM, et al. Are there long-term effects of extracorporeal shockwave lithotripsy in paediatric patients? BJUI. 2013; 111:666.
29. Janetschek G, Frauscher F, Knapp R, et al. New onset hypertension after extracorporeal shock wave lithotripsy: Age related incidence and prediction by intrarenal resistive index. J Urol. 1997; 158:346. [PubMed: 9224300]
30. Weber C, Gluck U, Staehler G, et al. Extracorporeal shock wave treatment raises blood pressure in borderline hypertensive rats. J Urol. 1995; 154:232. [PubMed: 7776436]
Handa et al. Page 10
J Urol. Author manuscript; available in PMC 2016 April 01.
Author M
anuscriptA
uthor Manuscript
Author M
anuscriptA
uthor Manuscript
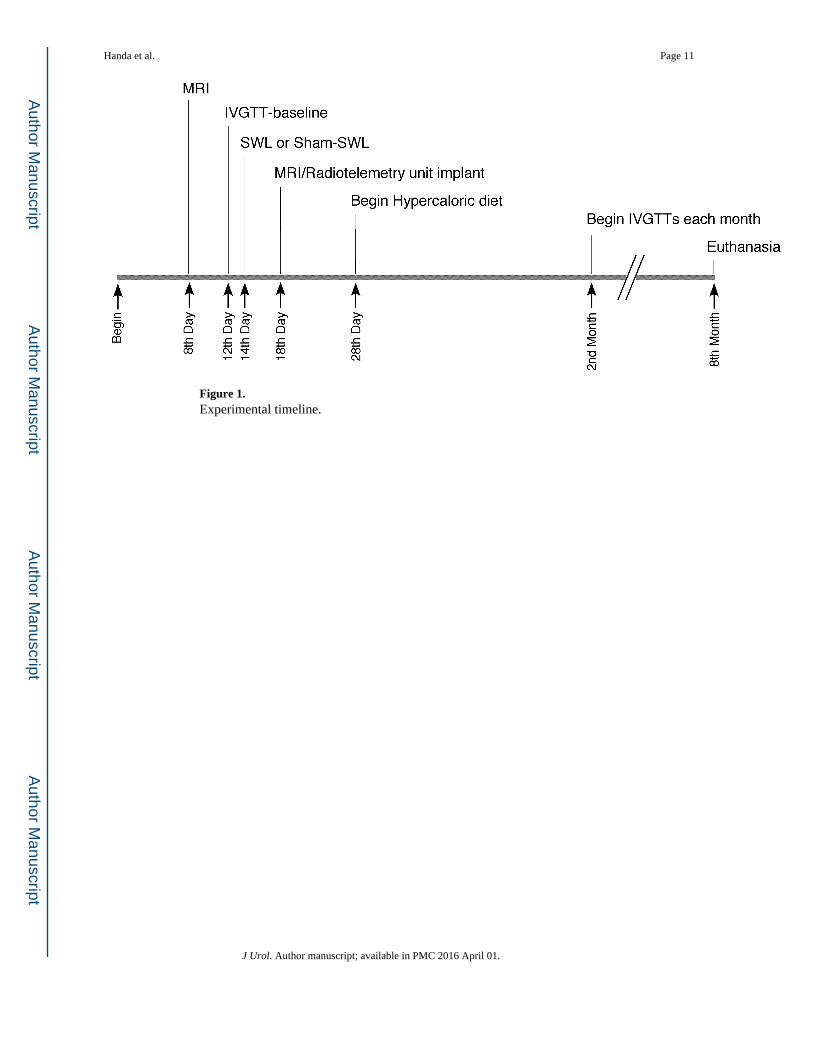
Figure 1. Experimental timeline.
Handa et al. Page 11
J Urol. Author manuscript; available in PMC 2016 April 01.
Author M
anuscriptA
uthor Manuscript
Author M
anuscriptA
uthor Manuscript
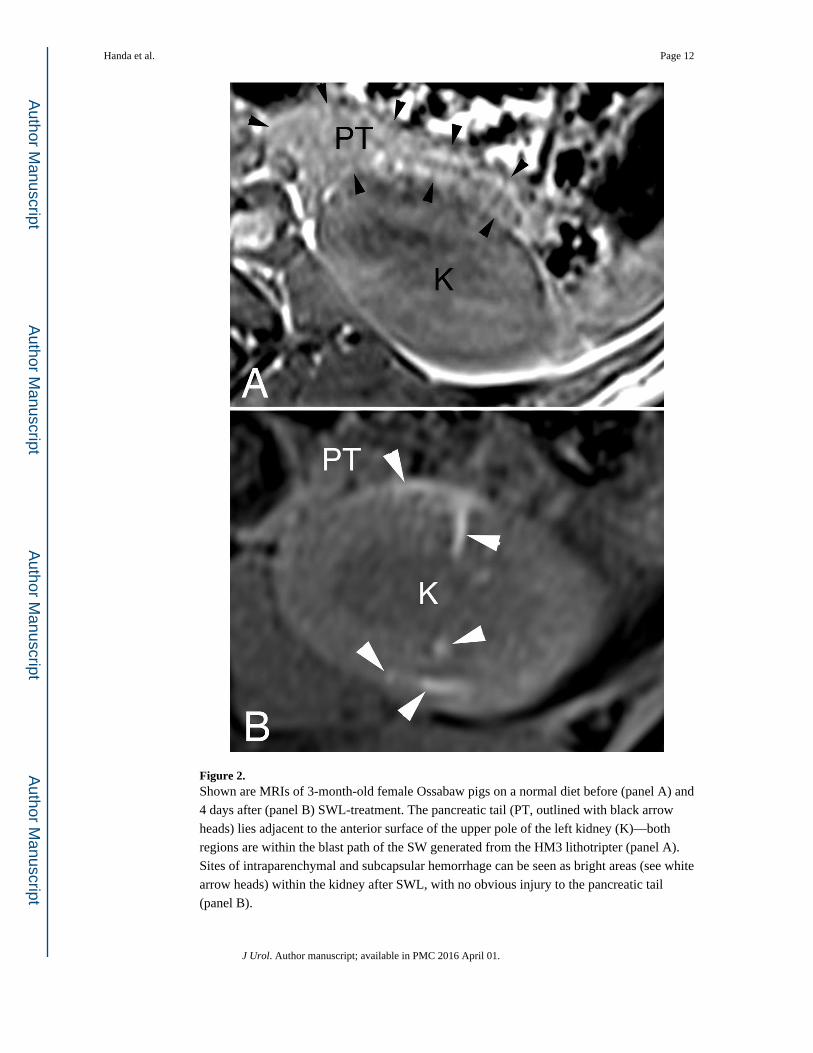
Figure 2. Shown are MRIs of 3-month-old female Ossabaw pigs on a normal diet before (panel A) and
4 days after (panel B) SWL-treatment. The pancreatic tail (PT, outlined with black arrow
heads) lies adjacent to the anterior surface of the upper pole of the left kidney (K)—both
regions are within the blast path of the SW generated from the HM3 lithotripter (panel A).
Sites of intraparenchymal and subcapsular hemorrhage can be seen as bright areas (see white
arrow heads) within the kidney after SWL, with no obvious injury to the pancreatic tail
(panel B).
Handa et al. Page 12
J Urol. Author manuscript; available in PMC 2016 April 01.
Author M
anuscriptA
uthor Manuscript
Author M
anuscriptA
uthor Manuscript
Figure 3. Body weight and caloric consumption of juvenile Ossabaw pigs on a diet high in fat,
cholesterol and fructose. One kg of the diet provides ~6000 kCal and ~2.5 g of sodium.
Handa et al. Page 13
J Urol. Author manuscript; available in PMC 2016 April 01.
Author M
anuscriptA
uthor Manuscript
Author M
anuscriptA
uthor Manuscript

Figure 4. MABP in sham-treated and SWL-treated juvenile Ossabaw pigs fed a HA diet. Each data
point represents the average blood pressure during a 12 h daylight cycle—a time when the
pig is most active. SWL or sham-treatment was performed ~14 days prior to feeding pigs the
HA diet.
Handa et al. Page 14
J Urol. Author manuscript; available in PMC 2016 April 01.
Author M
anuscriptA
uthor Manuscript
Author M
anuscriptA
uthor Manuscript
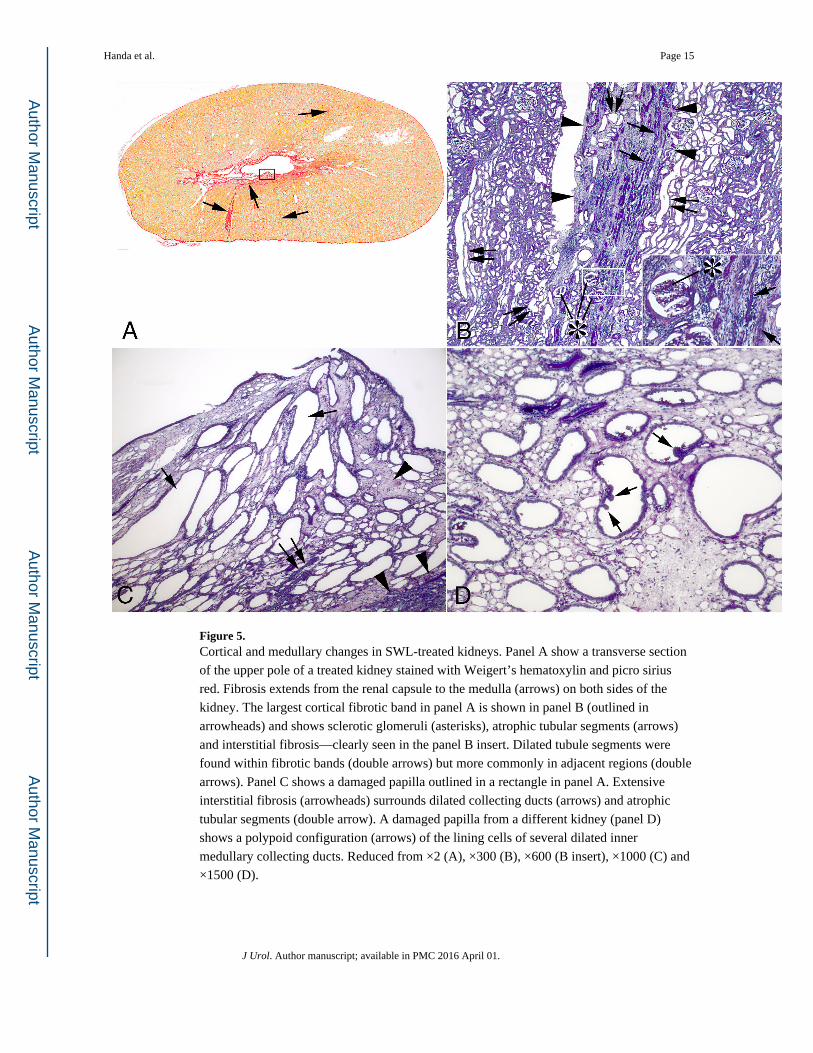
Figure 5. Cortical and medullary changes in SWL-treated kidneys. Panel A show a transverse section
of the upper pole of a treated kidney stained with Weigert’s hematoxylin and picro sirius
red. Fibrosis extends from the renal capsule to the medulla (arrows) on both sides of the
kidney. The largest cortical fibrotic band in panel A is shown in panel B (outlined in
arrowheads) and shows sclerotic glomeruli (asterisks), atrophic tubular segments (arrows)
and interstitial fibrosis—clearly seen in the panel B insert. Dilated tubule segments were
found within fibrotic bands (double arrows) but more commonly in adjacent regions (double
arrows). Panel C shows a damaged papilla outlined in a rectangle in panel A. Extensive
interstitial fibrosis (arrowheads) surrounds dilated collecting ducts (arrows) and atrophic
tubular segments (double arrow). A damaged papilla from a different kidney (panel D)
shows a polypoid configuration (arrows) of the lining cells of several dilated inner
medullary collecting ducts. Reduced from ×2 (A), ×300 (B), ×600 (B insert), ×1000 (C) and
×1500 (D).
Handa et al. Page 15
J Urol. Author manuscript; available in PMC 2016 April 01.
Author M
anuscriptA
uthor Manuscript
Author M
anuscriptA
uthor Manuscript

Author M
anuscriptA
uthor Manuscript
Author M
anuscriptA
uthor Manuscript
Handa et al. Page 16
Tab
le 1
Gly
cem
ic m
easu
rem
ents
in ju
veni
le O
ssab
aw p
igs
fed
a H
A d
iet.
HA
DIE
T D
UR
AT
ION
0-M
ON
TH
2-M
ON
TH
3-M
ON
TH
4-M
ON
TH
5-M
ON
TH
6-M
ON
TH
7-M
ON
TH
Fas
ting:
Pla
sma
Glu
cose
(m
g/dL
)10
8 ±
10
99 ±
287
* ±
283
** ±
398
± 1
086
* ±
185
* ±
5
Pla
sma
Insu
lin (
µU/m
l)13
± 6
12 ±
211
± 1
10 ±
123
* ±
412
± 0
18 ±
3
QU
ICK
I0.
334
± 0
.021
0.32
9 ±
0.0
040.
338
± 0
.007
0.34
5 ±
0.0
040.
301*
± 0
.012
0.33
2 ±
0.0
000.
317
± 0
.01
HO
MA
-BC
F%
93 ±
21
121
± 2
616
3 ±
13
192*
± 4
425
2***
± 3
519
0* ±
630
5***
± 5
3
IVG
TT
:
AU
Cgl
ucos
e/A
UC
insu
lin7.
23 ±
1.9
65.
53 ±
0.2
63.
64**
± 0
.51
4.19
* ±
0.6
83.
03**
± 0
.17
2.97
** ±
0.8
32.
91**
± 0
.08
BC
F (
pmol
/mm
ol)
12.5
0 ±
3.5
611
.34
± 0
.37
14.0
5 ±
2.1
313
.52
± 0
.87
16.4
2 ±
1.5
015
.59
± 3
.27
17.0
5 ±
2.3
5
KG
(m
in−
1 )6.
37 ±
0.4
23.
72**
± 0
.23
4.41
* ±
0.5
34.
17*
± 0
.42
4.20
* ±
0.3
34.
67*
± 0
.84
3.01
***
± 0
.37
S2 (
ml•
min
−1 •
pM•k
g−1 )
6.78
± 1
.19
2.50
***
± 0
.21
1.93
***
± 0
.20
1.77
***
± 0
.27
1.37
***
± 0
.05
1.14
***
± 0
.08
0.85
***
± 0
.12
DI
2056
± 1
9375
6***
± 7
677
3***
± 5
774
1***
± 7
770
5***
± 7
664
2***
± 6
248
5***
± 4
1
HA
die
t = h
yper
calo
ric
athe
roge
nic
diet
; QU
ICK
I =
qua
ntita
tive
insu
lin s
ensi
tivity
che
ck in
dex;
HO
MA
-%B
CF
= h
omeo
stas
is m
odel
ass
essm
ent f
or s
tead
y st
ate
beta
cel
l fun
ctio
n; A
UC
= a
rea
unde
r cu
rve
for
gluc
ose
and
insu
lin; B
CF
= b
eta
cell
func
tion;
KG
= g
luco
se to
lera
nce;
S2
= in
sulin
sen
sitiv
ity in
dex;
DI
= d
ispo
sitio
n in
dex.
Equ
atio
ns f
or e
ach
glyc
emic
mea
sure
are
des
crib
ed in
the
Cal
cula
tions
sect
ion
in M
etho
ds a
nd M
ater
ials
. Dat
a sh
own
are
mea
n ±
SE
M.
* = P
<0.
05,
**=
P<
0.01
,
*** =
P<
0.00
1 fr
om b
asel
ine
valu
es (
0-M
ON
TH).
J Urol. Author manuscript; available in PMC 2016 April 01.