swine disease reporting system · 2018-07-02 · prrs rrt-pcr data from the university of minnesota...
TRANSCRIPT
SWINE DISEASE REPORTING SYSTEM
Report # 5 (July 3rd, 2018)
Swine Disease Reporting System report 5 (July 3rd, 2018)
What is the SDRS? SHIC-funded, veterinary diagnostic laboratories (VDLs) collaborative project, with goal to aggregate swine diagnostic data from participating reporting VDLs, and report in an intuitive format (web dashboards), describing dynamics of disease detection by pathogen or disease syndrome over time, specimen, age group, and geographical space. For this report, to help develop the template, data is from the Iowa State University VDL. Specifically, for PRRSV PCR results, there was a contribution from the University of Minnesota VDL. Other VDLs should be participating soon. For all “2018 predictive graphs”, the expected value was calculated using a statistical model that takes into account the results from 3 previous years. The intent of the model is not to compare the recent data (2018) to individual weeks of previous years. The intent is to estimate expected levels of percent positive cases based on patterns observed in the past data, and define if observed percentage positive values are above or below the expected based on historic trends.
Collaborators: Iowa State University: Giovani Trevisan*, Leticia Linhares, Bret Crim; Poonam Dubey, Kent Schwartz, Rodger Main, Daniel Linhares**. University of Minnesota: Mary Thurn, Paulo Lages, Kimberly VanderWaal, Andres Perez, Jerry Torrison.
Kansas State University: Jamie Henningson, Eric Herrman, Gregg Hanzlicek, Ram Raghavan, Douglas Marthaler. South Dakota State University: Jon Greseth, Jane C. Hennings. * Giovani Trevisan: Project coordinator. E-mail: [email protected]. ** Daniel Linhares: Principal investigator. E-mail: [email protected].
Advisory Council: The advisory group reviews the data to discuss it and provide their comments to try to give the data some context and thoughts about its interpretation: Clayton Johnson, Emily Byers, Hans Rotto, Jeremy Pittman, Mark Schwartz, Paul Sundberg, Paul Yeske, Pete Thomas, Rebecca Robbins, Tara Donovan.
This report is an abbreviated version of the dashboards that are available online. To access the full data, use your computer, tablet, or phone to:
1) Scan the code below, or go to: www.powerbi.com 2) Login: [email protected] 3) Password: Bacon 100 4) On the left bar, click on ‘Apps’ 5) Select your dashboard of interest (e.g. PRRS)

SWINE DISEASE REPORTING SYSTEM
Report # 5 (July 3rd, 2018)
Page 1 – Detection of PRRSV RNA over time by rRT-PCR.
Figure 1 Top chart: Results of PRRS rRT-PCR cases over time. Bottom right: expected percentage of positive results for PRRSV RNA by rRT-PCR, with 1 standard deviation above and below the expected value. Bottom left: PRRS virus RFLPs detected on 2017, and 2018.
Figure 2 Left: expected percentage of positive results for PRRSV RNA by rRT-PCR, with 1 standard deviation above and below the expected value for Sow farms. Right: expected percentage of positive results for PRRSV RNA by rRT-PCR, with 1 standard deviation above and below the expected value for Wean to market animals. PRRS rRT-PCR data from the University of Minnesota Veterinary Diagnostic Laboratory (UMN-VDL) was consolidated with the data from the Iowa State University Veterinary Diagnostic Laboratory (ISU-VDL).

SWINE DISEASE REPORTING SYSTEM
Report # 5 (July 3rd, 2018)
SDRC Advisory Council highlights:
1) PRRS activity still above the predicted value for 2018, with a recent spike in sow farms. 2) Detection of RFLPs 2-5-2, 1-7-4, and 1-8-4 are proportionally higher for the first 6 months of 2018
when compared with all year of 2017. 3) Higher detection of RFLP 2-5-2 may be associated with use of MLV vaccine for PRRS control in sow
farms.

SWINE DISEASE REPORTING SYSTEM
Report # 5 (July 3rd, 2018)
Page 3 – Detection of enteric coronaviruses by rRT-PCR
Figure 3 Left side: results of PEDV, and PDCoV rRT-PCR cases over time. Right side charts: expected percentage of positive results for PEDV and PDCoV by rRT-PCR, with 1 standard deviation above and below the expected value, respectively.
SDRC Advisory Council highlights: 1) Spring months of 2018 had the highest number of test performed for PED and PDCoV; 2) The results for PED is following the predicted value for 2018. PDCoV still above predicted values but has
a consistent trend in decreasing percentage of positive results. This trend is consistent with decrease in percentage of detection for 2018 season:
a. Sow farms: winter 9.48%, spring 5.53%, and summer 2.67%. b. Wean to market winter 8.52%, spring 9.86%, and summer 5.24%.

SWINE DISEASE REPORTING SYSTEM
Report # 5 (July 3rd, 2018)
Page 4 – Detection of pathogens associated with CNS disease
Figure 4 Pathogen detection on CNS tissue over time. Each green bar indicates a different agent or syndrome. The red bar accounts for the sum of the green bars. Bottom: summer months of 2016, middle summer months of 2017, top summer months of 2018. Spring months contains results of June, July, August. ‘Multiple agents’ represent cases with more than one pathogen detected on CNS tissues. SDRC Advisory Council highlights:
a) June is considered the first month of summer, and the number of CNS cases detected were similar to the detection in previous years having Streptococcus suis as the major agent detected.
Respiratory Syndrome Information

SWINE DISEASE REPORTING SYSTEM
Report # 5 (July 3rd, 2018)
What is the Respiratory Syndrome Page? The respiratory syndrome page is a compilation of lab results from porcine respiratory tissue submitted to the ISU-VDL for pathogen investigation from 2010 to May 2018. As a prerequisite to be included in this group of results, the case should have been from porcine and have specimen from respiratory tract. Only results compatible with known respiratory agents are reported in this dashboard page. How it is organized? Respiratory data retrieved from ISU-VDL was organized at an accession ID case level. Information of animal category, specimen type, season, and geographic location was gathered similar to that of previous reports. Three new set of information were added. First, a filter allowing to separate specimens pertaining to upper and or lower reparatory tract was created. Second, cases where a final diagnostic, such as pneumonia, pleuritis, rhinitis, tracheitis, and/or systemic agent affecting respiratory tissue was reported by an ISU-VDL diagnostician, a diagnostic filter was compiled. The definition for multiple diagnostic was inserted when more than one of the following diagnostic codes was reported in the case: pneumonia, pleuritis, rhinitis, and/or tracheitis. When diagnostic code information was not available, and there was detection of a ‘respiratory’ pathogen, the term “Lab results” was assigned for diagnostic. And third, the agent detected is always reported. When there was detection of more than one agent, the definition multiple is assigned for agent. The specimen type oral fluid was excluded from this page, since it is more associated with disease monitoring. Where it is available? The Respiratory data is available as a dashboard (App) in the SDRS powerbi.com portal and can be accessed following instructions in the first page of this report. A list of abbreviations used in the respiratory page is provided in the second tab of the Respiratory App. Two dynamic graphs are available so far with information by season and over time. Relative number of cases and percentage of the agent over the total number of cases. Dynamic filters can be applied for animal category, specimen, upper and or lower respiratory tract, diagnostic, and agent. Specific data drilling will be performed and reported at the press report.
How to interpret? Respiratory data contains cases where respiratory tissue was submitted to ISU-VDL. The cases potentially represent a good picture of clinical cases happening in the field and submitted for diagnostic investigation. The number of cases and agents here reported only represents the agents detected at ISU-VDL.
SWINE DISEASE REPORTING SYSTEM
Report # 5 (July 3rd, 2018)
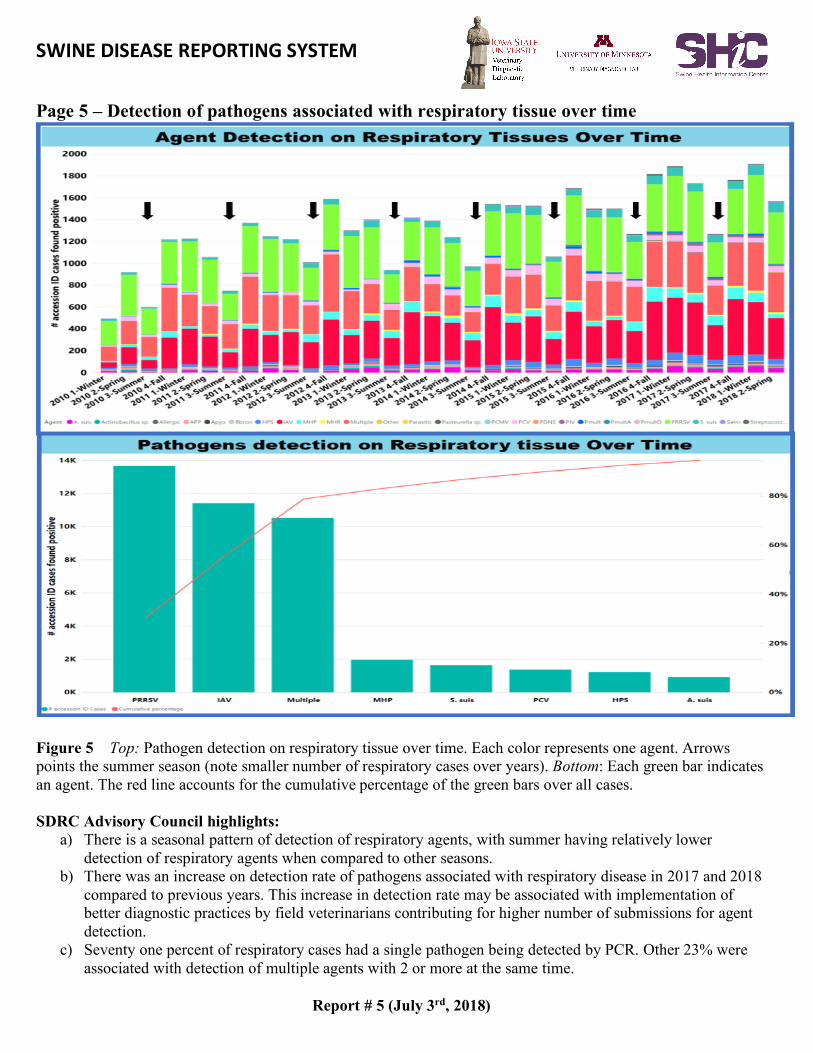
Page 5 – Detection of pathogens associated with respiratory tissue over time
Figure 5 Top: Pathogen detection on respiratory tissue over time. Each color represents one agent. Arrows points the summer season (note smaller number of respiratory cases over years). Bottom: Each green bar indicates an agent. The red line accounts for the cumulative percentage of the green bars over all cases. SDRC Advisory Council highlights:
a) There is a seasonal pattern of detection of respiratory agents, with summer having relatively lower detection of respiratory agents when compared to other seasons.
b) There was an increase on detection rate of pathogens associated with respiratory disease in 2017 and 2018 compared to previous years. This increase in detection rate may be associated with implementation of better diagnostic practices by field veterinarians contributing for higher number of submissions for agent detection.
c) Seventy one percent of respiratory cases had a single pathogen being detected by PCR. Other 23% were associated with detection of multiple agents with 2 or more at the same time.

SWINE DISEASE REPORTING SYSTEM
Report # 5 (July 3rd, 2018)
Page 6 – Detection of pathogens associated with respiratory tissue over time
Figure 6 Pathogen detection on respiratory tissue over time in percentage of occurrence by season. Each color represents one agent. Arrows points the fall season where IAV occurrence reached the highest share compared with the other season in the year (6 of 8 years in analysis). SDRC Advisory Council highlights:
a) There was a relative increase in detection of Influenza A virus (IAV), and decrease of detection of PRRSV between 2010 and 2018.
b) During the past 8 years, IAV had higher detection during the fall season.

SWINE DISEASE REPORTING SYSTEM
Report # 5 (July 3rd, 2018)
Page 7 – Multiple agents combination detected in respiratory tissue
Figure 7 Multiple agents detected in respiratory tissue per accession ID case level. Each blue bar represents a combination of 2 or more agents. The red line represents the cumulative percentage of multiple agents detected. SDRC Advisory Council highlights:
a) Viral agents such as PRRSV, IAV, and Circovirus have been detected frequently in respiratory cases with multiple agents.