swim and horizon 2020 support mechanism
TRANSCRIPT

This Project is funded by the European Union
SWIM and Horizon 2020 Support MechanismWorking for a Sustainable Mediterranean, Caring for our Future
Presented by:
Dr. Maggie KOSSIDA, SWIM-H2020 SM NKE
Training Workshop with the competent authorities on the process of designing measures and policy targets at the local/ decentralized level
15th March 2019, Beirut, Lebanon
SWIM-H2020 SM EFS-LB-1
Methods for assessing water use of various sectors

Presentation Outline
▪ Why do we need water use information?
▪ Basic definitions
▪ Typology for water use categories
▪ Guidelines for the estimation of water uses
▪ Monitoring and reporting of water uses
▪ Policy-relevant assessment of water uses, Indicators
▪ International examples
2
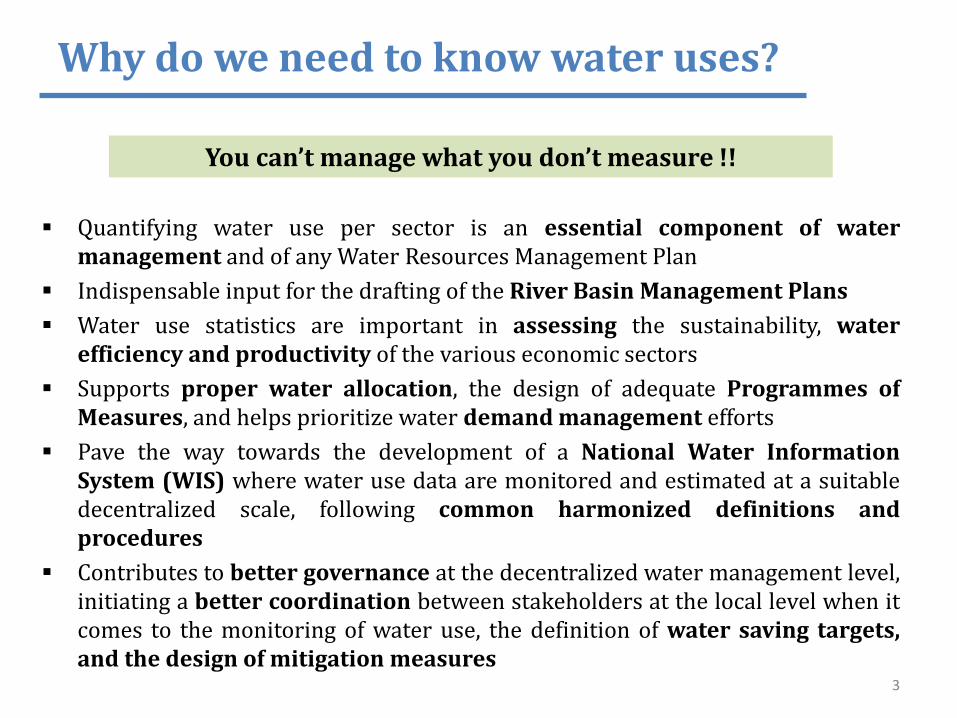
Why do we need to know water uses?
▪ Quantifying water use per sector is an essential component of watermanagement and of any Water Resources Management Plan
▪ Indispensable input for the drafting of the River Basin Management Plans
▪ Water use statistics are important in assessing the sustainability, waterefficiency and productivity of the various economic sectors
▪ Supports proper water allocation, the design of adequate Programmes ofMeasures, and helps prioritize water demand management efforts
▪ Pave the way towards the development of a National Water InformationSystem (WIS) where water use data are monitored and estimated at a suitabledecentralized scale, following common harmonized definitions andprocedures
▪ Contributes to better governance at the decentralized water management level,initiating a better coordination between stakeholders at the local level when itcomes to the monitoring of water use, the definition of water saving targets,and the design of mitigation measures
3
You can’t manage what you don’t measure !!

Basic Definitions
▪ Water Demand: the amount of water that is required to fully and completely satisfy awater use according to cultural, sociological, technological, meteorological conditions ona certain place in the world.
▪ Water Supply: the delivery of water from various sources (conventional and non-conventional) to the final users in order to satisfy the water demand. The water can bedelivered through a public water supply system (PWSS) or via self-supply (directabstraction or non-conventional production for own final use).
▪ Water Abstraction (or water withdrawal): the process of taking water from anatural hydrological regime (ground or surface water body), either temporarily orpermanently, and conveyed to a place of use.
▪ Water Use: the utilization of water for a specific purpose, e.g. by agriculture, industry,energy production and households. It includes the in—stream uses such as fishing,recreation, transportation, identifying nevertheless that these are non-consumptive typesof water use.
▪ Water Consumption: water abstracted which is no longer available for use because it hasevaporated, incorporated into products and crops, consumed by man or livestock, etc. Itrepresents the portion of water use that is not returned to the original water sourceafter being withdrawn and is no longer available for reuse. Water losses duringtransport are excluded because they may return to the system (e.g. leakage losses). 4
It is often observed that stakeholders do notnecessarily have a common understanding of thebasic definitions of water use related componentsand use the different terms interchangeably.
Basic Definitions (cont.)
5
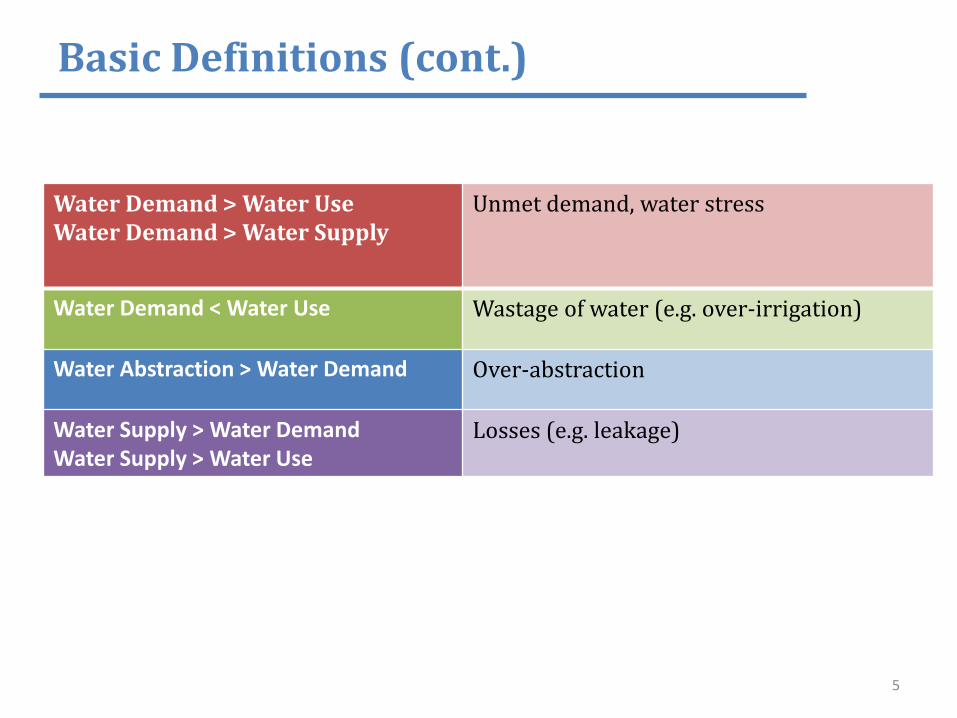
Water Demand > Water UseWater Demand > Water Supply
Unmet demand, water stress
Water Demand < Water Use Wastage of water (e.g. over-irrigation)
Water Abstraction > Water Demand Over-abstraction
Water Supply > Water DemandWater Supply > Water Use
Losses (e.g. leakage)

Basic Definitions (cont.)
▪ Returned water: the part of the water which has been abstracted from a freshwater source and discharged/ returned into its source or into another fresh waterbody (surface or groundwater) either before use (leakage losses) or after use(as treated effluent or as non-treated). Discharges to the sea are not included.
▪ Reused water: water that has undergone wastewater treatment and isdelivered to a user as reclaimed wastewater. Wastewater discharged into awatercourse and used again downstream is excluded (i.e. this is consideredreturned water).
▪ Recycled water: is used multiple times by the same user (either treated or non-treated) after withdrawal and before it returns to the natural hydrologic system.
6

Basic Definitions (cont.)
7
Conceptual flowchart of the “returned water” components
Basic Definitions (cont.)
8
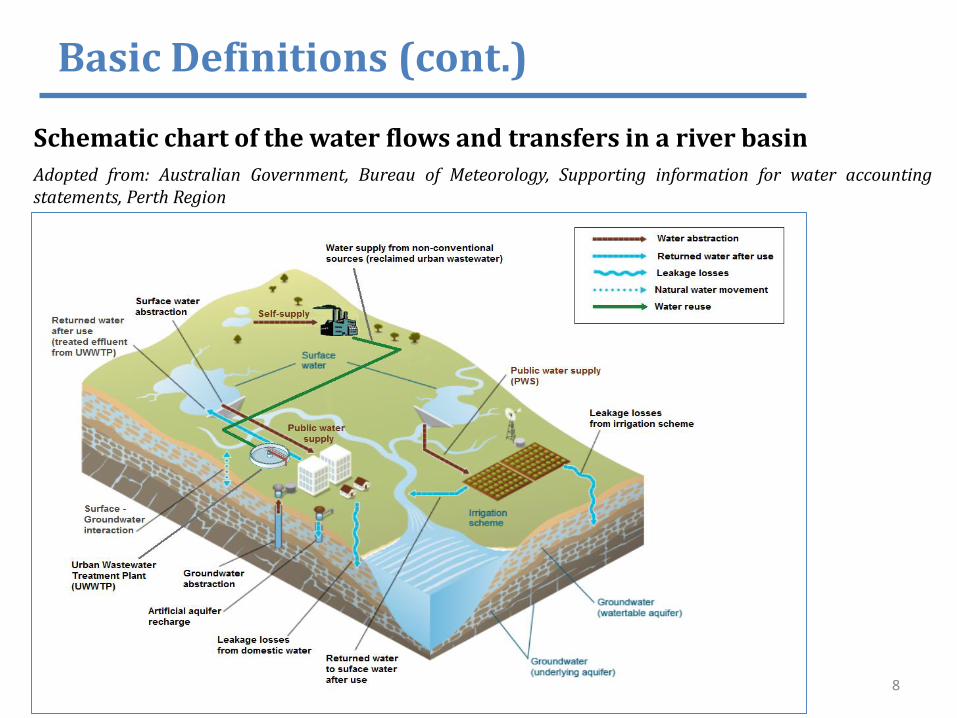
Schematic chart of the water flows and transfers in a river basin
Adopted from: Australian Government, Bureau of Meteorology, Supporting information for water accountingstatements, Perth Region
Typology of water uses
9
This typology can form a solid basis for common understandingamong the River Basins when it comes to defining and analyzingwater uses and their associated pressures in their River BasinManagement Plans.
Furthermore, as the current suggested typology is in close relationwith internationally accepted typologies, various National reportingrequirements towards third parties (e.g. to FAO, OECD, etc.) can befacilitated.
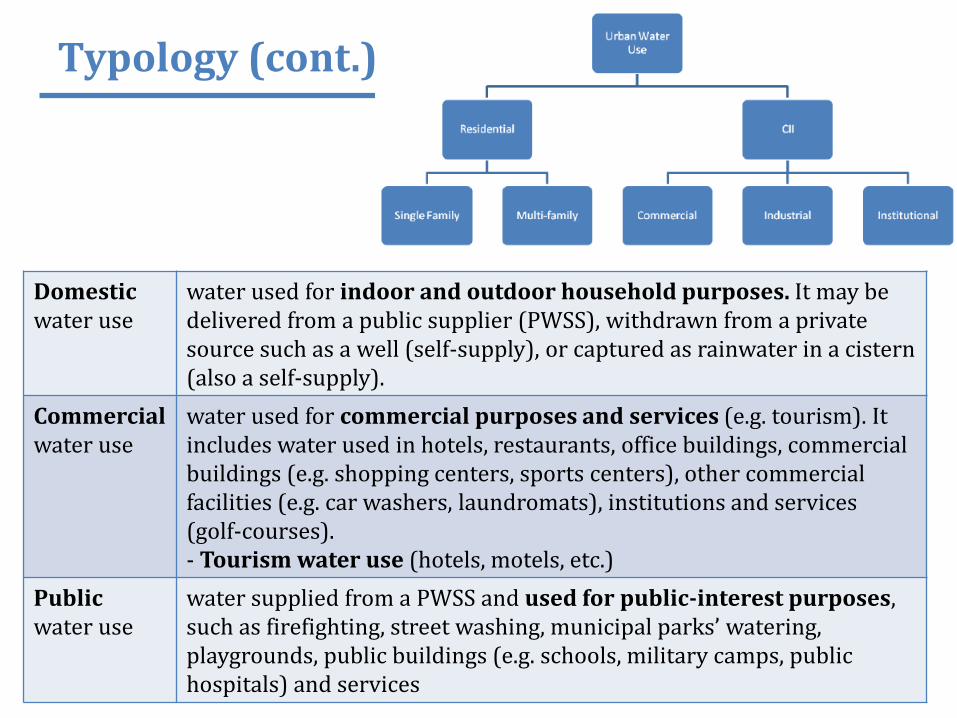
Typology (cont.)
10
Domestic water use
water used for indoor and outdoor household purposes. It may be delivered from a public supplier (PWSS), withdrawn from a private source such as a well (self-supply), or captured as rainwater in a cistern (also a self-supply).
Commercial water use
water used for commercial purposes and services (e.g. tourism). It includes water used in hotels, restaurants, office buildings, commercial buildings (e.g. shopping centers, sports centers), other commercial facilities (e.g. car washers, laundromats), institutions and services (golf-courses). - Tourism water use (hotels, motels, etc.)
Public water use
water supplied from a PWSS and used for public-interest purposes, such as firefighting, street washing, municipal parks’ watering, playgrounds, public buildings (e.g. schools, military camps, public hospitals) and services

Typology (cont.)
11
water use for Agriculture, forestry, fishing, fish farms
water used for growing of crops, raising and breeding of animals, harvesting of timber and other plants, animals or animal products from a farm or their natural habitats
- Irrigationwater use
water that is applied by an irrigation system to sustain growth in agricultural and horticultural vegetation. Irrigation/watering of commercial and public spaces (e.g. golf-courses, playgrounds, etc.) is not included here.
- Livestockwater use
water used for livestock watering, feedlots, dairy operations, and other on-farm needs.
- Aquaculture(fish-farming) water use
water use associated with the farming of finfish, shellfish, and other organisms that live in water, and off-stream water use associated with fish hatcheries.
Typology (cont.)
12
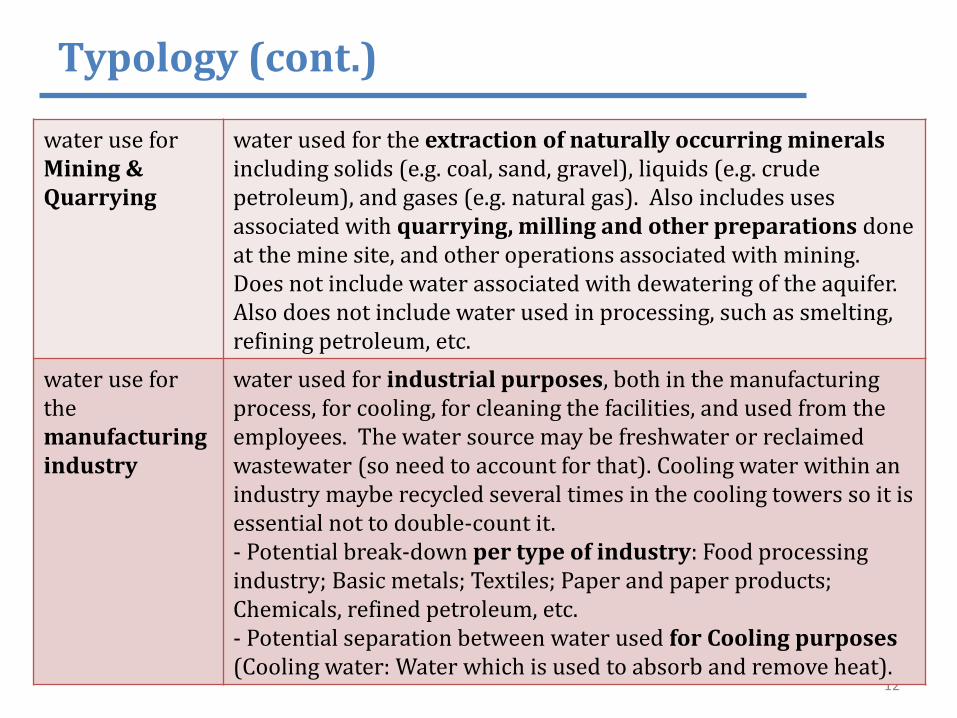
water use for Mining & Quarrying
water used for the extraction of naturally occurring minerals including solids (e.g. coal, sand, gravel), liquids (e.g. crude petroleum), and gases (e.g. natural gas). Also includes uses associated with quarrying, milling and other preparations done at the mine site, and other operations associated with mining. Does not include water associated with dewatering of the aquifer. Also does not include water used in processing, such as smelting, refining petroleum, etc.
water use for the manufacturing industry
water used for industrial purposes, both in the manufacturing process, for cooling, for cleaning the facilities, and used from the employees. The water source may be freshwater or reclaimed wastewater (so need to account for that). Cooling water within an industry maybe recycled several times in the cooling towers so it is essential not to double-count it. - Potential break-down per type of industry: Food processing industry; Basic metals; Textiles; Paper and paper products; Chemicals, refined petroleum, etc.- Potential separation between water used for Cooling purposes (Cooling water: Water which is used to absorb and remove heat).
Typology (cont.)
13
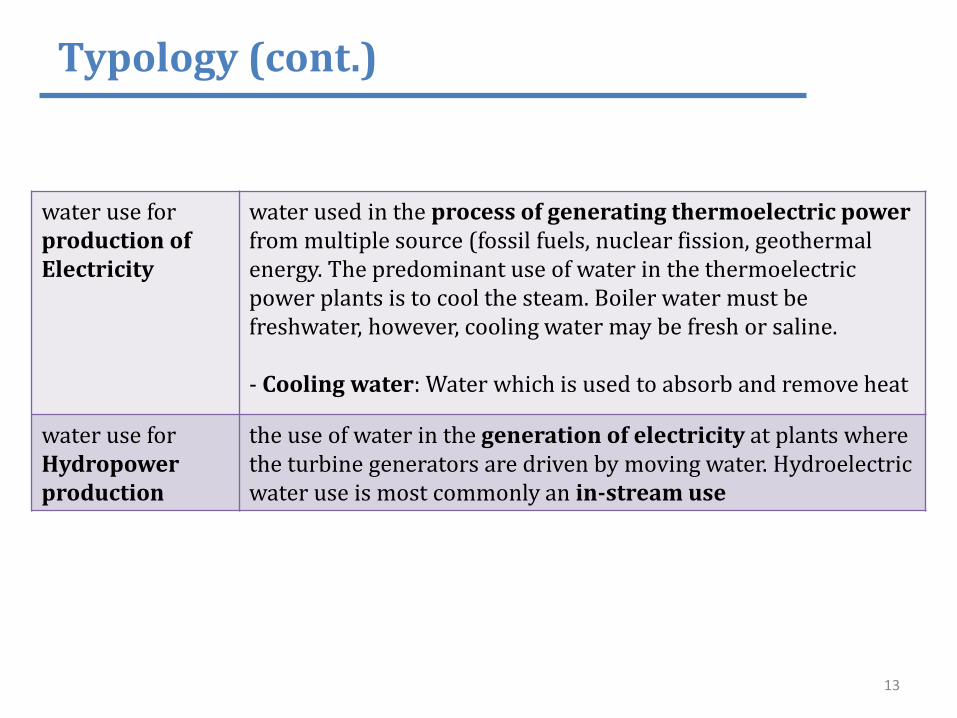
water use for production of Electricity
water used in the process of generating thermoelectric power from multiple source (fossil fuels, nuclear fission, geothermal energy. The predominant use of water in the thermoelectric power plants is to cool the steam. Boiler water must be freshwater, however, cooling water may be fresh or saline.
- Cooling water: Water which is used to absorb and remove heat
water use for Hydropower production
the use of water in the generation of electricity at plants where the turbine generators are driven by moving water. Hydroelectric water use is most commonly an in-stream use

Guidelines for estimating water use
14
It is often a problem that water use cannot be directly measured for all sectors, andthus different proxies and estimates need to be developed. To this extent it isimportant to have common proxy methodologies which are also based on primarydata which are feasible for the River Basins and relatively easy to retrieve
at the decentralized level
▪ The availability, completeness and most recent year of data can vary among sites, river basins, sectors
▪ The difficulty of accessing the data for estimating water use can vary (from requesting them from relevant agencies to designing a survey to collect the data)
▪ Compiling an inventory of all water-use sites is very useful to identify data gaps▪ When data are not readily available, water-use estimates may be determined using ancillary
data and water-use coefficients. The coefficients represents a unit-use water requirement and number of units such as population served, number of employees, acres of cropland, or number of golf courses, etc.
▪ If water-use coefficients are not available, coefficients can be developed from a representative sample of typical users that are more pertinent to a specific facility, site, Governorate.
▪ All data sources must be well documented▪ Site-specific water-use data are more commonly available for public-supply, industrial, and
thermoelectric-power facilities, ≠ less commonly available for self-supplied domestic, irrigation, aquaculture, livestock, and mining water-use sites.

Estimating Domestic water use
15
Pubic Water Suppliers (PWSs) often serve mixed users (domestic, commercial, industrial)
▪ Masterlist of PWSs (names, location, districts served, population served, sources of raw water)▪ More details for the PWSs: total withdrawal and per source, metering points (e.g. before
treatment, @ delivery), purchase or sell information, number of active service connections per type (residential, commercial, industrial), delivery estimates
▪ Water meters, billing records of residential water sold
Proxies: ▪ A per-capita use coefficient (lt/person/day) may be used to estimate total public-supply
water use or domestic deliveries from public supply (total public-supply per capita use coefficient vs. Domestic public-supply per capita use coefficient
▪ Preferably, the coefficient is derived from PWSS of similar size, customer base, rate structures, demographic and socioeconomic characteristics, climatic and geographic settings. Exploratorysampling
▪ Total public-supply per capita use coefficients are generally larger for systems that serve industrial and commercial users or have large losses
▪ Multiply with population served, or number of housing units with PS capability (billedresidential connections) and average number of people per household.
▪ Attention: service-area boundaries, vacationers , dual use ares, domestic self-supply!!▪ For self-supplied domestic use → use information from WWT facilities that set fees according
to metered water use, or from energy bills in case of groundwater pumping

Estimating Industrial water use
16
Water-use-intensive industries are often self-supplied. Reclaimed WW is often a source
▪ Masterlist of industrial facilities (names, location, sources of water)▪ Focus on the larger ones, while striving an adequate representation of the total in the area
▪ Water meters, billing records of industrial water sold
Proxies: ▪ A per-employee use coefficient (lt/employee/day) or per-unit of product (lt/product or
yield) may be used to estimate total industrial water use ▪ Preferably, the coefficient is derived from industries of similar size, type, age, climatic and
geographic settings. Exploratory sampling – Water Auditing▪ Multiply with ancillary data on employment or production or annual sales▪ Attention: water recycling e.g. in cooling towers, age of facility, specific processes and
water saving technologies, different water qualities for different purposes, TWW, saline water, censoring of data for privace reasons !!
▪ For self-supplied industrial use → map on the watershed to determine closest water sources, use information from permits, or WWT facilities that set fees according to metered water use, or from emission registers, or from energy bills in case of groundwater pumping

Estimating Irrigation water use
17
Irrigation water is often self-supplied or (in some cases) illegally abstracted. Reclaimed WW is often a source
▪ Masterlist of industrial facilities (names, location, sources of water)▪ Focus on the larger ones, while striving an adequate representation of the total in the area
▪ Water meters, billing records of agricultural water sold/ delivered by the irrigation districts
▪ Individual water users or water right holders to measure and report their withdrawals and irrigated acreages for each well or surface-water diversion
Proxies: ▪ Calculation of crop water needs using crop water-consumption coefficients for several
crops and system types (irrigated acres by crop type coupled with irrigation system type/ method)
▪ Ancillary data: total irrigated acres for each type of crop, irrigation system efficiencies, conveyance losses, climatic variables, irrigation management practices
▪ Key assumption: irrigation water applied is adequate for optimal plant growth and the plants are not being irrigated with more or less water than needed.
▪ Preferably, the coefficients are derived from fields of similar size, crop type, irrigation method, climatic and geographic settings. Exploratory and statistical sampling – Local surveys

Estimating Irrigation water use
18
▪ Attention: ˉ Unknown number of irrigated acres per crop type or confusion between total vs. irrigatedˉ Possibility of single or multiple cropping patterns ˉ Multiple sources of water: surface water, ground water, reclaimed WWˉ Application rates dependent on type, age, maintenance condition of irrigation systemˉ Seasonal irrigation needs ˉ Mismatch between permitted amounts vs. actual water use amountsˉ Privacy of primary data, unwillingness of public authorities to provide themˉ Mismatching of spatial scales and temporal incompatibilities (watershed, irrigation
district, etc.) between the ancillary data needed for the estimations
▪ Additional useful data: information on crop water shortages, acres harvested and yields by crop, energy sources, water and agricultural management practices, remote sensing data on crops, soil moisture, etc. has been
▪ For self-supplied irrigation use → map irrigated areas on the watershed to determine closest water sources, use information from WWT facilities that may provide source water, or from energy bills in case of groundwater pumping
Estimating Irrigation water use
19
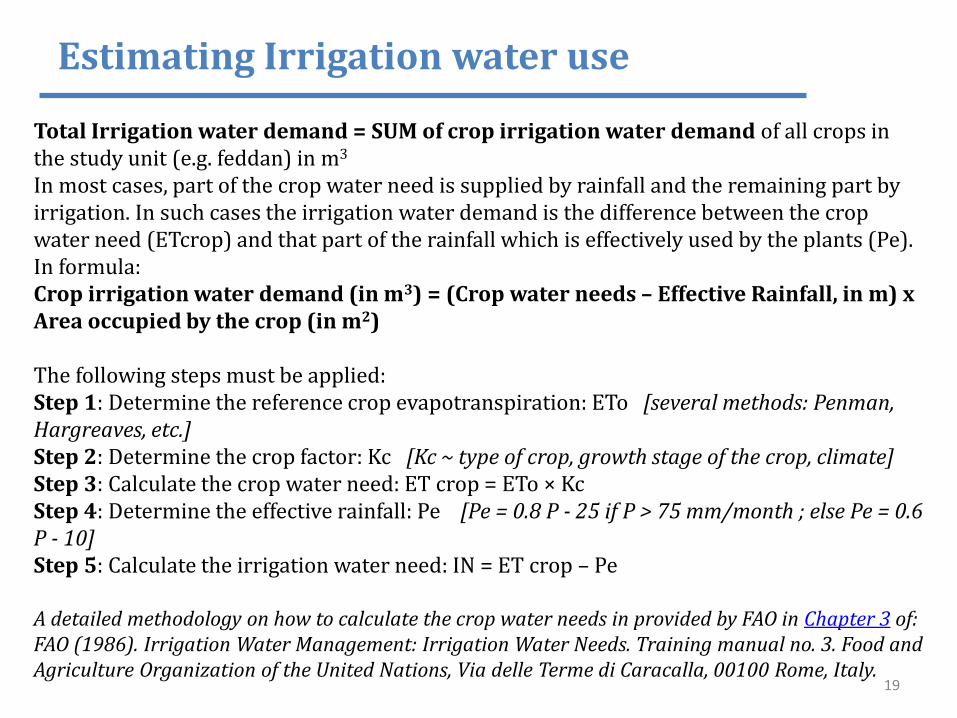
Total Irrigation water demand = SUM of crop irrigation water demand of all crops in the study unit (e.g. feddan) in m3
In most cases, part of the crop water need is supplied by rainfall and the remaining part by irrigation. In such cases the irrigation water demand is the difference between the crop water need (ETcrop) and that part of the rainfall which is effectively used by the plants (Pe). In formula: Crop irrigation water demand (in m3) = (Crop water needs – Effective Rainfall, in m) x Area occupied by the crop (in m2)
The following steps must be applied:Step 1: Determine the reference crop evapotranspiration: ETo [several methods: Penman, Hargreaves, etc.]Step 2: Determine the crop factor: Kc [Kc ~ type of crop, growth stage of the crop, climate] Step 3: Calculate the crop water need: ET crop = ETo × KcStep 4: Determine the effective rainfall: Pe [Pe = 0.8 P - 25 if P > 75 mm/month ; else Pe = 0.6 P - 10]Step 5: Calculate the irrigation water need: IN = ET crop – Pe
A detailed methodology on how to calculate the crop water needs in provided by FAO in Chapter 3 of: FAO (1986). Irrigation Water Management: Irrigation Water Needs. Training manual no. 3. Food and Agriculture Organization of the United Nations, Via delle Terme di Caracalla, 00100 Rome, Italy.
Estimating Thermoelectric-power water use
20
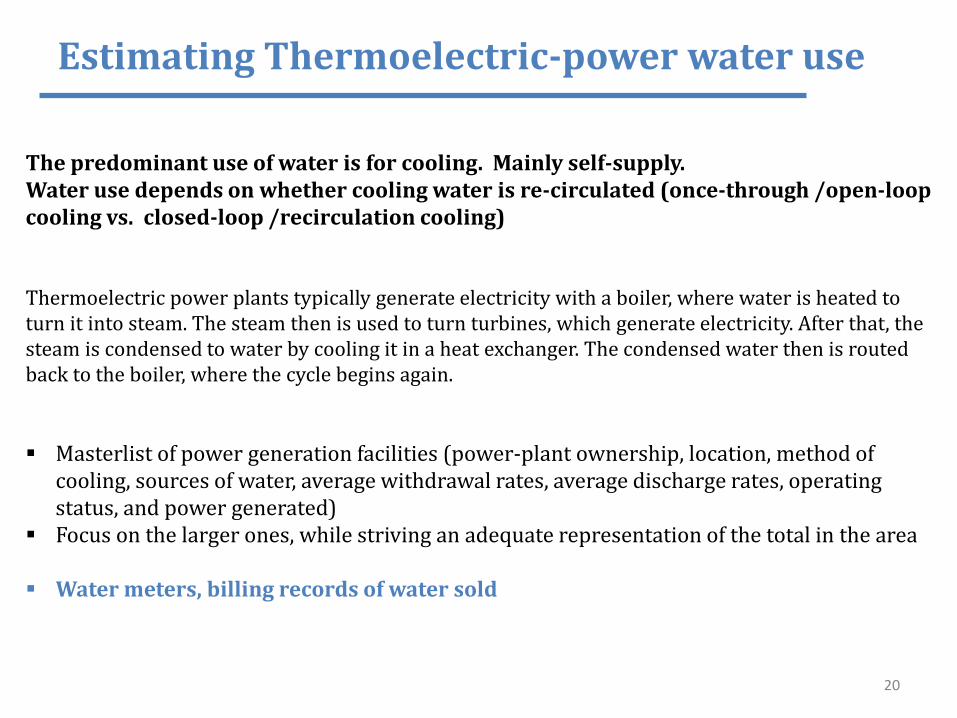
The predominant use of water is for cooling. Mainly self-supply.Water use depends on whether cooling water is re-circulated (once-through /open-loop cooling vs. closed-loop /recirculation cooling)
Thermoelectric power plants typically generate electricity with a boiler, where water is heated to turn it into steam. The steam then is used to turn turbines, which generate electricity. After that, the steam is condensed to water by cooling it in a heat exchanger. The condensed water then is routed back to the boiler, where the cycle begins again.
▪ Masterlist of power generation facilities (power-plant ownership, location, method of cooling, sources of water, average withdrawal rates, average discharge rates, operating status, and power generated)
▪ Focus on the larger ones, while striving an adequate representation of the total in the area
▪ Water meters, billing records of water sold

Estimating Thermoelectric-power water use
21
Proxies: ▪ Power-generation data can be used to estimate the water withdrawals. A coefficient to estimate
the m3 of water used per unit-hour of electricity generated is calculated using information from plants of similar age, design, and cooling methods. Exploratory surveys – Water Auditing
▪ Multiply this coefficient with the amount of electricity generated during a specified time period
▪ Ancillary data: site-specific water withdrawal and power generation data, volume discharged, data from the water permits or from other compliance requirements (emissions, WW registers, etc.)
▪ Attention: water recycling in cooling towers / Cycles of Concentration, age of facility, specific processes and water saving technologies, different water qualities for different purposes, TWW, saline water, censoring of data for privace reasons !!

Policy-relevant assessments –
Indicators
22
Indicator Type Sustainability dimension
Unit DPSIR classification
Water Use per sector / per capita
performance Environmental-Developmental
MCM,%
pressure
Water Consumption
performance Environmental-Developmental
MCM, %
pressure
% of (change in amount/volume) of freshwater used per sector
performance Environmental-Developmental
% pressure
Water reuse performance Environmental-Developmental-Economical
MCM, %
Response
Water re-cycling performance Environmental-Developmental-Economical
MCM, %
response
Water Exploitation Index (WEI)
performance Environmental-Developmental
% pressure

Policy-relevant assessments - Indicators
23
Indicator Type Sustainability dimension
Unit DPSIR classification
Economic Water Productivity of irrigated crops
efficiency Environmental-Developmental-Social-Economical
€/m3 (economic output produced per cubic meter of fresh water used)
impact
Water efficiency per sector
efficiency Environmental-Developmental-Social-Economical
Value added in €/m3 (value added per volume of water used by a given economic activity over time)
impact
Water use intensity by economic activity
efficiency Environmental-Developmental-Economical
m3/m2 or person or GDP
pressure
Water tariff performance Social-Developmental-Economical
EGP/m3 per use response
Cost Recovery performance Environmental-Developmental-Social-Economical
Cost recovery rate per Municipality and service percentage (%)
response

International examples
24
▪ USGS Water Use Data for the Nation, National Water Information System (NWIS)
▪ Australian Water Accounts▪ Water Information System Austria (WISA)▪ European Environment Agency (EEA) Water Base and Water Quantity
Reporting Tool▪ Eurostat / OECD Water Statistics▪ FAOSTAT / Aquastat

Water use in Lebanon
25
Domestic water
Includes:
Facts:
Responsible authority:
Monitoring & recording: Water meters at…?Measured by…?Estimation/ calculation based on…?Calculated by…?

Water use in Lebanon
26
Industrial water
Includes:
Facts:
Responsible authority:
Monitoring & recording:Water meters at…?Measured by…?Estimation/ calculation based on…?Calculated by…?
Water use in Lebanon
27
Irrigation water
Includes:
Facts:
Responsible authority:
Monitoring and recording:
Water meters at…?Measured by…?Estimation/ calculation based on…?Calculated by…?

This Project is funded by the European Union
SWIM and Horizon 2020 Support MechanismWorking for a Sustainable Mediterranean, Caring for our Future
Thank you!
Dr. Maggie KOSSIDA, [email protected]