swedish climate strategy
TRANSCRIPT

8/14/2019 Swedish Climate Strategy
http://slidepdf.com/reader/full/swedish-climate-strategy 1/140
Checkpoint 2004 – The Swedish Environmental Protection Agency
and the Swedish Energy Agency
Swedish Climate StrategA basis for the evaluation
of Swedish climate work

8/14/2019 Swedish Climate Strategy
http://slidepdf.com/reader/full/swedish-climate-strategy 2/140
Further copies of this brochure can be ordered from:
The Swedish Energy Agency Naturvårdsverket
ET 33:2004 ISBN 91-620-5418-X
ISSN 0282-7298
www.stem.se www.naturvardsverket.se/bokhandeln
[email protected] [email protected]
Orderfax: +46 16 544 22 59 Ordertelephone: + 46 8 505 933 40
Orderfax: + 46 8 505 933 99
500 copies
Graphic design and original: ArtoDito
Photography: The Swedish Energy Agency, Getty Images, Per Westergård
Print: Intellecta Tryckindustri, Solna 2004-15441.

8/14/2019 Swedish Climate Strategy
http://slidepdf.com/reader/full/swedish-climate-strategy 3/140
Swedish Climate StrategyA basis for the evaluation
of Swedish climate work
Checkpoint 2004 – The Swedish Environmental Protection Agency
and the Swedish Energy Agency

8/14/2019 Swedish Climate Strategy
http://slidepdf.com/reader/full/swedish-climate-strategy 4/140
Contents
Summarising Conclusions and Proposals 7
Background 7
Swedish targets up to 2008–2012 9
Forecast result for Sweden 9
Appraisal of policy instruments 10
How is the target to be structured in the Swedish climate strategy? 12
Proposals for further and revised policy instruments in climate strategy 14
Proposals with a view to developments after 2008 – 2012 16
1 The Assignment 212 Knowledge of Climate Change 25
2.1 The future of the global climate 27
2.2 Regional climate scenarios 29
2.3 Need of adaptation – globally 30
2.4 …and in Sweden 30
2.5 Possible stabilisation of the level of greenhouse gases
in the atmosphere 31
2.6 Reduction requirements 33
2.7 Technical potential and the need of technical development 34
3 How is the Climate Issue Developing? 37
3.1 International climate policy 37
3.2 Sweden’s climate and energy policy decisions 40
3.3 Sweden’s national target and international commitment 41
3.4 Sweden’s climate strategy after 2008 – 2012 42
4 Greenhouse Gas Emissions 45
4.1 Developments internationally and in the EU 45
4.2 Emissions in Sweden – what do the statistics tell us? 47
4.2.1 Greenhouse gas emissions 47
4.2.2 Emissions of other air pollutants 50
5 Forecasts 53
5.1 Forecasts for emissions internationally and in the EU 53
5.2 Forecasts for emissions in Sweden 54
2

8/14/2019 Swedish Climate Strategy
http://slidepdf.com/reader/full/swedish-climate-strategy 5/140
3
5.2.1 Overall results 56
5.2.2 Results at subsector level 58
5.2.3 Comparison with the forecast in the third national report 61
5.2.4 Results for trading and non-trading sectors 61
5.2.5 The sensitivity alternatives 63
6 Policy instruments in Climate Policy 67
6.1 Background 67
6.2 Policy instruments in the Swedish climate strategy 72
6.2.1 Intersectoral policy instruments 73
6.2.2 The energy area 79
6.2.3 Transport 81
6.2.4 Overall effect on emissions in the energy sector 86
7 Consequences of the EU Trading System 89
7.1 Description of the system 897.2 Consequences for Sweden 91
7.2.1 Emissions 91
7.2.2 Electricity prices 92
7.2.3 Economic growth 93
7.2.4 Structuring Sweden’s national target 94
7.3 The future development of the trading system 99
8 How Can Sweden Use the Other Flexible Mechanisms? 101
8.1 Effects of using project-based mechanisms 105
8.1.1 For Sweden 105
8.1.2 For the host countries 105
8.1.3 For the climate 106
9 What Will Happen to Sweden’s Emission Reduction Units? 109
10 Need Sweden’s Climate Strategy be Reinforced/Altered
in the Short Term? 113
10.1 Strategically important measures in a long-term perspective 113
10.2 Forecast and targets 115
10.3 The need for further and revised policy instruments 116
10.3.1 Sectors outside the trading system 119
10.3.2 Activities covered by the EU trading system 124
10.4 Socioeconomic effects of our proposals 128
10.5 Conclusions concerning other policy instruments
in the Swedish climate strategy 130
8/14/2019 Swedish Climate Strategy
http://slidepdf.com/reader/full/swedish-climate-strategy 6/140
4
Preface
The current Swedish climate strategy was adopted by the Riksdag(Parliament) in March 2002. The strategy is designed so that Swedish climate work and progress towards the national target are to be followed up on anongoing basis. Special checkpoints were inserted for the years 2004 and 2008in which the climate work is to be evaluated. If emission trends appear less
favourable at these times, new measures can be proposed and/or the targetreconsidered.
The Environmental Protection Agency and the Energy Agency have hadthe government’s assignment of compiling a basis for the first evaluation at
the 2004 checkpoint.This report describes the most important conclusions and results of our work on this assignment. The work is described in detail in four reports:
Forecasts for greenhouse gas emissions
Evaluation of the policy instruments of the climate strategy
Flexible mechanisms and targets in climate policy
New knowledge about the climate problem
Work on the assignment has taken place in collaboration with the Swedish Agency for Administrative Development, which has taken part in the reference
group for policy instrument evaluation, the Swedish Institute for Transportand Communications Analysis (SIKA), which has supplied material for thetransport forecast, contributed to the evaluation of policy instruments andparticipated in the reference group for policy instrument evaluation, theNational Institute of Economic Research which has contributed to severaltasks, the National Road? Administration which has participated in thereference group for policy instrument evaluation, and the National Board of
Building, Housing and Planning, which has supplied material for the policy instrument evaluation.

8/14/2019 Swedish Climate Strategy
http://slidepdf.com/reader/full/swedish-climate-strategy 7/140
5
karin sahlin of the Swedish Energy Agency and eva jernbäcker of the Environmental Protection Agency managed the project on behalf of eachauthority.
Managers for the sub-projects were:tobias jakobsson, Swedish Energy Agency and tea alopaeus
sandberg, Environmental Protection Agency (forecasts), reino
abrahamsson, Environmental Protection Agency and mathias
normand, Swedish Energy Agency (policy instruments), ulrika raab,Swedish Energy Agency and fredrik von malmborg, Environmental
Protection Agency (flexible mechanisms) andmarianne lilliesköld
,Environmental Protection Agency and kenneth möllersten, SwedishEnergy Agency (new knowledge about the climate problem).
A number of other employees at the Environmental Protection Agency and the Swedish Energy Agency have also contributed material and usefulopinions to the work.
lars-erik liljelund thomas korsfeldt
Director-General Director-General
Environmental Protection Agency Swedish Energy Agency

8/14/2019 Swedish Climate Strategy
http://slidepdf.com/reader/full/swedish-climate-strategy 8/140
6
“Climate change is a global problem necessitating international co-operation.
The framework for international co-operation is the Climate Change
Convention and the Kyoto Protocol.”

8/14/2019 Swedish Climate Strategy
http://slidepdf.com/reader/full/swedish-climate-strategy 9/140
7
Summarising Conclusions and Proposals
Background
The UN’s International Panel on Climate Change (IPCC) is becoming evermore certain that human activities are contributing to climate change. Theuncertainty now relates more to how great the increased greenhouse effect
might become, how quickly it might develop and which areas of the Earthmight be most affected.
Climate change is a global problem demanding international cooperation.The framework for international cooperation is the Climate Change
Convention and the Kyoto Protocol. The overall target of the 1992 ClimateChange Convention is for the concentration of greenhouse gases in theatmosphere to be stabilised at a level that prevents human impact on theclimate system becoming dangerous1). The 1997 Kyoto Protocol represents afirst step in quantifying the reductions in emissions required to attain the goalof the Convention. Under the Protocol, industrialised countries, known as Annex 1 parties, have to reduce emissions of greenhouse gases by just over
5% between 1990 and the commitment period 2008– 2012. To increaseflexibility for the parties in implementing their commitments and to increase
costeffectiveness, three ‘flexible mechanisms’ were introduced into the proto-col; emissions trading and climate projects abroad (joint implementation (JI))and the clean development mechanism (CDM)). It is also possible for themember states to some extent to credit sequestration of carbon in sinks underthe Kyoto Protocol.
The EU (EU 15) has a joint reduction commitment in relation to theKyoto Protocol. The EU’s joint commitment has been shared among themember states in an internal burden-sharing agreement. Under the burden-sharing agreement, Sweden has a commitment that Swedish emissions are not
to exceed 1990 emissions by more than 4%.In the spring of 2002, the Riksdag [Swedish Parliament] took decisions on
a national climate strategy which includes long-term and short-term targets
1) Such a level is to be achieved within a time-frame sufficient to allow ecosystems to adapt naturally to
climate change, to ensure that food production is not threatened and to enable economic development to
proceed in a sustainable manner..

8/14/2019 Swedish Climate Strategy
http://slidepdf.com/reader/full/swedish-climate-strategy 10/140
8
under the environmental quality objective Reduced Climate Impact. Thetarget up to 2050 is based on efforts needing to be made in all countries forstabilisation of the level of greenhouse gases below 550 ppm (parts permillion) of carbon dioxide equivalents to be achieved in the long term.Sweden is to press internationally for global work to be oriented towards this
target. The short-term target entails emissions of greenhouse gases in thecountry as a mean value for the period 2008–2012 not exceeding 96%of the 1990 level. This target is to be attained without compensating forsequestration in carbon sinks or by the use of flexible mechanisms.
The strategy is formulated in such a way that Swedish climate work anddevelopment towards the national objective are to be regularly monitored.Special checkpoints have been inserted in 2004 and 2008, when work onclimate is to be assessed. If emission forecasts at those checkpoints prove lessfavourable, new measures can be proposed and/or targets reviewed.
The Swedish Environmental Protection Agency and the Swedish Energy Agency have been commissioned by the government to draw up documenta-
tion ahead of the first assessment at the 2004 checkpoint. The emphasis inthe assignment is put on the national interim target for the period2008–2012.
National climate policy encounters new circumstances
The member states of the EU have drawn up a common strategy on climate.The most important policy instrument in this strategy is the future emissionstrading scheme. The EU Emissions trading scheme (EU ETS) is due to startin 2005. Under this scheme, enterprises can buy and sell emissionsallowances, so that emissions may increase in one country while at the sametime decreasing in another. Total emissions are not to exceed the cap for
emissions stipulated within the EU. The EU ETS has the potential both toexercise environmental control and to be cost-effective. It will, however, beimportant for Sweden to join in and influence development of the system sothat both the environmental effect and cost-effectiveness of the system can beachieved.
The new EU-wide policy instrument alters the prospects of Swedenhaving a national target for total emissions within the country. The prospectsfor national control of emissions in the sectors covered by the system arealtered in particular.

8/14/2019 Swedish Climate Strategy
http://slidepdf.com/reader/full/swedish-climate-strategy 11/140
9
The future EU-wide trading scheme has therefore been an importantfactor in our work and our conclusions and proposals. The present scope of the system is shown in the box below. More sectors and more gases may becovered by the EU ETS in the period after 2008.
Swedish targets up to 2008–2012
Forecast result for Sweden
An examination of the trend in emissions in Sweden and the result of the new baseline forecast of total emissions in Sweden by 2010 shows that Swedishclimate strategy to date has had an impact on emissions in several sectors.
Overall, it is estimated that emissions will end up below Sweden’s commit-ment under the EU burden-sharing agreement for the commitment underthe Kyoto Protocol but above Sweden’s national target. In the baselineforecast emissions are predicted to fall by just over 1% between 1990 and2010. Emissions need to decrease by a further 2 million tonnes of carbondioxide equivalents if the national interim target is to be met.
However, the trend in different sub-sectors is moving in differentdirections. Emissions in the transport and energy sectors are increasing most.Emissions are also increasing in industry, but at a slower rate. Emissions fromthe heating of homes and commercial premises and from the waste sector are
decreasing sharply. Emissions in the agricultural sector are also declining.
Trading sectors Covers, with effect from 2005, emissions of carbon dioxide from power and
heating plants, oil refineries, plants producing and processing iron, steel, glass and
fibreglass, cement, lime and ceramics and plants producing paper and pulp.
Non-trading sectors Covers other emissions of greenhouse gases (methane, nitrous oxide and the three
industrial gases HFC, PFC and SF6). Also encompasses emissions of carbon
dioxide from small-scale burning in the domestic sector, the transport sector and
from the rest of trade and industry.

8/14/2019 Swedish Climate Strategy
http://slidepdf.com/reader/full/swedish-climate-strategy 12/140
10
The forecast for those sectors which are initially to be covered by the EUtrading scheme suggests that emissions from these activities altogether may increase by 25%2) (30% if the carbon dioxide tax is removed) by 2010compared with the 1990 level, while emissions in non-trading sectors may decrease over the same period by 12%. Non-trading sectors also include the
transport sector, whose emissions are expected to increase over the period. It istherefore other non-trading sectors, i.e. homes and commercial premises andthe agricultural and waste sectors, which are predicted to contribute large fallsin emissions in the forecast.
Appraisal of policy instruments
It is consistently judged both in our own work and in an examination of theassessments of policy instruments made by other countries that it is difficultto appraise separate policy instruments. The effects of a single policy instru-ment are difficult to differentiate from other policy instruments and otherdriving forces in society.
Swedish climate strategy contains a number of policy instruments whicheither transcend sectors or are targeted. They have either been introducedthrough national initiatives or as a consequence of EU strategies and interna-tional climate work. The interaction between different policy instruments isparticularly significant in the area of energy. Policy instruments in other areas,particularly in the area of waste and agricultural policy, also affect emissions.
Our judgement is that, despite the difficulties mentioned above, it is thecarbon dioxide tax (introduced in 1991) in particular that has contributed to adecrease in emissions in Sweden in the last decade. The tax also offers goodpotential for high cost-effectiveness to be achieved as it makes it possible forthose who use energy to decide which measures are cost-effective. The effects
are clearly visible in the district-heating sector and in the heating of homesand commercial premises. The analysis also shows that the present-day levelof carbon dioxide tax in these sectors has a sufficient effect in terms of envi-ronmental control. Separate calculations have been made for the transportsector, showing that increases in tax on petrol and diesel have had some effect.
The electricity certificate system is judged to reduce emissions principally from the Nordic point of view. The system does not have what is required toachieve the same cost-effectiveness as an economic policy instrument with ageneral effect, such as the future trading scheme. The electricity certificate
2) At an assumed emission price of 10 euros per tonne of carbon dioxide

8/14/2019 Swedish Climate Strategy
http://slidepdf.com/reader/full/swedish-climate-strategy 13/140
11
system is principally motivated by energy policy, however, the intention beingto increase the use of electricity generated from renewable forms of energy.
Decisions on around a third of grant funds have been taken in the local climate investment programme (Klimp). This programme is judged capable of leading to decreases in emissions equivalent to 0.5% of the total emissions in
the country. An additional indirect benefit of the programme is that itcontributes to the climate work of the local authorities, partly by increasingknowledge of the opportunities that exist for reducing greenhouse gasesthrough local decisions.
Flexible mechanisms which work well (emissions trading and the project-based mechanisms of joint implementation (JI) and the clean developmentmechanism (CDM)) are important for continued international cooperationtowards climate change. They were important in making it possible for severalcountries to ratify the Kyoto Protocol, and the flexible mechanisms are judgeto be key factors in more far-reaching international commitments. As a resultof Swedish participation in the work on the mechanisms, we can influence
the design of the system and increase understanding of the demands of othercountries. All the flexible mechanisms contribute to cost-effectiveness inclimate measures. The difference in costs is due to countries having differentsituations at the outset, for example having different energy systems, havingreached differing stages of economic development and having worked todiffering extents with policy instruments to reduce emissions of greenhousegases. The climatic effects of taking measures nationally in Sweden or abroadare identical; from the point of view of the climate it does not matter wherethe action is taken.
Implementation of the EU emissions trading scheme (EU ETS) begins in2005, and will cover the member states of the enlarged European Union. The
EU ETS meets the requirements for being a powerful policy instrument as itsets a cap for the level of emissions permitted and also creates the necessary basis for cost-effective measures. Cost-effectiveness increases when the systemencompasses additional countries and sectors. Effectiveness is reduced, how-ever, if the countries allocate emission allowances according to different
methods and use complementary national policy instruments in a non-uniform way. It is also expected that emissions trading will affect the price of electricity. We anticipate that the price will be affected on the basis of anaverage electricity production cost, which represents the margin in the Nordicelectricity system.

8/14/2019 Swedish Climate Strategy
http://slidepdf.com/reader/full/swedish-climate-strategy 14/140
12
How is the target to be structured in the Swedish climate strategy?
With the introduction of the EU ETS, it becomes difficult and fundamental-ly illogical to retain a national target structure which at the same time sets
caps for total emissions in Sweden, including emissions in those sectors thatare covered by the trading scheme.
An offset target may then be preferable. With this type of target, emissionsin trading sectors are equated with the total quantity of allocated emissionsallowances3) for the period 2008–2012. The emissions allowances bought orsold by the enterprises in the trading sector in Sweden during the period willbe offset by an equivalent decrease in emissions or increase in emissions some-
where else within the framework of the trading scheme and are therefore notincluded.The actual emissions are calculated for other sectors (non-trading sectors).
The sum of the allocation and emissions from other sectors is to be less than
96% of 1990 emissions.This target structure is in agreement with the way in which the Kyoto
Protocol is structured and means that Swedish climate policy is adapted to thenew emissions trading scheme within the EU. The target structure meansthat emissions for Sweden decrease to the same extent as previously, whileemissions in Sweden may be higher or lower.
3) Under the EU emissions trading scheme, the member states are to issue rights for emissions of carbon
dioxide to all facilities covered by the trading scheme. The allocation is principally made free of charge,
but has to meet a number of criteria. The EU member states, following approval by the European
Commission, establish in a distribution plan the total number of emissions allowances to be allocated to
the trading sector.
We propose that:
• The present-day national interim target be replaced by a new structure. We callthis an “offset target”. In this way, the EU ETS can be integrated into the national
interim target. This structure means that changes in emissions in the trading sec-
tor (both increases and decreases) which are equivalent to purchase and sale of
emissions allowances are not included when target fulfilment in relation to the
national interim target is calculated.

8/14/2019 Swedish Climate Strategy
http://slidepdf.com/reader/full/swedish-climate-strategy 15/140
13
How much emissions need to decrease in Sweden depends on the size of the allocation to the trading sector, see figure below. The need for policy instruments in the sectors outside the trading sector thus depends on thequantity of emissions allowances allocated to plants in Sweden encompassedby the trading scheme. If a high allocation is given to the trading sector, this
means that other activities have to reduce their emissions. If a lower allocationis given to the trading sector, more measures are instead taken within theframework of the EU system.
The assignment includes, where necessary, making proposals for furthermeasures ahead of the period 2008–2012. To enable the need for further
measures to be assessed on the basis of the new proposed target structure,information is required on how many emissions allowances altogether will bedistributed to the trading sector. We do not yet know the level of the alloca-tion for the period 2008–2012, which will not be decided on until 2006.
We estimate that a slightly lower allocation than the present forecast for
the trading sector is macro-economically justified. We therefore base ourproposals on such an allocation being given during the period 2008–20124).
4) Such an allocation is also in line with the European Commission criteria for national distribution plans.
“High” allocation “Low” allocation
Emissions are to be below a particular level
Emissions target for thenon-trading sector
Permitted emissions in the non-trading sector will vary depending on the allocation given to the
trader
Allocated quantity

8/14/2019 Swedish Climate Strategy
http://slidepdf.com/reader/full/swedish-climate-strategy 16/140
14
Proposals for further and revised policy instruments
in climate strategy
The subsequent proposals are presented separately for the part of theemissions (the sectors/activities) encompassed by the EU trading scheme
and the sectors that are outside the trading scheme.
Sectors outside the EU ETS
We propose the following changes to policy instruments for sectors outside the trading sector (given an allocation of emissions allowances slightly below the present forecast):
• carbon dioxide differentiated vehicle taxes for light cars,
• the benefit of free fuel for a company car is valued at a factor of 1.8 of the marketprice instead of the present 1.2
• tax based on kilometres travelled for trucks from 2008
It is estimated that the policy instrument proposals in the transport sector taken
together will result in an annual reduction in emissions of just over 0.5 million
tonnes of carbon dioxide equivalents in Sweden over the period 2008–2012.
• further and increased government subsidies over the period 2006–2008 are
granted to local climate investment programmes. The programme should
primarily subsidise long-term strategic measures.• continued investment in climate information for 2006–2008
• implementation of the European Directive on the energy performance of
buildings so that the potential for energy efficiency improvement is utilised.
We also propose:
• that continued and expanded government support is given to work on the
project-based mechanisms JI and CDM over the period 2005–2012.

8/14/2019 Swedish Climate Strategy
http://slidepdf.com/reader/full/swedish-climate-strategy 17/140
15
With the previously mentioned assumption of an allocation somewhat below forecast, the need to introduce policy instruments (implement measures) insectors outside the trading scheme for the period 2008–2012 decreases asmeasures are also implemented under the EU trading scheme. We neverthe-less consider some further measures in the climate strategy to be justified in
the present situation as there is an extensive need for measures in the longerterm. The proposals may also improve the prospects of tightened internation-al commitments.
The proposals for policy instruments are long-term strategic proposals, i.e.they provide signals on changes that will be needed in the longer term. Anexample of this is the transport sector, where our forecast shows thatemissions are continuing to increase.
The local work on climate strategies is important partly in view of thechanges to inert structures that need to be made and can be stimulated withcontinued investment in local climate investment programmes (Klimp).
Continued efforts to develop the work on climate projects abroad, i.e. the
project-based mechanisms, are of key importance as it is judged that themechanisms may be of great significance in future global agreements.
If a higher allocation of emissions allowances were to be given instead tothe trading sector, in our example an allocation on a par with our baselineforecast, we judge that further policy instruments which reduce emissions inSweden by approximately 1.5 million tonnes of carbon dioxide equivalentsmay need to be introduced. In addition to the policy-instrument proposalspresented earlier, a further reduction in emissions in Sweden can be obtainedthrough:
• An increase in energy tax on motor fuels (petrol, diesel).
• An increase in carbon dioxide tax for the rest of trade and industry (outsidethe trading scheme) may result in further reductions in emissions. Furtheranalysis is required to show the macro-economic consequences of such anincrease.
An alternative way of fulfilling targets in this case would be instead to use theemission credits which Sweden is expected to receive through existing interna-tional efforts in other countries through the project-based mechanisms. Theactual reductions in emissions have then taken place in countries other thanSweden.

8/14/2019 Swedish Climate Strategy
http://slidepdf.com/reader/full/swedish-climate-strategy 18/140
16
In addition, it should be noted that Sweden may obtain a surplus of emission reduction units5) as Sweden’s national targets differ from the Swedishcommitment under the EU burden-sharing agreement. The idea according tothe decision on climate policy is that these reduction units could be saved.However, there are no established rules in the EU for a situation in which the
EU fails to comply with its joint commitment. There is thus uncertainty as to whether Sweden can assert its right to save up emission reduction units in thefuture.
Activities encompassed by the EU ETS: the trading sector
5) Under the Kyoto Protocol, the countries have been allocated a number of assigned amount units
(AAUs) for the period 2008–2012.
We propose as follows for the trading sector:
For applicable policy instruments acting within sectors which will be encompassed
by the EU emissions trading scheme, we propose that:
• The carbon dioxide tax for energy production by industry be removed,
• The carbon dioxide tax for heat production in hot-water boilers be retained but
that its level be reduced,
• The carbon dioxide tax for combined heat and power plants be removed provided
that:
– The electricity certificate system is extended and the quota is raised after 2010
– The same allocation principle (within the framework of the EU ETS) appliesto biofuels and fossil fuels in new CHP plants.
We additionally propose that:
Sweden plays an active part in the forthcoming assessment of the EU ETS . An assess-
ment of the EU ETS will start in 2005, and the European Commission is to make
proposals for any changes by 2006/2007. Sweden should play an active part in this
work. Issues which Sweden should emphasise include, for example, analysing
whether more sectors and gases may be encompassed by the system, member states
having the same allocation principles for new plants, new plants not being given
emissions allowances for free and the allocation principles being such that a scarcity of emissions allowances arises.

8/14/2019 Swedish Climate Strategy
http://slidepdf.com/reader/full/swedish-climate-strategy 19/140
17
An important issue in the introduction of emissions trading is whether acarbon dioxide tax will continue to be imposed on the trading sectors.
Further policy instruments in the trading sector in Sweden will not affecttotal emissions in the trading sector in Europe. An emissions trading schemetheoretically offers the advantage that measures to reduce emissions are taken
where they are cheapest. If the system is developed so that the companies canpredict that the number of emissions allowances on the market will decrease,good prospects are also created for structural changes that are favourable forattaining long-term climate targets.
In a system that works smoothly, supplementary policy instruments(e.g. carbon dioxide tax) should not therefore have an impact on the activitiesinvolved in emissions trading as this can adversely affect cost-effectiveness inthe trading scheme and distort competition.
At the same time, it is important during the introduction of the tradingscheme, when the price of emissions allowances can be expected to be low, toretain some supplementary control to promote structural changes that make
it easier to attain the long-term climate targets.Further policy instruments may also be justified by other social objectives
also having to be met. One of these is the energy-policy objective of increas-ing the proportion of renewable energy in the Swedish energy system. It istherefore important to maintain the competitiveness of biofuel in the produc-tion of electricity and heating when emissions trading is introduced. Anotherenergy-policy argument is Sweden’s security of supply.

8/14/2019 Swedish Climate Strategy
http://slidepdf.com/reader/full/swedish-climate-strategy 20/140
18
Proposals with a view to developments after 2008 –2012
It is important to keep a long-term perspective at all times in work on climate.Proposals which look towards the period 2008–2012 are therefore alsofeatured in our documentation for the assessment of Swedish climate strategy,checkpoint 2004.
According to our forecasts, emissions will increase after 2010. A decisivefactor in this trend is the assumption that Swedish nuclear power plants willbe phased out after a life of 40 years and be replaced primarily by natural gas.The forecast for development in the transport sector also shows continued
increases in emissions. The same trends otherwise apply up to 2010.Emissions from the heating of homes and commercial premises and emissionsfrom the waste sector, for instance, are forecast to continue decreasing.
Under the Riksdag decision, Sweden is to press for the level of greenhousegases to be stabilised in the long term at a level below 550 ppm greenhouse
gases. It is assumed that stabilisation at this kind of level will create the neces-sary basis to enable restriction of the rise in global mean temperature to below 2°C compared with the pre-industrial level. The conclusion has been drawnby several EU member states and at EU-wide level that it is necessary toendeavour to attain such a restriction in the rise in temperature. A stabilisa-
We propose that:
• Targets for the medium term need to be developed . Work should be started now to
draw up a basis for the development of the national climate strategy with targets
and policy instruments to include the medium term, the proposal being to look at
the period up to 2020. It should be possible for such a strategy to be established
by the 2008 checkpoint. The focus on national strategy should correlate well with
the line Sweden intends to pursue in international negotiations.
• Sweden should channel its national climate aspiration into a strategy ahead of future
international negotiations and into EU work . Sweden should negotiate an interna-
tional commitment which can also be used as a national target. As a result, other
countries can be influenced to adopt more ambitious commitments.
• Vulnerability and the risks associated with a changed climate in Sweden need to be
surveyed and analysed . Adaptation measures may need to be initiated. A survey of
this type can be initiated in conjunction with the fourth national report.

8/14/2019 Swedish Climate Strategy
http://slidepdf.com/reader/full/swedish-climate-strategy 21/140
19
tion level of this kind demands extensive global emission reductions, but atthe same time there are several routes by which the same level can be reached.Calculations6) show the need for reductions in emissions in industrialisedcountries will amount to about 80% if equal emissions per capita are to beattained globally by 2050. As far as Sweden is concerned, emissions under
these circumstances may need to decrease by 50–60% by 2050. Sweden hascomparatively low emissions per capita at the outset, but the emission forecastfor the period 2010 to 2020 points in the wrong direction. There is thereforealso a great need for reductions in emissions by 2050 in Sweden.
The IPCC considers, however, that it is already too late to completely avoid effects of climate change. Climate change will also affect Sweden, andalthough the effects may appear to be modest in comparison with otherregions, certain adaptation measures may need to be initiated.
6) For a more in-depth analysis, see Swedish EPA report Post Kyoto.
8/14/2019 Swedish Climate Strategy
http://slidepdf.com/reader/full/swedish-climate-strategy 22/140
20
“Is Sweden on the right track in work on climate change?”

8/14/2019 Swedish Climate Strategy
http://slidepdf.com/reader/full/swedish-climate-strategy 23/140
21
1 The Assignment
The Environmental Protection Agency and the Energy Agency have had thegovernment’s assignment of compiling a basis for the first evaluation at the2004 checkpoint.
Climate policy is associated with a number of uncertainties. When theclimate strategy was adopted in 2002, no decision had yet been made on theintroduction of a system of emissions allowances trading in the EU. Sweden
Our assignment has included:
• Producing a new overall forecast based on common basic assumptions.
• Carrying out evaluations of current policy instruments with a direct climate focus
or those which are quantitatively important for emissions
• Assessing the chance of achieving the interim target for the period 2008–2012using current policy instruments and measures, and where needed, submitting
proposals with assessed consequences for further/increased cost-effective measures.
• Making an economic and environmental assessment of the consequences of
integrating the flexible mechanisms into the interim target for the 2008– 2012
period and presenting an accessible overall description of costs and emission
effects of implementing measures nationally in Sweden and in other countries via
Joint Implementation and the Clean Development Mechanism.
• Making a survey of new knowledge on the climate problem. This task has includ-
ed producing an updated assessment of society’s capacity to implement the adap-tations necessary to avoid the consequences of an increased greenhouse effect.
Special weight is to be attached to information that is relevant to the long-term
objective.
It also included producing a summarising description of developments in other
countries with respect to emission, measures and policy instruments, and forecasts
of future developments carried out in those countries.
The assignment did not include analysing the consequences of using carbon sinks.

8/14/2019 Swedish Climate Strategy
http://slidepdf.com/reader/full/swedish-climate-strategy 24/140
22
ratified the Kyoto Protocol through the climate policy decision. Now, twoyears on, the EU has decided to introduce an emissions trading scheme. TheKyoto Protocol is not yet in force and there is still uncertainty surroundingthe actual results of the trading scheme in the EU. The first introductory period has not yet begun. A number of other Commissions of Inquiry are also
working in parallel with our work. At national level, some proposals havebeen submitted by Commissions concerning important taxes in the area, butno significant decisions have yet been made. Decisions about the shuttingdown of nuclear power plants are also very important for how carbon dioxideemissions in Sweden will develop, and negotiations are ongoing between theenergy industry and a specially appointed negotiator. At global level, negotia-tions will begin in 2005 under the auspices of the UNFCCC concerning new commitment periods and forms for global agreements for the post-Kyotoperiod.

8/14/2019 Swedish Climate Strategy
http://slidepdf.com/reader/full/swedish-climate-strategy 25/140
23

8/14/2019 Swedish Climate Strategy
http://slidepdf.com/reader/full/swedish-climate-strategy 26/140

8/14/2019 Swedish Climate Strategy
http://slidepdf.com/reader/full/swedish-climate-strategy 27/140
25
2 Knowledge of Climate Change
There is no longer much doubt that we are now able to see the impact on theclimate of anthropogenic greenhouse gas emissions, i.e. emissions caused by human beings. The greenhouse effect is increasing in intensity. The mostrecent research has generally confirmed the picture of an ever-warmer planet.The UN climate panel, the IPCC, is increasingly certain that human activity
is contributing to climate change. The uncertainty that exists is about how great the stronger greenhouse effect will be, how quickly it can develop andwhat areas of our planet will be most heavily affected. There is extensiveresearch on climate and climate change around the globe.
The IPCC made the most recent compilation of knowledge in the field inits third assessment report. The work of a fourth assessment report has begunand the report is expected to be ready by 2007. In Sweden, the researchprogramme SWECLIM17) has recently presented its final report containingthe results of regional climate models.
The strengthening of the greenhouse effect is primarily due to the increas-ing levels of carbon dioxide in the atmosphere as a consequence of widespread
use of fossil fuels. In the 20th century, the global population doubled and theuse of primary energy increased sixteenfold. One prerequisite for this rapid
increase in energy use has been the exploitation of fossil fuel reserves. Apart from carbon dioxide, other greenhouse gases are also being emittedat higher levels now than in the pre-industrial era. These include nitrousoxide, methane and some fluoride-containing substances. Other air pollu-tion, such as particles, also affect the climate system.
Carbon dioxide is also released by widespread global deforestation.(In boreal/temperate forests at northern latitudes, methane and nitrousoxide are also released if the land has previously been drained or is very humus-rich.)
7) The Swedish Regional Climate Modelling Programme at Rossby Centre, Swedish Meteorological and
Hydrological Institute, SMHI

8/14/2019 Swedish Climate Strategy
http://slidepdf.com/reader/full/swedish-climate-strategy 28/140
26
Figure 1 Global carbon dioxide emissions 1751–2000, from the use of oil, coal and natural
gas.8)
8) Source: Marland, G., T.A. Boden, and R. J. Andres. 2003. Global, Regional, and National CO2
Emissions. In Trends: A Compendium of Data on Global Change. Carbon Dioxide Information
Analysis Center, Oak Ridge National Laboratory, U.S. Department of Energy, Oak Ridge, Tenn.,
U.S.A. (See http://cdiac.esd.ornl.gov/).
1750 18501800
Year C O 2 ( b i l l i o n t o n n e
s c a r b o n / y e a r )
19501900 2000
4
6
8
10
0
2
1000 1200 1400 1600 1800 2000 Year
360
340
320
300
280
260
ppm
A t m o s p h e r i c c o n c e n t r a t i o n
CO2 concentration
Figure 2 Atmospheric carbon dioxide levels, 1000–2002
Note to Figure 2. Regular atmospheric measurements (black line) began in the late 1950s. Data for
earlier periods are based on analysis of air (grey symbols) trapped in inland ice. Current levels of
carbon dioxide are extremely high compared to levels during the 400,000 years that can be studied
using the Antarctic glaciers.

8/14/2019 Swedish Climate Strategy
http://slidepdf.com/reader/full/swedish-climate-strategy 29/140
27
Between the years 1860 and 2000, mean global temperature has risen by anaverage of 0.6°C ± 0.2. In Europe, the mean temperature has increased by
0.8°C during the same period. The most recent ten-year period has been the warmest on record. 1998 was the warmest year since 1861, and second warmest were 2002 and 2003, which were equally warm.
2.1 The future of the global climateContinued human influence on the composition of the atmosphere can beexpected in the 21st century. The third assessment report from the UNclimate panel IPCC produced a comprehensive basis for scenarios showinghow life on earth could develop in terms of population, technology, economicdevelopment in different parts of the world etc. These development assump-tions were then the basis of scenarios about future emissions, which in turn
were used for carbon cycle models of impact on the composition of theatmosphere. Global climate models were then used to calculate how the
climate could be affected. Estimates show global warming of between1.4–5.8°C during the period 1990–2100. Sea levels will then rise by between
1750 19001875
T e m p . a n o m a l y ( d e g C )
19501925 2000
0,8
1975
0,6
0,4
0,2
0,0
-0,2
-0,4
-0,6
Global air temperature (HadCRUT2v)2002 anomaly +0,48 °C(2nd warmest on record)
9) Source: Climatic Research Unit, University of East Anglia, UK.
Figure 3 Developments in mean global temperature for the period 1860–2002.
Note: given as annual deviations from the mean temperature for the 30-year period 1961–1990 9).

8/14/2019 Swedish Climate Strategy
http://slidepdf.com/reader/full/swedish-climate-strategy 30/140
28
0.09 and 0.88 m. Globally, precipitation will increase while certain areas willat the same time suffer more drought.
1000 1200 1400 1600 1800 2100 Year
6,5
T e m p e r a t u r e d e v i a t i o n f r o m m e a n
t e m p e r a t u r e ( o C ) 1 9 6 1 – 1 9 9 0
Northern hemisphere
1100 1300 1500 1700 1900 2000
5,5
6,0
4,0
4,5
5,0
2,0
2,5
3,0
3,5
-0,50,0
1,0
1,5
-1,0
Globally
IPCC Scenarios A1B
A1T A1F1 A2B1B2IS92a
Figure 4 Global temperature development, historically and according to IPCC scenarios.
The spread in results is because there are a number of uncertainties in thiseffect chain. A number of different assumptions can be made about society ’sfuture development and future emissions. In addition, the climate system iscomplex and there is great uncertainty about how the climate system will reactto even higher levels of greenhouse gases, how sensitive the climate system is.
There may for example be a risk that the climate system, instead of changinggradually in proportion to ongoing changes in impact, instead suddenly changes in an unwanted direction when a threshold level is reached. This
could mean, for example, the collapse of the western Antarctic inland ice with widespread resulting increases in sea level; that large amounts of methanetrapped inside permafrost are released, further reinforcing the greenhouseeffect; or that ocean currents change direction. There is today a lack of knowl-edge of how great these risks are, apart from the fact that they are conceivableand are judged to increase the more the climate is affected. The consequences
would be global.

8/14/2019 Swedish Climate Strategy
http://slidepdf.com/reader/full/swedish-climate-strategy 31/140
29
2.2 Regional climate scenarios
Regional climate scenarios primarily focusing on the Nordic region andSweden have been produced by the Swedish research programme SWE-CLIM. These describe how the climate at Sweden’s latitudes can develop
under certain conditions. The calculations in the model are based on twoglobal emission scenarios in which atmospheric carbon dioxide levels areassumed to be 600 and 850 ppm10) respectively in the year 2100. It should benoted that both scenarios exceed the long-term stabilisation goals for green-house gas levels formulated in Sweden and the EU, see section 2.5. below. Inthe scenarios, the annual mean temperature for Sweden increases by 2.5–4.5°C in a 100-year perspective. The calculated regional changes inprecipitation and evaporation show considerable variation. Over largeregions, precipitation is expected to increase while snow cover is reduced. The
growing season is extended by 1–2 months and the vegetation zones are shift-ed. Rate of water flow increases in the north and falls in the south. The springfloods characteristic of today will on average be less heavy. The risk of flood-ing is expected to fall in the spring but increase at other times of year. Futureclimate changes in these scenarios are not small from a Swedish perspective,even if they may appear moderate compared to other regions.
10) Parts per million
Figure 5 Changes in mean annual temperature in Europe in a 100-year perspective
Source SWECLIM
Present day Future

8/14/2019 Swedish Climate Strategy
http://slidepdf.com/reader/full/swedish-climate-strategy 32/140
30
In SWECLIM’s scenarios, the mean annual temperature in central Europeincreases by up to 6°C. In one of the simulations, summer temperature (June- August) increases by up to 10°C while precipitation falls heavily. Changes onthis scale would of course cause extensive problems in many areas, at the sametime as it is highly likely that the number of extreme weather situations, such
as torrential rain and long droughts, will increase in a changed climate. Thevariations in the results of the various simulations from SWECLIM aregreater for central Europe than for northern Europe. That winters are affectedin northern Europe and summers in continental Europe is however a consis-tent feature of both SWECLIM’s calculations and those of other internationalresearch groups.
2.3 Need of adaptation — globally
The IPCC is of the view that it is already too late to entirely avoid the effects of climate change, e.g. in the shape of flooding of low-lying coastal areas. Theconsequences of even a small increase in mean global temperature are particu-
larly grave for the small island nations of the South Pacific. The adaptation of anumber of sectors to a warmer climate with new conditions is therefore a nec-essary strategy and should supplement measures designed to mitigate climatechange. The Netherlands was early in starting discussions on what adaptationmeasures will be required to mitigate the effects of an increase in sea levels. Forsome regions, it may be necessary to switch crops or tree types to secure foodproduction and forestry. Altered conditions for food production can in turnlead to population migration. In thawing permafrost regions of Russia andCanada, measures are necessary to alleviate the effects of collapsing roads,buildings and pipelines etc. Generally, developing countries will have moredifficulty in dealing with climate change. They suffer in two ways – they are
often in regions affected by extensive weather and climate changes, and they do not have the resources to adapt to a changed climate with different weathersystems.
2.4 …and in Sweden
Vulnerability and risks in Sweden in a changed climate have thus far been theobject of only one or two analyses. No comprehensive programme has evalu-ated requirements, opportunities and costs. Some work has been started inrecent years by a number of bodies, such as sector authorities, to examine

8/14/2019 Swedish Climate Strategy
http://slidepdf.com/reader/full/swedish-climate-strategy 33/140
31
vulnerability and the need of adaptation, primarily related to flooding disas-ters. The National Board of Building, Housing and Planning, the NationalRescue Services Administration and the National Roads Administration havebegun some work. The SMHI and the power industry have reviewed theconsequences for hydroelectric power. More work may be necessary in the
field. A survey will be carried out during the work on the fourth nationalreport to the UNFCCC, and adaptation measures may need to be initiated.
SWECLIM’s scenarios show that precipitation may increase in Sweden,and that the mean annual temperature may increase somewhat more than theglobal average. Sweden extends over a number of zones from the subborealzone in the south to the boreal and Arctic-Alpine vegetation zone in thenorth, which results in a great variation in species and biotopes. Bothecosystems and technical systems are adapted to prevailing local/regionalconditions. An increase in temperature will therefore cause a shift in naturalvegetation zones and may lead to the extinction of some species, primarily inthe mountain regions. Increased precipitation and short-term high flow levels
increase the risk of flooding and associated problems such as earth-slip, subsi-dence, and leaching of pollutants. For investments with long lifetimes whichrequire large financial input, there may be problems. A number of functionsare dimensioned on the basis of historic information about extreme values forflows and precipitation; extreme values that may change in a changed climate.These include the load on buildings of wind and heavy wet snow, drinking water supply, electrical power supply, dam security and anti-flood measures,and dimensioning of drain systems and sewage systems.
2.5 Possible stabilisation of the level of
reenhouse gases in the atmosphere
At what level should the level of greenhouse gases be stabilised?
The overall goal of the UNFCCC is to stabilise the concentration of green-house gases in the atmosphere at levels that ensure that dangerous humaninterference with the climate system is avoided. The UNFCCC does not
however define what constitutes dangerous interference with the climatesystem. It is impossible to scientifically define the exact meaning of the word“dangerous” in terms of a stabilisation level since (i) there is still uncertainty about how much the climate will change and what the consequences will be,

8/14/2019 Swedish Climate Strategy
http://slidepdf.com/reader/full/swedish-climate-strategy 34/140
32
and (ii) the decision about whether a certain risk is acceptable or dangerous isbased on value judgements. The adoption of a long-term stabilisation level forthe concentration of greenhouse gases in the atmosphere is therefore finally apolitical issue.
According to the decision of the Riksdag, Sweden is to act to ensure that
long-term levels of greenhouse gases should be stabilised at levels under 550ppm carbon dioxide equivalents. Stabilisation at these levels can be assumedto help limit the increase in mean global temperature to 2100 to under 2°Ccompared to pre-industrial levels, but can lead to considerably greater changeif the climate system proves to be more easily affected. Similar objectives havealso been formulated in some other EU countries, see fact box.
The EU Council of Ministers has adopted the target that:
Mean global temperature is not to increase by more than 2°C compared to pre-industrial levels. When the target was adopted, it was thought that this target
would correspond to carbon dioxide levels being stabilised at 550 ppm (corre-
sponds to a stabilisation of the level of carbon dioxide equivalents at 650 ppm). The
two targets are probably not compatible. A stabilisation at approx. 450 ppm carbon
dioxide is necessary. An overview of the long-term climate strategy is under way
within the EU.
Germany intends to reduce that country ’s emissions by 40% between 1990 and
2020 if emissions within the EU fall by 30% at the same time.
The United Kingdom is to act to ensure that the industrialised countries reduce
their emissions by 60% to 2050, which is probably compatible with a carbon
dioxide stabilisation level of 550 ppm. With reductions in emissions in developing
countries, reduction may also be compatible with carbon dioxide stabilisation at
450 ppm
France is discussing ambition levels to 2050 that are compatible with a carbon
dioxide stabilisation level of 450 ppm.
The choice of stabilisation level however contains uncertainties about (i) thesize of emissions that can be permitted at various points in time and (ii) themagnitude of global warming. Against the background of these uncertainties,the IPCC recommends in its third assessment report that the world’s

8/14/2019 Swedish Climate Strategy
http://slidepdf.com/reader/full/swedish-climate-strategy 35/140
33
decision-makers adopt a hedging strategy, i.e. a strategy focused on the shortand long-term reduction of emissions that means that it will still be possibleto achieve very low stabilisation levels in the future at reasonable cost if itshould prove necessary.
2.6 Reduction requirements
Several individual countries, and the EU jointly, have thus come to theconclusion that it is best to attempt to limit global temperature increase inthis century to under 2°C compared with pre-industrial levels. To achievethis, the level of greenhouse gases in the atmosphere must be limited. TheUNFCCC points out that this must take place through limitation of emissions from sources and by managing and increasing sequestration tocarbon sinks.
There are many ways of reducing emissions that can lead to the samestabilisation levels, but the longer measures are postponed, the quicker emis-sions must fall when measures are finally applied. Reviews of various scenarios
produced by the IPCC to achieve stabilisation levels under 550 ppm carbondioxide equivalents point to a requirement that emissions in the industrialisedcountries must be reduced to 2020 by about 10–30% and to 2050 by about80%. If effective measures are applied at the same time in the developingcountries, there may be a smaller need of emission reductions in the industri-alised countries to 2050. (For a more detailed analysis, see the account in theEPA ’s report Post Kyoto.)
The background of how emissions have developed so far and the reportedforecasts for the countries in question indicate that great changes will benecessary in the near future to turn developments around.
For Sweden, emissions must be reduced by 50–60% by the year 2050
compared to 1990 levels in the above stabilisation scenarios. The reason thatSwedish emissions need to be reduced somewhat less compared to the averagefor the industrialised countries is that Sweden is starting from a relatively low level of per capita emissions. Since emissions have remained relatively stablein Sweden since 1990 (see section 5.2.1 below), the need of emission reduc-
tions by 2050 means that wide-ranging measures must be implemented overa relatively short period of time. Total emissions must on average be reducedby just over 1–1.5% per year during this period to match to global develop-ment limiting the temperature rise to under 2 °C.

8/14/2019 Swedish Climate Strategy
http://slidepdf.com/reader/full/swedish-climate-strategy 36/140
34
2.7 Technical potential and the need of technical development
The size of the emission reductions that will be necessary to stabilise the levelof greenhouse gases in the atmosphere at a certain level will largely depend onhow global energy requirements develop in the future.
Change can therefore take place through the use of new technology thatinvolves small carbon dioxide emissions, through the spread of existingenvironmentally sound technology, and also by suppressing demand throughaltered consumer behaviour. The view of the IPCC is that with restrainedconsumer demand, existing technology will be “enough” to keep emissionsdown so that the level of greenhouse gases can be stabilised at 550 ppm.Existing technology means, for example, greater energy efficiency, transferfrom coal and oil to natural gas, renewable energy such as biofuels and wind,and the use of sinks. If, on the other hand, the demand for energy increases
apace with historical developments, other technology will be required on alarge scale, such as the efficient conversion of solar energy into electricity andhydrogen gas, or the separation and storage of carbon dioxide. The necessary technology development in such an event requires widespread global research,development and demonstration efforts. It has been called into question whether the Kyoto Protocol is enough to start off technology developmenton a sufficient scale, bearing in mind the long-term need of new energy technology. Technology-oriented policies and policy instruments must beused as a supplement to protocols based on emission targets and market-
based mechanisms.

8/14/2019 Swedish Climate Strategy
http://slidepdf.com/reader/full/swedish-climate-strategy 37/140
35

8/14/2019 Swedish Climate Strategy
http://slidepdf.com/reader/full/swedish-climate-strategy 38/140
36
“At the global level, negotiations are due to start in2005 under the Kyoto Protocol on new commitment
periods and the forms global agreements are to take.”

8/14/2019 Swedish Climate Strategy
http://slidepdf.com/reader/full/swedish-climate-strategy 39/140
37
3 How is the Climate Issue Developing?
3.1 International climate policy
Since the climate problem is global, it is vitally important that there is contin-ual progress in international climate work. International co-operation has itsorigins in the Climate Convention and the Kyoto Protocol. The overall objec-
tive of the 1992 Climate Convention is that atmospheric concentration of greenhouse gases are to be stabilised at a level that prevents human impact onthe climate system from becoming dangerous. What level this means is notstated. An important principle of the Convention is that the industrialised
countries are to take the lead in combating climate change and its damagingeffects.The 1997 Kyoto Protocol is a first step in quantifying the emission reduc-
tions needed to achieve the targets of the Climate Convention. When it wassigned, the Protocol meant that the industrialised countries – known as the Annex 1 countries – undertook to reduce emissions of carbon dioxide,methane, nitrous oxide and some fluorinated greenhouse gases by just over
5% between 1990 and the 2008–2012 “commitment period”. Under theProtocol, the EU is to reduce emissions by 8% while the USA undertook to
reduce emissions by 7%. To enable greater flexibility in the parties’ imple-mentation of their commitments and increase cost-effectiveness, three“flexible mechanisms” were introduced in the Protocol – emissions tradingand climate projects in other countries (Joint Implementation (JI) and theClean Development Mechanism (CDM)). Under the Kyoto Protocol, it isalso possible for countries to count the sequestration of carbon to carbonsinks to some extent.
The flexible mechanisms were centrally important to many countries’ratification of the Protocol and are a key factor in its coming into force.
The Kyoto Protocol has not yet entered into force, but there are hopesthat Russia will ratify it thus making the commitments of the Protocolbinding. The reduction commitments made by the industrialised countriesfor the first commitment period of the Kyoto Protocol are far from sufficient,and more effective measures are required in the future. The hope is, however,that the Kyoto Protocol will provide a good basis for further work. Negotia-

8/14/2019 Swedish Climate Strategy
http://slidepdf.com/reader/full/swedish-climate-strategy 40/140
International Climate Policy
The IPCC The UN Climate Panel was formed in 1988. Three assessment reports on the
scientific knowledge base of climate change have been produced. They analyse,among other things, stabilisation levels for the emission of greenhouse gases into
the atmosphere. From 1000 to 450 ppm to the year 2100. The IPCC is working on
a fourth assessment report.
The 1992 Climate ConventionUN Framework Convention on Climate Change. Contains an agreement that the
level of greenhouse gases is to be stabilised at a level that stops human impact on the
climate system from becoming dangerous. At the end of the decade, the industri-
alised countries undertook to return to 1990 emission levels.
The 1997 Kyoto Protocol A large number of the world's industrialised countries committed themselves to
reducing their emissions by just over 5% as an average until 2008–2012. The
flexible mechanisms were introduced.
Flexible mechanisms Give cost-effective measures.
Emission rights trading. Enable parties with reduction commitments under the
Protocol to buy and sell emission rights from each other.
Joint implementation 2
Parties with reduction commitments can make investmentsin other countries and obtain emission credits according to fixed rules.
38
tions about commitments for the post–2012 period will begin in 2005. A key part of future climate regimes will continue to be the implementation of measures cost-effectively and in co-operation. It is highly likely that some sortof flexible mechanism that can lead to an evening out of costs and a spread of technology will also be an important component of future international
climate co-operation.
cont. >>

8/14/2019 Swedish Climate Strategy
http://slidepdf.com/reader/full/swedish-climate-strategy 41/140
The Clean Development Mechanism, CDM 2 Countries with reduction commit-
ments can implement projects in countries without reduction commitments and
obtain emission credits according to fixed rules. Is to contribute to sustainable
development according to the priorities of the host country.
The Marrakech Accord The countries could agree the principles of a regulatory framework for the pro-
ject-based mechanisms, interpretation of the supplementarity1 principle and the
regulations for sanctions and observance.
The EU Climate Strategy Under the Kyoto Protocol, the EU has made a joint commitment to reduce green-
house gas emissions by 8% from 1990 to 2008–2012. An internal distribution
has been done to allocate a burden to each member state. Sweden's commitment
is +4% and is legally binding. The EU's long-term target has been stated as a
stabilisation of carbon dioxide levels to 550 ppm. In 2000, the European Climate
Change Programme was established with the aim of identifying the most environ-
mentally sound and cost-effective measures within the EU. An important part of
the programme was to continue the work of drawing up the framework for the
EU trading system for emissions rights.
The Kyoto Protocol comes into force When at least 55 parties to the Climate Convention have joined the Protocol by
ratifying, accepting, approving or adopting the text. At least 55% of the total
1990 emissions of the Annex 1 countries are also required if the Protocol is to
come into force.
Negotiations about future commitments under the Kyoto Protocol Will commence in 2005. A key aspect of the work is to get all industrialised
countries involved in the international co-operation and that more countries
make quantified commitments.
1 Use of the mechanisms is to be supplementary to domestic measures. Domestic measures are thus tomake up a significant proportion of the effort made by each party in Annex 1 to meet its reductioncommitments.
2 Unlike emission trading between countries, JI and the CDM refer to actual projects.
39

8/14/2019 Swedish Climate Strategy
http://slidepdf.com/reader/full/swedish-climate-strategy 42/140
40
3.2 Sweden’s climate and energy policy decisions
Sweden has applied programmes and measures with the aim of reducinggreenhouse gas emissions since 1988, when the issue was first discussed in the Riksdag . Energy policy decisions with climate-related areas, and several of the
policy instruments in the energy policy field, also influence emissions devel-opments.
Sweden’s Climate and Energy Policy Decisions
In 1991, the energy policy agreement was expressed in a climate strategy.
Sweden should work to ensure that the OECD countries stabilise their emis-
sions at 1990 levels. The same year, Sweden introduced a carbon dioxide tax,
one of the first countries in the world to do so.
The 1993 climate policy decisionExpresses the target that carbon dioxide emissions from fossil sources in 2000
are to be stabilised at 1990 levels and thereafter fall. In accordance with the
Climate Convention. A programme of measures begins in the Baltic states.
The 2002 climate policy decision
Interim target to 2008–2012
Sweden's emissions of all 6 greenhouse gases as defined in the Kyoto Protocol
are to fall by 4% compared to 1990 levels. The target is to be met without
compensation for sequestration to carbon sinks or by using the flexible mecha-
nisms. The Swedish climate work and the national target are to be monitored
on an ongoing basis. If emissions trends appear less favourable than predicted,
or if the policy instruments adopted do not give the expected effects, the gov-
ernment can propose further measures or, where necessary, propose a revised
target. The consequences for Swedish industry and its competitive situation are
to be taken into account. Checkpoints were proposed for the years 2004 and
2008.
Long-term climate target
Sweden will work internationally for the orientation of global work towards
the target of stabilising greenhouse gas levels at 550 ppm. In 2050, emissions
for Sweden should in total be lower than 4.5 tonnes of carbon dioxide equiva-lents per year and inhabitant, and should thereafter fall further. Whether the
target is met is wholly determined by international work and measures in other
countries.
cont. >>

8/14/2019 Swedish Climate Strategy
http://slidepdf.com/reader/full/swedish-climate-strategy 43/140
41
3.3 Sweden’s national target and international commitment
Sweden has adopted a national climate strategy which includes long-term
and short-term targets under the national environmental quality objectiveReduced Climate Impact. The short-term target is that greenhouse gasemissions as an average of the period 2008–2012 are not to exceed 96% of 1990 levels. This target is to be achieved without compensation for sequestra-tion to carbon sinks or the use of flexible mechanisms.
Sweden’s national target differs from its commitment under the KyotoProtocol and the EU internal burden-sharing agreement. One stated reasonfor setting lower emission levels in the national climate strategy was that it would promote long-term structural change and that it is important that
investments in trade and industry, the domestic sector and the public sectorare made now with insight into the need to reduce greenhouse gas emissions.One consequence of Sweden’s having an emission target that differs from
its commitment in the EU and under the Kyoto Protocol is that Sweden may come to hold a surplus of emissions allowances in the form of AAUs11). In itsclimate policy decision, the government stated that Sweden will assert itsright to save the difference between the level of the national target and theinternational commitment for future use. It should be pointed out howeverthat it is not certain that Sweden can save surplus units, since these may beneeded if the EU is to meet its joint commitment under the Kyoto Protocol.There are also a number of regulations about how long they can be saved. See
further in Chapter 9.
11) Allocated to each country under the Kyoto Protocol at levels corresponding to the country ’s permitted
emissions for the current commitment period.
2002 års energipolitiska beslutThe 2002 energy policy decision
The goal of energy policy is to secure the supply of electricity and other energy
in both the short and long term at prices that are internationally competitive.
Energy policy is to create the conditions for efficient use of energy and cost-
effective energy supply. At the same time, effects on health, environment and
climate are to be low and the adaptation to an ecologically sustainable society is
facilitated. An important part of the strategy for reduced climate effects from
the energy sector is international climate measures.
8/14/2019 Swedish Climate Strategy
http://slidepdf.com/reader/full/swedish-climate-strategy 44/140

8/14/2019 Swedish Climate Strategy
http://slidepdf.com/reader/full/swedish-climate-strategy 45/140
43

8/14/2019 Swedish Climate Strategy
http://slidepdf.com/reader/full/swedish-climate-strategy 46/140
44
“Swedish strategy on climate change has had
an impact on emissions in several sectors.”

8/14/2019 Swedish Climate Strategy
http://slidepdf.com/reader/full/swedish-climate-strategy 47/140
45
4 Greenhouse Gas Emissions
4.1 Developments internationally and in the EU
The industrialised countries and the economies in transition – the “ Annex 1”countries of the Kyoto Protocol – reduced their greenhouse gas emissionssomewhat in the 1990–2000 period. The reduction was largely due to the
economic downturn in the EIT countries. There are great variations inemission trends between countries however. The USA, whose emissions makeup about 25% of the total global greenhouse gas emissions, lay about 12%above its 1990 emission levels in 2000. Sweden’s emissions in that year were
equivalent to 0.2% of total global emissions and were about 6% under 1990levels.Total emissions from the EU member states (EU15) were just over 2%
lower in 2001 than in 1990, largely as a result of large reductions in emissionsin Germany (conversion of the energy system in east Germany) and theUnited Kingdom (transition from coal to gas in the electricity system) andbecause emissions of other greenhouse gases, primarily methane and nitrous
oxide, have fallen generally in the EU. Emission trends for the varioussubsectors in Sweden are similar to those in the EU, with some exceptions.
Emissions from the transport sector increased by 20% as an average of theEU15 during the period while the increase in Sweden to 2001 was 8%. Oneexplanation might be that growth in GDP was lower in Sweden than the EUaverage. Emissions from the domestic and service sectors increased somewhatbetween 1990 and 2001 at EU level, while these emissions fell heavily inSweden.
The emissions of the United Kingdom and Germany together make upabout 40% of total EU emissions, so developments in these countries are of particular importance. The figures below show developments in the
1990–2000 period in a selection of Annex 1 countries. Information has beentaken from the countries’ most recent national reports to the ClimateConvention.

8/14/2019 Swedish Climate Strategy
http://slidepdf.com/reader/full/swedish-climate-strategy 48/140
46
Figure 6 Annex 1 countries that had reduced their emissions in 2000 compared to 1990 levels.
Note: The figure for Sweden has been revised and is now –6%.
S w i t z e r l a n d
F r a n c e
S w e d e n
E U
F i n l a n d
U n i t e d K i n g d o m
H u n g a r y
G e r m a n y
C z e c h R e p u b l i c
C r o a t i a
P o l a n d
S l o v a k i a
R u s s i a
B u l g a r i a
E s t o n i a
L i t h u a n i a
L a t v i a
– 1– 2– 2– 4– 4
– 13– 17– 19
– 23– 30– 32– 33
– 38
– 51– 55– 56
– 66
– 80
– 60
– 40
– 20
0
C h a n g e s r e l a t i v e t o
1 9 9 0 ( % )
M o n a c o
S p a i n
G r e e c e
C a n a d a
A u s t r a l i a
U S A
J a p a n
S l o v e n i a
B e l g i u m
N o r w a y
N e w Z e a l a n d
I t a l y
N e t h e r l a n d s
A u s t r i a
L i e c h t e n s t e i n
3635
242018
14118765543
00
10
20
30
40
50
C h a n g e s r e l a t i v e
t o 1 9 9 0 ( % )
Figure 7 Annex 1 countries that had increased their emissions in 2000 compared to 1990
levels.

8/14/2019 Swedish Climate Strategy
http://slidepdf.com/reader/full/swedish-climate-strategy 49/140

8/14/2019 Swedish Climate Strategy
http://slidepdf.com/reader/full/swedish-climate-strategy 50/140
48
Emissions in 2002 were 69.6 million tonnes which is about 3.5% under1990 levels. Carbon dioxide constituted about 80% of total emissions, calcu-lated in carbon dioxide equivalents, while emissions of methane were around8%, nitrous oxide around 12% and fluorinated greenhouse gases about 1%,see pie chart below. Compared to 1990, emissions of methane and nitrous
oxide have fallen by 8% each while total carbon dioxide emissions were about2% lower in 2002.
F gases
Nitrous oxide
Methane
Carbon dioxide
79%
8%
12%1%
Figure 9 Emissions in 2002 by greenhouse gas
Emissions can be compared to economic developments in Sweden during thesame period. Growth in GDP was on average 1.8% per year in 1990–2002.GDP fell in the early 1990s but since 1994 has increased by an average of 3%per year. Total emissions of greenhouse gases thus did not increase as a resultof growth in Sweden between 1990 and 2002. Greenhouse gas emissionsfrom various subsectors in society have however shown varying development,as shown in the diagram below.

8/14/2019 Swedish Climate Strategy
http://slidepdf.com/reader/full/swedish-climate-strategy 51/140
49
Figure 10 Emissions of greenhouse gases by various subsectors, 1990– 2002.
0
5,000
10,000
15,000
20,000
25,000
Waste
Agriculture
Industrial processesincl. F gases
Transports
Energy production, domestic and service sectors
Industrial energy production
Electricity and heating production
2002200019981996199419921990
12) In recent years, the use of reserve power production in electricity shortfalls fell in the country com-pared to the 1996 situation. Import of electricity has instead increased during such periods.
Emissions from electricity and heating production vary from year to yeardepending on factors such as water availability and temperature. This is mostclearly seen in the emissions from1996, which was an unusually cold and dry
year12). During this period, production of primarily district heating hasclimbed steeply from 41 to 55 TWh. Emissions from this sector have still notincreased significantly because the use of oil and coal has fallen while theburning of biofuels and waste has climbed steeply.
Emissions from industrial energy production and industrial processes vary between years with the economic situation, but also because of other factorssuch as price relationships between various types of energy (electricity and oilfor example) and the ongoing structural change in trade and industry.Emissions primarily come from a few large energy-intensive sectors, sodevelopments for these particular sectors greatly affect the overall picture.
Emissions from the domestic and service sectors have shown a steady decline
throughout the period. Emissions in 2002 were 37% lower than 1990emissions. The fall is largely due to a widespread transition from small oil-
burning boilers to district heating but also to heat pumps and small-scalebiofuel use.

8/14/2019 Swedish Climate Strategy
http://slidepdf.com/reader/full/swedish-climate-strategy 52/140
50
Emissions from the transport sector have increased by about 10% since1990. Road traffic emissions of carbon dioxide dominate. The increase is dueto an increase in transport kilometres, primarily for heavy goods transports, which in turn is due to trends in trade and industry towards greater exchangeof goods, centralised and specialised production etc. Road transport’s share of
total goods transport kilometres has shown a total increase in this period.Emissions from air and rail transport fell marginally in the period.
Agricultural emissions fell by about 8% between 1990 and 2002. Thereduced methane emissions are because of less livestock keeping while the fallin nitrous oxide is primarily due to the lower use of both commercial fertiliserand natural fertiliser.
Emissions from waste landfills have fallen by 29% during the same periodas a result of the collection of landfill gas and the reduced deposit of organicmaterial in landfills.
4.2.2 Emissions of other air pollutants
When measures are implemented to reduce greenhouse gas emissions, otheremissions can also be affected. These gases also have indirect impact on theclimate. Nitrogen oxides (NOx) and volatile organic compounds (NMVOC)influence the production of ozone, which in turn influences the greenhouseeffect, while sulphur dioxide (SO
2) gives rise to airborne particles that can
temporarily counteract the temperature-raising impact of greenhouse gases.

8/14/2019 Swedish Climate Strategy
http://slidepdf.com/reader/full/swedish-climate-strategy 53/140
51
Figure 11: Emissions of nitrogen oxides (NOx), sulphur dioxide (SO2) and volatile organic substances (NMVOC), 1990–2002
0
100
200
300
400
500
600
SO2 cap 2010
NOx cap 2010
NMVOC cap 2010
SO2
NOx
NMVOC
20082005200219961990
K i l o
t o n n e s
Emissions of nitrogen oxides have fallen by 25 % since 1990. Traffic and
mobile machinery are the largest sources of these emissions. The introductionof catalytic converters in passenger cars and the subsequent successively tougher exhaust standards have contributed to a reduction in emissions. Theextension of district heating and the fees levied on NOx in the early 1990shave also led to heavy reductions in nitrogen oxide emissions from the energy
sector.Sulphur dioxide emissions come from the energy, transport and industrialsectors and have fallen by 45% compared to 1990. Emissions were already low in Sweden in 1990.
Emissions of volatile organic substances fell 41% between 2002 and 1990.Road traffic and wood burning in households are the main sources of
emissions while mobile machinery, some industrial activities and the use of solvents are also significant.

8/14/2019 Swedish Climate Strategy
http://slidepdf.com/reader/full/swedish-climate-strategy 54/140
52
“The new forecast indicates that emissions up to 2010 will
increase in comparison with recent years, but will nevertheless
be slightly below 1990 levels.”

8/14/2019 Swedish Climate Strategy
http://slidepdf.com/reader/full/swedish-climate-strategy 55/140
53
5 Forecasts
5.1 Forecasts for emissions internationally and in the EU
Total greenhouse gas emissions from the Annex 1 countries are expected toincrease by 10% during the 1990–2010 period. Variations between countriesare significant. According to the forecast, emission increases are expected in
most countries compared to today ’s levels. The information has been takenfrom the countries’ most recent national reports to the UNFCCC.
–20
–10
0
10
20
30
40
50
60
Forecast
Commitment
I t a l y
J a p a n
F r a n c e
S l o v
e n i a
A u
s t r i a
F i n l a n d
N e t h e r l a n d s
B e l g
i u m
C r o a t i a
N e w Z e a l a n d
N o r w a y
A u s t r a l i a
C a n a d a
U S A
G r
e e c e
S p a i n
Figure 12 Forecasts for 2010 and Kyoto commitments for some Annex 1 countries.
Note: From the countries’ most recent reports to the Climate Convention, 2001.

8/14/2019 Swedish Climate Strategy
http://slidepdf.com/reader/full/swedish-climate-strategy 56/140
54
Figure 13 Forecasts for 2010 and Kyoto commitments for some Annex 1 countries.
Note: From the countries’ most recent reports to the Climate Convention, 2001.
–70
–60
–50
–40
–30
–20
–10
0
10
Forecast
Commitment
L a t v i a
E s t o n i a
G
e r m a n y
C
z e c h R e p u b l i c
S l o v a k i a
H
u n g a r y
U
n i t e d K i n g d o m
P o l a n d
B u l g a r i a
R u s s i a
C
z e c h R e p u b l i c
E U
L i e c h t e n s t e i n
S w e d e n
In the EU (EU15), only Sweden, the United Kingdom and Germany areexpected in the 2001 forecasts to meet their commitments using policies within the country under the EU burden-sharing agreement. According tothe EEA 2003 report, Germany will not meet its commitment under theburden-sharing agreement by 2010 using only policies within the country.
5.2 Forecasts for emissions in Sweden
A new forecast has been produced for greenhouse gas emissions in 2010 and2020. The forecast includes a main alternative and four sensitivity alterna-tives. The sensitivity alternatives above all operate on emissions of carbondioxide from the energy system. A combination of expert assessments andmodel calculations has been used in the work.
The forecast is based on currently applying climate and energy policy decisions. The fact box below summarises the various alternative forecasts and
some of the most important basic assumptions.

8/14/2019 Swedish Climate Strategy
http://slidepdf.com/reader/full/swedish-climate-strategy 57/140
55
Assumptions in the baseline forecast
• Nuclear power shut down after 40 years’ operational lifetime.
• Barsebäck 2 nuclear power reactor closed before 2010.
• EU ETS included by assuming a price for emissions allowances of 10 euros per
tonne CO2.
• CO2
tax retained in the trading sector.
• Otherwise, we assume current taxes and other policy instruments, the IEA ’s
assessment concerning the development of fossil fuel prices, the Energy Agency ’s
assessment of the development of biofuel prices and the National Institute of
Economic Research’s assessments of economic growth.
• For the 2010-2020 period, we assume that the quota for the electricity certificate
system is retained at the level decided for 2010. The same method applies to theprice assumed for emission allowances in the EU ETS, i.e. 10 euros per tonne
1990– 2000 2000– 2010 2010– 2020
GDP 1.9%/yr 1.7%/yr 1.8%/yr
Private consumption 1.5%/yr 2.6%/yr 2.6%/yr
Industry’s production value 4.4%/yr 2.6%/yr 3.3%/yr
2000 2010 2020
Crude oil, USD/barrel 28 21 25
Coal, USD/tonne at harbour 35 39 41
Natural gas USD/Mbtu 3.0 2.8 3.3
Sensitivity alternatives:
1. No CO2
tax in the trading sector.
2. Higher GDP
3. Nuclear power shut down after 32 years
4. Nuclear power shut down after 60 years.
• An emissions allowances price of 10 euros per tonne applies in all sensitivity alter-natives. A separate analysis studies the effects of various prices of emissionsallowances, and their effects on the Swedish energy system and on growth.
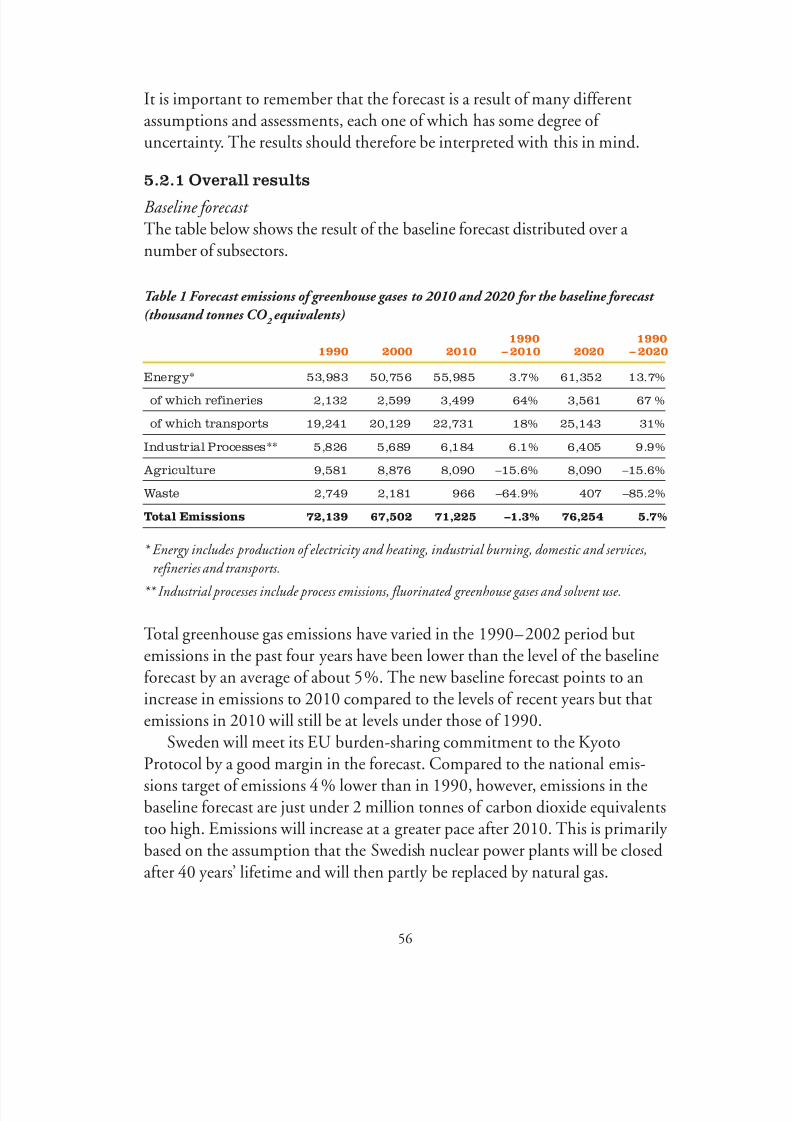
8/14/2019 Swedish Climate Strategy
http://slidepdf.com/reader/full/swedish-climate-strategy 58/140
56
It is important to remember that the forecast is a result of many differentassumptions and assessments, each one of which has some degree of uncertainty. The results should therefore be interpreted with this in mind.
5.2.1 Overall results
Baseline forecast The table below shows the result of the baseline forecast distributed over anumber of subsectors.
Table 1 Forecast emissions of greenhouse gases to 2010 and 2020 for the baseline forecast
(thousand tonnes CO 2
equivalents)
1990 19901990 2000 2010 – 2010 2020 – 2020
Energy* 53,983 50,756 55,985 3.7% 61,352 13.7%
of which refineries 2,132 2,599 3,499 64% 3,561 67 %
of which transports 19,241 20,129 22,731 18% 25,143 31%
Industrial Processes** 5,826 5,689 6,184 6.1% 6,405 9.9%
Agriculture 9,581 8,876 8,090 –15.6% 8,090 –15.6%
Waste 2,749 2,181 966 –64.9% 407 –85.2%
Total Emissions 72,139 67,502 71,225 –1.3% 76,254 5.7%
* Energy includes production of electricity and heating, industrial burning, domestic and services,
refineries and transports.
** Industrial processes include process emissions, fluorinated greenhouse gases and solvent use.
Total greenhouse gas emissions have varied in the 1990–2002 period butemissions in the past four years have been lower than the level of the baselineforecast by an average of about 5%. The new baseline forecast points to anincrease in emissions to 2010 compared to the levels of recent years but thatemissions in 2010 will still be at levels under those of 1990.
Sweden will meet its EU burden-sharing commitment to the KyotoProtocol by a good margin in the forecast. Compared to the national emis-
sions target of emissions 4 % lower than in 1990, however, emissions in thebaseline forecast are just under 2 million tonnes of carbon dioxide equivalentstoo high. Emissions will increase at a greater pace after 2010. This is primarily based on the assumption that the Swedish nuclear power plants will be closed
after 40 years’ lifetime and will then partly be replaced by natural gas.
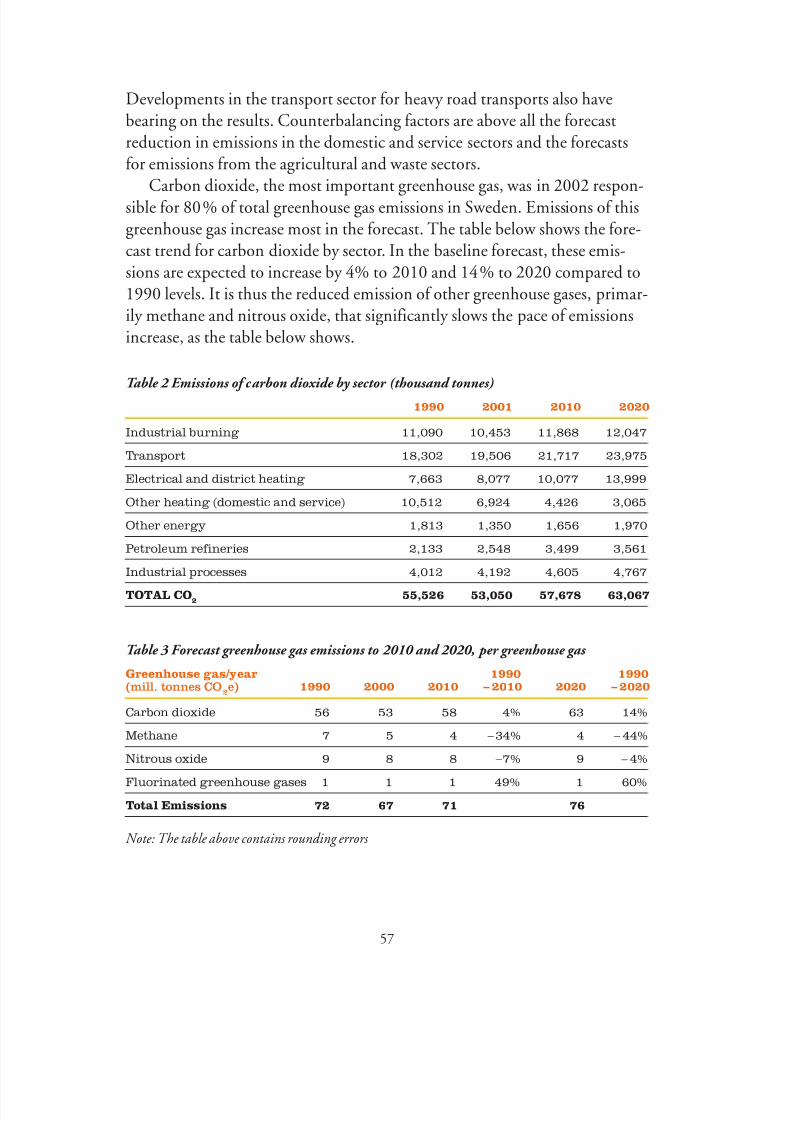
8/14/2019 Swedish Climate Strategy
http://slidepdf.com/reader/full/swedish-climate-strategy 59/140

8/14/2019 Swedish Climate Strategy
http://slidepdf.com/reader/full/swedish-climate-strategy 60/140
58
5.2.2 Results at subsector level
The diagram below shows the results of the baseline forecast by subsector.
0
5,000
10,000
15,000
20,000
25,000
30,000
Waste
Agriculture
Industrial processes incl. F gases
Transports
Energy production, domestic and service sectors
Industrial energy production
Electricity and heating production
2020201520102005200019951990
K i l o t o n n e s C O 2 e q u i v a l e n t s
Figure 14 Emissions of greenhouse gases by sector, actual emissions and forecast.
Electricity and heat productionEmissions from the production of electricity and heating including refineriesincreases compared to developments in the 1990s. Looking at the2000–2010 period, the increased emissions of carbon dioxide are primarily due to an increase in electricity and heating production from natural-gasbased combined heating and power plants and partly to an increased use of
waste in district heating production. In the 2000 –2010 period, extraproduction of electricity consists of biofuels and natural gas-based heatingand power, and wind power. According to the forecast, Sweden will exportabout 3 TWh of electricity in 2010. The increased carbon dioxide emissionsof the later period are largely a result of increased use of natural gas incombined heating and power plants and condensing power plants. For the2010–2020 period, the electricity production of nuclear power plants isexpected to fall by about 20 TWh (assumed 40-year lifetime). At the same
time, the demand for electricity is assumed to rise, making new productioncapacity necessary. This new production capacity consists primarily of
electricity production from natural gas condensing, natural gas heating andpower, and wind power. A net import of just over 2 TWh is expected for2020.

8/14/2019 Swedish Climate Strategy
http://slidepdf.com/reader/full/swedish-climate-strategy 61/140
59
Industrial energy use Emissions from this sector are expected in the forecast to increase somewhatup to 2010 and stabilise during the 2010–2020 period. The stabilisation of emissions in the latter period is explained by the increasing use of natural gasat the expense of oil use. Industrial energy use is expected to increase by
approx. 17 TWh during the 2000 –2010 period., For the 2010–2020 period,energy use is expected to continue to increase, but at a somewhat slower pacebecause of a somewhat lower rate of growth in energy-intensive industry.Electricity use increases throughout the period. The increase in energy usein the industrial sector is larger in the 2000–2010 period than in the2010–2020 period. This is because production growth in electricity-intensive industry is assumed to be lower during the later period and thatthe higher price of electricity has negative effects on some activities.
Energy use in the domestic and service sectors etc.Overall, the forecast shows a heavy reduction in emissions from the sector,
but the pace of reduction slows somewhat compared to developments in1990–2000 (emissions from the sector fell by 37% in 1990 –2002). Totalenergy use is expected to fall in the sector by about 7 TWh from 2000 to2020. The main fall is in oil use, which falls by 60 and 80% to 2010 and2020 respectively, compared to 1990 levels. The reduced use of oil is compen-sated by, among other things, district heating which means reduced conver-sion losses. Over and above this, the reduction is primarily due to the moreefficient use of energy for heating and hot water, and that the use of heatpumps increases. Electricity use is expected to increase during the period.Use of household electricity to run various electrical appliances and operatingelectricity in commercial premises contributes to the increase.
Transports Emissions from the transport sector increase in the prognosis at a higher ratethan before throughout the whole forecast period, 2000–2020. The increaseis largely due to increased diesel use. Developments are very hard to assess
however. Petrol use is expected to rise slightly during the period up to 2010because of assumptions about the introduction of cars with better fuel econo-my, increased use of biofuels – primarily ethanol mixed into petrol at low proportions – and a transition to diesel for light trucks. The increase in dieseluse is explained by a high rate of increase in goods transports using heavy

8/14/2019 Swedish Climate Strategy
http://slidepdf.com/reader/full/swedish-climate-strategy 62/140
60
vehicles, which is based on assumptions about the rate of growth of industry in the transport-intensive sectors. The IEA forecast that oil prices will only increase slightly by 2020 also affects results. Cautious assumptions are alsomade about the introduction of renewable fuels during the 2010–2020period.
Industrial processes and flourinated greenhouse gases In the forecast, total emissions will increase by 6% to 2010 and 9% to 2020compared with 1990 levels. It is primarily carbon dioxide emissions fromcertain industrial processes that are expected to increase while emissions of other greenhouse gases are expected to fall or be stabilised. An EU directiveregulating the emission of fluorinated greenhouse gases from some centralareas of use is expected to be adopted shortly. If the regulations are adoptedlargely in accordance with the Commission’s original proposal, this is expect-ed to lead to a reduction of flourinated greenhouse gases by 2020 comparedto 1990 levels, and only a weak increase until 201013).
Agriculture Emissions from the agricultural sector are expected to continue to fall to2010. The reduction is primarily due to the changes in livestock farming thatare expected to take place because of the EU’s CAP, and which will probably be reinforced by the most recent agriculture decision (MTR 14)). The forecast islargely based on the effects of the structural changes taking place in agricul-ture, and to a lesser degree on direct measures to reduce greenhouse gasemissions. The consequences of the MTR have been taken into account inthe forecast, but the actual effects of the government’s proposals for nationalapplication of the MTR are still very hard to assess.
13) This effect has however not been included in the baseline forecast since the regulation has not yet beenadopted.
14) Mid Term Review. The EU’s mid-term review of agricultural policy.

8/14/2019 Swedish Climate Strategy
http://slidepdf.com/reader/full/swedish-climate-strategy 63/140
61
Waste The release of methane from waste landfills is expected to fall heavily, by 65%and 85% to 2010 and 2020 respectively, as a result of the implementation of decisions banning landfill deposit of combustible and organic waste.Developments assume that deposit is replaced by new treatment capacity in
the form of waste burning and material recycling. Emissions from landfillshave, according to current emissions statistics, already been reduced by justunder 30% compared to 1990 levels.
Reductions in the waste and agricultural sectors are assessed to be so largeoverall by 2010 in the forecast that other emissions need only be stabilisedcompared to 1990 levels for an overall reduction of emissions of 4% to beachieved.
5.2.3 Comparison with the forecast in the third national report
The forecast in the third national report (NC3) had higher emissions in both2010 and 2020 compared to the new forecast. It is the forecast for the
emissions trend for the domestic and service sectors that differs most, but theforecast for emissions from industrial processes and energy production, as well as the agricultural forecast, are lower than the NC3. The forecast forelectricity and heating supply and refineries is considerably higher this timecompared to NC3. The new transport forecast is also higher.
5.2.4 Results for trading and non-trading sectors
An important policy instrument to limit carbon dioxide emissions is the new EU emissions trading scheme, EU ETS, see in more detail in Chapter 7.The total allocation of emissions allowances to the plants covered by theEU scheme will largely control how much other sectors must reduce their
emissions so that the targets set for 2010 for reduced climate impact are to bereached overall. This applies both at EU level and in Sweden.

8/14/2019 Swedish Climate Strategy
http://slidepdf.com/reader/full/swedish-climate-strategy 64/140
62
Table 4 shows estimated size of carbon dioxide emissions from plants in thetrading sector in 2010 in Sweden in the baseline forecast, with an emission priceof 10 euros/tonne and with current levels of carbon dioxide and energy tax.
Results show that emissions in Sweden for the trading sector increase by 2010 and are 25% higher than 1990 emissions. The greatest increase, in percent,comes from refineries but the greatest quantitative increase in levels is in emis-sions from electricity and district heating plants. Emissions in the non-tradingsectors are expected to fall in the same period by an average of 12% in spite of the fact that emissions from the transport sector are expected to rise. So it is the
other non-trading sectors, such as domestic and commercial premises and theagricultural and waste sectors that are expected to contribute large reductions inemissions in the forecast.
By 2020, the electricity and district heating sectors are expected to increasetheir emissions in Sweden to a level that is 80% higher than 1990 emissions(see Table 2) and the trading sector overall by 47%. It is mainly an extension of natural gas-based electricity and heating production which will become finan-cially viable with current policy instruments and the assumed emissions price.
Trading sectors
Covers from 2005 the emission of carbon dioxide from power and heating plants,
oil refineries, plants that produce and process iron, steel, glass and fibreglass,
cement and ceramics, and plants that produce paper and pulp. More gases and
more sectors may be covered by the system after 2008.
Non-trading sectors
Covers other emissions of greenhouse gases (methane, nitrous oxide and the
industrial gases HFC, PFC and SF6). Also covers emissions of carbon dioxide
from small-scale burning in the domestic sector, the transport sector and other
trade and industry.

8/14/2019 Swedish Climate Strategy
http://slidepdf.com/reader/full/swedish-climate-strategy 65/140
63
Table 4 Emissions historically and forecast until 2010 and 2020 distributed over trading
and non-trading sectors (million tonnes carbon dioxide equivalents).
Emissions Emissions Forecast 1990 Forecast 19901990* 2000 2010 – 2010 2020 – 2020
Trading sectors 21.1 20.6 26.5 +25% 30.9 +47%
Transports 19.2 20.1 22.7 +18% 25.1 +31%
Miscellaneous 31.8 27.1 22.0 –31% 20.2 –36%
Total, non-trading sectors 51.1 47.3 44.7 –12% 45.3 –11%
Total Emissions 72.1 67.5 71.2 –1.3% 76.3 +5.7%
* No careful allocation to non-trading and trading sectors exists for 1990. An estimate of what propor-
tion of emissions are from the trading and non-trading sectors is based on 2000 proportions.
5.2.5 The sensitivity alternatives
The table below summarises the results of the four sensitivity alternatives.Table 5 Greenhouse gas emissions for the various sensitivity alternatives (thousand tonnes
CO 2
equivalents)
1990 1990Total Emissions 1990 2000 2010 – 2010 2020 – 2020
Baseline forecast 72,139 67,502 71,225 –1.3% 76,254 5.7%
Without CO2
tax 72,139 67,502 72,292 0.2% 80,923 12.2%
Nuclear power 32 yrs 72,139 67,502 72,226 0.2% 82,877 15%
Nuclear power 60 yrs 72,139 67,502 71,179 –1.3% 72,814 0.9%
Higher GDP 72,139 67,502 73,752 2.2% 81,890 13.5%
The baseline forecast assumes that carbon dioxide tax is retained in the trad-
ing sector. The sensitivity alternative in which this tax is abolished points toan increase in emissions of about 1 million tonnes to 2010 compared to thebaseline forecast to roughly 1990 levels. The difference is expected to belarger by 2020 when emissions are about 5 million tonnes higher in thealternative without carbon dioxide tax compared to the baseline alternative.
If the lifetime of the remaining nuclear power plants is assumed to be 60
years, then the increase in emissions between 1990 and 2020 is estimated atless than 1%. If instead all nuclear power plants are assumed to close duringthe period up to 2020, which will be the case if a lifetime of 32 years isassumed, then emissions increase so that they are 1.5 percentage points abovethe baseline forecast in 2010 and 9 percentage points above it in 2020. In the

8/14/2019 Swedish Climate Strategy
http://slidepdf.com/reader/full/swedish-climate-strategy 66/140
64
alternative with higher GDP growth, from an average of 1.8% per year to2.3% per year, emissions increase steeply to both 2010 and 2020 comparedto the baseline alternative.
The result of all forecast alternatives can also be studied in the diagrambelow:
50,000
55,000
60,00065,000
70,000
75,000
80,000
85,000
Higher GDP
Historical emissions
Nuclear power 32 yrs
Nuclear power 60 yrs
Without CO2 tax
Main forecast
2020201520102005200019951990 G r e e n h o u s e g a
s e s , k i l o t o n n e s
C O 2 e q u i v a l e n t s
Figure 15 Result of all forecast alternatives

8/14/2019 Swedish Climate Strategy
http://slidepdf.com/reader/full/swedish-climate-strategy 67/140
65

8/14/2019 Swedish Climate Strategy
http://slidepdf.com/reader/full/swedish-climate-strategy 68/140
66
“The Swedish strategy includes taxes, subsidies, regulations,
information and various market-based trading schemes.”

8/14/2019 Swedish Climate Strategy
http://slidepdf.com/reader/full/swedish-climate-strategy 69/140

8/14/2019 Swedish Climate Strategy
http://slidepdf.com/reader/full/swedish-climate-strategy 70/140
68
Policy Instruments in Use – National
Intersectoral
Energy and carbon dioxide tax including petrol and diesel tax Today ’s energy tax system is based on a combination of carbon dioxide taxes, energy
taxes on fuel, capacity tax on nuclear power, and consumer taxes on electricity.
Carbon dioxide tax was introduced in 1991 and today is SEK 0.91/kg. A reduced
tax level applies to parts of trade and industry and the production of heating and
power.
The Environmental Code
All overarching legislation in the environment field has been gathered in an
Environmental Code since 1 January 1999.
Implementation of the EU trading system
See further, fact box on relevant EU directives.
LIP/Klimp – local investment programmes
LIP was adopted in 1997 and means that Swedish municipalities could apply for
government grants to local investment programmes to improve the environment
and create employment (SEK 6.2 billion). Support to local climate investment pro-
grammes has been available since 202 (SEK 1,040 million). Examples of measures
that have been awarded grants: energy savings in property, use of waste heating,
extension of district heating, recovery of methane for heating or fuels.
Information
Climate information campaign.
Energy (including domestic sector)
Grants for energy production from renewable energy sources (being phased out)
Investment support to electrical production from biomass, wind power and hydro-
electric power and an environmental bonus for electricity produced from wind
power. The environmental bonus for electricity is to be phased out to the year
2010.
Electricity certificate system.
Replaces previous grants and began in 2003. Obligatory for users of electricity tobuy a certain number of certificates in relation to their electricity consumption.
The target is an increase of electricity from renewable energy sources of 10 TWh to
2010.cont. >>

8/14/2019 Swedish Climate Strategy
http://slidepdf.com/reader/full/swedish-climate-strategy 71/140
69
Programme for energy efficiency
Long-term contracts with energy-intensive industry. Energy-intensive companies
undertake to carry out an energy analysis, introduce energy management systems
and implement energy efficiency measures that influence electricity use. In return,
the government will offer tax relief from the EU minimum electricity tax.
More efficient energy use
Information and training, grants for procurement of energy-efficient technology,
testing, labelling and certification and grants to municipal energy advisory services.
Building regulations
Requirements concerning the energy efficiency of buildings and permitted loss of
heat are set out in the National Board of Building’s Building Regulations and
General Recommendations. Energy performance requirements only apply to new
construction.
Transport
Tax reduction biofuels
Five-year exemption from tax to 2008 for biofuels.
Fuel tax
Vehicle fuels for road transports are subject to energy tax and carbon dioxide tax.
Apart from fuel taxes, cars are liable to an annual vehicle tax and a road user charge
is levied on trucks with a total weight exceeding 12 tonnes that run in international
traffic.
Automotive industry’s voluntary commitment See EU policy instruments.
Waste
Banning of landfill deposit
In 2002, the landfill deposit of combustible waste was banned. A ban on the deposit
of organic waste will be introduced in 2005.
Research/development
Research and development are not a policy instrument that affects emissions in theshort term, but can in a long-term perspective be seen as a way of guiding develop-
ments in the required direction. Examples of research areas are renewable energy
and energy efficiency.

8/14/2019 Swedish Climate Strategy
http://slidepdf.com/reader/full/swedish-climate-strategy 72/140
70
Policy Instruments in the EU – EU Directives
with direct or indirect impact on greenhouse gas emissions
Overarching policy instruments EU emissions rights trading system
Begins in 2005. Covers the emission of carbon dioxide from combined heating and
power plants, oil refineries, plants that produce and process iron, steel, glass and
fibreglass, lime, cement and ceramics and plants that produce paper and pulp. The
first trading period is between 2005 and 2007. Emission rights are allocated free
according to a number of established criteria.
Directives that link project-based flexible mechanisms to the EU emission rights trading
system
Companies covered by the EU trading system are allowed to use their credits from
projects to fulfil their obligations under the trading system.The IPCC Directive
Co-ordinated measures to prevent and limit pollution. The Commission is to be
responsible for an exchange of information on BAT (Best Available Technology) for
those sectors covered by the Directive.
Energy
Directive on the promotion of electricity production from renewable sources
Contains an indicative target (non-compulsory) about increasing the proportion of
electricity production from renewable sources to 22.1%. The member states are totake the steps necessary to achieve the target and implementation is to be assessed
in 2005.
The Energy Tax Directive
The member states are directed not to have energy taxes below a set minimum for
fossil fuels, motor fuels and electricity. The Directive sets out conditions for reduction
of energy taxes.
Directive to promote co-production of electricity and heating
The motives are increased energy efficiency and security of supply by increased
diversification of production. It is proposed that it is to be obligatory to set national
potentials for combined heating and power production and that the countries are to
evaluate current legislation with the aim of reducing barriers for combined heating
and power production.

8/14/2019 Swedish Climate Strategy
http://slidepdf.com/reader/full/swedish-climate-strategy 73/140
71
Directive on deregulation of the energy market
The market for gas and electricity is to be fully opened to all industrial customers in
2004, and to all domestic customers in 2007.
Energy efficiency
Directive on the energy performance of buildings
Entered into force in 2002. The aim is to increase information about cost-effective
energy saving measures for buildings. The Directive is a framework directive,
within which the member states set minimum requirements for example energy
performance, energy declarations and inspections or advice about boilers. The
directive is to be implemented by the end of 2005, with some exceptions.
Framework directive on energy labelling of household products
The Directive states what products are to be labelled and regulations about how the
labelling is to be determined.Directive on ecodesign of energy-consuming products
Is to contribute to integrating the lifecycle perspective into product design. Does
not involve any new legal obligations for producers, but is instead a framework for
the harmonisation of ecodesign requirements. In the first hand, the Directive is to
act as an incentive to industry to conclude voluntary agreements about ecodesign.
The Council of Ministers has agreed on the proposed Directive and it can come
into force once it has been approved by Parliament.
The energy services directive
The aim of the Commission proposal is to promote energy efficiency measures andto improve the market for energy services. The proposal contains a general energy
saving target of 1% per year, a special target for the public sectors of the member
states and an undertaking for energy distributors and energy suppliers to provide
energy services.
cont. >>

8/14/2019 Swedish Climate Strategy
http://slidepdf.com/reader/full/swedish-climate-strategy 74/140
6.2 Policy instruments in the Swedish climate strategy
The assignment includes evaluating existing policy instruments, and the
focus is on those policy instruments that have had direct importance for
greenhouse gas emissions. The Swedish strategy includes taxes, grants, regula-tions, information and various market-based trading schemes. Our review hasalso shown that the policy instruments introduced in the waste and agricul-tural policy sectors influence developments. We have however not evaluatedthese here.
On the basis of our own work and after a review of the policy instrumentassessments of other countries, our overall assessment is that it is difficult toevaluate individual policy instruments. The effects of individual policy instru-ments are difficult to distinguish from other policy instruments and other
forces in society. We have however in our work chosen to analyse each policy instrument
separately while attempting to include the interplay of the policy instrument with other instruments and other factors in society that could have influenceddevelopments.
72
Transport
Directive to promote biofuels in the transport sector
Gives a target that at least 2% of total fuel sales on 31 December 2005 are to be
biofuel. In 2010, the total proportion of biofuel will be 5.75% of fuel sold.
Voluntary commitment by the automotive industry
In 1996, the EU environment ministers adopted a strategy to reduce emissions of
carbon dioxide from passenger cars. The target is that the carbon dioxide emissions
of passenger cars hare to have fallen by an average of 210 g/km no later than 2010.
An agreement has been concluded with the European automotive industry ’s organi-
sation ACEA. Similar agreements have also been concluded with the Japanese and
Korean automotive industry organisations, JAMA and KAMA.
Trade and Industry
Regulation on emission of fluorinated greenhouse gases The proposal was adopted by the Commission in 2003. The proposal is currently
being negotiated by the Council and Parliament.

8/14/2019 Swedish Climate Strategy
http://slidepdf.com/reader/full/swedish-climate-strategy 75/140
73
Energy and carbon dioxide taxes bring considerable revenue to the govern-ment. A total of approximately SEK 58 billion of which SEK 19 billion arefor carbon dioxide tax. Of the different fuel types, petrol is the largest propor-tion, around SEK 25 billion.
In our evaluation, the emphasis has been on carbon dioxide tax, even if itis important to remember that society ’s actors encounter the total tax, i.e.both carbon dioxide and energy tax. Households also pay VAT.
How much the tax has influenced emissions in various sectors varies withits level.
In the district heating sector, where carbon dioxide tax has been applied to
the full extent, the use of fossil fuels has fallen heavily. At the same time, theuse of biofuels in this sector has increased to a corresponding degree. This
The following brief account concentrates on the effects on emissions. A final table reports a summarising assessment of the effects on other socialobjectives as well as cost-effectiveness.
6.2.1 Intersectoral policy instruments
Energy and carbon dioxide taxes Energy and carbon dioxide taxes are important policy instruments in Sweden.Carbon dioxide tax has direct controlling effects by making fossil fuels rela-tively expensive compared to other types of energy. Energy taxes make the useof energy more expensive, and so the tax can suppress use.
Carbon dioxide tax was introduced in 1991 and has increased from SEK 0.25/kg
carbon dioxide to SEK 0.91/kg in 2004. Manufacturing industry, agriculture,forestry and aquiculture pay a lower rate than the general level. In 1991, the tax rate
for industry was SEK 0.10/g and in 2004 was SEK 0.19/kg. There are also special
regulations for reductions in the tax for energy-intensive industry. From 2004, fuels
used in combined heating and power plants have also had reduced tax.
Energy tax varies between different fuels. The manufacturing industry, and fuels for
production in heating and power plants, pay no energy tax. Fuels used in the pro-
duction of electricity are exempt from both energy and carbon dioxide tax. Biofuels
are also exempt from energy tax.

8/14/2019 Swedish Climate Strategy
http://slidepdf.com/reader/full/swedish-climate-strategy 76/140
74
In the domestic and commercial premises sector, oil use has fallen heavily since the 1970s. Oil crises, increased energy prices, investment programmes
and not least taxation have all influenced the transition from oil to otherenergy carriers. The shift in heating has largely been to electricity and districtheating.
development, which is favourable from a climate viewpoint, can largely beascribed to the tax regulations. Investment support, and the environmentalprofiling of the various companies (often municipally-owned) are also con-tributing factors.
T W h
0
10
20
30
40
50
60
Heat pumpsElectrical boilersCoal
Natural gasOilBiofuels, peat, waste
2 0 0 2
2 0 0 1
2 0 0 0
1 9 9 9
1 9 9 8
1 9 9 7
1 9 9 6
1 9 9 5
1 9 9 4
1 9 9 3
1 9 9 2
1 9 9 1
1 9 9 0
1 9 8 9
1 9 8 8
1 9 8 7
1 9 8 6
1 9 8 5
1 9 8 4
1 9 8 3
1 9 8 2
1 9 8 1
1 9 8 0
Figure 17: Energy supplied in district heating 1980–2002
Source: Energy in Sweden 2003

8/14/2019 Swedish Climate Strategy
http://slidepdf.com/reader/full/swedish-climate-strategy 77/140
Calculations in the checkpoint 2004 work confirm that carbon dioxide taxinfluences emissions15). With today ’s carbon dioxide tax rate, emissions arecalculated as approx. 3 million tonnes lower in 2009 and approx. 5 milliontonnes lower in 2016 and 2023 compared to a situation in which the tax hasbeen abolished. See figure below.
75
15) The model calculation can be described as a future-oriented evaluation. Meaning that it shows differ-
ences between different tax levels for developments from 1995 and towards 2009 and 2016.
T W h
2 0 0 2
2 0 0 1
2 0 0 0
1 9 9 9
1 9 9 8
1 9 9 7
1 9 9 6
1 9 9 5
1 9 9 4
1 9 9 3
1 9 9 2
1 9 9 1
1 9 9 0
1 9 8 9
1 9 8 8
1 9 8 7
1 9 8 6
1 9 8 5
1 9 8 4
1 9 8 3
0
20
40
60
80
100
120
District heatingElectrical heating
GasOilBiofuels
m i l l i o n t o n n e s C O 2
35
40
45
50
55
60
65
70
7580
No CO2 tax 2004 CO2 tax levelmillion tonnes CO2
2023201620092002
Figure 18: Total heating in the domestic and commercial premises sectors, corrected for
normal year, 1983–2002
Source: Energy in Sweden 2003
Figure 19: Carbon dioxide emissions with (at 2004 levels) and without carbon dioxide tax.
Source: Calculations with MARKAL (Nordic) Profu

8/14/2019 Swedish Climate Strategy
http://slidepdf.com/reader/full/swedish-climate-strategy 78/140
The model calculation above did not include the transport sector. Separatecalculations were made to assess the effect of the increases in motor fuel taxfrom 1990 to today. The tax increases were mainly implemented at the begin-ning of the decade. The result shows that carbon dioxide emissions for 2002are expected to be between 0.7 and 1.4 million tonnes lower as a result of the
implemented tax increases. The interval is dependent on what price elasticity has been used (i.e. how much a price increase is assumed to influence demandfor petrol).16)
The Environmental Code Since 1 January 1999, all overarching legislation in the environmental fieldhas been collected in the Environmental Code. The Environmental Codecontains, among other things, a number of principles of due caution for allcommercial activity, including the use of best possible technology, and that allthose running a commercial activity or taking action are to make efficient useof resources and energy, and utilise the potential for recycling and reuse.
Renewable energy sources are to be used in the first hand. The due cautionrequirement does not apply to an extent that its fulfilment can be deemedunreasonable. Large environmentally hazardous activities require a permit.Consideration under the Environmental Code covers the issues of allowabili-ty and permits and what conditions are to apply to the activity. Greenhousegas emissions are part of the consideration.
Consideration under the Environmental Code has not been widely usedand its full potential to reduce greenhouse gases emissions is therefore uncer-tain. No conditions for greenhouse gas emissions have yet been applied underthe Environmental Code according to our information. The orientation hasinstead been to set requirements for energy efficiency and the switch of fossil
fuels to renewable ones. Requirements have also been set concerning efficienttransports.
There is also great uncertainty about whether parts of the EnvironmentalCode may become inapplicable for plants covered by the EU ETS (from2005). Under the trading directive, it is to be impossible to prescribe emission
limits for carbon dioxide for plants covered by the trading directive. It is alsopossible that the government may propose further changes, among these
76
16) The effects of new CO2
taxes in 2005 and effects on road traffic 2010 and 2020, memorandum of
25 March 2004, SIKA.

8/14/2019 Swedish Climate Strategy
http://slidepdf.com/reader/full/swedish-climate-strategy 79/140
being that it is not to be possible to set requirements for the first-hand use of renewable energy, thereby limiting the use of fossil fuels, and to makedemands concerning the energy efficiency of incinerator plants. Such a pro-posal was submitted by the “FlexMex 2” Commission of Inquiry in the springof 2004.
Local investment programmes LIP/KlimpLIP (Local Investment Programmes for ecologically sustainable development) were launched in 1996. The programmes began in 1998 and the last LIP grants were decided in 2002. A total of SEK 6.2 billion have been granted to 211investment programmes in 162 municipalities. The purpose of LIP was bothimproved environment and increased employment. A relatively large propor-tion of the grants have gone to measures with a climate orientation. The effectsof the local investment programmes include their having resulted in an estimat-ed reduction in carbon dioxide emissions of approx. 1.5 million tonnes per year.One uncertainty in the context is however that not all projects have submitted
their final reports. It is also difficult to assess the extent to which the projects would have been implemented even without grants, even if at a later date. Theevaluation carried out of the district heating and waste heating projects in LIPhowever indicates that only a small part of these projects would have beencarried out without the grants.
Starting from the year 2002, support has been given to local climate invest-ment programmes (Klimp). There are more stringent accounting requirementsin Klimp than in LIP, which allows the effects of the programme to be estimat-ed with a greater degree of accuracy. According to our calculations, Klimp isexpected to lead to about 0.4 tonnes lower emissions per year, if the results of the first decision rounds are extrapolated to the rest of the funds. The pro-
gramme can however lead to somewhat greater reduction in emissions if costeffectiveness is further stressed in future decision rounds. Support must not begiven however to measures that are profitable without grants. In both LIP andKlimp, energy measures have on average led to greater reductions in emissionsper SEK granted than have grants to other types of measures. The work of sub-
mitting applications has also strengthened the environmental work of themunicipal organisation and reinforces knowledge of potential local climatemeasures and their efficiency. The projects that have been given funds are “goodexamples” that provide ideas and inspiration to other municipalities.
77

8/14/2019 Swedish Climate Strategy
http://slidepdf.com/reader/full/swedish-climate-strategy 80/140
Climate information campaignThe Riksdag decided in 2002 that 30 million SEK per year for the2002–2004 period would be earmarked for a national climate informationcampaign. Climate information work would take place at national and locallevel. The final step, i.e. the local activities, was however smaller in scope than
planned since funding was withdrawn in the final year.Information measures are important given the background of the long-
term perspective that characterises climate policy decisions and measures.Information is however in many respects a poor policy instrument which, if itis to be effective, works best in combination with other policy instruments. Achieving a positive attitude to measures using information is no guarantee of changed behaviour, but it can increase understanding for more vigorouspolicy instruments.
Nor was the point of the climate information campaign to achieve direct reductions in emissions. Instead, the goal of the climate information cam-paign was to
• increase knowledge among the general public and the business community about the causes and impact of the greenhouse effect
• increase knowledge about the effects of individual action in reducing green-house gas emissions
• increase understanding concerning the adjustments in society that will benecessary in the long term to secure sustainable development
The result of the campaign was monitored by interviews before and after- wards. The results of the interviews show that the attitudes and knowledge of the Swedish population altered during the year in which the campaign wasunder way. According to the study, the campaign has for example contributedto greater knowledge about the climate issue.
Implementing the EU emissions trading scheme The EU’s scheme for trading in emissions allowances will commence on1 January 2005. This means that plants within energy-intensive industry andplants that produce energy will be covered by a joint EU policy instrument.
This also means that national climate policy will be conducted in a new situa-tion. See the next chapter about the consequences of the EU trading schemefor a more detailed description.
78

8/14/2019 Swedish Climate Strategy
http://slidepdf.com/reader/full/swedish-climate-strategy 81/140
79
6.2.2 The energy area
Policy instruments for greater energy efficiency and reduced energy use There currently exist, or are discussions about, policy instruments for greaterenergy efficiency in a number of areas, not least within the EU. Shifting ener-
gy use towards greater energy efficiency largely involves taxes and the forth-coming system for emissions allowances trading. Both of these have the effectof suppressing energy use since they affect the price for the final consumer.
The most recent energy policy decision from 2002 includes continuedfunding of information and training as well as labelling, testing and certifica-tion. The aim is to influence developments towards more energy efficientproducts and systems. This includes municipal energy advisory servicesdirected towards consumers to facilitate the choice of cost-effective environ-ment-friendly technology and support for the public procurement of technol-
ogy, with the intention of facilitating the market introduction of energy effi-cient technology.No quantitative estimate of how much each policy instrument has con-
tributed to reduced emissions has been able to be made. As we mentionedearlier in the section about the climate information campaign, it is difficult topoint to any actual reductions in emissions as a consequence of informationand training measures. These however support other policy instruments andincrease public knowledge of energy efficient solutions and can in the longterm lead to actual measures. A general problem is also knowing what would
have happened in the absence of the policy instrument. The greatest effect isprobably the long-term influence on the behaviour of consumers and business-es, leading them to more energy efficient investment decisions.
Starting from 2004, the measures will be reinforced by a programme for greater energy efficiency in energy-intensive industry (PFE). The programme will primarily cover energy intensive trade and industry covered by the new minimum tax on electricity 17). In other words, more efficient use of electricity will be the primary focus. In the forthcoming programme, companies willundertake to introduce energy management systems and implement energy analysis on an ongoing basis, and carry out certain measures to increase ener-gy efficiency 18). It is very difficult to assess in advance what effect the pro-
17) Under the directive, the minimum tax is to have been introduced no later than 1 January 2006.
Sweden has however chosen to introduce the minimum tax on electricity from 1 July 2004.
18) Measures that pay for themselves in 4 years must be implemented if the tax reduction is to be granted.

8/14/2019 Swedish Climate Strategy
http://slidepdf.com/reader/full/swedish-climate-strategy 82/140
gramme can be expected to have, among other things because the programme will not contain any quantitative targets. In combination with the EU ETS,the requirement for the introduction of energy management systems may bean effective tool to bring about greater energy efficiency.
Energy efficiency in buildings is partly controlled by the requirements of
the National Board of Building (Building Regulations and General Recommendations ). This is an important area since the requirements of today will affect the energy efficiency of buildings for a very long time, more than100 years into the future. The effect is difficult to assess from a climate view-point. More stringent requirements will have great importance in the longterm but have small effects in a short-term perspective, to 2010 for example.Follow-up of current regulations shows that energy consumption in new buildings is 20% higher than the requirements. The National Board of Building is currently considering making the building regulations morestringent.
In spite of the fact that the energy policy decision in 2002 changed direc-
tion by shifting away from grants and subsidies, some investment support has just been introduced. Tax reductions for investments in energy-efficient win-dows and biofuelled heating systems were introduced in 2004. A special taxdeduction for building work to make public buildings more energy efficienthas also been announced.
Several initiatives are under way in the EU regarding the more efficientuse of energy. A directive on the energy performance of buildings came intoforce in 2003. The government has appointed a special Commission of Inquiry with the task of submitting proposals for how the directive is to beimplemented in Sweden. The directives on ecodesign of energy-consumingproducts and efficient final use of energy and energy services (the energy
services directive) are currently being negotiated. All of these directives havethe potential of making a contribution to the long-term climate target.
The electricity certificate systemFrom the early 1990s until the present, several different systems have been
used to support electricity production from renewable energy sources. Thesehave included investment support for electricity production from biomass, wind power and hydroelectric power, and an environmental bonus for elec-tricity produced using wind power. An evaluation of these types of support isdescribed in the report “Evaluation of the Policy Instruments of the Climate
80

8/14/2019 Swedish Climate Strategy
http://slidepdf.com/reader/full/swedish-climate-strategy 83/140

8/14/2019 Swedish Climate Strategy
http://slidepdf.com/reader/full/swedish-climate-strategy 84/140
82
2010. Furthermore, the tax exemption is not expected to have any effects onemployment, Swedish agriculture or industrial competitiveness, since theincreased demand for ethanol is expected to be met primarily throughimport. The results of the evaluation also point to full tax exemption amount-ing to over-subsidisation by about SEK 2/litre of replaced petrol volume for
the import of tropical ethanol. General exemption from carbon dioxide taxand reduction of energy tax by half would probably be enough to achieve 5%mixing in all petrol. This would reduce the loss of tax revenues by SEK 350million to 2005; otherwise, it will be approximately SEK 1 billion.
Questions touching on policy instruments for the introduction of biofuelsand other renewable vehicle fuels are currently under consideration by theCommission of Inquiry studying renewable vehicle fuels, M2003:02, which will present its findings on 30/12 2004.
The automotive industry’s voluntary commitment to reduce carbon dioxide emissions from new cars In 1996, the EU environment ministers adopted a strategy to reduce emis-sions from passenger cars by an average of 25% by 2010 at the latest. Thebasis of the strategy is a voluntary agreement, in the first hand with theEuropean automotive industry organisation. Similar agreements have alsobeen concluded with the Japanese and Korean automotive industry organisa-tions. The commitment in the agreement applies to the 1995–2008 period.Requirements for fuel economy labelling for new cars and the use of financialpolicy instruments are also mentioned in the EU strategy. The commitment isan average for the whole of the EU market, and does not have to be fulfilledin each individual member state.
In Sweden, specific CO2
emissions of new cars have on average fallen by
11% from 1995 to 2002. This is in line with developments in the rest of theEU. A faster reduction is required for the rest of the period in order to reachthe 2008 target. Developments have slowed in the past few years, so it appearsthat it will be difficult to achieve the commitment in the Swedish market.There has been a sharp increase in the weight and engine power of new cars
over the past few years in the Swedish market. New diesel cars in particularhave become heavier and more powerful.
Our assessment is that the automotive industry ’s target of a 25% reduc-tion by 2008 will not be achieved in Sweden. By 2008, emissions per kmdriven are instead expected to fall by 20% compared to 1995. Developments

8/14/2019 Swedish Climate Strategy
http://slidepdf.com/reader/full/swedish-climate-strategy 85/140
83
are primarily influenced by trends in household income. There is nothing toindicate that the voluntary commitment in itself has resulted in a trend shift with respect to the fuel efficiency of new cars. Looking at historical develop-ments, specific fuel consumption in various vehicle segments has improved atabout the same average rate as during the period in which the commitment
began to apply.
Tax regulations for company cars About 25% of new car sales are company cars. They are on average heavierand have higher fuel consumption than the rest of the vehicle pool. Currentcompany car benefit regulations were changed in 1997 and 2002. The changein regulations in 1997 was to make those with company car benefit pay forthe fuel used in private driving. This target has only been met to 50%. Theevaluation of the change in regulations shows, however, that the decision totax the free fuel has had a significant effect in the form of fewer kilometresdriven. As a result of this change in regulations, carbon dioxide emissions are
expected to fall by 0.2 million tonnes per year. Company car benefit tax wasreduced for environmentally-friendly cars in 2002. The effect of this changein the regulations has not been able to be distinguished from other factorsinfluencing the increase in environmentally-friendly cars. Sales of environ-mentally-friendly cars increased from 3,500 cars in 2002 to 6,000 cars in2003. Most of these cars are company cars.
Carbon dioxide tax
Reduces the use of fossil fuels andthereby carbon dioxide emissions.The effect varies with sector.The current tax level has broughtabout a great fall in carbon dioxideemissions from heating.
A cost-effective instrument since itallows various actors to choose themost cost-effective adaptations.On account of conflicting objec-tives, the tax is differentiatedbetween sectors, which reduces
cost-effectiveness.
Contributes to energy efficiency,energy saving and increases the pro-portion of renewable energy.Negative effects on the competitive-ness of energy-intensive industry.
cont. >>
Table 6 Summary of conclusions from the evaluation of existing policy instruments.
Environmental Cost-effectiveness/- Effects on other socialimpact macroeconomic effects objectives

8/14/2019 Swedish Climate Strategy
http://slidepdf.com/reader/full/swedish-climate-strategy 86/140
84
Information/education
Hard to measure reductions inemission due to information.Changes in attitudes and intention
to change behaviour that willreduce emissions can be measured.But it is hard to distinguish theeffects of information from otherinstruments.
Hard to measure cost-effectivenessof information (see environmentalimpact). Information is most effec-
tive in combination with otherinstruments. Information can pro-vide knowledge of cost-effectivemeasures that the actors do nothave.
Trade in emissionsallowances
Effects on the total carbon dioxideemissions of the trading sectordepend on the total amount of emissions allowances allocated.
The more sectors included, themore cost-effective. Different allo-cation principles in different coun-tries (within the EU directive’scriteria framework) for allocationof emissions allowances reduceseffectiveness.
Depends on the price establishedin the EU market. Is expected toraise electricity prices, which canreduce the competitiveness of energy-intensive industry. Becauseof the costs of reducing emissionsfor the individual actor, a largerproportion of the necessary emis-sion reductions may take place inother regions. Relatively low pricesare expected to increase fossil fueluse in Sweden.
The Environmental Code
Hard to say. The cost-effectiveness of theEnvironmental Code from a cli-mate viewpoint is hard to evaluate,since few permits have been issuedin which climate or energy aspectshave been raised.
Hard to say.
Klimp/LIP
LIP is estimated to lead to 1.5 mil-lion tonnes lower emissions inthe 2008–2012 period. Early esti-mates of the total effects of Klimpgrants (total allocated 1040 mil-lion) are 0.4 million tonnes lowerannual emissions of carbon dioxideequivalents.
Grant systems lack the basicpotential to be as cost-effective ase.g. taxes. Energy-efficiency andenergy adaptation measures aremost cost-effective in LIP.
Many of the measures haveinvolved the energy sector, which has led to increased use of biofuels. Some positive effects onemployment.
Project-basedmechanisms
See Chapter 8.
Environmental Cost-effectiveness/- Effects on other socialimpact macroeconomic effects objectives

8/14/2019 Swedish Climate Strategy
http://slidepdf.com/reader/full/swedish-climate-strategy 87/140
85
Electricity certificatesystem
Reduces carbon dioxide emissionsbut the amount depends onassumptions of what renewableenergy is replacing.
In the short term, not a cost-effec-tive instrument since cheapermeasures are available within theEU emissions trading scheme. Inthe long term, renewable electrici-ty production is required forclimate and energy policy reasonsthat justify support in the form of electricity certificate systems.
Industrial competitiveness benefitsfrom the electricity certificate sys-tem. Suppresses long-term systemprice of electricity. Increasesdomestic electricity production with renewable energy sources.Leads to increased security of supply. Guarantees income to thegovernment through VAT andquota obligation charge.
PFE (long termvoluntary agreements)
Reduced electricity use reducescarbon dioxide emissions fromelectricity supply in the Nordicenergy system. Effects of PFE onelectricity use are difficult toestimate.
Energy surveying and energy analysis can identify measures thatare profitable for the company overand above its undertaking. Cost-effectiveness is reduced by the pro-gramme’s covering a specific sectorand also measures in a special field.
Minimises negative effects ongrowth and competitiveness sinceit is voluntary. Loss of governmentrevenue from energy taxes of amaximum of SEK 200 million peryear. Large industries that already have energy management systemsare at a greater advantage thansmaller companies. Interacts withemissions trading. Energy survey-ing gives a basis for cost-effectivemeasures to reduce use of elec-tricity and fossil fuels. TheEnvironmental Code’s require-ment for energy efficiency coin-cides with the purpose of PFE.Necessary to ensure that theundertakings in PFE are additional
to the environmental conditions.
Environmental Cost-effectiveness/- Effects on other socialimpact macroeconomic effects objectives
Tax-exemptionalternative fuels
About 0.6 million tonnes less CO2
emissions globally to 2010.Domestic ethanol production can-not compete with import. Mostcost-effective (0.4 SEK/kg CO
2)
using tropical ethanol.
Does not provide employment inSweden. Does not change energy supply situation. Tax exemption isexpected to oversubsidise low-levelmixtures in petrol by 500–600million SEK/year from 2004.
Automotive industry’svoluntary commitment to
reduce CO2 emissions innew cars to 2008
Does not seem to have led toincreased fuel-efficiency for new cars more than normal technicaldevelopment would. The commit-ment of 25% reduction within theEU is not expected to be met inSweden.
Voluntary commitment which hasnot led to significant effects, so nosignificant consequences can beexpected.

8/14/2019 Swedish Climate Strategy
http://slidepdf.com/reader/full/swedish-climate-strategy 88/140
86
6.2.4 Overall effect on emissions in the energy sector
We have carried out model calculations to see how the overall financial policy instruments of today affect the energy system compared to the correspondingfinancial instruments used in 1990. The results of the model calculation, seeFigures below, show lower carbon dioxide emissions in Sweden with today ’spolicy instruments compared to those of 1990 throughout the periodanalysed.
To obtain the whole picture, we also show the effects of the change in pol-icy instruments in Sweden from a Nordic perspective. Since electricity importis estimated to be significantly higher using 1990 instruments, the differencebetween the financial instruments of today and those of 1990 is estimated tobe greater when the Nordic perspective is included. In the calculations, it isassumed that coal condensation is at the margin of the Nordic electricity pro-duction system. In the 1990 policy instruments, the absence of emissionstrading and the electricity certificate system mean that other, cheaper, Nordicelectricity production is retained, at the same time as there is limited access tocost-effective domestic alternatives. So, we can say that emissions take placeoutside Sweden to a greater extent with the 1990 policy instruments.
m i l l i o n t o n n e s
C O 2
35
40
45
50
55
6065
70
75
80
1990 instrumentsCurrent instruments
2023201620092002
Figure 20: Carbon dioxide emissions for Sweden, national effects.
Source: Calculations with MARKAL (Nordic) Profu

8/14/2019 Swedish Climate Strategy
http://slidepdf.com/reader/full/swedish-climate-strategy 89/140
87
The interplay of policy instruments Most policy instruments interact directly or indirectly with a large number of other policy instruments. The interplay is striking in some cases, due to theparallel application of several policy instruments to achieve the same objec-tives. The report “Evaluation of Policy Instruments in Climate Policy ” makesa quantitative review of the interplay of the policy instruments. One example
of results is that the emissions trading scheme and the electricity certificatessystem are expected to affect each other’s price. A higher market price foremissions allowances tends to lead to lower prices for electricity certificates.The introduction of trade in emissions allowances leads to an increase in thecompetitiveness of renewable fuels which in turn leads to a reduction in theextra costs for producing electricity from renewable energy sources.
m i l l i o n t o n n e s C O 2
35
40
45
50
5560
65
70
75
80
1990 instrumentsCurrent instruments
2023201620092002
Figure 21: Carbon dioxide emissions for Sweden, Nordic effects.
Note: For import, coal condensation is assumed to be at the margin.Source: Calculations with MARKAL (Nordic) Profu

8/14/2019 Swedish Climate Strategy
http://slidepdf.com/reader/full/swedish-climate-strategy 90/140
88
“The EU trading scheme means that a
collective emissions cap is set at EU level.”

8/14/2019 Swedish Climate Strategy
http://slidepdf.com/reader/full/swedish-climate-strategy 91/140
89
7 Consequences of the EU Emissions
Trading Scheme
To meet the EU’s Kyoto commitment, the EU has produced a climate pro-gramme (European Climate Change Programme). The programme containsseveral parts of which the most important is a joint trading scheme for emis-sions, EU ETS.
7.1 Description of the system
The EU trading scheme starts in 2005 and from the start covers large areas of energy-intensive industry and combined heating and power plants (electricity
and heating production). The system is currently under construction in theindividual member states and at joint EU level. The first trading period isbetween 2005 and 2007 and is an introductory phase prior to the 2008–2012
period which is within the framework of the Kyoto Protocol’s first commit-ment period. The system will cover all EU member states – 25 countries.
The system involves the setting of an overall cap for permitted emissionsat EU level.Below the cap, companies may trade emissions rights and thismeans that a price will come to be set on emissions. A well-functioning sanc-tions system is to ensure that emissions do not exceed the predetermined cap.
The EU directive for the trading scheme says that at least 95% of theemissions allowances in the introductory period are to be allocated free of charge. For the period starting in 2008, at least 90% is to be allocated free. A smaller volume may thus be allocated after payment, and can for examplebe auctioned off. The directive says nothing about how allocation will take
place for the post–2012 period.The total amount of emissions allowances will be the same as the capcap
for emissions. Within this cap, companies’ actions on the basis of the price of emissions allowances will determine where the emissions will take place/be
reduced.

8/14/2019 Swedish Climate Strategy
http://slidepdf.com/reader/full/swedish-climate-strategy 92/140

8/14/2019 Swedish Climate Strategy
http://slidepdf.com/reader/full/swedish-climate-strategy 93/140
91
7.2 Consequences for Sweden
7.2.1 Emissions
The extent to which companies will be buyers or sellers will depend on the
costs of reducing emissions in the activity involved in relation to the marketprice of emissions allowances. If Swedish companies purchase emissionsallowances, that means that emissions in Sweden will increase. At the sametime, emissions in another EU country will have fallen. The opposite appliesif companies sell emissions allowances.
We do not know at present what price will be established in the market. We have carried out model calculations to analyse the consequences for theenergy system and emissions of carbon dioxide of different emissionsallowances prices. See box below.
The price of emissions allowances falls from 10 to 5 euros per tonne Carbon dioxide emissions will be just over 0.5 million tonnes higher per year in
Sweden
The price of emissions allowances climbs from 10 to 25 euros per tonne Carbon dioxide emissions will be just over 2 million tonnes lower per year in
Sweden
The difference in the results of the model calculations results from more or less use
of fossil fuels/biofuels for power and heating production. The higher emission price
also gives more wind power in the long term according to the model.
Other assumptions in accordance with our baseline forecast, see section 6.2

8/14/2019 Swedish Climate Strategy
http://slidepdf.com/reader/full/swedish-climate-strategy 94/140
92
In our prognosis, emissions in the trading sector increase by 25% from 1990to 2010. If this increase in emissions is related to the framework that now applies to the government’s plan for the allocation of emissions allowances, itindicates that Swedish plants (the companies that own them) will be net
purchasers of emissions allowances.
7.2.2 Electricity prices
The cost of electricity production based on fossil fuels will climb when thetrading scheme starts. How much that affects the market price of electricity isdependent on the price of emissions allowances and what type of productionis in the margin at different times of year. Various model calculations show increases in the price of electricity in the interval SEK 0.1–0.8 per kWh. Thehighest price corresponds to a situation where coal-based electricity produc-
tion is in the margin and has a price-setting effect all year round.
For all Nordic countries, the model result is as follows:
K i l o t o n n e s C O
2 / y r
0
20 000
40 000
60 000
80 000
100 000
120 000
SwedenNorway FinlandDenmark
25 €/ton CO210 €/ton CO25 €/ton CO2
Figure 23. Carbon dioxide emissions from industry and electricity and heating productionas a function of the price of emissions allowances in 2009 in four Nordic countries.
Source: MARKAL-calculations, Profu.

8/14/2019 Swedish Climate Strategy
http://slidepdf.com/reader/full/swedish-climate-strategy 95/140
93
7.2.3 Economic growth
The introduction of a scheme for emissions trading will bring about increasedgrowth in some sectors and lower growth in others. The diagram below showshow the 17 sectors included in the EMEC model of the Swedish Institute of Economic Research are affected by the different assumed cost levels for emis-
sions of carbon dioxide. The variations in cost are dependent on variousprices for emissions allowances but also on whether carbon dioxide tax isretained.
In our calculations, we assume that the average marginal production con-trols the average price over a year. A price for emissions allowances of 10 euros will then entail an electricity price increase of SEK 0.02 - 0.03 per kWh. Seethe figure below for how the model’s results are affected by the various pricelevels for emissions allowances.
SEK/MWh
Model year150
200
250
300
350
25 euros/tonne5 euros/tonne10 euros/tonne
2023201620092002
Figure 24. System price of electricity in the Swedish price area as a function of time and
the price of emissions allowances.
Note: The results apply on the assumption that nuclear power will be shut down, as in the main
alternative of the baseline forecast. Note that electricity prices show a relatively large increase even if
we assume unchanged emissions allowances prices over time. It is important to remember that trade
in emissions allowances is only one of several parameters affecting the price of electricity.
Source: Calculations with MARKAL (Nordic) Profu

8/14/2019 Swedish Climate Strategy
http://slidepdf.com/reader/full/swedish-climate-strategy 96/140
94
7.2.4 Structuring Sweden’s national target
As described previously, Sweden has a national interim target that differs from
Sweden’s international commitment. That Sweden will participate in the EUETS from 2005 puts the structure of the Swedish climate policy target in anew light. Today, Sweden’s objective is that emissions are to fall by 4% with-out the flexible mechanisms, i.e. in Sweden. Apart from emissions allowancestrading, there are two other flexible mechanisms, known as project-basedmechanisms. The EU ETS links to the project-based mechanisms.
A trading scheme means that you know in advance what the emissionlevel will be for the whole system, but it will be harder to assess what the emis-sion level might be in an individual country and thus what policy instrumentsmust be used to achieve a particular emissions target (that expresses actuallevels within the borders of one country). Furthermore, the Swedish govern-
Figure 25. Changes in the value added in various sectors between the years 2000–2010
with different assumed carbon dioxide tax levels.
Note: Various prices for emission allowances, and with/without current carbon dioxide tax.
Source: Calculations using EMEC, National Institute for Economic Research
0,0 0,5 1,0 1,5 2,0(%)
2,5 3,0 3,5 4,0
25/t CO25/t CO2
25/t CO2 + tax5/t CO2 + tax10/t CO2
Total trade and industry Domestic and com. property
Trade and other servicesCommunications
Construction industry Petroleum refineries
Water/sewage worksGasworks
Electrical/heating plantsOther manufacture
Engineering industry Iron, steel and metalworks
Chemicals industry Pulp, paper, graphic
Mines and mineral quarriesForestry Fishing
Agriculture

8/14/2019 Swedish Climate Strategy
http://slidepdf.com/reader/full/swedish-climate-strategy 97/140
95
What both policy instrument strategies have in common in a national emis-sions target is that they make relatively large demands on rapid follow-up andcontrol of emission trends in both sectors in order for the interim target to beachieved.
With an offset target, there is less need of follow-up and control of actual
emissions in the trading sector. When allocated emissions allowances havebeen deducted, it does not matter what size the emissions are. It is enoughthat each tonne of emissions corresponds to an emission right. The allocatedvolume then also determines the size of the scope for emissions occurring inthe non-trading sector. A decisive factor in the ability to meet the target is
ment cannot by itself influence the design of the system, which is a result of negotiations between the countries within the system.
We have analysed two different target structures for a situation in whichSweden has both an international commitment and a national interim target.One is the target structure of today, the “national emissions target”, and the
other is a definition in which purchased emissions allowances are offsetagainst emission increases in Sweden, the “national offset target”.
Different policy instrument strategies have been produced for the two dif-ferent target designs. The strategies mean that the national policy instrumentsare either directed towards the non-trading sector alone, or are directedtowards all sectors.
Trading sectors Covers from 2005 the emission of carbon dioxide from power and heating plants,
oil refineries, plants that produce and process iron, steel, glass and fibreglass,
cement and ceramics, and plants that produce paper and pulp. More gases and
more sectors may be covered by the system after 2008.
Non-trading sectors
Covers other emissions of greenhouse gases (methane, nitrous oxide and the three
industrial gases HFC, PFC and SF6). Also covers emissions of carbon dioxide from
small-scale burning in the domestic sector, the transport sector and other commer-
cial sectors.

8/14/2019 Swedish Climate Strategy
http://slidepdf.com/reader/full/swedish-climate-strategy 98/140
96
therefore what size the allocation will be, and so how big the requirement willbe for emission reductions in the non-trading sector.
Supplementary instruments can be used in the trading sector, but will nothowever make achievement of target easier in the structure using an offset tar-get, and it will reduce cost-effectiveness in the system as a whole. On the
other hand, there may be other reasons for not allowing emissions trading tobe the only policy instrument in the trading sector, such as other social objec-tives in e.g. in energy policy or long-term objectives in the field of climatepolicy.
The target structures have been analysed from various viewpoints. Onestarting point has been the reasons given in Sweden’s current climate strategy for having a target that differs from our international commitment. Below aresome brief remarks on these.
1. Climate impact and cost-effectiveness. If we “buy ” emissions allowances, emis-sions will not fall in Sweden, but may in other places. There is instead a possi-
bility that total emissions will fall more using the same financial input if theflexible mechanisms are used, since cost-effectiveness will be greater.
2. Sweden as a good example in international climate policy. Sweden’s potential toappear as a good example need not be less because flexible mechanisms areincluded in the climate objective. On the contrary, Sweden’s credibility canincrease if the flexible mechanisms are used, not least that of emissions trading,at the same time as Sweden acts to secure and develop their environmentally controlling effect.
3. Rigid structures. With respect to the potential for influencing rigid structures
and promoting development and distribution of new technology, our view – which is supported by international research – is that an environmental target(emission target) is not in itself enough to lead to the desired effect (in terms of innovation), but that it must be combined with directed policy instruments. What policy instrument(s) is most suitable depends on what technology one
wishes to develop. So, an offset target does not put obstacles in the path of influencing rigid structures and promoting technology development.

8/14/2019 Swedish Climate Strategy
http://slidepdf.com/reader/full/swedish-climate-strategy 99/140
97
4. Links to other policy areas. One link is other environmental targets, such asemissions of other pollutants than CO
2. One of the most important problem
sectors for other environmental quality targets, the transport sector, will initial-ly be outside the trading sector. Control of emissions therefore takes place out-side the trading scheme, regardless of what target structure is used. We do not
know today what sectors will be covered by the emissions trading scheme inthe future. In order to obtain an overview of how other emissions are affected, we must take into account that those measures that take place within theframework of the trading scheme in other countries near ours might have posi-tive effects on the emission of e.g. nitrogen oxides and sulphur. The energy policy objective of promoting bioenergy can be furthered by the use of supple-mentary policy instruments in the whole or parts of the trading sector shouldit appear that emissions trading is unfavourable to bioenergy.
5. Practical feasibility. Last but not least, an offset target is much simpler tohandle in practice as soon as emissions trading has begun. The EU trading
scheme makes it harder to assess emissions development in those sectors cov-ered by the system, since the price of emissions allowances is uncertain. As aresult, it is harder to assess what scope of policy instruments is necessary toachieve a national emissions target.
Against the background of our analysis, we have found that the targetstructure that involves the deduction of allocated emissions allowances fromthe emissions cap, i.e. the offset target, has many advantages over that of a sim-ple emissions target. The target structure is illustrated in the figure below.

8/14/2019 Swedish Climate Strategy
http://slidepdf.com/reader/full/swedish-climate-strategy 100/140
We repeat two important consequences of the selected target structure.• How many policy instruments are required in the non-trading sector is
dependent on how large the allocation of emissions allowances is to thetrading sector.
• Using supplementary policy instruments in the trading sector does notaffect the fulfilment of the climate target in the 2008–2012 period. If supplementary policy instruments are used, then it should be for other
reasons.
It is also important to emphasise that the target structure applies in a relative-ly short-term perspective and that it is at present difficult to know what struc-ture is suitable in the medium term. One uncertain factor is how internation-al climate work will develop. What happens after the first commitment peri-od of the Kyoto Protocol? This affects Sweden’s climate work, and what targetstructures and ambition level should be set in Sweden. The future design of the trading scheme is also important in this respect.
There is still great uncertainty in Sweden concerning the forthcoming
agreement on nuclear power. Within the framework of the chosen targetstructure above, early closure with possible resulting increasing emissions inSweden would not affect the ability to achieve the target for the 2008–2012period if such closure takes place after the allocation decision has been made.On the other hand, it affects to some extent the costs of reaching the target
98
“High” allocation “Low ” allocation
Emissions are to be below a particular level
Emissions target for thenon-trading sector
Permitted emissions in the non-trading sector will vary depending on the allocation given to the
trader.
Allocated quantity

8/14/2019 Swedish Climate Strategy
http://slidepdf.com/reader/full/swedish-climate-strategy 101/140
99
level (cap for emissions) in the EU trading scheme. In other words – there willbe more emissions that are to be covered with a given amount of emissionsallowances.
7.3 The future development of the EU ETS
The EU ETS that starts in 2005 has the potential to become a powerful poli-cy instrument. It leads to definite effects on emissions at the same time asemission reductions take place in a cost-effective way. It also has the advan-tage that it includes a large number of countries. For the system to lead toreduced emissions however, it is important that the total allocation takes placeso that there is a scarcity of rights within the framework of the system. Animportant part of Swedish climate work is therefore to participate actively inthe forthcoming evaluation of the system that starts in 2005 and that is to bereported by the European Commission in 2006/07. Sweden needs for exam-ple to have analyses made of whether more sectors and gases can be coveredby the system. Since the trading scheme also includes energy-intensive indus-
try which in a number of cases is active in an international market, it is also of great importance if the system in the future can include countries outside theEU. Other important issues are that the allocation criteria are such that ascarcity of emissions allowances is allocated and that the principles for how countries allocate emissions allowances to new plants are the same, and thatemissions allowances are not allocated free of charge to new plants. Swedenalso needs to work to ensure that emissions allowances in the long term (after2012) are not allocated free, but that companies instead pay via an auctionsystem.

8/14/2019 Swedish Climate Strategy
http://slidepdf.com/reader/full/swedish-climate-strategy 102/140
100
“Sweden has a long tradition when it comes to
international co-operation on climate issues”
8/14/2019 Swedish Climate Strategy
http://slidepdf.com/reader/full/swedish-climate-strategy 103/140
101
8 How Can Sweden Use the Other
Flexible Mechanisms?
Apart from the EU ETS, it is possible to use the project-based mechanisms (seefact box). Sweden has a long tradition of international climate co-operation inthe energy field. In the years 1992–94, a total of SEK 140 million was allocated,mainly intended as grants to the construction of environmentally-adapted ener-gy systems with less climate impact in the Baltic states and eastern Europe. Within the framework of the 1997 energy policy decision, SEK 350 million were allocated for international climate policy measures for the 1997–2004period within the framework of the UN Framework Convention on Climate
Change and the project-based flexible mechanisms of the Kyoto Protocol.International climate work on the basis of energy policy was said to be an impor-tant part of the strategy to reduce the climate impact of the energy sector.
Project-based mechanisms
Joint implementation
Introduced in the Kyoto Protocol. Countries with commitments under the Kyoto
Protocol and that invest in projects in other countries can obtain credits for the
emission reductions that the project gives rise to, emission reduction units, ERUs.
Clean Development Mechanism, CDM
Countries with reduction commitments under the Kyoto Protocol can, by invest-
ing in projects in countries with no commitments under the Protocol, obtain cred-
its for emission reductions, CERs (certified emission reductions). The CDM con-
tributes to sustainable development in accordance with the priorities of the host
country.
cont. >>

8/14/2019 Swedish Climate Strategy
http://slidepdf.com/reader/full/swedish-climate-strategy 104/140
102
The project-based mechanisms, and emissions trading, can contribute tomaking climate measures more cost-effective. The climate impact of nationalmeasures undertaken in Sweden or abroad are the same – it does not matterto the climate where the measure is undertaken. The difference in costs is dueto the fact that countries have varying starting points, for example differentenergy systems, have reached different stages of economic development and
have worked to varying extents with policy instruments to reduce greenhousegas emissions. It is possible to get a rough idea of this if you look at the carbonintensity (here expressed as gramme of carbon in relation to energy supply inMegaJoules [gC/MJ]) in various countries19).
19) Calculations done for the Environmental Advisory Council, 2002
Sweden is currently working as follows with the project-based mechanisms.
• Participant and investor in the World Bank Prototype Carbon Fund.
• Participant in a fund created within the framework of the Baltic Sea Region
Energy Co-operation (BASREC). Testing Ground Facility.SICLIP (Swedish International Climate Investment Programme)
– Intends to conclude agreements for a total of 4 JI projects which lead to the
acquisition of emission rights units. Proposals have come from Estonia, Poland,
Rumania, Russia and Hungary.
– Compile a portfolio of small and medium-sized CDM projects. Of 46 proposals,
a small number of projects have been selected. Agreements have been concluded
for CDM projects in India and one in Brazil and some projects are in the final
stages of negotiation. Discussions are also under way within the framework of a
multilateral investment fund oriented towards small-scale projects in the leastdeveloped countries.
Credits from the project-based mechanisms can also be traded freely in the EU
trading system. From 2008, the member states are able to set a ceiling at plant level
for how much companies may use to meet their obligations under the trading sys-
tem.
World Bank Prototype Carbon Fund
Countries and companies are members. Through the implemented projects, the
members obtain emission reduction units. Another aim is to exchange knowledge of
the project-based mechanisms of the Kyoto Protocol.

8/14/2019 Swedish Climate Strategy
http://slidepdf.com/reader/full/swedish-climate-strategy 105/140
103
Figure 26. Carbon intensity (gramme carbon in relation to total energy supply) for some
industrialised countries.
0
5
10
15
20
25
1960 1970 1980 1990 2000
K o l i n t e n s i t e t g C / M J
USA EU Japan Sverige
0
5
10
15
20
25
1970 1980 1990 2000
K o l i n t e
n s i t e t g C / M J
Indien Kina Brasilien
Figure 27. Carbon intensity in grammes carbon in relation to total energy supply for some
developing countries.
C a r b o n i n t e n s i t y g C / M J
C a r b o n i n t e n s i t y g C / M J
JapanEUUSA Sweden
25
20
15
10
5
0
25
20
15
10
5
0
1960 1970 1980 1990 2000
1970 1980 1990 2000
BrazilIndia China

8/14/2019 Swedish Climate Strategy
http://slidepdf.com/reader/full/swedish-climate-strategy 106/140
104
We have found the following reasons for Sweden to work with the project-based mechanisms.
1. Well-functioning flexible mechanisms are important for continuedinternational co-operation to counteract climate change. They areimportant factors in several countries’ ratification of the Kyoto Protocol
and will be important in more far-reaching international commitmentsafter the first commitment period of the Kyoto Protocol.
2. Emission reductions are achieved at low cost.3. Deeper relationships with the countries in which the projects are imple-
mented.4. Increased environmental awareness in the recipient countries.
The long-term goal is that trade and industry is to shoulder responsibility forapplication of the mechanisms. The EU emissions trading scheme and the link to the project-based mechanisms might be an incentive for businesses to getinvolved, but there are still difficulties. The Kyoto Protocol has still not come
into force and the body of regulation is still being written and methods created.Programmes at national level have an important role as standard bearers andcan bridge the period to a phase in which the market actors regard the risk asacceptable. Among other things, programmes at national level, by initiating andpreparing CDM and JI projects, can contribute to the development of the body of regulation and methods, and to making the process more established andeffective.
The work should be oriented as follows:1. Continued government involvement within the framework of SICLIP
(Swedish International Climate Investment Programme)
2. Capacity-building measures in Swedish trade and industry, primarily inthe trading sector.
Emission reduction units from implemented JI and CDM projects will cometo Sweden in different ways. Sweden already has a government programme
for climate projects and is also a participant in two funds that invest in cli-mate projects. With the funds now earmarked, about SEK 280 million, it isexpected that reduction credits will be earned amounting to about 5 milliontonnes of carbon dioxide equivalents. A small part, about 0.5 million tonnes, will however be delivered after 2012. In total, this is equivalent to 0.9 million

8/14/2019 Swedish Climate Strategy
http://slidepdf.com/reader/full/swedish-climate-strategy 107/140
105
tonnes of carbon dioxide equivalents per year in the 2008–2012 period.These emission reduction units can in the first hand be used as a reserve, butcan also be saved for future commitment periods. The price of the emissioncredits acquired by Sweden is between 5 and 8 dollars per tonne.
Reduction credits from the project-based mechanisms will also come to
Sweden via companies, both those that are participants in the EU emissionstrading scheme and those that are not. Reduction credits can be traded andused freely in the EU emissions trading scheme but from 2008 there will be acap at plant level that states how large a proportion of reduction credits theplant may use to comply with the rules. The level of this cap is to be set in thenational allocation plan.
8.1 Effects of using project-based mechanisms
8.1.1 For Sweden
The project-based mechanisms reduce the cost of measures and the same cli-mate effect can thereby be achieved but at a lower cost. International demandfor climate-efficient technology and climate-efficient services can be expectedto be boosted when the countries are to begin meeting their commitments by reducing greenhouse gas emissions and using the various mechanisms of theKyoto Protocol. The project-based mechanisms can aid the spread of technol-ogy and the commercialisation of new renewable and efficient environmentaltechnology. It can also help Swedish environmental technology to find abroader international market base.
8.1.2 For the host countries
The countries that can be hosts for JI and CDM are different from each other.Possible hosts for JI projects are countries with quantitative commitments,above all the transition economies of eastern Europe. Hosts for CDM projectsare countries that do not have quantitative emission commitments under theKyoto Protocol, primarily developing countries. CDM projects are to bring
about reduced greenhouse gas emissions but also contribute to sustainabledevelopment in the host country, and each project requires the consent of thehost country.
Through the Climate Convention and the Kyoto Protocol, the industri-alised countries have undertaken to be in the forefront, to support sustainable

8/14/2019 Swedish Climate Strategy
http://slidepdf.com/reader/full/swedish-climate-strategy 108/140
106
development, and assist developing countries to reduce the negative effects of climate change. Against this background, the CDM is an important instrumentsince it can contribute to knowledge and technology transfer to developingcountries. This is particularly important since the energy system in developingcountries is under construction and investments made today will have conse-
quences for several decades. The introduction of energy solutions that containrenewable energy is of great importance. The potential of renewable energy, andenergy efficiency, is often disregarded in developing countries and the CDMmeans that knowledge of the potential and the environmental benefits of renewable energy can be spread to those developing countries that will be thehosts of CDM projects. Experience from JI projects in eastern Europe alsoshows that they have had positive impact on the attitude to environmentally-adapted energy supply and energy use in the authorities and companies that were involved in the recipient countries.
For the host countries, the project-based mechanisms can be a means of obtaining foreign investment. It has been said, particularly by developing coun-
tries, that with the CDM they are not passive recipients, but that the CDM canbe an instrument that is used to serve their ambition to build up more environ-mentally-adapted energy systems. Several countries are building up institutionsto deal with the CDM on a large scale and are actively prioritising technology that they judge to be of interest for the country ’s development.
8.1.3 For the climate
Both the Climate Convention and the Kyoto Protocol emphasise cost-effec-tiveness. Using the flexible mechanisms enables the differences in cost betweendifferent countries to be evened out and the cost of meeting the commitmentsto be reduced, and greater reductions in emissions can also be achieved at a
given cost. There may of course be other barriers that result in the actions cho-sen not being the most cost-effective ones. Examples of such barriers are lack of knowledge or administratively complex systems that make implementationdifficult.
Concrete reductions in emissions with the project-based mechanisms Unlike emissions trading between countries, JI and the CDM are used inactual projects to reduce greenhouse gas emissions from various plants andactivities. The projects, and the related reductions in emissions, undergo avery thorough, public examination process that includes verification and

8/14/2019 Swedish Climate Strategy
http://slidepdf.com/reader/full/swedish-climate-strategy 109/140
107
certification to ensure that the emission reductions are actual and are largerthan those that would have occurred if the project had not taken place.
Even if the JI and CDM projects focus on greenhouse gas emissions, pro- jects that have other negative environmental aspects are not permitted. Theprojects undergo a strict review process that also includes an environmental
impact assessment.

8/14/2019 Swedish Climate Strategy
http://slidepdf.com/reader/full/swedish-climate-strategy 110/140

8/14/2019 Swedish Climate Strategy
http://slidepdf.com/reader/full/swedish-climate-strategy 111/140
109
9 What Will Happen to Sweden’s
Emission Reduction Units?
There are different kinds of emissions allowances and reduction credits, anddifferent rules for how they may be saved (see below). As described earlier, theEU has a joint commitment under the Kyoto Protocol and is jointly responsi-ble for meeting this commitment. This may affect how much control Swedenhas over the emissions allowances/reduction credits that Sweden does not useduring the first commitment period.
The Units of the Kyoto Protocol and the EU Trading System
Entitle the holder to emit 1 tonne of carbon dioxide equivalents under a certain defined period.
AAU – Assigned Amount Unit. Allocated to each country under the Kyoto
Protocol at amounts that correspond to the country ’s permitted emissions for the
applying commitment period.
EAU – In the EU trading system, the emission rights are called “Emission
Allowance Units”, and they are converted from the countries’ AAUs.
ERU – Emission Reduction Unit. Emission rights units that are converted from thecountries’ AAUs through projects within the framework of Joint Implementation.
CER – Certified Emission Reduction, emission rights units that are issued by the
board of the CDM after verification of emission reductions from projects. tCER
and ICER are time-limited credits from sink projects within the CDM.
RMU – Removal Units. Created by carbon sinks resulting from land and forestry
measures in countries with reduction commitments.
Rules for saving between the commitment periods of the Kyoto Protocol.
AAUs – can be saved with no restrictions.
EAUs – member states can give companies the right to save EAUs between the
period 2005–2007 and 2008–2012. Most member states have however declared
that they do not intend to allow this.
cont. >>

8/14/2019 Swedish Climate Strategy
http://slidepdf.com/reader/full/swedish-climate-strategy 112/140
110
Sweden has a national target of –4% without flexible mechanisms and sinks,and an international commitment of +4% that includes flexible mechanismsand sinks. The international commitment is legally binding, and if it is notmet sanctions may be expected. If Sweden does not use all the assignedamount units (AAUs) allocated in the Kyoto Protocol, which will be the caseif Sweden meets the national target, then Sweden will have surplus permitted
emissions of about 6 million tonnes of carbon dioxide equivalents per yearunder the Kyoto Protocol. What happens with any surplus that Sweden does
not use is important for the environment but is also an economic issue.If the emission surplus is saved and Sweden makes a larger reduction com-
mitment in the forthcoming commitment period that would otherwise be thecase, an environmental gain is achieved.
If the emission credits are however saved to be used in the forthcomingcommitment period, the environmental impact will be small in a long-termperspective, since emissions are simply being redistributed over time. It may be economically advantageous to save emissions allowances, since emissionsallowances can be assumed to be more expensive in the future.
Another way of dealing with emissions allowances that you do not intendto use is to sell them on the market. If you do that, someone else will usethem, and no positive environmental impact will result. It might instead helpreduce the price of emissions allowances.
ERUs and CERs – A country may save ERUs and CERs corresponding to 2.5% of
the amount of AAUs.
RMUs – may not be saved.
The Linking Directive – supplements the EU’s directive for emission rightstrading.
Companies covered by the EU trading system for emission rights can trade with
ERUs and CERs within the trading system. CERs will work in the system during
the first period between 2005 and 2007, but ERUs will not be available until the
beginning of the first commitment period. From 2008, member states are able to
put a ceiling at plant level for how large a proportion of ERUs and CERs the com-
panies can use to meet their obligations under the trading system.

8/14/2019 Swedish Climate Strategy
http://slidepdf.com/reader/full/swedish-climate-strategy 113/140
111
A surplus of credits may be necessary if the EU(15) is to meet its commit-ment. The credits can then either be traded in the EU or used in other politi-cally agreed ways that we are unable to predict today.
The most important issue for the EU to meet its commitment is that ithas a vigorous climate action plan and that steps are actually taken in good
time. If this is not enough, the EU has a number of other possible ways of dealing with the situation. Assigned amount units (AAUs) can be purchasedon the world market, you can choose to count the sinks that you are in factentitled to count under the Marrakech Accord, and you can use the project-based mechanisms. Of these three possibilities, the project-based mechanismsmay be the most attractive. Project credits are actual reductions and the risk of “hot air” is minimal with the strict regulations.

8/14/2019 Swedish Climate Strategy
http://slidepdf.com/reader/full/swedish-climate-strategy 114/140
112
“Sweden is on the right track in work on climate change, but new measures
are required as there is a great need for emission reductions in the long term.”

8/14/2019 Swedish Climate Strategy
http://slidepdf.com/reader/full/swedish-climate-strategy 115/140
113
10 Need Sweden’s Climate Strategy
be Altered in the Short Term?
The assignment of producing a basis for the evaluation of Sweden’s climatepolicy is mainly focused on the national interim target for the 2008 –2012period. Among other things, an assessment is to be made of the possibility of achieving the national interim target using current policy instruments andmeasures. Proposals for new or extended policy instruments, the conse-quences of which have been assessed, are to be submitted where necessary.The assignment also includes a study of the consequences of integrating theflexible mechanisms into the interim target.
Our proposals for how the Swedish climate strategy could be reinforcedhave their roots in the above assignment, but we also wish to stress the follow-ing important points.
• Solving the climate problem requires a high degree of international collabo-ration. It is, for example, of great importance that the EU countries find joint ways of reducing emissions, thus enabling them to drive global devel-opments forward. In the Swedish national strategy, there should be astronger link to international and joint EU policy instruments.
• The proposals must also have a long-term perspective and not simply be
based on the short-term achievement of targets in Sweden.
10.1 Strategically important measures in
a long-term perspective
There is a risk of attaching too much importance to different ways of meeting
short-term targets. At the same time, it is important to pay attention tochanges that are important in achieving long-term targets. We have identifiedsome strategic areas that are particularly important if long-term targets are tobe achieved in Sweden and globally.
In Sweden, for example, we have so far managed to reduce methane emis-sions to a quite large extent, primarily from waste landfills and agriculture,and the forecast points to possible further reductions of these emissions, con-tributing to meeting the target by 2010. Methane has a very significantimpact on the climate, while the period in which it remains in the atmosphere

8/14/2019 Swedish Climate Strategy
http://slidepdf.com/reader/full/swedish-climate-strategy 116/140
114
is relatively short, so early action to achieve reductions in methane emissionsdoes not really have very great importance with respect to long-term goals. Action to reduce emissions of other greenhouse gases, particularly carbondioxide, does however.
Investments with a very long lifetime are of particular interest in a long-term
climate strategy since the investment decisions of today are the basis for theuse of resources for a long time to come. Buildings and transport infrastructure are key areas20). New construction provides the greatest opportunities forreducing energy use at low cost. It is also important to provide incentives forreduced energy use during extensive renovation.
Infrastructure investments and localisation issues in physical planningoften have relatively short-term, limited effects on total transport kilometresbut as the various actors adapt themselves to new transport conditions, they might have long-term importance for developments in transport kilometres.
It is of great importance that favourable, stable conditions are provided forincreased introduction of renewable energy in the ongoing adaptation of the
energy system. It is also of central importance that wide-ranging economicinvestment takes place primarily in types of infrastructure that have long-term potential for use even when emissions of greenhouse gases need to befurther reduced. This is also highly relevant in developing countries in whichthe economy and the energy system are being built up.
Greater energy efficiency in all sectors of society is a further key area. Theongoing extension of the district heating network, replacing direct electricity and other sources of heating, is one example of an efficiency measure that cancontribute to the achievement of both short-term and long-term targets.Improvements in the fuel efficiency of new cars provide positive effects in ashort-term perspective, but also influence emissions in the long term since
cars have a relatively long lifetime in the Swedish car pool.Technology dissemination and development of new technology are also central
factors in meeting long-term targets and consist of an interplay betweeninventors, entrepreneurs and the market. Market demand is necessary fortechnology development to pick up speed and the creation of niche markets
can be one contribution to the achievement of the long-term climate targets.Trust in stable rules of play will be important in getting various actors to take
20) Radanne P. 2004. Reducing CO 2
emissions fourfold in France. Introduction to the debate. FrenchInterministerial Task Force on Climate Change (MIES).

8/14/2019 Swedish Climate Strategy
http://slidepdf.com/reader/full/swedish-climate-strategy 117/140
115
the initiative. Implementation of new technology in developing countries canalso contribute to sustainable development of these countries.
10.2 Forecast and targets
A review of emission trends in Sweden and the results of the new forecast of
total emissions in Sweden to 2010 show that Sweden’s climate strategy has sofar influenced emissions in several sectors. Overall, emissions are assessed asbeing lower than Sweden’s commitment under the EU burden-sharingscheme under the Kyoto Protocol, but will exceed Sweden’s national target.Developments in the different sub-sectors are heading in different directionshowever. Total emissions are estimated to increase after 2010. The forecast forthose sectors21) initially covered by the EU ETS points to emissions from thesesectors showing an overall increase of 25% to 2010 compared to 1990 levels, while emissions in the non-trading sectors fall during the same period by 12%. The non-trading sector also includes the transport sector, whose emis-sions are expected to increase. So it is the other non-trading sectors, such as
domestic and commercial premises and the agricultural and waste sectors,that contribute large emissions reductions to the forecast.
If the short-term national target of 4% lower emissions in 2010 comparedto 1990 is to be achieved, emissions must fall by a further 2 million tonnescarbon dioxide equivalents. Should the Riksdag choose to abolish carbondioxide tax in the trading sector, emissions must fall by a further 1 milliontonnes. Sweden’s commitment within the EU and under the Kyoto Protocolis however achieved in our forecast even if carbon dioxide tax is abolished.
As we showed earlier, the introduction of the EU ETS makes it illogical inprinciple to retain a national target definition that puts a cap on total emis-sions in Sweden, including the emissions that are included in the trading
scheme. We instead propose the introduction of an offset target22) so thatemissions in the trading sector are deemed equivalent to the total amount of emissions allowances allocated to plants in the sector for the 2008–2012period. Changes in emissions in the trading sector (increases as well asdecreases) will have a corresponding purchase or sale of emissions allowances.
21) Covers from 2005 the emission of carbon dioxide from power and heating plants, oil refineries, plants
that produce and process iron, steel, glass and fibreglass, cement and ceramics, and plants that producepaper and pulp. More gases and more sectors may be covered by the system after 2008.
22) The Flex Mex 2 Commission of Inquiry, in its sub-report Trading for a Better Climate (SOU 2003:60)
has also presented this proposal.

8/14/2019 Swedish Climate Strategy
http://slidepdf.com/reader/full/swedish-climate-strategy 118/140

8/14/2019 Swedish Climate Strategy
http://slidepdf.com/reader/full/swedish-climate-strategy 119/140
117
The result is due to the assessment that the average cost of reducing emis-sions in sectors outside the trading scheme is higher than the assumed price of emissions. The cost of measures varies between different sectors, and is influ-enced by a number of factors, including what carbon dioxide tax level hasapplied/applies. The use of fossil fuels for domestic heating and for transports
is today subject to a relatively high carbon dioxide tax. The general carbondioxide tax is today SEK 0.91 per kg and we have in our calculations workedon the basis of an emissions allowances price in the trading scheme of SEK 0.10 per kg.
Sweden would also be able to use emission reductions from measures car-ried out in other countries (emission credits from JI/CDM). Our assessmentis that the emission reduction units given within the framework of the ongo-ing programme can be used as a reserve and can be saved for the next com-mitment period. Read more about this in Chapter 10. Emission credits fromthe project-based mechanisms will also be included in the trading sectorthrough links from the trading scheme to the project-based mechanisms.
It should also be noted that Sweden, with its national emission target of –4%, will hold saved assigned allowance units (AAUs) under the EU burden-sharing agreement (as a party to the Kyoto Protocol).
The figures below illustrate the various components that together makeup Sweden’s options prior to the target period (both international and nation-al) 2008–2012. The aim is to clarify and describe. The route chosen can be acombination of some of the described options. Our proposal, presented laterin this chapter, is a combination of the two middle bars.

8/14/2019 Swedish Climate Strategy
http://slidepdf.com/reader/full/swedish-climate-strategy 120/140
118
A calculation with allocations according to the current proposal for the period
2005–2007 As mentioned previously, the allocated amount of emissions allowances forthe 2008–2012 period has not yet been decided. We wish to illustrate how the allocation level can affect results anyway, using a calculation.
If, for example , emissions allowances corresponding to approx. 23 milliontonnes of carbon dioxide equivalents are allocated for the 2008–2012 period
(corresponds to the cap in the interval proposed in the Swedish allocationplan for the 2005–2007 period), allocation will be 13% under the forecastemissions in the trading sector in the alternative in which carbon dioxide tax
is retained, and 16% under the forecast emissions when carbon dioxide tax isabolished.
In this example, Swedish plants are expected to be net purchasers of emis-sions allowances and the emissions for Sweden, i.e. the sum total of the allo-cated amount and the forecast emissions in the non-trading sectors, is about
Further policy instruments, JI/CDM
Further policy instruments, JI/CDM
Further policy instruments, JI/CDM
Further policy instruments, JI/CDM
More measures withinthe EU ETS
National instruments innon-trading sectors
Measures abroad offset against target
Target +4%
Emissionsforecast
Target –4%
Possible emissions deficit
Measures abroad
Emissions of other greenhouse gases and CO
2 emissions from transports
and heating of domestic and commercial premises, and other trade and industry
Allocated emission rights to the plants covered by the EU ETS. Actual emissions in Sweden will depend on the price of emissionrights
Emission credits from implemented projects in other countries, JI/CDM, which can be offset against the target.
Figure 28. Sweden’s options prior to the 2008–2012 commitment period (national target
and international commitment).

8/14/2019 Swedish Climate Strategy
http://slidepdf.com/reader/full/swedish-climate-strategy 121/140
119
68 million tonnes, which is 6% below 1990 emissions. So, emissions for Sweden are under –4%. Even with a somewhat less stringent allocation to thetrading sector, a 4% target, expressed as an offset target, is met. No proposalfor further or extended policy instruments would in principle be necessary if such an allocation is given.
10.3.1 Sectors outside the trading scheme
Our view is that regardless of whether the interim target for 2008–2012appears to be achieved, it is still justified to make some changes to the climatestrategy now, since there is an extensive need of measures in the long term.The proposals will also help in a future scenario involving more stringentinternational commitments. The policy instruments are long-term strategicones, i.e. provide direction on changes that will be needed in the longer term.
We propose the following changes to policy instruments for sectors outside the trading sector (assuming an allocation of emissions allowances somewhat below the current forecast)
• introduction of CO2-differentiated vehicle taxes for light vehicles,
• that the free-fuel benefit for company cars be valued at a factor of x1.8 market
price, instead of the present 1.2,
• introduction of kilometre tax for trucks from 2008,
• continued and increased national funding support to local climate investment
programmes during the period 2006–2008. The programmes should primarily
give grants to long-term strategic measures,
• continued climate information campaign for 2006 –2008,
• The EC Directive on the energy performance of buildings is implemented in a
way that utilises the potential for greater energy efficiency.
We also propose that
• continued and increased national funding be given for work on a programme of Joint Implementation and the Clean Development Mechanism in 2005 –2012.

8/14/2019 Swedish Climate Strategy
http://slidepdf.com/reader/full/swedish-climate-strategy 122/140
120
The motives for the proposals are above all their long-term significance, butin the short term, the measures in the transport sector are deemed to lead toan overall reduction in emissions in Sweden of just over 0.5 million tonnescarbon dioxide equivalents per year for the 2008–2012 period.
The reasoning behind the policy instruments is described below. For more
detailed description of the proposals, see the reports on policy instrumentsand flexible mechanisms.
Proposal for new and revised policy instruments in the transport sector The need of change in the transport sector is particularly great since emissionsare expected to continue to increase in this sector. The proposals contribute tosuppressing the heavy increase in emissions shown in the forecasts.
The current Swedish passenger car pool has a high level of fuel consump-tion and high carbon dioxide emissions compared to other European coun-tries. We propose that annual vehicle tax for new cars be differentiated accord-ing to cars’ carbon dioxide emissions and that it be adjusted for existing cars. The
proposal is estimated to reduce the average fuel consumption of new cars by approx. 2%. A similar proposal has just been submitted by the Road TaxCommission of Inquiry (SOU 2004:36).
Differentiation of annual vehicle tax will only to a limited extent influencethe selection of company cars. Company cars are heavier, more powerful andconsume more fuel than the average new car. Since company cars are 25% of all new cars, the design of company car benefit rules controls a significant por-tion of the energy-efficiency of the car pool. One important factor that coun-teracts energy efficiency is that company car drivers who receive free or partly free fuel do not need to pay the full cost of fuel for their private use. One of the goals of the 1997 change in regulations in which the free fuel benefit was
taxed for the first time was that company car holders would pay the fuel forprivate driving. Today, that target has only been met to 50%. To contribute toachieving the target of reaching full cost for private driving, the benefit value factor for free fuel must be raised from the current 1.2 to at least 1.8.
A kilometre-based tax on trucks over 3.5 tonnes should be introduced to
cover society’s economic costs for road transport of goods, starting in 2008.The European Commission has produced a proposal for kilometre tax.
The governments of several countries have also expressed a willingness tointroduce this type of system. Switzerland already has a system and Germany has decided to introduce km taxes.

8/14/2019 Swedish Climate Strategy
http://slidepdf.com/reader/full/swedish-climate-strategy 123/140

8/14/2019 Swedish Climate Strategy
http://slidepdf.com/reader/full/swedish-climate-strategy 124/140
122
Other energy efficiency Besides the transport sector, the domestic sector and trade and industry areother key areas for increased energy efficiency. Within these sectors, there areor will be a number of policy instruments. We are for example currently draw-ing up a programme for energy efficiency for energy-intensive industry. The
EC directive for the energy performance of buildings is currently being imple-mented in Sweden. Here, we feel that Sweden should implement the directivein a way that utilises the potential for greater energy efficiency. There are alsoother directives within the EU that aim to influence developments towardsmore energy-efficient solutions. The directive on ecodesign of energy-consum-ing products (the ecodesign directive) and on efficient final use of energy andenergy services (the energy services directive) are currently being negotiated. All of these directives have the potential of making a contribution to the long-term climate target.
We think that no more initiatives should be taken at present, but that thestrategy instead should be to:
• ensure that the directives have a strong position, with clear requirementsand targets
• clarify and fine-tune existing policy instruments
Project-based mechanisms Measures in the project-based mechanisms are to contribute to an interna-tional adaptation of the energy system towards one with less climate impactand will be part of Sweden’s contribution to developing the flexible mecha-nisms of the Kyoto Protocol. The measures will give the government andbusinesses the opportunity to participate in JI and the CDM, in the processacquiring emission reduction units which are to be able to be used to supple-
ment domestic measures to meet Sweden’s obligations under future interna-tional commitments.
The programme should consist of three parts:1) Swedish investments in JI and CDM projects2) Special measures for small-scale CDM projects in the least developed
countries3) Support and advice to Swedish companies participating in JI and CDM

8/14/2019 Swedish Climate Strategy
http://slidepdf.com/reader/full/swedish-climate-strategy 125/140
123
The need of further policy instruments in a high allocationIn a high allocation to the trading sector, in our example at the level of thebaseline forecast, our assessment is that policy instruments that reduce emis-sions in Sweden by a total of approx. 1.5 million tonnes carbon dioxideequivalents24) may need to be introduced. Apart from the proposed policy
instruments described earlier, further reductions in emissions in Sweden canbe achieved through:
• Increased energy tax on motor fuels (petrol, diesel),• Furthermore, an increase in carbon dioxide tax for other trade and
industry (outside the trading scheme) might lead to some reduction inemissions. Further analysis is required to show the socioeconomic effectsof such an increase.
Another way of achieving the target in this case might be to use the emissioncredits that Sweden is expected to receive through ongoing measures in othercountries via the project-based mechanisms.
Comments on an increase in energy taxes:Current energy taxes on petrol are SEK 2.68/litre and for diesel SEK 0.78/litre. Since 2000, energy taxes on fuels have been reduced to the samedegree that the general carbon dioxide tax has been increased, so that the totaltax burden in real terms (adjusted for the consumer price index) has remainedconstant.
The energy tax can be justified both for fiscal reasons and as a means of internalising the external costs to society to which that the use of fuel givesrise. The effects of the successive reduction in energy taxes has been that theenergy tax revenues of today do not bear the external costs to society that arise
during use. There are, then, socioeconomic motives for raising current energy taxes. If energy tax is to be raised, then it should be done in stages to give fuelconsumers time to make the adjustment prior to a long-term increase of ener-gy tax to achieve full internalisation. Other environmental effects, then, thancarbon dioxide emissions would justify an increase in energy tax but the effect
24) Further reductions in emissions of a total of 0.5 million tonnes of carbon dioxide equivalents are not
part of the baseline forecast. These are deemed to arise as a result of the coming regulation limiting
fluorinated greenhouse gases that is now being negotiated in the EU, and the ongoing Klimp pro-
gramme. These policy instruments therefore reduce the overall need of measures.

8/14/2019 Swedish Climate Strategy
http://slidepdf.com/reader/full/swedish-climate-strategy 126/140
124
of a fuel tax increase is the same from a climate viewpoint. An increase inenergy tax on fuel should take place within the framework of a green taxexchange with reductions of other taxes so that no overall loss of wealth arises.
10.3.2 Activities covered by the EU trading scheme
One important issue in the introduction of trade in emissions allowances is whether the trading sectors in the future are to pay carbon dioxide tax. Usingthe offset target that we propose, total emissions for the sectors covered by thetrading scheme in Europe are determined by the total allocation to the trad-ing scheme. Further policy instruments in the trading sector in Sweden willnot affect total emissions in Europe.
A trading scheme for emissions allowances has the theoretical advantagethat measures to reduce emissions will take place where this is cheapest. If thesystem is developed so that the companies can predict that the amount of emissions allowances on the market will fall, good conditions are also createdfor structural change that is favourable to the achievement of long-term
climate targets.In a well-functioning system, supplementary instruments (such as carbon
dioxide tax) should therefore not be charged to activities that are in the emis-sions trading scheme, since this can lower the cost-effectiveness of the tradingscheme and distort competition.
At the same time, it is important at the initial stages of the trading scheme, when the price of emissions allowances can be expected to be low, to retainsome supplementary instruments to promote the structural change that willmake it easier to achieve long-term climate targets.
Further policy instruments in the trading sector can also be justified inthat other objectives must also be fulfilled. One of these is the energy policy
objective of increasing the proportion of renewable energy in the Swedishenergy system. It is therefore important to maintain the competitiveness of biofuels in the production of electricity and heating, even when trade inemissions allowances is introduced. Another energy policy argument is thesecurity of Sweden’s energy supply.

8/14/2019 Swedish Climate Strategy
http://slidepdf.com/reader/full/swedish-climate-strategy 127/140
125
Proposals for current policy instruments in the sectors that will be covered by the EU ETS
25) At an emission price of 10 euros per tonne.
For current policy instruments in sectors that will be covered by the EU
emissions allowances trading scheme, we propose that:• Carbon dioxide tax for industrial energy use is abolished.
• Carbon dioxide tax for heat production in hot-water boilers is retained, but the
level can be reduced.
• Carbon dioxide tax for combined heating and power plants is abolished, provided
that:
– The electricity certificate system is extended, and the quota raised after 2010
– The same allocation principle (within the framework of the EU trading scheme)
applies to biofuels and fossil fuels in new CHP plants.
The reasoning behind the policy instruments is described below.
Carbon dioxide tax for industry is abolished To maintain the competitiveness of international trade and industry, we pro-pose that carbon dioxide tax for these companies be abolished. Industrialenterprises that are in the emissions allowances trading scheme act in a com-
petitive international market where prices are set globally. An increased costof carbon dioxide emissions thus means that these companies cannot shiftthese costs onto their customers by increasing prices. A large proportion of the companies’ emissions are related to production that in an internationalcomparison already takes place at relatively low carbon dioxide intensities.
These companies will find it difficult to reduce their carbon dioxide emissions without reducing production.
Levying higher costs for carbon dioxide on these companies than on theirEuropean competitors might have unwanted effects on growth and employ-
ment. Today, industry within the trading scheme uses fossil fuels to a very large extent. Our analyses show that emissions would increase by over 0.2million tonnes of carbon dioxide25) to 2010 if carbon dioxide tax was abol-

8/14/2019 Swedish Climate Strategy
http://slidepdf.com/reader/full/swedish-climate-strategy 128/140
126
ished for industry ’s energy use. We feel that an increase of this scale does not justify levying carbon dioxide tax on this part of the trading sector.
Carbon dioxide tax is retained in heating plants – but the tax level is reduced The use of biofuels in district heating has climbed steadily throughout the
1990s and today represents about 60% of total fuel use. Such use is evengreater in pure heating production. An important component in the conver-sion has been the ever-higher tax levels on fossil fuels for heat production. Sothat use of biofuels will remain at a high level, we recommend that the tax oncarbon dioxide is retained for heating plants. Our model calculations show that when carbon dioxide tax is abolished, the use of fossil fuels increases atthe expense of biofuels, above all in the post–2010 period.
Heating plants are active in a local market without international competi-tion. So if the tax is retained, this will not affect the competitiveness of thecompanies in relation to other plants that are in the emissions tradingscheme. It is however important to maintain the competitiveness of district
heating compared to other types of heating. We propose therefore that carbondioxide tax is retained but that it is reduced so that the total cost of carbondioxide (tax plus emissions allowances price) will not exceed today ’s carbondioxide tax level.
So that the emission trading scheme and a retained carbon dioxide tax willhave a controlling effect together, it is important not to introduce deductionsfor emissions allowances costs against today ’s carbon dioxide tax. Such astructure would reduce the effect of the trading scheme. A lower level of car-bon dioxide tax is preferable. The lower level should be set with some marginfor changes in the price of emissions allowances. This means that the totalcarbon dioxide cost (tax plus emissions allowances price) will be somewhat
lower than today. Our view however is that a carbon dioxide cost that is lowerthan today ’s carbon dioxide tax will still have a controlling effect. Exactly what the reduced level should be and what margins are necessary to avoiddouble taxation should be investigated further within the framework of thereform of the energy tax system that the Cabinet Office is working on.

8/14/2019 Swedish Climate Strategy
http://slidepdf.com/reader/full/swedish-climate-strategy 129/140
127
Carbon dioxide tax is abolished for combined power and heating plants, under certain conditions We propose that carbon dioxide tax for combined heating and power plantsbe abolished provided that new CHP plants, including biofuel plants, areallocated emissions allowances in the same way in the future application of
the trading scheme, and that the system of electricity certificates is extendedto 2020 with continued raised quotas.
If new fossil-based heating and power is allocated some emissionsallowances free, at the same time as biofuelled heating and power is not givenan allocation, this means that fossil-based heating and power is favoured inrelation to biofuel at the time of investment. Calculations of production costsfor new plants show that the allocated amount of emissions allowances isimportant if competitiveness is to exist between fossil-based and biofuelledheating and power.
The primary aim of the electricity certificate system is not explicitly tofavour biofuelled power and heating in relation to fossil-fuelled power and
heating. The set electricity certificate quota controls how much renewableelectricity will be generated within the energy system overall. What produc-tion technology or what fuel is used is not controlled by the electricity certifi-cate system. Our calculations however show that the electricity certificateprice plays an important role in the ability of biofuels to compete in com-bined heating and power if carbon dioxide tax is abolished. If the electricity certificate quota is not raised in the period beyond 2010, our forecast assess-ments show that with a low emission trading price, extra electricity fromCHP plants will be fossil-based. To maintain the competitiveness of biofu-elled combined heating and power, without carbon dioxide tax, we proposethat the electricity certificate system is extended with raised quotas after
2010.It should be pointed out however that the competitive situation between
the fuels is finally dependent on several prices that are determined in differentmarkets: fuel prices, emissions allowances prices, electricity certificate prices.
With the combination of proposals outlined above, we think that the
competitive situation of biofuels has been taken into account at the same timeas the competitiveness of combined heating and power with regard to con-densation power and other combined heating and power on the Nordic mar-ket is retained.

8/14/2019 Swedish Climate Strategy
http://slidepdf.com/reader/full/swedish-climate-strategy 130/140
128
10.4 Socioeconomic effects of our proposals
The table below gives a short summary of the socioeconomic effects of ourproposals. The report “Evaluation of the Policy Instruments of the ClimateStrategy ” gives a more detailed description.
Summary of socioeconomic effects The proposal for differentiated CO
2vehicle tax gives a
socioeconomic gain of reduced CO2
emissions – calculat-ed at SEK 0.91/kg – which is greater than the socio-economic losses of negative growth/employment. Thesocioeconomic calculation shows a total of approx.SEK 1.5 billion in gain over 20 years.
Introduction of Km tax makes goods transports by road pay for their costs (emissions, accidents, road wear etc.)
That is to say, without Km tax the socioeconomic lossesare higher than what trucks pay in energy tax. The
proposed Km tax level is weighted for maximum socio-economic efficiency.
An increase in the factor for free fuel in the car benefitrules will contribute to company car benefit holders’
paying the full fuel costs of their private driving. Notassessed as having any negative consequences foremployment/growth.
Environmental impact 2010: Reduction of 0.5 million tonnes CO2-eq,
2 thousand tonnes NOx
2020: Reduction of 0.8 million tonnes CO2-eq,
2.5 thousand tonnes NOx
Growth Km tax: For trade and industry as a whole, transportcosts are under 2% of the goods value of the transportedgoods. For the forestry and construction industry sec-tors, transport costs are a somewhat higher proportion.
Employment The redesign of vehicle tax is estimated to influenceemployment in the car sector to a small extent.
Km tax limits future employment in the road transportindustry somewhat, but gives increased employment formaritime transport/rail.
Distribution effects A redesign of vehicle tax gives a transfer of wealthfrom households with big cars (often large householdsin rural areas) to households with small cars (more
common in urban areas).
Km tax increases costs for the road transport industrywhich benefits rail/maritime transport. No regional dis-tribution effects are expected to arise. Revised companycar benefit rules give increased costs for those companycar holders who have free fuel.
Table 7 Socioeconomic effects of our proposals

8/14/2019 Swedish Climate Strategy
http://slidepdf.com/reader/full/swedish-climate-strategy 131/140

8/14/2019 Swedish Climate Strategy
http://slidepdf.com/reader/full/swedish-climate-strategy 132/140
130
10.5 Conclusions concerning other policy instruments in
the Swedish climate strategy
Research/development are important for long-term developments
Our assignment has not included an analysis of this field however.
Extended trading scheme to more sectors/gases
One conceivable change that we have not analysed in depth is a possible extension
of the EU trading scheme to more sectors (emissions). Sectors that might come into
question are the entire chemicals industry, the aluminium industry, plants for
incineration of domestic waste and transport sectors. The consequences of this are
being examined in more detail by the FlexMex2 Commission of Inquiry.
Effects of tax increases in the domestic and service sectors
The domestic and service sectors are already covered by a high level of carbon diox-ide tax. The calculations we have done show that further tax increases lead to very
small reductions in emissions. The measures that a further increase would lead to are
also more expensive than measures in other sectors that have a lower tax burden.
Bearing in mind that we have not been able to show significant reductions in emis-
sions as a result of increased taxes in this sector, it is not justified from a cost-effec-
tiveness viewpoint to further increase general carbon dioxide tax for the domestic
and service sectors.
Tax-exemption alternative fuels
The most important conclusions of our evaluation of tax exemption for biofuels isthat it gives an over-subsidisation of low-level mixing of ethanol into petrol, will
not lead to increased ethanol production in Sweden and that the EU quality
requirement permitting a maximum of 5% ethanol mixture in petrol prevents the
achievement of the target of 5.75% biofuel in the transport sector.
The most cost-effective way of increasing the proportion of renewable energy in the
transport sector is today low-level mixing into conventional motor fuels. It is there-
fore important that Sweden in the EU continues to take the initiative to achieve a
change of the highest permitted alcohol mixture from 5% to 10%.
cont. >>

8/14/2019 Swedish Climate Strategy
http://slidepdf.com/reader/full/swedish-climate-strategy 133/140
131
In principle, we think that research to develop new process technology that can
produce biofuels at lower cost is more important, for example in the form of
pyrolysis of cellulose to synthesis gas for further production of various biofuels.
At present, we do not wish to submit a specific proposal about biofuels, but will
allow the ongoing Commission of Inquiry 26) to propose policy instruments for theintroduction of biofuels. This Commission of Inquiry is to submit its findings on
31 December 2004.
Proposals for other trade and industry
One conceivable change is to increase carbon dioxide tax for other trade and indus-
try (those activities not included in the trading scheme). More information must
be produced however to show the socioeconomic effects of such an increase (both
emissions and growth). Alternative policy instruments should be investigated at the
same time. For example, policy instruments that influence developments towards
greater energy efficiency.
Proposals for transports
Carbon-dioxide differentiated company car benefit rules
We propose a special Commission of Inquiry with the task of submitting a detailed
proposal for the redesign of the Swedish system of assessing the value of the compa-
ny car benefit so that it becomes based on carbon dioxide emission
Index-link fuel taxes to GDP rather than CPI
We propose that a recalculation of carbon dioxide and energy taxes on vehicle fuels
to follow growth of GDP rather than the CPI should be investigated together with
Statistics Sweden (SCB).
26) Dir. 2003:89, Introduction of renewable vehicle fuels, 3 July 2003.

8/14/2019 Swedish Climate Strategy
http://slidepdf.com/reader/full/swedish-climate-strategy 134/140
132
List of Tables and Figures
Table
Table 1 Forecast emissions of greenhouse gases to 2010 and 2020
for the baseline forecast (thousand tonnes CO2
equivalents) 56
Table 2 Emissions of carbon dioxide by sector (thousand tonnes) 57
Table 3 Forecast greenhouse gas emissions to 2010 and 2020,
per greenhouse gas 57
Table 4 Emissions historically and forecast until 2010 and
2020 distributed over trading and non-trading sectors
(million tonnes carbon dioxide equivalents) 63
Table 5 Greenhouse gas emissions for the various sensitivity
alternatives (thousand tonnes CO2 equivalents) 63Table 6 Summary of conclusions from the evaluation of
existing policy instruments 83
Table 7 Socioeconomic effects of our proposals 128
Table 8 National economic effects of our proposals 129
Figures
Figure 1 Global carbon dioxide emissions 1751–2000, from the use of oil,
coal and natural gas 26
Figure 2 Atmospheric carbon dioxide levels, 1000–2002 26Figure 3 Developments in mean global temperature for
the period 1860–2002 27
Figure 4 Global temperature development, historically and
according to IPCC scenarios 28
Figure 5 Changes in mean annual temperature in Europe
in a 100-year perspective 29
Figure 6 Annex 1 countries that had reduced their emissions
in 2000 compared to 1990 levels. 46
Figure 7 Annex 1 countries that had increased their emissions
in 2000 compared to 1990 levels. 46
Figure 8 Emissions of various greenhouse gases, 1990– 2002
(in kilotonnes carbon dioxide equivalents) 47
Figure 9 Emissions in 2002 by greenhouse gas 48

8/14/2019 Swedish Climate Strategy
http://slidepdf.com/reader/full/swedish-climate-strategy 135/140
133
Figure 10 Emissions of greenhouse gases by various subsectors, 1990– 2002 49
Figure 11 Emissions of nitrogen oxides (NOx), sulphur dioxide (SO2)
and volatile organic substances (NMVOC), 1990 –2002 51
Figure 12 Forecasts for 2010 and Kyoto commitments for
some Annex 1 countries. 53
Figure 13 Forecasts for 2010 and Kyoto commitments for
some Annex 1 countries. 54
Figure 14 Emissions of greenhouse gases by sector,
actual emissions and forecast. 58
Figure 15 Result of all forecast alternatives 64
Figure 16 Ways to reduce carbon dioxide emissions fromenergy supply and useage 67
Figure 17 Energy supplied in district heating 1980–2002 74
Figure 18 Total heating in the domestic and commercial
premises sectors, corrected for normal year, 1983–2002 75
Figure 19 Carbon dioxide emissions with (at 2004 levels) and
without carbon dioxide tax 75
Figure 20 Carbon dioxide emissions for Sweden, national effects 86
Figure 21 Carbon dioxide emissions for Sweden, Nordic effects 87
Figure 22 Allocation of emissions allowances in relation to
the Kyoto commitments of 21 (out of 25) member states 90
Figure 23 Carbon dioxide emissions from industry and electricity
and heating production as a function of the price of emissions
allowances in 2009 in four Nordic countries 92
Figure 24 System price of electricity in the Swedish price area as
a function of time and the price of emissions allowances 93
Figure 25 Changes in the value added in various sectors between the
years 2000–2010 with different assumed carbon dioxide tax levels 94
Figure 26 Carbon intensity (gramme carbon in relation to
total energy supply) for some industrialised countries 103
Figure 27 Carbon intensity in grammes carbon in relation to
total energy supply for some developing countries 103
Figure 28 Sweden’s options prior to the 2008–2012 commitment period
(national target and international commitment) 118

8/14/2019 Swedish Climate Strategy
http://slidepdf.com/reader/full/swedish-climate-strategy 136/140
134
Criteria for the
national allocation plans
1. The total quantity of allowances to be allocated for the relevant period shall be con-
sistent with the Member State’s obligation to limit its emissions pursuant to Decision
2002/358/EC and the Kyoto Protocol, taking into account, on the one hand, the
proportion of overall emissions that these allowances represent in comparison with
emissions from sources not covered by this Directive and, on the other hand, national
energy policies, and should be consistent with the national climate change pro-
gramme. The total quantity of allowances to be allocated shall not be more than is
likely to be needed for the strict application of the criteria of this Annex. Prior to
2008, the quantity shall be consistent with a path towards achieving or over-achiev-
ing each Member State’s target under Decision 2002/358/EC and the Kyoto
Protocol.
2. The total quantity of allowances to be allocated shall be consistent with assessments
of actual and projected progress towards fulfilling the Member States’ contributions
to the Community ’s commitments made pursuant to Decision 93/389/EEC.
3. Quantities of allowances to be allocated shall be consistent with the potential,
including the technological potential, of activities covered by this scheme to reduce
emissions. Member States may base their distribution of allowances on average
emissions of greenhouse gases by product in each activity and achievable progress in
each activity.
4. The plan shall be consistent with other Community legislative and policy instru-
ments. Account should be taken of unavoidable increases in emissions resulting from
new legislative requirements.
8/14/2019 Swedish Climate Strategy
http://slidepdf.com/reader/full/swedish-climate-strategy 137/140
135
5. The plan shall not discriminate between companies or sectors in such a way as to
unduly favour certain undertakings or activities in accordance with the requirements
of the Treaty, in particular Articles 87 and 88 thereof.
6. The plan shall contain information on the manner in which new entrants will be able
to begin participating in the Community scheme in the Member State concerned.
7. The plan may accommodate early action and shall contain information on the man-
ner in which early action is taken into account. Benchmarks derived from reference
documents concerning the best available technologies may be employed by Member
States in developing their National Allocation Plans, and these benchmarks can
incorporate an element of accommodating early action.
8. The plan shall contain information on the manner in which clean technology,
including energy efficient technologies, are taken into account.
9. The plan shall include provisions for comments to be expressed by the public, and
contain information on the arrangements by which due account will be taken of
these comments before a decision on the allocation of allowances is taken.
10. The plan shall contain a list of the installations covered by this Directive with the
quantities of allowances intended to be allocated to each.
11. The plan may contain information on the manner in which the existence of competi-
tion from countries or entities outside the Union will be taken into account.

8/14/2019 Swedish Climate Strategy
http://slidepdf.com/reader/full/swedish-climate-strategy 138/140

8/14/2019 Swedish Climate Strategy
http://slidepdf.com/reader/full/swedish-climate-strategy 139/140

8/14/2019 Swedish Climate Strategy
http://slidepdf.com/reader/full/swedish-climate-strategy 140/140
The current Swedish climate strategy was adopted by the Riksdag
(Parliament) in March 2002. The strategy is designed so that
Swedish climate work and progress towards the national target are
to be followed up on an ongoing basis. Special checkpoints were
inserted for the years 2004 and 2008 in which the climate work is to
be evaluated. If emission trends appear less favourable at these
times, new measures can be proposed and/or the target reconsidered.
The Environmental Protection Agency and the Swedish Energy
Agency have had the government's assignment of compiling a basis
for the first evaluation at the 2004 checkpoint.
This report describes the most important conclusions and results of
our work on this assignment. The work is described in detail in four
reports: