suven life sciences 27th annual report limited together · respect in the global research-led...
TRANSCRIPT

PUTTING IT ALLTOGETHER
SUVEN LIFE SCIENCES LIMITED
27TH ANNUAL REPORT 2015-16
CIN: L24110TG1989PLC009713 SDE SERENE CHAMBERS, ROAD NO. 5, AVENUE 7, BANJARA HILLS, HYDERABAD - 500034
SUVEN LIFE SCIENCES LIMITED 27TH ANNUAL REPORT
Corporate InformationBoard of Directors Shri Venkateswarlu Jasti Chairman & CEO
Smt Sudha Rani Jasti Whole-time Director
Dr M R Naidu Director
Dr K V Raghavan Director
Shri D G Prasad Director
Prof Seyed E Hasnain Director
Shri M Gopalakrishna, IAS (Retd.) Director
Chief Financial OfficerCMA P Subba Rao
Company SecretaryCS K Hanumantha Rao
Statutory AuditorsKarvy & Co.,Chartered Accountants
No.2, Bhooma Plaza, Street No.4
Avenue 7, Banjara Hills, Hyderabad - 500 034
Secretarial AuditorsDVM Gopal & AssociatesCompany Secretaries
# 6/3/154-159, Flat No. 303, 3rd Floor,
Royal Majestic, Prem Nagar Colony, Hyderabad – 500 004
Internal AuditorsVemulapalli & Co.,Chartered Accountants
H. No. 14–1–90/435, Sai Dwarakamai, 1st Floor, Gayatri Nagar Colony,
Allapur, Borabanda, Hyderabad – 500 038
Registrars & Share Transfer AgentsKarvy Computershare Pvt. Ltd.Karvy Selenium, Tower B, Plot 31-32,
Gachibowli, Financial District,
Nanakramguda, Hyderabad - 500 032
BankersState Bank of India
Bank of Bahrain & Kuwait
Research and Development Centre(s)Research Centre – IPlot No.18, Phase III, IDA Jeedimetla,
Hyderabad, Telangana – 500 055
Research Centre - IIBio-Pharmaceutical Lab
Plot No(s). 267- 268, IDA Pashamylaram,
Medak Dist. Telangana – 502 307
Research Centre - IIIFormulation Development Centre
Plot No(s). 265 to 268, APIIC, IDA
Pashamylaram, Medak Dist, Telangana–502 307
Manufacturing FacilitiesUnit – 1: Dasaigudem (V), Suryapet (M)
Nalgonda Dist, Telangana – 508 213
Unit – 2: Plot No.18, Phase III, IDA
Jeedimetla, Hyderabad, Telangana – 500 055
Unit – 3: Plot No(s). 262- 264 & 269 – 271, IDA,
Pashamylaram, Medak Dist. Telangana – 502 307
Unit – 4: Plot No(s). 65 – 67, JN Pharmacity,
Parwada, Visakhapatnam, Andhra Pradesh – 531 019
Registered Office# 8-2-334 I SDE Serene Chambers I 6th Floor I Road No.5 I Avenue 7 I Banjara Hills
Hyderabad – 500 034 I Telangana I India I CIN: L24110TG1989PLC009713
Tel: 91 40 2354 1142/ 3311/ 3315, Fax: 91 40 2354 1152, Email: [email protected], website: www.suven.com
A PRODUCT
SUVEN LIFE SCIENCES LIMITED. RESEARCH-FOCUSED PHARMACEUTICAL PLAYER. WORKING COLLABORATIVELY WITH GLOBAL INNOVATOR COMPANIES.
STRENGTHENING ITS BUSINESS; ENHANCING NATIONAL RESPECT; HELPING MANKIND COUNTER DISEASE.
CONTENTS06 - ABOUT SUVEN | 08 - WHAT SUVEN ACHIEVED IN 2015-16 | 10 - 10 MINUTES WITH THE CHAIRMAN | 14 - OPERATIONAL OVERVIEW | 16 - MANAGEMENT DISCUSSION AND ANALYSIS | 24 - BOARD’S REPORT | 52 - REPORT ON CORPORATE GOVERNANCE | 65 - STANDALONE FINANCIAL SECTION | 95 - CONSOLIDATED FINANCIAL SECTION
CAUTIONARY STATEMENTIn this Annual Report, we have disclosed forward-looking information to enable investors to comprehend our prospects and take informed investment decisions. This report and other statements - written and oral - that we periodically make contain forward-looking statements that set out anticipated results based on the management’s plans and assumptions. We have tried, wherever possible, to identify such statements by using words such as ‘anticipates’, ‘estimates’, ‘expects’, ‘projects’, ‘intends’, ‘plans’, ‘believes’, and words of similar substance in connection with any discussion of future performance.
We cannot guarantee that these forward-looking statements will be realised, although we believe we have been prudent in assumptions. The achievement of results is subject to risks, uncertainties and even
inaccurate assumptions. Should known or unknown risks or uncertainties materialise, or should underlying assumptions prove inaccurate, actual results could vary materially from those anticipated, estimated or projected. Readers should bear this in mind.
We undertake no obligation to publicly update any forward-looking statements, whether as a result of new information, future events or otherwise.
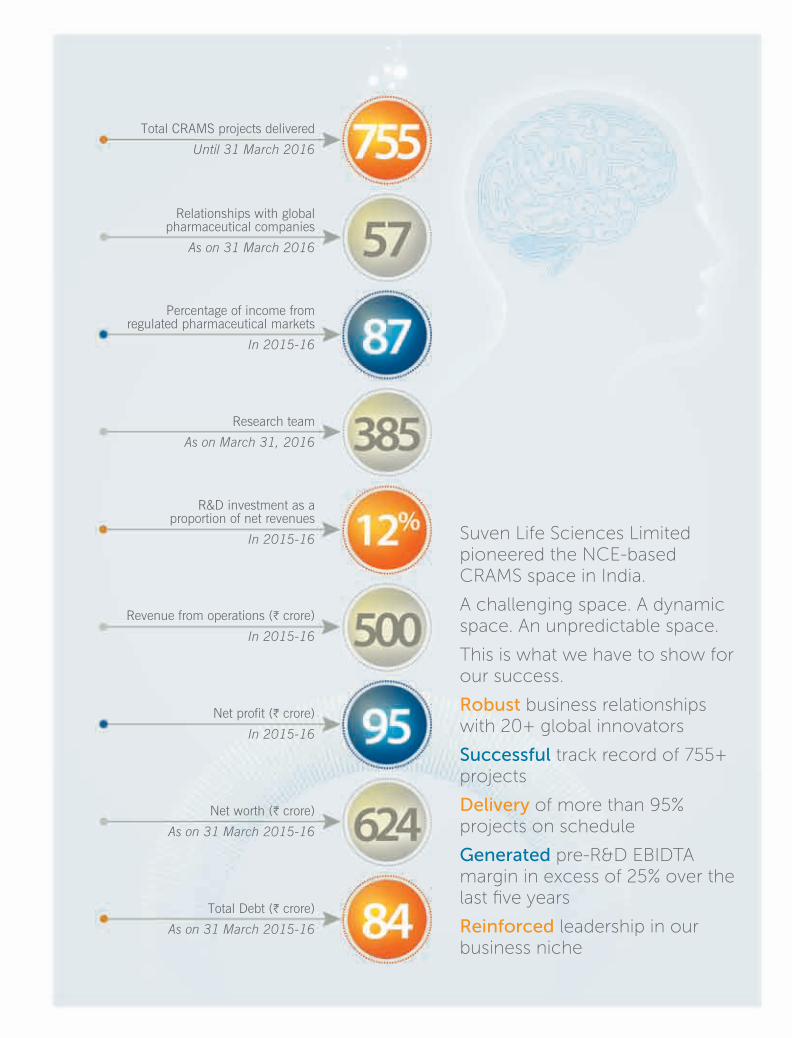
Total CRAMS projects delivered
Until 31 March 2016
Research team
As on March 31, 2016
R&D investment as a proportion of net revenues
In 2015-16
Revenue from operations (H crore)
In 2015-16
Net profit (H crore)
In 2015-16
Net worth (H crore)
As on 31 March 2015-16
Total Debt (H crore)
As on 31 March 2015-16
Relationships with global pharmaceutical companies
As on 31 March 2016
Percentage of income from regulated pharmaceutical markets
In 2015-16
Suven Life Sciences Limited pioneered the NCE-based CRAMS space in India.
A challenging space. A dynamic space. An unpredictable space.
This is what we have to show for our success.
Robust business relationships with 20+ global innovators
Successful track record of 755+ projects
Delivery of more than 95% projects on schedule
Generated pre-R&D EBIDTA margin in excess of 25% over the last five years
Reinforced leadership in our business niche

02

TRANSFORMING OUR CRAMS VERTICAL
FROM THE UNPREDICTABLE TO THE STABLE
Even as we have grown our revenues by 152% in the five years ending 2015-16, there is an apprehension that the
high-risk NCE-based CRAMS space is not predictable, as Suven’s successful project delivery does not guarantee repeat business and an innovator client can terminate molecule development.
For all the pessimists, we have a message.
After two decades of passionate engagement in the CRAMS space, Suven is at the cusp of transforming an unpredictable business towards increased stability.
We believe that this transformation will become increasingly manifest for some good reasons.
Commercial volumes for molecule launches: We supplied pre-launch quantities of intermediates for three molecules pertaining to three therapeutic indications – rheumatoid arthritis for a US-based innovator, anti-depressant and an anti-diabetic for European innovators. The commercial volumes for these products are expected to commence in 2016-17 and continue over the next few years.
Intermediate for specialty chemicals: We supply a complex speciality intermediary (derived from our CRAMS competence). The sales volume of this intermediate strengthened by 40% in 2015-16 and we expect to maintain similar volumes over the next few years.
ANDAs: In addition to the exclusive marketing license for our Malathion lotion to Taro Pharmaceuticals for the US and Canada, we filed three ANDAs in collaboration with customers; the maturing of these ANDAs could lead to attractive revenues.
Stable revenues from speciality chemicals and commercial supplies could lead to annuity revenues and topline growth of about 10-15%, reducing income volatility and providing stability.
3We filed three ANDAs in collaboration with customers; the maturing of these ANDAs could lead to attractive revenues.
03ANNUAL REPORT
2015/16SUVENLIFE SCIENCES LIMITED

GRADUATING OUR NCE INITIATIVE
FROM HIGH-RISK TO HIGH-RETURN
Even as our innovative pipeline received 984 product patents for 28 inventions and 38 process patents for 8
inventions, there is a lurking worry about the pace of our NCE development.
The fears are not misplaced. Of every 100 candidates initiated for clinical development the world over, only one on average succeeds to fruition.
At Suven, we possess a stronger average. Three of our NCE candidates moved into advanced stages in the molecule development lifecycle, making their prospective monetisation an increasing possibility.
Our flagship candidate SUVN 502 initiated phase 2A study in USA under US-IND and expected completion by last quarter of 2017.
Our SUVN-G3031 candidate completed Phase 1 trials in USA under US-IND successfully, undergoing long-term toxicology studies prior to entering Phase 2 trials.
Our SUVN-D4010 candidate completed Phase 1 clinical trials in USA under US-IND and will enter into long-term toxicological studies to move into Phase 2 clinical trial.
Our SUVN-911 candidate is in preparation for entering into Phase 1 clinical trials.
Even as per conservative estimates, the successful monetisation of even a single molecule has the potential to significantly advance business prospects (financially) and respect (globally).
25Planned investment (US$, mn) by Suven in developing SUVN 502 through Suven, Inc., for Phase 2A clinical development program in USA.
04

05ANNUAL REPORT
2015/16SUVENLIFE SCIENCES LIMITED

ABOUT THE CORPORATE
SUVEN LIFE SCIENCES. PIONEERED NCE-BASED CRAMS IN INDIA AND IS A LEADER IN THIS SPACE.
AMONG THE FEW INDIAN PHARMACEUTICAL PLAYERS FOCUSED ON DEVELOPING NEW CHEMICAL ENTITIES IN THE COMPLEX CNS SPACE.
RESPECTED OUTLIER IN A HIGH-PROFIT NICHE.
MAKING IT A COMPANY ATTRACTING GROWING RESPECT IN THE GLOBAL RESEARCH-LED PHARMACEUTICAL INDUSTRY.
60%Promoters’ holding, March 31, 2016
7%Institutional holding,
March 31, 2016
2,452Market capitalisation,
March 31, 2016 (H crore)
Mission Providing world-class R&D
solutions for Global Life Science companies with quality, speed
and cost-effectiveness
In search of new CNS therapies for better living
06
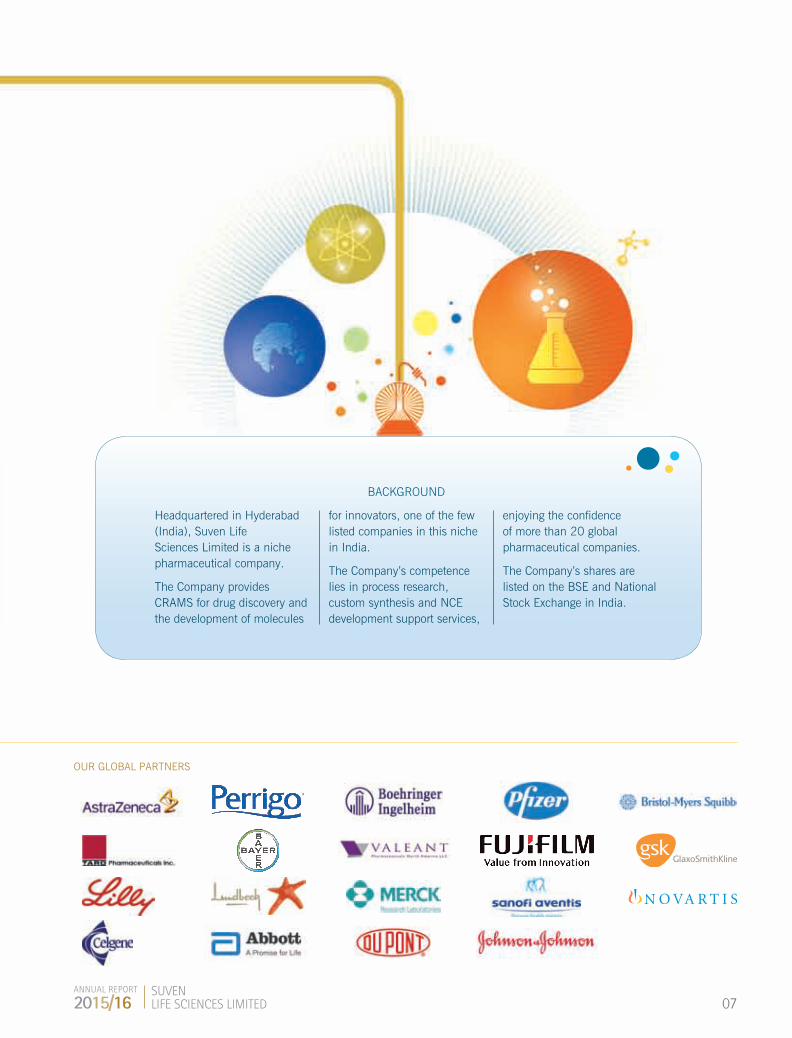
BACKGROUND
Headquartered in Hyderabad (India), Suven Life Sciences Limited is a niche pharmaceutical company.
The Company provides CRAMS for drug discovery and the development of molecules
for innovators, one of the few listed companies in this niche in India.
The Company’s competence lies in process research, custom synthesis and NCE development support services,
enjoying the confidence of more than 20 global pharmaceutical companies.
The Company’s shares are listed on the BSE and National Stock Exchange in India.
OUR GLOBAL PARTNERS
07ANNUAL REPORT
2015/16SUVENLIFE SCIENCES LIMITED
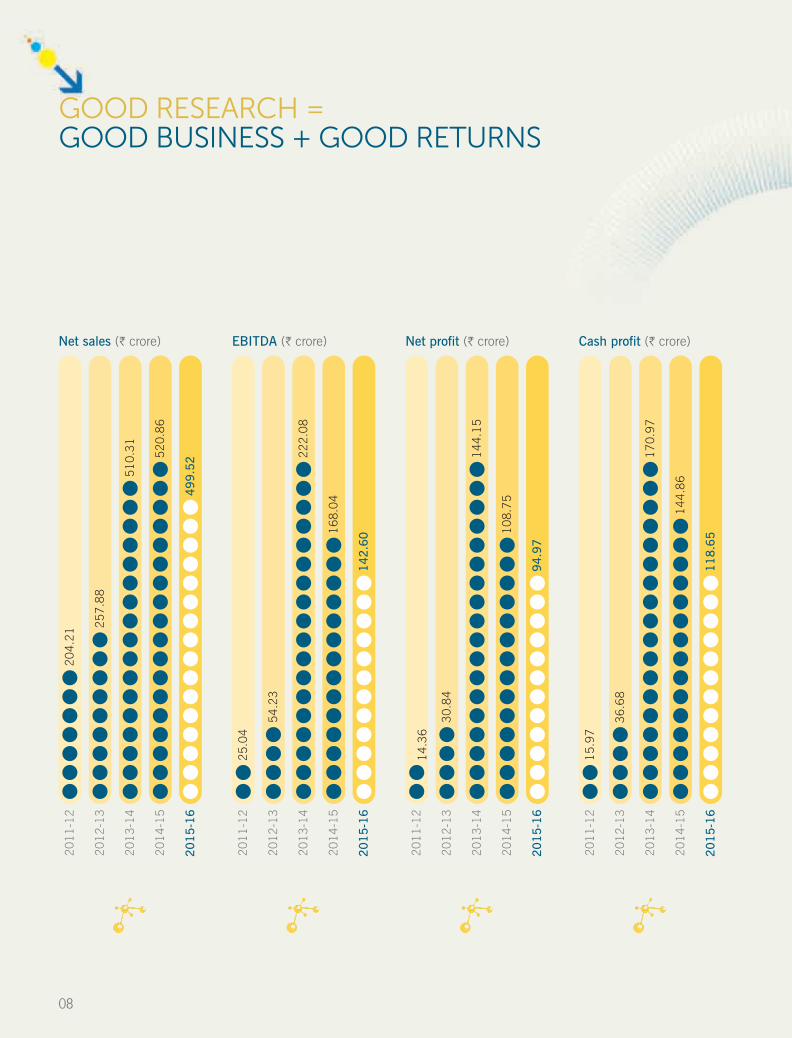
GOOD RESEARCH = GOOD BUSINESS + GOOD RETURNS
Net sales (H crore)
204.
2120
11-1
2
257.
8820
12-1
3
510.
3120
13-1
4
520.
8620
14-1
5
49
9.5
22
01
5-1
6
EBITDA (H crore)
25.0
420
11-1
2
54.2
320
12-1
3
222.
0820
13-1
4
168.
0420
14-1
5
14
2.6
02
01
5-1
6
Net profit (H crore)
14.3
620
11-1
2
30.8
420
12-1
3
144.
1520
13-1
4
108.
7520
14-1
5
94
.97
20
15
-16
Cash profit (H crore)
15.9
720
11-1
2
36.6
820
12-1
3
170.
9720
13-1
4
144.
8620
14-1
5
11
8.6
52
01
5-1
6
08
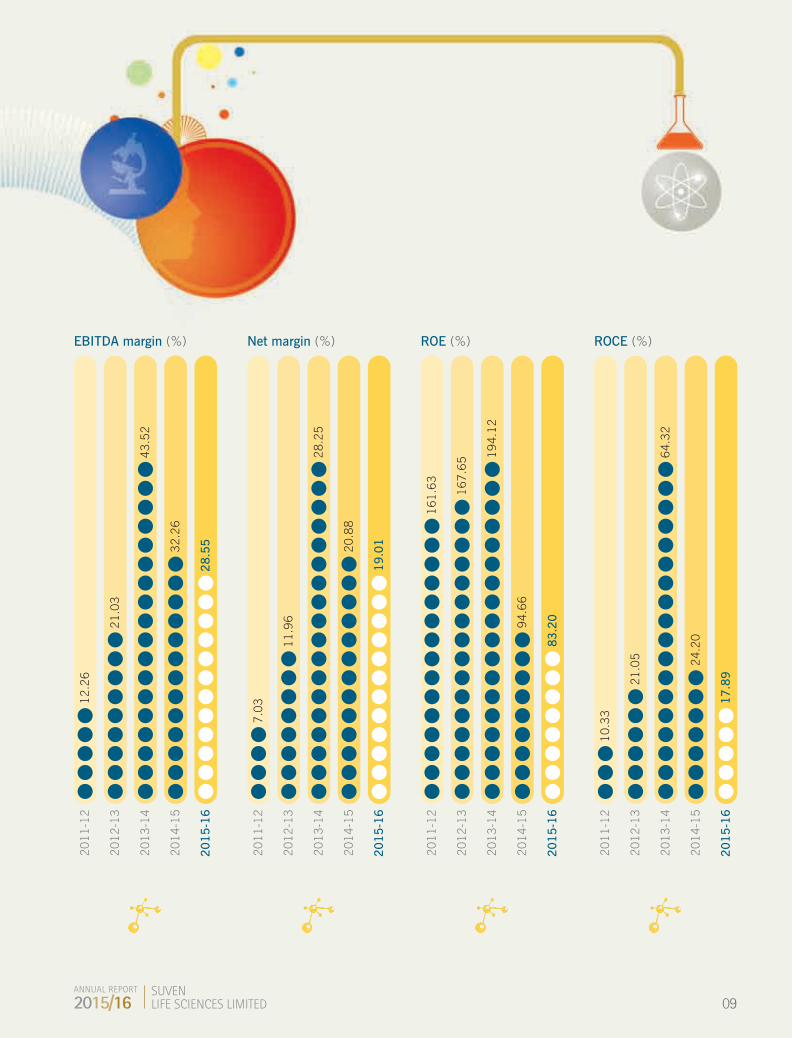
EBITDA margin (%)
12.2
620
11-1
2
21.0
320
12-1
3
43.5
220
13-1
4
32.2
620
14-1
5
28
.55
20
15
-16
Net margin (%)
7.03
2011
-12
11.9
620
12-1
3
28.2
520
13-1
4
20.8
820
14-1
5
19
.01
20
15
-16
ROE (%)
161.
6320
11-1
2
167.
6520
12-1
3
194.
1220
13-1
4
94.6
620
14-1
5
83
.20
20
15
-16
ROCE (%)
10.3
320
11-1
2
21.0
520
12-1
3
64.3
220
13-1
4
24.2
020
14-1
5
17
.89
20
15
-16
09ANNUAL REPORT
2015/16SUVENLIFE SCIENCES LIMITED

STATEMENT FROM THE CHAIRMAN’S DESK
SUVEN’S BUSINESS MODEL IS TRANSFORMING FROM THE PERCEIVED UNPREDICTABLE TO THE INCREASINGLY STABLE.
Dear shareholders, FISCAL 2015-16 WAS A CHALLENGING YEAR FOR OUR BUSINESS.
The year proved challenging because as the prevailing business environment compelled global innovator companies to reduce their R&D budgets and moderate the growth in their existing pipeline.
This reality resulted in reduced opportunities and termination of a number of projects, affecting our growth and profitability.
The result was that our company reported a decline in revenues, EBIDTA and net profit by 2%, 15% and 13% respectively over the previous year. This decline would have been sharper but for an increase in speciality chemical intermediate volumes.
I must indicate that this volume increase coincided with the commissioning of our Vishakhapatnam facility. The speciality chemical vertical generated H224 crore in revenues for the whole year, a 40% growth over the previous year.
For years, our story was being addressed with revenue haziness. The more pertinent message that I wish to communicate is that Suven’s business model is transforming from the perceived unpredictable to the increasingly stable due to stable business in speciality chemicals and commercialised products in CRAMS.
Revenue visibility and stable cash flows are critical at this juncture of Suven’s journey for a good reason. We need large cash flows to take our exciting NCE pipeline of four candidates in the clinical trial stage – SUVN-502 (Phase 2A), SUVN-G3031 and SUVN-D4010 (Phase 1) and SUVN-911 ready to start Phase 1. It is estimated that for clinical development of SUVN-502, for Phase 2A study in USA, the Company would need to invest US$25 million.
At Suven, we are prepared for this game-changer. Our war chest of about H241 crore in cash as on March 31, 2016 and cash flow visibility from our CRAMS business over a three to five year horizon (conservatively) provides comfort in taking our NCE development ahead to its logical conclusion.
10
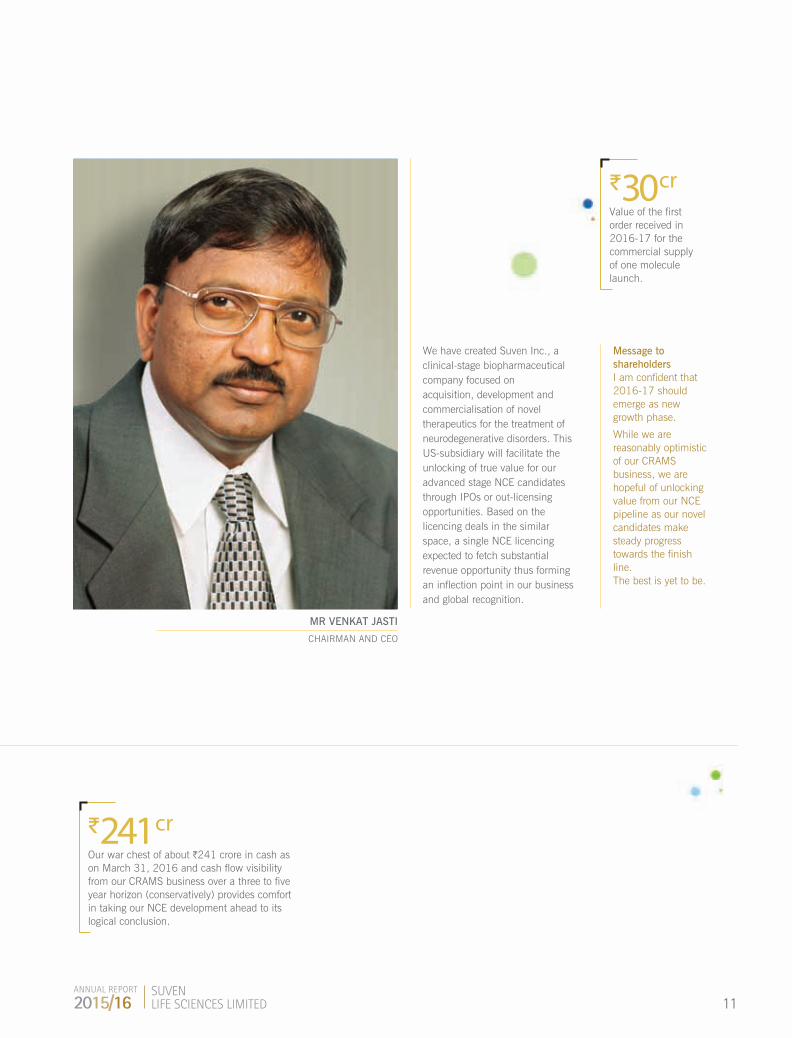
We have created Suven Inc., a clinical-stage biopharmaceutical company focused on acquisition, development and commercialisation of novel therapeutics for the treatment of neurodegenerative disorders. This US-subsidiary will facilitate the unlocking of true value for our advanced stage NCE candidates through IPOs or out-licensing opportunities. Based on the licencing deals in the similar space, a single NCE licencing expected to fetch substantial revenue opportunity thus forming an inflection point in our business and global recognition.
Message to shareholdersI am confident that 2016-17 should emerge as new growth phase.
While we are reasonably optimistic of our CRAMS business, we are hopeful of unlocking value from our NCE pipeline as our novel candidates make steady progress towards the finish line.The best is yet to be.
J241crOur war chest of about H241 crore in cash as on March 31, 2016 and cash flow visibility from our CRAMS business over a three to five year horizon (conservatively) provides comfort in taking our NCE development ahead to its logical conclusion.
J30crValue of the first order received in 2016-17 for the commercial supply of one molecule launch.
MR VENKAT JASTI
CHAIRMAN AND CEO
11ANNUAL REPORT
2015/16SUVENLIFE SCIENCES LIMITED
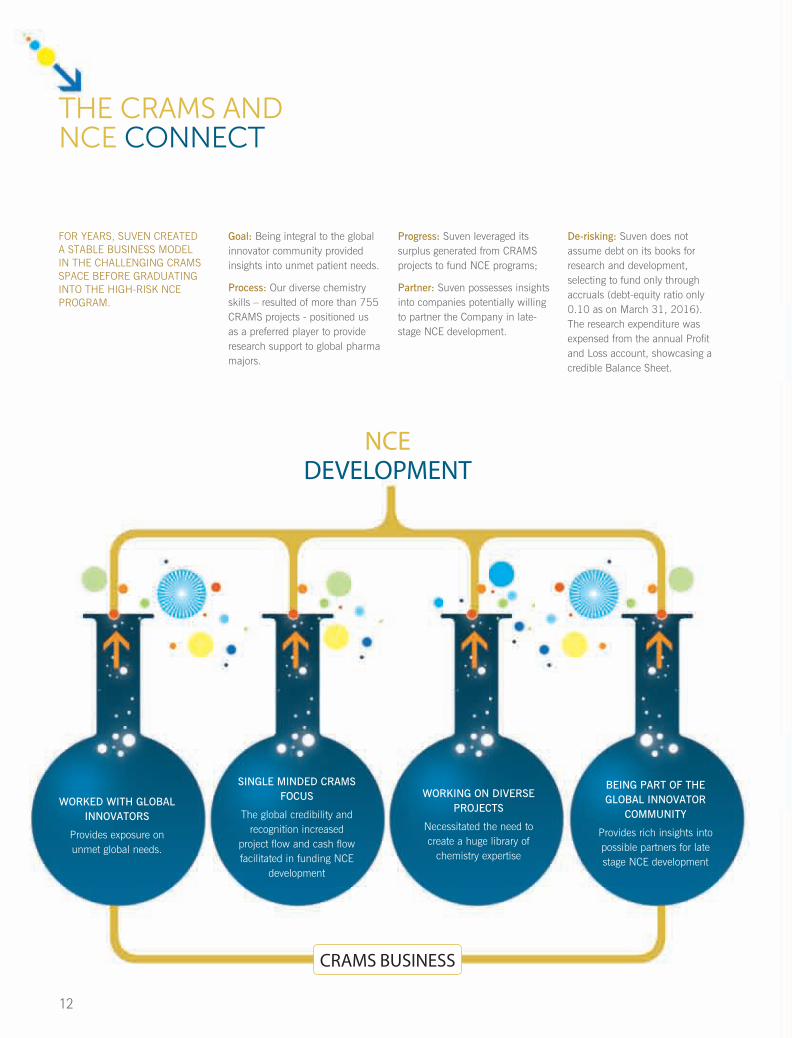
THE CRAMS AND NCE CONNECT
FOR YEARS, SUVEN CREATED A STABLE BUSINESS MODEL IN THE CHALLENGING CRAMS SPACE BEFORE GRADUATING INTO THE HIGH-RISK NCE PROGRAM.
Goal: Being integral to the global innovator community provided insights into unmet patient needs.
Process: Our diverse chemistry skills – resulted of more than 755 CRAMS projects - positioned us as a preferred player to provide research support to global pharma majors.
Progress: Suven leveraged its surplus generated from CRAMS projects to fund NCE programs;
Partner: Suven possesses insights into companies potentially willing to partner the Company in late-stage NCE development.
De-risking: Suven does not assume debt on its books for research and development, selecting to fund only through accruals (debt-equity ratio only 0.10 as on March 31, 2016). The research expenditure was expensed from the annual Profit and Loss account, showcasing a credible Balance Sheet.
WORKED WITH GLOBAL INNOVATORS
Provides exposure on unmet global needs.
SINGLE MINDED CRAMS FOCUS
The global credibility and recognition increased
project flow and cash flow facilitated in funding NCE
development
BEING PART OF THE GLOBAL INNOVATOR
COMMUNITY
Provides rich insights into possible partners for late stage NCE development
WORKING ON DIVERSE PROJECTS
Necessitated the need to create a huge library of
chemistry expertise
CRAMS BUSINESS
NCE DEVELOPMENT
12

OUR COMPETITIVE ADVANTAGE
Present across the CRAMS value chain – intermediates and
APIs
Leveraging capabilities to deliver NCE research
State-of-the-art facilities located across the states of
Telengana and Andhra Pradesh
Repeat business derived from long-standing relationships with
MNC customers
Long-term commercial supply opportunity following the launch of products by global sponsors
Engagement with innovator companies in developed markets
around stringent regulations
94% revenues derived from exports
Among few global players present in high-value CNS segment research
Built strong intellectual capabilities in CNS segment since 2005 (CNS second-largest and fastest-growing
segment)
Even a single successful molecule could offer a significant revenue
opportunity
Promising NCE research pipeline of 13 molecules
Pioneer in CRAMS business – research to execution
An integrated research service provider with unmatched
capabilities
Qualified research team of 385 scientists (30 PhDs)
EXECUTION COMPETENCE
INDUSTRY RELATIONSHIPS
PROMISING NCE PIPELINE
STRONG RESEARCH ORIENTATION
13ANNUAL REPORT
2015/16SUVENLIFE SCIENCES LIMITED

OPERATIONAL OVERVIEW
A“EVEN AS OUR 2015-16 PERFORMANCE DECLINED, WE ARE SATISFIED WITH OUR PERFORMANCE”
How would you describe the Company’s performance in 2015-16?In comparison to 2014-15, our topline and bottomline numbers were 2% and 13% lower, and yet I would say that we were fairly satisfied with our performance.
How would you explain this?At the start of 2015-16, we had anticipated a decline in our financial performance considering the global pharmaceutical environment and reduced R&D spending by our customers and successful project completion may not necessarily translate into repeat orders if the project does not carry through at the innovator’s end.. Despite this reality, we surpassed our target: against a topline estimate of H475 crore for the year under review, we reported H519 crore of revenue; against a net profit target of H85 crore, we delivered H95 crore.
What were the reasons for the decline in numbers? Only one: our CRAMS business, the flagship business, declined by about 18% over the previous year. This decline was due to a change in our product mix (high-value, high-margin to low
margin) which impacted our profitability. Our EBIDTA (post-R&D expenses) declined 400 bps from 32% in 2014-15 to 27% in 2015-16.
Your Q4/2015-16 performance represented a significant improvement over the previous nine-month performance. During the fourth quarter the CRAMS business increased as some Phase I projects graduated to Phase 2, generating increased volumes with superior profitability. Also the speciality chemical supplies increased substantially thus paving the growth and profitability.
Is this trend likely to sustain?The CRAMS business is expected to sustain growth from existing projects. The addition of two clients in 2015-16 should add to our project pipeline. For the speciality chemicals business, we expect to sustain the volumes through the current year.
Our recently-commissioned Vishakhapatnam facility provides us with the legroom to seamlessly manage increased operations. We are transferring our speciality chemical intermediate manufacturing operation fully to this unit which
Q
27%EBIDTA reported by the Company in 2015-16
14

in turn will release significant capacity to strengthen our CRAMS project execution in future.
What NCE pipeline milestones were achieved in 2015-16?Our key molecules advanced along the development cycle. SUVN-502 entered the Phase 2A trial; We need a patient pool of 537 across 90 US sites for conducting these trials. Besides, our molecules SUVN-G3031 and SUVN-D4041 reported heartening progress along the development cycle, clearing the safety hurdle by completing Phase 1 studies in USA under US-IND.
Can you provide some colour on the expectations for 2016-17?We are optimistic that fiscal 2016-17 could emerge as a next level growth phase in CRAMS vertical while the NCE vertical promises to unlock significant value.
SUVN-502entered the Phase 2A trial; We need a patient pool of 537 across 90 US sites for conducting these trials.
CRAMS business: We hope to receive commercial orders for three NCEs launched by our global customers in addition to an increase in CRAMS projects and speciality chemical intermediate supplies.
NCE vertical: Our key molecule SUVN-502 is in Proof of Concept (POC), Phase 2A clinical trials; SUVN-G3031 and SUVN-D4010 waiting to enter next stage of clinical development.
Suven is not a typical manufacturing business.
The Company is in a high-risk, high-return business, where the performance of a year cannot represent the base for estimating the next.
The Company’s prospects are dependent on R&D and budgets of global pharmacos, growth and profitability often being lumpy.
This reality makes it imperative for the Company to be appraised across three-year blocks.
FY2007-2010 FY2011-2013 FY2014-2016
Revenue (H crore) 399 618 1563
Growth over the earlier block 55% 153%
EBIDTA (H crore) 53 94 533
Growth over the earlier block 79% 466%
Net Profit (H crore) 22 56 348
Growth over the earlier block 147% 526%
SUVEN’S PERFORMANCE THROUGH THREE-YEAR BLOCKS
15ANNUAL REPORT
2015/16SUVENLIFE SCIENCES LIMITED
MANAGEMENT DISCUSSION AND ANALYSIS
Indian economic overviewAgainst a subdued global economic environment, the Indian economy grew at 7.6% in 2015-16 (7.2% in 2014-15) emerging as one of the fastest-growing nations in the globe. The economic growth was bolstered by an improvement in fortunes of the manufacturing sector (9.5% growth in 2015-16 against a 5.5% growth in 2014-15) and gains accrued from declining crude oil prices. The Indian economy expanded by 7.9% year-on-year in the first three months of 2016, higher than 7.2% growth in the previous quarter. It was the best performance in the past six quarters, as the farm sector rebounded and grew by 2.3% and the manufacturing sector output jumped 9.3%. Given the macroeconomic scenario and assuming normal 2016-17 monsoons, the Indian economy is set to register growth in excess of 7% for the third successive year. Against an unsupportive global economic landscape and weak back-to-back monsoons, a 7.6% GDP growth in 2015-16 (as estimated by the Central Statistics Organisation) was deemed encouraging.
Global pharmaceutical spaceThe unprecedented expansion in global healthcare access over the past ten years – ranging from hundreds of millions of people in low and middle-income countries gaining access via government programmes rising incomes and to the reduction in the uninsured population is expected to result in a significant increase in the volume of medicines consumed globally.
The volume of medicines consumed globally is expected to reach 4.5 trillion doses by 2020 (up by 24% from 2015). The largest pharmaceutical-using countries will be the pharmerging markets, accounting for two-thirds of global medicine volumes. This will mostly comprise generic medicines catalysed by dramatic increases in the utilisation of medicines due to broad-based healthcare expansions.
Global spending on medicines will reach US$1.4 trillion by 2020, an increase of 29-32% from 2015 compared to an increase of 35% in the past years. Spending on specialty therapies will continue to be more significant in developed markets than in pharmerging
Global economic overviewIN 2015, GLOBAL ECONOMIC ACTIVITY REMAINED SUBDUED LEADING TO A 3.1% GROWTH, MARGINALLY LOWER THAN IT WAS IN 2014. Preliminary data suggests that global growth during the second half of 2015 at 2.8% was weaker than forecasts on account of softer activity in the United States, Japan and advanced Asian economies. The World Economic Outlook forecasts global growth at 3.2% in 2016 and 3.5% in 2017. Growth in advanced economies is projected to remain at a modest 2%, the recovery hampered by weak demand, partly held down by unresolved crises, unfavourable demographics and low productivity. While emerging markets and developing economies will account for the largest share of global growth in 2016, prospects across countries remain uneven and generally weaker than during the past two decades.
8xCost per Novel Molecular Entity saw an 8x increase from US$140 million in the mid-1970s to US$ 1,200 million in the early-2000s
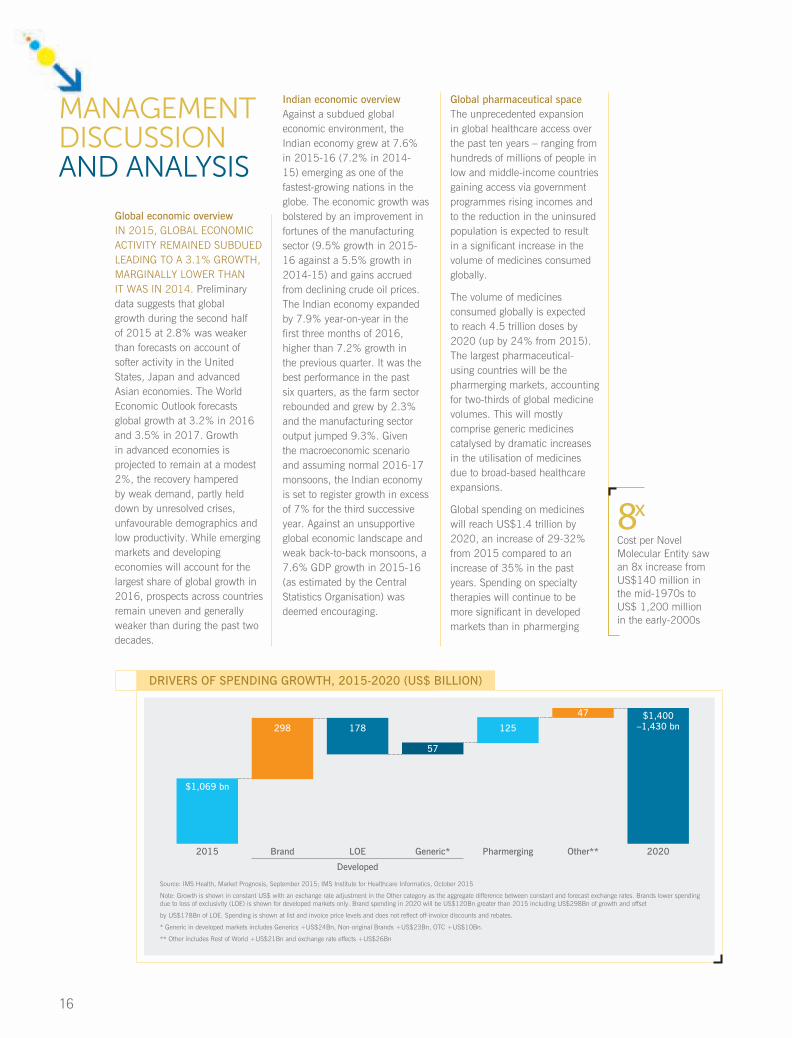
DRIVERS OF SPENDING GROWTH, 2015-2020 (US$ BILLION)
Source: IMS Health, Market Prognosis, September 2015; IMS Institute for Healthcare Informatics, October 2015
Note: Growth is shown in constant US$ with an exchange rate adjustment in the Other category as the aggregate difference between constant and forecast exchange rates. Brands lower spending due to loss of exclusivity (LOE) is shown for developed markets only. Brand spending in 2020 will be US$120Bn greater than 2015 including US$298Bn of growth and offset
by US$178Bn of LOE. Spending is shown at list and invoice price levels and does not reflect off-invoice discounts and rebates.
* Generic in developed markets includes Generics +US$24Bn, Non-original Brands +US$23Bn, OTC +US$10Bn.
** Other includes Rest of World +US$21Bn and exchange rate effects +US$26Bn
2015
$1,069 bn
Brand
298 178 125
47 $1,400–1,430 bn
LOE
Developed
Generic*
57
Pharmerging Other** 2020
16
markets. Spending growth will be driven by brands and increased usage in pharmerging markets, but will be offset by patent expiries and net price reductions.
CRAMS: Contract research and manufacturing services (CRAMS) is one of the fastest growing sectors in the pharmaceutical and biotechnology industry spaces. CRAMS span the entire range of services – a manufacturing contract of generic drugs which will allow partnering innovators to introduce new molecules for new-age ailments.
NCE-based CRAMS services span the range of R&D activities from New Chemical Entity (NCE) discovery, development and manufacturing. Huge investments coupled with low R&D productivity are driving companies to cut manufacturing costs by outsourcing their
research and manufacturing activities to cost-efficient nations.
Outsourcing to India offers significant benefits over the other matured pharmaceutical hubs in North America and Europe. India emerged as one of the leading cost-efficient, quality manufacturers of pharmaceuticals for a number of global players and multinational companies. Moreover, the ongoing economic crisis along with the increase in prices of generics are forcing global pharmaceutical companies to leverage the strengths of Indian pharmaceutical players in research and manufacturing areas.
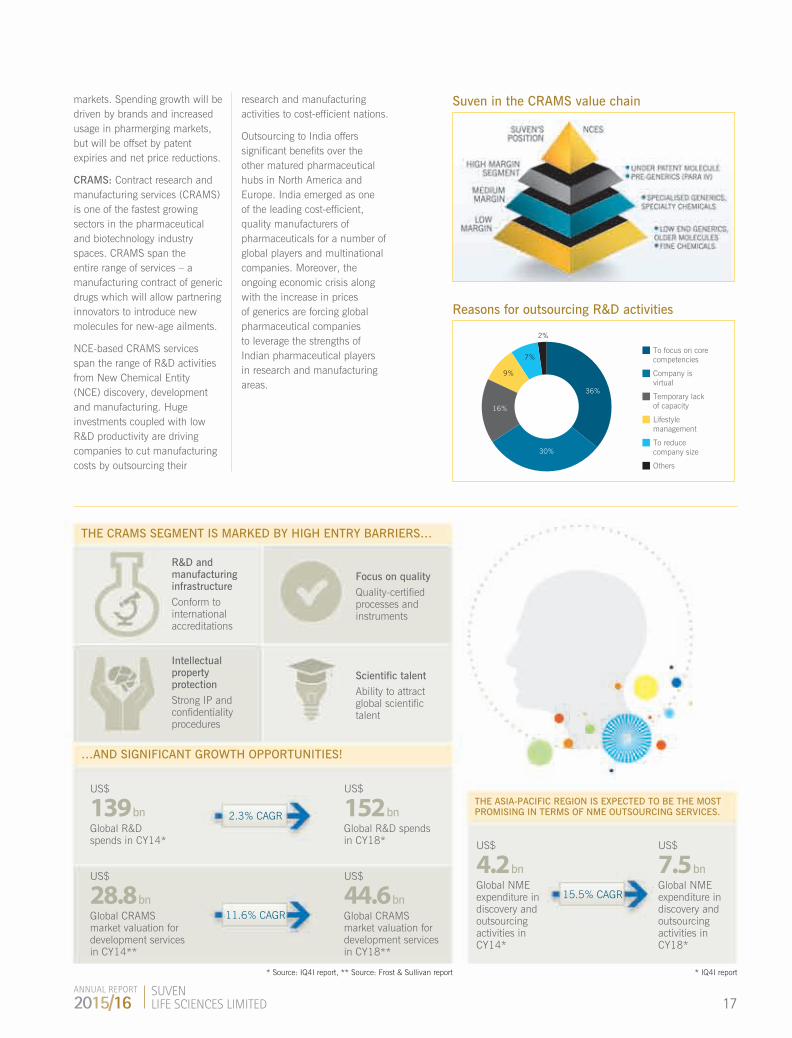
Suven in the CRAMS value chain
Reasons for outsourcing R&D activities
THE CRAMS SEGMENT IS MARKED BY HIGH ENTRY BARRIERS…
…AND SIGNIFICANT GROWTH OPPORTUNITIES!
THE ASIA-PACIFIC REGION IS EXPECTED TO BE THE MOST PROMISING IN TERMS OF NME OUTSOURCING SERVICES.
R&D and manufacturing infrastructureConform to international accreditations
Scientific talentAbility to attract global scientific talent
Intellectual property protectionStrong IP and confidentiality procedures
US$
139 bnGlobal R&D spends in CY14*
US$
28.8 bnGlobal CRAMS market valuation for development services in CY14**
* Source: IQ4I report, ** Source: Frost & Sullivan report * IQ4I report
US$
152 bnGlobal R&D spends in CY18*
US$
44.6 bnGlobal CRAMS market valuation for development services in CY18**
US$
4.2 bnGlobal NME expenditure in discovery and outsourcing activities in CY14*
US$
7.5 bnGlobal NME expenditure in discovery and outsourcing activities in CY18*
2.3% CAGR
15.5% CAGR
11.6% CAGR
Focus on qualityQuality-certified processes and instruments
7%
2%
9%
16%
30%
36%
To focus on core competencies
Company is virtual
Temporary lack of capacity
Lifestyle management
To reduce company size
Others
17ANNUAL REPORT
2015/16SUVENLIFE SCIENCES LIMITED

OPERATIONAL OVERVIEW01
CONTRACT RESEARCH AND MANUFACTURING OPERATIONS (CRAMS)
also provides long-term revenue visibility. It involves supplies of intermediates for NCEs that have cleared clinical trials and are ready for launch. Suven supplied pre-launch material for three products which received FDA approvals in FY14 and FY15. The commercial supply of one of the intermediates for these products is expected to begin in FY17.
Supply of intermediates for specialty chemicals: Suven is supplying intermediates for one specialty chemical product to a large global pharmaceutical and agrochemical conglomerate.
Segment performance, 2015-16Revenues declined by 2% from H521 crore in 2014-15 to H500 crore in 2015-16. This decline was due to a fall in revenues from base CRAMS projects as a few Phase-II projects were dropped by clients. This decline was cushioned by a considerable increase in revenues from specialty chemicals. The Company added two new clients to its CRAMS business. The
Company commenced operations at its Vishakhapatnam unit and shifted the manufacturing intermediates for a specialty chemical product to this unit. The shift not only optimised capacities at its CRAMS facilities but also made the CRAMS operations more efficient.
Business differentiatorsService: The Company is engaged in manufacture of niche NCE-based CRAMS – developing and manufacturing intermediates for NCEs for innovators companies.
Experience: The Company enjoys a two decade-long experience in the CRAMS business.
Expertise: The Company’s cutting-edge technology and adherence to globally-best practices have enabled it undertake 750+ projects belonging to global pharmaceutical companies.
Intellectual capital: The Company’s CRAMS team comprises 265 members of which 30 members hold master’s
Suven is a pure-play CRAMS player with a visible presence at the top-end of the CRAMS value chain, assisting global innovators in drug development by supplying intermediates with relevant NCEs during the clinical phase of drug development. The projects undertaken by the Company include process research, custom synthesis and intermediate manufacture. This flagship business segment accounts for more than 90% of the Company’s revenues. Within the CRAMS vertical, the Company has three revenue streams.
Base CRAMS: Suven works with global innovator companies, supplying intermediates for their NCEs during the clinical phase of drug development. When successful, this can translate into long-term supply agreements following launch. Over the years, Suven has reported a consistent rise in the number of active products under CRAMS. Currently, this accounts for the lion’s share of the CRAMS vertical’s revenues.
CRAMS for commercial products: This vertical is a high-value, high-margin vertical which
Growth in our business
2011-12
84Active projects
206Revenue (J crore)
25.21EBIDTA (J crore)
18

degrees and PhDs enabling it to service the top-end of the CRAMs value pyramid.
Relationships: The Company enjoys healthy business relationships with its customers thereby ensuring that all its business is repeat and referral-based in nature.
OptimismCARE ratings estimate that the Indian CRAMS industry’s share will increase to approximately 8-9% of global CRAMS market by 2018 from approximately 6% in 2013.
Looking forwardGoing ahead, the CRAMS business is expected to make a sizeable contribution to business growth as commercial production of three products are expected to begin during the current year. The Company is hopeful of generating repeat business from existing customers, as the global markets have started to look positive.
2015-16
2011-12 2012-13 2013-14 2014-15 2015-16
Active Phase-I projects 51 46 52 57 64
Active Phase-II projects 32 41 46 52 48
Active Phase-III projects 1 3 1 1 1
Total active projects 84 90 99 110 116
113Active projects
500Revenue (J crore)
142.60EBIDTA (J crore)
19ANNUAL REPORT
2015/16SUVENLIFE SCIENCES LIMITED
OPERATIONAL OVERVIEW02
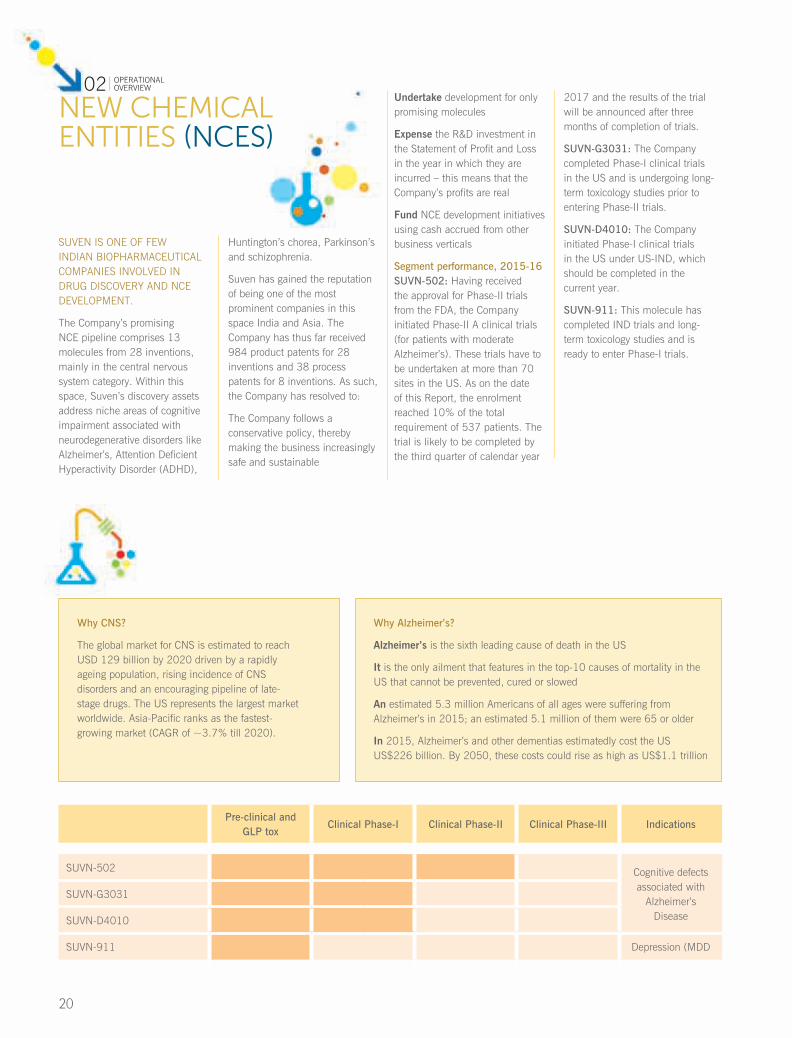
NEW CHEMICAL ENTITIES (NCES)
Undertake development for only promising molecules
Expense the R&D investment in the Statement of Profit and Loss in the year in which they are incurred – this means that the Company’s profits are real
Fund NCE development initiatives using cash accrued from other business verticals
Segment performance, 2015-16SUVN-502: Having received the approval for Phase-II trials from the FDA, the Company initiated Phase-II A clinical trials (for patients with moderate Alzheimer’s). These trials have to be undertaken at more than 70 sites in the US. As on the date of this Report, the enrolment reached 10% of the total requirement of 537 patients. The trial is likely to be completed by the third quarter of calendar year
2017 and the results of the trial will be announced after three months of completion of trials.
SUVN-G3031: The Company completed Phase-I clinical trials in the US and is undergoing long-term toxicology studies prior to entering Phase-II trials.
SUVN-D4010: The Company initiated Phase-I clinical trials in the US under US-IND, which should be completed in the current year.
SUVN-911: This molecule has completed IND trials and long-term toxicology studies and is ready to enter Phase-I trials.
SUVEN IS ONE OF FEW INDIAN BIOPHARMACEUTICAL COMPANIES INVOLVED IN DRUG DISCOVERY AND NCE DEVELOPMENT.
The Company’s promising NCE pipeline comprises 13 molecules from 28 inventions, mainly in the central nervous system category. Within this space, Suven’s discovery assets address niche areas of cognitive impairment associated with neurodegenerative disorders like Alzheimer’s, Attention Deficient Hyperactivity Disorder (ADHD),
Huntington’s chorea, Parkinson’s and schizophrenia.
Suven has gained the reputation of being one of the most prominent companies in this space India and Asia. The Company has thus far received 984 product patents for 28 inventions and 38 process patents for 8 inventions. As such, the Company has resolved to:
The Company follows a conservative policy, thereby making the business increasingly safe and sustainable
Why CNS?
The global market for CNS is estimated to reach USD 129 billion by 2020 driven by a rapidly ageing population, rising incidence of CNS disorders and an encouraging pipeline of late-stage drugs. The US represents the largest market worldwide. Asia-Pacific ranks as the fastest-growing market (CAGR of ~3.7% till 2020).
Why Alzheimer’s?
Alzheimer’s is the sixth leading cause of death in the US
It is the only ailment that features in the top-10 causes of mortality in the US that cannot be prevented, cured or slowed
An estimated 5.3 million Americans of all ages were suffering from Alzheimer’s in 2015; an estimated 5.1 million of them were 65 or older
In 2015, Alzheimer’s and other dementias estimatedly cost the US US$226 billion. By 2050, these costs could rise as high as US$1.1 trillion
Pre-clinical and GLP tox
Clinical Phase-I Clinical Phase-II Clinical Phase-III Indications
SUVN-502 Cognitive defects associated with
Alzheimer’s Disease
SUVN-G3031
SUVN-D4010
SUVN-911 Depression (MDD
20

ANALYSIS OF FINANCIAL STATEMENTS(Based on standalone financial statements)
Statement of Profit and Loss
Margins
Total income
EBIDTA margin
Total expenses
“We did better than our guidance. We look forward to rebounding strongly in 2016-17.”
Mr. Venkat Jasti, Chairman & CEO
518.872015-16 (J crore)
27.482014-15 (%)
398.412015-16 (J crore)
529.442014-15 (J crore)
31.742014-15 (%)
377.882014-15 (J crore)
(2)Decline over the previous year (%)
(426)Decline over the
previous year (bps)
5.43Increase over the previous year (%)
Revenue from operations declined by 2% from H520.85 crore in 2014-15 to H499.52 crore. This decline was primarily due to a drop in the base CRAMS
business. The drop was partly arrested by a considerable increase in sales volumes in the intermediates for the specialty chemicals segment. Other
incomes more than doubled from H8.58 crore in 2014-15 to H19.35 crore in 2015-16 – the return on investments being the key reason for this upsurge.
The drop in the CRAMs business impacted business profitability. EBIDTA declined from H168.04 crore in 2014-15 to H142.60 crore in 2015-16. Profit declined
from H151.55 crore in 2014-15 to H120.47 crore in 2015-16 while margins declined from 29% in 2014-15 to 23% in 2015-16. Consolidating the accounts of
Suven, Inc., USA, the wholly-owned subsidiary, the profit after tax reduced to H66.70 crore and expenditure on R&D increased to H91.10 crore.
Materials and manufacturing costs increased by less than 1% over the previous year. This was primarily due to an increase in supplies of specialty chemical intermediates. Employee costs increased by 14% over the previous year.
The Company’s R&D expenses also increased by 12% – from
H55.96 crore in 2014-15 to H62.95 crore in 2015-16. The increase was primarily due to pre-clinical and clinical development of various NCE molecules reaching early stages.
Finance costs increased marginally by 15% over the previous year as interest on long-term loans taken for the
Vishakhapatnam facility were not expensed to the Statement of Profit and Loss (earlier added to the gross block). Subsequently, interest cover declined marginally from 81.24x in 2014-15 to 74.54x in 2015-16. 12.13
R&D expenses as a percentage of the total income, FY2015-16
21ANNUAL REPORT
2015/16SUVENLIFE SCIENCES LIMITED

Balance SheetThe capital employed in the business increased from H645.75 crore as on March 31, 2015 to H675.51 crore as on March 31, 2016.
Cash flow statement
Net worth
Liabilities
Assets
623.64As of March 31, 2016
(J crore)
184.27As of March 31, 2016
(J crore)
443.72As of March 31, 2016
(J crore)
559.31As of March 31, 2015
(J crore)
213.82As of March 31, 2015
(J crore)
209.52As of March 31, 2015
(J crore)
11.50Increase over the previous year (%)
13.82Decrease over the previous year (%)
52.73Decrease over the previous year (%)
The Company’s equity capital comprises 12,72,82,478 equity shares with a face value of H1 per share. The equity capital remained unchanged over the
previous year. The balance under reserves and surplus increased by 11.26% from H546.59 crore as on March 31, 2015 to H610.92 crore as on March 31, 2016.
This increase was primarily on account of operational surplus ploughed back into the business. The entire reserve balance was free in nature. The book value per
share increased from H43.94 as on March 31, 2015 to H49.00 as on March 31, 2016.
Long-term borrowings declined from H61.45 crore as on March 31, 2015 to H43.23 crore as on March 31, 2016 – due to repayments made during the year (H18.23 crore) and transfer to other current liabilities (H16.75
crore – to be paid over the next 12 months). Short-term borrowings also declined from H28.23 crore as on March 31, 2015 to H24.16 crore as on March 31, 2016. Trade payables declined from H43.89 crore on
March 31, 2015 to H35.33 crore on March 31, 2016. Other current liabilities decreased by 1.09% over the previous year – due to a significant decrease in maturities payable during the year.
The fixed tangible assets balance increased from H290.31crore as on March 31, 2015 to H443.39 crore as on March 31, 2016 – consequent to the commissioning of the Vishakhapatnam facility and routine capital expenditure (H153.20 crore in 2015-16). Consequently, the balance under
capital work-in-progress declined from H107.01 crore as on March 31, 2015 to H7.20 crore as on March 31, 2016.
Current assets declined marginally from H476.98 crore as on March 31, 2015 to H466.68 crore as on March 31, 2016.
Increases in inventories, trade receivables and short-term loans were offset by a decline in the cash and bank balances. The working capital cycle stood at 244 days in 2015-16 against 236 days in 2014-15.
Cash earnings: Decline in the business operations and an increase in working capital requirements reduced the cash generated from operating activities from H142.90 crore
in 2014-15 to H92.20 crore in 2015-16.
Cash deployment: Purchase of fixed assets, repayment of borrowings (and interest thereon) and dividend payout, among
others, resulted in new cash outflow of H131.77 crore in 2015-16.
Subsequently, the cash and cash equivalent balance at the end of the year declined from H279.36
crore as on March 31, 2015 to H239.79 crore as on March 31, 2016.
0.10x The Company’s debt-equity ratio improved as on March 31, 2016 compared to 0.14x as on March 31, 2015
240.64 Cash and bank balance (H crore) as on March 31, 2016.
22

MANAGING BUSINESS RISKS
A business’s risk management strategy needs to evolve in line with altering macroeconomic dynamics. Your Company has always had a systematic approach to risk management. Centrally-issued policies and divisionally-evolved procedures ensure that business risks are effectively addressed. Some of the key risks which impact your business and their mitigation measures are outlined below.
Growth riskA large dependence on CRAMS could impede the Company’s ability to grow business over the medium-term.
01
Risk mitigation: Within the CRAMs segment, the Company has three revenue verticals –base CRAMS, intermediates for specialty chemicals and commercial supplies for NCEs. Despite being uncertain, the
CRAMS business continues to register healthy volumes thanks to the respect earned by Suven among global innovator companies. The Company’s specialty chemicals vertical has grown over the years – from
negligible size in 2011-12 to H224 crore in 2015-16. Moreover, commercial supplies to three NCEs are expected to commence in 2016-17 which is expected to propel business growth over the medium-term.
Base CRAMS risk
NCE risk
Funding risk
Lack of clinical success at the innovator-level could lead to business opportunities being lost.
Development of new molecules is a high-risk business as it requires sustained investment of time, people and funds which ultimately might not materialise into anything substantial.
Inability to garner adequate funds for business growth could adversely impact shareholder value creation.
02
03
04
Risk mitigation: Suven is a pure-play CRAMs player with more than two decades of rich experience across more than 750 projects for global innovator companies; the Company has a 99% success rate in project
execution and delivery. This has earned it the reputation of a preferred business partner for global pharmaceutical players focused on NCE development. This is reflected in the increasing number of active projects – 80 in
2010-11 to 110 in 2015-16. As the global economy revives, R&D efforts on NCE development are expected to intensify. This should open up interesting opportunities for the Company, going forward.
Risk mitigation: Suven has a rich pipeline of 13 molecules which are under various stages of development. Nine molecules have cleared the pre-clinical stages of the development cycle. But, the Company adopted a cautious strategy of cherry-picking
the most potent molecules for further development ensuring that it can seamlessly fund its NCE programme using cash accruals from other verticals. Consequently, only four molecules have reached clinical development stage.
Its SUVN-502 is the most promising molecule at Phase-II a clinical trials (human trials) stage. Thereafter, the Company will look for opportunities for further development or monetisation of these molecules.
Risk mitigation: Suven enjoys a strong financial position. The Company’s low debt-equity ratio at 0.10x (March 31, 2016) enables it to leverage its financial statements for funding
its capital investments. Besides, a H241 crore cash balance as on March 31, 2016 showcase the Company’s liquidity which can be used to address the increasing cash requirement of
its NCE business. Moreover, with the commissioning of its Vishakhapatnam facility, the Company does not have any significant capex project for the current year.
23ANNUAL REPORT
2015/16SUVENLIFE SCIENCES LIMITED
Board’s ReportTo,
The Members of Suven Life Sciences Limited
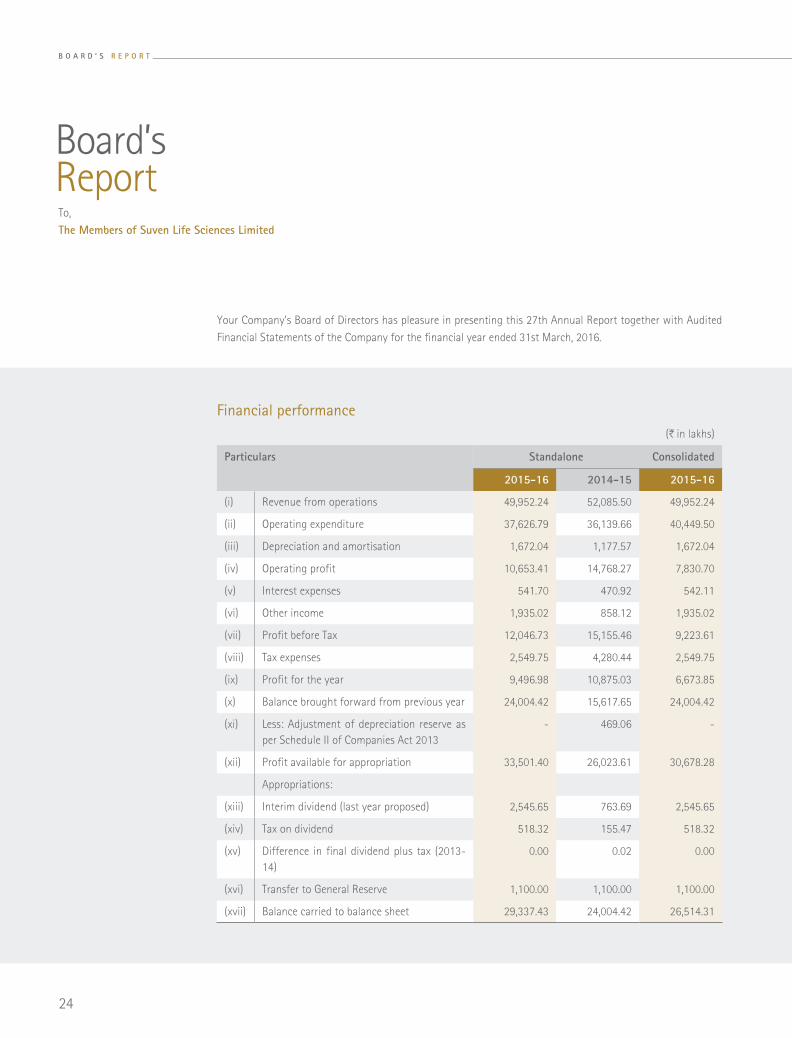
Your Company’s Board of Directors has pleasure in presenting this 27th Annual Report together with Audited
Financial Statements of the Company for the financial year ended 31st March, 2016.
Financial performance (H in lakhs)
Particulars Standalone Consolidated
2015-16 2014-15 2015-16
(i) Revenue from operations 49,952.24 52,085.50 49,952.24
(ii) Operating expenditure 37,626.79 36,139.66 40,449.50
(iii) Depreciation and amortisation 1,672.04 1,177.57 1,672.04
(iv) Operating profit 10,653.41 14,768.27 7,830.70
(v) Interest expenses 541.70 470.92 542.11
(vi) Other income 1,935.02 858.12 1,935.02
(vii) Profit before Tax 12,046.73 15,155.46 9,223.61
(viii) Tax expenses 2,549.75 4,280.44 2,549.75
(ix) Profit for the year 9,496.98 10,875.03 6,673.85
(x) Balance brought forward from previous year 24,004.42 15,617.65 24,004.42
(xi) Less: Adjustment of depreciation reserve as per Schedule II of Companies Act 2013
- 469.06 -
(xii) Profit available for appropriation 33,501.40 26,023.61 30,678.28
Appropriations:
(xiii) Interim dividend (last year proposed) 2,545.65 763.69 2,545.65
(xiv) Tax on dividend 518.32 155.47 518.32
(xv) Difference in final dividend plus tax (2013-14)
0.00 0.02 0.00
(xvi) Transfer to General Reserve 1,100.00 1,100.00 1,100.00
(xvii) Balance carried to balance sheet 29,337.43 24,004.42 26,514.31
24
B O A R D ’ S R E P O R T
Review of operationsYour Company has achieved a standalone sales volume of H49,952
lakhs as against H52,086 lakhs in the previous year. Profit after Tax
(PAT) of the Company was down by 13% to H9,497 lakhs from H10,875
lakhs in the previous financial year. The Earnings per Share (EPS) of your
Company has come down to H7.46 in fiscal 2015-16 per share from the
previous year EPS of H9.04 in fiscal 2014-15 per share.
During the year your Company has formed a wholly owned subsidiary
by name Suven, Inc a Delaware Company in USA. As result of the
consolidation for the year 2015-2016 the profit after tax reduced
from INR 9496.97 lakhs to 6673.85 lakhs due to clinical development
expenditure incurred by Suven, Inc., on SUVN-502.
ExportsYour Company continue to achieve a major chunk of revenues from the
exports accounting for a volume of H46879 lakhs, representing 94% of
the total revenue of H49952 lakhs during the year under review.
DividendYour Directors had recommended and paid an interim dividend of
H1.00 per equity share and a onetime special dividend of H1.00 per
equity share totaling to H2.00 per equity share (last year H0.60 paise
per equity share) during March, 2016. Your Directors recommend that
interim dividend paid may be treated as the final dividend for the year
2015-2016.
The total cash outflow on account of dividends paid including dividend
distribution tax paid is H3064 lakhs. The Company has paid the said
dividend to the shareholders who are on the Register of Members of the
Company as on the Record Date 15th March 2016 notified to the stock
exchanges in terms of SEBI (LODR) Regulations, 2015.
Transfer to reservesThe Company transferred 1100 lakhs to the general reserve during the
current financial year.
Research and developmentDuring the year Suven’s thrust on innovative R&D in CNS therapies continued with an R&D spend of H7096 lakhs accounting to 14% on sales with an increase of 20% over the previous year.
Your Company’s main focus stayed on discovering, developing and commercialising novel pharmaceutical products, which are first in class or best in class CNS therapies through the use of GPCR targets. Suven has 3 clinical stage compounds, a Phase 2 undergoing candidate SUVN-502, Phase 1 completed candidate SUVN-G3031 and Phase 1 undergoing candidate SUVN-D4010 for Alzheimer’s disease and Schizophrenia. In addition to that the Company has ten (10) internally-discovered therapeutic drug candidates currently in pre-clinical stage of development targeting conditions such as ADHD, dementia, depression, Huntington’s disease, Parkinson’s disease and pain.
Share capitalThe paid up Equity Share Capital as on March 31, 2016 was H1,272.83 lakhs. During the year under review, the Company has not issued any shares. Your company has not issued any shares with differential voting rights nor granted stock options or sweat equity shares.
Extract of annual returnPursuant to sub-section 3(a) of Section 134 and sub-section (3) of Section 92 of the Companies Act 2013, read with Rule 12 of the Companies (Management and Administration) Rules, 2014 the extracts of the Annual Return as at March 31, 2016 forms part of this report as “Annexure – A”.
Number of meetings of the board and audit committeeDuring the year under review five Board Meetings were convened and held on 26th May 2015, 14th August 2015, 10th November 2015, 12th February 2016 and 05th March 2016 and four Audit Committee Meetings were convened and held on 26th May 2015, 14th August 2015, 10th November 2015, 12th February 2016.
25ANNUAL REPORT
2015/16SUVENLIFE SCIENCES LIMITED

The Audit Committee composed of all independent directors. Shri D G
Prasad is the Chairman of the Audit Committee and Dr M R Naidu, Dr
K. V. Raghavan and Shri M Gopalakrishna are members of the Audit
Committee. The intervening gap between the meetings was within the
period prescribed under the Companies Act, 2013.
Directors responsibility rtatementYour Directors state that:i) The applicable accounting standards have been followed in the
preparation of the Annual Accounts.
ii) Such Accounting policies have been selected and applied
consistently and judgments and estimates made when required
that are reasonable and prudent so as to give a true and fair view
of the state of affairs of the Company at the end of the financial
year and of the profit of the Company for that period.
iii) Proper and sufficient care has been taken for the maintenance of
adequate accounting records in accordance with the provisions
of the Companies Act, 2013 for safeguarding the assets of the
Company and for preventing and detecting fraud and other
irregularities.
iv) The Directors have prepared the Annual Accounts on a going
concern basis.
v) Proper internal financial controls were in place to be followed by
the Company and that the financial controls were adequate and
were operating effectively.
vi) Proper systems devised to ensure compliance with the provisions
of all applicable laws and that such systems are adequate and
operating effectively.
Remuneration policyThe Board has, on the recommendation of the Nomination &
Remuneration Committee framed a policy for selection and
appointment of Directors, Senior Management and their remuneration.
The Remuneration Policy is stated in the Corporate Governance Report.
Particulars of loans, guarantees or investmentsThe Company has invested a sum of H2298 lakhs in Suven, Inc., a wholly
owned subsidiary as at 31st March 2016 for its business purpose. Apart
from the investment the Company did not give any Loans, or provided
Guarantees or any security during the year under the provisions of
Section 186 of the Companies Act, 2013.
SubsidiaryDuring the year 2015-2016 your Company has formed wholly owned
subsidiary company by name Suven, Inc., in USA. The consolidated
financial statements of the Company prepared in accordance with
Accounting Standards 21 and 27 as specified in the Companies
(Accounts) Rules, 2014, form part of the annual report.
Pursuant to the provisions of Section 129(3) of the Companies Act,
2013, a statement containing salient features of financial statements
of subsidiary in Form AOC 1 forms part of Board’s Report as “Annexure
B”. The separate audited financial statements in respect of the
subsidiary company shall be kept open for inspection at the Registered
Office of the Company during working hours for a period of 21 days
before the date of the Annual General Meeting. Your Company will
also make available these documents upon request by any Member of
the Company interested in obtaining the same. The separate audited
financial statements in respect of the subsidiary company is also
available on the website of your Company at http://www.suven.com/
AnnualReports.htm
Related party transactionsThe Particulars of contracts or arrangements with related parties
referred to in sub-section (1) of section 188 in the prescribed Form
AOC-2 pursuant to clause (h) of sub-section (3) of section 134 of the
Act and Rule 8(2) of the Companies (Accounts) Rules, 2014, forms part
of this report as “Annexure – C”.
The Board has approved a policy for related party transactions which
has been uploaded on the Company’s website.
Material changes and commitment affecting financial position of the CompanyThere are no material changes and commitments, affecting the financial
position of the Company which has occurred between the end of the
financial year of the Company i.e. March 31, 2016 and the date of the
Directors’ report i.e. 27th May, 2016.
Conservation of energy, technology absorption, foreign exchange earnings and outgoThe information on conservation of energy, technology absorption,
foreign exchange earnings and outgo stipulated under Section 134(3)
(m) of the Companies Act, 2013 read with Rule, 8 of the Companies
(Accounts) Rules, 2014, forms part of this report as “Annexure – D”.
Risk management policy The Board formulated a suitable risk policy to take care of unique
business models of your Company: Contract Technical Services (CTS)
and CRAMS. Suven is an IP creating and protecting company, strictly
adheres to and harmonise with the global patent regime. To ensure
the security and confidentiality of client data access to client data, is
restricted to the senior most team leader working on the respective
project and observes strict standards of confidentiality by entering
into an internal CDA. We believe that strict compliances to the non
disclosure requirements insulate our company against risks relating to
B O A R D ’ S R E P O R T
26

IPR infringement claims of our clients. In addition to these practices,
your company regularly conducts safety and preventive audits in all
plants and ensures that necessary safeguards are in place to protect the
assets against all perils with appropriate insurance policies.
Corporate social responsibilityIn compliance with Section 135 of the Companies Act, 2013 read
with the Companies (Corporate Social Responsibility Policy) Rules
2014, the Company has established Corporate Social Responsibility
(CSR) Committee composed of Shri M. Gopalakrishna as Chairperson,
Shri Venkateswarlu Jasti and Smt Sudha Rani Jasti as members. The
committee is responsible for formulating and monitoring the CSR
policy of the Company. Annual Report on CSR Activities forms part of
this Report as “Annexure – E”.
Performance evaluation of the boardPursuant to the provisions of the Companies Act, 2013 and as per
the SEBI (LODR) Regulations, 2015, the Board has carried out an
annual performance evaluation of its own performance, the directors
individually as well as the evaluation of the working of its Committees.
The manner in which the evaluation has been carried out has been
explained in the Corporate Governance Report.
Appointments / resignations of directors or key managerial personnelThe Company did not appoint any directors or Key Managerial Personnel
during the year. All Independent Directors have given declarations
confirming that they meet the criteria of independence as laid down
under Section 149(6) of the Companies Act, 2013 and SEBI (LODR)
Regulations, 2015. None of the Directors or Key Managerial Personnel
has resigned during the year under review.
Directors retiring by rotationIn accordance with the provisions of the Companies Act, 2013, Smt
Sudharani Jasti, Director retires by rotation at the ensuing Annual
General Meeting and being eligible, offers herself for re-appointment.
The brief profile(s) of the director(s) seeking appointment/ re-
appointment at the ensuing Annual General Meeting are presented in
the Annual Report.
Public depositsThe Company has not accepted any public deposits and as such, no
amount on account of principal or interest on public deposits was
outstanding as on the date of the balance sheet.
Internal financial control systems and their adequacyYour Company has laid down set of standards which enables to
implement internal financial control across the organisation and ensure
that the same are adequate and operating effectively (1) to provide
reasonable assurances that: transactions are executed in conformity
with generally accepted accounting principles/ standards or any other
criteria applicable to such statements, (2) to maintain accountability
for assets; access to assets is permitted only in accordance with
management’s general or specific authorisation and the maintenance
of records that in reasonable detail accurately and fairly reflect the
transactions and dispositions of the assets of the Company; and (3)
Provide reasonable assurance regarding prevention or timely detection
of unauthorised acquisition, use or disposition of the assets that could
have a material effect on the financial statements.
Vigil mechanismThe Company has put in place Whistle Blower Policy a vigil mechanism
to deal with instance of fraud and mismanagement, if any. The details
of the Whistle Blower Policy is explained in the Corporate Governance
Report and also posted on the website of the Company
Particulars of employees and remunerationThe information required under Section 197(12) of the Act read with
Rule 5 of The Companies (Appointment and Remuneration of Managerial
Personnel) Rules, 2014, forms part of this report as “Annexure – F”.
Investor serviceYour Company’s share registry operations (physical as well as electronic
form of holdings) will continue with Karvy Computershare Private
Limited, Registrars and Transfer Agents. They can be contacted at
Karvy Selenium, Tower B, Plot 31-32, Gachibowli, Financial District,
Nanakramguda, Hyderabad - 500 032, Phone No. 040-6716 1565 Fax
No. 040 -2300 1153 for any query relating to Shares.
The shares of the Company are listed on National Stock Exchange of
India Limited (NSE) and BSE Limited (BSE)
Corporate governanceA detailed Report on Corporate Governance prepared in substantial
compliance with the provisions of SEBI (LODR) Regulations, 2015 with
the Stock Exchanges together with the Auditors’ Certificate regarding
the compliance of conditions of corporate governance, forms part of
Annual Report.
Management’s discussion and analysisManagement’s Discussion and Analysis Report for the year under review,
as stipulated under Regulation 34 of the SEBI (LODR) Regulations, 2015,
is presented in a separate section forming part of the Annual Report.
AuditorsStatutory AuditorsPursuant to the provisions of section 139 of the Companies Act, 2013
and the Rules framed thereunder the Company in its Annual General
Meeting held on 12th August 2014 has appointed M/s. Karvy & Co.,
27ANNUAL REPORT
2015/16SUVENLIFE SCIENCES LIMITED

Chartered Accountants, as statutory auditors of the Company, from the
conclusion of the 25th Annual General Meeting till the conclusion of
the 28th Annual General Meeting to be held in the year 2017, subject to
ratification of their appointment at every Annual General Meeting. The
Auditors’ Report does not contain any qualifications.
Cost AuditorsIn terms of Cost (Records and Audit) Amendment Rules, 2014
dated 31st December 2014 issued by the Central Government, the
requirement for Cost Audit is not applicable to the Company based on
the export turnover criteria. However the Cost Auditors M/s DZR & Co.,
Cost Accountants are continuing in their office to carry out cost audit
of company’s cost records on voluntary basis.
Secretarial auditorsPursuant to the provisions of Section 204 of the Companies Act, 2013
and The Companies (Appointment and Remuneration of Managerial
Personnel) Rules, 2014, the Company has appointed M/s. dvmgopal &
associates, a firm of Company Secretaries in Practice to undertake the
Secretarial Audit of the Company. The Report of the Secretarial Audit
Report forms part of this report as “Annexure – G”. The Secretarial Audit
Report does not contain any qualifications.
Business responsibility reportA detailed Business Responsibility Report (BRR) is prepared. As a green
initiative the BRR is placed on website of your company and can be
accessed at web link at http://www.suven.com/AnnualReports.htm
Employees stock option schemesThe applicable disclosures as stipulated under SEBI guidelines with
regard to ‘Suven Employees Stock Option Scheme, 2004’, as on 31
March 2016 annexed to this report.
GeneralDuring the FY2016, there is no change in the nature of business of
the Company or any of its subsidiaries and your Company formed a
wholly owned subsidiary (WOS) by name Suven, Inc., in USA. Except
this WOS there are no companies which have become or ceased to be
its subsidiaries, joint ventures or associate companies during the year.
There are no significant material orders passed by the Regulators /
Courts which would impact the going concern status of the Company
and its future operations.
Your Directors further state that during the year under review, there
were no cases filed pursuant to the Sexual Harassment of Women at
Workplace (Prevention, Prohibition and Redressal) Act, 2013
AcknowledgementsYour Directors wish to place on record their gratitude to Shareholders
for the confidence reposed by them and thank all the shareholders,
customers, dealers, suppliers and other business associates for their
contribution to your Company’s growth. The Directors also wish to
place on record their appreciation of the valuable services rendered by
the executives, staff and workers of the Company.
Your Directors also thank the Central Government and State
Government, the Financial Institutions and Banks for their support
during the year and we look forward to its continuance.
For and on behalf of the Board of Directors
Venkateswarlu JastiPlace: Hyderabad Chairman & CEODate: 27th May 2016 DIN: 00278028
B O A R D ’ S R E P O R T
28

Form No. MGT-9Extract of Annual Return
as on the financial year ended on March 31, 2016[Pursuant to section 92(3) of the Companies Act, 2013 and rule 12(1) of the Companies (Management and Administration) Rules, 2014]
I. Registration and other details:
Annexure - A to the Board’s Report
(i) CIN L24110TG1989PLC009713
(ii) Registration Date 09-03-1989
(iii) Name of the Company SUVEN LIFE SCIENCES LIMITED
(iv) Category / Sub-Category of the Company Company limited by shares / Public company
(v) Address of the Registered office and contact details # 8-2-334, SDE Serene Chambers6th Floor, Avenue 7, Road No. 5Banjara Hills, Hyderabad – 500 034, Telangana, India Tel: 91-40-2354 1142/ 3311
(vi) Whether listed company Yes
(vii) Name, Address and Contact details of Registrar and Transfer Agent, if any
Karvy Computershare Pvt. Ltd.Karvy Selenium, Tower B, Plot 31-32, Gachibowli, Financial District, Nanakramguda, Hyderabad - 500 032Ph: 91-40-6716 1565Contact Persons: Ms. C Shobha Anand /Mr. US Singh
II. Principal business activities of the CompanyAll the business activities contributing 10% or more of the total turnover of the Company shall be stated:-
Sl. No.
Name and Description of main products / services NIC Code of the Product/ service
% to total turnover of the Company
1 Bulk Drugs and Intermediates 24231 93%
III. Particulars of holding, subsidiary and associate companies
Sl. No.
Name and address of the Company
CIN/GLN holding/ subsidiary/ associate
% of shares held Applicable Section
1 Jasti Property and Equity Holdings Private Limited *Plot No. 396, Road No. 22BJubilee Hills, Hyderabad – 500 033 Telangana, India
U74900TG2015PTC097580 holding 60% 2(46)
2 Suven Inc.,1100 Cornwall Road, Monmouth Juction, NJ08852, USA
NA subsidiary 100% 2(87)
* In its capacity as sole trustee of the Jasti Family Trust.
29ANNUAL REPORT
2015/16SUVENLIFE SCIENCES LIMITED
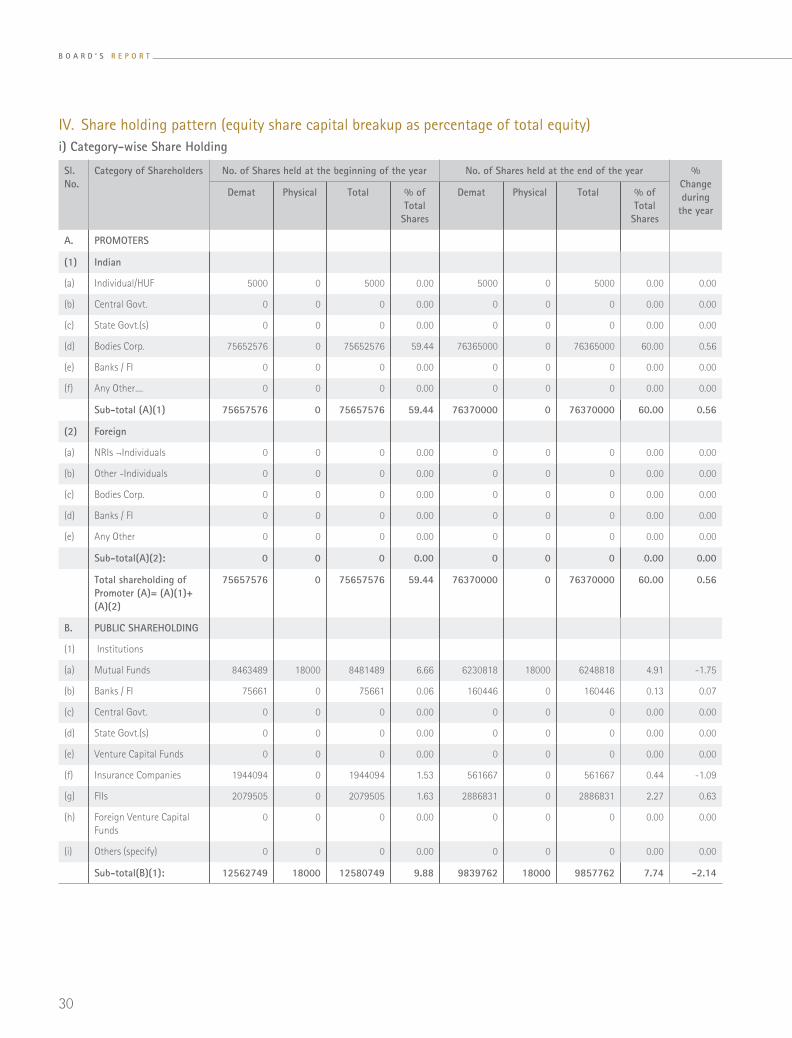
IV. Share holding pattern (equity share capital breakup as percentage of total equity)i) Category-wise Share Holding
Sl. No.
Category of Shareholders No. of Shares held at the beginning of the year No. of Shares held at the end of the year % Change during
the year
Demat Physical Total % of Total
Shares
Demat Physical Total % of Total
Shares
A. PROMOTERS
(1) Indian
(a) Individual/HUF 5000 0 5000 0.00 5000 0 5000 0.00 0.00
(b) Central Govt. 0 0 0 0.00 0 0 0 0.00 0.00
(c) State Govt.(s) 0 0 0 0.00 0 0 0 0.00 0.00
(d) Bodies Corp. 75652576 0 75652576 59.44 76365000 0 76365000 60.00 0.56
(e) Banks / FI 0 0 0 0.00 0 0 0 0.00 0.00
(f) Any Other.... 0 0 0 0.00 0 0 0 0.00 0.00
Sub-total (A)(1) 75657576 0 75657576 59.44 76370000 0 76370000 60.00 0.56
(2) Foreign
(a) NRIs ¬Individuals 0 0 0 0.00 0 0 0 0.00 0.00
(b) Other -Individuals 0 0 0 0.00 0 0 0 0.00 0.00
(c) Bodies Corp. 0 0 0 0.00 0 0 0 0.00 0.00
(d) Banks / FI 0 0 0 0.00 0 0 0 0.00 0.00
(e) Any Other 0 0 0 0.00 0 0 0 0.00 0.00
Sub-total(A)(2): 0 0 0 0.00 0 0 0 0.00 0.00
Total shareholding of Promoter (A)= (A)(1)+ (A)(2)
75657576 0 75657576 59.44 76370000 0 76370000 60.00 0.56
B. PUBLIC SHAREHOLDING
(1) Institutions
(a) Mutual Funds 8463489 18000 8481489 6.66 6230818 18000 6248818 4.91 -1.75
(b) Banks / FI 75661 0 75661 0.06 160446 0 160446 0.13 0.07
(c) Central Govt. 0 0 0 0.00 0 0 0 0.00 0.00
(d) State Govt.(s) 0 0 0 0.00 0 0 0 0.00 0.00
(e) Venture Capital Funds 0 0 0 0.00 0 0 0 0.00 0.00
(f) Insurance Companies 1944094 0 1944094 1.53 561667 0 561667 0.44 -1.09
(g) FIIs 2079505 0 2079505 1.63 2886831 0 2886831 2.27 0.63
(h) Foreign Venture Capital Funds
0 0 0 0.00 0 0 0 0.00 0.00
(i) Others (specify) 0 0 0 0.00 0 0 0 0.00 0.00
Sub-total(B)(1): 12562749 18000 12580749 9.88 9839762 18000 9857762 7.74 -2.14
B O A R D ’ S R E P O R T
30

ii) Shareholding of Promoters
Sl. No.
Shareholder’s Name Shareholding at the beginning of the year Share holding at the end of the year % change in share holding
during the year
No. of Shares
% of total Shares of
the Company
% of Shares Pledged /
encumbered to total shares
No. of Shares
% of total Shares of
the Company
% of Shares Pledged /
encumbered to total shares
1. Jasti Property and Equity Holdings Private Limited *
75652576 59.44 0.00 76365000 60.00 0.00 0.56
2. Venkateswarlu Jasti 1000 0.00 0.00 1000 0.00 0.00 0.00
3. Sudha Rani Jasti 1000 0.00 0.00 1000 0.00 0.00 0.00
4. Sirisha Jasti 1000 0.00 0.00 1000 0.00 0.00 0.00
5. Madhavi Jasti 1000 0.00 0.00 1000 0.00 0.00 0.00
6. Kalyani Jasti 1000 0.00 0.00 1000 0.00 0.00 0.00
Total 75657576 59.44 0.00 76370000 60.00 0.00 0.56
* In its capacity as sole trustee of the Jasti Family Trust.
Sl. No.
Category of Shareholders No. of Shares held at the beginning of the year No. of Shares held at the end of the year % Change during
the year
Demat Physical Total % of Total
Shares
Demat Physical Total % of Total
Shares
(2) Non-Institutions
(a) Bodies Corp.
(i) Indian 4209535 18000 4227535 3.32 3679572 9000 3688572 2.90 -0.42
(ii) Overseas 0 0 0 0.00 0 0 0 0.00 0.00
(b) Individuals
(i) Individual shareholders holding nominal share capital upto H1 lakh
24764563 955165 25719728 20.21 27501286 876165 28377451 22.29 2.09
(ii) Individual shareholders holding nominal share capital in excess of H1 lakh
2435793 120000 2555793 2.01 3227264 120000 3347264 2.63 0.62
(c) Others (specify)
i) Non Resident Indians 5917886 112200 6030086 4.74 5321927 112200 5434127 4.27 -0.47
ii) Clearing Members 511011 0 511011 0.40 172712 0 172712 0.14 -0.27
iii) NBFC 0 0 0 0.00 34590 0 34590 0.03 0.03
Sub-total (B)(2): 37838788 1205365 39044153 30.68 39937351 1117365 41054716 32.25 1.58
Total Public Shareholding (B)=(B)(1)+ (B)(2)
50401537 1223365 51624902 40.56 49777113 1135365 50912478 40.00 -0.56
C. Shares held by Custodian for GDRs & ADRs
0 0 0 0.00 0 0 0 0.00 0.00
Grand Total (A+B+C) 126059113 1223365 127282478 100.00 126147113 1135365 127282478 100.00 0.00
31ANNUAL REPORT
2015/16SUVENLIFE SCIENCES LIMITED
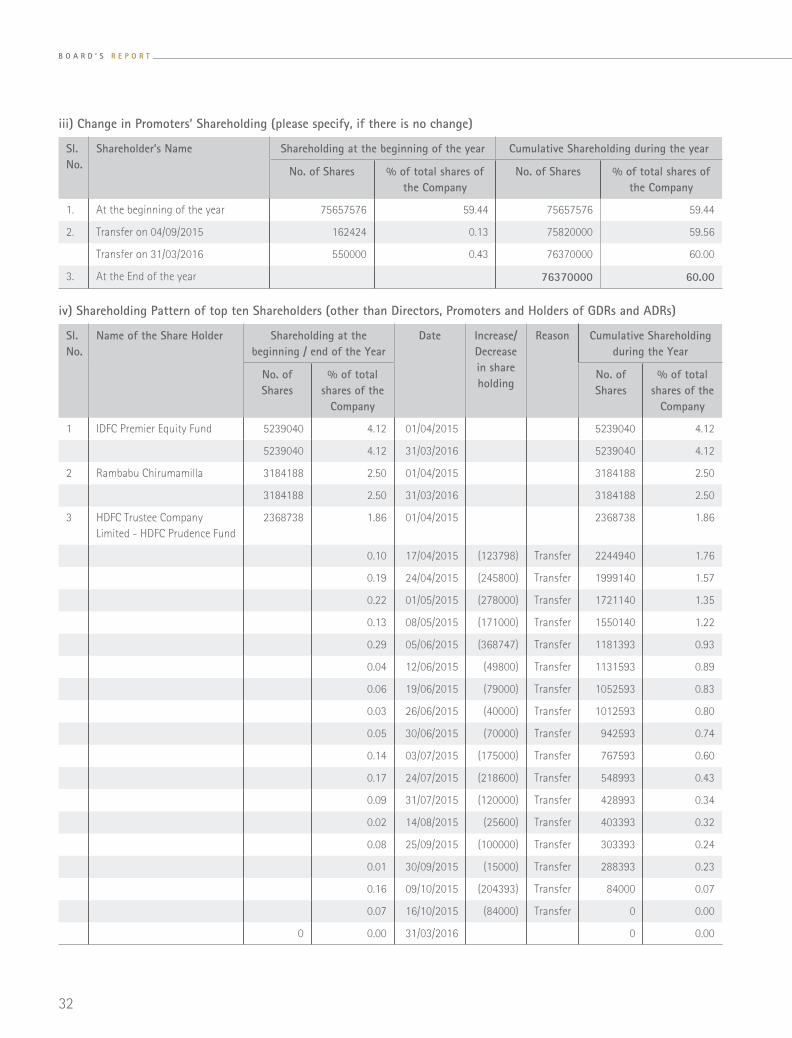
iii) Change in Promoters’ Shareholding (please specify, if there is no change)
Sl. No.
Shareholder’s Name Shareholding at the beginning of the year Cumulative Shareholding during the year
No. of Shares % of total shares of the Company
No. of Shares % of total shares of the Company
1. At the beginning of the year 75657576 59.44 75657576 59.44
2. Transfer on 04/09/2015 162424 0.13 75820000 59.56
Transfer on 31/03/2016 550000 0.43 76370000 60.00
3. At the End of the year 76370000 60.00
iv) Shareholding Pattern of top ten Shareholders (other than Directors, Promoters and Holders of GDRs and ADRs)
Sl. No.
Name of the Share Holder Shareholding at the beginning / end of the Year
Date Increase/ Decrease in share holding
Reason Cumulative Shareholding during the Year
No. of Shares
% of total shares of the
Company
No. of Shares
% of total shares of the
Company
1 IDFC Premier Equity Fund 5239040 4.12 01/04/2015 5239040 4.12
5239040 4.12 31/03/2016 5239040 4.12
2 Rambabu Chirumamilla 3184188 2.50 01/04/2015 3184188 2.50
3184188 2.50 31/03/2016 3184188 2.50
3 HDFC Trustee Company Limited - HDFC Prudence Fund
2368738 1.86 01/04/2015 2368738 1.86
0.10 17/04/2015 (123798) Transfer 2244940 1.76
0.19 24/04/2015 (245800) Transfer 1999140 1.57
0.22 01/05/2015 (278000) Transfer 1721140 1.35
0.13 08/05/2015 (171000) Transfer 1550140 1.22
0.29 05/06/2015 (368747) Transfer 1181393 0.93
0.04 12/06/2015 (49800) Transfer 1131593 0.89
0.06 19/06/2015 (79000) Transfer 1052593 0.83
0.03 26/06/2015 (40000) Transfer 1012593 0.80
0.05 30/06/2015 (70000) Transfer 942593 0.74
0.14 03/07/2015 (175000) Transfer 767593 0.60
0.17 24/07/2015 (218600) Transfer 548993 0.43
0.09 31/07/2015 (120000) Transfer 428993 0.34
0.02 14/08/2015 (25600) Transfer 403393 0.32
0.08 25/09/2015 (100000) Transfer 303393 0.24
0.01 30/09/2015 (15000) Transfer 288393 0.23
0.16 09/10/2015 (204393) Transfer 84000 0.07
0.07 16/10/2015 (84000) Transfer 0 0.00
0 0.00 31/03/2016 0 0.00
B O A R D ’ S R E P O R T
32
Sl. No.
Name of the Share Holder Shareholding at the beginning / end of the Year
Date Increase/ Decrease in share holding
Reason Cumulative Shareholding during the Year
No. of Shares
% of total shares of the
Company
No. of Shares
% of total shares of the
Company
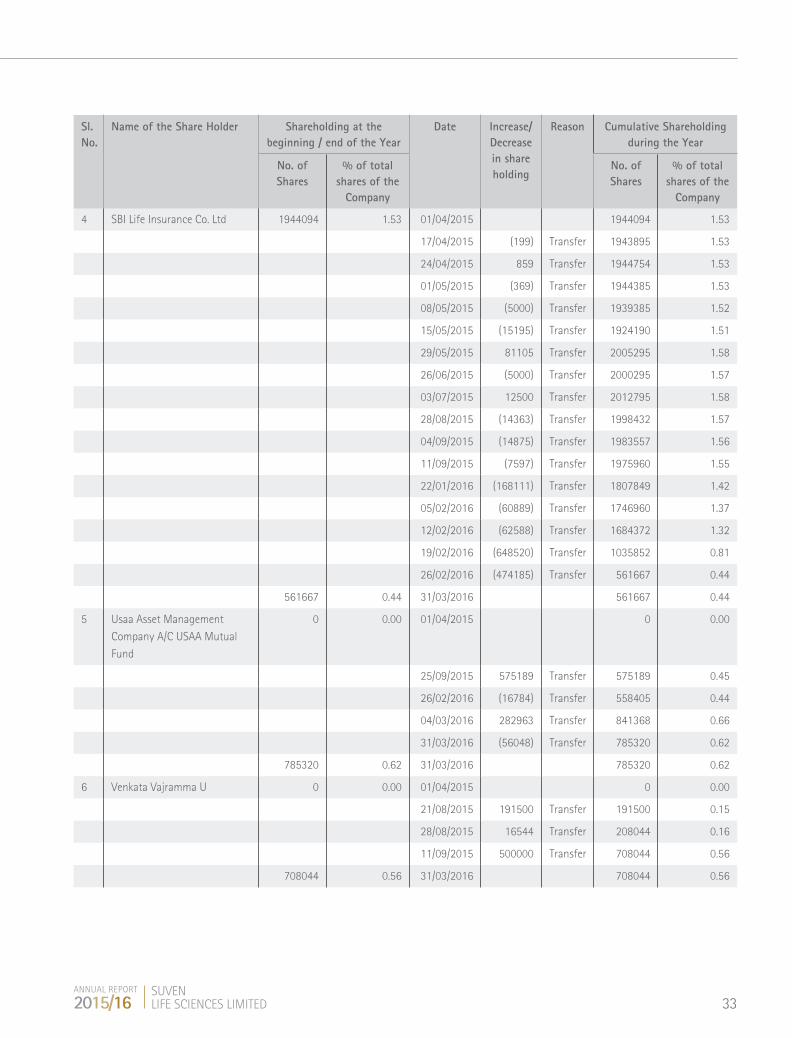
4 SBI Life Insurance Co. Ltd 1944094 1.53 01/04/2015 1944094 1.53
17/04/2015 (199) Transfer 1943895 1.53
24/04/2015 859 Transfer 1944754 1.53
01/05/2015 (369) Transfer 1944385 1.53
08/05/2015 (5000) Transfer 1939385 1.52
15/05/2015 (15195) Transfer 1924190 1.51
29/05/2015 81105 Transfer 2005295 1.58
26/06/2015 (5000) Transfer 2000295 1.57
03/07/2015 12500 Transfer 2012795 1.58
28/08/2015 (14363) Transfer 1998432 1.57
04/09/2015 (14875) Transfer 1983557 1.56
11/09/2015 (7597) Transfer 1975960 1.55
22/01/2016 (168111) Transfer 1807849 1.42
05/02/2016 (60889) Transfer 1746960 1.37
12/02/2016 (62588) Transfer 1684372 1.32
19/02/2016 (648520) Transfer 1035852 0.81
26/02/2016 (474185) Transfer 561667 0.44
561667 0.44 31/03/2016 561667 0.44
5 Usaa Asset Management
Company A/C USAA Mutual
Fund
0 0.00 01/04/2015 0 0.00
25/09/2015 575189 Transfer 575189 0.45
26/02/2016 (16784) Transfer 558405 0.44
04/03/2016 282963 Transfer 841368 0.66
31/03/2016 (56048) Transfer 785320 0.62
785320 0.62 31/03/2016 785320 0.62
6 Venkata Vajramma U 0 0.00 01/04/2015 0 0.00
21/08/2015 191500 Transfer 191500 0.15
28/08/2015 16544 Transfer 208044 0.16
11/09/2015 500000 Transfer 708044 0.56
708044 0.56 31/03/2016 708044 0.56
33ANNUAL REPORT
2015/16SUVENLIFE SCIENCES LIMITED
Sl. No.
Name of the Share Holder Shareholding at the beginning / end of the Year
Date Increase/ Decrease in share holding
Reason Cumulative Shareholding during the Year
No. of Shares
% of total shares of the
Company
No. of Shares
% of total shares of the
Company
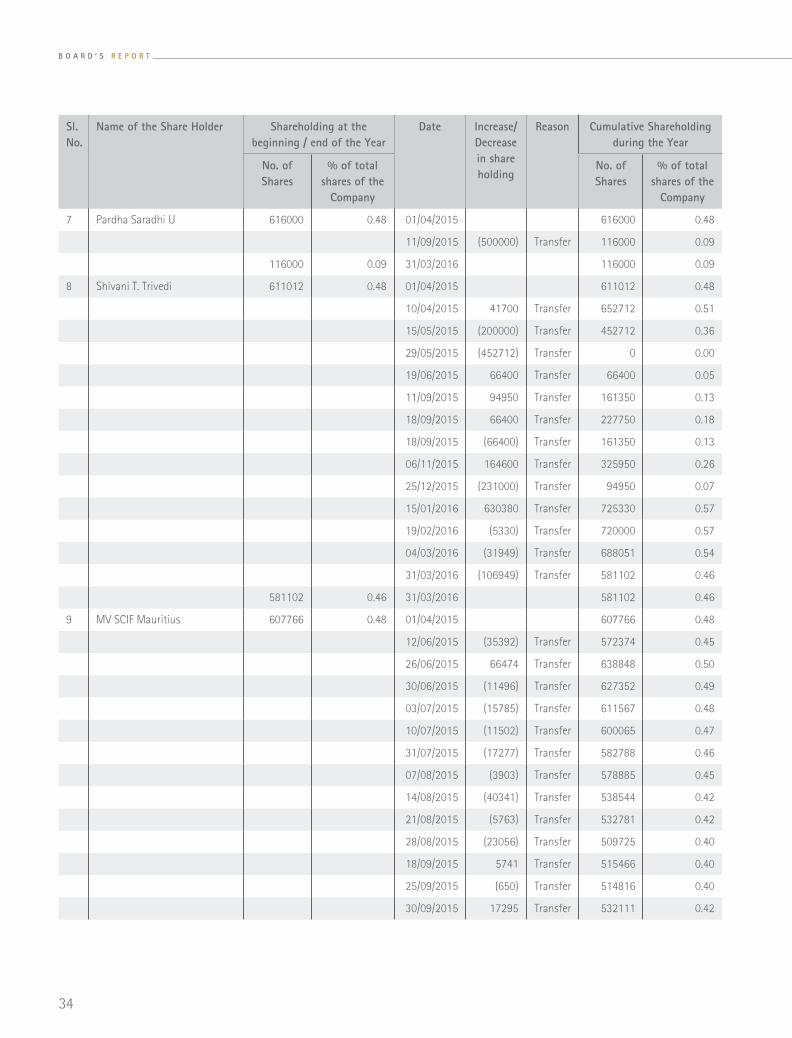
7 Pardha Saradhi U 616000 0.48 01/04/2015 616000 0.48
11/09/2015 (500000) Transfer 116000 0.09
116000 0.09 31/03/2016 116000 0.09
8 Shivani T. Trivedi 611012 0.48 01/04/2015 611012 0.48
10/04/2015 41700 Transfer 652712 0.51
15/05/2015 (200000) Transfer 452712 0.36
29/05/2015 (452712) Transfer 0 0.00
19/06/2015 66400 Transfer 66400 0.05
11/09/2015 94950 Transfer 161350 0.13
18/09/2015 66400 Transfer 227750 0.18
18/09/2015 (66400) Transfer 161350 0.13
06/11/2015 164600 Transfer 325950 0.26
25/12/2015 (231000) Transfer 94950 0.07
15/01/2016 630380 Transfer 725330 0.57
19/02/2016 (5330) Transfer 720000 0.57
04/03/2016 (31949) Transfer 688051 0.54
31/03/2016 (106949) Transfer 581102 0.46
581102 0.46 31/03/2016 581102 0.46
9 MV SCIF Mauritius 607766 0.48 01/04/2015 607766 0.48
12/06/2015 (35392) Transfer 572374 0.45
26/06/2015 66474 Transfer 638848 0.50
30/06/2015 (11496) Transfer 627352 0.49
03/07/2015 (15785) Transfer 611567 0.48
10/07/2015 (11502) Transfer 600065 0.47
31/07/2015 (17277) Transfer 582788 0.46
07/08/2015 (3903) Transfer 578885 0.45
14/08/2015 (40341) Transfer 538544 0.42
21/08/2015 (5763) Transfer 532781 0.42
28/08/2015 (23056) Transfer 509725 0.40
18/09/2015 5741 Transfer 515466 0.40
25/09/2015 (650) Transfer 514816 0.40
30/09/2015 17295 Transfer 532111 0.42
B O A R D ’ S R E P O R T
34

Sl. No.
Name of the Share Holder Shareholding at the beginning / end of the Year
Date Increase/ Decrease in share holding
Reason Cumulative Shareholding during the Year
No. of Shares
% of total shares of the
Company
No. of Shares
% of total shares of the
Company
09/10/2015 5764 Transfer 537875 0.42
30/10/2015 11524 Transfer 549399 0.43
20/11/2015 (11519) Transfer 537880 0.42
04/12/2015 (23037) Transfer 514843 0.40
11/12/2015 (57478) Transfer 457365 0.36
25/12/2015 (16354) Transfer 441011 0.35
31/12/2015 (5555) Transfer 435456 0.34
05/02/2016 4941 Transfer 440397 0.35
25/03/2016 (13323) Transfer 427074 0.34
427074 0.34 31/03/2016 427074 0.34
10 Sundaram Mutual Fund A/C
Sundaram Smile Fund
470418 0.37 01/04/2015 470418 0.37
470418 0.37 31/03/2016 470418 0.37
35ANNUAL REPORT
2015/16SUVENLIFE SCIENCES LIMITED

v) Shareholding of Directors and Key Managerial Personnel
Sl. No.
Name of the Directors/KMPs Shareholding at the beginning of the year
Cumulative Shareholding during the year
No. of Shares
% of total shares of the
Company
No. of Shares
% of total shares of the
Company
Dr. M R Naidu – Director
1. At the beginning of the year 9800 0.00 9800 0.00
2. Transfer on 04/03/2016 2000 0.00 7800 0.00
Transfer on 18/03/2016 2000 0.00 5800 0.00
3. At the end of the year 5800 0.00
Dr. K V Raghavan – Director
1. At the beginning of the year 2000 0.00 2000 0.00
2. Date wise Increase / Decrease in Shareholding during the year specifying the reasons for increase / decrease (e.g. allotment / transfer / bonus/ sweat equity etc):
Nil Nil Nil Nil
3. At the end of the year 2000 0.00 2000 0.00
Shri. D G Prasad - Director
1. At the beginning of the year 0 0.00 0 0.00
2. Date wise Increase / Decrease in Shareholding during the year specifying the reasons for increase / decrease (e.g. allotment / transfer / bonus/ sweat equity etc):
- - - -
3. At the end of the year 0 0.00 0 0.00
Prof. Seyed E Hasnain - Director
1. At the beginning of the year 0 0.00 0 0.00
2. Date wise Increase / Decrease in Shareholding during the year specifying the reasons for increase / decrease (e.g. allotment / transfer / bonus/ sweat equity etc):
- - - -
3. At the end of the year 0 0.00 0 0.00
Shri M Gopalakrishna - Director
1. At the beginning of the year 0 0.00 0 0.00
2. Date wise Increase / Decrease in Share holding during the year specifying the reasons for increase / decrease (e.g. allotment / transfer / bonus/ sweat equity etc):
- - - -
3. At the end of the year 0 0.00 0 0.00
Mr. K Hanumantha Rao – Company Secretary
1. At the beginning of the year 0 0.00 0 0.00
Date wise Increase / Decrease in Share holding during the year specifying
the reasons for increase / decrease (e.g. allotment / transfer / bonus/ sweat
equity etc):
- - - -
At the end of the year 0 0.00 0 0.00
B O A R D ’ S R E P O R T
36
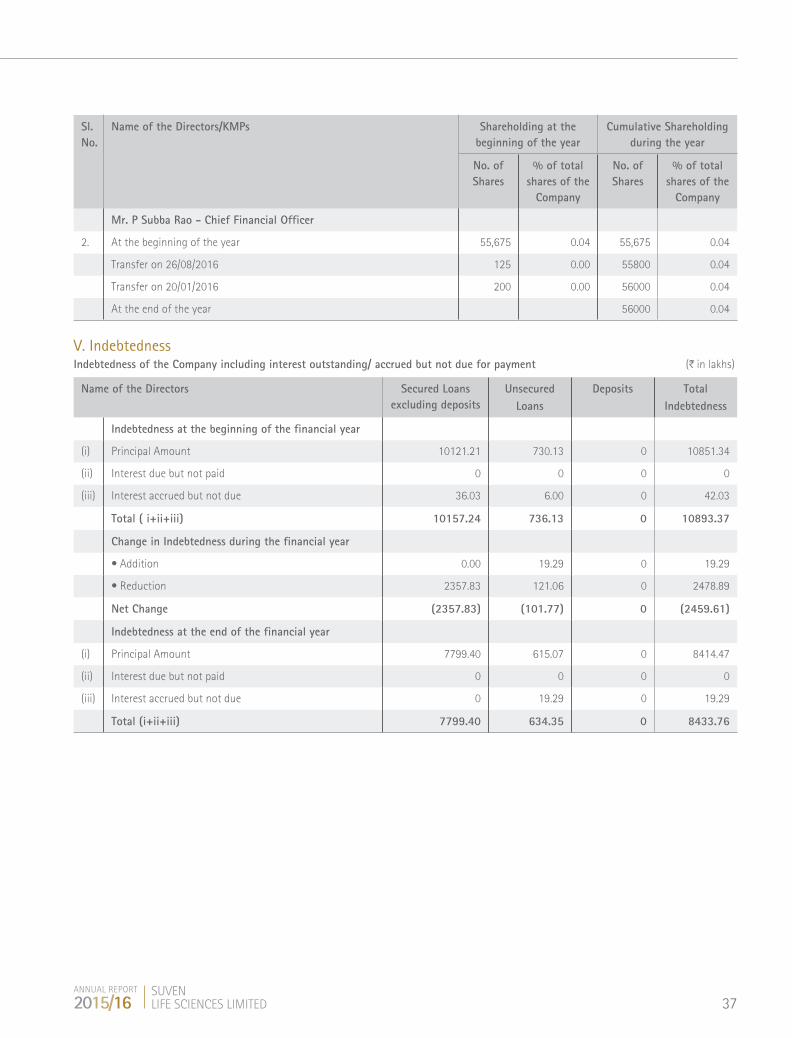
Sl. No.
Name of the Directors/KMPs Shareholding at the beginning of the year
Cumulative Shareholding during the year
No. of Shares
% of total shares of the
Company
No. of Shares
% of total shares of the
Company
Mr. P Subba Rao - Chief Financial Officer
2. At the beginning of the year 55,675 0.04 55,675 0.04
Transfer on 26/08/2016 125 0.00 55800 0.04
Transfer on 20/01/2016 200 0.00 56000 0.04
At the end of the year 56000 0.04
V. IndebtednessIndebtedness of the Company including interest outstanding/ accrued but not due for payment (H in lakhs)
Name of the Directors Secured Loans excluding deposits
Unsecured Loans
Deposits TotalIndebtedness
Indebtedness at the beginning of the financial year
(i) Principal Amount 10121.21 730.13 0 10851.34
(ii) Interest due but not paid 0 0 0 0
(iii) Interest accrued but not due 36.03 6.00 0 42.03
Total ( i+ii+iii) 10157.24 736.13 0 10893.37
Change in Indebtedness during the financial year
• Addition 0.00 19.29 0 19.29
• Reduction 2357.83 121.06 0 2478.89
Net Change (2357.83) (101.77) 0 (2459.61)
Indebtedness at the end of the financial year
(i) Principal Amount 7799.40 615.07 0 8414.47
(ii) Interest due but not paid 0 0 0 0
(iii) Interest accrued but not due 0 19.29 0 19.29
Total (i+ii+iii) 7799.40 634.35 0 8433.76
37ANNUAL REPORT
2015/16SUVENLIFE SCIENCES LIMITED
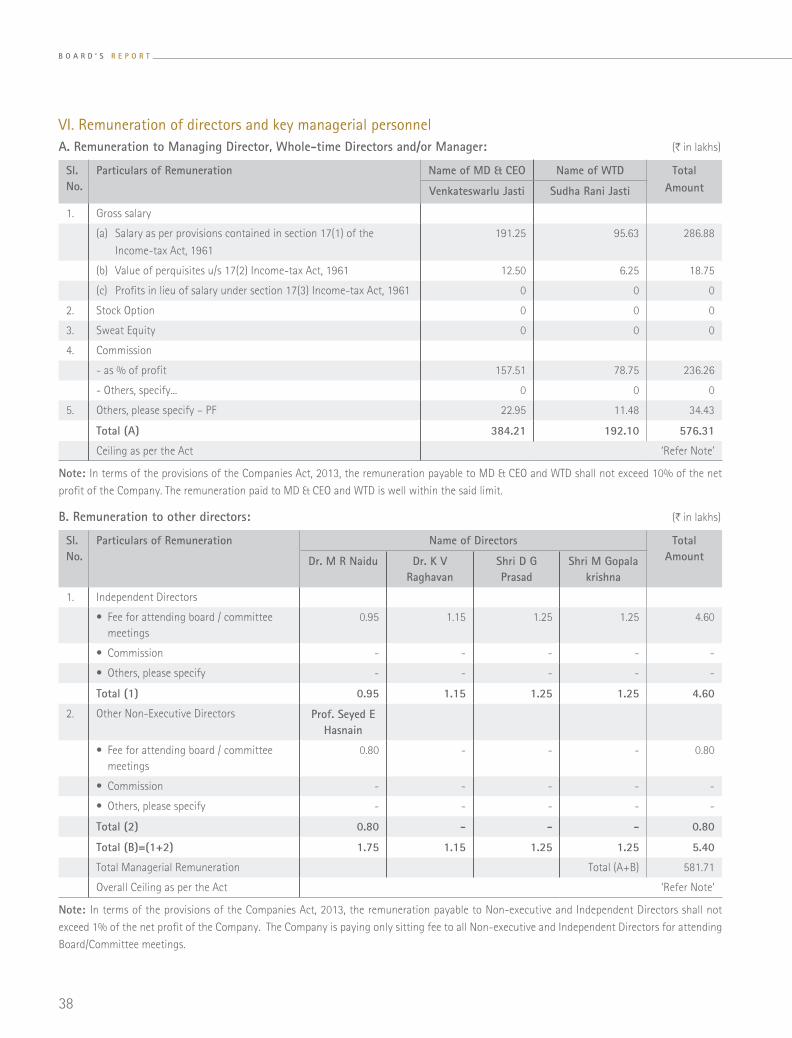
VI. Remuneration of directors and key managerial personnelA. Remuneration to Managing Director, Whole-time Directors and/or Manager: (H in lakhs)
Sl. No.
Particulars of Remuneration Name of MD & CEO Name of WTD Total AmountVenkateswarlu Jasti Sudha Rani Jasti
1. Gross salary
(a) Salary as per provisions contained in section 17(1) of the
Income-tax Act, 1961
191.25 95.63 286.88
(b) Value of perquisites u/s 17(2) Income-tax Act, 1961 12.50 6.25 18.75
(c) Profits in lieu of salary under section 17(3) Income-tax Act, 1961 0 0 0
2. Stock Option 0 0 0
3. Sweat Equity 0 0 0
4. Commission
- as % of profit 157.51 78.75 236.26
- Others, specify... 0 0 0
5. Others, please specify – PF 22.95 11.48 34.43
Total (A) 384.21 192.10 576.31
Ceiling as per the Act ‘Refer Note’
Note: In terms of the provisions of the Companies Act, 2013, the remuneration payable to MD & CEO and WTD shall not exceed 10% of the net
profit of the Company. The remuneration paid to MD & CEO and WTD is well within the said limit.
B. Remuneration to other directors: (H in lakhs)
Sl. No.
Particulars of Remuneration Name of Directors Total AmountDr. M R Naidu Dr. K V
RaghavanShri D G Prasad
Shri M Gopala krishna
1. Independent Directors
• Fee for attending board / committee meetings
0.95 1.15 1.25 1.25 4.60
• Commission - - - - -
• Others, please specify - - - - -
Total (1) 0.95 1.15 1.25 1.25 4.60
2. Other Non-Executive Directors Prof. Seyed E Hasnain
• Fee for attending board / committee meetings
0.80 - - - 0.80
• Commission - - - - -
• Others, please specify - - - - -
Total (2) 0.80 - - - 0.80
Total (B)=(1+2) 1.75 1.15 1.25 1.25 5.40
Total Managerial Remuneration Total (A+B) 581.71
Overall Ceiling as per the Act ‘Refer Note’
Note: In terms of the provisions of the Companies Act, 2013, the remuneration payable to Non-executive and Independent Directors shall not
exceed 1% of the net profit of the Company. The Company is paying only sitting fee to all Non-executive and Independent Directors for attending
Board/Committee meetings.
B O A R D ’ S R E P O R T
38

For and on behalf of the Board of Directors
Venkateswarlu JastiPlace: Hyderabad, Chairman & CEODate: 27th May, 2016 DIN: 00278028
C. Remuneration To Key Managerial Personnel other than MD/ Manager/ WTD (H in lakhs)
Sl. No.
Particulars of Remuneration Key Managerial Personnel Total AmountCompany Secretary Chief Financial
Officer
1. Gross salary
(a) Salary as per provisions contained in section 17(1) of the Income-tax Act, 1961
15.62 22.95 38.57
(b) Value of perquisites u/s 17(2) Income-tax Act, 1961 0.58 1.32 1.90
(c) Profits in lieu of salary under section 17(3) Income-tax Act, 1961 0.00 0.00 0.00
2. Stock Option 0.00 0.00 0.00
3. Sweat Equity 0.00 0.00 0.00
4. Commission
- as % of profit 0.00 0.00 0.00
- Others, specify... 0.00 0.00 0.00
5. Others, please specify – PF 0.00 0.00 0.00
Total 16.20 24.27 40.47
VII. Penalties / Punishment/ Compounding of Offences: (H in lakhs)
Type Section of the Companies
Act
BriefDescription
Details of Penalty / Punishment/ Compounding
fees imposed
Authority [RD / NCLT/
COURT]
Appeal made, if any (give
Details)
A. Company
Penalty NIL NA NA NA NA
Punishment NIL NA NA NA NA
Compounding NIL NA NA NA NA
B. Directors
Penalty NIL NA NA NA NA
Punishment NIL NA NA NA NA
Compounding NIL NA NA NA NA
C. Other Officers in Default
Penalty NIL NA NA NA NA
Punishment NIL NA NA NA NA
Compounding NIL NA NA NA NA
39ANNUAL REPORT
2015/16SUVENLIFE SCIENCES LIMITED

Form AOC-1[Pursuant to first proviso to sub-section (3) of Section 129 read with Rule 5 of Companies (Accounts) Rules, 2014]
Statement containing salient features of the financial statement of Subsidiaries/Associate Companies/Joint Ventures
1. Names of subsidiaries which are yet to commence operations : NIL
2. Names of subsidiaries which have been liquidated or sold during the year : NIL
For and on behalf of the Board of Directors
Venkateswarlu JastiPlace: Hyderabad, Chairman & CEODate: 27th May, 2016 DIN: 00278028
Annexure - B to the Board’s Report
Name of the Subsidiary Suven Inc.
Reporting period for the subsidiary concerned, if different from the holding company’s reporting period Uniform reporting period
Reporting currency USD
Exchange rate as on the last date of the relevant financial year in the case of foreign subsidiaries. H66.43
Share capital 3430000
Reserves & surplus (4213611)
Total assets 105442
Total Liabilities 889053
Investments NIL
Turnover NIL
Profit before taxation (4213611)
Provision for taxation NIL
Profit after taxation (4213611)
Proposed Dividend NIL
% of shareholding 100.00
B O A R D ’ S R E P O R T
40

Form No. AOC-2(Pursuant to clause (h) of sub-section (3) of section 134 of the Act and Rule 8(2) of the Companies (Accounts) Rules, 2014)
Disclosure of particulars of contracts/ arrangements entered into by the Company with related parties referred to in sub-section (1) of section 188
of the Companies Act, 2013 including certain arm’s length transactions under third proviso thereto
1. There are no contracts/ arrangements/ transactions entered into by the Company with related parties referred to in sub-section (1) of Section
188 of the Companies Act, 2013 which are not at arm’s length basis.
2. The following are the contracts/ arrangements/ transactions entered into by the Company with related parties referred to in sub-section (1) of
Section 188 of the Companies Act, 2013 which are at arm’s length basis
Annexure - C to the Board’s Report
Name(s) of the related party and nature of relationship
Nature of contracts/ arrangements/ transactions
Duration of the contracts / arrangements/ transactions
Salient terms of the contracts or arrangements or transactions including the value, if any:
Date(s) of approval by the Board, if any:
Amount paid as advances, if any:
Ms Kalyani Jasti – daughter
of Shri Venkateswarlu Jasti,
Chairman and CEO and Smt
Sudha Rani Jasti, Whole-
time Director
Serving the
Company as
President (US
Operations)
5 Years Looks after US
Operations, co-
ordination with
international customers
and review of technical
contracts of the
Company.
22nd Sept,
2014
Monthly salary of 18000
USD being paid in terms
of approval given by the
members in EGM held
on 21st October 2014
and with the approval of
the Audit Committee.
Ms Sirisha Jasti - daughter
of Shri Venkateswarlu Jasti,
Chairman and CEO and Smt
Sudha Rani Jasti, Whole-
time Director
Serving the
Company as GM
(HR & ADMN)
4 Years Looks after HR and
Administration
activities of the
Company.
26th May
2015
Monthly Salary of
H2,16,667/- being paid
within the threshold
limits prescribed under
the Companies Act,
2013. with the approval
of the Audit Committee.
For and on behalf of the Board of Directors
Venkateswarlu JastiPlace: Hyderabad, Chairman & CEODate: 27th May, 2016 DIN: 00278028
41ANNUAL REPORT
2015/16SUVENLIFE SCIENCES LIMITED

Conservation of Energy, Technology Absorption, Foreign Exchange Earnings and Outgo[Section 134(3)(m) of the Companies Act, 2013 read with Rule 8(3) of the Companies (Accounts) Rules, 2014]
(A) Conservation of energy (i) the steps taken or impact on conservation of energy; Energy conservation is of utmost importance to Suven. Creating awareness among the employees on energy conservation through
training and events Increased focus on procurement of energy efficient equipment
(ii) the steps taken by the Company for utilising alternate sources of energy; Nil
(iii) the capital investment on energy conservation equipments; Nil
(B) Technology Absorption (i) Efforts made towards technology absorption; Continuous improvement is our motto. Suven continues to use the latest technology for improving the productivity and quality and does
not require any technology importation
(ii) Benefits derived like product improvement, cost reduction, product development, import substitution; Due to awareness and training we have reduced the production downtimes and increased productivity while reducing the environmental
load.
(iii) In case of imported technology (imported during the last 3 years reckoned from the beginning of the financial year).
(C) Foreign exchange earnings and outgo The Foreign Exchange earned in terms of actual inflows during the year and the Foreign Exchange outgo during the year in terms of actual
outflows. Please refer to Note No. 40 to 41 of Notes to Financial Statements.
(iv) Expenditure incurred in the R&D centers and innovation centers of Suven during financial year 2015-16 are given below:
Annexure - D to the Board’s Report
For and on behalf of the Board of Directors
Venkateswarlu JastiPlace: Hyderabad, Chairman & CEODate: 27th May, 2016 DIN: 00278028
a) Technology imported NIL
b) Year of import NA
c) Whether the technology been fully absorbed NA
d) If not fully absorbed, areas where absorption has not taken place, and the reasons thereof. NA
(H in lakhs)
Expenditure on R&D and Innovation Year ended31st March, 2016
Year ended31st March, 2015
a) Capital 800.76 297.64
b) Recurring 6,295.08 5,596.26
c) Total R&D expenditure 7,095.84 5,893.90
d) Total R&D and innovation expenditure as a percentage of total turnover 14% 11%
B O A R D ’ S R E P O R T
42

Annual Report on Corporate Social Responsibility (CSR) Activities
Annexure - E to the Board’s Report
1. A brief outline of the Company’s CSR policy, including overview of projects or programmes proposed to be undertaken and a reference to the web-link to the CSR policy and projects or programmes
CSR Policy is stated herein below:Web link: http://suven.com/Pdf/CSR%20policy.pdf
2. Composition of the CSR Committee Shri M Gopalakrishna – Chairman of CSR committee(Independent Director)Shri Venkateswarlu Jasti (Chairman & CEO)Smt. Sudha Rani Jasti (Whole-time Director)
3. Average net profit of the Company for last three financial years 13338.78 lakhs
4. Prescribed CSR Expenditure (two percent of the amount as in item 3 above):
266.78 lakhs
5. Details of CSR spend for the financial year
a) Total amount spent for the financial year: 181.58 lakhs
b) Amount unspent, if any: 85.19 lakhs (Funds are earmarked for the identified Projects which are under implementation)
(c) Manner in which the amount spent during the financial year is detailed below: (H in lakhs)
Sr.No.
Projects / Activities Sector Projects or Programmes(District and
State)
Amount Outlay
(Budget) Project or Programs
wise
AmountSpenton the
project orprograms
CumulativeExpenditure
uptoreporting
period
AmountSpent: Direct/
through implementing
agency.
1. Educational Scholarship, Tuition
Support/sports and Promotion
of Road Safety awareness
Education Ranga Reddy,
Medak,
Nalgonda,
Hyderabad
and Vizag
94.00 93.24 134.54 Direct &
JVM Rural
Development
Trust.
2. Providing safe drinking water to
community, installing RO Plant,
Maintenance and water supply
Safe
Drinking
Water
Nalgonda
District
(Telangana)
6.50 6.37 21.74 Direct
3. Preventive health care camps Healthcare Nalgonda and
Hyderabad,
Telangana
80.00 79.47 100.47 Direct & LV
Prasad Trust
4. Mid-Day Meal programme Poverty and
malnutrition
Guntur Dist,
AP
3.00 2.50 2.50 Direct
TOTAL 181.58 259.25
Venkateswarlu Jasti M. GopalakrishnaPlace: Hyderabad, Chairman & CEO Chairman – CSR CommitteeDate: 27th May, 2016 DIN: 00278028 DIN: 00088454
43ANNUAL REPORT
2015/16SUVENLIFE SCIENCES LIMITED

Brief contents of the CSR policy as approved by the Board
Our Company recognises that business enterprises are economic organs of society and part of society and draw on societal resources
for their growth. We have a duty towards society and the communities and neighborhoods in whose vicinity we operate
The Company undertake the following CSR Projects/ Programs in any of the following areas:
(a) Promoting preventive health care and sanitation and making available safe drinking water to the communities where SUVEN
operates;
(b) Promoting education, including special education and employment enhancing vocational skills among children, literacy and
digital literacy among women, elderly, and the differently abled and enhance livelihood opportunities through projects.
(c) Ensuring environmental sustainability, ecological balance, protection of flora and fauna, animal welfare, agro forestry,
conservation of natural resources, promotion of art, culture and heritage sites and maintaining quality of soil, air and water.
B O A R D ’ S R E P O R T
44

Annexure - F to the Board’s Report
Information required under Section 197 of the Companies Act, 2013 read with Rule 5 of the Companies (Appointment and Remuneration of
Managerial Personnel) Rules, 2014
(i) the ratio of the remuneration of each director to the median remuneration of the employees of the Company for the financial year;
(ii) the percentage increase in remuneration of each director, Chief Financial Officer, Chief Executive Officer, Company Secretary or Manager, if any, in the financial year;
Dr M R Naidu, Dr K V Raghavan, Shri D G Prasad, Shri M Gopalakrishna, Independent Directors and Prof Seyed E Hasnain, Non-executive
Director were paid only sitting fees for attending the Board / Committee Meetings.
Dr M R Naidu, Dr K V Raghavan, Shri D G Prasad, Shri M Gopalakrishna, Independent Directors and Prof Seyed E Hasnain, Non-executive
Director were paid only sitting fees for attending the Board/ Committee Meetings.
(iii) the percentage increase in the median remuneration of employees in the financial year; 14.23 %
(iv) the number of permanent employees on the rolls of company; There were 954 permanent employees as on 31st March 2016
(v) the explanation on the relationship between average increase in remuneration and company performance; Factors considered while recommending increase in remuneration:
(a) Cost of Living
(b) Individual performance
(c) Company’s performance, etc.
(vi) comparison of the remuneration of the Key Managerial Personnel against the performance of the Company; For the financial year ended 31st March, 2016, the remuneration paid to all KMPs aggregate to approximately 4.55% of the Net Profit. The Net
Profit was H12710 lakhs where as remuneration paid to all KMPs aggregate to approximately 3.29% of the previous year H15751 lakhs.
(vii) variations in the market capitalisation of the Company, price earnings ratio as at the closing date of the current financial year and previous financial year and percentage increase over decrease in the market quotations of the shares of the Company in comparison to the rate at which the Company came out with the last public offer in case of listed companies, and in case of unlisted companies, the variations in the net worth of the Company as at the close of the current financial year and previous financial year;
Sr. No. Name of the Director Ratio of the remuneration to the median remuneration of the employees
1. Shri Venkateswarlu Jasti – Chairman &CEO 16.30 :1
2. Smt Sudharani Jasti – Whole-time Director 8.15 :1
Sr. No. Particulars Percentage increase in remuneration
1. Chairman & CEO 10.60%
2. Whole-time Director 13.37%
3. Chief Financial Officer 10.42%
4. Company Secretary 10.81%
Sr. No. Particulars As at 31st March, 2016 As at 31st March, 2015
BSE NSE BSE NSE
1. The market capitalisation of the Company 2454.01 Crores 2452.10 Crores 3669.55 Crores 3653.64 Crores
2. price earnings ratio 25.84 25.82 31.89 31.75
3. dwindle of 33% during the year under review
45ANNUAL REPORT
2015/16SUVENLIFE SCIENCES LIMITED

The Company had come out with initial public offer (IPO) in 1995 at the price of H50/- per equity share (including H40/- towards the share premium). As on 31st March, 2016 the market quotation of the Company share price (closing price) is as follows:
• BSE Limited: H192.80 • National Stock Exchange of India Ltd: H192.65
(viii) average percentile increase already made in the salaries of employees other than the managerial personnel in the last financial year and its comparison with the percentile increase in the managerial remuneration and justification thereof and point out if there are any exceptional circumstances for increase in the managerial remuneration;
Average percentage increase made in the salaries of employees other than the managerial personnel in the last financial year was 14.23. Whereas the remuneration of managerial personnel was increased by 11.51 % for the same financial year.
(ix) comparison of the each remuneration of the Key Managerial Personnel against the performance of the Company; The comparison of remuneration of each of the Key Managerial Personnel against the performance of the Company is as under:
(x) the key parameters for any variable component of remuneration availed by the directors; Commission payable to the managerial personnel is linked to the net profits of the Company as per terms of appointment of the managerial
personnel.
(xi) the ratio of the remuneration of the highest paid director to that of the employees who are not directors but receive remuneration in excess of the highest paid director during the year; Nil
(xii) Affirmation that the remuneration is as per the remuneration policy of the Company. Yes
Statement of particulars of employees pursuant to the provision of Sec 197(12) of the Companies Act, 2013 read with Rule 5(2) & 5(3) of the Companies (Appointment and Remuneration of Managerial Personnel) Rules, 2014 as amended.
Sr. No. Particulars % of net profit for the FY 2015-16
1. Chairman &CEO 2.78%
2. Whole-time Director 1.39%
3. Chief Financial Officer 0.21%
4. Company Secretary 0.16%
name of the employee
the age of
employee
designation of the
employee
gross remuneration
received(J in lakhs)
nature of employment,
whether contractual or otherwise
qualifications of the
employee
experience of the
employee
date of commencement of employment
the last employment held by such
employee before joining the Company
Shri Venkateswarlu Jasti
67 years Chairman & CEO
384.21 Regular M. Pharma; M.S. (Indus. Pharmacy)
42 years 09-03-1989 Business in USA
Smt Sudharani Jasti
62 years Whole-time Director
192.10 Regular B. Sc 35 years 09-03-1989 Business in USA
Dr. NVS Ramakrishna
54 years Vice President(Discovery Research)
150.00 Regular M. Sc., Ph. D 27 years 04-03-2002 Zydus Cadila
Dr. C Rajendiran 55years Vice President (R&D)
70.50 Regular M. Sc., Ph. D 25 years 21-01-2002 Sun Pharmaceuticals
Industries Ltd
None of the employee is related to the Directors except Shri Venkateswarlu Jasti who is spouse of Smt Sudha Rani Jasti.
For and on behalf of the Board of Directors
Venkateswarlu JastiPlace: Hyderabad, Chairman & CEODate: 27th May, 2016 DIN: 00278028
B O A R D ’ S R E P O R T
46

To
The Members of
M/s. Suven Life Sciences LimitedHyderabad
We have conducted Secretarial Audit pursuant to Section 204 of the Companies Act 2013, on the compliance of applicable Statutory Provisions
and the adherence to good corporate practices by M/s. Suven Life Sciences Limited (hereinafter called as “the Company”). Secretarial Audit was
conducted in a manner that provided us a reasonable basis for evaluating the corporate conducts/statutory compliances and expressing our
opinion thereon.
Based on our verification of the books, papers, minutes books, forms, returns filed and other records maintained by the Company and also the
information and according to the examinations carried out by us and explanations furnished and representations made to us by the Company, its
officers, agents and authorised representatives during the conduct of Secretarial Audit, we hereby report that in our opinion, the Company has
during the Audit Period covering the financial year ended on 31st March 2016 has complied with the Statutory Provisions listed hereunder and
also that the Company has proper Board-processes and compliance-mechanism in place to the extent, in the manner and subject to the reporting
made hereinafter.
1. We have examined the books, papers, minutes books, forms and returns filed and other records maintained by the Company for the financial
year ending 31st March, 2016 (“Audit Period”) and we report that the Company has complied with the relevant provisions of the Acts, Rules,
and Standards there under:
1.1. The Companies Act, 1956 (to the extent applicable) and the Companies Act, 2013 (the Act) and the Rules made there under;
1.2. The Securities Contracts (Regulation) Act, 1956 (‘SCRA’) and the Rules made there under;
1.3. The Depositories Act, 1996 and the Regulations and Bye-laws framed there under;
1.4. Foreign Exchange Management Act, 1999 and the rules and regulations made there under to the extent of Foreign Direct Investment,
Overseas Direct Investment and External Commercial Borrowings;
1.5. The following Regulations and Guidelines prescribed under the Securities and Exchange Board of India Act, 1992 (‘SEBI Act’):-
1.5.1. The Securities and Exchange Board of India (Substantial Acquisition of Shares and Takeovers) Regulations, 2011;
1.5.2. The Securities and Exchange Board of India (Prohibition of Insider Trading) Regulations, 2015;
1.5.3. The Securities and Exchange Board of India (Registrars to an Issue and Share Transfer Agents) Regulations, 1993 regarding the
Companies Act and dealing with client;
1.5.4. The Securities and Exchange Board of India (Share Based Employee Benefits) Regulations, 2014;
1.5.5. The Securities and Exchange Board of India (Listing Obligations and Disclosure Requirements) Regulations, 2015 & Listing
Agreements entered with the National Stock Exchange of India Limited and the BSE Limited.
1.6. Secretarial Standards on the Meetings of the Board of Directors and General Meetings issued by the Institute of Company Secretaries of
India.
Secretrial Audit Reportfor the Financial Year Ended 31st March 2016
Form No. MR 3Pursuant to Section 204 (1) of the Companies Act, 2013 and Rule 9 of the Companies
(Appointment and Remuneration of Managerial Personnel) Rules, 2014
Annexure - G to the Board’s Report
47ANNUAL REPORT
2015/16SUVENLIFE SCIENCES LIMITED
2. The Company is engaged in the business of manufacture and sale of bulk drugs and intermediaries. Accordingly, some of the following
applicable Industry specific Acts are covered under the purview of our audit, in consultation with the Management and on the basis of
the Guidance Note issued by the ICSI. Based on our verification and also reliance on the Compliance Certificates given by the respective
Department Heads, the Company has generally complied the following Industry Specific Laws:
(i) Drugs and Cosmetics Act, 1940 read with the Drugs and Cosmetics Rules, 1945 respectively in line with the amendments from time to
time;
(ii) Narcotic Drugs and Psychotropic Substances Act, 1985 read with the Narcotic Drugs and Psychotropic Substances Rules, 1985 respectively
in line with the amendments from time to time;
(iii) Petroleum act, 1934 read with the other Rules and Regulations respectively in line with the amendments from time to time;
(iv) Inflammable substances act, 1952read with the other Rules and Regulations respectively in line with the amendments from time to
time;
(v) Explosives act, 1884 read with Explosives Rules, 1983 respectively in line with the amendments from time to time;
(vi) Poisons act, 1919 read with the other Rules and Regulations respectively in line with the amendments from time to time;
(vii) Indian boilers act, 1923 read with the other Rules and Regulations respectively in line with the amendments from time to time.
3. We further report that:
3.1. The Board of Directors of the Company is duly constituted with proper balance of Executive Directors, Non-Executive Directors,
Independent Directors and a Woman Director. There were no changes in the composition of the Board of Directors during the period
under review.
3.2. Adequate Notice is given to all the Directors to schedule the Board Meetings were sent at least 7 days in advance.
3.3. There exists a system for seeking and obtaining further information and clarifications on the agenda items before the meeting and
meaningful participation at the meeting.
3.4. Majority decision is carried through and there were no instances of dissenting members in the Board of Directors.
3.5. It is to be noted that for the Audit period the following Acts/Regulations either not applicable or no event arise during the Audit Period:
(i) SEBI (ICDR) Regulations, 2009.
(ii) SEBI (Issue and Listing of Debt Securities) Regulations, 2008.
(iii) SEBI (Delisting of Equity Shares) Regulations, 2009.
(iv) SEBI (Buyback of Securities) Regulations, 1998.
3.6. There exists adequate systems and processes in the Company that commensurate with the size and operations of the Company to
monitor and ensure compliance with applicable laws, rules, regulations and guidelines.
4. We further report that during the audit period, there were no specific events / actions having a major bearing on the Company’s affairs in
pursuance of the above referred laws, rules, regulations, guidelines, standards, etc., referred to above.
For dvmgopal & associatesCompany Secretaries
DVM Gopal ProprietorPlace: Hyderabad M No: F6280
Date: 27.05.2016 CP No: 6798
Note: This letter is to be read with our letter of even date which is annexed and form an integral part of this report.
B O A R D ’ S R E P O R T
48
To
The Members of
M/s. Suven Life Sciences LimitedHyderabad
1. Maintenance of secretarial records is the responsibility of the management of the Company. Our responsibility is to express an opinion on
these secretarial records based on our audit.
2. We have followed the audit practices and processes as were appropriate to obtain reasonable assurance about the correctness of the contents
of the secretarial records. The verification was done on the random test basis to ensure that correct facts are reflected in secretarial records.
We believe that the processes and practices, we followed provide a reasonable basis for our opinion.
3. We have not verified the correctness and appropriateness of financial records and Books of Accounts of the Company.
4. Wherever required, we have obtained the Management representation about the compliance of laws, rules and regulations and happening of
events etc.
5. The compliance of the provisions of Corporate and other applicable laws, rules, regulations, standards is the responsibility of the Management.
Our examination was limited to the verification of procedures on random test basis.
6. The Secretarial Audit report is neither an assurance as to the future viability of the Company nor of the efficacy or effectiveness with which
the management has conducted the affairs of the Company.
For dvmgopal & associatesCompany Secretaries
DVM Gopal ProprietorPlace: Hyderabad M No: F6280
Date: 27.05.2016 CP No: 6798
ANNEXURE
49ANNUAL REPORT
2015/16SUVENLIFE SCIENCES LIMITED

Annexure to the Board’s Report
Statement as at 31st March, 2016, pursuant to Clause 12 (Disclosure in the Directors’ Report) of the Securities and Exchange Board of India
(Employee Stock Option Scheme and Employee Stock Purchase Scheme) Guidelines, 1999 in respect of Options granted under the Company’s
Employee Stock Option Schemes.
Sr. No. Description 2004 Plan
(a) Options granted 48,00,000
(b) The pricing formula At Market price; as per SEBI pricing formula
(c) Options vested 48,00,000
(d) Options exercised 17,45,538
(e) The total number of shares arising as a result of exercise of option 17,45,538
(f) Options lapsed 24,04,462
(g) Variation of terms of options NIL
(h) Money realised by exercise of options H3,74,50,470/-
(i) Total number of options in force 6,50,000
(j) i) Employee wise details of options granted to senior managerial
personnel during the year.
NIL
ii) Any other employee who receives a grant in any one year of option
amounting to 5% or more of option granted during that year.
NIL
iii) Identified employees who were granted option, during any one year,
equal to or exceeding 1% of the issued capital (excluding outstanding
warrants and conversions) of the Company at the time of grant;
NIL
(k) Diluted Earnings Per Share (EPS) pursuant to issue of shares on Exercise
of option calculated in accordance with [Accounting Standard (AS) 20
‘Earnings Per Share’].
H7.46
(l) Where the Company has calculated the employee compensation cost
using the intrinsic value of the stock options, the difference between
the employee compensation cost so computed and the employee
Compensation cost that shall have been recognised if it had used the fair
value of the options shall be disclosed. The impact of this difference on
Profits and on EPS of the Company shall also be disclosed.
The Company has used the intrinsic value method
to compute the employee compensation cost on
account of ESOP in the financial year 2015-16. Had the
Company used the fair value method, the ESOP cost in
the financial year would have been H31847953.00 and
net profit would have reduced by this amount. The EPS
(in H) would have been 7.21
(m) Weighted-average exercise prices and weighted-average fair values of
options shall be disclosed separately for options whose exercise price
either equals or exceeds or is less than the market price of the stock.
Number of outstanding options as on March 31, 2016
were–6,50,000. The weighted average exercise price
of the outstanding options as on March 31, 2016 was
H25.28 and the weighted average fair value of the
outstanding options as on March 31, 2016 was H25.02
B O A R D ’ S R E P O R T
50

Sr. No. Description 2004 Plan
(n) A description of the method and significant assumptions used during
the year to estimate the fair values of options, including the following
weighted-average information:
The Company has opted to use the Intrinsic value
method for accounting of compensation cost arising
out of ESOP. However for disclosures in Para (l) above
the following assumptions have been made
i) risk-free interest rate, 6.5%
ii) expected life, 48 months
iii) expected volatility, 50%
iv) expected dividends, and 1.33%
v) The price of the underlying share in market at the time of option
grant.Date of Grant Market Price J
18-09-2004 74.85
30-07-2005 88.65
29-04-2006 82.45
30-09-2006 101.15
03-05-2007 41.00
28-01-2008 36.40
12-07-2010 29.75
30-05-2011 22.30
51ANNUAL REPORT
2015/16SUVENLIFE SCIENCES LIMITED

Report on Corporate Governance
I. Statement on Company’s Philosophy on Code of GovernanceYour Company firmly believes that good corporate governance practices
are ingredients for the balanced development of an organisation which
would not only maximise the shareholder’s value but also contributed
to sustained and long lasting development of the organisation. The
Board of Directors believes in ethical values and high moral standards
in achieving the highest standards of corporate governance. All the
SUVEN activities are carried out in accordance with good corporate
practices and the Company is constantly striving to better them and
adopt the best practices.
Simultaneously, in keeping with best practices, your Company
committed to provide full spectrum of quality services and products
in Contract Technical Services (CTS) and Contract Research and
Manufacturing Services (CRAMS) by fulfilling customer’s satisfaction.
II. Board of DirectorsComposition of BoardThe Board represents an optimum mix of professionalism, knowledge
and experience. As on March 31, 2016, we had a total strength of seven
(7) Directors on the Board, comprising of: two (2) Executive Directors,
one (1) Non-executive Director (i.e. 40%) and four (4) Independent
Directors (i.e. 60%). The Company immensely benefits from the
professional expertise of the Independent Directors. The Board has
an adequate combination of Executive Directors, Non-Executive and
Independent Directors.
None of the Directors on the Board are Members of more than ten
Committees or Chairman of more than five Committees across all the
public companies in which they are Directors. Necessary disclosures
regarding Committee positions in other public companies as on March
31, 2016 have been made by the Directors.
Key information pertaining to Directors as on 31st March, 2016
Name of the Director Category No. of Board Meetings
Attendance at the last AGM
held on August 14, 2015
Directorship in other Public
Companies
No. of Committee positions held in all
companies
held attended Chairman Member
Shri Venkateswarlu Jasti Chairman & CEO
Promoter
5 5 Yes - - -
Smt Sudha Rani Jasti Whole-time Director
Promoter
5 5 Yes - - 1
Dr M R Naidu Independent
Non-Executive Director
5 3 No - - 2
Dr K V Raghavan Independent
Non-Executive Director
5 4 Yes 1 1 1
Shri D G Prasad Independent
Non-Executive Director
5 5 Yes 4 2 2
Prof Seyed E Hasnain Non-Executive Director 5 4 Yes 1 - 1
Shri M Gopalakrishna Independent
Non-Executive Director
5 5 Yes 8 1 6
R E P O R T O N C O R P O R A T E G O V E R N A N C E
52

Board MeetingsThe Board met five times in the Financial Year 2015–16, on 26th May 2015, 14th August 2015, 10th November 2015, 12th February 2016 and 05th March, 2016.
The time gap between any two meetings did not exceed one hundred and twenty days as per the requirements of SEBI (Listing Obligations and Disclosure Requirements) Regulations, 2015 and the required information was suitably placed before the board meetings. The details relating to financial and commercial transactions where directors may have a potential interest, if any, were provided to the Board and interested directors abstained from the proceedings.
Disclosure of relationships between directors inter-seNone of the Directors is related to other Directors, except Shri Venkateswarlu Jasti who is spouse of Smt. Sudha Rani Jasti
No. of shares held by Non-Executive Directors
Sl. No.
Name of Director No. of equity shares held as on 31st March 2016
1 Dr M R Naidu 5,800
2 Dr K V Raghavan 2,000
3 Shri D G Prasad NIL
4 Prof Seyed E Hasnain NIL
5 Shri M Gopalakrishna NIL
Board CommitteesThe Board has constituted various committees of directors to take
informed decisions in the best interest of the Company. These
committees monitor the activities falling within their terms of reference.
Some of the committees of the Board were renamed to align with the
provisions of the Companies Act, 2013 and SEBI (Listing Obligations
and Disclosure Requirements) Regulations, 2015.
III. Audit CommitteeComposition and terms of referenceThe present Audit Committee comprises of all Independent Directors.
All of whom possess accounting and financial management expertise
/ exposure.
The terms of reference to the Audit committee given by the Board are as
per SEBI (Listing Obligations and Disclosure Requirements) Regulations,
2015 as amended from time to time. The Committee reviews the
following information:
• Management discussion and analysis of financial condition and
results of operations,
• Statement of significant related party transactions (as defined by the
Audit Committee), submitted by management,
• Management letters / letters of internal control weaknesses issued by
the statutory auditors,
• Internal audit reports relating to internal control weaknesses and
• The appointment, removal and terms of remuneration of the Chief
internal auditor shall be subject to review by the Audit Committee.
The entire internal audit process has been reviewed by the Committee
and Internal Auditors role induced with requisite adequacy.
The composition of the Audit Committee is as follows
Name of Director & Designation Category of Director No. of Meetings
held attended
Shri D G Prasad – Chairman Independent & Non-Executive Director 4 4
Dr M R Naidu – Member Independent & Non-Executive Director 4 3
Dr K V Raghavan – Member Independent & Non-Executive Director 4 3
Shri M Gopalakrishna – Member Independent & Non-Executive Director 4 4
In addition to the members of the audit committee, these meetings are attended by the Heads of Accounts & Finance, Internal Auditors and
Statutory Auditors of the Company and the Company Secretary acts as the Secretary of the Audit Committee. The Chairman of the Audit Committee
Shri D G Prasad attended the annual general meeting (AGM) held on 14th August 2015.
Meetings held during the yearDuring the year Audit Committee met four times on 26th May 2015, 14th August 2015, 10th November 2015, and 12th February 2016. The
attendance of the Committee Members was presented in the above table.
53ANNUAL REPORT
2015/16SUVENLIFE SCIENCES LIMITED
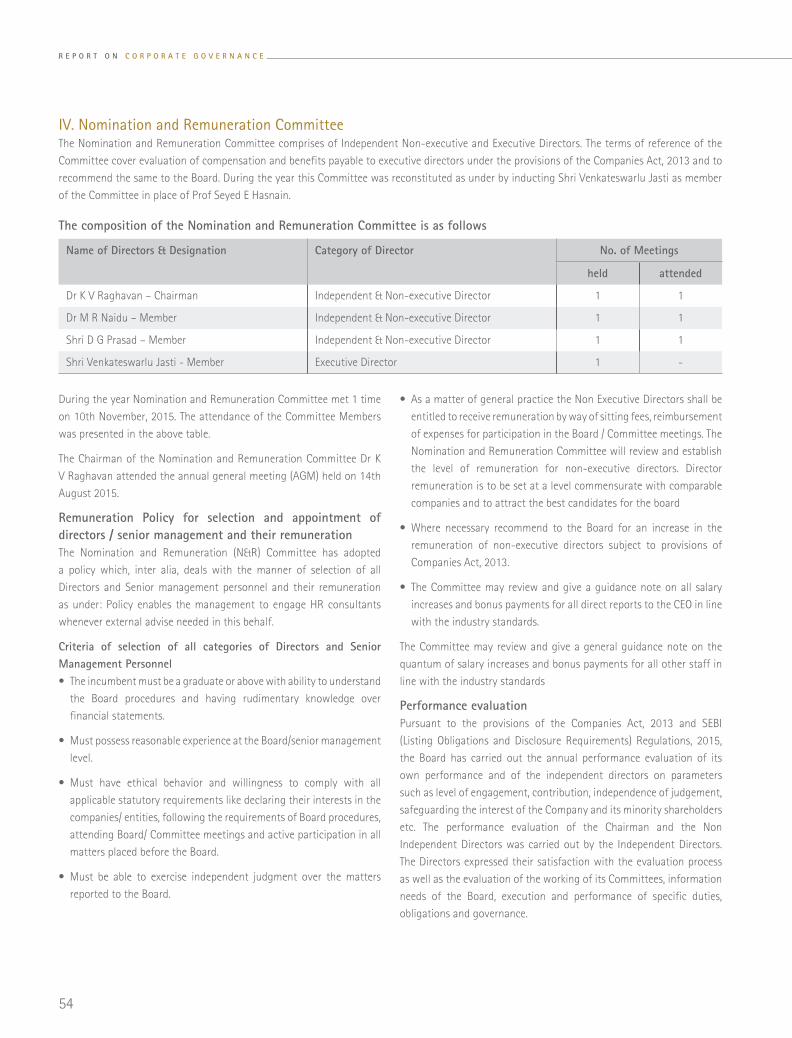
IV. Nomination and Remuneration CommitteeThe Nomination and Remuneration Committee comprises of Independent Non-executive and Executive Directors. The terms of reference of the
Committee cover evaluation of compensation and benefits payable to executive directors under the provisions of the Companies Act, 2013 and to
recommend the same to the Board. During the year this Committee was reconstituted as under by inducting Shri Venkateswarlu Jasti as member
of the Committee in place of Prof Seyed E Hasnain.
During the year Nomination and Remuneration Committee met 1 time
on 10th November, 2015. The attendance of the Committee Members
was presented in the above table.
The Chairman of the Nomination and Remuneration Committee Dr K
V Raghavan attended the annual general meeting (AGM) held on 14th
August 2015.
Remuneration Policy for selection and appointment of directors / senior management and their remunerationThe Nomination and Remuneration (N&R) Committee has adopted
a policy which, inter alia, deals with the manner of selection of all
Directors and Senior management personnel and their remuneration
as under: Policy enables the management to engage HR consultants
whenever external advise needed in this behalf.
Criteria of selection of all categories of Directors and Senior Management Personnel• The incumbent must be a graduate or above with ability to understand
the Board procedures and having rudimentary knowledge over
financial statements.
• Must possess reasonable experience at the Board/senior management
level.
• Must have ethical behavior and willingness to comply with all
applicable statutory requirements like declaring their interests in the
companies/ entities, following the requirements of Board procedures,
attending Board/ Committee meetings and active participation in all
matters placed before the Board.
• Must be able to exercise independent judgment over the matters
reported to the Board.
• As a matter of general practice the Non Executive Directors shall be
entitled to receive remuneration by way of sitting fees, reimbursement
of expenses for participation in the Board / Committee meetings. The
Nomination and Remuneration Committee will review and establish
the level of remuneration for non-executive directors. Director
remuneration is to be set at a level commensurate with comparable
companies and to attract the best candidates for the board
• Where necessary recommend to the Board for an increase in the
remuneration of non-executive directors subject to provisions of
Companies Act, 2013.
• The Committee may review and give a guidance note on all salary
increases and bonus payments for all direct reports to the CEO in line
with the industry standards.
The Committee may review and give a general guidance note on the
quantum of salary increases and bonus payments for all other staff in
line with the industry standards
Performance evaluationPursuant to the provisions of the Companies Act, 2013 and SEBI
(Listing Obligations and Disclosure Requirements) Regulations, 2015,
the Board has carried out the annual performance evaluation of its
own performance and of the independent directors on parameters
such as level of engagement, contribution, independence of judgement,
safeguarding the interest of the Company and its minority shareholders
etc. The performance evaluation of the Chairman and the Non
Independent Directors was carried out by the Independent Directors.
The Directors expressed their satisfaction with the evaluation process
as well as the evaluation of the working of its Committees, information
needs of the Board, execution and performance of specific duties,
obligations and governance.
The composition of the Nomination and Remuneration Committee is as follows
Name of Directors & Designation Category of Director No. of Meetings
held attended
Dr K V Raghavan – Chairman Independent & Non-executive Director 1 1
Dr M R Naidu – Member Independent & Non-executive Director 1 1
Shri D G Prasad – Member Independent & Non-executive Director 1 1
Shri Venkateswarlu Jasti - Member Executive Director 1 -
R E P O R T O N C O R P O R A T E G O V E R N A N C E
54

V.I. Stakeholders’ Relationship Committee
Stakeholders’ Relationship Committee of Directors reviews the following:Expeditious redressal of investor’s grievances, Transfer of shares, Dematerialisation/ Re-materialisation, Non receipt of Annual Reports and declared
dividend, all other matters related to shares.
Name and Address of Compliance OfficerCS K. Hanumantha RaoCompany Secretary & Compliance OfficerSuven Life Sciences Limited
SDE Serene Chambers, 6th Floor, Road No. 5
Avenue 7, Banjara Hills, Hyderabad – 500 034
CIN: L24110TG1989PLC009713
Tel: +91 40-2354 1142/ 3311, Fax: +91 40-2354 1152
Details of complaints/requests received and redressedDuring the year 2015-2016, 222 complaints were received pertaining to the dividends, annual reports, change of bank/ address details and split
shares etc. from shareholders and the complaints have been resolved to the satisfaction of the Complainants. As on 31/03/2016 there were no
complaints pending to be resolved.
The Constitution of Stakeholders’ Relationship Committee is as follows:
Name of Directors & Designation Category of Director No. of Meetings
Held Attended
Dr. K V Raghavan – Chairman Independent & Non-executive Director 4 3
Dr. M R Naidu – Member Independent & Non-executive Director 4 3
Smt. Sudha Rani Jasti – Member Executive Director 4 4
Remuneration paid to the Executive Directors and sitting fees paid to Non-Executive Directors during 2015-2016 is as under:Executive Directors
Name of the Director Salary & Allowances
Commission Contribution to Provident Fund
Perquisites Total
Shri Venkateswarlu Jasti, Chairman & CEO 191.25 157.51 22.95 12.50 384.21
Smt Sudha Rani Jasti, Whole-time Director 95.63 78.75 11.47 6.25 192.10
Non-Executive Directors
Name of the Director Sitting fee* (J)
Dr M R Naidu 95000.00
Dr K V Raghavan 115000.00
Shri D G Prasad 125000.00
Prof Seyed E Hasnain 80000.00
Shri M Gopalakrishna 125000.00
* Net of taxes.
J in lakhs
55ANNUAL REPORT
2015/16SUVENLIFE SCIENCES LIMITED

II. Share Transfers CommitteeTo ensure quicker investor services and expeditious disposal of the share transfer approvals, this Committee has been constituted with the following
members of the Board.
Shri Venkateswarlu Jasti, Chairman & CEO is heading the Committee and
Smt. Sudha Rani Jasti, Whole-time Director is a member
The Committee meets as and when the memorandum of transfers date is intimated by the Karvy Computershare Pvt. Ltd. (Registrars and Transfer
Agents) and accords its approvals accordingly.
The Committee met three times during the financial year 2015-16.
VI. Corporate Social Responsibility (CSR) CommitteeThe terms of reference of the Corporate Social Responsibility Committee (CSR) broadly comprises:
To review the existing CSR Policy and to make it more comprehensive so as to indicate the activities to be undertaken by the Company as specified
in Schedule VII of the Companies Act, 2013;
To provide guidance on various CSR activities to be undertaken by the Company and to monitor its progress
VII. ESOP Compensation CommitteeThe Committee has been authorised to frame suitable policies and systems to ensure that there is no violation, by an employee of any applicable
laws in India including, The Securities and Exchange Board of India (Insider Trading) Regulations 1992/2015; and perform such functions required
to be performed by the Compensation Committee under the SEBI Employee Stock Option Scheme and Employee Stock Purchase Scheme Guidelines,
1999.
ESOP Compensation Committee composed of Dr. M R Naidu as Chairman, Dr. K V Raghavan as Member and Shri Venkateswarlu Jasti as Member
of the Committee.
VIII. Meeting of Independent DirectorsDuring the year under review, the Independent Directors met on 12th February, 2016, carried out inter alia, the following process:
Evaluation of performance of Non Independent Directors and the Board of Directors as a whole; evaluation of performance of the Chairman of the
Company, taking into account the views of the Executive and Non Executive Directors and evaluation of the quality, content and timelines of flow
of information between the Management and the Board that is necessary for the Board to effectively and reasonably perform its duties. All the
Independent Directors were present at the Meeting.
The present independent directors were re-appointed on the Board w.e.f. 1st April 2014 for one term of 5 years. The Company has organised
familiarisation programmes with respect to their duties, roles, responsibilities, business models and operations of the Company and new SEBI
Regulations on Listing Obligations and Disclosure Requirements. The Company will organise necessary familiarisation programmes as and when
required. The terms and conditions of appointment of the independent directors are disclosed on the website of the Company. The information on
the familiarisation programmes can be accessed from our Company’s website at Web link:
http://suven.com/Familiarisation_program_for_independent_%20directors.pdf
The composition of the Corporate Social Responsibility Committee and the details of Members’ participation at the Meeting of the Committee held on 22nd May, 2015 are as under:
Name of the Director Category of Director No. of Meetings
Held Attended
Shri M Gopalakrishna – Chairman Independent & Non-executive Director 1 1
Shri Venkateswarlu Jasti – Member Executive Director 1 1
Smt. Sudha Rani Jasti – Member Executive Director 1 -
R E P O R T O N C O R P O R A T E G O V E R N A N C E
56

IX. General Body MeetingsAnnual General Meeting: Location, date and time of last three Annual General Meetings (AGMs) and Special Resolutions passed there at:
Year Venue Date and Time No. of Special Resolutions passed
2014-15 KLN Prasad Auditorium, The Federation of Andhra Pradesh Chambers of Commerce
& Industry [FAPCCI], 11-6-841, Red Hills, Hyderabad –500 004
14/08/2015
3:00 PM
NIL
2013-14 Forum Hall, Hotel Daspalla, Road No. 37, Jubilee Hills, Hyderabad – 500 033 12/08/2014
12:00 Noon
Two
2012-13 KLN Prasad Auditorium, The Federation of Andhra Pradesh Chambers of Commerce
& Industry [FAPCCI], 11-6-841, Red Hills, Hyderabad –500 004
13/08/2013
10:00 AM
Four
Postal Ballot:No item of business relating to matters specified under SEBI (Listing Obligations and Disclosure Requirements) Regulations, 2015 or the provisions
contained in section 110 of the Companies Act 2013, requiring voting by postal ballot is included in the Notice Convening the 27th Annual General
Meeting of the Company.
X. Means of CommunicationQuarterly Results, Press Releases, Presentations and Publications:
The quarterly results are generally published in widely circulated national newspapers the Business Standard and in one vernacular Language
newspaper Andhra Prabha (Telugu Daily). And also the half yearly and Annual Audited Financial Results are published in the same manner.
The Financial Results are also displayed on the Company’s web site www.suven.com official news releases; presentations made to the institutional
investors / analysts / media are also displayed on the Company’s website.
Management Discussion and Analysis detailed report is forming part of this Annual Report
The Company is filing/ submitting its Shareholding Pattern, Financial Results, Report on Corporate Governance on quarterly/ half-yearly /yearly
basis and are posted on the website of the Company as well as on the website of BSE/ NSE in accordance with the SEBI Regulations which may be
accessed by the shareholders.
XI. General Information for Shareholdersi) Annual General Meeting:
Financial Year : 2015 – 2016
Day and Date : Wednesday, 10th day of August, 2016
Time : 10:30 AM
Venue : KLN Prasad Auditorium, The Federation of Telangana and Andhra Pradesh Chambers of Commerce & Industry
[FTAPCCI], 11-6-841, Red Hills, Hyderabad –500 004
57ANNUAL REPORT
2015/16SUVENLIFE SCIENCES LIMITED

ii) Financial Calendar (tentative)
Financial Year April 1, 2016 to March 31, 2017
Quarter Ending Release of Results
June 30, 2016 latest by August 14, 2016
September 30, 2016 latest by November 14, 2016
December 31, 2016 latest by February 14, 2017
March 31, 2017 May 15, 2017*
* instead of publishing quarterly un-audited results, the Company may opt to publish Audited Annual within 60 days from the end of the
financial year as per SEBI Regulations.
iii) Dates of Book Closure: from 08th August, 2016 to 10th August, 2016 (both days inclusive)
iv) Dividend Disclosure: The Board of Directors declared and paid an interim dividend of H2.00 (including a onetime special dividend of H1.00)
per equity share of H1.00 each for the financial year 2015-2016 to the shareholders whose names appeared on 15th March 2016 being the
Record Date notified to the Stock Exchanges. Your Directors recommend that the interim dividend paid may be treated as final dividend for
the year 2015-2016.
Mode of Dividend payment and date Dividend remitted through National Electronic Clearing Service (NECS) at approved locations, wherever NECS details are available with the
Company; and in all other cases, through warrants payable at par. These warrants shall be valid for a period of 90 days. Post expiry of validity
period, these may be sent to the Company’s Office at # 8-2-334, SDE Serene Chambers, 6th Floor, Avenue 7, Road No. 5, Banjara Hills,
Hyderabad – 500 034 for issue of demand drafts in lieu of expired dividend warrants.
v) Listing on Stock Exchanges The shares of the Company are listed on
BSE Limited Phiroze Jeejeebhoy Towers, Dalal Street, Mumbai- 400001
National Stock Exchange of India Limited Exchange Plaza, C-1, Block G, Bandra Kurla Complex, Bandra (E), Mumbai – 400 051
The Company confirms that it has paid annual listing fees due to the stock exchanges for the financial year 2016-2017.
Depository for Equity Shares : NSDL and CDSL Demat ISIN Number : INE495B01038
vi) Stock Code
Stock Exchanges Scrip Code Scrip ID
BSE Limited 530239 SUVEN
National Stock Exchange of India Limited SUVEN-EQ SUVEN
R E P O R T O N C O R P O R A T E G O V E R N A N C E
58

vii) Stock Market Price Data BSE- SENSEX
Month BSE BSE SENSEX
HIGH (J) LOW (J) Volume (No.) HIGH LOW
2015 April 338.50 265.20 5,776,647 29,094.61 26,897.54
May 323.70 265.10 4,348,193 28,071.16 26,423.99
June 282.00 222.05 3,190,137 27,968.75 26,307.07
July 277.50 227.80 3,122,913 28,578.33 27,416.39
August 274.95 200.05 2,405,670 28,417.59 25,298.42
September 269.50 192.15 3,727,598 26,471.82 24,833.54
October 308.70 267.50 5,666,015 27,618.14 26,168.71
November 282.30 250.50 2,051,935 26,824.30 25,451.42
December 273.25 245.10 2,432,147 26,256.42 24,867.73
2016 January 269.40 201.60 1,534,932 26,197.27 23,839.76
February 223.70 144.35 2,095,492 25,002.32 22,494.61
March 211.80 153.70 3,403,567 25,479.62 23,133.18
viii) Stock Price Performance in comparison with NSE- NIFTY
Month NSE NSE NIFTY
HIGH (J) LOW (J) Volume (No.) HIGH LOW
2015 April 338.50 265.15 24,789,370 8,844.80 8,144.75
May 323.70 266.10 17,947,335 8,489.55 7,997.15
June 281.95 222.10 12,588,341 8,467.15 7,940.30
July 277.40 227.10 13,777,724 8,654.75 8,315.40
August 274.80 201.10 11,314,607 8,621.55 7,667.25
September 269.20 192.50 17,831,120 8,055.00 7,539.50
October 308.70 267.25 19,889,974 8,336.30 7,930.65
November 282.00 249.30 8,314,873 8,116.10 7,714.15
December 274.90 228.70 10,287,309 7,979.30 7,551.05
2016 January 269.00 201.20 6,287,767 7,972.55 7,241.50
February 223.90 144.30 9,439,015 7,600.45 6,825.80
March 211.40 153.45 15,051,736 7,777.60 7,035.10
59ANNUAL REPORT
2015/16SUVENLIFE SCIENCES LIMITED
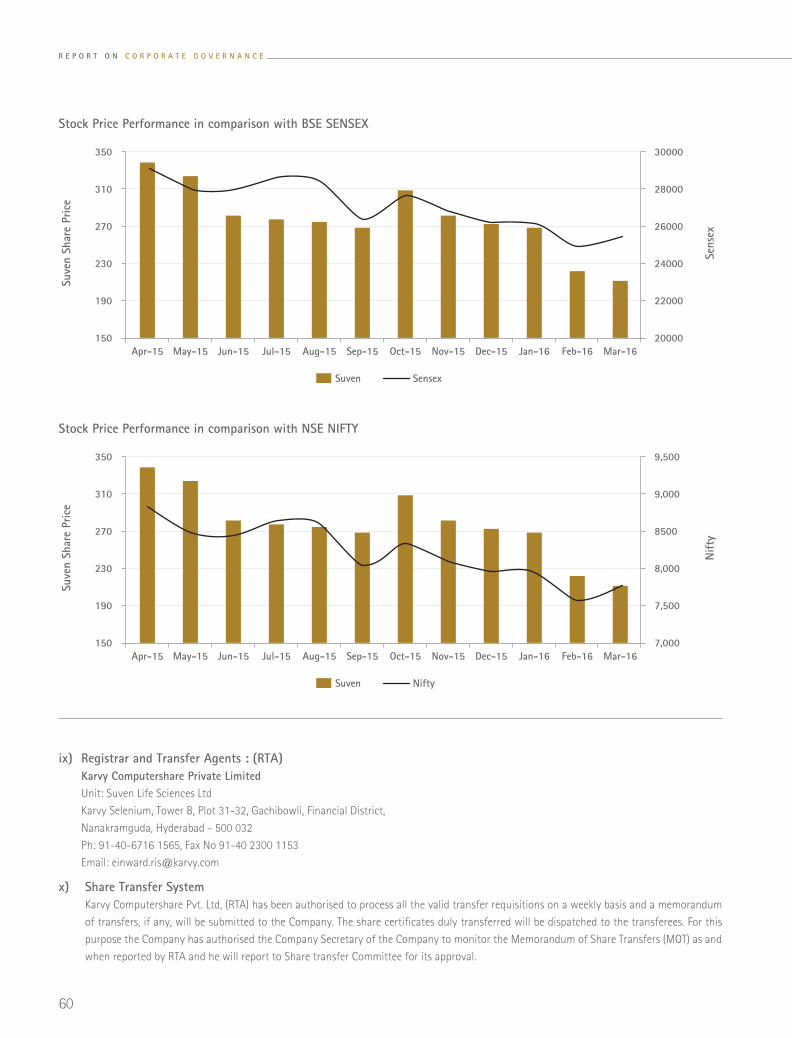
ix) Registrar and Transfer Agents : (RTA) Karvy Computershare Private Limited Unit: Suven Life Sciences Ltd
Karvy Selenium, Tower B, Plot 31-32, Gachibowli, Financial District,
Nanakramguda, Hyderabad - 500 032
Ph: 91-40-6716 1565, Fax No 91-40 2300 1153
Email: [email protected]
x) Share Transfer System Karvy Computershare Pvt. Ltd, (RTA) has been authorised to process all the valid transfer requisitions on a weekly basis and a memorandum
of transfers, if any, will be submitted to the Company. The share certificates duly transferred will be dispatched to the transferees. For this
purpose the Company has authorised the Company Secretary of the Company to monitor the Memorandum of Share Transfers (MOT) as and
when reported by RTA and he will report to Share transfer Committee for its approval.
Stock Price Performance in comparison with BSE SENSEX
Suve
n Sh
are
Pric
e
150
190
230
270
310
350
20000
22000
24000
26000
28000
30000
Sens
ex
Apr-15 May-15 Jun-15 Jul-15 Aug-15 Sep-15 Oct-15 Nov-15 Dec-15 Jan-16 Feb-16 Mar-16
Suven Sensex
Stock Price Performance in comparison with NSE NIFTY
Suve
n Sh
are
Pric
e
150
190
230
270
310
350
7,000
7,500
8,000
8500
9,000
9,500
Nift
y
Apr-15 May-15 Jun-15 Jul-15 Aug-15 Sep-15 Oct-15 Nov-15 Dec-15 Jan-16 Feb-16 Mar-16
Suven Nifty
R E P O R T O N C O R P O R A T E G O V E R N A N C E
60

xi) Distribution Shareholding Pattern as on 31st March 2016
Category (Amount) Shareholders Share Amount
Number % to total Amount % to total
1 – 5000 61645 98.44 19493992 15.32
5001 – 10000 534 0.85 4016604 3.16
10001 – 20000 219 0.35 3273261 2.57
20001 – 30000 78 0.12 1911323 1.50
30001 – 40000 38 0.06 1395205 1.10
40001 – 50000 28 0.04 1295196 1.02
50001 – 100000 47 0.08 3356570 2.64
100001 – and above 34 0.05 92540327 72.70
TOTAL 62623 100.00 127282478 100.00
xii) Categories of shareholders as on 31st March 2016
Sr. No. Category Cases Holding % to Equity
1 Promoters 6 76370000 60.00
2 Resident Individuals 58949 30666469 24.09
3 Mutual Funds 15 6248818 4.91
4 Non Resident Indians 1383 5434127 4.27
5 Corporate Bodies 840 4250239 3.34
6 Foreign Institutional Investors 38 2886831 2.27
7 Others 1392 1425994 1.12
TOTAL 62623 127282478 100.00%
The Company has obtained and filed with the Stock Exchange(s), the half yearly certificates from Company secretary in practice for
due Compliance with the share transfer formalities as required under regulation 40(9)&(10) of SEBI (Listing Obligations and Disclosure
Requirements) Regulations, 2015.
Promoters
Mutula funds
Non resident Indians Others
Residential individuals
Bodies corporates
Foreign institutional investors
61ANNUAL REPORT
2015/16SUVENLIFE SCIENCES LIMITED

xiii) Dematerialisation of shares and liquidity As on 31st March 2016, 99.11% of the paid up equity capital of the Company has been dematerialised and the trading of Equity shares in the
Stock Exchanges is under compulsory dematerialisation.
Members are encouraged to opt for dematerialisation of shares to eliminate bad deliveries, forgery, fake transfers etc., in the market.
xiv) Outstanding GDRs/ ADRs/ Warrants or any Convertible instruments, conversion date and likely impact on equity The Company has not issued any GDRs/ ADRs/ Warrants or any Convertible instruments in the past and hence as on March 31, 2016, the
Company does not have any outstanding GDRs/ ADRs/ Warrants or any convertible instruments.
xv) Commodity price risk or foreign exchange risk and hedging activities Our Company is following the natural hedging only as our receipts are more than the payments and also some of the exports are covered
under forward cover as such there are no foreign exchange risk.
xvi) Plant Locations
Unit 1 – Dasaigudem Village, Suryapet Mandal,
Nalgonda Dist, Telangana –508213
Unit 2 –
Plot No. 18, Phase III, IDA, Jeedimetla,
Hyderabad Telangana –500 055
Unit 3 –
Plot No(s). 262 - 264 & 269 - 271, IDA, Pashamylaram,
Medak Dist., Telangana – 502 307
Unit 4 – Plot No(s). 65 – 67, JN Pharmacity, Parwada,
Visakhapatnam, Andhra Pradesh – 531 019
Research and Development Centre(s)
Research Centre – I Plot No.18, Phase III, IDA Jeedimetla,
Hyderabad - 500 055 Telangana
Research Centre – II Bio-Pharmaceutical Lab
Plot No(s). 267- 268, IDA Pashamylaram,
Medak Dist. Telangana – 502 307
Research Centre – III Formulation Development Centre
Plot No(s). 265 to 268, IDA Pashamylaram,
Medak Dist, Telangana – 502 307
xvii) Address for Correspondence Regd. Office: 8-2-334, SDE Serene Chambers,
6th Floor, Road No. 5, Avenue 7,
Banjara Hills, Hyderabad – 500 034 Telangana
CIN: L24110TG1989PLC009713
Tel: +91 40-2354 3311 / 2354 1142, Fax: +91 40-2354 1152
E-mail: [email protected], [email protected]
Website: www.suven.com
xviii) Unpaid / Unclaimed Dividend Pursuant to the provisions of Section 123 of the Companies Act, 2013, dividend which remains unpaid or unclaimed for a period of seven
years from the date of its transfer to unpaid dividend account, is required to be transferred by Company to the Investor Education and
Protection Fund, established by the Central Government under the provisions of Section 125 of the Companies Act, 2013.
Shareholders of the Company who have either not received or have not en-cashed their dividend warrants, for the financial years 2008-09,
2009-10, 2010-11, 2011-12, 2012-13, 2013-14, 2014-15 and 2015-16 are requested to claim the unpaid/ unclaimed dividend from the
Company before transfer to the fund.
xix) Reconciliation of Share Capital Audit Report A qualified practicing Company Secretary carried out a quarterly share capital audit to reconcile the total admitted equity share capital with
the National Securities Depository Limited (NSDL) and the Central Depository Services (India) Limited (CDSL) and the total issued and listed
equity share capital. The audit report confirms that the total issued/ paid-up capital is in agreement with the total number of shares in
physical form and the total number of dematerialised shares held with NSDL and CDSL.
R E P O R T O N C O R P O R A T E G O V E R N A N C E
62
XII. Disclosuresi) Related party transactions All related party transactions with related parties during the financial year were done in accordance with the provisions of the Companies
Act, 2013 and SEBI (Listing Obligations and Disclosure Requirements) Regulations, 2015. No materially significant transactions with related
parties were entered during the financial year which was in conflict with the interest of the Company. None of the Non-Executive Directors
have any pecuniary material relationship or material transactions with the Company for the year ended March 31, 2016. The Board has
approved a policy for related party transactions which has been uploaded on the Company’s website at
Web link http://suven.com/Policy%20on%20Related%20Party%20Transactions.pdf
ii) Legal Compliance There were no instances of non-compliance by the Company, penalties, and strictures imposed on the Company by Stock Exchange or SEBI
or any statutory authority, on any matter related to capital markets, during the last three years.
iii) Whistle Blower Policy The Company has a Whistle Blower Policy to deal with instances of fraud and mismanagement, if any. The policy ensures that strict
confidentiality is maintained whilst dealing with concerns and also that no discrimination will be meted out to any person for a genuinely
raised concern. Pursuant thereto, anyone can approach directly Chairman of the Audit Committee or through Company Secretary to report
any suspected or confirmed incident of fraud / misconduct it is affirmed that no personnel has been denied access to the audit committee
and can be accessed at Web link http://suven.com/WBP_SUVEN.pdf
iv) Details of compliance with mandatory requirements and adoption of the non-mandatory requirements
Mandatory requirements The Company has complied with all the mandatory requirements of SEBI (Listing Obligations and Disclosure Requirements) Regulations, 2015
and is being reviewed from time to time.
Non-mandatory requirements
1. The Board: Office for non-executive Chairman at Company’s expense: Not Applicable
2. Shareholder Rights: Half-yearly declaration of financial performance to each household of shareholders: Not complied
3. Audit qualifications: Complied as there are not audit qualifications
4. Separate posts of Chairman & CEO: Not Applicable
5. Reporting of Internal Auditor: The Internal auditors directly to Audit Committee: Complied
v) web link policy for determining ‘material’ subsidiaries The Board has approved a policy for determining ‘material’ subsidiaries which has been uploaded on the Company’s website and it can be
accessed at Web link:
http://suven.com/POLICY_ON_DETERMINING_MATERIA%20EVENT_OR_INFORMATION.pdf
vi) disclosure of commodity price risks and commodity hedging activities : The Company did not undertake any commodity hedging activities during the year hence there were no commodity price risks involved.
Non-compliance of any requirement of corporate governance report
Our company has complied with all requirements of corporate governance report for the year 2015-2016.
The disclosures of the compliance with corporate governance requirements specified in regulation 17 to 27 and clauses (b) to (i) of sub-regulation (2) of regulation 46 shall be made in the section on corporate governance of the annual report
Our Company has complied with all the provisions of the above said Regulations of SEBI for the year 2015-2016.
63ANNUAL REPORT
2015/16SUVENLIFE SCIENCES LIMITED

To
The Members of
Suven Life Sciences Limited
As required under SEBI (Listing Obligations and Disclosure Requirements) Regulations, 2015, I hereby confirm that the Company has adopted a
Code of Conduct for all Board Members and Senior Management and the same has been placed on the Company’s website. All Board Members
and Senior Management personnel have affirmed compliance with the Code of Conduct in respect of the financial year ended 31st March, 2016.
For Suven Life Sciences Limited
Venkateswarlu JastiPlace: Hyderabad Chairman & CEODate: 27th May, 2016 DIN: 00278028
To
The Members of
M/s. Suven Life Sciences Limited
We have examined the Compliance of conditions of Corporate Governance by M/s. SUVEN LIFE SCIENCES LIMITED (“the Company”), for the year
ended on 31st March 2016, as stipulated in Clause 49 of the Listing Agreement (“Listing Agreement”) of the Company with the Stock Exchanges for
the period 1st April, 2015 to 30th November, 2015 and as per the relevant provisions of Securities and Exchange Board of India (Listing Obligations
and Disclosure Requirements) Regulations, 2015 (“Listing Regulations”) as referred to in Regulation 15(2) of the Listing Regulations for the period
1st December, 2015 to 31st March, 2016.
The compliance of conditions of Corporate Governance is the responsibility of the management. Our examination was limited to procedures and
implementations on thereof, adopted by the Company for ensuring the compliance of the conditions of the Corporate Governance. It is neither an
audit nor an expression of opinion on the financial statements of the Company.
In our opinion and to the best of our information and according to the explanation given to us, we certify that the Company has complied with the
conditions of Corporate Governance as stipulated in the above mentioned Listing Agreement/Listing Regulations, as applicable.
We further state that such compliance is neither an assurance as to the future viability of the Company nor the efficiency or effectiveness with
which the management has conducted the affairs of the Company.
For Karvy & Co.,Chartered Accountants
(Firm Registration No. 001757S)
Sanjeev Kumar SreepathiPlace: Hyderabad PartnerDate: 27th May, 2016 Membership No. 209145
Declaration Regarding Compliance by Board Members and Senior Management Personnel with the Company’s Code of Conduct
Certificate of Compliance
R E P O R T O N C O R P O R A T E G O V E R N A N C E
64

STANDALONE FINANCIAL SECTION
65ANNUAL REPORT
2015/16SUVENLIFE SCIENCES LIMITED
To
The Members of
Suven Life Sciences Limited
Report on the Standalone Financial Statements
We have audited the accompanying standalone financial statements of
Suven Life Sciences Limited (‘the Company’) which comprise the Balance
Sheet as at 31st March, 2016, the Statement of Profit and Loss and the
Cash Flow Statement for the year then ended and a summary of significant
accounting policies and other explanatory information.
Management’s Responsibility for the Standalone Financial Statements
The Company’s Board of Directors is responsible for the matters stated in
Section 134(5) of the Companies Act, 2013 (“the Act”) with respect to the
preparation of these standalone financial statements that give a true and
fair view of the financial position, financial performance and cash flows
of the Company in accordance with the accounting principles generally
accepted in India, including the Accounting Standards specified under
Section 133 of the Act, read with Rule 7 of the Companies (Accounts) Rules,
2014. This responsibility also includes maintenance of adequate accounting
records in accordance with the provisions of the Act for safeguarding the
assets of the Company and for preventing and detecting frauds and other
irregularities; selection and application of appropriate accounting policies;
making judgments and estimates that are reasonable and prudent; and
design, implementation and maintenance of adequate internal financial
controls, that were operating effectively for ensuring the accuracy and
completeness of the accounting records, relevant to the preparation and
presentation of the financial statements that give a true and fair view and
are free from material misstatement, whether due to fraud or error.
Auditor’s Responsibility
Our responsibility is to express an opinion on these standalone financial
statements based on our audit.
We have taken into account the provisions of the Act, the accounting and
auditing standards and matters which are required to be included in the
audit report under the provisions of the Act and the Rules made thereunder.
We conducted our audit in accordance with the Standards on Auditing
specified under Section 143(10) of the Act. Those Standards require that we
comply with ethical requirements and plan and perform the audit to obtain
reasonable assurance about whether the financial statements are free from
material misstatement.
An audit involves performing procedures to obtain audit evidence about the
amounts and the disclosures in the financial statements. The procedures
selected depend on the auditor’s judgment, including the assessment of
the risks of material misstatement of the financial statements, whether due
to fraud or error. In making those risk assessments, the auditor considers
internal financial control relevant to the Company’s preparation of the
financial statements that give a true and fair view in order to design
audit procedures that are appropriate in the circumstances. An audit
also includes evaluating the appropriateness of the accounting policies
used and the reasonableness of the accounting estimates made by the
Company’s Directors, as well as evaluating the overall presentation of the
financial statements.
We believe that the audit evidence we have obtained is sufficient and
appropriate to provide a basis for our audit opinion on the standalone
financial statements.
Opinion
In our opinion and to the best of our information and according to the
explanations given to us, the aforesaid standalone financial statements
give the information required by the Act in the manner so required and give
a true and fair view in conformity with the accounting principles generally
accepted in India, of the state of affairs of the Company as at 31st March,
2016 and its profit and its cash flows for the year ended on that date.
Report on Other Legal and Regulatory Requirements
As required by the Companies (Auditor’s Report) Order, 2016 (“the Order”),
issued by the Central Government of India in terms of sub-section (11)
of section 143 of the Act, we give in the Annexure-A, a statement on
the matters specified in paragraphs 3 and 4 of the Order, to the extent
applicable.
As required by section 143 (3) of the Act, we report that:
a) We have sought and obtained all the information and explanations
which to the best of our knowledge and belief were necessary for the
purposes of our audit.
b) In our opinion, proper books of account as required by law have been
kept by the Company so far as it appears from our examination of
those books.
c) The Balance Sheet, the Statement of Profit and Loss and the Cash Flow
Statement dealt with by this Report are in agreement with the books
of account.
d) In our opinion, the aforesaid standalone financial statements comply
with the Accounting Standards specified under Section 133 of the Act,
read with Rule 7 of the Companies (Accounts) Rules, 2014.
INDEPENDENT AUDITOR’S REPORT
S T A N D A L O N E F I N A N C I A L S E C T I O N
66

e) On the basis of the written representations received from the directors
as on 31st March, 2016, taken on record by the Board of Directors,
none of the directors is disqualified as on 31st March, 2016, from
being appointed as a director in terms of Section 164(2) of the Act.
f) With respect to the adequacy of the internal financial controls over
financial reporting of the Company and the operating effectiveness of
such controls, refer to our separate report in “Annexure-B”; and
g) With respect to the other matters to be included in the Auditor’s Report
in accordance with Rule 11 of the Companies (Audit and Auditors)
Rules, 2014, in our opinion and to the best of our information and
according to the explanations given to us;
i. The Company has disclosed the impact of pending litigations on
its financial position in its financial statements- Refer Note 29
to the financial statements;
ii. There has been no delay in transferring amounts, required to be
transferred, to the Investor Education and Protection Fund by
the Company.
For KARVY & CO.
Chartered Accountants
ICAI Firm Registration No: 01757S
(SANJEEV KUMAR SREEPATHI)
Place: Hyderabad Partner
Date : 27th May, 2016 Membership No. 209145
i. In respect of its fixed assets:
(a) The Company has maintained proper records showing full
particulars, including quantitative details and situation of fixed
assets.
(b) As explained to us, the management has physically verified
a substantial portion of the fixed assets during the year and
in our opinion frequency of verification is reasonable having
regard to the size of the Company and the nature of its assets.
The discrepancies noticed on physical verification of fixed
assets as compared to the books of account were not material
and have been properly dealt with in the books of accounts.
(c) In our opinion and according to the information and
explanations given to us, all the title deeds of immovable
properties are held in the name of the Company except 21.18
acres of freehold land acquired and taken possession and yet
to be registered for Vishakhapatnam Plant amounting to `
513.22 lakhs.
ii. According to the information and explanations given to us, the
inventories have been physically verified by the management during
the year. In our opinion, the frequency of verification is reasonable.
The discrepancies noticed on physical verification of inventory as
compared to the books of account were not material and have been
properly dealt with in the books of accounts.
iii. According to the information and explanations given to us, the
Company has not granted any loans, secured or unsecured to
companies, firms, Limited Liability partnerships or other parties
covered in the register maintained under section 189 of the Act.
Accordingly, the provisions of clause 3(iii) (a) to (c) of the Order are
not applicable to the Company.
iv. In our opinion and according to the information and explanations
given to us, the Company has complied with the provisions of section
185 and 186 of the Act, with respect to the loans and investments
made.
v. According to the information and explanations given to us, the
Company has not accepted any deposits from the public within the
meaning of Section 73 and 76 or any other relevant provisions of the
Act and the rules framed there under.
vi. We have broadly reviewed the books of account and records
Annexure - A referred to in paragraph 1 of Report on Other Legal and Regulatory Requirements section of our report of even date
Re: Suven Life Sciences Limited (‘the Company’)
67ANNUAL REPORT
2015/16SUVENLIFE SCIENCES LIMITED

maintained by the Company pursuant to the Rules made by the
Central Government of India for the maintenance of cost records
prescribed under sub-section (1) of section 148 of the Act in respect
of production and processing activities of the Company and are of
the opinion that prima facie, the prescribed accounts and records
have been maintained. We have however, not made a detailed
examination of the records with a view to determine whether they
are accurate or complete.
vii. In respect of Statutory dues:
(a) The Company is regular in depositing with appropriate
authorities, undisputed statutory dues including provident
fund, employees' state insurance, income-tax, sales-tax,
service tax, duty of customs, duty of excise , value added
tax, cess and other material statutory dues applicable to it.
According to the information and explanations given to us, no
undisputed amounts payable in respect of such statutory dues
were outstanding, at the year end, for a period of more than six
months from the date they became payable.
(b) According to the information and explanations given to us,
the dues outstanding of income-tax on account of dispute as
follows:
Name of the Statute Nature of the dues
Amount[` in lakhs]
Period to which the amount relates
Forum at which dispute is pending
Income Tax Act,1961 Income Tax 7.64 A.Y 2011-12 Income Tax Appellate Tribunal -Hyderabad
Income Tax Act,1961 Income Tax 20.94 A.Y2012-13 Income Tax Appellate Tribunal -Hyderabad
viii. Based on our audit procedures and as per the information and
explanations given by the management, we are of the opinion that
the Company has not defaulted in the repayment of dues to banks,
governments and financial institutions. The Company did not have
any debentures outstanding as at the year end.
ix. Based on the information and explanations given to us by the
management, the Company has raised moneys by way of QIP offer
amounting to ` 200 crores in F.Y 2014-2015 of which ` 60.50 crores
was utilised for the purposes it was raised and balance amounting to
` 139.50 crores yet to be utilised .No term loans were taken during
the year by the Company.
x. Based upon the audit procedures performed for the purpose of
reporting the true and fair view of the financial statements and as
per the information and explanations given by the management, we
report that no material fraud, by the Company or on the Company
by its officers or employees, has been noticed or reported during the
year.
xi. According to the information and explanations give to us and based
on our examination of the records of the Company, the Company has
paid/provided for managerial remuneration in accordance with the
requisite approvals mandated by the provisions of section 197 read
with Schedule V to the Act.
xii. In our opinion and according to the information and explanations
given to us, the Company is not a Nidhi Company. Accordingly,
paragraph 3(xii) of the Order is not applicable.
xiii. According to the information and explanations given to us and based
on our examination of the records of the Company, transactions with
the related parties are in compliance with sections 177 and 188 of
the Act where applicable and details of such transactions have been
disclosed in the financial statements as required by the applicable
accounting standards.
xiv. According to the information and explanations given to us and based
on our examination of the records of the Company, the Company has
not made any preferential allotment or private placement of shares
or fully or partly convertible debentures during the year.
xv. According to the information and explanations given to us and based
on our examination of the records of the Company, the Company
has not entered into non-cash transactions with directors or persons
connected with him. Accordingly, paragraph 3(xv) of the Order is not
applicable..
xvi. The Company is not required to be registered under section 45-IA of
the Reserve Bank of India Act 1934.
For KARVY & CO.
Chartered Accountants
ICAI Firm Registration No: 01757S
(SANJEEV KUMAR SREEPATHI)
Place: Hyderabad Partner
Date : 27th May, 2016 Membership No. 209145
S T A N D A L O N E F I N A N C I A L S E C T I O N
68

Annexure - B to the Our Report of even date on the Standalone Financial Statements of Suven Life Sciences Limited
Report on the Internal Financial Controls under Clause (i) of Sub-section 3 of Section 143 of the Companies Act, 2013 (“the Act”)
We have audited the internal financial controls over financial reporting
of Suven Life Sciences Limited (“the Company”) as of 31 March 2016 in
conjunction with our audit of the standalone financial statements of the
Company for the year ended on that date.
Management’s Responsibility for Internal Financial ControlsThe Company’s management is responsible for establishing and
maintaining internal financial controls based on the internal control over
financial reporting criteria established by the Company considering the
essential components of internal control stated in the Guidance Note on
Audit of Internal Financial Controls over Financial Reporting issued by the
Institute of Chartered Accountants of India (‘ICAI’). These responsibilities
include the design, implementation and maintenance of adequate internal
financial controls that were operating effectively for ensuring the orderly
and efficient conduct of its business, including adherence to company’s
policies, the safeguarding of its assets, the prevention and detection of
frauds and errors, the accuracy and completeness of the accounting
records, and the timely preparation of reliable financial information, as
required under the Companies Act, 2013.
Auditors’ ResponsibilityOur responsibility is to express an opinion on the Company's internal
financial controls over financial reporting based on our audit. We
conducted our audit in accordance with the Guidance Note on Audit of
Internal Financial Controls over Financial Reporting (the “Guidance Note”)
and the Standards on Auditing, issued by ICAI and deemed to be prescribed
under section 143(10) of the Companies Act, 2013, to the extent applicable
to an audit of internal financial controls, both applicable to an audit of
Internal Financial Controls and, both issued by the Institute of Chartered
Accountants of India. Those Standards and the Guidance Note require that
we comply with ethical requirements and plan and perform the audit to
obtain reasonable assurance about whether adequate internal financial
controls over financial reporting was established and maintained and if
such controls operated effectively in all material respects.
Our audit involves performing procedures to obtain audit evidence about the
adequacy of the internal financial controls system over financial reporting
and their operating effectiveness. Our audit of internal financial controls
over financial reporting included obtaining an understanding of internal
financial controls over financial reporting, assessing the risk that a material
weakness exists, and testing and evaluating the design and operating
effectiveness of internal control based on the assessed risk. The procedures
selected depend on the auditor’s judgment, including the assessment of the
risks of material misstatement of the financial statements, whether due to
fraud or error.
We believe that the audit evidence we have obtained is sufficient and
appropriate to provide a basis for our audit opinion on the Company’s
internal financial controls system over financial reporting.
Meaning of Internal Financial Controls over Financial ReportingA company's internal financial control over financial reporting is a
process designed to provide reasonable assurance regarding the reliability
of financial reporting and the preparation of financial statements for
external purposes in accordance with generally accepted accounting
principles. A company's internal financial control over financial reporting
includes those policies and procedures that (1) pertain to the maintenance
of records that, in reasonable detail, accurately and fairly reflect the
transactions and dispositions of the assets of the Company; (2) provide
reasonable assurance that transactions are recorded as necessary to permit
preparation of financial statements in accordance with generally accepted
accounting principles, and that receipts and expenditures of the Company
are being made only in accordance with authorisations of management
and directors of the Company; and (3) provide reasonable assurance
regarding prevention or timely detection of unauthorised acquisition, use,
or disposition of the Company's assets that could have a material effect on
the financial statements.
Inherent Limitations of Internal Financial Controls Over Financial ReportingBecause of the inherent limitations of internal financial controls over
financial reporting, including the possibility of collusion or improper
management override of controls, material misstatements due to error or
fraud may occur and not be detected. Also, projections of any evaluation of
the internal financial controls over financial reporting to future periods are
subject to the risk that the internal financial control over financial reporting
may become inadequate because of changes in conditions, or that the
degree of compliance with the policies or procedures may deteriorate.
Opinion In our opinion, the Company has, in all material respects, an adequate
internal financial controls system over financial reporting and such internal
financial controls over financial reporting were operating effectively as
at 31 March 2016, based on the internal control over financial reporting
criteria established by the Company considering the essential components
of internal control stated in the Guidance Note on Audit of Internal
Financial Controls Over Financial Reporting issued by the Institute of
Chartered Accountants of India.
For KARVY & CO. Chartered Accountants
ICAI Firm Registration No: 01757S
(SANJEEV KUMAR SREEPATHI)Place: Hyderabad Partner
Date : 27th May, 2016 Membership No. 209145
69ANNUAL REPORT
2015/16SUVENLIFE SCIENCES LIMITED

Particulars Note No.
As at 31st March 2016
As at
31st March 2015
EQUITY AND LIABILITIES
Shareholder's Funds
Share capital 3 1,272.83 1,272.83
Reserves and surplus 4 61,091.58 54,658.58
Non-Current Liabilities
Long-term borrowings 5 4,322.66 6,144.59
Long-term provision 6 239.49 227.48
Deferred Tax Liability(Net) 7 3,442.81 2,271.33
Current Liabilities
Short Term borrowings 8 2,416.36 2,823.51
Trade payables 9 3,533.11 4,389.08
Other current liabilities 10 4,198.25 4,244.59
Short-term provisions 6 274.50 1,281.42
Total 80,791.59 77,313.41
ASSETS
Non-current assets
Fixed assets
(i) Tangible assets 11 30,505.64 17,175.31
(ii) Intangible assets 11 29.71 19.61
(iii) Capital work-in-progress 719.72 10,701.33
Non-current investments 12 2,298.10 -
Long term loans and advances 13 409.49 1,088.74
Other non-current assets 18 160.53 630.54
Current assets
Current investments 14 3.64 3.64
Inventories 15 8,346.44 8,180.55
Trade receivables 16 5,356.49 4,016.92
Cash and bank balances 17 24,063.79 27,968.90
Short-term loans and advances 13 8,865.80 7,459.79
Other current assets 18 32.24 68.08
Total 80,791.59 77,313.41
Significant Accounting Policies 1-2
The accompanying notes are an integral part of the Financial Statements.
As per our report of even date for and on behalf of the Board of Directors offor KARVY & CO. SUVEN LIFE SCIENCES LIMITEDChartered AccountantsFirm registration number: 001757S
SANJEEV KUMAR SREEPATHI VENKATESWARLU JASTIPartner Chairman & CEOMembership No. 209145 DIN: 00278028
P. SUBBA RAO K. HANUMANTHA RAOPlace: Hyderabad Chief Financial Officer Company SecretaryDate: 27th May, 2016 Membership No. A11342 Membership No. A11599
BALANCE SHEET as at 31st March, 2016
(All amounts in lakhs in Indian Rupees, unless otherwise stated)
S T A N D A L O N E F I N A N C I A L S E C T I O N
70

Particulars Note No.
For the year ended 31st March 2016
For the year ended
31st March 2015
INCOME
Revenue from operations (Gross) 19 50,028.19 52,159.63
Less : Excise Duty 19 (75.95) (74.13)
Revenue from operations (Net) 49,952.24 52,085.50
Other Income 20 1,935.02 858.12
Total 51,887.26 52,943.62
EXPENSES:
Cost of materials consumed 21 17,845.37 17,724.78
(Increase)/ decrease in inventories of work-in-progress and finished goods 22 (1,205.21) 347.95
Manufacturing expenses 23 7,446.06 6,444.21
Employee benefit expense 24 4,163.59 3,651.17
Research & Development Expenses 25 6,295.08 5,596.26
Finance costs 26 541.70 470.92
Depreciation and amortisation expense 11 1,672.04 1,177.57
Other expenses 27 3,081.90 2,375.29
Total 39,840.53 37,788.15
Profit/(Loss) before tax 12,046.73 15,155.47
Tax expense:
(1) Current tax 2,577.07 3,090.18
(2) Previous year tax 2.99 180.03
(3) Deferred tax 1,171.47 (240.08)
(4) MAT Credit (Entitlement)/ Reversal (1,201.78) 1,250.31
Total Tax Expenditure 2,549.75 4,280.44
Profit/(Loss) for the year 9,496.98 10,875.03
Earnings per Share
Basic & Diluted 28 7.46 9.04
Significant Accounting Policies 1-2
STATEMENT OF PROFIT AND LOSS for the year ended 31st March, 2016
(All amounts in lakhs in Indian Rupees, unless otherwise stated)
The accompanying notes are an integral part of the Financial Statements.
As per our report of even date for and on behalf of the Board of Directors offor KARVY & CO. SUVEN LIFE SCIENCES LIMITEDChartered AccountantsFirm registration number: 001757S
SANJEEV KUMAR SREEPATHI VENKATESWARLU JASTIPartner Chairman & CEOMembership No. 209145 DIN: 00278028
P. SUBBA RAO K. HANUMANTHA RAOPlace: Hyderabad Chief Financial Officer Company SecretaryDate: 27th May, 2016 Membership No. A11342 Membership No. A11599
71ANNUAL REPORT
2015/16SUVENLIFE SCIENCES LIMITED

Particulars For the year ended 31st March 2016
For the year ended
31st March 2015
CASH FLOW FROM OPERATING ACTIVITIES
Profit before tax 12,046.73 15,155.47
Non-cash adjustment to reconcile profit before tax to net cash flows
Depreciation 2,395.29 2,421.20
Interest Income (247.91) (233.85)
Interest on Finance Cost 541.70 470.92
Dividend Income (50.34) (569.87)
Gain on sale of Investment (1,617.81) (7.83)
Loss due to asset discarded 32.15
Profit on Sale of Assets - (4.12)
Operating profit before working capital changes 13,099.81 17,231.92
Movements in working capital:
(Increase)/ Decrease in Long term Loans and Advances 679.25 174.98
(Increase)/ Decrease in Inventories (165.89) (317.69)
(Increase)/ Decrease in Trade Receivables (1,339.57) 2,530.11
(Increase)/ Decrease in Short Loans & Advances (1,406.01) (655.60)
(Increase)/ Decrease in other current assets 1,758.89 (1,405.90)
(Increase)/ Decrease in Trade Payables (855.97) 299.03
(Increase)/ Decrease in other current liabilities (46.35) (507.25)
(Increase)/ Decrease in short term provisions 142.78 658.51
(Increase)/ Decrease in long term provisions 12.01 48.13
Cash generated from operations 11,878.95 18,056.25
Direct taxes paid (net of refunds) (2,659.05) (3,765.74)
Net cash flow from operating activities (A) 9,219.90 14,290.51
CASH FLOWS FROM INVESTING ACTIVITIES
Sale/(Purchase) of Investments (2,298.10) 0.15
Purchase of Fixed Assets (5,786.26) (11,829.35)
Sale of Fixed Assets - 4.12
Gain on sale of Investment 1,617.81 7.83
Interest Received 275.65 209.62
Changes in bank balances not considered as cash equivalents (52.31) (6.91)
Dividend Received 50.34 569.87
Net cash flow used in investing activities (B) (6,192.87) (11,044.67)
CASH FLOW STATEMENT for the year ended 31st March, 2016
(All amounts in lakhs in Indian Rupees, unless otherwise stated)
S T A N D A L O N E F I N A N C I A L S E C T I O N
72

Particulars For the year ended 31st March 2016
For the year ended
31st March 2015
CASH FLOWS FROM FINANCING ACTIVITIES
Repayment of long-term borrowings (2,029.72) 1,826.23
Repayment of short- term borrowings (net) (407.15) (31.85)
Interest Paid on borrowings (564.44) (463.94)
Issue of capital with Premium - 20,000.00
Dividend Payouts (including Dividend Tax) (3,983.14) (3,417.12)
Net cash flow used in financing activities (C) (6,984.45) 17,913.31
Net (decrease)/increase in cash and cash equivalents (A+B+C) (3,957.42) 21,159.15
Cash and cash equivalents at the beginning of the year 27,936.19 6,777.04
Cash and cash equivalents at the end of the year 23,978.77 27,936.19
Components of cash and cash equivalents
Cash on hand 10.91 10.79
Balances with Banks 23,967.86 27,925.40
Total cash and cash equivalents (refer note 17) 23,978.77 27,936.19
Summary of significant accounting policies 1-2
CASH FLOW STATEMENT for the year ended 31st March, 2016
(All amounts in lakhs in Indian Rupees, unless otherwise stated)
The accompanying notes are an integral part of the Financial Statements.
As per our report of even date for and on behalf of the Board of Directors offor KARVY & CO. SUVEN LIFE SCIENCES LIMITEDChartered AccountantsFirm registration number: 001757S
SANJEEV KUMAR SREEPATHI VENKATESWARLU JASTIPartner Chairman & CEOMembership No. 209145 DIN: 00278028
P. SUBBA RAO K. HANUMANTHA RAOPlace: Hyderabad Chief Financial Officer Company SecretaryDate: 27th May, 2016 Membership No. A11342 Membership No. A11599
73ANNUAL REPORT
2015/16SUVENLIFE SCIENCES LIMITED

1. CORPORATE INFORMATION Suven Life Sciences Limited (Suven) is a bio-pharmaceutical company, began operations in 1989 as specialty chemicals provider about 27 years ago
and went on to create a NCE based CRAMS (Contract Research And Manufacturing Services) business model in 1995, providing building blocks (bulk
actives, drug intermediates and specialty chemicals) for global life science companies. Suven has made in-roads into drug discovery in the year
2005 with a specialisation on CNS (Central Nervous System) based programs targeting unmet medical need and 4 of the molecules in pipeline are
into clinical phase of development. The Company is targeting CNS indications where there is a high unmet medical need, patient populations are
identifiable, clinical endpoints can be well-defined and with possible commercialisation options.
Suven, Inc., a Delaware Company, is a WOS (wholly owned subsidiary) of Suven, is a clinical-stage biopharmaceutical company commenced activities in
October 2015, focused on the acquisition, development and commercialisation of novel therapeutics for the treatment of neurodegenerative disorders.
The near-term focus for Suven, Inc., is to develop Suven product candidate, which we refer to as SUVN-502, for the treatment of Alzheimer's disease
and other forms of dementia.
2. BASIS OF PREPARATION 2.1 Basis of Accounting The financial statements of the Company have been prepared in accordance with the generally accepted accounting principles in India (Indian
GAAP). The Company has prepared these financial statements to comply in all material respects with the accounting standards notified under
section 133 of the Companies Act 2013, read together with paragraph 7 of the Companies (Accounts) Rules 2014.
2.2 Use of Estimates
The presentation of financial statements in conformity with the generally accepted accounting principles requires management to make
estimates and assumptions that affect the reported value of assets and liabilities on the date of the financial statements and the reported
amount of revenue and expenditure for the year. The difference between the actual results and estimates are recognised in the period in which
the results are known / materialised.
2.3 Revenue Recognition
i. Revenue from sale of goods is recognised when significant risks and rewards in respect of ownership of products are transferred to
customers.
ii. Revenue from Contract Technical Services, Clinical Trials Services, Process Development Services and Formulation Development Charges are
recognised on completion of the milestone work.
iii. Income from Investments
(a) The Company recognises Interest on investments on accrual basis.
(b) Dividend income on investments is accounted for when the right to receive the payment is established.
2.4 Fixed Assets i. Tangible assets Fixed assets are stated at cost and as reduced by accumulated depreciation and accumulated impairement lossess . The cost comprises
purchase price, borrowing costs if capitalisation criteria are met and directly attributable cost of bringing the asset to its working condition
for the intended use. Any trade discounts and rebates are deducted in arriving at the purchase price.Exchange difference arising on Long
Term Foreign currency monetary items relating to acquisition of fixed assets are adjusted to the carrying cost of such assets.
Subsequent expenditure related to an item of fixed asset is added to its book value only if it increases the future benefits from the existing
asset beyond its previously assessed standard of performance. All other expenses on existing fixed assets, including day-to-day repair and
maintenance expenditure and cost of replacing parts, are charged to the statement of profit and loss for the period during which such
expenses are incurred.
Gains or losses arising from derecognition of fixed assets are measured as the difference between the net disposal proceeds and the carrying
amount of the asset and are recognised in the statement of profit and loss when the asset is derecognised.
ii. Intangible assets Intangible assets acquired separately are measured on initial recognition at cost. Following initial recognition, intangible assets are carried at
cost less accumulated amortisation and accumulated impairment losses, if any. Internally generated intangible assets, excluding capitalised
development costs, are not capitalised and expenditure is reflected in the statement of profit and loss in the year in which the expenditure
is incurred.
Intangible assets are amortised on a straight line basis over the estimated useful economic life. The Company uses a rebuttable presumption
NOTES TO THE FINANCIAL STATEMENTS
S T A N D A L O N E F I N A N C I A L S E C T I O N
74

that the useful life of an intangible asset will not exceed ten years from the date when the asset is available for use.
Gains or losses arising from derecognition of an intangible asset are measured as the difference between the net disposal proceeds and the
carrying amount of the asset and are recognised in the statement of profit and loss when the asset is derecognised.
2.5 Depreciation Depreciation on fixed assets is provided on straight-line basis at the rates arrived at based on the useful lives prescribed in Schedule II of the
Companies Act, 2013. The Company follows the policy of charging depreciation on pro-rata basis on the assets acquired or disposed off during
the year.
2.6 Investments
Investments, which are readily realisable and intended to be held for not more than one year from the date on which such investments are made,
are classified as current investments. All other investments are classified as long-term investments.
On initial recognition, all investments are measured at cost. The cost comprises purchase price and directly attributable acquisition charges such
as brokerage, fees and duties.
Non-current investments are stated at cost and provision for diminution is made if the decline in value is other than temporary in nature.
On disposal of an investment, the difference between its carrying amount and net disposal proceeds is charged or credited to the statement of
Profit & Loss.
2.7 Inventories i. Stock of raw materials, Stores, spares and fuel are stated at cost and are valued on FIFO basis.
ii. Work in process is stated at cost.
iii. Finished Goods are valued at the lower of the Cost or net realisable value.
2.8 Research & Development expenses i. Revenue expenditure on research and development activities is expensed as and when incurred.
ii. The expenditure on capital assets having alternative use either in R&D activity or otherwise are capitalised and amortised at the rate
specified in Schedule II of the Companies Act 2013.
iii. Depreciation on R&D assets is included in R&D expenses.
2.9 Foreign Currency Transactions i. Transactions denominated in foreign currency are normally recorded at the exchange rate prevailing at the time of the transaction.
ii. Any income or expense on account of exchange difference either on settlement or on translation is recognised in the profit and loss account,
except exchange difference arising on Long Term Foreign currency monetary items relating to acquisition of fixed assets which are adjusted
to the carrying cost of such assets.
iii. In case of Monetary items which are covered by forward exchange contracts, premium or discount on forward exchange contracts are
amortised and recognised in the profits and loss account over the period of the contract. Forward Exchange Contracts outstanding at the
balance sheet date, are stated at fair value and any gains or losses are recognised in the profit and loss account.
iv. Financial Derivative Contracts:
The realised gain/loss in respect of settled contracts are recognised in the Profit and loss account.
2.10 Retirement benefits to employees The Company has Defined Contribution Plan for its employees’ retirement benefits comprising of Provident Fund and Employees Pension
Scheme, 1995. The Company contributes to State Plans namely Employees’ State Insurance Scheme.
The Company has Defined Benefit Plan comprising of Gratuity Fund and Leave Encashment. The Company contributes to Gratuity Fund
administered by LIC. The liability for the Gratuity Fund and Leave Encashment are determined on the basis of an independent actuarial valuation
done at the year end. Actuarial Gains and Losses comprise experience adjustments and the effect of changes in the actuarial assumptions and
are recognised immediately in the Profit and Loss Account as income or expense.
2.11 Borrowing Cost Borrowing cost includes interest and amortisation of ancillary costs incurred in connection with the arrangement of borrowings.
Borrowing Costs that are directly attributable to the acquisition of a fixed asset are capitalised as part of the cost of the asset till the date the
asset is ready for commercial use. All other borrowing costs are charged to revenue.
NOTES TO THE FINANCIAL STATEMENTS
75ANNUAL REPORT
2015/16SUVENLIFE SCIENCES LIMITED

2.12 Income Taxes The current charge for taxes is calculated in accordance with relevant tax regulations applicable to the Company.
The deferred tax for the timing differences between the book and tax profits for the year end is accounted for, using the tax rates and laws that
have been substantially enacted as of the balance sheet date.
Deferred tax assets arising from timing differences are recognised and carried forward only if there is reasonable certainty that they will be
realised in future and reviewed for the appropriateness of their respective carrying value at each balance sheet date.
2.13 Earnings per share
The basic earnings per share (EPS) is computed by dividing the net profit after tax for the year by the weighted average number of equity shares
outstanding during the year. For the purpose of calculating diluted earnings per share, net profit after tax for the year and the weighted average
number of shares outstanding during the year are adjusted for the effects of all dilutive potential equity shares. The dilutive potential equity
shares are deemed converted as of the beginning of the period, unless they have been issued at a later date.
2.14 Impairment of Assets
If the carrying amount of fixed assets exceeds the recoverable amount on the reporting date, the carrying amount is reduced to the recoverable
amount. The recoverable amount is measured as the higher of the net selling price and the value in use determined by the present value of
estimated future cash flows.
2.15 Provisions Provisions are recognised when the Company has present legal or constructive obligations, as a result of past events, for which it is probable
that an outflow of economic benefits will be required to settle the obligation and a reliable estimate can be made for the amount of obligation.
2.16 Segmental information - Basis of preparation
i. Segment Revenue and Expenses
Revenues and expenses are allocated on a reasonable basis to segments being common manufacturing facilities and sales force.
ii. Segment Assets and Liabilities
Segment assets and liabilities which can be identified to a segment are allocated to the respective segment. The fixed assets and net current
assets are not identifiable for particular segment except R & D segment, because these assets can be used interchangeable among the
segments. Hence the management feels that the assets cannot be segregated to particular segment and to disclose these under unallocated
assets.
2.17 Employee Stock Option Schemes In accordance with the Securities and Exchange Board of India guidelines, the excess of the market price of shares, at the date of grant of options
under the Employee stock option schemes, over the exercise price is treated as employee compensation and amortised on a straight-line basis
over the vesting period.
2.18 Cash and Cash equivalents Cash and cash equivalents for the purposes of cash flow statement comprise cash at bank and in hand and short-term investments with an
original maturity of three months or less.
NOTES TO THE FINANCIAL STATEMENTS(All amounts in lakhs in Indian Rupees, unless otherwise stated)
S T A N D A L O N E F I N A N C I A L S E C T I O N
76

NOTES TO THE FINANCIAL STATEMENTS(All amounts in lakhs in Indian Rupees, unless otherwise stated)
3 SHARE CAPITAL:
Particulars As at 31st March, 2016
As at
31st March, 2015
Authorised Shares (Nos)
400,000,000 Equity shares of `1 /- each (400,000,000 Equity shares of `1 /- each) 4,000.00 4,000.00
4,000.00 4,000.00
Issued, Subscribed and fully paid up (Nos)
127,282,478 Equity shares of `1 /- each (127,282,478 Equity shares of ` 1 /- each) 1,272.83 1,272.83
1,272.83 1,272.83
3.3 Shares held by holding company Out of equity shares issued by the Company, shares held by its holding company are as below:
Particulars As at 31st March, 2016
As at
31st March, 2015
M/s. Jasti Property and Equity Holdings Private Limited
76,365,000 Equity shares of ` 1/- each (Previous year:75,652,576) 76,365,000 75,652,576
3.1 Reconciliation of the shares outstanding at the beginning and at the end of the year
Particulars As at 31st March, 2016 As at 31st March, 2015
Number Amount Number Amount
Equity shares
At the beginning of the year 127,282,478 1,272.83 116,828,788 1,168.29
Add: Issued during the year on account of QIP - - 10,453,690 104.54
Outstanding at the end of the year 127,282,478 1,272.83 127,282,478 1,272.83
3.2 Terms/ rights attached to equity shares The Company has only one class of equity shares having par value of `1/- per share. Each holder of equity shares is entitled to one vote per share. The
Company declares and pays dividends in Indian rupees.
The Board of Directors has declared and paid an interim dividend of `1/- per equity share and a onetime special dividend of `1/- per equity share. The
total amount of per share dividend recognised as distributions to equity shareholders was `2.00 (31st March, 2015: `0.60/-).
In the event of liquidation of the Company, the holders of equity shares will be entitled to receive remaining assets of the Company, after distribution
of all preferential amounts, if any. The distribution will be in proportion to the number of equity shares held by the shareholders.
3.4 Details of shareholders holding more than 5% shares in the Company
Name of shareholder As at 31st March, 2016 As at 31st March, 2015
Number % of Holding Number % of Holding
Equity shares of `1/- each fully paid up
M/s. Jasti Property and Equity Holdings Private Limited 76,365,000 60.00% 75,652,576 59.44%
As per records of the Company, including its register of shareholders/ members and other declarations received from shareholders regarding beneficial
interest, the above shareholding represents both legal and beneficial ownerships of shares.
3.5 Shares reserved for issue under Options Details of shares reserved for issue under the employee stock option plan of the Company
As at 31st March, 2016 As at 31st March, 2015
Number Amount Number Amount
Equity shares of ` 1/- each fully paid up 650,000 6.50 700,000 7.00
77ANNUAL REPORT
2015/16SUVENLIFE SCIENCES LIMITED

3 SHARE CAPITAL: (contd.)
Terms and Conditions of Options Granted Each option entitles the holder thereof to apply for and be allotted one equity share of the Company of ` 1.00 each upon payment of the exercise price
during the exercise period. The exercise period commences from the date of vesting of the Options and expires at the end of three years from the date
of vesting in respect of Options granted under the Suven Employee Stock Option Scheme -2004
The vesting period for conversion of Options is as follows: On completion of 24 months from the date of grant of the Options: 25% vests
On completion of 36 months from the date of grant of the Options: 35% vests
On completion of 48 months from the date of grant of the Options: 40% vests
The Options have been granted at the ‘market price’ as defined from time to time under the Securities and Exchange Board of India (Employee Stock
Option Scheme and Employee Stock Purchase Scheme) Guidelines, 1999.
4 RESERVE AND SURPLUS
Particulars As at 31st March, 2016
As at
31st March, 2015
General Reserve
Balance as per the last financial statements 6,736.61 5,636.61
Add : Amount transferred from surplus balance in the Statement of Profit and Loss 1,100.00 1,100.00
Closing balance 7,836.61 6,736.61
Securities Premium Account
Balance as per the last financial statements 23,917.54 4,022.08
Add : Received on further issue of shares - 19,895.46
Closing balance 23,917.54 23,917.54
Surplus in the statement of profit and loss
Balance as per the last financial statements 24,004.42 15,617.65
Add: Profit for the year 9,496.98 10,875.03
Less: Adjustment of depreciation reserve as per Schedule II of Companies Act 2013 - 469.06
Less: Appropriations
Transfer to General Reserve 1,100.00 1,100.00
Interim Dividend 2,545.65 -
Proposed dividend - 763.70
Earlier year's dividend 0.00 0.02
Tax on Interim Dividend 518.32 -
Income tax on Proposed dividend
Current Year - 155.47
Earlier year's provision 0.00 0.01
Closing balance 29,337.43 24,004.42
TOTAL 61,091.58 54,658.58
NOTES TO THE FINANCIAL STATEMENTS(All amounts in lakhs in Indian Rupees, unless otherwise stated)
S T A N D A L O N E F I N A N C I A L S E C T I O N
78

5 LONG TERM BORROWINGS
Particulars Non-Current Current
As at 31st March, 2016
As at 31st March, 2015
As at 31st March, 2016
As at 31st March, 2015
Term Loans
Foreign currency loans from Banks (Secured)
Term Loan From State Bank of India (Vizag Plant) 3,303.77 4,101.26 584.60 202.87
Corporate Loan From Bank of India - - - 647.57
Corporate Loan From Bank of Bahrain & Kuwait 498.23 1,407.60 996.45 938.40
Total (A) 3,802.00 5,508.86 1,581.05 1,788.84
Indian currency loans from others (Unsecured)
Loan from Department of Science & Technology, Government of India
520.66 635.73 94.40 94.40
Total (B) 520.66 635.73 94.40 94.40
Total (A + B) 4,322.66 6,144.59 1,675.45 1,883.24
Nature of Security Terms of repayment
Term Loan From State Bank of India (Vizag Plant)Secured by first and pari-passu charge on Land, Buildings, Plant & Machinery and Second charge on stocks, receivables and other current assets
The term loan is repayable in 20 quarterly installments after roll over commencing from March'2016. Rate of Interest LIBOR + 4%
Corporate Loan From Bank of IndiaSecured by first and pari-passu charge on Land, Buildings, Plant & Machinery and Second charge on stocks, receivables and other current assets
The term loan is fully paid and closed by 31st March 2016.
Corporate Loan From Bank of Bahrain & KuwaitSecured by first and pari-passu charge on Land, Buildings, Plant & Machinery and Second charge on stocks, receivables and other current assets
The term loan is repayable in 16 quarterly installments of USD 0.375 Million. Commencing from December 2013. Rate of Interest LIBOR + 3.50%
Loan from Department of Science & Technology - I The loan is repayable in 10 Annual installments of `50 Lakhs each commencing from October 2013. Rate of Interest 3.00%
Loan from Department of Science & Technology - II The loan is repayable in 10 Annual installments of `44.40 Lakhs each commencing from February 2013. Rate of Interest 3.00%
6 PROVISIONS
Particulars Long-Term Short-Term
As at 31st March, 2016
As at 31st March, 2015
As at 31st March, 2016
As at 31st March, 2015
Provision for Employee BenefitsGratuity 79.47 64.43 195.25 213.73
Leave Encashment 160.02 163.05 79.25 148.52
239.49 227.48 274.50 362.25
Other provisionsTaxation - - - -
Dividend - - - 763.70
Corporate Dividend Tax - - - 155.47
- - - 919.17
239.49 227.48 274.50 1,281.42
NOTES TO THE FINANCIAL STATEMENTS(All amounts in lakhs in Indian Rupees, unless otherwise stated)
79ANNUAL REPORT
2015/16SUVENLIFE SCIENCES LIMITED

7 DEFERRED TAX LIABILITY
Particulars As at 31st March, 2016
As at
31st March, 2015
Deferred Tax Liability
Fixed assets: Impact of difference between tax depreciation and depreciation/ amortisation charged for the
financial reporting
3,882.62 2,545.58
3,882.62 2,545.58
Deferred Tax Asset
Unabsorbed Losses 136.13 136.13
QIP Expenditure 125.80
Provision for Gratuity & Leave Encashment 177.88 138.12
439.81 274.25
Net deferred tax liability/ asset 3,442.81 2,271.33
8 SHORT TERM BORROWINGS
Particulars As at 31st March, 2016
As at 31st March, 2015
Loans repayable on demand
From Banks (Secured)
Working Capital Loans from State Bank of India 1,825.71 2,327.20
Working Capital Loans from Bank of Bahrain & Kuwait 590.65 496.31
2,416.36 2,823.51
8.1 ` 2,416.36 lakhs (Previous year: ` 2,823.51 lakhs) are secured by pari-passu first charge on inventories, receivables and other current assets of the
Company and pari-passu second charge on movable and immovable fixed assets of the Company and equitable mortgage of the properties belonging
to the Company, both present and future.
9 TRADE PAYABLES
Particulars As at 31st March, 2016
As at 31st March, 2015
Trade payables (Refer note 32 for details of dues to micro and small enterprises) 3,533.11 4,389.08
3,533.11 4,389.08
10 OTHER CURRENT LIABILITES
Particulars As at 31st March, 2016
As at 31st March, 2015
Current maturities of long-term borrowings (Refer Note 5) 1,675.45 1,883.24
Interest accrued but not due 19.29 42.03
Unclaimed dividend 84.99 32.66
Other payables
Liabilities for Expenses 1,852.57 1,256.38
Liabilities for statutory dues 118.37 102.90
Liabilities for Capital Works 447.58 927.38
4,198.25 4,244.59
NOTES TO THE FINANCIAL STATEMENTS(All amounts in lakhs in Indian Rupees, unless otherwise stated)
S T A N D A L O N E F I N A N C I A L S E C T I O N
80

11
FIXE
D AS
SETS
Part
icul
ars
Land
-
Free
Hol
dBu
ildin
gs -
Of
fice
at
Fact
ory
Build
ings
-
Fact
ory
Road
s -
RCC
(Car
pete
d)
Plan
t &
Equi
pmen
tFu
rnitu
re &
Fi
xtur
esVe
hicl
esOf
fice
Equi
pmen
tsLa
bora
tory
Eq
uipm
ents
ETP
Wor
ksM
isc F
ixed
As
sets
EDP
Equi
pmen
tsTo
tal
R&D
Equi
pmen
tsTo
tal
Tang
ible
As
sets
Soft
war
eTo
tal
Inta
ngib
le
Asse
ts
Gran
d To
tal
Cost
or v
alua
tion
As a
t 31s
t Mar
ch, 2
014
523
.05
44.
78
4,3
17.5
5 -
13
,034
.05
445
.39
180
.59
103
.00
1,4
65.0
2 4
06.6
6 4
.62
498
.00
21,
022.
69
5,7
17.8
0 26
,740
.49
-
-
26,
740.
49
Addi
tions
13.
33
- 4
26.8
9 -
1,1
16.4
2 1
0.11
4
5.27
8
.07
107
.21
201
.22
- 3
4.12
1
,962
.65
297
.64
2,2
60.2
8 2
0.34
2
0.34
2
,280
.62
Disp
osal
s -
15.
58
- 1
9.99
-
- -
4.6
2 5
8.68
9
8.87
-
98.
87
- -
98.
87
Othe
r Adj
ustm
ents
- -
- -
-Exc
hang
e di
ffere
nces
- -
- -
129
.41
- -
- -
- -
- 1
29.4
1 -
129
.41
- -
129
.41
As a
t 31s
t Mar
ch, 2
015
536
.38
44.
78
4,7
44.4
4 -
14
,264
.30
455
.50
205
.86
111
.07
1,5
72.2
3 6
07.8
7 -
4
73.4
4 2
3,01
5.88
6
,015
.43
29,
031.
31
20.
34
20.
34
29,
051.
65
Addi
tions
532
.59
- 4
,626
.77
753
.44
7,8
69.6
9 1
70.4
2 -
97.
65
379
.22
42.
05
- 7
6.26
1
4,54
8.09
8
00.7
6 1
5,34
8.85
1
2.78
1
2.78
1
5,36
1.63
Disp
osal
s -
- -
397
.19
- -
- 2
9.89
-
- -
427
.08
20.
50
447
.58
- -
447
.58
Othe
r Adj
ustm
ents
- -
- -
- -
- -
- -
- -
- -
- -
- -
-Exc
hang
e di
ffere
nces
- -
- -
406
.24
- -
- -
- -
- 4
06.2
4 -
406
.24
- -
406
.24
As a
t 31s
t Mar
ch, 2
016
1,0
68.9
8 4
4.78
9
,371
.21
753
.44
22,1
43.0
4 6
25.9
2 2
05.8
6 2
08.7
2 1
,921
.56
649
.92
-
549
.70
37,
543.
13
6,7
95.6
9 4
4,33
8.82
3
3.12
3
3.12
4
4,37
1.94
Depr
ecia
tion
Upto
31s
t Mar
ch, 2
014
-
12.
83
828
.11
-
4,6
23.1
2 2
21.0
2 9
2.69
5
2.26
3
19.5
4 1
21.4
3 4
.48
476
.99
6,7
52.4
7 2
,064
.63
8,8
17.1
0 -
-
8
,817
.10
Char
ge fo
r the
yea
r -
0.7
5 1
39.8
5 -
623
.50
48.
48
23.
96
5.5
7 2
00.1
5 3
5.43
-
99.
13
1,1
76.8
4 1
,243
.63
2,4
20.4
7 0
.73
0.7
3 2
,421
.20
Disp
osal
s -
- -
- 1
5.58
-
19.
99
- -
- 4
.62
58.
68
98.
87
- 9
8.87
-
- 9
8.87
Othe
r Adj
ustm
ents
-
-Adj
ustm
ent a
s per
Sc
hedu
le II
-
- -
- -2
0.17
1
4.02
-0
.14
45.
15
29.
19
17.
47
0.1
4 -7
0.46
1
5.21
7
02.1
0 7
17.3
1 -
- 7
17.3
1
Upto
31s
t Mar
ch, 2
015
-
13.
59
967
.96
-
5,2
10.8
7 2
83.5
2 9
6.53
1
02.9
8 5
48.8
8 1
74.3
4 -
4
46.9
7 7
,845
.65
4,0
10.3
6 1
1,85
6.00
0
.73
0.7
3 1
1,85
6.74
Char
ge fo
r the
yea
r -
0.7
5 2
62.6
9 5
6.77
9
58.0
9 5
8.67
1
8.59
1
8.43
1
95.6
0 6
3.82
-
35.
95
1,6
69.3
6 7
23.2
5 2
,392
.61
2.6
8 2
.68
2,3
95.2
9
Disp
osal
s -
- -
- 3
65.6
4 -
- -
29.
66
- -
- 3
95.3
0 2
0.13
4
15.4
3 -
- 4
15.4
3
Othe
r Adj
ustm
ents
-Adj
ustm
ent a
s per
Sc
hedu
le II
-
- -
- -
- -
- -
- -
- -
- -
- -
Upto
31s
t Mar
ch, 2
016
-
14.
34
1,2
30.6
5 5
6.77
5
,803
.31
342
.18
115
.12
121
.41
714
.82
238
.17
-
482
.92
9,1
19.7
0 4
,713
.48
13,
833.
18
3.4
1 3
.41
13,
836.
59
Net B
lock
As a
t 31s
t Mar
ch, 2
015
536
.38
31.
20
3,7
76.4
8 -
9
,053
.43
171
.99
109
.33
8.0
9 1
,023
.35
433
.53
-
26.
47
15,1
70.2
3 2
,005
.08
17,
175.
31
19.
61
19.
61
17,
194.
92
As a
t 31s
t Mar
ch, 2
016
1,0
68.9
8 3
0.44
8
,140
.56
696
.68
16,3
39.7
3 2
83.7
4 9
0.74
8
7.31
1
,206
.73
411
.75
-
66.
78
28,4
23.4
3 2
,082
.21
30,
505.
64
29.
71
29.
71
30,
535.
35
Not
e 1:
Dep
reci
atio
n on
R &
D E
quip
men
t of `
723
.25
Lakh
s ha
s be
en a
dded
to R
& D
Exp
ense
s (P
revi
ous
Year
: `12
43.6
3 La
khs)
Not
e 2:
Pur
suan
t to
the
enac
tmen
t of C
ompa
nies
Act
201
3, th
e Co
mpa
ny h
as a
pplie
d th
e es
timat
ed u
sefu
l liv
es a
s spe
cifie
d in
Sch
edul
e II,
exc
ept i
n re
spec
t of c
erta
in a
sset
s as d
iscl
osed
in A
ccou
ntin
g
Polic
y on
Dep
reci
atio
n, A
mor
tisat
ion
and
Depl
etio
n. A
ccor
ding
ly t
he u
nam
ortis
ed c
arry
ing
valu
e is
bei
ng d
epre
ciat
ed /
amor
tised
ove
r th
e re
vise
d/ r
emai
ning
use
ful l
ives
. The
writ
ten
dow
n
valu
e of
Fix
ed A
sset
s w
hose
live
s ha
ve e
xpire
d as
at 1
st A
pril
2014
hav
e be
en a
djus
ted
net o
f tax
, in
the
open
ing
bala
nce
of P
rofit
and
Los
s Ac
coun
t am
ount
ing
to `
469
.06
Lakh
s
NO
TES
TO T
HE
FIN
ANCI
AL S
TATE
MEN
TS(A
ll am
ount
s in
lakh
s in
Indi
an R
upee
s, un
less
oth
erw
ise
stat
ed)
81ANNUAL REPORT
2015/16SUVENLIFE SCIENCES LIMITED
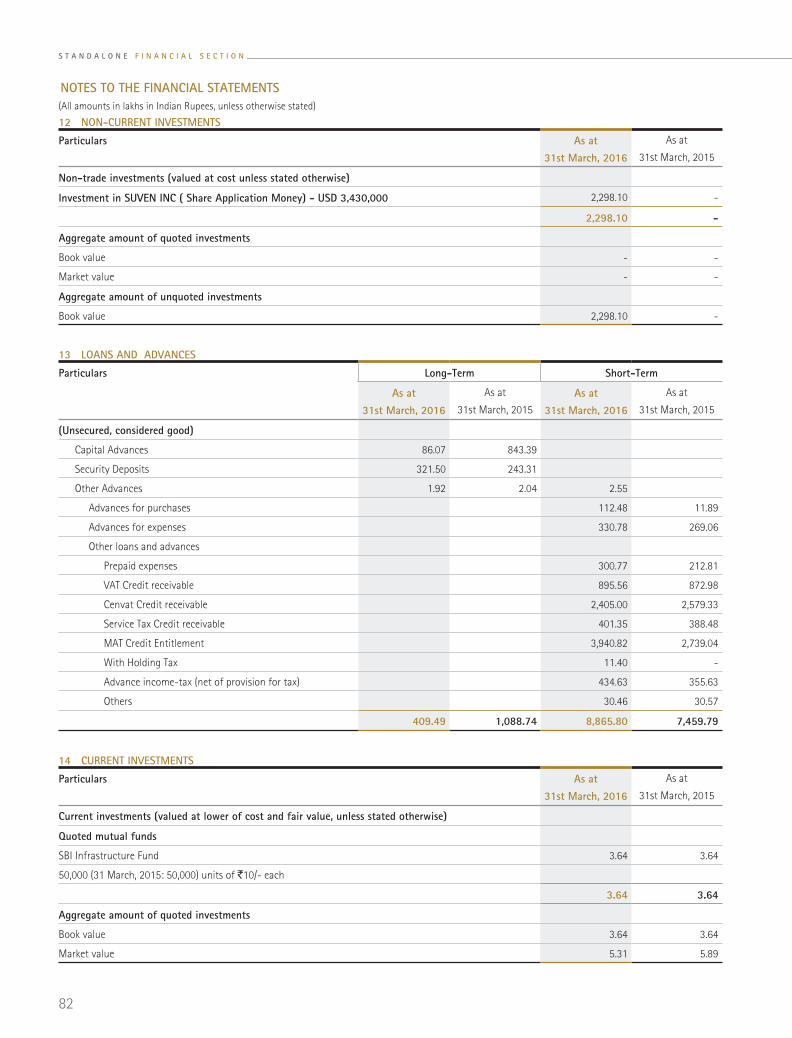
12 NON-CURRENT INVESTMENTS
Particulars As at 31st March, 2016
As at
31st March, 2015
Non-trade investments (valued at cost unless stated otherwise)
Investment in SUVEN INC ( Share Application Money) - USD 3,430,000 2,298.10 -
2,298.10 -
Aggregate amount of quoted investments
Book value - -
Market value - -
Aggregate amount of unquoted investments
Book value 2,298.10 -
13 LOANS AND ADVANCES
Particulars Long-Term Short-Term
As at 31st March, 2016
As at
31st March, 2015
As at 31st March, 2016
As at
31st March, 2015
(Unsecured, considered good)
Capital Advances 86.07 843.39
Security Deposits 321.50 243.31
Other Advances 1.92 2.04 2.55
Advances for purchases 112.48 11.89
Advances for expenses 330.78 269.06
Other loans and advances
Prepaid expenses 300.77 212.81
VAT Credit receivable 895.56 872.98
Cenvat Credit receivable 2,405.00 2,579.33
Service Tax Credit receivable 401.35 388.48
MAT Credit Entitlement 3,940.82 2,739.04
With Holding Tax 11.40 -
Advance income-tax (net of provision for tax) 434.63 355.63
Others 30.46 30.57
409.49 1,088.74 8,865.80 7,459.79
14 CURRENT INVESTMENTS
Particulars As at 31st March, 2016
As at
31st March, 2015
Current investments (valued at lower of cost and fair value, unless stated otherwise)
Quoted mutual funds
SBI Infrastructure Fund 3.64 3.64
50,000 (31 March, 2015: 50,000) units of `10/- each
3.64 3.64
Aggregate amount of quoted investments
Book value 3.64 3.64
Market value 5.31 5.89
NOTES TO THE FINANCIAL STATEMENTS(All amounts in lakhs in Indian Rupees, unless otherwise stated)
S T A N D A L O N E F I N A N C I A L S E C T I O N
82
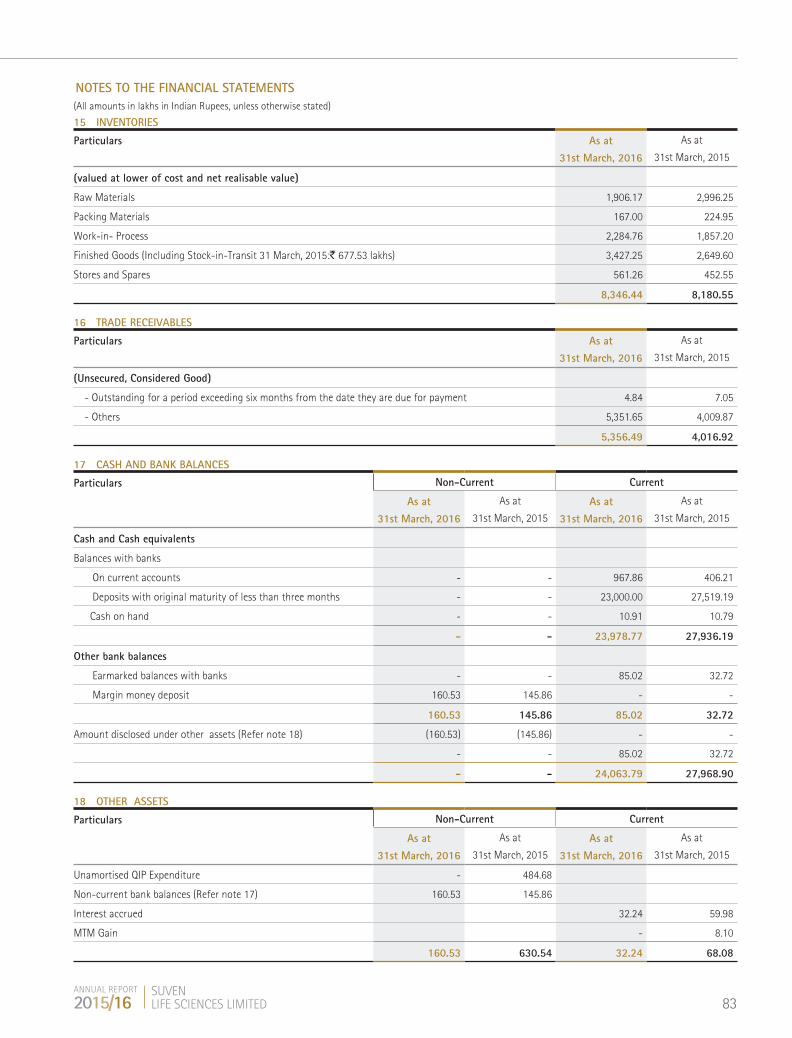
15 INVENTORIES
Particulars As at 31st March, 2016
As at
31st March, 2015
(valued at lower of cost and net realisable value)
Raw Materials 1,906.17 2,996.25
Packing Materials 167.00 224.95
Work-in- Process 2,284.76 1,857.20
Finished Goods (Including Stock-in-Transit 31 March, 2015:` 677.53 lakhs) 3,427.25 2,649.60
Stores and Spares 561.26 452.55
8,346.44 8,180.55
16 TRADE RECEIVABLES
Particulars As at 31st March, 2016
As at
31st March, 2015
(Unsecured, Considered Good)
- Outstanding for a period exceeding six months from the date they are due for payment 4.84 7.05
- Others 5,351.65 4,009.87
5,356.49 4,016.92
17 CASH AND BANK BALANCES
Particulars Non-Current Current
As at 31st March, 2016
As at
31st March, 2015
As at 31st March, 2016
As at
31st March, 2015
Cash and Cash equivalents
Balances with banks
On current accounts - - 967.86 406.21
Deposits with original maturity of less than three months - - 23,000.00 27,519.19
Cash on hand - - 10.91 10.79
- - 23,978.77 27,936.19
Other bank balances
Earmarked balances with banks - - 85.02 32.72
Margin money deposit 160.53 145.86 - -
160.53 145.86 85.02 32.72
Amount disclosed under other assets (Refer note 18) (160.53) (145.86) - -
- - 85.02 32.72
- - 24,063.79 27,968.90
18 OTHER ASSETS
Particulars Non-Current Current
As at 31st March, 2016
As at
31st March, 2015
As at 31st March, 2016
As at
31st March, 2015
Unamortised QIP Expenditure - 484.68
Non-current bank balances (Refer note 17) 160.53 145.86
Interest accrued 32.24 59.98
MTM Gain - 8.10
160.53 630.54 32.24 68.08
NOTES TO THE FINANCIAL STATEMENTS(All amounts in lakhs in Indian Rupees, unless otherwise stated)
83ANNUAL REPORT
2015/16SUVENLIFE SCIENCES LIMITED
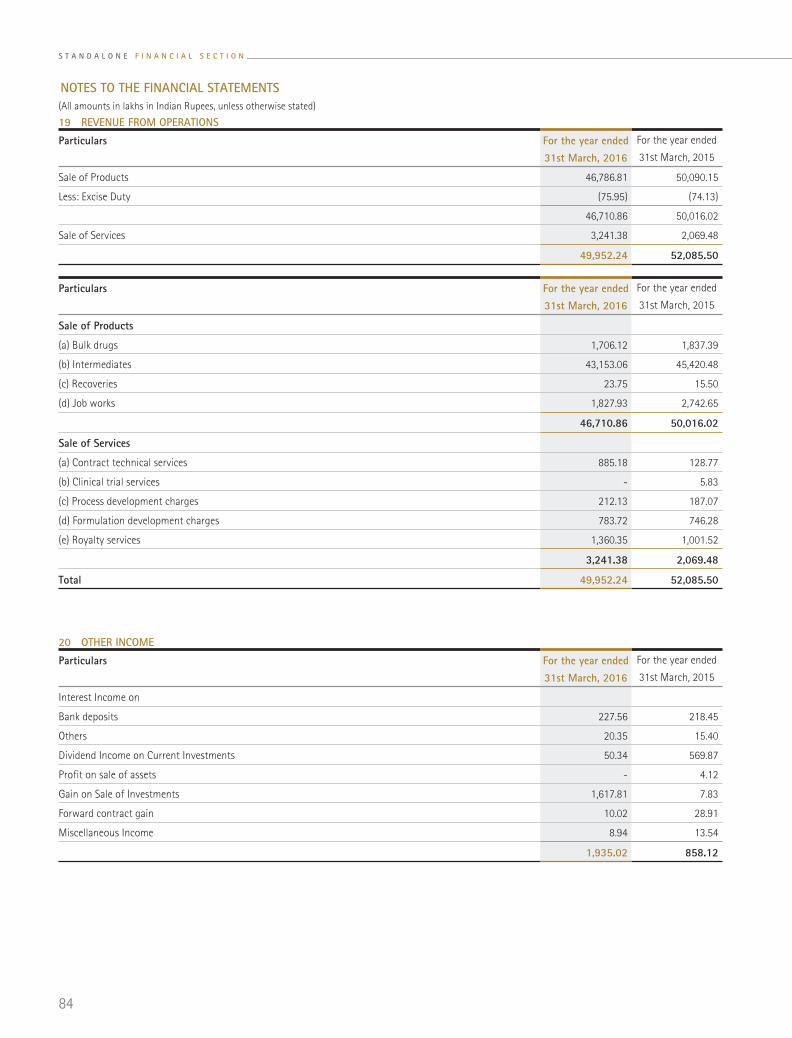
19 REVENUE FROM OPERATIONS
Particulars For the year ended 31st March, 2016
For the year ended
31st March, 2015
Sale of Products 46,786.81 50,090.15
Less: Excise Duty (75.95) (74.13)
46,710.86 50,016.02
Sale of Services 3,241.38 2,069.48
49,952.24 52,085.50
Particulars For the year ended 31st March, 2016
For the year ended
31st March, 2015
Sale of Products
(a) Bulk drugs 1,706.12 1,837.39
(b) Intermediates 43,153.06 45,420.48
(c) Recoveries 23.75 15.50
(d) Job works 1,827.93 2,742.65
46,710.86 50,016.02
Sale of Services
(a) Contract technical services 885.18 128.77
(b) Clinical trial services - 5.83
(c) Process development charges 212.13 187.07
(d) Formulation development charges 783.72 746.28
(e) Royalty services 1,360.35 1,001.52
3,241.38 2,069.48
Total 49,952.24 52,085.50
20 OTHER INCOME
Particulars For the year ended 31st March, 2016
For the year ended
31st March, 2015
Interest Income on
Bank deposits 227.56 218.45
Others 20.35 15.40
Dividend Income on Current Investments 50.34 569.87
Profit on sale of assets - 4.12
Gain on Sale of Investments 1,617.81 7.83
Forward contract gain 10.02 28.91
Miscellaneous Income 8.94 13.54
1,935.02 858.12
NOTES TO THE FINANCIAL STATEMENTS(All amounts in lakhs in Indian Rupees, unless otherwise stated)
S T A N D A L O N E F I N A N C I A L S E C T I O N
84

22 (INCREASE)/ DECREASE IN INVENTORIES OF WORK-IN-PROGRESS AND FINISHED GOODS
Particulars For the year ended 31st March, 2016
For the year ended
31st March, 2015
Inventories at the end of the year
Work-in-progress 2,284.76 1,857.20
Finished Goods 3,427.25 2,649.60
5,712.01 4,506.80
Inventories at the beginning of the year
Work-in-progress 1,857.20 2,230.61
Finished Goods 2,649.60 2,624.14
4,506.80 4,854.75
(Increase)/ decrease in inventories (1,205.21) 347.95
21 COST OF MATERIALS CONSUMED
Particulars For the year ended 31st March, 2016
For the year ended
31st March, 2015
Raw Materials
Opening Stock 2,996.25 2,447.42
Purchases 16,378.91 17,961.82
Less: Closing Stock 1,906.17 2,996.25
17,468.99 17,412.99
Packing Materials
Opening Stock 224.95 37.71
Purchases 318.43 499.03
Less: Closing Stock 167.00 224.95
376.38 311.79
Total 17,845.37 17,724.78
Details of Raw Materials consumed:
Particulars For the year ended 31st March, 2016 For the year ended 31st March, 2015
Quantity (KGs) Amount Quantity (KGs) Amount
(a) 3- Isochromanone 820,674 8,315.02 775,437 8,069.16
(b) Methanol 3,361,758 951.46 2,929,178 874.73
(c) Caustic Soda Lye 5,536,477 820.26 4,957,678 706.53
(d) Others - 7,382.25 - 7,762.57
Total 17,468.99 17,412.99
Details of inventories
Particulars For the year ended 31st March, 2016 For the year ended 31st March, 2015
Quantity (KGs) Amount Quantity (KGs) Amount
(a) 3- Isochromanone 30,164 189.41 114,505 1,106.81
(b) 2-Amino-5-Chloro-2-Fluorobenzophenone 3,100 102.70 2,250 65.45
(c) Chloro Acetaldehyde Dimethyl Acetal 11,714 76.84 7,366 53.78
(d) Others - 1,537.22 - 1,770.21
Total 1,906.17 2,996.25
NOTES TO THE FINANCIAL STATEMENTS(All amounts in lakhs in Indian Rupees, unless otherwise stated)
85ANNUAL REPORT
2015/16SUVENLIFE SCIENCES LIMITED
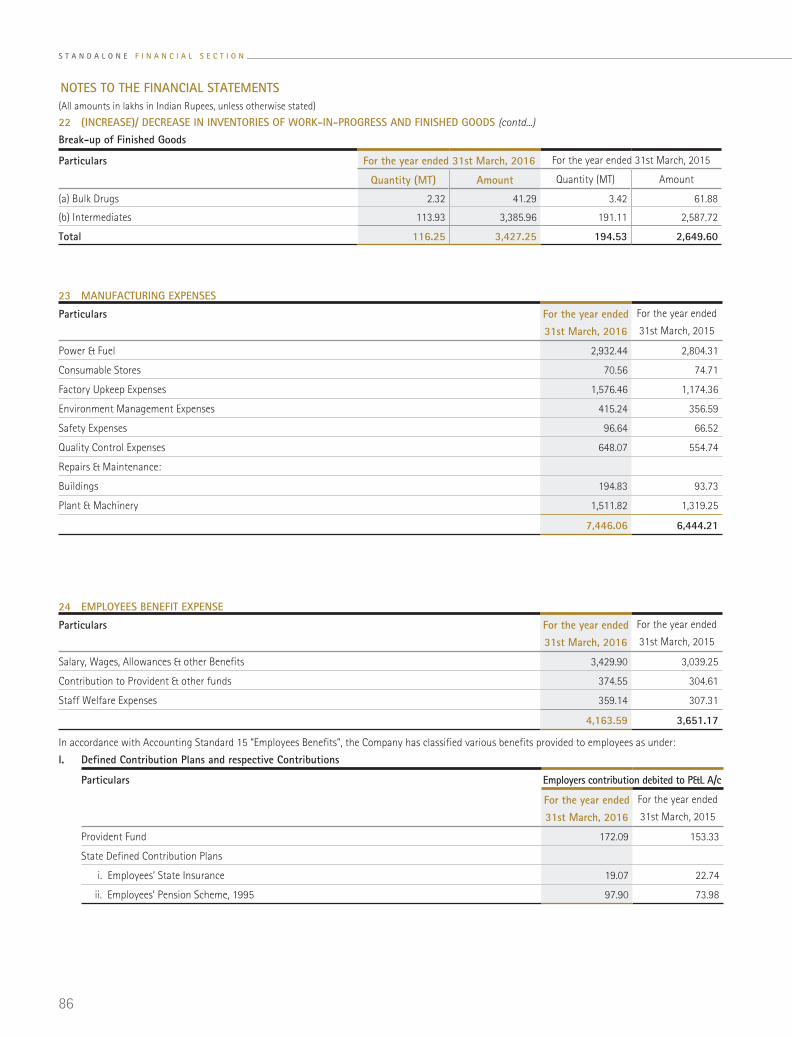
Break-up of Finished Goods
Particulars For the year ended 31st March, 2016 For the year ended 31st March, 2015
Quantity (MT) Amount Quantity (MT) Amount
(a) Bulk Drugs 2.32 41.29 3.42 61.88
(b) Intermediates 113.93 3,385.96 191.11 2,587.72
Total 116.25 3,427.25 194.53 2,649.60
22 (INCREASE)/ DECREASE IN INVENTORIES OF WORK-IN-PROGRESS AND FINISHED GOODS (contd...)
23 MANUFACTURING EXPENSES
Particulars For the year ended 31st March, 2016
For the year ended
31st March, 2015
Power & Fuel 2,932.44 2,804.31
Consumable Stores 70.56 74.71
Factory Upkeep Expenses 1,576.46 1,174.36
Environment Management Expenses 415.24 356.59
Safety Expenses 96.64 66.52
Quality Control Expenses 648.07 554.74
Repairs & Maintenance:
Buildings 194.83 93.73
Plant & Machinery 1,511.82 1,319.25
7,446.06 6,444.21
24 EMPLOYEES BENEFIT EXPENSE
Particulars For the year ended 31st March, 2016
For the year ended
31st March, 2015
Salary, Wages, Allowances & other Benefits 3,429.90 3,039.25
Contribution to Provident & other funds 374.55 304.61
Staff Welfare Expenses 359.14 307.31
4,163.59 3,651.17
Particulars Employers contribution debited to P&L A/c
For the year ended 31st March, 2016
For the year ended
31st March, 2015
Provident Fund 172.09 153.33
State Defined Contribution Plans
i. Employees’ State Insurance 19.07 22.74
ii. Employees’ Pension Scheme, 1995 97.90 73.98
In accordance with Accounting Standard 15 “Employees Benefits”, the Company has classified various benefits provided to employees as under:
I. Defined Contribution Plans and respective Contributions
NOTES TO THE FINANCIAL STATEMENTS(All amounts in lakhs in Indian Rupees, unless otherwise stated)
S T A N D A L O N E F I N A N C I A L S E C T I O N
86

Post-employment benefit plans a) Gratuity
Under the gratuity plan, every employee who has completed atleast five years of service gets a gratuity on departure @ 15 days of last drawn salary
for each completed year of service. The scheme is funded with an insurance company in the form of qualifying insurance policy.
The following tables summarise the components of net benefit expense recognised in the statement of profit and loss and the funded status and
amounts recognised in the balance sheet for the respective plan.
24 EMPLOYEES BENEFIT EXPENSE (contd...)
Statement of Profit & LossNet employee benefit expense recognised in the employee cost
Particulars For the year ended 31st March, 2016
For the year ended
31st March, 2015
Current service cost 34.37 28.01
Interest cost on benefit obligation 47.30 43.71
Expected return on plan assets (29.06) (23.34)
Net actuarial( gain) / loss recognised in the year 31.45 6.18
Net benefit expense 84.06 54.56
Changes in the present value of the defined benefit obligation are as follows:
Particulars For the year ended 31st March, 2016
For the year ended
31st March, 2015
Opening defined benefit obligation 591.21 546.34
Current service cost 34.37 28.01
Interest cost 47.30 43.71
Benefits paid (29.71) (33.03)
Actuarial (gains) / losses on obligation 30.18 6.18
Closing defined benefit obligation 673.35 591.21
Changes in the fair value of plan assets are as follows:
Particulars For the year ended 31st March, 2016
For the year ended
31st March, 2015
Opening fair value of plan assets 313.04 259.34
Expected return 29.06 23.34
Actuarial gains / (losses) - -
Contributions by employer 57.79 30.83
Benefits paid (1.27) (0.47)
Closing fair value of plan assets 398.62 313.04
Balance SheetBenefit (asset)/ liability
Particulars For the year ended 31st March, 2016
For the year ended
31st March, 2015
Present value of obligation at the end of the year 278.17 287.00
Fair value of plan assets at the end of the year (3.44) (8.83)
Net (asset) / liability recognised in the Balance Sheet 274.72 278.17
NOTES TO THE FINANCIAL STATEMENTS(All amounts in lakhs in Indian Rupees, unless otherwise stated)
87ANNUAL REPORT
2015/16SUVENLIFE SCIENCES LIMITED
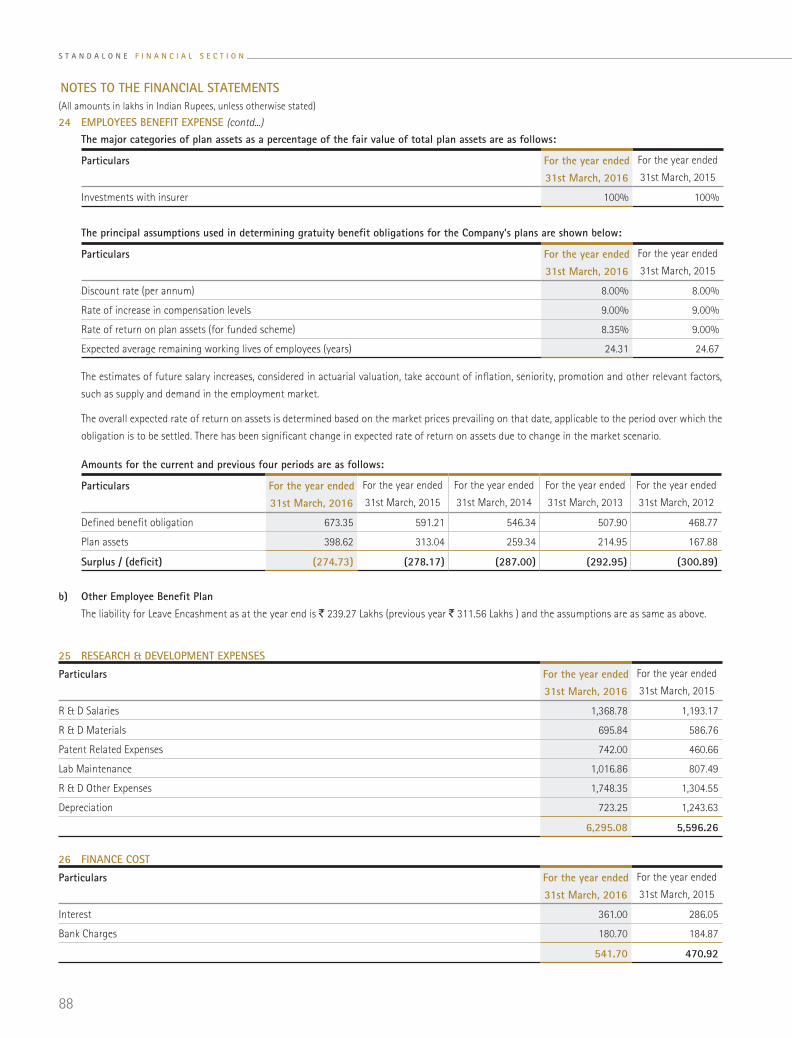
24 EMPLOYEES BENEFIT EXPENSE (contd...)
The major categories of plan assets as a percentage of the fair value of total plan assets are as follows:
Particulars For the year ended 31st March, 2016
For the year ended
31st March, 2015
Investments with insurer 100% 100%
The principal assumptions used in determining gratuity benefit obligations for the Company’s plans are shown below:
Particulars For the year ended 31st March, 2016
For the year ended
31st March, 2015
Discount rate (per annum) 8.00% 8.00%
Rate of increase in compensation levels 9.00% 9.00%
Rate of return on plan assets (for funded scheme) 8.35% 9.00%
Expected average remaining working lives of employees (years) 24.31 24.67
Amounts for the current and previous four periods are as follows:
Particulars For the year ended 31st March, 2016
For the year ended
31st March, 2015
For the year ended
31st March, 2014
For the year ended
31st March, 2013
For the year ended
31st March, 2012
Defined benefit obligation 673.35 591.21 546.34 507.90 468.77
Plan assets 398.62 313.04 259.34 214.95 167.88
Surplus / (deficit) (274.73) (278.17) (287.00) (292.95) (300.89)
The estimates of future salary increases, considered in actuarial valuation, take account of inflation, seniority, promotion and other relevant factors,
such as supply and demand in the employment market.
The overall expected rate of return on assets is determined based on the market prices prevailing on that date, applicable to the period over which the
obligation is to be settled. There has been significant change in expected rate of return on assets due to change in the market scenario.
b) Other Employee Benefit Plan The liability for Leave Encashment as at the year end is ` 239.27 Lakhs (previous year ` 311.56 Lakhs ) and the assumptions are as same as above.
25 RESEARCH & DEVELOPMENT EXPENSES
Particulars For the year ended 31st March, 2016
For the year ended
31st March, 2015
R & D Salaries 1,368.78 1,193.17
R & D Materials 695.84 586.76
Patent Related Expenses 742.00 460.66
Lab Maintenance 1,016.86 807.49
R & D Other Expenses 1,748.35 1,304.55
Depreciation 723.25 1,243.63
6,295.08 5,596.26
26 FINANCE COST
Particulars For the year ended 31st March, 2016
For the year ended
31st March, 2015
Interest 361.00 286.05
Bank Charges 180.70 184.87
541.70 470.92
NOTES TO THE FINANCIAL STATEMENTS(All amounts in lakhs in Indian Rupees, unless otherwise stated)
S T A N D A L O N E F I N A N C I A L S E C T I O N
88

27 OTHER EXPENSES
Particulars For the year ended 31st March, 2016
For the year ended
31st March, 2015
Administrative & Other Expenses
Rent 73.62 79.60
Rates & Taxes 24.96 10.06
Service Tax 24.67 10.88
Insurance 180.26 163.53
Communication Charges 100.33 76.25
Travelling & Conveyance 513.69 351.91
Printing & Stationery 108.99 89.79
Vehicle Maintenance 23.57 39.13
Professional Charges 287.50 356.07
Payments to Auditors :
As Auditors 12.00 10.00
As Tax Audit Fee 2.50 2.50
For Other Services 1.00 1.00
For Reimburesement of expenses 0.25 0.12
Security Charges 165.77 133.50
Donations 2.32 2.70
Repairs & Maintenance 46.73 49.97
Loss on Foreign Exchange Fluctuations 12.60 26.75
Bad Debts Written off 8.25 -
Loss due to discarded asset 32.15 -
Corporate Social Responsbility 133.01 126.24
QIP Expenses to the extent written off 484.68 121.17
General Expenses 170.22 202.58
2,409.07 1,853.75
Selling Expenses
Sales Promotion 241.06 164.85
Clearing & Forwarding 276.46 243.79
Commission on Sales 155.31 108.77
672.83 517.41
Clinical project expenses - 4.13
- 4.13
Total 3,081.90 2,375.29
28 EARNINGS PER SHARE
Particulars For the year ended 31st March, 2016
For the year ended
31st March, 2015
Net Profit after tax available for Equity shareholders 9,496.98 10,875.03
Weighted average of number of Equity shares outstanding during the year(Nos In Lakhs) 1,272.83 1,202.37
Basic Earnings per Equity share (`1/- Face Value) 7.46 9.04
NOTES TO THE FINANCIAL STATEMENTS(All amounts in lakhs in Indian Rupees, unless otherwise stated)
89ANNUAL REPORT
2015/16SUVENLIFE SCIENCES LIMITED

29 CONTINGENT LIABILITIES
Particulars For the year ended 31st March, 2016
For the year ended
31st March, 2015
Income tax appeal for Asst.year 2011-12 7.64 7.64
Income tax appeal for Asst.year 2012-13 20.94 20.94
Letter of Credit for Imports 649.69 1,207.21
34 EMPLOYEE STOCK OPTION SCHEME
Particulars For the year ended 31st March, 2016
For the year ended
31st March, 2015
Options outstanding at the beginning of the year 700,000 700,000
Add : Granted during the year - -
700,000 700,000
Less: Lapsed during the year 50,000 -
Converted into equity shares - -
650,000 700,000
30 COMMITMENTS
Particulars For the year ended 31st March, 2016
For the year ended
31st March, 2015
Estimated amount of contracts remaining to be executed on capital account 125.97 609.07
Forward Foreign Exchange Contracts - 1,133.47
31 During the year Unclaimed Dividend pertaining to 2007-08 amounting to ` 3.01 Lakhs has been transferred to Investor Education and Protection Fund.
There are no amounts due and outstanding to be credited to the Investor Education and Protection Fund as of 31st March, 2016 (Previous year:Nil)
32 Based on information available with the Company, no creditors have been identified as Micro and Small enterprises with in the meaning of "Micro,
Small and Medium enterprises development (MSMED) Act, 2006".
35 Excise Duty amounting to ` 9.54 Lakhs on Closing Stock of finished goods has been provided during the year to comply with ' Guidance Note on
Accounting treatment for Excise duty' issued by Institute of Chartered Accountants of India.
33 MANAGERIAL REMUNERATION
Particulars Chariman & CEO Whole-time Director
For the year ended 31st March, 2016
For the year ended
31st March, 2015
For the year ended 31st March, 2016
For the year ended
31st March, 2015
Salary & Allowances 191.25 145.00 95.62 69.00
Commission 127.10 157.51 63.55 78.75
Contribution to Provident Fund 22.95 17.40 11.48 8.28
Perquisites 12.50 - 6.25 -
Total 353.80 319.91 176.90 156.03
NOTES TO THE FINANCIAL STATEMENTS(All amounts in lakhs in Indian Rupees, unless otherwise stated)
S T A N D A L O N E F I N A N C I A L S E C T I O N
90

Particulars For the year ended 31st March, 2016
For the year ended
31st March, 2015
Amount raised through QIP - 20,000.00
Less : QIP expenses - 605.85
- 19,394.15
36 UTILISATION OF FUND RAISED THROUGH QIPDuring the year ended 31st March, 2015 the Company has raised ` 20,000 lakhs primarily for clinical development expenses, capital expenditure and
general corporate purposes and any other purposes as may be permissible under applicable law.
38 SEGMENT REPORTING(A) Primary Segment: Business Segment Segments have been identified and reported taking into account the nature of products, the differing risk and returns,the organisation structure,and
the internal financial reporting scheme. The Company has identified the following segments as its reportable segments:
(a) Manufacturing (CRAMS)
(b) Services (DDDSS)
(c) Research and Development
I. Manufacturing (CRAMS) - Bulk Drugs & Intermediates under contract services products are developed and produced on an exclusive basis
under contract Manufacturing services
II. Services (DDDSS) - Which consists of Collaborative Research Projects (CRP), Clinical Trials and Testing and Analysis services
(B) Secondary Segment: Geographical Segment The Company has identified the following geographical reportable segments:
(a) India-The Company sells Bulk Drugs and Intermedites and Fine Chemicals.
(b) USA -The Company sells Intermediates
(c) Europe-The Company sells Bulk Drugs and Intermedites
(d) Others -The Company sells Bulk Drugs and Intermedites
Particulars For the year ended 31st March, 2016
For the year ended
31st March, 2015
Investment in wholly owned subsidiary - Suven Inc., 2,298.10 -
Investment in Plant & Machinery -Vizag 3,145.72 -
5,443.82 -
Utilisation of QIP Funds:
37 CORPORATE SOCIAL RESPONSIBILITY EXPENDITURE(a) Gross amount required to be spent by the Company during the year : ` 266.78 Lakhs
(b) Amount spent on during the year on:
Particulars Construction/ acquisition of any asset On other purposes
For the year ended 31st March, 2016
For the year ended
31st March, 2015
For the year ended 31st March, 2016
For the year ended
31st March, 2015
Total amount spent for the financial year - - 181.58 126.24
Amount unspent - - 85.20 42.27
Total - - 266.78 168.51
NOTES TO THE FINANCIAL STATEMENTS(All amounts in lakhs in Indian Rupees, unless otherwise stated)
91ANNUAL REPORT
2015/16SUVENLIFE SCIENCES LIMITED

38 SEGMENT REPORTING (contd...)
(B) Secondary Segment
Particulars Manufacturing (CRAMS)
Services (DDSS) Research & Development
Unallocated Total
2015-16 2014-15 2015-16 2014-15 2015-16 2014-15 2015-16 2014-15 2015-16 2014-15
Segment Revenue
External Sales 46,710.86 50,016.03 3,241.37 2,069.48 - - - - 49,952.24 52,085.50
46,710.86 50,016.03 3,241.37 2,069.48 - - - - 49,952.24 52,085.50
Segment Result
Operating Profit 17,327.83 21,125.82 1,946.77 1,113.29 -6,295.08 -5,596.26 -819.70 -1,435.18 12,159.82 15,207.67
Interest Expense - - - - - - 361.00 286.05 361.00 286.05
Interest Income - - - - - - 247.91 233.85 247.91 233.85
Income Taxes - - - - - - 2,549.75 4,280.44 2,549.75 4,280.44
Net Profit 17,327.83 21,125.82 1,946.77 1,113.29 -6,295.08 -5,596.26 -3,482.54 -5,767.82 9,496.98 10,875.03
Other Information
Segment Assets 42,984.65 38,065.82 3,882.05 3,937.04 2,618.02 2,459.57 31,306.86 32,850.98 80,791.59 77,313.41
Segment Liabilities 7,756.84 9,813.34 341.76 324.79 1,661.84 1,900.92 661.78 699.55 10,422.22 12,738.60
Capital Expenditure 14,967.11 2,112.40 - - 800.76 297.64 - - 15,767.87 2,410.03
Depreciation 1,536.96 998.94 67.54 89.31 723.25 1,243.63 67.54 89.31 2,395.29 2,421.20
(C) Geographical Information:
Particulars Revenue Location of Assets Additions to Fixed Assets
For the year ended 31st March, 2016
For the year ended
31st March, 2015
For the year ended 31st March, 2016
For the year ended
31st March, 2015
For the year ended 31st March, 2016
For the year ended
31st March, 2015
INDIA 3,163.91 4,095.40 44,311.50 28,992.68 15,766.40 2,410.03
U S A 9,129.30 9,150.83 60.44 58.97 1.47 -
EUROPE 34,470.85 35,577.22 - - - -
OTHERS 3,264.13 3,262.05 - - - -
50,028.19 52,085.50 44,371.94 29,051.65 15,767.87 2,410.03
39 RELATED PARTY DISCLOSURESList of and relationship with related parties with whom transactions have taken place during the year :
Holding Company M/s. Jasti Property and Equity Holdings Private Limited
Wholly owned subsidiary M/s. Suven Inc.
Key Managerial Personnel Mr. Venkateswarlu Jasti ( Chairman & CEO)
Mrs. Sudha Rani Jasti ( Whole-time Director)
Mr. P. Subba Rao (Chief Financial Officer)
Mr. Hanumatha Rao (Company Secretary)
Relative of Key Managerial Personnel Ms. Kalyani Jasti ( Daughter of Mr.Venkateswarlu Jasti)
Ms. Sirisha Jasti (Daughter of Mr. Venkateswarlu Jasti)
Jointly controlled entity Suven Trust
NOTES TO THE FINANCIAL STATEMENTS(All amounts in lakhs in Indian Rupees, unless otherwise stated)
S T A N D A L O N E F I N A N C I A L S E C T I O N
92

39 RELATED PARTY DISCLOSURES (contd...)
Particulars Key Managerial Personnel
Relative of Key Managerial Personnel
Jointly controlled entity
Wholly owned Subsidiary
Total
2015-16 2014-15 2015-16 2014-15 2015-16 2014-15 2015-16 2014-15 2015-16 2014-15
Remuneration/ Salary 571.17 505.86 168.92 114.10 - - 740.09 619.96
Corporate Social
Responsibility
- - - 133.01 126.24 133.01 126.24
Investment 2,298.10 - 2,298.10 -
Balance outstanding
Remuneration/ Salary 190.65 237.95 - 0.89 - - 2,298.10 2,488.75 238.84
40 VALUE OF IMPORTS ON C I F BASIS
Particulars For the year ended 31st March, 2016
For the year ended
31st March, 2015
Raw Materials 5,053.75 5,030.38
Packing Materials 12.01 241.19
Components and Spare Parts 805.95 332.84
Capital Equipment 236.53 420.25
6,108.24 6,024.66
41 EXPENDITURE IN FOREIGN CURRENCY
Particulars For the year ended 31st March, 2016
For the year ended
31st March, 2015
Travel 155.49 73.99
Dividend 70.19 105.20
Sales Commission 147.21 103.85
Foreign Branch Expenses 599.56 488.87
Research & Development Expenses 2,270.33 1,652.91
3,242.78 2,424.82
42 VALUE OF IMPORTED AND INDIGENEOUS RAW MATERIALS, STORES AND SPARES CONSUMED AND PERCENTAGE OF EACH TO TOTAL CONSUMPTION
Particulars For the year ended 31st March, 2016 For the year ended 31st March, 2015
Value % to Total Value % to Total
Raw Materials
Imported 3,564.71 20.41% 2,003.52 11.51%
Indigenous 13,904.28 79.59% 15,409.47 88.49%
Total 17,468.99 100.00% 17,412.99 100.00%
Packing Materials
Imported 71.29 18.94% 164.85 52.87%
Indigenous 305.09 81.06% 146.94 47.13%
Total 376.38 100.00% 311.79 100.00%
Stores and Spares
Imported 805.94 46.90% 332.84 27.59%
Indigenous 912.58 53.10% 873.67 72.41%
Total 1,718.52 100.00% 1,206.51 100.00%
NOTES TO THE FINANCIAL STATEMENTS(All amounts in lakhs in Indian Rupees, unless otherwise stated)
93ANNUAL REPORT
2015/16SUVENLIFE SCIENCES LIMITED

43 DIVIDEND REMITTANCES IN FOREIGN CURRENCY
Year of remittance On account of Financial Year
Number of non-resident shareholders
No. of shares held Amount of dividend
2015/2016 2014/2015 5 3,509,388 70.19
2014/2015 2013/2014 7 4,207,900 105.20
44 EARNINGS IN FOREIGN CURRENCY
Particulars For the year ended 31st March, 2016
For the year ended
31st March, 2015
FOB Value of Exports 43,704.54 45,898.47
Royalty and Other Services 2,960.15 1,895.11
46,664.69 47,793.58
45 Previous year figures have been regrouped and reclassified wherever considered necessary to conform to this year's classifications.
As per our report of even date for and on behalf of the Board of Directors of
for KARVY & CO. SUVEN LIFE SCIENCES LIMITEDChartered Accountants
Firm registration number: 001757S
SANJEEV KUMAR SREEPATHI VENKATESWARLU JASTIPartner Chairman & CEO
Membership No. 209145 DIN: 00278028
P. SUBBA RAO K. HANUMANTHA RAOPlace: Hyderabad Chief Financial Officer Company Secretary
Date: 27th May, 2016 Membership No. A11342 Membership No. A11599
NOTES TO THE FINANCIAL STATEMENTS(All amounts in lakhs in Indian Rupees, unless otherwise stated)
S T A N D A L O N E F I N A N C I A L S E C T I O N
94

CONSOLIDATED FINANCIAL SECTION
95ANNUAL REPORT
2015/16SUVENLIFE SCIENCES LIMITED

To
The Members of
Suven Life Sciences Limited
Report on the Consolidated Financial Statements
We have audited the accompanying consolidated financial statements of
Suven Life Sciences Limited (‘the Holding Company’), and its subsidiary
(the Holding Company and its subsidiary together referred to as the Group),
comprising of the Consolidated Balance Sheet as at 31st March, 2016, the
Consolidated Statement of Profit and Loss and the Consolidated Cash Flow
Statement for the year then ended and a summary of significant accounting
policies and other explanatory information (hereinafter referred to as 'the
consolidated financial statements’).
Management’s Responsibility for the Consolidated Financial Statements
The Holding Company’s Board of Directors is responsible for the preparation
of these consolidated financial statements in terms of the requirements
of the Companies Act, 2013 (‘the Act’) that give a true and fair view of
the consolidated financial position, consolidated financial performance
and consolidated cash flows of the Group in accordance with the
accounting principles generally accepted in India, including the Accounting
Standards specified under Section 133 of the Act, read with Rule 7 of the
Companies (Accounts) Rules, 2014. The respective Board of Directors of
the companies included in the Group are responsible for maintenance
of adequate accounting records in accordance with the provisions of
the Act for safeguarding the assets of the Group and for preventing and
detecting frauds and other irregularities; the selection and application of
appropriate accounting policies; making judgments and estimates that are
reasonable and prudent; and the design, implementation and maintenance
of adequate internal financial controls, that were operating effectively
for ensuring the accuracy and completeness of the accounting records,
relevant to the preparation and presentation of the financial statements
that give a true and fair view and are free from material misstatement,
whether due to fraud or error, which have been used for the purpose of
preparation of the consolidated financial statements by the Directors of the
Holding Company, as aforesaid.
Auditor’s Responsibility
Our responsibility is to express an opinion on these consolidated financial
statements based on our audit.
While conducting the audit, we have taken into account the provisions
of the Act, the accounting and auditing standards and matters which are
required to be included in the audit report under the provisions of the Act
and the Rules made there under.
We conducted our audit in accordance with the Standards on Auditing
specified under Section 143(10) of the Act. Those Standards require that we
comply with ethical requirements and plan and perform the audit to obtain
reasonable assurance about whether the consolidated financial statements
are free from material misstatement.
An audit involves performing procedures to obtain audit evidence about
the amounts and the disclosures in the consolidated financial statements.
The procedures selected depend on the auditor’s judgment, including the
assessment of the risks of material misstatement of the consolidated
financial statements, whether due to fraud or error. In making those risk
assessments, the auditor considers internal financial control relevant to the
Holding Company’s preparation of the consolidated financial statements
that give a true and fair view in order to design audit procedures that
are appropriate in the circumstances. An audit also includes evaluating the
appropriateness of the accounting policies used and the reasonableness
of the accounting estimates made by the Holding Company’s Board of
Directors, as well as evaluating the overall presentation of the consolidated
financial statements.
We believe that the audit evidence we have obtained is sufficient and
appropriate to provide a basis for our audit opinion on the consolidated
financial statements.
Opinion
In our opinion and to the best of our information and according to the
explanations given to us, the aforesaid consolidated financial statements
give the information required by the Act in the manner so required and give
a true and fair view in conformity with the accounting principles generally
accepted in India, of the consolidated state of affairs of the Group as at
31st March, 2016, and their consolidated profit and their consolidated cash
flows for the year ended on that date.
INDEPENDENT AUDITOR’S REPORT
C O N S O L I D A T E D F I N A N C I A L S E C T I O N
96

Other Matters
The consolidated financial statements also include the Group’s share of net
loss of ` 2823.13 lakhs for the year ended 31stMarch, 2016, as considered
in the consolidated financial statements, in respect of the subsidiary
whose financial statements have not been audited by us. These financial
statements have been audited by other auditor whose report have been
furnished to us by the Management, and our opinion on the consolidated
financial statements, in so far as it relates to the amounts and disclosures
included in respect of these subsidiary, and our report in terms of sub-
sections (3) and (11) of Section 143 of the Act in so far as it relates to the
aforesaid subsidiary is based solely on the reports of the other auditors.
Our opinion on the consolidated financial statements, and our report on
Other Legal and Regulatory Requirements below, is not modified in respect
of the above matters with respect to our reliance on the work done and the
financial statements certified by the Management.
Report on Other Legal and Regulatory Requirements
1. As required by section 143 (3) of the Act, we report that:
a) We have sought and obtained all the information and
explanations which to the best of our knowledge and belief
were necessary for the purposes of our audit of the aforesaid
consolidated financial statements.
b) In our opinion, proper books of account as required by law,
relating to preparation of the aforesaid consolidated financial
statements have been kept so far as it appears from our
examination of those books.
c) The Consolidated Balance Sheet, Consolidated Statement of
Profit and Loss and the Consolidated Cash Flow Statement dealt
with by this Report are in agreement with the relevant books
of account maintained for the purpose of preparation of the
consolidated financial statements.
d) In our opinion, the aforesaid consolidated financial statements
comply with the Accounting Standards specified under Section
133 of the Act, read with Rule 7 of the Companies (Accounts)
Rules, 2014.
e) On the basis of written representations received from the
directors of the Holding Company as on 31st March, 2016, taken
on record by the Board of Directors of the Holding Company,
none of the directors of the Holding Company incorporated
in India is disqualified as on 31st March, 2016, from being
appointed as a director in terms of Section 164(2) of the Act.
f) With respect to the other matters to be included in the Auditor’s
Report in accordance with Rule 11 of the Companies (Audit
and Auditors) Rules, 2014, in our opinion and to the best of our
information and according to the explanations given to us:
i. The Consolidated financial statements disclose the impact
of pending litigations on the consolidated position of the
Group -Refer Note 28 to the financial statements.
ii. There has been no delay in transferring amounts, required
to be transferred, to the Investor Education and Protection
Fund by the Holding company incorporated in India.
For KARVY & CO.
Chartered Accountants
ICAI Firm Registration No: 01757S
(SANJEEV KUMAR SREEPATHI)
Place: Hyderabad Partner
Date : 27 May, 2016 Membership No. 209145
97ANNUAL REPORT
2015/16SUVENLIFE SCIENCES LIMITED
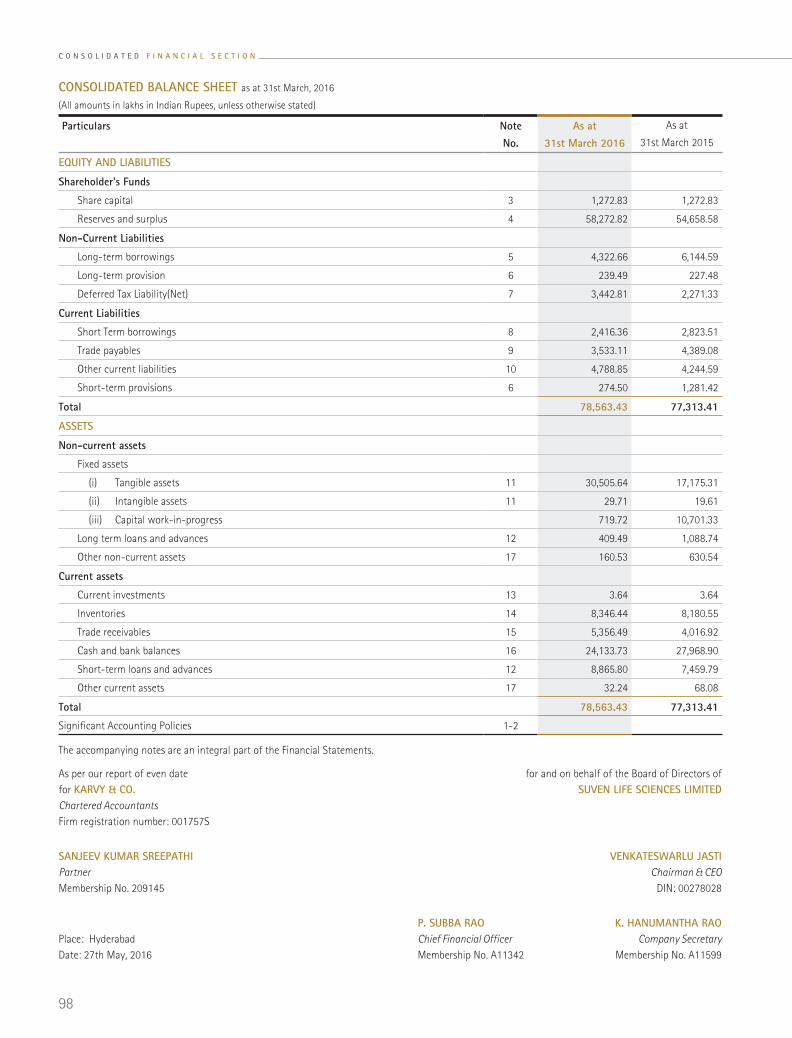
Particulars Note No.
As at 31st March 2016
As at
31st March 2015
EQUITY AND LIABILITIES
Shareholder's Funds
Share capital 3 1,272.83 1,272.83
Reserves and surplus 4 58,272.82 54,658.58
Non-Current Liabilities
Long-term borrowings 5 4,322.66 6,144.59
Long-term provision 6 239.49 227.48
Deferred Tax Liability(Net) 7 3,442.81 2,271.33
Current Liabilities
Short Term borrowings 8 2,416.36 2,823.51
Trade payables 9 3,533.11 4,389.08
Other current liabilities 10 4,788.85 4,244.59
Short-term provisions 6 274.50 1,281.42
Total 78,563.43 77,313.41
ASSETS
Non-current assets
Fixed assets
(i) Tangible assets 11 30,505.64 17,175.31
(ii) Intangible assets 11 29.71 19.61
(iii) Capital work-in-progress 719.72 10,701.33
Long term loans and advances 12 409.49 1,088.74
Other non-current assets 17 160.53 630.54
Current assets
Current investments 13 3.64 3.64
Inventories 14 8,346.44 8,180.55
Trade receivables 15 5,356.49 4,016.92
Cash and bank balances 16 24,133.73 27,968.90
Short-term loans and advances 12 8,865.80 7,459.79
Other current assets 17 32.24 68.08
Total 78,563.43 77,313.41
Significant Accounting Policies 1-2
The accompanying notes are an integral part of the Financial Statements.
As per our report of even date for and on behalf of the Board of Directors offor KARVY & CO. SUVEN LIFE SCIENCES LIMITEDChartered AccountantsFirm registration number: 001757S
SANJEEV KUMAR SREEPATHI VENKATESWARLU JASTIPartner Chairman & CEOMembership No. 209145 DIN: 00278028
P. SUBBA RAO K. HANUMANTHA RAOPlace: Hyderabad Chief Financial Officer Company SecretaryDate: 27th May, 2016 Membership No. A11342 Membership No. A11599
CONSOLIDATED BALANCE SHEET as at 31st March, 2016
(All amounts in lakhs in Indian Rupees, unless otherwise stated)
C O N S O L I D A T E D F I N A N C I A L S E C T I O N
98
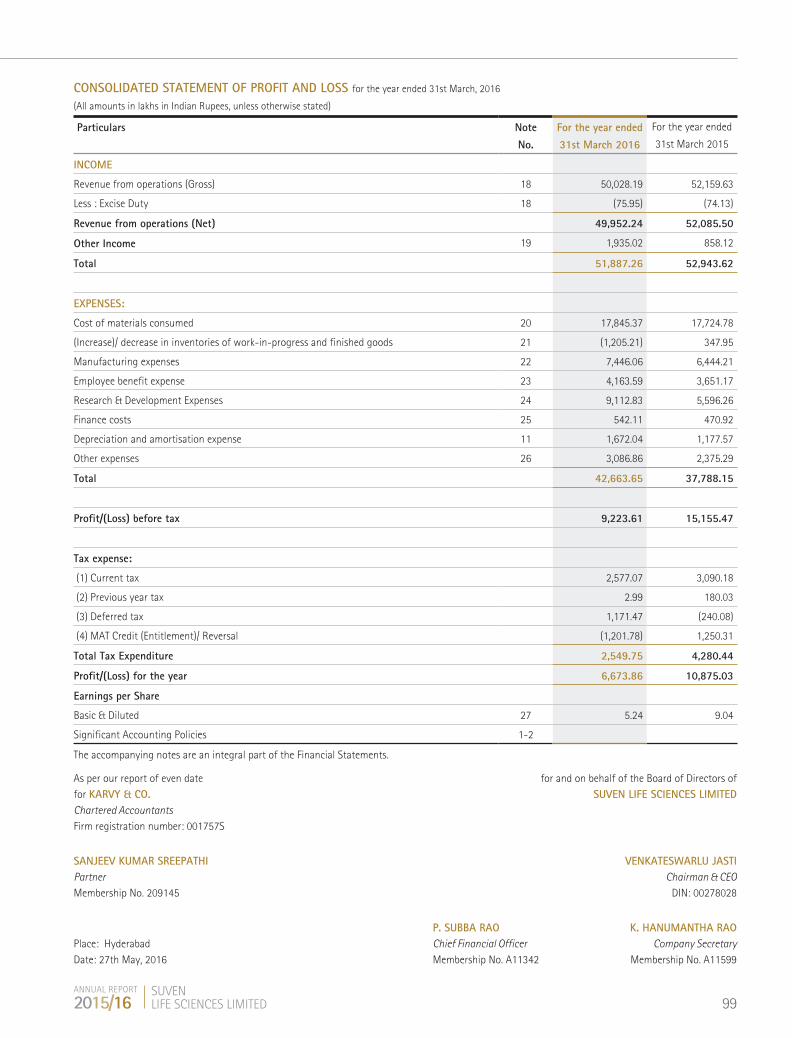
Particulars Note No.
For the year ended 31st March 2016
For the year ended
31st March 2015
INCOME
Revenue from operations (Gross) 18 50,028.19 52,159.63
Less : Excise Duty 18 (75.95) (74.13)
Revenue from operations (Net) 49,952.24 52,085.50
Other Income 19 1,935.02 858.12
Total 51,887.26 52,943.62
EXPENSES:
Cost of materials consumed 20 17,845.37 17,724.78
(Increase)/ decrease in inventories of work-in-progress and finished goods 21 (1,205.21) 347.95
Manufacturing expenses 22 7,446.06 6,444.21
Employee benefit expense 23 4,163.59 3,651.17
Research & Development Expenses 24 9,112.83 5,596.26
Finance costs 25 542.11 470.92
Depreciation and amortisation expense 11 1,672.04 1,177.57
Other expenses 26 3,086.86 2,375.29
Total 42,663.65 37,788.15
Profit/(Loss) before tax 9,223.61 15,155.47
Tax expense:
(1) Current tax 2,577.07 3,090.18
(2) Previous year tax 2.99 180.03
(3) Deferred tax 1,171.47 (240.08)
(4) MAT Credit (Entitlement)/ Reversal (1,201.78) 1,250.31
Total Tax Expenditure 2,549.75 4,280.44
Profit/(Loss) for the year 6,673.86 10,875.03
Earnings per Share
Basic & Diluted 27 5.24 9.04
Significant Accounting Policies 1-2
CONSOLIDATED STATEMENT OF PROFIT AND LOSS for the year ended 31st March, 2016
(All amounts in lakhs in Indian Rupees, unless otherwise stated)
The accompanying notes are an integral part of the Financial Statements.
As per our report of even date for and on behalf of the Board of Directors offor KARVY & CO. SUVEN LIFE SCIENCES LIMITEDChartered AccountantsFirm registration number: 001757S
SANJEEV KUMAR SREEPATHI VENKATESWARLU JASTIPartner Chairman & CEOMembership No. 209145 DIN: 00278028
P. SUBBA RAO K. HANUMANTHA RAOPlace: Hyderabad Chief Financial Officer Company SecretaryDate: 27th May, 2016 Membership No. A11342 Membership No. A11599
99ANNUAL REPORT
2015/16SUVENLIFE SCIENCES LIMITED

Particulars For the year ended 31st March 2016
For the year ended
31st March 2015
CASH FLOW FROM OPERATING ACTIVITIES
Profit before tax 9,223.61 15,155.47
Non-cash adjustment to reconcile profit before tax to net cash flows
Depreciation 2,395.29 2,421.20
Interest Income (247.91) (233.85)
Interest on Finance Cost 542.11 470.92
Dividend Income (50.34) (569.87)
Gain on sale of Investment (1,617.81) (7.83)
Loss due to asset discarded 32.15
Profit on Sale of Assets - (4.12)
Operating profit before working capital changes 10,277.10 17,231.92
Movements in working capital:
(Increase)/ Decrease in Long term Loans and Advances 679.25 174.98
(Increase)/ Decrease in Inventories (165.89) (317.69)
(Increase)/ Decrease in Trade Receivables (1,339.57) 2,530.11
(Increase)/ Decrease in Short Loans & Advances (1,406.01) (655.60)
(Increase)/ Decrease in other current assets 1,758.89 (1,405.90)
(Increase)/ Decrease in Trade Payables (855.97) 299.03
(Increase)/ Decrease in other current liabilities 544.25 (507.25)
(Increase)/ Decrease in short term provisions 142.78 658.51
(Increase)/ Decrease in long term provisions 12.01 48.13
Cash generated from operations 9,646.83 18,056.25
Direct taxes paid (net of refunds) (2,659.05) (3,765.74)
Net cash flow from operating activities (A) 6,987.78 14,290.51
CASH FLOWS FROM INVESTING ACTIVITIES
Sale/(Purchase) of Investments - 0.15
Purchase of Fixed Assets (5,786.26) (11,829.35)
Sale of Fixed Assets - 4.12
Gain on sale of Investment 1,617.81 7.83
Interest Received 275.65 209.62
Foreign currency translation reserve 4.36 -
Changes in bank balances not considered as cash equivalents (52.31) (6.91)
Dividend Received 50.34 569.87
Net cash flow used in investing activities (B) (3,890.41) (11,044.67)
CONSOLIDATED CASH FLOW STATEMENT for the year ended 31st March, 2016
(All amounts in lakhs in Indian Rupees, unless otherwise stated)
C O N S O L I D A T E D F I N A N C I A L S E C T I O N
100

Particulars For the year ended 31st March 2016
For the year ended
31st March 2015
CASH FLOWS FROM FINANCING ACTIVITIES
Repayment of long-term borrowings (2,029.72) 1,826.23
Repayment of short- term borrowings (net) (407.15) (31.85)
Interest Paid on borrowings (564.85) (463.94)
Issue of capital with Premium - 20,000.00
Dividend Payouts (including Dividend Tax) (3,983.14) (3,417.12)
Net cash flow used in financing activities (C) (6,984.86) 17,913.31
Net (decrease)/increase in cash and cash equivalents (A+B+C) (3,887.48) 21,159.15
Cash and cash equivalents at the beginning of the year 27,936.19 6,777.04
Cash and cash equivalents at the end of the year 24,048.71 27,936.19
Components of cash and cash equivalents
Cash on hand 10.91 10.79
Balances with Banks 24,037.80 27,925.40
Total cash and cash equivalents (refer note 16) 24,048.71 27,936.19
Summary of significant accounting policies 1-2
CONSOLIDATED CASH FLOW STATEMENT for the year ended 31st March, 2016
(All amounts in lakhs in Indian Rupees, unless otherwise stated)
The accompanying notes are an integral part of the Financial Statements.
As per our report of even date for and on behalf of the Board of Directors offor KARVY & CO. SUVEN LIFE SCIENCES LIMITEDChartered AccountantsFirm registration number: 001757S
SANJEEV KUMAR SREEPATHI VENKATESWARLU JASTIPartner Chairman & CEOMembership No. 209145 DIN: 00278028
P. SUBBA RAO K. HANUMANTHA RAOPlace: Hyderabad Chief Financial Officer Company SecretaryDate: 27th May, 2016 Membership No. A11342 Membership No. A11599
101ANNUAL REPORT
2015/16SUVENLIFE SCIENCES LIMITED

1. CORPORATE INFORMATION
Suven Life Sciences Limited (Suven) is a bio-pharmaceutical company, began operations in 1989 as specialty chemicals provider about 27 years ago
and went on to create a NCE based CRAMS (Contract Research And Manufacturing Services) business model in 1995, providing building blocks (bulk
actives, drug intermediates and specialty chemicals) for global life science companies. Suven has made in-roads into drug discovery in the year
2005with a specialisation on CNS (Central Nervous System) based programs targeting unmet medical need and 4 of the molecules in pipeline are
into clinical phase of development. The Company is targeting CNS indications where there is a high unmet medical need, patient populations are
identifiable, clinical endpoints can be well-defined and with possible commercialisation options
Suven, Inc., a Delaware Company, is a WOS (wholly owned subsidiary) of Suven, is a clinical-stage biopharmaceutical company commenced activities in
October 2015, focused on the acquisition, development and commercialisation of novel therapeutics for the treatment of neurodegenerative disorders.
The near-term focus for Suven, Inc., is to develop Suven product candidate, which we refer to as SUVN-502, for the treatment of Alzheimer's disease
and other forms of dementia.
2. BASIS OF PREPARATION
2.1 Basis of Accounting
The financial statements of the Company have been prepared in accordance with the generally accepted accounting principles in India (Indian
GAAP). The Company has prepared these financial statements to comply in all material respects with the accounting standards notified under
section 133 of the Companies Act 2013, read together with paragraph 7 of the Companies (Accounts) Rules 2014.
2.2 Use of Estimates
The presentation of financial statements in conformity with the generally accepted accounting principles requires management to make
estimates and assumptions that affect the reported value of assets and liabilities on the date of the financial statements and the reported
amount of revenue and expenditure for the year. The difference between the actual results and estimates are recognised in the period in which
the results are known / materialised.
2.3 Consolidation
(i) Principles of Consolidation:
The consolidated financial statements relate to Suven Life Sciences Limited and its subsidiary companies. The consolidated financial
statements have been prepared on the following basis:
i. The Financial statements of the Company and its subsidiary are combined on a line-by-line basis by adding together the book values
of the like items of assets, liabilities, income and expenses, after fully eliminating intra group balances and intra group transactions,
except wherever otherwise stated in accordance with accounting standard (AS-21) “Consolidated Financial Statements “notified under
the Companies (Accounts) Rules, 2014.
ii. The difference between the costs of investments in the subsidiaries, over the net assets at the time of acquisition of the shares in the
subsidiaries is recognised in the financial statements as Goodwill or Capital Reserve as the case may be.
iii. Minority Interest in the net assets of consolidated subsidiaries is identified and presented in consolidated balance sheet separately
from liabilities and equity of company's shareholders.
iv. Minority Interest in the assets of consolidated subsidiaries consists of:
a) The amount of equity attributable to minority at the date on which investment in subsidiaries is made; and
b) The minority share of movements in equity since the date parent subsidiary relationship came into existence.
v. Minority Interest's share of net profit for the year of consolidated subsidiaries is identified and against the profit after tax of the group.
Investment in equity method as per (AS 23) - “Accounting for Investments in Associates in Consolidation Financial Statements “.
vi. The Company accounts for its share in the change in net assets of the associates, post-acquisition, after eliminating unrealised profits
and losses resulting from transactions between the Company and its associates to the extent of its share, through its Profit and Loss
Account to the extent such change is attributable to the associates' Profit and Loss account and through its reserves for the balance,
based on available information.
NOTES TO THE CONSOLIDATED FINANCIAL STATEMENTS
C O N S O L I D A T E D F I N A N C I A L S E C T I O N
102
vii. The difference between the costs of investments in the associates and the share of net assets at the time of acquisition of the shares
in the associates is identified in the financial statements as Goodwill or Capital Reserve as the case may be
viii. The Consolidated financial statements are prepared using uniform accounting policies for like transactions and other events in similar
and are presented in the same manner as the Company's separate financial statements.
(ii) The Consolidated financial statements include the accounts of Suven Life Sciences Limited and wholly owned subsidiary.
Name of Subsidiary : Suven Inc.
Country of Incorporation : USA
Company's Interest : 100%
Financial Year of the Subsidiary Ended on : 31st March, 2016
2.4 Revenue Recognition
i. Revenue from sale of goods is recognised when significant risks and rewards in respect of ownership of products are transferred to
customers.
ii. Revenue from Contract Technical Services, Clinical Trials Services, Process Development Services and Formulation Development Charges are
recognised on completion of the milestone work.
iii. Income from Investments
(a) The Company recognises Interest on investments on accrual basis.
(b) Dividend income on investments is accounted for when the right to receive the payment is established.
2.5 Fixed Assets
i. Tangible assets
Fixed assets are stated at cost and as reduced by accumulated depreciation and accumulated impairement lossess . The cost comprises
purchase price, borrowing costs if capitalisation criteria are met and directly attributable cost of bringing the asset to its working condition
for the intended use. Any trade discounts and rebates are deducted in arriving at the purchase price.Exchange difference arising on Long
Term Foreign currency monetary items relating to acquisition of fixed assets are adjusted to the carrying cost of such assets.
Subsequent expenditure related to an item of fixed asset is added to its book value only if it increases the future benefits from the existing
asset beyond its previously assessed standard of performance. All other expenses on existing fixed assets, including day-to-day repair and
maintenance expenditure and cost of replacing parts, are charged to the statement of profit and loss for the period during which such
expenses are incurred.
Gains or losses arising from derecognition of fixed assets are measured as the difference between the net disposal proceeds and the carrying
amount of the asset and are recognised in the statement of profit and loss when the asset is derecognised.
ii. Intangible assets
Intangible assets acquired separately are measured on initial recognition at cost. Following initial recognition, intangible assets are carried at
cost less accumulated amortisation and accumulated impairment losses, if any. Internally generated intangible assets, excluding capitalised
development costs, are not capitalised and expenditure is reflected in the statement of profit and loss in the year in which the expenditure
is incurred.
Intangible assets are amortised on a straight line basis over the estimated useful economic life. The Company uses a rebuttable presumption
that the useful life of an intangible asset will not exceed ten years from the date when the asset is available for use.
Gains or losses arising from derecognition of an intangible asset are measured as the difference between the net disposal proceeds and the
carrying amount of the asset and are recognised in the statement of profit and loss when the asset is derecognised.
NOTES TO THE CONSOLIDATED FINANCIAL STATEMENTS
103ANNUAL REPORT
2015/16SUVENLIFE SCIENCES LIMITED
2.6 Depreciation
Depreciation on fixed assets is provided on straight-line basis at the rates arrived at based on the useful lives prescribed in Schedule II of the
Companies Act, 2013. The Company follows the policy of charging depreciation on pro-rata basis on the assets acquired or disposed off during
the year.
2.7 Investments
Investments, which are readily realisable and intended to be held for not more than one year from the date on which such investments are made,
are classified as current investments. All other investments are classified as long-term investments.
On initial recognition, all investments are measured at cost. The cost comprises purchase price and directly attributable acquisition charges such
as brokerage, fees and duties.
Non-current investments are stated at cost and provision for diminution is made if the decline in value is other than temporary in nature.
On disposal of an investment, the difference between its carrying amount and net disposal proceeds is charged or credited to the statement of
Profit & Loss
2.8 Inventories
i. Stock of raw materials, Stores, spares and fuel are stated at cost and are valued on FIFO basis.
ii. Work in process is stated at cost.
iii. Finished Goods are valued at the lower of the Cost or net realisable value.
2.9 Research & Development expenses
i. Revenue expenditure on research and development activities is expensed as and when incurred.
ii. The expenditure on capital assets having alternative use either in R&D activity or otherwise are capitalised and amortised at the rate
specified in Schedule II of the Companies Act 2013.
iii. Depreciation on R&D assets is included in R&D expenses.
2.10 Foreign Currency Transactions
i. Transactions denominated in foreign currency are normally recorded at the exchange rate prevailing at the time of the
transaction.
ii. Any income or expense on account of exchange difference either on settlement or on translation is recognised in the profit and loss account,
except exchange difference arising on Long Term Foreign currency monetary items relating to acquisition of fixed assets which are adjusted
to the carrying cost of such assets.
iii. In case of Monetary items which are covered by forward exchange contracts, premium or discount on forward exchange contracts are
amortised and recognised in the profit and loss account over the period of the contract. Forward Exchange Contracts outstanding at the
balance sheet date, are stated at fair value and any gains or losses are recognised in the profit and loss account.
iv. Financial Derivative Contracts:
The realised gain/loss in respect of settled contracts are recognised in the Profit and loss account.
2.11 Retirement benefits to employees
The Company has Defined Contribution Plan for its employees’ retirement benefits comprising of Provident Fund and Employees Pension
Scheme, 1995. The Company contributes to State Plans namely Employees’ State Insurance Scheme.
The Company has Defined Benefit Plan comprising of Gratuity Fund and Leave Encashment. The Company contributes to Gratuity Fund
administered by LIC. The liability for the Gratuity Fund and Leave Encashment are determined on the basis of an independent actuarial valuation
done at the year end. Actuarial Gains and Losses comprise experience adjustments and the effect of changes in the actuarial assumptions and
are recognised immediately in the Profit and Loss Account as income or expense.
NOTES TO THE CONSOLIDATED FINANCIAL STATEMENTS
C O N S O L I D A T E D F I N A N C I A L S E C T I O N
104
2.12 Borrowing Cost
Borrowing cost includes interest and amortisation of ancillary costs incurred in connection with the arrangement of borrowings.
Borrowing Costs that are directly attributable to the acquisition of a fixed asset are capitalised as part of the cost of the asset till the date the
asset is ready for commercial use. All other borrowing costs are charged to revenue.
2.13 Income Taxes
The current charge for taxes is calculated in accordance with relevant tax regulations applicable to the Company.
The deferred tax for the timing differences between the book and tax profits for the year end is accounted for, using the tax rates and laws that
have been substantially enacted as of the balance sheet date.
Deferred tax assets arising from timing differences are recognised and carried forward only if there is reasonable certainty that they will be
realised in future and reviewed for the appropriateness of their respective carrying value at each balance sheet date.
2.14 Earnings per share
The basic earnings per share (EPS) is computed by dividing the net profit after tax for the year by the weighted average number of equity shares
outstanding during the year. For the purpose of calculating diluted earnings per share, net profit after tax for the year and the weighted average
number of shares outstanding during the year are adjusted for the effects of all dilutive potential equity shares. The dilutive potential equity
shares are deemed converted as of the beginning of the period, unless they have been issued at a later date.
2.15 Impairment of Assets
If the carrying amount of fixed assets exceeds the recoverable amount on the reporting date, the carrying amount is reduced to the recoverable
amount. The recoverable amount is measured as the higher of the net selling price and the value in use determined by the present value of
estimated future cash flows.
2.16 Provisions
Provisions are recognised when the Company has present legal or constructive obligations, as a result of past events, for which it is probable
that an outflow of economic benefits will be required to settle the obligation and a reliable estimate can be made for the amount of obligation.
2.17 Segmental information - Basis of preparation
i. Segment Revenue and Expenses
Revenues and expenses are allocated on a reasonable basis to segments being common manufacturing facilities and sales force.
ii. Segment Assets and Liabilities
Segment assets and liabilities which can be identified to a segment are allocated to the respective segment. The fixed assets and net current
assets are not identifiable for particular segment except R & D segment, because these assets can be used interchangeable among the
segments. Hence the management feels that the assets cannot be segregated to particular segment and to disclose these under unallocated
assets.
2.18 Employee Stock Option Schemes
In accordance with the Securities and Exchange Board of India guidelines, the excess of the market price of shares, at the date of grant of options
under the Employee stock option schemes, over the exercise price is treated as employee compensation and amortised on a straight-line basis
over the vesting period.
2.19 Cash and Cash equivalents
Cash and cash equivalents for the purposes of cash flow statement comprise cash at bank and in hand and short-term investments with an
original maturity of three months or less.
NOTES TO THE CONSOLIDATED FINANCIAL STATEMENTS
105ANNUAL REPORT
2015/16SUVENLIFE SCIENCES LIMITED
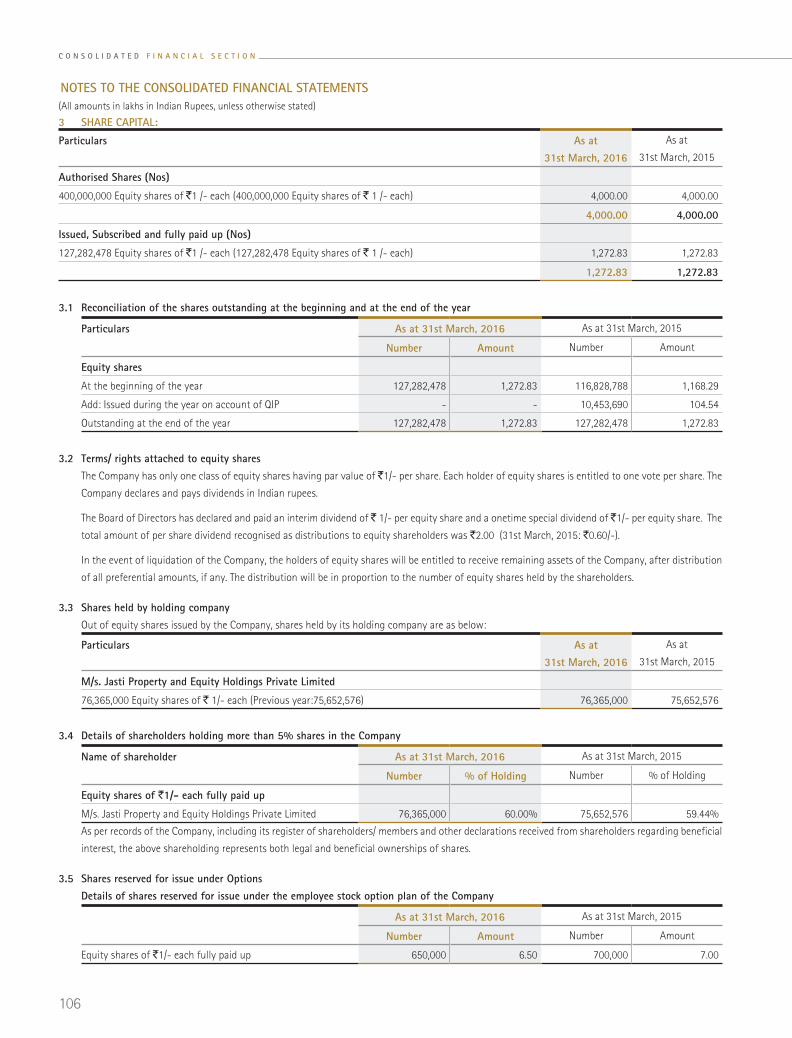
NOTES TO THE CONSOLIDATED FINANCIAL STATEMENTS(All amounts in lakhs in Indian Rupees, unless otherwise stated)
3 SHARE CAPITAL:
Particulars As at 31st March, 2016
As at
31st March, 2015
Authorised Shares (Nos)
400,000,000 Equity shares of `1 /- each (400,000,000 Equity shares of ` 1 /- each) 4,000.00 4,000.00
4,000.00 4,000.00
Issued, Subscribed and fully paid up (Nos)
127,282,478 Equity shares of `1 /- each (127,282,478 Equity shares of ` 1 /- each) 1,272.83 1,272.83
1,272.83 1,272.83
3.3 Shares held by holding company Out of equity shares issued by the Company, shares held by its holding company are as below:
Particulars As at 31st March, 2016
As at
31st March, 2015
M/s. Jasti Property and Equity Holdings Private Limited
76,365,000 Equity shares of ` 1/- each (Previous year:75,652,576) 76,365,000 75,652,576
3.1 Reconciliation of the shares outstanding at the beginning and at the end of the year
Particulars As at 31st March, 2016 As at 31st March, 2015
Number Amount Number Amount
Equity shares
At the beginning of the year 127,282,478 1,272.83 116,828,788 1,168.29
Add: Issued during the year on account of QIP - - 10,453,690 104.54
Outstanding at the end of the year 127,282,478 1,272.83 127,282,478 1,272.83
3.2 Terms/ rights attached to equity shares The Company has only one class of equity shares having par value of `1/- per share. Each holder of equity shares is entitled to one vote per share. The
Company declares and pays dividends in Indian rupees.
The Board of Directors has declared and paid an interim dividend of ` 1/- per equity share and a onetime special dividend of `1/- per equity share. The
total amount of per share dividend recognised as distributions to equity shareholders was `2.00 (31st March, 2015: `0.60/-).
In the event of liquidation of the Company, the holders of equity shares will be entitled to receive remaining assets of the Company, after distribution
of all preferential amounts, if any. The distribution will be in proportion to the number of equity shares held by the shareholders.
3.4 Details of shareholders holding more than 5% shares in the Company
Name of shareholder As at 31st March, 2016 As at 31st March, 2015
Number % of Holding Number % of Holding
Equity shares of `1/- each fully paid up
M/s. Jasti Property and Equity Holdings Private Limited 76,365,000 60.00% 75,652,576 59.44%
As per records of the Company, including its register of shareholders/ members and other declarations received from shareholders regarding beneficial
interest, the above shareholding represents both legal and beneficial ownerships of shares.
3.5 Shares reserved for issue under Options Details of shares reserved for issue under the employee stock option plan of the Company
As at 31st March, 2016 As at 31st March, 2015
Number Amount Number Amount
Equity shares of `1/- each fully paid up 650,000 6.50 700,000 7.00
C O N S O L I D A T E D F I N A N C I A L S E C T I O N
106

3 SHARE CAPITAL: (contd.)
Terms and Conditions of Options Granted Each option entitles the holder thereof to apply for and be allotted one equity share of the Company of ` 1.00 each upon payment of the exercise price
during the exercise period. The exercise period commences from the date of vesting of the Options and expires at the end of three years from the date
of vesting in respect of Options granted under the Suven Employee Stock Option Scheme -2004
The vesting period for conversion of Options is as follows: On completion of 24 months from the date of grant of the Options: 25% vests
On completion of 36 months from the date of grant of the Options: 35% vests
On completion of 48 months from the date of grant of the Options: 40% vests
The Options have been granted at the ‘market price’ as defined from time to time under the Securities and Exchange Board of India (Employee Stock
Option Scheme and Employee Stock Purchase Scheme) Guidelines, 1999.
4 RESERVE AND SURPLUS
Particulars As at 31st March, 2016
As at
31st March, 2015
General Reserve
Balance as per the last financial statements 6,736.61 5,636.61
Add : Amount transferred from surplus balance in the Statement of Profit and Loss 1,100.00 1,100.00
Closing balance 7,836.61 6,736.61
Foreign Exchange Translation Reserve
Balance as per the last financial statements - -
Add : Additions during the year 4.36 -
4.36 -
Securities Premium Account
Balance as per the last financial statements 23,917.54 4,022.08
Add : Received on further issue of shares - 19,895.46
Closing balance 23,917.54 23,917.54
Surplus in the statement of profit and loss
Balance as per the last financial statements 24,004.42 15,617.65
Add: Profit for the year 6,673.86 10,875.03
Less: Adjustment of depreciation reserve as per Schedule II of Companies Act 2013 - 469.06
Less: Appropriations
Transfer to General Reserve 1,100.00 1,100.00
Interim Dividend 2,545.65 -
Proposed dividend - 763.70
Earlier year's dividend 0.00 0.02
Tax on Interim Dividend 518.32 -
Income tax on Proposed dividend
Current Year - 155.47
Earlier year's provision 0.00 0.01
Closing balance 26,514.31 24,004.42
TOTAL 58,272.82 54,658.58
NOTES TO THE CONSOLIDATED FINANCIAL STATEMENTS(All amounts in lakhs in Indian Rupees, unless otherwise stated)
107ANNUAL REPORT
2015/16SUVENLIFE SCIENCES LIMITED

5 LONG TERM BORROWINGS
Particulars Non-Current Current
As at 31st March, 2016
As at 31st March, 2015
As at 31st March, 2016
As at 31st March, 2015
Term Loans
Foreign currency loans from Banks (Secured)
Term Loan From State Bank of India (Vizag Plant) 3,303.77 4,101.26 584.60 202.87
Corporate Loan From Bank of India - - - 647.57
Corporate Loan From Bank of Bahrain & Kuwait 498.23 1,407.60 996.45 938.40
Total (A) 3,802.00 5,508.86 1,581.05 1,788.84
Indian currency loans from others (Unsecured)
Loan from Department of Science & Technology, Government of India
520.66 635.73 94.40 94.40
Total (B) 520.66 635.73 94.40 94.40
Total (A + B) 4,322.66 6,144.59 1,675.45 1,883.24
Nature of Security Terms of repayment
Term Loan From State Bank of India (Vizag Plant)Secured by first and pari-passu charge on Land, Buildings, Plant & Machinery and Second charge on stocks, receivables and other current assets
The term loan is repayable in 20 quarterly installments after roll over commencing from March' 2016. Rate of Interest LIBOR + 4%
Corporate Loan From Bank of IndiaSecured by first and pari-passu charge on Land, Buildings, Plant & Machinery and Second charge on stocks, receivables and other current assets
The term loan is fully paid and closed by 31st March 2016.
Corporate Loan From Bank of Bahrain & KuwaitSecured by first and pari-passu charge on Land, Buildings, Plant & Machinery and Second charge on stocks, receivables and other current assets
The term loan is repayable in 16 quarterly installments of USD 0.375 Million. Commencing from December 2013.Rate of Interest LIBOR + 3.50%
Loan from Department of Science & Technology - I The loan is repayable in 10 Annual installments of `50 Lakhs each commencing from October 2013.Rate of Interest 3.00%
Loan from Department of Science & Technology - II The loan is repayable in 10 Annual installments of `44.40 Lakhs each commencing from February 2013.Rate of Interest 3.00%
6 PROVISIONS
Particulars Long-Term Short-Term
As at 31st March, 2016
As at 31st March, 2015
As at 31st March, 2016
As at 31st March, 2015
Provision for Employee BenefitsGratuity 79.47 64.43 195.25 213.73
Leave Encashment 160.02 163.05 79.25 148.52
239.49 227.48 274.50 362.25
Other provisionsTaxation - - - -
Dividend - - - 763.70
Corporate Dividend Tax - - - 155.47
- - - 919.17
239.49 227.48 274.50 1,281.42
NOTES TO THE CONSOLIDATED FINANCIAL STATEMENTS(All amounts in lakhs in Indian Rupees, unless otherwise stated)
C O N S O L I D A T E D F I N A N C I A L S E C T I O N
108

7 DEFERRED TAX LIABILITY
Particulars As at 31st March, 2016
As at
31st March, 2015
Deferred Tax Liability
Fixed assets: Impact of difference between tax depreciation and depreciation/ amortisation charged for the
financial reporting
3,882.62 2,545.58
3,882.62 2,545.58
Deferred Tax Asset
Unabsorbed Losses 136.13 136.13
QIP Expenditure 125.80 -
Provision for Gratuity & Leave Encashment 177.88 138.12
439.81 274.25
Net deferred tax liability/ asset 3,442.81 2,271.33
8 SHORT TERM BORROWINGS
Particulars As at 31st March, 2016
As at
31st March, 2015
Loans repayable on demand
From Banks (Secured)
Working Capital Loans from State Bank of India 1,825.71 2,327.20
Working Capital Loans from Bank of Bahrain & Kuwait 590.65 496.31
2,416.36 2,823.51
8.1 ` 2,416.36 lakhs (Previous year: ` 2,823.51 lakhs) are secured by pari-passu first charge on inventories, receivables and other current assets of the
Company and pari-passu second charge on movable and immovable fixed assets of the Company and equitable mortgage of the properties belonging
to the Company, both present and future.
9 TRADE PAYABLES
Particulars As at 31st March, 2016
As at
31st March, 2015
Trade payables (Refer note 31 for details of dues to micro and small enterprises) 3,533.11 4,389.08
3,533.11 4,389.08
10 OTHER CURRENT LIABILITES
Particulars As at 31st March, 2016
As at
31st March, 2015
Current maturities of long-term borrowings (Refer Note 5) 1,675.45 1,883.24
Interest accrued but not due 19.29 42.03
Unclaimed dividend 84.99 32.66
Other payables
Liabilities for Expenses 2,443.17 1,256.38
Liabilities for statutory dues 118.37 102.90
Liabilities for Capital Works 447.58 927.38
4,788.85 4,244.59
NOTES TO THE CONSOLIDATED FINANCIAL STATEMENTS(All amounts in lakhs in Indian Rupees, unless otherwise stated)
109ANNUAL REPORT
2015/16SUVENLIFE SCIENCES LIMITED
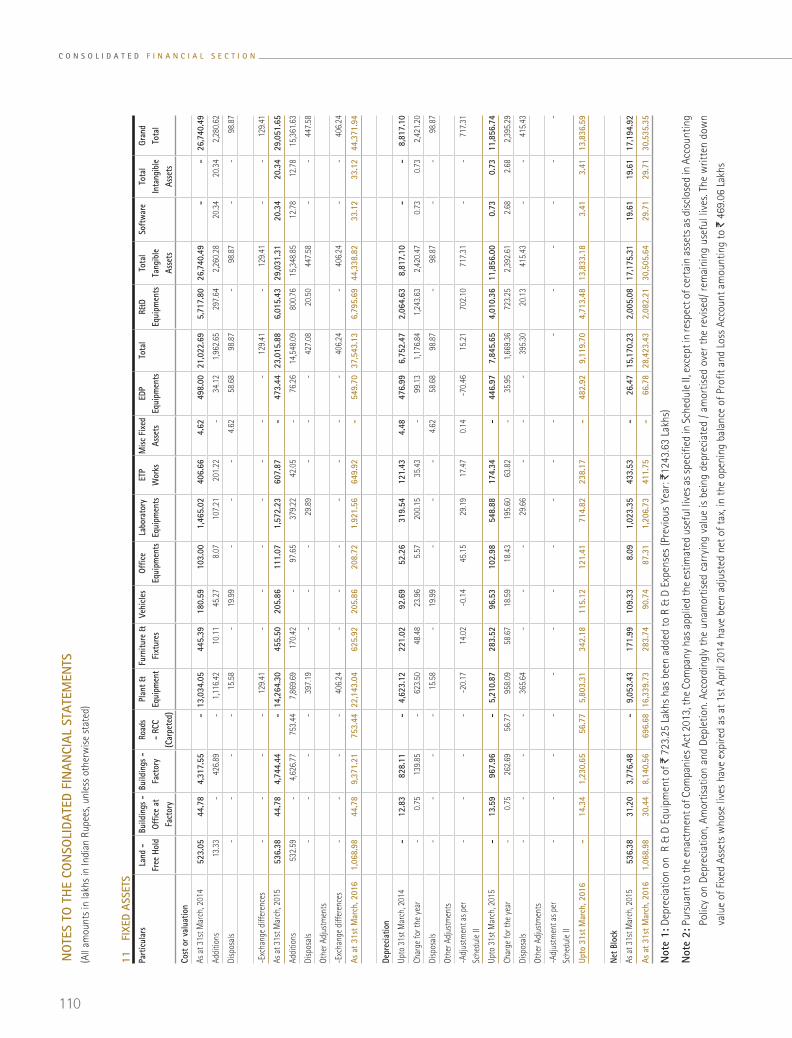
11
FIXE
D AS
SETS
Part
icul
ars
Land
-
Free
Hol
dBu
ildin
gs -
Of
fice
at
Fact
ory
Build
ings
-
Fact
ory
Road
s -
RCC
(Car
pete
d)
Plan
t &
Equi
pmen
tFu
rnitu
re &
Fi
xtur
esVe
hicl
esOf
fice
Equi
pmen
tsLa
bora
tory
Eq
uipm
ents
ETP
Wor
ksM
isc F
ixed
As
sets
EDP
Equi
pmen
tsTo
tal
R&D
Equi
pmen
tsTo
tal
Tang
ible
As
sets
Soft
war
eTo
tal
Inta
ngib
le
Asse
ts
Gran
d To
tal
Cost
or v
alua
tion
As a
t 31s
t Mar
ch, 2
014
523
.05
44.
78
4,3
17.5
5 -
13
,034
.05
445
.39
180
.59
103
.00
1,4
65.0
2 4
06.6
6 4
.62
498
.00
21,
022.
69
5,7
17.8
0 2
6,74
0.49
-
-
2
6,74
0.49
Addi
tions
13.
33
- 4
26.8
9 -
1,1
16.4
2 1
0.11
4
5.27
8
.07
107
.21
201
.22
- 3
4.12
1
,962
.65
297
.64
2,2
60.2
8 2
0.34
2
0.34
2
,280
.62
Disp
osal
s-
--
- 1
5.58
-
19.
99
- -
- 4
.62
58.
68
98.
87
- 9
8.87
-
- 9
8.87
-Exc
hang
e di
ffere
nces
- -
- -
129
.41
- -
- -
- -
- 1
29.4
1 -
129
.41
- -
129
.41
As a
t 31s
t Mar
ch, 2
015
536
.38
44.
78
4,7
44.4
4 -
14
,264
.30
455
.50
205
.86
111
.07
1,5
72.2
3 6
07.8
7 -
4
73.4
4 2
3,01
5.88
6
,015
.43
29,
031.
31
20.
34
20.
34
29,
051.
65
Addi
tions
532
.59
- 4
,626
.77
753
.44
7,8
69.6
9 1
70.4
2 -
97.
65
379
.22
42.
05
- 7
6.26
1
4,54
8.09
8
00.7
6 1
5,34
8.85
1
2.78
1
2.78
1
5,36
1.63
Disp
osal
s -
- -
- 3
97.1
9 -
- -
29.
89
- -
- 4
27.0
8 2
0.50
4
47.5
8 -
- 4
47.5
8
Othe
r Adj
ustm
ents
-Exc
hang
e di
ffere
nces
- -
- -
406
.24
- -
- -
- -
- 4
06.2
4 -
406
.24
- -
406
.24
As a
t 31s
t Mar
ch, 2
016
1,0
68.9
8 4
4.78
9
,371
.21
753
.44
22,1
43.0
4 6
25.9
2 2
05.8
6 2
08.7
2 1
,921
.56
649
.92
-
549
.70
37,
543.
13
6,7
95.6
9 4
4,33
8.82
3
3.12
3
3.12
4
4,37
1.94
Depr
ecia
tion
Upto
31s
t Mar
ch, 2
014
-
12.
83
828
.11
-
4,6
23.1
2 2
21.0
2 9
2.69
5
2.26
3
19.5
4 1
21.4
3 4
.48
476
.99
6,7
52.4
7 2
,064
.63
8,8
17.1
0 -
-
8
,817
.10
Char
ge fo
r the
yea
r -
0.7
5 1
39.8
5 -
623
.50
48.
48
23.
96
5.5
7 2
00.1
5 3
5.43
-
99.
13
1,1
76.8
4 1
,243
.63
2,4
20.4
7 0
.73
0.7
3 2
,421
.20
Disp
osal
s -
- -
- 1
5.58
-
19.
99
- -
- 4
.62
58.
68
98.
87
- 9
8.87
-
- 9
8.87
Othe
r Adj
ustm
ents
-Adj
ustm
ent a
s per
Sc
hedu
le II
-
- -
- -2
0.17
1
4.02
-0
.14
45.
15
29.
19
17.
47
0.1
4 -7
0.46
1
5.21
7
02.1
0 7
17.3
1 -
- 7
17.3
1
Upto
31s
t Mar
ch, 2
015
-
13.
59
967
.96
-
5,2
10.8
7 2
83.5
2 9
6.53
1
02.9
8 5
48.8
8 1
74.3
4 -
4
46.9
7 7
,845
.65
4,0
10.3
6 1
1,85
6.00
0
.73
0.7
3 1
1,85
6.74
Char
ge fo
r the
yea
r -
0.7
5 2
62.6
9 5
6.77
9
58.0
9 5
8.67
1
8.59
1
8.43
1
95.6
0 6
3.82
-
35.
95
1,6
69.3
6 7
23.2
5 2
,392
.61
2.6
8 2
.68
2,3
95.2
9
Disp
osal
s -
- -
- 3
65.6
4 -
- -
29.
66
- -
- 3
95.3
0 2
0.13
4
15.4
3 -
- 4
15.4
3
Othe
r Adj
ustm
ents
-Adj
ustm
ent a
s per
Sc
hedu
le II
-
- -
- -
- -
- -
- -
- -
- -
- -
Upto
31s
t Mar
ch, 2
016
-
14.
34
1,2
30.6
5 5
6.77
5
,803
.31
342
.18
115
.12
121
.41
714
.82
238
.17
-
482
.92
9,1
19.7
0 4
,713
.48
13,
833.
18
3.4
1 3
.41
13,
836.
59
Net B
lock
As a
t 31s
t Mar
ch, 2
015
536
.38
31.
20
3,7
76.4
8 -
9
,053
.43
171
.99
109
.33
8.0
9 1
,023
.35
433
.53
-
26.
47
15,1
70.2
3 2
,005
.08
17,
175.
31
19.
61
19.
61
17,
194.
92
As a
t 31s
t Mar
ch, 2
016
1,0
68.9
8 3
0.44
8
,140
.56
696
.68
16,3
39.7
3 2
83.7
4 9
0.74
8
7.31
1
,206
.73
411
.75
-
66.
78
28,4
23.4
3 2
,082
.21
30,
505.
64
29.
71
29.
71
30,
535.
35
Not
e 1:
Dep
reci
atio
n on
R &
D E
quip
men
t of `
723
.25
Lakh
s ha
s be
en a
dded
to R
& D
Exp
ense
s (P
revi
ous
Year
: `12
43.6
3 La
khs)
Not
e 2:
Pur
suan
t to
the
enac
tmen
t of C
ompa
nies
Act
201
3, th
e Co
mpa
ny h
as a
pplie
d th
e es
timat
ed u
sefu
l liv
es a
s spe
cifie
d in
Sch
edul
e II,
exc
ept i
n re
spec
t of c
erta
in a
sset
s as d
iscl
osed
in A
ccou
ntin
g
Polic
y on
Dep
reci
atio
n, A
mor
tisat
ion
and
Depl
etio
n. A
ccor
ding
ly t
he u
nam
ortis
ed c
arry
ing
valu
e is
bei
ng d
epre
ciat
ed /
amor
tised
ove
r th
e re
vise
d/ r
emai
ning
use
ful l
ives
. The
writ
ten
dow
n
valu
e of
Fix
ed A
sset
s w
hose
live
s ha
ve e
xpire
d as
at 1
st A
pril
2014
hav
e be
en a
djus
ted
net o
f tax
, in
the
open
ing
bala
nce
of P
rofit
and
Los
s Ac
coun
t am
ount
ing
to `
469
.06
Lakh
s
NO
TES
TO T
HE
CON
SOLI
DATE
D FI
NAN
CIAL
STA
TEM
ENTS
(All
amou
nts
in la
khs
in In
dian
Rup
ees,
unle
ss o
ther
wis
e st
ated
)
C O N S O L I D A T E D F I N A N C I A L S E C T I O N
110

12 LOANS AND ADVANCES
Particulars Long-Term Short-Term
As at 31st March, 2016
As at
31st March, 2015
As at 31st March, 2016
As at
31st March, 2015
(Unsecured, considered good)
Capital Advances 86.07 843.39 - -
Security Deposits 321.50 243.31 - -
Other Advances 1.92 2.04 2.55 -
Advances for purchases 112.48 11.89
Advances for expenses 330.78 269.06
Other loans and advances
Prepaid expenses 300.77 212.81
VAT Credit receivable 895.56 872.98
Cenvat Credit receivable 2,405.00 2,579.33
Service Tax Credit receivable 401.35 388.48
MAT Credit Entitlement 3,940.82 2,739.04
With Holding Tax 11.40 -
Advance income-tax (net of provision for tax) 434.63 355.63
Others 30.46 30.57
409.49 1,088.74 8,865.80 7,459.79
13 CURRENT INVESTMENTS
Particulars As at 31st March, 2016
As at
31st March, 2015
Current investments (valued at lower of cost and fair value, unless stated otherwise)
Quoted mutual funds
SBI Infrastructure Fund 3.64 3.64
50,000 (31 March, 2015: 50,000) units of `10/- each
3.64 3.64
Aggregate amount of quoted investments
Book value 3.64 3.64
Market value 5.31 5.89
14 INVENTORIES
Particulars As at 31st March, 2016
As at
31st March, 2015
(valued at lower of cost and net realisable value)
Raw Materials 1,906.17 2,996.25
Packing Materials 167.00 224.95
Work-in- Process 2,284.76 1,857.20
Finished Goods (Including Stock-in-Transit 31 March, 2015:` 677.53 lakhs) 3,427.25 2,649.60
Stores and Spares 561.26 452.55
8,346.44 8,180.55
NOTES TO THE CONSOLIDATED FINANCIAL STATEMENTS(All amounts in lakhs in Indian Rupees, unless otherwise stated)
111ANNUAL REPORT
2015/16SUVENLIFE SCIENCES LIMITED
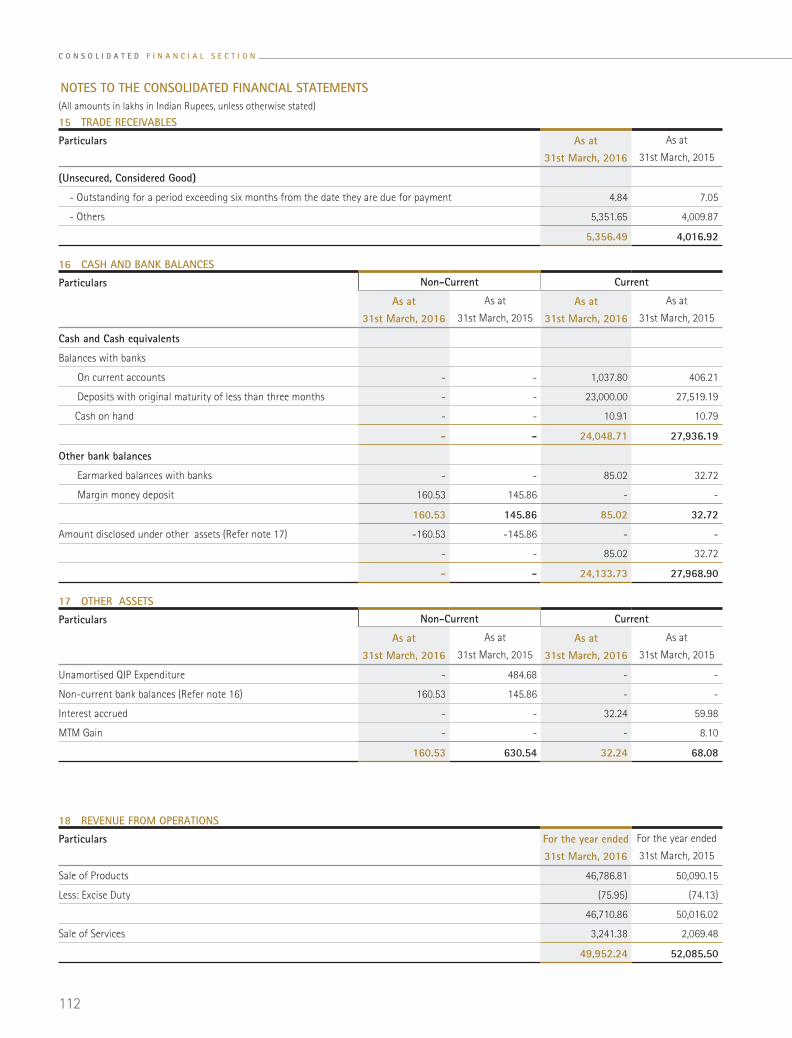
15 TRADE RECEIVABLES
Particulars As at 31st March, 2016
As at
31st March, 2015
(Unsecured, Considered Good)
- Outstanding for a period exceeding six months from the date they are due for payment 4.84 7.05
- Others 5,351.65 4,009.87
5,356.49 4,016.92
16 CASH AND BANK BALANCES
Particulars Non-Current Current
As at 31st March, 2016
As at
31st March, 2015
As at 31st March, 2016
As at
31st March, 2015
Cash and Cash equivalents
Balances with banks
On current accounts - - 1,037.80 406.21
Deposits with original maturity of less than three months - - 23,000.00 27,519.19
Cash on hand - - 10.91 10.79
- - 24,048.71 27,936.19
Other bank balances
Earmarked balances with banks - - 85.02 32.72
Margin money deposit 160.53 145.86 - -
160.53 145.86 85.02 32.72
Amount disclosed under other assets (Refer note 17) -160.53 -145.86 - -
- - 85.02 32.72
- - 24,133.73 27,968.90
17 OTHER ASSETS
Particulars Non-Current Current
As at 31st March, 2016
As at
31st March, 2015
As at 31st March, 2016
As at
31st March, 2015
Unamortised QIP Expenditure - 484.68 - -
Non-current bank balances (Refer note 16) 160.53 145.86 - -
Interest accrued - - 32.24 59.98
MTM Gain - - - 8.10
160.53 630.54 32.24 68.08
18 REVENUE FROM OPERATIONS
Particulars For the year ended 31st March, 2016
For the year ended
31st March, 2015
Sale of Products 46,786.81 50,090.15
Less: Excise Duty (75.95) (74.13)
46,710.86 50,016.02
Sale of Services 3,241.38 2,069.48
49,952.24 52,085.50
NOTES TO THE CONSOLIDATED FINANCIAL STATEMENTS(All amounts in lakhs in Indian Rupees, unless otherwise stated)
C O N S O L I D A T E D F I N A N C I A L S E C T I O N
112

Particulars For the year ended 31st March, 2016
For the year ended
31st March, 2015
Sale of Products
(a) Bulk drugs 1,706.12 1,837.39
(b) Intermediates 43,153.06 45,420.48
(c) Recoveries 23.75 15.50
(d) Job works 1,827.93 2,742.65
46,710.86 50,016.02
Sale of Services
(a) Contract technical services 885.18 128.77
(b) Clinical trial services - 5.83
(c) Process development charges 212.13 187.07
(d) Formulation development charges 783.72 746.28
(e) Royalty services 1,360.35 1,001.52
3,241.38 2,069.48
Total 49,952.24 52,085.50
19 OTHER INCOME
Particulars For the year ended 31st March, 2016
For the year ended
31st March, 2015
Interest Income on
Bank deposits 227.56 218.45
Others 20.35 15.40
Dividend Income on Current Investments 50.34 569.87
Profit on sale of assets - 4.12
Gain on Sale of Investments 1,617.81 7.83
Forward contract gain 10.02 28.91
Miscellaneous Income 8.94 13.54
1,935.02 858.12
18 REVENUE FROM OPERATIONS (contd...)
20 COST OF MATERIALS CONSUMED
Particulars For the year ended 31st March, 2016
For the year ended
31st March, 2015
Raw Materials
Opening Stock 2,996.25 2,447.42
Purchases 16,378.91 17,961.82
Less: Closing Stock 1,906.17 2,996.25
17,468.99 17,412.99
Packing Materials
Opening Stock 224.95 37.71
Purchases 318.43 499.03
Less: Closing Stock 167.00 224.95
376.38 311.79
Total 17,845.37 17,724.78
NOTES TO THE CONSOLIDATED FINANCIAL STATEMENTS(All amounts in lakhs in Indian Rupees, unless otherwise stated)
113ANNUAL REPORT
2015/16SUVENLIFE SCIENCES LIMITED

21 (INCREASE)/ DECREASE IN INVENTORIES OF WORK-IN-PROGRESS AND FINISHED GOODS
Particulars For the year ended 31st March, 2016
For the year ended
31st March, 2015
Inventories at the end of the year
Work-in-progress 2,284.76 1,857.20
Finished Goods 3,427.25 2,649.60
5,712.01 4,506.80
Inventories at the beginning of the year
Work-in-progress 1,857.20 2,230.61
Finished Goods 2,649.60 2,624.14
4,506.80 4,854.75
(Increase)/ decrease in inventories (1,205.21) 347.95
Details of Raw Materials consumed:
Particulars For the year ended 31st March, 2016 For the year ended 31st March, 2015
Quantity (KGs) Amount Quantity (KGs) Amount
(a) 3- Isochromanone 820,674 8,315.02 775,437 8,069.16
(b) Methanol 3,361,758 951.46 2,929,178 874.73
(c) Caustic Soda Lye 5,536,477 820.26 4,957,678 706.53
(d) Others - 7,382.25 - 7,762.57
Total 17,468.99 17,412.99
Details of inventories
Particulars For the year ended 31st March, 2016 For the year ended 31st March, 2015
Quantity (KGs) Amount Quantity (KGs) Amount
(a) 3- Isochromanone 30,164 189.41 114,505 1,106.81
(b) 2-Amino-5-Chloro-2-Fluorobenzophenone 3,100 102.70 2,250 65.45
(c) Chloro Acetaldehyde Dimethyl Acetal 11,714 76.84 7,366 53.78
(d) Others - 1,537.22 - 1,770.21
Total 1,906.17 2,996.25
20 COST OF MATERIALS CONSUMED (contd...)
Break-up of Finished Goods
Particulars For the year ended 31st March, 2016 For the year ended 31st March, 2015
Quantity (MT) Amount Quantity (MT) Amount
(a) Bulk Drugs 2.32 41.29 3.42 61.88
(b) Intermediates 113.93 3,385.96 191.11 2,587.72
Total 116.25 3,427.25 194.53 2,649.60
NOTES TO THE CONSOLIDATED FINANCIAL STATEMENTS(All amounts in lakhs in Indian Rupees, unless otherwise stated)
C O N S O L I D A T E D F I N A N C I A L S E C T I O N
114

22 MANUFACTURING EXPENSES
Particulars For the year ended 31st March, 2016
For the year ended
31st March, 2015
Power & Fuel 2,932.44 2,804.31
Consumable Stores 70.56 74.71
Factory Upkeep Expenses 1,576.46 1,174.36
Environment Management Expenses 415.24 356.59
Safety Expenses 96.64 66.52
Quality Control Expenses 648.07 554.74
Repairs & Maintenance:
Buildings 194.83 93.73
Plant & Machinery 1,511.82 1,319.25
7,446.06 6,444.21
23 EMPLOYEES BENEFIT EXPENSE
Particulars For the year ended 31st March, 2016
For the year ended
31st March, 2015
Salary, Wages, Allowances & other Benefits 3,429.90 3,039.25
Contribution to Provident & other funds 374.55 304.61
Staff Welfare Expenses 359.14 307.31
4,163.59 3,651.17
Particulars Employers contribution debited to P&L A/c
For the year ended 31st March, 2016
For the year ended
31st March, 2015
Provident Fund 172.09 153.33
State Defined Contribution Plans
i. Employees’ State Insurance 19.07 22.74
ii. Employees’ Pension Scheme, 1995 97.90 73.98
In accordance with Accounting Standard 15 “Employees Benefits”, the Company has classified various benefits provided to employees as under:
I. Defined Contribution Plans and respective Contributions
Post-employment benefit plans a) Gratuity
Under the gratuity plan, every employee who has completed atleast five years of service gets a gratuity on departure @ 15 days of last drawn salary
for each completed year of service. The scheme is funded with an insurance company in the form of qualifying insurance policy.
The following tables summarise the components of net benefit expense recognised in the statement of profit and loss and the funded status and
amounts recognised in the balance sheet for the respective plan.
Statement of Profit & LossNet employee benefit expense recognised in the employee cost
Particulars For the year ended 31st March, 2016
For the year ended
31st March, 2015
Current service cost 34.37 28.01
Interest cost on benefit obligation 47.30 43.71
Expected return on plan assets (29.06) (23.34)
Net actuarial( gain) / loss recognised in the year 31.45 6.18
Net benefit expense 84.06 54.56
NOTES TO THE CONSOLIDATED FINANCIAL STATEMENTS(All amounts in lakhs in Indian Rupees, unless otherwise stated)
115ANNUAL REPORT
2015/16SUVENLIFE SCIENCES LIMITED
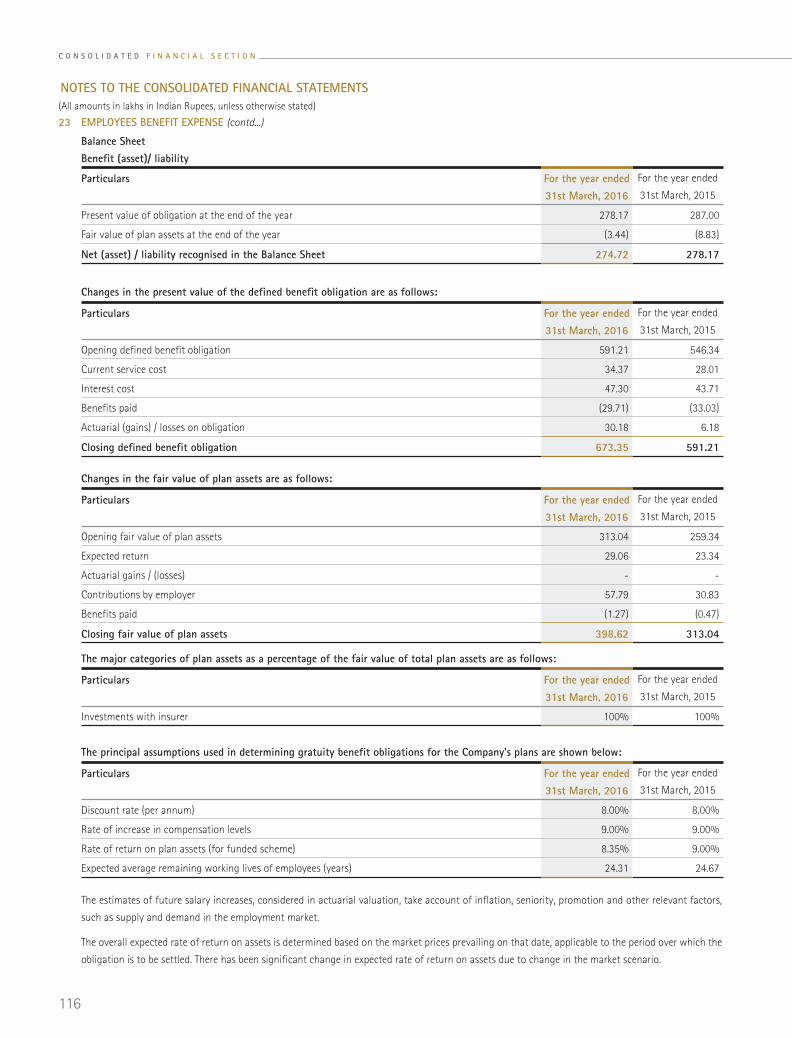
23 EMPLOYEES BENEFIT EXPENSE (contd...)
Changes in the present value of the defined benefit obligation are as follows:
Particulars For the year ended 31st March, 2016
For the year ended
31st March, 2015
Opening defined benefit obligation 591.21 546.34
Current service cost 34.37 28.01
Interest cost 47.30 43.71
Benefits paid (29.71) (33.03)
Actuarial (gains) / losses on obligation 30.18 6.18
Closing defined benefit obligation 673.35 591.21
Changes in the fair value of plan assets are as follows:
Particulars For the year ended 31st March, 2016
For the year ended
31st March, 2015
Opening fair value of plan assets 313.04 259.34
Expected return 29.06 23.34
Actuarial gains / (losses) - -
Contributions by employer 57.79 30.83
Benefits paid (1.27) (0.47)
Closing fair value of plan assets 398.62 313.04
Balance SheetBenefit (asset)/ liability
Particulars For the year ended 31st March, 2016
For the year ended
31st March, 2015
Present value of obligation at the end of the year 278.17 287.00
Fair value of plan assets at the end of the year (3.44) (8.83)
Net (asset) / liability recognised in the Balance Sheet 274.72 278.17
The major categories of plan assets as a percentage of the fair value of total plan assets are as follows:
Particulars For the year ended 31st March, 2016
For the year ended
31st March, 2015
Investments with insurer 100% 100%
The principal assumptions used in determining gratuity benefit obligations for the Company’s plans are shown below:
Particulars For the year ended 31st March, 2016
For the year ended
31st March, 2015
Discount rate (per annum) 8.00% 8.00%
Rate of increase in compensation levels 9.00% 9.00%
Rate of return on plan assets (for funded scheme) 8.35% 9.00%
Expected average remaining working lives of employees (years) 24.31 24.67
The estimates of future salary increases, considered in actuarial valuation, take account of inflation, seniority, promotion and other relevant factors,
such as supply and demand in the employment market.
The overall expected rate of return on assets is determined based on the market prices prevailing on that date, applicable to the period over which the
obligation is to be settled. There has been significant change in expected rate of return on assets due to change in the market scenario.
NOTES TO THE CONSOLIDATED FINANCIAL STATEMENTS(All amounts in lakhs in Indian Rupees, unless otherwise stated)
C O N S O L I D A T E D F I N A N C I A L S E C T I O N
116

23 EMPLOYEES BENEFIT EXPENSE (contd...)
Amounts for the current and previous four periods are as follows:
Particulars For the year ended 31st March, 2016
For the year ended
31st March, 2015
For the year ended
31st March, 2014
For the year ended
31st March, 2013
For the year ended
31st March, 2012
Defined benefit obligation 673.35 591.21 546.34 507.90 468.77
Plan assets 398.62 313.04 259.34 214.95 167.88
Surplus / (deficit) (274.73) (278.17) (287.00) (292.95) (300.89)
b) Other Employee Benefit Plan The liability for Leave Encashment as at the year end is ` 239.27 Lakhs (previous year ` 311.56 Lakhs ) and the assumptions are as same as above.
24 RESEARCH & DEVELOPMENT EXPENSES
Particulars For the year ended 31st March, 2016
For the year ended
31st March, 2015
R & D Salaries 1,368.78 1,193.17
R & D Materials 695.84 586.76
Patent Related Expenses 742.00 460.66
Lab Maintenance 1,016.86 807.49
R & D Other Expenses 4,566.10 1,304.55
Depreciation 723.25 1,243.63
9,112.83 5,596.26
25 FINANCE COST
Particulars For the year ended 31st March, 2016
For the year ended
31st March, 2015
Interest 361.00 286.05
Bank Charges 181.11 184.87
542.11 470.92
NOTES TO THE CONSOLIDATED FINANCIAL STATEMENTS(All amounts in lakhs in Indian Rupees, unless otherwise stated)
117ANNUAL REPORT
2015/16SUVENLIFE SCIENCES LIMITED

26 OTHER EXPENSES
Particulars For the year ended 31st March, 2016
For the year ended
31st March, 2015
Administrative & Other Expenses
Rent 73.62 79.60
Rates & Taxes 24.96 10.06
Service Tax 24.67 10.88
Insurance 180.26 163.53
Communication Charges 100.33 76.25
Travelling & Conveyance 513.69 351.91
Printing & Stationery 108.99 89.79
Vehicle Maintenance 23.57 39.13
Professional Charges 287.50 356.07
Payments to Auditors :
As Auditors 12.00 10.00
As Tax Audit Fee 2.50 2.50
For Other Services 1.00 1.00
For Reimburesement of expenses 0.25 0.12
Security Charges 165.77 133.50
Donations 2.32 2.70
Repairs & Maintenance 46.73 49.97
Loss on Foreign Exchange Fluctuations 12.60 26.75
Bad Debts Written off 8.25 -
Loss due to discarded asset 32.15 -
Corporate Social Responsbility 133.01 126.24
QIP Expenses to the extent written off 484.68 121.17
General Expenses 175.18 202.58
2,414.03 1,853.75
Selling Expenses
Sales Promotion 241.06 164.85
Clearing & Forwarding 276.46 243.79
Commission on Sales 155.31 108.77
672.83 517.41
Clinical project expenses - 4.13
- 4.13
Total 3,086.86 2,375.29
27 EARNINGS PER SHARE
Particulars For the year ended 31st March, 2016
For the year ended
31st March, 2015
Net Profit after tax available for Equity shareholders 6,673.85 10,875.03
Weighted average of number of Equity shares outstanding during the year 1,272.83 1,202.37
Basic Earnings per Equity share (`1/- Face Value) 5.24 9.04
NOTES TO THE CONSOLIDATED FINANCIAL STATEMENTS(All amounts in lakhs in Indian Rupees, unless otherwise stated)
C O N S O L I D A T E D F I N A N C I A L S E C T I O N
118

28 CONTINGENT LIABILITIES
Particulars For the year ended 31st March, 2016
For the year ended
31st March, 2015
Income tax appeal for Asst.year 2011-12 7.64 7.64
Income tax appeal for Asst.year 2012-13 20.94 20.94
Letter of Credit for Imports 649.69 1,207.21
33 EMPLOYEE STOCK OPTION SCHEME
Particulars For the year ended 31st March, 2016
For the year ended
31st March, 2015
Options outstanding at the beginning of the year 700,000 700,000
Add : Granted during the year - -
700,000 700,000
Less: Lapsed during the year 50,000 -
Converted into equity shares - -
650,000 700,000
29 COMMITMENTS
Particulars For the year ended 31st March, 2016
For the year ended
31st March, 2015
Estimated amount of contracts remaining to be executed on capital account 125.97 609.07
Forward Foreign Exchange Contracts - 1,133.47
30 During the year Unclaimed Dividend pertaining to 2007-08 amounting to ` 3.01 Lakhs has been transferred to Investor Education and Protection Fund.
There are no amounts due and outstanding to be credited to the Investor Education and Protection Fund as of 31st March 2016 (Previous year:Nil)
31 Based on information available with the Company, no creditors have been identified as Micro and Small enterprises with in the meaning of "Micro,
Small and Medium enterprises development (MSMED) Act ,2006".
34 Excise Duty amounting to ` 9.54 Lakhs on Closing Stock of finished goods has been provided during the year to comply with ' Guidance Note on
Accounting treatment for Excise duty' issued by Institute of Chartered Accountants of India.
32 MANAGERIAL REMUNERATION
Particulars Chariman & CEO Whole-time Director
For the year ended 31st March, 2016
For the year ended
31st March, 2015
For the year ended 31st March, 2016
For the year ended
31st March, 2015
Salary & Allowances 191.25 145.00 95.62 69.00
Commission 127.10 157.51 63.55 78.75
Contribution to Provident Fund 22.95 17.40 11.48 8.28
Perquisites 12.50 - 6.25 -
Total 353.80 319.91 176.90 156.03
NOTES TO THE CONSOLIDATED FINANCIAL STATEMENTS(All amounts in lakhs in Indian Rupees, unless otherwise stated)
119ANNUAL REPORT
2015/16SUVENLIFE SCIENCES LIMITED
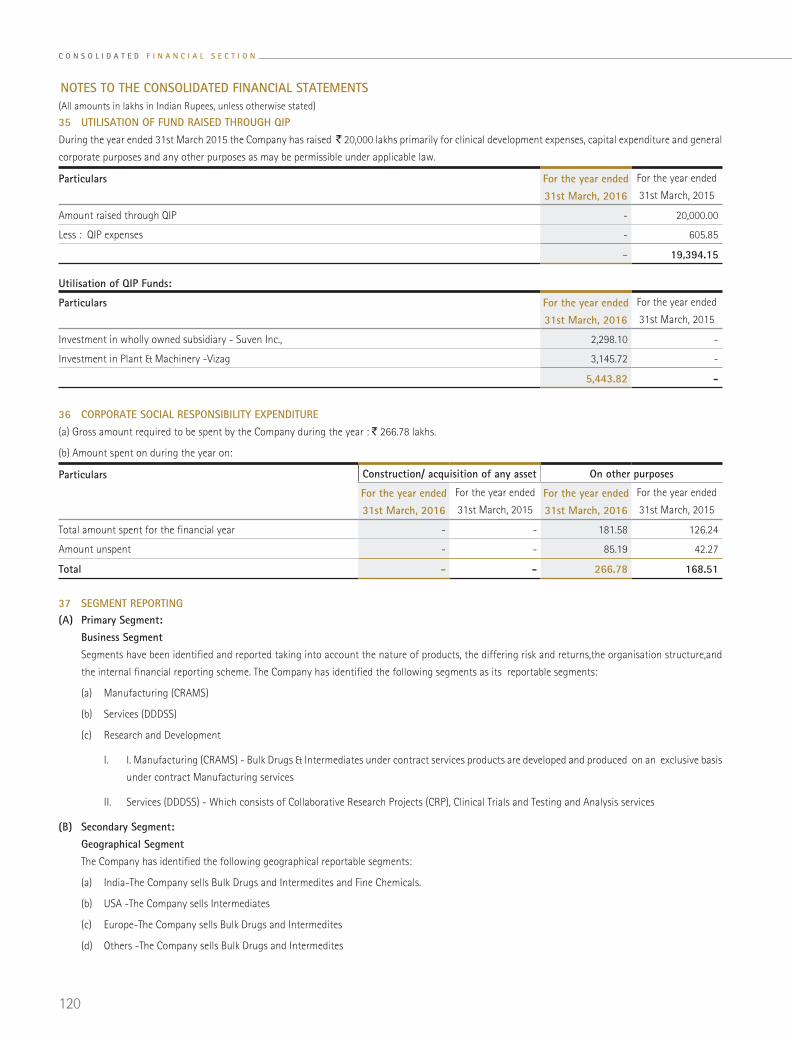
Particulars For the year ended 31st March, 2016
For the year ended
31st March, 2015
Amount raised through QIP - 20,000.00
Less : QIP expenses - 605.85
- 19,394.15
35 UTILISATION OF FUND RAISED THROUGH QIPDuring the year ended 31st March 2015 the Company has raised ̀ 20,000 lakhs primarily for clinical development expenses, capital expenditure and general
corporate purposes and any other purposes as may be permissible under applicable law.
37 SEGMENT REPORTING(A) Primary Segment: Business Segment Segments have been identified and reported taking into account the nature of products, the differing risk and returns,the organisation structure,and
the internal financial reporting scheme. The Company has identified the following segments as its reportable segments:
(a) Manufacturing (CRAMS)
(b) Services (DDDSS)
(c) Research and Development
I. I. Manufacturing (CRAMS) - Bulk Drugs & Intermediates under contract services products are developed and produced on an exclusive basis
under contract Manufacturing services
II. Services (DDDSS) - Which consists of Collaborative Research Projects (CRP), Clinical Trials and Testing and Analysis services
(B) Secondary Segment: Geographical Segment The Company has identified the following geographical reportable segments:
(a) India-The Company sells Bulk Drugs and Intermedites and Fine Chemicals.
(b) USA -The Company sells Intermediates
(c) Europe-The Company sells Bulk Drugs and Intermedites
(d) Others -The Company sells Bulk Drugs and Intermedites
Particulars For the year ended 31st March, 2016
For the year ended
31st March, 2015
Investment in wholly owned subsidiary - Suven Inc., 2,298.10 -
Investment in Plant & Machinery -Vizag 3,145.72 -
5,443.82 -
Utilisation of QIP Funds:
36 CORPORATE SOCIAL RESPONSIBILITY EXPENDITURE(a) Gross amount required to be spent by the Company during the year : ` 266.78 lakhs.
(b) Amount spent on during the year on:
Particulars Construction/ acquisition of any asset On other purposes
For the year ended 31st March, 2016
For the year ended
31st March, 2015
For the year ended 31st March, 2016
For the year ended
31st March, 2015
Total amount spent for the financial year - - 181.58 126.24
Amount unspent - - 85.19 42.27
Total - - 266.78 168.51
NOTES TO THE CONSOLIDATED FINANCIAL STATEMENTS(All amounts in lakhs in Indian Rupees, unless otherwise stated)
C O N S O L I D A T E D F I N A N C I A L S E C T I O N
120
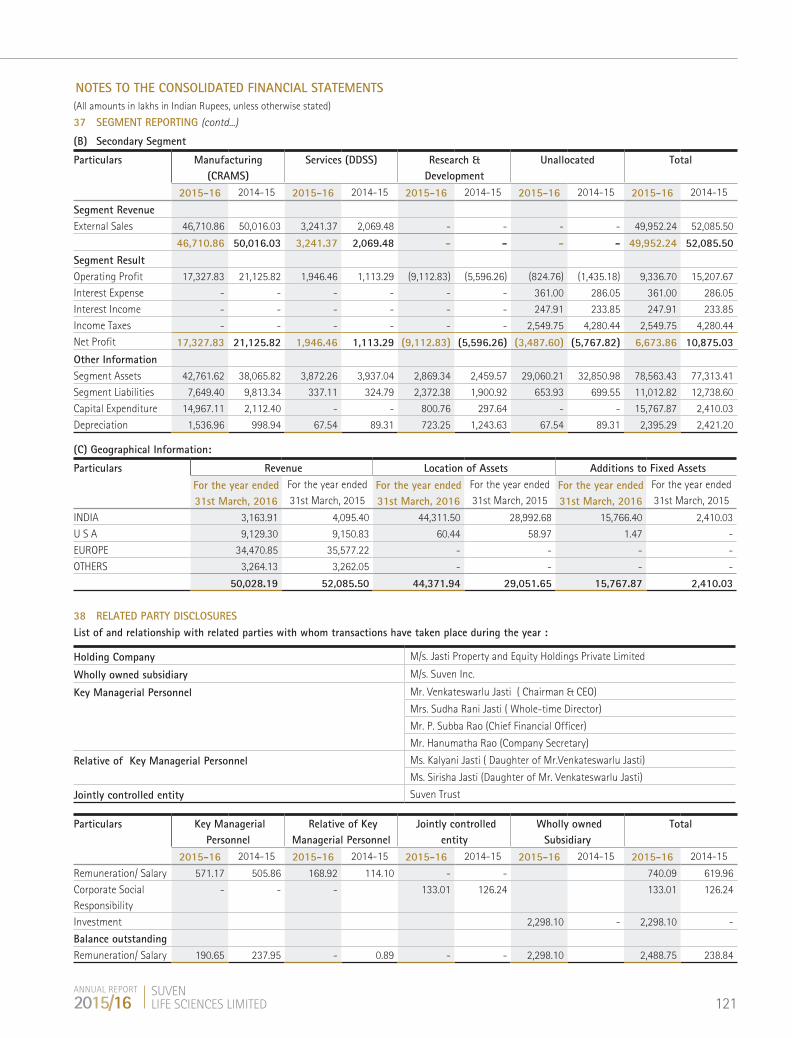
37 SEGMENT REPORTING (contd...)
(B) Secondary Segment
Particulars Manufacturing (CRAMS)
Services (DDSS) Research & Development
Unallocated Total
2015-16 2014-15 2015-16 2014-15 2015-16 2014-15 2015-16 2014-15 2015-16 2014-15
Segment RevenueExternal Sales 46,710.86 50,016.03 3,241.37 2,069.48 - - - - 49,952.24 52,085.50
46,710.86 50,016.03 3,241.37 2,069.48 - - - - 49,952.24 52,085.50 Segment ResultOperating Profit 17,327.83 21,125.82 1,946.46 1,113.29 (9,112.83) (5,596.26) (824.76) (1,435.18) 9,336.70 15,207.67
Interest Expense - - - - - - 361.00 286.05 361.00 286.05
Interest Income - - - - - - 247.91 233.85 247.91 233.85
Income Taxes - - - - - - 2,549.75 4,280.44 2,549.75 4,280.44
Net Profit 17,327.83 21,125.82 1,946.46 1,113.29 (9,112.83) (5,596.26) (3,487.60) (5,767.82) 6,673.86 10,875.03 Other InformationSegment Assets 42,761.62 38,065.82 3,872.26 3,937.04 2,869.34 2,459.57 29,060.21 32,850.98 78,563.43 77,313.41
Segment Liabilities 7,649.40 9,813.34 337.11 324.79 2,372.38 1,900.92 653.93 699.55 11,012.82 12,738.60
Capital Expenditure 14,967.11 2,112.40 - - 800.76 297.64 - - 15,767.87 2,410.03
Depreciation 1,536.96 998.94 67.54 89.31 723.25 1,243.63 67.54 89.31 2,395.29 2,421.20
(C) Geographical Information:
Particulars Revenue Location of Assets Additions to Fixed AssetsFor the year ended 31st March, 2016
For the year ended 31st March, 2015
For the year ended 31st March, 2016
For the year ended 31st March, 2015
For the year ended 31st March, 2016
For the year ended 31st March, 2015
INDIA 3,163.91 4,095.40 44,311.50 28,992.68 15,766.40 2,410.03
U S A 9,129.30 9,150.83 60.44 58.97 1.47 -
EUROPE 34,470.85 35,577.22 - - - -
OTHERS 3,264.13 3,262.05 - - - -
50,028.19 52,085.50 44,371.94 29,051.65 15,767.87 2,410.03
38 RELATED PARTY DISCLOSURESList of and relationship with related parties with whom transactions have taken place during the year :
Holding Company M/s. Jasti Property and Equity Holdings Private Limited
Wholly owned subsidiary M/s. Suven Inc.
Key Managerial Personnel Mr. Venkateswarlu Jasti ( Chairman & CEO)
Mrs. Sudha Rani Jasti ( Whole-time Director)
Mr. P. Subba Rao (Chief Financial Officer)
Mr. Hanumatha Rao (Company Secretary)
Relative of Key Managerial Personnel Ms. Kalyani Jasti ( Daughter of Mr.Venkateswarlu Jasti)
Ms. Sirisha Jasti (Daughter of Mr. Venkateswarlu Jasti)
Jointly controlled entity Suven Trust
Particulars Key Managerial Personnel
Relative of Key Managerial Personnel
Jointly controlled entity
Wholly owned Subsidiary
Total
2015-16 2014-15 2015-16 2014-15 2015-16 2014-15 2015-16 2014-15 2015-16 2014-15
Remuneration/ Salary 571.17 505.86 168.92 114.10 - - 740.09 619.96
Corporate Social Responsibility
- - - 133.01 126.24 133.01 126.24
Investment 2,298.10 - 2,298.10 -
Balance outstandingRemuneration/ Salary 190.65 237.95 - 0.89 - - 2,298.10 2,488.75 238.84
NOTES TO THE CONSOLIDATED FINANCIAL STATEMENTS(All amounts in lakhs in Indian Rupees, unless otherwise stated)
121ANNUAL REPORT
2015/16SUVENLIFE SCIENCES LIMITED

39 VALUE OF IMPORTS ON C I F BASIS
Particulars For the year ended 31st March, 2016
For the year ended
31st March, 2015
Raw Materials 5,053.75 5,030.38
Packing Materials 12.01 241.19
Components and Spare Parts 805.95 332.84
Capital Equipment 236.53 420.25
6,108.24 6,024.66
40 EXPENDITURE IN FOREIGN CURRENCY
Particulars For the year ended 31st March, 2016
For the year ended
31st March, 2015
Travel 155.49 73.99
Dividend 70.19 105.20
Sales Commission 147.21 103.85
Foreign Branch Expenses 599.56 488.87
Research & Development Expenses 2,270.33 1,652.91
3,242.78 2,424.82
41 VALUE OF IMPORTED AND INDIGENEOUS RAW MATERIALS, STORES AND SPARES CONSUMED AND PERCENTAGE OF EACH TO TOTAL CONSUMPTION
Particulars For the year ended 31st March, 2016 For the year ended 31st March, 2015
Value % to Total Value % to Total
Raw Materials
Imported 3,564.71 20.41% 2,003.52 11.51%
Indigenous 13,904.28 79.59% 15,409.47 88.49%
Total 17,468.99 100.00% 17,412.99 100.00%
Packing Materials
Imported 71.29 18.94% 164.85 52.87%
Indigenous 305.09 81.06% 146.94 47.13%
Total 376.38 100.00% 311.79 100.00%
Stores and Spares
Imported 805.94 46.90% 332.84 27.59%
Indigenous 912.58 53.10% 873.67 72.41%
Total 1,718.52 100.00% 1,206.51 100.00%
42 DIVIDEND REMITTANCES IN FOREIGN CURRENCY
Year of remittance On account of Financial Year
Number of non-resident shareholders
No. of shares held Amount of dividend
2015/2016 2014/2015 5 3,509,388 70.19
2014/2015 2013/2014 7 4,207,900 105.20
43 EARNINGS IN FOREIGN CURRENCY
Particulars For the year ended 31st March, 2016
For the year ended
31st March, 2015
FOB Value of Exports 43,704.54 45,898.47
Royalty and Other Services 2,960.15 1,895.11
46,664.69 47,793.58
NOTES TO THE CONSOLIDATED FINANCIAL STATEMENTS(All amounts in lakhs in Indian Rupees, unless otherwise stated)
C O N S O L I D A T E D F I N A N C I A L S E C T I O N
122

45 Previous year figures have been regrouped and reclassified wherever considered necessary to conform to this year's classifications.
As per our report of even date for and on behalf of the Board of Directors of
for KARVY & CO. SUVEN LIFE SCIENCES LIMITEDChartered Accountants
Firm registration number: 001757S
SANJEEV KUMAR SREEPATHI VENKATESWARLU JASTIPartner Chairman & CEO
Membership No. 209145 DIN: 00278028
P. SUBBA RAO K. HANUMANTHA RAOPlace: Hyderabad Chief Financial Officer Company Secretary
Date: 27th May, 2016 Membership No. A11342 Membership No. A11599
Salient features of financial statements of subsidiary/associates as per the Companies Act, 2013.
Name of the subsidiary : Suven Inc.
Reporting currency : USD
Share capital : USD 3,430,000
Reserves & surplus : USD ( 4,213,611)
Total assets : USD 105,442
Total liabilities : USD 889,053
Investments : Nil
Turnover / Total Income : Nil
Profit/(loss) before taxation : USD (4,213,611)
Provision for Taxation : Nil
Profit/ (loss) after taxation : USD (4,213,611)
Proposed dividend : Nil
% of share holding : 100%
44 Additional information, as required under Schedule III to the Companies Act, 2013, of enterprises consolidated as subsidiary/Associates
Name of the entity Net Assets, i.e., total assets minus total liabilities
Share in profit or loss
As % of consolidated net assets
Amount As % of consolidated profit or loss
Amount
Parent
Suven Life Sciences Ltd. 105% 62,364.41 14% 949.68
Subsidiaries:
Suven Inc. -1% (520.66) -42% (2,823.12)
Minority Interests in all subsidiaries - - - -
NOTES TO THE CONSOLIDATED FINANCIAL STATEMENTS(All amounts in lakhs in Indian Rupees, unless otherwise stated)
123ANNUAL REPORT
2015/16SUVENLIFE SCIENCES LIMITED
Notes
C O N S O L I D A T E D F I N A N C I A L S E C T I O N
124

Notes
125ANNUAL REPORT
2015/16SUVENLIFE SCIENCES LIMITED
Notes
C O N S O L I D A T E D F I N A N C I A L S E C T I O N
126

Notes
127ANNUAL REPORT
2015/16SUVENLIFE SCIENCES LIMITED

Notes
C O N S O L I D A T E D F I N A N C I A L S E C T I O N
128

Corporate InformationBoard of Directors Shri Venkateswarlu Jasti Chairman & CEO
Smt Sudha Rani Jasti Whole-time Director
Dr M R Naidu Director
Dr K V Raghavan Director
Shri D G Prasad Director
Prof Seyed E Hasnain Director
Shri M Gopalakrishna, IAS (Retd.) Director
Chief Financial OfficerCMA P Subba Rao
Company SecretaryCS K Hanumantha Rao
Statutory AuditorsKarvy & Co.,Chartered Accountants
No.2, Bhooma Plaza, Street No.4
Avenue 7, Banjara Hills, Hyderabad - 500 034
Secretarial AuditorsDVM Gopal & AssociatesCompany Secretaries
# 6/3/154-159, Flat No. 303, 3rd Floor,
Royal Majestic, Prem Nagar Colony, Hyderabad – 500 004
Internal AuditorsVemulapalli & Co.,Chartered Accountants
H. No. 14–1–90/435, Sai Dwarakamai, 1st Floor, Gayatri Nagar Colony,
Allapur, Borabanda, Hyderabad – 500 038
Registrars & Share Transfer AgentsKarvy Computershare Pvt. Ltd.Karvy Selenium, Tower B, Plot 31-32,
Gachibowli, Financial District,
Nanakramguda, Hyderabad - 500 032
BankersState Bank of India
Bank of Bahrain & Kuwait
Research and Development Centre(s)Research Centre – IPlot No.18, Phase III, IDA Jeedimetla,
Hyderabad, Telangana – 500 055
Research Centre - IIBio-Pharmaceutical Lab
Plot No(s). 267- 268, IDA Pashamylaram,
Medak Dist. Telangana – 502 307
Research Centre - IIIFormulation Development Centre
Plot No(s). 265 to 268, APIIC, IDA
Pashamylaram, Medak Dist, Telangana–502 307
Manufacturing FacilitiesUnit – 1: Dasaigudem (V), Suryapet (M)
Nalgonda Dist, Telangana – 508 213
Unit – 2: Plot No.18, Phase III, IDA
Jeedimetla, Hyderabad, Telangana – 500 055
Unit – 3: Plot No(s). 262- 264 & 269 – 271, IDA,
Pashamylaram, Medak Dist. Telangana – 502 307
Unit – 4: Plot No(s). 65 – 67, JN Pharmacity,
Parwada, Visakhapatnam, Andhra Pradesh – 531 019
Registered Office# 8-2-334 I SDE Serene Chambers I 6th Floor I Road No.5 I Avenue 7 I Banjara Hills
Hyderabad – 500 034 I Telangana I India I CIN: L24110TG1989PLC009713
Tel: 91 40 2354 1142/ 3311/ 3315, Fax: 91 40 2354 1152, Email: [email protected], website: www.suven.com
A PRODUCT
SUVEN LIFE SCIENCES LIMITED. RESEARCH-FOCUSED PHARMACEUTICAL PLAYER. WORKING COLLABORATIVELY WITH GLOBAL INNOVATOR COMPANIES.
STRENGTHENING ITS BUSINESS; ENHANCING NATIONAL RESPECT; HELPING MANKIND COUNTER DISEASE.
CONTENTS06 - ABOUT SUVEN | 08 - WHAT SUVEN ACHIEVED IN 2015-16 | 10 - 10 MINUTES WITH THE CHAIRMAN | 14 - OPERATIONAL OVERVIEW | 16 - MANAGEMENT DISCUSSION AND ANALYSIS | 24 - BOARD’S REPORT | 52 - REPORT ON CORPORATE GOVERNANCE | 65 - STANDALONE FINANCIAL SECTION | 95 - CONSOLIDATED FINANCIAL SECTION
CAUTIONARY STATEMENTIn this Annual Report, we have disclosed forward-looking information to enable investors to comprehend our prospects and take informed investment decisions. This report and other statements - written and oral - that we periodically make contain forward-looking statements that set out anticipated results based on the management’s plans and assumptions. We have tried, wherever possible, to identify such statements by using words such as ‘anticipates’, ‘estimates’, ‘expects’, ‘projects’, ‘intends’, ‘plans’, ‘believes’, and words of similar substance in connection with any discussion of future performance.
We cannot guarantee that these forward-looking statements will be realised, although we believe we have been prudent in assumptions. The achievement of results is subject to risks, uncertainties and even
inaccurate assumptions. Should known or unknown risks or uncertainties materialise, or should underlying assumptions prove inaccurate, actual results could vary materially from those anticipated, estimated or projected. Readers should bear this in mind.
We undertake no obligation to publicly update any forward-looking statements, whether as a result of new information, future events or otherwise.

PUTTING IT ALLTOGETHER
SUVEN LIFE SCIENCES LIMITED
27TH ANNUAL REPORT 2015-16
CIN: L24110TG1989PLC009713 SDE SERENE CHAMBERS, ROAD NO. 5, AVENUE 7, BANJARA HILLS, HYDERABAD - 500034
SUVEN LIFE SCIENCES LIMITED 27TH ANNUAL REPORT