sustaining the wet tropics - james cook university
TRANSCRIPT


SUSTAINING THE WET TROPICS:
A REGIONAL PLAN FOR NATURAL RESOURCE MANAGEMENT
VOLUME 2B CONDITION REPORT: SUSTAINABLE USE
J. Armour1, L. Cogle1, V. Rasiah1 and J. Russell2
1Department of Natural Resources and Mines, Mareeba 2Northern Fisheries Centre, Cairns
Established and supported under the Australian Cooperative Research Centres Program

© Cooperative Research Centre for Tropical Rainforest Ecology and Management, and FNQ NRM Ltd. ISBN 0 86443 712 9 This work is copyright. The Copyright Act 1968 permits fair dealing for study, research, news reporting, criticism or review. Selected passages, tables or diagrams may be reproduced for such purposes provided acknowledgment of the source is included. Major extracts of the entire document may not be reproduced by any process without written permission of either the Chief Executive Officer, Cooperative Research Centre for Tropical Rainforest Ecology and Management, or Executive Officer, FNQ NRM Ltd. Published by the Cooperative Research Centre for Tropical Rainforest Ecology and Management. Further copies may be obtained from FNQ NRM Ltd, PO Box 1756, Innisfail, QLD, Australia, 4860. This publication should be cited as: Armour, J., Cogle, L., Rasiah, V., and Russell, J. (2004), Sustaining the Wet Tropics: A Regional Plan for Natural Resource Management, Volume 2B Condition Report: Sustainable Use. Rainforest CRC and FNQ NRM Ltd, Cairns (115 pp). January 2004 Cover Photos: Top: Richard Pearson Centre: Great Barrier Reef
Marine Park Authority Bottom: Richard Pearson

CONDITION REPORT: SUSTAINABLE USE i
PREFACE
Managing natural resources for sustainability and ecosystem health is an obligation of stakeholders at all levels. At the State and Commonwealth government level, there has been a shift over the last few years from the old project-based approach to strategic investment at a regional scale. To oversee this investment, regional natural resource management (NRM) bodies have been established across Queensland and Australia. The new NRM Board for the Wet Tropics region, FNQ NRM Ltd, was appointed in late 2003. The aim of this community-based Board is to take the Wet Tropics to the forefront of conservation and sustainable use of natural resources through strengthened community participation. One of the first tasks of the new Board is the preparation of a new NRM Plan for the Wet Tropics to strategically focus investment while incorporating the outcomes of previous planning in the region. At a high-level regional science meeting held in November 2002, it was agreed that the Plan should be based on a clear documentation of the state of resources in the region. While there is a wealth of research publications on the region, there has been no synthesis of this material into a document for the consultation and plan preparation processes. This is the purpose of the current report. The information in this report deals with the second of the three overarching objectives that will direct decision-making under the extension of the NHT Program, namely sustainable use of natural resources. It is the third of a series of documents that will be co-produced as supporting information to the Plan (see introduction to this report). The principal authors of this report were John Armour, Lex Cogle and Velu Rasiah from the Land and Water Science Group, NR&M, Mareeba and John Russell from the Northern Fisheries Centre, DPI, Cairns. The authors wish to acknowledge the contribution made by others, including those who reviewed the document as organisational representatives. The Commonwealth and State governments should also be thanked for their support through the NHT Program extension. This report is designed to be used by planners and decision-makers involved in the development of the Wet Tropics NRM Plan. It should also be of use to others involved in NRM in the private sector and at the local, State and Commonwealth government levels. Indigenous and community groups, students and the public generally should also find the report, and those that follow, a valuable resource. I take pleasure in presenting it to the regional community.
Mike Berwick Chair, FNQ NRM Ltd

ii SUSTAINING THE WET TROPICS: A REGIONAL PLAN FOR NRM
TABLE OF CONTENTS
PREFACE....................................................................................................................... I LIST OF TABLES ........................................................................................................ V LIST OF ACRONYMS .............................................................................................. VI 1. INTRODUCTION.................................................................................................1
1.1. THIS REPORT...............................................................................................1 1.2. SUSTAINABLE USE – WHAT IS IT? .........................................................1 1.3. AIMS OF THE REPORT ...............................................................................1 1.4. REPORT FRAMEWORK..............................................................................2 1.5. REPORT PREPARATION ............................................................................2 1.6. DATA ACQUISITION ..................................................................................2
2. WATER HEALTH (INCLUDING SURFACE WATER, GROUND WATER AND WETLANDS) ...............................................................................................3
2.1. QUALITY ......................................................................................................3 2.1.1. DEFINITION.........................................................................................3 2.1.2. CONDITIONS, TRENDS AND CURRENT STATE OF
KNOWLEDGE......................................................................................5 2.1.3. CRITICAL ISSUES, IMPACTS AND THREATS .............................15 2.1.4. CURRENT STATE OF UNDERSTANDING ....................................16 2.1.5. ACTIONS FOR SUSTAINABLE USE...............................................17 2.1.6. INSTITUTIONAL ARRANGEMENTS .............................................17
2.2. QUANTITY .................................................................................................18 2.2.1. DEFINITION.......................................................................................18 2.2.2 CONDITION, TRENDS AND CURRENT STATE OF KNOWLEDGE
.............................................................................................................18 2.2.3. CRITICAL ISSUES, IMPACTS AND THREATS .............................22 2.2.4. CURRENT STATE OF UNDERSTANDING ....................................23 2.2.5. POTENTIAL ACTIONS FOR SUSTAINABLE USE........................23 2.2.6. INSTITUTIONAL AND ADMINISTRATIVE ARRANGEMENTS.24
3. SOIL HEALTH ...................................................................................................26 3.1. ACIDIFICATION ........................................................................................26
3.1.1. DEFINITION.......................................................................................26 3.1.2. CONDITION, TRENDS AND CURRENT STATE OF KNOWLEDGE
.............................................................................................................27 3.1.3. CRITICAL ISSUES, IMPACTS AND THREATS .............................29 3.1.4. CURRENT STATE OF UNDERSTANDING ....................................29 3.1.5. POTENTIAL ACTIONS FOR SUSTAINABLE USE........................29
3.2. ACID SULFATE SOILS..............................................................................30 3.2.1. DEFINITION.......................................................................................30 3.2.2. CONDITION, TRENDS AND CURRENT STATE OF KNOWLEDGE
.............................................................................................................30 3.2.3. CRITICAL ISSUES, IMPACTS AND THREATS .............................31 3.2.4. CURRENT STATE OF UNDERSTANDING ....................................32 3.2.5. POTENTIAL ACTIONS FOR SUSTAINABLE USE........................32 3.2.6. INSTITUTIONAL AND ADMINISTRATIVE ARRANANGEMENTS
.............................................................................................................33 3.3. SOIL EROSION (HILLSLOPE, GULLY, BANK) .....................................33
3.3.1. DEFINITION.......................................................................................33 3.3.2. CONDITION, TRENDS AND CURRENT STATE OF KNOWLEDGE
.............................................................................................................34 3.3.3. CRITICAL ISSUES, IMPACTS AND THREATS .............................35 3.3.4. CURRENT STATE OF UNDERSTANDING ....................................36 3.3.5. POTENTIAL ACTIONS FOR SUSTAINABLE USE........................36

CONDITION REPORT: SUSTAINABLE USE iii
3.4. SALINITY....................................................................................................39 3.4.1. DEFINITION.......................................................................................39 3.4.2. CONDITION, TRENDS AND CURRENT STATE OF KNOWLEDGE
.............................................................................................................39 3.4.3. CRITICAL ISSUES, IMPACTS AND THREATS .............................39 3.4.4 CURRENT STATE OF UNDERSTANDING ....................................40 3.4.5 POTENTIAL ACTIONS FOR SUSTAINABLE USE........................40
3.5 FERTILITY DECLINE (CHEMICAL, PHYSICAL, BIOLOGICAL IN SITU)............................................................................................................40
3.5.1 DEFINITION.......................................................................................40 3.5.2 CONDITION, TRENDS AND CURRENT STATE OF KNOWLEDGE
.............................................................................................................41 3.5.3 CRITICAL ISSUES, IMPACTS AND THREATS .............................43 3.5.4 CURRENT STATE OF UNDERSTANDING ....................................44 3.5.5 POTENTIAL ACTIONS FOR SUSTAINABLE USE........................45
3.6 URBAN ENCROACHMENT ON GQAL ...................................................45 3.6.1. DEFINITION.......................................................................................45 3.6.2. CONDITION, TRENDS AND CURRENT STATE OF KNOWLEDGE
.............................................................................................................45 3.6.3. CRITICAL ISSUES, IMPACTS AND THREATS .............................45
3.7. CARBON BALANCE..................................................................................46 3.7.1. DEFINITION.......................................................................................46 3.7.2. CONDITION, TRENDS AND CURRENT STATE OF KNOWLEDGE
.............................................................................................................46 3.7.3. CRITICAL ISSUES, IMPACTS AND THREATS .............................47 3.7.4. CURRENT STATE OF UNDERSTANDING (A GAP ANALYSIS) 48 3.7.5. POTENTIAL ACTIONS FOR SUSTAINABLE USE........................48 3.7.6. INSTITUTIONAL AND ADMINISTRATIVE ARRANGEMENTS.48
4. BIOLOGICAL HEALTH...................................................................................49 4.1. DISTURBANCES TO AQUATIC ECOLOGY...........................................49
4.1.1. DEFINITION.......................................................................................49 4.1.2. CONDITION, TRENDS AND CURRENT STATE OF KNOWLEDGE
.............................................................................................................49 4.1.3. CRITICAL ISSUES, IMPACTS AND THREATS .............................52 4.1.4. CURRENT STATE OF UNDERSTANDING (A GAP ANALYSIS OF
RESEARCH NEEDS) .........................................................................53 4.1.5. POTENTIAL ACTIONS FOR SUSTAINABLE USE........................54 4.1.6. INSTITUTIONAL AND ADMINISTRATIVE ARRANGEMENTS.54
4.2. PEST PLANTS AND ANIMALS................................................................55 4.2.1. PEST PLANTS....................................................................................56 4.2.2. PEST ANIMALS.................................................................................67 4.2.3. PEST INVERTEBRATES AND PEST DISEASES ...........................71
4.3. VEGETATION (TREE THICKENING, PASTURE DECLINE) ................73 4.3.1. CONDITION, TRENDS AND CURRENT STATE OF KNOWLEDGE
.............................................................................................................73 4.3.2. CRITICAL ISSUES, IMPACTS AND THREATS / CURRENT
STATE OF UNDERSTANDING........................................................73 4.3.3. POTENTIAL ACTIONS FOR SUSTAINABLE USE........................73 4.3.4. ADMINISTRATIVE ARRANGEMENTS..........................................73
5. FRESHWATER AND MARINE FISHERIES .................................................74 5.1. FISH HABITATS.........................................................................................74
5.1.1. DEFINITION.......................................................................................74 5.1.2. CONDITION, TRENDS AND CURRENT STATE OF KNOWLEDGE
.............................................................................................................74

iv SUSTAINING THE WET TROPICS: A REGIONAL PLAN FOR NRM
5.1.3. CRITICAL ISSUES, IMPACTS AND THREATS .............................75 5.1.4. CURRENT STATE OF UNDERSTANDING (GAP ANALYSIS OF
RESEARCH NEEDS) .........................................................................75 5.1.5. INSTITUTIONAL AND ADMINISTRATIVE ARRANGEMENTS.76
5.2. EXOTIC AND TRANSLOCATED FISH AND INVERTEBRATES.........76 5.2.1. DEFINITION.......................................................................................76 5.2.2. CONDITIONS, TRENDS AND CURRENT STATE OF
KNOWLEDGE....................................................................................77 5.2.3. CRITICAL ISSUES, IMPACTS AND THREATS .............................78 5.2.4. CURRENT STATE OF UNDERSTANDING (GAP ANALYSIS OF
RESEARCH NEEDS) .........................................................................80 5.2.5. POTENTIAL ACTIONS FOR SUSTAINABLE USE........................80 5.2.6. INSTITUTIONAL AND ADMINISTRATIVE ARRANGEMENTS.80
5.3. NETTING, TRAWLING AND LINE FISHING .........................................81 5.3.1. DEFINITION.......................................................................................81 5.3.2. CONDITIONS, TRENDS AND CURRENT STATE OF
KNOWLEDGE....................................................................................82 5.3.3. CRITICAL ISSUES, IMPACTS AND TRENDS ...............................82 5.3.4. CURRENT STATE OF UNDERSTANDING (GAP ANALYSIS OF
RESEARCH NEEDS) .........................................................................84 5.3.5. POTENTIAL ACTIONS FOR SUSTAINABLE USE........................84 5.3.6. INSTITUTIONAL AND ADMINISTRATIVE ARRANGEMENTS.85
5.4. AQUACULTURE ........................................................................................85 5.4.1. DEFINITION.......................................................................................85 5.4.2. CONDITION, TRENDS AND CURRENT STATE OF KNOWLEDGE
.............................................................................................................86 5.4.3. CRITICAL ISSUES, IMPACTS AND THREATS .............................87 5.4.4. CURRENT STATE OF UNDERSTANDING (GAP ANALYSIS OF
RESEARCH NEEDS) .........................................................................88 5.4.5. POTENTIAL ACTIONS FOR SUSTAINABLE USE........................89 5.4.6. INSTITUTIONAL AND ADMINISTRATIVE ARRANGEMENTS.89
6. REFERENCES....................................................................................................91

CONDITION REPORT: SUSTAINABLE USE v
LIST OF TABLES
Table 1: Common water quality issues affecting the environmental values of water and the associated pollutants. .......................................................... 4
Table 2: Some water quality indicators for different ecosystems................................. 4 Table 3: Fertiliser use for sugarcane in some areas for 2000. ...................................... 6 Table 4: Transport of N and P in runoff, bedload and leaching (with
ranges) from the common cropping systems and rainforest on Ferrosols in the Johnstone River catchment. ................................................. 7
Table 5: Estimates of relative contribution of N and P from different landuse categories to water quality in the GBR lagoon. ................................ 7
Table 6: Trigger values for N and P for different aquatic environments...................... 8 Table 7: Reference values for the oxides of N (Nox), total dissolved N and
P in near pristine streams in the Johnstone catchment................................... 8 Table 8: Total N concentrations (with ranges) recorded in some streams of
the Plan region. .............................................................................................. 8 Table 9: Groundwater nitrate-N (µg/L) in the major catchments of the Wet
Tropics. The numbers within parenthesis are ranges.................................. 12 Table 10: Most used pesticides in two sugar cane regions (t active
ingredient per year)...................................................................................... 14 Table 11: River pollution indices. ................................................................................ 15 Table 12: Risk, nitrogen and phosphorus discharge in the past, the present
and the proposed targets for selected catchments. ....................................... 16 Table 13: Stream runoff, numbers of gauging stations and groundwater
monitoring bores for water management areas in the Wet Tropics region........................................................................................................... 19
Table 14: Acid addition rates for north Queensland cropping systems. ....................... 27 Table 15: Percentage of surface soil samples within two pH categories and
estimated area of agricultural land for catchments based on data from commercial laboratories...................................................................... 28
Table 16: The percentage of surface soil above pH 5.6 within each time category with a low and high acid addition rate to decrease to a pH of 5.6 and estimated area. ...................................................................... 28
Table 17: Sediment exports, risk factors and sediment targets with estimates of the proportion of sediment attributable to hillslope, gully or stream bank erosion. .................................................................................... 36
Table 18: Diagnostic land limitation class for various crops on basaltic soils. ............ 39 Table 19: Median nutrient balances in t/Statistical Local Area for cropping,
pasture, horticulture, sugar cane. ................................................................. 42 Table 20: Determinants of the status of soil structure degradation in
Queensland cropping soils........................................................................... 43 Table 21: Numbers of naturalised exotic species. ........................................................ 55 Table 22: Prioritised list of wet and dry tropics weeds. ............................................... 59 Table 23: Ranked list of Wet Tropics environmental weeds of concern...................... 60 Table 24: Weeds, their impacts and some current/past work for agriculture
in the region................................................................................................. 63 Table 25: Pest plants identified under the Land (Pest and Stock Route
Management) Act 2002. .............................................................................. 65 Table 26: Pest animals identified under the Land (Pest and Stock Route
Management) Act 2002. .............................................................................. 70 Table 27: Critical issues associated with pest invertebrates for agriculture in
the region. .................................................................................................... 71 Table 28: Critical issues associated with pest diseases for agriculture in the
region........................................................................................................... 72

vi SUSTAINING THE WET TROPICS: A REGIONAL PLAN FOR NRM
LIST OF ACRONYMS
ACTFR Australian Centre for Tropical Freshwater Research ANZECC Australian and New Zealand Environment and Conservation Council ARMCANZ Agricultural and Resource Management Council of Australia and New Zealand AWRC Australian Water Resources Council BMP Best Management Practice BRD Bycatch Reduction Device BSES Bureau of Sugar Experiment Stations COAG Council of Australian Governments CPPB Certified Professional Public Buyer CRC Cooperative Research Centre CSIRO Commonwealth Scientific and Industrial Research Organisation DO Dissolved Oxygen DPA Dugong Protection Area DPI Queensland Department of Primary Industries EMS Environmental Management System EPA Queensland Environmental Protection Agency ER Enrichment Ratio GBR Great Barrier Reef GBRMPA Great Barrier Reef Marine Park Authority GCTB Green Cane Trash Blanket GHG Greenhouse Gases GQAL Good Quality Agricultural Land GVP Gross Value of Production GW Ground Water IPCC Intergovernmental Panel on Climate Change IWM Integrated Weed Management LGA Local Government Authority LWMP Land and Water Management Plans NATA National Association of Testing Authorities NCAS National Carbon Accounting System NLWRA National Land and Water Resources Audit NQWMS National Water Quality Management Strategy NRM Natural Resource Management NR&M Queensland Department of Natural Resources & Mines PMP Property Management Plan QFS Queensland Fisheries Service RIT River Improvement Trust ROP Resource Operations Plan RWUE Rural Water Use Efficiency SDR Sediment Delivery Ratio SLA Statistical Local Area TED Turtle Exclusion Device WONS Weeds of National Significance WQ Water Quality WRP Water Resource Plan

CONDITION REPORT: SUSTAINABLE USE 1
1. INTRODUCTION
1.1. THIS REPORT A new Natural Resource Management Plan (NRM Plan) is currently being prepared for the Wet Tropics region to meet new planning guidelines for community-based programs such as the Natural Heritage Trust (NHT). In the past, community-based programs such as Integrated Catchment Management and the NHT have been criticised for being ad hoc and not necessarily focused on strategic resource management priorities. They have also been criticised for being too bureaucratic for local people and not responsive enough to local issues and needs. Recent changes in NRM policy have addressed these criticisms and changed from a project-based approach to one that emphasises strategic investment at a regional scale. In particular, the extension of the NHT Program will have a clear emphasis on regional outcomes. Key elements of this new emphasis will be: • Regional empowerment and ownership through an integrated regional planning
approach to natural resource management; • Funding that will focus on the natural resource management outcomes to be
achieved; • Establishment of measurable and achievable resource condition and management
action targets; and • Actions based on sound science. This requires the best possible use of available data and scientific knowledge. At a high-level regional science meeting, held in late November 2002, it was agreed that the plan should be based on a clear documentation of the state of resources in the region. While there is a wealth of research publications on the region, there has been no synthesis of this material into a document for the consultation and plan preparation processes. This is the purpose of the current report. The information in this report deals with the second of the three overarching objectives that will direct decision-making under the extension of the NHT Program, namely sustainable use of natural resources. Companion reports will be produced for the other two overarching objectives: biodiversity conservation and community capacity building and institutional change. While every effort has been made to ensure the accuracy and reliability of information in this study, it is not intended to be a fully comprehensive, scientific review. 1.2. SUSTAINABLE USE – WHAT IS IT? The Natural Heritage Trust (NHT) describes Sustainable Use of Natural Resources as one of its overarching objectives. In particular, NHT identifies three activities for achieving this objective: • Improving the condition of natural resources that underpin the sustainability and
productivity of resource based industries; • Securing access to natural resources for sustainable productive use; and • Encouraging the development of sustainable and profitable management systems for
application by landholders and other natural resource managers and users. 1.3. AIMS OF THE REPORT This report is an important compilation of the available research and natural resource management experience of the Wet Tropics NRM Region. It aims to establish a continuing information base for developing sound strategies and management to achieve the sustainable use of natural resources. The headings are:

2 SUSTAINING THE WET TROPICS: A REGIONAL PLAN FOR NRM
• Definition - a brief description of the theme; • Condition, trends and current state of knowledge - the state of the resource, changes
over time and technical information for the theme; • Critical issues, impacts and threats - key issues that are likely to have a major impact
on the resource for the theme; • Current state of understanding - an analysis of gaps that indicates insufficient data
and/or lack of understanding by managers of natural resources for the theme; • Potential actions for sustainable use - an assessment of the solutions to resource
degradation challenges for the theme; and • Institutional and administrative arrangements. 1.4. REPORT FRAMEWORK The report addresses sustainable use under four broad themes: 1. Water health; 2. Soil health; 3. Biological health; and 4. Freshwater and marine fisheries. Each of the major themes has a number of sub-themes, which identify specific issues. Although these themes and issues are treated in separate chapters, many subjects are interrelated. Most are discussed largely within a single chapter to avoid undue duplication although certain material can logically be discussed in more than one chapter. Care has been taken to identify links and provide cross-references. 1.5. REPORT PREPARATION The Land and Water Science Group, Department of Natural Resources and Mines (NR&M), Mareeba and the Northern Fisheries Centre, Department of Primary Industries (DPI), Cairns compiled the report utilising their broad experience in land, water and fisheries management research and development in far north Queensland. The principal authors were: Dr John Armour, Senior Soil Scientist, NR&M, Mareeba Dr Lex Cogle, Principal Scientist, NR&M, Mareeba Dr Velu Rasiah, Senior Soil Scientist, NR&M, Mareeba Dr John Russell, Principal Fisheries Biologist, DPI, Cairns Geoff McDonald (CSIRO, Brisbane) and Nigel Weston (Rainforest CRC, Cairns), as compilers of the NRM Plan, provided substantial information and guidance on content in the report and reviewed sections. Many people reviewed the report and in particular, we are grateful for the valuable comments of Richard Pearson (JCU, Townsville), Mike Rimmer and Neil Gribble (DPI Fisheries, Cairns), Shane Campbell and Jim Mitchell (NR&M, Charters Towers), Jason Douglas (NR&M, Mareeba), Phil Moody (NR&M, Indooroopilly), Paul Reddell (CSIRO, Atherton), Mark Annandale (DSD, Cairns), and Kev Shaw and Jim Kernot (DPI, Mareeba). We acknowledge the contribution made by others who reviewed the document as organisational representatives. Other colleagues within the Departments of Natural Resources and Mines, and Primary Industries provided valuable information, comment and guidance. Jann O’Keefe and Shannon Hogan (Rainforest CRC, Cairns) assisted with report production. 1.6. DATA ACQUISITION Published reports cited in the text are to be found in the reference list at the end of the report. Other unpublished sources are acknowledged by the use of organisational abbreviations. Data that appear without acknowledgement or citation were provided by the principal authors and/or expert reviewers.

CONDITION REPORT: SUSTAINABLE USE 3
2. WATER HEALTH (INCLUDING SURFACE WATER, GROUND WATER AND WETLANDS)
2.1. QUALITY 2.1.1. DEFINITION
Water health is defined primarily by the quality of water (WQ) for a desired use (ANZECC 2000) and to protect a range of aquatic ecosystems, from freshwater to marine. For example, high quality is expected for drinking. Medium to poor quality is sufficient for irrigation, hydroelectric power generation and industrial uses. The relationships between the use, WQ and causative factors are summarised in Table 1. WQ is characterised by chemical, physical, and biological components. The chemical component is characterised by indicators such as solutes, total nitrogen (N), dissolved N (nitrate and ammonium), total and dissolved phosphorus (P), total and dissolved C, electrical conductivity, pH, cations (e.g. Na, Ca and Mg), heavy metals (e.g. Hg, Pb, Cd, Cu, Zn, Cr, Ni), anions (e.g. Cl and SO4), and organic pollutants such as pesticides and oils. The physical component is usually characterised by temperature, turbidity defined by suspended organic and inorganic matter (silt and clay), dissolved oxygen, and viscosity. An important reference for water quality in Australia is the Australian and New Zealand Guidelines for Fresh and Marine Water Quality as part of the Australian National Water Quality Management Strategy (NQWMS, ANZECC & ARMCANZ, 2000). This states that long-term management of water resources requires: • A designated and clearly stated set of environmental values; • An understanding of the links between human activity and environmental quality; • Unambiguous goals for management; • Appropriate WQ objectives; and • A management framework including mechanisms for cooperation, feedback,
regulation and auditing (Box 1). The Guidelines state that the effect of a particular stressor (or toxicant) on ecosystem function depends upon: • Nature of the ecosystem; • Type of stressor; and • Environmental factors that may modify the effect of the stressor. For non-biological stressors, the Guidelines recommend guideline trigger values that represent bioavailable concentrations or unacceptable levels of contamination (Table 6 in this document; Section 3.3 in ANZECC & ARMCANZ 2000). A summary of some water quality indicators for different ecosystems is presented in Table 2. The major indicators of biological component of water quality are structure of macro-invertebrate and/or fish communities in rivers, streams, estuaries and marine environment, structure and biomass of phytoplankton, benthic algae (diatoms), algal blooms, bacterial and viral pathogens. Unacceptable increases or decreases in any one or combination of the indicators can have significant impacts on human and ecosystem health. Trigger values for these indicators for a given ecosystem have been proposed (ANZECC 2000). Numerical trigger values have been assigned for each chemical and physical indicator but not for the biological indicators.

4 SUSTAINING THE WET TROPICS: A REGIONAL PLAN FOR NRM
Table 1: Common water quality issues affecting the environmental values of water and the associated pollutants (adapted from Table 2 of Water Quality Targets Hand Book 2000).
Environmental Value Water Quality Issue Causative factor
Stress/death of fish Low dissolved O2, algal bloom, chemical contamination, pH, salinity, habitat modification, flow alteration, temperature
Loss of diversity of aquatic animals
Chemical toxicants, altered habitat (e.g. sediments, algal bloom), acidic waters, increased salinity, heavy metals, dissolved O2, temperature
Loss of seagrass Nutrients and turbidity
Smothering of aquatic fauna Suspended sediments
Loss of spawning trigger for fish Flow alteration and temperature
Aquatic ecosystem
Loss of aquatic plants Acidic waters
Taste and odour associated with algal bloom and sediments Nutrients, sediment, and salinity
Human health problem Toxins from algal bloom, chemicals, viruses, faecal coliform and other microorganisms Drinking water
Reduced treatment and disinfection capability Nutrients and sediments
Water unsuitable for consumption by stock Toxins, suspended sediment, salinity
Contaminated foods (mussel, oyster) Heavy metals, Toxicants, viruses, faecal coliform, etc.
Fouled pumps and corroded pipes Suspended sediment, pH, and salinity
Primary industries (irrigation, stock, aquaculture, human consumption of aquatic food)
Water unsuitable for irrigation Salinity
Smell and Odour Nutrients and sediments
Beach closures Viruses, faecal coliform, and other organisms Recreation and aesthetics
Nuisance growth of aquatic plants scums, toxic blue greens Nutrients, turbidity, light and temperature
Blockage of intake screens Nutrients and light Industrial Equipment fouling and
corroding pipes Suspended sediments, pH and salinity
Table 2: Some water quality indicators for different ecosystems (adapted from Table 3 of Water Quality Targets Hand Book 2000).
Indicator Rivers Groundwater Lakes Wetlands Estuaries Marine
Total N
Nitrate
Dissolved N
Total P
Filterable reactive P
Turbidity/sediment
Transparency
Salinity

CONDITION REPORT: SUSTAINABLE USE 5
DEFINE PRIMARY MANAGEMENT AIMS
DETERMINE APPROPRIATE GUIDELINE TRIGGER VALUES FOR SELECTED INDICATORS
FURTHER SITE-SPECIFIC INVESTIGATIONS:
• Consider effects of ecosystem-specific modifying factors
• Comparison with reference condition
• Biological effects data (e.g. direct toxicity assessment)
POTENTIAL RISK
HIGH RISK
(initiate remedial actions)
TEST AGAINST GUIDELINE VALUES
Compare key performance indicators with guideline ‘trigger’ values for specific ecosystem type
LOW RISK
Nitrogen (N) and phosphorus (P) may be present in water in a wide range of chemical compounds. N - the major inorganic forms of N are nitrate (NO3), ammonium (NH4), and nitrite (NO2, usually in very low concentrations). They have an immediate effect on aquatic biota due to their effect on growth and variable toxicity. Sediment-bound and organic N are the other major components. For example in the Johnstone River, the proportions of the total N load were sediment-bound (50%), nitrate (27%) and ammonium (3%). P - inorganic P is filtered reactive P (FRP, also known as orthophosphate or phosphate, PO4
3) which is bioavailable. Sediment bound P normally comprises most of the P in waters e.g. 81% in the Johnstone River).
Box 1: Framework for assessing the physico-chemical stressors in ambient waters (Source: Figure 3.3.1. ANZECC & ARMCANZ 2000).
WQ targets should be defined by the community and other stakeholders. This requires consideration of what they want to protect (e.g. drinking water, ecosystem protection, riverine quality, etc.) as well as current and future uses of water. After the environmental values have been decided targets should be set to achieve or maintain them. Setting targets requires knowledge of current condition and long term trends. Thus, WQ targets include numerical levels or descriptive statements that must be met within a specified timeframe to protect and maintain environmental values. 2.1.2. CONDITIONS, TRENDS AND CURRENT STATE OF KNOWLEDGE
2.1.2.1 General
In general, the changes in WQ are induced by vegetation clearing and land management for forestry, cropping and animal husbandry, urban development and associated non-agricultural industries. Several recent reviews have summarised the impacts of sediments, nutrients (particularly N and P), and pesticides from catchments on Queensland coastal ecosystem health, with the Great Barrier Reef as a focus (e.g. Brodie 2002; Anon 2003; Williams 2001; Haynes et. al. 2001; Productivity Commission report 2003). This section will focus on the deterioration in WQ associated with the landuse, particularly the use of fertiliser N and P in intensive agricultural systems because of their direct impact on WQ. The discussion is focused on contaminants that have significant impact on ecosystem health, such as the oxides of N (NOx), total dissolved N, total dissolved P, and some pesticides. Erosion and associated sediment loads in streams may also adversely affect WQ (refer to Section 3.3).
Box 2: Forms of N and P.
6 SUSTAINING THE WET TROPICS: A REGIONAL PLAN FOR NRM
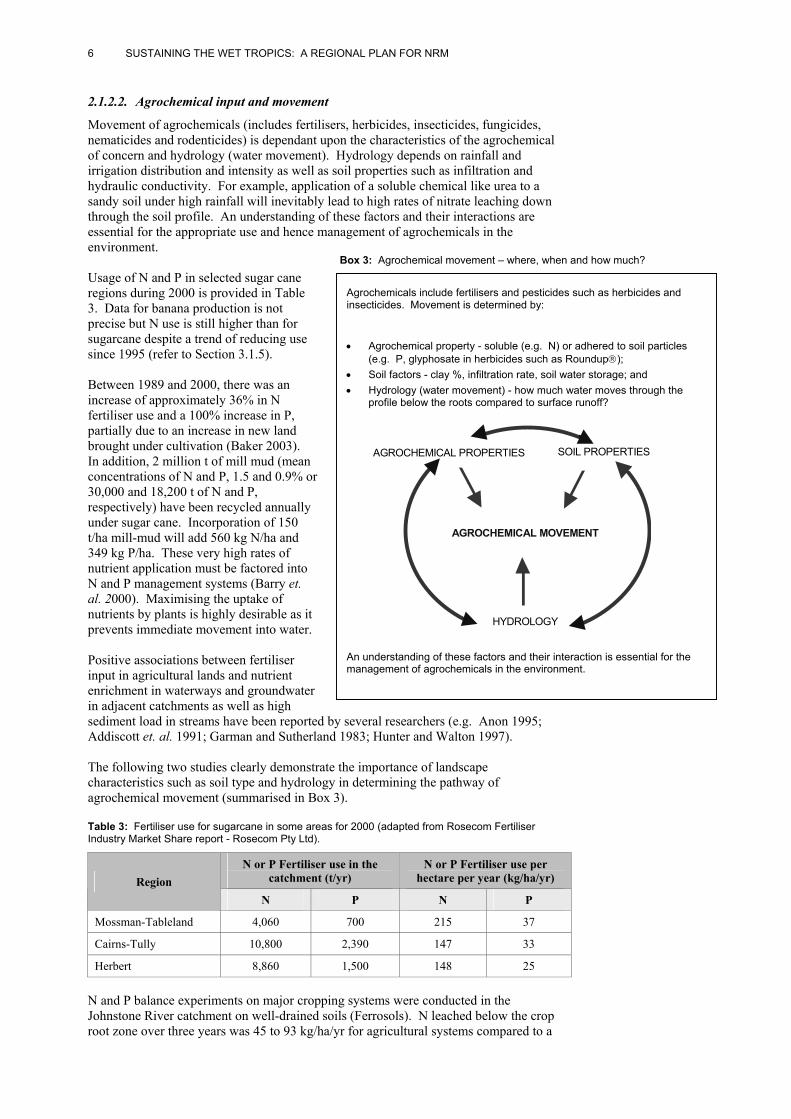
2.1.2.2. Agrochemical input and movement
Movement of agrochemicals (includes fertilisers, herbicides, insecticides, fungicides, nematicides and rodenticides) is dependant upon the characteristics of the agrochemical of concern and hydrology (water movement). Hydrology depends on rainfall and irrigation distribution and intensity as well as soil properties such as infiltration and hydraulic conductivity. For example, application of a soluble chemical like urea to a sandy soil under high rainfall will inevitably lead to high rates of nitrate leaching down through the soil profile. An understanding of these factors and their interactions are essential for the appropriate use and hence management of agrochemicals in the environment. Usage of N and P in selected sugar cane regions during 2000 is provided in Table 3. Data for banana production is not precise but N use is still higher than for sugarcane despite a trend of reducing use since 1995 (refer to Section 3.1.5). Between 1989 and 2000, there was an increase of approximately 36% in N fertiliser use and a 100% increase in P, partially due to an increase in new land brought under cultivation (Baker 2003). In addition, 2 million t of mill mud (mean concentrations of N and P, 1.5 and 0.9% or 30,000 and 18,200 t of N and P, respectively) have been recycled annually under sugar cane. Incorporation of 150 t/ha mill-mud will add 560 kg N/ha and 349 kg P/ha. These very high rates of nutrient application must be factored into N and P management systems (Barry et. al. 2000). Maximising the uptake of nutrients by plants is highly desirable as it prevents immediate movement into water. Positive associations between fertiliser input in agricultural lands and nutrient enrichment in waterways and groundwater in adjacent catchments as well as high sediment load in streams have been reported by several researchers (e.g. Anon 1995; Addiscott et. al. 1991; Garman and Sutherland 1983; Hunter and Walton 1997). The following two studies clearly demonstrate the importance of landscape characteristics such as soil type and hydrology in determining the pathway of agrochemical movement (summarised in Box 3). Table 3: Fertiliser use for sugarcane in some areas for 2000 (adapted from Rosecom Fertiliser Industry Market Share report - Rosecom Pty Ltd).
N or P Fertiliser use in the catchment (t/yr)
N or P Fertiliser use per hectare per year (kg/ha/yr) Region
N P N P
Mossman-Tableland 4,060 700 215 37
Cairns-Tully 10,800 2,390 147 33
Herbert 8,860 1,500 148 25 N and P balance experiments on major cropping systems were conducted in the Johnstone River catchment on well-drained soils (Ferrosols). N leached below the crop root zone over three years was 45 to 93 kg/ha/yr for agricultural systems compared to a
Agrochemicals include fertilisers and pesticides such as herbicides and insecticides. Movement is determined by:
• Agrochemical property - soluble (e.g. N) or adhered to soil particles (e.g. P, glyphosate in herbicides such as Roundup®);
• Soil factors - clay %, infiltration rate, soil water storage; and • Hydrology (water movement) - how much water moves through the
profile below the roots compared to surface runoff?
AGROCHEMICAL MOVEMENT
AGROCHEMICAL PROPERTIES SOIL PROPERTIES
HYDROLOGY
An understanding of these factors and their interaction is essential for the management of agrochemicals in the environment.
Box 3: Agrochemical movement – where, when and how much?

CONDITION REPORT: SUSTAINABLE USE 7
very low rate from rainforest (Table 4). This was the major loss mechanism via water to the environment, although export of the harvested crop was the largest ‘sink’ for N for sugarcane. The N transported in runoff was <5 kg N/ha/yr, although ‘dry’ wet seasons were experienced during the planting phase of sugar cane and banana crops, when risk of erosion was highest. P transport from agricultural systems was low. Table 4: Transport of N and P in runoff, bedload and leaching (with ranges) from the common cropping systems and rainforest on Ferrosols in the Johnstone River catchment (adapted from Prove and Moody 1997).
N transport (kg N/ha/yr) P transport (kg P/ha/yr) Land Use
Bedload Runoff Below 60 cm Bedload Runoff Below 60 cm
Sugar cane < 1 5 (1-6) 45 (30-56) 0-1 <0.5 < 0.1
Banana < 1 4 (1-7) 93 (71-152) < 1 <3 < 1.0
Pasture < 1 <0.5 46 (40– 54) < 0.5 < 0.5
Rainforest <2 < 13 < 0.5 In contrast are the data from Bohl et. al. (2000) who studied the N and water balance on poorly drained soils of the lower Herbert floodplain. Over two years, an average of 33 kg N/ha was removed from the root zone by sub-surface water movement compared with 63 kg N/ha by runoff and gaseous losses. N movement approximated the movement of water in the landscape. The contribution of different landuse categories to N and P loads to the GBR has been calculated (Table 5). It is evident that the major proportion of N and P reaching the GBR lagoon originated from grazing land. In contrast, intensively cropped land that occupies only 8% of the landmass but receives much higher applications of fertiliser, contributed 38% of N and 22% of P loads. Table 5: Estimates of relative contribution of N and P from different landuse categories to water quality in the GBR lagoon (adapted from Productivity Commission Report 2003, Table 2.3).
Nitrogen contribution Phosphorus contribution Sector
Quantity (t/yr) Proportion of total (%) Quantity (t/yr) Proportion of
total (%)
Grazing 18,110 56 55,540 57
Sugar cane 8,800 27 1,300 13
Other crops 3,500 11 880 9
Sewage 1,930 6 1,930 20 2.1.2.3. Nitrogen in streams
Most forms of N are classified as ‘chemical stressors that are not toxic but can directly affect ecosystems’. Ammonia is the exception as it is a ‘stressor directly toxic to biota’ (ANZECC & ARMCANZ 2000). N concentrations in streams may be assessed against generalised trigger values provided for different aquatic ecosystems in northern Australia (Table 6). Detailed local research has identified Taylor Creek and Corsi’s site (on the Johnstone River) as representative of undisturbed / pristine systems in the Johnstone River catchment (Hunter et. al. 2001). Their median and 20th percentile values for NOx-N are lower than the ANZECC trigger values provided for upland/lowland rivers. In line with recommendations of ANZECC, we propose that the values in Table 7 be used as references to assess the impact of landuse changes on WQ of streams.
• Grazing lands contribute large quantities of N and P to the GBR despite generally very low rates of fertiliser use.
• Intensively cropped lands (predominately sugarcane and bananas) contribute proportionally much more N and P on an area basis.
• Reducing N, P and sediment loads from these contrasting land use systems will require markedly different management.
Box 4: Transport of N and P to the Great Barrier Reef.

8 SUSTAINING THE WET TROPICS: A REGIONAL PLAN FOR NRM
Table 6: Trigger values for N and P for different aquatic environments (adapted from Table 3.3.4, ANZECC & ARMCANZ 2000). TP = total phosphorus, FRP = filterable phosphorus, TN = total nitrogen, NOx = oxides of nitrogen. aLower values are for rivers draining from rainforest catchments.
Ecosystem Total P (µg P/L) FRP (µg P/L) Total N (µg N/L) NOx (µg N/L)
Upland river 10 5 150 30
Lowland river 10 4 200-300a 10
Freshwater lakes 10 5 350 10
Wetland 10 5 350 10
Estuaries 20 5 250 30
inshore 15 5 100 2 Marine
offshore 10 2 100 1 Table 7: Reference values for the oxides of N (NOx), total dissolved N and P in near pristine streams in the Johnstone catchment (adapted from Hunter et. al. (2001), tables A4.1, A4.3, and A4.5. n = number of observations).
Stream Range Median 20th Percentile Monitoring period n
NOx (µg N/L)
South Johnstone 1 – 80 6 3 May 91-Nov 96 77
Taylor Creek 1 – 540 25 15 May 91-June 96 527
Total N (µg N/L)
South Johnstone 17 – 409 84 31 June 91-Nov 96 63
Taylor Creek 10 – 6100 100 30 May 91-June 96 355
Dissolved P (µg P/L)
South Johnstone 5 – 60 20 10 June 91-Nov 96 64
Taylor Creek 10 – 650 20 10 June 91-June 96 361 Using the values from Tables 7 and 8, we assessed the data available for the major systems in the Wet Tropics (Figure 1). It is clear that there was considerable variability in concentrations from season to season, year to year and stream to stream (i.e. spatio-temporal variation). For example, Total N and Total P in the Barron River are as high as 760 µg/L in January 1999 but not in 2000 or 2001. In Whyanbeel and Scheu Creeks (Table 8), the median and the 20th percentile values are approximately an order of magnitude higher than ANZECC trigger values provided for upland and/or lowland rivers (Table 6) and proposed reference values (Table 7). Table 8: Total N concentrations (with ranges) recorded in some streams of the Plan region (Source: NR&M).
Stream Median (µg N/L) Mean (µg N/L) 20th percentile (µg N/L)
Daintree River 99 119 (78-188) 82
Mossman River 98 116 (81-267) 85
Barron River 141 138 (66-179) 118
Whyanbeel Creek 223 286 (158-771) 187
Scheu Creek 562 587 (328-873) 418

CONDITION REPORT: SUSTAINABLE USE 9
Figure 1: Nitrate-N or total N and phosphorus concentrations in selected streams of the Wet Tropics. Note the varying y axis scales. Detailed studies on the impact of landuse and crop management on water quality in the Barron and Johnstone catchments have been completed. In the Barron, 32 sites were sampled at monthly intervals (Cogle et. al. 2000). The median nitrate-N values for all the sub-catchments were <155 µg N/L, apart from Mazlin Creek, which contains a sewage treatment plant and had a median of 532 µg N/L. The medians for all the sub-catchments, except at one site, above Lake Tinaroo were above the recommended ANZECC trigger of 340 µg N/L. Below the lake, all the medians were < 340 µg N/L. Generally, more than 50% of the recorded values were higher than the reference values provided for a creek in Table 7. This study clearly identified the ‘hot spot’ distributions in the Barron catchment by monitoring on a catchment scale. A detailed Water Management study in the Johnstone catchment between1991 to 1997 has been published (Hunter et. al. 2001). The median nitrate-N concentrations ranged from 25 µg/L at Taylor Creek to 798 µg/L at Scheu Creek (Friels Road). For the Johnstone River, the 20th percentile values, ranged from 29 to 75 µg/L at five out of the six sites (5 to 439 measurements). This implies that 80% of the recorded nitrate concentrations were above both the trigger values for upland/lowland rivers (Table 6) and the reference value of the South Johnstone River of 3 µg/L. For the South Johnstone River, the 20th percentile values were equal to or greater than 30 µg/L, i.e. equal to the trigger value for upland rivers, but much higher than that for lowland river or reference (93 to 397 measurements at three sites). For most of the creeks, the 20th percentile values were higher than the trigger values provided for upland/lowland rivers. Monitoring at
Tota
l N (µ
g/L)
, exc
ept f
or S
cheu
Cre
ek, w
here
N is
nitr
ate
(µg/
L).

10 SUSTAINING THE WET TROPICS: A REGIONAL PLAN FOR NRM
different locations for a given creek (e.g. Nind Creek) produced 20th percentile values that varied by an order of magnitude along the creek, indicating the locations of ‘hot spots’. Nitrate-N concentrations in the Herbert River at Ingham were monitored from May 1995 to May 2000 and ranged from 100 to 200 µg/L (Queensland Water Quality Summary 2000). The concentrations are much higher than the ANZECC trigger values (10-30 µg/L) provided for upland/lowland rivers. For the Tully River at Average Mean Thread Distance (AMTD, upstream from the river mouth) 17.5 km and 71 km, only total N concentrations are available as for the Mulgrave River at Peets Bridge (GS111007A) and Herbert at 95 km AMDT. In the Tully River, the total N at 17.5 km in general was higher than at 71 km, and at both locations it ranged from 100-1000 µg/L (Queensland Water Quality Summary 2000). In general, these values are higher than the trigger values provided for upland/lowland rivers and for marine inshore/offshore environment. The total N at the Mulgrave River site was around 100 µg/L and is similar to that in the Tully River at AMTD 71 km. In Herbert River AMTD 97 km, the total N was around 400 µg/L and is similar to that in Tully AMTD 17.5 km. Though spatial variations were reported, the locations of ‘hot spots’ in time are not clear. 2.1.2.4. Nitrogen in groundwater
It is evident that large quantities of N may be leached below the root zone as nitrate-N in well drained soils such as Ferrosols (Table 5). The potential of nitrate to enter surface waterways by base-flow or lateral-flow, and/or enter deep groundwater are major concerns. Rasiah et. al. (2003a) showed that substantial quantities of the leached nitrate were retained deep in the ferrosol profiles of the Wet Tropics (Figure 2). For example, the average N load at a depth of 1-12 m across 19 ferrosol profiles was 1550 kg/ha compared with 185 kg/ha in eight non-ferrosols. This implies that during the same period ≈ 1300 kg N/ha of nitrate-N was ‘lost’ from non-ferrosols to surface or groundwater and/or denitrification. In contrast, 11 kg/ha was retained in a rainforest ferrosol. These workers suggested that 1500 kg N/ha accumulation in the ferrosols would have required at least 50 yr at an input rate of 150 kg N/ha/yr. Nitrate has been monitored at weekly to fortnightly intervals in fluctuating shallow (1-12 m) groundwater in the same catchment for three consecutive years. The sites were a typical Ferrosol (Site FF) and non-Ferrosol (Site AJ, Figure 3). The data indicate that nitrate-N concentrations at site FF (500 to 1500 µg/L) were generally lower than at Site-AJ) (500 to 2500 µg/L). Though ANZECC trigger values for nitrate-N in fluctuating groundwater are not provided, we believe that the concentrations are high, particularly due to the potential for the discharge of this water into streams (Rasiah et. al. 2003b). For a better appreciation of the potential risk, concentration data was used to calculate the N load in groundwater, which varied from 5 to 120 kg/ha. Groundwater heights fluctuated throughout the year with rapid fluctuations during the wet season (December through May). In late May, the groundwater receded rapidly to 9-10 m below the surface. It is assumed that the receding GW drained into streams discharging 40 to 80 kg N/ha (Rasiah et. al. 2003b). It should be noted here that the N-load in groundwater is comparable to the large quantities of the nitrate that leached below the root zones (Table 5). It is not clear whether the estimated 8800 t N/yr (Table 4) that was discharged into GBR from sugar cane production and other cropland included the contribution from receding shallow groundwater. This issue needs to be clarified. Weier (1998) conducted an extensive survey of 260 deep bores (15-60 m deep, with depth to groundwater generally from 2-20m) for nitrate-N concentration in GW in the Wet Tropics catchments. The results indicated that 220 out of the 260 bores had nitrate-N concentrations of 0 to 2250 µg/L, 31 bores had 2250 to 5600 µg/L, 9 bores had 5600 to 11,300 µg/L, and 3 bores had >11,300 µg/L. Only qualitative inferences are possible because sampling was undertaken only once.
• The 20th percentile values are higher than the trigger values provided in the ANZECC guidelines for upland/lowland rivers and the reference values recorded at pristine locations in local streams (i.e. 80% of recorded values are higher than this).
• Long term monitoring along streams draining from sub-catchments with contrasting landuse and management is essential to assess impacts on N and P discharge.
• Less information is available for phosphorus than for nitrogen.
Box 5: The impact of landuse on stream N and P concentrations.

CONDITION REPORT: SUSTAINABLE USE 11
Hunter et. al. (2001) conducted a focused study on groundwater nitrate in the Johnstone Catchment, involving 43 bores (18 were monitored at least twice, 14 sites at least on four occasions and one site very intensively, n = 88). Nitrate-N concentrations varied spatially and also between samplings in a given bore. Median concentrations were <500 µg/L in 23 bores, of which 16 were <30 µg/L and 3 were >3000 µg/L. To examine the nitrate-N status on a broader scale, we gathered the available data from NR&M managed bores. Spatio-temporal variability in groundwater nitrate is the norm, not an exception (Table 9). Thus, any generalisation with regard to nitrate-N discharge to off-site aquatic systems should be made cautiously. For example, in the 57 bores of the Herbert catchment, the nitrate-N ranged from as low as zero (more correctly < analytical method reporting limit) to 8014 µg/L nitrate-N. The temporal changes in nitrate-N are illustrated by the changes in Bore 113, in which the concentration decreased from 4176 µg/L in March 1999 to 858 µg/L in May 2000. In contrast, concentrations in Bore 114 increased from 406 µg/L March 1999 to 2530 µg/L in May 2001. This variability demonstrates the need for long term groundwater nitrate –N data for meaningful interpretation, extrapolation through modelling, and the development of an understanding of the fate of this important contaminant. The ultimate result is the development of guidelines for management decisions. The spatio-temporal changes in the other three catchments showed similar variability to that observed in the Herbert. The groundwater nitrate-N data from the four catchment summarised in Table 9 generally indicate that 95% of the values are greater than the trigger values (2 to 30 µg/L) provided in ANZECC guidelines for different aquatic environments. The median values were highest in the Johnstone Catchment followed by Mossman, Barron, and Herbert in that order. The 20th percentile value was highest for the Mossman followed by Johnstone, Barron, and Herbert. The median or 20th percentile value is an order of magnitude higher than the ANZECC trigger value provided for upland/lowland rivers or the other aquatic environment. Estimates of the N-load available in GW for discharge is essential because the GW can be discharged directly into streams or into other areas of the aquatic environment by base-flow or possibly via ‘wonky holes1’. The 20th percentile values for the four catchments indicate that at least for 80% of the time, the quality of the GW in relation to nitrate is unacceptable for the different aquatic ecosystems (ANZECC Table 8). 1 Wonky hole is the term for springs on the seabed that pump out fresh water draining from the land. Fishermen have known about these springs for decades, coining the term ‘wonky holes’ because the rough terrain around the springs can trap their nets and overturn boats.
Site FF
0
500
1000
1500
2000
2500
3000
0
2
4
6
8
10
12
NO3-N(µg)GWHT(m)
Site AJ
0
500
1000
1500
2000
2500
3000
0
2
4
6
8
10
12
NO3-N(µg)GWHT(m)
Nitr
ate-
N in
gro
undw
ater
(µg
N/L
)
Gro
undw
ater
leve
l fro
m th
e bo
ttom
of t
he p
iezo
met
ers
(m)
Time (calendar dates)
Figure 3: Nitrate-N dynamics in fluctuating shallow groundwater in Ferrosol and non-Ferrosol profiles in the South Johnstone catchment.
0
2
4
6
8
10
0 50 100 150 20
N load (kg/ha)
Dep
th (m
)
PB140
CO139
Forest
Figure 2: N-load in Ferrosol and non-Ferrosol profiles compared with rainforest.

12 SUSTAINING THE WET TROPICS: A REGIONAL PLAN FOR NRM
Table 9: Groundwater nitrate-N (µg/L) in the major catchments of the Wet Tropics. The numbers within parenthesis are ranges (Source: Groundwater Database, NR&M).
Catchment Number of bores
Number of observations Mean Median 20th percentile
Barron 26 177 845 (0-5,327) 610 225
Mossman 18 33 1054 (0-4,740) 700 271
Johnstone 11 64 1332 (0-4,334) 1174 226
Herbert 57 77 1224 (0-8,014) 429 113 The differences in median and/or 20th percentile values reported in the current analysis and those of Hunter et. al. (2001) and Weier (1998) are attributed to sampling intensity, rainfall, location in the catchment and other unknown factors. This emphasises the need for consistency in sampling programs (frequency, time, number of samples, methodology). 2.1.2.5. Phosphorus in streams
Phosphorus is usually reported as total P (the complete load of P in water, components of which are sediment bound P, organic P as well as dissolved phosphate) and phosphate (or filtered reactive phosphorus, FRP), which is the dissolved component that is immediately available to biota. The forms of P as classified as ‘stressors that are not toxic but can directly affect ecosystems’ (ANZECC & ARMCANZ 2000). Most of the P transported in water is associated with sediment. For example, sediment bound P comprised 81% of the P was transported with sediment in the Johnstone Rivers (Hunter and Walton 1997). In the Herbert River, during the cyclone Sadie event of 1974, 81% of the total P was exported as sediment in a discharge of 493, 600 ML (Mitchell et. al. 1996). This contrasts with a later report from the Herbert River that only 35% of the total P was sediment bound (Bramley and Roth 2002). However, that study mainly sampled low flow events that are ‘generally irrelevant in terms of loads of river-borne material transported annually’ (Mitchell et. al. 1996). The bioavailability of sediment P once it reaches the marine environment is not straightforward. Some research has shown that the transition from freshwater to marine conditions caused the adsorbed P on sediment to become more strongly held in sediments from the Johnstone and Herbert Rivers (Pailles and Moody 1992, 1995; Edis et. al. 2002). The ANZECC trigger value for total P in upland/lowland rivers, freshwater lakes/reservoirs, and offshore marine environment is 10 µg P/L for each one of the aquatic ecosystems (Table 6). The data presented in Figure 1 indicates that, exclusive of the Whyanbeel Creek and Mossman River at Mossman, the total P during monitoring was generally higher than the trigger values. The total P in the upstream South Johnstone River, at the Central Mill and in the North Johnstone River (GS112004A) ranged from 5 - 10 µg/L and occasionally > 10 µg/L between May 1995 and May 2000 (Queensland Water Quality Summary 2000). In the Herbert River at Ingham, the total P was > 10 µg/L and an opposite trend was observed at AMTD 97 km. Median total P concentrations were 93, 29 and 21 µP/L for the landuses of sugarcane, grazing and forestry in the Herbert during predominantly low flow conditions (Bramley and Roth 2002). In the Tully River at AMTD 17.5 km, the total P was often higher than at AMTD 71 km and exceeded the trigger value on several occasions. In Mulgrave River at Peets Bridge (GS111007A), the total P was often around the trigger value (Queensland Water Quality Summary 2000). In the Johnstone Catchment, the 20th percentile values for the total dissolved phosphorus (TDP) at six sites in the Johnstone River (see discussion on nitrate) were around 10 µg/L
• Do the estimates of N-load discharged to the near coastal environment include the load from the groundwater? Information on N loads in groundwater and the time of discharge are essential.
• The number of recorded observations is generally low (1 to 10) during the last 5-10 years.
• The 20th percentile values (i.e. lowest 20% of recorded values) are less than trigger values provided in the ANZECC guidelines for drinking water but are substantially higher than that provided for other aquatic systems (streams/estuaries/marine).
Box 6: The impact of landuse on groundwater N concentration.

CONDITION REPORT: SUSTAINABLE USE 13
(Hunter 2001). This shows that 80% of the recorded observations were higher than the trigger values provided for upland/lowland rivers. A similar trend existed for the South Johnstone River and in the creeks where the observations were made. In the Barron Catchment, the FRP medians for all the sub-catchments were < 15 µg /L, apart from 2 sites (Cogle et. al. 2000). In the Lake Tinaroo catchment, for all the sub-catchments exclusive of two, had 80th percentile values < 16 µg N/L, and below Tinaroo Dam the 80th percentile was < 15 µg /L, exclusive at four locations. 2.1.2.6 Sediment
Sediment, or suspended particulates, in water contributes to turbidity, which has been classed as a ‘non-toxic direct effect stressor. It can reduce light penetration into a water body and result in reduced primary production, possible deleterious effects on phytoplankton, macrophytes and seagrasses, or smother benthic organisms and their habitats’ (ANZECC & ARMCANZ 2000). Extensive literature on the effects of sedimentation on reefs is available, although the difficulties of quantifying the effects of turbidity have been noted (Larcombe et. al. 2001). Sediment is also important because it carries significant quantities of N and P. In both cases, it may reduce the sustainability of enterprises or ecosystems, since the loss of soil and nutrients at the source reduces the productivity of that enterprise or ecosystem. However, sediment transported from a point does not immediately travel to a catchment outlet and may result in sediment being deposited in stream channels or occurring as slow moving sediment slugs through the water course. These sediment deposits have implications both for stream biota and water quality, as mentioned above, and for other riverine uses (see Section 2.2.2.3. on riverine geomorphology and flooding). Issues of sediment delivery ratios are dealt with in the soil erosion section (3.3.1). Sediment export, risk factors and sediment target reductions for the rivers of the Plan Region are discussed in Section 3.3 (e.g. Table 17). 2.1.2.7. Dissolved oxygen
Dissolved oxygen (DO) levels in water can have a dramatic effect upon aquatic life. A number of fish kills in coastal streams have been attributed to low levels of DO from non-point source freshwater runoff (e.g. Brodie 2002; Rayment and Bohl 2002). Trigger values of 80-120% saturation for various parts of the catchment have been provided in the ANZECC guidelines. Important factors affecting DO are the temperature of in-stream water and runoff water, dissolved sugars from cane harvesting as well as organic material leached from green cane trash blankets by rainfall or irrigation, effluent runoff from industry and sewage, runoff from acid sulfate soils, algal blooms, etc (Brodie 2002; Hunter and Armour 2001; Rayment and Bohl 2002). Continuous monitoring for DO is desirable to integrate the effects of diurnal fluctuations, tidal influences, climate and land and water management. In reality but depending upon the monitoring program, continuous monitoring is likely to be restricted to periods of high risk, e.g. post-harvesting of green cane trash blanket at the time of first storms or first flood irrigations. 2.1.2.8. Pesticides
Pesticides comprise a wide range of naturally occurring and synthetic compounds with an associated range in chemical properties. These properties affect the persistence and mobility in landscapes and aquatic systems. Concentrations in potable water should be below detection limits and their accumulation over time in other aquatic ecosystems should be minimised to reduce the risk of potential ecological effects on fauna and flora. The most commonly used herbicides in the sugar industry are atrazine and 2,4-D (Table 10). A re-evaluation of the use of diuron in the industry by Australian Pesticides and Veterinary Medicines Authority is currently underway.

14 SUSTAINING THE WET TROPICS: A REGIONAL PLAN FOR NRM
Pesticides used in sugar cane production have been found in the stream biota of the Wet Tropics (Russell et. al. 1996c) and in the stream waters of Johnstone Catchment (Hunter et. al. 2001). Concentrations of herbicides were diuron up to 2.3 µg/L, atrazine up to 0.7 µg/L (often), and 2,4-D in the ranges of 0.18 to 1.58 µg/L. Dieldrin and diuron were recently found in subtidal sediments at concentrations that may be hazardous to the fauna and flora of coastal ecosystems (Haynes et. al. 2000a: 2000b). Lindane and dieldrin have been detected in dugongs collected along the Queensland coast (Haynes et. al. 2000a). Atrazine, diuron, lindane, dieldrin, DDT, and DDE have been detected in subtidal sediments, particularly between Townsville and Daintree River. Apart from dieldrin and diuron, the concentrations of other pesticides in water and sediments are believed not to be toxic to aquatic animals. Though diuron is found in mangrove sediments in the estuary of the Pioneer River at Mackay, cause-effect relationship between mangrove death and diuron has not yet been proven (Duke et. al. 2001). Detailed studies of pesticide persistence, interaction and mobility in the soil and concentrations and loads leaving tropical sugarcane paddocks at Bundaberg and Mareeba (Walsh R catchment) have been reported (Simpson et. al. 2001). Other reports detail pesticide residues in sediments and biota along the Queensland coast (Mortimer 2000; Cavanagh et. al. 1999). 2.1.2.9. Heavy metals
Repeated application of mill mud to paddocks, as a cost effective nutrient recycling process, has been found to produce concentrations of Cd and Zn that were 3-5 times higher levels than where no mill mud was applied (Barry et. al. 1998). Production of peanuts and other edible crops on land treated with mill mud may lead to higher concentrations of these metals entering the food chain. Similar concerns exist for heavy metal contaminants of fertilisers. 2.1.2.10. Acid sulfate runoff
Acid sulfate soils can have a severe impact on WQ from low pH, low dissolved oxygen and toxic concentrations of metals. This affects terrestrial and aquatic biota, agricultural production and infrastructure (refer to Section 3.2). 2.1.2.11. Discharge from commercial aquaculture
Brodie (2002) indicated that discharge from aquaculture contains significant concentrations of N, P, and suspended solids and the magnitude of N and P production from a hectare of prawn pond is about an order of magnitude higher than from a hectare of sugar cane (Brennan 1999). Therefore, strict environmental licensing by regulatory agencies has been proposed to reduce the downstream impact of discharge from these industries (Robertson 2000). 2.1.2.12. River pollution index (RPI)
The River Pollution Index has been proposed to define the current pollutant discharge trends of the major rivers that discharge into Great Barrier Reef Marine Park (GBR, Devlin et. al. 2001a). The RPI integrates the river flows, flow variability, and the pollutants (sediments, N, P, pesticides, and urban discharge) loads discharged. The values provided in Table 11 indicate how different factors contribute towards pollution discharge potential. For example, high RPI for the Johnstone River is associated with a high frequency index and a high fertiliser index. These indices are useful to identify the major causes of pollution in the river system and to suggest appropriate abatement measures.
North1 Herbert
Herbicides
Atrazine 108 33.8
Diuron 34.2 16.7
2,4-D 50.2 28.2
Glyphosate 10.3 4.4
Ametryn 8.7 2.2
Paraquat 12.1 3.4
Insecticide
Chlorpyrifos 2.6 3.1
Heptachlor 1.1
Fungicide
MEMC 0.7 0.4
Table 10: Most used pesticides in two sugar cane regions (t active ingredient per year). 1 North = areas of Mossman, Babinda, Mulgrave, Mourilyan, South Johnstone, Tully (Hamilton & Haydon 1996).

CONDITION REPORT: SUSTAINABLE USE 15
Table 11: River pollution indices (adapted from Table 7.1, pp155, of Productivity Commission Report 2003). 1 Each index ranged from 0 (minimum) to 10 (maximum). The frequency index is a measure of the variability of river flow (based on the number of days when flows exceeded the daily mean), suspended solid estimates from National Land and Water Resources Audits, fertiliser and diuron indices based on per hectare use, and urban discharge based on catchment population ranging from 0 to 4. The River pollution index is the sum of the six indices.
River Discharge index1
Frequency index
Suspended solid index
Fertiliser index
Diuron index
Urban index
River pollution index
Johnstone 4.6 9.1 1.0 10.0 3.6 3.0 31.2
Tully 3.2 10.0 0.4 5.4 0.8 3.0 22.8
Mulgrave 3.5 8.7 0.9 3.7 1.2 2.0 19.9
Herbert 3.9 6.0 2.4 2.7 0.8 3.0 18.8
Mossman 0.6 8.4 0.4 3.9 3.4 1.0 17.6
Barron 0.8 5.1 2.7 2.0 0.1 4.0 14.6
Daintree 1.2 7.2 1.1 0.4 0.5 0.5 10.9 2.1.3. CRITICAL ISSUES, IMPACTS AND THREATS
It is now generally accepted that landuse activities in the Wet Tropics catchments are contributing to a decline in water quality, particularly in the near coastal section of the GBR. There is evidence of serious impacts on the health, reproductive capacity of corals, seagrass and fauna of inshore reef (Brodie 2002; Haynes et. al. 2000a,b). High concentrations of N, P, and pesticides not only affect GBR health, but also can seriously impact on health and composition of fauna and flora of freshwater lakes, estuaries streams, creeks, and aquatic ecosystems, through algal bloom, eutrophication, changes in pH, deoxygenation, and reduced light penetration. The impact on freshwater and marine biota is discussed in Section 5. Critical issues are: • Nitrate and total N concentrations in streams and ground water during the last 5-10
years in the major agricultural catchments are generally higher than the ANZECC trigger values, as well as reference values reported by Hunter et. al. (2001). Similarly, the FRP concentrations are higher than the ANZECC trigger values suggested for upland and lowland rivers;
• N discharge to the GBR since 1850 has reportedly increased by 200-400% and P by 300-1,500% without any sign of abatement (Brodie 2002);
• Control of sediment movement into streams will have drastically reduced P and N loads as well as reducing damaging effects of turbidity;
• Pesticides or their residues were found in streams and sediments wherever they were monitored;
• Drainage waters from exposed acid sulfate soils have adversely affected water quality and reinforce the need for critical assessment when disturbance is proposed; and
• Waters containing high concentrations of N, P, suspended solids and diseases from aquaculture can have significant impact on the fish or other aquatic organisms.
To sustain environmental health and the current agricultural production systems, draft targets for 2011 are presented in Table 12. Total N transport from the catchments has increased by approximately 195% from each catchment during the last 150 years, implying an average annual increase of 35t/yr during the last 150 years. The target reductions proposed for the Tully River is 57%, followed by 50% each for Mossman, Mulgrave-Russell, Johnstone, Murray, and Herbert Rivers. The reductions proposed for Barron and Daintree are 34%. The 50 to 57% reduction from Tully-Mulgrave catchments would require a substantial reduction in fertiliser-N input, which is ≈ 150 kg/ha/yr. Further, the chronic low world market price for sugar is favouring conversion to banana production, which has historically high application rates of N. However, recent research has demonstrated that N rates may be considerably reduced from industry

16 SUSTAINING THE WET TROPICS: A REGIONAL PLAN FOR NRM
practice (refer to Sections 3.1.5, 3.5.5). Future changes in land use require careful consideration during the target setting for these catchments. The current total P transport is 525 to 580% higher than what is 150 years ago and the reductions proposed for 2011 are approximately 30% for each catchment, exclusive of 50% for Johnstone. Table 12: Risk, nitrogen and phosphorus discharge in the past, the present, and the proposed targets for selected catchments (adapted from Table 2 of the Report on Great Barrier Reef Water Quality Action Plan 2003). 1 Risk to the GBR from catchment quality impacts, Reef Risk Workshop, March 2003.
Nitrogen (t/ha) Phosphorus (t/ha) Catchment Risk1 Export in
1850 Current export
Target for 2011
Export in 1850
Current export
Target for 2011
Daintree River Low 169 499 334 8 53 36
Mossman River Medium 79 234 117 4 25 17
Barron River Low 109 321 215 5 34 23
Russell-Mulgrave River Medium 489 1441 721 24 153 103
Johnstone River High 628 1849 925 31 196 98
Tully River High 442 1303 652 22 138 92
Murray River Medium 142 420 210 7 45 30
Herbert River Medium 539 1588 794 26 168 113 These proposed targets should be included in the planning process for natural resource management and reflect the best current science. Sediment and nutrient budgets for GBR catchments have been recently revised (Brodie et. al. 2003). 2.1.4. CURRENT STATE OF UNDERSTANDING
Analysis of the existing information on the quality of waters in streams and groundwater (to a limited extent), suggests the need for the following in water quality monitoring programs: • Major emphasis should be placed on monitoring both surface and groundwater
because of the general spareness of the data. This applies particularly throughout the wet season following major rain events and will require well-planned coordination and consistency across catchments;
• Sampling programs should be continuous to quantify the impact of the changes in management and/or land use practices on nutrient generation and transport;
• A key issue is monitoring streams in catchments to identify ‘hot spots’ by participatory research involving producers and local stakeholders concerned with water quality; and
• Biophysical monitoring programs should be linked and complementary to biological monitoring programs as identified in the Biological Health, and Freshwater and Marine Fisheries sections.
Ideally, the water quality indicators defined earlier would satisfy the need for most purposes, including drinking water, river, estuary, freshwater, and marine ecosystem health assessment. However, the following are considered essential for monitoring at a catchment scale: total N (TN), nitrate-N, ammonium-N, total P (TP), dissolved P, electrical conductivity, DO, pH, cations of salinity concern such as Ca, Na, and Mg, heavy metals such as Cd, Fe and Al, and the most commonly used pesticides (e.g. atrazine, diuron). The frequency of sampling is an important aspect in water quality monitoring to capture the temporal changes in streams and fluctuating groundwater, which discharges into

CONDITION REPORT: SUSTAINABLE USE 17
surface waterways through lateral-flow, base-flow, and/or wonky holes. During the wet season, frequent sampling is required preferably after major rain events and flow-volume recorded to calculate loads. At the end of wet season and until the rapid fall in shallow fluctuating groundwater ceases, frequent monitoring is again required for the estimation of N-load discharge by lateral-flow. During the dry season, sampling at bimonthly or monthly intervals is sufficient to calculate base-flow N-load discharge. The environmental impact of applications of other agrochemicals has been sparsely studied in comparison to N and P. However, existing studies suggest that further research is likely to reveal other areas of concern. Broad scale (i.e. catchment scale) modelling of nutrient and sediment sources and delivery within the Plan region has been completed (Brodie et. al. 2003). The challenge now is to ground truth the model inputs/outputs as well as deliver the information at property scale for use by land managers. 2.1.5. ACTIONS FOR SUSTAINABLE USE
Land management should aim to minimise the movement of sediment and nutrients into waterways because the link between terrestrial activity and water quality has been clearly demonstrated. This includes: • Setting water quality targets for catchment and sub-catchments; • Appropriate nutrient management for primary production (e.g. use of soil and plant
analyses, rate, type and timing of fertiliser (see Sections 3.1.5, 3.5.5); • Control of erosion (and thus sediment) in catchments, including grazing and cropped
lands, roads, urban development; • Rehabilitation and extension of riparian buffers in appropriate areas to reduce the
movement of sediments and sediment-bound nutrients to waterways; • Avoidance of coarse textured soils with associated risk of N leaching for heavily
fertilised systems; and • Genetic engineering and/or breeding for self N-synthesis (e.g. sugarcane). After the selection of appropriate indicators for a given system, the numerical values of the system should be assessed against the corresponding values reported in Table 6 or that from a pristine system. Such comparison would indicate the system’s health as impacted by changes in landuse and/or management practices. 2.1.6. INSTITUTIONAL ARRANGEMENTS
The institutional arrangement for water health sustainability is shared among federal, state, and regional agencies and community groups. The Environmental Protection Agencies both at federal and state level are regulatory in nature and are primarily involved with point source pollutants. In the Wet Tropics NRM Region, the pollutants are mostly non-point source, primarily from agricultural and land clearing activities. The state Land Act, Water Act, and the Soil Conservation Act are primarily designed to protect degradation of the aforementioned resources through appropriate regulations in-order to maintain the long term sustainability. The state government Department of Natural Resources and Mines is assigned with this task. However, water quality is really a collective responsibility in a sub-catchment or a catchment. In this regard, the regional bodies operate in collaboration with community groups. For example, the recently formed Wet Tropics Natural Resources Management Board (now FNQ NRM Ltd) is primarily responsible for planning and setting targets for region and anticipate the research programs developed by state and federal agencies satisfy or agree with their targeted plan.

18 SUSTAINING THE WET TROPICS: A REGIONAL PLAN FOR NRM
2.2. QUANTITY 2.2.1. DEFINITION
Water quantity refers to the amount of water moving through the landscape and atmosphere. It may be represented by a diagram of the terrestrial water cycle (see Figure 4). There are many components of the water cycle, but essentially water: • is delivered to the landscape as precipitation (rainfall and condensation); • travels about the landscape as runoff, infiltration, drainage and streamflow; • is stored in various locations such as rivers, lakes, soil and groundwater; and • returns to the atmosphere via evaporation and transpiration. Commonly, the term ‘water quantity’ is interpreted as the total amount of water available for use, but it may incorporate the impacts of water moving through the landscape, e.g. flooding. In the region, rainfall seasonality is high (see Volume 1 of this series) and this results in distinct wet and dry seasons. There are two major impacts of this climatic pattern on both natural processes and human systems. The first is that runoff can be high during short periods resulting in flooding of streams and rivers (see Figure 5). The second is that there are periods during the year when water can be in short supply as waterways have low flow and/or groundwater levels are lowered. Orographic factors driven by topography (the Wet Tropics consist of a narrow coastal strip, a major mountain range reaching 1622m and areas of high elevation to the west) and south-easterly wind patterns are major determinants of water quantity across the region during parts of the year. In addition to water resources in surface water and groundwater reserves, the soil profile is a significant seasonal reserve of available water for agricultural and natural area vegetation. Soils vary in their available water capacity and soil maps provide insights to the amount of water available (refer to see soils section). 2.2.2 CONDITION, TRENDS AND CURRENT STATE OF KNOWLEDGE
2.2.2.1 Data availability
The National Land and Water Resources Audit defined surface water management areas and groundwater management units as the basis for reporting on water quantity, use and allocation. In the Wet Tropics region, there are nine surface water management areas (Table 13). The definition of groundwater management areas is more complex, as some may overlie each other, and are hence less readily represented. However, the broadly defined Tasman groundwater province underlies the region.
Rainfall
Evaporation Runoff
Infiltration
Drainage
Groundwater
Streamflow
Transpiration
Figure 4: Elements of the terrestrial water balance include rainfall, evaporation, transpiration, infiltration, drainage, groundwater flow and stream flow.

CONDITION REPORT: SUSTAINABLE USE 19
0
10000
20000
30000
40000
50000
60000
70000
Oct 1996-Feb 1999
ML/
day
Figure 5: Daily flow information (ML/day) at the Bilwon Gauging Station between 1996 and 1999. Water resources in the region have been assessed by various government agencies, now combined within the Department of Natural Resources and Mines (NR&M). It manages surface water and groundwater databases containing stream information from gauging sites, stations and water table levels. Surface water information is available on the website (www.nrm.qld.gov.au/watershed), with statistical summaries of stream flow (e.g. median, percentiles). More detailed information on surface water and groundwater, such as daily flow information (e.g. Figure 5, Bilwon Gauging Station on the Barron River) is available from Departmental staff. Most runoff occurs during the summer months when monsoonal influences dominate rainfall patterns (Table 13). At other times, stream baseflow is provided by groundwater flow systems. Gauging stations are located in many of the major surface water management areas, which include the principle stream arm and tributaries. Table 13: Stream runoff, numbers of gauging stations and groundwater monitoring bores for water management areas within the Wet Tropics region (Source: NLWRA 2001). @ Refers to runoff reported in the NLWRA. * Figure in brackets represents the total number of stations for which data exists, including those no longer being monitored. It also includes stations not physically in the identified river catchment, but in the surface water management area.
Surface Water Management Area Name
(Number)
Rainfall (mm/yr)@
Runoff (mm/yr)@
Number of Gauging Stations*
Number of Groundwater
Bores
Daintree River (108) 2384 1196 4 (6) 9
Mossman River (109) 1852 779 1 (6) 16
Barron River (110) 1311 449 10 (35) 66
Mulgrave - Russell River (111) 3141 1809 6 (27) 87
Johnstone River (112) 3217 1862 7 (8) 113
Tully River (113) 2739 1455 3 (8) 13
Murray River (114) 2239 1097 1 (1) 41
Hinchinbrook Island (115) 2206 1042 0 (0) 0
Herbert River (116) 1194 357 12 (25) 97 Major ‘in stream’ water storages used for urban or irrigation supply in the region are on the Barron River (Tinaroo Falls Dam, Copperlode Dam, Kuranda Weir), Tully River

20 SUSTAINING THE WET TROPICS: A REGIONAL PLAN FOR NRM
(Koombooloomba Dam) and Herbert River (Wild River Weir). However, water regulation (water storages, water harvesting) in the region is an exception rather than the rule, and total storage capacity is only a small proportion of annual stream runoff. Groundwater resources have reasonable characterisation based on the groundwater bore network sited across the region (Table 13). However, this information is restricted primarily to alluvial areas due to the major use of these areas for groundwater abstraction. The Atherton Basalts, a fractured rock aquifer, is one exception. Hydrological assessments have been undertaken in the Barron (Atherton Basalts, Barron Delta), Mulgrave, Mossman/Mowbray, Herbert, Tully Murray and Johnstone/Russell regions (Cook et. al. 2001, Gutteridge Haskins & Davey 1999, Hair 1999, Herbert 1998, 1998b, 1999, Huxley and Bjornsson 1998, Leach and Rose 1979, Muller 1975, Locsey and Cox undated). 2.2.2.2. Water allocation
Allocation of surface water by stream licensing procedures is managed by NR&M. Currently, several areas in the Barron, Upper Johnstone, Upper Herbert and Murray Rivers are fully allocated at low flows. Conditional allocations at higher flows allow water harvesting. Indeed a baseflow (50% of the 1 in 4 year annual low flow) surplus exists on the (1) Lower Mulgrave River, (2) Russell River and major tributaries, (3) South Johnstone River, (4) Liverpool Creek and major tributaries, (5) Tully River and major right bank tributaries, and (6) Lower Herbert River. Allocation of surface water and hence the currency of licences can vary over time depending on demand. There are two areas currently fully committed as groundwater resources and these are the Atherton Subartesian Management Area and the Cairns Northern Beaches Subartesian Area, where substantial investigations have been undertaken. 2.2.2.3. Riverine geomorphology and flooding
Waterways in the region are generally short, and subject to a number of major flow events each year. These variable flow levels have impacts on waterway structure and direction, sediment levels and deposition, and associated floodplains. As the region becomes more populated, river stability is a greater priority, and streambed and bank stability are major underlying issues. Streambed erosion is the process by which the bed of the stream is lowered to a new lower level, while stream bank erosion is the erosion of the bank of the waterway. Both these processes occur naturally, but rates can be exacerbated by human activities such as: • Channel clearing, swamp drainage, desnagging; • Quarrying of bed material; • Destruction of riparian vegetation; • Flow concentration under roads and bridges; or • Weed infestations and stream clogging. To counter these impacts, initiatives driven by River Improvement Trusts (RIT) and catchment management associations in the region have led to integrated approaches to river stabilisation (T Smith, pers. comm.). In the Mulgrave River, innovations with ‘snag’ design have led to dual benefits of improved riverine habitat development and stabilised riparian areas. There has been an effective partnership in the Barron River catchment between the Upper, Middle and Lower Barron catchment groups and the Cairns River Improvement Trust. One result is the Barron River management action plan, a strategy for the implementation of priority works. The Barron River catchment has five local authorities, which have had important participation through the catchment groups and have co-funded projects. This partnership has commenced implementation of its priorities including revegetation activities at the confluence of Freshwater Creek and the Barron River.

CONDITION REPORT: SUSTAINABLE USE 21
In addition to the activities of river improvement trusts, the Queensland Government has initiated discussions on a statewide flood mitigation policy (Queensland Government 2002). In the discussion paper it is recognised that: • Each year floods can seriously affect the economy and well being of the community; • Floodplains are natural resources of immense value, both as sites of most urban
development and environmental significance; and • Processes are needed to reduce the deleterious impacts of flooding. The paper suggests the major constraints to identifying solutions to the flood issue are the lack of complete and reliable information on the extent and frequency of flooding in different areas. A further measure to reduce the impacts of alterations of riverine geomorphology is the licensing requirements of the Queensland Government on the quarrying of bed material in waterways. Permits are granted by the NR&M and reported in its annual water statistics (NR&M 2002). 2.2.2.4. Water in the environment
A major component of water in the landscape is the role it plays in maintaining the environment. The term ‘environmental flow’ is used to describe this and it can be defined as the flow necessary to maintain healthy riverine habitats and systems. Brizga et. al. (2001) undertook a major study of the environmental flows of the Barron River, as part of the water planning process for the catchment. These authors identified a range of environmental flow performance measures including flow amount and seasonality and identified eight components to the flow affected ecosystems including geomorphology, riparian vegetation, aquatic plants, wetlands, aquatic macroinvertebrates, freshwater fishes, other vertebrates and end of system environments. They also particularly noted that continued monitoring is a crucial part of assessing environmental flows. Recent work in the region has provided new insights to the way that water is precipitated and transferred from clouds to the landscape water balance (McJannet and Reddell 2002). The research suggested that in some months up to forty percent more water can be harvested out of clouds than is measured as rainfall in standard rain gauges. This coupled with a reduced water demand by cloud forests implies that water flow through these catchments is not primarily driven by incident rainfall, but by other mechanisms of water transfer 2.2.2.5. Water use efficiency
The Rural Water Use Efficiency (RWUE) program in the Wet Tropics has been reported at http://nrm.dnr.qld.gov.au/rwue/index.html. This program has encouraged irrigators to improve their water use efficiency though activities in several industries (horticulture, dairy, sugar and cotton and grains). In the Wet Tropics, activities have concentrated on the first three industries. In areas like the Atherton Tablelands, which has a large number of mixed enterprise farms, irrigation efficiency initiatives in one industry have spilt over to other industries (Rohan Geddes, RWUE Officer Tolga, pers. comm.). Much of the benefit of the program has been related to extension and awareness activities (e.g. field days, media events). Demonstration sites have also identified practices for improving irrigation efficiencies. One example is the Upper Johnstone and Lake Eacham Landcare project working with farmers in the dairy industry. This project has altered best management practice (BMP) for the area due to field monitoring, and has a significant number of local irrigators using the new BMP. Water trading has been introduced in the Mareeba Dimbulah Irrigation Area. It is expected that this market-based system will improve water efficiency by allowing water to be used for higher value uses. The rules for trading will be defined under the Resource Operations Plan of the Barron Water Resource Plan.

22 SUSTAINING THE WET TROPICS: A REGIONAL PLAN FOR NRM
In urban areas, metering, water pricing and education/community awareness programs have been successful in reducing water demand and encouraging water efficiency (NR&M 2002). For example, in Cairns City a two-tiered water pricing strategy was introduced to reflect different demands and the uses to which water was put. This approach reduced demand and delayed the need for infrastructure investment. Studies in other parts of Queensland have also identified the potential for rainwater tanks to reduce residential water demand. 2.2.3. CRITICAL ISSUES, IMPACTS AND THREATS
In 1994, the Council of Australian Governments (COAG) recognised that action was needed to maximise the net value of use and existence of the water resource and move to increased financial viability of the water industry (NLWA 2001). In addition, the environmental importance of the water resource and its finite reserves were recognised. The governments agreed to a strategic basis for action - the National Water Reform Framework - with the provision of water for the environment as a key principle. This agreement underpins all issues associated with water quantity in the Wet Tropics region. The water planning agenda of the Queensland government is explained in a latter section, but it is critical that all considerations for natural resource management account for, and support this program in their priorities. Notable in the water planning for the State is the importance of community participation in process during its course. The water planning process requires readily available and reliable water information for all water reserves. Increasingly, monitoring of surface water and groundwater reserves is inadequate due to budgetary and other resourcing constraints in government agencies. While this is a nationally recognised problem, further local efforts are required to ensure that valuable information is collected for regional waterways, and stored on readily accessible databases. This will ensure the provision of interpreted information for water resource allocations to all users, including the environment. In areas where monitoring (gauging, bores) is either inadequate or not available, water resource allocation is based on mathematical models of varying capabilities. As it is difficult to resource all on-ground monitoring, significant effort should be made to ensuring accredited water allocation models are available and developed. Models of the landscape water balance require calibration data from monitored sites (as above), but also need access to new knowledge on the landscape water balance, as research becomes available. Water use efficiency is critical if water supply is to be available for future generations. Improved water efficiencies can be identified across the breadth of the water industry from water supply, water distribution and water use and in the urban and rural environments. • The ‘Waterwise’ program developed a range of initiatives over many years including
for improvements in urban areas. EPA manages the program to improve water efficiencies across home gardens, councils and industries. It develops programs and studies (e.g. Least Cost Planning) aimed at reducing consumption, with consequential and potential multiple benefits in reducing water storage infrastructure requirements.
• In 1999, the Rural Water Use Efficiency (RWUE) was initiated as a partnership between industry and government to improve the use and management of available irrigation water and thereby improve the competitiveness, profitability and environmental sustainability of Queens land’s rural industries. This first phase of this program ends in 2003 and further funding is needed to ensure this successful program continues.
Stormwater from urban areas is a major issue both from the quantity and quality perspective. Peak flows can cause flood damage to building and road infrastructure, while water may contain a range of chemicals and sediments, which harm the environment. It is only in more recent times that water quality has become a recognised issue and the work of organisations such as the CRC for Catchment Hydrology

CONDITION REPORT: SUSTAINABLE USE 23
(www.catchment.crc.org.au) have been working on solutions in some parts of Australia for several years. Large areas of agricultural land along the north tropical coast are under successful agricultural production following artificial drainage of flooded and waterlogged land. Drainage using sub-surface and surface drains has allowed sugar to be planted in many areas following legislative requirements of a number of State Government Acts. Associated issues of impacts on groundwater to ecosystems and potential acid sulfate soils are dealt with elsewhere in the report (see Soil Health, Section 3.2). 2.2.4. CURRENT STATE OF UNDERSTANDING
There are gaps in our current state of understanding in: • Environmental flows - the water resource planning process requires knowledge of the
allocations required for environmental health for the regional waterways (e.g. the work of Brigza and Davis (2001) in the Barron River);
• Hydrological modelling requires acceptable/approved modelling procedures and data for calibration. Better understanding of the interactions of the component parts of the landscape water balance will improve the outputs of modelling;
• Understanding of the interactions between component parts of the landscape water balance, particularly groundwater;
• Water use efficiency in urban and rural sectors; • Flood risk analysis and amelioration including urban stormwater management
options; and • Integrated approaches to riverine health for ecosystem health and disaster
management. 2.2.5. POTENTIAL ACTIONS FOR SUSTAINABLE USE
The NLWRA reports on the sustainability of surface and groundwater resources and recognises that sustainable water use requires consideration of a complex set of biophysical interactions and social and economic demands. It provides working sustainability definitions as: • Surface Water: The limit on potentially divertible water that will be allowed to be
diverted from a resource after taking into account of environmental values and making provision for environmental water needs; and
• Groundwater: The level of extraction measured over a specified planning timeframe that should not be exceeded to protect the higher value social, environmental and economic uses associated with the aquifer.
Water licensing is an important component part of surface water and groundwater allocation and provides practices for sustaining water supplies. Information on licensing can be found in the annual water statistics compiled by the Queensland Government (Department of Natural Resources and Mines 2002). Further, the Barron Water Resource Plan defines the volume that can be sustainably allocated in the Barron and Upper Mitchell catchments. The financial incentives component of the RWUE program has been successful in achieving sustainable use by providing ‘seed funding’ for the investments in irrigation efficiency. Farmers use the funding to support their own investment in improved irrigation infrastructure. The RWUE program has identified sustainable use practices for each of its target rural industries (a) cotton and grains, (b) dairy and lucerne, (c) horticulture, and (d) sugar. Publications for these programs are identified in http://nrm.dnr.qld.gov.au/rwue/index.html. Land and water management plans aim to develop sustainable water use and land management practices on rural lands. The Water Act 2000 requires LWMPs for water

24 SUSTAINING THE WET TROPICS: A REGIONAL PLAN FOR NRM
trading or for new allocations (Department of Natural Resource and Mines 2000), however it is recognised that these plans should be an important component of any sustainable rural property. They include a property map/plan, soils and land suitability information, water management practices and plans, land management and cropping practices and plans and identify areas of natural and cultural heritage conservation. The Queensland Water Recycling Strategy has set a framework to enable the use of recycled water. The initiative is managed by the Environmental Protection Agency (www.epa.qld.gov.au) and encourages water recycling by governments, industry and the community. Recycling opportunities were identified for agriculture, aquaculture, industry, urban design, aquifer storage, stormwater, grey/black water amongst other topical areas. The water reform agenda of COAG led to the development in October 2000 of SunWater, as a government owned corporation. The initiative is part of promoting private sector involvement in managing water infrastructure leading to fairer water costing (Department of Natural Resource and Mines 2002a). Water metering for monitoring water use in irrigation is to be implemented gradually (Department of Natural Resource and Mines 2002b). This follows water metering in urban areas over several years. 2.2.6. INSTITUTIONAL AND ADMINISTRATIVE ARRANGEMENTS
The Queensland Government enacted the Water Act 2000 to provide a legislative framework for the management, planning and allocation of water resources in Queensland. Under the Act, Water Resource Plans (WRP) will be progressively completed for water catchments throughout Queensland (Qld Govt 2000). These plans aim to: • Protect river health and aquatic habitats by identifying environmental flow needs; • Specify existing water entitlements and assess the capacity of the water resource to
support these entitlements; • Identify any further allocations which may become available without compromising
environmental needs or without adversely affecting existing water users; • Involve the community and industry in determining water management strategies and
in identifying an appropriate balance between environmental and consumptive needs; and
• Identify catchment wide monitoring and reporting requirements. A central feature of the WRP process is the use of a basin-wide hydrological model to simulate river flows and possible water usage across the catchment. Following completion of the WRP, Resource Operations Plans (ROP) are to be developed for each catchment. ROPs will outline processes for dealing with unallocated water identified in the WRP and take account of: • Projected water needs and/or priorities for environmental, urban, industrial and rural
priorities; • Strategies, including any development proposals, for meeting those water needs or
priorities when there is a shortfall between water supply and water requirements; and • Strategies for the future allocation of water taking into account the effectiveness of
the market in water to meet expected needs. ROPs should provide water users and potential entrants to the water industry with a degree of certainty regarding the availability of water and strategies and priorities for release of additional water allocations.

CONDITION REPORT: SUSTAINABLE USE 25
A Water Resource Plan has been completed for the Barron River and this catchment is currently subject to the ROP process. A Wet Tropics Water Resource Plan is under consideration from the Daintree River catchment to the Herbert River catchment. River Improvement Trusts (RITs) are statutory bodies made up of local authorities, special interest members and an independent chair. The Governor in Council appoints members of the RIT. Their charter is to repair flood damage, to put in place flood mitigation practices and to provide river stabilisation management practices. The statutory power of the RIT ensures that actions are undertaken and they provide a useful collaborator to catchment management associations and the NRM Board in achieving natural resource management results. There are five River Improvement Trusts between the Daintree and Herbert River catchments. Local authorities are the major financial providers of RIT activities, combined with grants and other funding when available.

26 SUSTAINING THE WET TROPICS: A REGIONAL PLAN FOR NRM
3. SOIL HEALTH
Soil health may be defined as ‘the quality that enables a soil to provide the proper compounds, in the proper amounts, and in the proper balance for the growth of plants when other factors are available’. It is normally compared to undisturbed systems and is broadly classified under three categories - chemical, physical, and biological. The chemical components of soil health are usually characterised by soil pH (acidity and alkalinity), electrical conductivity (a measure of salinity), soil organic matter (total C and labile C), soil mineral nutrient composition and contents (particularly N, P, and K), clay mineralogy, composition and content, cation (CEC) and anion (AEC) exchange capacities, and oxidation-reduction (Eh) status. A soil is generally characterised by a numerical value for any given characteristic. For example, if a soil of pH 6.5 decreases to 5.6 due to disturbance, then pH becomes an indicator of soil health. The most commonly used indicators of soil physical health are plant available volumetric soil water content, infiltration, hydraulic conductivity, bulk density and porosity, soil aeration and gas diffusivity, penetration resistance, soil structural stability and erodibility. Soil biological health is usually characterised by composition and density of soil microorganisms, which performs the most important role in the turn over of C and N in soil and preserve the soil as a living dynamic entity. Thus, the dominance or absence of a given microorganism in a disturbed soil is considered an indicator of soil biological health. Though soil health is broadly classified into three categories and characterised by indicators, in reality they are interdependent. 3.1. ACIDIFICATION 3.1.1. DEFINITION
Accelerated or induced acidification of soils is caused by agricultural production systems that have radically altered natural ecosystems. It is measured as a decrease in pH and contrasts with acidification of soils as a natural process that occurs very slowly over thousands of years. Soil acidity has been recognised as a serious national and international soil degradation issue (Evans 1991; NLWRA 2001). Soil pH affects the availability of all plant nutrients, either directly or indirectly and the result is reduced plant productivity. Adverse impacts of soil acidity may be due to one of more of the following: • An increase in the availability of toxic elements such as aluminium and
manganese. • Decrease in availability of calcium, magnesium and molybdenum. • Reduced soil microbial activity (particularly affecting nitrogen,
phosphorus and sulfur cycles) and biodiversity. Soil pH may be measured in either water (pHW) or calcium chloride (pHCa). All references in this report refer to pHW unless otherwise stated, as this is the traditional method used in Queensland. pHW is typically 0.7 to 0.8 higher than pHCa (see Ahern et. al. 1995 for conversion models). Soils have been classified as extremely acidic (<5.0), highly acidic (5.0-5.6) and moderately acidic (5.6-6.4).
• Chemical: Soil pH, electrical conductivity), soil organic matter (total C and labile C), soil mineral nutrients composition and contents (particularly N, P, and K), clay type, mineralogy, and content, cation (CEC) and anion (AEC) exchange capacities, and oxidation-reduction (Eh) status.
• Physical: Plant available volumetric soil water content, infiltration, hydraulic conductivity, bulk density and porosity, soil aeration and gas diffusivity, penetration resistance, soil structural stability and erodibility.
• Biological: Composition and density of soil microorganisms.
Box 7: Indicators of soil health.
The major processes are:
• Export of alkalinity in produce (e.g. sugarcane, bananas, hay, milk etc)
• Leaching of nitrate from N fertilisers like urea and DAP below roots. This leaves acidity from the fertiliser in the soil.
• Export of produce is unavoidable but nitrate leaching can be managed. A key point is better matching N fertiliser supply with plant demand (total rate and dose, timing, placement).
• A practical method of correction of soil acidity is the use of nitrate fertilisers (e.g. potassium nitrate, calcium ammonium nitrate) in high value production systems. This is effective to at least 80 cm.
Box 8: Soil acidification processes.

CONDITION REPORT: SUSTAINABLE USE 27
3.1.2. CONDITION, TRENDS AND CURRENT STATE OF KNOWLEDGE
Two major factors causing soil acidification are leaching of nitrate and export of plant and animal products from paddocks. Nitrogen (N) is usually applied as urea or ammonium products (e.g. DAP, ammonium sulfate). These are rapidly converted to nitrate by a process that leaves acidity in the soil. If plants absorb all of the nitrate from urea, there is no effect upon soil acidity because of neutralization by plants or microbes. However, nitrate is highly soluble and subject to leaching below the roots leaving the acidity behind in the soil. Ammonium products always acidify the soil. In contrast, nitrate sources of N (e.g. potassium nitrate, calcium nitrate) alkalise the soil. Current research at Mareeba has clearly demonstrated that remediation of soil acidity in the subsoil can be practically achieved simply by changing the N source from urea to nitrate forms (Webb 2002). Over a two year period, they were able to alkalise a kandosol (i.e. reverse soil acidity) by a profile average of 0.5 (pHCa) to a depth of 80 cm. Export of product such as fruit, sugar cane and animals is an essential part of any farming business but results in the export of alkalinity, which is equivalent to acidification of the soil. Alkalinity may be transported from the general paddock to stock camps in animal excreta. There are very clear contrasts between natural and modern agricultural systems. In the former, N input is low and mainly in the form of leaf litter (the ultimate ‘slow release fertiliser’). Extensive root networks minimise leaching of nitrate while export of plant and animal products is minimal. All major cropping systems are acidifying but the rates are particularly high for bananas (Table 14). Acidification rates for N fertilised grass pastures used for beef production on the wet tropical coast have been reported by Teitzel et. al. (1991) and Gilbert et. al. (1995). Rates of pH change in 0-10 cm were from -0.013 to - 0.021 units per year for applications of 180 kg/ha/yr as urea (Teitzel et. al. 1991). These low rates imply limited leaching of nitrate. More detailed work by Gilbert et. al. (1995) showed that an N application of 250 kg/ha as urea requires a lime application of 0.5-0.6 t/ha to maintain neutrality. However, the limited effect of lime on subsoil acidity remains an issue. The high rates reported for stylosanthes pastures were for intensively managed legume-dominant pasture that are rarely found. Table 14: Acid addition rates for north Queensland cropping systems. (Source: Noble et. al. 1997; Moody & Aitken 1997). a Summer crop-winter fallow, e.g. maize or peanuts-fallow.
Cropping system Soil type Rainfall Years since clearing
Acid addition rate (kg/ha/yr)
Sugar cane Kurosol, Hydrosol 1700-4000 5-70 140-235
Banana Ferrosol, dermosol 3100-4100 25-45 1400-2000
Summer crop-winter fallowa Ferrosol 950-1700 30-89 40-150
Grass-legume and grass N cut for hay Ferrosol, Kandosol 1300-4100 30-60 50-550
Stylosanthes pasture (grazed)
Dermosol, Kandosol, Ferrosol 860-1000 10-24 0-175
There is direct evidence of the extent of nitrate leaching past the root zone of sugar cane, bananas and pasture (Prove and Moody 1997) as well as measures of historical loss by analysis of soil cores to 12 m in the Johnstone catchment (Rasiah and Armour 2001; Rasiah et. al. 2003a). The latter has revealed N loads in soil profiles as high as 4000 kg N/ha under long term sugarcane and banana production. The National Land and Water Resources Audit (NLWRA) commissioned detailed assessments of soil acidification, which:

28 SUSTAINING THE WET TROPICS: A REGIONAL PLAN FOR NRM
• Mapped the distribution of acidic soils in agricultural regions of Australia; • Determined the rates of acidification for regional farming systems; • Determined the pH buffering capacity of Australian soils; and • Assessed the decrease in plant yield and off-site effects of acidity. Current information on the percentage of agricultural land in each catchment in the extremely and moderately acidic categories for surface and subsoils are presented in Table 15. Based on the most conservative figures reported, there are 71,000 ha of extremely acidic surface soil and 66,000 ha of extremely acidic subsurface soil in the region. The impact of the acidity may be appreciated by considering the quantity of lime required to increase the soil pH of extremely acid soils to 5.6. This has been calculated to be 480,000 t with a maintenance rate of 17-85,000 t/yr for the river basins listed in Table 15 (Table 32 in Appendix, NLWRA 2001). Current rates of application appear to be much lower than these broad scale estimates. Rates of acidification in soils may be assessed with by a risk assessment that calculates the time before soils reach a target pH of 5.6 for low and high rates of acid addition (Table 16). This is an early warning to land managers about the extent of acidification in catchments. Table 15: Percentage of surface soil samples within two pH categories and estimated area of agricultural land (thousand hectares, 103 ha, ± 3000 ha) for catchments based on data from commercial laboratories (first number) and ASRISa (second number) (Source: NLWRA 2001). aASRIS - Australian Soil Resources Information System.
Surface soil Subsoil (30-40 cm)
AWRC River Basin (number)
Extremely acidic (<5.0)
Highly acidic
(5.0-6.6)
Area (10³ ha)
Extremely acidic (<5.0)a
Highly acidic (5.0-6.6)a
Area (10³ ha)a
Daintree (108) 5-40 85-49 16 49 46 16
Mossman (109) 12-5 66-84 15 38 53 15
Barron River (110) 4-5 34-45 39 5 35 39
Russell-Mulgrave (111) 10-25 55-64 46 13 80 46
Johnstone (112) 22-44 42-54 94 13 85 94
Tully (113) 12-35 41-62 41 38 61 41
Murray (114) 2-14 88-64 29 18 80 29
Herbert (115) 48-22 25-33 170 7 35 170 Table 16: The percentage of surface soil (0-10 cm) above pH 5.6 within each time category with a low and high acid addition rate (50 and 250 kg lime/ha/yr) to decrease to a pH of 5.6 and estimated area (thousand ha, 103 ha) above pH 5.6 (Source: NLWRA 2001).
AWRC River Basin 0≤5 years 5-10 years 10-20 years ≥20 years Area (10³ ha)
Daintree 7-24 0.48 10-28 83-0 2
Mossman 75-95 5-0 14-5 5-0 2
Barron 29-75 16-21 20-4 35-0 2
Russell-Mulgrave 61-100 34-0 5-0 0 4
Johnstone 91-100 0 0 0 1
Tully 89-100 11-0 0 0 1
Murray 65-100 27-0 9-0 0 7
Herbert 45-89 25-6 14-4 15-2 79

CONDITION REPORT: SUSTAINABLE USE 29
3.1.3. CRITICAL ISSUES, IMPACTS AND THREATS
A major issue is the lack of awareness of the problem. This is due to the insidious nature of soil acidification. The reason is that a slow decline in pH may not be reflected in crop yield because of increased fertiliser application or avoidance of sensitive crop species. There is also a disparity between lime requirement and the current application rates of lime. Subsoil acidity is particularly difficult to correct with liming products due to their extremely slow downward movement, even in well-drained soils under high rainfall and temperatures. Another issue is that the very limited numbers of soil analyses conducted below 20 cm hide the true nature of subsoil acidity, as surface analyses will only reflect applications of liming products. Off-site impacts of soil acidification have not been quantified in Australia but the potential for impact has been recognised as ‘potentially enormous’ (NLWRA 2001). Some of the impacts are: • Increased contamination of ground and surface water by nitrate from N fertiliser; • Reduced plant yields, farm income, land values and domestic/export earnings; • Reduced agricultural options for plant species; • Reduced vegetation cover (including impact on riparian areas) and associated risk of
increased erosion of soil; • Irreversible degradation of soil clay minerals (i.e. reduced soil fertility); • Declining pH of waterways and aquatic environments; and • Increased infrastructure costs from acidity. 3.1.4. CURRENT STATE OF UNDERSTANDING
Soil acidity, particularly subsoil acidity, is not widely recognised as a major sustainability challenge and this is a constraint to remediation. An important concept is that high rates of acidification demonstrate inefficient use of N fertilisers such as urea, with associated adverse impacts on water quality. 3.1.5. POTENTIAL ACTIONS FOR SUSTAINABLE USE
Sustainable use requires management to maintain a system in which pH change is generally neutral, although some change may be desirable in certain extremes (e.g. very alkaline soils used for sugar cane production). Actions for sustainable use are: • Regular soil analysis to at least 50 cm should be conducted annually (or at harvest)
for cropping lands and every 3-5 years for extensive grazing lands. This should be used to monitor trends and guide liming programs;
• Application of liming products (e.g. lime and dolomite); • Control of nitrate leaching, ideally by balancing the plant demand for N with supply
from the soil, with associated benefits to off-site water quality. Some options are: o Application of fertiliser N at appropriate rates, which include the contribution
from other sources (soil reserves, mill mud, etc). o Doses of N that are appropriate to crop age and growth rate. o Selection of N fertiliser (slow release sources may be an option for some
situations); and • Use of nitrate fertiliser for high value production systems. Lime application should be appropriate to the rates of acidification that are occurring and may only be achieved by a regular, soil monitoring program to a depth of at least 50 cm. Data from NLWRA suggest that current application rates of lime on a catchment scale are much lower than desirable (Section 3.1.2). A trade-off for the application of high

30 SUSTAINING THE WET TROPICS: A REGIONAL PLAN FOR NRM
rates of lime may be the use of nitrate N sources (e.g. potassium and calcium nitrates) that alkalise the soil. For sugar cane production, the main options are application of appropriate rates of N fertiliser (e.g. COMPASS, Azzopardi et. al. 2002), removal of areas of poor productivity because any constraints to growth will limit the ability of the plant to absorb N (Reghenzani and Armour 2000) and appropriate rates of lime. A recent paper has challenged the conventional determination of ‘optimum’ N rates from yield response experiments and suggested a reduction in the average N application rate from 160 to 100 kg N/ha (Mallawaarachchi et. al. 2002). The lower rates were justified by economic returns to growers as well as by a reduced environmental impact. Intensively managed horticultural crops (bananas, papaws, lychees, etc) have the most potential for achieving pH neutrality because of the relatively low cost of fertilisers (typically 6%) compared to other inputs. Most of the crops have irrigation systems that allows for split application of N fertiliser. This may be by fertigation where small and frequent application is relatively simple (drippers and under-plant mini-sprinklers) and/or by the ability to water in surface-applied products (overhead irrigation). Selection of more expensive nitrate products is also feasible. The greatest impact on achieving sustainability is likely to come from drastic reductions in rates of applied N. Bananas and papaws typically receive rates that are two to three times higher than that required for optimum yield. However, average rates of application to bananas have decreased from 520 in 1995 to 250 kg/ha/an in 2003 (Daniells 1995; Armour and Daniells 2002; N Richards et. al. 2003; D Hine pers. comm.). Further reductions are possible because bananas may be grown with as little as 150 kg N/ha under careful management, an important consideration in light of the Reef Water Quality Action Plan (Anon 2003). Acidification of grazing land is considered a minor problem. Most of the cattle production is from extensive grazing enterprises (semi-arid tropics) that receive low rates (mostly nil) of fertiliser N. N fertilised grass pastures on the wet tropical coast have low rates of acidification, at least in the surface 10 cm (Teitzel et. al. 1991). The exceptions are intensively managed dairy pastures that receive rates of fertiliser N as high as 450 kg/ha/yr. However, a preliminary experiment has demonstrated that traditional N management may be considerably improved. N fertiliser application was closely matched with plant demand by monitoring ‘degree days’. This allowed the rate of N to be reduced by 30% without affecting yield. An additional benefit was a reduction in plant nitrate concentrations and consequently in nitrate toxicity in cows (Silver et. al. 2003). 3.2. ACID SULFATE SOILS 3.2.1. DEFINITION
Acid sulfate soils (ASS) is the common name given to soils that contain significant amounts of iron sulfides, the most common being pyrite (FeS2). The ASS areas of most concern were formed within the past 10 000 years (the Holocene epoch), after the last major sea level rise. ASS commonly occur on coastal wetlands as layers of Holocene marine muds and sands deposited in protected low energy environments. The ASS found in tropical areas such as Queensland are expected to contain higher levels of iron sulfides than ASS formed in the cooler conditions of the southern states (Powell and Ahern 1999). There are an estimated 2.3 million hectares of ASS located along the coast of Queensland and any estuarine or coastal area below 5 m AHD is potentially at risk. 3.2.2. CONDITION, TRENDS AND CURRENT STATE OF KNOWLEDGE
Within the NRM Board area, ASS have been investigated at different scales in the Moresby River (Dawson and Smith 1997), Ingham and Tully areas (Smith and Ahern 1998), Babinda-Cairns land resource assessment (Sumalee soil type is ASS; Murtha et. al. 1994), East Trinity (Smith et. al. 2003) as well as other surveys for specific developments (Figure 6). The most well known example of ASS is at East Trinity, 1 km east of the Cairns CBD. Actual acid sulfate soils were producing hazardous levels of acid and heavy metal

CONDITION REPORT: SUSTAINABLE USE 31
contaminants and degrading approximately 720 of the 940 ha East Trinity property and the adjacent foreshores. It has been estimated (Hicks et. al. 1999) that since disturbance 30 years ago, the site has produced 72,000 t of sulfuric acid at an annual rate of 34 t H+/ha/yr (Hicks et. al. 1999). Conventional rehabilitation of the soil was estimated to cost $62m (plus labour, capital equipment and earthworks) over the next 25 years. Considerable success with the rehabilitation strategy, lime-assisted tidal exchange management, has been achieved by a multi-discipline, multi-agency team (Smith et. al. 2003).
Figure 6: Potential or actual acid sulfate soil risk. 3.2.3. CRITICAL ISSUES, IMPACTS AND THREATS
Identification in the field is not always easy due to burial by more recently deposited soils of alluvial origin. While permanently waterlogged, these potential ASS soils are

32 SUSTAINING THE WET TROPICS: A REGIONAL PLAN FOR NRM
benign, but upon disturbance the chemical processes are initiated (i.e. turns them into actual acid sulfate soils). When ASS are exposed to air (i.e. no longer in a waterlogged condition), the iron sulfides in the soil react to produce a variety of iron compounds and sulfuric acid. Initially a chemical reaction, the process is accelerated by bacteria such as Thiobacillus ferroxidans. The following chemical equation is commonly used to summarise the whole process (Dent 1986):
FeS2 + 15/4H2O + 7/2O2 Fe(OH)3 + 4H+(aq) + 2SO4
2-(aq)
pyrite + water + oxygen bacteria
ferric hydroxide
+ sulfuric acid
The resultant highly acid soils support a much-reduced range of plant species and acid water draining from them can produce ecosystem damage downstream, including fish kills. The low pH has drastic effect on the concentrations of many metals and metalloids (e.g. a substantial increase in iron and aluminium, as well as zinc, manganese, lead, chromium, nickel, copper and arsenic) in water. Runoff from ASS may have very low concentrations of dissolved oxygen. ASS may affect groundwater quality as well as surface water. Other effects of ASS and drainage water are loss of productivity from agricultural lands and damage to infrastructure such as houses, roads, bridges and retaining walls from corrosion of concrete. The annual cost of ASS disturbance and management in Queensland has been estimated to be more than $180m (Sutherland and Powell 2000). Proponent investigations do not provide certain strategic planning information that resource mapping provides. Such information is often collected in an ad hoc manner. This will vary in quality and cannot easily be combined to provide information required for future land use planning. Such information is not readily available to other agencies or the community for future use. Thus, while the ‘user pays’, only the user may benefit from the information collected. Alternatively, the State, commonly assisted by the LGA and industry (usually sugar cane), can fund a resource mapping program, making the product publicly owned information. 3.2.4. CURRENT STATE OF UNDERSTANDING
There is no comprehensive ASS mapping of the wet tropical coast (WTC) between Ingham and Cape Tribulation. Pilot studies and development investigations have indicated that large expanses of shallow ASS are not likely, as occurs in coastal areas to the south. However, shallow ASS occupy the very fragile and ecologically important areas of the coastal fringe on the WTC. This zone is the subject of development pressure from agriculture, aquaculture, sand extraction and urbanisation, including canal development. While there are not expansive areas of shallow ASS on the WTC, deep marine muds are known to occur at significant distance inland, such as in Tully, along the base of the scarp, between Caravonica and Smithfield, and under the Barron delta. These occur at depths that would not normally affect uses such as agriculture. However, sand extraction and large-scale construction activities have a significant likelihood to intercept these deeper ASS strata. 3.2.5. POTENTIAL ACTIONS FOR SUSTAINABLE USE
Detailed information is available in Soil Management Guidelines (Dear et. al. 2002). This document covers risk assessment, management and avoidance strategies. The first of eight management principles is ‘The disturbance of ASS should be avoided wherever possible’.

CONDITION REPORT: SUSTAINABLE USE 33
3.2.6. INSTITUTIONAL AND ADMINISTRATIVE ARRANANGEMENTS
A state planning policy (SPP 2/02: Planning and Managing Development involving Acid Sulfate Soils) under the Integrated Planning Act 1997 has been issued. This affects local government authorities (LGAs) and developers when preparing or amending planning schemes and when assessing certain development applications. In short, the policy requires that ASS are either not disturbed, or are managed to prevent environmental damage. The State Planning Policy does not necessitate detailed resource mapping, but it does require that LGAs delineate areas of ‘high probability’ in the preparation of planning schemes. These ‘high probability’ areas must be conservative in nature (s5.5, SPP 2/02 Guideline2), and generally based on general, broad scale information such as elevation and geological units. Either this can result in a significant over- or under-estimate of ASS affected lands. Whether or not quality resource information exists, the policy obligates proponents to carry out an ASS investigation appropriate to the scale of the development (s5.2 SPP 2/02). Thus where the local authority has only indicative estimates of ‘high probability’ ASS lands, it may be imposing blanket conditions over non-ASS areas, or be failing to request investigations where they are required. LGAs such as the Gold Coast as well as the cane industry in southeast Queensland have favoured the latter approach. Possession of quality resource information by LGAs is fundamental to the principles of planning. They may elect to have ‘no-go’ zones based on quality data, or allow certain uses with appropriate conditions. The proponent then has clear guidelines, a more definitive basis for costing additional investigations and potentially reduced investigation costs. Alternatively, the LGA may not have sufficient grounds for precluding development on land that it would otherwise wish to deem inappropriate for a particular use. These situations have caused much controversy in the past, and led to less than optimal land usage. State departments such as NR&M, EPA and DPI Fisheries are in a similar position to LGAs. Without resource data, assessment officers are often obliged to adopt an ‘overkill’ approach and either refuse permits or impose inappropriate conditions, again creating unnecessary controversy. Some state departments have officially recognised the need for the proper management of ASS and have endorsed the need for quality mapping. Members of the Interdepartmental Committee on ASS are:
Local Government and Planning Department of Main Roads
Department of State Development Department of Transport
Environment Protection Agency Department of Primary Industries
Department of Public Works Queensland Health 3.3. SOIL EROSION (HILLSLOPE, GULLY, BANK) 3.3.1. DEFINITION
Soil erosion is the natural process that removes soil by water (and wind, but water is the main force in this region) particularly where there is high intensity rainfall and steep slopes. Erosion has been classified as: • Splash erosion, where raindrop impact acts as both the detaching and transport agent
in the absence of ponded water. Splash erosion occurs before ponding and runoff is initiated. The distance of transport is typically small;
• Sheet erosion, where the detaching agent is raindrop impact and the detached soil is transported by a thin and more or less uniform layer of overland flow;
2 The State Planning Policy 2/02 Guideline: Acid Sulfate Soils (SPP 2/02 Guideline) is a
accompanying document to the policy that provides advice and information on interpreting and implementing the policy. Please refer to Version 2 of this document.

34 SUSTAINING THE WET TROPICS: A REGIONAL PLAN FOR NRM
• Rill erosion, caused by concentrated overland flow where there is high energy and shear stress associated with the flow. Rills are defined as flow channels that can be corrected by tillage and are typically shallow;
• Gully erosion, where rills become large and not readily corrected by tillage. Gullies develop from rills due to large quantity of concentrated surface water; and
• Mass movement, where soil movement is caused by the forces of gravity. A pre-condition for mass movement is the development of a slip plane with low shear strength.
Erosion may be greatly accelerated by overgrazing, clearing, cultivation and urban activities such as the development of real estate. Associated degradation of riparian vegetation accelerates erosion of creek and riverbanks and reduces the capacity to trap sediment and nutrients. However, sediment transported from a point does not immediately travel to a catchment outlet. The sediment delivery ratio (SDR) is the ratio of sediment delivered at a catchment outlet to the erosion within the catchment area. It recognises that material, which moves from a point in the catchment, does not necessarily move immediately to the catchment outlet. This means that small-scale soil erosion estimates need to have a SDR applied to them to provide estimates of sediment movement to the catchment outlet. However, the size of the catchment and hence the location of the catchment outlet is determined by the particular situation and therefore SDR is not a simple calculation. For example, the National Land and Water Audit calculated sediment and nutrient flowing from whole river systems into the Great Barrier Reef Lagoon. In contrast, a local authority may only be interested in what sediment may be deposited on a road network in their local area. Finally, it is necessary to recognise that eventually, all material moved from a point will reach the catchment outlet. The enrichment ratio (ER) is a measure of the enrichment of sediment compared to the source material, and is generally applied to clay and to nutrient fractions. This recognises that sediment can be enriched by clay because it stays in suspension longer in overland flow than other size fractions, or that nutrients are concentrated in sediments because soil erosion removes relatively more nutrient rich surface soil. A generalised equation for ER is:
ER = concentration in sediment /concentration in topsoil One of the variables with ER is determining the depth of topsoil, which varies with the individual situation. 3.3.2. CONDITION, TRENDS AND CURRENT STATE OF KNOWLEDGE
Rates and impact of erosion have been reported by NLWRA (2001) and reviewed by Neil et. al. (2002) and Brodie (2002). While there is some disagreement about the impact of increased sediment loads on the GBR, targets for a reduction in sediment loads to the GBR have been proposed by the GBR Water Quality Action Plan (Brodie et. al. 2001). Paddock scale measurements have been undertaken for a range of cropping/landscape systems. On the wet tropical coast with rainfall of up to 3500 mm/year, soil erosion losses from conventionally cultivated canelands were in the range 47-505 t/ha/yr, with an average annual loss of 148 t/ha/yr. The introduction of no tillage reduced this loss to <15 t/ha/year, but ground cover did not affect soil erosion greatly (Prove et. al. 1995). Soil erosion studies currently underway at Kairi on the Atherton Tablelands (rainfall of 1252 mm) have shown soil erosion losses of between 0 and 30 t/ha/year for grass pastures and bare cultivated land (Cogle et. al., in press). There are distinct differences between pastures of the Wet Tropics (both beef and dairy) and extensive grazing in the semi-arid tropics. On the southern Atherton Tablelands (Barron and Johnstone River catchments), most of the dairy production is from permanent pastures that receive nil cultivation, except during establishment. As a result, sediment

CONDITION REPORT: SUSTAINABLE USE 35
losses are very low (Moody et. al. 1996). Sediment losses from the intensively managed, irrigated winter rye grass pastures are expected to be similarly low. These areas occupy only ≈7% of the landscape and are increasingly established (≈80%) with minimum tillage in mid-late April, generally avoiding the risk of intensive rainfall (H Smith, pers. comm.). A similarly low loss of suspended sediments (<1 kg/ha/year) was measured from beef production in the Wet Tropics (Moody et. al. 1996). Detailed estimates of sediment loads of within paddock runoff have been undertaken on the Atherton Tableland by rainfall simulation at very high rainfall intensities of 98 (pasture sites) to 145 (rainforest sites) mm/hour (Burton 2001). Sediment loads were an average of 578 mg/L for pasture (range 23-4181 mg/L) and 291 mg/L for rainforest. The results for the pasture sites were influenced by a very high load of 4181 mg/L from a cattle pad located on a farm road in over-grazed pasture. If these data are excluded, the mean of sediment loads from well-managed pasture was 278 mg/L, which was similar to rainforest. In the semi-arid tropics, beef production occupies a large area of the Herbert catchment (1,165,000 ha) and is an important contributor to sediment loads. On grazing lands near Charters Towers, which is similar to the upper Herbert and other semi-arid tropics areas, soil loss from grazed lands ranged up to 1 t/ha/yr depending on cover and seasonal rainfall (Scanlan et. al. 1996; McIvor et. al. 1995). Critical relationships between cover and relative soil loss and runoff have been reported by Gardner et. al. (1990). These clearly demonstrate the importance of about 40% cover at the end of the dry season as a critical target for reducing runoff and soil loss. While this research was undertaken in the Burdekin basin, the results are applicable to the Herbert. Reduced groundcover reduces the frequency of fire, which in turn encourages tree thickening with further reductions in groundcover due to competition (Sharp and Whittaker 2003). Fire management to control the serious problem of tree thickening is currently being researched in the Gulf region (Kernot and Grice 2003). Stream bank erosion is accelerated by cattle with access to watercourses and reduced cover on frontage land. The reduced cover is due to high stocking rates and invasion by weed species (lantana, rubbervine, pink burr and devils fig) (Burrows et. al. 2002; Kernot and English 2003). Rehabilitation of degraded frontage land reduced the bedload to 30% of that from uncleared native pasture in each of two wet seasons (Kernot and English 2003). The rehabilitation included removal of exotic weeds, fencing and sowing of improved grasses and legumes. A national broad scale of soil erosion was conducted by NLWRA and used by GBRMPA to evaluate the risk to the GBR, based on the increase in sediment between 1850 and current rates (Table 17). Streams have been categorised in low (Daintree and Mossman Rivers), medium (Barron, Russell-Mulgrave, Tully, Murray and Herbert Rivers) and high risk (Johnstone River). The risk assessment has been used to develop sediment export targets to be achieved by 2011. Modelling of the Herbert River catchment with SedNet with more detailed data has calculated that hillslope erosion is the dominant source of sediment (52%), with equal contributions from gully and stream bank erosion (Bartley et. al. 2003). This work has identified the relative importance of landuse and area of the catchment occupied by that landuse. However, observation suggests that the cover component of 60% used in the modelling is an unrealistic estimate of cover at the end of the dry season, when risk of storm rain and potential for erosion is high. Recent work (Brodie et. al. 2003) has extended the Herbert River analysis to all GBR catchments and this provides a valuable framework for identifying areas within all catchments for targeted management and research. 3.3.3. CRITICAL ISSUES, IMPACTS AND THREATS
Soil erosion has serious impacts both on-site and off-site. The on-site effects are loss of topsoil and associated nutrients as well as a decline in soil structure under severe erosion. There is a reduction in plant productivity in all cases. Loss of topsoil is particularly important in the transport of P from the landscape into streams because 77-80% of the P was transported with sediment in the Johnstone and Herbert Rivers (Hunter and Walton 1997) . P has a major impact on water quality.

36 SUSTAINING THE WET TROPICS: A REGIONAL PLAN FOR NRM
Table 17: Sediment exports, risk factors and sediment targets with estimates of the proportion of sediment attributable to hillslope, gully or stream bank erosion (Source: 1(Brodie et. al. 2001), 2National Land and Water Resources Audit 2001). Sediment risk is the magnitude of the increase in sediment load between 1850 and present, where low = 1 to 5-fold, medium = 5 to 12-fold and high = ≥ 12 fold.
AWRC River Basin
Current Export (t/yr)1
Sediment Risk1
Sediment Target
reduction factor1
2011 Target sediment
export (t/y)1
Hillslope Erosion (% of input to river)2
Gully Erosion (%
of input to river)2
Stream bank Erosion (% of input to
river)2
Daintree 94,132 L 1 94,132 82 1 17
Mossman 15,131 L 1 15,131 78 2 20
Barron 145,877 M 0.67 97,738 79 10 10
Russell-Mulgrave 222,425 M 0.67 149,025 70 2 28
Johnstone 305,142 H 0.5 152,571 65 6 29
Tully 88,084 M 0.67 59,016 33 5 63
Murray 17,098 M 0.67 11,456 27 8 65
Herbert 664,787 M 0.67 445,407 75 13 12 Soil erosion has detrimental impacts on downstream streams, reservoirs, lakes and estuarine and marine environments (see Section 5.1.3 for effects on Fish Habitats). Impacts of increased sediment loads are: • Reduced stream clarity; • Diminished light available for photosynthesis; • Increased treatment of water for human use; • Increased flooding of land; and • Reduced capacity of reservoirs. 3.3.4. CURRENT STATE OF UNDERSTANDING
Sediment exports based on NLWRA data for all streams of the NRM Board area have been re-calculated with more detailed input data (Brodie et. al. 2003). The results, which may be considered to be hazard maps, will provide powerful tools for catchment management as for the Herbert River revision (Bartley et. al. 2003). The next phase will require the critical step of translation of these catchment scale model outputs to property and paddock scale, where landscape management is actually undertaken. Significant improvements in landscape management will require substantial investment in property management planning (PMP) and infrastructure (e.g. fences, watering points). 3.3.5. POTENTIAL ACTIONS FOR SUSTAINABLE USE
A simply stated objective is that soil should be retained within the landscape. Management should be undertaken as part of a PMP and include Best Management Practice (BMP) and/or Environmental Management System (EMS). Examples are COMPASS for sugar cane (Azzopardi et. al. 2002), banana EMS (Hine et. al. 2003) and the Grazing Land Management Education Manual (Figure 7, EDGE Network 2003). Common targets for all agricultural systems are: • Consideration of land suitability based on erosion hazard; • Management of ground cover; • Rehabilitation of riparian zones; and • Management of surface water and drains to control erosion (e.g. contour banks,
grassed waterways, etc.).

CONDITION REPORT: SUSTAINABLE USE 37
In the forestry industry there has been an effort to develop guidelines for sustainable production. A Code of Practice for Native Timber Harvesting has been developed by DPI and EPA, and is available on the EPA website (www.epa.gov.au). Guidelines also exist for private rainforest harvesting (Annandale 2002), while the Queensland Forest Practices code is currently being developed for plantation timbers by EPA and the Department of State Development. For cultivated land: • Avoidance of steep land from cultivation (Table 18); • Removal of seriously flood-prone areas from production due to the risk of wholesale
removal of entire plants as well as nutrient enriched topsoil; • Management of erosion prone areas of paddocks identified in recent research in the
Herbert River catchment (Roth et. al. 2002); • Minimum tillage practices such as the use of a green cane trash blanket (GCTB) in
cane; forming up mounds and growing pasture prior to planting bananas and papaws in a narrow strip that is cultivated or sprayed out to minimise soil disturbance;
• Management of ground cover in plantation crops, particularly in the inter-row where bare areas allow erosion. An enhancement of this for bananas is to use mowing/mulching techniques that discharge plant material from the inter-row to the plant row, thus increasing organic matter and nutrient capture in the row; and
• Placement of banana trash on the shoulder of rows to reduce movement of soil from the mound to the inter-row.
For grazing lands, particularly the semi-arid tropics due to large areas and less reliable rainfall to maintain ground cover: • Management of pasture cover by stocking rates and access. Grazing management
targets with the aim of maintaining land in condition A or B are an essential tool; • Prevent or manage tree and shrub thickening; • Control of weeds; and • Management of stock access to riparian areas.

38 SUSTAINING THE WET TROPICS: A REGIONAL PLAN FOR NRM
‘A’ Condition (or ‘Good Condition’) – 100% of original carrying capacity:
• Good coverage of 3P (Perennial, Palatable and Productive) grasses for that land type with less than 30% bare ground.
• No significant weed infestations. • No erosion and good soil surface
condition. • No sign, or early signs, of woodland
thickening.
‘B’ Condition (or ‘Fair Condition’) – 80% of original carrying capacity:
Has one or more of the following: • Some decline in 3P grasses, increase
in other species (less favoured grasses, weeds) and/or bare ground (>30% but <60%).
• Some decline in soil condition, some signs of previous and/or current susceptibility to erosion is a concern.
• Some thickening in density of woody plants.
‘C’ Condition (or ‘Poor Condition’) – 55% of original carrying capacity:
Has 1 or more of the following: • General decline of 3P grasses, large
amounts of less favoured species and/or bare ground (>60%).
• Obvious signs of past erosion and/or susceptibility currently high.
• General thickening in density of woody plants.
‘D’ Condition (or ‘Very Poor Condition’) – 20% of original carrying capacity:
Has one or more of the following: • General lack of any perennial grasses
or forbs. • Severe erosion or scalding, resulting
in hostile environment for plant growth.
• Thickets of woody plant cover most of the area.
Figure 7: Grazing Management Targets to improve regional ecosystems and land condition, and optimise primary production (Source: EDGE Network 2002).

CONDITION REPORT: SUSTAINABLE USE 39
Table 18: Diagnostic land limitation class for various crops on basaltic soils (Source: Murtha and Smith 1994).
Agricultural Suitability Class
Arable cropping (slope %)
Horticultural tree crops (slope %)
Improved pasture (slope %)
1. Minor limitations <2 or 3 <10 <10
2. Slight limitations 3-8 10-15 10-20
3. Moderate limitations 8-15 15-20 20-30
4. Severe limitations 15-20 20-30 30-35
5. Unsuitable >20 >30 >35 3.4. SALINITY 3.4.1. DEFINITION
Salinity is the presence of soluble salts in soil or water. Salinisation is the process of salts accumulating in soil or water and is caused by changes to catchment water balance. In dryland situations, it is induced by changes in vegetation composition and density. Under irrigated conditions, the efficiency of applied irrigation water is an additional factor determining salinisation. Salts originate in the soil profile and are mobilised by the changes in the water balance. Salt may also be introduced via groundwater sourced irrigation water. Salinity is often identified under two important headings: • Salinity hazard refers to the inherent characteristics of the landscape that predispose
it to land and water salinity; and • Salinity risk refers to the probability that land or water salinity may develop if certain
management practices or land use changes occur. 3.4.2. CONDITION, TRENDS AND CURRENT STATE OF KNOWLEDGE
It has been recognised as a serious soil degradation threat in Australia and has led to the implementation of the National Action Plan for Salinity and Water Quality. A Salinity Audit has identified areas that are subject to salinity from geological and climatic factors been conducted across Australia to measure the extent of salinity. (http://audit.ea.gov.au/ANRA/ land/docs/national/Salinity_QLD.html). An estimated 48,000 hectares of land in Queensland are affected by salinity, with an area of over 3 million hectares having the potential to become affected by the year 2050. In the Wet Tropics region, very small areas are currently affected by salinity. These are: • In the northern part of the Mareeba-Dimbulah Irrigation area (McClurg 1990;
Malcolm et. al. 1992). The Cattle Creek area within the irrigation area west of Mareeba is in the Mitchell River catchment, but is adjacent to the Wet Tropics region and contains areas of saline groundwater (Lait 1998). The direction of groundwater movement is unclear so that rising groundwater levels may threaten the quality of groundwater within the Wet Tropics; and
• In the western parts of the Herbert River catchment. Some areas that have been mapped by Land Resource surveys (Heiner and Grundy 1994, Grundy and Heiner 1998, Enderlin and Neenan 2000) have been identified as having saline and sodic properties, particularly at depth. Northern parts of the Burdekin catchment, which has features that are similar to the adjacent upper Herbert catchment, have been identified in the Salinity Hazard map.
3.4.3. CRITICAL ISSUES, IMPACTS AND THREATS
Adverse impacts from salinity include: • Reduced agricultural productivity;

40 SUSTAINING THE WET TROPICS: A REGIONAL PLAN FOR NRM
• Reduced water quality; • Loss of biodiversity; and • Damage to infrastructure (e.g. roads, buildings) with resultant increased costs for the
whole community. Three key issues for management are: • The long response time between changed land management and changes in
groundwater; • An outbreak of salinity may appear a long way from the cause; and • A range of scales, local, sub-catchment and regional with different time scales and
different management responses. On a national scale, there is an estimated three-fold increase in the area at risk of dryland salinity over the coming decades. The Salinity Audit has concluded that substantial changes in the water balance, and therefore in land use, are required to address this threat. In northern Australia, protection and prevention management options are still available, implying that northern Australia has potential to avoid degradation from dryland salinity. 3.4.4 CURRENT STATE OF UNDERSTANDING
Further mapping of salinity hazard is appropriate based on the land resource surveys that have already been completed. This is particularly the case in the western parts of the region and if broadscale tree clearing is to be undertaken. Management practices to manage potential salinity issues in the irrigation area need to be developed and implemented. 3.4.5 POTENTIAL ACTIONS FOR SUSTAINABLE USE
In a general sense, agriculture and other land management should be adapted to suit Australian landscapes. ‘Management options in regions already affected by dryland salinity will need to take account of groundwater characteristics. These varying characteristics have been broadly grouped by groundwater flow systems during the National Land and Water Resource Audit's program. Solutions will be based on engineering and innovative farming systems and productive use of saline resources. In many cases, management responses will involve trade-offs between land use patterns and water balance responses. Sometimes, the preferred option will be to `buy time' to allow solutions to be developed. Engineering options are important and may be preferred for protection of key assets.’ The Salinity Management Handbook (Salcon 1997) provides valuable information on the sustainable management of soils and landscapes for salinity management. 3.5 FERTILITY DECLINE (CHEMICAL, PHYSICAL,
BIOLOGICAL IN SITU) 3.5.1 DEFINITION
Fertility decline (also termed soil fatigue and soil degradation) may be due to chemical, physical or biological factors or a combination of these. Salinity may reduce soil fertility due to its impact on chemical and physical fertility (Section 3.4). 3.5.1.1 Chemical fertility
The most important aspects of chemical fertility decline are: • Acidification with associated reduction in microbial activity/diversity as well as
reduced cation exchange capacity in soils with variable charge (e.g. ferrosols). High pH or excessive alkalisation from exposure of highly alkaline sub-soils occurs
CONDITION REPORT: SUSTAINABLE USE 41
occasionally (e.g. some Burdekin soils). Acidification has been discussed in Section 3.1;
• Organic matter decline and associated reduction in nutrient holding capacity; and • Decline in fertility due to disparity between input from fertiliser and other sources
and the nutrient output in produce. An example is the depletion of soil S reserves in cropping systems due to the use of high analysis fertilisers that contain nil S. Excessive application of nutrient may also cause a reduction in fertility by producing a toxicity or imbalance that affects plant productivity (e.g. excessive P application to macadamia soils in the absence of soil analysis has induced Fe deficiency).
3.5.1.2 Physical fertility
Soil physical degradation has been described in the most general sense as a ‘change for the worst’ in the soil structure (McGarry et. al. 1999). It is the loss of soil air spaces from compression and shear forces from cultivation or animal traffic. This reduces the ability of the soil to supply water and nutrients to plants, and allow gaseous exchange with the atmosphere. These changes are shown as an increase in bulk density and a reduction in total porosity. 3.5.1.3 Biological fertility
Soil biota includes a diverse range of organisms that largely control soil chemical and physical properties. Examples of control are regulation of soil organic matter and nutrient cycling, maintenance of soil structure and biological degradation of pollutants. The biota includes microorganisms (bacteria, fungi), microflora (protozoa, nematodes), microarthropods (collembola, mites) and macroorganisms (earthworms, ants, termites). The total biomass in fertile soils may exceed 10 t/ha on a wet weight basis. A decline in the biological health of the soil includes loss of microbial biomass and biodiversity as well as an increase in pests such as parasitic nematodes and diseases (particularly soil pathogens). 3.5.2 CONDITION, TRENDS AND CURRENT STATE OF KNOWLEDGE
It is usually difficult to separate the effects of a reduction in the chemical, physical and biological fertility of a soil because they are intimately linked. A local research program, the Sugar Yield Decline Joint Venture, has been investigating these three components for 10 years (Garside 2003). The yield decline in sugar cane monoculture is caused by the soil health problems of low organic matter, low pH, poor structure from excessive cultivation and heavy machinery, and reduced microbial biomass and biodiversity (Garside 2003; Pankhurst et. al. 2003). Integrated research programs such as this have been rare. 3.5.2.1 Chemical fertility
Loss of organic matter is a critical component of soil fertility decline, but is not been adequately measured by the conventional organic carbon method of Walkley and Black (Walkley 1947). That method does not separate labile and non-labile fractions because it also measures inert charcoal that can comprise a large proportion of the total soil organic matter. Labile carbon has an important role in key chemical and physical properties of ferrosols in the Atherton Tableland, Lakeland and South Burnett areas (Bell et. al. 1998). This role has been supported by recent runoff plot research at Kairi (Cogle et. al. 2003 in press). Similarly, low labile carbon in sugarcane monoculture has been implicated in poor soil health (Pankhurst et. al. 2003). Broad scale data on nutrient balances for the macronutrients; N, P, K, Ca, Mg and S for statistical local areas (SLA) are available from the NLWRA (2001). They are based on estimates of nutrient inputs and outputs from the SLA for cropping, pasture, horticulture and sugar cane production. Data for six Wet Tropics SLAs have been collated (Table 19). • Median N and P balances were positive (inputs>outputs) in all SLA; • Median K balance positive for all SLA apart from Atherton;

42 SUSTAINING THE WET TROPICS: A REGIONAL PLAN FOR NRM
• Median Ca and Mg were nearly neutral but strongly negative balances were recorded for sugar cane production; and
• Median S often negative for sugar cane but positive for other systems. Positive balances indicate that fertiliser application rates may be refined with associated positive environmental results for N and P. N fertiliser management has been discussed in detail in Acidification (Section 3.1). P warrants particular attention as the most common soil P tests (Colwell extractable P, BSES extractable P) are quite reliable for measuring P accumulation/depletion and can thus provide valuable guidance for monitoring the fertiliser program as well as providing an indication of risk associated with off-site movement via erosion. Strongly negative balances indicate that the nutrients are likely to limit productivity at some stage, dependent upon the soil reserves, plant demand and rate of output. Table 19: Median nutrient balances (minimum, maximum) in t/Statistical Local Area for cropping, pasture, horticulture, sugar cane (Source: NLWRA 200).
N balance P balance K balance Ca balance Mg balance S balance
Atherton 3 (-78, 1064) 22 (-47, 91) -24 (-103, 312) -5 (-20, 5) -5 (-34, -2) 8 (-191, 87)
Cardwell 351 (96, 1914) 95 (56, 122) 4 (-231, 143) 3 (-150, 32) -6 (-155, 0) 2 (-135, 4)
Douglas 77 (44, 661) 24 (15, 33) 11 (-378, 68) 0.4 (-86, 7) 0 (-87, 0) 31 (2, 60)
Eacham 129 (263, 4911) 113 (38, 165) 256 (-2, 803) 5 (0, 35) 0 (-1, 2) 91 (4, 161)
Herberton 1313 (519, 71715) 124 (43, 304) 403 (-12, 826) 19 (-1, 44) 0 (-4, 6) 16 (-176, 142)
Johnstone 660 (78, 2627) 100 (90, 183) 202 (-892, 472) 13 (-244, 75) 0 (-230, 3) 10 (-58, 91) More detailed but still regional assessments of the soil fertility of sugar cane soils have been undertaken. In the north sugar cane production area (equivalent to NRM Board area from Daintree south, but including the Black River), soil pH values and K concentrations are low. For soil phosphorus, mean BSES P values were 97 mg/kg (± 85 standard deviation, range 2-360 mg/kg; Rayment et. al. 1998). This is more than four times the critical BSES P value for sugar cane. However, the greatest impact of high soil P concentrations will be offsite, if soil is removed by erosion. An assessment of this environmental risk will not only require the soil P test value but also measurement of the key soil property, P buffer capacity (P ‘fixing’ ability). Risk increases as soil P test values increase and soil P buffer capacity decreases. Broad scale assessment may be refined by a nutrient balance at a paddock scale. The P balance for bananas is strongly positive due to high rates of application (average of 68 kg/ha/yr; Daniells 1995) and export of only 3 kg/ha/yr in bunches (Armour and Daniells 2002). In addition, there is evidence of high and increasing P concentrations in banana soils. A similar disparity between application and removal rates has been reported for sugar cane (Prove and Moody 1997). 3.5.2.2 Physical fertility
The decline in soil physical fertility is considered ubiquitous to the cropping and grazing lands of the world. Prevention and control of degradation is a goal that may be achieved over decades. ‘Soil water content at the time of traversing or cultivating the soil is the principal determinant of the severity and extent of degradation. Tractor loads, implement design, speed and tyre size, type and inflation are all important, but not as much as soil water content’ (McGarry et. al. 1999). Cultivation at water contents greater than the plastic limit of the soil will smear the soil rather than shear it (which does not cause physical fertility decline). Flotation tyres can reduce the vehicle ground pressure on the soil but only by a relatively small amount compared to the effect of soil moisture conditions at the time of cultivation. The definition and extent of physical fertility decline is difficult to assess because much of it may be hidden or blamed on other factors such as soil pathogens. Good soil moisture or additional fertiliser may mask it. Statements on physical fertility decline for

CONDITION REPORT: SUSTAINABLE USE 43
Queensland and Australia have tended to be brief, general in content and sometimes accompanied by a highly generalised map of location (McGarry et. al. 1999). Location and correct diagnosis of the problem is a critical factor in determining the success of remediation programs. Spade-dug holes or soil pits at different scales are the recommended method for assessing the extent and depth of the problem, in turn guiding the remediation process (McGarry et. al. 1999). A significant increase in soil bulk density and decrease in saturated hydraulic conductivity has been measured locally from a single pass of a sugar cane haulout unit (Braunack and Peatey 1999). Controlled traffic systems aim to restricting the traffic to the same tracks, as far as possible, to reduce the impact of compaction on the soil area in which the plants are growing. A summary of threats to soil physical fertility for two cropping systems is presented in Table 20. Table 20: Determinants of the status of soil structure degradation in Queensland cropping soils. (Source: McGarry et. al. 1999; S Lindsay pers. comm., Garside 2003).
Crop Potential for wet
sowing/cultivation/ harvest
Minimum till practices
Controlled traffic/ retained beds
Rotation crops for structure repair
Sugar cane Very high, especially for harvesting
Routine removal of beds and plough out to 0.4 m depth
Experimental work underway
Experimental work underway
Horticulture High, especially at harvesting
Increasing grower interest
Rare, but grower interest increasing
Rare, but grower interest increasing
In the south Burnett area, long term cropping over 30 to 50 years on ferrosols has lead to the development of hard setting soils with compacted layers and poor rainfall infiltration. This reduction in soil physical fertility was associated with reduced concentrations of organic carbon and vehicle traffic when the soil was too wet (Bell et. al. 1997). Pasture leys were able to significantly improve the physical fertility of continuously cropped soils within 2-4 years. These results are particularly applicable to the intensively cropped ferrosols of the coast and Atherton Tablelands. Other work at Ingham has confirmed the usefulness of crop rotation breaks to improve soil health (Pankhurst et. al. 2003). 3.5.2.3 Biological fertility
The importance of biological fertility has not received much attention until the last 10 years or so (e.g. Roper and Gupta 1995; Pankhurst et. al. 1999). This has possibly been driven by the failure of modern intensive agriculture to maintain the soil resource. In long term sugarcane monoculture soils, Pankhurst et. al. (2003) reported the presence of detrimental soil biota, specific pathogens such as Pachymetra and growth responses as high as 25-30% to fumigation (with an associated significant improvement in the health of the cane root system). Other research programs to investigate soil biology are underway in Australia. Examples are banana (Banana Root and Soil Health, Pattison personal communication), macadamia (Stevenson 2003), Northern Rivers (NSW) Soil Health Card (http://www.lis.net.au/~tuckland/ gsp/shctimconv.pdf) and cotton (Cotton soil health, influences on cotton root diseases, http://www.crdc.com.au/). The programs will provide scientific data as well as an increased awareness among growers about the importance of this neglected aspect of soil fertility. 3.5.3 CRITICAL ISSUES, IMPACTS AND THREATS
• Decline in organic matter, particularly the labile (easily oxidised) fraction of soil organic matter;
• Soil acidification (refer to Section 3.1);

44 SUSTAINING THE WET TROPICS: A REGIONAL PLAN FOR NRM
• Unbalanced nutrient management programs (e.g. excessive applications of N, P and K, limited applications of Mg and S);
• Lack of recognition and research into soil physical fertility degradation; and • Tendency to ignore subsoil fertility, despite the important role of the subsoil in
supplying water and nutrients. 3.5.4 CURRENT STATE OF UNDERSTANDING
The use of soil and plant analyses to direct nutrient management programs is inadequate for the scale and value of major agricultural industries in the region. Current inadequacies in soil testing are: • Limited use e.g. infrequently and not systematically; • Sampling of only the surface horizon (0-10 or 0-15 cm) and disregarding the subsoil; • Use of laboratories that are not NATA accredited and may not use appropriate
methodology for Australian conditions, especially soil analyses; and • Inadequate monitoring of trends over time (e.g. continuing application of P despite
high soil P concentrations in sugarcane and banana soils). A continuing trend of acidification is an indication that rates of nitrate leaching from some N fertiliser products are unacceptably high (Section 3.1.2). For plant analysis, the inadequacies are lack of use and poorly defined diagnostic criteria. The value of soil and plant analyses to guide fertiliser application as well as a reduction in N and K application rates for bananas is currently being promoted (Daniells and Armour 2003). A framework for environmentally sound management of P fertiliser in the sugar industry has been presented (Bramley et. al. 2003). Factors to be considered are soil profile characteristics, rainfall, runoff susceptibility, soil P sorption properties and P requirements of the crop. It is clear that more sophisticated soil tests and a more detailed assessment of individual paddocks is necessary to improve P management. The P buffering index is an example of an improved soil test (Burkitt et. al. 2002). There is generally limited information about the yield variability of paddocks, even for intensively managed crops. Yield mapping by the use of yield monitors and remote sensing is now available for sugar cane and other crops and may be used to calculate gross margins in blocks (e.g. Bramley and Quabba 2001). It is possible to more closely balance the fertiliser inputs with expected outputs (i.e. harvested product) by the use of electronically controlled fertiliser spreaders, and radically alter current fertiliser recommendations that are often applied at a regional scale. Other inputs such as pesticides and irrigation water may be similarly targeted. At the extreme, yield mapping could be used to identify parts of paddocks that should be removed from production because of poor productivity, with an expected improvement in offsite water quality. In banana production, management decisions concerning the economic return and the desired level of inputs (e.g. fertiliser) to match the outputs (i.e. bunches) is often difficult because bunch yield from individual paddocks is generally not recorded. As well as using productivity methodology, it is possible to evaluate recharge and N losses to groundwater on a catchment scale using data and tools that are currently available to the sugar industry (soil resource and climate data, water balance models and GIS; Bohl et. al. 2001). This is an example of risk mapping in production areas and is a precursor to adjusting management to suit those risks. A project at catchment scale undertake assessments of both nutrient and sediment exports in all coastal streams entering the GBR has been completed (Brodie et. al. 2003). The results should provide an important guide for improved catchment management, but as detailed above and in Soil Erosion (Sections 3.3.2 and 3.3.4), attention to paddock scale management is essential.

CONDITION REPORT: SUSTAINABLE USE 45
3.5.5 POTENTIAL ACTIONS FOR SUSTAINABLE USE
It is highly desirable for primary producers to regard the essential resource, soil, as a living, breathing entity, rather than something that holds up the plant. In this context, conventional agriculture can learn much from organic production. EMS/BMP practices will be important components of PMP, which will provide a basic framework for improved management on a whole farm basis. A very clear statement about the future of sugar cane production was ‘excessive tillage, high inputs of chemicals and fertiliser and long term monoculture must pass into history’ (Garside 2003). It is also relevant to other intensively managed production systems. Potential actions under the umbrella of increased extension and implementation of PMP are: • Management of paddocks according to both monitoring programs (soil and plant
analyses, yield, offsite water quality) and yield potential as a high priority; • Monitoring of soil fertility in the lower part of the root zone (20-50 cm), especially
pH so that acidification can be corrected; • Application rates of nutrients need considerable refinement for many crops (refer to
Section for 3.1.5); • Increased use of pasture rotations in long term cropping systems to remediate degraded
soils; • Cultivation techniques to prevent loss of physical fertility, including controlled
traffic, minimum tillage and the use of flotation tyres; and • Laboratory analyses should be undertaken in laboratories accredited by NATA. 3.6 URBAN ENCROACHMENT ON GQAL 3.6.1. DEFINITION
Good Quality Agricultural Land is defined in the State Planning Policy 1/92 Development and the Conservation of Agricultural Land as land that is capable of sustainable use for agriculture, with a reasonable level of inputs, and without causing degradation of land or other natural resources. Villages and towns have traditionally been developed in Australia on highly fertile agricultural areas, mostly because they relied upon the surrounding agricultural areas for much of their wealth. Ironically, the expansion of these urban areas is now threatening the continued existence of agricultural activity, as well as ancillary industries (e.g. sugar mills). 3.6.2. CONDITION, TRENDS AND CURRENT STATE OF KNOWLEDGE
Land suitability mapping undertaken by NR&M has identified areas of Good Quality Agricultural Land in the Wet Tropics bioregion. There are a number of gaps in this data particularly in the Babinda-Cairns area, however it is anticipated that this work will be finalised shortly. This mapping is at a scale suitable for regional planning as well as for use in decision-making by local authorities. It is summarised in FNQ 2010 (FNQ Regional Planning Advisory Committee 1998). 3.6.3. CRITICAL ISSUES, IMPACTS AND THREATS
According to the FNQ 2010 Regional Plan, key threats to Good Quality Agricultural Land are poor farm management practices and the encroachment of urban, rural-residential and non-agricultural farming activities onto agricultural land. A critical issue from urban encroachment is the abuse of the ability of local authorities to create small lot subdivisions in a rural landscape (also known as family transfers). The intention is the provision of accommodation for people linked to the continuing operation of the farm. Unfortunately, such provisions have been abused in the past. As a result, responsible local authorities and the state government are progressively removing this provision from planning schemes. An associated issue is the provision in a planning scheme to allow subdivision of rural land into lots that are too small to be viable farming units. Such developments are a form of rural residential development. Again, these provisions are being modified during the review of such planning schemes. The location of urban

46 SUSTAINING THE WET TROPICS: A REGIONAL PLAN FOR NRM
development in any form can inhibit farming practice thereby limiting the extent to which the land resources can be used. 3.6.3.1. Current state of understanding (a gap analysis)
There is a perception that the introduction of the State Planning Policy 1/92 Development and the Conservation of Agricultural Land has prevented any urban development from occurring on farming land. However, there is no data to either support or dispel this perception. Economic circumstances such as a down turn in the local economy and reduction in the growth rate of Cairns City may be the actual cause of any reduction in the encroachment of urban development upon Good Quality Agricultural Land. There is no data available for the conversion of land zoned rural to urban uses. 3.6.3.2. Potential actions for sutainable use
Establishment of monitoring of the rate of conversion of land from rural to urban land uses would assist in determining if urban encroachment onto Good Quality Agricultural Land was an issue. 3.7. CARBON BALANCE 3.7.1. DEFINITION
The global carbon cycle identifies how carbon is exchanged and stored in a range of terrestrial, geological, marine and atmospheric pools. It interacts closely with other biogeochemical cycles such as nutrient and hydrological cycles and is altered to a great extent by human impacts. Because of the interaction between these cycles, the NLWRA (2001) used mean annual net primary productivity as a measure of the carbon balance in Australia. The Wet Tropics region of Australia has a high mean annual net primary productivity. Terrestrial systems are an important part of the global carbon cycle and carbon may be stored/retained in carbon sinks such as plants (e.g. forests, crops, pastures), harvested product (e.g. timber, paper) and soils (soil organic matter). Carbon is exchanged within this system via photosynthesis, respiration, decomposition and burning (IPCC 2000). Losses from the terrestrial system lead to increases in atmospheric carbon dioxide, and have a major impact on global greenhouse gasses and contribute to global warming. Other greenhouse gasses include nitrous oxide, methane and chlorofluorocarbons. Atmospheric carbon dioxide levels have risen by 30% over the last 250 years. 3.7.2. CONDITION, TRENDS AND CURRENT STATE OF KNOWLEDGE
Carbon is contained in a number of carbon pools within the terrestrial landscape. These pools include forest biomass, crop and pasture biomass, litter and mulch on the soil surface and organic matter mixed through the soil. These pools are greatly impacted by human activities. The carbon balance in the Wet Tropics NRM Region, as defined by mean annual net primary productivity has not changed greatly since European style agriculture was introduced (NLWRA 2001). Indeed, some pockets of increased productivity exist in the region, and these represent the impact of increased nitrogen and phosphorus fertilisation. However, while the carbon balance may be neutral or positive over the whole region, transfers between carbon pools still occur. For example, Ferrosols contain approximately 4 % organic carbon in their virgin state, but this declines to less than 2% following cultivation (Warrell et. al. 1984). Similarly, land use change such as clearing forest for agriculture or urban development, or planting forests for silviculture and conservation will vary the carbon stored in each respective pool. Grazing management, clearing, fire and climate change can also significantly alter the amount of carbon stored in tropical savannas. (http://www.savanna. ntu.edu.au/research/projects/nutrients_water.html). An effective accounting system is required to identify the trends and current condition of the carbon balance. At a national level, the National Carbon Accounting System (NCAS) has been developed (AGO 2003). NCAS uses a verified model based accounting system operating at a highly disaggregated scale (25m, monthly time steps) and aggregates emissions

CONDITION REPORT: SUSTAINABLE USE 47
for all carbon pools. This system could be applied at a regional level to identify the trends within the Wet Tropics NRM Region. Another tool, Range-ASSESS (Hill et. al. 2002), has also been developed to assist decisions in the grazing industry with respect to land management to reduce the risk of carbon loss from these agricultural systems. Increases in atmospheric carbon dioxide levels have led to significant national scientific and political discussion about ways to reduce the greenhouse gases, and subsequent global warming. Regionally, Crimp et. al. (2003) have released an assessment of the impacts of climate change on the Cairns and Great Barrier Reef region. They identified options across the breadth of climate change matters to address these impacts. A considerable part of this discussion is related to the use of carbon sinks. Carbon sinks are broadly used to describe the carbon removed from the atmosphere by plants and stored in living biomass and organic matter, both above and belowground, in terrestrial ecosystems. This process is known as sequestration. Forests are commonly identified as potential carbon sinks and can be significant sinks, particularly during their early years of growth, but their sink potential reduces with age. Other ecosystems (e.g. savannas and woodlands) are also significant sinks (www.greenhouse.crc.org.au). The soil organic carbon is a major carbon pool in the terrestrial carbon cycle. 3.7.3. CRITICAL ISSUES, IMPACTS AND THREATS
The potential threat of climate change on a global scale from increased atmospheric concentrations of greenhouse gases has lead to international efforts to reduce these emissions. The Kyoto Protocol has set emission targets for six heat-trapping greenhouse gases (GHG) - carbon dioxide, methane, nitrous oxide, hydrofluorocarbons (HFCs), perfluorocarbons (PFCs) and sulfur hexafluoride. Because of these targets, vegetation management and associated carbon balance will become an even more important issue. There is a significant current debate about clearing usually for agricultural production (although urban development is important in some areas). It concerns the balance between development, conservation for threatened animal and plant species and ecosystem preservation including broader issues such as salinisation. For example, vegetation and the associated soil are carbon sinks because of the absorption of CO2 from the atmosphere. In contrast, clearing vegetation will quickly release much of this back to the atmosphere. ‘Australia is the only developed country with significant greenhouse emissions from vegetation and soils. Many opportunities exist to reduce these emissions and increase carbon stores through improved agricultural and forestry practices and programs of re-vegetation, as well as reductions in land degradation and clearing.’ (http://www.greenhouse. crc.org.au/crc/ecarbon/faqs.htm - gheffect). Australia as a whole has undertaken to restrict GHG to 8% above 1990 levels between 2008-12. It has been estimated that land clearing contributed 64 Mt CO2eq of net emission in 1998, with 20% (92 Mt CO2eq) from agricultural properties. The CRC for Greenhouse Accounting has reported that it might be possible to store more than 300 Mt of soil carbon by rehabilitation of degraded rangelands in Australia. At a local regional scale, practices that reduce the loss of carbon from the terrestrial cycle are an effective way to contribute to solutions to the global greenhouse problem. Hence, pressures on vegetation through clearing for agriculture and urban development need to be managed and agricultural practices that promote organic matter loss (e.g. continuous cultivation) need to be discouraged in preference for reduced tillage practices to reduce carbon mineralisation to carbon dioxide. Carbon trading is likely to have an impact on land management, as it is an additional factor to be considered in addition to numerous other choices. There is the potential for carbon sinks to be a source of funds to land managers for rehabilitation of degraded areas, conservation of existing vegetation and modifications to existing farming methods.

48 SUSTAINING THE WET TROPICS: A REGIONAL PLAN FOR NRM
3.7.4. CURRENT STATE OF UNDERSTANDING (A GAP ANALYSIS)
Uncertainties include: • The application of a transparent carbon accounting system over the whole region; • The difficulty of monitoring soil organic carbon due to general soil heterogeneity; • Variables that contribute to uncertainty in measurement of C such as climate, inputs,
fallowing, initial soil C (both quantity and quality), land management such as tillage/fallowing, soil texture;
• Uncertainty about livestock numbers and rates of emissions; and • Impact of feral (e.g. rabbits) and native grazing (e.g. kangaroos) animals on pasture
condition. 3.7.5. POTENTIAL ACTIONS FOR SUSTAINABLE USE
Implementation of the National Carbon Accounting System at a regional scale will assist in identifying the most beneficial practices to address greenhouse issues. This will also aid the start up of an effective means of carbon trading and subsequently lead to land management being driven by the potential returns for carbon credits. 3.7.6. INSTITUTIONAL AND ADMINISTRATIVE ARRANGEMENTS
In addition to national arrangements for greenhouse issues, the Regional Vegetation Management Planning process identifies the regional approach to the retention of vegetation in the Wet Tropics and Northern Einasleigh. This process is a useful mechanism for reducing losses of carbon dioxide from the terrestrial carbon cycle. Local governments have also implemented different approaches to tree planting in their local government planning schemes and these schemes could identify their goals with respect carbon trading via tree planting and forestry schemes.

CONDITION REPORT: SUSTAINABLE USE 49
4. BIOLOGICAL HEALTH
4.1. DISTURBANCES TO AQUATIC ECOLOGY 4.1.1. DEFINITION
Aquatic ecology is the study of the relationships of organisms with other organisms and non-living factors in an aquatic environment. In the Wet Tropics, the types of aquatic habitats present include lakes, ponds, lagoons, wetland complexes, impoundments, rivers and streams, estuaries and oceans and coral reefs. Riparian habitats are also strongly associated with aquatic ecology. For the purposes of this document, only streams, estuaries, impoundments and associated ecosystems will be examined. In this section, major anthropogenic impacts on aquatic ecology in the Wet Tropics are outlined. 4.1.2. CONDITION, TRENDS AND CURRENT STATE OF KNOWLEDGE
4.1.2.1. Riparian zone
The riparian zone is the interface between terrestrial and aquatic ecosystems and it plays an important role by contributing to the physical and biological structure of a healthy stream (Petersen et. al. 1987). It plays roles in moderating changes to stream morphology (Reynolds 1986), provides complex lateral habitats including eddies, backwaters and side channels, is a source of woody debris which, as well as influencing the geomorphic structure of the stream, acts as habitat and refuges for fish and invertebrates (Heede 1985; Gregory et. al. 1991). The autochthonous productivity originating within the stream channels of Wet Tropics rivers is not high, so input of allochthonous material (e.g. wood, leaves and dissolved carbon) from outside the stream channel is very important to biota in these waterways (Burrows 1998). The riparian forest also acts to reduce the amount of solar radiation that the aquatic habitats receive thereby modulating primary productivity and water temperature (Russell and Hales 1993a). The thinning of the overhead canopy can result in the proliferation of exotic grass such as para grass (Brachiaria (Urochloa) mutica) that can clog the watercourses with vegetation, cause the deposition of sediment (Russell and Hales 1993a), and even change the fish species composition of affected habitats (Arthington et. al. 1983). One effect of the overabundance of this one type of habitat is to skew the balance of organisms in the stream to those suited to this type of disturbed habitat. In south-east Queensland, a dramatic decline in the health of forest streams was observed when gross primary productivity substantially exceeded respiration, especially when instream primary producers shifted from palatable unicellular algae to prolific filamentous green algae and macrophytes (Bunn et. al. 1999). Riparian vegetation also influences river health by the input of organic matter, fruits and arthropods that serve as energy sources for aquatic food webs (Dudgeon 1989; Bunn et. al. 1998) and the potential to intercept nutrients and sediments being transported from terrestrial ecosystems to streams in groundwater and/or surface runoff (Lowrance et. al. 1984; Pusey and Arthingon 2003). This has important consequences for aquatic biota, maintaining habitat structure, food web structure and water quality (Pusey and Arthingon 2003). The catchments of many tropical lowland streams in the Wet Tropics have been extensively cleared for agricultural production to the extent where very little of the native riparian vegetation remains (Bunn et. al. 1998). Some work has been done on quantifying the extent of riparian loss in Wet Tropics catchments. In the streams in the sugar cane growing areas of the Daintree catchment nearly 70% of the total length of all streams were classified as having a sparse riparian cover (Russell et. al. 1998). In the Moresby catchment, 47% of the 167 km of streams assessed had sparse riparian forest and most of the streams that were assessed as having a wide riparian coverage were in the rugged upper parts of the catchment (Russell et. al. 1996a). In some subcatchments of the Barron system, up to 62% of the total minor stream length had sparse riparian cover on at least one bank (Russell et. al. 2000). Moller (1996) and Johnson (1998) concluded that the riparian vegetation of streams in the Herbert and Tully/Murray catchments should be managed to reduce further degradation and that impacted areas should be rehabilitated to a more functional condition. A comparative study of Babinda and Behana Creeks found that human influences had reduced riparian health of Babinda

50 SUSTAINING THE WET TROPICS: A REGIONAL PLAN FOR NRM
Creek to a greater extent than in Behana Creek, even though water extraction was significant from Behana Creek (Buiting 1992). 4.1.2.2. Wetlands
Vegetation clearing for agricultural activities in the Wet Tropics has also resulted in a loss of lowland rainforest, native grasses, sclerophyll forest and wetlands, particularly freshwater wetlands. Wetlands have many roles including nutrient removal, sediment retention, groundwater recharge and discharge, fish and wildlife habitat and nurseries, shoreline stabilisation, hydrological storages and in export of primary production. Apart from impacting on these functions, wetland reclamation can also have long term effects in other parts of the catchment or even offshore. In disturbed acid sulfate areas, acid and biotoxic metals are exported downstream from the affected area. Drainage construction results in a lowering of the water table that potentially affects adjacent, untouched wetlands. For example, drainage of land for sugar cane production in Mulgrave catchment resulted in a lowering of the water table that, in turn, killed Melaleuca trees in an adjacent national park (Russell et. al. 1996b). Further details of anthropogenic impacts on wetlands in the Wet Tropics are given in the Marine and Freshwater Fisheries section. 4.1.2.3. Instream habitat
The type, diversity and abundance of benthic macroinvertebrates, including insects, crustaceans and molluscs, can provide valuable information on aquatic ecosystem health. The advantage of using macroinvertebrates in aquatic health studies revolves around their wide range of ecological tolerances, fundamental role in ecosystem function and utility as study organisms (Department of Natural Resources 1999). In the Barron River, a recent survey of macroinvertebrate populations suggested that, at most sites, the river was a relatively healthy system although nutrient enrichment may have caused degradation at one site, at least (Russell et. al. 2000). Taxa identified from the Barron system that may be indicative of healthy environments included mayflies (Ephemeroptera) (particularly from the Caenidae and Leptophlebiidae families), and stoneflies (Plecoptera) from the Notonemouridae family. The dominance of taxa such as Diptera (an order of true flies) in macroinvertebrate samples may be indicative of some form of degradation (Russell et. al. 2000). Ecological condition of sites in the Wet Tropics, including the Barron River (Choy et. al. 1998), using bioindicators is being undertaken on a regular basis. Organic effluents with high biological oxygen demand, thermal pollution, agricultural chemicals, acid leachate and other sources of pollution have considerable impacts on stream ecology and riverine health. A study of pollution from organic sugar mill effluent in the Russell River catchment showed a decrease in macroinvertebrate diversity and a corresponding drop in dissolved oxygen concentrations (Pearson and Penridge 1987). Most, if not all, of the thermal pollution in the Wet Tropics originates from the discharge of cooling water from sugar mills. In an earlier study (Russell and Hales 1993b), a mill was observed directly discharging hot water (52°C) into the coastal reaches of the Johnstone River, which influenced the ambient river temperature for a number of kilometres downstream. With modern mill technology including cooling towers, the discharge of hot cooling water has been substantially reduced. 4.1.2.4. Acid leachate
Acid sulfate soils develop as a result of disturbance or drainage of parent materials that are rich in pyrite (Dent 1986) (see Section 3.2 for more details). Drainage from acid sulfate soils, which is acidic and has high concentrations of some biotoxic metal and metalloids, has the potential to cause considerable environmental damage and is thought to be responsible for extensive fish kills and outbreaks of red spot disease, which have had significant impacts on the fishing industry (Hyne and Wilson 1997). Acid sulfate soils have caused environmental problems throughout the Wet Tropics including at East Trinity near Cairns where fish kills have occurred over an extended period. Recent studies (Cavicchiolo 2001; Russell and McDougall 2003) suggest that there is not a major problem with the bioaccumulation of metalloids and metals in aquatic biota in receiving waters from the site. For example, the most recent study found that metal and

CONDITION REPORT: SUSTAINABLE USE 51
metalloid concentrations in the muscle tissue of mud crabs resident in both Hills and Firewood creeks and Falls Creek, an unimpacted reference creek, were generally within acceptable levels although zinc, selenium and copper levels were elevated in some samples (Russell and McDougall 2003). 4.1.2.5. Exotic species
Apart from exotic pasture grass species, other macrophytes can impact on aquatic ecology. Floating macrophytes pests including water hyacinth (Eichhornia crassipes), salvinia (Salvinia molesta), water lettuce (Pistia stratiotes) are all found in Wet Tropics streams and impoundments and are capable of forming dense mats that reduce fish populations, limiting food sources for water fowl, providing shelter for mosquitoes or reducing water quality (Sainty and Jacobs 1988). The exotic pest blue trumpet vine (Thunbergia grandiflora), a vigorously growing twining vine, is found in tropical rainforests particularly along riverbanks and eventually smothers and kills native trees (Parsons and Cuthbertson 1992). This plant is a native to northern India and is widely cultivated as an ornamental but is naturalised in parts of the Wet Tropics including the Russell-Mulgrave floodplain where it is difficult to eradicate (Bolton 1990; Russell et. al. 1996b). Pond apple, (Annona glabra), an introduced tree which invades wetlands to rapidly become the dominant species is common in parts of the Wet Tropics including coastal parts of the Johnstone, Russell-Mulgrave Rivers (Russell et. al. 1996b) and Trinity Inlet catchments. It is regarded as a serious threat to the integrity of Melaleuca swamps and a potential threat to some mangrove areas (Le Cussan 1991). Introduced and translocated fish and crustaceans may also impact on the aquatic ecology and this is discussed in detail in the Freshwater and Marine Fisheries section. Other introduced biota including cane toads (Bufo marinus), feral pigs (Sus scrofa) and domestic cattle (Bos indicus, B. taurus) can cause significant damage, for example, to riparian zones, stream banks and instream habitat. 4.1.2.6. Environmental flaws
Extraction of water for agricultural, urban or industrial uses potentially can reduce the flow of streams to a level that threaten instream biota. Environmental flows are the flows that are necessary to maintain healthy riverine habitat and ecosystems and currently these are being assessed in a number of Queensland catchments through the development of Water Resource Plans (formerly known as Water Allocation Management Plans or WAMPS) by the Queensland Department of Natural Resources and Mines (Department of Natural Resources 1999). These plans aim to develop a balance between consumptive and non-consumptive or environmental uses of water (refer to Section 2.2.4) 4.1.2.7. Pesticides
Agricultural chemicals have the potential to substantially impact on aquatic ecosystems. The adverse effects that nutrients can have on aquatic ecosystems, particularly on the Great Barrier Reef, have been highlighted in a number of recent reports (Baker 2003; Productivity Commission 2003). These effects are reported in detail in the Section 2.1 of this document. Pesticides, both from agricultural and domestic sources also have the potential to impact on biological health. In a study of pesticide residues in aquatic biota in the Wet Tropics no evidence was found of the presence of organophosphate insecticides although residues of a metabolite of DDT (DDE) and dieldrin were found in a small percentage of the samples (Russell et. al. 1996c). The same study also found low levels of 2,4D 2,4,5T and atrazine in a small number of samples and reported significantly higher levels of DDE in an agricultural catchment (Johnstone River) than in a largely wilderness area (Daintree River) but no significant difference in dieldrin levels. Similarly, another study (Mortimer 2000) of pesticides in crabs in Queensland found residues of dieldrin occurred at all locations, heptachlor epoxide and DDT (principally metabolites DDD and DDE) at most sites and suggested this was a result of historical usage. In the Mackay region of central Queensland, Duke et. al. (2001) associated the dieback of a single species of mangrove with the presence of the herbicides diuron and ametryn in mangrove sediments. Others, however, dispute that the cause of the dieback is related to herbicides, pointing out that burial or partial burial of mangrove pneumatophores caused by the deposition of unusually high loads of sediment during an

52 SUSTAINING THE WET TROPICS: A REGIONAL PLAN FOR NRM
unseasonable flood event is a more plausible explanation (Kirkwood and Dowling 2002). Sediment and seagrass samples collected at intertidal and tidal locations along the Queensland coast showed evidence of pesticide and herbicide residues including low levels of atrazine, diuron, lindane, dieldrin, DDT and DDE (Haynes et. al. 1999). This study found that contaminants were concentrated in samples collected along the Wet Tropics coast between Townsville and Port Douglas and in Moreton Bay, a consequence of their past and present use and the runoff that occurs in those areas. The presence of diuron was regarded with concern because of potential impacts on local sea grass communities (Haynes et. al. 1999). 4.1.3. CRITICAL ISSUES, IMPACTS AND THREATS
Inappropriate agricultural and other anthropogenic activities both impact and threaten the biological health of Wet Tropics streams and, in some instances, the Great Barrier Reef. While the Wet Tropics World Heritage Area does protect streams or sections of streams, there are a number of critical issues, threats and potential threats to aquatic ecology in the area that need to be documented. Modification of near-stream or riparian vegetation or channel morphology may affect stream biota by elevating sediment loads, increasing water temperature disrupting aquatic food webs or decreasing habitat diversity (Karr and Schlosser 1978). The extensive clearing of the original riparian forests in many Wet Tropics catchments provides opportunities for colonisation of stream banks, verges and the streams themselves by exotic pest plants. In the Wet Tropics, para grass (Urochloa mutica) is a particular problem (Russell et. al. 1996b; Russell et. al. 1996a; Russell and Hales 1997a; Russell and Hales 1997b; Russell et. al. 1998; Russell et. al. 2000) but other introduced pasture species such as hymenachne (Hymenachne amplexucaulis) and aleman grass (Echinochloa polystachya) may pose a greater threat to streams because they can grow in up to 1.2m of water and can be up to 50% more productive (Bunn et. al. 1998). Bunn (1997) reports that para grass contributes very little to aquatic food webs and its senescent leaf material collects on the stream bed where it remains unprocessed by secondary consumers, forming a thick layer of organic ooze inimical to both fish and invertebrates (Pusey and Arthingon 2003). Additionally, the growth of pasture grasses in streams reduces the diversity of flow environments present by confining discharge to a central flow path of uniformly high velocity (Pusey and Arthington 2003). Reduced flows on the fringes of these streams lead to conditions of poor water quality, particularly low dissolved oxygen (Pusey and Arthington 2003). Restoration of native riparian vegetation will provide an effective long term means of controlling invasive macrophytes in disturbed lowland streams (Bunn et. al. 1998). The process of ‘desnagging’, where woody debris is removed from watercourses, particularly fast flowing streams, to reduce bank and stream bed erosion, also impacts on biological health. This is no longer widely practiced and instead the woody structures are realigned to minimise erosion. Threats to the aquatic ecology through the proliferation of aquatic macrophytes are being addressed in a number of ways. Chemical application and mechanical removal is being routinely used to control plants such as hymenachne, water hyacinth and salvinia. Salvinia is also being controlled by the strategic release of the weevil Cyrtobagous salviniae (Sainty and Jacobs 1988). The issue of exotic and translocated fish species is discussed in Section 5.2, but other introduced biota from cane toads to cattle and feral pigs also impact on aquatic ecology and, in particular, instream integrity. Domestic cattle can have dramatic impacts on the riparian zone, cause bank slough-off, resulting in erosion and sedimentation, damage to the stream bed and associated biota and introduce elevated faecal coliform and faecal streptococci levels (Kauffman et. al. 1983a; Kauffman and Krueger 1984). Feral pigs can cause similar sorts of disturbances and additionally dig up the stream bank in search of food. Disturbance of acid sulfate soils through drainage, coastal developments or other activities has the potential to cause serious and lasting environmental damage; the east Trinity development of coastal marine wetlands at Cairns is an example of how, when disturbed, acid sulfate soils can cause considerable environmental harm and potential economic damage (Hicks et. al. 1999; Russell and Helmke 2002). While some tidal wetlands have been reclaimed, freshwater wetlands account for most wetland loss in the Wet Tropics. Given the diverse roles of wetlands, their destruction must impact on the aquatic ecology of the area.

CONDITION REPORT: SUSTAINABLE USE 53
While there is a lack of evidence of the presence of pesticide residues in aquatic biota, it should not be construed that their use is having no effects on aquatic ecosystems. The shift towards the use of non-persistent pesticides in agriculture may result in acute effects including death of early life history stages, loss of vigour, genetic or physiological changes becoming more significant (Willis and McDowell 1982; Russell et. al. 1996c). Conversely, the presence of herbicides in sediments may not necessarily be related to dieback of adjacent mangroves (Duke et. al. 2001); further work is needed to elucidate the impacts of these chemicals on ecosystems in the Wet Tropics. Reduction of water flows through extraction for anthropogenic uses, if not properly managed, risks the sustainability of stream ecosystems. Extraction occurs for a variety of purposes including human consumption, irrigation, industrial and urban uses and this needs to be balanced against environmental requirements. In some parts of the Wet Tropics there is evidence that nutrients may be impacting on aquatic ecology. For example, at least one site in the upper Barron catchment showed evidence of an over-representation of tolerant biota in the macroinvertebrate samples; these data, in conjunction with available water quality information, suggests nutrient enrichment (Russell et. al. 2000). Data from the AusRivAS program suggests that the Barron system, compared to other north Queensland streams, has a rich macroinvertebrate fauna and only mild impacts (Choy et. al. 1998; Choy et. al. 1999). However, these authors suggest that inclusion of temporal data may result in impacts becoming more evident at the end of the dry season. Pearson and Penridge (1987) demonstrated that the diversity macroinvertebrate fauna in a north Queensland coastal stream polluted with organic sugar mill effluent was dominated by Oligochaeta and one species of chironomid, or in the most severe conditions by that chironomid alone. They also noted associated drops in the dissolved oxygen concentrations of streams affected by the pollution, a result of increased biological oxygen demand. 4.1.4. CURRENT STATE OF UNDERSTANDING (A GAP ANALYSIS OF
RESEARCH NEEDS)
• Development of effective and cost-effective techniques for rapid large-scale revegetation of riparian forests;
• Repeat of habitat assessment done in Wet Tropics catchments in the 1990s to determine if subsequent activities in the catchments including rehabilitation and land clearing are further impacting on instream and riparian habitat;
• Remap the current status of all wetlands in the Wet Tropics and determine losses that have occurred since they were last audited;
• Prioritisation of areas for rehabilitation on a catchment by catchment basis; • Further development of bioindicators for the health of Wet Tropics streams; • Investigation of biological control methods for plant and animal pests, both aquatic
and terrestrial, in the Wet Tropics; • Development and/or refinement of techniques for quantifying environmental flow
requirements for Wet Tropics streams; • Impacts of pesticides on aquatic biota including early life history stages, behavioural,
physiological or genetic changes; • Rehabilitation methods for acid sulfate soil areas. NR&M in collaboration with
CSIRO Land & Water, James Cook University and DPI are currently undertaking rehabilitation studies on east Trinity acid sulfate soil site near Cairns. The impacts of acid leachate on aquatic ecosystems and rehabilitation strategies requires further research;
• Requires the production of designs for and encourage the construction of artificial wetlands and sediment retention basins in critical areas throughout the Wet Tropics; and
• Ecological modelling of a river/estuarine ecosystem to achieve an understanding of basic biological processes in the tropics and the potential effects of introduction of pest species (tilapia and carp), destruction of riparian habitat, and flow-on connectivity effects to the estuary and marine ecosystem.

54 SUSTAINING THE WET TROPICS: A REGIONAL PLAN FOR NRM
4.1.5. POTENTIAL ACTIONS FOR SUSTAINABLE USE
• Implementation of best management practices in agricultural areas including minimum tillage, cane trash blanketing, sustainable irrigation practices to crops that require additional water and development of strategies to minimise further loss of riparian vegetation and maximise rehabilitation of degraded riparian forests;
• Environmental flows - in the Barron catchment, a Water Resource Plan (WRP) is being developed to balance water that can be extracted for urban, industrial and agricultural purposes and allocate water that should be left to maintain the health of the riverine systems;
• Acid sulfate soils - areas with a high potential for disturbance of acid sulfate soils need to be identified and mapped. Management requires careful attention to minimise the possibility of any disturbances to potential acid sulfate soils and thereby reduce the likelihood of environmental harm (refer to Section 3.2 Acid sulfate soils); and
• Management of stock access to riparian areas - includes provision of off-stream watering points, fencing of watercourses to protect riparian zones and stream banks and beds.
4.1.6. INSTITUTIONAL AND ADMINISTRATIVE ARRANGEMENTS
The Water Act (2000) provides a statutory framework for the allocation and management of water. There are two levels of planning: the water resource plan that provides the primary trade off between consumptive and non-consumptive uses of water. The second level of planning is the resource operations plan which sets out the management arrangements necessary to implement the water resource plan and includes details like rules for operating, trading allocations and cessation of extraction for environmental reasons. Water allocations separate from land in the sense that they can be owned by non-landholders and can be traded separately from land. They specified in terms of location, volume and other attributes. The Vegetation Management Act 1999 creates a framework for the management of native vegetation to achieve: • The ecologically sustainable use of land; • The protection of biodiversity and other environmental and social values; • Planning certainty for landholders, industry and the community; • Prevention of land degradation such as salinity and soil erosion; and • Protection of water quality within catchments. The Wet Tropics World Heritage Protection and Management Act 1993 was proclaimed in November 1993 for the protection and management of the Wet Tropics World Heritage Area. The Nature Conservation Act 1992 and associated regulations aims to conserve nature in Queensland. It is based on the principles of conservation of biological diversity, ecologically sustainable use of wildlife, ecologically sustainable development and on international criteria developed by the World Conservation Union (International Union for the Conservation of Nature and Natural Resources) for establishing and managing protected areas. The Environment Protection and Biodiversity Conservation Act 1999 (Commonwealth) that came into force in July 2000 requires an assessment and approval process for activities that are likely to have a significant impact on the Commonwealth marine environment, on nationally threatened species and ecological communities, and on internationally protected migratory species.
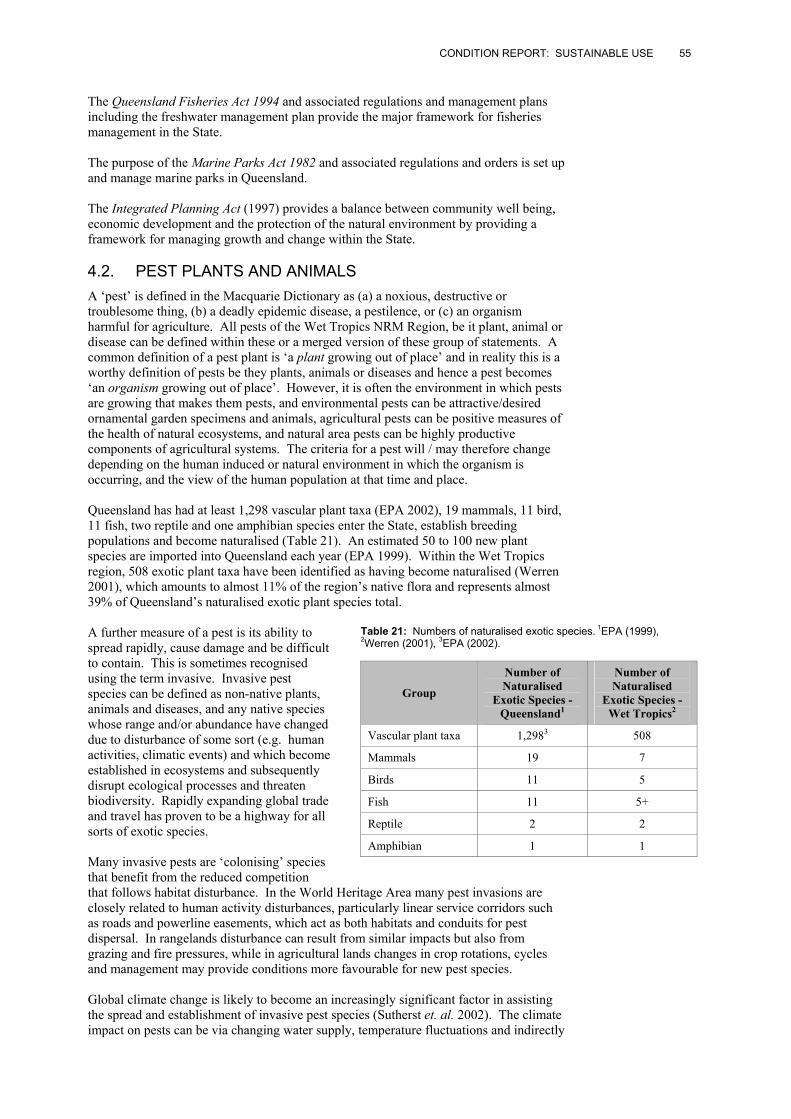
CONDITION REPORT: SUSTAINABLE USE 55
The Queensland Fisheries Act 1994 and associated regulations and management plans including the freshwater management plan provide the major framework for fisheries management in the State. The purpose of the Marine Parks Act 1982 and associated regulations and orders is set up and manage marine parks in Queensland. The Integrated Planning Act (1997) provides a balance between community well being, economic development and the protection of the natural environment by providing a framework for managing growth and change within the State. 4.2. PEST PLANTS AND ANIMALS A ‘pest’ is defined in the Macquarie Dictionary as (a) a noxious, destructive or troublesome thing, (b) a deadly epidemic disease, a pestilence, or (c) an organism harmful for agriculture. All pests of the Wet Tropics NRM Region, be it plant, animal or disease can be defined within these or a merged version of these group of statements. A common definition of a pest plant is ‘a plant growing out of place’ and in reality this is a worthy definition of pests be they plants, animals or diseases and hence a pest becomes ‘an organism growing out of place’. However, it is often the environment in which pests are growing that makes them pests, and environmental pests can be attractive/desired ornamental garden specimens and animals, agricultural pests can be positive measures of the health of natural ecosystems, and natural area pests can be highly productive components of agricultural systems. The criteria for a pest will / may therefore change depending on the human induced or natural environment in which the organism is occurring, and the view of the human population at that time and place. Queensland has had at least 1,298 vascular plant taxa (EPA 2002), 19 mammals, 11 bird, 11 fish, two reptile and one amphibian species enter the State, establish breeding populations and become naturalised (Table 21). An estimated 50 to 100 new plant species are imported into Queensland each year (EPA 1999). Within the Wet Tropics region, 508 exotic plant taxa have been identified as having become naturalised (Werren 2001), which amounts to almost 11% of the region’s native flora and represents almost 39% of Queensland’s naturalised exotic plant species total. A further measure of a pest is its ability to spread rapidly, cause damage and be difficult to contain. This is sometimes recognised using the term invasive. Invasive pest species can be defined as non-native plants, animals and diseases, and any native species whose range and/or abundance have changed due to disturbance of some sort (e.g. human activities, climatic events) and which become established in ecosystems and subsequently disrupt ecological processes and threaten biodiversity. Rapidly expanding global trade and travel has proven to be a highway for all sorts of exotic species. Many invasive pests are ‘colonising’ species that benefit from the reduced competition that follows habitat disturbance. In the World Heritage Area many pest invasions are closely related to human activity disturbances, particularly linear service corridors such as roads and powerline easements, which act as both habitats and conduits for pest dispersal. In rangelands disturbance can result from similar impacts but also from grazing and fire pressures, while in agricultural lands changes in crop rotations, cycles and management may provide conditions more favourable for new pest species. Global climate change is likely to become an increasingly significant factor in assisting the spread and establishment of invasive pest species (Sutherst et. al. 2002). The climate impact on pests can be via changing water supply, temperature fluctuations and indirectly
Table 21: Numbers of naturalised exotic species. 1EPA (1999), 2Werren (2001), 3EPA (2002).
Group
Number of Naturalised
Exotic Species - Queensland1
Number of Naturalised
Exotic Species - Wet Tropics2
Vascular plant taxa 1,2983 508
Mammals 19 7
Birds 11 5
Fish 11 5+
Reptile 2 2
Amphibian 1 1

56 SUSTAINING THE WET TROPICS: A REGIONAL PLAN FOR NRM
through changes in available food supply. Similarly, climate change will potentially alter pest dynamics and physiological processes. Climate change was the subject of a recent workshop in Cairns in August 2002. (Sutherst et. al. 2002.) 4.2.1. PEST PLANTS
4.2.1.1. Definition
Pest plants, sometimes known as weeds, are problems in all landscapes and landuses. The definition of a pest plant depends greatly on the intended land use. In simple terms, a weed is a plant out of place (Queensland Government 2002). Weeds are plants that are able to spread rapidly and produce unwanted economic, environmental or social impacts. They can be plants accidentally or intentionally introduced to Australia, or they can be native plants that have become weedy due to inappropriate management. Most of Queensland’s serious pest plants were introduced from overseas. Some have entered the country as contaminants, others are deliberately introduced to enhance rural production, or for ornamental use in domestic gardens and landscaping. 4.2.1.2. Condition, trends and current state of knowledge
Recognised and potential weeds are described in many popular and scientific publications (e.g. Smith 2002, Turner and McMahon 1989, Wilson et. al. 1995, Dowling and McKenzie 1993, Parsons and Cuthbertson 2001). These publications provide information on the areal extent of the weed and its potential range, as well as its biology. The series of publications on each of the Weeds of National Significance (WONS) is a good example of the generally available literature, as is the NR&M Pest Fact series. Distribution and abundance databases such as Pestinfo, Wildnet and Herbrecs (Queensland Government 2000) are also useful sources of information. As described later, the identification of ‘what is a weed’ means, however, that information on some species is not as readily available as might be desired. In the Wet Tropics region, there are a number of weeds that are currently listed by various authors (e.g. Thorp and Lynch 2000). WONS are weed species identified by a national committee as having characteristics that make them an important pest at a national level. Their selection was based on objective criteria and consultation across the country. The weeds listed as WONS and which occur in the region are Parkinsonia, Lantana, Rubbervine, Hymenachne, Salvinia, Cabomba, Parthenium, and Pond Apple. In addition to these species a number of other species were considered by the WONS panel and include Bathurst Burr, Bellyache Bush, Blue Thunbergia, Caltrope, Chinee Apple, Giant Rats Tail Grass, Grader Grass, Hyptis, Mexican Poppy, Mission Grass, Mother of Millions, Noogoora Burr, Paterson’s Curse, Sicklepod, Sida, Snake Weed, Tobacco Weed and Water Hyacinth. The increasing recognition of the importance of weeds to the community at large, means that significant on-ground investment is made in the form of land protection officers in state government and weed officers in local government, and these staff, along with professional scientists are continually identifying new weed incursions and threats into the region. One example would be that during field surveys undertaken to assess the extent of the invasive weed Chromolaena odorata (Siam Weed) in 1994, the plant Praxelis clematidea was found repeatedly (Waterhouse and Corlett 1996) and this has subsequently been recognised as a potentially new serious plant pest in northern Australia. Additionally, organisations and individuals are identifying species of concern for the region from other field and desk based assessments and these include species that are recognised for other purposes (e.g. Leucaena, Singapore Daisy) (Werren 2001). The current state of knowledge is covered in a range of publications, not least the biennial Weeds Society Conferences, which are held at different locations throughout Australia and other such meetings (e.g. 5th Queensland Weed Symposium 1998). These forums provide the current findings on weeds and coupled with the work conducted by Land Protection officers and their colleagues in Local Councils can provide up to date information on the spread of weeds and other plant species in the landscape. For example, Bray et. al. (1998)

CONDITION REPORT: SUSTAINABLE USE 57
discussed the potential spread of Giant Rats Tail Grass in pastures and identified ecological, spread patterns and causes, management aspects of this weedy grass and its impact on pastoral production. NR&M publishes annually a technical highlights report that contains a summary of current pest research. The Wet Tropics Management Authority also publishes current status reports that provide insights into weed issues. Recently, it was reported that although most of the plants causing environmental harm have originated in other countries, there are some native plants, such as the vine, Merremia peltata, which can also be considered as ‘weedy’. This is due to their massive increase in abundance because of human disturbance associated with artificial rainforest edges adjacent to agricultural lands and infrastructure corridors. Box 9: Leucaena - a background.
Many weed species have complex interactions in the landscape. Setter and her colleagues (Setter et. al. 2002) studied the dispersal of Pond Apple in the Wet Tropics and found that both the endangered cassowary and the feral pig were important dispersers of seed. Importantly while it was recognised that both feral pigs and Pond Apple should be destroyed, it was reported that some members of the community thought that Pond Apple was an important cassowary food source. Tomley and Hardwick (1996) reported on the use of rubbervine rust in far north Queensland as part of potential integrated control measures for rubbervine. They identified the increased defoliation of rubbervine due to rust causing increased grass growth in the pasture and resultant higher fuel loads for fire management control of the rubbervine in the landscape. The Rainforest CRC is undertaking a program of research into the biology, ecology, and control methods of several high profile environmentally destructive Wet Tropics weeds. The primary aim of the research is to improve our knowledge of weeds, their effect on the environment, and the effect of weed treatments on these environments, with a view to decreasing their negative impacts. The research is currently focussed on pond apple, harungana, hymenachne, siam weed and tobacco weed. The Australian Quarantine and Inspection Service (AQIS) are increasing the policing of quarantine regulations. In the last year, 9762 items have been destroyed, 6324 items decontaminated and 55 items ordered into quarantine at Cairns airport alone. A sub-program of AQIS, the Northern Australian Quarantine Strategy (NAQS) was established in 1989, after a special review of quarantine in northern Australia highlighted special quarantine risks faced by the region. The major role of NAQS is the surveillance and monitoring for new pests, diseases and weeds primarily focussed on a narrow coastal zone from Broome to Cairns, to provide early warning of movement of new pests towards northern Australia.
• Leucaena leucocephala originates from Central America and the Yucatan Peninsula of Mexico. There are two main subspecies of Leucaena leucocephala, ssp. leucocephala and ssp. glabrata. The other subspecies, ixtahuacana, is of no economic consequence at this stage.
• Leucaena forage is extremely palatable, with a nutritive value similar to that of lucerne. Growth rates of cattle grazing leucaena are greater than those from other tropical forages. Once established, it provides the basis for a low maintenance system of producing high quality beef.
• The Global Invasive Species Database lists Leucaena leucocephala among ‘One Hundred of the World’s Worst Invasive Exotic Species’. In Queensland, weedy infestations are limited to small areas across the state but it has potential to be a serious environmental weed. While most weed infestations are from long-term stands of ssp. leucocephala, the cultivated varieties (ssp. glabrata) of leucaena also have potential to become weeds.
• The draft Queensland Government policy states that Leucaena is recognised as valuable forage for parts of Queensland when managed properly, but it constitutes a threat to the natural environment if not contained in those areas in which it has been planted, or controlled in those areas that it has already invaded. Leucaena should only be planted in situations where containment is feasible and where no equally productive, less risky alternative species may be employed.
• The Leucaena Network has developed a detailed Code of Conduct for beef producers to ‘minimise the risk of commercial leucaena’ adding to existing weed problems.

58 SUSTAINING THE WET TROPICS: A REGIONAL PLAN FOR NRM
4.2.1.3. Critial issues, impacts and threats
The critical issues for pest plants in the region can be grouped under the following headings: • What is a weed/risk assessment? • Research issues associated with weed identification and management; and • Implementation of management plans. As already identified, plant species are weeds when growing in the wrong place. Because of the diversity of land use in the region, there is some divergence of opinion for some species. It is therefore imperative to have a weed risk assessment system that recognises the potential dangers of plant species, as well as their role in the different landuses of the Wet Tropics region. Acceptable systems will help ensure the early detection and eradication of potential weed species before they become a major problem. The terrestrial landuses of the region can be identified broadly as agriculture, protected areas, tourism, residential and mining and processing. Agriculture has been a major part of the landscape for the last 150 years. Large areas are successfully cropped to sugar cane, field crops (e.g. maize, peanuts, potatoes), and horticultural crops (e.g. avocados, lychees, mangoes, macadamias). Grazing (beef, dairy) is a major agricultural industry on both the coastal lowlands and the adjacent hinterland. Each of these agricultural practices is subject to the impacts of weeds competing for light, water and nutrients, and if uncontrolled, production losses occur. Grazing animals may also be subject to toxins from poisonous plants in the landscape. A further aspect of the agricultural industries is the need to protect exposed land from soil erosion and retain fertility. These practices require plant species, which grow rapidly to protect exposed soils, and which may replenish lost nutrients. Protected areas (national parks) are major repositories of biodiversity but are also major drawcards for the region’s tourism industry. Retention and protection of the unique flora and fauna is critical. Residential and mining/processing landuses impact on more localized areas, and except for some levels of soil erosion protection are probably less reliant on particular plant species for viability. The ornamental horticulture industry however is dependent on species, which are popular with home gardeners and landscapers. Significant efforts have been made to develop / review transparent weed risk assessment systems (Werren 2001) and these have resulted in lists of priority weeds. Lists are included in publications by Werren (2001), Bebawi et. al. (2001), Thorp and Lynch (2000), Csurhes and Edwards (1998) and these build on the principles espoused by Humphries et. al. (1992). However, the relationship with some industries is still fragile as apparent by publications on pasture plants such as Humphries and Partridge (1995), who summarise valuable pasture species for a range of tropical and sub-tropical environments. Clearly, stakeholders in the process are still not in total agreement about appropriate criteria for weeds and the use of plant species for industry (all forms). Attempts have been made to arrive at agreed policies and some have been successful (e.g. ponded pastures - see Box 10), but continued consultation and communication is necessary as weed risk assessment criteria are set by regulatory authorities. NR&M undertakes research and development activities towards addressing the weed problems in Queensland. As part of the resource allocation exercise Bebawi et. al. (2001) undertook a weed research prioritisation exercise using a multiple objective decision support system for north Queensland. This participatory approach evaluated the environmental, economic, social and cultural impacts of species prior to identifying a rank order, which are shown in Table 22. In addition, the authors aimed to identify the different types of research needed for different weeds.

CONDITION REPORT: SUSTAINABLE USE 59
Box 10: Ponded pastures.
Other organisations such as the Wet Tropics Management Authority (WTMA) have related aims and in a separate exercise WTMA commissioned the Rainforest CRC to develop an environmental weed risk assessment and priority ranking system (RAS) tailored to the needs of World Heritage Area management (Werren 2001). The ranked list shown in Table 23 resulted from applying the Rainforest CRC system to the terrestrial weed species short-listed by Bebawi et. al. (2001) plus several additional species considered as of World Heritage management concern by Werren (2001). However Werren (personal communication) recognises that the full range of naturalised exotic plants are yet to be comprehensively evaluated in terms of their weed risk and that information in Table 23 is just an example of what is possible. Table 22: Prioritised list of wet and dry tropics weeds (Source: Bebawi et. al. 2001).
Wet Tropics Weeds Dry Tropics Weeds No.
Scientific Name Common Name Scientific Name Common Name
1 Mikania micrantha Mikania Prosopis spp. Mesquite
2 Chromolaena odorata Siam weed Parthenium hysterophorus Parthenium
3 Mimosa diplotricha Giant sensitive plant Jatropha gossypiifolia Bellyache bush
4 Eupatorium catarium Praxelis Crytostegia grandiflora Rubbervine
5 Thunbergia spp. Thunbergia Acacia nilotica Prickly acacia
6 Miconia calvescens Miconia Ziziphus mauritiana Chinee apple
7 Annona glabra Pond apple Sporobolus spp. Rat’s tail grasses
8 Alternanthera philoxeroides Alligator weed Parkinsonia aculeata Parkinsonia
9 Hymenachne amplexicaulis Hymenachne; Ponded Alternanthera pungens Khaki weed
10 Andropogon gayanus Gamba grass Echinochloa polystachya Aleman grass
11 Cabomba caroliniana Cabomba Lantana camara Lantana
12 Stachytarpheta spp. Snakeweed Bryophyllum delagoense Mother of millions
13 Harungana madagascariensis Harungana Cascabela thevetia Yellow oleander; Captain
cook tree
14 Senna obtusifolia Sicklepod Tribulus terrestris Caltrop; Goats head burr
15 Elephantopus mollis Tobacco weed Calotropis procera Calotrope; Kings crown
16 Cyperus aromaticus Navua sedge Datura stramonium Thornapple
17 Psidium guajava Guava Ricinus communis Castor oil plant
18 Leucaena leucocephala Leucaena Agave spp. Sisal hemp
19 Brachiaria mutica Para grass Themeda quadrivalvis Grader grass
• Ponded pastures are created by the construction of banks or the modification of naturally wet areas in which fresh water is impounded or used primarily to grow adapted plant species and produce fodder for grazing. Introduced pasture species used for ponded pastures in Queensland include Para Grass, Aleman Grass and Hymenachne. Pastoral production has been increased through the ability for producers to feed livestock high quality fodder, into dry seasons.
• However, these species are now regarded as invasive weeds in natural freshwater systems and Hymenachne is a weed of natural significance (WONS).
• Queensland Government policy requires its agencies/departments to no longer recommend these species as part of the development of ponded pastures, and that established ponded pasture infrastructure will be progressively reviewed as to its legality and function.

60 SUSTAINING THE WET TROPICS: A REGIONAL PLAN FOR NRM
Wet Tropics Weeds Dry Tropics Weeds No.
Scientific Name Common Name Scientific Name Common Name
20 Spathodea campanulata African tulip tree Xanthium spp. Noogoora burr
21 Hyptis spp. Knob weed; Stinking roger; Comb hyptis Eriocereus spp. Harrisa cactus
22 Rottboellia cochinchinensis Itch grass Opuntia spp. Pest pear
23 Euphorbia heterophylla Milk weed
24 Allamanda cathartica Yellow allamanda vine
25 Turbina corymbose Turbine vine
26 Sphagneticola trilobata Singapore daisy
27 Tithonia diversifolia Tithonia
28 Sansevieria trifasciata Mother-in-laws tongue
29 Eichhornia crassipes Water hyacinth
30 Pistia stratiotes Water lettuce
31 Salvinia molesta Salvinia Table 23: Ranked list of Wet Tropics environmental weeds of concern (Source: Werren 2001).
Scientific name Common name
Annona glabra Pond apple
Leucaena leucocephala Leucaena
Chromolaena odorata Siam weed
Sphagneticola trilobata Singapore daisy
Hymenachne amplexicaulis Hymenachne
Miconia calvescens Miconia
Psidium guajava Guava
Thunbergia spp. Thunbergia
Brachiaria mutica Para grass
Mikania micrantha Mile-a-minute
Panicum maximum Guinea grass
Parmentiera aculeata Cucumber tree
Turbina corymbosa Turbine vine
Ageratina riparia Mistflower
Andropogon gayanus Gamba grass
Mangifera indica Mango
Spathodea campanulata African tulip tree
Tithonia diversifolia Japanese sunflower
Solanum seaforthianum Brazilian nightshade
Azadirachta indica Neem
Eupatorium catarium Praxelis
Harungana madagascariensis Harungana
Stachytarpheta spp. Snakeweed

CONDITION REPORT: SUSTAINABLE USE 61
Scientific name Common name
Senna obtusifolia Sicklepod
Syngonium podophyllum Syngonium
Sansevieria trifasciata Mother-in-laws tongue
Hyptis capitata Knob weed
Mimosa diplotricha Giant sensitive plant
Cyperus aromaticus Navua sedge
Allamanda cathartica Yellow allamanda
Elephantopus mollis Tobacco weed
Euphorbia heterophylla Milk weed
Eichhornia crassipes Water hyacinth (aquatic)
Pistia stratiotes Water lettuce (aquatic)
Salvinia molesta Salvinia (aquatic)
Elodea canadensis Pondweed (aquatic)
Sagittaria graminea ssp. platyphylla Arrowhead (aquatic)
Cabomba caroliniana Cabomba (aquatic)
Alternanthera philoxeroides Alligator weed (aquatic) These lists (Bebawi et. al. 2001, Werren 2001) identify plant species that have been introduced accidentally and purposely for agriculture and ornamental purposes and include: • The ponded-pasture grass hymenachne (Hymenachne amplexicaulis), which was
released in north Queensland in 1988 and took just eleven years to become one of Australia’s top twenty worst weeds (Weed of National Significance);
• Singapore daisy (Sphagneticola trilobata), a garden creeper extensively used as a quick ground-cover and first imported in the mid-1970s, but now ranking as one of the worst invaders along the Queensland coast;
• Lantana, an ornamental that has spread throughout northern Australia, and smothers native vegetation and can poison stock; and
• The mango, a major crop species in North Queensland, contributing significantly to the regional economy.
They do not necessarily identify species related to known species of the same genera or family. For example, Navua Sedge is identified in both the above lists, but it is recognised that other species of Cyperus such as Nutgrass (C. rotundus) are serious weeds of maize, sugar cane, vegetables and tobacco in coastal and sub-coastal regions (Parsons and Cuthbertson 2001). This emphasizes even further the importance of a readily acceptable and transparent plant risk assessment system for all potential plant imports, but that realistic criteria are necessary if a broad range of land uses are to be co-existent in the Wet Tropics region. The importance of this task is recognised by the CRC for Australian Weed Management, which has a program (1) devoted to the provision of tools for a co-ordinated national approach to the assessment, management and prevention of newly emerging weed problems. Further to the above-mentioned concerns about the entry of pest plants to the country/region, there are significant management concerns about the ease of transfer of pest seeds and plant material within the region, both across the area and between land uses. Good hygiene is necessary when transporting products such as hay for animal feed and similarly management practices for slashing the verges of roads could be considered for Singapore daisy control.

62 SUSTAINING THE WET TROPICS: A REGIONAL PLAN FOR NRM
Box 11: Vehicle hygeine
Agricultural industries in the Wet Tropics region are affected by plant pests by the competitive effects of weed species, possible contamination of produce and possible toxic substances in some plants on livestock. Each industry has undertaken varying levels of research, development and extension depending on the actual and perceived nature of the pest plant problem. Some information on weeds, their impacts and current work for agriculture in the region has been collated in Table 24. A major recognised threat has been the reduced investment by government in weed science and the implications it has for managed and natural ecosystems (Lovett and Knights 1996). However, these authors identified the CRC for Australian Weed Management as being an important initiative to promote improved investment in weed issues and communication across the Australian weed scientist network. There are a broad range of control measures for pest plants including chemical control, mechanical control, fire and biocontrol. These are all considered as part of the toolkit that pest plant managers apply depending on the circumstances as part of an integrated management program. In this regard, Paynter and Flanagan (2002) discuss the benefits of an integrated approach using all agents for Mimosa pigra control and how as biological agent attack rates increased in stands, which were fragmented by herbicide and mechanical control. Similarly, agricultural systems, which are using reduced tillage practices to address soil conservation, can result in changes in the weed flora due to a greater reliance on herbicides, (e.g. as identified by Cogle et. al. 1991 in north Queensland). These changes may mean that periodic cultivation is required to ensure that weeds are controlled appropriately (Lovett and Knights 1996).
Across Queensland, isolated outbreaks of declared plants such as parthenium weed, giant rats tail grass and prickly acacia are found on properties and roadsides each year. Outbreaks of these declared plants are often located hundreds of kilometres from core infestations. These outbreaks occur as a result of machinery, livestock, vehicles, fodder, grain, material and equipment contaminated with weed seeds and viable plant parts. These contaminants may be unknowingly transported during day to day activities. Examples include:
• Mud and soil containing weed seed can be transported on heavy machinery to another location (e.g. during dam construction, road works, scrub clearing, soil and gravel extraction).
• Vehicles driven through weed infestations may transport weed seeds that become trapped in radiators or inside the cab on floor mats, especially after wet conditions.
• Boats, trailers and equipment can be contaminated with plant segments of declared water weeds (e.g. during work on water courses and storage facilities).
Policies for government vehicles are being written to ensure that all vehicles with the potential to spread weed seeds in the above manner are subject to a “wash-down” procedure prior to movement across the country. These procedures may have a broader applicability to other vehicle owners.

CONDITION REPORT: SUSTAINABLE USE 63
Table 24: Weeds, their impacts and some current/past work for agriculture in the region.
Industry Impact Current work
Sugar cane Response to NRA on review of use of the herbicide Diuron. www.bses.org.au
Herbicide sensitivity/susceptibility of tropical crops and weeds; issues of registration
Hawton et. al. (1990)
Tillage and herbicide options for weed control and impact on weed spectra in peanuts, maize and sorghum
Hawton and Johnson (1981), Cogle et. al. (1991)
Field crops
Crop weed research, mostly in southern Australia, but may be applicable
CRC Aust Weed Management
Horticultural crops
Herbicide sensitivity/susceptibility of tropical crops and pastures and weeds Hawton et. al. (1990)
Herbicide control of weeds in pastures and impact of chemicals on pastures Hawton and Johnson (1983)
Fungus assessment - rubbervine Vogler and Lindsay (2002)
Biological control options - Mimosa pigra Paynter and Flanagan (2002)
Grazing (beef, dairy)
Chemical control/ pig habitat/poisonous - Bellyache Bush
Vitelli and Madigan (2002) CRC Weeds Program 3
Herbicide use is a valuable weed control tool, and registration of chemicals for different weeds and locations is an important issue. Pratley (1996) identified the lack of flexibility with respect to ‘off label’ uses of various chemicals and delays with receiving approvals as a major impediment to weed control in Australia, and Hawton et. al. (1990) identified the need for continuing evaluation work on chemicals in the region to ensure that chemical availability for control of various weeds is available. The major reason for regulatory processes is to protect humans and the environment from any damaging consequences of herbicide use. The Australian Pesticides and Veterinary Medicines Authority (ex National Registration Authority) is mandated to ensure the risk of using chemicals is acceptably low. Consideration of the environmental consequences of herbicide use is made when assessing chemicals for registration or review. Hence studies of the persistence of chemicals on farm and their impacts off-farm are important as part of the ongoing assessment of chemicals for registration as herbicides (see Section 2.1.2.8 Pesticides). 4.2.1.4. Current state of understanding
There are gaps in our current state of understanding in: • What is a weed/risk assessment? Transparent risk assessment systems are an important way
of preventing plant species becoming problems in the landscape. However, these systems need to be constructed in an environment of full consultation with all land users and industries;
• Research issues associated with plant ecology, weed identification and management; and
• Implementation of management plans: − Identification of management plans is only part of the process towards control of
pest species. Successful management requires all stakeholders to be supportive of the desired solutions. To achieve this planning must be inclusive and co-operative management actions should be supported.

64 SUSTAINING THE WET TROPICS: A REGIONAL PLAN FOR NRM
− Management plans apply at many levels from individual properties as part of a property management plan to the control of pests on all ‘State Land’, the latter being an important issue in the region.
4.2.1.5. Potential actions for sustainable use
NR&M has facilitated the development of Local Government Pest Management Plans throughout the State over the past 4 years. All local government areas within the Wet Tropics are included. These plans outline how Local Government will manage pests in their Local Goverment area in line with the Rural Lands Protection Act 1985. In north Queensland, 10 Local Governments are currently preparing a ‘Regional’ Pest Management Plan and this plan will link to current National and State pest plant and animal strategies (including Weeds of National Significance - WONS). An aim of the plans is to provide better coordination across Local Government boundaries and a second aim is to try and get key strategies and actions included on the Wet Tropics Regional NRM strategy to help provide direction on the way in which NR&M funds are spent in the future (including the NHT Program extension). In the region, some industries have developed plans for sustainable management approaches to pest plants. For example, the Wet Tropics Management Authority has prepared a pest management plan for the WHA. This plan includes weed and animal of environmental concern. Similarly, Best Practice Guidelines for some agricultural industries have identified management practices for pest plants. Road verges, associated road maintenance and vehicle traffic continue to accelerate weed spread. The Wet Tropics Road Maintenance Code of Practice is one attempt at improving road verge management and to bring roadside weed management to the highest standards. Similarly, the Code of Practice and Environmental Management Plans for the electricity supply industry also aims to minimise the impact and spread of undesirable weeds. Another means of improving management of pest plants is improved community awareness of weeds and their potential impacts. The production of user-friendly books and pamphlet’s has been particularly successful in some areas. In addition to these ‘simple’ publications, detailed works such as the CRC publication ‘Australian Weed Management Systems’ (Edited by Sindel 2000) and the populist book, ‘Feral Future’ (Low 1999) expose people to the dilemma of plant pest control in the 21st century. The concept of integrated weed management (IWM) is an important approach to sustainable management practices. IWM can be defined as a ‘sustainable management system that combines all appropriate weed control options’ (Sindel 2000). These options can include physical, ecological, biological, chemical and genetic methods to obtain effective and economical weed control. Application of these principles requires a co-ordinated effort of landholders, scientists and others. In the Wet Tropics region further efforts could be made to encourage IWM in agricultural systems, in a similar way to that of the Local Government pest management plans. While weeds addressed may not be those listed in risk assessment schemes, benefits in terms of more efficacious herbicide use and consequent reduced offsite impacts may accrue. 4.2.1.6. Institutional and administrative arrangements
The Rural Lands Protection Act 1985 is administered by NR&M. Until recently there were five categories of declared plants viz: P1 - plants whose introduction into the State is prohibited; P2 - plants that are to be destroyed throughout the State; P3 - plants whose numbers and/or distribution are to be reduced throughout the State; P4 - plants that are to be prevented from spreading from the place that they occur within
the State; and P5 - plants that should be controlled only under the management of a government
department or local government.

CONDITION REPORT: SUSTAINABLE USE 65
New legislation titled the Land (Pest and Stock Route Management) Act 2002 listing three classes of noxious pests (plants and animals) has been enacted. The three classes are: Class 1 - not generally established in Queensland and has potential to cause an adverse
economic, environmental or social impact; Class 2 - established in Queensland and can cause significant adverse economic,
environmental or social impact (including in another State); and Class 3 - established in Queensland and has or could have adverse economic,
environmental or social impact (including in another State). The current list of pest plant species under the new Act is listed in the following table and much overlap exists with previous tables. In addition to these lists, local government councils have the capacity to declare weeds within their boundaries. Therefore, in some parts of the Wet Tropics weeds not in Table 25 may be identified as ‘declared’. Table 25: Pest plants identified under the Land (Pest and Stock Route Management) Act 2002.
Class 1 Class 2 Class 3
Acacia (non-indigenous to Australia) (Acacia spp. other than Acacia nilotica and Acacia farnesiana)
African boxthorn (Lycium ferocissimum)
African fountain grass (Pennisetum setaceum)
Alligator weed (Alternanthera philoxeroides)
American rat’s tail grass (Sporobolus jacquemontii)
African tulip tree (Spathodea campanulate)
Anchored water hyacinth (Eichhornia azurea)
Annual ragweed (Ambrosia artemisifolia)
Aristolochia or Dutchman’s pipe (Aristolochia spp. Other than native species)
Badhara bush (Gmelina asiatica)
Belly-ache bush (Jatropha gossypiifolia)
Asparagus fern (Protasparagus densiflorus, P. africanus and P. plumosus)
Bitou bush (Chrysanthemoides monilifera)
Cabomba (Cabomba spp.)
Athel pine (Tamarix aphylla)
Bridal creeper (Asparagus asparagoides)
Chinee apple (Ziziphus mouritiana)
Balloon vine (Cardiospermum grandiflorum)
Chilean needle grass (Nasella neesiana)
Fireweed (Senecio madagascariensis)
Blackberry (Rubus fruiticosus agg.)
Christ thorn (Ziziphus spina-christi)
Giant parramatta grass (Sporobolus fertilis)
Broad-leaved pepper tree (Schinus terebinthifolius)
Eurasian water milfoil (Myriophyllum spicatum)
Giant sensitive plant (Mimosa invisa)
Camphor laurel (Cinnamomum camphora)
Floating water chestnuts (Trapa spp.)
Rat’s tail grass (Sporobolus pyramidalis and S. natalensis)
Captain cook tree (Thevetia peruviana)
Gorse (Ulex europaeus)
Groundsel bush (Baccharis halimifolia)
Cat’s claw vine (Macfadyena unguis-cati)
Honey locust (Gleditisia spp. including cultivars and varieties)
Harrisia cactus (Ericocereus spp.)
Chinese celtis (Celtis sinensis)
Horsetails (Equisetum spp.)
Hymenachne (Hymenachne amplexicaulis)
Harungana (Harungana madagascariensis)
Hygrophila (Hygrophila costata)
Mesquites (Prosopis glandulosa, P.pallida and P. velutina)
Lantana (all species) (Lantana spp.)
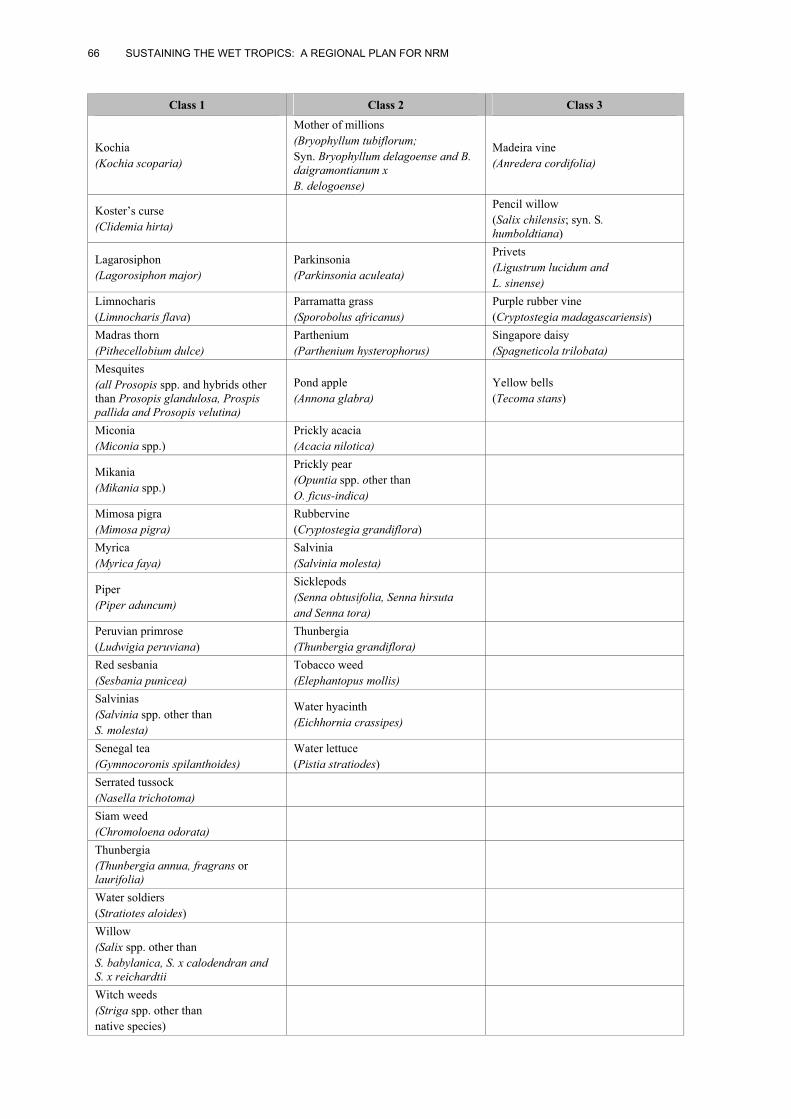
66 SUSTAINING THE WET TROPICS: A REGIONAL PLAN FOR NRM
Class 1 Class 2 Class 3
Kochia (Kochia scoparia)
Mother of millions (Bryophyllum tubiflorum; Syn. Bryophyllum delagoense and B. daigramontianum x B. delogoense)
Madeira vine (Anredera cordifolia)
Koster’s curse (Clidemia hirta)
Pencil willow (Salix chilensis; syn. S. humboldtiana)
Lagarosiphon (Lagorosiphon major)
Parkinsonia (Parkinsonia aculeata)
Privets (Ligustrum lucidum and L. sinense)
Limnocharis (Limnocharis flava)
Parramatta grass (Sporobolus africanus)
Purple rubber vine (Cryptostegia madagascariensis)
Madras thorn (Pithecellobium dulce)
Parthenium (Parthenium hysterophorus)
Singapore daisy (Spagneticola trilobata)
Mesquites (all Prosopis spp. and hybrids other than Prosopis glandulosa, Prospis pallida and Prosopis velutina)
Pond apple (Annona glabra)
Yellow bells (Tecoma stans)
Miconia (Miconia spp.)
Prickly acacia (Acacia nilotica)
Mikania (Mikania spp.)
Prickly pear (Opuntia spp. other than O. ficus-indica)
Mimosa pigra (Mimosa pigra)
Rubbervine (Cryptostegia grandiflora)
Myrica (Myrica faya)
Salvinia (Salvinia molesta)
Piper (Piper aduncum)
Sicklepods (Senna obtusifolia, Senna hirsuta and Senna tora)
Peruvian primrose (Ludwigia peruviana)
Thunbergia (Thunbergia grandiflora)
Red sesbania (Sesbania punicea)
Tobacco weed (Elephantopus mollis)
Salvinias (Salvinia spp. other than S. molesta)
Water hyacinth (Eichhornia crassipes)
Senegal tea (Gymnocoronis spilanthoides)
Water lettuce (Pistia stratiodes)
Serrated tussock (Nasella trichotoma)
Siam weed (Chromoloena odorata)
Thunbergia (Thunbergia annua, fragrans or laurifolia)
Water soldiers (Stratiotes aloides)
Willow (Salix spp. other than S. babylanica, S. x calodendran and S. x reichardtii
Witch weeds (Striga spp. other than native species)

CONDITION REPORT: SUSTAINABLE USE 67
Whole of Government approaches to pest plants are also another direction that is leading to more acceptable/agreeable pest plant management. The recent development of the Queensland Government Policy on Ponded pastures will help advisors and landholders make decisions about the applicability for ponded pasture development on their properties. 4.2.2. PEST ANIMALS
4.2.2.1. Definition
A pest animal is one that is known, in some circumstances, to cause one or more of the following outcomes (Qld Govt 2002): • Has a negative impact on primary or other production; • Has a negative impact on human health or safety; • Directly reduces the sustainability of native flora or fauna populations or the
resources upon which these depend; or • Creates a nuisance that reduces the quality of life for a community. Pest animals are problems in all landscapes and landuses. Under the Rural Lands Protection Act 1985 in Queensland, several animals were declared pests. Pest animals represent a threat to agriculture, the environment and the land itself. The declared animals in Queensland grouped as: Group 1 - All mammal species NOT native to Queensland; Group 2 - All reptile species NOT native to Queensland; and Group 3 - Locusts (migratory, spur throated and Australian plague). The 1985 Act does not cover exotic birds, amphibians or invertebrates. The Act identified eight categories to indicate the type of management required and the important A1 / A2 / A3 animals were Fox, Rabbit, Hare, Feral Buffalo, Dingo and Feral Pig. As has been identified in the pest plants section new legislation titled the Land (Pest and Stock Route Management) Act 2002 listing three classes of noxious pests (plants and animals) will soon replace the above Act. The draft list of animals is shown in Table 26. The Queensland Pest Animal Strategy 2002-2006 (Queensland Government 2002b) makes a clear distinction between exotic and native animals. Pest animals are exotic animals causing detrimental impacts on the environment, industry or community activities. Problem animals are native animals that sometimes conflict with local or immediate human activities and are generally protected under the nature Conservation Act 1992. Control of native animals is by authorised officers or under permit. 4.2.2.2. Condition, trends and current state of knowledge
There is a reasonable body of knowledge on a range of pest animals, however much seems to be held by a small group of specialists. There is a similar predicament as for pest plants in that some undeclared animal pests are viewed as such in different industries or communities. The report on Vertebrate pests of built up areas in Queensland (O’Keefe and Walton 2001) provides useful insights to this dilemma. Fact sheets (BSES, NR&M, DPI) provide information on declared and non-declared pest animals in the state and provide valuable background, ecology and management information. Some research has been undertaken on feral pigs (Sus scrofa) in the region and adjacent areas (see Feral Pigs: Pest Status and Prospects for Control, Ed. C.N. Johnson 2001). Feral pigs were introduced to Australia by early settlers and are declared pests under Queensland legislation. They are regarded to have a medium density across the Wet Tropics area, but are found in all habitat types in Queensland. They have a major potential and actual impact due to their flexible diet and habitat requirements and ability to breed rapidly. Damage has been estimated at $80m (NR&M 2002) and includes

68 SUSTAINING THE WET TROPICS: A REGIONAL PLAN FOR NRM
impacts on crops, livestock, pasture, fencing and watering points and the destruction of riparian vegetation. In addition, feral pigs may carry both infectious diseases and parasites. Rats have been and are a major vertebrate pest (problem animal) in sugar cane. It is notable that rat problems have been instrumental in human disease and agronomic changes in the sugar industry during the last century. Also notable is that the two important rat species are native species (Climbing Rat, Melomys burtoii and Ground Rat, Rattus sordidus), which have proliferated in broad scale sugar cane production. BSES, EPA and other institutions have undertaken significant research in recent years and identified management practices such as tree planting on adjacent lands to reduce rat habitat. Dingoes (Canis lupus dingo) are present throughout the State but less prevalent in more populated areas. In the Wet Tropic region they may have some impact in sparser areas such as the Herbert River catchment and the beef industry. Rabbits (Oryctolagus cuniculus) are major agricultural and environmental pests in Australia. They compete with native animals, destroy the landscape and are a primary cause of soil erosion by preventing regeneration of native vegetation. In the region they have been present for many years with populations fluctuating based on seasonal conditions and the calvci virus on the Atherton Tableland. There is a diverse view on the subject of flying foxes (Pteropus spp.) in the Wet Tropics. These animals are protected under the Nature Conservation Act 1992, but are recognised as major problems in the northern horticultural industry, particularly for lychees, longans and cashews. They also have a variable reputation in towns and cities due to their roosting behaviour. In the horticultural industry, efforts are underway to identify cost effective crop protection practices and these include netting systems of various types, which cost between $6,000-30,000 per ha depending on the system. Other options include shooting (permits are necessary), scare devices, odour emitters and acoustic repellents. The cane toad (Bufo marinus) is worthy of mention in any discussion of pest animals, and as it is also an important problem in the Wet Tropics. Their introduction to Australia was intentional and aimed at the biological control of the Frenchi and Greyback cane beetles in the sugar cane industry. Unfortunately, they were only partially successful as biological control agents due to habitat differences and indiscriminate dietary requirements. 4.2.2.3. Critical issues, impacts and threats
One difficulty appears to be the lack of an easy method for determining the potential impact for any new pests. Recently, the Rainforest CRC has developed a vertebrate pest risk assessment scheme for the Wet Tropics (Harrison and Congdon 2001) designed to establish the relative pest status, and the current and potential ecological impacts of exotic vertebrates presently found within the Wet Tropics region. Their findings were that the current major vertebrate pests are the pig, cat, cane toad and dog/dingo. These species ranked high primarily due to their current levels of ecological impacts and because of the current lack of feasible control options. The Rainforest CRC pest risk assessment scheme used criteria clearly linked to ecological impact, and schemes that consider the impact to other industries, particularly agriculture need to be established to ensure that all industries are considered. Transparent schemes should consider both agricultural and ecological issues and there would doubtless be general agreement as to the pest status of various animal species. Agricultural industries in the Wet Tropics region are subject to animal pests through damage to produce in various forms (e.g. yield reductions, lowering product quality, etc.). Each industry has undertaken varying levels of research, development and extension depending on the actual and perceived nature of the pest plant problem.

CONDITION REPORT: SUSTAINABLE USE 69
Werren (pers. comm.) is currently summarising the Pest Management Plans of the local governments in the region for the development of a regional pest management plan. Animals that have been identified as high priorities in current plans are cats, dingos/dogs, pigs, rabbits, white cockatoos, black cockatoos, and wallabies. During consultation for the development of the regional pest management plan, the top seven mean scores for animal pests (pest animals and problem animals) were pigs, dingos/dogs, rabbit’s, black cockatoos, feral horses, currawongs and cane rats. 4.2.2.4. Current state of understanding
There are gaps in our current state of understanding in: • What is an animal pest / risk assessment? Transparent risk assessment systems are
an important way of preventing animal species becoming problems in the landscape. However, these systems need to be constructed in an environment of full consultation with all land users and industries;
• Research issues associated with animal ecology and management (e.g. feral pig diets) are currently being studied to assess the ecological impact; and
• Implementation of management plans. − Identification of management plans is only part of the process towards control of
animal pest species. Successful management requires all stakeholders to be supportive of the desired solutions. To achieve this planning must be inclusive and co-operative management actions should be supported.
− Management plans can be at many levels from individual properties, as part of a property management plan to the control of pests on all ‘State Land’. The latter being an important issue in the region.
4.2.2.5. Potential actions for sustainable use
Effective rat management in sugar cane can be based on a four pronged integrated pest management strategy (http://www.bses.org.au/). The strategy includes: • Establishing a need to bait via monitoring, co-ordinated by the CPPBs; • Control of weeds in crops to reduce available high protein food sources; • Harbourage management including weed control, grazing and tree planting; and • Strategic baiting using rodenticides. As previously discussed, management in horticultural industries includes netting, scare devices and chemicals. Further information can be found in the DPI Agrilink series. 4.2.2.6. Institutional and administrative arrangements
New legislation titled the Land (Pest and Stock Route Management) Act 2002 listing three classes of noxious pests (plants and animals) will soon replace the above Act. The three classes are: Class 1 - not generally established in Queensland and has potential to cause an adverse
economic, environmental or social impact; Class 2 - established in Queensland and can cause significant adverse economic,
environmental or social impact (including in another State); and Class 3 - established in Queensland and has or could have adverse economic,
environmental or social impact (including in another State). The current list of pest plant species under the new Act are listed in the following table and much overlap exists with previous tables.

70 SUSTAINING THE WET TROPICS: A REGIONAL PLAN FOR NRM
Table 26: Pest animals identified under the Land (Pest and Stock Route Management) Act 2002.
Class 1 Class 2
Alpaca (Lama pacos) Australian plague locust (Chortoicetus terminifera)
Axolotyl (Ambystoma mexicanum) Cat, other than a domestic cat (Felis catus)
Bison or American buffalo (Bison bison) Dingo (Canis familiaris dingo)
Blackbuck antelope (Antilope cervicapra) Dingo hybrid (Canis familiaris dingo x Canis familiaris)
Black rat (Rattus rattus) Dog, other than a domestic dog (Canis familiaris)
Camel (Camelus dromedarius) European fox (Vulpes vulpes)
Bali cattle (Bos javanicus and B. sondaicus)
European rabbit (domestic and wild breeds) (Ocyctologus caniculus)
Cane toad (Bufo marinus) Goat, other than a domestic goat (Capra hircus)
Cattle (Bos spp) Migratory locust (Locusta migrantaria)
Chital (axis) deer (Felis catus) Feral pig (Sus scrofa)
Domestic cat (Felis catus) Spur-throated locust (Austracris guttulosa)
Domestic dog (Canis familiaris)
Domestic goat (Capra hircus)
Pig, other than a feral pig (Sus scofa)
Donkey (Equus asinus)
European hare (lepus capensis)
Fallow deer (Dama dama)
Guanicoe (Lama guanicoe)
Guinea pig (Cavia porcellus)
Hog deer (Axis porcinus)
Horse (Equus caballus)
House mouse (Mus musculus)
Llama (Lama glamo)
Red deer (Cervus elaphus)
Rusa deer (Cervus timorensis)
Sambar deer (Cervus unicolor)
Sewer rat (Rattus narvegicus)
Sheep (Ovis aries)
Wapiti deer (Cervus canadensis)
Water buffalo (Budalus bubalis)
White-tail deer (Odocoileus virginianus)

CONDITION REPORT: SUSTAINABLE USE 71
4.2.3. PEST INVERTEBRATES AND PEST DISEASES
Pest invertebrates and diseases have impacts on natural resource management in the region through their direct effects on life cycles in agricultural and natural ecosystems. This section briefly highlights aspects of their impact. 4.2.3.1 Definition
Pest invertebrates are problems in all landscapes and landuses. Invertebrates refer to animals without backbones and include insects and nematodes. Insects can be major pests of many crop species at various stages of their life cycle by consuming plant parts or fruits, or by damaging crop product. Nematodes can damage crop root growth thereby reducing plant vigour and production. It should be noted that while insects and nematodes can be major pests, it is also fully recognised that this group of organisms can also play a vital role in plant production via activities such as pollination and nutrient cycling. Pest diseases are problems in all landscapes and landuses. Diseases include fungal, bacterial and viral organisms. 4.2.3.2 Condition and trends and current state of knowledge
There are insect pest lists for all major crop species and these pests are the subject of significant research by agencies, CRCs and agro-chemical companies. Robertson (2001) outlined the problems of Greyback cane grubs in the northern sugar industry. This pest is endemic to north-eastern Australia and occurs in sugar cane between Sarina and Mossman and also occurs on the Atherton Tablelands and in their native environment feed on native grasses. The larvae feed on plant roots and cause reduced growth, poor yields and reduce the ability of the crop to ratoon. Widespread outbreaks have occurred with over 3000 ha damaged since 1996. Following the removal of the pesticides BHC and Heptachlor from registered chemical control lists, a resurgence of these pests occurred. Their ecology and control mechanism were identified during research activities in the 1990s and improved management practices have been well publicized in Grubplan (BSES internet site). Grubplan is an integrated approach that incorporates chemical (suSCon_Blue, Confidor), biological (Biocane) and cultural (rotations and trap crops) to deliver a damage control strategy for the cane industry. Information on other crop pests of sugar cane can be found on the BSES website. Fruitpiecing moths and fruitspotting bugs are important pest of the horticultural industry in the Wet Tropics. Fay (2002) discussed the significance of these pests to the range of crops and their ecology and habitat. Fruitpiecing moths and fruitspotting bugs between them, feed on about 40 different cultivated fruits or nuts and crop losses greater than 50% have been attributed to each on occasions. These and other species may live in both agricultural and natural habitats (Blanche et. al. 2002) and it would appear that the positive and negative ecosystem services from entomological species need further evaluation. The banana scale moth is a major problem in the banana industry and, until 10 years ago, large quantities of pesticides were broadcast on to the crop, either aerially or sprayed. Research by Pinese and colleagues (Bruno Pinese personal communication) identified an improved method of pesticide application by injecting pesticide into the banana bell, hence reducing chemical use by 95%. This has recently led to new techniques using a reusable ribbon containing suSCon 2003. 4.2.3.3. Critical issues, impacts and threats Table 27: Critical issues associated with pest invertebrates for agriculture in the region.
Industry Impact Current work
Sugar cane • Greyback cane grubs can cause major yield problems.
• Management plans and practices. Robertson research.
Field crops

72 SUSTAINING THE WET TROPICS: A REGIONAL PLAN FOR NRM
Industry Impact Current work
Horticultural crops
• Mango Leafhopper
• Spiraling Whitefly; Red banded caterpillar
• Melon Thrips
• Papaya Fruit Fly
• Banana Skipper
• Quarantine
• Banana Biosecurity Plan
Grazing (beef, dairy) Table 28: Critical issues associated with pest diseases for agriculture in the region.
Industry Impact Current work
Sugar cane • Orange Rust; Sugar cane smut • BSES, Quarantine
Field crops • Peanuts [Leaf Spot (Early, Late),
CBR (Black Rot)]
• Potatoes [Bacterial Wilt, Leaf Spot]
Horticultural crops
• Bananas [Black Sigatoka, Moko Disease, Panama Tropical race 4, Freckle Disease]
• Papaya [Black Spot, Phytophera]
• Avocadoes [Phytophera]
• Integrated approaches using cultural and chemical practices (Peterson, Grice)
• Quarantine
• Banana Biosecurity Plan
Grazing (beef, dairy) • Hay contamination by fungus and fungicides
4.2.3.4. Current state of understanding
There are gaps in our current state of understanding in: • Research to maintain adequate control mechanisms for crops. This includes integrated
pest management practices, and identification and registration of chemicals for pest control;
• Surveillance and monitoring. These must be maintained to ensure that new pests are not entering the country (e.g. AQIS, NAQS, Northwatch) and will enable control measures to be put in place before problems become too great;
• The impact of new pests entering Australia (e.g. mango leafhopper, Moko disease). Hence, basic and applied research is necessary in entomology and plant pathology in the tropics; and
• Ensuring capacity to address new problems. Capacities within organisations to provide an integrated response to incursions of pests, which threaten our environmental and agricultural sectors, need to be maintained in regional areas. This includes biosecurity planning such as the national Banana Industry Biosecurity Plan.
4.2.3.5. Potential actions for sustainable use
The Department of Primary Industries and industry bodies are continually developing management practices to reduce the impact of pest invertebrates and diseases on agriculture and forestry production. Plant invertebrate disease threats (e.g. phytopthera) in forestry and protected estates are also being addressed by the above bodies and universities. 4.2.3.6. Institutional and administrative arrangements
The chemical registration process and quarantine matters are dealt with under legislation of both the Federal and State governments.

CONDITION REPORT: SUSTAINABLE USE 73
4.3. VEGETATION (TREE THICKENING, PASTURE DECLINE) 4.3.1. CONDITION, TRENDS AND CURRENT STATE OF KNOWLEDGE
Woody weed invasion results in reduced biodiversity, an interesting paradox as most of the threats to Australian biodiversity are from clearing. It also reduces pasture production and makes cattle management more difficult (hence increasing costs). Critically from a land management perspective, there is increased runoff and relative soil loss (refer to Section 3.3.2). Some recent work has demonstrated the potential of burning during the storm season (in conjunction with stock exclusion over a growing season), to halt or reverse woody regrowth. This was particularly so in areas dominated by wattles, whereas other species such as poplar gums (Eucalyptus platyphylla) and melaleucas (Melaleuca nervosa and viridiflora) were thought to require repetitive fires (Mt Garnet Landcare 2002; Stanton 2002). Similar research is currently underway in the gulf savannas (Kernot and Grice 2003). 4.3.2. CRITICAL ISSUES, IMPACTS AND THREATS / CURRENT STATE OF
UNDERSTANDING
Results from the Mt Garnet research have shown that fire management has the capability to reverse the invasion of grassy woodland. The cost to the grazier is the cost of fencing as well as the loss of grazing from the pasture for more than 12 months. It is necessary use one wet season of pasture growth to produce fuel for a fire of sufficient intensity to reduce woody weeds during the next storm season. The losses have to be balanced against improved pasture production in subsequent seasons. 4.3.3. POTENTIAL ACTIONS FOR SUSTAINABLE USE
Appropriate management of grazing land, as detailed in the Grazing Land Management guidelines (EDGE Network 2002), is the key to control of weed invasion. 4.3.4. ADMINISTRATIVE ARRANGEMENTS
The Vegetation Management Act 1999 creates a framework for the management of native vegetation to achieve: • The ecologically sustainable use of land; • The protection of biodiversity and other environmental and social values; • Planning certainty for landholders, industry and the community; • Prevention of land degradation such as salinity and soil erosion; and • Protection of water quality within catchments. The Wet Tropics World Heritage Protection and Management Act 1993 was proclaimed in November 1993 for the protection and management of the Wet Tropics World Heritage Area. The Nature Conservation Act 1992 and associated regulations aims to conserve nature in Queensland. It is based on the principles of conservation of biological diversity, ecologically sustainable use of wildlife, ecologically sustainable development and on international criteria developed by the World Conservation Union (International Union for the Conservation of Nature and Natural Resources) for establishing and managing protected areas. The Environment Protection and Biodiversity Conservation Act 1999 (Commonwealth) that came into force in July 2000 requires an assessment and approval process for activities that are likely to have a significant impact on the Commonwealth marine environment, on nationally threatened species and ecological communities, and on internationally protected migratory species.

74 SUSTAINING THE WET TROPICS: A REGIONAL PLAN FOR NRM
5. FRESHWATER AND MARINE FISHERIES
5.1. FISH HABITATS 5.1.1. DEFINITION
Habitat simply means the environment where an animal lives and reproduces. Identifying fish habitat can be difficult because fish move through the ocean or rivers and use different types of habitats for different purposes. For example, a fish might spawn in one type of area and forage for food in another. Nursery areas that support juvenile fish may be totally different to habitats where adults of the same species are found. For example, post larval barramundi use supralittoral lagoons and swamps as nursery habitat (Russell and Garrett 1985) whereas the juveniles and adults utilise more permanent watercourses. In the Wet Tropics there are a myriad of fish habitats ranging from first order streams in the upper catchment through to inshore coral reefs. 5.1.2. CONDITION, TRENDS AND CURRENT STATE OF KNOWLEDGE
Anthropogenic activities have had considerable impacts on fish habitat in Wet Tropics catchments, particularly over the latter part of the 20th century. In Wet Tropics catchments over about the past 50 years there have been significant losses of tidal and freshwater wetlands. In the Moresby River catchment in the 41 years between 1951 and 1992 the total area of coastal wetlands decreased by about 27% or 1,548 hectares (Russell et. al. 1996a). Similarly in the Russell-Mulgrave catchment (Russell et. al. 1996b) documented a 54% loss of non-tidal wetlands over a 40 year period between 1952 and 1992 with most of the land reclaimed for sugar production. In some catchments the loss of wetlands appears to be less severe. In the Barron catchment there was a net wetland loss of only 180 hectares or 16% between 1952 and 1996 (Russell et. al. 2000). While most of the wetland losses in Wet Tropics catchments have been largely non-tidal, freshwater wetlands there are exceptions. On the eastern side of Trinity Inlet, Cairns some 700 hectares of predominantly mangroves and saltpan were cleared in the 1970s ostensibly for sugar production. The reclamation of these wetlands involved the construction of a bund wall around the perimeter of the site to prevent tidal flooding and the tidal creeks on the site were fitted with floodgates to stop tidal action. Apart from wetland loss, fish habitat has been degraded or lost through other anthropogenic activities both direct and indirect. There has been an increase in sedimentation in Wet Tropics streams because of inappropriate land use activities. In Queensland, about 14 million tonnes of sediment are transported to the coast annually and river sediment loads are generally 10 to 50 times greater than pre-European loads in intensively used river basins (National Land and Water Resources Audit 2001). Sediment loads can have adverse impacts on fish and fish habitats. While only extremely high concentrations of sediment can cause mortality in adult fish, lower levels can affect adults through subtle changes in behaviour or disruption of normal reproduction. Excessive sedimentation can also decrease streambed roughness by infilling the gaps between the substrate that can act as habitat for an array of invertebrate prey species (Karr and Schlosser 1978). It can also result in reduced respiration and feeding of aquatic biota (National Land and Water Resources Audit 2001). There is also potential for degradation of sea grass meadows, which are critical habitat for some prawn species (Coles et. al. 1987) although (Brodie 2002) suggests that the sea grasses in the Great Barrier Reef World Heritage Area are in reasonable condition with respect to their spatial extent. Mangroves are also extremely important as fish habitat (McNae 1974; Saenger 1979; Robertson and Duke 1987; Pinto and Punchihewa 1996; Laegdsgaard and Johnson 2001). Mangroves, in general, are not affected by increased nutrient inputs (Brodie 2002) and may be advantaged by increased suspended solids leading to larger areas of substrate suitable for mangrove colonisation. Occasionally, there are reported cases of mangrove dieback in Queensland.

CONDITION REPORT: SUSTAINABLE USE 75
5.1.3. CRITICAL ISSUES, IMPACTS AND THREATS
The general close proximity of seagrass beds to land raises the prospect that meadows may be impacted by material originating from land and vulnerable to changes in coastal processes (Brodie 2002). Brodie contends that recent studies of factors that contribute to seagrass decline have shown that increased anthropogenic inputs to the coastal zone may be linked to seagrass loss. Seagrass growth and performance is adversely affected by high water turbidity, smothering by sediment or mud, high nutrient availability and the presence of herbicide residues in sediment (Haynes et. al. 2000a; Haynes et. al. 2000b). Increased nutrient supply from mainland river discharge has resulted in an expansion of the area of seagrass meadows on reefal areas at Green Island in the Wet Tropics although such areas are normally without seagrass (Udy et. al. 1999). There are also potential impacts from port developments in the region, e.g. at Cairns and Mourilyan Harbour (R. Coles, DPI, pers. comm.). 5.1.4. CURRENT STATE OF UNDERSTANDING (GAP ANALYSIS OF
RESEARCH NEEDS)
• Seagrass - surveys that were done of the sea grass meadows in the Wet Tropics area are dated and the Wet Tropics areas should be remapped to determine their current extent and changes that have occurred since the last survey in 1987;
• Water harvesting and irrigation - a wide variety of issues relating to flood loss, timing of pump operation, environmental flows, overland flows, levee banks, altered hydrology, water storage management, instream structures, fish and weed capture and redistribution need investigation;
• Drainage - preferential flow paths, flood and flow duration, channel modification, de-snagging, fish stranding, groundwater drainage, loss of wetlands, artificial wetlands, ideal drain design, stormwater management, urban runoff need more work;
• Water quality - major concerns include causes/management of fish kills, water quality tolerances, effects of fertiliser and herbicides/pesticides (including on the Great Barrier Reef), salination and groundwater pollution;
• Exotic aquatic weeds - control methods for noxious weeds and effects of ponded pastures need to be examined in relation to the proliferation of exotic plant species;
• Climate - issues relate to climate change, sea level change, drought planning and future water demand prioritisation/effects need investigation. Specific issues include the effects of rising sea level on existing marine and freshwater wetlands and associated biota, increased cyclonic activity and changes in rainfall patterns, impacts of rising water temperature on aquatic biota, particularly migratory fish species need to be investigated;
• Riparian zone - importance of riparian zone to instream habitat and nutrient filtering; guidelines for riparian restoration; how to best educate stakeholders about riparian zone issues need investigation;
• Habitat - resurvey and map the instream habitat of Wet Tropics rivers to determine temporal changes using similar techniques (Russell and Hales 1993a; Russell and Hales 1997a; Russell et. al. 1998);
• Agricultural practices - there is need for further work on the impacts of agricultural practices in areas such as potential sugar cane trash to increase instream biological oxygen demand, tillage timing for reducing erosion, cane juice pollution and how applied nutrients effect water quality and habitat;
• Urbanisation - quantification of current and future impacts of urbanisation on habitat, medium and long term effects of increased water extraction on instream habitat;
• Catchment management plans/activities - effects on habitat of sand and gravel extraction, river improvement works including stream bank armouring, dredging and other mining activities need to be explored and remediation and restoration measures assessed;
• Land clearing -there is a suite of issues related to land clearing including problems associated with increased runoff, erosion, siltation, interference in water table dynamics and the activation of acid sulfate soils. Guidelines and legislation are needed to prevent or minimise the effects of these problems;

76 SUSTAINING THE WET TROPICS: A REGIONAL PLAN FOR NRM
• Fish passage - anthropogenic activities have resulted in the disruption of fish passage through construction of stream barriers, sand dams, flood and tide gates, road/rail/farm crossings. These barriers are numerous and there is a need for suitable and easily constructed fishway designs to facilitate fish passage; and
• Potential actions for sustainable use (administrative or political actions): − Identification of and protection of critical fish habitats as marine protected areas
including Fish Habitat Areas and Marine Parks. − Education of the public on the importance of habitat to fisheries. − Closer cooperation and integration of the activities of government agencies
responsible for the management of riparian lands, riverine habitat and fisheries. However, a more explicit framework for sustainable use, which would incorporate these and other elements, could best be developed by hosting a workshop of stakeholder groups including natural resource managers, researchers, community catchment and Landcare groups and fishers. This would result in a plan that could be very effectively utilised in natural resource planning at both government and community levels. 5.1.5. INSTITUTIONAL AND ADMINISTRATIVE ARRANGEMENTS
The Integrated Planning Act (1997) provides a balance between community well being, economic development and the protection of the natural environment by providing a framework for managing growth and change within the State. The Nature Conservation Act 1992 and associated regulations aims to conserve nature in Queensland. It is based on principles to conserve biological diversity, ecologically sustainable use of wildlife, ecologically sustainable development and international criteria developed by the World Conservation Union (International Union for the Conservation of Nature and Natural Resources) for establishing and managing protected areas. The Environment Protection and Biodiversity Conservation Act 1999 (Commonwealth) that came into force in July 2000 requires an assessment and approval process for activities that are likely to have a significant impact on the Commonwealth marine environment, on nationally threatened species and ecological communities, and on internationally protected migratory species. The Queensland Fisheries Act 1994 and associated regulations and management plans provide the major framework for fisheries management in the State. It includes protection of fisheries values including marine plants, coastal fisheries and licensing and disease monitoring. The Environmental Protection Act (1994) and associated regulations aim to protect Queensland’s environment, to remove uncertainty regarding administrative responsibility for environmental protection and to allow integration of environmental protection with resource and infrastructure development. The Integrated Planning Act (1997) provides a balance between community well being, economic development and the protection of the natural environment by providing a framework for managing growth and change within the State. The Great Barrier Reef Marine Park Act (1975) is the primary Act in respect of management and protection of the Great Barrier Reef Marine Park. 5.2. EXOTIC AND TRANSLOCATED FISH AND
INVERTEBRATES 5.2.1. DEFINITION
An exotic species is one that is not native to Australia as opposed to a translocated species, which is a native fish that has been moved beyond its natural range. There are increasing concerns about the threats posed to our native fish and invertebrates by the

CONDITION REPORT: SUSTAINABLE USE 77
largely uncontrolled spread of exotic species in Australia and particularly in the Wet Tropics. Human mobility has radically increased the rate at which large numbers of living things are moving from one ecosystem to another. As more species invade natural communities that are not equipped to cope with them, more native species are stressed, or in extreme cases face local extinction with the result that natural ecology is permanently altered. 5.2.2. CONDITIONS, TRENDS AND CURRENT STATE OF KNOWLEDGE
Some exotic fish species that have become established predominantly in the freshwater reaches of Wet Tropics streams. They include aquarium fish such as guppies and swordtails that have subsequently become established as escapees or have been deliberately stocked. Other species such as mosquito fish have been introduced to address specific problems. Guppies were found in many Wet Tropics streams (Pusey and Kennard 1996) including the Johnstone, (Russell and Hales 1993b), Daintree (Russell et. al. 1998), Barron (Russell et. al. 2000), Moresby (Russell et. al. 1996a) and Russell-Mulgrave catchments (Russell et. al. 1996b). Similarly, swordtails (Xiphophorus helleri) were found in parts of the Johnstone, Russell and Mulgrave and Barron catchments (Russell and Hales 1993b; Russell et. al. 1996b; Russell et. al. 2000). While guppies and swordtails are popular aquarium fish and were almost certainly introduced into the wild as a result of releases or escapees from home aquarium systems, mosquito fish (Gambusia holbrooki) were introduced into Wet Tropics streams for mosquito control. Mosquito fish were first introduced into the Cairns area over 50 years ago during the Second World War but, fortuitously, they appear not to have become widely established in the Wet Tropics. Recent surveys of Wet Tropics streams have their distribution to be very limited. For example, Russell et. al. (2000) in an extensive survey of the Barron River found mosquito fish present in only one site on a single occasion. There was evidence of their adverse impacts on native fishes including predation on larval melanotaenids, pseudomugils and eleotrids (Ivantsoff and Aarn 1999). McKay (1984) noted that fast flowing rivers and streams were not suited to mosquito fish and that, when present, they generally inhabit quieter backwaters away from the main current. If these observations were correct, the generally fast flowing streams of the Wet Tropics would not provide suitable habitat for mosquito fish. Two species of tilapia, Tilapia mariae and Oreochromis mossambicus (or mosambique mouthbrooder), were found in Wet Tropics streams. However, there is a possibility that a number of hybrids may also be present (J. Johnson, Queensland Museum, pers. comm.). Importation of the Mozambique mouthbrooder into Australia has been prohibited since 1963 and tilapia are a declared noxious fish in most Australian States (including Queensland) and the Northern Territory. Despite this, and heavy penalties for translocation and cultivation, they are spreading at an alarming rate. While this can be partly attributed to natural dispersion, fish regularly turn up in dams and ponds where their presence can only be attributed to human intervention (Arthington 1989). In the past, these species have been readily available through the aquarium industry and other sources and are now well established in natural watercourses in eastern Queensland and parts of Western Australia. Oreochromis mossambicus is established in southeast Queensland and in the Townsville region (Arthington et. al. 1984) and was recently found in sections of Lake Tinaroo (Alf Hogan, DPI, pers. comm.). Fish in dams on private property from sites in the upper catchment were almost certainly responsible for colonising Lake Tinaroo. T. mariae were established in a number of Wet Tropics streams including the Johnstone River (Russell and Hales 1993b) and the Russell and Mulgrave Rivers (Russell et. al. 1996b). O. mossambicus was found at a number of sites above Lake Tinaroo during this study, including both in the main river and minor streams. This species has been found in previous surveys in this sub-catchment and has now been located in Lake Tinaroo (Alf Hogan, DPI Fisheries Group, pers. comm.). O. mossambicus was also established in other Queensland waterways including the Ross River (Townsville) and in the Brisbane area (Arthington et. al. 1984). Translocation of native fish species into rivers or the new habitats created by the construction of impoundments (McKay 1989) has been widely practiced in Australia including in the Wet Tropics, ostensibly for creating recreational fisheries. In the Wet Tropics fish stocking activities can be traced back to early last century when there were

78 SUSTAINING THE WET TROPICS: A REGIONAL PLAN FOR NRM
unsuccessful attempts to establish the non-native recreational fish species including rainbow (Salmo gairdnerii) and brown (Salmo trutta) trout in streams including the Barron River (Grant 1975) with some attempts dating back to early last century. The completion of the Tinaroo Falls Dam in 1958 resulted in an increase in translocation activity in the Barron catchment and advances in breeding technology for barramundi (Lates calcarifer) in the 1980s resulted in the creation of a successful ‘put and take’ recreational fishery for that species in the impoundment. The increase in visitor numbers that resulted from the creation of this fishery has been of significant economic and social benefit to the local community. A cost benefit analysis of the barramundi stocking program in Lake Tinaroo indicates that each dollar spent on fish stocking generated a potential $31m of economic benefit to the Queensland economy (Rutledge et. al. 1990). Hogan (pers. comm.) estimates the value of the Tinaroo fishery alone to be in excess of $10m. Community fish stocking groups, under permit from the Queensland Department of Primary Industries, are currently stocking fish species (predominantly barramundi) into a number of rivers and impoundments in the Wet Tropics. Apart from the impoundment stockings, there are currently permits to stock fish (barramundi) into coastal rivers to enhance or promote the recovery of existing fisheries. Monitoring of recreational and commercial fisheries in the Johnstone River suggests that stocked fish now make up between about 10 and 15% of the catch (Rimmer and Russell 1998b). Redclaw (Cherax quadricarinatus) is a freshwater crayfish native to the Gulf of Carpentaria drainage and a popular aquaculture and recreational species. While the Department of Primary Industries translocation policy prohibits the stocking of this species outside of its natural range, its popularity as recreational species and its use in aquaculture has resulted in it becoming widely established, in most cases illegally, in many Queensland catchments including a number in the Wet Tropics. 5.2.2.1 Marine exotic species
There is concern that marine pests enter Australian waters in the bilge water or attached to the hulls of foreign vessels. There have been instances of this occurring in Australian ports and in the Wet Tropics. For example, Asian Green Mussels (Perna viridis) were found on the hull of a vessel in Cairns Harbour in 2001. These mussels are an exotic species native to the tropics from the northwest Indian Ocean and Persian Gulf to the Philippines and from the east China Sea in the north down through the Indonesian archipelago. It has also accidentally been introduced into the Caribbean and from there by currents and human activities to the coast of nearby Venezuela and the Florida coast. It has also been intentionally introduced to many south Pacific Islands such as Fiji and Polynesia. 5.2.3. CRITICAL ISSUES, IMPACTS AND THREATS
5.2.3.1. Marine exotics species
In many countries, particularly China, India, Thailand, Singapore and the Philippines, Asian green mussels are an important aquaculture species. Indeed, they have been introduced to many Pacific Islands as an aquaculture species. Despite their aquaculture potential, they are regarded as a pest species in many areas because of their ability to grow quickly, cover boat hulls and choke underwater intake pipes. Densities of up to 35,000 mussels m2 can form carpets up to 0.6m thick. It was found to be clogging canals of power plants on the Florida coast in 1999. 5.2.3.2. Freshwater exotic and translocated species
While guppies, swordtails and mosquito fish were present in many Wet Tropics catchments, these species appear not to have become established in large numbers. However, there was considerable concern that populations of tilapia will become widely established in the Barron River catchment. Furthermore, there is a reasonable probability that the fish now found in the upper catchment will eventually become established in drainage from the Gulf of Carpentaria. While tilapia has not been recorded in any drainage to the west of the catchment, there was considerable speculation that the billabongs and slow flowing streams characteristic of this region could provide ideal habitat allowing this species to build up large numbers to the detriment of native fish and the general ecology.

CONDITION REPORT: SUSTAINABLE USE 79
Potentially this could adversely affect the valuable recreational and riverine/coastal commercial fisheries of the Gulf. In the Gulf of Carpentaria, the barramundi fishery is worth nearly $6m/yr and the Northern Prawn Fishery is valued at $100m/yr. The commercial and recreational sectors are worth in excess of $400m and $50m/yr respectively, in Queensland (Williams 1997). There are examples of where translocated fish species are documented to have adverse impacts on rare or unique fishes. For example, Lake Eacham rainbow fish (Melanotaenia eachamensis) were thought extinct from their type locality, Lake Eacham (Barlow et. al. 1987). These authors suggested that translocated species, in particular mouth-almighty (Glossamia aprion), were strongly implicated in the disappearance of M. eachamensis from Lake Eacham. It now appears that M. eachamensis species is still present in the Barron River, as well as the Tully, Herbert and Johnstone Rivers (Pusey et. al. 1997, Katrina McGuigan, University of Queensland, pers. comm.). In the confined and isolated environment of Lake Eacham, resident M. eachamensis stocks appear to have been much more vulnerable to predation than stocks in other riverine locations. However, the disappearance of this species from its type locality, possibly as the result of inappropriate translocations of other fish species, does underline how finely balanced and susceptible some aquatic ecosystems are to inappropriate anthropogenic activities. There has also been speculation that novel introductions, such as stocked fish, would place at risk significant frog and crustacean assemblages, particularly in high mountain streams. There is little or no evidence that this has happened in the past in the Wet Tropics and, indeed, studies of the distribution of predator species such as barramundi in the Barron catchment support the contention that these species are confined to the main impoundment and are not found in small feeder streams (Russell et. al. 2000). Most larger predators, where hatchery technology is presently available to allow production of large numbers for stocking, would be unlikely to venture into small streams and more likely stay resident in impoundments, which by definition are artificial habitats. Further, when evaluating such comments it must be remembered that long finned eels (Anguilla reinhardtii), a large and voracious carnivore, and a number of other smaller carnivorous / omnivorous fishes are naturally found in many, if not most of the upland streams considered vulnerable. When applications for stocking species are assessed by the Department of Primary Industries a series of policy principles have been adopted to ensure that the proposed actions are in accord with the principles of ecologically sustainable development, including the maintenance of ecological systems and the protection of biodiversity (Queensland Fisheries Management Authority 1998). These principles are: • Stocking of public or private waters with translocated species or non-indigenous
genetic stocks of a species will be considered only where a clear economic, social or conservation benefit can be demonstrated and where no alternative native species in the drainage basin have similar potential;
• Translocations will not be permitted in catchments where the integrity of native fish communities remains substantially intact and/or there are one or more threatened species of fish or other aquatic organisms and/or there are several native fish species of value;
• Translocation of species accorded threatened status because of habitat loss or other factors will be supported;
• With the exception of threatened species, preference will be given for translocating species that will not form self-sustaining populations in their target environment;
• All potential translocations will be subject to disease risk assessments to minimise the risk of disease transfers; and
• All proposals to translocate fish species of non-indigenous stocks of the same species are to be considered on a case-by-case basis.

80 SUSTAINING THE WET TROPICS: A REGIONAL PLAN FOR NRM
5.2.4. CURRENT STATE OF UNDERSTANDING (GAP ANALYSIS OF RESEARCH NEEDS)
5.2.4.1. Marine exotic species
One of the most urgent of needs is for the development of protocols for identifying and then dealing with vessels that potentially carry exotic marine species thereby minimising the risk of these becoming established in Australian waters. A second need revolves around the lack of information about what pests are already established, as many north Queensland ports (e.g. Port Douglas, Innisfail) have never been surveyed. Once the status of all ports has been established, there is a need for regular monitoring for pest incursions. 5.2.4.2. Freshwater exotic species
The Queensland Department of Primary Industries is developing a regional plan for the management of noxious fish in the Wet Tropics. An education and extension strategy that will target both school students and the adult community is being developed by the DPI in an effort to control the spread of noxious fish in Queensland. SunWater are currently considering placing screens on the irrigation channel from Tinaroo Dam, which potentially provides a conduit for tilapia to colonise the Mitchell catchment. As well as further targeted educational programs, there is need for more research and monitoring, particularly directed to controlling the spread of tilapia and minimising releases of aquarium fish into the wild that would potentially impact on native fish and stream ecology. • Ecological impacts of translocated and exotic fish species; • The potential for interbasin transfer of native and exotic fishes; • Community monitoring programs to monitor the spread of exotic fishes; and • Management and control of tilapia and other exotic fishes in the Wet Tropics
including development of educational material. 5.2.5. POTENTIAL ACTIONS FOR SUSTAINABLE USE
The EPA has released a brochure that outlines steps that can be taken to prevent the spread of Asian green mussels in Australia (www.epa.gov.au/environment/science/water/marine_pests.html). These measures include: • Painting of boat hulls with appropriate antifouling in accordance with manufacturers’
directions. Regular cleaning of propellers and other underwater fittings that cannot be painted with antifouling;
• Regular flushing of seawater inlets with freshwater to kill newly settled pests; and • Removal of any established green mussels when discovered. A monitoring program has been implemented by the Cairns Port Authority in its port area to monitor the presence of fouling organisms (A. Fletcher, Cairns Port Authority, pers. comm.). This program involves the strategic placement of settlement surfaces including ceramic tiles and unravelled poly rope that are checked at approximately three monthly intervals. 5.2.6. INSTITUTIONAL AND ADMINISTRATIVE ARRANGEMENTS
The Queensland Fisheries Act 1994 and associated regulations and management plans including the freshwater management plan which deals with translocation issues provides the major framework for fisheries management in the State. The Wet Tropics World Heritage Protection and Management Act 1993 was proclaimed in November 1993 for the protection and management of the Wet Tropics World Heritage Area.

CONDITION REPORT: SUSTAINABLE USE 81
The Nature Conservation Act 1992 and associated regulations aims to conserve nature in Queensland. It is based on principles to conserve biological diversity, ecologically sustainable use of wildlife, ecologically sustainable development and international criteria developed by the World Conservation Union (International Union for the Conservation of Nature and Natural Resources) for establishing and managing protected areas. The Environmental Protection Act (1994) and associated regulations aim to protect Queensland’s environment, to remove uncertainty regarding administrative responsibility for environmental protection and to allow integration of environmental protection with resource and infrastructure development. 5.3. NETTING, TRAWLING AND LINE FISHING 5.3.1. DEFINITION
Queensland commercial fisheries are the third largest in value in Australia and the eight most valuable primary produce for Queensland (Williams 2002a). The commercial fisheries are made up of two sectors: the commercial harvest sector, which has a gross value of production (GVP) of $295m and the aquaculture sector, which has a GVP of $55m (Williams 2002a). As well as the commercial sector, Queensland fisheries also have recreational and indigenous sectors. The recreational fishery has an estimated 800,000 participants who claim to have fished at least once a year and expenditure on recreational fishing is around $300m per year, an important contributor to local economies (Williams 2002a). Little information is available on the indigenous sector except that it is believed to be substantial in some areas (Williams 2002a). All three fishing sectors are represented in the Wet Tropics area. The reef line fishery is described as all fishing activities that take reef fish by handline, rod and line or troll line within the Great Barrier Reef Marine Park (Turnbull 1996). Since the commercial fishery began in the 1930s, there has been little change in fishing methods with both recreational and commercial demersal fishers using very similar techniques and equipment (Turnbull 1996). The commercial reef line fishery on the Great Barrier Reef is worth about $10m per annum with coral trout accounting for about 60% of the catch (Department of Primary Industries 2002c). As well as coral trout, a range of other demersal species are caught including red emperor, sea perch and red throat emperor (Turnbull 1996; Department of Primary Industries 2002a) and near surface swimming pelagic species such as mackerel (Scombermorus spp.) and mahi mahi (Coryphaena hippurus) (Turnbull 1996). The commercial fishery includes the trade of both live and dead fish with the bulk of the live fish, predominantly coral trout, exported directly to the Asian market. The reef line fishery also attracts recreational and indigenous fishers who target reef species for their recreational and sporting value, their eating qualities and cultural significance (Department of Primary Industries 2002c). There is a marked seasonality in commercial catches, effort and catch rates with all three parameters showing a gradual increase from a low early in the year to a high between September and November (Trainor 1991). Trawling is one of the most widely used commercial fishing methods in Australia (Australian Bureau of Statistics 2003) and the gross value of production of the Queensland trawl fishery was estimated to be $110m in 2000 (Williams and Dredge 2002). Essentially, the northern trawl fishery (the Great Barrier Reef lagoon) harvests tiger, endeavour, red-spot king and banana prawns with bugs taken as an incidental catch (Williams 2002b). In the northern section of the east Queensland Coast between about Cape York and Babinda, prawns (predominantly tiger and endeavour species) make up nearly 97% of the catch and are also the major component of the catches between Mission Beach and Cardwell (Williams 2002b). As well as prawns, the prawn trawl fishery results in the harvesting of a wide variety of non-target species or bycatch, most of which consists of non-commercial species and are discarded (Poiner et. al. 1998). Fish bycatch, in particular, have a particularly low survival rate after being caught in trawls and are generally species associated with the seabed (Poiner et. al. 1998). The ratio of fish to invertebrates in the catch varies with location; in offshore areas of the northern section of the Great Barrier Reef marine park the ratio of fish biomass to
82 SUSTAINING THE WET TROPICS: A REGIONAL PLAN FOR NRM
invertebrate biomass was about 1:3.5 whereas inshore it was around 1:1 (Wassenberg et. al. 1998). The east coast inshore fishery, which extends from Cape York to Baffle Creek (near Bundaberg), is a multispecies fishery that harvests tropical fishes such as threadfins, barramundi, tropical shark and grey and spotted mackerel (Williams et. al. 2002). However, on the east Queensland coast, there are some 50 species that could be potentially harvested in the fishery (Russell 1988). In the Wet Tropics region, gill netting is a major fishing technique used predominantly in rivers and along coastal foreshores (Williams et. al. 2002. Gillnets are highly selective in their ability to catch target species and damage to the sea bed, unlike trawling, is usually minimal with nets either being anchored in place or hauled across the substratum by hand (Halliday et. al. 2001). Generally the smaller the net mesh size the greater the number of fish that are caught and, as not all fish are marketed, particularly the smaller ones, the bycatch component can be decreased by increasing the mesh size (Halliday et. al. 2001). There is also a developing coastal and offshore multi-species gill net fishery for shark. 5.3.2. CONDITIONS, TRENDS AND CURRENT STATE OF KNOWLEDGE
In a recent review of the management arrangements for the coral reef line fishery (Department of Primary Industries 2002a) a number of emerging trends were identified including: • Declining catch rates of target species. In particular, a drop in the commercial catch rate
of coral trout from approximately 110 kg per day in 1992 to approximately 65 kg per day in 2001 and red throat emperor from approximately 60 kg in 1992 to approximately 40 kg in 2001;
• A dramatic expansion of effort in the commercial reef line sector including a recent take-up of latent effort in response to market forces and the growing demand for all coral reef fin fish species;
• Indications of increased overfishing resulting in decreasing yield for increased fishing effort. Research has found that fished populations of common coral trout are significantly smaller and lighter than fish found in protected areas. This is of concern if the stock has been subjected to levels of fishing pressure which result in fish being harvested as soon as they reach legal size; and
• A gradual shift over the past five years from an even distribution in total catch of coral reef fish between commercial and recreational fishers to an estimated 65:35% ratio in favour of commercial fishers.
In response to these trends, the Queensland Fisheries Service is proposing a range of management changes to the reef line fishery including variations in size and bag limits, limiting commercial licences and boat sizes and removing latent effort. Commercial fishers in Queensland are required to provide information regarding catch and effort to the Queensland Fisheries Service (QFS). In the trawl fishery, the logbooks are required to be completed daily and submitted to QFS within 15 days of the end of each month where it is stored on a database (Queensland Fisheries Service 2002). Up until the end of 2000, the trawl fishery was managed with input controls including restrictions on the number of boats in the fishery, area and seasonal closures and boat and net size controls (Williams 2002b). This was substantially altered in 2001 to limit the number of days in which any trawler can harvest in the fishery as well as an increase in the number and extent of area and time closures (Williams 2002b). In the Far Northern Section of the GBR marine park the extent of prawn trawling on fish populations is probably low given the low fishing effort (Poiner et. al. 1998). The abundance of commercial prawn species is generally higher in trawled areas and there are large year-to-year variations in prawn population abundance (Poiner et. al. 1998). 5.3.3. CRITICAL ISSUES, IMPACTS AND TRENDS
One of the key critical issues in the reef line fishery is the significant increase in total commercial catch and effort and a gradual decline in the catch rates of target species that

CONDITION REPORT: SUSTAINABLE USE 83
have occurred over the past decade. Earlier studies have remarked on the high levels of latent effort in the fishery (Gwynne 1990; Turnbull 1996). Commercial logbook records for the years 1988 to 1990 show that 90% of the catch of the reef line fishery was landed by only 250 vessels (Gwynne 1990) while 50% of the commercial coral trout catch for 1994 was landed by only 30 vessels, although 270 vessels were recorded as having caught coral trout in that year (Turnbull 1996). Since the mid-1990s, the live fish trade has expanded, resulting in increased levels of catch and effort. Demand for this value-added product has resulted in a take-up of latent effort in the commercial sector. Due to these increases in commercial catch and effort levels, action needs to be taken to ensure the fishery and its key stocks such as coral trout are used sustainably. The Draft Plan proposes to deal directly with excess fishing capacity through an effort management scheme intended to reduce and cap effort at 1996 levels. The export of live reef fish to Asian markets is subject to considerable political opposition from other reef user groups, particularly the charter fishing industry and recreational fishers (Turnbull 1996). This opposition is based on the perception that the live fish export industry is resulting in considerable damage to reef fish stocks and limiting supplies of reef fish that should be otherwise available for locals to catch and consume (Turnbull 1996). Demersal trawling makes contact with the sea floor and therefore it can have substantial impacts on seabed habitats and benthic (occurring at or near the bottom of a water body) ecosystems (Australian Bureau of Statistics 2003). The extent of essentially indiscriminate impacts can be significant, including physical removal, disturbance of organisms and non-living components and increases in water turbidity. The nature of the catch in trawl fisheries other than the target species can include threatened species (e.g. turtles) and invertebrate (e.g. jellyfish) and large amounts of non-target species. Nearly 10,000 turtles are caught accidentally by trawl fishing each year in northern Australia, but an estimated 90% of these are released alive (State of the Environment 2001). Repeated trawling may prevent the recolonisation of benthic species, both sedentary and mobile. Trawl nets may dislodge attached species such as sponges and modify the habitat and food chains. Possible effects of trawling also include changes in food webs, such as increased populations of scavengers such as seabirds, fish and crabs. A 1996 study by the CSIRO and the Queensland Department of Primary Industries showed that each pass of the trawl along the seabed removes about 5% to 25% of the seabed life. However, there is a cumulative effect; seven trawls over the same area of seabed removed about half the seabed life, and 13 trawls removed 70% to 90%. In the far northern Great Barrier Reef Marine Park, for every tonne of prawns harvested, about six to ten tonnes of other species are discarded (State of the Environment 2001). About 80% of the discards are dead before being dumped and, with the exception of those taken by birds or pelagic predators, most end up on the sea bed (Poiner et. al. 1998). Current zoning in the Great Barrier Reef Marine Park prohibits trawling on about 20% of the sea floor (Australian Bureau of Statistics 2003). While both the trawl and reef line fisheries operate in the Great Barrier Reef Marine Park, there appears to be minimal interaction between the two fisheries. In the far northern section of the Great Barrier Reef Marine Park, recreational and commercially important species of fish do occur in the inter-shoal areas where trawling activities are concentrated but prawn trawls seldom catch juveniles or adults of these species (Poiner et. al. 1998). The physical damage done to the sea floor through gillnet fishing is relatively low as mostly the nets are anchored in place and fish passively (Halliday et. al. 2001). In some operations they are hauled across the bottom but this is done manually and damage is generally limited (Halliday et. al. 2001). The marketable section of the catch is high, up to 50 species (Russell 1988), and the discard component is generally low (Halliday et. al. 2001). In the gillnet fishery, the discard component of the catch consists of a variety of species, many of which are discarded live (Halliday et. al. 2001). The fate of bycatch is correlated with the amount of time that it remains in the net, handling during release, mesh type and environmental parameters like the strength of the current or tidal flow. One major concern is the impacts that gillnets are having on large non target species, particularly dugong (Dugong dugong) but also on other species such as crocodiles (Crocodylus porosus and C. johnstoni) and saw sharks (Pristis spp.). A series of 16 Dugong Protected Areas (DPAs) were instigated along the east Queensland coast in 1997, including in the Wet Tropics adjacent to Hinchinbrook Island, ostensibly to protect dugong. Netting is banned in seven of the DPAs, however modified nets are still

84 SUSTAINING THE WET TROPICS: A REGIONAL PLAN FOR NRM
permitted in nine others. There is also a developing shark fishery along the east coast that is tending to sue hydraulic net reels. The mechanisation of net retrieval makes the fishing operations more effective thus changing effort levels in the fishery (N. Gribble, Queensland Department of Primary Industries, pers. comm.). 5.3.4. CURRENT STATE OF UNDERSTANDING (GAP ANALYSIS OF
RESEARCH NEEDS)
• Further development of bycatch minimisation techniques and methods for improving survival of trawled bycatch;
• Investigations of alternate harvesting techniques for prawns and fish; • Socio-economic survey of commercial and recreational fishers in the Great Barrier
Reef Marine Park including impacts of proposed management interventions including marine protected areas and reef line fishery restrictions;
• Development of sustainability indicators for fish stocks, habitats and ecosystems; • Information on catch and effort in indigenous fisheries; • Some gaps exist on the basic biology of targeted and bycatch species. For example,
more information is needed on species composition and sustainable harvest levels for the shark fishery and critical habitats, reproductive behaviour and vulnerability of major species;
• Identification of critical habitats in the life cycles of important commercial and recreational species and what makes them important;
• The information of non-fishing related human activities on fisheries including pollution, agricultural point and non-point sources and habitat loss and degradation;
• The effect of the destruction of wetlands habitat on juvenile recruitment into coastal and reef fish stocks; and
• The effect of climate change on the range and juvenile habitat of tropical coastal fish species with particular interest on the effect of resultant instability as increased ranges overlap.
5.3.5. POTENTIAL ACTIONS FOR SUSTAINABLE USE
Due to increases in commercial catch and effort levels in the reef line fishery, actions are currently proposed to ensure that the fishery and its key stocks, such as coral trout, are used sustainably. New management measures (Department of Primary Industries 2002b) that are proposed for the fishery include: • Changes in size limits of a number of reef species that better reflect each species’
biological characteristics; • A moratorium on the issuing of new commercial fishing boat licences for the reef
line fishery and limiting boat upgrades for a period of 12 months from the start of the plan;
• It is proposed that excess fishing capacity be removed from the fishery through the introduction of an effort management scheme;
• Protection of certain species including potato cod, barramundi cod and Maori wrasse; and
• Possession limits for some operators to reduce the potential for further increases in commercial catch and effort while still allowing those operators to continue to assess fish for sale at non-commercial levels.
Actions are already being implemented in the trawl fishery to ensure sustainability. At present no sea bed species are listed as endangered or threatened, but the volume and type of bycatch has raised concerns about the sustainability of the industry. As a response to the significant issues and impacts of bycatch on the marine environment, the Commonwealth developed a National Bycatch Policy in 1999 and a Commonwealth Bycatch Policy in 2000. By the end of 2001, Bycatch Action Plans were developed for 14 of the 21 Commonwealth fisheries. Turtle exclusion devices (TEDs) and bycatch

CONDITION REPORT: SUSTAINABLE USE 85
reduction devices (BRDs) allow escape and have been trialled in the Northern Prawn Fishery since 1993. They became compulsory in this fishery in 2000. These projects show that the use of TEDs and BRDs has resulted in a substantial decline in the catches of large animals such as turtles, stingrays and sharks (Poiner et. al. 1998). However, the use of BRDs in this fishery seems to have had little impact on the catch of the smaller, more abundant bycatch. Poiner et. al. (1998) suggested that while BRDs will not lessen the impacts of trawls on many sessile animals like sponges they do lead to about a 20% decrease in the amount of bycatch. They contend that BRDs do lessen the impact of trawling on some demersal animals, particularly fish, which generally have a low survival rate after being trawled. The Commonwealth Government has provided just over $1m from the Natural Heritage Trust to establish the SeaNet extension service. The project is focused on increasing the rate of adoption by the commercial fishing sector of new fishing gear and practices to aid bycatch reduction and to implement environmental best practice (Australian Bureau of Statistics 2003). Poiner et. al. (1998) contend that, for the trawl fishery, ecological sustainability and economic return may be achieved by careful control of trawl effort and selective use of area closures. 5.3.6. INSTITUTIONAL AND ADMINISTRATIVE ARRANGEMENTS
There are both Commonwealth and state fisheries laws under which fisheries are managed through general regulations or other statutory methods. There are various methods to manage each fishery such as size and catch limits and gear restrictions. In Queensland, the Queensland Fisheries Act 1994 and associated regulations provide the major framework for fisheries management in the State. Other State and Commonwealth legislation also impact directly and indirectly on fisheries management. The Environment Protection and Biodiversity Conservation Act 1999 (Commonwealth) (the EPBC Act) came into force in July 2000. It requires an assessment and approval process for activities that are likely to have a significant impact on the Commonwealth marine environment, on nationally threatened species and ecological communities, and on internationally protected migratory species. The Act also requires that all Commonwealth managed fisheries have their own environmental impact strategically assessed. One of the most significant legislative changes is the removal of the general exemption of most marine fish from export control regulation under the Wildlife Protection (Regulation of Exports and Imports) Act 1982 (Commonwealth). The removal of the exemption makes the taking of marine native species consistent with the taking of terrestrial native species. This change comes into effect in December 2003. Before a fishery can become exempt from the Act, it must show that the fishery is ecologically sustainable in terms of its impact on: target species, non-target species and bycatch, and the ecosystem generally (including habitat) (State of the Environment 2001; Australian Bureau of Statistics 2003). Emergency measures to save dugongs in the southern Great Barrier Reef and Hervey Bay regions, were announced by the Federal and Queensland Governments in August 1997. Central to these measures was the establishment of a system of 16 dugong protection areas (DPAs), in these regions. The Areas were declared in legislation under the Queensland Nature Conservation Act 1992 and Queensland Fisheries Act 1994 (Great Barrier Reef Marine Park Authority 2003). 5.4. AQUACULTURE 5.4.1. DEFINITION
The term aquaculture means the farming of aquatic organisms including fish, molluscs, crustaceans and aquatic plants. Farming implies some sort of intervention in the rearing process to enhance production, such as regular stocking, feeding, protection from predators, etc. Farming also implies individual or corporate ownership of the stock being cultivated. For statistical purposes, aquatic organisms which are harvested by an individual or corporate body which has owned them throughout their rearing period contribute to aquaculture while aquatic organisms which are exploitable by the public as a common property resource, with or without appropriate licences, are the harvest of fisheries. The definition encompasses both freshwater and marine situations and generally includes organisms that spend their entire life cycles in the water and applies mainly to species that are utilized as human food (Stickney 1994). While aquaculture

86 SUSTAINING THE WET TROPICS: A REGIONAL PLAN FOR NRM
encompasses both saltwater and freshwater, the term mariculture is used to distinguish species that are reared in brackish or marine environments. Unlike in temperate regions, offshore culture facilities using large floating and/or submersible cages are virtually non-existent (De Silva 1998) however smaller cages in inshore coastal areas are very common. Freshwater aquaculture in the Wet Tropics is confined largely to pond based, on-farm systems. 5.4.2. CONDITION, TRENDS AND CURRENT STATE OF KNOWLEDGE
In the Wet Tropics area there is a range of aquaculture activities including both freshwater and saltwater ponds and land-based hatcheries and some cage culture activities for grow out in Hinchinbrook Channel. The main aquatic species cultured in the Wet Tropics are barramundi (Lates calacrifer), redclaw (Cherax quadricarinatus) and the penaeid species black tiger prawns (Penaeus monodon) and banana prawns (P. merguiensis). The penaeid prawns are marine and are pond-farmed while redclaw are an entirely freshwater crustacean. The potential of other species for aquaculture in the region is being trialled but they are not currently in large scale production. These species include mud crabs (Scylla serrata), eels (Anguilla reinhardti), jade perch (Scortum barcoo), golden Perch (Macquaria ambigua) and sleepy cod (Oxyeleotris lineolata). (M. Heidenreich, Queensland Department of Primary Industries, pers. comm.) Additionally, there is also some production of aquarium and ornamental fish including natives and exotics (Lobegeiger 2003) however the extent of these operations in the Wet Tropics is thought to be relatively small. Prawn farming is an expanding industry along the east Queensland coast and prawn farm effluents may be a considerable local source of nutrients (ACTFR 2002). Marine pond aquaculture is rapidly expanding with some estimates suggesting another 1000 ha of ponds were under construction (2002) or planned to start construction soon (ACTFR 2002). However, Robertson (Queensland Department of Primary Industries, pers. comm.) suggests that this is probably an overestimate, with the area of ponds constructed during that period probably closer to 150 ha. Prawn production in Australia is growing and in 2001/02 the harvest of farmed species was 3255 tonnes and was valued at $51.5m (Lobegeiger 2003). This was an increase of 1554 tonnes (91%) over the total production in 1998/99 (Lobegeiger 2003). Queensland is the largest producer of farmed prawns with more than 80% of the ponds in northern Australia (about 790 hectares of ponds) distributed along the east coast of Queensland (Robertson 2000). Australian prawn farms typically now have 1 ha ponds that are stocked at 20-45 prawns m-2 and produce 4-8 tonnes per hectare per crop (Robertson 2000). These marine or brackish ponds are generally aerated and may require regular water exchange to maintain their water quality. Redclaw are a native crustacean of the Gulf of Carpentaria and are a popular aquaculture and recreational species in Queensland. They have become established in many Wet Tropics catchments including the Barron River where their presence is attributed to both escapees from aquaculture farms and deliberate, unauthorised introductions (Russell et. al. 2000). Crayfish production has increased by over 22% from 70.0 tonnes in 1999/00 to 86.3 tonnes in 2000/01 and then dropped to 74.9 tonnes in 2001/02 (Lobegeiger 2003). The total value of the industry decreased from $1.1m in 2000/01 to $1.0m in 2001/02 (Lobegeiger 2003) (see Figure 8). During this period average farm gate prices increased from $12.82/kg to $13.40/kg (Lobegeiger 2003). Most redclaw crayfish are produced in on-farm ponds although there is a small number of farms throughout the State that use recirculating systems (Lobegeiger 2001). The total value of barramundi production in Queensland in 2001/02 was $6.9m with the annual harvest during that period 840 tonnes of whole fish (Lobegeiger 2003) (see Figure 8). Barramundi spawn in saltwater and require saltwater for the early parts of their life history but then can be successfully grown out to marketable size in either freshwater or saltwater. In the Wet Tropics one company uses grow out sea cages that are located in Hinchinbrook Channel while others use freshwater or brackish water earthen or lined ponds (Rimmer and Russell 1998a). The fish in these ponds are mostly in cages although, in some situations, they are allowed to free range throughout the pond. A

CONDITION REPORT: SUSTAINABLE USE 87
number of indoor barramundi farms are operating in parts of Australia. These have controlled environment buildings, use fresh or brackish water and a high level of recirculation through physical and biological filters (Rimmer and Russell 1998a). In the Wet Tropics some partial recirculating systems are in use and one farm has installed a raceway device on a freshwater pond in a trial to facilitate barramundi production (C. Robertson, Queensland Department of Primary Industries, pers. comm.).
0
500
1000
1500
2000
2500
3000
3500
1997/98 1998/99 1999/00 2000/01
Prod
uctio
n (to
nnes
)
Marine Prawns Kuruma Prawns Barramundi Redclaw
0
10
20
30
40
50
60
1997/98 1998/99 1999/00 2000/01
Valu
e ($
x 1
06 ))
Figure 8: Annual production and value of major aquaculture species in Queensland (Source: Lobegeiger 2003.) 5.4.3. CRITICAL ISSUES, IMPACTS AND THREATS
The discharge from coastal aquaculture under present cultivation techniques contains significant concentrations of suspended solids, nitrogen and phosphorus (Brodie 2002). The loss of nitrogen and phosphorus per hectare of pond is about an order of magnitude greater than that lost from a hectare of sugar cane production (Brennan 1999). Robertson (2000) reported that concerns about downstream impacts of nutrients, suspended solids and organic loadings from prawn farms have led to strict environmental licensing by various regulatory agencies in Australia. This licensing is based primarily on the need for the protection of coastal water quality, fisheries habitats and other aquatic resources and the prevention of diseases that may spread from aquaculture facilities. Concerns about environmental impacts of aquaculture have led to the regulation of discharge water quality from aquaculture farms with restrictions on the concentration or quantity of the nutrients nitrogen and phosphorus, levels of suspended solids and particulate matter (Robertson 2000). The actual parameters for individual aquaculture licenses are also determined by site-specific features including flushing and assimilative capacity of receiving waters, farm design and intensity of production. Recent changes to EPA licensing conditions have resulted in the implementation of load based licensing (kg/ha/day discharge of nutrients and suspended solids) for prawn farms (C. Robertson, DPI, pers. comm.).

88 SUSTAINING THE WET TROPICS: A REGIONAL PLAN FOR NRM
Prawn farmers aim to maximise prawn survival and growth with the use of high-protein feeds and by maintaining pond water quality through aeration and regular water exchange. Water exchange can minimise the effects of nitrogen accumulation by rinsing it from the pond, whereas in a closed or zero exchange pond the rate of daily feed input becomes the determining factor of the overall biomass carrying capacity of the pond (Hopkins et. al. 1993). Disease is a threat to both farmed and natural stocks. Globally, the emergence of virulent and contagious viral diseases has led to considerable losses in production and closure of farms in most shrimp farming industries, other than in Australia (Robertson 2000). The Queensland Department of Primary Industries and other agencies continuously monitor diseases issues on aquaculture farms (C. Robertson, Queensland Department of Primary Industries, pers. comm.). While there are benefits to the introduction of recirculation systems on aquaculture farms there are also potential problems. A recirculating farm presents increased disease risks, given that carriers may quickly transmit a disease in the recycled pond effluent and it becomes imperative that sound disease management and prevention protocols are in place to reduce exposure to such risks (Robertson 2000). Redclaw are a popular aquaculture species in the Wet Tropics and the extent of farming operations is generally restricted to a small number of ponds. There are issues related to escapees from redclaw farms establishing populations in watercourses outside their natural range and, potentially, with transmission of diseases to wild populations and to other freshwater crustacean species. Redclaw are subject to a number of diseases that include fungal, microsporidian, temnocephalids, nematodes, protozoans and certain viruses (Wingfield 2002). Adherence to proper hygiene practices has minimised the risk of bringing infections on the farm and minimised the risk of pathogens establishing and spreading. Cultured barramundi are subject to a range of diseases including ciliated protozoans, bacterial pathogens including Vibrio, Aeromonas, Pasteurella and Streptococcus, columnaris disease, fungi, myxosporideans, monogeneans, trematodes, crustaceans and viruses (Rimmer and Russell 1998a). A nodavirus has occasionally resulted in severe larval mortalities in Australian hatcheries in the past although this can now be readily controlled with improved hatchery methods and regular screening of broodstock (Rimmer and Russell 1998a). The issue of nutrient discharge from freshwater barramundi and redclaw ponds is not as great as it is in marine ponds. Discharges need to be licensed and meet environmental discharge conditions, however many farms use the water for irrigation rather than directly discharging into watercourses. 5.4.4. CURRENT STATE OF UNDERSTANDING (GAP ANALYSIS OF
RESEARCH NEEDS)
• Reduction of nutrients and other chemicals in wastewater released from aquaculture operations;
• Increasing the availability of Penaeus monodon broodstock for use in prawn aquaculture;
• Investigating the occurrence of the disease GAV in prawn farms, its transmission from natural stocks through the acquisition of broodstock and subsequent impacts on production;
• Development of bioremediation and other technologies to meet the challenge of stricter environmental discharge regulations;
• Improving automation and reducing labour inputs in barramundi aquaculture production systems;
• Marketing/market research for barramundi aquaculture; • Developing procedures to eliminate nodavirus transfer between hatcheries and
development of vaccines for diseases such as columnaris disease; and • Investigating means of increasing redclaw production to meet market demand.

CONDITION REPORT: SUSTAINABLE USE 89
5.4.5. POTENTIAL ACTIONS FOR SUSTAINABLE USE
Techniques using settlement ponds and cleanup ponds containing algae, bivalves and fish can reduce suspended solids and nutrients in pond discharge to low levels (Brodie 2002). Many Australian farms recirculate water as routine practice. Partial recirculation helps minimise fluctuations in water quality (salinity, turbidity, nutrient load) and reduces the risk of introducing pathogens from the wild. However, partial recirculation is not suited to all farms. Farms have variable requirements depending on a range of factors including quality of intake water, location within the catchment, availability of land, rainfall and access to tidal waters. In response to the increasing need for disease management and prevention, shrimp farming industries around the world have increasingly adopted best management practices and procedures to minimise the risk of disease. These measures are termed biosecurity. Improvements in biosecurity are aimed at preventing disease entry into a farm or hatchery operation by, for example, the quarantine of incoming stock. Also, there is a trend developing for some species (e.g. banana prawns) to use closed life cycle, disease free stock where no animals are bought onto the farm. Dissolved nitrogen resulting from feed protein can accumulate as ammonium and/or nitrate which can become toxic to prawns and other organisms in the ponds. Overfeeding can also result in reduced feed digestion and increased faeces production. If appropriate treatment systems are not incorporated into the design of conventional flow-through farms, the discharge of effluent high in nitrogenous metabolites may have adverse downstream environmental impacts. Treatment ponds can be incorporated into farm design to capture nitrogen and other nutrients before discharge or can be incorporated into recirculating systems. The recycling of excess nitrogen and the maximising of overall feeding efficiency would be an important gain for any aquaculture enterprise, rather than its loss in discharge waters which can potentially have major downstream impacts. The use of recirculation technology in aquaculture ponds, while still in its developmental phase, has a number of major advantages including: • Environmental sustainability; • Prevention of disease entering the farm from intake waters; • Avoidance of poor water quality in intake waters; and • Potential for higher production by stabilising water quality and improving growth. The use of recirculating marine pond water does not necessarily imply that all discharges will cease as all farms require regular and complete emptying and drying out as a disease management strategy. Indeed, farms in the Wet Tropics where there is considerable seasonal rainfall may overflow with considerable amounts of stormwater that would act to lower salinity. Under such circumstances, only a partial recirculating system would be feasible especially when the inflow of seawater is required to raise pond salinities. The use of wastewater from freshwater ponds for irrigation is another example of minimising discharges into natural watercourses. 5.4.6. INSTITUTIONAL AND ADMINISTRATIVE ARRANGEMENTS
State (EPA) and Federal (GBRMPA) authorities regulate effluent discharges in Queensland based on discharge volume and water quality criteria (Robertson 2000). The aquaculture industry is licensed and regulated under State legislation by the Queensland Fisheries Service. Local government planning regulations also apply. Specific acts and legislations that apply follow. The Nature Conservation Act 1992 and associated regulations aims to conserve nature in Queensland. It is based on principles to conserve biological diversity, ecologically sustainable use of wildlife, ecologically sustainable development and international criteria developed by the World Conservation Union (International Union for the Conservation of Nature and Natural Resources) for establishing and managing protected areas.

90 SUSTAINING THE WET TROPICS: A REGIONAL PLAN FOR NRM
The Environment Protection and Biodiversity Conservation Act 1999 (Commonwealth) that came into force in July 2000 requires an assessment and approval process for activities that are likely to have a significant impact on the Commonwealth marine environment, on nationally threatened species and ecological communities, and on internationally protected migratory species. The Queensland Fisheries Act 1994 and associated regulations and management plans provide the major framework for fisheries management in the State. It includes protection of fisheries values including marine plants, coastal fisheries and licensing and disease monitoring. The Environmental Protection Act (1994) and associated regulations aim to protect Queensland’s environment, to remove uncertainty regarding administrative responsibility for environmental protection and to allow integration of environmental protection with resource and infrastructure development. The Integrated Planning Act (1997) provides a balance between community well being, economic development and the protection of the natural environment by providing a framework for managing growth and change within the State. The Great Barrier Reef Marine Park Act (1975) is the primary Act in respect of the Great Barrier Reef Marine Park. It includes provisions which: • Establish the Great Barrier Reef Marine Park. • Establish the Great Barrier Reef Marine Park Authority, a Commonwealth authority
responsible for the management of the Marine Park. • Establish the Great Barrier Reef Consultative Committee to advise the Minister and
the GBRMPA. • Provide a framework for planning and management of the Marine Park, including
through zoning plans, plans of management and permits. • Prohibit operations for the recovery of minerals (which includes prospecting or
exploration for minerals) in the Marine Park (unless approved by the GBRMPA for research).
• Require compulsory pilotage for certain ships in prescribed areas of the Great Barrier Reef Region.
• Provide for regulations, collection of environmental management charge, enforcement, etc.

CONDITION REPORT: SUSTAINABLE USE 91
6. REFERENCES
ACTFR (2002). The effects of landuse on water quality in Australian northeast coastal catchments and coastal waterways. Australian Centre for Tropical Freshwater Research, James Cook University, Report Number 02/07. (Townsville, Queensland.)
Addiscott T.M., Whitmore A.P. and Powlson D.S. (1991). ‘Farming, Fertilisers and the Nitrate Problem’. (C.A.B. International, Wallingford.)
AGO (2003). National carbon greenhouse emissions from land use change in Australia: Results of the National Carbon Accounting System 1988-2001. Australian Greenhouse Office. August 2003. Available from <http://www.greenhouse.gov.au.
Ahern C.R., Baker D.E. and Aitken R.L. (1995). Models for relating pH measurements in water and calcium chloride for a wide range of pH, soil types and depths. Plant and Soil 171, 47-52.
Ahern C.R., Hey K.M., Watling K.M. and Eldershaw V.J. (Eds) (2000). Acid Sulfate Soils: Environmental Issues, Assessment and Management, Technical Papers, Brisbane, 20-22 June, 2000. Department of Natural Resources, Indooroopilly, Queensland, Australia. DNRQ00092.
Annandale M. (2002). Guidelines for private rainforest harvesting in North Queensland – A silvicultural manual. NHT Project Report May 2002. Queensland Forestry research Institute, DPI, Brisbane.
Anon (1995). ‘Nutrient Management in Irrigated Agriculture, Research and Implementation’ Proceedings of a Conference June 19-20, 1995, Echuca. 139 pp. (Agriculture Victoria.)
Anon (2003). Draft Reef Water Quality Protection Plan: For catchments adjacent to the Great Barrier Reef Water World Heritage Area. (http://www.thepremier.qld.gov.au/reefwater/).
ANZECC & ARMCANZ (2000). Australian and New Zealand Guidelines for Fresh and Marine Water Quality 2000, No. 4. National Water Quality Management Strategy. (Australian and New Zealand Environment and Conservation Council and Agriculture and Resource Management Council of Australia and New Zealand, Canberra.)
Armour J.D. and Daniells J.W. (2002). Banana Nutrition in north Queensland. Final Report on project FR95013 to Horticulture Australia Ltd.
Arthington A.H. (1989). Impacts of introduced and translocated freshwater fishes in Australia. In ‘Proceedings of a Workshop on the Introduction of Exotic Organisms in Asia’. Vol. 3 (Ed. S.S. de Silva.) pp.7-20. (Asian Fisheries Society: Manila.)
Arthington A.H., McKay R.J., Russell D.J. and Milton D.A. (1984). Occurrence of the introduced cichlid Oreochromis mossambicus (Peters) in Queensland. Australian J. Marine and Freshwater Research 35, 267-272.
Arthington A.H., Milton D.A. and McKay R.J. (1983). Effects of urban development and habitat alterations on the distribution and abundance of native and exotic freshwater fish in the Brisbane region, Queensland. Australian Journal of Ecology 8, 87-101.
Australian Bureau of Statistics (2003). Year Book of Australia 2003 - Fishing and the environment. In [Internet]. Available from <http://www.abs.gov.au/Ausstats> [Accessed 28/04/2003].
Australian National Parks and Wildlife Services (1990). Plant Invasions, The Incidence of Environmental Weeds In Australia.
Australian Quarantine and Inspection Services (2002). Northern Australia Quarantine Strategy (NAQS) 2001-2002 Year in Review.
Azzopardi M., Salvetti M., Kaddatz P., Schmidtke K. and Quirk R. (2002). Compass: Helping Queensland and New South Wales canegrowers move in the right direction. Proc. Aust. Soc. Sugar Cane Tech. 24, 304-10.

92 SUSTAINING THE WET TROPICS: A REGIONAL PLAN FOR NRM
Baker J. (2003). A report on the study of land-sourced pollutants and their impacts on water quality in and adjacent to the Great Barrier Reef.
Barclay D. and Pearce B. (1999). Atherton Tablelands Basalt Project, A Preliminary Review of Available Groundwater Reserves in the Atherton Tableland Basalt.
Barlow C.G., Hogan A.E. and Rodgers L.J. (1987). Implication of translocated fishes in the apparent extinction in the wild of the Lake Eacham Rainbowfish, Melanotaenia eachamensis. Australian Journal of Marine and Freshwater Research 38, 897-902.
Barry G.A., Price A.M. and Lynch P.J. (1998). Some implications of the recycling of sugar industry by-products. In: Proceedings of the Australian Society of Sugar Cane Technologists. pp.52-55. Ballina.
Barry G.A., Rayment G.E., Bloesch P.M. and Price A. (2000). Recycling sugar industry by-products and municipal biosolids on caneland. In: ‘Environmental Short Course for Sustainable Sugar Production- Course Manual’. Eds. R.C. Bruce, M. Johnston and G.E. Rayment. pp.129-134 (CRC for Sustainable Sugar Production, Townsville).
Bartley R., Henderson A., Prosser I.P., Hughes A.O., McKergow L., Lu H., Bainbridge Z. and Roth C. (2003). Patterns of Erosion and Sediment and Nutrient Transport in the Herbert River Catchment, Queensland. CSIRO Land and Water Technical Report.
Bebawi F.F., Campbell S.D. and Stanley T.D. (2001). Priority List for Weed Research In North Queensland Vol. 2: Wet Tropics.
Bell M.J., Bridge B.J., Harch G.R. and Orange D.N. (1997). Physical rehabilitation of degraded krasnozems using ley pastures. Australian J. Soil Research. 35, 1093-1113.
Bell M.J., Moody P.W, Connolly R.D. and Bridge B.J. (1998). The role of active fractions of soil organic matter in physical and chemical fertility of Ferrosols. Aust. J. Soil Res. 36, 809-19.
Biggs A.J.W. and Philip S.R. (1994). Soils of Cape York Peninsula. Queensland Department of Natural Resources.
Blanche R., Bauer R. Cunningham S. and Floyd R. (2002). Services and dis-services of rainforest insects to crops in north Queensland. Co-operative Research Centre for Tropical Rainforest Ecology and Management. (20 pages).
Bohl H.P., Mitchell D.C., Fanning D.J. and Roth C.H. (2000). Water and nitrogen balance for a heavy floodplain soil under sugarcane in the Australian Wet Tropics. In 'NZSSS/ASSSI Soil 2000 Conference'. Canterbury, NZ.
Bohl H.P., Roth C.H., Tetzlaff D. and Timmer J. (2001). Estimation of groundwater recharge and nitrogen leaching under sugarcane in the Ripple Creek catchment, Lower Herbert. Proc. Aust. Soc. Sugar Cane Technol. 23, 84-89.
Bolton M.P. (1990). New Pest Plants - North Queensland.
Bramley R.G.V. and Quabba R.P. (2001). Opportunities for improving the management of sugar cane production through the adoption of precision agriculture - an Australian perspective. In 'Proceedings of the 24th International Society of Sugar Cane Technologists Congress.
Bramley R.G.V., Roth C.H. and Wood A.W. (2003). Risk assessment of phosphorus loss from sugar cane lands - A tool to promote improved management of P fertiliser. Aust .J. Soil Res. 41, 627-44.
Braunack M.V. and Peatey T.C. (1999). Changes in soil physical properties after one pass of a sugar cane haulout unit. Aust. J. Exper. Agric. 39, 733-42.
Bray S.G., Schulke W., Yee M. and Vogler W. (1998). How does giant rats tail grass spread? Proceedings of the 5th Queensland Weed Symposium. 22-24 September; Cairns, Qld.
Brennan D. (1999). Pollution control policies for Australian prawn farms. In ‘43rd Annual Conference of the Australian Agricultural and Resource Economics Society’. (Eds. Christchurch, New Zealand.)

CONDITION REPORT: SUSTAINABLE USE 93
Brizga S. and Davis J. (1999). Barron Basin Water Allocation and Management Plan. Draft technical Report 4: Environmental Investigations. Department of Natural Resources 1999.
Brodie J. (2002). The effects of landuse on water quality in Australian north-east coastal catchments and coastal waterways. Report No. 02/07. Australian Centre for Tropical Freshwater Research, James Cook University, Townsville.
Brodie J., Furnas M., Ghonim S., Haynes D., Mitchell A., Morris S., Waterhouse J., Yorkston J., Andas D., Lowe D. and Ryan M. (2001). 'Great Barrier Reef Catchment Water Quality Action Plan.' Great Barrier Reef Marine Park Authority, Townsville.
Brodie J., McKergow L.A., Prosser I.P., Furnas M., Hughes A.O. and Hunter H. (2003). Sources of sediment and nutrient exports to the Great Barrier Reef World Heritage Area. ACTFR Report 03/11.
BSES Bulletin (October 1989). No. 28 - Weeds In Australian Cane Fields. BSES, Brisbane.
Buiting M. (1992). A comparative study between the Babinda and Behana Creeks. Report Nature Conservation Department, Agricultural University Wageningen and Water Resources Commission, Queensland.
Bunn S.E., Davies P.M. and Kellaway D.M. (1997). Contributions of sugar cane and invasive pasture grass to the aquatic food web of a tropical lowland stream. Marine and Freshwater Research 48, 173-179.
Bunn S.E., Davies P.M. and Mosisch T.D. (1999). Ecosystem measures of river health and their response to riparian and catchment degradation. Freshwater Biology 41, 333-345.
Bunn S.E., Davies P.M., Kellaway D.M. and Prosser I.P. (1998). Influence of invasive macrophyptes on channel morphology and hydrology in an open tropical lowland stream, and potential control by riparian shading. Freshwater Biology 39, 171-178.
Burkitt L.L., Moody P.W., Gourley C.J.P. and Hannah M.C. (2002). A simple phosphorus buffering index for Australian soils. Aust. J. Soil Res. 40, 497-513.
Burrows D.W. (1998). FNQ 2010 regional environment strategy key waterways report. Australian Centre for Tropical Freshwater Research, James Cook University, (Townsville.)
Burrows W.H., Henry B.K., Back P.V., Hoffmann M.B., Tait L.J., Anderson E.R., Menke N., Danaher T., Carter J.O. and McKeon G.M. (2002). Growth and carbon stock change in eucalypt woodlands in northeast Australia: ecological and greenhouse sink implications. Global Change Biology 8: 769-84.
Burton J.M. (2001). Environmental implications of nutrient movement in the intensive livestock industries of the Atherton Tablelands. Honours Thesis, B. Science, Griffith University.
Cannon M.G., Smith C.D., Murtha G.G. (1992). 'Soils of the Cardwell-Tully area, north Queensland.' (CSIRO Div. of Soils Divisional Report 115.)
Cavanagh J.E., Burns K.A., Brunskill G.J. and Coventry R.J. (1999). Organochlorine pesticide residues in soils and sediments of the Herbert and Burdekin River regions, north Queensland- implications for contamination of the Great Barrier Reef. Marine Pollution Bulletin 39:367-375.
Cavicchiolo M.A. (2001). An investigation into the bioaccumulation of arsenic and zinc in biota downstream of an area affected by acid sulfate soils. University of New England, (Canberra.)
Choy S., Marshall C.J. and Marshall J. (1999). An assessment of the ecological condition of the Barron River using macroinvertebrates as bioindicators. Queensland Department of Natural Resources, Freshwater Biological Monitoring Report Number 12.
Choy S., Stowar M. and Marshall C. (1998). Summary Report on the ecological condition of riverine sites in the Barron River Catchment. Resource Condition and Trend Unit, Resource Sciences & Knowledge, Department of Natural Resources (Brisbane.)

94 SUSTAINING THE WET TROPICS: A REGIONAL PLAN FOR NRM
Cogle A.L., Bateman R.J. and Heiner D.H. (1991). Conservation cropping systems for the semi arid tropics of north Queensland. Australian J. Experimental Agriculture 31: 515-23.
Cogle A.L., Keating M.A., Langford P.A., Gunton J. and Webb I.S. (2003). Runoff, Soil loss and Nutrient Transport from Cropping Systems on Red Ferrosols in Northern Australia. Aust. J. Soil Res. (submitted).
Cogle A.L., Keating M.A., Langford P.A., Gunton J. and Webb I.S. (2003). Calibration, Validation and Application of the Cropping Systems Model PERFECT to the Atherton Tablelands, North Queensland. Aust. J. Soil Res. (submitted).
Cogle A.L., Lane L.J. and Basher, L. (2003). Testing the Hillslope Erosion Model for application in India, New Zealand and Australia. Environmental Modelling and Software 18:825-830.
Cogle A.L., Langford P.A., Kistle S.E., Ryan T.J., McDougall A.J., Russell D.J. and Best E.K. (2000). Natural Resources of the Barron River Catchment 2. Water quality, land use and land management interaction. Information Series QI00033. ISSN 0727-6273. The State of Queensland, Department of Primary Industries.
Cogle A.L., Langford P.A., Russell D.J. and Keating M.A. (2001). Sediment and nutrient movement in a tropical catchment with multiple land use. Sustaining our Aquatic Environments - Implementing Solutions. Townsville 20-23 November 2001.
Cogle A.L., Littlemore J. and Heiner D.H. (1994). Soil organic matter changes and crop responses to fertiliser under conservation cropping systems in the semi-arid tropics of north Queensland. Australian J. Exper. Agric. 35, 233-7.
Coles R.G., Lee Long W.J., Squire B.A., Squire L.C. and Bibby J.M. (1987). Distribution of Seagrasses and Associated Juvenile Commercial Penaeid Prawns in North-eastern Queensland Waters. Australian J. Marine and Freshwater Res. 38, 103-119.
Cook F.J., Gardner E.A. and Carlin G. (1999). Acid range from canelands: Quantities exported and the mechanism of production. In: Proceedings of the Australian Society of Sugar cane Technologists. Vol. 21 pp246-258. Townsville.
Cook P.G., Herczeg A.L. and McEwan K.L. Athrep13.doc/1.03.01 Groundwater Recharge and Contribution to Stream Base flow, Atherton Tablelands, Queensland.
Crimp S., Balston J., Ash A., Anderson-Berry L., Done T., Greiner R., Hilbert D., Howden M., Jones R., Stokes C., Stoeckl N., Sutherst B. and Whetton P. (2003). A study to determine the scope and focus of an integrated assessment of climate change impacts and options for adaptation in the Cairns and Great Barrier Reef region. Australian Greenhouse Office.
Csurches S.M. and Edwards R. Queensland Department of Natural Resources, Environment Australia. (January 1998), Potential Environmental Weeds In Australia.
Csurhes S.M., Mackey A.P. and Fitzsimmons L. (1999). Hymenachne (Hymenache amplexicaulis) in Queensland.
Daniells J.W. (1995). Results of a survey of research/development priorities and crop management practices in the north Queensland banana industry. DPI Bulletin QB95001.
Daniells J.W. and Armour J.D. (2003). How to Slash Banana Fertiliser Bills and Save the Reef. Fifth Australian Banana Industry Congress. Townsville.
Dawson H.A. and Smith C.D. (1997). Extent of the Acid Sulphate Soils in the Moresby River Catchment. Department of Natural Resources. DNRQ980004. ISBN0724274278.
De Silva S.S. (1998). Tropical mariculture: current status and prospects. In 'Tropical Mariculture'. (Ed. S.S. De Silva.) pp. 1-16. (Academic Press: San Diego.)
Dear S.E., Moore N.G., Dobos S.K., Watling K.M. and Ahern C.R. (2002). Soil Management Guidelines. In Queensland Acid Sulphate Soil Technical Manual. Department of Natural Resources and Mines, Indooroopilly, Queensland, Australia.
CONDITION REPORT: SUSTAINABLE USE 95
Dent D. (1986). Acid sulphate soils: a baseline for research and development. International Institute for Land Reclamation and Improvement ILRI, The Netherlands.
Department of Natural Resources (1999). Barron basin water allocation and management plan. Resource Management Program, Department of Natural Resources.
Department of Natural Resources and Mines (2002). Annual Water Statistics.
Department of Natural Resources and Mines (2002). Atherton Tablelands and Cairns Water Strategy.
Department of Primary Industries (2000). DPI Note Using herbicides Responsibilities for Landholders.
Department of Primary Industries (2002a). Infosheet 1: Queensland’s proposed new Fisheries Management Plan for Coral Reef Fin Fish. In Queensland Department of Primary Industries. Available from <www.dpi.qld.gov.au/fishweb/10963.html> [Accessed 1/04/2003].
Department of Primary Industries (2002b). Infosheet 3: Commercial fishers - how the proposed changes affect you. In Queensland Department of Primary Industries. Available from <www.dpi.qld.gov.au/fishweb/10981.html> [Accessed 1/04/2003].
Department of Primary Industries (2002c). Monitoring our reef fish - an overview. In Queensland Department of Primary Industries. Available from <www.dpi.qld.gov.au/fisheriesmonitoringprogram/ 11126.html> [Accessed 01/04/2003].
Devlin M., Brodie J., Waterhouse J., Mitchell A., Audas D., and Haynes D. (2001a). Exposure of Great Barrier Reef inner-shelf reefs to river-borne contaminants. Paper presented at the Sustaining Our Aquatic Environments Conference, Townsville, 20-23 November.
Dhileepan K., Madigan B., Vitelli M., McFadyen R., Webster K. and Trevino M. (1996). A New Initiative in the Biological Control of Parthenium. Proceedings of the 11th Australian Weeds Conference, Melbourne, Australia, 30 September - 3 October, Ed. R.C.H Shepherd, pp. 309-312. (Weed Science Society of Victoria Inc., Frankston.)
Dolling P.J., Moody P., Noble A., Helyar K., Hughes B., Reuter D. and Sparrow L. Soil Acidity and Acidification. Project 5.4C. National Land and Water Resources Audit, Canberra.
Dowling R.M. and McKenzie R.A. (1993). Poisonous Plants – A Field Guide. Information Series QI92035. Department of Primary Industries. Brisbane.
Dudgeon D. (1989). The influence of riparian vegetation on the functional organisation of four Hong Kong stream communities. Hydrobiologia 179, 183-194.
Duke N.C., Roelfsema C., Tracey D. and Godson L. (2001). Preliminary investigation into dieback of mangroves in the Mackay Region. Report to the Queensland Fisheries Services, Northern Region, Mackay.
EDGE Network (2002). Grazing Land Management Education Package. Meat and Livestock Australia. Sydney.
Edis R.B., Bramley R.G.V., White R.P. and Wood A.W. (2002). Desorption of phosphate from sugarcane soils into simulated natural waters. Marine and Freshwater Research, 53, 961-70.
Enderlin N.G. and Neenan D.W. (2000). An assessment of Land Suitability for Irrigated Agriculture in the Upper Herbert River Catchment and Kaban Areas, North Queensland. Queensland Department of Natural Resources.
EPA (1999). State of the Environment Queensland 1999. Environmental Protection Agency, Brisbane.
EPA (2002). Queensland Herbarium Achievements 2000-2001. Environmental Protection Agency, Brisbane.
Evans G. (1991). ‘Acid Soils in Australia.’ p.38. (Bureau of Rural Resources, Department of Primary Industries and Energy: Canberra.)

96 SUSTAINING THE WET TROPICS: A REGIONAL PLAN FOR NRM
Fay H.A.C. (2002). Fruitpiercing moths and fruitspotting bugs: Intractable pests of tree fruits in a reduced-insecticide environment. Proceeding of International Symposium on Tropical and Subtropical Fruits. Ed. R. Drew. Acta Hort. 575:485-493.
FNQ Regional Planning Advisory Committee (1998). 'FNQ2010 Regional Planning Project. Integrated Regional Strategies for Far North Queensland.' DLGP.
Galloway R.W., Gunn R.H. and Story R. (1970). Lands of the Mitchell-Normanby Area - Land Systems. CSIRO Land Research Series No. 26.
Gardner C.J., McIvor J.G. and Williams J. (1990). Dry tropical rangelands: solving one problem and creating another. Proceedings of the Ecological Society of Australia. 16:279-286.
Garman D.E.J. and Sutherland P.D. (1983). Pesticides, fertiliser, heavy metals and salinity - an assessment of the non-point source problems in Australia. In: ‘Workshop on Non-point Sources of Pollution in Australia Proceedings. Aust. Water Resources Council Conference Series No. 9. pp.27-47 (AGP, Canberra).
Garside A.L. (2003). Sustainable sugarcane farming systems: developments to date. In 'Proc. of Sugar Workshop, Outlook 2003'. Canberra p. 13pp.
Gilbert M.A., Dickenson G., Moody P.W. and Cooksley D. (1995). Soil acidification under nitrogen-fertilised pastures in tropical Australia. In 'Plant Soil Interactions at Low pH'. (Eds. R. Date et. al.) pp. 785-90. (Kluwer Academic Publishers).
Grant E.M. (1975). ‘Guide to Fishes.’ (Queensland Coordinator General’s Department: Brisbane.)
Great Barrier Reef Marine Park Authority (2003). Dugong protected Areas. In [Internet]. Available from [Accessed 7/05/03].
Gregory S.V., Swanson F.J., Mckee W.A. and Cummins K.W. (1991). An ecosystem perspective of riparian zones. Bioscience 41, 540-551.
Grice A.C. and Brown J.R., (1996). An Overview of the Current Status of Weed Management in Australian Rangelands. Proceedings of the 11th Australian Weeds Conference, Melbourne, Australia, 30 September - 3 October, Ed. R.C.H Shepherd, pp. 195-204. (Weed Science Society of Victoria Inc., Frankston).
Grundy M.J. and Bryde N.J. (1989). Land Resources of the Einasleigh-Atherton Dry Tropics. Queensland Department of Primary Industries. QO89004.
Grundy M.J. and Heiner I. (1998). Land resources of the Ravenshoe – Mt Garnet area. Volume 2. Land Suitability. Department of Natural Resources Land Resources Bulletin DNRQ980122.
Gutteridge Haskins & Davey Pty Ltd (1999). Department of Natural Resources, Mulgrave River Aquifer Study Abstraction to Supply Cairns City.
Gwynne L. (1990). A review of the reef line fishery and proposed management measures. A discussion paper. Queensland Fisheries Management Authority, (Brisbane).
Hair I.D. (1999). Hydrogeology of the Russell and Johnstone Rivers Alluvial Valleys, North Queensland.
Halliday I., Ley J.A., Tobin A.J., Garrett R., Gribble N. and Mayer D. (2001). The effects of net fishing: addressing biodiversity and bycatch issues in Queensland inshore waters. Queensland Department of Primary Industries and Australian Institute for Marine Science, QO01022. (Brisbane.)
Hamilton D. and Haydon G. (1996). Pesticides and fertilisers in Queensland sugar industry - estimates of usage and likely environmental fate. Department of Primary Industries, Project: ICM-R&D.94.01. Department of Primary Industries, Queensland.
Harrison D.A. and Congdon B.C. (2002). Wet Tropics Vertebrate Pest Risk Assessment.
Hawton D. (1992). Effect of Propanil, 2,4,5-T and other Herbicides on Echinochloa Colona (L.) Link and Cyperus Iria L. in Dry Seeded Rice.

CONDITION REPORT: SUSTAINABLE USE 97
Hawton D. and Johnston I.D.G. (1981). Weed Control in Peanuts in North Queensland.
Hawton D. and Johnson I.D.G. (1983). Chemical Controls of Weeds in Temperate Winter Dairy Pastures on the Atherton Tablelands.
Hawton D., Johnson I.D.G., Loch D.S., Harvey G.L., Marley J.M.T., Hazard W.H.L., Bibo J. and Walker S.R. (1990). A Guide to the Susceptibility of some Tropical Crop and Pasture Weeds and the Tolerance of some Crop Legumes to Several Herbicides.
Haynes D. and Michalek-Wagner K. (2000b). Water quality in the Great Barrier Reef World Heritage Area: past perspectives, current issues and research directions. Marine Pollution Bulletin. 41(7-12): 428-434.
Haynes D., Brodie J., Christie C., Delvin M., Michalek-Walker K., Morris S., Ramsay M., Storrie J., Waterhouse J. and Yorkston H. (2001). Great Barrier Reef water quality; current issues. Great Barrier Reef Marine Park Authority, Townsville.
Haynes D., Muller J.F. and Carter S. (1999). Pesticide and herbicide residues in sediments and seagrasses from the Great Barrier Reef World Heritage Area and Queensland coast. In 'Sources, fates and consequences of pollutants in the Great Barrier Reef and Torres Strait'. (Ed. D. Kellaway.) Vol. 25 pp. 9. (Great Barrier Reef Marine Park Authority: Townsville.)
Haynes D., Muller J.F. and Carter S. (2000a). Pesticide and herbicide residues in sediments and seagrass from Great Barrier Reef World Heritage Area and Queensland coats. Marine Pollution Bulletin. 41(7-12):279-287.
Haynes D., Ralph P., Prange J. and Dennison W. (2000b). The impact of the herbicide diuron on photosynthesis in three species of tropical seagrass. Marine Pollution Bulletin 41, 288-293.
Haynes D., Ralph P., Prange J. and Dennison W. (2000c). The impact of herbicide diuron on photosynthesis in three species of tropical seagrass. Marine Pollution Bulletin 41 (7-12):288-293.
Heede B. (1985). Interactions between streamside vegetation and stream dynamics. In 'Riparian Ecosystems And Their Management: Reconciling Conflicting Uses. First North American Riparian Conference, April 16-18, 1985, Tucson, Arizona'. (Eds. R.R. Johnson, C.D. Ziebell, D.R. Patton, P.F. Ffolliott and R.H. Hamre.) pp. 54-58. (USDA Forest Service: Tucson, Arizona.)
Heiner I.J. and Grundy M.J. (1994). Land Resources of the Ravenshoe - Mt Garnet area North Queensland. Volume 1 Land resource inventory, Department of Primary Industries, Brisbane.
Herbert G. (August 1998). Atherton Tableland/Cairns Region Water Planning Study Review Of Groundwater Conditions and Issues with Further Irrigation Development Scheme.
Herbert G.C. (08/1998). Occurrence of Groundwater Under Cane Lands in Far North Queensland.
Herbert G.C. (March 1999). Report on Mulgrave Groundwater Model. Department of Natural Resources.
Hicks W.S., Bowman G.M. and Fitzpatrick R.W. (1999). East Trinity Acid Sulfate Soils Part 1: Environmental Hazards. CSIRO Land and Water Technical Report 14/99. pp.85. http://www.clw.csiro.au/publications/technical99/tr14-99.pdf.
Hill M., Braaten R., McKeon G., Barrett D., Dyer R., Friedel M., VanVreeswyk A., Hacker R., Henry B., Carter J., Haberkorn G., McGregor C. and Marlow N. (2002). Range-ASSESS: A spatial framework for analysis of potential for carbon sequestration in rangelands. CRC Technical Publication No 1 – 2002. Cooperative Research Centre for Greenhouse Accounting.
Hine D., Muller J. and Dunn J. (2003). Environmental Management Systems Manual for the Banana and Papaya Industries in the Wet Tropics. Queensland Fruit and Vegetable Growers.

98 SUSTAINING THE WET TROPICS: A REGIONAL PLAN FOR NRM
Hopkins J.S., Hamilton R.D., Sandifer P.A., Browdy C.L. and Stokes A.L. (1993). Effect of water exchange on production, water quality, effluent characteristics and nitrogen budgets in intensive shrimp ponds. Journal - World Aquaculture Society 24, 304-320.
Humphries L.R. and Partridge I.J. (1995). A Guide to Better Pastures for the Tropics and Subtropics. Revised 5th Edition. NSW Agriculture.
Humphries S.E. and Stanton J. Peter (December 1992). Weed Assessment In the Wet Tropics World Heritage Area of North Queensland.
Humphries S.E., Groves R.H. and Mitchell D.S. (1992). Plant Invasion Of Australian Ecosystems.
Hunter H. and Walton R. (1997). 'From land to river to reef lagoon: Land use impacts on water quality in the Johnstone River Catchment.' Department of Natural Resources, Brisbane.
Hunter H.M. and Armour J.D. (2001). Offsite movement of nutrients: Contrasting issues at three Australian Study Sites. In ‘Offsite movement of agrochemicals in tropical sugar production. Project Report’. Bundaberg. (Ed. B.W. Simpson).
Hunter H.M., Sologinkin S.J., Choy S.C., Hooper A.R., Allen W.S., Raymond M.A. and Peters J. (2001). Water Management in the Johnstone Basin. NHT Project No. 952194. The State of Queensland (Department of Natural Resources & Mines).
Huxley W. and Bjornsson B. (31 March 1998). Atherton Tableland/Cairns Regional Planning Study. A Review of Groundwater Conditions and Opportunities for Further Development - Mulgrave River Alluvium.
Hyne R.V. and Wilson S.P. (1997). Toxicity of acid-sulphate soil leachate and aluminium to the embryos and larvae of Australian bass (Macquaria novemaculeata) in estuarine water. Environmental Pollution 97, 221-227.
IPCC (2000). Land Use, Land Use Change and Forestry: Summary for Policymakers. A special report of the Intergovernmental Panel on Climate Change. Available from www.greenhouse. crc.org.au/crc/ecarbon/faqs.htm.
Isbell R.F., Webb A.A., and Murtha G.G. (1968). ‘Explanatory Data for Sheet 7: North Queensland.’ Atlas of Australian Soils, Collator K.H. Northcote. CSIRO in association with Melbourne University Press, East Melbourne, Victoria.
Ivantsoff W. and Aarn (1999). Detection of predation on Australian native fishes. Marine and Freshwater Research 50, 476-478.
Johnson C.N. (2001). Feral Pigs: Pest Status and Prospects for Control. Proceedings of a Feral Pig Workshop James Cook University - Cairns. March 1999.
Johnson D.P. (1998). State of the Rivers - Tully and Murray Rivers and major tributaries. Queensland Department of Natural Resources, (Brisbane.)
Karr J.R. and Schlosser I.J. (1978). Water resources and the land-water interface. Science (Washington, D.C.) 201, 229-234.
Kauffman J.B. and Krueger W.C. (1984). Livestock impacts on riparian ecosystems and streamside management implications: a review. Journal of Range Management 37, 430-437.
Kauffman J.B., Krueger W.C. and Vavra M. (1983a). Effects of cattle grazing on riparian plant communities. Journal of Range Management 36, 685-691.
Kernot J. and English B. (2003). Reclamation of degraded frontage land. Technical Report to NHT for project NHT 982019.
Kernot J. and Grice A. (2003). Developing, implementing and evaluating fire management of woody vegetation in the Gulf region. Project NBP.319, Meat and Livestock Australia.
Kirkwood A. and Dowling R. (2002). Investigation of mangrove dieback in the Pioneer River estuary, MacKay. Queensland Herbarium, Environmental Protection Agency, (Brisbane.)

CONDITION REPORT: SUSTAINABLE USE 99
Laegdsgaard P. and Johnson C. (2001). Why do juvenile fish utilise mangrove habitats? Journal of Experimental Marine Biology and Ecology 257, 229-253.
Lait R. (1998). Groundwater occurrence and chemistry in the Cattle Creek catchment, North Queensland. Masters Thesis, Queensland University of Technology, Brisbane.
Land Protection, Department of Natural Resources and Mines Queensland (2002). Weeds Strategy 2002 – 2006.
Larcombe P., Costen A. and Woolfe K.J. (2001). The hydrodynamic and sedimentary settling of nearshore coral reefs, central Great Barrier Reef shelf, Australia: Paluma Shoals, a case study. Sedimentology, 48, 811-35.
Le Cussan J. (1991). 'A report on the intertidal vegetation of the Daintree, Endeavour and Russell/ Mulgrave Rivers.' (Queensland Department of Environment and Heritage.)
Leach L.M. and Rose U.E. (March 1979). Groundwater Storage Behaviour Mulgrave River Area.
Lobegeiger R. (2001). Report to Farmers - Queensland Aquaculture Production Survey 1999-2000. Queensland Department of Primary Industries, (Brisbane.)
Lobegeiger R. (2003). Report to Farmers - Queensland Aquaculture Production Survey 2001-2002. Queensland Department of Primary Industries, QI03030. (Brisbane.)
Locsey K.L. and Cox M.E. (undated). The Atherton Tablelands Basalt aquifer North Queensland: A Hydrochemical Investigation.
Lovett J.V. and Knights S.E. (1996). Where in the World is Weed Science Going? Proceedings of the 11th Australian Weeds Conference, Melbourne, Australia, 30 September - 3 October, Ed. R.C.H Shepherd, pp. 3-13. (Weed Science Society of Victoria Inc., Frankston).
Low T. (1999). Feral Future: The Untold Story Of Australia’s Exotic Invaders. Viking Penguin Books, Ringwood, Australia.
Lowrance R.R., Todd R.L. and Asmussen L.E. (1984). Nutrient cycling in an agricultural watershed: I. Phreatic movement. Journal of Environmental Quality 13, 22-26.
Mackey A.P., Miller E.N. and Palmer W.A. Natural Resources (November 1997). Sicklepod in Queensland.
Malcolm D.T., Heiner I.J. and McClurg J.I. (1992). Soil And Land Suitability of the Proposed Douglas Creek Cane Expansion Area, Mareeba. Unpublished report, Department of Primary Industries, Mareeba.
Malcolm D.T., Nagel B.K.A., Sinclair I., and Heiner I.J. (1999). Land Resources Bulletin, Soils and Agricultural Land Suitability of the Atherton Tablelands North Queensland. Brisbane: DNRQ980091.
Mallawaarachchi T, Monypenny R. and Rayment, G.E. (2002). An intergrated strategy to enhance profit ability and environmental compliance in the Australian sugar industry. Proc. Aust. Soc. Sugar Cane Tech. 24.
McClurg J.I. (1990). Soils and land Suitability of the Biboohra area, Mareeba. Unpublished report, Department of Primary Industries, Mareeba.
McGarry D., Sharp G. and Bray S.G. (1999). The Current Status of Soil Structure Degradation in Queensland Cropping Soils. Department of Natural Resources, Brisbane. DNRQ990092.
McIvor J.G., Williams J. and Gardener C.J. (1995). Pasture management influences runoff and soil movement in the semi-arid tropics. Aust. J of Experimental Agriculture 35, 55-65.
McJannet D. and Reddell P. (2002). Where earth meets sky: Cloud forests of the Wet Tropics. Information Series. CRC for Tropical Rainforest Ecology & Management.

100 SUSTAINING THE WET TROPICS: A REGIONAL PLAN FOR NRM
McKay R.J. (1984). Introductions of exotic fishes in Australia. In ‘Distribution, Biology and Management of Exotic Fishes’. (Eds. W.J. Courtenay, Jr. and J.R. Stauffer, Jr.) pp.177-199. (Johns Hopkins University Press: Baltimore.)
McKay R.J. (1989). Exotic and translocated freshwater fishes in Australia. In ‘Exotic Aquatic Organisms in Australia. Proceedings of the workshop on introduction of exotic aquatic organisms in Asia. Asian Fisheries Society Special Publication’. Vol. 3 21-34. (Asian Fisheries Society: Manila.)
McNae W. (1974). Mangrove forests and fisheries. Indian Ocean Fisheries Commission IOFC/DEV.
Mitchell A.W., Reghenzani J.R., Hunter H.M. and Bramley R.G.V. (1996). Water quality and nutrient fluxes from river systems draining to the Great Barrier Reef Marine Park. In ‘Downstream effects of land use’. (Eds.H.M. Hunter, A.G. Eyles and G.E. Rayment) pp.23-33.
Moller G. (1996). State of the Rivers - Herbert River and major tributaries. Queensland Department of Natural Resources, (Brisbane.)
Moody P.W. and Aitken R.L. (1997). Soil acidification under tropical agricultural systems. 1. Rates of acidification and contributing factors. Aust. J. Soil Res. 35, 163-73.
Moody P.W., Reghenzani J.R., Armour J.D., Prove B.G. and McShane T.J. (1996). Nutrient balances and transport at farm scale - Johnstone River catchment. In ‘Downstream effects of land use’. (Eds.H.M. Hunter, A.G. Eyles and G.E. Rayment) pp.347-351.
Mortimer M.R. (2000). Pesticide and trace metal concentration in Queensland estuarine crabs. Marine Pollution Bulletin 41:359-366.
Moss A.J., Rayment G.E., Reilly N. and Best E.K. (1992). Sediment and nutrient exports from Queensland coastal catchments, a desk study. DPI.
Mt Garnet District Landcare Group Incorporated (2002). Rehabilitation of savannah woodland habitats by appropriate fire management. NHT Project Final Report, project 992035.
Muller P.J. (1975/17). Mulgrave River Groundwater Investigations Report on Exploratory Drilling.
Murtha G.G. and Smith C.D. (1994). 'Key to the soils and land suitability of the wet tropical coast. Cardwell-Cape Tribulation.' CSIRO.
Murtha G.G., Cannon M.G. and Smith C.D. (1994). Soils of the Babinda - Cairns area, north Queensland, CSIRO, Australia.
National Land and Water Resources Audit (2000). Australian Dryland Salinity Assessment. (http://audit.ea.gov.au/ANRA/land/docs/national/Salinity_Contents.html).
National Land and Water Resources Audit (2001). Australian Agricultural Assessment. (http://audit.ea.gov.au/ANRA/agriculture/docs/national/Agriculture_Contents.html).
National Water Quality Management Strategy (2000). An Introduction to the Australian and New Zealand Guidelines for Fresh and Marine Water Quality 4A.
National Weeds Strategy Executive Committee (June 2001). Rubbervine.
Neil D.T., Orpin A.R., Ridd P.V. and Yu B. (2002). Sediment yield and impacts from river catchments to the Great Barrier Reef lagoon: a review. Marine and Freshwater Research. 53, 733-52.
NLWRA (2001). Australian Agricultural Assessment. National Land and Water Resources Audit, Canberra, http://www.nlwra.gov.au.
Noble A.D., Cannon M. and Mulle D. (1997). Evidence of accelerated soil acidification under Stylosanthes-dominated pastures. Aust. J. Soil Res. 35, 1309-22.
NRM (18 April 2002). Land Protection Pest and Stock Route Management Act Information. Department of Natural Resources and Mines, Brisbane.

CONDITION REPORT: SUSTAINABLE USE 101
NRM (18 April 2002). Land Protection Pest and Stock Route Management Act Land Protection (Pest and Stock Route Management) Act 2002. Department of Natural Resources and Mines, Brisbane.
NRM (18 April 2002). Land Protection Pest and Stock Route Management Act Land Protection (Pest and Stock Route Management) Act 2002- Information Kit. Department of Natural Resources and Mines, Brisbane.
NRM (18 April 2002). Land Protection Pest and Stock Route Management Act Information New Legislation at a glance. Department of Natural Resources and Mines, Brisbane.
NRM (2000/01). 2000/01 Technical Highlights Annual Report on Weeds and Pest Animal Research.
NRM (2001). The Rabbit. NRM Facts - Pest Series. QNRM01282. Department of Natural Resources and Mines, Brisbane.
NRM (31 May 2002). Pest Fact Sheet. Department of Natural Resources and Mines, Brisbane.
NRM Fact Sheet (May 2002). Feral Pigs in Queensland - distribution, ecology and impact Declared. Department of Natural Resources and Mines, Brisbane.
NRM Pest Series (April 2002). Pest Animal Management in Settled Areas Planning for Success. Department of Natural Resources and Mines, Brisbane.
NRM Pest Series (June 2002). Dingoes in Queensland - distribution and Ecology. Department of Natural Resources and Mines, Brisbane.
NRM Pest Series (May 2002). Feral cat ecology and Control. Department of Natural Resources and Mines, Brisbane.
NRM Pest Series (May 2002). Feral Pig Control in the Wet Tropics. Department of Natural Resources and Mines, Brisbane.
NRM Pest Series (November 2001). Declared Animals of Queensland. Department of Natural Resources and Mines, Brisbane.
NRM Pest Series (November 2001). The cane toad Bufo Marinus. Department of Natural Resources and Mines, Brisbane.
O’Keeffe M.S. and Walton C.S. (June 2001). Vertebrate Pests of Built - Up Areas in Queensland.
Pailles C. and Moody P.W. (1992). Phosphorus sorption-desorption by some sediments of the Johnstone Rivers catchment, north Queensland. Aust. J. Marine and Freshwater Research 43, 1535-45.
Pailles C. and Moody P.W. (1995). Effects of experimental conditions on phosphorus extracted from estuarine and marine sediments. Marine and Freshwater Research 46, 435-40.
Palmer W.J. (1996). Biological Control of Prickly Acacia in Australia. Proceedings of the 11th Australian Weeds Conference, Melbourne, Australia, 30 September - 3 October, Ed. R.C.H Shepherd, pp. 239-242. (Weed Science Society of Victoria Inc., Frankston).
Pankhurst C.E., Magarey R.C., Stirling G.R., Holt J.R. and Brown J.D. (1999). Rotation induced changes in soil biological properties and their effect on yield decline in sugar cane. Proc. Aust. Soc. Sugar Cane Technologists 22, 225-29.
Pankhurst C.E., Magarey R.C., Stirling G.R., Blair B.L., Bell M.J. and Garside, A.L. (2003). Management practices to improve soil health and reduce the effects of detrimental soil biota associated with yield decline of sugarcane in Queensland, Australia. Soil and Tillage Research 72, 125-37.
Parsons W.T. and Cuthbertson E.G. (1992). 'Noxious weeds of Australia.' (Inkata Press: Melbourne.)
Parsons W.T. and Cuthbertson E.G. (2001). Noxious Weeds of Australia. 2nd Edition. CSIRO Publishing, 150 Oxford St, Collingwood, Vic.

102 SUSTAINING THE WET TROPICS: A REGIONAL PLAN FOR NRM
Paull C.J. (2000). DPI Note - Avoiding Pesticide Residues in Stockfeeds and Structures. Department of Primary Industries, Brisbane.
Paynter Q. and Flanagan G.J. (2002). Integrated Management of Mimosa Pigra, Proceedings of the 13th Australian Weeds Conference, Perth, Western Australia, 8-13 September, Eds. H. Spafford Jacob, J. Dodd and J.H. Moore, pp. 165-168. (Plant Protection Society of Western Australia.)
Pearson R.G. and Penridge L.K. (1987). The effects of pollution by organic sugar mill effluent on the macro-invertebrates of a stream in tropical Queensland. Journal of Environmental Management 24, 205-215.
Petersen J.R.C., Madsen B., Wilzbach M.A., Magadza C.H.D., Paarlberg A., Kullberg A. and Cummins K.W. (1987). Stream Management: Emerging Global Similarities. Ambio 18, 166-179.
Pinto L. and Punchihewa N.N. (1996). Utilisation of mangroves and seagrasses by fishes in the Negombo Estuary, Sri Lanka. Marine Biology [Mar. Biol.] 126, 333-345.
Poiner I.R., Glaister J.P., Pitcher R., Burridge C., Wassenberg T., Gribble N.A., Hill B.J., Blaber S.J.M. and Milton D.A. (1998). Final report on the effects of trawling in the Far Northern section of the Great Barrier Reef: 1991-1996. CSIRO Division of Marine Research, (Cleveland.)
Powell B. and Ahern C.R. (1999). QASSMAC acid sulfate soils management strategy for Queensland. Queensland Department of Natural Resources. Brisbane.
Pratley J.E. (1996). Weed Management Research in Crops Production - A Review. Proceedings of the 11th Australian Weeds Conference, Melbourne, Australia, 30 September - 3 October, Ed. R.C.H Shepherd, pp. 17-22. (Weed Science Society of Victoria Inc., Frankston).
Productivity Commission (2003). Industries, Land Use and Water Quality in the Great Barrier Reef Catchment, Research Report, Canberra. Media Publications, Victoria. ISBN 1 74037 1135.
Prove B.G. and Moody P.W. (1997). 'DAQ3S Nutrient Balances and Transport from Agricultural and Rainforest Lands.' QDNR/DPI.
Prove B.G., Doogan V.J. and Truong P.N.V. (1995). Nature and magnitude of soil erosion in sugar cane land on the wet tropical coast of north-eastern Queensland. Aust. J. of Experimental Agriculture, 35, 641-649.
Pusey B.J. and Arthingon A.H. (2003). Importance of the riparian zone to the conservation and management of freshwater fish: a review. Marine and Freshwater Research 54, 1-16.
Pusey B.J. and Kennard M.J. (1996). Species richness and geographical variation in assemblage structure of the freshwater fish fauna of the Wet Tropics region of northern Queensland. Marine and Freshwater Research 47, 563-573.
Pusey B.J., Bird J., Kennard M.J. and Arthington A.H. (1997). Distribution of the Lake Eacham Rainbowfish in the Wet Tropics Region, North Queensland. Aust. J. of Zoology 45, 75-84.
Queensland Department of Natural Resources and Mines (2003). Land cover change in Queensland 1999-2001. http://www.nrm.qld.gov.au.
Queensland Fisheries Management Authority (1998). Queensland Freshwater Fisheries. Queensland Fisheries Management Authority, (Brisbane, Queensland.)
Queensland Fisheries Service (2002). Status of the Queensland east coast otter trawl fishery after the first effort year (2001). Fisheries Resource Management, Queensland Fisheries Service, (Brisbane).
Queensland Government (2002). Flood mitigation strategy.
Queensland Government (2002). The Queensland Pest Animal Strategy 2002-2006.
Queensland Water Quality Summary (2000). Water Quality Report for Catchments Containing Sugar cane in Queensland.

CONDITION REPORT: SUSTAINABLE USE 103
Rasiah V. and Armour J.D. (2001). Nitrate accumulation under cropping in the Ferrosols of Far North Queensland Wet Tropics. Aust. J. Soil Research. 39: 329-341.
Rasiah V., Armour J.D., Menzies N.W., Heiner D.H. and Donn M.J. (2003a). Nitrate retention under sugarcane in wet tropical Queensland deep soil profiles. Aust. J. Soil Res. 41, 1145-61.
Rasiah V., Armour J.D., Yamamoto T. and Heiner D.H. (2003b). Nitrate dynamics in shallow groundwater and the potential for transport to off-site water bodies. Water Air and Soil Pollution, 147, 183-202.
Rayment G.E. and Bohl H.P. (2002). Dissolved oxygen in waterways of sugar catchments. In ‘Managing Soils, Nutrients and the Environment for Sustainable Sugarcane Production, Course Manual’. (Ed. R.C. Bruce.) (CRC for Sustainable Sugar Production, Townsville.)
Rayment G.E., Jeffrey A.J., Barry G.A. and Baker D.E. (1998). The environmental and productive significance of nutrients in Queensland canelands. In ‘National Soils Conference, Environmental benefits of soil management’. Brisbane pp. 170-6. (Australian Society of Soil Science).
Reghenzani J.R. and Armour J.D. (2000). Management to minimise nutrient transport from canelands. In 'Environmental Short Course for Sustainable Sugar Production'. (Ed. RC Bruce, M; Rayment, G.E.) pp. 123-7. (CRC for Sustainable Sugar Production: Townsville.)
Reynolds L.F. (1986). 'Trees and Streams - Preserving a Fish Habitat.' (NSW Dept. Ag.: Sydney, N.S.W.)
Richards N. et. al. (2003). Papaya final report to Horticulture Australia (in preparation).
Rimmer M.A. and Russell D.J. (1998). Survival of stocked barramundi, Lates calcarifer (Bloch), in a coastal river system in far northern Queensland, Australia. Bulletin of Marine Science 62, 325-336.
Rimmer M.A. and Russell D.J. (1998a). Aspects of the biology and culture of Lates calcarifer. In 'Tropical Mariculture'. (Ed. S. S. De Silva.) pp. 449-476. (Academic Press: San Diego.)
Robertson A.I. and Duke N.C. (1987). Mangroves as nursery sites: comparisons of the abundance and species composition of fish and crustaceans in mangroves and other nearshore habitats in tropical Australia. Marine Biology 96, 193-205.
Robertson C. (2000). International advances in prawn farm recirculation technology - design principles and efficiency of treatment systems. Queensland Department of Primary Industries, Information Series QO 01008. (Brisbane.)
Robertson L. (2001). Integration of chemical, cultural and biological controls in North Queensland sugar cane for Greyback Canegrub (Dermolepida albohirtum (Waterhouse). In - Proceedings of the Sixth Workshop for Tropical Agricultural Entomologists. Darwin. May 1998. Department of Primary Industries and Fisheries. Technical Bulletin No.288.
Roper M.M. and Gupta W.S.R. (1995). Management practices and soil biota. Australian Journal of Soil Research. 33 321-339.
Rosecom Fertiliser Industry Market Share report - Rosecom Pty Ltd.
Roth C., Visser F. and Reghenzani J.R. (2002). Managing and monitoring sediment loss from cane lands - lessons from the Herbert. In 'Regional Water Quality Conference. Sustainable Agriculture in the Wet Tropics for the 21st Century'. Tully.
Russell D.J. (1988). An assessment of the east Queensland inshore gill net fishery. Queensland Department of Primary Industries, Queensland Department of Primary Industries Report Number QI88024. (Brisbane.)
Russell D.J. and Garrett R.N. (1985). Early life history of barramundi, Lates calcarifer (Bloch), in north-eastern Queensland. Australian J. of Marine and Freshwater Research 36, 191-201.

104 SUSTAINING THE WET TROPICS: A REGIONAL PLAN FOR NRM
Russell D.J. and Hales P.W. (1993a). ‘Stream Habitat and Fisheries Resources of the Johnstone River Catchment.’ (Queensland Department of Primary Industries: Brisbane.)
Russell D.J. and Hales P.W. (1993b). Stream Habitat and Fisheries Resources of the Johnstone River Catchment. Queensland Department of Primary Industries, Queensland Department of Primary Industries Report Number QI93056. (Brisbane.)
Russell D.J. and Hales P.W. (1997). Fish Resources and Stream Habitat of the Liverpool, Maria and Hull Catchments. Queensland Department of Primary Industries, QI97039. (Brisbane.)
Russell D.J. and Hales P.W. (1997a). Fish Resources and Stream Habitat of the Liverpool, Maria and Hull Catchments. Queensland Department of Primary Industries, QI97039. (Brisbane.)
Russell D.J. and Hales P.W. (1997b). Major Fisheries Resource and Habitat Issues in the Johnstone River Catchment. In 'Proceedings of Conference on Downstream Effects of Land Use, April, 1995'. (Eds. H. M. Hunter, A. G. Eyles and G. E. Rayment.) pp. 353-357. (Department of Natural Resources: Brisbane.)
Russell D.J. and Helmke S.A. (2002). Impacts of acid leachate on water quality and fisheries resources of a tidal creek in northern Australia. Marine and Freshwater Research 53, 19-33.
Russell D.J. and McDougall A.J. (2003). Biota and Stream Water Quality Monitoring. In 'Demonstration of Management and Rehabilitation of Acid Sulfate Soils at East Trinity'. (Eds. C.D. Smith, M.A. Martens, C.R. Ahern, V.J. Eldershaw, B. Powell, E.V. Barry and G.L. Hopgood.) pp. (Queensland Department of Natural Resources and Mines: Brisbane.)
Russell D.J., Hales P.W. and Helmke S.A. (1996a). Fish Resources and Stream Habitat of the Moresby River Catchment. Queensland Department of Primary Industries, QI96061. (Brisbane.)
Russell D.J., Hales P.W. and Helmke S.A. (1996b). Fish resources and stream habitat of the Moresby River catchment. Report No. QI96061. (Queensland Department of Primary Industries, Brisbane.)
Russell D.J., Hales P.W. and Helmke S.A. (1996b). 'Stream Habitat and Fish Resources in the Russell and Mulgrave Rivers Catchment.' (Queensland Department of Primary Industries: Brisbane.)
Russell D.J., Hales P.W. and Moss A. (1996a). Pesticide residues in aquatic biota from northeast Queensland coastal streams. Proceedings of the Royal Society of Queensland. 106:23-30.
Russell D.J., Hales P.W. and Moss A. (1996c). Pesticide Residues in Aquatic Biota From North-East Queensland Coastal Streams. Proceedings of the Royal Society of Queensland 106, 23-30.
Russell D.J., McDougall A.J. and Kistle S.E. (1998). 'Stream Habitat and Fish Resources of the Daintree, Saltwater, Mossman and Mowbray Catchments.' (Queensland Department of Primary Industries: Brisbane.)
Russell D.J., McDougall A.J., Ryan T.J., Kistle S.E., Aland G., Cogle A.L. and Langford P.A. (2000). Natural resources of the Barron River catchment 1. Stream habitat, fisheries resources and biological indicators. Queensland Department of Primary Industries, QI00032.
Rutledge W., Rimmer M., Russell J., Garrett R. and Barlow C. (1990). Cost benefit of hatchery-reared barramundi, Lates calcarifer (Bloch), in Queensland. Aquaculture and Fisheries Management 21, 443-448.
Saenger P. (1979). Mangroves- our ugly ducklings. Oceans (Australia) 1, 176-181.
Sainty G. and Jacobs S. (1988). 'Water Plants In Australia.' Publisher: Sainty & Associates, Darlinghurst. 2010.
Salcon (1997). Salinity Management Handbook. Department of Natural Resources, Brisbane.

CONDITION REPORT: SUSTAINABLE USE 105
Sammut J. and Lines-Kelly R. (1996). An introduction to acid sulfate soils. Department of Environment, Sports and Territories, Canberra.
Scanlan J.C., Pressland A.J. and Myles D.J. (1996). Runoff and soil movement on mid-slopes in north east Queensland grazed woodlands. Rangeland Journal 18 (1) 33-46.
Setter M., Bradford M., Dorne B., Lynes B., Michell J., Setter S. and Westcott D. (2002). Pond Apple - are the Endangered Cassowary and Feral Pig helping this Weed to Invade Queensland’s Wet Tropics? Proceedings of the 13th Australian Weeds Conference, Perth, Western Australia, 8-13 September, Eds. H. Spafford Jacob, J. Dodd and J.H. Moore, pp. 173-176. (Plant Protection Society of Western Australia).
Sharp B.R. and Whittaker R.J. (2003). The irreversible cattle driven transformation of a seasonally flooded Australian savanna. J. Biogeography. 30, 783-802.
Silver B.A., Molloy R.H., Stewart R.L. and Fry R.R. (2003). Improving the nitrogen use efficiency of annual ryegrass on the Atherton Tablelands using degree-days as a scheduling tool. North Johnstone and Lake Eacham Landcare Association, unpublished report.
Simpson B. (2003). Agrochemical Environmental Risk Management Tool for Landholders and Extension Bodies. Department of Natural Resources and Mines. Final Report on project QNR 27 to Land and Water Australia.
Simpson B.W., Fraser G., Armour J.D., Hargreaves P.A. and Ruddle L.J. (2001). Pesticide Studies - Australia. In 'Offsite Movement of Agrochemicals in Tropical Sugar Production'. Ed. B.W. Simpson. Department of Natural Resources & Mines, Brisbane.
Sindel B.M. (2000). Australian Weed Management Systems. Ed. B.M. Sindel, Published by R.G. and F.J. Richardson, Melbourne. Pp504.
Smith C.D. and Ahern C.R. (1998). Report on Acid Sulphate Soils Investigation Ingham and Tully Drainage Schemes. Department of Natural Resources, Resource Sciences Centre, Indooroopilly. DNRQ980106. ISBN0724274375.
Smith C.D., Martens M.A., Ahern C.R., Eldershaw V.J., Powell B., Barry E.V. and Hopgood G.L. (2003). Demonstration of Management and Rehabilitation of Acid Sulfate Soils at East Trinity: Technical Report. Department of Natural Resources and Mines, Indooroopilly, Australia.
Smith N.M. (2002). Weeds of the Wet/Dry Tropics of Australia - A Field Guide. Environment Centre NT. Darwin. Pp112.
Stanton J.P. (2002). Observations on controlled grazing and burning experiments, Mt Garnet Landcare Group, November 1998-November 2002. Unpublished Report following inspection on 17 December 2002.
State of the Environment (2001). Coasts and Oceans. In ‘Australia State of the Environment Report 2001’. (CSIRO Publishing on behalf of the Department of the Environment and Heritage: Canberra.)
Stevenson R. (2003). Develop a benchmark for soil health in macadamia orchards. Horticulture Australia Ltd. Project.
Stickney R.R. (1994). 'Principles of Aquaculture.' (John Wiley and Sons: New York.).
Sutherland N.M. and Powell B. (2000). Overview of the Queensland Acid Sulfate Soils Management Advisory Committee. In Acid Sulfate Soils: Environmental Issues, Assessment and Management, Technical Papers. Ahern C.R., Hey K.M., Watling K.M. and Eldershaw V.J. (Eds). Brisbane, 20-22 June, 2000. Department of Natural Resources, Indooroopilly, Queensland, Australia.
Sutherst B., Fay H. and Ritchie S. (2002). Adapting pest management to climate change in the Cairns region. In - Climate Change Workshop Notes. Cairns. August 2002.
Teitzel, Gilbert and Cowan (1991). Trop Grass.
Thorp J.R., and Lynch R. (2000). The Determination of Weeds of National Significance.
Tomley A.J. and Hardwick G. (1996). Bulking Up, Field Distribution and Establishment of Rubbervine Rust, Maravalia Cryptostegiae in Far North Queensland. Proceedings of

106 SUSTAINING THE WET TROPICS: A REGIONAL PLAN FOR NRM
the 11th Australian Weeds Conference, Melbourne, Australia, 30 September - 3 October, Ed. R.C.H Shepherd, pp. 237-238. (Weed Science Society of Victoria Inc., Frankston).
Trainor N. (1991). Commercial line fishing. The Queensland Fisherman March, 17-25.
Turnbull C. (1996). Domestic Reef Fishing Industry Assessment. Queensland Department of Primary Industries, QI96106. (Brisbane.)
Turner G. and McMahon G. (1989). Weeds in Australian Cane Fields. BSES Bulletin October 1989. No. 28. Bureau of Sugar Experiment Stations. Indooroopilly. Australia.
Udy J.W., Dennison W.C., Lee Long W. and McKenzie L.J. (1999). Responses to seagrass to nutrients in the Great Barrier Reef, Australia. Marine Ecological Progress Series 185, 257-271.
Vitelli J. and Madigan B. (2002). Is Aerial Control of Bellyache Bush Effective? Proceedings of the 13th Australian Weeds Conference, Perth, Western Australia, 8-13 September, Eds. H. Spafford Jacob, J. Dodd and J.H. Moore, pp. 169-172. (Plant Protection Society of Western Australia.)
Vogler W. and Lindsay A. (2002). The Impact of the rust Fungus Maravalia Cryptostegiae on three rubbervine (Cryptostegia Grandiflora) populations in Tropical Queensland. Proceedings of the 13th Australian Weeds Conference, Perth, Western Australia, 8-13 September, Eds. H. Spafford Jacob, J. Dodd and J.H. Moore, pp. 180-182. (Plant Protection Society of Western Australia.)
Walkley A. (1947). A critical examination of a rapid method for determining organic carbon in soils - effect of variations in digestion conditions and of inorganic soil constituents. Soil Science 63, 251-64.
Walton C.S. (2003). Leucaena (Leucaena leucocephala) in Queensland. Department of Natural Resources and Mines. Brisbane.
Warrell L.A., Thompson W.P. and Cannon M.G. (1984). Soils of the Kairi Research Station, Atherton Tableland, North Queensland. Bulletin. QB 84006. (Queensland Department of Primary Industries).
Wassenberg T.J., Burridge C.Y., Connell M. and Gribble N. (1998). A validation of short-duration scientific tows as a representation of long commercial-length tows: comparing the catch rates, size composition and species composition of prawn trawler by catch in the far northern Great Barrier Reef, Australia. Fisheries Research 36, 35-46.
Water Quality Targets: A Hand Book (2002). Environment Australia, GPO Box 787, Canberra ACT 2601.
Water Resources Audit, Canberra. Available from <http://www.nlwra.gov.au> [Accessed 20/05/2003].
Waterhouse B.M. and Corlett R.T. (1996). Overlooked but still: Invading Praxelis Clematidea the Unknown Weed. Proceedings of the 11th Australian Weeds Conference, Melbourne, Australia, 30 September - 3 October, Ed. R.C.H Shepherd, pp. 406. (Weed Science Society of Victoria Inc., Frankston).
Webb M. (2002). Development of technologies to alleviate soil acidification in legume based production systems in the tropics of Asia and Australia. Annual report to ACIAR for Project LWR1/1998/124.
Weier K.L. (1998). Groundwater study in the Ingham, Tully, Innisfail, Gordonvale, Atherton, Mareeba and Mossman Regions. CSIRO Tropical Agriculture, Townsville.
Werren G. (January 2001). Environmental Weeds of the Wet Tropics Bioregion: Risk Assessment & Priority Ranking. Co-operative Research Centre for Tropical Rainforest Ecology and Management.
Werren G., Panetta D. and Gossem S. Environmental weed risk assessment in the Wet Tropics: Addressing problems of invasive alien species as a major threat to landscape integrity and health.

CONDITION REPORT: SUSTAINABLE USE 107
Williams D. (2001). Impacts of terrestrial runoff on the Great Barrier Reef World heritage Area. CRC Reef Research Centre, Australian Institute of marine science, Townsville.
Williams L.E. (2002a). Queensland fisheries overview. In ‘Queensland’s fisheries resources: current condition and recent trends 1988-2000’. (Ed. L.E. Williams.) pp.1-3. (Queensland Department of Primary Industries: Brisbane.)
Williams L.E. (2002b). 'Queensland's fisheries resources - current condition and trends 1988-2000.' (Queensland Department of Primary Industries: Brisbane.)
Williams L.E. (Ed) (1997). 'Queensland's Fisheries Resources.' (Queensland Department of Primary Industries: Brisbane.)
Williams L.E. and Dredge M.L.C. (2002). Trawl fisheries of Queensland. In 'Queensland's fisheries resources: current condition and recent trends 1988-2000'. (Ed. L.E. Williams.) pp 16-21. (Queensland Department of Primary Industries: Brisbane.)
Williams L.E., Garrett R.N. and O’Neil M.F. (2002). Inshore fisheries of Queensland. In ‘Queensland’s fisheries resources: current condition and recent trends 1988-2000’. (Ed. L.E. Williams.) pp94-109. (Queensland Department of Primary Industries: Brisbane.)
Willis G.H. and McDowell L.L. (1982). Review: pesticides in agricultural runoff and their effects on downstream water quality. Environmental Toxicology and Chemistry 1, 267-279.
Wilson B.J., Hawton D. and Duff A.A. (1995). Crop Weeds of Northern Australia – identification at seedling and mature stages. Department of Primary Industries. Queensland.
Wilson P.R. (1991). Agricultural land suitability of the wet tropical coast, Mossman to Julatten area, QO91010. DPI, Brisbane.
Wilson P.R. and Baker D.E. (1990). Soils and Agricultural Land Suitability of the Wet Tropical Coast of North Queensland: Ingham Area. QO91010. Queensland Department of Primary Industries, Brisbane.
Wingfield M. (2002). Diseases of redclaw crayfish. Queensland Department of Primary Industries, In Redclaw Information Package. (Brisbane.)