sustained innovation and creativity - toyota industries · pursuit of sustained innovation and...
TRANSCRIPT
ANNUAL REPORT 2006Year ended March 31, 2006
Sustained Innovation and Creativity

Cautionary Statement with Respect to Forward-Looking Statements
Defi nition of Terms
This annual report contains projections and other forward-looking statements that involve risks and uncertainties. The use of the words “expect,” “anticipate,” “estimate,” “forecast,” “plan” and similar expressions is intended to identify such forward-looking statements. Projections and forward-looking statements are based on the current expectations and estimates of Toyota Industries Corporation and its Group companies regarding their plans, outlook, strategies and results for the future. All such projections and forward-looking statements are based on management’s assumptions and beliefs derived from the information available to it at the time of producing this report and are not guarantees of future performance. Toyota Industries and its Group companies undertake no obligation to publicly update or revise any forward-looking statements, whether as a result of new information, future events or otherwise. Therefore, it is advised that you should not rely solely upon these projections and forward-looking statements in making your investment decisions. You should also be aware that certain risks and uncertainties could cause the actual results of Toyota Industries Corporation and its Group companies to differ materially from any projections or forward-looking statements discussed in this report. These risks and uncertainties include, but are not limited to, the following: (1) reliance on a small number of customers, (2) product development capabilities, (3) intellectual property rights, (4) product defects, (5) price competition, (6) reliance on suppliers of raw materials and components, (7) environmental regulations, (8) success or failure of strategic alliances with other companies, (9) exchange rate fl uctuations, (10) share price fl uctuations, (11) effects of disasters, power blackouts and other incidents, (12) latent risks associated with international activities and (13) retirement benefi t liabilities.
“Fiscal 2006” refers to the fi scal year ended March 31, 2006, and other fi scal years are referred to in a corresponding manner. All references to the “Company” herein are to Toyota Industries Corporation, and references to “Toyota Industries,” “Toyota Industries Group” or the “Group” herein are to the Company and its 153 consolidated subsidiaries.
Profi le
About the Cover“Be ahead of the times through endless creativity, inquisitiveness and pursuit of improvement,” reads one of the fi ve Toyota Precepts, symbolizing the wisdom of company founder Sakichi Toyoda. The precepts have served as the basis of the thinking and guiding principles of the entire Toyota Group. “Sustained innovation and creativity,” which serves as the theme of this year’s annual report, embodies our determination to stay on a path to further growth through this spirit.
Toyota Industries Corporation was founded in 1926 by Japan’s “master of
invention,” Sakichi Toyoda, to manufacture automatic looms. During the
intervening years, Toyota Industries broadened the scope of its business
domains to include textile machinery, automobiles, materials handling
equipment, electronics and logistics solutions. With production bases in North
America, Europe and Asia, including Japan, China and India, as well as a
worldwide sales network, mainly in its Materials Handling Equipment and
Textile Machinery segments, the operations of the Toyota Industries Group
span the globe.
In November 2006, Toyota Industries will celebrate its 80th anniversary.
We remain committed to further growth of our businesses in the unwavering
pursuit of sustained innovation and creativity.

1Toyota Industries Corporation Annual Report 2006
Consolidated Financial Highlights
At a Glance
2
Letter to Shareholders4
Message from the President6
14
Investor Information104
Toyota Industries in Numbers99
Focus on Business16Materials Handling Equipment
Automotive Stamping DiesManufacturing Equipment
Vehicle/EngineCar Air-Conditioning Compressor
Logistics SolutionsElectronics
Textile Machinery
16
4242
3026
3834
41
Exploring Toyota Industries43Medium-Term Management PlanResearch and DevelopmentCorporate GovernanceEnvironmental and Social Contribution Efforts
Directors, Corporate Auditors and Managing OfficersCorporate Organization
Locations of Major Subsidiaries Outside Japan
44464851
Toyota Industries’ 80 Years of History54
5756
60Corporate Data58
Financial Section61
Report of Independent Auditors
Consolidated Eleven-Year Summary
Consolidated Balance Sheets
Consolidated Statements of Shareholders’ EquityConsolidated Statements of Income
Notes to Consolidated Financial StatementsConsolidated Statements of Cash Flows
Management’s Discussion and Analysis of Financial Condition and Results of Operations
98
62
74
79
7776
78
64
Contents

2 Toyota Industries Corporation Annual Report 2006
Consolidated Financial Highlights
Net sales
Automobile ¥746,796 ¥616,200 ¥603,863 ¥595,460 ¥563,599 $6,357,334
Materials Handling Equipment 595,237 503,990 443,444 373,008 353,043 5,067,141
Logistics 65,145 – – – – 554,567
Textile Machinery 49,789 43,902 45,969 48,740 30,705 423,844
Others 48,989 77,446 71,103 52,011 32,816 417,034
Millions of yenThousands of
U.S. dollars
Toyota Industries Corporation and Consolidated Subsidiaries
Years ended March 31
Thousands ofU.S. dollars
%change
Millions of yen
20062006 2005 2004 2003 2002
200620042006 2005 2003 2002
Note: U.S. dollar amounts have been translated from yen, for convenience only, at the rate of 117.47 yen = US$1, the approximate exchange rate on March 31, 2006.
For the Year
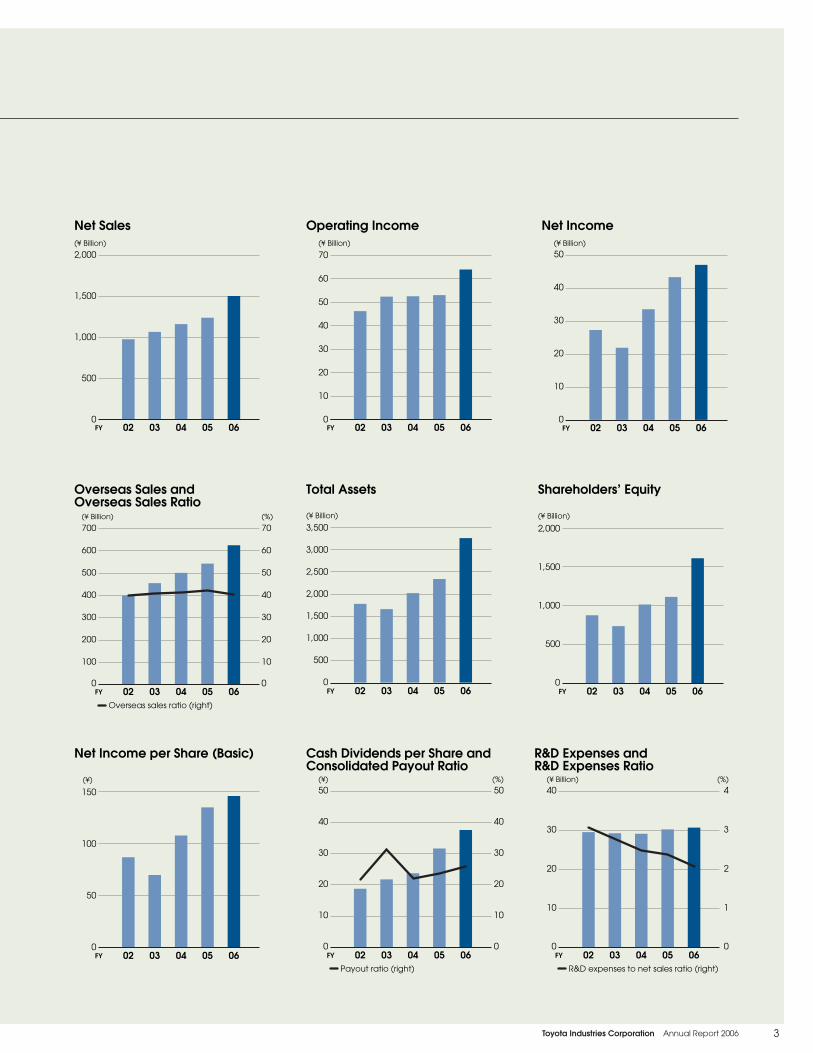
Net sales ¥1,505,956 ¥1,241,538 ¥1,164,379 ¥1,069,219 ¥980,163 21.3% $12,819,920
Operating income 64,040 53,120 52,631 52,478 46,330 20.6 545,160
Ordinary income 80,635 70,913 58,971 51,375 47,866 13.7 686,431
Net income 47,077 43,358 33,623 21,934 27,311 8.6 400,758
Overseas sales 620,946 539,009 497,357 451,594 396,470 15.2 5,285,996
Depreciation and amortization 87,288 70,213 65,352 59,154 55,174 24.3 743,066
Capital expenditures 158,836 136,506 89,509 87,559 88,320 16.4 1,352,141
Research and development
expenses
31,166 30,051 29,562 29,705 29,985 3.7 265,310
Per Share Data (yen, U.S. dollars)
Net income — basic ¥146.16 ¥135.09 ¥108.04 ¥70.19 ¥87.28 8.2% $1.24
Net income — diluted 146.02 135.03 101.97 62.90 78.26 8.1 1.24
Cash dividends 38.00 32.00 24.00 22.00 19.00 18.8 0.32
At Year-End
Total assets ¥3,245,341 ¥2,326,824 ¥2,011,995 ¥1,650,391 ¥1,770,401 39.5% $27,626,977
Shareholders’ equity 1,611,227 1,115,747 1,016,764 738,868 878,812 44.4 13,716,072
Number of employees 32,977 30,990 27,431 25,030 23,056 6.4
Sales by Business Segment
3Toyota Industries Corporation Annual Report 2006
500
0
1,000
1,500
040302FY 0605
(¥ Billion)
2,000
Net Sales
0
10
20
30
40
50(¥ Billion)
Net Income
040302FY 0605
(¥ Billion)
Operating Income
20
10
0
40
30
60
50
70
040302FY 0605
0
100
200
300
400
500
600
700(¥ Billion)
0
10
20
30
40
50
60
70(%)
Overseas Sales and Overseas Sales Ratio
040302FY 0605Overseas sales ratio (right)
0
500
1,000
1,500
2,000(¥ Billion)
Shareholders’ Equity
040302FY 06050
500
1,000
1,500
2,000
2,500
3,000
3,500
Total Assets
040302FY 0605
(¥ Billion)
0
10
20
30
40(¥ Billion)
R&D Expenses and R&D Expenses Ratio
040302FY 06050
1
2
3
4(%)
R&D expenses to net sales ratio (right)
0
50
100
150(¥)
Net Income per Share (Basic)
040302FY 06050
10
20
30
40
50(¥)
Cash Dividends per Share and Consolidated Payout Ratio
040302FY 06050
10
20
30
40
50(%)
Payout ratio (right)

4 Toyota Industries Corporation Annual Report 2006
Dear Shareholders:
Toyota Industries made tremendous strides in strengthening our management structure
and expanding our business foundation under a fi ve-year Medium-Term Management
Plan that was completed in the fi scal year ended March 31, 2006 (fi scal 2006). As a result,
we are pleased to report that in fi scal 2006, the plan’s fi nal year, Toyota Industries achieved
consolidated net sales of ¥1,506.0 billion and consolidated ordinary income of ¥80.6
billion, thereby surpassing the targets of ¥1,200 billion in consolidated net sales and ¥80.0
billion in consolidated ordinary income.
In spite of these positive results, we will continue to push ahead to realize a potentially
greater level of performance. In the fi scal year ending March 31, 2007, Toyota Industries
initiated a new fi ve-year Medium-Term Management Plan (April 2006 – March 2011)
that we believe will guide us on a path to further growth. Under the new plan, we have
signifi cantly raised the bar for performance by setting the extremely challenging targets
of surpassing ¥2,000 billion in consolidated net sales and ¥140.0 billion in consolidated
ordinary income. To achieve these objectives, we will strive to further reinforce the strengths
of such core businesses as the Materials Handling Equipment and automobile-related
businesses while actively cultivating the Logistics Solutions and other new businesses. In
essence, our new management plan clearly articulates the strategic directions Toyota
Industries plans to pursue as we enter a new phase of growth.
Along with the new management plan, we have devised the 2010 Vision, which
envisions the desired status of the Toyota Industries Group in 2010—namely, the attainment
by each business division of an overwhelmingly dominant competitive advantage in
the areas of quality, cost and delivery. To achieve this, we need to continue to develop
leading-edge technologies that anticipate the needs of the times and enhance our
value chain by forging deeper synergies among business divisions, which would not be
possible without the combined efforts and capabilities of our employees. Accordingly, we
intend to commit our energy to the development of personnel with superior skills as well as
the augmentation of workplace strengths that foster a spirit of teamwork.
Letter to Shareholders

5Toyota Industries Corporation Annual Report 2006
To achieve stable growth over the long term, it is essential that companies undertake
business activities with a view toward promoting harmony between society and the
global environment while maintaining healthy relationships with stakeholders. Furthermore,
we believe that initiatives to ensure thorough compliance and strengthen corporate
governance are also indispensable. With an eye toward the future, we remain committed
to attaining sustainable growth and raising our corporate value to meet the expectations
of our shareholders and other stakeholders.
Tetsuro ToyodaPresident
Tadashi IshikawaChairman
Tetsuro ToyodaPresident
August 2006
Tadashi IshikawaChairman

6 Toyota Industries Corporation Annual Report 2006
Message from the President
Tetsuro ToyodaPresident
Celebrating Our 80th AnniversaryIn November 2006, Toyota Industries will mark a momentous milestone when it celebrates the
80th anniversary of its founding. Over the past eight decades, Toyota Industries has successfully
navigated numerous challenges to steadily expand the scope of its business through sustained
innovation and creativity. Our achievements have been made thanks to the loyal patronage
of customers, devotion of employees, understanding of local communities and the support
of our shareholders, all of whom I wish to express my deepest appreciation. Toyota Industries’
management remains committed to ensuring the ongoing growth of its businesses while
supporting the livelihood of employees and their families, contributing to society and providing
customers with excellent products and services. Above all, we have renewed our resolve to fulfi ll
our crucial responsibility of meeting the expectations of our shareholders.

7Toyota Industries Corporation Annual Report 2006
All Business Segments Maintain Generally Solid PerformancesDuring fi scal 2006, all segments once again reported favorable results, as evidenced by
across-the-board increases in net sales. Additionally, with the exception of the Automobile
Segment, most segments achieved increases in operating income over the previous fi scal year.
A summary of business results by segment is as follows.
Automobile SegmentIn fi scal 2006, net sales increased 21.2% from the previous fi scal year to ¥746.8 billion, but
operating income declined 11.7% to ¥20.1 billion. The increase in net sales was fueled primarily by
robust sales in the Vehicle Business of the Vitz (Yaris outside Japan) and the RAV4, both of which
underwent a full model change in February and November 2005, respectively. In the Engine
Business, factors contributing to higher sales in this segment included the commencement of
production of 2.2-liter direct-injection AD diesel engines for the European market in March 2005
and the start of production of 2.5-liter and 3.0-liter direct-injection KD diesel engines for Toyota
Motor Corporation’s (TMC) Innovative International Multi-Purpose Vehicle (IMV) Project in June
Record-Breaking Results for Fiscal 2006In fi scal 2006, ended March 31, 2006, Toyota Industries achieved record-high consolidated net
sales and income amid an expanding global economy. Fueled mainly by increases in the
Automobile and Materials Handling Equipment segments, consolidated net sales for the fi scal
year jumped 21.3% to ¥1,506.0 billion. Consolidated operating income increased 20.6% to ¥64.0
billion, as the rise in net sales and the success of cost-reduction activities compensated for
increased depreciation expenses in the Vehicle and Engine businesses and higher prices for raw
materials. Consolidated ordinary income increased 13.7% to ¥80.6 billion and consolidated net
income rose 8.6% to ¥47.1 billion.
Note: Segment net sales fi gures do not include intersegment transactions. However, segment operating income (loss) fi gures do include operating income (loss) arising from intersegment transactions.
Increase in net sales
Cost reductions
Exchange rate fluctuations
Increase in depreciation
expenses
Increase in raw material
prices Increase in personnel expenses Increase in
miscellaneous expenses
Non-operating income (losses)70.9
+23.5
+21.0+4.6 -13.2
-12.0
-6.6
-6.4
- 1.2 80.6(¥ Billion)
05
Up 9.7 billion yenover fiscal 2005
06FY
Factors for Increase (Decrease) in Consolidated Ordinary Income

8 Toyota Industries Corporation Annual Report 2006
2005. Also contributing to growth in net sales in the Automobile Segment was an increase in
overseas unit sales in the Car Air-Conditioning Compressor Business. On the other hand, the
decline in operating income resulted from higher depreciation expenses and pre-production
costs associated with the introduction of new products and release of model changes in the
Vehicle and Engine businesses.
Materials Handling Equipment SegmentNet sales by the Materials Handling Equipment Segment rose 18.1% from the previous fi scal
year to ¥595.2 billion. This rise was underpinned by large increases in sales of the TOYOTA, BT and
Raymond brands supported by an expanding global economy in addition to favorable results by
Aichi Corporation, which manufactures and sells aerial work platforms. Operating income surged
48.6% to ¥38.8 billion.
Logistics SegmentThe Logistics Segment was newly established in fi scal 2006, separating the logistics-related
businesses (logistics solutions and transportation businesses) that were previously part of the
Others Segment.
During fi scal 2006, the Logistics Segment achieved net sales of ¥65.1 billion. This increase
refl ected solid results by Asahi Security Co., Ltd. (Asahi Security), which was acquired by Toyota
Industries in March 2005 and provides comprehensive total cash management outsourcing.
Other contributing factors were higher sales in the Logistics Solutions Business, which handles all
phases of customers’ logistics and enhances their overall supply chain management, as well
as improved results of the Taikoh Transportation Group, which is involved in cargo transport and
other logistics businesses. Operating income of the Logistics Segment was ¥1.6 billion.
Textile Machinery SegmentNet sales by the Textile Machinery Segment advanced 13.4% to ¥49.8 billion, primarily refl ecting
higher sales of air-jet looms to our principal markets of China and India, as well as robust sales of
ring spinning frames mainly by our production and sales subsidiary in India. This segment posted
an operating loss of ¥70 million, an improvement of ¥0.7 billion from the previous fi scal year.
Others SegmentBecause we separated our logistics-related businesses from the Others Segment and established
the Logistics Segment, net comparisons with the previous year’s results cannot be made. In fi scal
2006, net sales were ¥49.0 billion and operating income amounted to ¥3.7 billion.
Key Initiatives Undertaken during Fiscal 2006Underscoring a strong determination to expand current and future businesses, Toyota Industries
adopted a number of forward-looking strategic initiatives during the fi scal year under review.
Several of the more notable initiatives are as follows.

9Toyota Industries Corporation Annual Report 2006
Further Deploying Our Engine Business OverseasIn March 2005, production of 2.2-liter direct-injection AD
diesel engines for the European market was successively
started at the Hekinan Plant in Japan and at Toyota
Motor Industries Poland Sp.zo.o. (TMIP)*, a joint venture
in Europe with TMC. Refl ecting a rising awareness that
diesel engines offer superior environmental performance,
the proportion of diesel vehicles in Europe is increasing.
This trend makes it imperative for TMC to strengthen its
lineup of diesel vehicles for the European market where
it is striving to raise its presence. Toyota Industries will work
to contribute to TMC’s European strategy through the
joint development of diesel engines with TMC as well as
the production of these engines.
In June 2005, the Higashichita Plant started
producing 2.5-liter and 3.0-liter direct-injection KD diesel
engines for TMC’s IMV Project. While contributing to
TMC’s overseas strategy, Toyota Industries also continues
to press ahead with initiatives for further expanding its
own business.
Versatile Approach to Overseas Production of Car Air-Conditioning CompressorsDecember 2005 marked the start of production at TD Automotive Compressor Georgia, LLC
(TACG), established jointly in July 2004 by Toyota Industries and DENSO Corporation (DENSO) as
a second North American compressor production base near Atlanta in the U.S. state of Georgia.
Although fi xed-displacement compressors have been
the main compressor used in North America, in view of
increasing global environmental awareness, we foresee
rising demand for variable-displacement compressors,
which offer excellent fuel effi ciency. TACG is producing
variable-displacement compressors to meet this
demand.
In May 2005, Toyota Industries established TD
Automotive Compressor Kunshan Co., Ltd. (TACK), a
joint venture with DENSO, Toyota Tsusho Corporation
and others, as its second car air-conditioning
compressor production base in China. In April 2006,
TACK inaugurated production of variable-displacement
compressors, which are being supplied to car makers
mainly in the southern part of China.
* Toyota Industries’ stake in TMIP is 40%. Toyota Industries is chiefl y responsible for production operations at TMIP.
Higashichita Plant
2AD diesel engine
2KD diesel engine
Toyota Motor Industries Poland Sp.zo.o.
TD Automotive Compressor Georgia, LLC
TD Automotive Compressor Kunshan Co., Ltd.
10 Toyota Industries Corporation Annual Report 2006
Offi cial Launch of Toyota Material Handling Group (TMHG)In April 2006, Toyota Industries offi cially launched TMHG as a new organization to integrate the BT
Industries Group and TOYOTA Material Handling Company (TMHC). We have so far successfully
expanded synergies between the BT Industries Group and TMHC by mutually supplying each
other’s brand products, sharing sales and production know-how, exchanging personnel and
jointly procuring components. Through this strategic reorganization, we aim to create additional
synergies as well as further solidify the positioning of this segment as “undisputed No. 1” in the
global lift truck market.
Expanding the Scope of Our Logistics Solutions BusinessIn its Logistics Solutions Business, Toyota Industries has redefi ned the concept of “logistics” to
encompass the “fl ow of cash” and the “fl ow of information” in addition to the traditional “fl ow
of goods.” During the course of business activities, the fl ow of goods is usually accompanied by
fl ows of information and money. By broadening our concept of “logistics” to include this overall
fl ow as well as offering companies optimal logistics by improving this fl ow, we intend to create
new business models and seize new business opportunities. As part of these efforts, in March
2005 we acquired Asahi Security and made this company into a wholly owned subsidiary. Asahi
Security offers comprehensive cash management outsourcing services, including cash collection
and delivery as well as cash proceeds management for the retail, service and transportation
sectors. In January 2006, we further bolstered our Logistics Solutions Business by acquiring
an equity stake (41.4% share) in Wanbishi Archives Co., Ltd., which provides comprehensive
information management that includes handling collection and distribution of vital documents,
magnetic tapes and crucial corporate data.
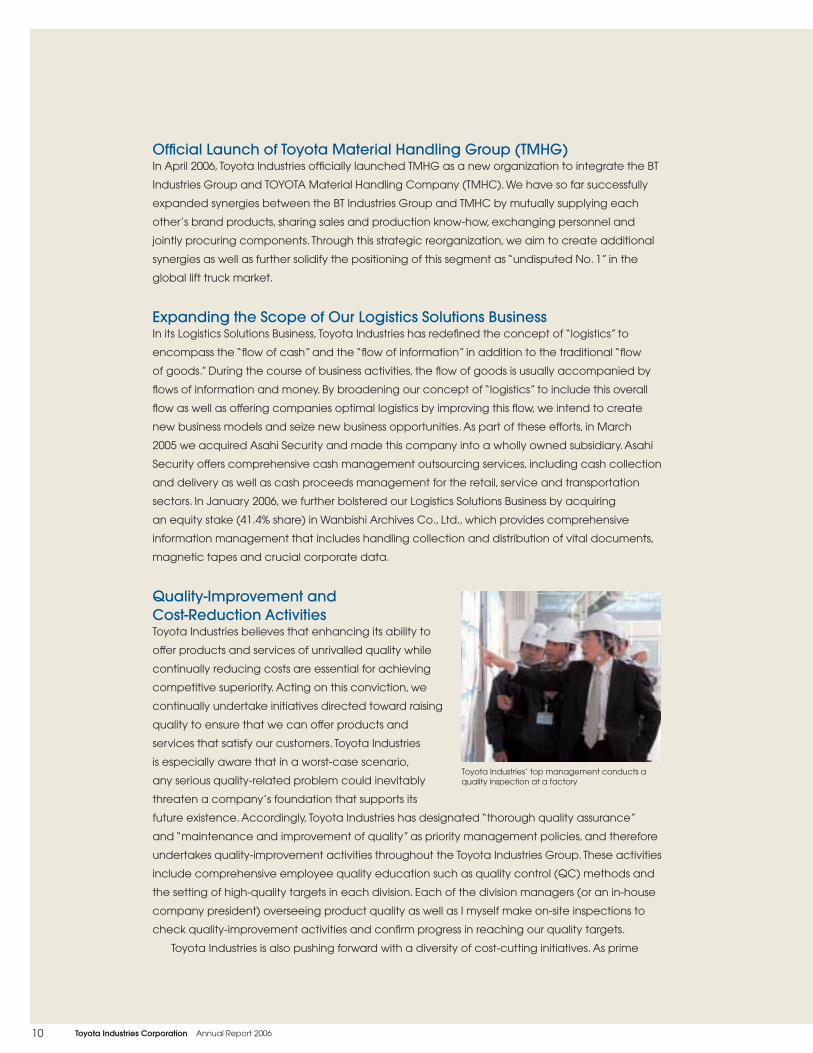
Quality-Improvement and Cost-Reduction ActivitiesToyota Industries believes that enhancing its ability to
offer products and services of unrivalled quality while
continually reducing costs are essential for achieving
competitive superiority. Acting on this conviction, we
continually undertake initiatives directed toward raising
quality to ensure that we can offer products and
services that satisfy our customers. Toyota Industries
is especially aware that in a worst-case scenario,
any serious quality-related problem could inevitably
threaten a company’s foundation that supports its
future existence. Accordingly, Toyota Industries has designated “thorough quality assurance”
and “maintenance and improvement of quality” as priority management policies, and therefore
undertakes quality-improvement activities throughout the Toyota Industries Group. These activities
include comprehensive employee quality education such as quality control (QC) methods and
the setting of high-quality targets in each division. Each of the division managers (or an in-house
company president) overseeing product quality as well as I myself make on-site inspections to
check quality-improvement activities and confi rm progress in reaching our quality targets.
Toyota Industries is also pushing forward with a diversity of cost-cutting initiatives. As prime
Toyota Industries’ top management conducts a quality inspection at a factory
11Toyota Industries Corporation Annual Report 2006
examples, each division undertakes cost-reduction projects through organized and well-planned
cost-reduction activities. Besides our unceasing value engineering (VE) and value analysis (VA)
activities, these cost-reduction activities also extend to an array of other areas that include
consideration of optimized global procurement of materials. These efforts also cover our Head
Offi ce, where we are implementing comprehensive activities to trim fi xed costs via improved
operational effi ciency and other such measures.
Unveiling a New Medium-Term Management PlanIn October 2005, Toyota Industries formulated a new fi ve-year medium-term management plan
that was subsequently launched in the fi scal year beginning April 2006.
The new medium-term management plan integrates management and business plans for
the next fi ve years while articulating the directions that Toyota Industries will pursue. With the
foundation of this plan being the attainment of the spirit of harmony and enhancement of
workplace strengths, which includes nurturing employees, we will strive for the highest levels of
quality, intend to execute reforms by fortifying our value chain and developing leading-edge
technologies as well as achieve growth as a company with dominant businesses. We expect
these measures will allow us to attain our targets of consolidated net sales exceeding ¥2,000
billion and ordinary income of ¥140 billion by fi scal 2011, the fi scal year ending March 31, 2011.
By business segment, we have set a net sales target of ¥1,000 billion for automobile-related
businesses and net sales of ¥1,000 billion in the Logistics and Materials Handling Equipment
businesses. To facilitate the attainment of these challenging targets, we expect to make a
capital investment of around ¥500 billion during the fi ve-year period (April 2006 - March 2011).
Business Outlook for Fiscal 2007In fi scal 2007, ending March 31, 2007, the Japanese economy is anticipated to remain on a
recovery track while the economies of the United States, China and other principal countries are
expected to attain stable growth. Nevertheless, the outlook for fi scal 2007 precludes optimism as
there are concerns regarding risk factors such as a further rise in crude oil prices accompanying
political instability in the Middle East as well as possible rapid adjustments in exchange rates.
Amid this economic environment, Toyota Industries expects the Materials Handling Equipment
Segment to continue expanding its business results and also anticipates increased sales in the
Automobile and Logistics segments. Accordingly, consolidated net sales are forecast to rise 10.9%
to ¥1,670.0 billion for fi scal 2007. Despite an increased burden of depreciation expenses in the
Automobile Segment, we expect that a rise in net sales coupled with a bolstering of Group-wide
cost-reduction activities will enable a 5.4% rise in ordinary income to ¥85.0 billion and a 4.1%
increase in net income to ¥49.0 billion.Note: The fi nancial projections set forth above are based upon a number of assumptions and estimates that, while presented
with numerical specifi city and considered reasonable by us when taken as a whole, are inherently subject to signifi cant economic, business, competitive, regulatory and operational uncertainties, contingencies and risks, many of which are beyond our control. Financial projections are necessarily speculative in nature, and it can be expected that one or more of the assumptions underlying the projections will prove not to be valid, and unanticipated events and circumstances are likely to occur. Actual results will vary from the fi nancial projections and those variations may be material. Consequently, this report should not be regarded as a representation by us or any other person that the fi nancial projections will be achieved. Current rapidly changing market trends in the global economy make it particularly diffi cult to predict product demand and other related matters.

12 Toyota Industries Corporation Annual Report 2006
Looking toward the Future“United We Grow”In April 2005, Toyota Industries World Convention 2005 was held in Japan to gather all persons
involved with Toyota Industries’ Materials Handling Equipment Business under the slogan, “United
We Grow.” This slogan represents our aspirations to continually grow with capabilities befi tting the
world’s leading company in materials handling equipment, backed by the solidarity of the BT
Industries Group and TMHC under the framework of TMHG. As I have often pointed out, I believe
the “United We Grow” slogan also transcends the Materials Handling Equipment Segment and
symbolizes the future direction of the entire Toyota Industries Group. Additionally, not only does
the slogan express our strong intention to create new value by fostering further collaboration
among employees within the Toyota Industries Group and creating synergies through the organic
interaction among the Group’s business divisions, but it also symbolizes our resolve to promote
stronger relationships with shareholders, customers, members of the local community and other
stakeholders.
Aiming to Increase Corporate ValueThe management team of Toyota Industries—your company—believes that its most critical
mission is to raise our long-term, stable earnings power and create even higher corporate value.
To that end, we expect to carry out dynamic and strategic business operations while establishing
more effi cient company management systems and steadily improving our business results
through stable growth of our businesses. Throughout its history, Toyota Industries has diversifi ed its
businesses into a broad range of fi elds. By strategically and organically combining management
resources that are the wellspring of its competitive advantage—namely, the know-how, key
technologies, human resources and markets cultivated by each business—Toyota Industries is
confi dent it can create new value and realize further growth and development in each business.
In this way, we can attain a “conglomerate premium” whereby the worth of Toyota Industries as
a whole adds up to more than the sum of individual businesses.
Cultivating Global-Oriented Personnel to Support MonozukuriWe recognize that raising corporate value depends on how we can cultivate our human
resources. Although in recent years we have achieved solid growth in our logistics and other
non-manufacturing businesses as we steadily diversify our portfolio of businesses, Toyota Industries
is still essentially a company that engages in monozukuri (literally meaning “creating things” but
it implies a philosophy that recognizes the value of the innovative creation of quality products).
Unquestionably, the main source of our competitiveness is employees who are well versed in
the Toyota Production System (TPS) and fi lled with passion and a sense of mission. Therefore,
strengthening employee education in monozukuri will be essential for Toyota Industries to further
hone monozukuri and ensure its ongoing existence amid intensifying competition. At the same
time, we must resolutely promote initiatives to ensure that the specialized knowledge and skills
cultivated over the course of our long history are successfully handed down to subsequent
generations.
Toyota Industries is also moving ahead quickly with the globalization of its businesses, and
non-Japanese employees now account for over half of all staff on a consolidated basis.
Centered around the Materials Handling Equipment Segment, which has achieved the most

13Toyota Industries Corporation Annual Report 2006
progress in globalizing its business, Toyota Industries is actively
promoting globalization as it accelerates overseas local
production in its other businesses as well. Crucial to sustaining
this globalization will be the cultivation of global-oriented
personnel who have specialized knowledge and technical
skills to handle the transfer of production know-how such
as TPS—a source of Toyota Industries’ competitiveness—
to overseas production bases and who can execute their
duties within different cultural environments. In the Materials
Handling Equipment Segment, in particular, we aim for the effective utilization of human
resources by placing the right people in the right jobs regardless of their nationalities.
Earning Greater Trust of Stakeholders Deeply committed to strengthening our bonds of trust with shareholders and other stakeholders,
Toyota Industries is proactively bolstering its corporate governance to fi rmly establish a structure
that facilitates effi cient and highly transparent management. As part of these efforts, to respond
quickly and fl exibly to changes in the management environment and accelerate future-oriented
reforms, we recently adopted our unique Managing Offi cer System. In addition to a streamlined
Board of Directors for quicker decision-making, managing offi cers assume greater responsibility
for business operations, thereby contributing to the realization of a more effi cient management
structure that enables the further enhancement of operational-based management. At the
same time, we are also implementing thorough compliance measures. Moreover, as a good
corporate citizen, we will work to earn the further trust of society by earnestly undertaking
environmental and social contribution activities.
Sustained Innovation and CreativityAs I mentioned at the outset of my message, in November 2006 Toyota Industries will
commemorate its 80th anniversary. Toyota Industries’ founder, Sakichi Toyoda, aspired to be an
inventor who would contribute to society, and subsequently established Toyota Industries to
commercialize automatic looms, which he invented after numerous trials and errors. His founding
spirit—sustained innovation and creativity, a venture spirit as well as a belief in contributing to
society—hasn’t lost its luster even after 80 years. Toyota Industries continues to carry on this spirit
to write a new history through sustained innovation and creativity.
In closing, I ask our shareholders for your continued understanding and support.
Tetsuro ToyodaPresident
Employees strive to perfect their skills at the Technical Training Center
August 2006

14 Toyota Industries Corporation Annual Report 2006
Percentage of Net Sales
49.6%
39.5%
4.3%3.3% 3.3%
Toyota Industries is active in a diverse
range of business domains. These extend
from the Textile Machinery Segment,
a business we have carried out since
our founding, to such core businesses
as the Automobile Segment and the
Materials Handling Equipment Segment.
Our extensive portfolio of businesses
also includes the Logistics Segment,
which we expect will grow steadily in
the future, in addition to the Others
Segment, which includes promising
businesses that are still relatively small in
scale. Given these characteristics of our
operations, Toyota Industries is essentially
a diversifi ed company encompassing
a wide variety of businesses, each with
clearly defi ned core businesses. By
strategically and organically combining
key technologies and production
know-how cultivated in our numerous
businesses with our extensive customer
bases, we aim to create new value
added that allows our overall corporate
value to exceed the simple sum of
individual businesses.
Automobile Segment
Others Segment
Textile Ma chin ery Segment
Materials Handling Equipment Seg ment
Logistics Segment
Note: Segment net sales fi gures do not include intersegment transactions. However, segment operating income (loss) fi gures do include operating income (loss) arising from intersegment transactions.
At aGlance
• Passenger vehicles
• Diesel engines
• Gasoline engines
• Car air-conditioning compressors
• Electronic components for automobiles
• Foundry parts for engines
• Automotive stamping dies, etc.
7SEU17 Compressor
Main Products
Vitz (Yaris outside Japan)
2AD Diesel engine
Automobile Segment
The Automobile Segment is Toyota Industries’ largest business segment and accounts for 49.6% of consolidated net sales. Within this segment, the Vehicle Business manufactures the Vitz (Yaris outside Japan) and RAV4 (for Europe and North America), while the Engine Business produces diesel and gasoline engines. The Car Air-Conditioning Compressor Business develops and produces swash-plate fi xed-displacement compressors, one-way swash-plate continuous variable-displacement compressors and scroll-type compressors. Power electronics devices for automobiles are also included in this segment. In fi scal 2006, net sales of the Automobile Segment were ¥746.8 billion and operating income amounted to ¥20.1 billion.
06
Net Sales
Operating Income
0504
616.2603.9
(¥ Billion)
FY0
200
400
600
800
060504
20.122.827.5
(¥ Billion)
FY0
20
40
60
80
746.8
Business Overview
Materials Handling Equipment Seg ment
• Counterbalanced lift trucks
• Warehouse trucks
• Aerial work platforms
• Automated storage and retrieval systems
• Automatic guided vehicles, etc.
Main Products
The Materials Handling Equipment Segment’s mainstay products are counterbalanced lift trucks, warehouse trucks, aerial work platforms, automated storage and retrieval systems, and automatic guided vehicle systems. This segment is mainly composed of the Toyota Material Handling Group, which is a leading manufacturer of lift trucks, and Aichi Corporation, which holds the top share of the domestic market for aerial work platforms. In fi scal 2006, net sales of the Materials Handling Equipment Segment amounted to ¥595.2 billion. Operating income totaled ¥38.8 billion.
06
Net Sales
Operating Income
0504
504.0443.4
(¥ Billion)
FY0
200
400
600
800
060504
38.8
26.119.3
(¥ Billion)
FY0
20
40
60
80
595.2
TZ-10A type “RR”Truck mount aerial work platform
Refl exReach truck
GENEO (8FG25)Internal combustion counterbalanced lift truck
Business Overview
DC-DC converter

15Toyota Industries Corporation Annual Report 2006
RX240NEWRing spinning frame
JAT710 Air-jet loom
Textile Ma chin ery Segment
• Ring spinning frames
• Roving frames
• Drawing frames
• Air-jet looms
• Water-jet looms
• Sizing machines, etc.
Main Products
The Textile Machinery Segment produces and sells spinning and weaving machinery. Spinning machinery includes the manufacture and sales of ring spinning frames, roving frames and combing machines, while weaving machinery involves the manufacture and sales of air-jet looms and water-jet looms along with such preparatory machinery for weaving as sizing machines and automatic drawing-in machines. In fi scal 2006, net sales of the Textile Machinery Segment were ¥49.8 billion. The segment posted an operating loss of ¥70 million.
06
Net Sales
Operating Income
0504
49.846.0
(¥ Billion)
FY0
20
40
60
80
060504
(0.8)
(¥ Billion)
FY(2)
0
2
4
6
43.9
(0.1)0.1
Business Overview
Low-temperature polysilicon TFT-LCDs
Wire bonding package sub strate
FPC sub strate
Others Segment
• Wire bonding package substrates
• Flip chip package substrates
• Flexible printed circuit (FPC) substrates
• Low-temperature polysilicon TFT-LCDs, etc.
Main Products
The Others Segment consists mainly of newer businesses that Toyota Industries has entered relatively recently and that are thus still small in scale. At the core of this segment is TIBC Corporation, a joint venture with Ibiden Co., Ltd. that produces semiconductor package substrates. Although it is an equity-method affi liate, we regard ST Liquid Crystal Display Corp. (STLCD)*, a joint venture with Sony Corporation that produces low-temperature polysilicon TFT-LCDs, as part of this segment. In fi scal 2006, net sales of the Others Segment amounted to ¥49.0 billion and operating income was ¥3.7 billion.* As STLCD is an affi liate and not a consolidated
subsidiary, its sales and operating income (loss) are not included in the consolidated fi gures, but are accounted for by the equity method.
06
Net Sales
Operating Income
0504
49.0
71.1
(¥ Billion)
FY0
20
40
60
80
060504
5.2
(¥ Billion)
FY0
2
4
6
8
77.4
3.7
5.8
Business Overview
Logistics Segment
• Transportation services
• Logistics planning
• Operation of distribution centers
• Total cash management outsourcing, etc.
Main Services
In fi scal 2006, the Logistics Segment was established as a new segment, integrating into a single segment the distribution-related businesses (Logistics Solutions Business and Transportation Business) previously included in the Others Segment. Toyota Industries expects that these businesses will grow to become one of its core businesses in the future. In particular, the Logistics Solutions Business offers a unique business model that optimizes the overall fl ow of goods, money and information to comprehensively address customers’ logistics needs. In fi scal 2006, net sales of the Logistics Segment amounted to ¥65.1 billion. Operating income was ¥1.6 billion.
06
Net Sales
Operating Income
65.1
(¥ Billion)
FY0
20
40
60
80
06
(¥ Billion)
FY0
2
4
6
8
1.6
Business Overview
Logistics solutions
16 Toyota Industries Corporation Annual Report 2006
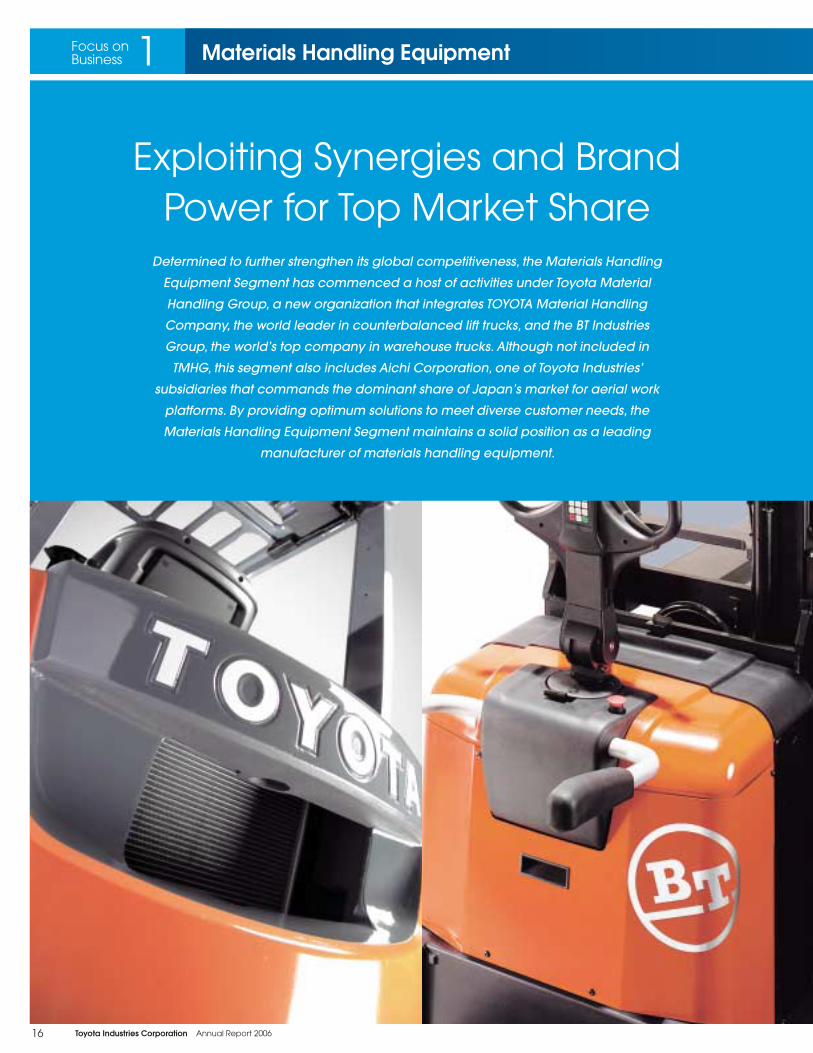
Exploiting Synergies and Brand Power for Top Market Share
Determined to further strengthen its global competitiveness, the Materials Handling
Equipment Segment has commenced a host of activities under Toyota Material
Handling Group, a new organization that integrates TOYOTA Material Handling
Company, the world leader in counterbalanced lift trucks, and the BT Industries
Group, the world’s top company in warehouse trucks. Although not included in
TMHG, this segment also includes Aichi Corporation, one of Toyota Industries’
subsidiaries that commands the dominant share of Japan’s market for aerial work
platforms. By providing optimum solutions to meet diverse customer needs, the
Materials Handling Equipment Segment maintains a solid position as a leading
manufacturer of materials handling equipment.
1Focus onBusiness Materials Handling Equipment

17Toyota Industries Corporation Annual Report 2006
Within the Materials Handling Equipment Segment, Toyota
Material Handling Company (TMHC) and the BT Industries
Group have made strenuous efforts to realize synergies by
mutually supplying each other’s brand products, sharing
sales and production know-how, exchanging personnel and
jointly procuring components. Backed by the success of
these efforts, in April 2006 we integrated both entities under
the framework of Toyota Material Handling Group (TMHG),
a new organization that we expect will allow us to maximize
synergies as we strive to achieve our target of becoming
“undisputed No. 1” in the global lift truck market.
In carrying out its operations, TMHG has divided its
global markets into four regions—Europe, North America,
Japan and International—and established a Board as the
decision-making body within each of these four regional
organizations. A Management Committee, composed
of TMHG top management and representatives of each
regional organization, formulates strategies and manages
TMHG as a whole.
TMHG has also set up Sub-Committees, comprising
functional sections of each regional organization, to handle
such principal functions as quality, R&D, product planning,
information system/information technology, plant operation,
human resources and fi nance. Cross-sectional linkages
permeating the entire organization facilitate the sharing
of best practices and know-how cultivated regionally as
well as by TMHC and the BT Industries Group. Measures to
be stressed include the ongoing transfer and sharing of the
Toyota Material Handling Group—Maximizing SynergiesToyota Production System—the source of our competitive
edge—joint procurement of components, joint transport
of components and products, standardization of platforms
and joint development of key components. By undertaking
business closely focused on the needs of customers in its own
geographic region, TMHG aims to further accelerate global
development and capture a one-third share of the global lift
truck market as early as possible in the 2010s.
Global Strategy, Optimum Resource Allocation, Global Management Control
Quality, R&D, Product Planning, Information System/Information Technology, Plant Operation, Human Resources and Finance
TMHJ
TMHG President Tatsuo Matsuura
Management Committee
Sub-Committees
TMHNATMHE TMHI TMHJToyota Material Handling
North AmericaToyota Material Handling
EuropeToyota Material Handling
InternationalToyota Material Handling
Japan
Organizational Chart of Toyota Material Handling Group
The formation of Toyota Material Handling Group was announced at the Toyota Industries World Convention 2005 to maximize the synergies of TOYOTA, BT and Raymond brands.

18 Toyota Industries Corporation Annual Report 2006
Brand Portfolio
TOYOTA BrandTOYOTA-brand lift trucks and other industrial vehicles
are sold in Japan under the brand name of TOYOTA
L&F (Logistics and Forklifts). Outside Japan, the TOYOTA
INDUSTRIAL EQUIPMENT brand/emblem is used.
Aichi BrandAichi, a leading manufacturer of aerial work platforms in
Japan, uses the AICHI brand throughout the world. Visit
www.aichi-corp.jp for further information.
BT BrandBT-brand warehouse trucks enjoy strong recognition in
Europe and other regions.
Raymond BrandThe Raymond brand is well recognized in North America.
Other BrandsThe CESAB and Lift-Rite brand names are also used in
designated markets.
Subsequent to establishing TMHG, we will continue to fi rmly
maintain the TOYOTA, BT and Raymond brands, with TMHG
carrying out activities globally utilizing the strong power
of each of these brands. The BT and Raymond brands
boast strong recognition in Europe and the United States,
respectively, while the TOYOTA brand is solidly positioned in
Japan and the United States. TMHG seeks to fully execute
its business utilizing these brand assets. Although not a part
of the TMHG organization, Aichi Corporation (Aichi) also
possesses its own strong brand and is promoting its business
globally.
1Focus onBusiness Materials Handling Equipment

19Toyota Industries Corporation Annual Report 2006
position in this critical segment of the materials handling
market. The combination of these industry-leading brands
fi rmly establishes TMHNA as the number-one supplier of
materials handling equipment in North America.
Calendar year 2005 was not only a record sales year for
TMHNA but also one of signifi cant milestones. The Raymond
brand introduced two new models featuring its exclusive
ACR System™: the AC-powered 5000 Series orderpickers and
8000 Series pallet trucks. In addition, the TOYOTA brand was
recently honored by Reed Research Group as the leading
supplier of lift trucks in terms of quality and value in the
United States for the second consecutive year. Additionally,
the 5,000-pound capacity TOYOTA internal combustion,
cushion tire lift truck was named the most fuel effi cient and
productive lift truck by USAC Properties, Inc., a subsidiary of
the United States Auto Club.
Year-to-date 2006 has already provided some signifi cant
milestones. Toyota built and celebrated the production of its
250,000th lift truck at the Toyota Industrial Equipment Mfg.,
Inc. (TIEM) facility in Columbus, Indiana. TIEM, home to the
state-of-the-art National Customer Center (NCC), builds 99%
of the TOYOTA-brand lift trucks sold in North America. During
its fi rst year of operation, the NCC welcomed more than 340
guests representing nearly 100 companies.
Japanese MarketAmid a strong recovery in the Japanese economy, total
demand in the domestic market for lift trucks in calendar year
2005 increased 9% from 2004 to 82.0 thousand units.
Responding to brisk demand, aggressive sales activities
implemented within Toyota Industries’ Materials Handling
Equipment Business included promoting proposal-based
marketing and fortifying response to large-scale and
wide-ranging customers. Mirroring the rising environmental
awareness of companies, we achieved a particularly large
increase in sales of electric counterbalanced lift trucks. As a
result, the Materials Handling Equipment Business recorded an
11% increase in sales to 35.6 thousand units.
For calendar year 2005, Toyota Material Handling Japan
(TMHJ) garnered a record-high market share of 43.4% for sales
of lift trucks in Japan, marking the seventh year running that
its market share has topped 40% and the 40th consecutive
year that it has maintained the top-ranked position in the
Japanese lift truck industry.
Business Activities in Fiscal 2006
04 05030201CY
(%)
0
50
10
20
30
4040.6 41.2 42.6 42.6 43.4
Toyota’s Growing Share in the Japanese Lift Truck Market
Sonny Toyoda, president of TIEM; Al Rawson, president of Atlas Toyota Material Handling and chairman of Toyota’s National Dealer Advisory Council; Shankar Basu, president and CEO of Toyota Material Handling USA, Inc.; and Tatsuo Matsuura, president of Toyota Material Handling Group, celebrate the production of the 250,000th lift truck, a four-wheel internal combustion cushion tire model.
TOYOTA-brand lift trucks are sold and supported by a
network of 69 dealers through 187 locations. Raymond-brand
trucks are sold and supported by an international network
of Raymond dealers who provide comprehensive materials
handling solutions. In North America, 39 dealers serve the
United States, Canada and Mexico, selling and servicing
Raymond trucks through 108 locations.
Aichi recorded a sharp rise in sales from the previous
fi scal year, supported by solid replacement demand
from such principal customers as the electric power and
telecommunications industries.
North American MarketThe North American market for lift trucks showed continued
strong growth in 2005. Toyota Material Handling North
America (TMHNA) took advantage of the sustained growth,
with the TOYOTA brand recording its highest sales volume
to date, and solidifi ed its position as the top-selling lift truck
brand in North America for the fourth consecutive year,
improving its position relative to other industry players. Sales of
Raymond-brand electric lift trucks were also at record levels,
exhibiting particularly strong sales growth in the warehousing
and distribution segment to maintain Raymond’s top-selling

20 Toyota Industries Corporation Annual Report 2006
European MarketThe European market for industrial trucks continued to
grow signifi cantly during the year in continuation of a
decades-long period of solid growth. At the same time, there
has recently been a marked increase in cyclical demand
as well. As a whole, market growth was strongest in Eastern
Europe.
The total European market at the end of calendar year
2005 reached 298,000 units. Market share in Europe for Toyota
Material Handling Europe (TMHE) was close to 20%, clearly
demonstrating TMHE’s prominence as one of the three major
suppliers in the European market.
The competitive climate continues to be intense. Further,
a prolonged rise in raw materials costs combined with a
recurrent unwillingness of large customers to absorb price
increases present a signifi cant challenge in a market with
very strong European-based competitors.
During the year, close integration between the Toyota
and BT organizations within TMHG became even stronger,
underpinned by the two-brand strategy. As one sign of this
deeper integration, a joint development project was carried
out, resulting in the launch of a new range of 24-volt electric
counterbalanced lift trucks towards the end of 2005. The
market reception of this new product has been extremely
positive.
Other International MarketsAfrica, Asia, Oceania, the Middle East and South America,
which comprise substantial and varied business areas,
encompass emerging markets with rapid growth prospects,
such as the BRICs (Brazil, Russia, India and China) countries.
This range of diversity clearly means that the challenges and
economic performance factors are different in character.
In general, all markets have demonstrated growth, with
economic development inevitably spurring higher levels of
business activity. In such an environment, potential sales of
Cargo Blitz TRAIGO
counterbalanced lift trucks and warehouse trucks are strong.
The key approach in international markets has centered
on maximizing our business opportunities by offering a full
range of products to meet our customers’ total materials
handling needs. We must also ensure our impressive product
portfolio is available to all customers in all markets through
our different distribution channels.
The total market for lift trucks in 2005 expanded 17%, along
with 15% and 25% growth for counterbalanced lift trucks
and warehouse trucks, respectively. Overall market shares
for Toyota Material Handling International (TMHI) showed
favorable growth over the same period. Encouragingly, both
growth in total market size and market share for TMHI was
achieved in all of these other international areas.
1Focus onBusiness Materials Handling Equipment
During calendar year 2005, total worldwide unit
sales of TOYOTA-brand lift trucks amounted to a
record-high 116.4 thousand units. TOYOTA is the
only brand in the industry to achieve annual sales
exceeding 100,000 units as a single brand.
Currently manufactured at production bases
in Japan, the United States, France and China,
TOYOTA-brand lift trucks are sold and serviced at 320
global sales and service bases all over the world.
Please visit www.global-toyotaforklifts.com for
more information on the global sales network and
TOYOTA-brand products.
116.4117.8
Unit Sales of TOYOTA-Brand Lift Trucks
120
100
80
60
40
20
(Thousand units)(Target)
05040302010CY 06
Record-High Unit Sales of TOYOTA-Brand Lift Trucks
Topic
24-volt three-wheel counterbalanced lift trucks jointly developed by Toyota, BT and CESAB

21Toyota Industries Corporation Annual Report 2006
signifi cant events for TMHNA. Toyota will commemorate its 40th
anniversary of establishing operations in North America and
Raymond celebrates its 85th anniversary. Additionally, in early
2007 the Raymond brand expects to ship its 300,000th lift truck.
TMHNA will continue to accelerate the implementation
of the Toyota Production System (TPS) at its manufacturing
facilities in Columbus, Indiana; Greene, New York; Muscatine,
Iowa; and Brantford, Ontario, Canada. As a result, we will
further improve our already strong reputation for product
quality and reliability. In conjunction with TPS, TMHNA operates
under a global charter that promotes environmental
responsibility throughout the entire company. Of signifi cant
importance is the exclusive emissions system employed by
the 8-Series that not only surpasses 2007 Federal EPA emissions
standards, but also meets California’s stringent 2010 emission
standards—three years early.
European MarketFor 2006, the general growth trend in the European market is
expected to continue, albeit at a somewhat lower rate than
the last couple of years. Most regional areas are expected
to show growth, especially in Eastern Europe. On the other
hand, an overall increase in GDP levels in Western Europe
is expected to fuel higher market demand in the materials
handling industry in these markets as well.
In line with continued integration of its European
organizations, TMHE expects to reap additional synergies in
different areas, further increasing its competitiveness to the
benefi t of its customers.
Other International MarketsIn 2006, TMHI anticipates continued growth in other key
international markets, with strong growth expected in
designated markets, along with business expansion in the
automotive sector and other industries in each region.
In line with ongoing growth in important markets such as
China and Australia, TMHI plans to further strengthen its levels
of activity and local operations. TMHI aims to ensure that its
reputation for quality products is complemented by strong
support capabilities, including maintaining an emphasis on
providing sophisticated systems solution sales for the more
complex warehousing installations planned by many of its
internationally active customers in third party logistics and
warehousing sectors.
It is also clear that key markets in the Middle East, Asia and
South America require ever-higher levels of sales and service
support, and the focus will remain directed toward satisfying
these needs. Backed by the current Toyota/BT sales network,
TMHI approaches the market with a determination to forge
deeper relationships and develop stronger ties with its dealers
and customers.
Japanese MarketThe year 2006 marks the 50th anniversary since the
commencement of sales of TOYOTA-brand lift trucks in Japan.
During this commemorative year, TMHJ expects continued
solid growth in the domestic lift truck market.
In the future, TMHJ will strive to expand sales and market
share by offering products and services that we hope will
deliver even greater customer satisfaction. In line with these
efforts, TMHJ plans to carry out proposal-based marketing
that offers solutions that accurately address customer needs
as well as promote fl eet management contracts to major
customers spanning a wide range of geographic regions. In
September 2006, the series of 1- to 3.5-ton internal combustion
counterbalanced lift trucks with higher standards for both
safety and environmental features will be reintroduced in
Japan after a full model change. TMHJ believes this will serve
as the tailwind to further penetrate the market. Also, TMHJ will
actively market and sell a wide lineup of materials handling
systems that include racks, automatic guided vehicle systems
and automated storage and retrieval systems.
North American MarketIn 2006, TMHNA anticipates the North American market for
materials handling equipment will refl ect the overall economic
outlook, with a slowing pace of growth. Both the TOYOTA and
Raymond brands are well situated to take advantage of
these market conditions to expand their industry leadership
positions. We hope to strengthen the TOYOTA brand’s position
as the number-one selling brand in North America with
the introduction of the much-anticipated 8-Series line, with
internal combustion, pneumatic and cushion tire models
that range from 3,000 to 6,500 pounds. The 8-Series has been
designed to build on Toyota’s strengths with increased visibility,
improved ergonomics, enhanced productivity and superior
durability, all while maintaining its position as the industry’s
safety leader. In January 2007, Toyota will exhibit at ProMat,
the largest materials handling show in North America, where
consumers will get their fi rst look at the 8-Series. We hope to
solidify the Raymond brand’s leadership role in the warehouse
and distribution market with products featuring improved
performance and reliability at reduced cost of ownership,
expanding the range of products with the advantages of
AC power. Both of TMHNA’s
brands will seek to expand fl eet
services and fl eet management
offerings in response to demand
by large customers who want to
optimize their lift truck fl eets
and control costs.
The year 2006 will
mark a number of
Looking Ahead
8FGU25

22 Toyota Industries Corporation Annual Report 2006
Topics
Toyota Industries World Convention 2005In April 2005, the Toyota Industries World Convention was held
in Japan to share the vision for further growth of the Materials
Handling Equipment Business among the TOYOTA/BT-related
distributors and dealers around the world. At the convention,
everyone present pledged their unity to solidify Toyota
Industries’ global top position in the materials handling
equipment industry under the slogan “United We Grow.” The
integration of TMHC and the BT Industries Group under the
framework of TMHG as a means of further creating synergies
was also announced.
Development of Fuel-Cell Lift TrucksToyota Industries developed the fuel-cell hybrid system for
lift trucks in-house, a fi rst among lift truck manufacturers. The
TOYOTA FCHV-F lift truck, which incorporates the fuel-cell
hybrid system jointly developed with Toyota Motor Corporation
(TMC), was exhibited at CeMAT 2005, an international
trade fair for intralogistics held in
Hannover, Germany, in October
2005. Although a few technical issues
must still be addressed prior to
commercialization and widespread
use, the fuel-cell lift truck has great
market potential due to its
superior features.
Full Model Change of Compact Electric Tow TractorsThe new Tugnova* (CBT/CBTY) series of electric tow tractors (2-
to 4-ton towing capacity) was introduced into the Japanese
and overseas markets in March 2006 after
a full model change. This was the fi rst
time for Toyota Industries to incorporate
an AC drive system in its compact tow
tractors, achieving superior operability
and lower maintenance costs and
ensuring a high standard of safety.
BT Industries Celebrates its 60th AnniversaryA key part of TMHG’s operations, BT Industries AB was
established in Sweden in 1946, when it began selling
construction and transportation equipment, and has since
expanded its operations worldwide. In addition to acquiring
The Raymond Corporation of the United States in 1997 and
CESAB Carrelli Elevatori S.p.A of Italy in 1999, BT Industries
subsequently established a production and sales structure
in the United States, while expanding its product lineup in
Europe. In 2000, BT Industries became one of Toyota Industries’
subsidiaries and is now carrying out its business by pursuing
synergies with the TOYOTA brand under the framework of
TMHG.
50th Anniversary of Lift Truck Sales in Japan and 20th Anniversary of Domestic Sales of Materials Handling SystemsIn 2006, Toyota Industries marked the 50th anniversary of selling
TOYOTA-brand lift trucks in Japan and its 20th anniversary
since commencing sales of materials handling systems such
as automatic guided vehicle systems. A ceremony was held
in April 2006 to celebrate these anniversaries with domestic
distributors and related persons.
Joint Development of Electric Counterbalanced Lift Trucks for the European MarketTMHC and the BT Industries Group jointly developed a
three-wheel electric counterbalanced lift truck for the
European market and started shipment of the product in
January 2006. Cesab, which is part of the BT Industries Group,
took the initiative in the development and produces the
product in Italy. The lift truck is marketed as the TRAIGO under
the TOYOTA brand, the Cargo under the BT brand and the Blitz
under the CESAB brand.
Full Model Change of 1- to 3.5-Ton Internal Combustion Lift TrucksIn September 2006, Toyota Industries will commence sales of
1- to 3.5-ton internal combustion lift trucks in Japan following
a full model change (sold as the GENEO in Japan and the
8-Series overseas). The 1- to 3.5-ton class internal combustion lift
trucks dominate approximately 50% of the Japanese lift truck
market and are used by a wide variety of customers primarily
in the transport and warehouse industries. Toyota Industries
embarked on the development of new
lift trucks to attain an even higher level
of performance and functionality in
the areas of safety, environmental
features and ease of operation. This
product series will be introduced
gradually to the U.S. and
European markets.
FCHV-F fuel-cell lift truck
Tugnova (CBT)
1Focus onBusiness Materials Handling Equipment
* A coined word that combines the English word “tug” and the Latin word “nova,” which means “new,” as well as the English word “innovation,” meaning a new kind of tow tractors
New GENEO (8-Series) internal combustion counterbalanced lift truck

23Toyota Industries Corporation Annual Report 2006
Products for the Japanese Market
Products for the Japanese Market — Materials Handling Systems
2AFBR15Automatic guided lift truck
Rack Sorter B Automated storage and retrieval system (Plastic container type)
Road Sorter H(ACBH10)Automatic guided vehicle system
Partner Rack Rail-less mobile rack
SE08B SC40A
Rack Sorter P Automated storage and retrieval system (Pallet type)
SR-18AJ RX07BSH15B
Truck Mount Aerial Work Platforms Self-Propelled Aerial Work Plat forms
TZ-10A type “RR”
GENEO (8FG25)Internal combustion
coun ter bal anced lift truck
GENEO-B (7FB15)Electric coun ter bal anced lift truck
GENEO-E (7FBE15)Three-wheel electric counterbalanced lift truck
GENEO-R (7FBR15)Electric reach truck
2TE18Electric tow tractor
Note: Although Aichi Corporation is not integrated into the Toyota Material Handling Group, it comprises an important part of the Materials Handling Equipment Segment.
APLB8Automatic guided pallet truck
Products for the Japanese Market — Industrial Vehicles
Please visit www.aichi-corp.jp for more information.

24 Toyota Industries Corporation Annual Report 2006
Products for the North American Market
7FGCU55-BCSInternal combustion cushion tire counterbalanced lift truck—boxcar special model
8FGCU25Internal combustion cushion tire counterbalanced lift truck
7FBEU20Three-wheel electric counterbalanced lift truck
7FBCU25Electric cushion tire counterbalanced lift truck
7BPUE15Electric order picker
7FGU70Internal combustion pneumatic tire counterbalanced lift truck
1Focus onBusiness Materials Handling Equipment
Raymond Model 7400Reach-Fork TruckReach truck
8FGU25Internal combustion pneumatic tire counterbalanced lift truck
Raymond Model 8400 Pallet TruckElectric pallet truck
Raymond EASi Pacer Stand-Up Counterbalanced TruckElectric counterbalanced truck
Raymond Model 5600 OrderpickerOrder picking truck
Raymond Swing-Reach TruckVery narrow aisle truck
Please visit www.toyotaforklift.com for more information.
Please visit www.raymondcorp.com for more information.

25Toyota Industries Corporation Annual Report 2006
7FBMF25Electric counterbalanced lift truck (80V)
7FG/DF30Internal combustion counterbalanced lift truck with deluxe cabin
Products for the European Market
7FBRE14Electric reach truck
7SLLPowered stacker
7FBEF15 Three-wheel electric counterbalanced lift truck (48V)
Three-wheel electric counterbalanced lift truck (24V)
Please visit www.bt-industries.com for more information.
Pro LifterHand pallet truck
Ixion*Support arm stacker truck
OpusLow-level order picking truck
Minimover*Electric stacker truck
Refl exReach truck
Cargo DDiesel-engined counterbalanced truck
Vector*Very narrow aisle truck with shuttle forks
* Launched during the years 2005-2006
Cargo E*Three-wheel electric counterbalanced truck
Please visit www.toyota-tiee.com for more information.

26 Toyota Industries Corporation Annual Report 2006
Applying Unrivalled Technologies to Create Revolutionary Products
The Car Air-Conditioning Compressor Business is a core business of the Automobile Segment
in addition to being an important strategic business of Toyota Industries. Drawing on a wealth
of cutting-edge technologies, we effi ciently develop and manufacture high-quality products
that are closely tailored to customer needs. By doing so, Toyota Industries is contributing to
enhancements in comfort and technological advances of vehicles manufactured not only by
Toyota Motor Corporation but the world’s other top-name automakers as well.
2Focus onBusiness Car Air-Conditioning Compressor

27Toyota Industries Corporation Annual Report 2006
Breakthrough Innovations and Cutting-Edge Compressors for Hybrid VehiclesToyota Industries’ car air-conditioning compressors are noted
for unsurpassed quality and reliability, attributes that have
won extensive acclaim from Toyota Motor Corporation
(TMC) and other leading automakers. As testimony to our
unsurpassed technological development capabilities, our Car
Air-Conditioning Compressor Business has solidly established
its competitive superiority in the industry.
This business has a proven track record in consistently
developing new epoch-making products that continually
foresee evolving market needs, and in turn, stimulate further
technological innovation of automakers. As prime examples,
in the 1960s we developed Japan’s fi rst swash-plate
compressor, while in the 1980s we developed a compact,
lightweight 10-cylinder swash-plate fi xed-displacement
compressor noted for its outstanding reliability at high
operating speeds. We followed this accomplishment in
the 1990s by responding to growing concerns about
the environment with the development of an internally
controlled one-way swash-plate variable-displacement
compressor that reduces the load on the engine to raise
fuel effi ciency. Building on this momentum, in the late 1990s
Toyota Industries unveiled an externally controlled continuous
variable-displacement clutchless compressor that enhances
acceleration and reduces energy consumption by sensing
changes in the external environment, such as engine
acceleration. Demonstrating a dedicated commitment to
combating such environmental problems as destruction of
the earth’s ozone layer and global warming, in 2002 Toyota
Industries and DENSO Corporation (DENSO) developed an
electrically driven compressor for fuel-cell hybrid vehicles that
uses CO2 as a substitute refrigerant for hydrofl uorocarbons.
Also in collaboration with DENSO, in 2003 we developed a
two-way compressor with a built-in motor for hybrid vehicles
and an electrically driven compressor for hybrid vehicles.
The two-way compressor is driven alternately by the engine
during driving and by a built-in motor during engine stop,
while the electrically driven compressor realizes an optimal
balance between fuel effi ciency and comfort since the car
air conditioner can remain turned on even during engine
stop. Each of these pioneering compressors was developed
and commercialized ahead of our competitors, offering
further evidence of our technological and competitive
superiority.
At the Forefront of the Market with Superb Technological CapabilitiesIn fi scal 2006, Toyota Industries’ total global production
and sales of car air-conditioning compressors amounted
to 19.1 million units, giving us the top share of the global
market. In the Japanese market, we sold approximately
5.5 million compressors to TMC and other principal
domestic automakers, which made us the market leader.
Automobile trends
Toyota Industries’
product development
Improve gas mileage
Hybrid cars, fuel-cell hybrid vehicles
Reduce ozone layer destruction
Provide higher engine performance and comfortable interior
Fixed- displacement type Use of HFC-134a refrigerant
Variable-displacementtype
CO2 compressor
Externally controlled, variable displacement, clutchless type
Compact, lightweight10-cylinder swash-plate compressor*
1981
1997
1980s 1990s 2000s
1995
2002
2003
Slow down global warming
Electrically driven compressor2003
Power efficient, superb drivability7-cylinder one-way swash-plate compressor*
Ultra-lightweight, ultra-power efficient, superb drivability6-cylinder one-way swash-plate compressor*
CFC-freeCO2 compressor for fuel-cell hybrid vehicles*
* World’s first commercial products
Compact, lightweight, highly efficientElectrically driven compressor for hybrid vehicles*
Rotary valve-type compressor
Rotary valve-type variable-displacement compressor*
2003 Two-way compressorTwo-way compressor for hybrid vehicles*
Automobile Trends and Toyota Industries’ Product Development

28 Toyota Industries Corporation Annual Report 2006
Toyota Industries produces
compressors through a global
tripolar structure encompassing
Europe, the United States and Asia,
including Japan, established through
direct investments. We also license
production in Asia (excluding Japan)
and South America. By carrying out
production near our markets, we
are better able to supply products
precisely tailored to local market
needs while reducing shipment costs
and exchange rate risks.
Car Air-Conditioning Compressor Manufacturing Bases
MACI
ACTIS
Detroit
Licensed manufacturersConsolidated subsidiaries
Local offices
TACG
DNBR
DNTS
Munich
TDDK
DNIA
SUBROS
DWHI
TACK
YSD Toyota Industries Corporation
In the United States, during fi scal 2006 Toyota Industries
sold 7.6 million car air-conditioning compressors, primarily
comprising fi xed-displacement compressors (including
exports and local production), to major U.S. automakers
and Japanese auto manufacturers in North America. In
Europe, we sold approximately 5.6 million compressors, mainly
variable-displacement compressors (including exports and
local production), during fi scal 2006.
Operating an Optimal Global Production StructureWith bases in Japan, North America, Europe and Asia, Toyota
Industries has established an optimal global production
structure for its Car Air-Conditioning Compressor Business.
In Japan, our largest production base, we have built an
effi cient three-plant integrated production structure that
encompasses all phases of operations from production of
materials to processing and assembly.
In the United States, Michigan Automotive Compressor,
Inc. (MACI)* produces swash-plate fi xed-displacement
compressors. In July 2004, Toyota Industries and DENSO jointly
established TD Automotive Compressor Georgia, LLC (TACG)**,
a second North American compressor production base
situated near Atlanta in the U.S. state of Georgia that began
operations in December 2005. Although fi xed-displacement
compressors have been the main type of compressor
used in North America, we expect that rising global
environmental awareness will spur increased demand for
2Focus onBusiness Car Air-Conditioning Compressor
Consolidated Compressor Sales
(Million units)
20.0
18.0
16.0
14.0
12.0
10.0
8.0
6.0
4.0
2.0
080 81 82 83 84 85 86 87 88 89 90 91 92 93 94 95 96 97 98 99 00 01 02 03 04 05FY
19.118.2
17.9
Variable-displacement compressor
World’s first 10-cylinder swash-plate fixed-displacement compressor
World’s first one-way swash-plate variable-displacement compressor
World’s first variable-displacement clutchless compressor
World’s first two-way compressor for hybrid vehicles
World’s first mass-produced electrically driven compressor for hybrid vehicles
Fixed-displacement compressor
Others

29Toyota Industries Corporation Annual Report 2006
variable-displacement
compressors, which
offer excellent energy
effi ciency. To respond
to this increase in
demand, TACG was
established as a new
plant specializing in
variable-displacement
compressors in the
southern United States, where automakers have been
actively setting up operations. TACG plans to produce 2
million compressors annually by 2010.
In Europe, TD Deutsche Klimakompressor GmbH (TDDK)*
produces swash-plate variable-displacement compressors.
In China, where future
demand is expected to
grow, Toyota Industries
established a joint
venture, TD Automotive
Compressor Kunshan Co.,
Ltd. (TACK), in May 2005.
TACK began producing TD Automotive Compressor Kunshan Co., Ltd.
TD Automotive Compressor Georgia, LLC
Fixed-Displacement Type
Continuous Variable-Displacement Type For Hybrid Vehicles
10S17 compressor(Swash-plate type)
7SBU16 compressor(Swash-plate type)
7SEU17 com pres sor (Externally controlled, clutchless type)
SV07 com pres sor(Vane type)
SCS06 com pres sor(Scroll type)
ES18 electric compressor(Hermetic scroll type)
ES27 electric compressor(Hermetic scroll type)
variable-displacement compressors on schedule in April
2006. Yantai Shougang DENSO Co., Ltd. (YSD, in which Toyota
Industries holds a 15% stake), a joint venture established
in 1994 with DENSO and Shougang Corporation, began
producing variable-displacement compressors in April 2006
in addition to fi xed-displacement compressors already being
produced.
Looking AheadRegarding the future direction of our business, we plan to
undertake activities geared mainly toward further penetration
of overseas markets. In Europe, where the proportion of new
cars fi tted with car air conditioners has risen to nearly 80%,
Toyota Industries will work to expand sales by cultivating new
customers and further penetrating markets. These efforts will
be directed mainly toward supplying products matched to
the needs of the European market.
In the United States, we expect to work actively to secure
new orders. Aggressive sales promotion activities will also be
undertaken in cooperation with DENSO in the BRICs (Brazil,
Russia, India and China) markets, where automobile sales
continue to expand.
* MACI and TDDK are joint ventures with DENSO. As of March 31, 2006, Toyota Industries held 60% and 65%, respectively, of the shares of these companies.
** TACG is capitalized at US$78 million as of March 31, 2006. Toyota Industries North America, Inc. (a holding company controlling Toyota Industries’ North American operations) invested 65% of this capital and DENSO International America, Inc. (a company controlling DENSO’s North American operations) invested 35%.
All of Toyota Industries’ car air-conditioning compressors are supplied to DENSO, which in turn sells these to leading automakers worldwide. DENSO not only sells our compressors as a single unit but also incorporates them in DENSO’s car air-conditioning systems.

30 Toyota Industries Corporation Annual Report 2006
Realizing Global Competitiveness via Operational Excellence
Toyota Industries contributes to Toyota Motor Corporation’s car production through the
assembly of automobiles and the manufacture of engines. In recent years, the Vehicle and
Engine businesses have undertaken a host of initiatives for expanding their operations in
response to TMC’s global strategy. Highly aware that outstanding production capabilities are
the wellspring of competitiveness for these businesses, we expect to make unrelenting efforts
to achieve continuous improvements and further strengthen competitiveness.
3Focus onBusiness Vehicle/Engine

31Toyota Industries Corporation Annual Report 2006
Vehicle Business
Advantages as a Compact and Midsize Automobile ManufacturerToyota Industries plays a vital role in Toyota Motor
Corporation’s (TMC) car production as one of the vehicle
assembly arms within the Toyota Group. Our Vehicle Business
primarily assembles compact and midsize automobiles under
consignment from TMC. At present, we manufacture two
models, the RAV4 for Europe and the United States and the
Vitz (Yaris outside Japan). Our Vehicle Business has won high
acclaim for its top-class quality and quick production launch
within the Toyota Group. Moreover, the adoption of the
Toyota Production System ensures the thorough elimination of
all waste from production operations and that our plants are
utilized with the utmost effi ciency.
The Vehicle Business’s automobile assembly operations
date back to the Publica (van) and Corolla (van) in the
late 1960s and early 1970s. Based on the success of these
operations, the full-scale assembly business commenced with
the Starlet at the Nagakusa Plant in 1978. We subsequently
started manufacturing the Vitz (Yaris outside Japan), the
successor vehicle of the Starlet, in 1999. The fi rst-generation
Vitz sparked an expansion in the compact car market in
Japan and was later recognized as a global-standard
compact car. Re-introduced in Japan in February 2005 after
undergoing a full model change, the second-generation
Vitz integrates the most advanced safety features and
environmental technologies, offering the highest level of
quality.
The RAV4 also underwent a full model change and was
re-introduced in November 2005. The newest RAV4 is a truly
global model, offering an even wider interior, high driving
performance and world-class environmental and safety
performance.
Highly Effi cient Pre-Production ProcessTo launch production of the new Vitz and RAV4 in a short
time period, we conducted a sweeping review of our entire
pre-production process that included reducing the burden
of the actual pre-production process as well as equalizing
peak burdens. Along with these measures, we removed
many barriers among relevant manufacturing, production
technology and quality control departments. By eliminating
such obstacles as communication gaps—an impediment
to speed—and delayed decision-making, we successfully
implemented concurrent engineering whereby everyone
worked as part of a unifi ed organization to handle multiple
tasks simultaneously.
We also improved infrastructure at our assembly plant to
better respond to TMC’s global expansion and be ready to
manufacture at a high, stable level.
While further raising production capabilities, which are
the strength of our Vehicles Business, we expect to produce
vehicles with superior quality and cost effi ciency, thereby
further contributing to TMC’s car manufacturing operations.
RAV4Vitz(Yaris outside Japan)
Vehicles
Topic
AD Diesel Engine Fitted in the RAV4 for EuropeHighly fuel-effi cient, diesel engine vehicles are widely popular as
ecological vehicles, especially in Europe since
they emit less CO2.
Toyota Industries developed the
ecological AD diesel engine jointly with
TMC. The engine is produced at Toyota
Industries’ Hekinan Plant and fi tted in the
new RAV4 for Europe, which is assembled
by the Vehicle Business. AD diesel engine

32 Toyota Industries Corporation Annual Report 2006
Our Strengths in Development and ProductionToyota Industries’ Engine Business manufactures diesel and
gasoline engines ranging in capacity from 1500 cc to 5200
cc. Manufactured under consignment from TMC, all our
automobile engines are installed on designated TOYOTA cars.
Our diesel engines developed in collaboration with TMC, in
particular, offer high power and lighter weight in addition
to lower noise and vibration. Moreover, Toyota Industries
commands the world’s largest market share of high-output,
environmentally friendly industrial engines for lift trucks and
other materials handling equipment in addition to engines
such as gas engine-driven heat pumps. Other activities of the
Engine Business include the manufacture of an assortment of
foundry parts integrating sophisticated technologies.
Utilizing an automatic guided vehicle system, our Engine
Business operates a fl exible structure that responds quickly to
production fl uctuations and achieves operational excellence,
which includes superior capabilities in making quick
production launches.
The Engine Business is also at the forefront of developing
new technologies that reduce environmental load. A
noteworthy trend in recent years has been an increase in
the proportion of diesel engine vehicles, especially in Europe,
spurred by the realization that diesel engines are more
effective in enhancing fuel effi ciency and lowering CO2
emissions. At the same time, TMC aims to raise its presence
in the European market and thus plans to increase sales
by bolstering its diesel vehicle lineup. In response, Toyota
Engine Business
Industries aims to contribute to their European strategy
through joint development of diesel engines with TMC and
production of high-quality diesel engines.
Establishment of Global Production StructureIn March 2005, we started production of 2.2-liter
direct-injection AD diesel engines at the Hekinan Plant in
Japan and at Toyota Motor Industries Poland Sp.zo.o.* (TMIP),
a joint venture in Europe with TMC. This engine is also fi tted in
the RAV4 and Lexus IS in addition to the Avensis and Corolla
Verso that TMC assembles in the United Kingdom and Turkey,
respectively.
The Hekinan Plant, together with the Kyowa and
Higashichita plants, function as mother plants for overseas
bases that manufacture engines and foundry parts. In
carrying out this crucial role, these mother plants take
the lead in adopting the latest production technologies
developed in Japan and work to refi ne the production
process and technologies before transferring the most
advanced production know-how and expertise to overseas
bases.
Contributing to TMC’s IMV ProjectIn June 2005, the Higashichita Plant commenced production
of the 2.5-liter and 3.0-liter direct-injection KD diesel engines
for TMC’s Innovative International Multi-Purpose Vehicle (IMV)
* Toyota Industries’ stake is 40%. Toyota Industries is chiefl y responsible for production operations at TMIP.
3Focus onBusiness Vehicle/Engine
Constructiondrawing
Drawing phase
SE drawing Final drawing
Drawing completed Actual production phase
Trial production Line-off Massproduction
Vehicle review
Equipment review
Process configuration
Creation of class standards
Redo
Redo
Improvement of production line
Vehicle review
Equipment review
Process configuration
Creation of class standards
Trial productioncompleted
Moved upMoved upConfirmation step
Consideration of items forimprovement ofproduction line
Traditionalpre-production
process
Pre-production process for RAV4
Pre-Production Process Innovation
The pre-production process for
the new RAV4 began in parallel
with that for the Vitz (Yaris outside
Japan). To prepare for the
production launch of the two
models in a short period of time,
Toyota Industries conducted
a sweeping review of its
pre-production process in order to
reduce the burden of the actual
pre-production process as well as
to equalize peak burdens.
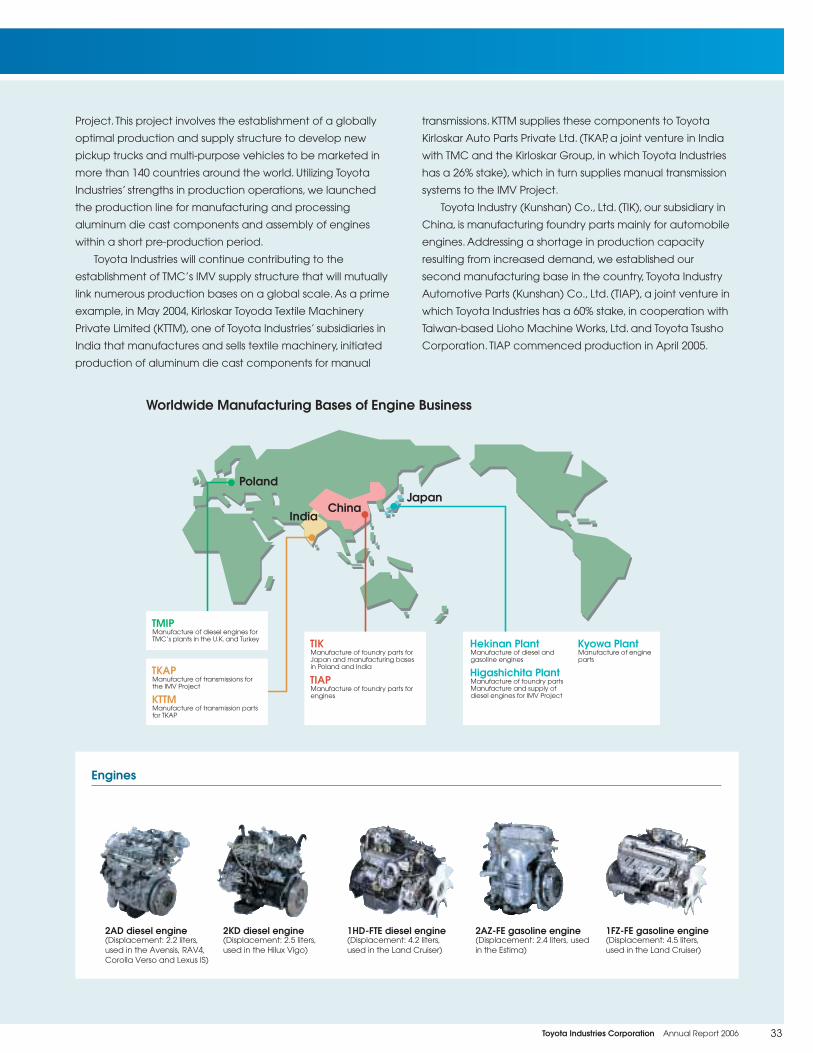
33Toyota Industries Corporation Annual Report 2006
TMIPManufacture of diesel engines for TMC’s plants in the U.K. and Turkey TIK
Manufacture of foundry parts for Japan and manufacturing bases in Poland and India
TIAPManufacture of foundry parts for engines
Hekinan PlantManufacture of diesel and gasoline engines
Kyowa PlantManufacture of engine parts
Higashichita PlantManufacture of foundry partsManufacture and supply of diesel engines for IMV Project
TKAPManufacture of transmissions for the IMV Project
KTTMManufacture of transmission parts for TKAP
Poland
ChinaJapan
India
Engines
2AD diesel engine(Displacement: 2.2 liters, used in the Avensis, RAV4, Corolla Verso and Lexus IS)
2KD diesel engine(Displacement: 2.5 liters, used in the Hilux Vigo)
1HD-FTE diesel engine(Displacement: 4.2 liters, used in the Land Cruiser)
2AZ-FE gasoline engine(Displacement: 2.4 liters, used in the Estima)
1FZ-FE gasoline engine(Displacement: 4.5 liters, used in the Land Cruiser)
Project. This project involves the establishment of a globally
optimal production and supply structure to develop new
pickup trucks and multi-purpose vehicles to be marketed in
more than 140 countries around the world. Utilizing Toyota
Industries’ strengths in production operations, we launched
the production line for manufacturing and processing
aluminum die cast components and assembly of engines
within a short pre-production period.
Toyota Industries will continue contributing to the
establishment of TMC’s IMV supply structure that will mutually
link numerous production bases on a global scale. As a prime
example, in May 2004, Kirloskar Toyoda Textile Machinery
Private Limited (KTTM), one of Toyota Industries’ subsidiaries in
India that manufactures and sells textile machinery, initiated
production of aluminum die cast components for manual
transmissions. KTTM supplies these components to Toyota
Kirloskar Auto Parts Private Ltd. (TKAP, a joint venture in India
with TMC and the Kirloskar Group, in which Toyota Industries
has a 26% stake), which in turn supplies manual transmission
systems to the IMV Project.
Toyota Industry (Kunshan) Co., Ltd. (TIK), our subsidiary in
China, is manufacturing foundry parts mainly for automobile
engines. Addressing a shortage in production capacity
resulting from increased demand, we established our
second manufacturing base in the country, Toyota Industry
Automotive Parts (Kunshan) Co., Ltd. (TIAP), a joint venture in
which Toyota Industries has a 60% stake, in cooperation with
Taiwan-based Lioho Machine Works, Ltd. and Toyota Tsusho
Corporation. TIAP commenced production in April 2005.
Worldwide Manufacturing Bases of Engine Business

34 Toyota Industries Corporation Annual Report 2006
Aiming for Future Growthwith Leading-Edge
Electronics Components
The Electronics Business engages in the development, manufacture and sales of power
electronics components for automobiles as well as manufactures and sells low-temperature
polysilicon TFT-LCDs and semiconductor package substrates through joint ventures. Toyota
Industries expects the Electronics Business to be a key driver of its future growth.
4Focus onBusiness Electronics
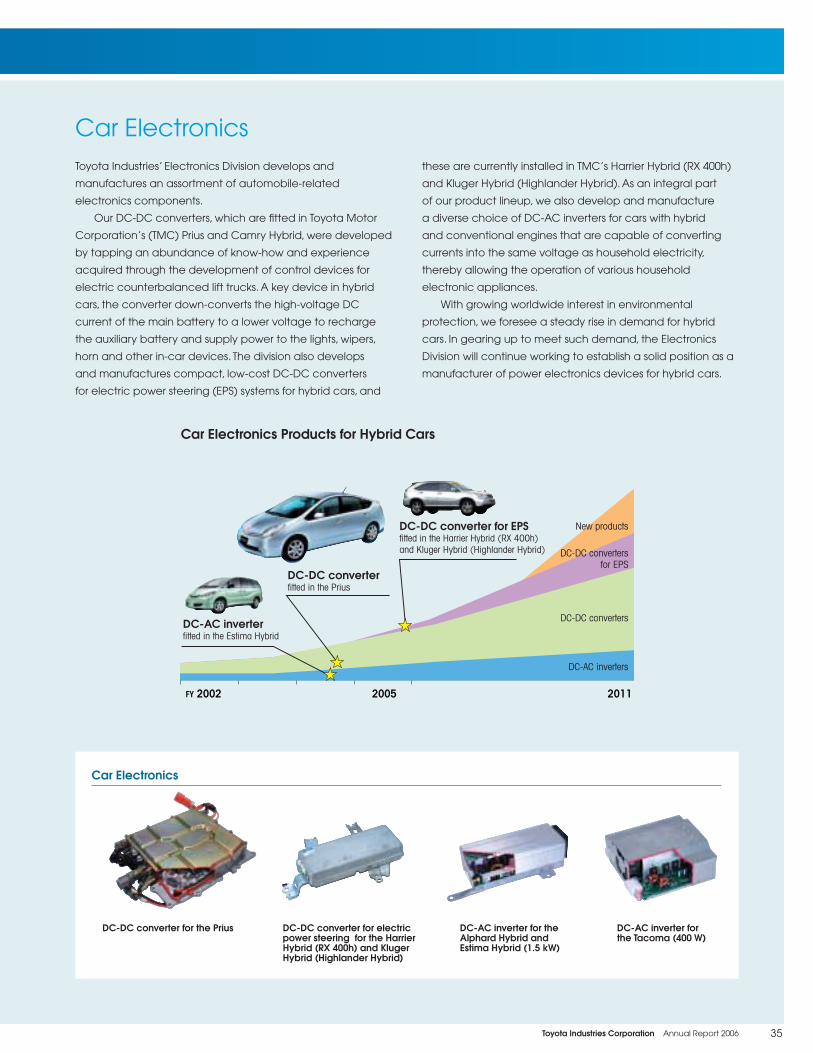
35Toyota Industries Corporation Annual Report 2006
Car Electronics
2005 20112002
DC-AC inverter fitted in the Estima Hybrid
DC-DC converter fitted in the Prius
DC-DC converter for EPS fitted in the Harrier Hybrid (RX 400h) and Kluger Hybrid (Highlander Hybrid)
DC-DC converters
DC-DC convertersfor EPS
New products
DC-AC inverters
FY
Toyota Industries’ Electronics Division develops and
manufactures an assortment of automobile-related
electronics components.
Our DC-DC converters, which are fi tted in Toyota Motor
Corporation’s (TMC) Prius and Camry Hybrid, were developed
by tapping an abundance of know-how and experience
acquired through the development of control devices for
electric counterbalanced lift trucks. A key device in hybrid
cars, the converter down-converts the high-voltage DC
current of the main battery to a lower voltage to recharge
the auxiliary battery and supply power to the lights, wipers,
horn and other in-car devices. The division also develops
and manufactures compact, low-cost DC-DC converters
for electric power steering (EPS) systems for hybrid cars, and
Car Electronicsthese are currently installed in TMC’s Harrier Hybrid (RX 400h)
and Kluger Hybrid (Highlander Hybrid). As an integral part
of our product lineup, we also develop and manufacture
a diverse choice of DC-AC inverters for cars with hybrid
and conventional engines that are capable of converting
currents into the same voltage as household electricity,
thereby allowing the operation of various household
electronic appliances.
With growing worldwide interest in environmental
protection, we foresee a steady rise in demand for hybrid
cars. In gearing up to meet such demand, the Electronics
Division will continue working to establish a solid position as a
manufacturer of power electronics devices for hybrid cars.
Car Electronics Products for Hybrid Cars
DC-AC inverter for the Alphard Hybrid and Estima Hybrid (1.5 kW)
DC-DC converter for the Prius DC-AC inverter for the Tacoma (400 W)
DC-DC converter for electric power steering for the Harrier Hybrid (RX 400h) and Kluger Hybrid (Highlander Hybrid)

36 Toyota Industries Corporation Annual Report 2006
STLCD
ST Liquid Crystal Display Corp. (STLCD) was established as a
joint venture with Sony Corporation (Sony). Holding a 50%
stake in this company, Toyota Industries accounts for STLCD as
an affi liate by the equity method.
As a core operation within the Electronics Business, STLCD
manufactures small and medium-sized low-temperature
polysilicon (poly-Si) TFT-LCD panels primarily for such
applications as video and digital still cameras and mobile
phones. These TFT-LCD panels are noted for such basic
features as high resolution and low energy consumption.
In addition, Sony is actively promoting its system-on-glass
technology that integrates the display device and its driver
circuits onto a single glass substrate (panel), enabling
highly reliable, lightweight and miniaturized display
modules. Accordingly, these TFT-LCD panels integrate Sony’s
cutting-edge technological prowess.
By combining Sony’s excellent LCD development
capabilities with Toyota Industries’ outstanding expertise in
quality control and manufacturing technology, STLCD has built
an optimal production system for manufacturing high-quality,
high-performance LCD panels. Since inaugurating mass
production in 1999, STLCD has earned a high level of
trust from an extensive range of customers for its product
quality, cost competitiveness and reliable, on-time delivery.
STLCD presently operates with a monthly production
capacity of 40,000 panels (600 x 720 mm) and is establishing
a structure capable of providing stable supplies of displays
for mobile devices that quickly meet customer needs.
On a different front, Sony acquired the LCD panel
manufacturing business of International Display Technology
Co., Ltd. and subsequently established ST Mobile Display
Corporation (STMD) in March 2005 to manufacture
low-temperature poly-Si TFT-LCD panels for mobile devices
in anticipation of expanded market demand. STMD
commenced mass production in April 2006. Sony will position
STMD alongside STLCD as a crucial manufacturing base for
low-temperature poly-Si TFT-LCD panels for mobile devices.
Toyota Industries made a 20% capital investment in STMD.
Low-Temperature Polysilicon TFT-LCD Panels
ST Liquid Crystal Display Corp.
Low-temperature polysilicon TFT-LCDs
4Focus onBusiness Electronics
ST Mobile Display Corporation

37Toyota Industries Corporation Annual Report 2006
TIBC
WB: Wire bonding (package)FC: Flip chipFPC: Flexible printed circuit
Substrate trend
TIBC product line
WB substrates
FC substrates
Flip-chippedSuper fine
Multi-layered
FPC substrates for IC cards
FPC package substrates
WB package substrates
FC package substrates
FineSuper thin-filmed
Double-sided
1980 1990 2000 2005 2010
Sep. 1997
Apr. 1999
Oct. 2002Sep. 1998
TIBC founded
LSI wirebonding
Flip chipbonding
IC signal pins
Semiconductor Package Substrate Trend and TIBC’s Production Engineering Development
Flexible printed circuit (FPC) package substrate
Flip chip (FC) package substrate
Wire bonding (WB) package substrate
TIBC Corporation
Toyota Industries entered the semiconductor package
substrates business in 1998 when it established TIBC
Corporation (TIBC), a joint venture with Ibiden Co., Ltd. (Ibiden).
Semiconductor package substrates are indispensable
components of PCs, digital still and video cameras, mobile
phones, home video game consoles, IC cards and memory
cards. Adopting technologies introduced from Ibiden, TIBC
has steadily expanded its product lineup from its initial
manufacturing of fl exible printed circuit (FPC) substrates for IC
cards to wire bonding (WB) package substrates and fl ip chip
(FC) package substrates.
TIBC’s semiconductor package substrates are sold
through Ibiden to the world’s premier semiconductor
manufacturers and semiconductor-packaging companies
for such applications as PCs and mobile phones. TIBC’s FPC
substrates are also marketed through Ibiden to SIM card
Semiconductor Package Substratesand smart card suppliers mainly in Europe and China for
integration into credit cards and telephone cards.
Amid high demand for applications in PCs and
mobile phones during fi scal 2006, TIBC recorded a strong
performance primarily as a result of a switch to high
value-added products.
FPC package substrate
Contact IC cardsMain applications:
WB package substrate
Memory for portable devices, chipsets for PCs
Main applications:
FC package substrate
CPU for PCs, PC graphics, chipsets for PCs
Main applications:
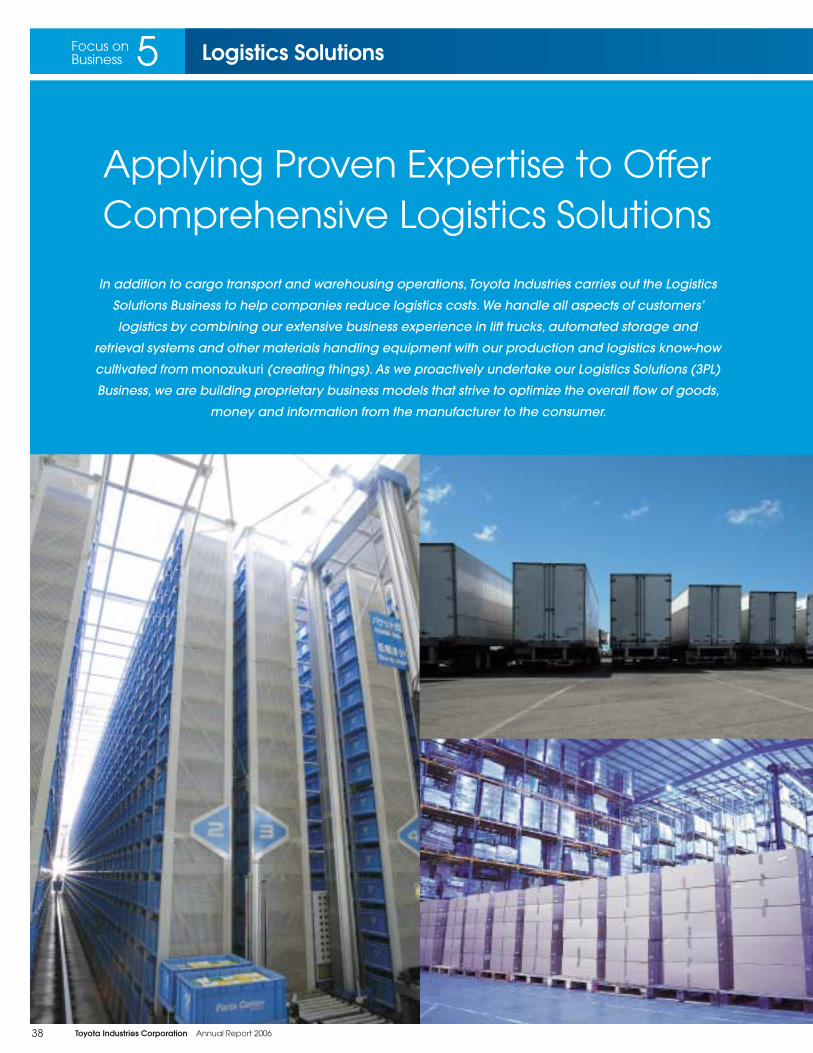
38 Toyota Industries Corporation Annual Report 2006
Applying Proven Expertise to Offer Comprehensive Logistics Solutions
In addition to cargo transport and warehousing operations, Toyota Industries carries out the Logistics
Solutions Business to help companies reduce logistics costs. We handle all aspects of customers’
logistics by combining our extensive business experience in lift trucks, automated storage and
retrieval systems and other materials handling equipment with our production and logistics know-how
cultivated from monozukuri (creating things). As we proactively undertake our Logistics Solutions (3PL)
Business, we are building proprietary business models that strive to optimize the overall fl ow of goods,
money and information from the manufacturer to the consumer.
5Focus onBusiness Logistics Solutions

39Toyota Industries Corporation Annual Report 2006
Operational Scope of the Logistics Solutions Business
Manufacturer Distribution center Retailer Consumer
Distribution center Store improvement consulting
Financial services
• Receipt of goods/storage• Provide guidance on a
simplified goods storage method that prevents maintaining unnecessary inventories
• Goods presentation/display• Provide guidance on ways to
get rid of wasteful operations and increase time spent with customers
• Planning/design• Planning and overall design
of efficient distribution center operations
• Operation/contracted management
• Cost reduction through constant improvements
Comprehensive information management• Safe-keeping of crucial documents• Document collection and delivery services
• Cash registers• Sales management for each
cash register and cash collection and delivery
• ATMs• Cash replenishment and
maintenance
Creating Logistics Solutions by Adopting Proprietary Know-HowAs one core business that will support future growth, Toyota
Industries is involved in the full-scale operation of its Logistics
Solutions (3PL) Business in Japan. Through this business, we offer
comprehensive solutions to customers’ logistics that include
handling all aspects of their logistics from the planning and
operation of distribution centers to improving their entire
supply chain. Toyota Industries aims to help customers
reduce their total logistics costs and address their needs for
logistics improvements by tapping a wealth of accumulated
experience gained via the production and sales of lift trucks,
automated storage and retrieval systems and other materials
handling equipment, as well as our production know-how
that is exemplifi ed by the Toyota Production System. Toyota
Industries considers “logistics” as an ongoing process that
continues until a product passes the checkout counter at a
retail store. From the perspective of optimizing the overall fl ow
of goods, we thus aim to build proprietary business models
that enable extensive improvements, including logistics
reforms within retail outlets.
Formats for Optimizing the Entire Flow of Goods, Money and InformationPrimarily through the Advanced Logistics Division, Toyota
Industries is promoting an array of business formats aimed
at providing optimal solutions for individual customers. These
include the establishment of Advanced Logistics Solutions
Co., Ltd. (ALSO), a wholly owned subsidiary, along with the
planning, total design and operation of distribution centers
via joint ventures with customers and logistics operators as
well as the acquisition of equity stakes in logistics operators.
In March 2005, we took an important step in bolstering
our Logistics Solutions Business by acquiring Asahi Security
Co., Ltd. (Asahi Security) and making this company into a
wholly owned subsidiary. Asahi Security offers comprehensive
cash management outsourcing services, including cash
collection and delivery, cash proceeds management and
equipment security for the retail, services and transportation
sectors. We further bolstered our Logistics Solutions Business
in January 2006 by acquiring an equity stake (41.4% share)
in Wanbishi Archives Co., Ltd., which stores and manages
crucial data for companies and government agencies
as well as provides data backup services in the event of
disasters. Based on the view that logistics extends far beyond
the mere “fl ow of goods” to encompass the “fl ow of cash”
and “fl ow of information,” the aforementioned acquisitions
and investments were aimed at expanding the spheres of
our Logistics Solutions Business and were also in line with our
business strategy of providing solutions that enable customers
to optimize their overall supply chain.
We plan to effectively allocate management resources to
our Logistics Solutions Business, while making major efforts to
accelerate the growth of this business and position it as a key
aspect of Toyota Industries’ future operations.
Supporting Customers’ Logistics through Cargo Transport and Warehousing OperationsToyota Industries is engaged in general logistics activities,
including cargo transport. Taikoh Transportation Co., Ltd.,
a Toyota Industries Group company, provides a variety
of trucking services that extend throughout Japan via its
automotive parts logistics network, as well as warehouse
storage operations.

40 Toyota Industries Corporation Annual Report 2006
5Focus onBusiness Logistics Solutions
March 2002:Advanced Logistics Solutions Co., Ltd. (ALSO) established as a wholly owned subsidiary to plan logistics and operate distribution centers.
November 2002:Commenced operation of a room-temperature distribution center for convenience stores commissioned by Mitsui & Co., Ltd.
Invested in Teion Shokuhin Ryutsu Inc., which engages in storage and delivery of frozen and chilled foods (in which Toyota Industries has a 60% stake via indirect investment through ALSO).
October 2003:KTL Co., Ltd. (KTL) established as a joint venture (in which Toyota Industries has a 50.5% stake) with Kokuyo Logitem Co., Ltd., a logistics subsidiary of Kokuyo Co., Ltd.
November 2003:KTL commenced operation of the Kokuyo Tokyo Metropolitan Area Integrated Distribution Center (IDC).
March 2004:Acquired a share of Fuji Logistics Co., Ltd. (Fuji Logistics, in which Toyota Industries has a 26% stake, with shares acquired from Fuji Electric Holdings Co., Ltd.).
April 2004:TF Logistics Co., Ltd. established as a joint venture (in which Toyota Industries has a 51% stake) with Fuji Logistics for the transport and maintenance of information devices.
March 2005:Asahi Security Co., Ltd. made into a wholly owned subsidiary.
January 2006:Acquired a share of Wanbishi Archives Co., Ltd. (in which Toyota Industries has a 41.4% stake).
June 2006:Nissen Logistics Service Co., Ltd. (currently Mail & eBusiness Logistics Service Co., Ltd.) became a subsidiary (in which Toyota Industries has a 50.5% stake).
Toyota Industries’ Expanding Logistics Solutions Business
Frozen foods
Chilled foods
Distribution
Apparel
Pharmaceuticalproducts
Unrefrigeratedfoods
Others(area platform)
Printed matter
Stationery supplies
Buildingequipment
Electronicequipment
Cosmetics anddaily use products
Establishment ofjoint ventures
Direct capital relationships
TeionShokuhin
RyutsuTakasue
Ryoshoku
KokuyoLogitem
WanbishiArchives
AsahiSecurity
Mail &eBusinessLogisticsServive
FujiLogistics
Started operations by fiscal 2005
Negotiations underway
Principal Initiatives of the Logistics Solutions Business
Topic
Entry into Mail-Order LogisticsIn June 2006, Toyota Industries acquired a 50.5%
stake from Nissen Co., Ltd. (Nissen), one of the largest
mail-order companies in Japan that engages in
producing and selling clothing and interior goods,
in Nissen Logistics Service Co., Ltd. The company,
which became a subsidiary and was renamed Mail &
eBusiness Logistics Service Co., Ltd. (Mail & eBusiness
Logistics), is involved in the shipping, storage and
inspection of goods made by Nissen and its affi liates.
Toyota Industries will cooperate with Nissen to reform
Mail & eBusiness Logistics’ operations by optimizing the
overall fl ow of logistics from procurement to customer
delivery. Toyota Industries aims to further develop its
Logistics Solutions Business through expansion into the
mail-order logistics business, which has a broad-based
supply chain.

41Toyota Industries Corporation Annual Report 2006
RX240NEW ring spinning frame FL100 roving frame DX8 drawing frame
Weaving Machinery
LW600 water-jet loomJAT710 air-jet loom Mackee Sizing machine for spun yarn
Spinning Machinery
Filamaster Sizing machine for fi lament yarn
VC5A comber
Realizing Distinctive, All-Around Quality and Top Customer ServiceThe history of the Toyota Group began with the invention of
an automatic loom by Toyota Industries’ originator Sakichi
Toyoda. During the intervening years, the Textile Machinery
Business, Toyota Industries’ founding business, has made
signifi cant contributions to the development of the textile
industry not only in Japan but also around the globe.
Toyota Industries’ Textile Machinery Business undertakes
integrated operations encompassing development,
manufacturing and sales of top-quality spinning and weaving
machinery. Backed by cutting-edge technologies and fi nely
tailored services, we are able to meet evolving customer
needs the world over.
With an increasing global population and economic
advancement in emerging countries, continued expansion
of textile consumption is expected. On the other hand, the
industry is also witnessing intensifying competition for survival
as a result of the emergence of regional manufacturers. Amid
this trend, Toyota Industries will strengthen its technological
development capabilities and raise levels of customer
services as it works to reinforce its position as one of the
leading manufacturers of textile machinery. We will strive
to differentiate ourselves by exploiting our technological
capabilities to develop weaving machinery that is capable
of weaving high value-added fabrics for the latest fashion.
To meet increasingly sophisticated market needs, we
develop and produce superior spinning and weaving
machinery that incorporates cutting-edge control,
communications and mechatronics technologies. Of
particular note, Toyota Industries commands the top global
share for its mainstay air-jet looms. Additionally, as an industry
leader, we have also earned high global acclaim from
customers for ring spinning frames and roving frames.
Please visit www.toyota-industries.com/textile for further
information about our Textile Machinery Business.
Weaving MachineryToyota Industries develops, manufactures and sells two
types of weaving machinery: air-jet looms, which insert
weft yarns using air, and water-jet looms, which use water
for the same purpose. We provide customers around the
world with state-of-the-art products that meet and exceed
basic performance requirements demanding high speed
and reliability as well as that incorporate such advanced
functions as monitoring and remote setting of the machines
via the Internet. Toyota Industries also develops, manufactures
and sells such preparatory machinery for weaving as sizing
machines that enable uniform, high-quality sizing of yarns.
Spinning MachineryToyota Industries provides spinning-related machinery such as
high-speed ring spinning frames and roving frames to meet
a vast spectrum of customer needs. These products excel
in spinning high-quality yarns as well as in providing superior
productivity. We also produce and sell drawing frames and
combers.
Toyota Kirloskar Textile Machinery Private Limited, our
subsidiary in India, manufactures ring spinning frames for the
local market.
6Focus onBusiness Textile Ma chin ery

42 Toyota Industries Corporation Annual Report 2006
Manufacture and Quick Delivery of High-Quality Automotive Stamping DiesToyota Industries’ Machinery & Tools Sub-Division handles the
design and manufacture of stamping dies for Toyota Motor
Corporation (TMC), Toyota Industries’ Vehicle Division and
TOYOTA Material Handling Company (TMHC). The sub-division
manufactures and provides quick delivery of top-quality
stamping dies by blending the skills of its experienced
engineers with leading-edge simulation technology.
Moreover, the sub-division is winning high acclaim for its
outstanding capabilities and has received such accolades
as TMC’s “Super” Award for Quality Performance on numerous
occasions.
Expanding manufacturing stamping dies at overseas
Hood panel trim die Rear door outer draw die
locations is also being actively pursued. Addressing the rapid
growth of the Chinese automobile market, Toyota Industries
established Lio Fung Tool & Die (Kunshan) Co., Ltd. (LFTD, in
which Toyota Industries has a 35% stake) as a joint venture
with Taiwan-based Lioho Machine Works, Ltd. LFTD began
operation in April 2004 and currently produces stamping dies
for TOYOTA vehicles manufactured in China as well as for
Toyota Industries’ lift trucks.
By manufacturing these stamping dies, Toyota Industries
is contributing to TMC’s automobile business as well as their
global strategy.
NC machine tool for aluminum parts
Circuit board inspection system with high-resolution line scan camera
Toyota Industries actively produces its own essential
manufacturing equipment such as machining and assembly
equipment. Our Mechatronics Systems Department
manufactures and supplies customized manufacturing
equipment for the Compressor Division, Engine Division, TMHC,
our affi liates and other divisions. The internal production
of manufacturing equipment permits unifi ed product
development and design, quick development and production
times, and facilitates the rapid launch of production lines.
Toyota Industries’ excellent production facilities contribute to
the Toyota Industries Group’s monozukuri (creating things),
serve as a source of competitiveness in each business
and protect against any outfl ow of proprietary production
know-how. The Mechatronics Systems Department is also
entrusted with the crucial role of cultivating human resources
skilled in various production technologies for creating new
manufacturing equipment and deploying these personnel
where needed throughout the Group.
In-House Production of Vital Manufacturing Equipment and Production Technologies to Support Product Competitiveness
7Focus onBusiness Automotive Stamping Dies
8Focus onBusiness Manufacturing Equipment

43Toyota Industries Corporation Annual Report 2006
Exploring Toyota IndustriesToyota Industries’ diverse businesses derive their competitiveness from its
clear-cut management principles and corporate strategy. It also comes
from a fair and unwavering corporate stance, organizational capabilities
that enable strategies to be fi rmly executed, an 80-year tradition and
history, and our high aspirations. These attributes combine to form our
corporate DNA and support the competitive advantage of each of
our businesses. Also shaping Toyota Industries are our vision, systems,
organizational structure and our fulfi llment of responsibilities as a corporate
citizen. On the following pages, we explore the various elements, including
our management and Toyota Industries Group companies, which form the
foundation of Toyota Industries’ efforts to realize its aspirations.
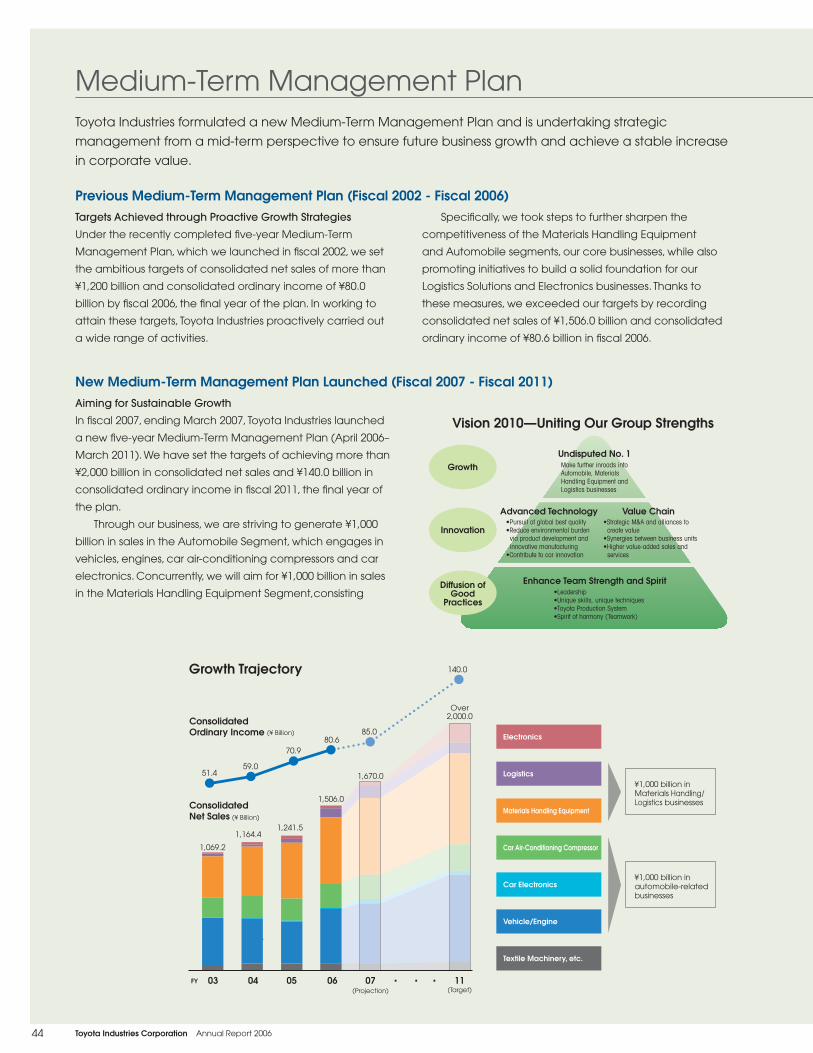
44 Toyota Industries Corporation Annual Report 2006
51.459.0
70.9
85.0Consolidated Ordinary Income
140.0
Over2,000.0
03 04 05 06 07(Projection)
11(Target)
. . .
Electronics
Logistics
Materials Handling Equipment
Car Air-Conditioning Compressor
Car Electronics
Vehicle/Engine
Textile Machinery, etc.
¥1,000 billion in automobile-related businesses
¥1,000 billion in Materials Handling/Logistics businesses
1,069.2
1,164.41,241.5
Consolidated Net Sales
1,506.0
1,670.0
80.6
(¥ Billion)
(¥ Billion)
FY
Medium-Term Management PlanToyota Industries formulated a new Medium-Term Management Plan and is undertaking strategic
management from a mid-term perspective to ensure future business growth and achieve a stable increase
in corporate value.
Diffusion ofGood
Practices
Innovation
GrowthUndisputed No. 1
Advanced Technology Value Chain
Enhance Team Strength and Spirit
•Pursuit of global best quality•Reduce environmental burden
via product development and innovative manufacturing
•Contribute to car innovation
•Strategic M&A and alliances to create value
•Synergies between business units•Higher value-added sales and
services
Make further inroads into Automobile, Materials Handling Equipment and Logistics businesses
•Leadership•Unique skills, unique techniques•Toyota Production System•Spirit of harmony (Teamwork)
Vision 2010—Uniting Our Group Strengths
Growth Trajectory
Aiming for Sustainable Growth
In fi scal 2007, ending March 2007, Toyota Industries launched
a new fi ve-year Medium-Term Management Plan (April 2006–
March 2011). We have set the targets of achieving more than
¥2,000 billion in consolidated net sales and ¥140.0 billion in
consolidated ordinary income in fi scal 2011, the fi nal year of
the plan.
Through our business, we are striving to generate ¥1,000
billion in sales in the Automobile Segment, which engages in
vehicles, engines, car air-conditioning compressors and car
electronics. Concurrently, we will aim for ¥1,000 billion in sales
in the Materials Handling Equipment Segment,consisting
Targets Achieved through Proactive Growth Strategies
Under the recently completed fi ve-year Medium-Term
Management Plan, which we launched in fi scal 2002, we set
the ambitious targets of consolidated net sales of more than
¥1,200 billion and consolidated ordinary income of ¥80.0
billion by fi scal 2006, the fi nal year of the plan. In working to
attain these targets, Toyota Industries proactively carried out
a wide range of activities.
Specifi cally, we took steps to further sharpen the
competitiveness of the Materials Handling Equipment
and Automobile segments, our core businesses, while also
promoting initiatives to build a solid foundation for our
Logistics Solutions and Electronics businesses. Thanks to
these measures, we exceeded our targets by recording
consolidated net sales of ¥1,506.0 billion and consolidated
ordinary income of ¥80.6 billion in fi scal 2006.
Previous Medium-Term Management Plan (Fiscal 2002 - Fiscal 2006)
New Medium-Term Management Plan Launched (Fiscal 2007 - Fiscal 2011)

45Toyota Industries Corporation Annual Report 2006
•Stable growth in the U.S. and European markets
•Expanding markets in BRICs and East European countries
•Heightening awareness toward the environment and safety
•Increasing need to improve logistics efficiency in Japan
•Shift to outsourcing logistics operations at companies
•Rising need for large-scale distribution centers
•Toyota Global 15 (Toyota Motor Corporation’s [TMC] scheme to secure 15% global share in the early 2010s)
•Shift to fuel-efficient vehicles and compact cars
•Toyota Global 15
•Expansion of diesel engines in Europe
•Reassessment of diesel engines in the United States and Japan
•Expansion of hybrid vehicles
•Advancement in electronic in-car devices through technological innovation
•Steady market expansion in Europe and the United States
•Rapid market expansion in China and emerging countries
•Expansion in hybrid vehicles•Commercialization of car air conditioners
using CO2 as refrigerant
•Asia as the primary market
•Although susceptible to economic trends, expanded demand expected as a result of increasing global population and growth in emerging countries
•Securing undisputed global No. 1 position by maximizing synergies under the framework of TMHG
•Annual lift truck sales of 250,000 units (one-third of global market share)
•Growth as one of the core businesses•Establishment of new business models
Toyota Production System (TPS)Establishing platformsM&As, alliances
•Establishing position as a specialized compact car manufacturer
•Global No. 1 in quality, cost and delivery (by contributing to development and pre-production process)
•Top manufacturer of diesel engines in Toyota Group (joint development with TMC)
•Serialize the new generation of clean, quiet and fuel-efficient diesel engines
•Leading manufacturer in power source devices and systems for hybrid vehicles
•Marketing of new electronics products for automobiles
•Aiming for 50% global market share•Expanded sales of electrically driven
compressors and CO2 compressors
•Top share and leading technological edge in air-jet looms
•Growth of air-jet looms as core product•Establishing position to outdistance other
global players
Business Future Market Status in 2010
Vehicle
Engine
Car Electronics
Car Air-Conditioning Compressor
Textile Machinery
Logistics
Materials Handling Equipment
of the Toyota Material Handling Group (TMHG) and Aichi
Corporation, and in the Logistics Segment.
Along with the new plan, the Vision 2010 was formulated,
expressing the desired status of Toyota Industries. With the
cornerstone of our plan being building a spirit of harmony
and fortifying workplace strengths, beginning with human
resources development, we will strive for the highest levels of
quality and execute reforms by developing leading-edge
technologies and strengthening our value chain in order to
realize growth as a company with market-leading businesses.
Solidifying the Strengths of Our Businesses for Sustainable GrowthBy fi scal 2011, we hope to reach our desired status of
each business, which will aim to reinforce the strengths
of each business and fortify the competitiveness of our
core businesses, while accelerating the growth of our new
businesses through measures that include establishing new
business models.
Status in 2010 by Business

46 Toyota Industries Corporation Annual Report 2006
Research and Development
Toyota Industries’ R&D activities can be broadly classifi ed into
the two areas of product development and improvements
performed independently within each business division and
R&D undertaken mainly by the Research & Development
Center. The latter is conducted separate from the activities
of the business divisions and carried out with a view toward
Company-wide management strategy.
Toyota Industries is active in a variety of business domains,
and each of its divisions possesses its own distinctive
technological strengths, core technologies and market
characteristics. Instrumental to effi ciently developing
new products matched to customer needs, the technical
departments of each division must lead the way in product
improvement, technology development and applied
research. For this purpose, each division maintains its own staff
of engineers, experiment facilities and research laboratories
and engages in proactive technology development efforts
guided by product development plans.
The Research & Development Center is involved in R&D
in such technology fi elds as materials fi elds that serve as a
common foundation for all divisions as well as R&D in new
fi elds that include leading-edge technologies. In accordance
with specifi c research themes, we also collaborate with
Toyota Central Research & Development Laboratories, Inc.,
an R&D facility of the Toyota Group involved in basic research,
as well as with universities and other outside R&D institutions.
The Research & Development Center, situated within the
Corporate Center (corporate headquarters), handles the
promotion of Company-wide new business development and
technology management. To enhance the effi ciency of our
Company-wide R&D structure, the center facilitates lateral
transfers of technologies among divisions that span various
domains and investigates new technology development
themes. At the same time, the center promotes the systematic
and continuous creation of new products and services that
will serve as pillars of future business utilizing the extensive
accumulated technological know-how and external networks
(both human and information) of each business division.
Functioning as a development base for our information
systems, our “e-Lab” IT research laboratory is engaged in
R&D activities in various IT-related fi elds. This laboratory’s
activities include research on digital simulation technologies
for shortening product development times and reducing
lead-times from development to production and shipping.
Also, the lab engages in the development of an optimal
network system for joint development of parts with suppliers
as well as for parts procurement.
In fi scal 2006, R&D expenditures totaled ¥31.2 billion,
up ¥1.1 million (3.7%) from the previous fi scal year. R&D
expenditures accounted for 2.1% of consolidated net sales, a
decline of 0.3 percentage point. By segment, R&D expenses
amounted to ¥16.6 billion in the Automobile Segment, ¥12.9
billion in the Materials Handling Equipment Segment, ¥731
million in the Textile Machinery Segment and ¥1.0 billion in the
Others Segment.
In keeping with its founding spirit of “Be ahead of the times through endless creativity, inquisitiveness and
pursuit of improvement,” Toyota Industries carries out strategic research and development (R&D) that aims
not merely at improving short-term business results but also at attaining sustained growth in the future.
Recognizing that R&D activities are essential for maintaining the competitive advantage of the Toyota
Industries Group in the years ahead, we undertake effi cient R&D activities by concentrating the allocation of
management resources in specifi cally targeted fi elds.
e-Lab, Toyota Industries’ development base for in-house information systems

47Toyota Industries Corporation Annual Report 2006
Development of Air-Cooled DC-DC ConverterToyota Industries has developed an air-cooled DC-DC converter that down-converts the high voltage of the main battery—the drive source for hybrid cars—to a lower voltage. The realization of high effi ciencies enables this DC-DC converter to be air-cooled instead of the conventional method of water-cooling, thus allowing greater freedom for positioning within the vehicle. The DC-DC converter is fi tted on the Camry Hybrid that TMC began selling in North America in May 2006.
Development of 150W DC-AC Inverter With the development of a new 150W AC inverter, we have expanded our lineup of DC-AC inverters that convert currents used in vehicles to the same voltage as household electricity. We began supplying these for the DaimlerChrysler Dodge Caliber in January 2006.
Development of 7SBH17 Externally Controlled One-Way Swash-Plate Variable-Displacement Compressor for the TOYOTA EstimaToyota Industries began supplying an upgraded externally controlled one-way swash-plate variable-displacement compressor* for the TOYOTA Estima, which underwent a full model change in January 2006.
New Products Developed and Launched in Fiscal 2006
Automobile Segment [Car Air-Conditioning Compressors]
Automobile Segment [Car Electronics]
Materials Handling Equipment Segment
Development of Fuel-Cell Lift TruckToyota Industries developed the TOYOTA FCHV-F fuel-cell lift truck that incorporates a fuel-cell hybrid system jointly developed with Toyota Motor Corporation (TMC). Toyota Industries exhibited the lift truck at CeMAT 2005, an international trade fair for intralogistics held in Hannover, Germany, in October 2005. By collaborating with TMC in the use of leading-edge technologies and components for automobiles, we will continue to aim for the further development of high-performance, low-cost fuel-cell systems and plan to carry out mass production of such systems.
Full Model Change for Compact Electric Tow TractorsToyota Industries introduced the new Tugnova (CBT/CBTY) series of electric tow tractors (2- to 4-ton towing capacity) into the Japanese and overseas markets in March 2006 after a full model change. Addressing the recent trend toward small-lot logistics, the Tugnova series is Toyota Industries’ fi rst compact electric tow tractors to be fi tted with an AC drive system, featuring superior operability and lower maintenance costs. Additionally, this series offers the highest levels of safety, operability and economical operation that includes excellent safety features, a compact design to enable superior tight turning and an extended battery life with a larger capacity for longer operation.
TOYOTA FCHV-F Tugnova (CBT)
* Externally controlled variable-displacement compressors send signals about interior temperature, external temperature and revolution to the control valve. This highly precise displacement control allows compressors to operate at optimal displacement, thereby enabling large improvements in fuel economy.
These compressors offer enhanced effi ciency and increased cooling capabilities compared with previous externally controlled variable-displacement compressors.
7SBH17
150W DC-AC Inverter Air-Cooled DC-DC Converter

48 Toyota Industries Corporation Annual Report 2006
Reforming the Management SystemEffective June 22, 2006, we reformed our management system
by streamlining the Board of Directors and newly creating the
position of managing offi cer. To ensure quick decision-making
amid intensifying global competition, we reduced the
number of Board members from 30 to 17. At the same time,
we adopted the Managing Offi cer System to ensure speedy
operational execution. Managing offi cers are non-Board
members, who are appointed for a one-year term, tasked
with the operational execution of respective businesses of
which they are in charge.
Information DisclosureToyota Industries considers it an important element of
corporate governance to disclose corporate and fi nancial
information, and accordingly, strives for strict accountability
to shareholders and investors. Starting from fi scal 2004, we
have been publishing quarterly fi nancial statements. In 2005,
Toyota Industries set up the Information Disclosure Committee
to monitor the completeness, appropriateness and timeliness
of important information disclosed in fi nancial statements
and other materials. Pertinent information is also promptly
disclosed to the public through the Investor Relations section
of our Web site and other media channels.
Toyota Industries’ Management SystemToyota Industries’ Board of Directors, Management Council,
Management Committee and Business Operation Committee
work to ensure prompt decision-making on matters with a
major infl uence on shareholders’ interests and on crucial
issues affecting business operations. The Board of Directors
generally convenes once a month to discuss and resolve
crucial management matters, such as those necessitated by
law. As of June 22, 2006, the Board of Directors consisted of 17
directors, including one external director.
Based on Japan’s Commercial Code, Toyota Industries has
chosen to maintain the traditional “Corporate Auditor/Board
of Corporate Auditors” system. With a long history in Japan,
a Board of Corporate Auditors is a body that is completely
independent from the management of a company and
functions in parallel with the Board of Directors. Toyota
Industries believes this auditing system adequately ensures
the proper execution of duties by the Board of Directors.
As of June 22, 2006, Toyota Industries’ Board of Corporate
Auditors consisted of fi ve corporate auditors, with two
standing corporate auditors and three outside corporate
auditors. Appointed at the Shareholders’ Meeting, the
corporate auditors’ primary duties encompass auditing
of business operations and accounting activities. An audit
of business operations determines whether directors are
stringently adhering to ordinances and the articles of
incorporation in the execution of their duties. An audit
of fi nances involves the oversight of business results and
a variety of fi nancial-related activities. In addition, the
corporate auditors have the authority to inspect relevant
documents, make auditing visits to headquarters, business
divisions and subsidiaries and conduct investigations fi rsthand.
The Corporate Auditor’s Offi ce at Toyota Industries has been
staffed with specialist personnel who facilitate the proper
execution of the corporate auditors’ duties.
Corporate GovernanceToyota Industries believes that achieving a stable increase in corporate value over the long term and
maintaining the trust of society are crucial management issues. Therefore, we consider it imperative to build
good relationships with such stakeholders as shareholders, customers, business partners, local communities
and employees based on our determination to contribute to the enrichment of society through our business
activities.
In accordance with these objectives, we are striving to maintain and enhance management effi ciency
as well as the fairness and transparency of our corporate activities. To that end, we are aiming to improve our
corporate governance through measures that include strengthening management monitoring and ensuring
timely information disclosure, while building a governance system that can respond quickly and fl exibly to
changes in the business environment.
Investor relations section of Toyota Industries’ Web site

49Toyota Industries Corporation Annual Report 2006
Corporate Governance Structure of Toyota Industries Corporation
With the exception of matters resolved at the Shareholders’ Meeting, the Board of Directors discusses and decides all important management matters. Toyota Industries has also independently set up the Management Council, Management Committee and Business Operation Committee to increase effi ciency and the speed of management and decision-making as well as facilitate appropriate judgment. By deliberating on important matters
related to management strategies and individual businesses, these bodies assist top management and the Board of Directors in appropriate decision-making. Among the issues deliberated on by the Management Council, Management Committee and Business Operation Committee, the crucial issues prescribed in Japan’s Commercial Code are put forth for discussion by the Board of Directors.
Board of Directors17 directors
(including 1 external director)
Shareholders' Meeting
Appointment/Dismissal Appointment/
Monitoring
Appointment/Dismissal
Reporting
Reporting
Reporting
Reporting
Reporting
Reporting
Reporting
Appointment/Monitoring
Board of Corporate Auditors5 auditors
(including 3 external auditors)
Monitoring
Monitoring
Corporate Auditor’s Office
Monitoring/Reporting
Independent Auditors
Accountingaudit
PresidentDirectives
Directives
Directives Directives Directives
Directives
ManagementCommittee
(Deliberates onimportant matters from
management's perspective)
Discussing/Reporting
ManagementCouncil
(Reports on execution of business operations)
Discussing/Reporting
Business OperationCommittee
(Follows up on execution of business operations)
Reporting
Committees* Audit Office
Internal audits
Directors/Managing Officers
Business Divisions & In-House Company
Management CouncilDirectors and managing offi cers convene to share reports on the status of operations of each business.
Management CommitteeThe Management Committee deliberates on crucial matters related to all areas of management, including Company-wide strategy and allocation of management resources. The committee consists of directors above the executive vice president level. When the president considers it necessary, relevant other directors and managers also attend committee meetings.
Business Operation CommitteeThe Business Operation Committee deliberates on crucial matters related to each business segment. The president, directors in charge of corporate planning and directors assigned to oversee divisional operations (division managers, etc.) attend committee meetings.
Export Transaction Control Committee
Environmental Committee
Stock Option Committee
Compliance Subcommittee
Data Security Subcommittee
Crisis Response Subcommittee
Regional Society Contribution Subcommittee
Corporate Code of Conduct Committee
* Major Committees

50 Toyota Industries Corporation Annual Report 2006
Strengthening ComplianceToyota Industries believes that compliance extends beyond
adherence to laws and ordinances to also include respecting
local cultures and customs in step with changes in the times.
The Corporate Code of Conduct Committee plays a central
role in strengthening our compliance systems and frameworks
while stipulating conduct guidelines and thoroughly informing
all employees of these guidelines via education activities.
Additionally, Toyota Industries is reinforcing compliance
systems at domestic and overseas subsidiaries, while its
Purchasing Department closely monitors suppliers to ensure
their compliance as well.
With Toyota Industries’ president serving as chairman,
the Corporate Code of Conduct Committee is tasked with
controlling the Group’s corporate activities in areas related
to compliance and crisis response. Consisting of most
directors, corporate auditors and managing offi cers, the
committee convenes several times per year to confi rm the
status of any crucial problems that may have arisen as well as
countermeasures and responses to be taken. The committee
also deliberates on initiatives to be taken in the next fi scal
year.
Under the jurisdiction of the Corporate Code of Conduct
Committee, we designated a number of departments as
legal compliance departments, which monitor laws and
ordinance for ensuring thorough Company-wide compliance.
We also set up the Compliance Subcommittee and the
Data Security Subcommittee. Chaired by a director, these
subcommittees consist of members selected from relevant
divisions and departments, and in principle, convene
monthly while undertaking activities in accordance with their
respective plans.
The Audit Offi ce and designated legal compliance
departments cooperate in implementing compliance audits
of each department and domestic and overseas subsidiaries.
We also implement Company-wide employee education
programs according to the level of employees’ positions and
fi elds of specialization, while the designated legal compliance
departments handles education of persons in charge of
related departments. In addition, we undertake various
enlightenment activities to raise employee compliance
awareness levels.
Corporate Governance
Basic Philosophy
Respect for the LawToyota Industries is determined to comply with the letter and spirit of the law, in Japan and overseas, and to be fair and transparent in all its dealings.
Respect for OthersToyota Industries is respectful of the people, culture and traditions of each region and country in which it operates. It also works to promote economic growth and prosperity in those regions and countries.
Respect for the Natural EnvironmentToyota Industries believes that economic growth and conservation of the natural environment are compatible. It strives to offer products and services that are clean, safe and of high quality.
Respect for CustomersToyota Industries conducts intensive product research and forward-looking development activities to create new value for its customers.
Respect for EmployeesToyota Industries strives to nurture the inventiveness and other abilities of its employees. It seeks to create a climate of cooperation, so that both employees and the Company can realize their full potential.
The following is a statement of Toyota Industries’ basic philosophy. This basic philosophy constitutes the expressly stated beliefs of the management and serves as a guide for corporate behavior.
Five ValuesWe also have Five Values that form an action guide for our employees to enforce our basic philosophy.
Global PerspectiveLearning from the best in the world, we aim to become the best in the world.
Customer FirstWe forge partnerships with our customers and strive to exceed their expectations.
Welcoming New ChallengesUnbound by convention, we embrace the challenge of creation.
Encouraging Professional ExcellenceWe develop our strengths, and think and act responsibly.
Encouraging Effective TeamworkWe recognize the human worth of each individual and collaborate to achieve goals.
The Toyoda Precepts*1. Be a contributor to the development and welfare of the
country by working together, regardless of position, in faithfully fulfi lling your duties.
2. Be ahead of the times through endless creativity, inquisitiveness and pursuit of improvement.
3. Be practical and avoid frivolity.
4. Be kind and generous; strive to create a warm, homelike atmosphere.
5. Be reverent, and show gratitude for things great and small in thought and deed.
* The Toyoda Precepts were assembled in 1935 to commemorate the six-year passing of company founder Sakichi Toyoda. Since then, the precepts have served as the basis of the thinking and guiding principles of the entire Toyota Group.

51Toyota Industries Corporation Annual Report 2006
Global Vision
Harmony
Improvement Responsibility
SustainableManagement
Collaborate with local communities and global society in addressing
environmental protection.
Improve eco-effi ciency for all our business activities, products and services.
Fulfi ll our social responsibility of environmental
protection.
Environmental and Social Contribution Efforts
In order to help protect the environment while contributing
to global economic development and the enrichment of
society, Toyota Industries has continually strengthened its
Group-wide environmental activities. As examples of these
efforts, in January 2003 we unveiled the Toyota Industries
Group Corporate Commitment to the Environment,
which articulated the Group’s basic policies toward the
environment. Since then, we have worked vigorously to
promote the sharing of a unifi ed environmental awareness
among subsidiaries around the world and directed each
Toyota Industries recognizes that being a good corporate citizen entails far-reaching responsibilities to
the environment as well as to the local communities in which we operate. Accordingly, we undertake
independent environmental activities that include reducing CO2 emissions and other substances, promoting
recycling and obtaining ISO 14001 certifi cation at our facilities. At the same time, Toyota Industries also
believes in giving back to society, and as such, promotes employees’ volunteer efforts and interaction with
local communities.
Group company to establish an environmental management
system. At the same time, every month we have collected
environmental data based on uniform criteria from our Group
production companies and monitored the progress of the
Group’s overall environmental management. Consequently,
amid evolving social circumstances, the vital issues requiring
responses from the Toyota Industries Group became
evident. For that reason, in July 2005 we revised the Toyota
Industries Group Corporate Commitment to the Environment
and renamed it the Global Environmental Commitment,
Environmental Protection Activities
•The Toyota Industries Group will continue to set challenging
targets aimed at further reducing the environmental
impact of its business activities, listening carefully to the
voices of its stakeholders, and acting in compliance with
the letter and spirit of laws and regulations.
Global Environmental CommitmentThe Toyota Industries Group will contribute to a balance between environmental protection and economic growth in its
wide-ranging businesses.
•The Toyota Industries Group plans to improve its
environmental management, placing environmental
activities among its highest priorities. In particular, Toyota
Industries will give priority to the following items.
Curb global warming— Aiming to reduce energy
consumption and the output of greenhouse gases
through the entire lifecycle of its products, services and
production activities
Use resources more effi ciently— Utilizing raw materials,
water and other resources effi ciently while working to
reduce, reuse and recycle waste products
Reduce environmental risk factors— Reducing the use and
output of harmful chemical substances of concern while
evaluating environmental risk factors at the planning
stage of business activity in order to prevent pollution
•The Toyota Industries Group will aim to foster greater
communication and teamwork within a wide range of
partnerships, including those with customers and suppliers,
in order to promote sustainable management of the
environment. In addition, the Toyota Industries Group will
act as an upstanding corporate citizen, taking an active
part in the planning of activities that contribute to various
regional communities as well as to our global society.
Basic Policies

52 Toyota Industries Corporation Annual Report 2006
EuropeManufacturing companies: 6Sales companies: 5Other: 1
Total: 12
AsiaManufacturing companies: 4Sales companies: 1Other: 1
Total: 6
JapanToyota Industries Corporation (non-consolidated): 11 basesManufacturing companies: 18Sales companies: 41Other: 14
Total: 73
Note: Toyota Industries determined the scope of Group-wide environmental management companies by considering the characteristics of each of its subsidiaries and affiliates. Consequently, the scope of consolidation for environmental management companies is different from the scope of consolidation based on financial definition.
AustraliaSales companies: 1
South AmericaSales companies: 1
North AmericaManufacturing companies: 8Sales companies: 3Other: 1
Total: 12
the environmental impact of all our business activities. We
also formulated and implemented the Third Environmental
Action Plan, which ran from fi scal 2002 through fi scal 2006,
and successfully attained the plan’s targets for the Company
on a non-consolidated basis in all categories (for detailed
information, please refer to our Social & Environmental
Report). To further promote our environmental activities,
in October 2005 we formulated the Fourth Environmental
Action Plan to be implemented from fi scal 2007 through
fi scal 2011. Aimed at further strengthening Group-wide
environmental management, the Fourth Environmental
Action Plan establishes activity policies and targets covering
the entire Toyota Industries Group in Japan and overseas,
with the overall objective of reducing the environmental
load throughout the entire product lifecycle as well as in
production activities.
Environmental and Social Contribution Efforts
which embodies policies shared by all consolidated
Group companies, as we further bolster our Group-wide
environmental management.
Environmental Management Systems and the Fourth Environmental Action PlanSince 1996, Toyota Industries has been striving to enhance
its environmental activities by improving its environmental
management system. In line with these efforts, we acquired
ISO 14001 certifi cation for all eight of the Company’s
non-consolidated production bases in Japan by March
2003. From fi scal 2002, Toyota Industries expanded the
scope of sections securing ISO 14001 certifi cation beyond
manufacturing sections to include product development,
management and service sections. Furthermore, in response
to the revision of ISO 14001 in November 2004, we have been
strengthening initiatives to reduce the indirect environmental
impact of our operations.
In our efforts to further improve the effectiveness of
our environmental management system, in fi scal 2005 we
promoted measures that included on-site verifi cation and
evaluation of the status of implementation of environmental
management systems at domestic manufacturing subsidiaries
and instructed the management to make any necessary
improvements. Our environmental management system also
extends to reducing the environmental load throughout the
entire product lifecycle and within our supply chain.
Further demonstrating our commitment to addressing
various environmental issues, we also established the
Environmental Committee, chaired by the president and
composed of four specialized subcommittees. Recognizing
the importance of taking a Group-wide approach to
environmental protection, in fi scal 2001 we introduced
consolidated environmental management to ascertain
Scope of Group-Wide Environmental Management (As of March 31, 2006)
Key Points of the Fourth Environmental Action Plan(1) Expanding our lineup of ecological productsStrengthen development and sales of environment-friendly products that help protect the environment during the usage stage in which a product exerts the greatest environmental impact, with these efforts covering the entire product lifecycle.(2) Reducing emissions of greenhouse gasesActively promote measures to tackle global warming.(3) Using resources more effi cientlyPromote a reduction in resource loss, bearing in mind the sharp rises in raw material costs caused by energy and other resource problems.(4) Reducing environmental risk factorsUpgrade chemical substance monitoring and curb emissions of environment-impacting substances, thereby reducing environmental risk factors, preventing the incurrence of costs arising from damage claims and preventing a loss of trust by society.(5) Augmenting consolidated environmental managementBe aware of the Group-wide trend toward increased environmental impact accompanying an expansion in production by the Group’s consolidated companies.

53Toyota Industries Corporation Annual Report 2006
Support for the Special OlympicsToyota Industries supports the activities of the Special
Olympics Nippon Aichi. The Special Olympics is an
international organization that provides persons with
intellectual disabilities with opportunities for daily training in
sports and for displaying their training results at year-round
athletic competitions. In accordance with the primary mission
of its activities, we make our athletic grounds, gymnasiums
and other facilities available for use at these competitions, as
well as provide donations to Special Olympics and support its
activities and events.
In March 2006, 23 athletes from Toyota Industries’ women’s
softball club participated in the Special Olympics Nippon
Aichi-sponsored Sports Experience Caravan as support staff,
providing more than
100 participants
with instruction
on catching
and batting, and
thereby showing
participants the fun
of softball.
Communications on Environmental Protection and Social Contribution ActivitiesToyota Industries publishes the Social & Environmental Report,
which summarizes the initiatives and achievements of our
environmental protection and social contribution activities.
To obtain a copy of this report, please see the contact
information listed on the last page of this annual report.
The contents of the Social & Environmental Report, along
with the recent details of our environmental protection
and social contribution activities, are also available on
our Web site (www.toyota-industries.com). Through utilizing
such communication tools, Toyota Industries will proactively
continue to disclose information to stakeholders about the
ways in which we fulfi ll our social responsibilities.
Toyota Industries actively promotes support activities that
contribute to society by providing human resources, facilities
and fi nancial resources. Toyota Industries’ employees also
make self-initiated efforts to serve the community via such
means as volunteer activities.
At present, Toyota Industries and its global subsidiaries are
undertaking social contribution activities that are self-initiated
by local bases and tailored to each community. To carry out
balanced Group social contribution activities as our business
operations become even more globalized, Toyota Industries
established the Corporate Citizenship Subcommittee in fi scal
2006 and has begun devising medium-term initiatives for our
social contributions.
Participating in the Management of the Toyota Commemorative Museum of Industry and TechnologyFounded jointly by 13 Toyota Group companies, the Toyota
Commemorative Museum of Industry and Technology strives
to promote an understanding by young people about the
“spirit of research and creation” and the importance and
pleasure of monozukuri (creating things). The museum also
aims to preserve and utilize the museum building, designated
as an important urban landmark building by Nagoya City, as
a historic industrial site.
Toyota Industries provides the museum with human
resources, funds to cover operating costs and articles
for exhibit, while also participating in the museum’s
management.
Social Contribution Activities
Athletes from Toyota Industries’ women’s softball club instructing participants at the Sports Experience Caravan
Circular loom invented by Sakichi Toyoda on display at the entrance of the Toyota Commemorative Museum
of Industry and Technology
Toyota Commemorative Museum of Industry and Technology
Social & Environmental Reports

54 Toyota Industries Corporation Annual Report 2006
FounderSakichi Toyoda
1924Toyoda Automatic Loom Type G invented by Sakichi Toyoda.
1926Toyoda Au to mat ic Loom Works, Ltd. (now Toyota Industries Cor po ra tion) es tab lished to man u fac ture and market automatic looms in vent ed by Sakichi Toyoda.
1929Spinning frame production starts.
Automatic loom patent sold to Platt Brothers & Co., Ltd. of the U.K.
1933Automobile Division set up.
1934A-type automobile engine completed.
1935Prototype of Model A1 passenger car completed.
Company unveils Model G1 truck at a new-car-release exhibition in Shibaura, Tokyo.
1937Automobile Division separates and be comes Toyota Motor Co., Ltd. (now Toyota Motor Corporation).
1940Steel Production Division separates and becomes Toyoda Steel Works, Ltd. (now Aichi Steel Corporation).
1944Obu Plant starts operations, producing castings.
1949Company stock listed on Tokyo, Osaka and Nagoya stock exchanges.
19746P compressor production starts.
1977Swash-plate compressor technology licensed to Chrysler and Ford.
Compressor Division separates from Textile Machinery Division.
1978Starlet (automobile) production starts.
Aerial lift equipment production starts.
1980JA air-jet loom production starts.
198110P compressor production starts.
1982Production starts on C-type diesel engines for small passenger cars.
Hekinan Plant starts operations, producing automobile diesel engines.
1985Engine Division separates from Vehicle Division.
10PA com pres sor production starts.
1986Company awarded the Deming Prize for quality control implementation.
X300 series lift truck production starts.
1987Sprint er Cielo (ex port ed as the Corolla Lift Back) production starts.
Electronics Sub-Division set up.
1988Toyota Industrial Equipment Mfg., Inc. (TIEM) established in Columbus, In di ana, U.S., as a joint ven ture with Toyota Motor Corporation.
RX100 ring spinning frame production starts.
1989Michigan Automotive Compressor, Inc. (MACI) established in Jackson, Michigan, U.S., as a joint venture with DENSO Corporation.
1952Automobile engine (S-type gasoline engine) production starts.
1953Kyowa Plant starts operations, producing engines and assembling automobiles.
1955Vehicle Division set up.
1956Lift truck production starts.
1959P-type gasoline engine production starts.
1960Shovel loader production starts.
Car air-conditioning compressor (CC3A type, CC3B type) production starts.
1963Dump truck production starts.
Friction welder pro duc tion starts.
1964J-type diesel engine production starts.
1967Nagakusa Plant starts operations, producing small commercial vehicles.
Publica (van) and Mini Ace (automobile) production starts.
Electric coun ter bal anced lift truck production starts.
1968Open-end spinning machine production starts.
1970Takahama Plant starts operations, producing industrial vehicles.
1971Corolla (van) production starts.
Divisional organization system introduced (3 divisions: Textile Machinery, Industrial Vehicle and Vehicle).
Toyoda-Sulzer Manufacturing Ltd. established as a joint venture with Sulzer Brothers, Ltd. of Switzerland to produce projectile looms.
Sakichi Toyoda was born in
Shizuoka Prefecture, Japan,
in 1867. He became an
inventor while still in his teens
and devoted his life to the
study and development of
textile machinery. Starting
with a wooden handloom,
he sub se quent ly pioneered a
new era in textile machinery
with in ven tions that included
Japan’s fi rst power loom,
the circular loom and the
Toyoda Automatic Loom
Type G. Sakichi was awarded
84 patents and 35 utility
models in his lifetime and is
remembered with pride in
Japan as one of the world’s
greatest inventors. We at
Toyota Industries are proud to
carry on the engineering spirit
of our illustrious founder.
Foundation – 1980s
Deming Prize
Toyota In dus tries’ 80 Years of History
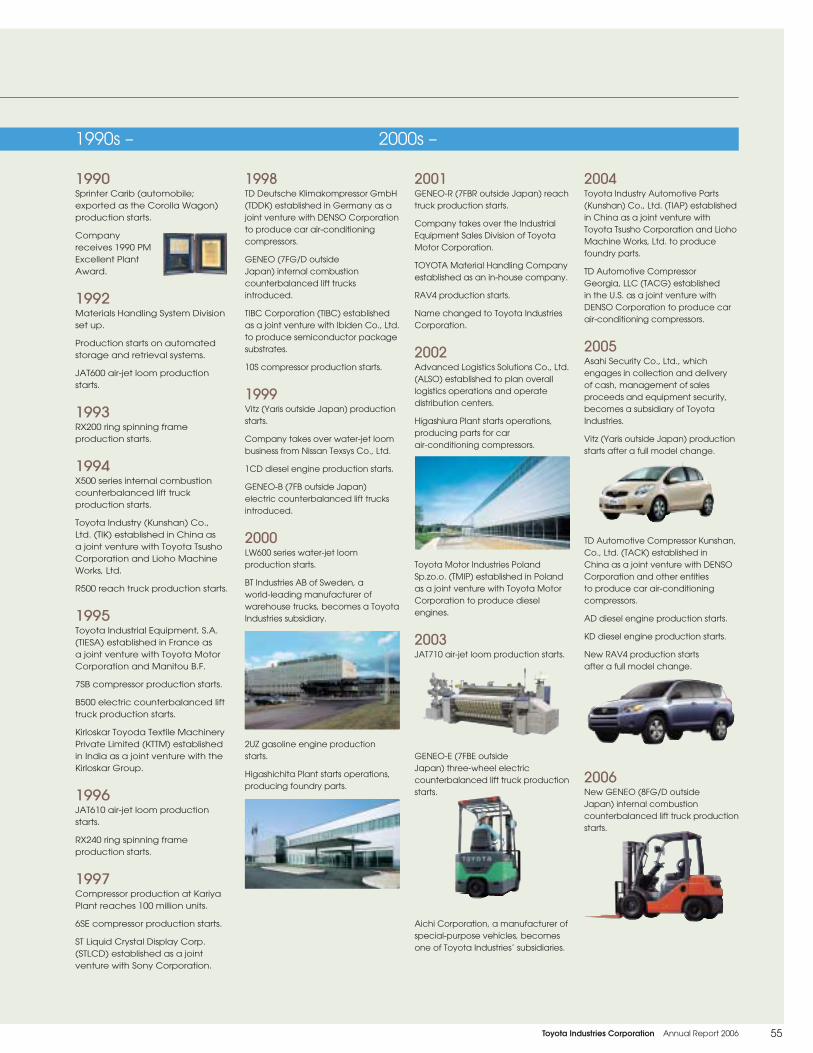
55Toyota Industries Corporation Annual Report 2006
1998TD Deutsche Klimakompressor GmbH (TDDK) established in Germany as a joint venture with DENSO Cor po ra tion to produce car air-con di tion ing com pres sors.
GENEO (7FG/D outside Japan) internal combustion counterbalanced lift trucks introduced.
TIBC Corporation (TIBC) established as a joint venture with Ibiden Co., Ltd. to produce semiconductor package substrates.
10S compressor production starts.
1999Vitz (Yaris outside Japan) pro duc tion starts.
Com pa ny takes over water-jet loom business from Nissan Texsys Co., Ltd.
1CD diesel engine production starts.
GENEO-B (7FB outside Japan) electric counterbalanced lift trucks introduced.
2000LW600 series water-jet loom pro duc tion starts.
BT Industries AB of Sweden, a world-leading manufacturer of warehouse trucks, becomes a Toyota Industries subsidiary.
2UZ gasoline engine production starts.
Higashichita Plant starts operations, producing foundry parts.
1990Sprinter Carib (automobile; exported as the Corolla Wagon) production starts.
Company receives 1990 PM Excellent Plant Award.
1992Materials Handling System Division set up.
Production starts on au to mat ed storage and retrieval sys tems.
JAT600 air-jet loom production starts.
1993RX200 ring spinning frame production starts.
1994X500 series internal combustion coun ter bal anced lift truck production starts.
Toyota Industry (Kunshan) Co., Ltd. (TIK) established in China as a joint venture with Toyota Tsusho Corporation and Lioho Machine Works, Ltd.
R500 reach truck production starts.
1995Toyota Industrial Equipment, S.A. (TIESA) established in France as a joint venture with Toyota Motor Corporation and Manitou B.F.
7SB compressor production starts.
B500 electric counterbalanced lift truck production starts.
Kirloskar Toyoda Textile Machinery Private Limited (KTTM) established in India as a joint venture with the Kirloskar Group.
1996JAT610 air-jet loom production starts.
RX240 ring spinning frame production starts.
1997Compressor production at Kariya Plant reaches 100 million units.
6SE compressor production starts.
ST Liquid Crystal Display Corp. (STLCD) established as a joint venture with Sony Corporation.
2001GENEO-R (7FBR outside Japan) reach truck production starts.
Company takes over the Industrial Equipment Sales Division of Toyota Motor Corporation.
TOYOTA Material Handling Company established as an in-house company.
RAV4 production starts.
Name changed to Toyota Industries Corporation.
2002Advanced Logistics Solutions Co., Ltd. (ALSO) es tab lished to plan overall logistics operations and operate dis tri bu tion centers.
Higashiura Plant starts operations, producing parts for car air-con di tion ing compressors.
Toyota Motor Industries Poland Sp.zo.o. (TMIP) established in Poland as a joint venture with Toyota Motor Corporation to produce diesel engines.
2003JAT710 air-jet loom pro duc tion starts.
GENEO-E (7FBE outside Japan) three-wheel electric coun ter bal anced lift truck production starts.
Aichi Corporation, a manufacturer of special-purpose vehicles, becomes one of Toyota Industries’ subsidiaries.
2004Toyota Industry Automotive Parts (Kunshan) Co., Ltd. (TIAP) established in China as a joint venture with Toyota Tsusho Corporation and Lioho Machine Works, Ltd. to produce foundry parts.
TD Automotive Compressor Georgia, LLC (TACG) established in the U.S. as a joint venture with DENSO Corporation to produce car air-conditioning compressors.
2005Asahi Security Co., Ltd., which engages in collection and delivery of cash, management of sales proceeds and equipment security, becomes a subsidiary of Toyota Industries.
Vitz (Yaris outside Japan) production starts after a full model change.
TD Automotive Compressor Kunshan, Co., Ltd. (TACK) established in China as a joint venture with DENSO Corporation and other entities to produce car air-conditioning compressors.
AD diesel engine production starts.
KD diesel engine production starts.
New RAV4 production starts after a full model change.
2006New GENEO (8FG/D outside Japan) internal combustion counterbalanced lift truck production starts.
1990s – 2000s –
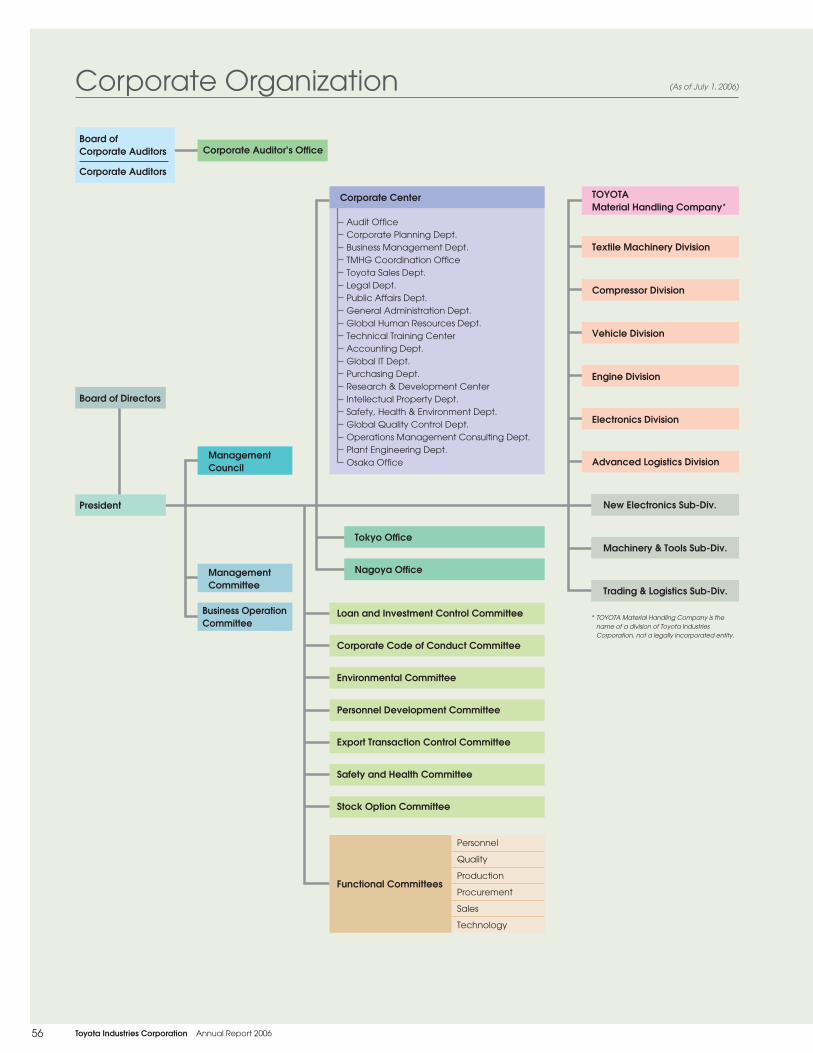
56 Toyota Industries Corporation Annual Report 2006
Corporate Organization (As of July 1, 2006)
Corporate Auditor’s Office
ManagementCommittee
ManagementCouncil
Business OperationCommittee
Board of Directors
President
Board of Corporate Auditors
Corporate Auditors
Machinery & Tools Sub-Div.
New Electronics Sub-Div.
Trading & Logistics Sub-Div.
Advanced Logistics Division
Engine Division
Electronics Division
Vehicle Division
Compressor Division
Textile Machinery Division
* TOYOTA Material Handling Company is the name of a division of Toyota Industries Corporation, not a legally incorporated entity.
Safety and Health Committee
Stock Option Committee
Export Transaction Control Committee
Personnel Development Committee
Environmental Committee
Corporate Code of Conduct Committee
Loan and Investment Control Committee
Nagoya Office
Tokyo Office
Personnel
Quality
Production
Procurement
Sales
Technology
Functional Committees
Audit OfficeCorporate Planning Dept.Business Management Dept.TMHG Coordination OfficeToyota Sales Dept.Legal Dept.Public Affairs Dept.General Administration Dept.Global Human Resources Dept.Technical Training CenterAccounting Dept.Global IT Dept.Purchasing Dept.Research & Development CenterIntellectual Property Dept.Safety, Health & Environment Dept.Global Quality Control Dept.Operations Management Consulting Dept.Plant Engineering Dept.Osaka Office
Corporate Center TOYOTA Material Handling Company*

57Toyota Industries Corporation Annual Report 2006
Senior Managing Directors
Akira Imura Shigetaka Yoshida Masafumi Kato Yasuharu Toyoda Yutaka Murodono
Standing Corporate Auditors
Shigetaka Mitomo Masanori Ito
Corporate Auditors
Hiroshi Okuda Fumio Kawaguchi Katsuaki Watanabe
Corporate Auditors
Board of Directors
Honorary Chair man
Yoshitoshi Toyoda
ChairmanTadashi Ishikawa*
PresidentTetsuro Toyoda*
* Representative Director
Executive Vice PresidentShinjiro Kamimura*
Executive Vice PresidentYoshikatsu Mizuno*
Executive Vice PresidentTatsuo Matsuura*
Directors, Corporate Auditors and Managing Offi cers (As of June 22, 2006)
Managing Offi cers
Director
Tatsuro Toyoda
Kazunori Yoshida Kosaku Yamada Toshiyuki Sekimori Kimpei Mitsuya
Hiroya Kono Kenji Takenaka Satoshi Kaseda Hirofumi Tsuji Yukio Yamakita Takaki Ogawa Kazue Sasaki
Hirotaka Morishita Shinya Furukawa Hironori Ito Akira Onishi Per Zaunders Hiroshi Sakai Eishi Furuta
Tadayoshi Baba Takashi Okubo Norio Sasaki Toshifumi Ogawa Hayato Ikeda Toshifumi Onishi
Executive Vice PresidentNorio Sato*

58 Toyota Industries Corporation Annual Report 2006
Japan Aichi Corporation Group (4 companiess) *1 – – – TIBC Corporation Aichi ¥3,250,000 60.0% Asahi Security Co., Ltd. Tokyo ¥516,360 100.0% TOYOTA L&F Tokyo Co., Ltd. Tokyo ¥350,000 100.0% Logistics Planning Tokyo Co., Ltd. Tokyo ¥10,000 100.0% Altex Co., Ltd. Shizuoka ¥200,000 75.0% Sun River Co., Ltd. Osaka ¥150,000 100.0% Izumi Machine Mfg. Co., Ltd. Aichi ¥150,000 68.8% TOYOTA L&F Keiji Co., Ltd. Kyoto ¥140,000 75.0% Tokyu Co., Ltd. Aichi ¥135,000 63.3% Mino Tokyu Co., Ltd. Gifu ¥18,000 93.4% Advanced Logistics Solutions Co., Ltd. Aichi ¥100,000 100.0% Teion Shokuhin Ryutsu Inc. Tokyo ¥55,000 60.0% Toyoda High System, Incorporated Aichi ¥100,000 90.0% Nishina Industrial Co., Ltd. Nagano ¥100,000 82.0% Suzaka Nishina Industrial Co., Ltd. Nagano ¥50,000 96.8% ALTRAN Corporation Aichi ¥100,000 60.0% KTL Co., Ltd. Tokyo ¥100,000 50.5% TF Logistics Co.,Ltd. Tokyo ¥100,000 51.0% Tokaiseiki Co., Ltd. Shizuoka ¥98,000 92.1% Taikoh Transportation Group (5 Companies)*2 – – – SKE Inc. Aichi ¥80,000 100.0% SK Maintenance Corporation Aichi ¥50,000 70.0% Unica Co., Ltd. Aichi ¥50,000 100.0% Iwama Loom Works, Ltd. Aichi ¥49,920 100.0% Kawamoto System Corporation Aichi ¥47,000 100.0% Nagao Kogyo Co., Ltd. Aichi ¥31,000 100.0% TOYOTA L&F Shizuoka Co., Ltd. Shizuoka ¥30,000 100.0% Hara Corporation Gifu ¥23,193 100.0% Sun Valley Inc. Aichi ¥22,500 100.0% Sun Valley CVS Takaramachi Inc. Aichi ¥3,000 100.0% Mizuho Industry Co., Ltd. Aichi ¥20,000 93.8%
Sun Staff, Inc. Aichi ¥20,000 100.0% ALT Logistics Co., Ltd. Aichi ¥20,000 60.0% Shine’s Inc. Aichi ¥10,000 100.0% Toyota Industries Well Support Corporation Aichi ¥10,000 100.0%
Kariya Plant Textile machinery, car air-conditioning compressors 1,723 1927Obu Plant Parts for car air-conditioning compressors 506 1944Kyowa Plant Electronic equipment, automotive press dies, production facilities, engine parts 890 1953Nagakusa Plant Automobiles 2,238 1967Takahama Plant Lift trucks, materials handling systems 1,566 1970Hekinan Plant Engines for automobiles and industrial equipment 1,505 1982Higashichita Plant Foundry parts, engine parts 665 2001Higashiura Plant Parts for car-airconditioning compressors 120 2002
Number ofEmployees
Major Plants
Consolidated Subsidiaries% of
Voting RightsCapital
(thousands in local currency)Location in JapanCompany Name
(Parent Company)
Start ofOperations
Corporate Data (As of March 31, 2006)

59Toyota Industries Corporation Annual Report 2006
JapanST Liquid Crystal Display Corp. Aichi ¥23,000,000 50.0%Fuji Logistics Co., Ltd. Tokyo ¥2,979,675 26.8%Aichi Corporation Group (1 company) *1 – – –Wanbishi Archives Co., Ltd. Tokyo ¥4,000,000 43.1%
Outside JapanBT Industries Group *4 (16 companies) – – –Aichi Corporation Group (1 company)*1 – – –Toyota Motor Industries Poland Sp.zo.o. Jelcz-Laskowice, Poland PLN500,000 40.0%
Outside JapanToyota Industries Sweden AB *3 Mjölby, Sweden SEK6,652,977 100.0%BT Industries Group *3*4 (65 companies) – – –Toyota Industries Finance International AB *3 Mjölby, Sweden SEK25,000 100.0%Michigan Automotive Compressor, Inc. Parma, Michigan, U.S.A. US$146,000 60.0%Toyota Industries North America, Inc. *5 Schaumburg, Illinois, U.S.A. US$37,900 100.0%Toyota Industrial Equipment Mfg., Inc. *5 Columbus, Indiana, U.S.A. US$60,000 100.0%TD Automotive Compressor Georgia, LLC *5 Jefferson, Georgia, U.S.A. US$78,000 65.0%Toyota Material Handling USA, Inc. *5 Irvine, California, U.S.A. US$12,500 100.0%ACTIS Manufacturing Ltd. LLC *5 Grapevine, Texas, U.S.A. US$2,000 60.0%Toyoda Textile Machinery, Inc. *5 Charlotte, North Carolina, U.S.A. US$1,300 100.0%Toyota-Lift of Los Angeles, Inc. *5 Santa Fe Springs, California, U.S.A. US$1,500 100.0%Toyota Industries Personnel Service of America, Inc. *5 Schaumburg, Illinois, U.S.A. US$100 100.0%Aichi Corporation Group (1 company) *1 – – –Toyota Industry (Kunshan) Co., Ltd. Kunshan, Jiangsu, China US$23,000 70.0%Toyota Industry Automotive Parts (Kunshan) Co., Ltd. Kunshan, Jiangsu, China US$12,500 60.0%TD Automotive Compressor Kunshan Co., Ltd. Kunshan, Jiangsu, China US$6,600 61.0%Toyota Material Handling (Shanghai) Co., Ltd. Shanghai, China US$1,000 70.0%Toyota Industries Trading & Logistics (China) Co., Ltd. Shanghai, China US$1,000 100.0%Kirloskar Toyoda Textile Machinery Private Limited Bangalore, Karnataka, India Rs2,426,200 95.1%TD Deutsche Klimakompressor GmbH Straßgräbchen, Germany EUR20,452 65.0%Toyota Gabelstapler Deutschland GmbH Duisburg, Germany EUR720 100.0%Toyota Industrial Equipment, S.A. Ancenis, France EUR9,000 60.0%Toyota Material Handling Europe NV/SA Brussels, Belgium EUR 62 100.0%Toyota Industrial Equipment Europe, S.A.R.L. Ancenis, France/Brussels, Belgium EUR75 100.0%Toyota Material Handling Belgium SA/NV Temse, Belgium EUR2,000 100.0%Toyota Carrelli Elevatori Italia S.r.l. Bologna, Italy EUR3,249 100.0%Toyota Truck Norge AS Trondheim, Norway NOK110,000 100.0%Toyota Truckutleie Norge AS Trondheim, Norway NOK100 100.0%Toyota Truck Danmark A/S Vejle, Denmark DKK10,000 100.0%Toyota Truckudlejning Danmark A/S Vejle, Denmark DKK500 100.0%Toyota Industrial Equipment (UK) Limited Castleford, West Yorkshire, U.K. GBP48 100.0%Toyota Industrial Equipment (Northern) Limited Castleford, West Yorkshire, U.K. GBP2,043 100.0%Toyota Textile Machinery Europe AG Zurich, Switzerland SFR3,000 100.0%Toyota Maquinas Texteis Brasil Ltda. São Paulo, Brazil US$200 100.0%Toyota Industries Corporation Australia Group *7 (11 companies) Sydney, Australia – –Toyota Industries Mercosur Ltda. São Paulo, Brazil R$26,510 100.0%
*1 Aichi Corporation Group comprises Aichi Corporation, its four subsidiaries and two affi liates. Aichi Corporation is headquartered in Saitama Prefecture and capitalized at ¥10,425 million.Toyota Industries Corporation holds 51.1% of voting rights of Aichi Corporation.
*2 Taikoh Transportation Group comprises Taikoh Transportation Co., Ltd. and its four subsidiaries. Taikoh Transportaion Co., Ltd. Is headquartered in Aichi Prefecture and capitalized at ¥83,985 thousand.Toyota Industries Corporation holds 51.4% of voting rights of Taikoh Transportation Co., Ltd.
*3 Toyota Industries Sweden AB is a holding company which holds a 100% share of BT Industries AB, Toyota Industries Finance International AB and Toyota Material Handling Europe NV/SA.*4 BT Industries Group comprises BT Industries AB, its 64 subsidiaries and 16 affi liates. BT Industries AB is headquartered in Mjölby, Sweden and capitalized at SEK560 million.*5 Toyota Industries North America, Inc. is a holding company that exercises control over Toyota Industrial Equipment Mfg., Inc., Toyota Material Handling USA, Inc., ACTIS Manufacturing Ltd. LLC,
Toyota-Lift of Los Angeles, Inc., Toyoda Textile Machinery, Inc., Toyota Industries Personnel Service of America, Inc. and TD Automotive Compressor Georgia, LLC.*6 Toyota Industries Corporation Australia Group comprises Toyota Industries Corporation Australia Pty Limited and its 10 subsidiaries. Toyota Industries Corporation Australia Pty Limited is headquartered in
Sydney, Australia and capitalized at AUD62.8 million. Toyota Industries Corporation holds 100.0% of voting rights of Toyota Industries Corporation Australia Pty Limited.
Note: ¥−Japanese yen; SEK−Swedish krona; US$−U.S. dollar; EUR−Euro; Rs−Indian rupee; NOK−Norwegian krone; DKK−Danish krone; GBP−British Pound; AUD−Australia dollar; R$−Brazil real; SFR−Swiss franc;PLN−Poland zloty
Affi liates Accounted for by the Equity Method
Capital(thousands in local currency)Location
Capital(thousands in local currency)Location
Company Name
Company Name
% ofVoting Rights
% ofVoting Rights

60 Toyota Industries Corporation Annual Report 2006
Toyota Industries North America, Inc.
Toyota Industrial Equipment Mfg., Inc.
Toyota Material Handling USA, Inc.
Toyota-Lift of Los Angeles, Inc.
Michigan Automotive Compressor, Inc.
TD Automotive Compressor Georgia, LLC
ACTIS Manufacturing, Ltd. LLC
Toyoda Textile Machinery, Inc.
Toyota Industries Personnel Service of America, Inc.
Toyota Industries Mercosur Ltda.
Toyota Maquinas Texteis Brasil Ltda.
Toyota Industries Sweden AB
Toyota Material Handling Europe NV/SA
BT Industries AB*1
Toyota Industrial Equipment, S.A.
Toyota Industrial Equipment Europe, S.A.R.L.*2
Toyota Gabelstapler Deutschland GmbH
Toyota Truck Norge AS
Toyota Truckutleie Norge AS
Toyota Truck Danmark A/S
Toyota Truckudlejning Danmark A/S
Toyota Carrelli Elevatori Italia S.r.l.
Toyota Industrial Equipment (UK) Limited
Toyota Industrial Equipment (Northern) Limited
Toyota Material Handling Belgium SA/NV
TD Deutsche Klimakompressor GmbH
Toyota Textile Machinery Europe AG
Toyota Industries Finance International AB
Toyota Industries Corporation Australia Pty Limited
Toyota Industry (Kunshan) Co., Ltd.
Toyota Industry Automotive Parts (Kunshan) Co., Ltd.
Toyota Material Handling (Shanghai) Co., Ltd.
TD Automatic Compressor Kunshan Co., Ltd.
Kirloskar Toyoda Textile Machinery Private Limited
Toyota Industries Trading & Logistics (China) Co., Ltd.
1
2
3
4
5
6
7
8
9
10
11
12
13
14
15
16
17
7 6
1110
18
19
20
21
22
23
24
26
25
27
29
30
28
31
32
33
22
29
34
Company Name
34
35
Company Name
*1 BT Industries AB has 80 subsidiaries and affiliates (as of March 31, 2006).*2 Toyota Industrial Equipment Europe’s sales and marketing office is located in Brussels, Belgium.
12 14 28
261 9
43
5
28
1918
25
27
1720 21
15 16
13 16
23 24
3532
South America
Europe
Asia & Oceania
North America
31 3330
(As of March 31, 2006)Locations of Major Subsidiaries Outside Japan

61Toyota Industries Corporation Annual Report 2006
Fi nan cial Sec tion
Consolidated Eleven-Year Summary
Management’s Discussion and Analysis of Financial Con di tion and Results of Operations
Consolidated Balance Sheets
Consolidated Statements of Income
Consolidated Statements of Shareholders’ Equity
Consolidated Statements of Cash Flows
Notes to Consolidated Financial Statements
Report of Independent Auditors
62
64
74
76
77
78
79
98
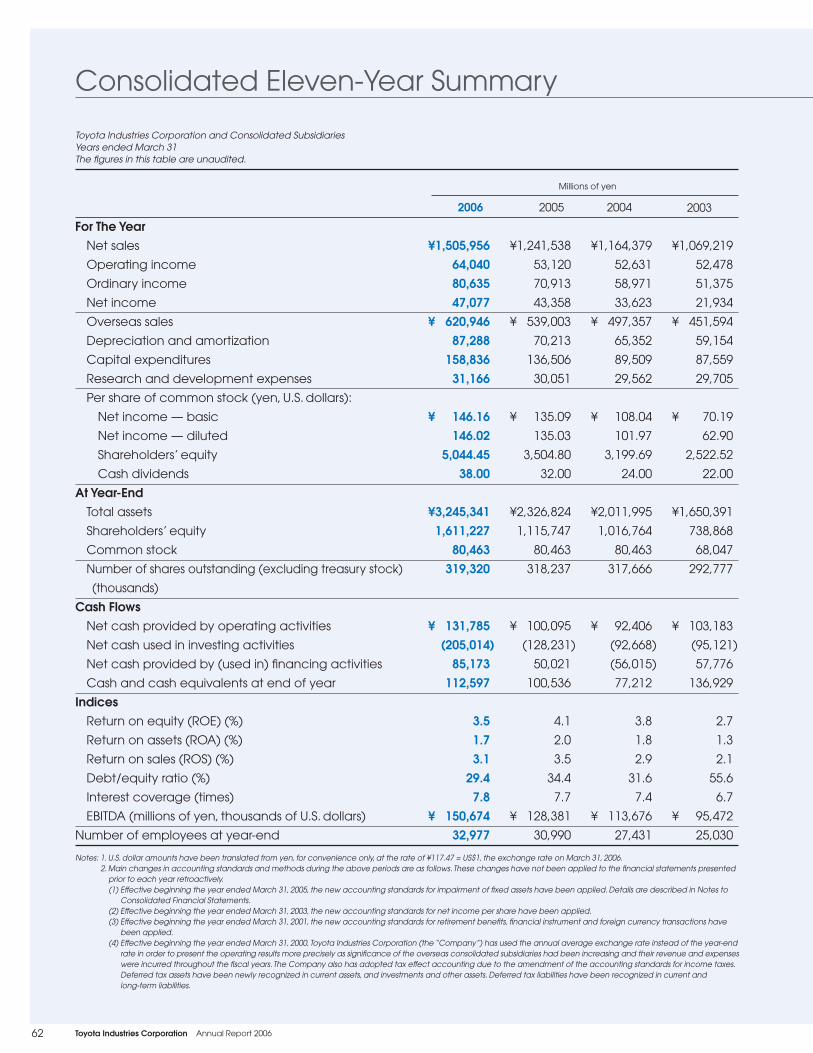
62 Toyota Industries Corporation Annual Report 2006
For The YearNet sales ¥1,505,956 ¥1,241,538 ¥1,164,379 ¥1,069,219
Operating income 64,040 53,120 52,631 52,478
Ordinary income 80,635 70,913 58,971 51,375
Net income 47,077 43,358 33,623 21,934
Overseas sales ¥ 620,946 ¥ 539,003 ¥ 497,357 ¥ 451,594
Depreciation and amortization 87,288 70,213 65,352 59,154
Capital expenditures 158,836 136,506 89,509 87,559
Research and development expenses 31,166 30,051 29,562 29,705
Per share of common stock (yen, U.S. dollars):
Net income — basic ¥ 146.16 ¥ 135.09 ¥ 108.04 ¥ 70.19
Net income — diluted 146.02 135.03 101.97 62.90
Shareholders’ equity 5,044.45 3,504.80 3,199.69 2,522.52
Cash dividends 38.00 32.00 24.00 22.00
At Year-EndTotal assets ¥3,245,341 ¥2,326,824 ¥2,011,995 ¥1,650,391
Shareholders’ equity 1,611,227 1,115,747 1,016,764 738,868
Common stock 80,463 80,463 80,463 68,047
Number of shares outstanding (excluding treasury stock)
(thousands)
319,320 318,237 317,666 292,777
Cash FlowsNet cash provided by operating activities ¥ 131,785 ¥ 100,095 ¥ 92,406 ¥ 103,183
Net cash used in investing activities (205,014) (128,231) (92,668) (95,121)
Net cash provided by (used in) fi nancing activities 85,173 50,021 (56,015) 57,776
Cash and cash equivalents at end of year 112,597 100,536 77,212 136,929
IndicesReturn on equity (ROE) (%) 3.5 4.1 3.8 2.7
Return on assets (ROA) (%) 1.7 2.0 1.8 1.3
Return on sales (ROS) (%) 3.1 3.5 2.9 2.1
Debt/equity ratio (%) 29.4 34.4 31.6 55.6
Interest coverage (times) 7.8 7.7 7.4 6.7
EBITDA (millions of yen, thousands of U.S. dollars) ¥ 150,674 ¥ 128,381 ¥ 113,676 ¥ 95,472
Number of employees at year-end 32,977 30,990 27,431 25,030
Notes: 1. U.S. dollar amounts have been translated from yen, for convenience only, at the rate of ¥117.47 = US$1, the exchange rate on March 31, 2006.2. Main changes in accounting standards and methods during the above periods are as follows. These changes have not been applied to the fi nancial statements presented
prior to each year retroactively.(1) Effective beginning the year ended March 31, 2005, the new accounting standards for impairment of fi xed assets have been applied. Details are described in Notes to
Consolidated Financial Statements.(2) Effective beginning the year ended March 31, 2003, the new accounting standards for net income per share have been applied. (3) Effective beginning the year ended March 31, 2001, the new accounting standards for retirement benefi ts, fi nancial instrument and foreign currency transactions have
been applied.(4) Effective beginning the year ended March 31, 2000, Toyota Industries Corporation (the “Company”) has used the annual average exchange rate instead of the year-end
rate in order to present the operating results more precisely as signifi cance of the overseas consolidated subsidiaries had been increasing and their revenue and expenses were incurred throughout the fi scal years. The Company also has adopted tax effect accounting due to the amendment of the accounting standards for income taxes.Deferred tax assets have been newly recognized in current assets, and investments and other assets. Deferred tax liabilities have been recognized in current and long-term liabilities.
Toyota Industries Corporation and Consolidated SubsidiariesYears ended March 31The fi gures in this table are unaudited.
2005 2004 20032006
Millions of yen
Consolidated Eleven-Year Summary

63Toyota Industries Corporation Annual Report 2006
¥ 980,163 ¥ 767,383 ¥625,773 ¥558,876 ¥572,698 ¥530,851 ¥476,084
46,330 47,304 28,867 24,814 32,729 32,675 19,926
47,866 44,525 27,162 23,172 33,202 31,157 21,560
27,311 22,637 13,686 10,391 20,491 17,931 13,549
¥ 396,470 ¥ 298,794 ¥191,992 ¥178,737 ¥150,417 ¥116,738 ¥119,358
55,174 46,454 42,752 34,380 27,958 28,043 27,240
88,320 127,273 44,746 60,468 62,007 35,408 29,629
29,985 26,196 24,062 23,231 23,112 19,691 18,770
¥ 87.28 ¥ 75.90 ¥ 48.32 ¥ 36.30 ¥ 72.33 ¥ 63.55 ¥ 48.03
78.26 67.77 43.18 32.62 63.48 55.20 47.13
2,809.54 3,036.77 1,116.62 1,063.05 1,056.81 996.18 947.04
19.00 17.00 16.00 16.00 16.00 16.00 13.00
¥1,770,401 ¥1,869,642 ¥685,914 ¥617,071 ¥593,004 ¥556,291 ¥454,503
878,812 951,298 316,293 301,158 304,097 281,154 267,145
68,022 68,019 40,178 40,178 40,133 31,458 31,322
312,796 313,260 283,260 283,296 287,752 282,233 282,083
¥ 81,078 ¥ 78,413 ¥ 68,058 ¥ 44,133 ¥ 50,952 ¥ 51,327 N/A
(106,711) (155,871) (67,187) (96,222) (26,897) (74,968) N/A
1,225 94,472 27,500 24,368 (12,918) 69,081 N/A
71,120 95,297 77,332 49,955 74,303 62,322 N/A
3.0 3.6 4.4 3.4 7.0 6.5 5.2
1.5 1.8 2.1 1.7 3.6 3.6 3.1
2.8 2.9 2.2 1.9 3.6 3.4 2.8
35.9 30.7 60.5 51.6 37.5 46.0 20.4
5.8 9.1 14.5 16.4 17.6 13.0 8.7
¥ 97,540 ¥ 79,921 ¥ 64,681 ¥ 51,033 ¥ 55,212 ¥ 55,548 ¥ 44,830
23,056 21,118 13,132 12,797 11,239 10,738 10,806
(5) Effective beginning the year ended March 31, 1999, the Company has presented consolidated fi nancial statements as follows: In the consolidated statements of income, enterprise taxes, which had been included in selling, general and administrative expenses up to and including the previous year, have been included in income taxes.Amortization of goodwill, which had been classifi ed as a deductible item from income before income taxes until the previous year, has been included in selling, general and administrative expenses. Equity in earnings/losses of affi liates, which had been added to or deducted from income before income taxes until the previous year, has been included in non-operating income or expenses.
3. Net income per share, ROE and ROA are computed based on the average number of shares, shareholders’ equity and total assets, respectively, for each year.4. Debt/equity ratio = Interest-bearing debt / Shareholders’ equity5. Interest coverage = (Operating income + Interest and dividends income) / Interest expenses6. EBITDA = Income before income taxes + Interest expenses - Interest and dividends income + Depreciation and amortization
$12,819,920 545,160 686,431 400,758 $ 5,285,996 743,066 1,352,141 265,310
$ 1.24 1.24 42.94 0.32
$27,626,977 13,716,072 684,966
$ 1,121,861 (1,745,246) 725,062 958,517
$ 1,282,659
Thousands ofU.S. dollars
2006
Millions of yen
2002 2001 2000 1999 1998 1997 1996

64 Toyota Industries Corporation Annual Report 2006
05 06
(¥ Billion)
040302FY
200
400
600
800
Net Sales, Overseas Sales andOverseas Sales Ratio
0
Net sales (left)Overseas sales (left)Overseas sales ratio (right)
10
20
30
40
(%)
70
1,600 80
1,000
1,200
1,400
50
60
0
Result of Operations
Operating PerformanceIn fi scal 2006, the Japanese economy was on a solid recovery track. Private-sector capital investment increased on the back of improved corporate earnings while consumer spending rose as employment conditions improved. The overall economic outlook was also positive overseas, with an expanding U.S. economy and the European economy maintaining their underlying strengths. In Asia, the Chinese economy continued to grow at a brisk pace.
In this environment, Toyota Industries made efforts to strengthen its corporate structure by attempting to ensure customer trust through its dedication to quality, the development of appealing new products, aggressive sales promotions and execution of a Group-wide program to reduce costs. As a result, total consolidated net sales of Toyota Industries amounted to ¥1,506.0 billion, an increase of ¥264.4 billion (21.3%) over fi scal 2005. (For a breakdown of operating results by business segment, refer to Operating Performance Highlights by Business Segment.) At the profi t level, ordinary income amounted to ¥80.6
Management’s Discussion and Anal y sis of Financial Condition and Results of Op er a tions
05 06
(¥ Billion)
040302FY
20
40
60
Ordinary Income andOrdinary Income Ratio
0
100
2
4
6
0
10
80 8
(%)
Ordinary income (left)Ordinary income ratio (right)
The following Management’s Discussion and Analysis of Financial Condition and Results of Operations is based on information known to management as of June 2006. This section contains projections and forward-looking statements that involve risks, uncertainties and assumptions. You should be aware that certain risks and uncertainties could cause the actual results of Toyota Industries Corporation and its consolidated subsidiaries to differ materially from any projections or forward-looking statements. These risks and uncertainties include, but are not limited to, those listed under “Risk Information” and elsewhere in this annual report. The fi scal year ended March 31, 2006 is referred to as fi scal 2006 and other fi scal years are referred to in a corresponding manner. All references to the “Company” herein are to Toyota Industries Corporation; and references to “Toyota Industries,” “Toyota Industries Group” or the “Group” herein are to the Company and its 153 consolidated subsidiaries.

65Toyota Industries Corporation Annual Report 2006
billion, an increase of ¥9.7 billion (13.7%) over fi scal 2005. Despite the effects of a steep rise in crude oil and steel prices, as well as increases in depreciation and personnel expenses, this increase was achieved due largely to an expansion in global sales and Group-wide cost-reduction efforts. Net income amounted to ¥47.1 billion, an increase of ¥3.7 billion (8.6%) over fi scal 2005.
Cost of Sales and Selling, General and Administrative ExpensesCost of sales for fi scal 2006 increased ¥234.7 billion (22.5%) over fi scal 2005 to ¥1,276.5 billion. This increase refl ected increases in depreciation expenses, raw materials prices and personnel expenses in addition to an increase in net sales. Selling, general and administrative expenses increased ¥18.8 billion (12.8%) to ¥165.4 billion, due primarily to increases in personnel, sales promotion and depreciation expenses.
Operating IncomeOperating income for fi scal 2006 increased ¥10.9 billion (20.6%) over fi scal 2005 to ¥64.0 billion, attributable mainly to an increase in sales in Japan and overseas as well as Group-wide cost-reduction activities.
Operating Performance Highlightsby Business SegmentBelow are the operating results by business segment. Net sales for each segment do not include intersegment transactions.
Automobile SegmentIn the automobile industry as a whole, sales in Japan were almost the same as in fi scal 2005. Overseas sales rose over
the same period as a result of increases in the Asian and Latin American markets. Net sales of the Automobile Segment of Toyota Industries totaled ¥746.8 billion, an increase of ¥130.6 billion (21.2%) over fi scal 2005. Within this segment, net sales of the Vehicle Business totaled ¥372.1 billion, an increase of ¥93.3 billion (33.4%) over fi scal 2005. Both the Vitz (Yaris outside Japan) and the RAV4, which underwent a full model change, recorded robust sales. Net sales of the Engine Business totaled ¥132.4 billion, an increase of ¥19.1 billion (16.8%) over fi scal 2005. We proactively augmented our engine production capacity to accommodate an increase in global production of
05 06
2
4
8
14
0040302FY
10
20
630
70
1260
1050
40
Operating Income andOperating Income Ratio
0
(%)(¥ Billion)
Operating income (left) Operating income ratio (right)
800
600
400
200
0
(¥ Billion)
Net Sales of Automobile Segment
0605040302FY
20
10
Operating Income of Automobile Segment
40
30
0
(¥ Billion)
05 06040302FY
(Million Units)
Car Air-ConditioningCompressor Unit Sales
0605040302FY0
20
15
10
5
JapanNorth AmericaEuropeAsia and Oceania

66 Toyota Industries Corporation Annual Report 2006
vehicles by Toyota Motor Corporation (TMC). This measure in turn led to increases in sales of KD diesel engines that started being produced in June 2005 for TMC’s Innovative International Multi-Purpose Vehicle (IMV) Project and AD diesel engines fi tted in the RAV4 for Europe. Net sales of the Car Air-Conditioning Compressor Business totaled ¥216.0 billion, an increase of ¥18.0 billion (9.1%) over fi scal 2005. While sales in the domestic market were approximately the same level as for fi scal 2005, overseas sales increased. TD Automotive Compressor Georgia, LLC (TACG), which was established in the U.S. state of Georgia in July 2004, started production of variable-displacement compressors in December 2005. TD Automotive Compressor Kunshan, Co., Ltd., which was established in China in May 2005, also commenced production of car air-conditioning compressors in April 2006.
Materials Handling Equipment SegmentIn the materials handling equipment industry as a whole, unit sales increased substantially over fi scal 2005. Demand was strong in the Japanese and overseas markets amid a sustained global economic recovery. Within this environment, Toyota Industries strengthened its sales network globally, while promoting vigorous sales promotion activities targeting major clients. Net sales of the Materials Handling Equipment Segment of Toyota Industries totaled ¥595.2 billion, an increase of ¥91.2 billion (18.1%) over fi scal 2005. In Japan, unit sales of TOYOTA-brand electric counterbalanced lift trucks increased signifi cantly in line with a heightened environmental awareness among domestic companies. As a result, we achieved a 43.4% share in the Japanese lift truck market during January to December 2005, marking the 40th consecutive year that we maintained a top
position in the domestic lift truck industry. Globally, we sold a record 112,000 TOYOTA-brand lift trucks, an increase of 11% over the same period in 2004. The BT brand posted a strong increase in sales of reach trucks, low-level order picking trucks and other warehouse trucks. Aichi Corporation, one of our subsidiaries and a major manufacturer of aerial work platforms, recorded a substantial increase in sales over fi scal 2005 on the back of strong replacement demand from electricity companies and the telecommunications industry. In July 2005, we established the Toyota Material Handling Group to further strengthen cooperation and maximize synergies between TOYOTA and BT brands. Under this new framework, we aim to consolidate our Materials Handling Equipment Business in Europe, North America and Japan to enhance our global market share.
Logistics SegmentToyota Industries has entered into the logistics solutions business to reduce customers’ logistics costs through optimized logistics processes. Net sales of the Logistics Segment amounted to ¥65.1 billion in fi scal 2006, due largely to the solid performance of the transportation business and the contribution made by Asahi Securities Co., Ltd., which is engaged in comprehensive cash management outsourcing services such as cash collection and delivery as well as cash proceeds management. In January 2006, we acquired the capital stock of Wanbishi Archives Co., Ltd. to further expand our business domain.
Textile Machinery SegmentIn the textile machinery industry as a whole, the mainstay Chinese market remained strong on the back of robust demand for capital investment, despite the Chinese government’s monetary-tightening measures and the
FY0
(¥ Billion)
400
200
100
Net Sales of Materials HandlingEquipment Segment
300
0605040302
600
500
FY
40
25
30
35
15
10
20
5
0
(¥ Billion)
Operating Income of Materials Handling Equipment Segment
0605040302 05 0603 0402FY
80
60
40
20
0
(¥ Billion)
Net Sales of Logistics Segment
05 0603 0402FY
(¥ Billion)
Operating Income of Logistics Segment
2
1
3
0
The Logistics Segment was newly created in fi scal 2006.

67Toyota Industries Corporation Annual Report 2006
safeguards exercised by Europe and the United States to contain Chinese garment imports. Net sales of the Textile Machinery Segment of Toyota Industries totaled ¥49.8 billion, an increase of ¥5.9 billion (13.4%) from fi scal 2005, due largely to an increase in sales of air-jet looms to China and India as well as strong sales of spinning machinery.
Others SegmentBecause we separated our logistics-related businesses from the Others Segment into the Logistics Segment, net comparisons with the previous year’s results cannot be made. Net sales of the Others Segment for fi scal 2006 amounted to ¥49.0 billion. TIBC Corporation (TIBC), a joint venture with Ibiden Co., Ltd. that manufactures and sells ball grid array plastic package substrates, underwent strong demand for plastic package substrates for personal computers.
Sales by Geographical SegmentBelow are Toyota Industries’ operating results by geographical segment. Net sales for each geographical segment do not include intersegment transactions.
JapanNet sales increased ¥194.3 billion (23.8%) over fi scal 2005 to ¥1,009.4 billion, while operating income totaled ¥52.8 billion, up ¥9.2 billion (21.1%). These increases are due mainly to a rise in unit sales of vehicles and lift trucks.
North AmericaNet sales totaled ¥246.1 billion, an increase of ¥33.9 billion (16.0%) over fi scal 2005. Operating income was ¥6.7 billion, up ¥0.4 billion (6.4%). Both increases were the result of an increase in unit sales of lift trucks.
EuropeNet sales increased ¥27.6 billion (14.6%) to ¥216.2 billion, due largely to an increase in unit sales of lift trucks. On the other hand, operating income decreased ¥0.1 billion (3.0%) to ¥4.5 billion, mainly as a result of a decrease in earnings of car air-conditioning compressor manufacturing subsidiaries.
OthersNet sales totaled ¥34.2 billion, an increase of ¥8.7 billion (33.8%), whereas operating income rose ¥0.8 billion (131.6%) to ¥1.5 billion.
Non-Operating Income and ExpensesNon-operating income increased ¥5.6 billion (14.6%) to ¥43.9 billion in fi scal 2006, owing primarily to an increase in dividends income from TMC. Non-operating expenses totaled ¥27.3 billion, an increase of ¥6.8 billion (33.0%), due mainly to increases in interest expenses and a loss on disposal of fi xed assets.
Income before Income TaxesIncome before income taxes amounted to ¥80.6 billion, up ¥10.3 billion (14.6%), as a result of a ¥9.7 billion increase in ordinary income.
Income TaxesIncome taxes increased ¥6.1 billion (27.2%) to ¥28.3 billion, due largely to an increase in income taxes of the Company and the BT Industries Group.
Minority Interest in Consolidated SubsidiariesMinority interest in consolidated subsidiaries amounted to ¥5.3 billion, up ¥0.5 billion (10.7%), as a result of strong performance by subsidiaries.
05 0603 0402FY
50
40
30
20
10
0
(¥ Billion)
Net Sales of Textile Machinery Segment
05 0603 0402FY
(¥ Billion)
Operating Income (Loss) of Textile Machinery Segment
2
1
0
(1)
3
(2)0605040302FY
40
20
0
(¥ Billion)
Net Sales of Others Segment
60
80
Operating Income of Others Segment
0605040302FY
5
6
4
3
2
1
0
(¥ Billion)
(Including Elimination of Intersegment Transactions)

68 Toyota Industries Corporation Annual Report 2006
Net IncomeNet income totaled ¥47.1 billion, an increase of ¥3.7 billion (8.6%) over fi scal 2005. Net income per share was ¥146.16, compared with ¥135.09 in fi scal 2005. Diluted net income per share increased from ¥135.03 to ¥146.02.
Liquidity and Capital Resources
Toyota Industries’ fi nancial policy is to ensure suffi cient fi nancing and liquidity for its business activities and to maintain strong balance sheets. Currently, funds for capital investments and other long-term capital needs are provided from retained earnings and long-term debt, and working capital needs are met through short-term loans. Long-term debt fi nancing is carried out mainly through issuance of corporate bonds and loans from fi nancial institutions. In addition to current assets such as cash and cash equivalents and securities, Toyota Industries maintained a commercial paper issuance capacity of ¥100.0 billion as of March 31, 2006. Toyota Industries continues to maintain its solid fi nancial condition. Through the use of such current assets as cash and cash equivalents and securities, as well as free cash fl ows and funds procured from fi nancial institutions, Toyota Industries believes that it will be able to provide suffi cient funds for the working capital necessary to expand existing businesses and develop new projects, and for future investments. Regarding fund management, the Company undertakes integrated fund management of its
subsidiaries in Japan, while Toyota Industries North America, Inc. (TINA) and Toyota Industries Finance International AB (TIFI) centrally manage the funds of subsidiaries in North America and Europe, respectively. Through close cooperation among the Company, TINA and TIFI, we strive for effi cient, unifi ed fund management on a global consolidated basis.
Assets, Liabilities and Shareholders’ Equity
Total assets at the end of fi scal 2006 amounted to ¥3,245.3 billion, up ¥918.5 billion (39.5%) over the end of fi scal 2005, due largely to an increase in investments and other assets. Current assets increased ¥46.3 billion (10.0%) over the previous fi scal year-end to ¥509.3 billion, refl ecting the increases in cash and cash equivalents as well as trade notes and accounts receivable. Property, plant and equipment increased ¥69.1 billion (15.1%) to ¥526.2 billion. Intangible assets decreased ¥7.0 billion (6.0%) to ¥110.0 billion, due mainly to amortization of goodwill. Investments and other assets amounted to ¥2,100.0 billion, an increase of ¥810.2 billion (62.8%) over fi scal 2005. This increase was mainly the result of an increase in the market prices of shares of TMC and other Toyota Group companies held by Toyota Industries. On the liabilities side, current liabilities increased ¥24.6 billion (5.8%) over the previous fi scal year-end to ¥446.1 billion as a result of an increase in trade notes and accounts payable. Long-term liabilities amounted to ¥1,138.7 billion, an
FY
500
0 0
30
20
10
40
50
60
70
1,000
1,500
2,000
2,500
3,000
3,500
Total Assets, Shareholders’ Equity and Shareholders’ Equity Ratio
(%)(¥ Billion)
Total assets (left)Shareholders’ equity (left)Shareholders’ equity ratio (right)
040302 05 06040302FY
20
40
60
80
Net Income per Share
0
100
120
160
140
(¥)
05 06
BasicDiluted

69Toyota Industries Corporation Annual Report 2006
increase of ¥390.1 billion (52.1%) over the previous fi scal year-end. This was due chiefl y to issuance of bonds and an increase in deferred tax liabilities arising from a rise in the market value of investment securities. Minority interest in consolidated subsidiaries increased ¥8.4 billion (20.5%) to ¥49.3 billion. Shareholders’ equity increased ¥495.5 billion (44.4%) to ¥1,611.2 billion. This increase primarily refl ected an increase in net unrealized gains on other securities accompanying an increase in the market value of investment securities. The ratio of shareholders’ equity to total assets increased from 48.0% in the previous fi scal year to 49.6%, while shareholders’ equity per share at year-end rose from ¥3,504.80 to ¥5,044.45.
Cash Flows
Cash fl ows from operating activities resulted in an increase in cash of ¥131.8 billion in fi scal 2006, due mainly to income before income taxes amounting to ¥80.6 billion. Net cash provided by operating activities increased ¥31.7 billion (31.7%) from ¥100.1 billion in the previous fi scal year. Cash fl ows from investing activities resulted in a decrease in cash of ¥205.0 billion, attributable primarily to payments for purchases of property, plant and equipment amounting to ¥161.5 billion, an increase of ¥51.4 billion (46.7%) from fi scal 2005. Net cash used in investing activities increased ¥76.8 billion (59.9%) from ¥128.2 billion in the previous fi scal year. Cash fl ows from fi nancing activities resulted in an increase in cash of ¥85.2 billion due mainly to proceeds from issuance of bonds in an amount of ¥68.7 billion. Net cash
provided by fi nancing activities increased ¥35.2 billion (70.3%) from ¥50.0 billion in the previous fi scal year. After translation adjustments, cash and cash equivalents as of March 31, 2006 stood at ¥112.6 billion, an increase of ¥12.1 billion (12.0%) over fi scal 2005.
Investment in Property, Plant and EquipmentDuring fi scal 2006, Toyota Industries made a total investment of ¥151.8 billion in property, plant and equipment (including ¥21.7 billion in vehicles and materials handling equipment for lease) in order to launch new products, streamline and upgrade production equipment, and augment R&D facilities. In the Automobile Segment, investment in property, plant and equipment totaled ¥90.5 billion. A primary breakdown of this amount included ¥61.5 billion for the Company, ¥8.1 billion for TACG, ¥5.9 billion for TD Deutsche Klimakompressor GmbH, ¥5.4 billion for Izumi Machine Mfg. Co., Ltd., ¥3.6 billion for Tokyu Co., Ltd., ¥1.3 billion for Toyota Industry Automotive Parts (Kunshan) Co., Ltd. and ¥1.2 billion for Tokaiseiki Co., Ltd. The Materials Handling Equipment Segment made an investment in property, plant and equipment in the total amount of ¥38.2 billion. The primary breakdown comprised ¥6.8 billion for the Company and ¥11.3 billion for the BT Industries Group. Investment in property, plant and equipment in the Logistics Segment totaled ¥3.8 billion, including ¥23 million for the Company and ¥3.1 billion for Taikoh Transportation Co., Ltd. The Textile Machinery Segment made an investment in property, plant and equipment in the total amount of ¥0.6
(¥ Billion)
FY
(50)
0
50
100
150
Cash Flows
(200)
(250)
(150)
(100)
Net cash provided by operating activitiesNet cash used in investing activitiesNet cash provided by (used in) financing activities
02 03 04 05 06
(¥ Billion)
FY0
100
80
60
40
20
140
160
120
Investment in Property, Plant and Equipment
0605040302
AutomobileMaterials Handling EquipmentLogisticsTextile MachineryOthers

70 Toyota Industries Corporation Annual Report 2006
billion, including ¥0.4 billion for the Company. In the Others Segment, the investment in property, plant and equipment totaled ¥18.7 billion, including ¥13.1 billion for the Company and ¥4.9 billion for TIBC. Necessary funds were provided by a portion of bonds as well as internal funds and bank loans.
Business Strategy
Since its establishment as a specialized textile machinery manufacturer in 1926, Toyota Industries has diversifi ed the scope of its businesses and achieved growth to become a company with such wide-ranging businesses as automobile-related, materials handling equipment, logistics and textile machinery businesses. At present, Toyota Industries is undertaking an array of initiatives aimed at achieving further growth under a new fi ve-year Medium-Term Management Plan begun in fi scal 2007, ending March 2007. With an emphasis on quality as the basis of its management, Toyota Industries regards addressing environmental and safety-related areas and enhancing competitiveness as crucial management issues over the medium to long term. Accordingly, we will promote the development of cutting-edge technologies for providing products that anticipate customer needs, while strengthening our value chain. Additionally, we will create a structure for reinforcing our global consolidated management and utilizing our overall capabilities. As the basis for this structure, Toyota Industries plans to bolster its workplace strengths and cultivate global-oriented personnel who will support future business growth. By business, our Vehicle and Engine businesses will strive for further growth in performance by contributing to TMC’s global strategy. The Materials Handling Equipment and Car Air-Conditioning Compressor businesses are expected to maintain their respective leading positions in world markets while implementing global business strategies, expanding market share and enhancing business results. Meanwhile, the Textile Machinery Business aims to maintain its No. 1 share of the global market for air-jet looms and aims for stable business operations. The Electronics Business, including power electronics devices for hybrid vehicles, and the Logistics Solutions Business will promote initiatives aimed at achieving growth to become future pillars of our operations. By undertaking these measures, we intend to strengthen our competitiveness and raise corporate value. We also anticipate the undertaking of corporate activities with a consideration of the environment and working to realize growth in harmony with society.
Strategies and Outlook
Outlook for Results for Fiscal 2007Toyota Industries expects the Japanese economy to continue along a steady path toward recovery thanks to a favorable ripple effect on consumer spending arising from strong corporate performance. However, uncertainties persist regarding exchange rate fl uctuations and a further increase in the prices of crude oil and other raw materials. For fi scal 2007, ending March 31, 2007, Toyota Industries forecasts consolidated net sales of ¥1,670.0 billion, ordinary income of ¥85.0 billion and net income of ¥49.0 billion. We are determined to heighten the comprehensive capabilities of the Toyota Industries Group as a whole by placing utmost emphasis on product quality, giving considerations to the environment and safety, increasing our competitive strengths, promoting technological advancements and strengthening our value chain so that we can develop and market leading-edge products that anticipate customer needs. We also plan to further augment global consolidated management and build a business structure that can take advantage of the collective strength of Toyota Industries while enhancing capabilities in the workplace and nurturing personnel of international caliber who will lead Toyota Industries to the next level of growth. We will further strive to promote adherence to compliance as well as proactive participation in environmental protection and social contribution activities. Our projections are based on an exchange rate of ¥115.0 = US$1.
Dividend Policy
The Company regards the benefi ts of shareholders as one of its most important management policies. Based on this stance, we will strive to strengthen Toyota Industries’ corporate constitution, promote proactive business development and raise its corporate value. The Company’s dividend policy is to meet the expectations of shareholders while giving full consideration to business performance, capital demand, the dividend payout ratio on a consolidated basis and other factors. Toyota Industries’ Ordinary General Meeting of Shareholders, held on June 22, 2006, approved a year-end cash dividend of ¥20.0 per share. Including the interim cash dividend of ¥18.0 per share, cash dividends for the year totaled ¥38.0 per share, an increase of ¥6.0 per share over fi scal 2005. The dividend payout ratio was 40.3%. On a consolidated basis, it was 26.0%.

71Toyota Industries Corporation Annual Report 2006
Toyota Industries intends to use retained earnings to improve the competitiveness of its products, augment production capacity in Japan and overseas, as well as expand into new fi elds of business and strengthen its corporate constitution in securing future profi ts for its shareholders. It will also use retained earnings to repurchase treasury stock.
Risk Information
The following represent risks that could have a material impact on Toyota Industries’ fi nancial condition, business results and share prices. The risks mentioned in this annual report represent only a portion of the risks that could have an impact on Toyota Industries’ fi nancial condition and business results, and do not necessarily cover all possible risks. There is also a possibility that Toyota Industries could be affected in the future by risks currently unknown or not considered noteworthy or signifi cant.
Principal CustomersToyota Industries’ automobile and engine products are sold primarily to TMC. In fi scal 2006, net sales to TMC accounted for 35.0% of consolidated net sales. Therefore, TMC’s vehicle sales could have an impact on Toyota Industries’ business results. As of March 31, 2006, TMC held 24.02% of the Company’s voting rights.
Product Development CapabilitiesBased on the concept of “developing appealing new products,” Toyota Industries proactively develops new products by utilizing its leading-edge technologies, as it strives to anticipate increasingly sophisticated and diversifying needs of the market and ensure the satisfaction of its customers. R&D activities are focused mainly on developing and upgrading products in current business fi elds and peripheral sectors. Toyota Industries expects that revenues derived from these fi elds will continue to account for a signifi cant portion of total revenues and anticipates that future growth will be contingent on the development and sales of new products in these fi elds. Toyota Industries believes that it can continue to develop appealing new products. However, Toyota Industries may not be able to forecast market needs and develop and introduce appealing new products in a timely manner. This could result in lower future growth and have an adverse impact on Toyota Industries’ fi nancial condition and business results. Such a situation could result from risks that include no assurance Toyota Industries can allocate suffi cient future funds necessary for the development of appealing new products; no assurance that product sales will be
successful, as forecasts of products supported by the market may not always be accurate; and no assurance that newly developed products and technologies will always be protected as intellectual property.
Intellectual Property RightsIn undertaking its business activities, Toyota Industries has acquired numerous intellectual property rights, including those acquired overseas, such as patents related to its products, product designs and manufacturing methods. However, not all patents submitted will necessarily be registered as rights, and these patents could thus be rejected by patent authorities or invalidated by third parties. Also, a third party could circumvent a patent of Toyota Industries and introduce a competing product into the market. Moreover, Toyota Industries’ products utilize a wide range of technologies. Therefore, Toyota Industries could become a party subject to litigation involving the intellectual property rights of a third party.
Product DefectsGuided by the basic philosophy of “offering products and services that are clean, safe and of high quality,” Toyota Industries makes its utmost efforts to enhance quality. However, Toyota Industries cannot guarantee all its products will be defect-free and that product recalls will not be made in the future. Toyota Industries is insured for product liability indemnity. However, Toyota Industries cannot guarantee that this insurance will suffi ciently cover fi nal indemnity amounts incurred. Product defects that could lead to large-scale recalls and product liability indemnities could result in large cost burdens and have a signifi cant negative impact on the evaluation of Toyota Industries. It could also have an adverse effect on Toyota Industries’ fi nancial condition and business results due to a decrease in sales, deterioration of profi tability and decrease in share prices of Toyota Industries.
Price CompetitionToyota Industries faces extremely harsh competition in each of the industries in which it conducts business, including its Automobile and Materials Handling Equipment businesses, which are the core of Toyota Industries’ earnings foundation. Toyota Industries believes it offers high-value-added products that are unrivalled in terms of technology, quality and cost. Amid an environment characterized by intensifying price competition, however, Toyota Industries may be unable to maintain or increase market share against low-cost competitors or to maintain profi tability. This could have an adverse impact on Toyota Industries’ fi nancial condition and business results.

72 Toyota Industries Corporation Annual Report 2006
Reliance on Suppliers of Raw Materials and ComponentsToyota Industries’ products rely on various raw materials and components from suppliers outside the Toyota Industries Group. Toyota Industries has concluded basic business contracts with these external suppliers and assumes it can carry out stable transactions for raw materials and components. However, Toyota Industries has no assurances against future shortages of raw materials and components, which arise from a global shortage due to tight supply or an unforeseen accident involving a supplier. Such shortages could have a negative effect on Toyota Industries’ product production and cause an increase in costs, which could have an adverse impact on Toyota Industries’ fi nancial condition and business results.
Environmental RegulationsIn view of its social responsibilities as a company, Toyota Industries strives to reduce any burden on the environment resulting from its production processes, as well as strictly adheres to applicable environmental laws and regulations. However, various environmental regulations could also be revised and strengthened in the future. Accordingly, any expenses necessary for continuous strict adherence to these environmental regulations could result in increased business costs and have an adverse impact on Toyota Industries’ fi nancial condition and business results.
Alliances with Other CompaniesAiming to expand its businesses, Toyota Industries engages in joint activities with other companies through alliances and joint ventures. However, a wildly fl uctuating market trend or a disagreement between Toyota Industries and its partners, owing to business, fi nancial or other reasons, could prevent Toyota Industries from deriving the intended benefi ts of its alliances.
Exchange Rate FluctuationsToyota Industries’ businesses encompass the production and sales of products and the provision of services worldwide. Generally, the strengthening of the yen against other currencies (especially against the U.S. dollar and the euro, which account for a signifi cant portion of Toyota Industries’ sales) has an adverse impact on Toyota Industries’ business, while a weakening of the yen has a favorable impact. An increase in the value of currencies in countries or regions where Toyota Industries carries out production could lead to an increase in local production, procurement and distribution costs. Such an increase in costs could reduce Toyota Industries’ price competitiveness. Additionally, because export sales of several businesses are denominated mainly in
yen, exchange rate fl uctuations could have an adverse impact on Toyota Industries’ fi nancial condition and business results due to a change in market prices.
Share Price FluctuationsToyota Industries holds marketable securities, and therefore bears the risk of price fl uctuation of these shares. Based on fair market value of these shares at the end of the fi scal year under review, Toyota Industries had unrealized gains. However, unrealized gains on marketable securities could worsen depending on future share price movements. Additionally, a fall in share prices could reduce the value of pension assets, leading to an increase in the pension shortfall.
Effects of Disasters, Power Blackouts andOther IncidentsToyota Industries carries out regular checks and inspections of its production facilities to minimize the effect of production breakdown. However, there is no assurance Toyota Industries can completely prevent or lessen the impact of man-made or natural disasters, including malfunctions of production facilities, fi res at production facilities and power blackouts. For example, the majority of Toyota Industries’ domestic production facilities and most of its business partners are situated in the Chubu region. Therefore, a major earthquake such as the Tokai Earthquake, or an incident that affects other operations, could delay or stop production or shipment activities. Such prolonged delays and stoppages could have an adverse impact on Toyota Industries’ fi nancial condition and business results.
Latent Risks Associated withInternational ActivitiesToyota Industries manufactures and sells products and provides services in various countries. Such unforeseen factors as social chaos, including political disruptions, terrorism and wars, as well as changes in economic conditions, could have an adverse impact on Toyota Industries’ fi nancial condition and business results.
Retirement Benefi t LiabilitiesToyota Industries’ employee retirement benefi t expenses and liabilities are calculated based on expected rates of return on pension assets as well as assumptions upon making actuarial calculations that incorporate discount rates and other factors. Therefore, differences between actual results and assumptions as well as changes in the assumptions could have a signifi cant impact on recognized expenses and calculated liabilities in future accounting periods.

73Toyota Industries Corporation Annual Report 2006
Signifi cant Accounting Policies and Estimates
Toyota Industries’ fi nancial statements are prepared in conformity with accounting principles and practices generally accepted in Japan. In preparing fi nancial statements, management must make estimates, judgments and assumptions that affect reported amounts of assets and liabilities at fi scal year-end as well as revenues and expenses during each fi scal year. Among Toyota Industries’ signifi cant accounting policies, the following categories require a considerable degree of judgment and estimation and are highly complex.
Allowance for Doubtful AccountsTo prepare for the risk of receivables becoming uncollectible, Toyota Industries estimates its allowance for doubtful accounts by utilizing the percentage of historical experiences in credit losses for ordinary receivables and individually examining the feasibility of collection for receivables that seem to be uncollectible. Evaluating the allowance for doubtful accounts involves judgments made in accordance with the nature of the situation, and this allowance represents an essential and crucial estimate—including future estimates of cash fl ow amounts and timing—that could change signifi cantly. Based on currently available information, Toyota Industries’ management believes its present allowance for doubtful accounts is suffi cient. However, the need to signifi cantly increase allowance for doubtful accounts in the future could have an adverse impact on Toyota Industries’ business results.
Allowance for Retirement Benefi tsCalculations differ for retirement benefi ts, retirement benefi t expenses and liabilities after employee retirement, as well as benefi ts for employees on leave of absence because different assumptions are used at the time of calculation. Assumptions include such factors as discount rates, amount of benefi ts, interest expenses, expected rates of return on pension assets and mortality rates. The difference in amounts between these assumptions and actual results is calculated cumulatively and amortized over future accounting periods, and thus becomes an expense and is recognized as a liability in future accounting periods. Toyota Industries believes its assumptions are reasonable. However, differences between actual results or changes in the assumptions could have an impact on retirement benefi ts and retirement benefi t expenses and liabilities after employee retirement.
Toyota Industries’ Relationship to Toyota Motor Corporation
Due to historical reasons, Toyota Industries maintains close relationships with TMC and Toyota Group companies in terms of capital and business dealings.
Historical BackgroundIn 1933, Kiichiro Toyoda, the eldest son of founder Sakichi Toyoda and then Managing Director of Toyota Industries (then Toyoda Automatic Loom Works, Ltd.), established the Automobile Division within the Company based on his resolve to manufacture Japanese-made automobiles. In 1937, the Automobile Division was spun off and became an independent company, Toyota Motor Co., Ltd. (the present Toyota Motor Corporation).
Capital RelationshipIn light of this historical background, Toyota Industries and TMC have maintained a close capital relationship. As of March 31, 2006, Toyota Industries held 5.54% (200,025 thousand shares) of TMC’s total shares issued. Likewise, as of the same date, TMC held 24.02% (76,600 thousand shares) of Toyota Industries’ total voting rights and 23.51% of total shares issued. Toyota Industries is a TMC affi liate accounted for by the equity method.
Business RelationshipToyota Industries assembles certain cars and produces automobile engines under consignment from TMC. Toyota Industries also sells car air-conditioning compressors to DENSO, a Toyota Group company. Additionally, we sell a portion of our other components and products directly or indirectly to other Toyota Group companies. In fi scal 2006, our net sales to TMC and DENSO accounted for 35.0% and 7.6% of our consolidated net sales, respectively.
Contributions to the Toyota GroupAs a member of the Toyota Group, Toyota Industries aims to contribute to strengthening the competitiveness of TMC and other Toyota Group companies in such areas as quality, cost, delivery and technologies. Toyota Industries is confi dent that raising the Toyota Group’s competitiveness will lead to increases in our sales to and profi ts from the Toyota Group, thereby contributing to raising Toyota Industries’ corporate value.
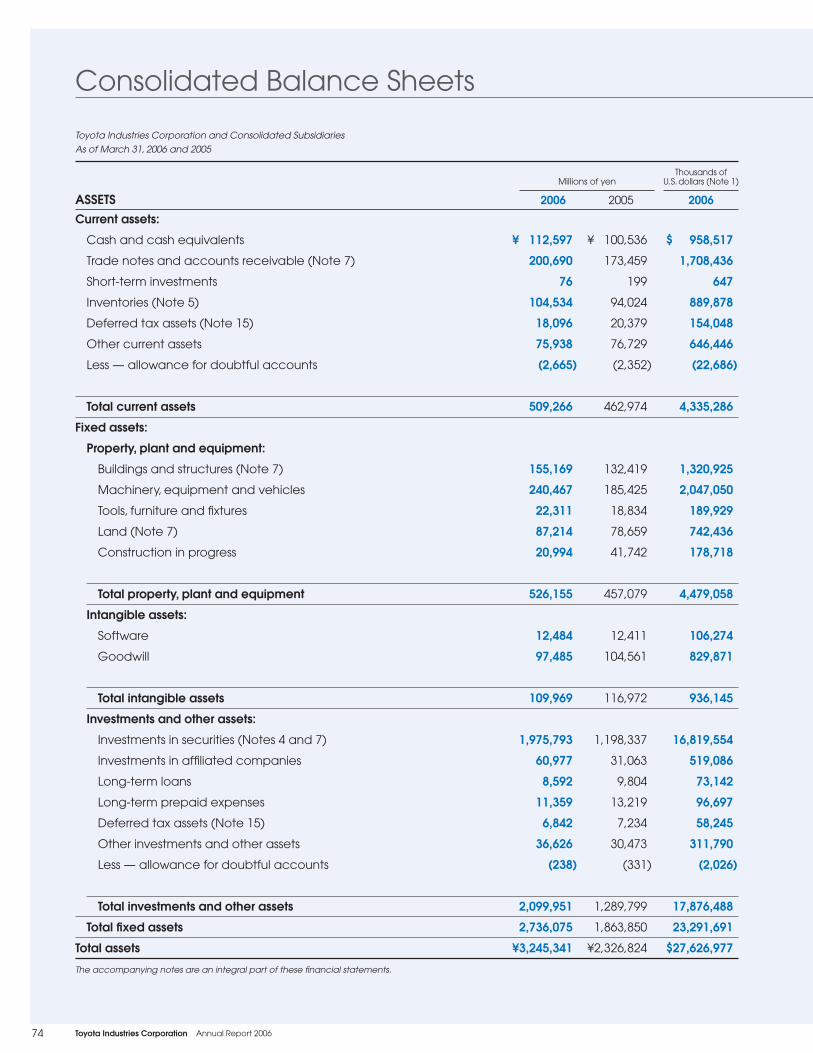
74 Toyota Industries Corporation Annual Report 2006
Toyota Industries Corporation and Consolidated Subsidiaries
As of March 31, 2006 and 2005
Current assets:
Cash and cash equivalents ¥ 112,597 ¥ 100,536 $ 958,517
Trade notes and accounts receivable (Note 7) 200,690 173,459 1,708,436
Short-term investments 76 199 647
Inventories (Note 5) 104,534 94,024 889,878
Deferred tax assets (Note 15) 18,096 20,379 154,048
Other current assets 75,938 76,729 646,446
Less — allowance for doubtful accounts (2,665) (2,352) (22,686)
Total current assets 509,266 462,974 4,335,286
Fixed assets:
Property, plant and equipment:
Buildings and structures (Note 7) 155,169 132,419 1,320,925
Machinery, equipment and vehicles 240,467 185,425 2,047,050
Tools, furniture and fi xtures 22,311 18,834 189,929
Land (Note 7) 87,214 78,659 742,436
Construction in progress 20,994 41,742 178,718
Total property, plant and equipment 526,155 457,079 4,479,058
Intangible assets:
Software 12,484 12,411 106,274
Goodwill 97,485 104,561 829,871
Total intangible assets 109,969 116,972 936,145
Investments and other assets:
Investments in securities (Notes 4 and 7) 1,975,793 1,198,337 16,819,554
Investments in affi liated companies 60,977 31,063 519,086
Long-term loans 8,592 9,804 73,142
Long-term prepaid expenses 11,359 13,219 96,697
Deferred tax assets (Note 15) 6,842 7,234 58,245
Other investments and other assets 36,626 30,473 311,790
Less — allowance for doubtful accounts (238) (331) (2,026)
Total investments and other assets 2,099,951 1,289,799 17,876,488
Total fi xed assets 2,736,075 1,863,850 23,291,691
Total assets ¥3,245,341 ¥2,326,824 $27,626,977
The accompanying notes are an integral part of these fi nancial statements.
Thousands ofU.S. dollars (Note 1)Millions of yen
2006 2005 2006ASSETS
Consolidated Balance Sheets

75Toyota Industries Corporation Annual Report 2006
Current liabilities:
Trade notes and accounts payable ¥ 182,595 ¥ 160,231 $ 1,554,397
Short-term bank loans (Note 7) 38,929 59,945 331,395
Commercial paper 29,680 – 252,660
Current portion of bonds (Note 7) 15,000 20,300 127,692
Other payables 30,620 45,462 260,662
Accrued expenses 67,674 59,357 576,096
Accrued income taxes 13,625 15,297 115,987
Deposits received from employees 20,915 20,055 178,046
Deferred tax liabilities (Note 15) 3,858 4,067 32,842
Other current liabilities (Note 7) 43,222 36,826 367,941
Total current liabilities 446,118 421,540 3,797,718
Long-term liabilities:
Bonds (Note 6) 283,832 230,000 2,416,208
Long-term bank loans (Notes 6 and 7) 106,268 73,492 904,640
Deferred tax liabilities (Note 15) 681,504 381,787 5,801,515
Allowance for retirement benefi ts (Note 14) 46,535 44,463 396,144
Other long-term liabilities 20,586 18,891 175,245
Total long-term liabilities 1,138,725 748,633 9,693,752
Total liabilities 1,584,843 1,170,173 13,491,470
Minority interests in consolidated subsidiaries 49,271 40,904 419,435
Shareholders’ equity (Note 10):
Common stock:
Authorized — 1,091,245,000 shares
Issued — 325,840,640 shares as of March 31, 2006 and 2005 80,463 80,463 684,966
Capital surplus 105,665 105,601 899,506
Retained earnings 358,386 325,331 3,050,873
Net unrealized gains on other securities 1,047,191 591,218 8,914,540
Foreign currency translation adjustments 33,886 29,861 288,465
Treasury stock at cost (14,364) (16,727) (122,278)
6,520,194 shares as of March 31, 2006
7,603,825 shares as of March 31, 2005
Total shareholders’ equity 1,611,227 1,115,747 13,716,072
Total liabilities, minority interests and shareholders’ equity ¥3,245,341 ¥2,326,824 $27,626,977
Thousands ofU.S. dollars (Note 1)Millions of yen
2006 2005 2006LIABILITIES, MINORITY INTERESTS AND SHARE HOLD ERS’ EQUITY
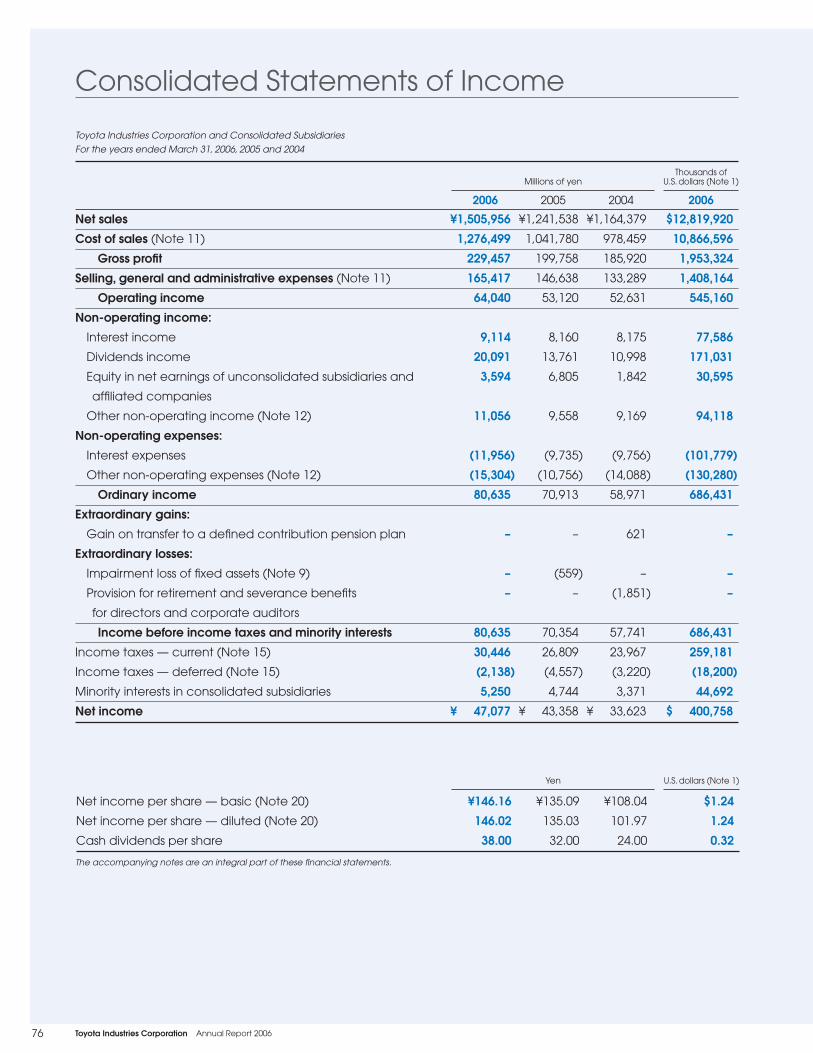
76 Toyota Industries Corporation Annual Report 2006
Net sales ¥1,505,956 ¥1,241,538 ¥1,164,379 $12,819,920
Cost of sales (Note 11) 1,276,499 1,041,780 978,459 10,866,596
Gross profi t 229,457 199,758 185,920 1,953,324
Selling, general and administrative expenses (Note 11) 165,417 146,638 133,289 1,408,164
Operating income 64,040 53,120 52,631 545,160
Non-operating income:
Interest income 9,114 8,160 8,175 77,586
Dividends income 20,091 13,761 10,998 171,031
Equity in net earnings of unconsolidated subsidiaries and
affi liated companies
3,594 6,805 1,842 30,595
Other non-operating income (Note 12) 11,056 9,558 9,169 94,118
Non-operating expenses:
Interest expenses (11,956) (9,735) (9,756) (101,779)
Other non-operating expenses (Note 12) (15,304) (10,756) (14,088) (130,280)
Ordinary income 80,635 70,913 58,971 686,431
Extraordinary gains:
Gain on transfer to a defi ned contribution pension plan – – 621 –
Extraordinary losses:
Impairment loss of fi xed assets (Note 9) – (559) – –
Provision for retirement and severance benefi ts
for directors and corporate auditors
– – (1,851) –
Income before income taxes and minority interests 80,635 70,354 57,741 686,431
Income taxes — current (Note 15) 30,446 26,809 23,967 259,181
Income taxes — deferred (Note 15) (2,138) (4,557) (3,220) (18,200)
Minority interests in consolidated subsidiaries 5,250 4,744 3,371 44,692
Net income ¥ 47,077 ¥ 43,358 ¥ 33,623 $ 400,758
Net income per share — basic (Note 20) ¥146.16 ¥135.09 ¥108.04 $1.24
Net income per share — diluted (Note 20) 146.02 135.03 101.97 1.24
Cash dividends per share 38.00 32.00 24.00 0.32
The accompanying notes are an integral part of these fi nancial statements.
Toyota Industries Corporation and Consolidated Subsidiaries
For the years ended March 31, 2006, 2005 and 2004
U.S. dollars (Note 1)Yen
Thousands ofU.S. dollars (Note 1)Millions of yen
20062005 20042006
Consolidated Statements of Income

77Toyota Industries Corporation Annual Report 2006
Balance at March 31, 2003 313,324 ¥68,047 ¥ 89,365 ¥269,381 ¥ 331,668 ¥16,890 ¥(36,483)Net income – – – 33,623 – – –Cash dividends – – – (7,417) – – –Bonuses to directors and corporate auditors – – – (290) – – –Net unrealized gains on other securities – – – – 202,411 – –Foreign currency translation adjustments – – – – – 2,893 –Conversions of convertible bonds 12,517 12,416 12,416 – – – 35,601Repurchase of treasury stock – – – – – – (17,094)Gain on disposal of treasury stock – – 3,962 – – – –Change in subsidiaries’ year-ends – – – (625) – – –
Balance at March 31, 2004 325,841 80,463 105,743 294,672 534,079 19,783 (17,976)Net income – – – 43,358 – – –Cash dividends – – – (7,949) – – –Bonuses to directors and corporate auditors – – – (331) – – –Net unrealized gains on other securities – – – – 57,139 – –Foreign currency translation adjustments – – – – – 10,078 –Repurchase of treasury stock – – – – – – (53)Exercise of stock options – – (142) – – – 1,302Effect of adoption of a new accounting standard
for retirement benefi ts by foreign subsidiaries – – – (4,419) – – –
Balance at March 31, 2005 325,841 80,463 105,601 325,331 591,218 29,861 (16,727)Net income – – – 47,077 – – –Cash dividends – – – (11,794) – – –Bonuses to directors and corporate auditors – – – (406) – – –Net unrealized gains on other securities – – – – 455,973 – –Foreign currency translation adjustments – – – – – 4,025 –Repurchase of treasury stock – – – – – – (52)Exercise of stock options – – 64 – – – 2,415Decrease due to increase in affi liates accounted
for under the equity method – – – (1,822) – – –
Balance at March 31, 2006 325,841 ¥80,463 ¥105,665 ¥358,386 ¥1,047,191 ¥33,886 ¥(14,364)
Toyota Industries Corporation and Consolidated Subsidiaries
For the years ended March 31, 2006, 2005 and 2004
Millions of yen
Treasurystock
at cost
Foreign currencytranslation
adjustments
Net unrealizedgains on
other securitiesRetainedearnings
Capitalsurplus
Commonstock
Numberof shares
(Thousands)
The accompanying notes are an integral part of these fi nancial statements.
Balance at March 31, 2005 $684,966 $898,961 $2,769,482 $5,032,928 $254,201 $(142,394)Net income – – 400,758 – – –Cash dividends – – (100,400) – – –Bonuses to directors and corporate auditors – – (3,456) – – –Net unrealized gains on other securities – – – 3,881,612 – –Foreign currency translation adjustments – – – – 34,264 –Repurchase of treasury stock – – – – – (443)Exercise of stock options – 545 – – – 20,559Decrease due to increase in affi liates accounted
for under the equity method – – (15,511) – – –
Balance at March 31, 2006 $684,966 $899,506 $3,050,873 $8,914,540 $288,465 $(122,278)
Thousands of U.S. dollars (Note 1)
Treasurystock
at cost
Net unrealizedgains on other
securitiesRetainedearnings
Capitalsurplus
Commonstock
Foreign currencytranslation
adjustments
Consolidated Statements of Shareholders’ Equity

78 Toyota Industries Corporation Annual Report 2006
Cash fl ows from operating activities:Income before income taxes and minority interests ¥ 80,635 ¥ 70,354 ¥ 57,741 $ 686,431Adjustments to reconcile income before income taxes and minority interests to net cash provided by operating activities:Depreciation and amortization 87,288 70,213 65,352 743,066Impairment loss of fi xed assets – 559 – –Increase (decrease) in allowance for doubtful accounts 101 371 46 860Interest and dividends income (29,205) (21,921) (19,173) (248,617)Interest expenses 11,956 9,735 9,756 101,779Equity in net earnings of affi liated companies (3,594) (6,805) (1,842) (30,595)(Increase) decrease in receivables (27,435) (22,923) (11,051) (233,549)(Increase) decrease in inventories (9,228) (12,851) 751 (78,556)Increase (decrease) in payables 21,377 26,893 2,631 181,979Others, net 12,161 (4,063) 9,741 103,524Subtotal 144,056 109,562 113,952 1,226,322
Interest and dividends income received 29,236 21,972 18,900 248,881Interest expenses paid (11,009) (8,711) (9,845) (93,718)Income taxes paid (30,498) (22,728) (30,601) (259,624)
Net cash provided by operating activities 131,785 100,095 92,406 1,121,861Cash fl ows from investing activities:
Payments for purchases of marketable securities – – (101) –Proceeds from sales of marketable securities 1 – 3,874 9Payments for purchases of property, plant and equipment (161,505) (110,112) (78,268) (1,374,862)Proceeds from sales of property, plant and equipment 8,415 10,043 3,201 71,635Payments for purchases of investment securities (47,727) (9,563) (14,301) (406,291)Proceeds from sales of investment securities 2,046 3,300 2,615 17,417Payments for acquisition of subsidiaries’ stock resulting in change in scope of consolidation
– (16,943) – –
Proceeds from acquisition of subsidiaries’ stock resulting in change in scope of consolidation
– – 1,216 –
Payments for loans made (2,256) (2,371) (4,978) (19,205)Proceeds from collections of loans 3,264 2,784 5,448 27,786Payments for acquisition of business – – (961) –Others, net (7,252) (5,369) (10,413) (61,735)
Net cash used in investing activities (205,014) (128,231) (92,668) (1,745,246)Cash fl ows from fi nancing activities:
Increase (decrease) in short-term loans (22,902) (13,687) (10,959) (194,960)Increase (decrease) in commercial paper 29,520 (15,000) 15,000 251,298Proceeds from long-term bank loans 38,824 40,786 4,522 330,501Repayments of long-term bank loans (3,366) (6,964) (8,530) (28,654)Proceeds from issuances of bonds 68,730 50,000 – 585,086Repayments of bonds (20,300) – (31,677) (172,810)Payments to convertible bond redemption funds – – (56,670) –Proceeds from convertible bond redemption funds – – 56,670 –Payments for repurchase of treasury stock (52) (53) (17,094) (443)Cash dividends paid (11,785) (7,949) (7,414) (100,323)Cash dividends paid to minority shareholders (854) (667) (252) (7,270)Others, net 7,358 3,555 389 62,637
Net cash provided by (used in) fi nancing activities 85,173 50,021 (56,015) 725,062Translation adjustments of cash and cash equivalents 117 1,439 323 996Net increase (decrease) in cash and cash equivalents 12,061 23,324 (55,954) 102,673Cash and cash equivalents at beginning of year 100,536 77,212 136,929 855,844Net decrease in cash and cash equivalents due to change in subsidiaries’ year-ends – – (3,763) –Cash and cash equivalents at end of year ¥112,597 ¥100,536 ¥ 77,212 $ 958,517
Toyota Industries Corporation and Consolidated Subsidiaries
For the years ended March 31, 2006, 2005 and 2004
The accompanying notes are an integral part of these fi nancial statements.
Thousands ofU.S. dollars (Note 1)Millions of yen
20062005 20042006
Consolidated Statements of Cash Flows

79Toyota Industries Corporation Annual Report 2006
1. Basis of presenting consolidated fi nancial statementsThe accompanying consolidated fi nancial statements have been prepared based on the accounts maintained by Toyota Industries Corporation (the “Company”), and its consolidated subsidiaries (together, hereinafter referred to as “Toyota Industries”) in accordance with the provisions set forth in the Commercial Code of Japan and the Securities and Exchange Law, and in conformity with accounting principles generally accepted in Japan, which are different in certain respects as to the application and disclosure requirements of International Financial Reporting Standards. Certain items presented in the consolidated fi nancial
statements submitted to the Director of the Kanto Finance Bureau in Japan have been reclassifi ed in these accounts for the convenience of readers outside Japan. Amounts in U.S. dollars are included solely for the convenience of readers outside Japan. The rate of ¥117.47=US$1, the rate of exchange prevailing at March 31, 2006, has been used in translation. The inclusion of such amounts are not intended to imply that the Japanese yen actually represent, or have been or could be converted into, equivalent amounts in U.S. dollars at this rate or any other rates.
2. Summary of signifi cant accounting policies
Notes to Consolidated Financial State ments
(1) ConsolidationThe consolidated fi nancial statements include the accounts of the Company and its 153 subsidiaries (43 domestic subsidiaries and 110 overseas subsidiaries, which are listed on pages 58 and 59) in 2006, 146 subsidiaries (43 domestic subsidiaries and 103 overseas subsidiaries) in 2005 and 140 subsidiaries (42 domestic subsidiaries and 98 overseas subsidiaries) in 2004. For the year ended March 31, 2006, nine subsidiaries were newly added to the scope of consolidation and two companies were excluded from the scope of consolidation because of mergers and acquisitions. For the year ended March 31, 2005, 11 subsidiaries were newly added to the scope of consolidation and six companies were excluded from the scope of consolidation because of mergers and acquisitions. For the year ended March 31, 2004, 22 subsidiaries were newly added to the scope of consolidation. One unconsolidated subsidiary was excluded from the scope of consolidation due to temporary investments. The fi scal years of certain subsidiaries are different from the fi scal year of the Company. Since the difference is not more than three months, the Company is using those subsidiaries’ statements for those fi scal years, making adjustments for signifi cant transactions that materially affect the fi nancial position or results of operations. All signifi cant intercompany transactions, balances and unrealized profi ts within Toyota Industries have been eliminated. A full portion of the assets and liabilities of the acquired subsidiaries is stated at fair value as of the date of acquisition of control.
(2) Investments in unconsolidated subsidiaries and affi liates
Investments in 22 major affi liates in 2006, 20 major affi liates in 2005 and one unconsolidated subsidiary and 19 major affi liates in 2004 are accounted for by the equity method of accounting. Investments in unconsolidated subsidiaries and affi liates not accounted for by the equity method are stated at cost due to their insignifi cant effect on the consolidated fi nancial statements. The major affi liates accounted for by the equity method are listed on page 59.
(3) Translation of foreign currencies Foreign currency denominated receivables and payables are translated into Japanese yen at the year-end exchange rates and the resulting transaction gains or losses are included in income statements. All asset and liability accounts of foreign subsidiaries and affi liates are translated into Japanese yen at year-end exchange rates and all revenue and expense accounts are translated at prevailing fi scal average rates.
(4) Cash and cash equivalentsCash and cash equivalents include all highly liquid investments, generally with original maturities of three months or less, that are readily convertible to known amounts of cash and are so near maturity that they present insignifi cant risk of changes in value because of changes in interest rates.

80 Toyota Industries Corporation Annual Report 2006
(5) Marketable securities and investment in securities
Toyota Industries classifi es securities into four categories by purpose of holding: trading securities, held-to-maturity securities, other securities and investments in unconsolidated subsidiaries and affi liates. Toyota Industries did not have trading securities or held-to-maturity securities as of March 31, 2006 and 2005. Other securities with readily determinable fair values are stated at fair value based on market prices at the end of the year. Unrealized gains and losses are included in “Net unrealized gains on other securities” as a separate component of shareholders’ equity. Cost of sales of such securities is determined by the moving-average method. Other securities without readily determinable fair values are stated at cost, as determined by the moving-average method. Investments in unconsolidated subsidiaries and affi liates are accounted for by the equity method (see Note 2 (2)).
(6) InventoriesInventories are stated mainly at cost determined by the moving-average method.
(7) Property, plant and equipment, and depreciation
Property, plant and equipment are stated at cost. Depreciation expenses of property, plant and equipment are computed mainly by the declining-balance method for the Company and Japanese subsidiaries and by the straight-line method for foreign subsidiaries. Signifi cant renewals and additions are capitalized at cost. Repairs and maintenance are charged to income as incurred. Accumulated depreciation as of March 31, 2006 and 2005 was ¥585,996 million (US$4,988,474 thousand) and ¥541,383 million, respectively.
(8) Intangible assets and amortizationAmortization of intangible assets is computed using the straight-line method. Software costs for internal use are amortized by the straight-line method over their expected useful lives (mainly fi ve years). Goodwill, if material, is amortized principally over less than 20 years on a straight-line basis, while immaterial goodwill is charged to income as incurred. Accumulated amortization of intangibles and goodwill as of March 31, 2006 and 2005 was ¥53,553 million (US$455,887 thousand) and ¥42,637 million, respectively.
(9) Impairment of fi xed assets Calculation of the impairment of fi xed assets is based on reasonable and supportable assumptions and projection of the grouping of assets and recoverable value, with due consideration for the specifi c conditions of each company. The recoverable amount of assets is calculated based on net selling price. The change in accounting policy is described in Note 3.
(10) Allowances for doubtful accounts Toyota Industries adopted the policy of providing an allowance for doubtful accounts in an amount suffi cient to cover possible losses on collection by estimating individually uncollectible amounts and applying to the remaining accounts a percentage determined by certain factors such as historical collection experiences.
(11) Deferred charges Stock issuance costs and bond issuance costs are expensed as incurred.
(12) Allowance for retirement benefi ts Toyota Industries accrues an amount which is considered to be incurred in the period based on the estimated projected benefi t obligations and estimated pension assets at the end of the year. To provide for the retirement benefi ts for directors and corporate auditors, an amount which is calculated at the end of the year as required by an internal policy describing the retirement benefi ts for directors and corporate auditors is accrued.
(13) Lease transactions Finance leases other than those that are deemed to transfer the ownership of the leased assets to lessees are accounted for mainly by a method similar to that applicable to ordinary operating leases.
(14) Consumption tax The consumption tax under the Japanese Consumption Tax Law withheld by Toyota Industries on sales of goods is not included in the amount of net sales in the accompanying consolidated statements of income, and the consumption tax paid by Toyota Industries under the law on purchases of goods and services, and expenses is not included in the related amount.

81Toyota Industries Corporation Annual Report 2006
3. Change in accounting policy and adoption of new accounting standards
(15) Hedge accounting (a) Method of hedge accountingMainly the deferral method of hedge accounting is applied. In the case of foreign currency forward contracts and foreign currency option contracts, the hedged items are translated at contracted forward rates if certain conditions are met. (b) Hedging instruments and hedged itemsHedging instruments: Derivatives instruments (interest rate
swaps, foreign currency forwards and foreign currency option contracts)
Hedged items: Risk of change in interest rate on borrowings and risk of change in forward exchange rate on transactions denominated in foreign currencies (assets and liabilities, and forecasted transactions)
(c) Hedging policyHedging transactions are executed and controlled based on Toyota Industries’ internal policy, and Toyota Industries is hedging interest rate risks and foreign currency risks. Toyota Industries’ hedging activities are reported periodically to a director responsible for accounting.(d) Method used to measure hedge effectivenessHedge effectiveness is measured by comparing accumulated changes in market prices of hedged items and hedging instruments or accumulated changes in estimated cash fl ows from the inception of the hedge to the date of measurements performed. Currently it is considered that there are high correlations between them.(e) OthersDue to the fact that counterparties to Toyota Industries represent major fi nancial institutions which have high creditworthiness, Toyota Industries believes that the overall credit risk related to its fi nancial instruments is insignifi cant.
(16) Appropriation of retained earningsIn the accompanying consolidated statements of shareholders’ equity, the approved amount during the relevant fi scal year is refl ected for the appropriation of retained earnings of consolidated subsidiaries. In Japan, the payment of bonuses to directors and corporate auditors is made out of retained earnings through an appropriation, instead of being charged to income for the year.
(17) Income taxesThe provision for income taxes is computed based on the pretax income included in the consolidated statements of income. The asset and liability approach is used to recognize deferred tax liabilities and assets for the expected future tax consequences of temporary differences between the carrying amounts and the tax bases of assets and liabilities. Valuation allowances are recorded to reduce deferred tax assets when it is more likely than not that a tax benefi t will not be realized.
(18) Net income per shareThe computation of basic net income per share is based on the weighted-average number of outstanding shares of common stock. The calculation of diluted net income per share is similar to the calculation of basic net income per share, except that the weighted-average number of shares outstanding includes the additional dilution from potential common stock equivalents such as convertible bonds. Cash dividends per share shown in the statements of income are the amounts applicable to the respective years.
For the year ended March 31, 2005 Impairment of fi xed assetsToyota Industries has applied Accounting Standards for Impairment of Fixed Assets (Opinions Concerning Establishment of Accounting Standards for Impairment of Fixed Assets) issued on August 9, 2002 by the Business Accounting Council in Japan, and the application guideline for Accounting Standards for Impairment
of Fixed Assets (the Financial Accounting Standard Implementation Guideline No. 6 issued on October 31, 2003), to the consolidated fi nancial statements for fi scal 2005, as early adoption of such standards and guidelines, which are effective for fi scal years beginning on and after April 1, 2005, was permitted for the consolidated accounting for the fi scal year ended March 31, 2005.

82 Toyota Industries Corporation Annual Report 2006
4. Marketable securities:
(1) As of and for the year ended March 31, 2006:(a) Other securities with readily determinable fair value as of March 31, 2006 are as follows:
In this year, Toyota Industries recorded ¥1,487 million (US$12,659 thousand) of impairment on an equity security included in securities with carrying amount not exceeding the cost lines.
(b) Other securities sold during the year ended March 31, 2006 are as follows:
Securities with carrying amount
exceeding acquisition cost:
Stocks ¥212,297 ¥1,956,654 ¥1,744,357 $1,807,245 $16,656,627 $14,849,382
Subtotal 212,297 1,956,654 1,744,357 1,807,245 16,656,627 14,849,382
Securities with carrying amount
not exceeding acquisition cost:
Stocks 1,808 1,339 (469) 15,391 11,399 (3,992)
Subtotal 1,808 1,339 (469) 15,391 11,399 (3,992)
Total ¥214,105 ¥1,957,993 ¥1,743,888 $1,822,636 $16,668,026 $14,845,390
Millions of yen Thousands of U.S. dollars
Acquisitioncost
Carryingamount Difference Acquisition
costCarryingamount Difference
Realized lossesRealized gainsProceeds
Thousands of U.S. dollars
Realized lossesRealized gainsProceeds
Millions of yen
¥2,517 ¥1,280 ¥2 $21,427 $10,896 $17
Thousands ofU.S. dollarsMillions of yen
Carrying amount
Other securities
Domestic unlisted stocks excluding over-the-counter stocks ¥17,800 $151,528
Money management funds 45,003 383,102
(c) The carrying amount of securities (excluding held-to-maturity bonds which are included within securities with fair value) without readily determinable fair values as of March 31, 2006 are as follows:
(d) Redemption schedule of se cu ri ties which have maturities within other securities as of March 31, 2006 is as follows:
Over 5 yearswithin
10 yearsOver
10 years
Over 1 yearwithin
5 yearsWithin1 year
Over 5 yearswithin
10 yearsOver
10 years
Over 1 yearwithin
5 yearsWithin1 year
Thousands of U.S. dollarsMillions of yen
Bonds
Government bonds ¥0 ¥– ¥– ¥– $0 $– $– $–
Total ¥0 ¥– ¥– ¥– $0 $– $– $–

83Toyota Industries Corporation Annual Report 2006
(2) As of and for the year ended March 31, 2005:(a) Other securities with readily determinable fair value as of March 31, 2005 are as follows:
In this year, Toyota Industries recorded ¥35 million of impairment on an equity security included in securities with carrying amount not exceeding the cost lines.
(b) Other securities sold during the year ended March 31, 2005 are as follows:
Other securities
Domestic unlisted stocks excluding over-the-counter stocks ¥18,288
Money management funds 40,006
(c) The carrying amount of securities (excluding held-to-maturity bonds which are included within securities with fair value) without readily determinable fair values as of March 31, 2005 are as follows:
(d) Redemption schedule of securities which have maturities within other securities as of March 31, 2005 is as follows:
Bonds
Government bonds and municipal bonds, etc. ¥– ¥– ¥0 ¥–
Other bonds 1 – – –
Total ¥1 ¥– ¥0 ¥–
Securities with carrying amount exceeding acquisition cost:
Stocks ¥191,932 ¥1,177,188 ¥985,256
Subtotal 191,932 1,177,188 985,256
Securities with carrying amount not exceeding acquisition cost:
Stocks 3,348 2,911 (437)
Bonds
Government and municipal bonds, etc. 0 0 0
Other bonds 1 1 0
Subtotal 3,349 2,912 (437)
Total ¥195,281 ¥1,180,100 ¥984,819
Over 5 yearswithin
10 yearsOver
10 years
Over 1 yearwithin
5 yearsWithin1 year
Millions of yen
Carrying amount
Millions of yen
¥3,189 ¥1,789 ¥32
Realized lossesRealized gainsProceeds
Millions of yen
DifferenceCarryingamount
Acquisitioncost
Millions of yen

84 Toyota Industries Corporation Annual Report 2006
5. Inventories
The Company:
2.70% bonds due 2008 without collateral ¥ 30,000 ¥ 30,000 $ 255,384
2.15% bonds due 2008 without collateral 20,000 20,000 170,256
1.50% bonds due 2006 without collateral 15,000 15,000 127,693
1.94% bonds due 2009 without collateral 15,000 15,000 127,693
1.25% bonds due 2005 without collateral – 20,000 –
1.91% bonds due 2010 without collateral 20,000 20,000 170,256
0.41% bonds due 2007 without collateral 30,000 30,000 255,384
1.13% bonds due 2012 without collateral 50,000 50,000 425,641
1.03% bonds due 2012 without collateral 30,000 30,000 255,384
1.46% bonds due 2014 without collateral 20,000 20,000 170,256
1.01% bonds due 2010 without collateral 20,000 – 170,256
1.66% bonds due 2015 without collateral 30,000 – 255,384
Consolidated subsidiaries:
1.80% bonds due 2005 – 300 –
0.49-0.87% medium-term notes due 2009-2010 18,832 – 160,314
Long-term bank loans 109,268 77,522 930,178
Less: current portion of long-term debt (18,000) (24,330) (153,231)
Total ¥390,100 ¥303,492 $3,320,848
6. Long-term debt(1) Long-term debt as of March 31, 2006 and 2005 consists of the following:
(2) Annual maturities of long-term debt as of March 31, 2006 are as follows:
Year ending March 31
2007 ¥ 18,000 $ 153,231
2008 66,827 568,886
2009 22,118 188,286
2010 32,291 274,887
2011 51,188 435,754
2012 and thereafter 217,676 1,853,035
Total ¥408,100 $3,474,079
Inventories as of March 31, 2006 and 2005 consist of the following:
Finished goods ¥ 40,703 ¥35,616 $346,497
Raw materials 16,097 15,331 137,031
Work in process 37,089 34,587 315,731
Supplies 10,645 8,490 90,619
Total ¥104,534 ¥94,024 $889,878
200620052006
Millions of yenThousands of
U.S. dollars
200620052006
Millions of yenThousands of
U.S. dollars
Thousands ofU.S. dollarsMillions of yen

85Toyota Industries Corporation Annual Report 2006
Other current liabilities ¥20,806 ¥19,966 $177,118
Short-term bank loans 363 3,158 3,090
Current portion of bonds – 300 –
Long-term bank loans 156 2,685 1,328
Total ¥21,325 ¥26,109 $181,536
(2) Se cured li a bil i ties as of March 31, 2006 and 2005 are as follows:
Investments in securities ¥57,035 ¥33,345 $485,528
Buildings and structures 1,798 3,155 15,306
Land 2,953 3,798 25,138
Trade notes and ac counts receivable 245 1,033 2,086
Other – 41 –
Total ¥62,031 ¥41,372 $528,058
(1) Assets pledged as collateral as of March 31, 2006 and 2005 are as follows:
7. Assets pledged as collateral
Guarantees given by the Company ¥1,000 ¥25,401 $ 8,513
Guarantees given by consolidated subsidiaries 1,180 700 10,045
Guarantee forwards given by the Company 544 2,954 4,631
Toyota Industries is contingently liable for guarantees as of March 31, 2006 and 2005 as follows:
8. Contingent liabilities
Hyogo One idle property Building ¥ 28
Land 338
Tochigi One idle property Land 86
Nagano One idle property Land 59
Kagawa One idle property Land 48
Total ¥559
Region Items Details of Fixed assets
200620052006
Millions of yenThousands of
U.S. dollars
200620052006
Millions of yenThousands of
U.S. dollars
200620052006
Millions of yenThousands of
U.S. dollars
2005
Millions of yen
9. Impairment loss of fi xed assets

86 Toyota Industries Corporation Annual Report 2006
10. Shareholders’ equityUnder the Japanese Commercial Code, amounts equal to at least 10% of the sum of the cash dividends and other external appropriations paid by the Company and its domestic subsidiaries must be set aside as a legal reserve until it equals 25% of common stock. The legal reserve may be used to reduce a defi cit or may be transferred to common stock by taking appropriate corporate action. In consolidation, the legal reserves of the Company and its domestic subsidiaries are accounted for as retained earnings. A year-end cash dividend is approved at the Ordinary General Meeting of Shareholders of the Company held
after the close of the fi scal year to which the dividend is applicable. In addition, interim cash dividends may be paid upon resolution of the Board of Directors, subject to limitations imposed by the Japanese Commercial Code. Proceeds from the conversion of convertible bonds have been accounted for in approximately equal amounts as common stock and capital surplus. At least 50% of the proceeds have been accounted for as common stock, in accordance with the provisions of the Japanese Commercial Code.
Research and development expenses, which are included in selling, general and administrative expenses and manufacturing costs, amounted to ¥31,166 million
(US$265,310 thousand), ¥30,051 million and ¥29,562 million for the years ended March 31, 2006, 2005 and 2004, respectively.
12. Other non-operating income and expenses
Other non-operating income:
Gain on sales of marketable securities ¥ 1,280 ¥ 1,659 ¥ 819 $ 10,896
Rental income of fi xed assets 2,110 1,932 1,833 17,962
Exchange gain 1,197 500 836 10,190
Gain on sales of fi xed assets 838 957 808 7,134
Sundries 5,631 4,510 4,873 47,936
Total ¥11,056 ¥ 9,558 ¥ 9,169 $ 94,118
Other non-operating expenses:
Loss on impairment of securities ¥ 1,469 ¥ 56 ¥ 251 $ 12,505
Depreciation 1,716 2,381 2,342 14,608
Loss on disposal of fi xed assets 4,488 2,381 3,523 38,206
Exchange loss 1,745 610 1,283 14,855
Bond issuance costs 201 205 502 1,711
Sundries 5,685 5,123 6,187 48,395
Total ¥15,304 ¥10,756 ¥14,088 $130,280
2006
Millions of yenThousands of
U.S. dollars
20042006 2005
11. Research and development expenses
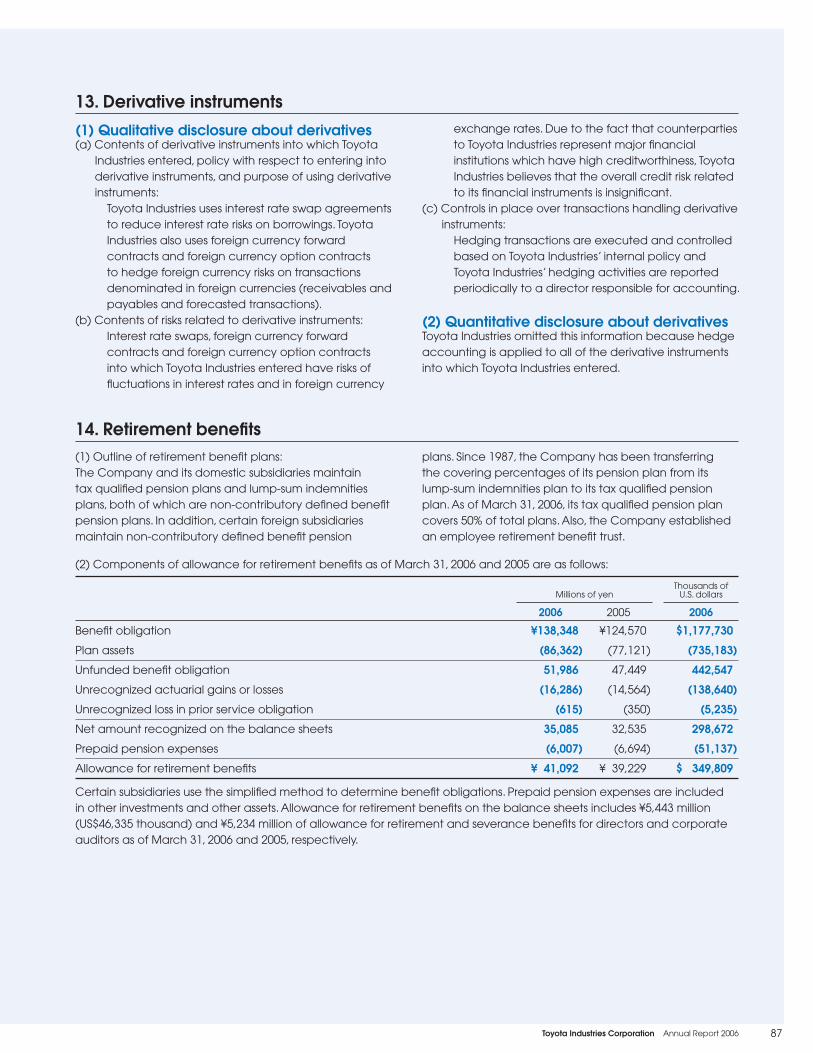
87Toyota Industries Corporation Annual Report 2006
13. Derivative instruments
(1) Qualitative disclosure about derivatives(a) Contents of derivative instruments into which Toyota
Industries entered, policy with respect to entering into derivative instruments, and purpose of using derivative instruments:
Toyota Industries uses interest rate swap agreements to reduce interest rate risks on borrowings. Toyota Industries also uses foreign currency forward contracts and foreign currency option contracts to hedge foreign currency risks on transactions denominated in foreign currencies (receivables and payables and forecasted transactions).
(b) Contents of risks related to derivative instruments: Interest rate swaps, foreign currency forward contracts and foreign currency option contracts into which Toyota Industries entered have risks of fl uctuations in interest rates and in foreign currency
exchange rates. Due to the fact that counterparties to Toyota Industries represent major fi nancial institutions which have high creditworthiness, Toyota Industries believes that the overall credit risk related to its fi nancial instruments is insignifi cant.
(c) Controls in place over transactions handling derivative instruments:
Hedging transactions are executed and controlled based on Toyota Industries’ internal policy and Toyota Industries’ hedging activities are reported periodically to a director responsible for accounting.
(2) Quantitative disclosure about derivativesToyota Industries omitted this information because hedge accounting is applied to all of the derivative instruments into which Toyota Industries entered.
Certain subsidiaries use the simplifi ed method to determine benefi t obligations. Prepaid pension expenses are included in other investments and other assets. Allowance for retirement benefi ts on the balance sheets includes ¥5,443 million (US$46,335 thousand) and ¥5,234 million of allowance for retirement and severance benefi ts for directors and corporate auditors as of March 31, 2006 and 2005, respectively.
(1) Outline of retirement benefi t plans:The Company and its domestic subsidiaries maintain tax qualifi ed pension plans and lump-sum indemnities plans, both of which are non-contributory defi ned benefi t pension plans. In addition, certain foreign subsidiaries maintain non-contributory defi ned benefi t pension
plans. Since 1987, the Company has been transferring the covering percentages of its pension plan from its lump-sum indemnities plan to its tax qualifi ed pension plan. As of March 31, 2006, its tax qualifi ed pension plan covers 50% of total plans. Also, the Company established an employee retirement benefi t trust.
(2) Components of allowance for retirement benefi ts as of March 31, 2006 and 2005 are as follows:
Benefi t obligation ¥138,348 ¥124,570 $1,177,730
Plan assets (86,362) (77,121) (735,183)
Unfunded benefi t obligation 51,986 47,449 442,547
Unrecognized actuarial gains or losses (16,286) (14,564) (138,640)
Unrecognized loss in prior service obligation (615) (350) (5,235)
Net amount recognized on the balance sheets 35,085 32,535 298,672
Prepaid pension expenses (6,007) (6,694) (51,137)
Allowance for retirement benefi ts ¥ 41,092 ¥ 39,229 $ 349,809
200620052006
Millions of yenThousands of
U.S. dollars
14. Retirement benefi ts

88 Toyota Industries Corporation Annual Report 2006
Method of attribution of estimated retirement benefi ts
to periods of employee service: Straight-line method
Discount rate 2.00% 2.00% 2.00%
Expected return on plan assets 3.00% 3.00% 3.00%
Amortization period of prior service obligation 6–11 years 6–11 years 6–11 years
Amortization period of unrecognized actuarial gains
or losses
20 years 20 years 20 years
(4) Assumptions used for calculation of retirement benefi ts for the years ended March 31, 2006, 2005 and 2004 are as follows:
(3) Components of retirement benefi t expenses for the years ended March 31, 2006, 2005 and 2004 are as follows:
Service cost ¥ 7,921 ¥ 7,446 ¥ 7,424 $ 67,430
Interest cost 4,079 3,987 4,559 34,724
Expected return on plan assets (2,436) (2,196) (822) (20,737)
Amortization of prior service obligation 95 85 79 809
Amortization of unrecognized actuarial gains or losses 779 1,030 1,854 6,631
Retirement ben e fi t expenses ¥10,438 ¥10,352 ¥13,094 $ 88,857
Retirement expenses of subsidiaries which adopted the simplifi ed method are included in service cost.
2006
Millions of yenThousands of
U.S. dollars
20042006 2005
20042006 2005
(5) Plan assets relating to welfare pension fund under multiemployer pension plan:Amounts of plan assets calculated based on proportion of contribution to the fund made by each domestic subsidiary are ¥11,214 million (US$95,463 thousand) and ¥8,226 million as of March 31, 2006 and 2005, respectively.
— Straight-line method over
the remaining service
period of employees
starting from the year
incurred
— Straight-line method over
the average remaining
service period of
employees starting from
following year

89Toyota Industries Corporation Annual Report 2006
15. Income taxes(1) The signifi cant components of deferred tax assets and liabilities as of March 31, 2006 and 2005 are as follows:
Deferred tax assets:
Allowance for retirement benefi ts ¥ 15,561 ¥ 12,842 $ 132,468
Trade receivables 2,867 5,270 24,406
Accrued expenses 6,739 6,049 57,368
Net operating loss carry-forwards for tax purposes 2,012 1,979 17,128
Depreciation 4,538 5,222 38,631
Securities 2,529 2,195 21,529
Enterprise tax payable 1,045 1,059 8,896
Other 14,119 15,962 120,192
Subtotal 49,410 50,578 420,618
Less — valuation allowance (2,705) (2,689) (23,027)
Total deferred tax assets 46,705 47,889 397,591
Deferred tax liabilities:
Other securities 695,355 392,618 5,919,426
Depreciation 6,004 5,355 51,111
Land 1,112 1,110 9,466
Reserve for advanced depreciation 520 537 4,426
Reserve for special depreciation 678 529 5,772
Other 3,460 5,981 29,454
Total deferred tax liabilities 707,129 406,130 6,019,655
Net deferred tax liabilities ¥(660,424) ¥(358,241) $(5,622,064)
Net deferred tax liabilities consist of the following components on the consolidated balance sheets.
Current assets — deferred tax assets ¥ 18,096 ¥ 20,379 $ 154,048
Investments and other assets — deferred tax assets 6,842 7,234 58,245
Current liabilities — deferred tax liabilities (3,858) (4,067) (32,842)
Long-term liabilities — deferred tax liabilities (681,504) (381,787) (5,801,515)
Net deferred tax liabilities ¥(660,424) ¥(358,241) $(5,622,064)
(2) Reconciliations of differences between the statutory rate of income taxes and the effective rate of income taxes for the years ended March 31, 2006, 2005 and 2004 are as follows:
Statutory rate of income taxes 39.9% 39.9% 41.2%
Addition (reduction) in taxes resulting from:
Dividends income and others permanently not recognized as taxable income (5.0) (3.8) (3.4)
Equity in earnings of affi liates – (3.8) –
Other 0.2 (0.7) (1.9)
Effective rate of income taxes 35.1% 31.6% 35.9%
200620052006
Millions of yenThousands of
U.S. dollars
200620052006
Millions of yenThousands of
U.S. dollars
200420052006

90 Toyota Industries Corporation Annual Report 2006
(b) Pro forma information regarding future minimum lease payments as of March 31, 2006 and 2005 is as follows:
16. Leases
(1) Finance leases (as a lessee) which do not transfer ownership of leased properties to lessees(a) Pro forma information regarding the leased properties such as acquisition cost and accumulated depreciation, which
are not refl ected in the accompanying consolidated balance sheets under fi nance leases as of March 31, 2006 and 2005, is as follows:
Machinery and equipment:
Acquisition cost equivalents ¥14,894 ¥13,791 $126,790
Accumulated depreciation equivalents 7,838 7,050 66,724
Machinery and equipment net balance equivalents 7,056 6,741 60,066
Tools, furniture and fi xtures:
Acquisition cost equivalents 13,603 12,146 115,800
Accumulated depreciation equivalents 6,866 6,232 58,449
Tools, furniture and fi xtures net balance equivalents 6,737 5,914 57,351
Software:
Acquisition cost equivalents 123 128 1,047
Accumulated depreciation equivalents 73 59 621
Software net balance equivalents 50 69 426
Total net leased properties ¥13,843 ¥12,724 $117,843
Acquisition cost equivalents include the imputed interest expense portion because the percentage which is computed by dividing future minimum lease payments by total balance of property, plant and equipment at year-end is immaterial.
Due within 1 year ¥ 4,254 ¥ 4,061 $ 36,214
Due after 1 year 9,589 8,663 81,629
Total ¥13,843 ¥12,724 $117,843
The amount equivalent to future minimum lease payments as of the end of the year includes the imputed interest expense portion because the percentage which is computed by dividing future minimum lease payments by total balance of property, plant and equipment at year-end is immaterial.
(c) Total lease payments for the years ended March 31, 2006, 2005 and 2004 are as follows:
2006 ¥5,236 $44,573
2005 4,927 –
2004 3,614 –
Pro forma depreciation expenses, which are not refl ected in the accompanying consolidated statements of income, are computed mainly by the straight-line method, which assumes zero residual value and leasing term to be useful lives for the years ended 2006, 2005 and 2004, and are equivalent to the amount of total lease payments of the above.
200620052006
Millions of yenThousands of
U.S. dollars
200620052006
Millions of yenThousands of
U.S. dollars
Millions of yenThousands of
U.S. dollars

91Toyota Industries Corporation Annual Report 2006
(2) Operating leases (as a lessee)Pro forma future lease payments under operating leases as of March 31, 2006 and 2005 are as follows:
Due within 1 year ¥ 4,367 ¥ 4,165 $ 37,175
Due after 1 year 12,273 17,392 104,478
Total ¥16,640 ¥21,557 $141,653
(3) Finance leases (as a lessor) which do not transfer ownership of leased properties to lessees(a) Information regarding leased properties such as acquisition cost and accumulated depreciation under fi nance leases
as of March 31, 2006 and 2005 is as follows:
Machinery and equipment:
Acquisition cost ¥7,356 ¥8,928 $62,620
Accumulated depreciation 4,030 5,221 34,307
Total net leased property ¥3,326 ¥3,707 $28,313
(b) Pro forma information regarding future minimum lease income as of March 31, 2006 and 2005 is as follows:
Due within 1 year ¥1,256 ¥1,750 $10,692
Due after 1 year 3,308 3,167 28,160
Total ¥4,564 ¥4,917 $38,852
The amount equivalent to future minimum lease income includes the imputed interest income portion because the percentage which is computed by dividing future minimum lease income by total balance of property, plant and equipment at year-end is immaterial.
(c) Total lease receipts and depreciation expenses for the years ended March 31, 2006 and 2005 are as follows:
Total lease payments to be received ¥1,703 ¥2,351 $14,497
Depreciation expenses 1,603 1,830 13,646
200620052006
Millions of yen Thousands of U.S. dollars
200620052006
Millions of yen
200620052006
Millions of yen
200620052006
Millions of yen
(4) Operating leases (as a lessor) Pro forma information regarding future minimum rentals under operating leases as of March 31, 2006 and 2005 is as follows:
Due within 1 year ¥10,722 ¥10,040 $ 91,274
Due after 1 year 21,612 16,382 183,979
Total ¥32,334 ¥26,422 $275,253
200620052006
Millions of yen
17. Subsequent event
Thousands of U.S. dollars
On June 22, 2006, the shareholders of the Company authorized payment of a year-end cash dividend to shareholders of record as of March 31, 2006 of ¥20 (US$0.17) per share, or a total of ¥6,386 million (US$54,363
thousand), and bonuses to directors and corporate auditors of ¥301 million (US$2,562 thousand). Cash dividends for the year totaled ¥38 (US$0.32) per share, including a semi-annual dividend of ¥18 (US$0.15).
Thousands of U.S. dollars
Thousands of U.S. dollars
Thousands of U.S. dollars

92 Toyota Industries Corporation Annual Report 2006
18. Segment information
(1) Business segmentsAs of and for the years ended March 31, 2006, 2005 and 2004:
Sales:
Automobile
Outside customer sales ¥ 746,796 ¥ 616,200 ¥ 603,863 $ 6,357,334
Intersegment transactions 20,768 18,223 15,698 176,794
767,564 634,423 619,561 6,534,128
Materials Handling Equipment
Outside customer sales 595,237 503,990 443,444 5,067,141
Intersegment transactions 482 149 138 4,103
595,719 504,139 443,582 5,071,244
Logistics
Outside customer sales 65,145 – – 554,567
Intersegment transactions 6,356 – – 54,107
71,501 – – 608,674
Textile Machinery
Outside customer sales 49,789 43,902 45,969 423,844
Intersegment transactions 23 25 16 196
49,812 43,927 45,985 424,040
Others
Outside customer sales 48,989 77,446 71,103 417,034
Intersegment transactions 20,851 21,579 14,132 177,501
69,840 99,025 85,235 594,535
Subtotal 1,554,436 1,281,514 1,194,363 13,232,621
Elimination of intersegment transactions (48,480) (39,976) (29,984) (412,701)
Total ¥1,505,956 ¥1,241,538 ¥1,164,379 $12,819,920
Operating costs and expenses:
Automobile ¥ 747,469 ¥ 611,660 ¥ 592,031 $ 6,363,063
Materials Handling Equipment 556,950 478,054 424,233 4,741,211
Logistics 69,914 – – 595,165
Textile Machinery 49,883 44,698 45,885 424,645
Others 66,107 93,782 79,485 562,756
Elimination of intersegment transactions (48,407) (39,776) (29,886) (412,080)
Total ¥1,441,916 ¥1,188,418 ¥1,111,748 $12,274,760
Operating income (loss):
Automobile ¥ 20,095 ¥ 22,763 ¥ 27,530 $ 171,065
Materials Handling Equipment 38,769 26,085 19,349 330,033
Logistics 1,587 – – 13,509
Textile Machinery (71) (771) 100 (605)
Others 3,733 5,243 5,750 31,779
Elimination of intersegment transactions (73) (200) (98) (621)
Total ¥ 64,040 ¥ 53,120 ¥ 52,631 $ 545,160
2006
Millions of yenThousands of
U.S. dollars
20042006 2005

93Toyota Industries Corporation Annual Report 2006
Automobile ............................................Passenger vehicles, diesel and gasoline engines, car air-conditioning compressorsMaterials handling equipment............Counterbalanced lift trucks, warehouse trucks, automated storage and retrieval systems, truck mount aerial work platformsLogistics ..................................................Transportation services, logistics planning, operation of distribution centers, collection and delivery of cash and management of
sales proceedsTextile machinery ..................................Ring spinning frames, air-jet looms, water-jet loomsOthers .....................................................Semiconductor package substrates
Assets:
Automobile ¥ 420,205 ¥ 407,436 ¥ 338,247 $ 3,577,126
Materials Handling Equipment 509,366 465,832 406,384 4,336,137
Logistics 106,356 – – 905,389
Textile Machinery 16,517 25,622 24,744 140,606
Others 103,083 148,712 100,626 877,526
Corporate assets or elimination 2,089,814 1,279,222 1,141,994 17,790,193
Total ¥3,245,341 ¥2,326,824 ¥2,011,995 $27,626,977
Depreciation and amortization:
Automobile ¥ 48,370 ¥ 37,075 ¥ 35,793 $ 411,765
Materials Handling Equipment 30,044 27,016 23,538 255,759
Logistics 3,310 – – 28,177
Textile Machinery 1,011 898 931 8,606
Others 4,544 5,215 5,443 38,682
Corporate or elimination of intersegment transactions 9 9 (353) 77
Total ¥ 87,288 ¥ 70,213 ¥ 65,352 $ 743,066
Capital expenditures:
Automobile ¥ 101,897 ¥ 92,692 ¥ 48,793 $ 867,430
Materials Handling Equipment 43,521 33,973 32,205 370,486
Logistics 4,046 – – 34,443
Textile Machinery 731 1,613 1,204 6,223
Others 8,620 8,223 7,749 73,380
Corporate or elimination of intersegment transactions 21 5 (442) 179
Total ¥ 158,836 ¥ 136,506 ¥ 89,509 $ 1,352,141
Main products of each segment are as follows:
Changes in business segmentThe logistics-related business, which was included in the Others Segment until the previous fi scal year, has been separated and declared independently as the Logistics Segment starting from this fi scal year. In fi scal 2005, the Logistics Segment posted net sales of ¥37,913 million, an operating loss of ¥650 million, assets of ¥78,951 million, depreciation and amortization of ¥1,323 million and capital expenditures of ¥2,930 million.
2006
Millions of yenThousands of
U.S. dollars
20042006 2005
Corporate assets included in corporate assets or elimination consist mainly of cash and cash equivalents, short-term investments and investments in securities held by the Company.
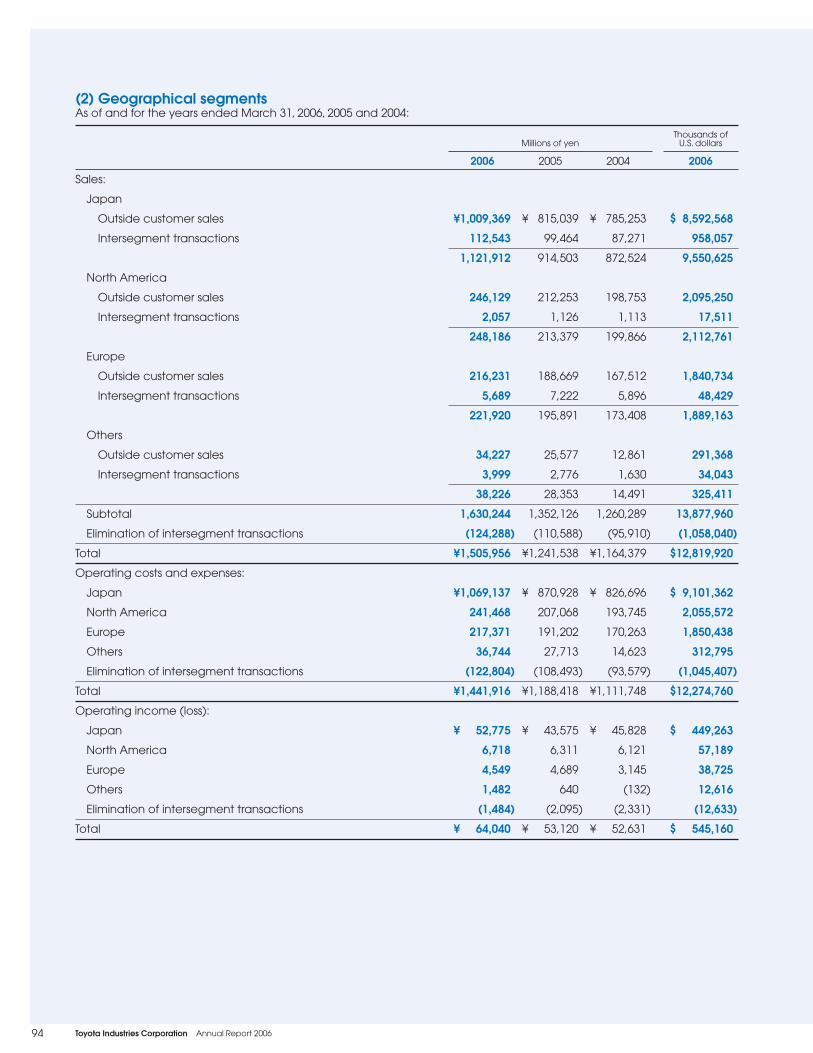
94 Toyota Industries Corporation Annual Report 2006
(2) Geographical segmentsAs of and for the years ended March 31, 2006, 2005 and 2004:
Sales:
Japan
Outside customer sales ¥1,009,369 ¥ 815,039 ¥ 785,253 $ 8,592,568
Intersegment transactions 112,543 99,464 87,271 958,057
1,121,912 914,503 872,524 9,550,625
North America
Outside customer sales 246,129 212,253 198,753 2,095,250
Intersegment transactions 2,057 1,126 1,113 17,511
248,186 213,379 199,866 2,112,761
Europe
Outside customer sales 216,231 188,669 167,512 1,840,734
Intersegment transactions 5,689 7,222 5,896 48,429
221,920 195,891 173,408 1,889,163
Others
Outside customer sales 34,227 25,577 12,861 291,368
Intersegment transactions 3,999 2,776 1,630 34,043
38,226 28,353 14,491 325,411
Subtotal 1,630,244 1,352,126 1,260,289 13,877,960
Elimination of intersegment transactions (124,288) (110,588) (95,910) (1,058,040)
Total ¥1,505,956 ¥1,241,538 ¥1,164,379 $12,819,920
Operating costs and expenses:
Japan ¥1,069,137 ¥ 870,928 ¥ 826,696 $ 9,101,362
North America 241,468 207,068 193,745 2,055,572
Europe 217,371 191,202 170,263 1,850,438
Others 36,744 27,713 14,623 312,795
Elimination of intersegment transactions (122,804) (108,493) (93,579) (1,045,407)
Total ¥1,441,916 ¥1,188,418 ¥1,111,748 $12,274,760
Operating income (loss):
Japan ¥ 52,775 ¥ 43,575 ¥ 45,828 $ 449,263
North America 6,718 6,311 6,121 57,189
Europe 4,549 4,689 3,145 38,725
Others 1,482 640 (132) 12,616
Elimination of intersegment transactions (1,484) (2,095) (2,331) (12,633)
Total ¥ 64,040 ¥ 53,120 ¥ 52,631 $ 545,160
2006
Millions of yenThousands of
U.S. dollars
20042006 2005

95Toyota Industries Corporation Annual Report 2006
(3) Overseas salesFor the years ended March 31, 2006, 2005 and 2004:
Overseas sales:
North America ¥ 247,958 ¥ 208,676 ¥ 196,861 $ 2,110,820
Europe 249,237 225,409 211,081 2,121,707
Others 123,751 104,918 89,415 1,053,469
Total ¥ 620,946 ¥ 539,003 ¥ 497,357 $ 5,285,996
Total sales ¥1,505,956 ¥1,241,538 ¥1,164,379 $12,819,920
Ratio of overseas sales to total sales (%):
North America 16.5% 16.8% 16.9%
Europe 16.5 18.2 18.1
Others 8.2 8.4 7.7
Total 41.2% 43.4% 42.7%
North America ...................................U.S.A., CanadaEurope ................................................Germany, France, ItalyOthers .................................................Australia, China, India
Assets:
Japan ¥ 834,717 ¥ 788,828 ¥ 643,180 $ 7,105,788
North America 179,116 151,048 136,830 1,524,781
Europe 278,825 264,274 238,388 2,373,585
Others 48,207 33,640 22,082 410,377
Corporate assets or elimination 1,904,476 1,089,034 971,515 16,212,446
Total ¥3,245,341 ¥2,326,824 ¥2,011,995 $27,626,977
North America ...................................U.S.A., CanadaEurope ................................................Sweden, France, GermanyOthers .................................................Australia, China, India
Corporate assets included in corporate assets or elimination consist mainly of cash and cash equivalents, short-term investments and investments in securities held by the Company.
2006
Millions of yenThousands of
U.S. dollars
20042006 2005
Signifi cant countries or areas belonging to each segment as of March 31, 2006 are as follows:
2006
Millions of yenThousands of
U.S. dollars
20042006 2005
Signifi cant countries or areas belonging to each segment as of March 31, 2006 are as follows:

96 Toyota Industries Corporation Annual Report 2006
19. Related party transactions
Toyota Motor Corporation ¥527,020 ¥414,235 ¥406,267 $4,486,422
Toyota Motor Corporation held 24.02% of the Company’s voting rights as of March 31, 2006. The above transactions were carried out on commercial terms and conditions.
(2) Purchase of goods and services for the years ended March 31, 2006, 2005 and 2004 were as follows:Purchase of goods:
Toyota Motor Corporation ¥370,566 ¥285,019 ¥285,412 $3,154,559
Purchase of services:
Toyota Industries Health Insurance Society ¥62 ¥60 ¥66 $528
Toyota Medical Corporation 46 46 37 392
Toyota Technological Institute 50 50 50 426
Toyota Industries Health Insurance Society’s chairman as of March 31, 2006, 2005 and 2004 is Shiro Endo, who is a director of the Company and holds 0.01% of the Company’s shares. Toyota Medical Corporation’s chairman as of March 31, 2006, 2005 and 2004 is Yoshitoshi Toyoda, who is a director of the Company and holds 0.06% of the Company’s shares. Toyota Technological Institute’s chairman as of March 31, 2006, 2005 and 2004 is Tatsuro Toyoda, who is a director of the Company and holds 0.08% of the Company’s shares. The transactions above were carried out on commercial terms and conditions.
(3) Outstanding balances arising from sale/purchase of goods/services as of March 31, 2006 and 2005 are as follows:Receivables from a related party:
Toyota Motor Corporation ¥32,600 ¥31,594 $277,518
Payable to a related party:
Toyota Motor Corporation ¥46,965 ¥35,780 $399,804
The following trasactions were carried out with related parties:
2006
Millions of yenThousands of
U.S. dollars
20042006 2005
2006
Millions of yenThousands of
U.S. dollars
20042006 2005
2006
Millions of yenThousands of
U.S. dollars
20042006 2005
(1) Sales of goods and services for the years ended March 31, 2006, 2005 and 2004 were as follows:
200620052006
Millions of yenThousands of
U.S. dollars
200620052006
Millions of yenThousands of
U.S. dollars
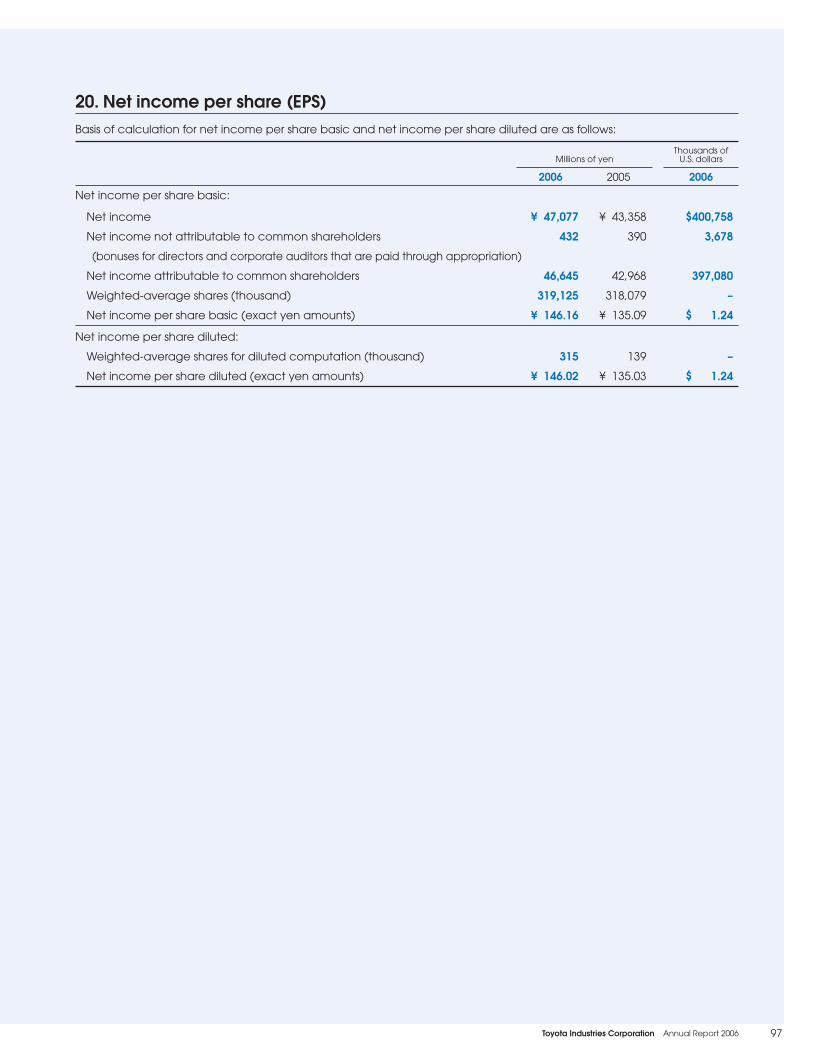
97Toyota Industries Corporation Annual Report 2006
20. Net income per share (EPS)Basis of calculation for net income per share basic and net income per share diluted are as follows:
Net income per share basic:
Net income ¥ 47,077 ¥ 43,358 $400,758
Net income not attributable to common shareholders 432 390 3,678
(bonuses for directors and corporate auditors that are paid through appropriation)
Net income attributable to common shareholders 46,645 42,968 397,080
Weighted -average shares (thousand) 319,125 318,079 –
Net income per share basic (exact yen amounts) ¥ 146.16 ¥ 135.09 $ 1.24
Net income per share diluted:
Weighted-average shares for diluted computation (thousand) 315 139 –
Net income per share diluted (exact yen amounts) ¥ 146.02 ¥ 135.03 $ 1.24
200620052006
Millions of yenThousands of
U.S. dollars
98 Toyota Industries Corporation Annual Report 2006
To the Board of Directors and Shareholders of
Toyota Industries Corporation
We have audited the accompanying consolidated balance sheets of Toyota Industries
Corporation and its consolidated subsidiaries as of March 31, 2005 and 2006, and the related
consolidated statements of income, shareholders’ equity, and cash fl ows for each of the three
years in the period ended March 31, 2006, all expressed in Japanese Yen. These consolidated
fi nancial statements are the responsibility of the Company’s management. Our responsibility is
to express an opinion on these consolidated fi nancial statements based on our audits.
We conducted our audits in accordance with auditing standards generally accepted in
Japan. Those standards require that we plan and perform the audit to obtain reasonable
assurance about whether the consolidated fi nancial statements are free of material
misstatement. An audit includes examining, on a test basis, evidence supporting the amounts
and disclosures in the consolidated fi nancial statements. An audit also includes assessing
the accounting principles used and signifi cant estimates made by management, as well as
evaluating the overall consolidated fi nancial statement presentation. We believe that our
audits provide a reasonable basis for our opinion.
In our opinion, the consolidated fi nancial statements referred to above present fairly, in all
material respects, the consolidated fi nancial position of Toyota Industries Corporation and its
consolidated subsidiaries as of March 31, 2005 and 2006, and the consolidated results of their
operations and their cash fl ows for each of the three years in the period ended March 31,
2006 in conformity with accounting principles generally accepted in Japan.
The amounts expressed in U.S. dollars, which are provided solely for the convenience of
the reader, have been translated on the basis set forth in Note 1 to the accompanying
consolidated fi nancial statements.
ChuoAoyama PricewaterhouseCoopers
Nagoya, Japan
June 22, 2006
Report of Independent Auditors
Report of Independent Auditors

99Toyota Industries Corporation Annual Report 2006
Toyota Industries in Numbers

100 Toyota Industries Corporation Annual Report 2006
0
(¥ Billion)(¥ Billion)
05 06040302FY
Net Sales, Ordinary Income andOrdinary Income Ratio
0
200
100
150
50
2,000
1,000
1,500
500
5.1%5.7% 5.4%
4.9% 4.8%
Ordinary income ratioNet sales (left) Ordinary income (right)
040302FY
Depreciation and Amortization
005 06
(¥ Billion)
75
100
50
25
Automobile Materials Handling Equipment Logistics OthersTextile Machinery
(¥ Billion)
50
150
200
100
Capital Expenditures
0040302FY 0605 Automobile Materials Handling Equipment Logistics OthersTextile Machinery
(¥ Billion)
040302FY
40
30
20
10
R&D Expenses andR&D Expenses to Net Sales Ratio
0
(%)4
3
2
1
005 06 Automobile Materials Handling Equipment Textile Machinery Others (left)
R&D expenses to net sales ratio (right)
Net sales ¥980,163 ¥1,069,219 ¥1,164,379 ¥1,241,538 ¥1,505,956Ordinary income 47,866 51,375 58,971 70,913 80,635Ordinary income ratio (%) 4.9 4.8 5.1 5.7 5.4
Millions of yen
20062005200420032002
Depreciation and amortization: ¥55,174 ¥59,154 ¥65,352 ¥70,213 ¥87,288Automobile Segment 33,403 34,157 35,793 37,075 48,370Materials Handling Equipment Segment 18,882 20,801 23,538 27,016 30,044Logistics Segment – – – – 3,310Textile Machinery Segment 797 1,006 931 898 1,011Others Segment (including corporate
or elimination)
2,092 3,190 5,090 5,224 4,553
Millions of yen
20062005200420032002
Capital expenditures: ¥88,320 ¥87,559 ¥89,509 ¥136,506 ¥158,836Automobile Segment 61,023 49,380 48,793 92,692 101,897Materials Handling Equipment Segment 26,337 24,350 32,205 33,973 43,521Logistics Segment – – – – 4,046Textile Machinery Segment 523 2,164 1,204 1,613 731Others Segment (including corporate
or elimination)
437 11,665 7,307 8,228 8,641
Millions of yen
20062005200420032002
R&D expenses: ¥29,985 ¥29,705 ¥29,562 ¥30,051 ¥31,166Automobile Segment 18,060 18,748 15,755 17,214 16,578Materials Handling Equipment Segment 9,246 9,298 10,651 10,976 12,855Logistics Segment – – – – –Textile Machinery Segment 1,335 1,053 1,164 1,030 732Others Segment (including corporate
or elimination)
1,344 606 1,992 831 1,001
R&D expenses to net sales ratio (%) 3.1 2.8 2.5 2.4 2.1
Millions of yen
20062005200420032002
Toyota Industries in Numbers
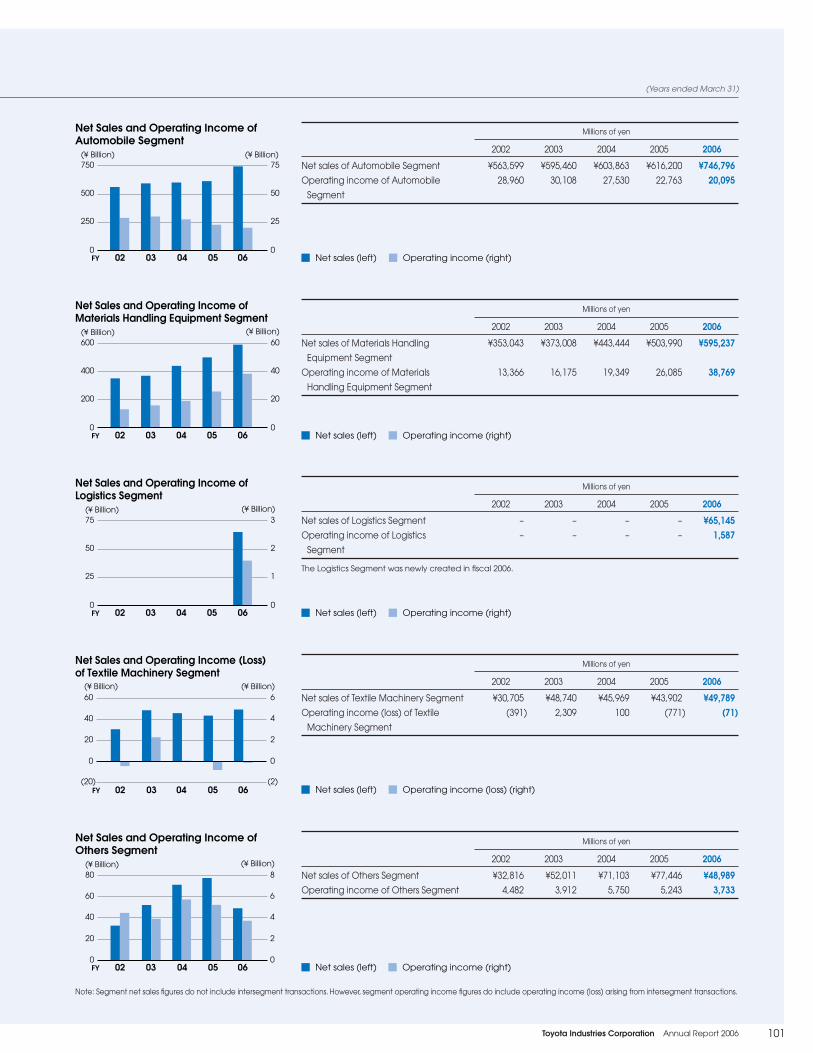
101Toyota Industries Corporation Annual Report 2006
040302FY
Net Sales and Operating Income of Materials Handling Equipment Segment
0
200
400
600
20
40
60
0
(¥ Billion)
05 06
(¥ Billion)
Net sales (left) Operating income (right)040302FY
Net Sales and Operating Income of Automobile Segment
0
250
500
750
0
25
50
75(¥ Billion) (¥ Billion)
05 06
040302FY
Net Sales and Operating Income of Others Segment
0
20
40
80
60
0
2
8
6
4
(¥ Billion)
05 06
(¥ Billion)
(20) (2)
Net Sales and Operating Income (Loss) of Textile Machinery Segment
(¥ Billion)(¥ Billion)
040302FY 05 06
0 0
6
220
440
60
Net sales of Automobile Segment ¥563,599 ¥595,460 ¥603,863 ¥616,200 ¥746,796Operating income of Automobile
Segment
28,960 30,108 27,530 22,763 20,095
Millions of yen
20062005200420032002
Net sales of Materials Handling
Equipment Segment
¥353,043 ¥373,008 ¥443,444 ¥503,990 ¥595,237
Operating income of Materials
Handling Equipment Segment
13,366 16,175 19,349 26,085 38,769
Millions of yen
20062005200420032002
Net sales of Others Segment ¥32,816 ¥52,011 ¥71,103 ¥77,446 ¥48,989Operating income of Others Segment 4,482 3,912 5,750 5,243 3,733
Millions of yen
20062005200420032002
Note: Segment net sales fi gures do not include intersegment transactions. However, segment operating income fi gures do include operating income (loss) arising from intersegment transactions.
Net sales (left) Operating income (right)
Millions of yen
20062005200420032002
Net sales of Textile Machinery Segment ¥30,705 ¥48,740 ¥45,969 ¥43,902 ¥49,789Operating income (loss) of Textile
Machinery Segment
(391) 2,309 100 (771) (71)
Net sales (left) Operating income (loss) (right)
Net sales (left) Operating income (right)
040302FY
Net Sales and Operating Income of Logistics Segment
0
25
50
75
1
2
3
0
(¥ Billion)
05 06
(¥ Billion)
Net sales of Logistics Segment – – – – ¥65,145Operating income of Logistics
Segment
– – – – 1,587
Millions of yen
20062005200420032002
Net sales (left) Operating income (right)
(Years ended March 31)
The Logistics Segment was newly created in fi scal 2006.

102 Toyota Industries Corporation Annual Report 2006
ROE ROA05 06040302FY
ROE and ROA
(%)
2
4
0
6
Basic Diluted040302FY
50
100
Net Income per Share
0
150(¥)
05 06
Shareholders’ equity (left) Debt/equity ratio (right) Interest-bearing debt (left)
(¥)
040302FY
Shareholders’ Equity per Share
05 06
4,000
6,000
2,000
0
0 0
100
75
50
25500
1,000
1,500
2,000
Interest-Bearing Debt, Shareholders’ Equity and Debt/Equity Ratio
(%)(¥ Billion)
FY 040302 05 06
Return on equity (ROE) 3.0 2.7 3.8 4.1 3.5Return on assets (ROA) 1.5 1.3 1.8 2.0 1.7
%
20062005200420032002
Net income per share — basic ¥87.28 ¥70.19 ¥108.04 ¥135.09 ¥146.16Net income per share — diluted 78.26 62.90 101.97 135.03 146.02
Yen
20062005200420032002
Interest-bearing debt ¥315,354 ¥410,622 ¥ 320,967 ¥ 383,737 ¥ 473,709Shareholders’ equity 878,812 738,868 1,016,764 1,115,747 1,611,227Debt/equity ratio (%) 35.9 55.6 31.6 34.4 29.4
Millions of yen
20062005200420032002
Shareholders’ equity per share ¥2,809.54 ¥2,522.52 ¥3,199.69 ¥3,504.80 ¥5,044.5
Yen
20062005200420032002
Toyota Industries in Numbers

103Toyota Industries Corporation Annual Report 2006
Payout ratio (right)Cash dividends per share (left)0402FY
40
30
10
20
Cash Dividends per Share andConsolidated Payout Ratio
0 0
10
20
30
40
50 50(%)(¥)
03 05 06
1,000
1,500
2,000
500
(¥ Billion)
040302FY
Market Capitalization
05 060
PER (left) PBR (right)05 06040302FY
PER and PBR
(Times)
20
10
30
0
40(Times)
0.5
0.25
0.75
0
1.0
40
10
30
20
(Thousands)
040302FY
Number of Employees
05 060
Cash dividends per share ¥19.00 ¥22.00 ¥24.00 ¥32.00 ¥38.00Payout ratio (%) 21.8 31.3 22.2 23.7 26.0
Yen
20062005200420032002
Market capitalization ¥649,052 ¥513,824 ¥786,223 ¥961,075 ¥1,535,931
Millions of yen
20062005200420032002
Price/earnings ratio (PER) 23.8 25.0 22.9 22.4 32.9Price/book value ratio (PBR) 0.7 0.7 0.8 0.9 1.0
Times
20062005200420032002
Number of employees 23,056 25,030 27,431 30,990 32,977
Persons
20062005200420032002
(Years ended March 31)

104 Toyota Industries Corporation Annual Report 2006
Toyota Motor Corporation 24.02
DENSO Corporation 9.29
The Master Trust Bank of Japan, Ltd. 6.14
Towa Real Estate Co., Ltd. 4.92
Third Avenue Fund-Custodial Trust Company 4.35
Bank of Bermuda Limited, Hamilton 2.71
Toyota Tsusho Corporation 2.31
State Street Bank and Trust Company 2.28
Nippon Life Insurance Company 2.11
Aisin Seiki Co., Ltd. 2.06
% of Voting rights
Transfer AgentMitsubishi UFJ Trust and Banking Corporation
1-4-5, Marunouchi, Chiyoda-ku, Tokyo-to, 100-8212, Japan
Telephone: +81-(0)3-3212-1211
Corporate Head Offi ceTOYOTA INDUSTRIES CORPORATION
2-1, Toyoda-cho, Kariya-shi, Aichi-ken,
448-8671, Japan
Telephone: +81-(0)566-22-2511
Facsimile: +81-(0)566-27-5650
Date of EstablishmentNovember 18, 1926
Common StockNo par value
Authorized: 1,091,245,000 shares
Issued: 325,840,640 shares
Stock Exchange ListingsTokyo, Osaka and Nagoya (Ticker Code: 6201)
Number of Shareholders18,762
Common Stock Price and Trading Volume (Tokyo Stock Exchange)
Major Share hold ers
30,000
40,000
50,000
20,000
10,000
0
2,000
3,000
4,000
1,000
0
5,000
(yen) (Thousand shares)
White: Closing Price > Opening PriceBlack: Opening Price > Closing Price
High
Low
ClosingOpening
High
Low
OpeningClosing
107 1/03 1/04 1/054 7 10 4 7 10 4 107 1/061/024/01 4107
Common stock price (left scale)
Trading volume (right scale)
Investor Information (As of March 31, 2006)

PublicationsOur Corporate Brochure and Social & Environmental Report are available in both English and Japanese upon written request to the Public Affairs Department at our Corporate Head Offi ce.
Internet Home PageUpdated information is published regularly on our Web site. (http://www.toyota-industries.com)
Further InformationFor further information, please write to the Investor Relations Offi ce at our Corporate Head Offi ce.
2-1, Toyoda-cho, Kariya-shi, Aichi-ken 448-8671, JapanTelephone: +81-(0)566-22-2511 Facsimile: +81-(0)566-27-5650www.toyota-industries.com
Printed in Japan
This annual report is printed on recycled paper using soy ink to minimize the impact on the environment.