sustainable use of industrial-waste as partial replacement of … · steel slag, copper slag,...
TRANSCRIPT
International Journal of Sustainable Built Environment (2016) 5, 484–516
HO ST E D BYGulf Organisation for Research and Development
International Journal of Sustainable Built Environment
ScienceDirectwww.sciencedirect.com
Review Article
Sustainable use of industrial-waste as partial replacementof fine aggregate for preparation of concrete – A review
Manoj Kumar Dash a,1, Sanjaya Kumar Patro b,⇑, Ashoke Kumar Rath a,2
aSchool of Civil Engineering, KIIT University, Bhubaneswar, Odisha, IndiabDepartment of Civil Engineering, VSS University of Technology, Burla, Odisha, India
Received 20 December 2015; accepted 20 April 2016
Abstract
Utilisation of industrial waste materials in concrete compensates the lack of natural resources, solving the disposal problem of wasteand to find alternative technique to safeguard the nature. There are a number of industrial wastes used as fully or partial replacement ofcoarse aggregate or fine aggregate. This review carries out a thorough assessment about industrial waste substances, which can be ade-quately utilised in concrete as fine aggregate substitution. This paper reviewed some of these industrial wastes like waste foundry sand,steel slag, copper slag, imperial smelting furnace slag (ISF slag), blast furnace slag, coal bottom ash, ferrochrome slag, palm oil clinkeretc. Out of these materials, maximum number of experiments have been conducted using waste foundry sand and copper slag as fineaggregate replacement, but still more examinations are required for other waste materials as replacement of sand in concrete. Differentphysical and mechanical properties of industrial waste as well as of industrial waste concrete, in which natural sand is substituted havebeen reviewed and comparisons are made between them. Deflection and leaching study review are carried out additionally and compared.It can be observed that the concrete where sand is replaced by copper slag, imperial smelting furnace slag, class F fly ash exhibitsimproved strength and durability properties, but it’s slump increases as the rate of replacement increases in the case of copper slagand the slump decreases in the case of class F fly ash. There is a less research work reported on ferrochrome slag and palm oil clinkerused as sand substitution, so it is felt that further detailed investigations are required.� 2016 The Gulf Organisation for Research and Development. Production and hosting by Elsevier B.V. This is an open access article under the CCBY-NC-ND license (http://creativecommons.org/licenses/by-nc-nd/4.0/).
Keywords: Industrial solid waste; Waste management; Waste foundry sand; Steel slag; Copper slag
http://dx.doi.org/10.1016/j.ijsbe.2016.04.006
2212-6090/� 2016 The Gulf Organisation for Research and Development. Production and hosting by Elsevier B.V.
This is an open access article under the CC BY-NC-ND license (http://creativecommons.org/licenses/by-nc-nd/4.0/).
⇑ Corresponding author. Cell: +91 9439502377.E-mail addresses: [email protected] (M.K. Dash), [email protected] (S.K. Patro), [email protected] (A.K. Rath).
1 Cell:+91 9438244644.2 Cell:+91 8763054230.
Peer review under responsibility of The Gulf Organisation for Research and Development.

M.K. Dash et al. / International Journal of Sustainable Built Environment 5 (2016) 484–516 485
Contents
1. Introduction . . . . . . . . . . . . . . . . . . . . . . . . . . . . . . . . . . . . . . . . . . . . . . . . . . . . . . . . . . . . . . . . . . . . . . . . . . . . . . . 4862. Physical properties of industrial wastes as fine aggregate . . . . . . . . . . . . . . . . . . . . . . . . . . . . . . . . . . . . . . . . . . . . . . . . 490
2.1. Shape and appearance . . . . . . . . . . . . . . . . . . . . . . . . . . . . . . . . . . . . . . . . . . . . . . . . . . . . . . . . . . . . . . . . . . . 4902.2. Particle gradation . . . . . . . . . . . . . . . . . . . . . . . . . . . . . . . . . . . . . . . . . . . . . . . . . . . . . . . . . . . . . . . . . . . . . . 4902.3. Specific gravity . . . . . . . . . . . . . . . . . . . . . . . . . . . . . . . . . . . . . . . . . . . . . . . . . . . . . . . . . . . . . . . . . . . . . . . . 4902.4. Bulk density . . . . . . . . . . . . . . . . . . . . . . . . . . . . . . . . . . . . . . . . . . . . . . . . . . . . . . . . . . . . . . . . . . . . . . . . . . 4902.5. Water absorption . . . . . . . . . . . . . . . . . . . . . . . . . . . . . . . . . . . . . . . . . . . . . . . . . . . . . . . . . . . . . . . . . . . . . . 490
3. Mechanical properties of industrial waste. . . . . . . . . . . . . . . . . . . . . . . . . . . . . . . . . . . . . . . . . . . . . . . . . . . . . . . . . . . 4924. Chemical properties . . . . . . . . . . . . . . . . . . . . . . . . . . . . . . . . . . . . . . . . . . . . . . . . . . . . . . . . . . . . . . . . . . . . . . . . . . 4955. Fresh properties of concrete . . . . . . . . . . . . . . . . . . . . . . . . . . . . . . . . . . . . . . . . . . . . . . . . . . . . . . . . . . . . . . . . . . . . 495
5.1. Slump test . . . . . . . . . . . . . . . . . . . . . . . . . . . . . . . . . . . . . . . . . . . . . . . . . . . . . . . . . . . . . . . . . . . . . . . . . . . 495
5.1.1. Waste foundry sand . . . . . . . . . . . . . . . . . . . . . . . . . . . . . . . . . . . . . . . . . . . . . . . . . . . . . . . . . . . . . . . 4955.1.2. Copper slag . . . . . . . . . . . . . . . . . . . . . . . . . . . . . . . . . . . . . . . . . . . . . . . . . . . . . . . . . . . . . . . . . . . . . 4955.1.3. Steel slag . . . . . . . . . . . . . . . . . . . . . . . . . . . . . . . . . . . . . . . . . . . . . . . . . . . . . . . . . . . . . . . . . . . . . . . 4955.1.4. Granulated blast furnace slag . . . . . . . . . . . . . . . . . . . . . . . . . . . . . . . . . . . . . . . . . . . . . . . . . . . . . . . . 4955.1.5. ISF slag . . . . . . . . . . . . . . . . . . . . . . . . . . . . . . . . . . . . . . . . . . . . . . . . . . . . . . . . . . . . . . . . . . . . . . . . 4955.1.6. Bottom ash . . . . . . . . . . . . . . . . . . . . . . . . . . . . . . . . . . . . . . . . . . . . . . . . . . . . . . . . . . . . . . . . . . . . . 4955.1.7. Ferrochrome slag . . . . . . . . . . . . . . . . . . . . . . . . . . . . . . . . . . . . . . . . . . . . . . . . . . . . . . . . . . . . . . . . . 4975.1.8. Class F fly ash . . . . . . . . . . . . . . . . . . . . . . . . . . . . . . . . . . . . . . . . . . . . . . . . . . . . . . . . . . . . . . . . . . . 4975.1.9. Palm oil clinker . . . . . . . . . . . . . . . . . . . . . . . . . . . . . . . . . . . . . . . . . . . . . . . . . . . . . . . . . . . . . . . . . . 4975.2. Compaction factor test . . . . . . . . . . . . . . . . . . . . . . . . . . . . . . . . . . . . . . . . . . . . . . . . . . . . . . . . . . . . . . . . . . 4975.3. Air content . . . . . . . . . . . . . . . . . . . . . . . . . . . . . . . . . . . . . . . . . . . . . . . . . . . . . . . . . . . . . . . . . . . . . . . . . . . 498
6. Leaching test . . . . . . . . . . . . . . . . . . . . . . . . . . . . . . . . . . . . . . . . . . . . . . . . . . . . . . . . . . . . . . . . . . . . . . . . . . . . . . . 4987. Density of concrete . . . . . . . . . . . . . . . . . . . . . . . . . . . . . . . . . . . . . . . . . . . . . . . . . . . . . . . . . . . . . . . . . . . . . . . . . . 498
7.1. Waste foundry sand . . . . . . . . . . . . . . . . . . . . . . . . . . . . . . . . . . . . . . . . . . . . . . . . . . . . . . . . . . . . . . . . . . . . 4987.2. Steel slag . . . . . . . . . . . . . . . . . . . . . . . . . . . . . . . . . . . . . . . . . . . . . . . . . . . . . . . . . . . . . . . . . . . . . . . . . . . . 4987.3. Copper slag . . . . . . . . . . . . . . . . . . . . . . . . . . . . . . . . . . . . . . . . . . . . . . . . . . . . . . . . . . . . . . . . . . . . . . . . . . 4987.4. ISF slag . . . . . . . . . . . . . . . . . . . . . . . . . . . . . . . . . . . . . . . . . . . . . . . . . . . . . . . . . . . . . . . . . . . . . . . . . . . . . 4987.5. Bottom ash. . . . . . . . . . . . . . . . . . . . . . . . . . . . . . . . . . . . . . . . . . . . . . . . . . . . . . . . . . . . . . . . . . . . . . . . . . . 4987.6. Class F type fly ash. . . . . . . . . . . . . . . . . . . . . . . . . . . . . . . . . . . . . . . . . . . . . . . . . . . . . . . . . . . . . . . . . . . . . 4997.7. Palm oil clinker. . . . . . . . . . . . . . . . . . . . . . . . . . . . . . . . . . . . . . . . . . . . . . . . . . . . . . . . . . . . . . . . . . . . . . . . 499
8. Hardened concrete properties . . . . . . . . . . . . . . . . . . . . . . . . . . . . . . . . . . . . . . . . . . . . . . . . . . . . . . . . . . . . . . . . . . . 499
8.1. Compressive strength. . . . . . . . . . . . . . . . . . . . . . . . . . . . . . . . . . . . . . . . . . . . . . . . . . . . . . . . . . . . . . . . . . . . 4998.1.1. Waste foundry sand . . . . . . . . . . . . . . . . . . . . . . . . . . . . . . . . . . . . . . . . . . . . . . . . . . . . . . . . . . . . . . . 4998.1.2. Steel slag . . . . . . . . . . . . . . . . . . . . . . . . . . . . . . . . . . . . . . . . . . . . . . . . . . . . . . . . . . . . . . . . . . . . . . . 4998.1.3. Copper slag . . . . . . . . . . . . . . . . . . . . . . . . . . . . . . . . . . . . . . . . . . . . . . . . . . . . . . . . . . . . . . . . . . . . . 5008.1.3. ISF slag . . . . . . . . . . . . . . . . . . . . . . . . . . . . . . . . . . . . . . . . . . . . . . . . . . . . . . . . . . . . . . . . . . . . . . . . 5008.1.5. Blast furnace slag . . . . . . . . . . . . . . . . . . . . . . . . . . . . . . . . . . . . . . . . . . . . . . . . . . . . . . . . . . . . . . . . . 5008.1.6. Bottom ash . . . . . . . . . . . . . . . . . . . . . . . . . . . . . . . . . . . . . . . . . . . . . . . . . . . . . . . . . . . . . . . . . . . . . 5008.1.7. Ferrochrome slag . . . . . . . . . . . . . . . . . . . . . . . . . . . . . . . . . . . . . . . . . . . . . . . . . . . . . . . . . . . . . . . . . 5008.1.8. Class F fly ash . . . . . . . . . . . . . . . . . . . . . . . . . . . . . . . . . . . . . . . . . . . . . . . . . . . . . . . . . . . . . . . . . . . 5008.1.9. Palm oil clinker . . . . . . . . . . . . . . . . . . . . . . . . . . . . . . . . . . . . . . . . . . . . . . . . . . . . . . . . . . . . . . . . . . 501
8.2. Splitting tensile strength. . . . . . . . . . . . . . . . . . . . . . . . . . . . . . . . . . . . . . . . . . . . . . . . . . . . . . . . . . . . . . . . . . 501
8.2.1. Waste foundry sand . . . . . . . . . . . . . . . . . . . . . . . . . . . . . . . . . . . . . . . . . . . . . . . . . . . . . . . . . . . . . . . 5018.2.2. Steel slag . . . . . . . . . . . . . . . . . . . . . . . . . . . . . . . . . . . . . . . . . . . . . . . . . . . . . . . . . . . . . . . . . . . . . . . 5028.2.3. Copper slag . . . . . . . . . . . . . . . . . . . . . . . . . . . . . . . . . . . . . . . . . . . . . . . . . . . . . . . . . . . . . . . . . . . . . 5028.2.4. Blast furnace slag . . . . . . . . . . . . . . . . . . . . . . . . . . . . . . . . . . . . . . . . . . . . . . . . . . . . . . . . . . . . . . . . . 5028.2.5. Bottom ash . . . . . . . . . . . . . . . . . . . . . . . . . . . . . . . . . . . . . . . . . . . . . . . . . . . . . . . . . . . . . . . . . . . . . 5028.2.6. Class F fly ash . . . . . . . . . . . . . . . . . . . . . . . . . . . . . . . . . . . . . . . . . . . . . . . . . . . . . . . . . . . . . . . . . . . 5028.3. Flexural strength . . . . . . . . . . . . . . . . . . . . . . . . . . . . . . . . . . . . . . . . . . . . . . . . . . . . . . . . . . . . . . . . . . . . . . . 503
8.3.1. Waste foundry sand . . . . . . . . . . . . . . . . . . . . . . . . . . . . . . . . . . . . . . . . . . . . . . . . . . . . . . . . . . . . . . . 5038.3.2. Steel slag . . . . . . . . . . . . . . . . . . . . . . . . . . . . . . . . . . . . . . . . . . . . . . . . . . . . . . . . . . . . . . . . . . . . . . . 5038.3.3. Copper slag . . . . . . . . . . . . . . . . . . . . . . . . . . . . . . . . . . . . . . . . . . . . . . . . . . . . . . . . . . . . . . . . . . . . . 5038.3.4. ISF slag . . . . . . . . . . . . . . . . . . . . . . . . . . . . . . . . . . . . . . . . . . . . . . . . . . . . . . . . . . . . . . . . . . . . . . . . 5038.3.5. Blast furnace slag . . . . . . . . . . . . . . . . . . . . . . . . . . . . . . . . . . . . . . . . . . . . . . . . . . . . . . . . . . . . . . . . . 5038.3.6. Bottom ash . . . . . . . . . . . . . . . . . . . . . . . . . . . . . . . . . . . . . . . . . . . . . . . . . . . . . . . . . . . . . . . . . . . . . 5048.3.7. Class F fly ash . . . . . . . . . . . . . . . . . . . . . . . . . . . . . . . . . . . . . . . . . . . . . . . . . . . . . . . . . . . . . . . . . . . 5048.3.8. Palm oil clinker . . . . . . . . . . . . . . . . . . . . . . . . . . . . . . . . . . . . . . . . . . . . . . . . . . . . . . . . . . . . . . . . . . 5048.4. Modulus of elasticity (MOE) . . . . . . . . . . . . . . . . . . . . . . . . . . . . . . . . . . . . . . . . . . . . . . . . . . . . . . . . . . . . . . 504

486 M.K. Dash et al. / International Journal of Sustainable Built Environment 5 (2016) 484–516
8.4.1. Relation between compressive strength and dynamic modulus of elasticity. . . . . . . . . . . . . . . . . . . . . . . . . 506
8.5. Ultrasonic pulse velocity (UPV) . . . . . . . . . . . . . . . . . . . . . . . . . . . . . . . . . . . . . . . . . . . . . . . . . . . . . . . . . . . . 5068.5.1. Relation between compressive strength and ultrasonic pulse velocity . . . . . . . . . . . . . . . . . . . . . . . . . . . . . 5068.5.2. Prediction of modulus of elasticity using ultrasonic pulse velocity . . . . . . . . . . . . . . . . . . . . . . . . . . . . . . . 506
9. Durability of industrial waste concrete. . . . . . . . . . . . . . . . . . . . . . . . . . . . . . . . . . . . . . . . . . . . . . . . . . . . . . . . . . . . . 506
9.1. Water absorption and permeability . . . . . . . . . . . . . . . . . . . . . . . . . . . . . . . . . . . . . . . . . . . . . . . . . . . . . . . . . . 5069.2. Initial surface absorption . . . . . . . . . . . . . . . . . . . . . . . . . . . . . . . . . . . . . . . . . . . . . . . . . . . . . . . . . . . . . . . . . 5079.3. Rapid chloride permeability test . . . . . . . . . . . . . . . . . . . . . . . . . . . . . . . . . . . . . . . . . . . . . . . . . . . . . . . . . . . . 5079.4. Abrasion resistance . . . . . . . . . . . . . . . . . . . . . . . . . . . . . . . . . . . . . . . . . . . . . . . . . . . . . . . . . . . . . . . . . . . . . 5089.5. Acid resistance . . . . . . . . . . . . . . . . . . . . . . . . . . . . . . . . . . . . . . . . . . . . . . . . . . . . . . . . . . . . . . . . . . . . . . . . 5089.5.1. Loss in mass . . . . . . . . . . . . . . . . . . . . . . . . . . . . . . . . . . . . . . . . . . . . . . . . . . . . . . . . . . . . . . . . . . . . 5089.5.2. Change in compressive strength . . . . . . . . . . . . . . . . . . . . . . . . . . . . . . . . . . . . . . . . . . . . . . . . . . . . . . . 5099.5.3. Relation between percentage loss in weight and reduction compressive strength . . . . . . . . . . . . . . . . . . . . . 509
9.6. Sulphate resistance . . . . . . . . . . . . . . . . . . . . . . . . . . . . . . . . . . . . . . . . . . . . . . . . . . . . . . . . . . . . . . . . . . . . . 509
9.6.1. Loss in mass . . . . . . . . . . . . . . . . . . . . . . . . . . . . . . . . . . . . . . . . . . . . . . . . . . . . . . . . . . . . . . . . . . . . 5099.6.2. Change in compressive strength . . . . . . . . . . . . . . . . . . . . . . . . . . . . . . . . . . . . . . . . . . . . . . . . . . . . . . . 5099.7. Drying shrinkage. . . . . . . . . . . . . . . . . . . . . . . . . . . . . . . . . . . . . . . . . . . . . . . . . . . . . . . . . . . . . . . . . . . . . . . 5099.8. High-temperature effect . . . . . . . . . . . . . . . . . . . . . . . . . . . . . . . . . . . . . . . . . . . . . . . . . . . . . . . . . . . . . . . . . . 5099.9. Freeze–thaw resistance. . . . . . . . . . . . . . . . . . . . . . . . . . . . . . . . . . . . . . . . . . . . . . . . . . . . . . . . . . . . . . . . . . . 5109.10. Drying–wetting effect . . . . . . . . . . . . . . . . . . . . . . . . . . . . . . . . . . . . . . . . . . . . . . . . . . . . . . . . . . . . . . . . . . . 5109.11. Carbonation . . . . . . . . . . . . . . . . . . . . . . . . . . . . . . . . . . . . . . . . . . . . . . . . . . . . . . . . . . . . . . . . . . . . . . . . . 510
10. Structural behaviour of industrial waste-concrete . . . . . . . . . . . . . . . . . . . . . . . . . . . . . . . . . . . . . . . . . . . . . . . . . . . . 510
10.1. Deflection test . . . . . . . . . . . . . . . . . . . . . . . . . . . . . . . . . . . . . . . . . . . . . . . . . . . . . . . . . . . . . . . . . . . . . . . . 51010.2. Pull-off strength . . . . . . . . . . . . . . . . . . . . . . . . . . . . . . . . . . . . . . . . . . . . . . . . . . . . . . . . . . . . . . . . . . . . . . 51011. Micro-structural analysis . . . . . . . . . . . . . . . . . . . . . . . . . . . . . . . . . . . . . . . . . . . . . . . . . . . . . . . . . . . . . . . . . . . . . 510
11.1. X-ray Diffraction Spectrometer (XRD) . . . . . . . . . . . . . . . . . . . . . . . . . . . . . . . . . . . . . . . . . . . . . . . . . . . . . . 51011.2. Scanning Electron Microscope (SEM) . . . . . . . . . . . . . . . . . . . . . . . . . . . . . . . . . . . . . . . . . . . . . . . . . . . . . . . 51112. Conclusion . . . . . . . . . . . . . . . . . . . . . . . . . . . . . . . . . . . . . . . . . . . . . . . . . . . . . . . . . . . . . . . . . . . . . . . . . . . . . . . 513References . . . . . . . . . . . . . . . . . . . . . . . . . . . . . . . . . . . . . . . . . . . . . . . . . . . . . . . . . . . . . . . . . . . . . . . . . . . . . . . . 514
1. Introduction
Concrete the most broadly used construction material(Prabhu et al., 2014), aggregate makes 70% of its volumeis the principal component material in concrete productionand consumes globally 8–12 million tons of natural aggre-gate annually (Devi and Gnanavel, 2014; Al-Jabri et al.,2009). The aggregate classifications used are course aggre-gate with 4.75 mm particle size or more and fine aggregatewith 4.75 mm particle size or less. Fine aggregate (Sand) isa significant material utilised for the composition of mortarand concrete and assumes a most essential part in designmix. Sand is a major component of concrete and propertiesof a specific concrete mix will be determined by the propor-tion and type of sand used to formulate concrete. It has sig-nificant impact on the workability, durability, strength,weight, and shrinkage of concrete. Sand is usually a largercomponent of the mix than cement. Sand can fill up thepores or voids in the concrete, which is also a contributingfactor for the strength of concrete. Sand reduces volumechanges resulting from setting and hardening process andprovides a mass of particles which are suitable to resistthe action of applied loads and show better durability thancement paste alone. Hence sand has a major role for con-crete to solidify to give the necessary strength. Use of reg-ular sand is high, because of the large utilisation of mortarand concrete. Thus the need of sand is more in growingcountries to mitigate the fast infrastructure development.
The growing demand of sand results in non-availabilityof good quality sand and especially in India, deposits ofnatural sand are being exhausted which create an extrememenace to the environment. Fast withdrawal of sand fromwaterway bed, brings about such a large number of issueslike losing water holding soil strata, extending to the slidingof the banks of river (Sankh et al., 2014). The extraction ofsand from the waterway enhances the cost of sand and hasseverely affected the financial viability of the constructionindustry. As such finding an alternate material to naturalsand has got to be imperative. As the industrialisationincreases, the amount of waste material product is alsoincreasing, which has turned into an ecological issue thatmust be managed. Pappu et al. (2007) stated that in India960MT solid waste is being generated yearly, out of which290MT are unwanted inorganic waste of mining & indus-trial division. Regular resources are exhausting largelywhile in the meantime the produced wastes from the indus-tries are expanding significantly. To safeguard the environ-ment, efforts are being made for using industrial waste inconcrete for conserving natural resources and reduce thecost of construction materials. Assuming industrial wastein the form of fine aggregate for concrete production canbe considered one of the environmental benefits and alsoshows better performance in concrete. The utilisation ofwaste items in concrete makes it inexpensive and reutilizeof wastes is supposed as the best ecological option for tak-ing care of the issue of waste disposal (Bahoria et al., 2013).
M.K. Dash et al. / International Journal of Sustainable Built Environment 5 (2016) 484–516 487
Different types of industrial waste materials such aswaste foundry sand (Prabhu et al., 2014; Khatib et al.,2013; Basar and Aksoy, 2012; Singh, 2012; Salokhe andDesai, 2009; Singh and Siddique, 2012a,b; Etxeberriaet al., 2010; Siddique et al., 2009, 2011, 2015; Aggarwaland Siddique, 2014), steel slag (Devi and Gnanavel, 2014;Qasrawi et al., 2009; Rajan, 2014; Khajuria and Siddique,2014; Chang-long et al., 2008; Kothai and Malathy,2014), copper slag (Al-Jabri et al., 2009a,b, 2011;Alnuaimi, 2012; Wu et al., 2010; Rose and Suganya,2015; Meenakshi and Ilangovan, 2011; Chavan andKulkarni, 2013; Ambily et al., 2015; Velumani andNirmalkumar, 2014; Poovizhi and Kathirvel, 2015; Wuet al., 2010), imperial smelting furnace slag (Tripathiet al., 2013; Weeks et al., 2008; Atzeni et al., 1996;Morrison et al., 2003), blast furnace slag (Yuksel et al.,2006, 2007, 2011; Valcuende et al., 2015; Yuksel andGenc, 2007; Yuksel et al., 2011), coal bottom ash (Baiet al., 2005; Singh and Siddique, 2014; Kim et al., 2014;Andrade et al., 2009; Bilir, 2012; Kim and Lee, 2011; Shi-Cong and Chi-Sun, 2009), ferrochrome slag (Panda et al.,2013), class F type fly ash (Rajamane et al., 2007;Siddique, 2003), and Palm oil clinker (Rashad, 2016;Kanadasan et al., 2015; Wahab et al., 2015; Abdullahiet al., 2010; Ahmmad et al., 2014; Mohammed et al.,2011, 2013) have been used as partially or fully sandreplacement material in concrete production and theirproperties with control concrete are compared.
Indian foundries deliver roughly 1.71MT of waste foun-dry sand (WFS) in every year (Khatib et al., 2013; Singh,2012). Foundry sand is a derivative of alloy casting indus-tries, where the sand has been used for its thermal conduc-tivity as moulding substances. Depending upon the type ofbinder used in casting, foundry sands are of two types suchas clay bonded system also known as green sand and chem-ically bonded system (Chemically Bonded Sand). Manyresearchers like Prabhu et al. (2014), Khatib et al. (2013),Basar and Aksoy (2012), Singh (2012), Salokhe andDesai (2009), Singh and Siddique (2012a,b), Etxeberriaet al. (2010), Siddique et al. (2009, 2015) have carried outresearch works to evaluate the use of foundry sand as asubstitute substances for sand in concrete production.Prabhu et al. (2014) have evaluated the utilisation of foun-dry sand obtained from aluminium casting industry used asa substitute for fine aggregate in five different substitutionrates (10%, 20%, 30%, 40%, 50%) and concluded that thestrength properties of concrete mixture incorporating foun-dry sand up to 20% is moderately near to the strength valueof control mix. Khatib et al. (2013) have reported thatthere is a systemic increment in water absorption; diminishin compressive strength and ultrasonic pulse velocity(UPV) with growing amount of waste foundry sand in con-crete. Basar and Aksoy (2012) have stated that waste foun-dry sand can be successfully used in making great qualityready-mix concrete as partial supplanting of fine aggregatewith no unfavorable mechanical, micro-structural and eco-logical effect, but substitution should not exceed 20%.
According to the report of Singh (2012), Singh andSiddique (2012a,b), partial supplanting of sand with wastefoundry sand up to 15% increases compressive strength,splitting tensile strength, modulus of elasticity and abra-sion resistance of concrete mixtures with the increment ofwaste foundry sand as replacement for fine aggregate.Siddique et al. (2009, 2015) assess the properties of concretein which sand was partially supplanted with three differentpercentages (10%, 20%, 30%) of used foundry sand as par-tial substitution (Siddique et al., 2009) and studied twogrades of concrete M-20 & M-30 incorporating waste foun-dry sand as partial substitution with five percentages (0%,5%, 10%, 15%, 20%) Siddique et al., 2015. They inferredthat with the rate of increment of foundry sand contentin concrete, the compressive strength, splitting tensilestrength, modulus of rupture and modulus of elasticity ofconcrete mixes increased (Siddique et al., 2009) andenhanced chloride permeability resistance of concrete(Siddique et al., 2015). Aggarwal and Siddique (2014) haveevaluated the effect of waste foundry sand and bottom ashin equal quantities as fractional substitution of fine aggre-gate in various percentages on concrete properties. Theoutcomes indicate there is an increase in compressivestrength, splitting tensile strength and modulus of ruptureby substituting 30% of the natural sand with equal quanti-ties of waste foundry sand and bottom ash. Kaur et al.(2012) investigates the outcome of inclusion of fungal trea-ted waste foundry sand and effect of aspergillus spp. oncompressive strength and water absorption of concrete.
Steel slag is the waste product of steel and iron creatingprocess. Electric arc furnace steel slag has low or no poz-zolanic activities and not suitable to be utilised in blendedcement manufacture (Qasrawi et al., 2009). Devi andGnanavel (2014) concluded that, the concrete with partialsubstitution of fine aggregate by steel slag shows preferredimperviousness to hydrochloric acid (HCl) than sulphuricacid (H2SO4). Qasrawi et al. (2009) stated the utilisationof steel slag has a negative effect on the workability ofcement particularly the substitution proportions over50%. Best results for compressive strength are obtainedwhen substitution proportions are somewhere around 15–30%. In the research they have suggested better outcomecan be acquired if powder finer than 0.15 mm is excludedfrom slag. John and John (2013) and Rajan (2014) havestudied on the utilisation of induction furnace steel slag/steel slag and inferred that the compressive strength of con-crete containing induction furnace steel slag greater than30% is found to be lower than control mix. Khajuria andSiddique (2014) have affirmed that by replacing fine aggre-gate with iron slag a by-product of iron and steel makingindustry in concrete, the compressive strength increaseswith increase in the substitution up to 30%.
Presently worldwide around 33MT of copper slag is gen-erated yearly amongst that India contributes 6.0–6.5 mil-lion tons. 50% copper slag can be utilised as substitutionof regular sand into acquire mortars and concrete with per-formance needed, durability and strength (Sankh et al.,

488 M.K. Dash et al. / International Journal of Sustainable Built Environment 5 (2016) 484–516
2014). Al-Jabri et al. (2009a,b, 2011) have considered theimpact of utilising copper slag as sand substitution on theproperties of high strength concrete and some of the con-crete properties such as physical, chemical, workabilityand mechanical properties. Alnuaimi (2012) has examinedthe utilisation of copper slag substitution for sand in rein-forced concrete slender column and concluded that substi-tution up to 40% sand with copper slag created nosignificant change in column failure load. Wu et al.(2010) investigated that under 40% copper slag as fineaggregate substitutions can accomplish a high strengthconcrete that is similar to or better than the control blend.According to them strength enhanced with 40% supplantedby copper slag was mostly credited to its physical proper-ties. It has a superior compressibility than sand, whichcan partially mitigate the stress concentration (Al-Jabriet al., 2011). Rose and Suganya (2015) have concluded thatcompressive strength increased by surrogating fine aggre-gate by 40% of copper slag. Meenakshi and Ilangovan(2011) have researched the impact of utilising copper slagand ferrous slag by equivalent rate as partial substitutionof sand and achieved higher strength at the 100% replace-ment level than control concrete. Chavan and Kulkarni(2013) examined the impact of utilising copper slag as sub-stitution of sand on strength properties and reached to aconclusion that concrete acquire increased strength thanreference concrete mix when 75% fine aggregate is replacedby copper slag.
Imperial smelting furnace (ISF) slag is produced duringthe pyrometallurgical refining of sulphide metal. Tripathiet al. (2013) have assessed the potential of imperial smeltingfurnace (ISF) slag in concrete as fine aggregate, consideringthe existence of toxic components (lead and zinc) and theirnegative effect on hydration of cement. They presumed thatthere is improvement in mechanical properties of concreteand leaching of toxic element within the safe limit byreplacing natural sand by the imperial smelting furnace(ISF) slag. Weeks et al. (2008) have carried out their studyon retardation of cement hydration created by substantialmetal available in slag from the imperial smelting furnacesystem of zinc generation, when used as sand in concreteand inferred that ISF slag utilised as sand retard the settingof Portland cement. Atzeni et al. (1996) have analysed thepossibility of using granulated slag resulting from the leadand zinc processing from the Kivet and Imperial smeltingplant in partial or total substitution of fine aggregate inconcrete and reported it is feasible to use in concrete.
Granulated blast furnace slag (GBF Slag), which isobtained from rapidly water-cooled slag from blast furnacein the production of pig iron, has been effectively utilised inconcrete mixes because of lime content. GBF Slag is usedas partial substitution for Portland cement. Yuksel et al.(2006, 2007) in their research work focus on using nonground GBF slag in concrete as sand replacement in con-crete. Valcuende et al. (2015) researched the effect ofground GBF slag as a partial substitution of sand on thecompressive strength and drying shrinkage in
self-compacting concrete. The researchers concluded, atan early age concrete replaced with slag show similar com-pressive strength, but at 365 days, the higher the quantityof sand supplanted by slag the higher the concrete’s com-pressive strength tends to be.
Presently, India is delivering in more than 100 milliontons of coal ash, from which 15–20% ash is, remaining atbase and the balance is fly ash. There are numerous clientsfor fly ash, but the ash remains at bottom and keeps oncontaminating nature with risky disposal (Sankh et al.,2014). Furnace bottom ash (FBA) generated from thermalpower plants is a waste material, it generally has no poz-zolanic property, for which it is inadmissible to be utilisedas a cement substitution material in concrete. On the otherhand, its grain size distribution is like that of sand whichmakes it alluring to be utilised as a sand substitution mate-rial. Several researchers like Bai et al. (2005), Singh andSiddique (2014) and Kim et al. (2014) have consideredthe use of bottom ash as a partial substitution of normalsand in concrete. Bai et al. (2005) have concentrated onthe impact of bottom ash with two design mixes (i) definitewater-cement (WC) proportion and (ii) constant slumpranges. They observed that at a definite WC ratio, the dry-ing shrinkage and compressive strength decrease with theincrement in bottom ash incorporation in concrete, but atconstant slump ranges, the compressive strength was equiv-alent with the reference concrete mix, while the dryingshrinkage expanded with the increment when natural sandsubstituted by furnace bottom ash above 30%. Singh andSiddique (2014) have investigated that bottom ash concreteexhibits better dimensional stability, better imperviousnessto chloride particle infiltration and sulphuric acid attack ascompared to traditional concrete. Kim et al. (2014) haveinvestigated chloride resistance of high strength concreteby supplanting fine aggregate with fine bottom ash andthe results shows that bottom ash in high strength concretecan significantly reduce the amount of chloride diffusion.Andrade et al. (2009) explore the properties of concreteby utilisation of coal bottom ash (CBA) as a swap for reg-ular sand in the fresh state and concluded that water lossby bleeding due to existence of bottom ash, the higherthe CBA content of the concrete more prominent thisimpact.
Ferrochrome slag produced as water cooled granulatedslag is a major solid waste generated during manufactureof ferrochrome alloy. Panda et al. (2013) carried out a testexamination to study the use of air cooled slag as a partialsubstitution of coarse aggregate in concrete and watercooled granulated slag as a part substitution of sand inconcrete. The study demonstrates the concrete mix withferrochrome slag supplanted as sand exhibits perfect out-come regarding compressive strength and the leachablechromium stays all around immobilized in the concretematrix and cement and with low to non-perceivable levelof chromium leaching.
In India, the amount of fly ash generated from thermalpower plants is nearly 80MT every year, amongst it the

M.K. Dash et al. / International Journal of Sustainable Built Environment 5 (2016) 484–516 489
lion’s share of fly ash produced is of class F type and itspercentage utilisation is less than 10% in manufacturingof cement, known as Pozzolana Portland cement.Rajamane et al. (2007) investigated fly ash as a partial sub-stitution material as natural sand and suggested an equa-tion to anticipate concrete compressive strength at28 day. Siddique (2003) has investigated the supplantingnatural sand by class F fly ash. This study concluded thatsplitting tensile strength, compressive strength, modulusof rupture and modulus of elasticity of concrete werehigher in which class F fly ash incorporated than controlmix.
Palm oil factories generate different types of waste whichincorporates oil palm fibre, oil palm shell (OPS) palm oilmill effluent (POME) and empty fruit bunches (EFB).The yearly production of solid waste from the palm oilindustry in South East Asian countries, Malaysia, Indone-sia and Thailand is around 90.5 million tones and it is oneof the most growing agricultural waste materials of theworld (Rashad, 2016). Lack of proper management ofthese wastes could lead to environmental pollution(Kanadasan et al., 2015). Supplanting these wastes asaggregate replacement in concrete is an alternativeapproach to solve this problem (Wahab et al., 2015). Theoil palm shell aggregate being an organic material mightdisintegrate with time and this would have an adverse effecton the durability of the resulting concrete (Abdullahi et al.,
Figure 1. Indus
2010). The incineration process of oil palm shell and oilpalm fibre for 4 h at 400 �C produces palm oil clinker(POC), which is obtained in chunks ranging between 100and 400 mm being crushed into aggregates are substitutedpartially as coarse or fine aggregate in concrete. Ahmmadet al. (2014) have been carried out to study the displace-ment ductility and torsional ductility of lightweight con-crete element containing crushed oil palm shell (OPS) isused as coarse aggregate in different mixes and palm oilclinker (POC) as fine aggregate for sand replacement andconcluded that modulus of elasticity of concrete with100% OPS as coarse aggregate and natural sand replacedwith 50% palm oil clinker sand is 8.57 GPa in comparedto normal weight concrete (control concrete) modulus ofelasticity 28.34 GPa, but its modulus of resilience and mod-ulus of toughness are significantly higher. Mohammedet al. (1863) have investigated chloride resistance of light-weight concrete with palm oil clinker aggregate and con-cluded that chloride-ion penetrability at 28 days are highdue to the porous nature of palm oil clinker aggregate.
This paper presents a comprehensive evaluation aboutindustrial waste substances that can be viably utilised inconcrete as fine aggregate substitution and the objectiveis to discuss some of the properties like physical, chemicalcomposition of industrial waste, fresh concrete, hardenedconcrete properties and leaching study using the aboveindustrial waste and their comparison.
trial wastes.
490 M.K. Dash et al. / International Journal of Sustainable Built Environment 5 (2016) 484–516
2. Physical properties of industrial wastes as fine aggregate
Physical properties of industrial wastes such as grainsize distribution, density, specific gravity, fine substanceand absorption help to acknowledge its suitability andworkability to be replaced as fine aggregate in concrete(see Fig. 1).
2.1. Shape and appearance
The blast furnace slag is dark smooth particle and gran-ular (Sankh et al., 2014). In general foundry sand is sub-rakish to round in shape. Green foundry sands are darkor grey, whereas chemically bonded foundry sands are ofgreyish in colour (Singh, 2012). The copper slag is granularin nature, dark polished particle and has a grain size distri-bution like natural sand (Ambily et al., 2015). ISF slag isdark in shading, vitreous, granular and contain toxic metal(lead and zinc) (Tripathi et al., 2013). The molecules of coalbottom ash have a rough texture and are rakish, irregularand permeable (Siddique, 2014). Palm oil clinker (POC)is porous in nature and grey in colour (Wahab et al.,2015).
2.2. Particle gradation
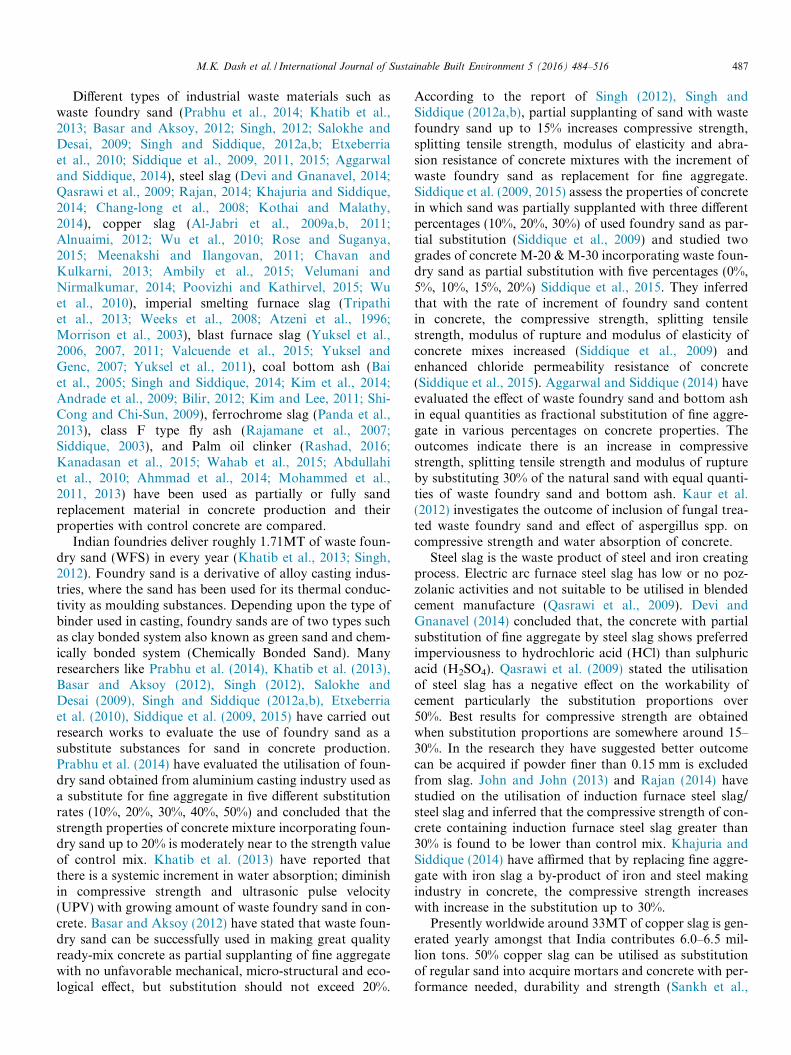
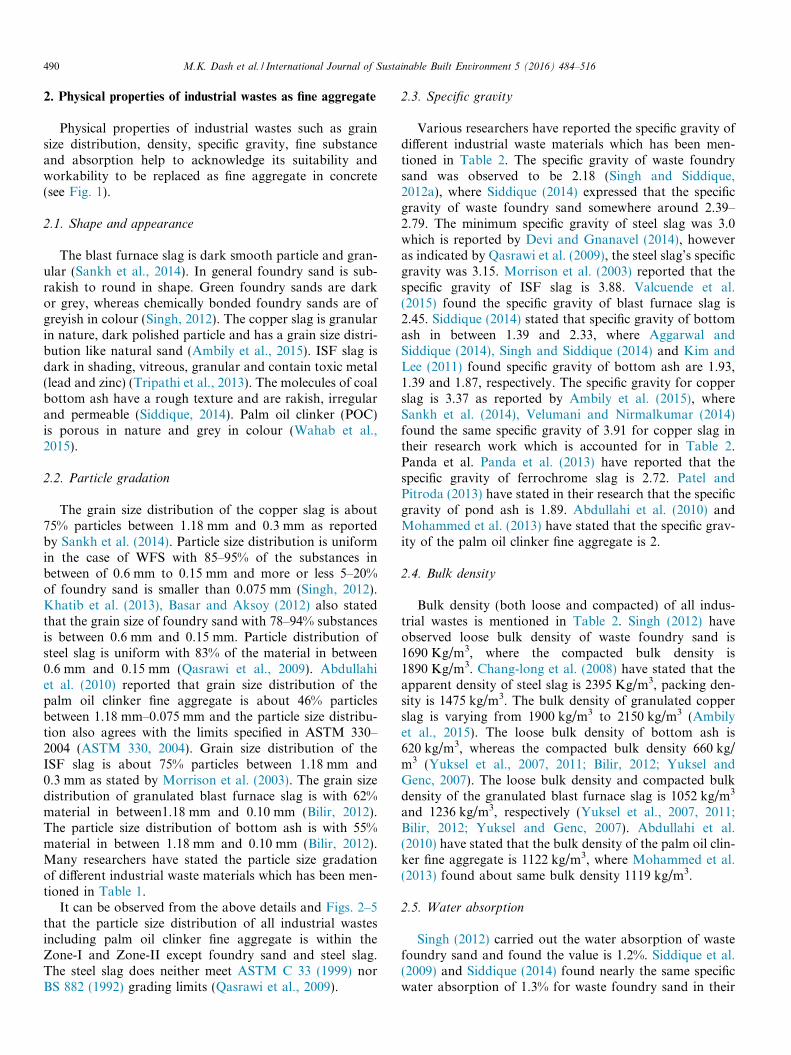
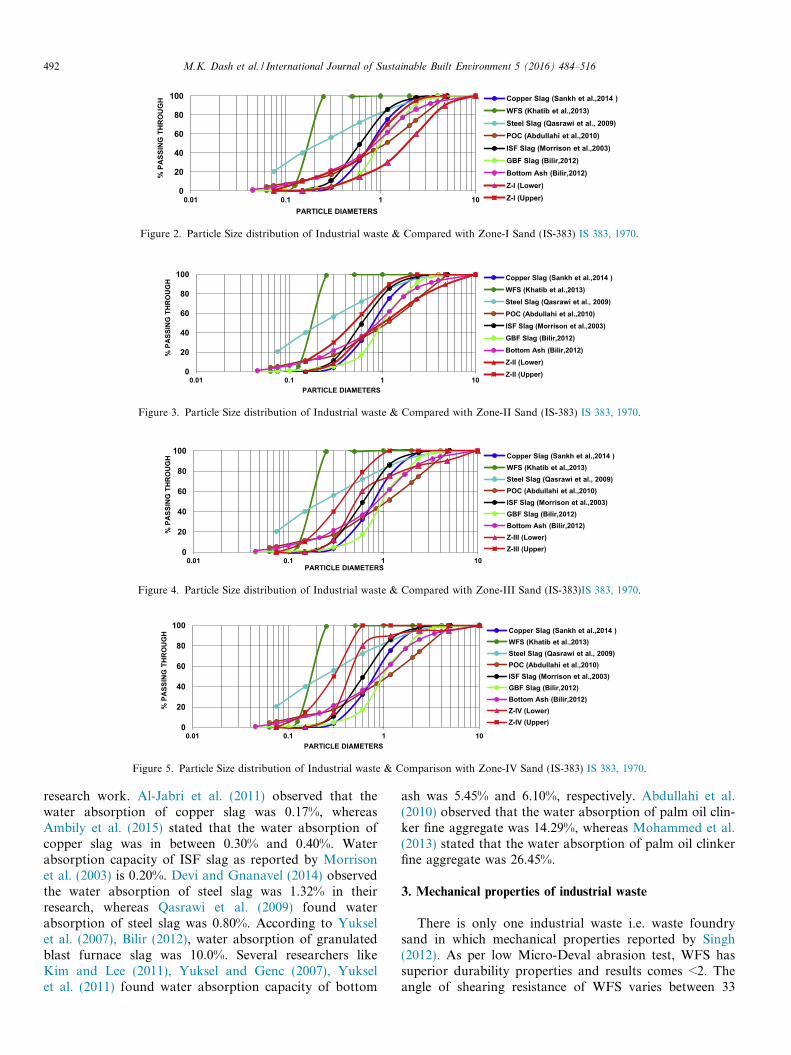
The grain size distribution of the copper slag is about75% particles between 1.18 mm and 0.3 mm as reportedby Sankh et al. (2014). Particle size distribution is uniformin the case of WFS with 85–95% of the substances inbetween of 0.6 mm to 0.15 mm and more or less 5–20%of foundry sand is smaller than 0.075 mm (Singh, 2012).Khatib et al. (2013), Basar and Aksoy (2012) also statedthat the grain size of foundry sand with 78–94% substancesis between 0.6 mm and 0.15 mm. Particle distribution ofsteel slag is uniform with 83% of the material in between0.6 mm and 0.15 mm (Qasrawi et al., 2009). Abdullahiet al. (2010) reported that grain size distribution of thepalm oil clinker fine aggregate is about 46% particlesbetween 1.18 mm–0.075 mm and the particle size distribu-tion also agrees with the limits specified in ASTM 330–2004 (ASTM 330, 2004). Grain size distribution of theISF slag is about 75% particles between 1.18 mm and0.3 mm as stated by Morrison et al. (2003). The grain sizedistribution of granulated blast furnace slag is with 62%material in between1.18 mm and 0.10 mm (Bilir, 2012).The particle size distribution of bottom ash is with 55%material in between 1.18 mm and 0.10 mm (Bilir, 2012).Many researchers have stated the particle size gradationof different industrial waste materials which has been men-tioned in Table 1.
It can be observed from the above details and Figs. 2–5that the particle size distribution of all industrial wastesincluding palm oil clinker fine aggregate is within theZone-I and Zone-II except foundry sand and steel slag.The steel slag does neither meet ASTM C 33 (1999) norBS 882 (1992) grading limits (Qasrawi et al., 2009).
2.3. Specific gravity
Various researchers have reported the specific gravity ofdifferent industrial waste materials which has been men-tioned in Table 2. The specific gravity of waste foundrysand was observed to be 2.18 (Singh and Siddique,2012a), where Siddique (2014) expressed that the specificgravity of waste foundry sand somewhere around 2.39–2.79. The minimum specific gravity of steel slag was 3.0which is reported by Devi and Gnanavel (2014), howeveras indicated by Qasrawi et al. (2009), the steel slag’s specificgravity was 3.15. Morrison et al. (2003) reported that thespecific gravity of ISF slag is 3.88. Valcuende et al.(2015) found the specific gravity of blast furnace slag is2.45. Siddique (2014) stated that specific gravity of bottomash in between 1.39 and 2.33, where Aggarwal andSiddique (2014), Singh and Siddique (2014) and Kim andLee (2011) found specific gravity of bottom ash are 1.93,1.39 and 1.87, respectively. The specific gravity for copperslag is 3.37 as reported by Ambily et al. (2015), whereSankh et al. (2014), Velumani and Nirmalkumar (2014)found the same specific gravity of 3.91 for copper slag intheir research work which is accounted for in Table 2.Panda et al. Panda et al. (2013) have reported that thespecific gravity of ferrochrome slag is 2.72. Patel andPitroda (2013) have stated in their research that the specificgravity of pond ash is 1.89. Abdullahi et al. (2010) andMohammed et al. (2013) have stated that the specific grav-ity of the palm oil clinker fine aggregate is 2.
2.4. Bulk density
Bulk density (both loose and compacted) of all indus-trial wastes is mentioned in Table 2. Singh (2012) haveobserved loose bulk density of waste foundry sand is1690 Kg/m3, where the compacted bulk density is1890 Kg/m3. Chang-long et al. (2008) have stated that theapparent density of steel slag is 2395 Kg/m3, packing den-sity is 1475 kg/m3. The bulk density of granulated copperslag is varying from 1900 kg/m3 to 2150 kg/m3 (Ambilyet al., 2015). The loose bulk density of bottom ash is620 kg/m3, whereas the compacted bulk density 660 kg/m3 (Yuksel et al., 2007, 2011; Bilir, 2012; Yuksel andGenc, 2007). The loose bulk density and compacted bulkdensity of the granulated blast furnace slag is 1052 kg/m3
and 1236 kg/m3, respectively (Yuksel et al., 2007, 2011;Bilir, 2012; Yuksel and Genc, 2007). Abdullahi et al.(2010) have stated that the bulk density of the palm oil clin-ker fine aggregate is 1122 kg/m3, where Mohammed et al.(2013) found about same bulk density 1119 kg/m3.
2.5. Water absorption
Singh (2012) carried out the water absorption of wastefoundry sand and found the value is 1.2%. Siddique et al.(2009) and Siddique (2014) found nearly the same specificwater absorption of 1.3% for waste foundry sand in their

Table 1Particle size distribution of different industrial wastes.
Sieve (mm) Cumulative passing (%)
Copper slagSankh et al. (2014)
WFSKhatib et al. (2013)
Steel slagQasrawi et al. (2009)
ISF slagMorrison et al. (2003)
GBF slagBilir (2012)
Bottom ashBilir (2012)
Palm oil clinkerAbdullahi et al. (2010)
ASTM limitsQasrawi et al. (2009)
10 – 100 100 – – – – 1008 – 100 – – – – – –5 – – 99 100 – – 100 1004.75 99.6 – – – – – –4 – 100 – – 99.38 94.03 –3.35 – – – – 98.2 91.9 –2.34/2.36/2.4 97.9 – 95.6 98 92.16 86.23 74.29 95–1002 – 100 – – – – 68.58 –1.7 – – – – 77.1 76.97 –1.18/1.20 75.4 – 85.4 86 62.26 61.7 51.44 80–1001 – 100 – – – – –0.85 – – – – – – 42.87 –0.6 32.1 – 72.1 49 17.72 36.63 34.30 50–850.5 – 99.6 – – – – – –0.3 4 – 56.2 11 4.94 21.6 17.16 25–600.212 – – – – 2.84 14.09 – –0.25 – 99.3 – – – – – –0.15 0.3 – 40 – – – 11.45 10–300.125 – 5.6 – – – – – –0.1 – – – – 0.8 6.57 – –0.075 0 – 20.5 – 0.44 3.8 5.71 NA0.063 – 0.3 – – – – 4.31 –0.045 – – – – 0.12 1.07 –Pan 0 0 – – – – –
WFS – waste foundry sand, ISF Slag – imperial smelting furnace slag, GBF Slag – granulated blast furnace slag.
M.K.Dash
etal./In
ternatio
nalJournalofSusta
inable
Built
Enviro
nment5(2016)484–516
491
0
20
40
60
80
100
0.01 0.1 1 10
% P
ASSI
NG
TH
RO
UG
H
PARTICLE DIAMETERS
Copper Slag (Sankh et al.,2014 )WFS (Khatib et al.,2013)Steel Slag (Qasrawi et al., 2009)POC (Abdullahi et al.,2010)ISF Slag (Morrison et al.,2003) GBF Slag (Bilir,2012)Bottom Ash (Bilir,2012)Z-I (Lower)Z-I (Upper)
Figure 2. Particle Size distribution of Industrial waste & Compared with Zone-I Sand (IS-383) IS 383, 1970.
0
20
40
60
80
100
0.01 0.1 1 10
% P
ASSI
NG
TH
RO
UG
H
PARTICLE DIAMETERS
Copper Slag (Sankh et al.,2014 )WFS (Khatib et al.,2013)Steel Slag (Qasrawi et al., 2009)POC (Abdullahi et al.,2010)ISF Slag (Morrison et al.,2003) GBF Slag (Bilir,2012)Bottom Ash (Bilir,2012)Z-II (Lower)Z-II (Upper)
Figure 3. Particle Size distribution of Industrial waste & Compared with Zone-II Sand (IS-383) IS 383, 1970.
0
20
40
60
80
100
0.01 0.1 1 10
% P
ASSI
NG
TH
RO
UG
H
PARTICLE DIAMETERS
Copper Slag (Sankh et al.,2014 )WFS (Khatib et al.,2013)Steel Slag (Qasrawi et al., 2009)POC (Abdullahi et al.,2010)ISF Slag (Morrison et al.,2003) GBF Slag (Bilir,2012)Bottom Ash (Bilir,2012)Z-III (Lower)Z-III (Upper)
Figure 4. Particle Size distribution of Industrial waste & Compared with Zone-III Sand (IS-383)IS 383, 1970.
0
20
40
60
80
100
0.01 0.1 1 10
% P
ASSI
NG
TH
RO
UG
H
PARTICLE DIAMETERS
Copper Slag (Sankh et al.,2014 )WFS (Khatib et al.,2013)Steel Slag (Qasrawi et al., 2009)POC (Abdullahi et al.,2010)ISF Slag (Morrison et al.,2003) GBF Slag (Bilir,2012)Bottom Ash (Bilir,2012)Z-IV (Lower)Z-IV (Upper)
Figure 5. Particle Size distribution of Industrial waste & Comparison with Zone-IV Sand (IS-383) IS 383, 1970.
492 M.K. Dash et al. / International Journal of Sustainable Built Environment 5 (2016) 484–516
research work. Al-Jabri et al. (2011) observed that thewater absorption of copper slag was 0.17%, whereasAmbily et al. (2015) stated that the water absorption ofcopper slag was in between 0.30% and 0.40%. Waterabsorption capacity of ISF slag as reported by Morrisonet al. (2003) is 0.20%. Devi and Gnanavel (2014) observedthe water absorption of steel slag was 1.32% in theirresearch, whereas Qasrawi et al. (2009) found waterabsorption of steel slag was 0.80%. According to Yukselet al. (2007), Bilir (2012), water absorption of granulatedblast furnace slag was 10.0%. Several researchers likeKim and Lee (2011), Yuksel and Genc (2007), Yukselet al. (2011) found water absorption capacity of bottom
ash was 5.45% and 6.10%, respectively. Abdullahi et al.(2010) observed that the water absorption of palm oil clin-ker fine aggregate was 14.29%, whereas Mohammed et al.(2013) stated that the water absorption of palm oil clinkerfine aggregate was 26.45%.
3. Mechanical properties of industrial waste
There is only one industrial waste i.e. waste foundrysand in which mechanical properties reported by Singh(2012). As per low Micro-Deval abrasion test, WFS hassuperior durability properties and results comes <2. Theangle of shearing resistance of WFS varies between 33

Table 2Physical properties of different industrial wastes.
Properties WFS Prabhu et al.(2014), Basar andAksoy (2012), Singh(2012), Singh andSiddique (2012a),Singh and Siddique(2012b), Etxeberriaet al. (2010), Siddiqueet al. (2009)Aggarwal andSiddique (2014) andAggarwal andSiddique (2014)
Steel slagDevi andGnanavel(2014),Qasrawiet al.(2009)andChang-long et al.,2008
C. Slag Al-Jabriet al. (2009), Al-Jabri et al. (2009),Al-Jabri et al.(2011), Wu et al.(2010), Ambilyet al. (2015),Velumani andNirmalkumar(2014)and Poovizhiand Kathirvel(2015)
ISF SlagTripathiet al.(2013)andMorrisonet al.,2003
GBF SlagYuksel et al.(2007),Valcuendeet al. (2015),Bilir (2012),Yuksel andGenc (2007)andYukselet al. (2011)
B. Ash Aggarwal andSiddique (2014),Yuksel et al. (2007),Bai et al. (2005),Singh and Siddique(2014), Bilir (2012),Kim and Lee (2011),Yuksel and Genc(2007), Yuksel et al.(2011)andShi-Congand Chi-Sun (2009)
FeCrSlagPandaet al.(2013)
POCAbdullahiet al. (2010)andMohammedet al. (2013)
Ranges inphysicalproperties ofnormalweightaggregateMaterials forConcreteConstruction(1999)
Specific gravity 2.18–2.61 3.0–3.19 3.40–3.91 3.69–3.88 2.08–2.45 1.39–1.93 2.72 2.0 2.3–2.9Loose bulk density (kg/m3) 1160 2395 – – 1052 620 – 1122Compacted Bulk Density (kg/m3) – – – – 1236 660 – –Unit weight (kg/m3) 1520–1784 – – – – 948 – –Density (kg/m3) – 3600 3900 – 2190 – –Fineness Modulus 1.60–1.89 2.08 1.76–3.76 – 1.37–1.83 4.8 3.31 2.3–3.1Water Absorption% 0.33–7.67 0.8–1.32 0.3–0.4 0.20–0.45 8.0–10.0 5.45–32.2 – 14.29–26.45 0–8Moisture Content% 0.11 – 0.1 – – – – – 0–10Materials finer than 75 lm (%) 1.08–24 – – – – – – –Clay lumps and friable particles (%) 0.40–1.44 – – – 1 2.0–2.4 – –Particle Grading Zone – – Zone–I – – Zone-I –
WFS – waste foundry sand, C.slag – copper slag, ISF slag – imperial smelting furnace slag, GBF slag – granulated blast furnace slag, B.ash –bottom ash, FeCr slag: ferrochrome slag, POC – palm oilclinker.
M.K.Dash
etal./In
ternatio
nalJournalofSusta
inable
Built
Enviro
nment5(2016)484–516
493

Table 3Chemical composition of different industrial wastes used as fine aggregate.
Component WFS (Prabhu et al. (2014),Khatib et al. (2013), Basarand Aksoy (2012); Singh(2012), Etxeberria et al.(2010); Siddique et al.(2009) andAggarwal andSiddique (2014)
Steel slagQasrawi et al.(2009),Chang-longet al. (2008)andKothaiand Malathy(2014)
Copper slag Al-Jabriet al. (2009), Al-Jabriet al. (2009), Al-Jabriet al. (2011), Wu et al.(2010), Ambily et al.(2015)andPoovizhi andKathirvel, 2015
ISF slagTripathi et al.(2013)andMorrisonet al., 2003
GBF slag Yukselet al. (2006), Yukselet al. (2007),Valcuende et al.(2015), Bilir (2012),Yuksel and Genc(2007)andYukselet al., 2011
Bottom ash Aggarwal andSiddique (2014), Yuksel et al.(2007), Bai et al. (2005), Singhand Siddique (2014), Bilir(2012), Yuksel and Genc(2007) Yuksel et al. (2011)andShi-Cong and Chi-Sun,2009
FeCr SlagPanda et al.(2013)
Class Ffly ash(Siddique(2003)
POCAhmmadet al.(2014)
SiO2 78.81–95.10 0.8–35 25.84–33.05 16.30–18.08 30.20–35.09 56.44–61.80 56.44–61.80 55.3 59.63Al2O3 0.81–10.41 1.0–16.0 0.22–2.52 8.17 17.54 17.80–29.24 17.80–29.24 25.7 3.7Fe2O3 0.94–5.39 97.05 53.45–68.29 34.28–38.33 0.7 6.56–13.00 6.56–13.00 5.3 4.62CaO 0.14–1.88 0.40–52 0.15–6.06 11.98–17.91 37.80–39.50 0.75–3.25 0.75–3.25 5.6 8.16MgO 0.30–1.97 0.4–11 1.56–1.65 1.93 5.50–7.50 0.40–3.20 0.40–3.20 2.1 5.01SO3 0.03–0.84 – 0.11–1.89 10.26 0.70–1.90 0.02–0.82 – 1.4 0.73K2O 0.25–1.14 – 0.23–0.81 0.71 0.3 1.08–2.12 – 0.6 11.66Na2O 0.19–0.87 – 0.28–1.40 0.68 0.3 0.086–0.95 – 0.4 0.32TiO2 0.04–0.22 0.01 0–0.41 – 0.68 0.88–0.95 – 1.3 0.22Mn2O3 0.047 – 0.06–0.22 1.33 – – – – –MnO – 1.07–8.0 – – 0.83 – – – –Cr2O3 0.025–0.37 – – – – – – – –NiO 0.005 – – – – – – – –ZnO 0.018 – – 9.21–11.37 – – – – –SrO 0.005 – – – – – – – –CI 0.04–0.071 0.01-0.018 – – 0.01 – – -IR – 14.88 6.28 – – – – –CuO – 0.46–1.20 – - – – – –P2O3 – – – 0.37 – – – –P2O5 0.02–0.05 0.5–1.0 – – – 0.2 – – 5.37PbO – – 1.22–7.39 – – – – –Fe – 0.5–10.0 – – 0.7 13 – – –Sulphide
Sulphur– 0–0.4 0.25 0.25–1.41 0.66 0.604 – – –
Loss onignition
1.32–6.93 – 6.59 5.68–6.59 1.08 0.89–5.80 – 1.9 –
WFS – waste foundry sand, ISF slag – imperial smelting furnace slag, GBF.slag – Granulated blast furnace slag, FeCr slag – ferrochrome slag, POC – palm oil clinker.
494M.K.Dash
etal./In
ternatio
nalJournalofSusta
inable
Built
Enviro
nment5(2016)484–516

M.K. Dash et al. / International Journal of Sustainable Built Environment 5 (2016) 484–516 495
and 40 degrees, which is similar to that of ordinary sand.Valcuende et al. (2015) have reported that Micro-Devalindex of blast furnace slag is 14.
4. Chemical properties
Chemical constitution of the industrial wastes relies onthe kind of metal, sort of combustible utilised, which hasbeen mentioned in Table 3. WFS are rich in silica contentand covered with a slim film of burnt carbon, remainingbinder (resins/chemicals, bentonite, sea coal,) and dust(Singh, 2012). Copper slag contains Fe2O3 which is about53.45% (Al-Jabri et al., 2011), whereas ISF slag consistsof Fe2O3 which is 38.33% (Morrison et al., 2003). Thechemical constitution of bottom ash differs based upontype of coal used and the process of burning. Bottom ashis basically made out of silica, iron and alumina with littlequantity of magnesium, calcium, and sulphate etc.(Siddique, 2014). The chemical constituent of steel slag dif-fers with furnace type, grade of steel and pre-treatmentprocess. The steel slag mainly consists of SiO2, CaO,Fe2O3, Al2O3, MgO, MnO, P2O5 (Yi et al., 2012). Themain chemical constituent of blast furnace slag is CaOwhich is 56.10%. Siddique (2003) has determined the chem-ical constitution of class F fly ash, as indicated by ASTM C311 (2013) and found primary constituent silicon dioxide55.3% and aluminium oxide 25.7%. The Palm oil clinkeris mainly consist SiO2 and K2O (Ahmmad et al., 2014).
5. Fresh properties of concrete
5.1. Slump test
Consistency of fresh concrete is a mix property whichincorporates the different necessities of stability, mobility,compatibility, finishability and placeability (Aggarwaland Siddique, 2014). Slump test is used extensively in sitework all over the world. Suggested ranges for low worka-bility, medium workability and high workability of con-crete, the slump value are 25 mm–75 mm, 50 mm–100 mmand 100 mm–150 mm, respectively (IS 456, 2000). Variousresearchers who carried out the slump test using differentindustrial waste materials in concrete are explained below.
5.1.1. Waste foundry sand
Prabhu et al. (2014) investigated that the slump valuewas decreased when the partial substitution of WFSincreased in constant water-cement ratio 0.44. However,they concluded that the impact of foundry sand on worka-bility was not significant with the substitution rate up to10% and the slump value of mixtures was equal to controlmix. Siddique et al. (2009) studied the impact of WFS onthe slump of concrete. Normal sand was partly supplantedwith 0%, 10%, 20% and 30% WFS with a constant water-cement ratio 0.50. It was noticed that slump of WFS con-crete decreases as the replacement ratio increases. This maybe most likely because of the presence of clayey type fine
substances in the WFS, which are compelling in diminish-ing fresh concrete fluidity (Singh, 2012). Aggarwal andSiddique (2014) presented the results of an exploratoryexamination into concrete produced with constant slump30 mm by replacing natural sand with WFS and bottomash which gave an idea about the increase in water demanddue to increase in substitution of sand with WFS and bot-tom ash.
5.1.2. Copper slag
The workability of copper slag was evaluated by Al-Jabri et al. (2009) and described that the workability ofconcrete increases altogether with the increment of copperslag content in concrete mixes. Slump was measured to be28 mm for reference mix, whereas for concrete with 100%copper slag, slump was 150 mm. Wu et al. (2010) inferredthat that addition of copper slag enhances the workabilityof the concrete mix, because of the smooth polished surfacecomposition and low moisture soaking up characteristic ofthe copper slag.
5.1.3. Steel slag
The slump decreases as the substitution rate levelincreases which was found by Devi and Gnanavel (2014)using the steel slag as a substitution of sand. The greaterrate of substitution of sand by steel slag makes the worka-bility of concrete less. Qasrawi et al. (2009) reported thatconcrete in which sand supplanted by steel slag has beenclassified as medium workability up to replacement level50%. The mixes consisting 100% slag were sticky insteaddry. It was presumed that the loss of workability is becauseof two variables, the increment of fines and the incrementof angularity.
5.1.4. Granulated blast furnace slag
Yuksel and Genc (2007) reported that increase in slumpvalue was noticed while the replacement ratio increased forgranulated blast furnace slag. For reference concrete themeasured slump was 60 mm though for 50% replacementof granulated blast furnace slag, the measured slump was100 mm.
5.1.5. ISF slag
According to Tripathi et al. (2013) fresh concrete withsand substitutions over 50% by ISF Slag, appeared harsh,without adequate paste, hard to close-pack, and had a gen-erally uneven finished surface. This was a consequence oflacking fines and surface qualities of ISFS particles, whichget to be apparent particularly at higher replacement levels.
5.1.6. Bottom ash
The particle size of bottom ash is generally smaller(75 lm) than sand. The utilisation of bottom ash (BA) asreplacement of sand in concrete increases the quantity offines and uneven textured, irregular shaped and permeableparticle, in this way increasing the internal particles fric-tion. These properties enhance the water demand and

Table 4Fresh concrete and Mechanical properties of concrete using industrial waste as a fine aggregate replacement.
Author Industrial waste W/C % Replacement Slump inmm/CF
CompressiveStrength*
Split TensileStrength*
Flexuralstrength*
Prabhu et al. (2014) WFS 0.44 0 115 33.14 2.77 4.0910 113 33.24 2.61 3.9920 101 32.58 2.6 3.9930 93 31.24 2.51 3.8840 77 29.48 2.31 3.6950 63 25.23 2.21 3.66
Aggarwal and Siddique (2014) WFS + BA 0.5 0 30 36.27 2.08 4.440.52 5 + 5 = 10 30 29.02 1.8 4.10.53 10 + 10 = 20 30 29.63 2.05 40.55 15 + 15 = 30 30 31.81 2.46 4.340.58 20 + 20 = 40 30 29.95 2.35 3.870.61 25 + 25 = 50 30 30.53 2.25 3.950.68 30 + 30 = 60 30 21.08 1.45 3.6
Devi and Gnanavel (2014) Steel slag 0.55 0 35 20.67 2.26 1.7210 28 19.56 – –20 23 20.1 – –30 18 20.78 – –40 13 28.3 2.47 6.850 11 19.32 – –
Al-Jabri et al. (2011) Copper slag 0.35 0 65.5 45 3 7.710 80 46 3.5 7.220 80 47 3.7 7.240 110 47.1 3.8 6.550 130 47 4.1 7.3
Meenakshi and Ilangovan (2011) CS + FS 0.5 0 20 25.2 4.05 –10 + 10 = 20 32 38.6 6.3 –20 + 20 = 40 46 39.9 7.3 –30 + 30 = 60 54 40.1 7.8 –
Tripathi et al. (2013) ISF slag 0.4 0 0.93 48.25 – 6.4810 0.93 54 – 6.1920 0.92 52.7 – 6.4630 0.92 55.46 – 6.4440 0.92 56.17 – 6.2650 0.94 51.5 – 6.960 0.92 51.28 – 6.9270 0.9 50.74 – 4.94
Yuksel and Genc (2007) GBF slag 0.477 0 60 46.5 3.3 4.7110 80 45.63 3.23 5.2220 90 42.4 3.2 –30 110 41.7 3 4.540 100 41.7 2.76 –50 120 36.1 2.3 4.5
Yuksel and Genc (2007) Bottom ash 0.477 0 60 46.5 3.3 4.7110 80 38.81 3.28 3.720 90 35.38 2.93 –30 80 37.15 2.68 3.6640 70 35.3 2.26 –50 50 35.6 2.11 3.72
Yuksel and Genc (2007) GBFS + BA 0.477 0 60 46.5 – –5 + 5 = 10 80 37.6 – –10 + 10 = 20 90 33.6 – –15 + 15 = 30 90 33 – –20 + 20 = 40 80 31.33 – –25 + 25 = 50 70 31.25 – –
Panda et al. (2013) FeCr slag 0.5 0 48–60 30.5 – –20 48–60 29.4 – –40 48–60 29.6 – –60 48–60 29.8 – –80 48–60 30.1 – –100 48–60 30 – –
(continued on next page)
496 M.K. Dash et al. / International Journal of Sustainable Built Environment 5 (2016) 484–516

Table 4 (continued)
Author Industrial waste W/C % Replacement Slump inmm/CF
CompressiveStrength*
Split TensileStrength*
Flexuralstrength*
Siddique (2003) Cl. F fly ash 0.47 0 100 26.4 3 3.70.48 10 90 28.2 3.1 4.00.49 20 65 30.8 3.2 4.20.49 30 40 34.9 3.4 4.40.49 40 30 38.9 3.5 4.40.5 50 20 40 3.54 4.3
ESA (0000) POC – 0 – 30 – 6.17– 5 – 33.06 – 7.9– 10 – 35.27 – 8.22
CF: compaction factor, CS – copper slag, FS – ferrous Slag, BA – bottom ash, POC – palm oil clinker, FeCr – ferrochrome slag.* Strength are measured after 28 days of curing in Mpa.
M.K. Dash et al. / International Journal of Sustainable Built Environment 5 (2016) 484–516 497
reduce the workability (Siddique, 2014). The slump valueswhich were found by Yuksel and Genc (2007) using the fur-nace bottom ash as a substitution material are recorded inTable 4. Replacement caused an increase in slump value upto 20% replacement beyond that slump values weredecreased. Shi-Cong and Chi-Sun (2009) investigated thatat the fixed W.C. ratio, the slump of the furnace bottomash replaced concrete was increased with an increment inthe percentage of furnace bottom ash substitution. Thiswas because of furnace bottom ash had higher absorptionvalue than that of normal sand resulting more free wateravailable and make the fresh concrete fluidity. Bai et al.(2005) had done the analysis with fixed water cement ratioand constant slump. They concluded that without changingwater cement ratio, the slump was increased with the incre-ment of the FBA and in constant slump range, the incre-ment of the FBA; there was an abatement of free watercontent. Kim and Lee (2011) explained that the slump val-ues were not changed as the bottom ash substitution pro-portion was increased. FBA consumed a lesser quantityof cement paste and water on the surface of the particlebecause of its lower porosity and water absorption.
5.1.7. Ferrochrome slag
Panda et al. (2013) found that the substitution of fer-rochrome slag as more or less exhibit comparative resultsas that with normal sand i.e. within the range 48 mm–60 mm.
5.1.8. Class F fly ashSiddique (2003) reported that a decrease in slump value
was observed while the replacement ratio increased for
0
40
80
120
160
200
240
0 10 20 30 40 50 60 70
Slum
p in
mm
Industrial Waste Replacement (%
Figure 6. Slump of different i
class F type fly ash. For reference concrete the measuredslump was 100 mm for W.C. ratio 0.47 whereas for 50%replacement of class F type fly ash measured slump was20 mm at W.C. ratio 0.50.
5.1.9. Palm oil clinker
Ahmmad et al. (2014) have reported that a decrease inslump value was observed when replacement ratioincreased by palm oil clinker fine aggregate. Slump of con-trol concrete was found to be 196 mm, where slump of theconcrete in which coarse aggregates were fully replaced byoil palm shell and natural sand substituted 50% by palm oilclinker fine aggregate was 83 mm.
So from the above discussion and Fig. 6, it can be con-cluded that steel slag concrete, WFS slag concrete, class Ffly ash concrete, and palm oil clinker concrete show lowworkability whereas a slump value increases with replace-ment ratio increases in copper slag and GBF slag concrete,but in case of bottom ash concrete the slump valueincreases up to 20% replacement and beyond that itdecreases.
5.2. Compaction factor test
The compaction factor test is in light of the definition,that workability of the concrete is that property that deci-des the quantity of work needed to create full compaction.The test comprises basically of applying a standard mea-sure of work to the standard amount of concrete and mea-suring the subsequent compaction. The compaction factorof concrete in which fine aggregate is replaced by fer-rochrome slag found by Panda et al. (2013) is 0.88 and
80 90 100
)
WFS (Prabhu et al.,2014)
Steel Slag (Devi and Gnanavel, 2014)
C. Slag (Al-jabri et al. ,2011)
Class F fly ash (Siddique,2003)
POC (Ahmmad et al.,2014)
B.Ash [53]
GBFS [53]
ndustrial waste concretes.

498 M.K. Dash et al. / International Journal of Sustainable Built Environment 5 (2016) 484–516
0.92 showing midway workability for concrete items.Aggarwal and Siddique (2014) investigated with constantcompaction factor 0.78–0.83 by replacing natural sand withWFS and bottom ash presented the results that increase inwater demand with increase in supplanting of sand withwaste foundry sand and bottom ash.
5.3. Air content
Siddique et al. (2009) found the air content between4.2% and 4.5% in concrete in which natural sand isreplaced by three percentages (10%, 20%, 30%) of usedfoundry sand. Singh and Siddique (2012b) found the sameair content like Siddique et al. (2009) between 4.2% and4.5% in concrete in which natural sand is replaced by fourrates (5%, 10%, 15%, 20%) of waste foundry sand, whereasAggarwal and Siddique (2014) found it in the range of 2.1–3.4% in concrete in which natural sand is replaced by wastefoundry sand and bottom ash. In fresh concrete, the aircontent of class F fly ash concrete is lower than that of nor-mal weight concrete. The air content is 3.2%, 3.8%, 4.0%for 50%, 40%, 30% class F fly ash concrete respectively incomparison to the control concrete air content 5.2%(Siddique, 2003).
6. Leaching test
The general objective of the leaching tests is to quantifythe mobility of chemical species present in waste or wastebased materials in a given leachant. In other words leach-ing test is a test during which a material is put into con-tact with a leachant and some constituents of the materialare extracted. Basar and Aksoy (2012) have reported thatthere was an increase in total organic carbon value withthe addition of waste foundry sand, but TOC values werestill under points of confinement characterised as EULFDclass-III. Tripathi et al. (2013) observed that leaching oflead and cadmium from the concrete in which 70% natu-ral sand supplanted by ISF slag were within acceptablelimit 5 and 1 ppm respectively but these limits in the caseof raw ISFS were higher. Morrison et al. (2003) worked tofocus the levels of lead and zinc discharged from the ISFslag in different solutions. They had concluded that leach-ing of metal ions from the ISF slag could be controlled byutilisation of pulverized fuel ash and GBF slag. Pandaet al. (2013) performed short tank leaching test on con-crete specimen having a disparate percentage of fer-rochrome slag as fine aggregate and sand with normaldistiled water with pH value 6.68 and with toxicity char-acteristic leaching procedure extraction liquid pH 2.88.They concluded that chromium leaching study resultsexhibited low level leaching, Cr (VI) and total chromiumlimitations are within the Indian regulatory dischargestandard and USEPA. According to them blast furnaceslag based Portland cement is best in disabling Cr (III)as well as Cr (VI).
7. Density of concrete
Concrete’s compressive strength primarily relies on theworkability of concrete. The poor workability of the con-crete diminishes the compaction of the concrete andincreases the porosity of the concrete. The increase inporosity decreases the density of the concrete and leadsto a reduction in compressive strength. That’s why densityis one of the most prime variables to consider in the designof concrete structure.
7.1. Waste foundry sand
Prabhu et al. (2014) reported that the density of concretein hardened stage decreases as the percentage of replace-ment of foundry sand increases. According to them manyfoundries still are using clay, sawdust and wood flour asa binding material to form the moulds. The presence ofthose particles reduces the specific density of the material,and also decreases the density of the concrete by creatingair voids in the concrete. But according to Siddique et al.(2009) density of fresh concrete of control mix was almostequal to the density of concrete in which sand was substi-tuted by foundry sand from 10% to 30%.
7.2. Steel slag
Qasrawi et al. (2009) reported that the utilisation of steelslag in concrete, density of concrete was increased becauseit supplanted sand which has a lesser specific gravity. How-ever the increment in the density is little and considered asnormal-density concrete.
7.3. Copper slag
Al-Jabri et al. (2009) reported that, there is merely incre-ment in the density of the concrete with copper slagreplacement increases, which is ascribed to the high specificgravity of copper slag. This perception is in accordancewith comparative perception from different studies(Poovizhi and Kathirvel, 2015), where it has been statedthat density of concrete was increased as the rate of substi-tution of sand by copper slag increases.
7.4. ISF slag
Morrison et al. (2003) noted that density of concreteincreases when ISF slag was added as sand substitutionbecause of high specific gravity of ISF slags. The otherresearchers like Tripathi et al. (2013) have also confirmedthat the density of concrete was increased as the percentageof replacement of sand by ISF slag increases.
7.5. Bottom ash
Kim and Lee (2011) noticed that the densities ofconcrete in hardened stage linearly diminished as the

M.K. Dash et al. / International Journal of Sustainable Built Environment 5 (2016) 484–516 499
substitution proportion of bottom ash were increased.They found density was less than 2000 Kg/m3, when100% natural sand was supplanted by bottom ash.
7.6. Class F type fly ash
Siddique (2003) reported that the fresh concrete densityis almost similar to control mix up to replacement level50%. They found fresh density of concrete in which fineaggregate is replaced 10%, 20%, 30%, 40% and 50% byclass F type fly ash were 2310, 2314, 2314, 2316 and2319 kg/m3, respectively in comparison to control concretefresh density 2308 kg/m3.
7.7. Palm oil clinker
Ahmmad et al. (2014) have stated that density controlconcrete was 2342 kg/m3, where the density of the concretein which coarse aggregate fully replaced by oil palm shelland natural sand substituted 25%, 37.5% and 50% by palmoil clinker fine aggregate were 1913, 1902 and 1889 kg/m3,respectively.
From this review it can be observed that in cases likecopper slag, steel slag and ISF slag density of concreteincreases with inclusion of replacing industrial waste mate-rials, density of class F type fly ash concrete and wastefoundry sand concrete is almost similar with that of controlconcrete, but the concrete in which sand was replaced bybottom ash and palm oil clinker, the density of concretedecreases. It is observed that densities of all concrete spec-imens, where natural sand was replaced by different indus-trial wastes were within the range of 2000–2600 kg/m3
which are valid for normal concrete class (Basar andAksoy, 2012). The densities of palm oil clinker concretewere ranging from 1360 to 1920 kg/m3 which agree withthe limits specified for light weight aggregate concrete(Materials for Concrete Construction, 1999).
8. Hardened concrete properties
8.1. Compressive strength
Out of numerous tests connected to the concrete, com-pressive strength test is the extreme vital which gives athought regarding all the qualities of concrete. Conductingthis particular test one can determine whether concretework has been done legitimately or not. All other mechan-ical parameters directly depend on the compressivestrength of the concrete. Selected compressive strength val-ues of concrete after 28 days of curing examined by differ-ent researchers in which fine aggregate fully or partially isreplaced by different industrial wastes are listed in Table 4.
8.1.1. Waste foundry sand
Prabhu et al. (2014) reported that even though no mar-ginal improvement in compressive strength was observed infoundry sand replaced concrete, the concrete mixture
containing foundry sand up to 20% replacement was rela-tively close to the strength of control mix, but beyond20% replacement concrete mixtures showed lower strengththan control mix. It is due to the fineness of foundry sanddecreases the workability of concrete and decreases thecompressive strength of concrete as a result. Basar andAksoy (2012) reported that increased proportions ofreplaced waste foundry sand in concrete result in a dimin-ishment in compressive strength because of the higher sur-face area of fine molecules which prompted the decrease inthe water cement gel in concrete matrix; henceforth nohelpful tying of aggregates with cement paste can be com-pleted. Singh and Siddique (2012a) stated that higher com-pressive strength of waste foundry sand concrete mixes wasachieved than reference concrete mix. According to them,compressive strength of reference mix was 40 MPa at28 days, where concrete mix with fine aggregate supplanted15% by WFS, found 17% increment in compressivestrength than control concrete. Salokhe and Desai (2009)carried out their test by supplanting sand with waste foun-dry sand from ferrous and non-ferrous casting industry.Concrete made with ferrous waste foundry sand displayedlesser compressive strength than reference concrete for 10%and 20% substitution rate and it was verging on equivalentto that of control blend for 30% substitution level. Though,the compressive strength of concrete in which 10% non-ferrous waste foundry sand were incorporated showedpractically equivalent value as that of reference concreteand continues diminishing for 20% and 30% substitutionlevel. Aggarwal and Siddique (2014) reported thatthere was a decline in compressive strength of concretemixes with the incorporation of waste foundry sand andbottom ash as substitution in equal percentage of fineaggregate.
8.1.1.1. Fungal treated waste foundry sand
Kaur et al. (2012) reported that at 28 days of curing, thereference concrete mix achieved a compressive strength of33.10 N/mm2, while 10%, 15% and 20% untreated WFSin concrete achieved a compressive strength of 33.76 N/mm2, 29.30 N/mm2 and 27.80 N/mm2 individually. Thereis a negligible decline in compressive strength when sandis substituted partially by the WFS. In the event of sandsubstituted by fungal treated WFS demonstrates superiorcompressive strength which is even if more than controlmix.
8.1.2. Steel slag
Devi and Gnanavel (2014) have reported that there is anincrement in compressive strength of concrete by 27.04% inwhich sand was supplanted by 40% steel slag. Qasrawiet al. (2009) had concluded that improvement of compres-sive strength was achieved when fine aggregates werereplaced by steel slag between 15% and 30%, beyond the30% replacement level concrete mix exhibits lower com-pressive strength than the reference concrete mix at theage of 28 days, 90 days and 180 days.

500 M.K. Dash et al. / International Journal of Sustainable Built Environment 5 (2016) 484–516
8.1.3. Copper slag
Al-Jabri et al. (2009) have stated that the compressivestrength of concrete is marginally more as copper slagreplacement increments up to 50% after that the compres-sive strength was decreased notably because of increase inthe free water which is excess than the needed for cementpaste hydration. Al-Jabri et al. (2009) the same researcheralso carried out the test by adopting fixed slump in the con-crete by diminishing the water content as copper slagreplacement amount increased. The maximum compressivestrength was achieved by a concrete mix in 28-day with100% substitution of copper slag which was 107.4 N/mm2
though the compressive strength for the reference concretewas 88.1 N/mm2. This proposes that there was around 22%enhancement in the compressive strength of concrete inwhich fixed slump was kept (Al-Jabri et al., 2009).Poovizhi and Kathirvel (2015) have also concluded thatthere was maximum increment of compressive strengthwhen 40% normal sand substituted by copper slag.
8.1.3. ISF slag
Tripathi et al. (2013) have reported that the compressivestrength of the reference control concrete with W.Cratio 0.55, 0.50, 0.45, and 0.40 were 41.70, 43.83, 45.77,and 48.20 N/mm2 individually. For elevated W.C ratio0.55 compressive strength was diminishing with an incre-ment in ISF slag, although this decline was not significantfor sand substitutions up to 60%. The strength of ISFslag concrete mixes with W.C ratio 0.45 was like thecontrol mix, while the strength of 0.40 W.C ratio ISF slagconcrete was pretty nearly 5–16% more than the referencemix.
8.1.5. Blast furnace slag
Yuksel et al. (2006) have reported that the compressivestrength of blast furnace slag concrete is diminishing whenthe rate of replacement increases. They achieved the com-pressive strength of control mix 15.47 MPa and14.83 MPa at 25%, 12.24 MPa at 50%, 10.92 MPa at75%, 9.66 MPa at 100% by inclusion of blast furnace slagin concrete. Valcuende et al. (2015) have concluded thatat early ages, the concrete in which fine aggregate replacedby blast furnace slag show similar compressive strength tothe reference concrete. However, at 365 days due to slagreactivity, the higher the quantity of sand replaced byslag the higher the concrete’s compressive strength tendsto be.
2000
2200
2400
2600
2800
3000
0 10 20 30 40 50 60 70
Den
sity
in K
g/m
3
Industrial Waste Replacement (%)
Figure 7. Density of different
8.1.6. Bottom ash
Bai et al. (2005) examined the compressive strength offurnace bottom ash concrete by taking four different mixproportions with a constant WC ratio of 0.45 and at fixedslump, resulted that the compressive strength diminishedwith increment of furnace bottom ash in constant watercement ratio at all ages. However, at the constant slumpthe compressive strength of the furnace BA concrete wassimilar to that of the control concrete at all the ages.Singh and Siddique (2014) reported that they found theseven day compressive strength of BA concrete diminishedwith the increment in replacement level. With the advance-ment of age, the compressive strength of BA concrete mix-ture increased at a faster rate. Bottom ash concretemixtures at 28 days of curing, achieved compressivestrength comparable to that of control concrete mixture.At 90 days of curing, the compressive strength of bottomash replaced by 20%, 30%, 40%, 50%, 75% in concrete mix-tures was 5.27%, 12.29%, 6.30%, 6.93%, 2.67% and 2.06%,respectively higher than that of control concrete. At365 days of curing, bottom ash concrete mixtures with20%, 30%, 40%, 50%, 75% replaced level gained compres-sive strength 33.69%, 31.69%, 35.87%, 31.84%, 37.04%and 37.96%, respectively over their 28 day compressivestrength as compared to 30.02% gained by control con-crete. Shi-Cong and Chi-Sun (2009) also found the sameresult as Bai et al. (2005) that the compressive strengthdiminished with increment of furnace bottom ash in con-stant water cement ratio at all ages attributed to high initialfree water content. However, at the constant slump, fur-nace bottom ash concrete compressive strength at all theages was higher than the control concrete.
8.1.7. Ferrochrome slag
Panda et al. (2013) found that there is no significantchange in compressive strength with the increment in slagpercentage. At 100% substitution of slag, there is no signif-icant change in compressive strength as compared withcubes with river sand as fine aggregate.
8.1.8. Class F fly ash
Siddique (2003) examined the compressive strength ofclass F fly ash concrete by taking six different mix propor-tions with a water cement ratio of 0.47, 0.48, 0.49, 0.49,0.49, 0.50, respectively and resulted that strength achievedat 0%, 10%, 20%, 30%, 40% and 50%, were 26.4 MPa,28.2 MPa, 30.8 MPa, 34.9 MPa, 38.9 MPa, 40 MPa,
80 90 100
WFS (Siddique et al.,2009)
Steel Slag (Qasrawi et al., 2009)
Class F fly ash (Siddique,2003)
ISF Slag (Morrison et al.,2003)
Bottom Ash (Siddique et al.,2014)
Copper Slag (Wu et al. ,2010)
industrial waste concretes.
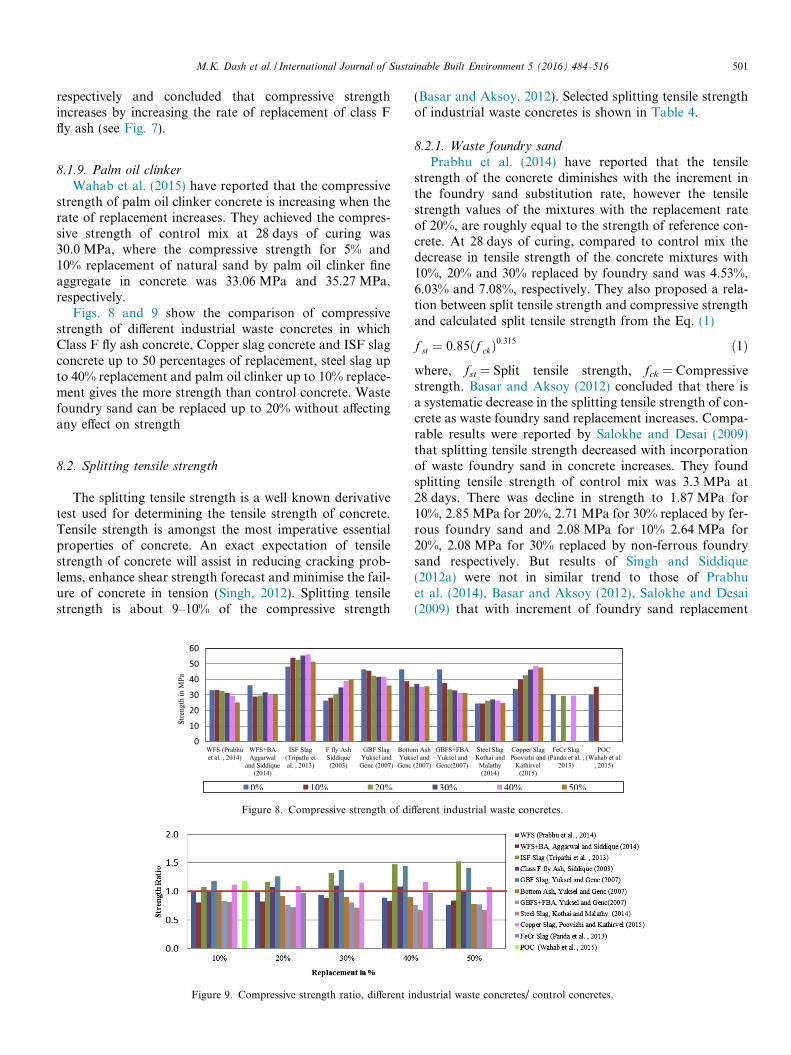
M.K. Dash et al. / International Journal of Sustainable Built Environment 5 (2016) 484–516 501
respectively and concluded that compressive strengthincreases by increasing the rate of replacement of class Ffly ash (see Fig. 7).
8.1.9. Palm oil clinker
Wahab et al. (2015) have reported that the compressivestrength of palm oil clinker concrete is increasing when therate of replacement increases. They achieved the compres-sive strength of control mix at 28 days of curing was30.0 MPa, where the compressive strength for 5% and10% replacement of natural sand by palm oil clinker fineaggregate in concrete was 33.06 MPa and 35.27 MPa,respectively.
Figs. 8 and 9 show the comparison of compressivestrength of different industrial waste concretes in whichClass F fly ash concrete, Copper slag concrete and ISF slagconcrete up to 50 percentages of replacement, steel slag upto 40% replacement and palm oil clinker up to 10% replace-ment gives the more strength than control concrete. Wastefoundry sand can be replaced up to 20% without affectingany effect on strength
8.2. Splitting tensile strength
The splitting tensile strength is a well known derivativetest used for determining the tensile strength of concrete.Tensile strength is amongst the most imperative essentialproperties of concrete. An exact expectation of tensilestrength of concrete will assist in reducing cracking prob-lems, enhance shear strength forecast and minimise the fail-ure of concrete in tension (Singh, 2012). Splitting tensilestrength is about 9–10% of the compressive strength
0
10
20
30
40
50
60
WFS (Prabhu et al. , 2014)
WFS+BA Aggarwal
and Siddique (2014)
ISF Slag (Tripathi et al. , 2013)
F fly Ash Siddique (2003)
GBF Slag Yuksel and
Genc (2007)
BottoYuks
Genc
Stre
ngth
in M
Pa
0% 10% 20%
Figure 8. Compressive strength of di
Figure 9. Compressive strength ratio, different i
(Basar and Aksoy, 2012). Selected splitting tensile strengthof industrial waste concretes is shown in Table 4.
8.2.1. Waste foundry sand
Prabhu et al. (2014) have reported that the tensilestrength of the concrete diminishes with the increment inthe foundry sand substitution rate, however the tensilestrength values of the mixtures with the replacement rateof 20%, are roughly equal to the strength of reference con-crete. At 28 days of curing, compared to control mix thedecrease in tensile strength of the concrete mixtures with10%, 20% and 30% replaced by foundry sand was 4.53%,6.03% and 7.08%, respectively. They also proposed a rela-tion between split tensile strength and compressive strengthand calculated split tensile strength from the Eq. (1)
f st ¼ 0:85ðf ckÞ0:315 ð1Þwhere, fst = Split tensile strength, fck = Compressivestrength. Basar and Aksoy (2012) concluded that there isa systematic decrease in the splitting tensile strength of con-crete as waste foundry sand replacement increases. Compa-rable results were reported by Salokhe and Desai (2009)that splitting tensile strength decreased with incorporationof waste foundry sand in concrete increases. They foundsplitting tensile strength of control mix was 3.3 MPa at28 days. There was decline in strength to 1.87 MPa for10%, 2.85 MPa for 20%, 2.71 MPa for 30% replaced by fer-rous foundry sand and 2.08 MPa for 10% 2.64 MPa for20%, 2.08 MPa for 30% replaced by non-ferrous foundrysand respectively. But results of Singh and Siddique(2012a) were not in similar trend to those of Prabhuet al. (2014), Basar and Aksoy (2012), Salokhe and Desai(2009) that with increment of foundry sand replacement
m Ash el and
(2007)
GBFS+FBA Yuksel and Genc(2007)
Steel Slag Kothai and
Malathy (2014)
Copper Slag Poovizhi and
Kathirvel (2015)
FeCr Slag (Panda et al. ,
2013)
POC (Wahab et al.
, 2015)
30% 40% 50%
fferent industrial waste concretes.
ndustrial waste concretes/ control concretes.

502 M.K. Dash et al. / International Journal of Sustainable Built Environment 5 (2016) 484–516
in concrete, splitting tensile strength was diminished. Singhand Siddique (2012a) found splitting tensile strength ofcontrol mixture at 28 days was 4.23 MPa. It was increasedby 3.55%, 8.27%, 10.40% and 6.38% in which sand wasreplaced 5%, 10%, 15%, and 20% by waste foundry sand,respectively than control mix (Singh and Siddique,2012a). Etxeberria et al. (2010) found higher splitting ten-sile strength 3.0 MPa and 2.7 MPa in concrete mix wherefine aggregates are replaced by chemically foundry sandand green foundry sand respectively in comparison withcontrol mix splitting tensile strength 2.4 MPa. Aggarwaland Siddique (2014) reported that in 28 day curing, therewas decrease in 13.46%, 1.44% and 30.29% in split tensilestrength for mixes in which the sand replaced level was10%, 20%, 60% by foundry waste sand and bottom ashequally and it was observed with an increase in 18.27%,12.98%, and 8.17% for the mixes in which sand replacedlevel was 30%, 40%, 50% in comparison to the referencemix.
8.2.2. Steel slag
Devi and Gnanavel (2014) have found split tensilestrength of control mix was 2.26 MPa and 2.47 MPa forconcrete mix in which fine aggregate replaced by 40% steelslag which is 9.29% higher than the control mix.
8.2.3. Copper slag
Al-Jabri et al. (2009) found higher splitting tensilestrength 6.2 MPa, 6.1 MPa and 6.1 MPa in concrete mixwhere fine aggregates replaced by 20%, 40%, and 50% withcopper slag and found lesser splitting tensile strength5.2 MPa, 4.8 MPa, 4.7 MPa, 4.4 MPa in concrete mixwhere fine aggregates are replaced by 10%, 60%, 80%,100%, respectively in comparison with control mix splittingtensile strength 5.4 MPa. They stated that for design pur-pose the tensile strength can be experientially taken as
f st ¼ 0:45ffiffiffiffiffiffif cu
pð2Þ
where fst and fcu are tensile and compressive strength at28 days, respectively. Al-Jabri et al. (2011) have statedthere was an increase in split tensile strength with incorpo-ration of copper slag in concrete mix up to 80%. Theyfound splitting tensile strength of reference nix at 28 dayswas 3.0 MPa and 3.5 MPa, 3.7 MPa, 3.8 MPa, 4.1 MPa,
0
1
2
3
4
WFS (Prabhu et al.,2014)
WFS+BA Aggarwal and Siddique
(2014)
F fly Ash Siddique (2003)
GBF Sland Ge
Stre
ngth
in M
Pa
0% 10% 20%
Figure 10. Split tensile strength of di
3.6 MPa, 3.6 MPa in concrete mix where fine aggregateswere replaced by 10%, 20%, 40%, 50%, 60%, 80% copperslag respectively. Wu et al. (2010) found splitting tensilestrength 9.6 MPa in concrete mix where fine aggregateswere replaced by 40% with copper slag and found less split-ting tensile strength in concrete mix where fine aggregateswere replaced by 20%, 60%, 80%, 100%, respectively incomparison with control mix splitting tensile strength9.3 MPa. Similar results reported by Velumani andNirmalkumar (2014) like Wu et al. (2010) state that splittensile strength of concrete with 40% surrogating fineaggregate by copper slag has the maximum split tensilestrength and it was 7.25 N/mm2 where split tensile strengthof conventional concrete was 4.89 N/mm2.
8.2.4. Blast furnace slag
Yuksel and Genc (2007) observed that the split tensilestrength diminishes as the rate increments for granulatedblast furnace slag replacements and no distinction in thesplit tensile strength was seen up to a 10% substitution.For the granulated blast furnace slag substitution up to30%, the decrease in the split tensile strengths is 12%.
8.2.5. Bottom ash
Yuksel and Genc (2007) found that the split tensilestrength diminishes as the rate for furnace bottom ash sub-stitutions increases. They concluded that no distinction inthe split strength was seen up to a 10% substitution andbeyond that the reductions in the values of split strengthfor the furnace bottom ash substitutions were much higher.For 50% furnace bottom ash replacement split tensilestrength was obtained 58% less than the control mix.
8.2.6. Class F fly ash
Siddique (2003) concluded from his research that thesplit tensile strength of class F fly ash concrete increasesby increasing the percentage of replacement of class F flyash. The split tensile strength accomplished in 28 days ofcuring at 0%, 10%, 20%, 30%, 40% and 50%, replaced byclass F fly ash were 3.0 MPa, 3.1 MPa, 3.2 MPa,3.4 MPa, 3.5 MPa, 3.5 MPa, respectively.
Figs. 10 and 11 show the comparison of Split tensilestrength of different industrial waste concretes in whichWFS + BA concrete, class F fly ash concrete and copper
ag Yuksel nc (2007)
Bo�om Ash Yuksel and Genc
(2007)
Steel Slag Kothai and Malathy
(2014)
Copper Slag Poovizhi and
Kathirvel (2015)
30% 40% 50%
fferent industrial waste concretes.
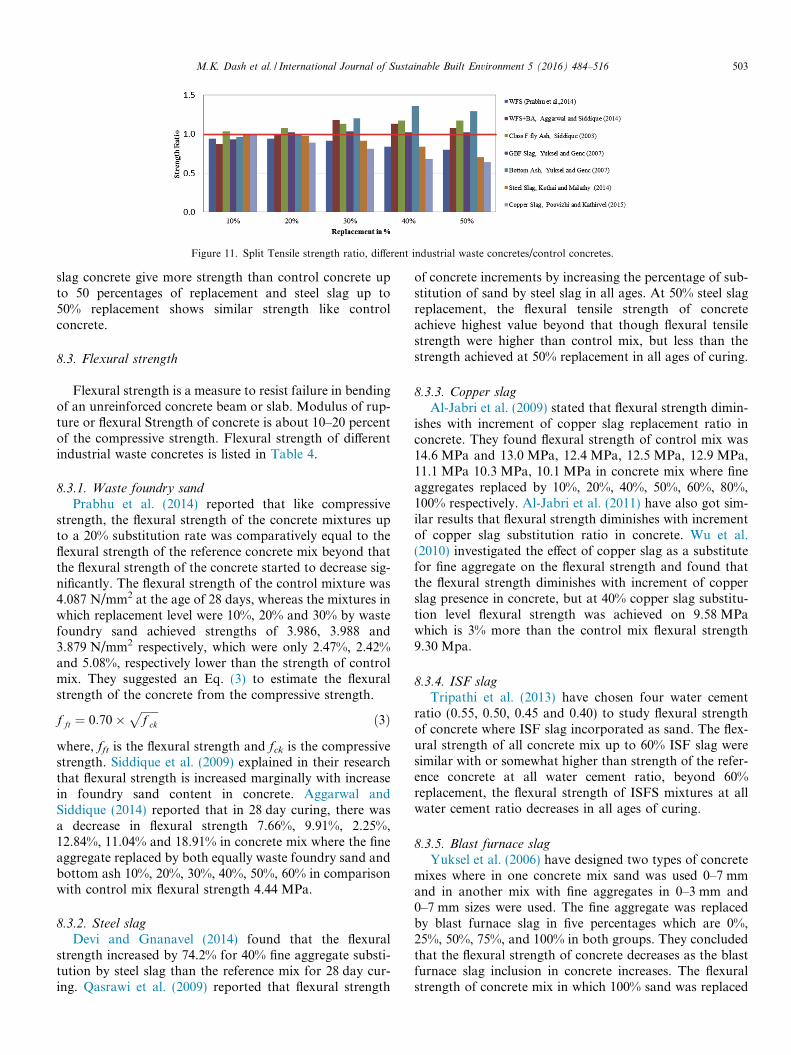
Figure 11. Split Tensile strength ratio, different industrial waste concretes/control concretes.
M.K. Dash et al. / International Journal of Sustainable Built Environment 5 (2016) 484–516 503
slag concrete give more strength than control concrete upto 50 percentages of replacement and steel slag up to50% replacement shows similar strength like controlconcrete.
8.3. Flexural strength
Flexural strength is a measure to resist failure in bendingof an unreinforced concrete beam or slab. Modulus of rup-ture or flexural Strength of concrete is about 10–20 percentof the compressive strength. Flexural strength of differentindustrial waste concretes is listed in Table 4.
8.3.1. Waste foundry sand
Prabhu et al. (2014) reported that like compressivestrength, the flexural strength of the concrete mixtures upto a 20% substitution rate was comparatively equal to theflexural strength of the reference concrete mix beyond thatthe flexural strength of the concrete started to decrease sig-nificantly. The flexural strength of the control mixture was4.087 N/mm2 at the age of 28 days, whereas the mixtures inwhich replacement level were 10%, 20% and 30% by wastefoundry sand achieved strengths of 3.986, 3.988 and3.879 N/mm2 respectively, which were only 2.47%, 2.42%and 5.08%, respectively lower than the strength of controlmix. They suggested an Eq. (3) to estimate the flexuralstrength of the concrete from the compressive strength.
f ft ¼ 0:70�ffiffiffiffiffiffif ck
pð3Þ
where, fft is the flexural strength and fck is the compressivestrength. Siddique et al. (2009) explained in their researchthat flexural strength is increased marginally with increasein foundry sand content in concrete. Aggarwal andSiddique (2014) reported that in 28 day curing, there wasa decrease in flexural strength 7.66%, 9.91%, 2.25%,12.84%, 11.04% and 18.91% in concrete mix where the fineaggregate replaced by both equally waste foundry sand andbottom ash 10%, 20%, 30%, 40%, 50%, 60% in comparisonwith control mix flexural strength 4.44 MPa.
8.3.2. Steel slag
Devi and Gnanavel (2014) found that the flexuralstrength increased by 74.2% for 40% fine aggregate substi-tution by steel slag than the reference mix for 28 day cur-ing. Qasrawi et al. (2009) reported that flexural strength
of concrete increments by increasing the percentage of sub-stitution of sand by steel slag in all ages. At 50% steel slagreplacement, the flexural tensile strength of concreteachieve highest value beyond that though flexural tensilestrength were higher than control mix, but less than thestrength achieved at 50% replacement in all ages of curing.
8.3.3. Copper slag
Al-Jabri et al. (2009) stated that flexural strength dimin-ishes with increment of copper slag replacement ratio inconcrete. They found flexural strength of control mix was14.6 MPa and 13.0 MPa, 12.4 MPa, 12.5 MPa, 12.9 MPa,11.1 MPa 10.3 MPa, 10.1 MPa in concrete mix where fineaggregates replaced by 10%, 20%, 40%, 50%, 60%, 80%,100% respectively. Al-Jabri et al. (2011) have also got sim-ilar results that flexural strength diminishes with incrementof copper slag substitution ratio in concrete. Wu et al.(2010) investigated the effect of copper slag as a substitutefor fine aggregate on the flexural strength and found thatthe flexural strength diminishes with increment of copperslag presence in concrete, but at 40% copper slag substitu-tion level flexural strength was achieved on 9.58 MPawhich is 3% more than the control mix flexural strength9.30 Mpa.
8.3.4. ISF slag
Tripathi et al. (2013) have chosen four water cementratio (0.55, 0.50, 0.45 and 0.40) to study flexural strengthof concrete where ISF slag incorporated as sand. The flex-ural strength of all concrete mix up to 60% ISF slag weresimilar with or somewhat higher than strength of the refer-ence concrete at all water cement ratio, beyond 60%replacement, the flexural strength of ISFS mixtures at allwater cement ratio decreases in all ages of curing.
8.3.5. Blast furnace slag
Yuksel et al. (2006) have designed two types of concretemixes where in one concrete mix sand was used 0–7 mmand in another mix with fine aggregates in 0–3 mm and0–7 mm sizes were used. The fine aggregate was replacedby blast furnace slag in five percentages which are 0%,25%, 50%, 75%, and 100% in both groups. They concludedthat the flexural strength of concrete decreases as the blastfurnace slag inclusion in concrete increases. The flexuralstrength of concrete mix in which 100% sand was replaced

0
5
10
15
20
WFS (Prabhu et al.,2014)
WFS+BA Aggarwal and
Siddique (2014)
F fly Ash Siddique (2003)
GBF Slag Yuksel and
Genc (2007)
Bo�om Ash Yuksel and
Genc (2007)
Steel Slag Kothai and
Malathy (2014)
Copper Slag Poovizhi and
Kathirvel (2015)
POC (Wahab et al. , 2015)
Stre
ngth
in M
Pa
0% 10% 20% 30% 40% 50%
Figure 12. Flexural strength of different industrial waste concretes.
504 M.K. Dash et al. / International Journal of Sustainable Built Environment 5 (2016) 484–516
by blast furnace slag is 3.56 MPa in comparison with con-trol mix flexural strength 5.15 MPa and other flexuralstrength value are listed in Table 4. Yuksel and Genc(2007) observed that for the 10% substitution blast furnaceslag, flexural strength increased 10% than control mix. Forthe 20% and 50% blast furnace slag substitutions, the ten-sile strength values were near to the control specimenvalue.
8.3.6. Bottom ash
Yuksel and Genc (2007) observed that furnace bottomash replacement in concrete decreases the flexural strengthquite considerably. The flexural strength of control mixwas 4.71 MPa, where for 10%, 20% and 30% replacement,the flexural strength were 3.7 MPa, 3.66 MPa and3.72 MPa, respectively. The result shows a decline in thetensile strength is almost 10% for 10% replacement of sandby furnace bottom ash and important to note that there isvirtually no change in the tensile strength values beyondthe 10% furnace bottom ash replacement (see Fig. 12).
8.3.7. Class F fly ashSiddique (2003) reported the flexural behaviour of class
F fly ash concrete as that behaves same like compressivestrength that flexural strength increases when the percent-age replacement increased. The flexural strength of 50%class F fly ash concrete at 28 days of curing was 4.3 MPawith respect to control concrete strength 3.7 MPa (seeTable 5).
8.3.8. Palm oil clinker
Wahab et al. (2015) have stated that the flexural strengthof palm oil clinker concrete is increasing when the rate ofreplacement increases. The flexural strength of controlmix at 28 days of curing was 6.17 MPa and 7.90 MPa at5%, 8.22 MPa at 10% by substitution of palm oil clinkeras fine aggregate in concrete.
Figs. 12 and 13 shows the comparison of Flexuralstrength of different industrial waste concretes, whichshows better flexural strength than control concrete up to50 percentages of replacement in case of class F fly ash con-crete and copper slag concrete. Waste foundry sand con-crete up to 20% and steel slag concrete up to 50%replacement shows similar strength like control concrete.
Palm oil clinker concrete up to 10% substitution exhibitsmore flexural strength than reference concrete.
8.4. Modulus of elasticity (MOE)
Modulus of elasticity or Young’s Modulus is a measureof stiffness of an elastic material and utilised to describe theelastic properties of items when they are stretched or com-pressed. Young’s modulus of concrete is a standoutamongst the most vital parameters in the design of struc-tural members. Waste foundry sand is the only industrialwaste materials on which modulus of elasticity propertyhas been studied. There are less number of researcherswho have found out this E-value on one industrial wasteconcrete in which sand is supplanted by WFS. Basar andAksoy (2012) reported that there was a lessening in themodulus of elasticity of concrete mix in which normal sandis partially substituted by WFS. The modulus of elasticityof the concrete mixes was assessed by them at the ages of7, 28, 56 and 90 days utilising the observational relation-ship recommended by TS 500:2000 (TS 500, 2000) asfollows:
Ecj ¼ 3250ffiffiffiffiffiffiffif ckj
qþ 14; 000 Mpa ð4Þ
where, Ecj is the modulus of elasticity of the concrete inMPa at j-day and fckj is the compressive strength of theconcrete in MPa at j-day. Singh and Siddique (2012a)reported that incorporation of waste foundry sand in con-crete led to increment in modulus of elasticity at all ages.Increase in modulus of elasticity by 1.67%, 5.01%, 6.35%and 4.35% of concrete mix was observed in which fineaggregate was replaced by 5% WFS, 10% WFS, 15%WFS and 20% WFS respectively than the control concretemixture modulus of elasticity 29.91 GPa in 28 day curing.Etxeberria et al. (2010) concluded that there is a decreasein modulus of elasticity by increasing the substitution levelof waste foundry sand in concrete mix. Further, variationin modulus of elasticity was observed linearly increasingup to 15%, at 20% supplanting of natural sand with foun-dry sand, it starts decreasing. At 28-day, control mixtureacquired a MOE of 25.1 GPa, whereas modulus of elastic-ity of mixes with 10% used foundry sand (UFS), 20% UFSand 30% UFS accomplished 26.75, 27.60, and 28.4 GPaindividually (Etxeberria et al., 2010). Siddique (2003) stated
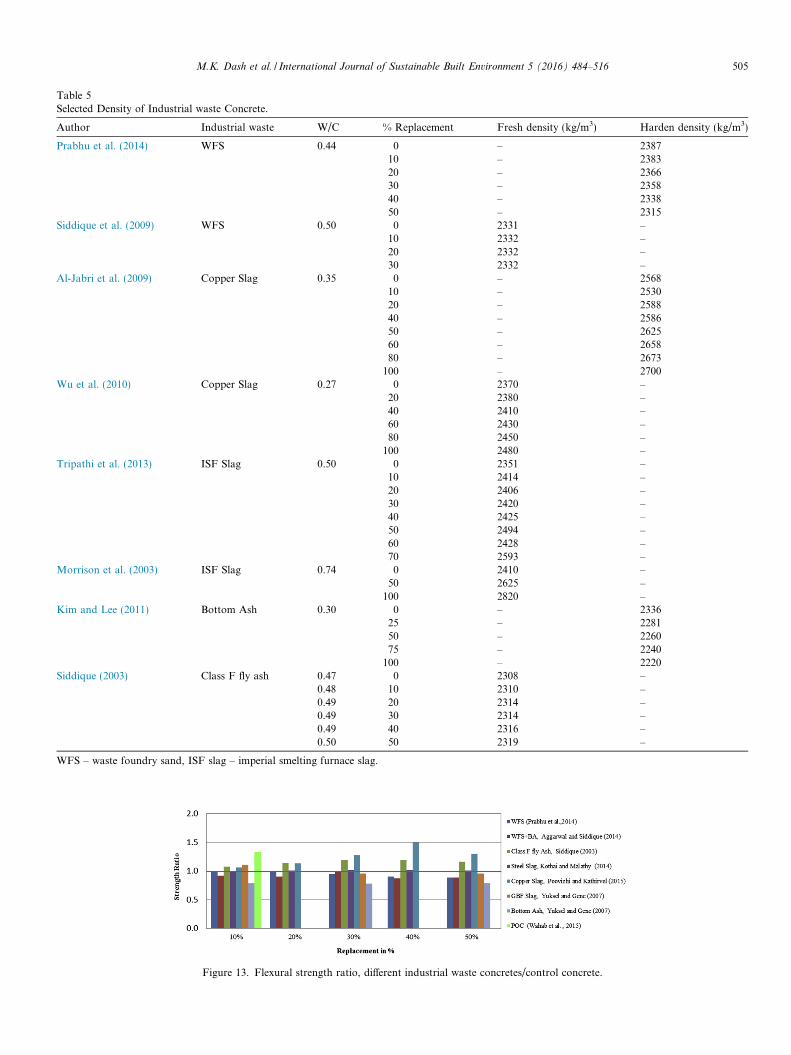
Table 5Selected Density of Industrial waste Concrete.
Author Industrial waste W/C % Replacement Fresh density (kg/m3) Harden density (kg/m3)
Prabhu et al. (2014) WFS 0.44 0 – 238710 – 238320 – 236630 – 235840 – 233850 – 2315
Siddique et al. (2009) WFS 0.50 0 2331 –10 2332 –20 2332 –30 2332 –
Al-Jabri et al. (2009) Copper Slag 0.35 0 – 256810 – 253020 – 258840 – 258650 – 262560 – 265880 – 2673100 – 2700
Wu et al. (2010) Copper Slag 0.27 0 2370 –20 2380 –40 2410 –60 2430 –80 2450 –100 2480 –
Tripathi et al. (2013) ISF Slag 0.50 0 2351 –10 2414 –20 2406 –30 2420 –40 2425 –50 2494 –60 2428 –70 2593 –
Morrison et al. (2003) ISF Slag 0.74 0 2410 –50 2625 –100 2820 –
Kim and Lee (2011) Bottom Ash 0.30 0 – 233625 – 228150 – 226075 – 2240100 – 2220
Siddique (2003) Class F fly ash 0.47 0 2308 –0.48 10 2310 –0.49 20 2314 –0.49 30 2314 –0.49 40 2316 –0.50 50 2319 –
WFS – waste foundry sand, ISF slag – imperial smelting furnace slag.
Figure 13. Flexural strength ratio, different industrial waste concretes/control concrete.
M.K. Dash et al. / International Journal of Sustainable Built Environment 5 (2016) 484–516 505

506 M.K. Dash et al. / International Journal of Sustainable Built Environment 5 (2016) 484–516
that the modulus of elasticity of class F fly ash concretes upto 50% substitution was higher than the control blend.
8.4.1. Relation between compressive strength and dynamicmodulus of elasticity
Dynamic modulus test is a simple nondestructive test.The dynamic modulus of elasticity of waste foundry con-crete can be predicted from compressive strength usingequations as recommended by IS 456 (2000), IS 13311(Part 1) (1992) and proposed by Prabhu et al. (2014) whichare
E ¼ 5000�ffiffiffiffiffiffif ck
pð5Þ
E ¼ qð1þ lÞð1� 2lÞ1� l
� v2 ð6Þ
where E is the dynamic Young’s Modulus of elasticity inMpa, fck is the compressive strength of concrete, q is thedensity of concrete in kg/m3, V is the pulse velocity inm/s and l is the dynamic poison’s ratio of the concrete.The difference between the dynamic elastic modulus valuescomputed using IS 456 (2000) and IS 13311(1) (1992) doesnot show any great difference and the values were relativelyclose (Prabhu et al., 2014).
8.5. Ultrasonic pulse velocity (UPV)
The ultrasonic pulse velocity test is a non-destructivetest to evaluate the consistency and relative nature of con-crete. UPV test involves the computation of electronicwave velocity through concrete. The quality of concrete isanalysed by utilising this test. Khatib et al. (2013) founda similar trend that decreases in USPV decreased with anincrease of, waste foundry sand content in concrete. USPVtest was performed by Singh and Siddique (2012a) andUSPV value at 28 days of curing was found 4.231 km/s,4.245 km/s, 4.253 km/s, 4.266 km/s, 4.255 km/s for con-crete in which sand is supplanted by 0%, 5%, 10%, 15%and 20% of WFS, from this it can be concluded that asthe rate of substitution increases the value of USPVincreased. Siddique et al. (2015) have also got similarresults that increase in WFS in concrete the USPV valueswere increased. Velumani and Nirmalkumar (2014) havereported that USPV values for concrete mixes wereincreased in which fine aggregate were replaced by copperslag. They found maximum UPSV value 5.208 km/s forboth the concrete mix containing 40% and 100% copperslag in comparison with control mix UPSV value4.615 km/s.
8.5.1. Relation between compressive strength and ultrasonic
pulse velocity
Khatib et al. (2013) describe the relationship betweenUPV and strength for all curing days for all concrete mixesY = 0.019e1.6009x, with R2 = 0.9699 indicating strong rela-tion, where X is the UPV and Y is the compressive strength.
This equation is by all accounts free of WFS content or thecuring time.
8.5.2. Prediction of modulus of elasticity using ultrasonic
pulse velocity
Dynamic modulus of elasticity (Ed) can be measuredutilising ultrasonic pulse velocity. The equation utilisedfor this intention was given in Eq. (7) that needs Poisson’sratio. UPSV technique was used by Yuksel et al. (2011) formeasuring dynamic modulus of elasticity
Ed ¼ V 2q=K ð7Þwhere Ed = dynamic modulus of elasticity in KN/mm2,V= compression wave velocity in km/s, K = (1� m)/[(1 + m)(1–2m)], q = density in kg/m3, m = dynamic Poisson’s ratiowhich was assumed as 0.2 for the test.
9. Durability of industrial waste concrete
9.1. Water absorption and permeability
High water absorption ratio of concrete mixes has lowerstrengths (Basar and Aksoy, 2012). The capillary waterabsorption as demonstrated by rate of water consumedper unit area and it increases when rate of substitution ofWFS increased. An increase in water absorption capacitycauses diminishing in compressive strength. A linear func-tion appears to describe the relation between strength andwater absorption coefficient by Khatib et al. (2013), that is:Y = �13.349X + 59.949, with an R2 = 0.9234 showing adecent relationship, where X is the water absorption coeffi-cient and Y is the compressive strength. Basar and Aksoy(2012) found water absorption for concrete mixture con-taining WFS was found 5.4%, 5.8%, 6.4%, and 6.6% onconcrete containing 10%, 20%, 30% and 40% of WFS atthe age of 28 days in comparison of control mix waterabsorption 5%. It is apparent that the traditional concretewithout WFS shows slightest water absorption ratio andthere is increment in water absorption ratio when the rateof substitution of WFS increases (Basar and Aksoy,2012). For the durability of hardened concrete, porosityand water absorption are vital pointers. Diminishment ofwater retention & porosity can extraordinarily upgradethe long haul performance. Decrease in porosity addition-ally enhances the compressive & flexural strengths of con-crete (Salokhe and Desai, 2009). Salokhe and Desai(2009) have reported that no obvious impact of foundrywaste sand on water absorption of mixes was seen exceptconcrete mix with 20% ferrous foundry sand shows waterabsorb 1.13% in comparison to the control mix waterabsorption 1.91%. Al-Jabri et al. (2009) concluded thatup to 40% substitution of sand by copper slag there is ageneral diminishing in the surface water absorption, afterthat the water absorption quickly increases. They recom-mend that the substitution of 40% of copper slag in theconcrete blend will have reduced surface water absorption.Velumani and Nirmalkumar (2014) found a similar trend

M.K. Dash et al. / International Journal of Sustainable Built Environment 5 (2016) 484–516 507
that the rate of substation of copper slag increases up to40%, the surface water absorption decreases. Yuksel andGenc (2007) observed that when the fine aggregate isreplaced by either granulated blast furnace slag, furnacebottom ash or both, water absorption ratios of concreteswas increased. For 20% GBF slag and/or furnace bottomash substitutions the water absorption ratios are 5.0%,4.66%, 4.73% with respect to the control specimen value4.73%. Kaur et al. (2012) reported that 20% WFS concretewith the addition of fungal (Aspergillus spp.) treated showsdecrease 68.8% in water absorption and 45.9% in porosity.
9.2. Initial surface absorption
To evaluate the durability of high performance concretethe initial surface absorption test was conducted by Al-Al-Jabri et al. (2009) and found surface absorption diminish-ing was for the most part sharp during the initial 30 min,diminished subsequently up to 120 min. The highestabsorption rate was observed in concrete mix with 100%copper slag Concrete mixes with 40% copper slag and20% copper slag demonstrated the lowest absorption ratefor the whole time term. Khatib et al. (2013) reported thatrate of initial water absorption is generally higher when thewaste foundry sand content in the mixture increases. Fol-lowing 1 day of curing, the water absorption coefficient isdetectably higher than that at the other curing periods.The WAC decreases for all blends beyond 7 days of curing(see Fig. 14).
9.3. Rapid chloride permeability test
A durable concrete is the particular case that performsattractively under expected presentation condition amidits service life period. One of the fundamental attributesaffecting the strength of concrete is its porousness to theingress of chloride. The chloride particle introduce in theconcrete can cause detrimental effects on concrete addition-ally on the reinforcement. Due to chloride particle penetra-tion, swelling of concrete is occurred (Singh and Siddique,2012a). Singh and Siddique (2012a) found on the rapidchloride permeability test for 0%, 5%, 10%, 15% and 20%substitution by WFS at 28 days of curing, charges passedwere 1368, 1250, 1150, 1060 and 1190 coulombs. Concretemix in which WFS content increased up to 15% coulomb
y = 0.019e1.6x
R² = 0.9699
0
10
20
30
40
50
3 3.5 4 4.5 5
Com
pres
sive
Str
engt
h ( M
Pa)
UPV (km/Sec)
1 day7 Day28 Day90 Day
Figure 14. Relationship between compressive strength and UPV (Khatibet al., 2013).
value increased, which demonstrate that concrete turnedout to be denser. At 20% WFS concrete, there is marginalincrement in coulomb value in comparison to 15% WFSconcrete but yet it is not as much as control concretemix. The results obtained for all concrete mixtures arelow permeability ranges as per ASTM C 1202 (between1000 and 2000). With the increment of WFS percentagein concrete mixtures, RCPT values are diminished.Siddique et al. (2015) have compared rapid chloride perme-ability in M20 and M30 grades of concrete with sand sub-stituted by spent foundry sand. In both the grades ofconcrete coulombs charge diminish with increase in foun-dry sand content as well as with age, The RCPT valuesin coulombs found by Aggarwal and Siddique (2014) were578, 628, 616, 600, 664, 652, and 741 in concrete mix wherefine aggregates are replaced 0%, 10%, 20%, 30%, 40%, 50%and 60% by waste foundry sand, respectively at 90 days.From this it can be concluded that chloride-ion permeabil-ity of concrete mixtures increased with the increment inwaste foundry sand but still have low permeability as perASTM C 1202–97 (ASTM C1202, 0000). Devi andGnanavel (2014) reported that charge passed in coulombsmore in 40% fine aggregate replacement by steel slag con-crete than conventional concrete, but still comes underlow. According to Yuksel et al. (2006) charge passingthrough the concrete samples in RCPT were 2016.27,1319.94 and 1347.03 in concrete mix where 0%, 25% and50% fine aggregate were replaced by granulated blast fur-nace slag. Bilir (2012) have concluded that inclusion ofnon-ground GBF Slag, bottom ash or both as fine aggre-gate in concrete builds the resistance against chloride pen-etration. Concrete up to 40% replacement with GBF slagand bottom ash single or both as fine aggregate demon-strate lower charge passing, even if at 50% substitution pro-portions the charges passing are more than control mix butwithin the same low chloride particle permeability groupcorresponding to ASTM C 1202–97 (ASTM C1202,0000). Singh and Siddique (2014) found in bottom ash con-crete mixtures, resistance to chloride ion penetrationincreased with increase in coal bottom ash content in con-crete. The charge passed through all bottom ash concreteblends was lower than that passed through reference spec-imen at all the ages of curing. It is obvious from test out-comes that after 28 days of curing age, resistance tochloride ion penetration increased significantly due to poz-zolanic action of coal bottom ash. Shi-Cong and Chi-Sun(2009) compared the chloride ion penetration resistanceon concrete mix with constant water cement proportionand steady slump. With increasing percentages of furnacebottom ash in concrete mix with fixed water cement ratio,the resistance to chloride-particle ingress of the concretemixes were less, where resistance to chloride-ion infiltrationof all furnace bottom ash concrete mixes at same slumprange was superior to anything that of the reference mixand the impact was most noteworthy for the FBA blendspresumably because of the pozzolanic impact between thesmall FBA particles and the hydrated cement paste. The

Chloride ion penetrability as perASTM C1202-1997>4000 High2000–4000 Moderate1000–2000 Low100–1000 Very low<100 Negligible
Figure 15. Effect of Industrial waste on chloride ion permeability.
508 M.K. Dash et al. / International Journal of Sustainable Built Environment 5 (2016) 484–516
resistances to chloride ion penetration in palm oil clinkerconcrete mixes are less due to the porous nature of palmoil clinker aggregate (Mohammed et al., 2011).
Fig. 15 shows the comparison of effect of industrialwaste on chloride ion permeability of different industrialwaste concretes, which shows maximum decline in RCPTvalue at 30% in Bottom ash concrete, GBFS concreteand 15% in WFS concrete.
9.4. Abrasion resistance
Singh and Siddique (2012b) reported that the presenceof increasing amounts of waste foundry sand in concretemix the depth of wear diminished and improved the abra-sion resistance. Tripathi et al. (2013) compared the abra-sion resistance of concrete mix with 0.55, 0.50, 0.45 and0.40 water cement ratio. They found water cement ratio0.55 and 0.50 in concrete mixes, the depth of wearincreased with an increment in the supplanting of sand withISF slag. The mixes for water cement ratio 0.45, the depthof wear diminished marginally for sand substitutions up to40% by ISF slag and increment noticed after that. Thedepth of wear in the water cement ratio 0.40 mixtures werealike to control mix up to 40% sand substitutions andbeyond that slightly increased. They concluded that theporosity of ISF Slag concrete may increase because of itsirregular particle shape which impacts the depth of wear.Yuksel et al. (2007) compared surface abrasion on concretemix with inclusion of GBF slag, BA or both as river sand inconcrete and concluded that loss of mass is diminishingmarginally for low substitution proportions and itincreases again for high substitution ratios. The Surfaceabrasion loss expressed in mass in cm3/50 cm2 and the
1.0
1.5
2.0
2.5
3.0
0 10 20 30 40 50
Dep
th o
f Wea
r in
mm
Industrial Waste Replacement (%
Figure 16. Effect of Industrial waste o
values were within the upper limit 15 cm3/50 cm2 as speci-fied by ASTM C 936 (1982).
Fig. 16 shows the comparison of effect of industrialwaste on depth of wear in abrasion test of different indus-trial waste concretes which shows depth of wear minimumat 30% replaced ISFS concrete and at 15% replaced wastefoundry sand concrete.
9.5. Acid resistance
Concrete being alkaline in nature is susceptible to attackby sulphuric acid formed from either bacterium processesin sewage system or sulphur dioxide available in the atmo-sphere (Singh and Siddique, 2014). Devi and Gnanavel(2014) have carried out their acid resistance experimentof concrete cube in both sulphuric acid and hydrochloricacid. From their outcome, the weight reduction is less for40% substitution of normal sand by steel slag when com-pared to the control concrete. By adding steel slag in fineaggregate has preferable acid resistance than reference con-crete. At the point when contrasted the weight reduction ismore when dipped in sulphuric acid than hydrochloricacid, this is on account of the lack of hydration rate whichis high in Sulphuric acid. Amount of CSH gel constitutedby the hydration activity, when dipped in sulphuric acidwill be lower than when dipped in hydrochloric acid. Theyfound external surface of the cubes submerged in sulphuricacid had deteriorated more than the cubes submerged inhydrochloric acid.
9.5.1. Loss in mass
Singh and Siddique (2014) reported that bottom ashconcrete mix performed slightly better than control
60 70 80 )
0.42 W/C-WFS, Singh and Siddique (2012)
0.40 W/C-ISFS (Tripathi et al.,2013)
0.45 W/C-ISFS (Tripathi et al.,2013)
n depth of wear in abrasion test.

M.K. Dash et al. / International Journal of Sustainable Built Environment 5 (2016) 484–516 509
concrete, when immersed in 3% sulphuric acid solution andpercentage loss of weight of CBA concrete specimensdecreased with increment in CBA incorporation in con-crete. After 28 days of immersion period the weight lossof 20%, 30%, 40%, 50%, 75% and 100% bottom ash con-crete mixtures was 9.53%, 10.05%, 8.97%, 8.94%, 8.75%and 7.89%, respectively as compared to 10.87% weightloss of the control concrete. From this it is evident thatloss of mass in bottom ash concrete is less than referencemix.
9.5.2. Change in compressive strength
The loss in 28-day compressive strength of 0%, 20%,30%, 40%, 50%, 75% and 100% bottom ash concrete mix-tures was 49.23%, 48.76%, 50%, 49.10%, 40.32%, 35.52%and 37.11%, respectively. The percentage loss of 28 dayscompressive strength diminished with increase in coal bot-tom ash content in concrete, perhaps the lower permeabil-ity of bottom ash concrete mixtures contributed towardsenhancing the resistance to external sulphuric acid attack(Singh and Siddique, 2014).
9.5.3. Relation between percentage loss in weight and
reduction compressive strength
Singh and Siddique (2014) expressed that the loss incompressive strength increment approximately linearlywith the increase in mass loss of concrete specimens andderived an equation of relationship between mass lossand compressive strength loss of concrete due to externalsulphuric acid attack is given as under
Dr ¼ 4:2383Dmþ 7:2194 R2 ¼ 0:9467 ð8Þwhere, Dr = percentage loss in compressive strength,Dm = percentage loss in mass.
9.6. Sulphate resistance
Permeability of concrete plays an important role in pro-tecting against external sulphate attack. Sulphate attackcan take the form of expansion, loss in compressivestrength and loss in mass of concrete. The sulphate relatedexpansion of concrete is associated with the formation ofettringite and gypsum (Singh and Siddique, 2014). Sincemagnesium sulphate attack is more severe on concrete,Singh and Siddique (20140 immersed the concrete specimenin a 10% solution of magnesium sulphate and found at28 days of immersion period, the expansion values (%) of20%, 30%, 40%, 50%, 75% and 100% bottom ash concretemixtures were 53.33 � 10�6, 60 � 10�6, 66.67 � 10�6,60 � 10�6, 53.33 � 10�6 and 53.33 � 10�6 respectively ascompared to 50 � 10�6 of control concrete.
9.6.1. Loss in mass
Singh and Siddique (2014) reported that bottom ashconcrete specimen, even after 210 days of immersion in10% magnesium sulphate solution, no loss in mass of allthe concrete specimens was observed.
9.6.2. Change in compressive strength
There was no reduction in compressive strength tookplace after immersion in 10% magnesium sulphate solutionrather it continued to increase during the test period. After28 days of immersion period, percentage increase in com-pressive strength of the bottom ash concrete mixture waslower than that of reference concrete. However, after 90 daysof immersion period, increase in compressive strength of30%, 75%, and 100% bottom ash concrete mixes was higherthan that of reference concrete; this indicates that the cementcontinued to hydrate in magnesium sulphate solution overthe test period. The increase in strength of BA concretemay be attributed to continuous hydration and the fillingof pores with CSH gel formed because of pozzolanic actionof bottom ash (Singh and Siddique, 2014).
9.7. Drying shrinkage
Hardened concrete in unsaturated air experiences dryingshrinkage. It is the movement of water, which causes expan-sion, or shrinkage of hardened concrete (Yuksel et al., 2006).According to Singh and Siddique (2014) shrinkage strainswas diminished with the increase in CBA content in concrete.At 90 days of drying period, the shrinkage strains of 20%,30%, 40%, 50%, 75% and 100% bottom ash concrete mix-tures were 520� 10�6, 413.33 � 10�6, 406.67� 10�6,366.67 � 10�6, 320 � 10�6 and 300� 10�6, respectivelywhere during the same period, shrinkage strain of controlconcrete was 493.33� 10�6. The reduced shrinkage strainexhibited by bottom ash concrete mixes was probably dueto lower free water cement ratio. During the mixing proce-dure the porous particles of dry coal bottom ash retainedpart of water internally. It is also believed that, the porouscoal bottom ash particles released the water during dryingof specimens. This resulted in lesser shrinkage strains on dry-ing of bottom ash concrete mixtures (Singh and Siddique,2014). Shi-Cong and Chi-Sun (2009) have reported that thesimilar conclusion that drying shrinkage diminished withthe increment of the furnace bottom ash content. Bai et al.(2005) studied drying shrinkage on concrete mix in samewater cement proportion and constant slump and concludedthat at 0.45 and 0.55 fixed water cement ratio, values of thedrying shrinkage of furnace bottom ash concretes were lowerthan the reference mix at all curing ages but at the constantdecided slump ranges the drying shrinkage of the furnacebottom ash concretes was higher than reference mix.Valcuende et al. (2015) found that higher the drying shrink-age in the concrete mix with higher the blast furnace slagcontent in concrete mix. Since the concretes made with slagare more porous, water is lost faster, as can be seen evapo-rates the internal pressure in the capillary network increasesand promotes drying shrinkage.
9.8. High-temperature effect
Yuksel et al. (2006) concluded that under the high tem-perature effect, there has not been a decrease in the strength

510 M.K. Dash et al. / International Journal of Sustainable Built Environment 5 (2016) 484–516
of the concrete in which both type 0–3 mm and 0–7 mmsand were used with respect to control concrete providedthat GGBFS/sand ratio is less than 75%. Yuksel et al.(2007) reported that the residual strength of concretein which sand was substituted by blast furnace slag andbottom ash up to 40% is higher than control specimen.This implies that substitution of GBFS and/or BAdoes constructive outcomes on resistance to hightemperature.
9.9. Freeze–thaw resistance
Yuksel et al. (2007) used 90-day’s values of compressivestrength as referral values to compare the strength of con-crete replaced with blast furnace slag, bottom ash and bothas river sand in different ratio series specimens after thefreeze–thaw cycles. Concrete mixes up to 20% substitution,there is increment in resistance to freeze–thaw anddecreases again for the replacement level above 20%. Bilir(2012) stated that the loss of strength after the freeze–thawcycles in concrete replaced with 20% and 30% granulatedblast furnace slag was 2.21% and 2.28% with respect toconcrete mix loss 6.49% at 90 days of curing. Concretereplaced with 20% and 30% bottom ash the loss of strengthafter the freeze–thaw cycles was 4.92% and 5.53% withrespect to concrete mix loss 6.49%. Therefore concretemade by utilising GBF slag and BA as sand substitutioncan be stated as durable to freezing–thawing and 20–30%substitution proportions can be acknowledged as an idealsubstitution proportion.
9.10. Drying–wetting effect
Yuksel et al. (2007) used 90-day’s compressive strengthvalues as referral values to compare the strength of con-crete replaced with that of granulated blast furnace slag,bottom ash and both as fine aggregate in different ratio ser-ies specimens after the drying–wetting cycles. As indicatedby them, strength of concrete diminishes with rate of incre-ment of substitution of GBF slag, bottom ash and bothafter drying-wetting impact.
9.11. Carbonation
Siddique et al. (2011) have carried out carbonation testand reported that with increase in rate of substitution offoundry sand in concrete shows increase in carbonationdepth. For each increment in 10% foundry sand, i.e. mixfrom 10% to 60%, there is at a normal 0.17 mm incrementin carbonation depth in concrete mixes at 90 days. Also, at365 days at a normal 0.33 mm increment in carbonationdepth was seen in concrete mixes. The most extreme car-bonation depth watched around 2.17 mm at 90 days and5 mm at 365 days for concrete mixes which is far less thanthe cover of reinforcing steel bars to cause corrosion inwhich sand was substituted by 60% foundry sand.
10. Structural behaviour of industrial waste-concrete
10.1. Deflection test
Devi and Gnanavel (20140 reported that as the loadrises, the deflection increases moderately in RCC beamswhen part of the sand supplanted by steel slag. Load deflec-tion diagrams are for 40% replacement compared with con-ventional concrete. RCC beams with steel slag indicateparticularly the same deflection as reference concrete.
10.2. Pull-off strength
Tripathi et al. (2013) did an experiment by taking steelslag as a part substitution of natural sand and examinedthe pull-off strength with different water cement ratios.They found an increment in strength for water cement ratio0.50 mixtures up to 60% ISFS inclusion and for watercement proportion 0.45, sand substitution in between 40and 60%. The pull-off strength of concrete mixes with watercement ratio 0.40 was alike to the reference concrete. Thepull-off strength of concrete mixes with water cement pro-portion 0.55 with an increment of the sand substitutionlevel. It is evident that ISF slag does not unfavorably influ-ence the tensile strength of cover-zone concrete.
11. Micro-structural analysis
Micro-structural analyses were conducted using X-rayDiffraction Spectrometer (XRD) and Scanning ElectronMicroscope (SEM) by many researchers.
11.1. X-ray Diffraction Spectrometer (XRD)
XRD technique is conducted to analyse the componentsof concrete mixes (Aggarwal and Siddique, 2014). The X-ray diffraction standard and examination of the concretei.e. reference mix, and 20% WFS concrete mixes ware car-ried out by Basar and Aksoy (2012) and when the qualita-tive, quantitative and morphological analysis results ofreference concrete and 20% waste foundry sand containingconcrete are investigated, no significant differences betweenthem are observed (Fig. 17).
Aggarwal and Siddique (2014) have reported that X-raydiffraction design investigation of the concrete i.e. referencemix, and concrete mixes with waste foundry sand and bot-tom ash was done at the age of 365 days and in the quali-tative and quantitative investigation of cement, there wasstrong overlapping of major diffraction peaks of all themain phases of cement constituent in the angular rangeof 2h values from 30� to 35� making the distinguishing ofthe individual parts exceptionally difficult. In all the mixes,C2S, C3S, and C4AF crests are not noticeable showing thatthey may be completely consumed or overlapping of thepeaks of un-hydrated cement. SiO2 peak demonstratingfree silica in control concrete was seen at 1800 (Fig. 18).The X-ray diffraction pattern observed in concrete mix
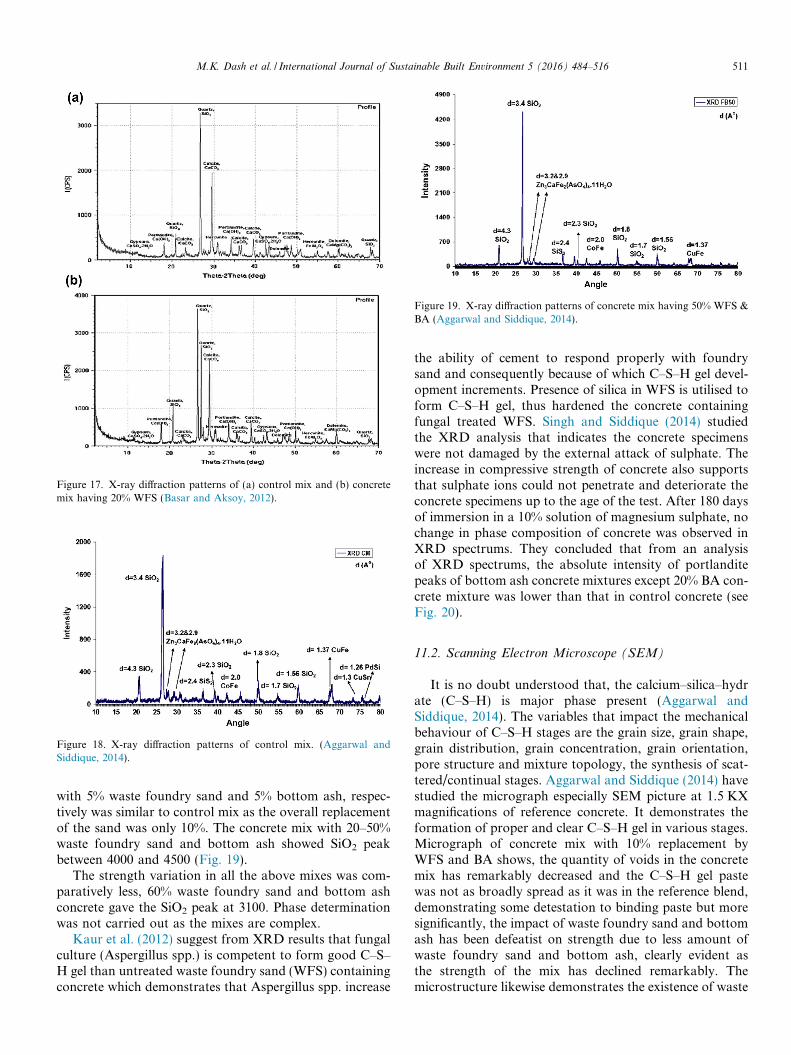
Figure 18. X-ray diffraction patterns of control mix. (Aggarwal andSiddique, 2014).
Figure 19. X-ray diffraction patterns of concrete mix having 50% WFS &BA (Aggarwal and Siddique, 2014).
Figure 17. X-ray diffraction patterns of (a) control mix and (b) concretemix having 20% WFS (Basar and Aksoy, 2012).
M.K. Dash et al. / International Journal of Sustainable Built Environment 5 (2016) 484–516 511
with 5% waste foundry sand and 5% bottom ash, respec-tively was similar to control mix as the overall replacementof the sand was only 10%. The concrete mix with 20–50%waste foundry sand and bottom ash showed SiO2 peakbetween 4000 and 4500 (Fig. 19).
The strength variation in all the above mixes was com-paratively less, 60% waste foundry sand and bottom ashconcrete gave the SiO2 peak at 3100. Phase determinationwas not carried out as the mixes are complex.
Kaur et al. (2012) suggest from XRD results that fungalculture (Aspergillus spp.) is competent to form good C–S–H gel than untreated waste foundry sand (WFS) containingconcrete which demonstrates that Aspergillus spp. increase
the ability of cement to respond properly with foundrysand and consequently because of which C–S–H gel devel-opment increments. Presence of silica in WFS is utilised toform C–S–H gel, thus hardened the concrete containingfungal treated WFS. Singh and Siddique (2014) studiedthe XRD analysis that indicates the concrete specimenswere not damaged by the external attack of sulphate. Theincrease in compressive strength of concrete also supportsthat sulphate ions could not penetrate and deteriorate theconcrete specimens up to the age of the test. After 180 daysof immersion in a 10% solution of magnesium sulphate, nochange in phase composition of concrete was observed inXRD spectrums. They concluded that from an analysisof XRD spectrums, the absolute intensity of portlanditepeaks of bottom ash concrete mixtures except 20% BA con-crete mixture was lower than that in control concrete (seeFig. 20).
11.2. Scanning Electron Microscope (SEM)
It is no doubt understood that, the calcium–silica–hydrate (C–S–H) is major phase present (Aggarwal andSiddique, 2014). The variables that impact the mechanicalbehaviour of C–S–H stages are the grain size, grain shape,grain distribution, grain concentration, grain orientation,pore structure and mixture topology, the synthesis of scat-tered/continual stages. Aggarwal and Siddique (2014) havestudied the micrograph especially SEM picture at 1.5 KXmagnifications of reference concrete. It demonstrates theformation of proper and clear C–S–H gel in various stages.Micrograph of concrete mix with 10% replacement byWFS and BA shows, the quantity of voids in the concretemix has remarkably decreased and the C–S–H gel pastewas not as broadly spread as it was in the reference blend,demonstrating some detestation to binding paste but moresignificantly, the impact of waste foundry sand and bottomash has been defeatist on strength due to less amount ofwaste foundry sand and bottom ash, clearly evident asthe strength of the mix has declined remarkably. Themicrostructure likewise demonstrates the existence of waste

Figure 20. (A) Micrograph of reference concrete specimen (B) Micrograph concrete mix having 10% WFS & BA (Aggarwal and Siddique, 2014).
Figure 21. (A) SEMmicrograph of reference concrete specimen, (B) SEMmicrograph concrete with 30% GBF slag, (C) SEMmicrograph of concrete with30% Bottom Ash (Yuksel et al., 2007).
512 M.K. Dash et al. / International Journal of Sustainable Built Environment 5 (2016) 484–516
foundry sand and bottom ash particles of different sizes atdifferent spots. The reduction in strength ascribed to thenon-arrangement of legitimate C–S–H gel when contrastedwith microstructure of control mix. The micrographs ofconcrete mix in which fine aggregates replaced by wastefoundry sand and bottom ash equally in 20%, 30%, 40%,50% show similarity in the pattern formation of C–S–Hgel in these mixes with all of them nearly having samestrength. The micrograph of concrete mix with 60%replacement shows that the mix has crumbled with leavingwaste foundry sand and bottom ash particles from mix.The C–S–H gel couldn’t be seen at many places in themicrograph (Aggarwal and Siddique, 2014).
The Scanning electron magnifying instrument (SEM)pictures were seen by Yuksel et al. (2007) for the specimensat 90-days and found the control concrete demonstrates athick structure and no sign of permeable structure. Con-cretes mixes with low-rate substitution by granulated blastfurnace slag are alike to control concrete with consider tomicrostructure, but when the substitution proportion ismore than 30% it demonstrates porous structure(Fig. 21B). In the case of concrete mix, where bottom ashused as fine aggregate structure is turning out to be a largernumber of permeable than the reference concrete(Fig. 21C). As the rate of bottom ash substitution grows,the structure is turning out to be more permeable havingconsiderably more pores dispersed around the surface ofthe aggregate. In this way, the development of discreteparticle and permeable territory near to the total surfacesmay be the major reason in diminishing the values of
compressive strength with an increment in the rate of bot-tom ash in sand substitution (Yuksel et al., 2007).
The similar results are obtained by Bilir (2012) in respectof SEM image of blast furnace slag concrete and reportedwhen rate of substitution more than 30% exhibit porousstructure and in case of FBA concrete, structure were morepermeable than the reference concrete. Singh and Siddique(2014) were studied Scanning Electron Micrographs offractured pieces of control concrete and 50%, 75%, 100%coal bottom ash concrete generated from compression testof specimens after 180 days immersed in the 10% magne-sium sulphate solution. It is apparent from the SEMimages that sulphate ion diffusion did not take place evento a depth near to the surface. No signs of gypsum andmono sulphate morphologies, which can indicate theattack by sulphate were observed in either of the concretemixtures. At higher resolutions, show dense and evenlyspread calcium silicate hydrate gel and very small ettringiteneedles in few voids were observed in the concrete mix-tures. Yuksel and Genc (2007) reported by performingSEM analysis that concrete specimens produced by utilis-ing GBFS and FBA substitutions have very distinctivemicrostructures. The reference concrete sample shows athick structure made out uneven grains and the hydrateditems connect firmly to the surface of the aggregate. Con-crete, in which common sand was supplanted by 10%GBFS shows extremely close-packed, had thick structureand few pores could be seen in the closer zones of theaggregate surface. On account of supplanting FBA as fineaggregates rather than regular sand, it can be noticed that

Figure 22. SEM micrograph of the (a) control concrete, (b) Concrete with 20% copper slag, (c) Concrete with 40% copper slag, (d) Concrete with 60%copper slag, (e) Concrete with 80% copper slag, (f) Concrete with 100% copper slag (Wu et al., 2010).
M.K. Dash et al. / International Journal of Sustainable Built Environment 5 (2016) 484–516 513
microstructure reshapes its network structure. Rather thanasymmetrical grains, the grains were getting to be roundand the pores were getting to be smaller and dispersed.Strength of FBA concrete is lower since FBA is more per-meable and feeble in contrast with GBFS and commonsand. In the pore water, the existence of Ca ions wouldquicken responses occurring at the interface of the C–S–H gel and the surface of the aggregate that is GBFS andcan be formed a tough association between surface ofaggregate and cement hydration items in correlation toFBA substitution. The reactivity of blast furnace slag relieson fragment diameter. As per these studies, early strengthscan be achieved with a particle diameter of blast furnaceslag under 3 lm, particle within 3 lm to 20 lm diameteris beneficial for long haul strengths and GBFS with otherfragment sizes just has a micro-aggregate effect (Yukseland Genc, 2007). Wu et al. (2010) have reported that fromthe SEM perceptions completed on sand surface, particlesof copper slag, broke control concrete and copper slag con-crete, restricted distinction can be seen amongst cementpaste and sand matrix between the reference mix and theconcrete with 20% copper slag substitution since limitedpresence of copper slag in composites. On the other hand,significant difference is seen in the microstructure concretewith surpassing 40% substitution of copper slag, enormousvoids, larger density of micro cracks, wider spacing of cap-illary channels and capillary channels associated together.More than 40% copper slag substitution in CS reinforcedconcrete, reduction in dynamic compressive strength dueto these extra fault (Fig. 22c).
12. Conclusion
Utilisation of different industrial wastes as a fine aggre-gate replacement was reviewed in this paper. All the con-crete properties like physical, fresh, hardened werediscussed and compared between them. Micro-structuralanalysis of industrial-waste based concrete was also dis-cussed and compared with normal concrete. It is certainthat there are a number of industrial wastes that can beconfidently used as fine aggregate replacement like wastefoundry sand, steel slag, copper slag, ISF slag, blast fur-nace slag, coal bottom ash, ferrochrome slag and class Ffly ash in concrete. Based on the review, number of conclu-sions can be drawn and these are listed below.
(1) Physical properties such as bulk density, specificgravity and grain size distribution of all industrial-wastes were almost equal to the properties of naturalsand except the particle size distribution of foundrysand; steel slag does neither meet ASTM C33 norIS-383–1970 grading limits.
(2) In the case of concrete where fine aggregate isreplaced by waste foundry sand, steel slag and palmoil clinker, slump value reduces by increasing the per-centage of replacement and concrete mix in whichfine aggregate substituted by copper slag and bottomash, slump value increases by increasing the replace-ment ratio. Concrete with granulated blast furnaceslag shows slump value increasing up to replacementlevel 20%, beyond that slump value decreases.

514 M.K. Dash et al. / International Journal of Sustainable Built Environment 5 (2016) 484–516
(3) Inclusion of steel slag, copper slag and ISF slag inconcrete, density of concrete increases but in additionof waste foundry sand and bottom ash in concrete thedensity decreases.
(4) Waste foundry sand can be utilised as a substitutionof 20% of sand without compromising the mechanicaland physical properties. Abrasion resistance of con-crete mixtures increased with the increase in WFScontent as replacement for fine aggregate. Inclusionof WFS increases the USPV values and decreasedthe chloride ion penetration in concrete. This reviewalso shows that 15.6% increases in compressivestrength of concrete after 28 days is achieved withthe addition of fungal (Aspergillus spp.) treated20% WFS containing concrete.
(5) The utilisation of steel slag up to 30% as sand substi-tution in concrete mixes has a constructive outcomeon both compressive and tensile strengths; shows bet-ter acid resistance than control concrete. RCC beamswith steel slag shows almost the same deflection asconventional concrete, hence introducing it in con-crete will eliminate one of the environmental prob-lems created by the steel industry.
(6) From this review it might be reasoned that the utilisa-tion of copper slag up to 40% as sand substitutionimproves strength and durability characteristics atsame workability and there is a decrease in the sur-face water absorption as copper slag quantityincreased up to 40% replacement. Copper slag, anindustrial waste material, makes it possible to pro-duce ultra-high performance concrete.
(7) The review uncovers that incorporation of ISF slagenhances the mechanical properties of concrete atlower water cement ratio and abrasion resistanceconcrete containing ISFS is similar to conventionalconcrete for sand substitutions up to 50%. Leachingof lead and cadmium from concrete mixes withinclusion of 70% ISF slag is within satisfactorylimits.
(8) When granulated blast furnace slag is u utilised as thesand substitution material, they positively diminishthe tensile and compressive strength of concrete.SEM investigations and water absorption testsdemonstrated that the supplanted concrete was moreporous than the control concrete and it could be theprincipal cause for the reduction in strength with anincrement in the substitution rates of GBFS.
(9) Bottom Ash as fine aggregate somewhere around30% and 50% substitution proportions prompts ade-quate durability properties. No signs of externalattack of sulphate were observed during examinationof SEM images and XRD spectrum of specimensimmersed in 10% magnesium sulphate solution upto 180 days. Bottom ash concrete mixtures showedbetter resistance to chloride ion penetration andexternal sulphuric acid attack. It can be concludedthat replacement level for bottom ash, however, is
up to 30% without a noteworthy diminishment instrength of concrete and mix of GBFS and FBAcan be utilised as 10% substitution of sand.
(10) Without creating remarkable ecological contamina-tion issue, ferrochrome slag a complicated solid wastehaving dumping problem can be pertinently used assand substitution material with chromium immobi-lization in concrete matrix.
(11) Concrete specimens at all the ages with sand sup-planted fly ash up to 50%, compressive strength, split-ting tensile strength, flexural strength, and modulusof elasticity were higher than the reference concrete.
(12) Palm oil clinker contributed higher compressivestrength and flexural strength compared to controlconcrete due to inclusion of fine POC as partialreplacement of sand starts pozzolanic reaction ofthe concrete matrix and improved interfacial bondbetween paste and aggregates.
Finally this overall review concluded that industrial by-products can be utilised as a part of concrete innovations atgreatest amount for a sustainable standard strength, dura-bility and eco-friendly concrete.
References
Abdullahi, M., Al-Mattarneh, H.M.A., Mohammed, B.S., 2010. Charac-terisation of palm oil clinker aggregate. Int. J. Appl. Eng. Res. 16,2877–2882.
Aggarwal, Y., Siddique, R., 2014. Microstructure and properties ofconcrete using bottom ash and waste foundry sand as partialreplacement of fine aggregates. Constr. Build. Mater. 54, 210–223.
Ahmmad, R., Jumaat, M.Z., Bahri, S., Islam, A.B.M.S., 2014. Ductilityperformance of lightweight concrete element containing massive palmshell clinker. Constr. Build. Mater. 63, 234–241.
Al-Jabri, K.S., Hisada, M., Al-Saidy, A.H., Al-Oraimi, S.K., 2009.Performance of high strength concrete made with copper slag as a fineaggregate. Constr. Build. Mater. 23, 2132–2140.
Al-Jabri, K.S., Hisada, M., Al-Oraimi, S.K., Al-Saidy, A.H., 2009.Copper slag as sand replacement for high performance concrete. Cem.Concr. Compos. 31, 483–488.
Al-Jabri, K.S., Al-Saidy, A.H., Taha, R., 2011. Effect of copper slag as afine aggregate on the properties of cement mortars and concrete.Constr. Build. Mater. 25, 933–938.
Alnuaimi, A.S., 2012. Effects of copper slag as a replacement for fineaggregate on the behavior and ultimate strength of reinforced concreteslender columns. TJER 9 (2), 90–102.
Ambily, P.S., Umarani, C., Ravisankar, K., Prem, P.R., Bharatkumar, B.H., Iyer, N.R., 2015. Studies on ultra high performance concreteincorporating copper slag as fine aggregate. Constr. Build. Mater. 77,233–240.
Andrade, L.B., Rocha, J.C., Cheriaf, M., 2009. Review influence of coalbottom ash as fine aggregate on fresh properties of concrete. Constr.Build. Mater. 23, 609–614.
ASTM C 936, 1982. Standard Specification for Solid Concrete Interlock-ing Paving Units. ASTM International, West Conshohocken.
ASTM C 33, 1999. Standard Specification for Concrete Aggregates.ASTM International, West Conshohocken.
ASTM 330, 2004. Standard Specification for Lightweight Aggregates forStructural Concrete. ASTM International, West Conshohocken.
ASTM C 311, 2013. Standard Test Methods for Sampling and Testing FlyAsh or Natural Pozzolans for Use in Portland-Cement Concrete.ASTM International, West Conshohocken.

M.K. Dash et al. / International Journal of Sustainable Built Environment 5 (2016) 484–516 515
ASTM C1202:97. Standard test method for electrical indication ofconcrete’s ability to resist chloride ion penetration. ASTM Interna-tional, West Conshohocken.
Atzeni, C., Massidda, L., Sanna, U., 1996. Use of granulated slag fromlead and zinc processing in concrete technology. Cem. Concr. Res. 26(9), 1381–1388.
Bahoria, B.V., Parbat, D.K., Naganaik, P.B., 2013. Replacement ofnatural sand in concrete by waste products: a state of art. J. Environ.Res. Dev. 7, 1651–1656.
Bai, Y., Darcy, F., Basheer, P.A.M., 2005. Strength and drying shrinkageproperties of concrete containing furnace bottom ash as fine aggregate.Constr. Build. Mater. 19, 691–697.
Basar, H.M., Aksoy, N.D., 2012. The effect of waste foundry sand (WFS)as partial replacement of sand on the mechanical, leaching and micro-structural characteristics of ready-mixed concrete. Constr. Build.Mater. 35, 508–515.
Bilir, T., 2012. Effects of non-ground slag and bottom ash as fine aggregateon concrete permeability properties. Constr. Build. Mater. 26, 730–734.
BS 882, 1992. Specification for Aggregates from Natural Sources forConcrete. British Standards Institution, UK.
Chang-long, W., Yan-ming, Q.I., Jin-yun, H., 2008. Experimental studyon steel slag and slag replacing sand in concrete. Int. WorkshopModell. Simul. Optim. 13, 451–455.
Chavan, R.R., Kulkarni, D.B., 2013. Performance of copper slag onstrength properties as partial replace of fine aggregate in concrete mixdesign. Int. J. Adv. Eng. Res. Stud. II (IV), 95–98.
Devi, V.S., Gnanavel, B.K., 2014. Properties of concrete manufacturedusing steel slag. Procedia Eng. 97, 95–104.
Etxeberria, M., Pacheco, C., Meneses, J.M., Berridi, I., 2010. Properties ofconcrete using metallurgical industrial by-products as aggregates.Constr. Build. Mater. 24, 1594–1600.
IS 13311(Part 1), 1992. Methods of Non-Destructive Testing of Concrete:Part 1 Ultrasonic Pulse Velocity. Bureau of Indian Standards, NewDelhi.
IS 383, 1970. Specifications for Coarse and Fine Aggregates from NaturalSources for Concrete. Bureau of Indian Standards, New Delhi.
IS 456, 2000. Plain and Reinforced Concrete Code of Practice. Bureau ofIndian Standards, New Delhi.
John, A., John, E., 2013. Study on the partial replacement of fineaggregate using induction furnace slag. Am. J. Eng. Res. 4, 01–05.
Kanadasan, J., Fauzi, A.F.A., Razak, H.A., Selliah, P., Subramaniam, V.,Yusoff, S., 2015. Feasibility studies of palm oil mill waste aggregatesfor the construction industry. Materials 8, 6518–6530.
Kaur, G., Siddique, R., Rajor, A., 2012. Properties of concrete containingfungal treated waste foundry sand. Constr. Build. Mater. 29, 82–87.
Khajuria, C., Siddique, R., 2014. Use of iron slag as partial replacement ofsand to concrete. Int. J. Sci. Eng. Technol. Res. 3 (6), 1877–1880.
Khatib, J.M., Herki, B.A., Kenai, S., 2013. Capillarity of concreteincorporating waste foundry sand. Constr. Build. Mater. 47, 867–871.
Kim, H.K., Lee, H.K., 2011. Use of power plant bottom ash as fine andcoarse aggregates in high-strength concrete. Constr. Build. Mater. 25,1115–1122.
Kim, H.K., Jang, J.G., Choi, Y.C., Lee, H.K., 2014. Improved chlorideresistance of high-strength concrete amended with coal bottom ash forinternal curing. Constr. Build. Mater. 71, 334–343.
Kothai, P.S., Malathy, R., 2014. Utilization of steel slag in concrete as apartial replacement material for fine aggregates. Int. J. Innovative Res.Sci. Eng. Technol. 3 (4), 1585–1592.
Materials for Concrete Construction, 1999. American Concrete Institute.ACI Education Bulletin E1–99:1–26.
Meenakshi, S.S., Ilangovan, R., 2011. Performance of copper slag andferrous slag as partial replacement of sand in concrete. Int. J. Civ.Struct. Eng. 1 (4), 918–927.
Mohammed, B.S., Hossain, K.M.A., Foo, W.L., Abdullahi, M., 2011.Rapid chloride permeability test on lightweight concrete made with oilpalm clinker. Int. J. Eng. Res. Appl. 1 (4), 1863–1870.
Mohammed, B.S., Foo, W.L., Hossain, K.M.A., Abdullahi, M., 2013.Shear strength of palm oil clinker concrete beams. Mater. Des. 46,270–276.
Morrison, C., Hooper, R., Lardner, K., 2003. The use of ferro-silicate slagfrom ISF zinc production as a sand replacement in concrete. Cem.Concr. Res. 33, 2085–2089.
Panda, C.R., Mishra, K.K., Panda, K.C., Nayak, B.D., Nayak, B.B.,2013. Environmental and technical assessment of ferrochrome slag asconcrete aggregate material. Constr. Build. Mater. 49, 262–271.
Pappu, A., Saxena, M., Asolekar, S.R., 2007. Solid wastes generation inIndia and their recycling potential in building materials. Build.Environ., 2311–2320
Patel, G.K., Pitroda, J.K., 2013. Assessment of natural sand and pond ashin Indian context. Int. J. Eng. Trends Technol. 4 (10), 4287–4292.
Poovizhi, T., Kathirvel, P., 2015. Behaviour of concrete with partialreplacement of copper slag as cement and fine aggregate. Trans. Eng.Sci. 3 (2), 30–35.
Prabhu, G.G., Hyun, J.H., Kim, Y.Y., 2014. Effects of foundry sand as afine aggregate in concrete production. Constr. Build. Mater. 70, 514–521.
Qasrawi, H., Shalabi, F., Asi, I., 2009. Use of low CaO unprocessed steelslag in concrete as fine aggregate. Constr. Build. Mater. 23, 1118–1125.
Rajamane, N.P., Peter, J.A., Ambily, P.S., 2007. Prediction of compres-sive strength of concrete with fly ash as sand replacement material.Cem. Concr. Compos. 29, 218–223.
Rajan, M.S., 2014. Study on strength properties of concrete by partiallyreplacement of sand by steel slag. Int. J. Eng. Technol. Sci. 1 (6), 96–99.
Rashad, A., 2016. Cementitious materials and agricultural wastes asnatural fine aggregate replacement in conventional mortar andconcrete. J. Build. Eng. 5, 119–141.
Rose, A.L., Suganya, P., 2015. Performance of copper slag on strengthand durability properties as partial replacement of fine aggregate inconcrete. Int. J. Emerging Technol. Adv. Eng. 5 (1), 434–437.
Salokhe, E.P., Desai, D.B., 2009. Application of foundry waste sand inmanufacture of concrete. IOSR J. Mech. Civ. Eng., 43–48
Sankh, A.C., Biradar, P.M., Naghathan, S.J., Ishwargol, M.B., 2014.Recent trends in replacement of natural sand with different alterna-tives. IOSR J. Mech. Civ. Eng., 59–66
Shi-Cong, K., Chi-Sun, P., 2009. Properties of concrete prepared withcrushed fine stone, furnace bottom ash and fine recycled aggregate asfine aggregates. Constr. Build. Mater. 23, 2877–2886.
Siddique, R., 2003. Effect of fine aggregate replacement with Class F flyash on the mechanical properties of concrete. Cem. Concr. Res. 33,539–547.
Siddique, R., 2014. Utilization of industrial by-products in concrete.Procedia Eng. Struct. Constr. Mater. 95, 335–347.
Siddique, R., Schutter, G.D., Noumowe, A., 2009. Effect of used-foundrysand on the mechanical properties of concrete. Constr. Build. Mater.23, 976–980.
Siddique, R., Aggarwal, Y., Aggarwal, P., Kadri, E.H., Bennacer, R.,2011. Strength, durability, and micro-structural properties of concretemade with used-foundry sand (UFS). Constr. Build. Mater. 25, 1916–1925.
Siddique, R., Singh, G., Belarbi, R., Mokhtar, K.A., Kunal, 2015.Comparative investigation on the influence of spent foundry sand aspartial replacement of fine aggregates on the properties of two gradesof concrete. Constr. Build. Mater. 83, 216–222.
Singh, G., 2012. Strength and durability studies of concrete containingwaste foundry sand Ph.D. Thesis. ThaUniversity, Patiala-147004,Punjab (India), pp. 1–153.
Singh, G., Siddique, R., 2012a. Effect of waste foundry sand (WFS) aspartial replacement of sand on the strength, ultrasonic pulse velocityand permeability of concrete. Constr. Build. Mater. 26, 416–422.
Singh, G., Siddique, R., 2012b. Abrasion resistance and strengthproperties of concrete containing waste foundry sand (WFS). Constr.Build. Mater. 28, 421–426.

516 M.K. Dash et al. / International Journal of Sustainable Built Environment 5 (2016) 484–516
Singh, M., Siddique, R., 2014. Compressive strength, drying shrinkageand chemical resistance of concrete incorporating coal bottom ash aspartial or total replacement of sand. Constr. Build. Mater. 68, 39–48.
Tripathi, B., Misra, A., Chaudhary, S., 2013. Strength and abrasioncharacteristics of ISF slag concrete. J. Mater. Civ. Eng. 25, 1611–1618.
TS 500, 2000. Requirements for design and construction of reinforcedconcrete structures. Turkish Standards Institution, Ankara.
Valcuende, M., Benito, F., Parra, C., Minano, I., 2015. Shrinkage of self-compacting concrete made with blast furnace slag as fine aggregate.Constr. Build. Mater. 76, 1–9.
Velumani, M., Nirmalkumar, K., 2014. Durability and characteristics ofcopper slag as fine aggregate and fly ash as cement in concrete. 2nd Int.Conf. Current Trends Eng. Technol., pp. 222–227.
Wahab, E.S.A., Omar, R., Osmi, S.F.C., Khairussaleh, N.A.M., Abdul-lah, A., 2015. Preliminary study on mechanical properties of concreteadded with fine palm oil clinker. Available from: <www.jeaconf.org>.
Weeks, C., Hand, R.J., Sharp, J.H., 2008. Retardation of cementhydration caused by heavy metals present in ISF slag used asaggregate. Cem. Concr. Compos. 30, 970–978.
Wu, W., Zhang, W., Ma, G., 2010. Optimum content of copper slag as afine aggregate in high strength concrete. Mater. Des. 31, 2878–2883.
Wu, W., Zhang, W., Ma, G., 2010. Mechanical properties of copper slagreinforced concrete under dynamic compression. Constr. Build. Mater.24, 910–917.
Yi, H., Xu, G., Cheng, H., Wang, J., Wan, Y., Chen, H., 2012. Anoverview of utilization of steel slag. Procedia Environ. Sci. 16, 791–801.
Yuksel, I., Genc, A., 2007. Properties of concrete containing non groundash and slag as fine aggregate. ACI Mater. J. 104 (4), 397–403.
Yuksel, I., Ozkan, O., Bilir, T., 2006. Use of granulated blast-furnace slagin concrete as fine aggregate. ACI Mater. J., 203–208
Yuksel, I., Bilir, T., Ozkan, O., 2007. Durability of concrete incorporatingnon-ground blast furnace slag and bottom ash as fine aggregate. Build.Environ. 42, 2651–2659.
Yuksel, I., Siddique, R., Ozkan, O., 2011. Influence of high temperatureon the properties of concretes made with industrial by-products as fineaggregate replacement. Constr. Build. Mater. 25, 967–972.