sustainable transportation energy pathways a …chapter 3: the hydrogen fuel pathway part 1 hydrogen...
TRANSCRIPT

SUSTAINABLE TRANSPORTATION ENERGY PATHWAYS
A Research Summary for Decision Makers
Edited by Joan Ogden and Lorraine Anderson

Institute of Transportation StudiesUniversity of California, DavisOne Shields Avenue, Davis, California 95616
© 2011 by The Regents of the University of California, Davis campusAll rights reserved. Published 2011
Available under a Creative Commons BY-NC-ND 3.0 license <http://creativecommons.org/licenses/by-nc-nd/3.0/>. For information on commercial licensing, contact [email protected].

64
SUSTAINABLE TRANSPORTAT ION ENERGY PATHWAYS
PART 1: INDIVIDUAL FUEL/ VEHICLE PATHWAYS
PART 1
Chapter 3: The Hydrogen Fuel Pathway
Joan Ogden, Christopher Yang, Joshua Cunningham, Nils Johnson, Xuping Li, Michael Nicholas, Nathan Parker, and Yongling Sun
We turn now from biofuels and electricity to a fuel pathway that holds out promise farther in the future. Hydrogen has been widely discussed as a long-term fuel option to address environmental and energy security problems posed by current transportation fuels. Hydrogen fuel cell cars are several times more effi cient than today’s conventional gasoline cars, and they produce zero tailpipe emissions. They offer good performance, a range of 270-430 miles,1 and can be refueled in a few minutes. Hydrogen can be made with zero or near-zero emissions from widely available resources, including renewables (like biomass, solar, wind, hydropower, and geothermal), fossil fuels (such as natural gas or coal with carbon capture and sequestration), and nuclear energy. In principle, it should be possible to produce and use hydrogen transportation fuel with near-zero well-to-wheels emissions of greenhouse gases and greatly reduced emissions of air pollutants while simultaneously diversifying away from our current dependence on petroleum.2 To reach stringent long term goals for cutting greenhouse gas emissions from transportation, it appears likely that the light duty fl eet will be largely electrifi ed by 2050 (see Chapter 8). Hydrogen fuel cells are an important enabling technology for this vision. Automakers foresee a future electrifi ed light duty fl eet with batteries powering smaller, shorter range cars and hydrogen fuel cells powering larger vehicles with longer range. To electrify all segments of the light duty market, fuel cells are a necessary complement to batteries. Recent assessments affi rm the long-term potential of hydrogen to greatly reduce oil dependence as well as transportation emissions of greenhouse gases and air pollutants—far beyond what might be achieved by energy effi ciency alone. They also highlight the complex technical and logistical challenges that must be addressed before a hydrogen-based transportation system can become a reality. This chapter discusses some of the major questions regarding future use of hydrogen in the transportation sector and highlights STEPS research on these issues.
• What is the technical outlook for hydrogen vehicles and hydrogen supply?• What are the environmental impacts of hydrogen fuel compared to alternatives?• What would a hydrogen infrastructure look like, and how could we make a transition to
hydrogen?• What policies and business strategies are needed to support hydrogen in both the near
and long terms?
65
SUSTAINABLE TRANSPORTAT ION ENERGY PATHWAYS
CHAPTER 3: THE HYDROGEN FUEL PATHWAY
PART 1
CHALLENGES ON THE HYDROGEN FUEL PATHWAYThese complex technical and logistical challenges must be addressed before a hydrogen-
based transportation system can become widespread:
• Technical challenges. While many of the technologies exist to build a hydrogen
energy system, further development is needed on key emerging technologies. In
particular, further development is needed for proton exchange membrane (PEM)
fuel cell cost and durability, hydrogen storage on vehicles, and technologies for zero-
carbon hydrogen production.
• Logistical challenges. Full adoption of FCVs will require a widespread hydrogen
infrastructure. The issue is not producing low-cost hydrogen at large scale but
distributing hydrogen to many dispersed users at low cost, especially during the early
stages of a transition.
• Transition issues / coordination of stakeholders. A hydrogen transition
means many major changes at once: adoption of new types of cars, building a new
fuel infrastructure, and development of new low-carbon primary energy resources.
These changes will require coordination among diverse stakeholders with differing
motivations (fuel suppliers, vehicle manufacturers, and policymakers), especially in
the early stages when costs for vehicles are high and infrastructure is sparse. Factors
that could ease transitions, like compatibility with the existing fuel infrastructure, are
more problematic for hydrogen than for electricity or liquid synthetic fuels.
• Policy challenges. Finally, consistent policies that refl ect the external costs of
energy—such as global climate change and damage to health from air pollution, plus
the costs of oil supply insecurity—are lacking. This is a barrier to introducing more-
effi cient, cleaner technologies, including hydrogen, and to assuring that hydrogen is
made from low-carbon sources. It is almost certain that technology-specifi c policies
will be needed to support a hydrogen transition.
Technology Status and Outlook
We start with the technology status and outlook for hydrogen vehicles and hydrogen supply. Technologies that use hydrogen, notably fuel cells, are making rapid and signifi cant progress.
But while many of the technologies to build a hydrogen-based transportation system already exist, further development is needed for key emerging technologies, especially proton exchange membrane (PEM) fuel cells for automotive use, hydrogen storage on vehicles, and technologies for zero-carbon hydrogen production.

66
SUSTAINABLE TRANSPORTAT ION ENERGY PATHWAYS
CHAPTER 3: THE HYDROGEN FUEL PATHWAY
PART 1
Hydrogen vehiclesAlthough internal combustion engines can run on hydrogen, it is the higher-effi ciency, zero-emission hydrogen fuel cell that has largely captured the attention of automakers. Several automakers have embraced fuel cells as a superior zero-emission technology and have large development and commercialization programs. Honda, Toyota, Daimler, GM and Hyundai have announced plans to commercialize FCVs sometime between 2015 and 2020.3 Hydrogen and fuel cells represent a logical progression beyond effi ciency and increasing electrifi cation of cars with hybrid and electric drive trains. As noted above, many automakers see complementary roles for hydrogen fuel cells and battery electric vehicles and are pursuing both technologies. Fuel cells are highly effi cient electrochemical “engines” that combine hydrogen and oxygen in air to produce electricity to power the vehicle. Fuel cells operate without combustion or emissions of pollutants or greenhouse gases; the only tailpipe emission is water. Today’s development FCVs have fuel economies twice that of comparable gasoline cars, and 35 to 65 percent higher than gasoline hybrids.4 FCVs use electric drive trains but have a longer range, a faster refueling time, and the potential for lower cost than battery electric cars.5 In addition to the fuel cell stack, other key components of a hydrogen FCVs include hydrogen storage, electric motors and power controllers, and batteries for hybrid operation and cold start support (most fuel cell vehicles today are hybrids). A key technology for automotive applications is the proton exchange membrane or PEM fuel cell. Manufacturers have reduced the weight and volume of PEM fuel cell systems so that they easily fi t under the hood of a compact car. Fuel cell systems have demonstrated good driving performance and meet goals for low-temperature operation and freeze tolerance. However, several issues remain. Current automotive PEM fuel cells still fall short of the 5,000-hour lifetime needed, lasting about 2,000 hours in on-road tests,6 although durability is steadily increasing and researchers have reported new designs that might take fuel cells to 7,000 hours and beyond. Recently, 5,000 hours durability was demonstrated in laboratory cells under non-ideal conditions that resemble on-road operation.7
The U.S. Department of Energy (DOE) estimates that if today’s automotive PEM fuel cell systems were mass-produced (at levels of 500,000 units per year), costs would drop to $51/kW (or about $4,000 for an 80-kW system), roughly twice the cost of a comparable internal combustion engine8. Fuel cell system costs are expected to continue declining toward the DOE goal of $30/kW because of improved materials, reductions in required platinum loading, and increased power density. Storing enough hydrogen on a car for a reasonable traveling range (say 300 miles) is another key design issue. Storage requires high-pressure cylinders, liquid hydrogen at a super-cooled 20 K, or special materials such as metal hydrides that absorb hydrogen under pressure. Hydrogen storage systems are heavier and bulkier than those for gasoline, though less so than batteries, and compressing or liquefying hydrogen requires energy. Finding a better storage method is a major thrust of hydrogen R&D worldwide. In the absence of a breakthrough storage technology, most hydrogen vehicles today opt for the simplicity of compressed gas storage, which will be the system choice for early commercialization. Because of the low volumetric density of these systems, many FCV manufacturers have begun to design around the storage system in order to get adequate range without reducing passenger or cargo space in the vehicle. GM, Honda, Toyota, Daimler

67
SUSTAINABLE TRANSPORTAT ION ENERGY PATHWAYS
CHAPTER 3: THE HYDROGEN FUEL PATHWAY
PART 1
and Hyundai have all demonstrated light-duty fuel cell cars with a 270–400-mile range, using compressed hydrogen gas at 35–70 MPa (megapascals, a measure of pressure).9 These vehicles meet the U.S. DOE goals for range. Costs for mass-produced compressed storage tanks based upon current technology are estimated to be around $15–23/kWh (or about $2,500–3,700 for a compact FCV storing enough hydrogen for a 300-mile range).10 Although these are substantially higher than the DOE’s 2015 goals of $2–4/kWh, a recent National Academies study found acceptable overall vehicle costs with hydrogen storage tanks costing $10–15/kWh.11
H2 TECHNOLOGIES: CURRENT STATUS VS 2015 DOE GOALS
When we compare the status of current (2010) H2 technologies in demonstration vehicles and goals set by the U.S.
Department of Energy (DOE) for 2015, we can see that current technologies have farthest to go to reach durability, system-cost, and storage-cost goals. The fi gure at the bottom shows how close the current technology is to the 2015 goal.
While estimates of the price of mass-produced FCVs based upon projections for 2015 technology are within a few thousand dollars of conventional vehicles,12 initial FCV models will not be produced in such high volumes and as a result will have a high price premium. At a scale of 50,000 FCVs being produced worldwide, estimated prices are around $75,000 per vehicle. Prices can drop quickly as manufacturing volume increases. Mass-produced, mature technology FCVs are estimated to have a retail price $3,600 to $6,000 higher than a comparable gasoline internal combusion engine vehicle (ICEV).13
Today 2015 Goals
In-use durability (hrs) 2000 5000
Vehicle Range (miles/tank) 280-400 300
Fuel Economy (mi/kg H2) 72 60
Fuel Cell Effi ciency 53-58% 60%
Fuel Cell System Cost ($/kW) 51 30
H2 Storage Cost ($/kWh) 15-23 10-15 (NRC)
2-4 (USDOE)
200%
100%
0%Durability Range Fuel
EconomyFuel CellEffi ciency
Fuel CellSystem
H2 Storage Cost
68
SUSTAINABLE TRANSPORTAT ION ENERGY PATHWAYS
CHAPTER 3: THE HYDROGEN FUEL PATHWAY
PART 1
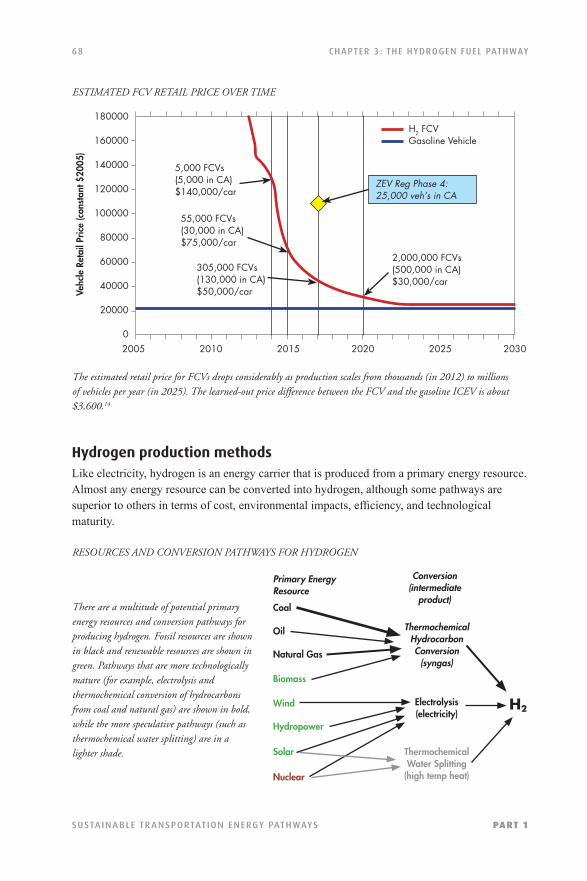
ESTIMATED FCV RETAIL PRICE OVER TIME
The estimated retail price for FCVs drops considerably as production scales from thousands (in 2012) to millions of vehicles per year (in 2025). The learned-out price difference between the FCV and the gasoline ICEV is about $3,600.14
Hydrogen production methodsLike electricity, hydrogen is an energy carrier that is produced from a primary energy resource. Almost any energy resource can be converted into hydrogen, although some pathways are superior to others in terms of cost, environmental impacts, effi ciency, and technological maturity.
RESOURCES AND CONVERSION PATHWAYS FOR HYDROGEN
There are a multitude of potential primary energy resources and conversion pathways for producing hydrogen. Fossil resources are shown in black and renewable resources are shown in green. Pathways that are more technologically mature (for example, electrolysis and thermochemical conversion of hydrocarbons from coal and natural gas) are shown in bold, while the more speculative pathways (such as thermochemical water splitting) are in a lighter shade.
180000
160000
140000
120000
100000
80000
60000
40000
20000
02005 2010 2015 2020 2025 2030
Vehc
le R
etai
l Pric
e (c
onst
ant $
2005
)
H2 FCVGasoline Vehicle
2,000,000 FCVs(500,000 in CA)$30,000/car
ZEV Reg Phase 4:25,000 veh’s in CA
5,000 FCVs(5,000 in CA)$140,000/car
55,000 FCVs(30,000 in CA)$75,000/car
305,000 FCVs(130,000 in CA)$50,000/car
Primary Energy Resource
ThermochemicalHydrocarbonConversion
(syngas)
Conversion(intermediate
product)Coal
Oil
Natural Gas
Biomass
Wind
Hydropower
Solar
Nuclear
Electrolysis(electricity)
ThermochemicalWater Splitting
(high temp heat)
H2

69
SUSTAINABLE TRANSPORTAT ION ENERGY PATHWAYS
CHAPTER 3: THE HYDROGEN FUEL PATHWAY
PART 1
In the United States, about 9 million tonnes of hydrogen are produced each year (enough to fuel a fl eet of about 35 million fuel cell cars). Steam reforming of natural gas is the most common method of hydrogen production today (mainly for industrial and refi nery purposes), accounting for about 95 percent of hydrogen production in the United States. In the near to medium term, fossil fuels (primarily natural gas) are likely to continue to be the least expensive and most energy-effi cient resources from which to produce hydrogen. Conversion of these resources still emits some carbon into the atmosphere. However, future hydrogen production technologies could virtually eliminate GHG emissions. For large central plants producing hydrogen from natural gas or coal, it is technically feasible to capture the CO
2
and permanently sequester it in deep geological formations, although the widespread use of sequestration technology poses important challenges and will not happen until 2020 at the earliest. Production of hydrogen from renewable biomass is a promising midterm option (post 2020) with very low net carbon emissions. In the longer term, vast carbon-free renewable resources such as wind and solar energy might be harnessed for hydrogen production via electrolysis of water. While this technology is still improving, high costs for electrolyzers and renewable electricity (in part because of the low capacity factors of intermittent renewable sources) suggest that renewable electrolytic hydrogen will likely cost more than hydrogen from fossil resources with carbon capture and sequestration (CCS) or biomass gasifi cation.

70
SUSTAINABLE TRANSPORTAT ION ENERGY PATHWAYS
CHAPTER 3: THE HYDROGEN FUEL PATHWAY
PART 1
DELIVERED COST OF HYDROGEN FROM VARIOUS PATHWAYS
Here we compare the delivered cost of hydrogen transportation fuel produced via different pathways for “near term” (scaled up infrastructure with current technology) and “future” (full scale infrastructure with advanced technologies beyond 2015).15 We see that costs will come down as technology advances, and that production from hydrocarbons generally costs less than electrolytic hydrogen production. All central alternatives assume hydrogen is deployed at a massive scale, which could happen beyond 2020. On-site alternatives use stations serving numbers of cars similar to today’s gasoline stations (at 1,500 kg of H
2 per day). We also show estimated H
2 costs for smaller size stations (100 kg
of H2 per day) typical of near-term demonstration H
2 stations which serve a relatively small number of early FCVs.
These small stations would have signifi cantly higher hydrogen cost because of scale economies. The range for hydrogen fuel costs to compete with gasoline on a cents-per-mile basis is shown, based on an effi cient gasoline hybrid competing with an FCV. If H
2 costs $3–6/kg, the fuel cost per mile for an FCV is about the same as for an effi cient gasoline
hybrid using gasoline at $2–4/gal, assuming that the fuel economy of a fuel cell vehicle is 1.5 times higher than that of a comparable gasoline hybrid.
Del
iver
ed H
2 Cos
t ($/
kg)
14
12
10
8
6
4
2
0
Distributed H2production
100 kg/dstation
1500 kg/dstation
Large central H2 plantswith pipeline distribution
NG centr
al ref
ormer
Biomas
s gas
ifi cati
on
Nuclea
rW
ind el
ectro
lysis
Solar
PV el
ectro
lysis
On-site
NG re
former
On-site
elec
rolyz
er
On-site
NG re
former
On-site
elec
rolyz
er
Coal g
asifi c
ation
Coal g
asifi c
ation
w/C
CS
Competesw/gasoline@$2-4/gal
FutureNear Term
H2 Supply Pathway

71
SUSTAINABLE TRANSPORTAT ION ENERGY PATHWAYS
CHAPTER 3: THE HYDROGEN FUEL PATHWAY
PART 1
In the United States, the lowest-cost low-carbon hydrogen supply pathways appear to be biomass gasifi cation and hydrogen from coal with CCS. Each could contribute signifi cantly to the long-term hydrogen supply. The lowest-cost option depends on the market penetration of FCVs, the local feedstock and energy prices, as well as geographic factors such as city size and density of demand. Detailed regional studies reveal possibilities for further optimizing the hydrogen supply system at the regional level. It appears that hydrogen could be delivered to consumers for about $3–4/kg, with near-zero emissions of greenhouse gases, on a well-to-wheels basis, which leads to a reduction in fuel cost per mile compared to gasoline vehicles, given the increased effi ciency of FCVs.
H2 AND ELECTRICITY AS PRIMARY ENERGY CARRIERS16
One compelling vision of a future decarbonized energy system involves the use of
two primary energy carriers—hydrogen and electricity. H2 and electricity are both
decarbonized energy carriers that enable conversion, transport, and utilization of a wide
variety of primary energy resources. In an integrated energy system, these two energy
carriers could complement each other; they could be produced from the same primary
energy resources and could in fact be co-produced and inter-converted. However, they
have very different characteristics, which suggest specialized uses and applications for each.
Given the benefi ts associated with electric-drive vehicles, hydrogen and electricity
are in competition as the primary energy carrier for light-duty vehicles. However, many
industry experts foresee a complementary role in the future light-duty sector dominated
by electric-drive vehicles in which small, shorter-range vehicles are powered by batteries
and longer-range, larger passenger vehicles are powered by fuel cells. The main technical
challenges facing battery-powered vehicles stem from the energy density limitations and
recharge times associated with batteries. Fuel cells appear to alleviate these issues with
refueling speeds and vehicle ranges that approach those of gasoline vehicles, though these
benefi ts are traded off for greater infrastructure requirements.
Transportation
Industrial
Residential
Commercial
Carbonaceous feedstocksCoal, Natural gas,petroleum, biomass
Nuclear energyNuclear electricity, heat
Renewable electricityWind, solar, geothermal,hydro
Hydrogen
Electricity
72
SUSTAINABLE TRANSPORTAT ION ENERGY PATHWAYS
CHAPTER 3: THE HYDROGEN FUEL PATHWAY
PART 1
Co-production is another area where these two energy carriers may interact. They
can be made from the same primary resources and can be co-produced with higher
effi ciency and lower cost than producing either one separately. These can occur at
the large scale (for example, thermochemical conversion from fossil fuels with carbon
capture and sequestration) or the small scale (for instance, separate energy stations at
one refueling station).
Finally, hydrogen and electricity can be inter-converted via electrolyzers and fuel
cells. While effi ciency losses occur in converting one energy carrier to another, a number
of circumstances may offer compelling reasons to do so. Such circumstances include
electrolysis using cheap off-peak electricity, hydrogen production as a means of storing
and leveling intermittent renewable electricity, and vehicle-to-grid electricity in a fuel cell
vehicle.
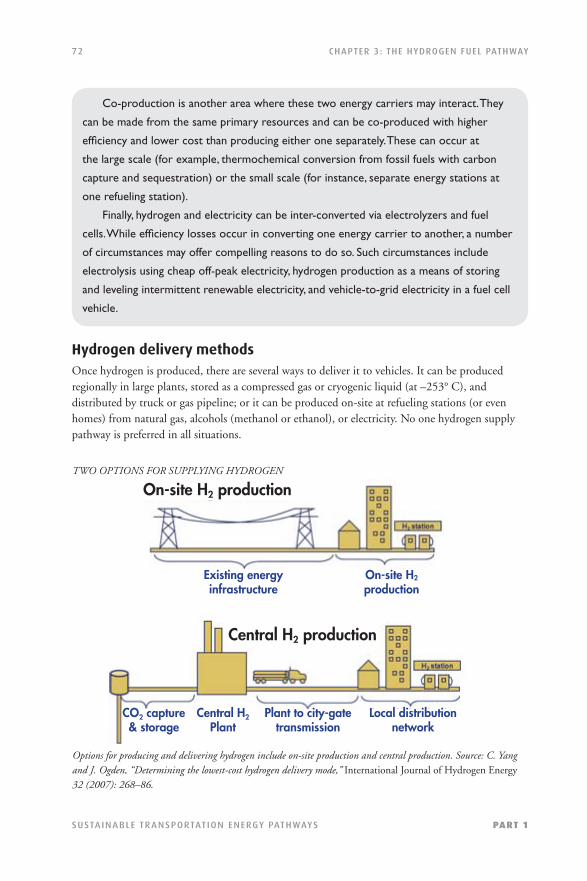
Hydrogen delivery methodsOnce hydrogen is produced, there are several ways to deliver it to vehicles. It can be produced regionally in large plants, stored as a compressed gas or cryogenic liquid (at –253° C), and distributed by truck or gas pipeline; or it can be produced on-site at refueling stations (or even homes) from natural gas, alcohols (methanol or ethanol), or electricity. No one hydrogen supply pathway is preferred in all situations.
TWO OPTIONS FOR SUPPLYING HYDROGEN
Options for producing and delivering hydrogen include on-site production and central production. Source: C. Yang and J. Ogden, “Determining the lowest-cost hydrogen delivery mode,” International Journal of Hydrogen Energy 32 (2007): 268–86.
CO2 capture& storage
Central H2 Plant
Plant to city-gatetransmission
Local distributionnetwork
On-site H2 production
Existing energyinfrastructure
On-site H2
production
Central H2 production
73
SUSTAINABLE TRANSPORTAT ION ENERGY PATHWAYS
CHAPTER 3: THE HYDROGEN FUEL PATHWAY
PART 1
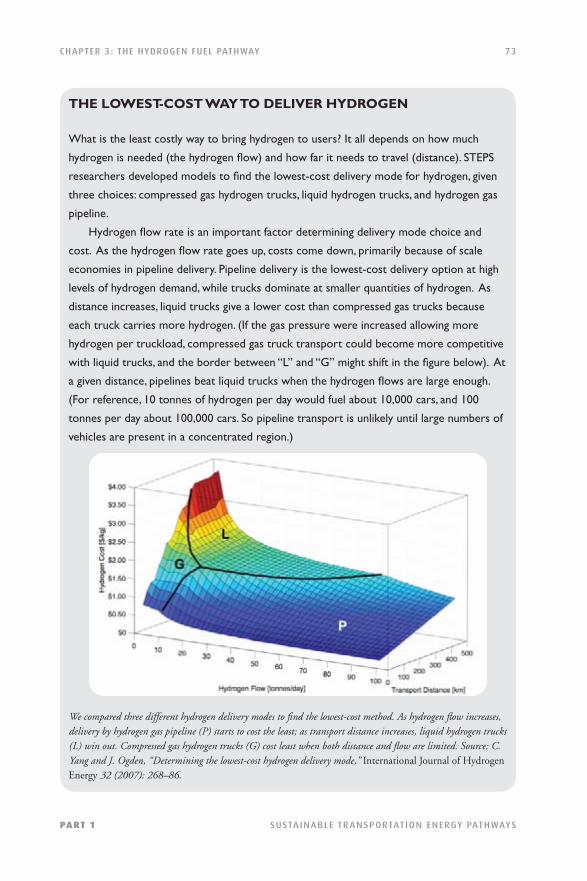
THE LOWEST-COST WAY TO DELIVER HYDROGEN
What is the least costly way to bring hydrogen to users? It all depends on how much
hydrogen is needed (the hydrogen fl ow) and how far it needs to travel (distance). STEPS
researchers developed models to fi nd the lowest-cost delivery mode for hydrogen, given
three choices: compressed gas hydrogen trucks, liquid hydrogen trucks, and hydrogen gas
pipeline.
Hydrogen fl ow rate is an important factor determining delivery mode choice and
cost. As the hydrogen fl ow rate goes up, costs come down, primarily because of scale
economies in pipeline delivery. Pipeline delivery is the lowest-cost delivery option at high
levels of hydrogen demand, while trucks dominate at smaller quantities of hydrogen. As
distance increases, liquid trucks give a lower cost than compressed gas trucks because
each truck carries more hydrogen. (If the gas pressure were increased allowing more
hydrogen per truckload, compressed gas truck transport could become more competitive
with liquid trucks, and the border between “L” and “G” might shift in the fi gure below). At
a given distance, pipelines beat liquid trucks when the hydrogen fl ows are large enough.
(For reference, 10 tonnes of hydrogen per day would fuel about 10,000 cars, and 100
tonnes per day about 100,000 cars. So pipeline transport is unlikely until large numbers of
vehicles are present in a concentrated region.)
We compared three different hydrogen delivery modes to fi nd the lowest-cost method. As hydrogen fl ow increases, delivery by hydrogen gas pipeline (P) starts to cost the least; as transport distance increases, liquid hydrogen trucks (L) win out. Compressed gas hydrogen trucks (G) cost least when both distance and fl ow are limited. Source: C. Yang and J. Ogden, “Determining the lowest-cost hydrogen delivery mode,” International Journal of Hydrogen Energy 32 (2007): 268–86.
74
SUSTAINABLE TRANSPORTAT ION ENERGY PATHWAYS
CHAPTER 3: THE HYDROGEN FUEL PATHWAY
PART 1
Environmental Impacts of Hydrogen Fuel
The environmental impacts of hydrogen fuel vary with the production pathway. Most life-cycle analyses of alternative fuels have focused on emissions and energy use, but recently several authors have expanded their focus to estimate primary resource, land, water, and materials use associated with hydrogen energy systems as compared to other fuels.
GHG emissions, air pollution, and energy useMost hydrogen production today is from fossil fuels, which releases CO
2, the major GHG linked
to climate change. For the near term, FCVs using hydrogen produced from natural gas would reduce well-to-wheels GHG emissions by about half compared to current gasoline vehicles. For large central plants producing hydrogen from hydrocarbons (natural gas, coal or biomass), it is technically feasible to capture the CO
2 and permanently sequester it in deep geological formations,
although sequestration technology will not be in widespread use before 2020 at the earliest. Production of hydrogen from renewable biomass is a promising midterm option with very low net carbon emissions. In the longer term, carbon-free renewables such as wind and solar energy might be harnessed for hydrogen production via electrolysis of water. Air pollution reductions are signifi cant with hydrogen pathways compared to gasoline, leading to better air quality17 and lower social costs.18 And petroleum use for hydrogen pathways is very small. The only oil use is associated with truck delivery and electricity generation for hydrogen compression or liquefaction, and this is much lower than with any gasoline pathway.
75
SUSTAINABLE TRANSPORTAT ION ENERGY PATHWAYS
CHAPTER 3: THE HYDROGEN FUEL PATHWAY
PART 1
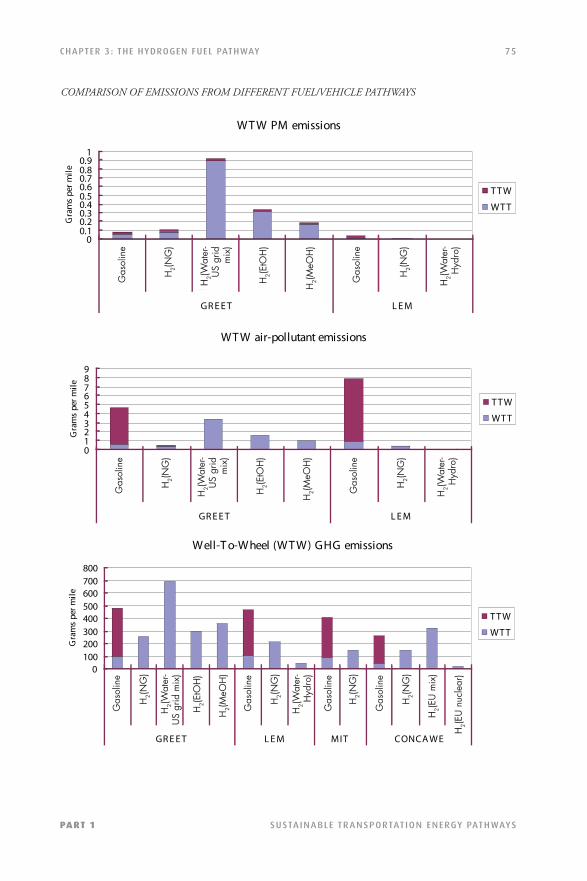
COMPARISON OF EMISSIONS FROM DIFFERENT FUEL/VEHICLE PATHWAYS
WT W PM emissions
00.10.20.30.40.50.60.70.80.9
1
Gas
olin
e
H2(
NG
)
H2(
Wat
er-
US
grid
mix
)
H2(
EtO
H)
H2(
MeO
H)
Gas
olin
e
H2(
NG
)
H2(
Wat
er-
Hyd
ro)
GR E E T L E M
Gra
ms
per m
ile
T T W
WT T
WT W air-pollutant emissions
0123456789
Gas
olin
e
H2(
NG
)
H2(
Wat
er-
US
grid
mix
)
H2(
EtO
H)
H2(
MeO
H)
Gas
olin
e
H2(
NG
)
H2(
Wat
er-
Hyd
ro)
GR E E T L E M
Gra
ms
per m
ile
T T W
WT T
Well-T o-Wheel (W T W) GHG emissions
0100200300400500600700800
Gas
olin
e
H2(
NG
)
H2(
Wat
er-
US
grid
mix
)
H2(
EtO
H)
H2(
MeO
H)
Gas
olin
e
H2(
NG
)
H2(
Wat
er-
Hyd
ro)
Gas
olin
e
H2(
NG
)
Gas
olin
e
H2(
NG
)
H2(
EU
mix
)
H2(
Nuc
lear
)
GR E E T L E M MIT CONCA WE
Gra
ms
per m
ile
T T W
WT T
Gas
olin
e
H2(N
G)
H2(W
ater
-U
S gr
idm
ix)
H2(E
tOH
)
H2(M
eOH
)
Gas
olin
e
H2(N
G)
H2(W
ater
-H
ydro
)
Gas
olin
e
H2(N
G)
H2(W
ater
-U
S gr
idm
ix)
H2(E
tOH
)
H2(M
eOH
)
Gas
olin
e
H2(N
G)
H2(W
ater
-H
ydro
)
Gas
olin
e
Gas
olin
e
Gas
olin
e
Gas
olin
e
H2(N
G)
H2(N
G)
H2(E
U m
ix)
H2(N
G)
H2(N
G)
H2(W
ater
-U
S gr
id m
ix)
H2(W
ater
-H
ydro
)
H2(E
tOH
)
H2(M
eOH
)
H2(E
U n
ucle
ar)

76
SUSTAINABLE TRANSPORTAT ION ENERGY PATHWAYS
CHAPTER 3: THE HYDROGEN FUEL PATHWAY
PART 1
We compare the well-to-wheels (WTW) emissions of greenhouse gases, air pollutants, and particulate matter (PM) for a variety of hydrogen pathways, based on results from the Argonne National Laboratory GREET model, the UC Davis LEM model, MIT, and the European Union CONCAWE study. We break emissions down into phases: well-to-tank (WTT) and tank-to-wheels (TTW). Emissions are shown for H
2(NG) = hydrogen from on-site natural gas
reforming; H2(Water) = hydrogen from on-site water electrolysis; H
2(EtOH) = hydrogen from ethanol at refueling
stations; and H2(MeOH) = hydrogen from methanol at refueling stations.
Notes: The emission results from GREET V.1.8c.0 are for year 2010 using default input parameters in the GREET model. The LEM model assumes that electricity generation is from hydropower for hydrogen production from water electrolysis. PM emissions from GREET are larger than those from LEM as LEM considers emission reductions due to emission controls while GREET does not. GREET also includes the PM emissions from brake and tire wear. According to GREET, most of the PM emissions are from the WTT phase, about 1.8 percent of total air pollution is PM from gasoline, and about 20–27 percent of total air pollution is PM from H
2 pathways.
Sources: M. Wang, “Well-to-Wheels Analysis with the GREET Model,” 2005 U.S. DOE Hydrogen Program Review, May 26, 2005; M. Wang, “Well to Wheels Analysis of Vehicle/Fuel Systems with GREET at Argonne National Lab,” presentation at the U.S. DOE Hydrogen Analysis Deep Dive meeting, San Antonio, TX, March 22, 2007; M. A. Delucchi, “A Lifecycle Emissions Model (LEM): Lifecycle Emissions from Transportation Fuels, Motor Vehicles, Transportation Modes, Electricity Use, Heating and Cooking Fuels, and Materials,” UCD-ITS-RR-03-17-MAIN (Institute of Transportation Studies, University of California, Davis, 2003); M. A. Kromer and J. B. Heywood, Electric Powertrains: Opportunities and Challenges in the U.S. Light-Duty Vehicle Fleet, LEFF 2007-02 RP (Sloan Automotive Laboratory, MIT Laboratory for Energy and the Environment, May 2007); EUCAR (European Council for Automotive Research and Development), CONCAWE, and ECJRC (European Commission Joint Research Centre), Well-to-Wheels Analysis of Future Automotive Fuels and Powertrains in the European Context, Well-to-Wheels Report, Version 2c, March 2007.
Use of primary energy resources, land, water, and other materialsWith hydrogen fuel cells the amount of primary energy required is similar to that for gasoline hybrids and considerably less than for conventional gasoline cars. There are plentiful near-zero-carbon resources for hydrogen production in the United States. For example, a mix of low-carbon resources including natural gas, coal (with carbon sequestration), biomass, and wind power could supply ample hydrogen for vehicles. With 20 percent of the biomass resource, plus 15 percent of the wind resource, plus 25 percent added use of coal (with sequestration), 300 million hydrogen vehicles (approximately the entire U.S. fl eet projected in 2030) could be served with near-zero GHG emissions.
77
SUSTAINABLE TRANSPORTAT ION ENERGY PATHWAYS
CHAPTER 3: THE HYDROGEN FUEL PATHWAY
PART 1
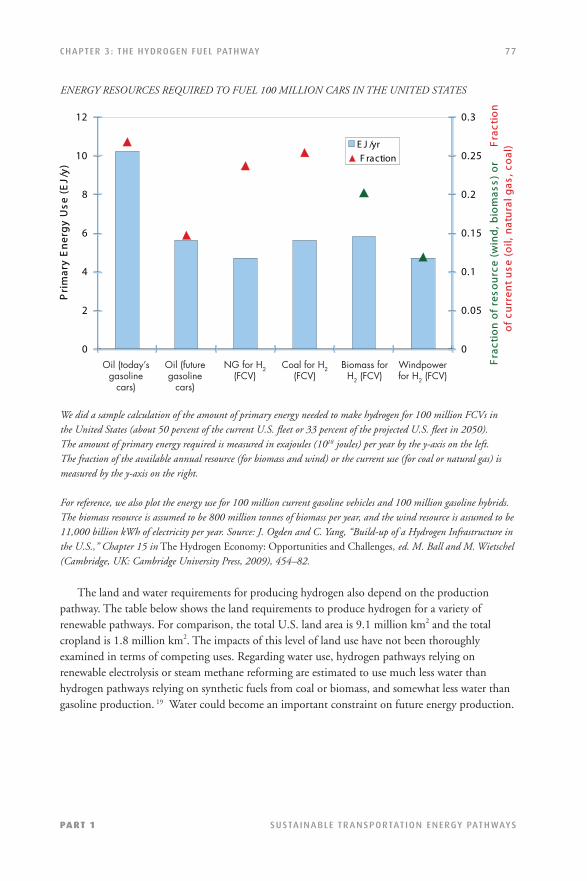
ENERGY RESOURCES REQUIRED TO FUEL 100 MILLION CARS IN THE UNITED STATES
We did a sample calculation of the amount of primary energy needed to make hydrogen for 100 million FCVs in the United States (about 50 percent of the current U.S. fl eet or 33 percent of the projected U.S. fl eet in 2050). The amount of primary energy required is measured in exajoules (1018 joules) per year by the y-axis on the left. The fraction of the available annual resource (for biomass and wind) or the current use (for coal or natural gas) is measured by the y-axis on the right.
For reference, we also plot the energy use for 100 million current gasoline vehicles and 100 million gasoline hybrids. The biomass resource is assumed to be 800 million tonnes of biomass per year, and the wind resource is assumed to be 11,000 billion kWh of electricity per year. Source: J. Ogden and C. Yang, “Build-up of a Hydrogen Infrastructure in the U.S.,” Chapter 15 in The Hydrogen Economy: Opportunities and Challenges, ed. M. Ball and M. Wietschel (Cambridge, UK: Cambridge University Press, 2009), 454–82.
The land and water requirements for producing hydrogen also depend on the production pathway. The table below shows the land requirements to produce hydrogen for a variety of renewable pathways. For comparison, the total U.S. land area is 9.1 million km2 and the total cropland is 1.8 million km2. The impacts of this level of land use have not been thoroughly examined in terms of competing uses. Regarding water use, hydrogen pathways relying on renewable electrolysis or steam methane reforming are estimated to use much less water than hydrogen pathways relying on synthetic fuels from coal or biomass, and somewhat less water than gasoline production. 19 Water could become an important constraint on future energy production.
0
2
4
6
8
10
12
Oil (today'sgasoline
cars)
Oil (futuregasoline
cars)
NG for H2(F C V )
C oal for H2(F C V )
B iomass forH2 (F C V )
Windpowerfor H2 (F C V )
Pri
mar
y E
ner
gy
Use
(E
J/y)
0
0.05
0.1
0.15
0.2
0.25
0.3
Fra
ctio
n o
f re
sou
rce
(win
d, b
iom
ass)
or
Fra
ctio
n
of
curr
ent
use
(o
il, n
atu
ral g
as, c
oal
)E J /yr F raction
Oil (today’sgasoline
cars)
Oil (futuregasoline
cars)
NG for H2(FCV)
Coal for H2(FCV)
Biomass for H2 (FCV)
Windpowerfor H2 (FCV)

78
SUSTAINABLE TRANSPORTAT ION ENERGY PATHWAYS
CHAPTER 3: THE HYDROGEN FUEL PATHWAY
PART 1
LAND AREA REQUIRED TO PRODUCE RENEWABLE H2
Materials availability could also become an issue for widespread use of hydrogen. For example, FCVs require use of a platinum catalyst in the fuel cell. If these vehicles come into widespread use in the future, signifi cant quantities of platinum will be needed. However, studies by STEPS researchers and other have shown that there should be suffi cient platinum for FCVs (see Chapter 7 for a full discussion).
Hydrogen Pathway Land Area (m2) Total Land Area (km2) to to Produce 1 GJ Produce H2 for 100 H2 per Year Million Cars
Electrolytic H2
Solar PV 1.89 5,700
Solar thermal electric 5.71 17,000
Wind 6.3-33 19,000–99,000
Hydropower 11-500
H2 via biomass gasifi cation 50 150,000
79
SUSTAINABLE TRANSPORTAT ION ENERGY PATHWAYS
CHAPTER 3: THE HYDROGEN FUEL PATHWAY
PART 1
Building a Hydrogen Infrastructure
Adoption of hydrogen will require a widespread hydrogen infrastructure to fuel vehicles. Unlike the case with gasoline and electricity, there is currently no large-scale infrastructure bringing hydrogen to consumers. Because there are many options for hydrogen production and delivery, and no one supply option is preferred in all cases, creating such an infrastructure is a complex design problem. The challenge is not so much producing low-cost hydrogen at large scale as it is distributing hydrogen to many dispersed users at low cost, especially during the early stages of the transition. Recent studies (including those at UC Davis)20 have found that the design of a hydrogen infrastructure depends on many factors, including these:
• Scale. Hydrogen production, storage, and delivery systems exhibit economies of scale, and costs generally decrease as demand grows.
• Geography / regional factors. The location, size, and density of demand, the location and size of resources for hydrogen production, the availability of sequestration sites, and the layout of existing infrastructure can all infl uence hydrogen infrastructure design.
• Feedstocks. The price and availability of feedstocks for hydrogen production, and energy prices for competing technologies (for example, gasoline prices), must be taken into account.
• Technology status. Assumptions about hydrogen technology cost and performance determine the best supply option.
• Supply and demand. The characteristics of the hydrogen demand and how well it matches supply must be considered. Time variations in demand (refueling tends to happen during the daytime, with peaks in the morning and early evening) and in the availability of supply (for example, wind power is intermittent) can help determine the best supply and how much hydrogen storage is needed in the system.
• Policy. Requirements for low-carbon or renewable hydrogen infl uence which hydrogen pathways are used.
In this section, we discuss a national rollout for the United States, early infrastructure and transition issues in southern California, and regional designs for two leading low-carbon options: biomass hydrogen and coal with CCS.
A scenario for hydrogen infrastructure build-up in the United StatesBuilding a national hydrogen refueling infrastructure in a large, diverse country such as the United States is a complex design problem involving regional considerations. We developed the SSCHISM model to study this challenge. We use SSCHISM to determine the least-cost method for supplying hydrogen to a particular city at a given market penetration.

80
SUSTAINABLE TRANSPORTAT ION ENERGY PATHWAYS
CHAPTER 3: THE HYDROGEN FUEL PATHWAY
PART 1
MODELING HYDROGEN INFRASTRUCTURE: THE UC DAVIS SSCHISM MODEL
To understand the design and economics of a hydrogen infrastructure, STEPS
researchers developed the Steady-State City Hydrogen Infrastructure System Model
(SSCHISM).21 SSCHISM fi nds the lowest-cost infrastructure design based on regionally
specifi c information (city population and physical size, energy prices, electricity
grid characteristics), plus engineering/economic models of hydrogen infrastructure
component costs, and market factors. We analyzed a wide variety of hydrogen supply
pathways for each of 73 major U.S. urban areas. Outputs include the levelized cost of
delivered hydrogen, the infrastructure capital cost, CO2 emissions, and primary energy
requirements.
Our SSCHISM model fi nds the lowest-cost infrastructure design based on regionally specifi c information (city population and physical size, energy prices, electricity grid characteristics), plus hydrogen infrastructure component costs and market factors.
In the model, we assume that the fi rst few thousand FCVs are successfully introduced in 2012, with tens of thousands of FCVs by 2015, 2 million in the fl eet by 2020, 10 million by 2025, and about 200 million (60 percent of the fl eet) by 2050. Because of the need to locate infrastructure and vehicles together, hydrogen is introduced in a succession of “lighthouse” cities, starting with the Los Angeles area. We assume that some minimum number of hydrogen stations is needed in each city to assure adequate coverage and consumer convenience and to help deal with the “chicken-or-egg” problem of assuring hydrogen fuel availability to early vehicle owners.
City InfoPopulation, physical sizeEnergy PricesGrid compostion
OutputsLevelized H2 costInfrastructure costLowest cost pathwayCO2 emissionsPrimary energy inputs
Infrastructure CostsComponent Costs National Acadamies H2A
User InputsMarket penetrationStation sizeH2 pathway of interestCity of interest
Steady State CityHydrogen
InfrastructureSystem Model
(SSCHISM)
Idealized City ModelPipeline distancesTruck distances

81
SUSTAINABLE TRANSPORTAT ION ENERGY PATHWAYS
CHAPTER 3: THE HYDROGEN FUEL PATHWAY
PART 1
PROJECTED INTRODUCTION OF FCVS IN “LIGHTHOUSE” CITIES, 2012–2025
The number of light-duty FCVs sold annually in 27 “lighthouse” cities is given here in thousands of vehicles per year introduced between 2012 and 2025. The total number of hydrogen vehicles in 2025 is 10 million, and 2.5 million vehicles are sold that year. Source: S. Gronich, “Hydrogen and FCV Implementation Scenarios, 2010–2025,” presented at the U.S. DOE Hydrogen Transition Analysis Workshop, Washington DC, August 9–10, 2006.
As new cities are phased in over time, hydrogen is initially costly because of the low demand in the new cities, but costs fall as demand grows. The phased introduction of hydrogen infrastructure and vehicles leads to differences in hydrogen market penetration and also contributes to differences in hydrogen cost for different cities. City size and density as well as local feedstock and energy prices also contribute to these cost differences.
2012 2013 2014 2015 2016 2017 2018 2019 2020 2021 2022 2023 2024 2025Los Angeles 1 2 2 25 40 50 85 120 160 190 210 250 270 300 New York, Chicago 25 40 50 85 120 150 175 185 225 240 270 San Francisco, Washington/Baltimore 20 30 55 85 120 140 160 190 210 230 Boston, Philadelphia, Dallas 20 50 85 120 145 165 195 210 220 Detroit, Houston 25 50 80 120 140 160 190 210 Atlanta, Minneapolis, Miami 40 75 100 115 130 160 180 Cleaveland, Phoenix, Seattle 45 70 90 120 150 170 Denver, Pittsburgh, Portland, St.Louis, Cincinnati, Indianapolis, Kansas City 60 80 110 130 150 Milwaukee, Charlotte, Orlando, Columbus, Salt Lake City 55 80 110 130 Nashville, Buffalo, Raleigh 40 70 90 Nationwide 260 540

82
SUSTAINABLE TRANSPORTAT ION ENERGY PATHWAYS
CHAPTER 3: THE HYDROGEN FUEL PATHWAY
PART 1
PROJECTED HYDROGEN COSTS TO 2030
The range and progression of delivered hydrogen costs over time is shown for selected “lighthouse” cities. Cost differences are due to phased introduction of hydrogen cars as well as to city size and density and local feedstock and energy prices.
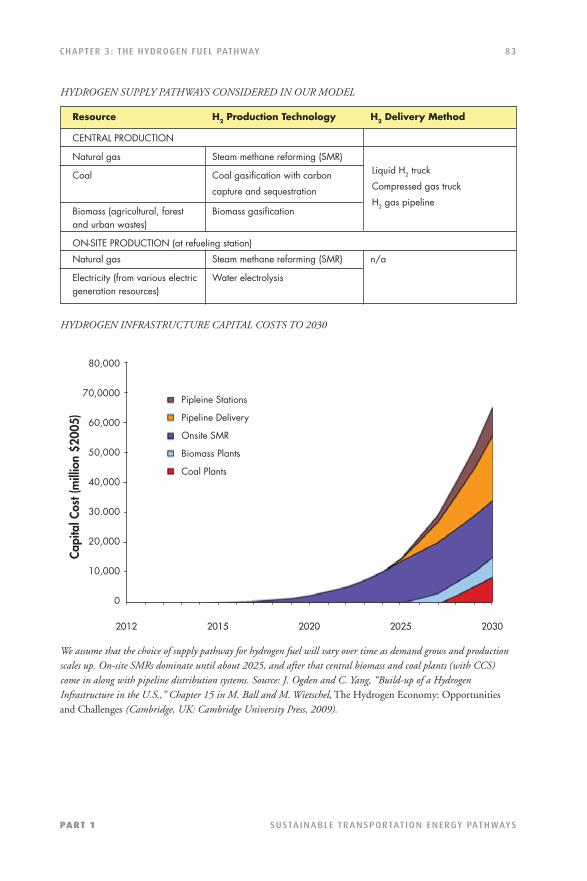
The choice of supply pathway also varies over time. At low demand, on-site steam methane reformers (SMRs) dominate because the large investments required for central production and hydrogen delivery are not yet justifi ed. As hydrogen demand in a particular city grows, it makes sense to build central production plants and delivery systems when the economies of scale associated with large production plants overcome the additional cost associated with pipeline or truck delivery. This sequence is played out in each of the 73 urban areas in the model. However, the point at which this switch from distributed to central production occurs and the least-cost central pathway differ depending upon the size of the city, level of demand, demand density, and local energy and feedstock prices. On-site SMRs dominate until about 2025, and after that central biomass and coal plants with CCS come in along with pipeline distribution systems. The switch to central plants tends to occur at a lower market penetration for larger cities because the actual hydrogen demand is larger for these cities, while on-site SMRs tend to persist longer in smaller cities.
Leve
lized
Cos
t of H
2 ($/
kWh)
Leve
lized
Cos
t of H
2 ($/
kg)
2012 2014 2016 2018 2020 2022 2024 2026 2028 2030
Hydrogen Cost in Selected Cities.024
0.22
0.20
0.18
0.16
0.14
0.12
0.10
0.08
0.06
8
7
6
5
4
3
2
Los Angeles, California New York, New York
Miami, Florida Denver, Colorado
Washington, DC Dallas, Texas
Albuquerque, New Mexico Atlanta, Georgia
83
SUSTAINABLE TRANSPORTAT ION ENERGY PATHWAYS
CHAPTER 3: THE HYDROGEN FUEL PATHWAY
PART 1
HYDROGEN SUPPLY PATHWAYS CONSIDERED IN OUR MODEL
HYDROGEN INFRASTRUCTURE CAPITAL COSTS TO 2030
We assume that the choice of supply pathway for hydrogen fuel will vary over time as demand grows and production scales up. On-site SMRs dominate until about 2025, and after that central biomass and coal plants (with CCS) come in along with pipeline distribution systems. Source: J. Ogden and C. Yang, “Build-up of a Hydrogen Infrastructure in the U.S.,” Chapter 15 in M. Ball and M. Wietschel, The Hydrogen Economy: Opportunities and Challenges (Cambridge, UK: Cambridge University Press, 2009).
Resource H2 Production Technology H2 Delivery Method
CENTRAL PRODUCTION
Natural gas Steam methane reforming (SMR)
Coal Coal gasifi cation with carbon
capture and sequestration
Biomass (agricultural, forest Biomass gasifi cation and urban wastes)
ON-SITE PRODUCTION (at refueling station)
Natural gas Steam methane reforming (SMR) n/a
Electricity (from various electric Water electrolysis generation resources)
Capi
tal C
ost (
mill
ion
$200
5)
2012 2015 2020 2025 2030
80,000
70,0000
60,000
50,000
40,000
30.000
20,000
10,000
0
Pipleine Stations
Pipeline Delivery
Onsite SMR
Biomass Plants
Coal Plants
Liquid H2 truck
Compressed gas truck
H2 gas pipeline
84
SUSTAINABLE TRANSPORTAT ION ENERGY PATHWAYS
CHAPTER 3: THE HYDROGEN FUEL PATHWAY
PART 1
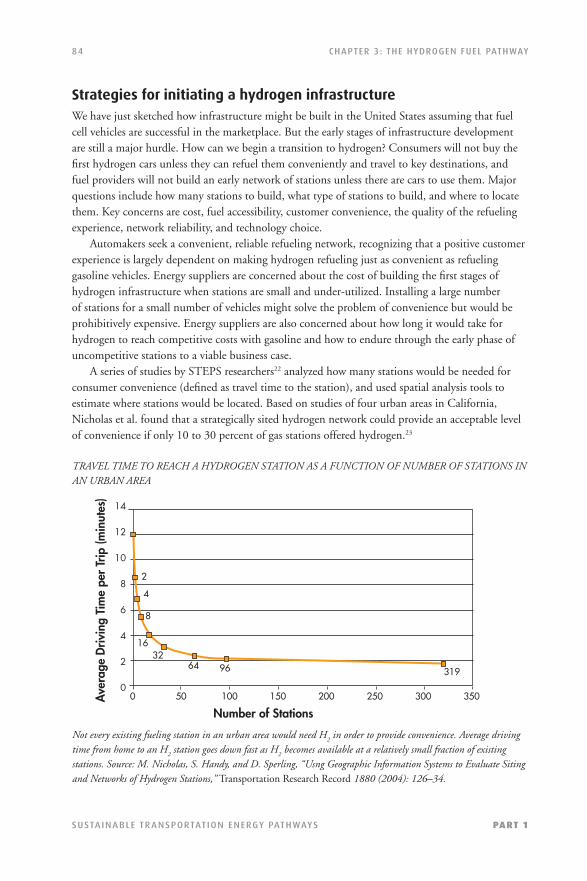
Strategies for initiating a hydrogen infrastructureWe have just sketched how infrastructure might be built in the United States assuming that fuel cell vehicles are successful in the marketplace. But the early stages of infrastructure development are still a major hurdle. How can we begin a transition to hydrogen? Consumers will not buy the fi rst hydrogen cars unless they can refuel them conveniently and travel to key destinations, and fuel providers will not build an early network of stations unless there are cars to use them. Major questions include how many stations to build, what type of stations to build, and where to locate them. Key concerns are cost, fuel accessibility, customer convenience, the quality of the refueling experience, network reliability, and technology choice. Automakers seek a convenient, reliable refueling network, recognizing that a positive customer experience is largely dependent on making hydrogen refueling just as convenient as refueling gasoline vehicles. Energy suppliers are concerned about the cost of building the fi rst stages of hydrogen infrastructure when stations are small and under-utilized. Installing a large number of stations for a small number of vehicles might solve the problem of convenience but would be prohibitively expensive. Energy suppliers are also concerned about how long it would take for hydrogen to reach competitive costs with gasoline and how to endure through the early phase of uncompetitive stations to a viable business case. A series of studies by STEPS researchers22 analyzed how many stations would be needed for consumer convenience (defi ned as travel time to the station), and used spatial analysis tools to estimate where stations would be located. Based on studies of four urban areas in California, Nicholas et al. found that a strategically sited hydrogen network could provide an acceptable level of convenience if only 10 to 30 percent of gas stations offered hydrogen.23
TRAVEL TIME TO REACH A HYDROGEN STATION AS A FUNCTION OF NUMBER OF STATIONS IN AN URBAN AREA
Not every existing fueling station in an urban area would need H2 in order to provide convenience. Average driving
time from home to an H2 station goes down fast as H
2 becomes available at a relatively small fraction of existing
stations. Source: M. Nicholas, S. Handy, and D. Sperling, “Usng Geographic Information Systems to Evaluate Siting and Networks of Hydrogen Stations,” Transportation Research Record 1880 (2004): 126–34.
Ave
rage
Driv
ing
Tim
e pe
r Tr
ip (m
inut
es)
0 50 100 150 200 250 300 350
14
12
10
8
6
4
2
0
Number of Stations
319966432
16
8
4
2

85
SUSTAINABLE TRANSPORTAT ION ENERGY PATHWAYS
CHAPTER 3: THE HYDROGEN FUEL PATHWAY
PART 1
Later we explored a “cluster strategy” for introducing hydrogen vehicles and refueling infrastructure in southern California over the decade from 2010 to 2020 to satisfy California’s zero-emission vehicle regulation. Clustering refers to coordinated introduction of hydrogen vehicles and refueling infrastructure in a few focused geographic areas such as smaller cities (like Santa Monica and Irvine) within a larger region (for instance, the Los Angeles Basin). We analyzed several transition scenarios for introducing hundreds to tens of thousands of vehicles and 8 to 40 stations, considering station placement, convenience of the refueling network (for both local—home to station—and regional travel), type of hydrogen supply, and economics (capital and operating costs of stations, hydrogen cost). A cluster strategy provides good convenience and reliability with a small number of strategically placed stations, reducing infrastructure costs. (Clustering enables the average FCV driver to reach a hydrogen station in about 4 minutes, even with a sparse network of 16 stations. In rollout plans without clustering the average travel time for a 16-station network was 16 minutes.24) A cash fl ow analysis estimates infrastructure investments of $120–170 million might be needed to build a network of 42 stations serving the fi rst 25,000 vehicles. As more vehicles are introduced, the network expands, larger stations are built, and the cost of hydrogen becomes competitive on a cents-per-mile basis with gasoline.
STRATEGIES FOR EARLY H2 INFRASTRUCTURE
Clustering is a good strategy for early H2 infrastructure. Here is one plan for H
2 station build-out in southern
California. Source: M. A. Nicholas and J. M. Ogden, “An Analysis of Near-Term Hydrogen Vehicle Rollout Scenarios for Southern California,” UCD-ITS-RR-10-03 (Institute of Transportation Studies, University of California, Davis, 2010).
636 FCVs 3442 FCVs 25,000 FCVs
#Stations 8 20 42
#clusters 4 (2sta/cluster) 6 (3 sta/cluster) 12 (3 sta/cluster
Connect.sta 0 2 6
Station Mix 4 Portable refuelers 8 Portable Refuelers 10 Portable Refuelers
4 SMRs (100 kg/d 12 SMRs (250 kg/d) 12 SMRs (250 kg/d)
20 SMRs (1000 kg/d)
New Equip. 4 Portable refuelers 4 Portable Refuelers 2 Portable Refuelers
Added 4 SMRs (100 kg/d 12 SMRs (250 kg/d) 20 SMRs (250 kg/d)
Capital Cost $20 million $52 million $98 million
O&M Cost 3-5 $million/y 11-14 $million/y 30-40 $million/y
H2 Cost $/kg 77 37 13
Ave travel time 3.9 minutes 2.9 minutes 2.6 minutes
Diversion time 5.6 minutes 4.5 minutes 3.6 minutes
2009-2011 2012-2014 2015-2017

86
SUSTAINABLE TRANSPORTAT ION ENERGY PATHWAYS
CHAPTER 3: THE HYDROGEN FUEL PATHWAY
PART 1
HOME REFUELING STRATEGIES FOR HYDROGEN VEHICLES
In contrast to the early infrastructure build-out strategies discussed above—which rely
on a network of public stations, whose high cost and low utilization are discouraging to
private investment—we have also explored the use of home and neighborhood refueling
strategies as paths toward commercializing FCVs. In particular, we have assessed “tri-
generation” systems, which are energy systems designed to meet the three energy needs
of a typical household—electricity, heat, and transportation fuel. Current tri-generation
technologies produce hydrogen by reforming natural gas. The economics of hydrogen
refueling can be improved by co-producing electricity and heat. Home and neighborhood
refueling both potentially offer convenience along with early availability of hydrogen fuel
with less investment than a dedicated hydrogen station network.25
We developed an interdisciplinary framework and an engineering-economic model
to evaluate the economic and environmental performance of tri-generation systems
for home and neighborhood refueling. Based on near-term projections for system cost
and performance, our model shows that residential tri-generation systems can become
economically competitive, especially in regions with low natural gas prices and high
electricity prices. In future work, we will examine neighborhood refueling concepts and
tri-generation systems based on electrolyzers.
A typical tri-generation system simultaneously provides home electricity and heat along with hydrogen for a vehicle.
fuel reformer
water gasshift
purifi er
compressor
storage
FC
cogenerationsystem
energyfl ow
H2
Building
NG Pipe
electricity grid
vehicleH2
NG
(Wout,Qout)
<=5 kWelec, hot water

87
SUSTAINABLE TRANSPORTAT ION ENERGY PATHWAYS
CHAPTER 3: THE HYDROGEN FUEL PATHWAY
PART 1
Regional hydrogen supply case studiesThere are many options for hydrogen supply, and the lowest-cost design could vary by region. In this regard, hydrogen is more like electricity (which relies on regional primary energy sources) than like gasoline. To better understand the diversity of possible solutions for hydrogen supply in the United States, STEPS researchers have pioneered the use of engineering-economic models coupled with spatial information (GIS data) and optimization techniques. These models provide insight into the design, cost, and extent of regional hydrogen infrastructure. Unlike the SSCHISM model, which examines infrastructure for individual cities, these models let us evaluate whether economies of scale (and lower costs) can be achieved more quickly when infrastructure is designed for large regions encompassing multiple cities. Coal with carbon capture and sequestration has been identifi ed as one of the lowest-cost low-carbon, long-term hydrogen supply pathways.26 To examine the regional deployment of centralized coal-based hydrogen infrastructure in the United States, we used regional spatial data to estimate the location and magnitude of demand and to identify potential locations for H
2 production
facilities, CO2 storage sites, and distribution networks for both H
2 and CO
2. We also used a
network optimization tool to identify the lowest-cost infrastructure design for meeting demand at several market penetration levels. We evaluated both steady-state and dynamic deployment scenarios.27
In the steady-state scenarios, infrastructure is optimized independently for demand at different FCV market penetration levels ranging from 5 percent to 75 percent. Each design is independent of the others and represents a snapshot in time. A steady-state analysis for the state of Ohio, for example, indicates that a regional perspective lowers the levelized cost of hydrogen relative to models that examine individual cities.28
HYDROGEN INFRASTRUCTURE DESIGNS FOR OHIO BASED ON COAL WITH CCS
Our steady-state analysis for the state of Ohio came up with these optimal infrastructure designs at 5 percent, 25 percent, and 75 percent market penetration by FCVs. Source: N. Johnson, C. Yang, and J. Ogden, “A GIS-based Assessment of Coal-Based Hydrogen Infrastructure Deployment in the State of Ohio,” International Journal of Hydrogen Energy 33 (2008): 5287–303.
a) 5% b) 25% c) 75%
Pipeline Interstate Coal Plant Intercity Station Sequestration Site Demand center

88
SUSTAINABLE TRANSPORTAT ION ENERGY PATHWAYS
CHAPTER 3: THE HYDROGEN FUEL PATHWAY
PART 1
Modeling infrastructure deployment at the regional level allows for demand to be aggregated and economies of scale in production and distribution to be achieved at lower market penetration levels. At this level, pipeline delivery costs less than truck delivery, with the levelized cost of hydrogen delivered via pipeline ranging from $3.20/kg at 5-percent market penetration to $2.20/kg at 75-percent market penetration. However, the steady-state analysis assumes that the infrastructure is fully utilized and consequently does not account for the underutilization of capital that would occur during a transition. For this reason, steady-state models tend to underestimate the cost of hydrogen. To address this issue, we conducted dynamic modeling of infrastructure deployment in which infrastructure is built over time to meet a growing demand and the timing of investments is tracked. This model accounts for underutilization of capital as large infrastructure investments are made to meet anticipated demand levels. For hydrogen infrastructure with pipeline distribution in Ohio, the levelized cost of hydrogen ranges from $4.30/kg at 5-percent market penetration to $2.70/kg at 75-percent market penetration. These costs represent a 20-percent to 35-percent increase in the cost of hydrogen compared with the results of the steady-state model. We conducted similar dynamic modeling for California in which hydrogen infrastructure deployment with pipeline and liquid H
2 truck distribution was compared over a 30-year
planning period.29 This study found that truck distribution is competitive with pipelines in the fi rst ten years (1-percent to 14-percent market penetration) since truck transport is less capital-intensive than pipelines and thus is impacted less by underutilization of capital. However, once the infrastructure becomes well utilized in later time periods, pipelines achieve better economies of scale since this mode is dominated by annual operating costs (for example, electricity for H
2
liquefaction and diesel for trucks). CCS represents a very small portion of the total infrastructure costs (less than 3 percent).
COSTS FOR HYDROGEN DELIVERY IN CALIFORNIA BASED ON COAL WITH CCS
Our dynamic modeling for California came up with these levelized costs for hydrogen delivered via pipeline and truck over a 30-year planning period.
$5.00
$4.00
$3.00
$2.00
$1.00
$4.70
$4.34
$3.12
$3.71
$2.53
$3.33
PIPE TRUCK PIPE TRUCK PIPE TRUCK
CO2 SequestrationRefueling StationsH2 TerminalH2 TrucksH2 City DistributionH2 TransmissionH2 LiquifactionH2 StorageH2 Production
Year 1-10 Year 11-20 Year 21-30
89
SUSTAINABLE TRANSPORTAT ION ENERGY PATHWAYS
CHAPTER 3: THE HYDROGEN FUEL PATHWAY
PART 1
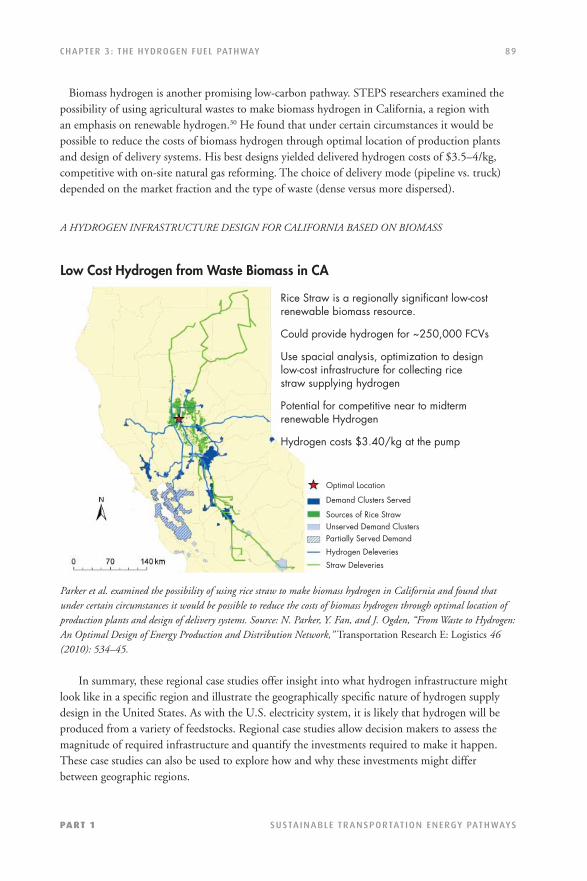
Biomass hydrogen is another promising low-carbon pathway. STEPS researchers examined the possibility of using agricultural wastes to make biomass hydrogen in California, a region with an emphasis on renewable hydrogen.30 He found that under certain circumstances it would be possible to reduce the costs of biomass hydrogen through optimal location of production plants and design of delivery systems. His best designs yielded delivered hydrogen costs of $3.5–4/kg, competitive with on-site natural gas reforming. The choice of delivery mode (pipeline vs. truck) depended on the market fraction and the type of waste (dense versus more dispersed).
A HYDROGEN INFRASTRUCTURE DESIGN FOR CALIFORNIA BASED ON BIOMASS
Parker et al. examined the possibility of using rice straw to make biomass hydrogen in California and found that under certain circumstances it would be possible to reduce the costs of biomass hydrogen through optimal location of production plants and design of delivery systems. Source: N. Parker, Y. Fan, and J. Ogden, “From Waste to Hydrogen: An Optimal Design of Energy Production and Distribution Network,” Transportation Research E: Logistics 46 (2010): 534–45.
In summary, these regional case studies offer insight into what hydrogen infrastructure might look like in a specifi c region and illustrate the geographically specifi c nature of hydrogen supply design in the United States. As with the U.S. electricity system, it is likely that hydrogen will be produced from a variety of feedstocks. Regional case studies allow decision makers to assess the magnitude of required infrastructure and quantify the investments required to make it happen. These case studies can also be used to explore how and why these investments might differ between geographic regions.
Low Cost Hydrogen from Waste Biomass in CA
Rice Straw is a regionally signifi cant low-cost renewable biomass resource.
Could provide hydrogen for ~250,000 FCVs
Use spacial analysis, optimization to design low-cost infrastructure for collecting rice straw supplying hydrogen
Potential for competitive near to midtermrenewable Hydrogen
Hydrogen costs $3.40/kg at the pump
Optimal Location
Demand Clusters Served
Sources of Rice StrawUnserved Demand ClustersPartially Served Demand
Hydrogen Deleveries
Straw Deleveries
90
SUSTAINABLE TRANSPORTAT ION ENERGY PATHWAYS
CHAPTER 3: THE HYDROGEN FUEL PATHWAY
PART 1
Policies and Business Strategies Needed to Support Hydrogen
The results presented in this chapter (and in Chapter 9), as well as those of several recent studies,31 indicate that the costs to buy down FCVs to market-clearing levels (through technological learning and mass production) and build the associated infrastructure might be tens of billions of dollars, spent over the course of one to two decades. The majority of the cost will be associated with early FCVs, and a lesser amount with early infrastructure. It is almost certain that government policy will be needed to bring these technologies to cost-competitive levels. How might policy and business strategy support the future of hydrogen in the energy system? Since the start of the 21st century, the vision of hydrogen-fueled transportation has received attention from policymakers and industry worldwide, with investments of billions of dollars in public and private funds.32 Eighteen countries have national programs to develop hydrogen energy; in North America, more than 30 U.S. states and several Canadian provinces have announced regional “roadmaps” or “hydrogen highways.”33 Automakers and energy companies like Shell and Total are working with governments to introduce the fi rst fl eets of hydrogen vehicles and refueling mini-networks in Europe (notably Germany and Norway), Japan, Korea, and the United States (notably California, Hawaii and New York34). However, while there is a growing imperative for alternative fuels driven by concerns about oil supply, rising fuel costs, and climate change, and the search by politicians for a quick technical fi x, the context for considering future alternative fuels is dynamic and uncertain. In the early 2000s, hydrogen and fuel cells were widely seen as the endgame. Over the past few years, though, it has become apparent that hydrogen infrastructure will take more time to develop and implement than was previously assumed. Meanwhile, technical progress continues in a variety of other alternative-fuel and effi cient-vehicle technologies that are nearer term and/or more compatible with the existing energy system, especially liquid biofuels and plug-in hybrid electric vehicles. Still hydrogen fuel cell vehicles are moving forward rapidly, and several automakers plan to commercialize hydrogen fuel cell vehicles around 2015, just a few years after battery cars, which are making their initial appearance now. Hydrogen and fuel cells are part of a technical progression, building on effi ciency and increasing electrifi cation of cars that encompasses hybrid electric drive trains, plug-in hybrids, and improved batteries. Hydrogen should be seen as one aspect of a broad move toward lower-carbon energy. To realize hydrogen’s full benefi ts will require making hydrogen from domestic and widely available zero-carbon or decarbonized primary energy supplies. Hydrogen can benefi t from ongoing efforts to develop biomass and coal gasifi cation with carbon sequestration for electric power, as well as renewable energy sources such as wind and solar. Finally, public policy is needed to move toward a goal of zero-emission, low-carbon transportation with diversifi cation away from oil-derived transportation fuels. This calls for a comprehensive strategy, based on developing and encouraging the use of clean, effi cient internal combustion engine vehicles in the near term, coupled with a long-term strategy supporting the introduction and scale-up of advanced transportation technologies including hydrogen and fuel cells, advanced batteries, and biofuels.

91
SUSTAINABLE TRANSPORTAT ION ENERGY PATHWAYS
CHAPTER 3: THE HYDROGEN FUEL PATHWAY
PART 1
Summary and Conclusions
• Hydrogen fuel cell vehicles are making rapid progress; it appears likely that they will meet their technical and cost goals and could be commercially ready by 2015. Hydrogen infrastructure technologies are also progressing, and the technology to produce natural-gas-based hydrogen is commercial today. In the near term (up to 2025), hydrogen fuel will likely be produced from natural gas, via distributed production at refueling stations, or, where available, excess industrial or refi nery hydrogen. Beyond 2025, central production plants with pipeline delivery will become economically viable in urban areas and regionally, and low carbon hydrogen sources such as renewables and fossil with CCS will be phased in.
• The environmental impacts of hydrogen fuel vary with the production pathway. For the near term, FCVs using hydrogen made from natural gas would reduce well-to-wheels GHG emissions by about half compared to current gasoline vehicles. Future hydrogen production technologies could virtually eliminate GHG emissions. On the other hand, important constraints on use of land, water, and materials required by the hydrogen pathway are not well understood. This is a key area for future work under the STEPS program.
• Building a hydrogen infrastructure will be a decades-long process in concert with growing vehicle markets. We have modeled infrastructure deployment in individual “lighthouse” cities as well as at the regional level. Since it is likely that hydrogen will be produced from a variety of feedstocks, optimal supply strategies will differ between geographic regions.
• When FCVs are mass marketed and sold to consumers in 2015 or soon after, hydrogen must make a major leap to a commercial fuel available initially at a small network of refueling stations and must be offered at a competitive price. The fi rst steps are providing hydrogen to test fl eets and demonstrating refueling technologies in mini-networks. Several such projects are now underway in Germany, Japan, and North Anerica. Learning from these programs will include development of safety codes and standards. If strategically placed, these early sparse networks could provide good fuel accessibility for early users, while forming a seedbed for a large scale hydrogen infrastructure rollout after 2015.
• Getting through the transition to hydrogen will involve signifi cant costs and some technological and investment risks. Concentrating hydrogen projects in key regions like southern California will focus efforts, lower investment costs to make refueling available to consumers, and hasten infrastructure cost reductions through faster market growth and economies of scale.
• Even under optimistic assumptions, it will be several decades before FCV technologies can signifi cantly reduce emissions and oil use globally, because of the time needed for new vehicle technology to gain major fl eet share. Beyond this, hydrogen can yield signifi cant benefi ts, greater than those possible with effi ciency alone. This underscores the importance of providing consistent support for hydrogen and fuel cell vehicle technologies as they approach commercial introduction, so they can progress more quickly to scale, yielding competitive costs and greater societal benefi ts.

92
SUSTAINABLE TRANSPORTAT ION ENERGY PATHWAYS
CHAPTER 3: THE HYDROGEN FUEL PATHWAY
PART 1
Notes1. K. Wipke, D. Anton, S. Sprik,
Evaluation of Range Estimates for Toyota FCHV -adv Under Open Road Driving
Conditions, Savannah River National Laboratory Report, SRNS -STI -2009 -00446, August 10, 2009, available
from: http://www.cleancaroptions.com/Toyota_431_mile_range.pdf
2. See National Research Council, National Academy of Engineering, Committee on Alternatives and Strategies for Future
Hydrogen Production and Use, The Hydrogen Economy: Opportunities, Costs, Barriers, and R&D Needs (Washington,
DC: National Academies Press, 2004), available from http://www.nap.edu/catalog.php?record_id=10922; National
Research Council, Committee on Assessment of Resource Needs for Fuel Cell and Hydrogen Technologies, Transitions to
Alternative Transportation Technologies: A Focus on Hydrogen (Washington, DC: National Academies Press, 2008), available
from http://www.nap.edu/catalog.php?record_id=12222; D. Gielen and G. Simbolotti, Prospects for Hydrogen and Fuel
Cells (Paris, France: OECD/IEA, International Energy Agency Publications, 2005); M. Ball and M. Wietschel, The
Hydrogen Economy: Opportunities and Challenges (Cambridge, UK: Cambridge University Press, 2009); A. Rousseau and
P. Sharer, “Comparing Apples to Apples: Well-to-Wheel Analysis of Current ICE and Fuel Cell Vehicle Technologies,”
2004-01-1015 (Argonne National Laboratory, 2004); M. A. Weiss, J. B. Heywood, A. Schafer, and V. K. Natarajan,
“Comparative Assessment of Fuel Cell Cars,” MIT LFEE 2003-001 RP (MIT Laboratory for Energy and the
Environment, 2003); M. A. Kromer and J. B. Heywood, Electric Powertrains: Opportunities and Challenges in the U.S.
Light-Duty Vehicle Fleet, LEFF 2007-02 RP (Sloan Automotive Laboratory, MIT Laboratory for Energy and the
Environment, May 2007), http://web.mit.edu/sloan-auto-lab/research/beforeh2/fi les/kromer_electric_powertrains.pdf; A.
Bandivadekar, K. Bodek, L. Cheah, C. Evans, T. Groode, J. Heywood, E. Kasseris, M. Kromer, and M. Weiss, On the
Road in 2035: Reducing Transportation’s Petroleum Consumption and GHG Emissions (MIT Laboratory for Energy and
the Environment, 2008); S. Plotkin and M. Singh, “Multi-Path Transportation Futures Study: Vehicle Characterization
and Scenario Analyses (DRAFT)” (Argonne National Laboratory, June 24, 2009); EUCAR (European Council for
Automotive Research and Development), CONCAWE, and ECJRC (European Commission Joint Research Centre),
Well-to-Wheels Analysis of Future Automotive Fuels and Powertrains in the European Context, Well-to-Wheels Report, Version
2c, March 2007, available at http://ies.jrc.ec.europa.eu/our-activities/support-for-eu-policies/well-to-wheels-analysis/
WTW.html.
3. For statements from automakers about their HFCV commercialization timelines, see http://www.fuelcells.org/automaker_
quotes.pdf. See also the 2009 USCAR (United States Council for Automotive Research) white paper “Hydrogen Research
for Transportation: The USCAR Perspective,” available at http://www.uscar.org/guest/article_view.php?articles_id=312.
4. M. A. Weiss, J. B. Heywood, A. Schafer, and V. K. Natarajan, “Comparative Assessment of Fuel Cell Cars,” MIT
LFEE 2003-001 RP (MIT Laboratory for Energy and the Environment, 2003); M. A. Kromer and J. B. Heywood,
Electric Powertrains: Opportunities and Challenges in the U.S. Light-Duty Vehicle Fleet, LEFF 2007-02 RP (Sloan Automotive
Laboratory, MIT Laboratory for Energy and the Environment, May 2007), http://web.mit.edu/sloan-auto-lab/research/
beforeh2/fi les/kromer_electric_powertrains.pdf.
5. Kromer and Heywood, Electric Powertrains.
6. K. Wipke, S. Sprik, J. Kurtz, and T. Ramsden, “Controlled Hydrogen Fleet and Infrastructure Analysis,” 2010 DOE
Annual Merit Review and Peer Evaluation Meeting, Washington, DC, June 10, 2010,
http://www.nrel.gov/hydrogen/pdfs/tv001_wipke_2010_o_an8.pdf.
7. D. Papageorgopoulos, “Fuel Cells,” 2010 Annual Merit Review and Peer Evaluation Meeting, Washington, DC, June 8,
2010, http://www.hydrogen.energy.gov/pdfs/review10/fc00a_papageorgopoulos_2010_o_web.pdf.
8. S. Satyapal Hydrogen Fuel Cells Program Overview2011 Annual Merit Review and Peer Evaluation Meeting May 9, 2011.
available at: http://www.hydrogen.energy.gov/pdfs/review11/pl003_satyapal_joint_plenary_2011_o.pdf
9. Wipke et al., “Controlled Hydrogen Fleet and Infrastructure Analysis.”
10. N. Stetson, “Hydrogen Storage, 2010 Annual Merit Review and Peer Evaluation Meeting (8 June 2010) available at:
http://www.hydrogen.energy.gov/pdfs/review10/st00a_stetson_2010_o_web.pdf.
11. National Research Council, Transitions to Alternative Transportation Technologies.
12. Kromer and Heywood, Electric Powertrains; National Research Council, Transitions to Alternative Transportation Technologies.
13. National Research Council, Committee on Assessment of Resource Needs for Fuel Cell and Hydrogen Technologies,
Transitions to Alternative Transportation Technologies: A Focus on Hydrogen (Washington, DC: National Academies
Press, 2008), available from http://www.nap.edu/catalog.php?record_id=12222.
14. Ibid.

93
SUSTAINABLE TRANSPORTAT ION ENERGY PATHWAYS
CHAPTER 3: THE HYDROGEN FUEL PATHWAY
PART 1
15. For comparison see hydrogen cost estimates from the U.S. Department of Energy, http://www.hydrogen.energy.gov/pdfs/
progress10/vii_10_ruth.pdf.
16. Adapted from C. Yang, “Hydrogen and Electricity: Parallels, Interactions, and Convergence,” International Journal of
Hydrogen Energy 33 (2008): 1977–94.
17. G. Wang, J. Ogden, and D. Sperling, “Comparing Air Quality Impacts of Hydrogen and Gasoline,” Transportation
Research Part D: Transport and Environment 13 (2008): 436–48.
18. Y. Sun, J. Ogden, and M. Delucchi, “Societal Life-cycle Buy-down Cost of Hydrogen Fuel Cell Vehicles,” accepted for
publication in the International Journal of Hydrogen Energy, 2010.
19. C. W. King and M. E. Webber, “Water Use and Transportation,” Environmental Science and Technology 42 (2008):
7866–872.
20. M. Mintz, “Hydrogen Delivery Infrastructure Analysis,” U.S. Department of Energy Hydrogen Program FY 2008 Annual
Progress Report, 368–71; J. Schindler, “E3 Database—A Tool for the Evaluation of Hydrogen Chains,” L-B-Systemtechnik
GmbH Ottobrunn, presentation at the IEA Workshop, March 22, 2005; C. Yang and J. Ogden, “U.S. Urban Hydrogen
Infrastructure Costs Using the Steady State City Hydrogen Infrastructure System Model (SSCHISM),” presented at the
2007 National Hydrogen Association Meeting, San Antonio, TX, March 18–22, 2007; C. Yang and J. Ogden,
“Determining the Lowest-cost Hydrogen Delivery Mode,” International Journal of Hydrogen Energy 32 (2007): 268–86; B.
D. James and J. Perez, “Hydrogen Infrastructure Pathways Analysis Using HYPRO,” poster presented at the NHA
Meeting, San Antonio, TX, March 18–22, 2007; D. L. Greene, P. N. Leiby, B. James, J. Perez, M. Melendez, A.
Milbrandt, S. Unnasch, M. Hooks, “Analysis of the Transition to Hydrogen Fuel Cell Vehicles and the Potential Hydrogen
Energy Infrastructure Requirements,” ORNL/TM-2008/30 (Oak Ridge National Laboratory, March 2008),
http://www-cta.ornl.gov/cta/publications/reports/ornl_tm_2008_30.pdf.
21. C. Yang and J. Ogden, “U.S. Urban Hydrogen Infrastructure Costs Using the Steady State City Hydrogen Infrastructure
System Model (SSCHISM),” presented at the 2007 National Hydrogen Association Meeting, San Antonio, TX, March
18–22, 2007. A beta copy of the model is posted on Christopher Yang’s website at UC Davis Institute of Transportation
Studies, available at www.its.ucdavis.edu/people.
22. M. Nicholas, S. Handy, and D. Sperling, “Using Geographic Information Systems to Evaluate Siting and Networks
of Hydrogen Stations,” Transportation Research Record 1880 (2004), 126–34; M. A. Nicholas and J. M. Ogden,
“Detailed Analysis of Urban Station Siting for California Hydrogen Highway Network,” Transportation Research Record
1983 (2007): 121–28; M. Nicholas, “The Importance of Interregional Refueling Availability to the Purchase Decision,”
UCD-ITS-WP-09-01 (Institute of Transportation Studies, University of California, Davis, 2009), http://pubs.its.ucdavis.
edu/publication_detail.php?id=1269; M. Nicholas, “Driving Demand: What Can Gasoline Refueling Patterns Tell Us
About Planning an Alternative Fuel Network?” Journal of Transport Geography, in press, 2010; M. A. Nicholas and J.
M. Ogden, “An Analysis of Near-Term Hydrogen Vehicle Rollout Scenarios for Southern California,” UCD-ITS-
RR-10-03 (Institute of Transportation Studies, University of California, Davis, 2010).
23. Nicholas, Handy, and Sperling, “Using Geographic Information Systems to Evaluate Siting and Networks of Hydrogen
Stations”; Nicholas and Ogden, “Detailed Analysis of Urban Station Siting for California Hydrogen Highway Network.”
24. Ibid.
25. X. Li and J. Ogden, “Understanding the Design and Economics of Distributed Tri-generation Systems for Home and
Neighborhood Refueling,” presented at the 2010 National Hydrogen Association Meeting, Long Beach, CA, May 3–6,
2010; X. Li, J. Ogden, and K. Kurani, “An Overview of Automotive Home and Neighborhood Refueling,” Proceedings of
the 24th Electric Vehicle Symposium, Stavanger, Norway, May 13–16, 2009.
26. National Research Council, The Hydrogen Economy; National Research Council, Transitions to Alternative Transportation
Technologies.
27. N. Johnson and J. Ogden, “Moving Towards a National Assessment of Coal-Based Hydrogen Infrastructure Deployment
with Carbon Capture and Sequestration,” presented at the Seventh Annual Conference on Carbon Capture and
Sequestration, Pittsburgh, PA, May 5–8, 2008; N. Johnson, C. Yang, and J. Ogden, “Build-Out Scenarios for
Implementing a Regional Hydrogen Infrastructure,” presented to the National Hydrogen Association, Long Beach,
CA, March 11–16, 2006; N. Johnson, C. Yang, and J. Ogden, “A Blueprint for the Long-Term Deployment of Hydrogen
Infrastructure in California,” presented to the National Hydrogen Association, Sacramento, CA, March 30–April 4,
2008; N. Johnson, C. Yang, and J. Ogden, “A GIS-Based Assessment of Coal-Based Hydrogen Infrastructure Deployment
in the State of Ohio,” International Journal of Hydrogen Energy 33 (2008): 5287–303; N. Johnson, C. Yang, and J. Ogden,
“A Regional Model of Coal-Based Hydrogen Infrastructure Deployment with Carbon Capture and Storage (CCS),”
presented at the Pittsburgh Coal Conference, Pittsburgh, PA, September 29–October 2, 2008.

94
SUSTAINABLE TRANSPORTAT ION ENERGY PATHWAYS
CHAPTER 3: THE HYDROGEN FUEL PATHWAY
PART 1
28. Johnson, Yang, and Ogden, “GIS-based Assessment of Coal-Based Hydrogen Infrastructure Deployment.”
29. Ibid.
30. N. Parker, Y. Fan, and J. Ogden, “From Waste to Hydrogen: An Optimal Design of Energy Production and Distribution
Network,” Transportation Research Part E: Logistics 46 (2010): 534–45.
31. D. Greene, P. Leiby, and D. Bowman, Integrated Analysis of Market Transformation Scenarios with HyTrans, ORNL/TM-
2007/094 (Oak Ridge National Laboratory, June 2007); S. Gronich, “Hydrogen and FCV Implementation Scenarios,
2010–2025,” U.S. DOE Hydrogen Transition Analysis Workshop, Washington, DC, August 9–10, 2006,
http://www1.eere.energy.gov/hydrogenandfuelcells/analysis/scenario_analysis_mtg.html; Z. Lin, C.-W. Chen, J. Ogden,
and Y. Fan, “The Least-Cost Hydrogen for Southern California,” International Journal of Hydrogen Energy 33 (2008):
3009–3014; Gielen and Simbolotti, Prospects for Hydrogen and Fuel Cells.
32. See National Research Council, Committee on Assessment of Resource Needs for Fuel Cell and Hydrogen Technologies,
Transitions to Alternative Transportation Technologies: A Focus on Hydrogen (Washington, DC: National Academies Press,
2008), available from http://www.nap.edu/catalog.php?record_id=12222. This report estimates a current RD&D funding
level for hydrogen and fuel cells in the U.S. private sector of about $700 million per year. Globally, the total is several times
this amount.
33. See the International Partnership for Hydrogen and Fuel Cells in the Economy, http://www.iphe.net, and State Activities
That Promote Fuel Cells and Hydrogen Infrastructure Development (Washington, DC: Breakthrough Technologies Institute,
2006), http://www.fuelcells.org/info/StateActivity.pdf.
34. See these documents from the California Fuel Cell Partnership: “Hydrogen Fuel Cell Vehicle and Station Deployment
Plan, Action Plan” (February 2009), available at http://www.cafcp.org/sites/fi les/Action%20Plan%20FINAL.pdf, and
“Hydrogen Fuel Cell Vehicle and Station Deployment Plan, Progress and Next Steps” (April 2010), available at
http://www.cafcp.org/sites/fi les/FINALProgressReport.pdf.