sustainable strategy for corporate governance based on the
TRANSCRIPT

RESEARCH Open Access
Sustainable strategy for corporategovernance based on the sentimentanalysis of financial reports with CSRYuan Song, Hongwei Wang* and Maoran Zhu
* Correspondence: [email protected] of Economics andManagement, Tongji University,Shanghai 200092, China
Abstract
Focusing only on shareholders’ financial return is not consistent with the concept ofsustainable corporate governance. In contrast to financial performance, corporatesocial responsibility (CSR) is a non-financial performance index. Financial reportsconsist of both financial and non-financial disclosures. These disclosures helpinvestors make decisions. This paper characterizes the interaction between thesentiment analysis of financial reports and CSR scores. The classification accuracythrough SVM exceeds 86%. The empirical study shows that the financial reportsentiment based on the PESTEL model, Porter’s Five Forces model, and Value Chain(Primary and Support Activities) significantly correlates to the CSR score.
Keywords: Financial report, CSR score, Sentiment analysis, Object library
BackgroundLawlor (2001) warned that even if an organization is “as pure as the driven snow in its
own operations, it should expect public scrutiny of the practices of suppliers and asso-
ciates”. Bad news about companies such as Nike, GAP, Reebok, and Hennes & Mauritz
(H&M) attracted negative media attention in the late 1990s. In 2012, Apple became a
high-profile target for non-government organizations concerned about working condi-
tions in multinational supply chains. These concerns were related to the China-based
Foxconn organization, where the vast majority of its 1.2 million employees were in-
volved in assembling Apple products (according to Reuter’s reports). At the request of
250,000 petitioners, Apple was persuaded to ask the Fair Labor Association to investi-
gate the working conditions at the Foxconn factory in China. Walmart was heavily crit-
icized for its workplace practices in the US. In 2012, the National Employment Law
Project (NELP) published the “Chain of Greed” report (Cho et al., 2012) about Wal-
mart’s worker exploitation in the US. Some responsibility for the conditions of the
poorly paid garment makers in Bangladesh has also been placed on the western
retailers who sold the garments made by these oppressed workers after the collapse of
the Rana Plaza building caused international outrage.
Since the Global Financial Crisis (GFC), and amid a lingering recession that has
intensified pressure from shareholders, companies are devising new corporate social
responsibility (CSR) models that are more aligned with their core business goals and
Financial Innovation
© The Author(s). 2018 Open Access This article is distributed under the terms of the Creative Commons Attribution 4.0 InternationalLicense (http://creativecommons.org/licenses/by/4.0/), which permits unrestricted use, distribution, and reproduction in any medium,provided you give appropriate credit to the original author(s) and the source, provide a link to the Creative Commons license, andindicate if changes were made.
Song et al. Financial Innovation (2018) 4:2 https://doi.org/10.1186/s40854-018-0086-0
services. For example, blue-chip companies, such as Visa and Unilever, are creating
new markets in the developing world by closely aligning social causes with their over-
arching corporate strategies. CSR has a strong role to play in the provision of informa-
tion for risk management purposes. The Carbon Disclosure Project (CDP) was formed
in 2000. Based in New York and London, the CDP focuses on the implications of cli-
mate change for shareholder value and commercial operations. CDP believes that car-
bon emissions and climate change represent significant business risks and, therefore,
an organization’s policies and performance in relation to climate change should be fac-
tored into investment decisions. The decision to report information (whether it be CSR
or financial information) is the concept of “accountability”. It is defined as the duty to
provide a report, or an account, of the actions and decisions made about those areas of
activity for which an organization is deemed to be responsible. The Commission of
European Communities (CEC) states that CSR is “a concept whereby companies inte-
grate social and environmental concerns in their business operations and in their inter-
action with their stakeholders on a voluntary basis. Being socially responsible means
not only fulfilling legal expectations, but also going beyond compliance and investing
more into human capital, the environment, and the relations with stakeholders” (CEC
2001) , p. 6. The above definition is also consistent with the definition of CSR provided
by the World Business Council on Sustainable Development: “The commitment of
business to contribute to sustainable economic development, working with employees,
their families, the local community, and society at large to improve their quality of life”
(Holme & Watts, 2000), p. 10.
The 3 main pillars of sustainability include environmental, social, and economic sus-
tainability. Social and environmental performance can affect an organization’s future
reputation, brands, and its ability to attract talented staff and maintain consumer and
public support (CPA Australia, 2015a). Based on the Stakeholder Theory, corporate
governance includes both financial performance and CSR. CSR refers to a wide range
of activities that an organization undertakes, from charity donations to the manage-
ment of carbon emissions. Based on the Signaling Theory, a financial report (FR) is the
fundamental tool investors use to make decisions. It contains financial ratios as well as
textual notes. Through this textual information, investors can learn about the firm’s so-
cial responsibility. Sentiment analysis is a relatively mature technique. However, China’s
capital market is growing and Chinese is a complex language. We developed a sustain-
able strategy for corporate governance based on the sentiment analysis of Chinese fi-
nancial reports with CSR. We solved 3 main problems: (1) Identifying the subjective
object description in financial reports, (2) building an object library based on strategic
models, and (3) characterizing the interaction between the CSR score and financial re-
port sentiment categories.
Literature review
Sustainability is widely recognized as one of the most important challenges facing the
world today (Wan, Arief, & Rajagopalan, 2014). For most of the world’s largest com-
panies, reporting on non-financial information appears to be a continuing trend. The
communication of the social and environmental dimensions of a company plays a key
Song et al. Financial Innovation (2018) 4:2 Page 2 of 14
role in the sustainable development of an organization, and therefore should be investi-
gated in depth (Enrique & Michaela, 2015).
Multinational corporations play a prominent role in shaping the environmental tra-
jectory of the planet. The integration of environmental costs and benefits into corpor-
ate decision-making has an enormous, but as yet unfulfilled, potential to promote
sustainable development. Now is the time to take advantage of an explosion of sustain-
ability commitments from business leaders and expanding pressure for sustainable
practices from shareholders, financial institutions, and consumers (Kareiva, McNally, &
McCormick Steve et al., 2015). CSR initiatives are crucial for achieving part of an inclu-
sive growth vision. Organizations that are proactive rather than reactive may help
achieve a sustainable inclusive growth via various CSR initiatives (Radhakrishnan, Chit-
rao & Nagendra, 2014). Research on CSR disclosure points to an increasing lack of
completeness and decreasing amount of credibility in the information reported, as well
as concerns about overall reporting practices. The evidence supports increasing
skepticism about the use of CSR reporting practices as tools used to enhance perceived
accountability (Giovanna, Silvia, & Federica, 2015). Standalone CSR reporting by retail
companies appears to positively influence perceptions of a company’s reputation and
may lead to increased appeal for socially responsible investors (Dennis & Na, 2014).
Disclose CSR could increase transparency and non-financial accountability in capital
markets. The empirical study reveals that family ownership reduces the level of CSR
disclosure (Safaee M & M S Gerayli, 2017). Combining stakeholder theory with CSR re-
search is a historic accomplishment (Zhang, Liang, & Yin, 2012). Chinese empirical
data showed that CSR behavior is one of the key factors influencing consumers’ pur-
chasing decisions (Ma, 2011). Data from listed Chinese companies in Shanghai demon-
strated that the previous years’ CSR positively affects the current year’s corporate
financial performance (CFP), and the current year’s CFP positively affects the CSR
(Zhang, Jin, & Li, 2013). An empirical analysis showed that, assuming CSR is exogen-
ous, the current CSR plays a significant positive role in promoting the current CFP, and
vice versa (Yin, Liu, & Chen, 2014).
There is a vast amount of financial information on companies’ financial performance
available to investors in electronic form (Salahuddin & Gow, 2016; Loughran & McDo-
nald, 2011; Robert, Schumaker, & Hsinchun, 2009; Kloptchenko et al., 2004). While the
automatic analysis of financial figures is common, it has been difficult to automatically
extract information from the textual part of financial reports. The textual part contains
more information than numerical part in an annual report (Chen et al., 2012; Hobson,
Mayew, & Venkatachalam, 2012; Chan & Franklin, 2011; Feng, 2010; Feng, 2006;
Kloptchenko et al., 2004). In recent decades, and with the advent of the eXtensible
Business Reporting Language (XBRL), financial reports have experienced a great change
in terms of the unified reporting process. Nevertheless, the unstructured part of finan-
cial reports, the footnotes, remains a barrier to accurate automatic and real-time finan-
cial analysis (Heidari & Felden, 2015). Currently, the application of data mining to
auditing is at an early stage of development and researchers typically take a scatter-shot
approach to it, investigating patterns in financial statement disclosures, text in annual
reports and MD&As, and journal entries without the appropriate guidance, such as the
lessons drawn from investigations on known fraud patterns (Gray & Debreceny, 2014).
The sentiment (tone, opinion) has been assessed using several categorization schemes
Song et al. Financial Innovation (2018) 4:2 Page 3 of 14

in order to explore the various aspects of language used in the annual reports of US
companies. The results indicated that the sentiment information is an important fore-
casting determinant of financial performance and, thus, can be used to support the
decision-making process of corporate stakeholders (Hajek, Olej, & Myskova, 2014).
(Wang et al. 2016) investigated the correlation between mutual funds’ scale and return
in China by text mining a large volume of online financial reports. They further
employed K-means clustering for fund categorization, which enables the reliable exam-
ination of correlations between the fund’s scale and return. The findings highlighted
the uniqueness of emerging markets while providing interesting guidelines for exploit-
ing big data analytics for financial studies.
Corporate social responsibility is crucial for sustainable corporate governance.
Researchers have realized the potential value of the textual analysis of financial reports
for detecting fraud, managing risk, and forecasting future performance. However, few
researchers have performed empirical studies on the sentiment analysis of financial
reports based on strategic factors and CSR. This paper will illustrate how to perform
an effective sentiment analysis of financial reports.
MethodsResearch framework
The research framework is shown in Fig. 1 and includes 4 steps: (1) data collection and
preprocessing, (2) subjective sentence identification, emotional trend classification, and
object description extraction, (3) the object library of the financial reports, and (4)
empirical analysis.
Data collection and preprocessing
To develop the sample for the transferrable object library, we used firm-year observa-
tions from different industries, including real estate, automobile, medicine, electric,
communications, and energy. The final sample contained 50 financial reports from
2008 to 2013. The data came from www.cninfo.com.cn, which is the designated disclos-
ure website of the China Securities Regulatory Commission. To distinguish our work
Fig. 1 Research Framework
Song et al. Financial Innovation (2018) 4:2 Page 4 of 14
from existing quantitative (financial ratios) research and mine the potential information
contained in the textual content of the financial reports, we did not extract common
words like “we” or “company” or industry-specific words and pure financial termin-
ology such as “automobile”, “real estate”, or “asset-liability ratio”. The classification pre-
cision based on the sentence corpus was higher than that of the paragraph or
document (Zheng, 2014); we extracted 32,767 sentences from the textual part of the fi-
nancial reports based on the full-stop punctuation.
Identification of the object description
Using the approach found in (Bao and Datta’s 2014) work, we recruited 10 graduate
students to label the sample sentences. Each student labels around 4000 sentences,
among which 800 sentences are repetitive. Before labeling, they are briefed on the def-
inition and trained on a number of real labeled examples. We keep communication and
discussion during the whole process. The consistency of repetitive sentences reaches
80%. We only retain the subjective sentences whose labels are agreed upon by other an-
notators. The final sample set contained 2001 subjective sentences with a general emo-
tional tendency and 4181 groups of related object descriptions. The expression of the
subjective emotion was very complicated, and each sentence may not only have de-
scribed the situation and emotional expression of a single aspect of the company. Al-
though the variety of sentences means that some sentences will tend to approve some
aspects of the company while others tend to criticize aspects of the company, a sen-
tence’s general emotional tendency can be identified. The emotion tendency of the in-
ternal parts of 1 sentence can be different from the whole emotional tendency of the
sentence. Therefore, we labeled the whole emotional tendency, related object descrip-
tion of each sentence, and emotional tendency of each object description (shown in
Table 1).
Let us use the first sentence to illustrate this process of identification. Even though
there is only one sentence (divided by full stop punctuation), the subjective expression
involves 4 groups of the object description, which should be listed separately. Among
them, 2 groups of emotional expression are negative descriptions about the company’s
external environment, but the whole emotional tendency of this sentence is positive.
Therefore, the general emotion of this sentence should be labeled as positive, while its
constituent parts are labeled as having different emotional tendencies. We obtained a
set of 1724 positive sentences and 277 negative sentences. Among the object descrip-
tion groups, there were 3482 expressing positive emotions and 699 expressing negative
emotions. For both the sentence level and object description level, around 85% of this
sample expressed positive emotions and only 15% expressed negative emotions. After
removing the repeated items, there were 2637 objects and 1728 descriptions. The dif-
ference in these results may be explained by the fact that the describing objects in fi-
nancial reports can differ in thousands of ways, while the emotional tendency is mainly
expressed as either “good” or “bad”.
SVM testing
Text consists of characters and punctuation, constituting words, phrases, sentences,
paragraphs, sections, chapters, and documents. Before the computer could
Song et al. Financial Innovation (2018) 4:2 Page 5 of 14

automatically deal with textual content, we needed to find an idealized method of for-
mal representation that reflected the potential content of the text and then help it to
identify different texts. The Support Vector Machine (SVM), a supervised learning
method, is a prominent method for text classification (Pang et al., 2002; Mullen & Col-
lier, 2004; Whitelaw et al., 2005; Ni et al., 2007). The basic idea of the SVM is to use a
training set to find the hyperplane in vector space and then separate the data points
into as many different categories as possible. Through a trained SVM model, the emo-
tional tendency of the testing data could be automatically predicted.
We labeled the subjective sentences of financial reports from different industries. After re-
moving the data with missing values, we obtained a matrix of 1966*1728 (sentence*descrip-
tion). Based on the proportion of 3:1, we divided the data into a training set and a testing set.
Table 2 shows the SVM classification result. The precision ratio was 97.36% and re-
call ratio was 88.04% when identifying a positive emotional tendency. The precision
Table 2 Testing result of the SVM
Human label as + 1 Human label as − 1
Machine label as + 1 405 11
Machine label as − 1 55 30
Table 1 Examples of object description identification
Sentenceemotion
Sentence Object Description Descriptionemotion
+ 1 2013 年,面对复杂的外部环境和日益激烈的行业竞争,公司坚持“有质量的增长”,规模稳步增长,经营效率不断提升。(Faced with complicated externalenvironment and increasingly fierceindustry competition in 2013, the companyadheres to the growth of quality, makes asteady rise in scale, and constantly improvesoperational efficiency.)
external environment complicated −1
industry competition increasingly fierce −1
scale steady rise + 1
operational efficiency constantly improve + 1
+ 1 公司稳健的经营风格、审慎的财务管理以及良好的信用积累获得国际投资者认可,为拓展海外融资渠道创造了良好条件。(The firm’s stable operation style, prudentfinancial management and good creditaccumulation are approved by internationalinvestors, which help create favorableconditions to expand overseas financingchannels.)
operation style Stable + 1
financial management Prudent + 1
credit accumulation Good + 1
−1 受市场形势变化以及公司积极进行产品结构的调整,主动关停部分老车型的影响,报告期内,公司产销规模出现了下滑。(The company’s production and marketingscale have declined during the reportingperiod, due to the influence of changesin market conditions and active close ofpartly old models in order to adjustproduct structure.)
production andmarketing scale
Decline −1
−1 主要归因于化工产品价格同比下跌幅度较大,化工板块业绩同比下降。(Theperformance of chemical sector decreaseddue to price fall of chemical products.)
product price Decrease −1
−1 这些都可能会对本公司生产经营和效益带来较大的影响。(All of these could lead to alarge influence on the company’s productoperation and efficiency.)
product operation
and efficiency
large influence −1
Note: the original corpus is in Chinese, and the contents in brackets are corresponding translation. Similarly hereinafter
Song et al. Financial Innovation (2018) 4:2 Page 6 of 14

ratio was 35.29% and recall ratio was 73.17% when identifying a negative emotional
tendency. The total precision ratio reached 86.83% and the F-measure value was
51.81%. The positive precision was much higher than that for the negative identifica-
tion, which can be explained by the aforementioned statistical results. When preparing
financial reports, managers usually have a positive attitude or mood (instead of a nega-
tive or adverse emotional tendency) towards the company’s financial position, operation
results, and cash flow. Thus, most sentences in the sample set expressed positive emo-
tion and few were negative. This tendency was also reflected in the calculation of “the
precision ratio of identifying the negative emotional tendency”. The denominator con-
tained a large number of misjudged samples that the machine recognized as − 1 while
the human label was + 1, which led to the lower precision ratio for negative
expressions.
Object library of the financial reports
SWOT strategic analysis is a common method for evaluating corporate performance,
which contains an analysis of the internal environment and external environment. In
the above section, we divided the financial reports into sentences based on full stop
punctuation, then identified the emotional tendency of the sentences, and finally ex-
tracted the related object description. These objects were words or phrases that we
wanted to classify. Our process was as follows.
First, we labeled these objects as internal or external.
If the text described the company’s external information, it belonged to the external
strategic analysis. The strategic analysis of the external environment is usually subdi-
vided into the macro environment analysis and industry environment analysis. The
former analyzes the whole environment, which can influence all kinds of industries, so
we used the PESTEL model for these data. The latter aims at the strategic factors in a
specific industry outside of a company that affect the company being analyzed as well
as all the other companies engaged in similar economic and operational activities in
the same industry; for these data, we adopted Porter’s Five Forces model.
If the sentence described the company’s internal situation, it belonged to the internal
strategic analysis. Companies cannot control external environment factors. The stra-
tegic analysis of the internal environment relates to controllable factors, which can be
improved by management and other control measures. The Value Chain includes the
Primary and Support Activities and is used for corporate internal analysis.
There were 11 (6 + 5) external object categories, shown in Table 3. After removing the
repeated items, the statistical results indicated that, among the factors in the corporate ex-
ternal environment, companies were concerned about the economic factor, industry ri-
valry, and power of the buyer the most, which are issues related to company earnings.
Table 4 shows that the internal objects are more related to a firm’s infrastructure,
marketing and sales, and operations and technology development than human resource
management and services. The factors of least importance are inbound logistics, out-
bound logistics, and procurement.
There were 345 sentences describing the external environment and 859 related
groups of the object descriptions. There were 1656 sentences describing the internal
environment and 3322 related groups of object descriptions, which were 4.8 times and
Song et al. Financial Innovation (2018) 4:2 Page 7 of 14
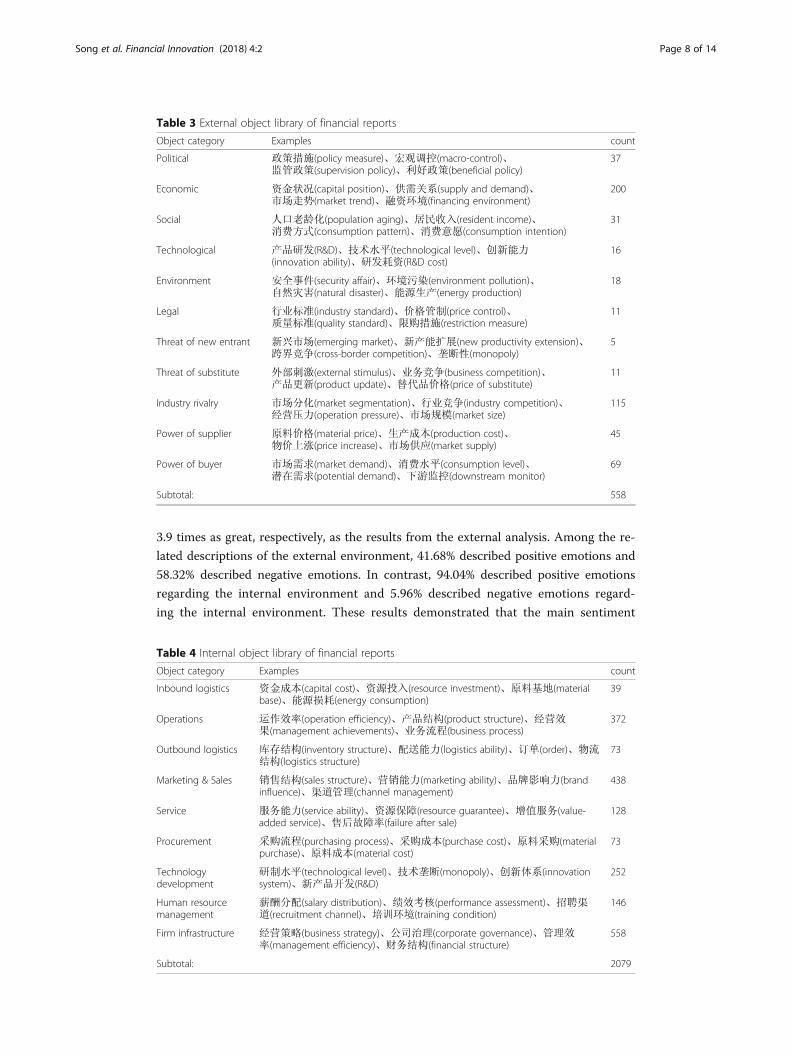
3.9 times as great, respectively, as the results from the external analysis. Among the re-
lated descriptions of the external environment, 41.68% described positive emotions and
58.32% described negative emotions. In contrast, 94.04% described positive emotions
regarding the internal environment and 5.96% described negative emotions regard-
ing the internal environment. These results demonstrated that the main sentiment
Table 3 External object library of financial reports
Object category Examples count
Political 政策措施(policy measure)、宏观调控(macro-control)、监管政策(supervision policy)、利好政策(beneficial policy)
37
Economic 资金状况(capital position)、供需关系(supply and demand)、市场走势(market trend)、融资环境(financing environment)
200
Social 人口老龄化(population aging)、居民收入(resident income)、消费方式(consumption pattern)、消费意愿(consumption intention)
31
Technological 产品研发(R&D)、技术水平(technological level)、创新能力(innovation ability)、研发耗资(R&D cost)
16
Environment 安全事件(security affair)、环境污染(environment pollution)、自然灾害(natural disaster)、能源生产(energy production)
18
Legal 行业标准(industry standard)、价格管制(price control)、质量标准(quality standard)、限购措施(restriction measure)
11
Threat of new entrant 新兴市场(emerging market)、新产能扩展(new productivity extension)、跨界竞争(cross-border competition)、垄断性(monopoly)
5
Threat of substitute 外部刺激(external stimulus)、业务竞争(business competition)、产品更新(product update)、替代品价格(price of substitute)
11
Industry rivalry 市场分化(market segmentation)、行业竞争(industry competition)、经营压力(operation pressure)、市场规模(market size)
115
Power of supplier 原料价格(material price)、生产成本(production cost)、物价上涨(price increase)、市场供应(market supply)
45
Power of buyer 市场需求(market demand)、消费水平(consumption level)、潜在需求(potential demand)、下游监控(downstream monitor)
69
Subtotal: 558
Table 4 Internal object library of financial reports
Object category Examples count
Inbound logistics 资金成本(capital cost)、资源投入(resource investment)、原料基地(materialbase)、能源损耗(energy consumption)
39
Operations 运作效率(operation efficiency)、产品结构(product structure)、经营效果(management achievements)、业务流程(business process)
372
Outbound logistics 库存结构(inventory structure)、配送能力(logistics ability)、订单(order)、物流结构(logistics structure)
73
Marketing & Sales 销售结构(sales structure)、营销能力(marketing ability)、品牌影响力(brandinfluence)、渠道管理(channel management)
438
Service 服务能力(service ability)、资源保障(resource guarantee)、增值服务(value-added service)、售后故障率(failure after sale)
128
Procurement 采购流程(purchasing process)、采购成本(purchase cost)、原料采购(materialpurchase)、原料成本(material cost)
73
Technologydevelopment
研制水平(technological level)、技术垄断(monopoly)、创新体系(innovationsystem)、新产品开发(R&D)
252
Human resourcemanagement
薪酬分配(salary distribution)、绩效考核(performance assessment)、招聘渠道(recruitment channel)、培训环境(training condition)
146
Firm infrastructure 经营策略(business strategy)、公司治理(corporate governance)、管理效率(management efficiency)、财务结构(financial structure)
558
Subtotal: 2079
Song et al. Financial Innovation (2018) 4:2 Page 8 of 14
expressed in these financial reports was about internal information disclosure,
mainly good news about corporate performance. Compared with the internal dis-
closure, the description of the external environment revealed much more emotion
that is negative.
Results and discussionWe developed a regression model for the CSR score and financial report sentiment,
shown below:
Log CSRitð Þ ¼ α:Log CSRit−1ð Þ þ β:Control variablesit þ γ:FR categoriesit þ ε
The CSR score data was taken from www.hexun.com. Control variables included
the ROE, BM ratio, and company size, which were obtained from the China Stock
Market & Accounting Research (CSMAR) database. The empirical data set con-
sisted of 16 companies (000002 Vanke, 600050 China Unicom, 600028 SINOPEC,
601857 CNPC, 600104 SAIC Motor, 000800 FAW CAR, 000927 TJ FAW, 000572
HaiMa Motor, 601607 Shanghai Pharma, 000538 Yunnan Baiyao, 000423 DEEJ,
600085 TongRenTang, 000651 GREE, 600690 Haier, 600839 Sichuan Changhong,
and 000016 KONKA A) in various industries over a period of 2 years, 2012 and
2013. Based on the object library we built and emotional tendencies classified in
the above sections, we calculated the financial reports’ sentiment value of each cat-
egory using Models 1–6.
Model 1:
Log CSRitð Þ ¼ α:Log CSRit−1ð Þ þ β11:ROEit þ β12:BMit þ β13:Log Sizeitð Þ þ ε
Model 2:
Log CSRitð Þ ¼ α:Log CSRit−1ð Þ þ β11:ROEit þ β12:BMit þ β13:Log Sizeitð Þ þ γ11:FRit þ ε
Model 3:
Log CSRitð Þ ¼ α:Log CSRit−1ð Þ þ β11:ROEit þ β12:BMit þ β13:Log Sizeitð Þþγ21:Externalit þ γ22:Internalit þ ε
Model 4:
Log CSRitð Þ ¼ α:Log CSRit−1ð Þ þ β11:ROEit þ β12:BMit þ β13:Log Sizeitð Þþγ31:PESTELit þ γ32:Porterit þ γ33:ValueChainit þ ε
Model 5:
Log CSRitð Þ ¼ α:Log CSRit−1ð Þ þ β11:ROEit þ β12:BMit þ β13:Log Sizeitð Þþγ41:PESTELit þ γ42:Porterit þ γ43:Primaryitþγ44:Supportit þ ε
Model 6:
Log(CSRit) = α. Log(CSRit − 1) + β11. ROEit + β12. BMit + β13. Log(Sizeit) + γ51. Politicalit+ γ52. Economicit + γ53. Socialit + γ54. Technologicalit + γ55. Environmentit+γ56. Legalit + γ57. Entrantit + γ58. Substituteit + γ59. Rivalryit+ γ60. Supplierit + γ61. Buyerit + γ62. Inboundit + γ63. Operationsit
Song et al. Financial Innovation (2018) 4:2 Page 9 of 14

+ γ64. Outboundit + γ65. Marketingit + γ66. Serviceit + γ67. Procurementit+ γ68. Technologyit + γ69. Humanit + γ70. Infrastructureit + ε
Table 5 presents the descriptive statistics for our sample. The units of the CSR and
Size are obviously different from the other variables, so we used the log value of these
2 variables for the regression.
Table 6 shows the experiment results, among which Model 5 demonstrates a stat-
istical significance between the CSR score and financial report sentiment based on
the categories of the PESTEL, and Porter’s Five Forces, Primary Activities and Sup-
port Activities. It outperformed the other models. The signs of the 4 variables’ co-
efficients were consistent with the aforementioned statistical results. When
Table 5 Summary statistics of the sample data
Variable Min Max Mean Standard Deviation
CSR 0.61 86.66 59.00 23.27
Control Variables
ROE −0.10 0.31 0.11 0.11
BM 0.17 1.46 0.83 0.35
Size 14.74 21.10 17.51 1.60
FR Categories
FR −0.09 1.00 0.71 0.27
External −1.00 1.00 −0.10 0.57
Internal 0.42 1.00 0.90 0.16
PESTEL −1.00 1.00 0.11 0.68
Porter −1.00 1.00 −0.40 0.60
Primary 0.29 1.00 0.88 0.20
Support 0.40 1.25 1.00 0.17
Political −1.00 1.00 0.00 0.76
Economic −1.00 1.00 0.09 0.54
Social 0.00 1.00 0.26 0.44
Technological −1.00 1.00 0.13 0.42
Environment −1.00 1.00 0.03 0.47
Legal −1.00 1.00 −0.13 0.49
Entrant −1.00 1.00 0.00 0.25
Substitute −1.00 1.00 −0.06 0.44
Rivalry −1.00 1.00 −0.45 0.57
Supplier −1.00 1.00 −0.39 0.56
Buyer −1.00 1.00 0.03 0.64
Inbound −1.00 1.00 0.37 0.60
Operation 0.00 1.00 0.88 0.27
Outbound 0.00 1.00 0.64 0.48
Marketing 0.00 1.00 0.85 0.27
Service −1.00 1.00 0.78 0.47
Procurement 0.00 1.00 0.58 0.48
Technology 0.00 1.00 0.83 0.35
Human 0.00 1.00 0.80 0.39
Infrastructure −0.33 1.00 0.87 0.31
Song et al. Financial Innovation (2018) 4:2 Page 10 of 14

preparing a financial report, managers express positive emotions in accordance
with Porter’s Five Forces and Support Activities, which show the company’s oppor-
tunities and strengths. Managers may also complain about the threat from the
macro environment and weakness of the Primary Activities.
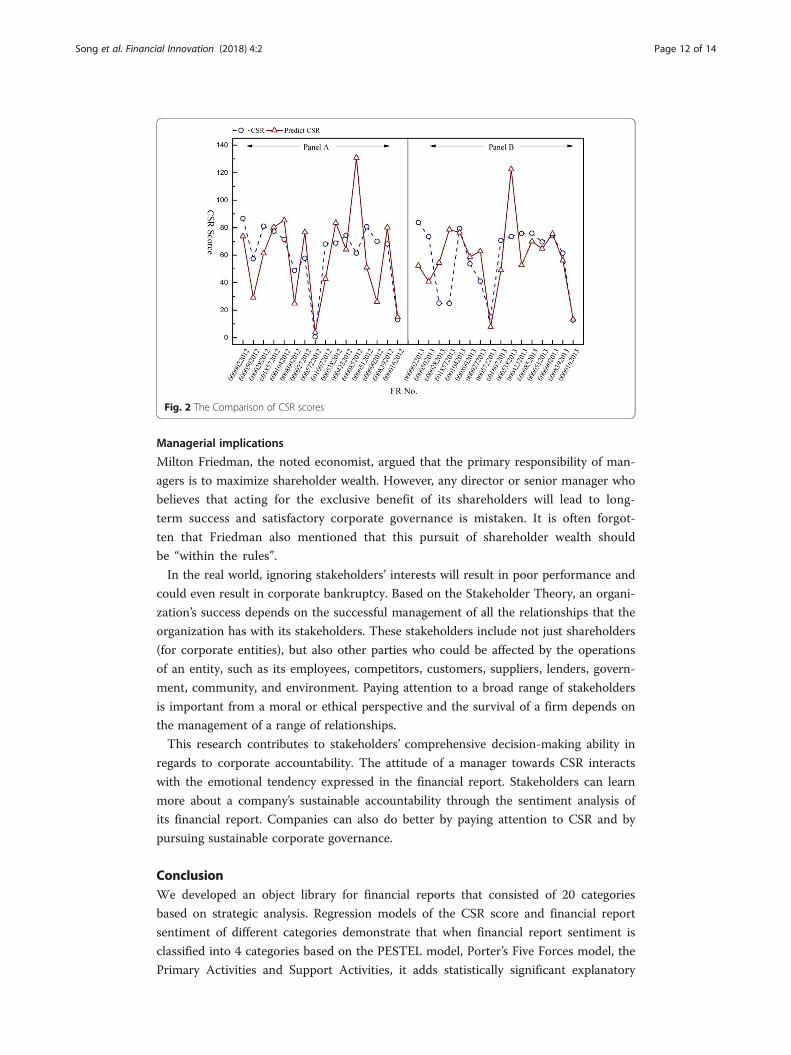
Based on Model 5, we calculated the predicted values for the CSR scores. The com-
parison between predicted values and true values of the CSR scores is plotted as Fig. 2,
which shows a consistent trend.
Table 6 Regression results of different models
Variable category Variable Model 1 Model 2 Model 3 Model 4 Model 5 Model 6
Intercept −1.4860 −1.4306 − 1.5804 −1.0108 − 0.9943 0.5900
Control variables Log(CSRt-1) 0.3392· 0.3174 0.3250· 0.3378· 0.2761· 0.3483
ROE − 0.2841 − 0.1069 0.0012 0.1019 −0.7234 − 0.2213
BM −0.4080· −0.3889 − 0.3698 −0.4782· − 0.7948** −0.7326
Log(Sizet-1) 2.3923 2.4235 2.4579 2.1105 2.1349 0.7702
FR categories FR −0.1311
External −0.1072
Internal −0.0406 − 0.0598
PESTEL −0.1812 −0.2689*
Porter 0.0825 0.2839*
Primary −1.1081*
Support 1.4174**
Political −0.1021
Economic 0.0174
Social −0.0595
Technological −0.0220
Environment 0.0359
Legal 0.1794
Entrant 0.0997
Substitute 0.1795
Rivalry 0.2797
Supplier 0.0553
Buyer −0.1574
Inbound −0.1462
Operation 0.3617
Outbound −0.1118
Marketing 0.1446
Service −0.0820
Procurement 0.3196
Technology 0.4783
Human −0.2218
Infrastructure −0.3058
Adjusted R2 0.3660 0.3484 0.3386 0.3608 0.5203 0.0283
Variable “Internal” in Model 3 is actually “ValueChain” in model 4, their value are the same·* and ** indicate p < 10%, p < 5% and 1% respectively
Song et al. Financial Innovation (2018) 4:2 Page 11 of 14
Managerial implications
Milton Friedman, the noted economist, argued that the primary responsibility of man-
agers is to maximize shareholder wealth. However, any director or senior manager who
believes that acting for the exclusive benefit of its shareholders will lead to long-
term success and satisfactory corporate governance is mistaken. It is often forgot-
ten that Friedman also mentioned that this pursuit of shareholder wealth should
be “within the rules”.
In the real world, ignoring stakeholders’ interests will result in poor performance and
could even result in corporate bankruptcy. Based on the Stakeholder Theory, an organi-
zation’s success depends on the successful management of all the relationships that the
organization has with its stakeholders. These stakeholders include not just shareholders
(for corporate entities), but also other parties who could be affected by the operations
of an entity, such as its employees, competitors, customers, suppliers, lenders, govern-
ment, community, and environment. Paying attention to a broad range of stakeholders
is important from a moral or ethical perspective and the survival of a firm depends on
the management of a range of relationships.
This research contributes to stakeholders’ comprehensive decision-making ability in
regards to corporate accountability. The attitude of a manager towards CSR interacts
with the emotional tendency expressed in the financial report. Stakeholders can learn
more about a company’s sustainable accountability through the sentiment analysis of
its financial report. Companies can also do better by paying attention to CSR and by
pursuing sustainable corporate governance.
ConclusionWe developed an object library for financial reports that consisted of 20 categories
based on strategic analysis. Regression models of the CSR score and financial report
sentiment of different categories demonstrate that when financial report sentiment is
classified into 4 categories based on the PESTEL model, Porter’s Five Forces model, the
Primary Activities and Support Activities, it adds statistically significant explanatory
Fig. 2 The Comparison of CSR scores
Song et al. Financial Innovation (2018) 4:2 Page 12 of 14
power to the CSR score. The result is transferrable to different industries. In the future,
we can apply the method for creating an object library of financial reports to other fi-
nancial disclosures.
FundingNational Natural Science Foundation of China (No. 71371144, 71601119, 71771177).
Authors’ contributionsYuan Song collected data and wrote the main paper. Hongwei Wang gave the main idea and improvementsuggestions. Maoran Zhu contributed to the experiment analysis. All the authors read and approved the finalmanuscript.
Authors’ informationYuan Song is a PhD candidate at School of Economics and Management, Tongji University, Shanghai 200,092, China.Her research interests include corporate governance, auditing and textual analysis.Hongwei Wang is currently a professor of Information Systems in the School of Economics and Management at TongjiUniversity, China. His research interests include sentiment analysis, social media, and business intelligence.Maoran Zhu is an associate professor of Management Science in the School of Economics and Management at TongjiUniversity, China. His research interests include E-commerce and business intelligence.
Competing interestsThe authors declare that they have no competing interests.
Publisher’s NoteSpringer Nature remains neutral with regard to jurisdictional claims in published maps and institutional affiliations.
Received: 3 July 2016 Accepted: 8 February 2018
ReferencesBao Y, Datta A (2014) Simultaneously discovering and quantifying risk types from textual risk disclosures. Manag Sci
60(6):1371–1391Bonson E, Bednarova M (2015) CSR reporting practices of Eurozone companies. Revista de Contabilidad-Spanish
Accounting Review 18(2):182–193CEC (Commission of European Communities) (2001), Promoting a European framework for corporate social
responsibility, Green Paper, Commission of European Communities, Brussels, accessed June 2014, http://eur-lex.europa.eu/summary/chapter/employment_and_social_policy.html?root_default=SUM_1_CODED=17
Chan SWK, Franklin J (2011) A text-based decision support system for financial sequence prediction. Decis Support Syst52(1):189–198
Chen CL, Liu CL, Chang YC, Tsai HP (2012) Opinion Mining for Relating Subjective Expressions and Annual Earnings inus financial statements. J Inform Sci Engineering 29(4):743–764
Cho E H, Christman A, Emsellem M, Ruckelshaus C K, & Smith R (2012), Chain of greed: How Walmart’s domesticoutsourcing produces everyday low wages and poor working conditions for warehouse workers, accessed June2014, http://www.nelp.org/page/-/Justice/2012/ChainOfGreed.pdf?nocdn=1
CPA Australia 2015. CPA Program Global Strategy and Leadership [M]., Version 15aGray Glen L, Debreceny Roger S (2014) A taxonomy to guide research on the application of data mining to fraud
detection in financial statement audits. Int J Account Inf Syst 15(4):357–380Heng W, Junjie W, Shi Y, Jian C (2016) On Characterizing Scale Effect of Chinese Mutual Funds via Text Mining. Signal
Process 124:266–278Hobson JL, Mayew WJ, Venkatachalam M (2012) Discussion of analyzing speech to detect financial misreporting. J
Account Res 50(2):393–400Holme R, Watts P (2000), Corporate Social Responsibility: Making good business sense, World Business Council on
Sustainable Development. http://www.ceads.org.ar/downloads/Making%20good%20business%20sense.pdf.Accessed Feb 2018.
Kai-guo Y, Xiao-qin L, Hua-dong C (2014) Study on the relationship between corporate social responsibility andfinancial performance from the endogenous perspective-evidence from Chinese listed companies. China SoftScience 06:98–108 (in Chinese)
Kareiva Peter M, McNally Brynn W, Steve MC, Tom M, Mary R (2015) Improving global environmental management withstandard corporate reporting. Proc Natl Acad Sci U S A 112(24):7375–7382
Kloptchenko A, Eklund T, Karlsson J, Back B, Vanharanta H, Visa A (2004) Combining Data and Text Mining Techniquesfor Analysing Financial Reports. International Journal of Intelligent Systems in Accounting, Finance andManagement 12(1):29–41
Lawlor P (2001). Chasing the triple bottom line, IT Web News, 27 July, accessed June 2014, http:// allafrica.com/stories/200107270552.html
Li F (2006). Do stock market investors understand the risk sentiment of corporate annual reports?. Ssrn ElectronicJournal
Li F (2010) Textual analysis of corporate disclosures: a survey of the literature. J Account Lit 29:143–165Loughran T, Mcdonald B (2011) When is a liability not a liability? Textual analysis, dictionaries, and 10-Ks. J Financ 66:
35–65
Song et al. Financial Innovation (2018) 4:2 Page 13 of 14
Ma L-l (2011) A study on the mechanism of the impact of the Company' s social responsibility on Consumers'willingness of purchase. Management World 05:120–126 (in Chinese)
Maryam H & Felden Carsten (2015). Impact of text mining application on financial footnotes analysis. 10th internationalconference on design science research in information systems and technology (DESRIST). Dublin, IRELAND
Michelon G, Pilonato S, Ricceri F (2015) CSR reporting practices and the quality of disclosure: an empirical analysis. CritPerspect Account 33:59–78
Mohammad S, Jeff G (2016) The effects of internet usage, financial development and trade openness on economicgrowth in South Africa: a time series analysis. Telematics Inform 33(4):1141–1154
Mullen T & Collier N (2004). Sentiment analysis using support vector machines with diverse information sources.Proceedings of EMNLP-2004, Barcelona, Spain, 412-418
Ni X, Xue G, Ling X, Yu Y & Yang Q (2007). Exploring in the weblog space by detecting informative and affectivearticles. Proc. of the 16th Int. Conf. On world wide web, 281–290
Pang B, Lee L & Vaithyanathan S (2002). Thumbs up? sentiment classification using machine learning techniques TheConference on Empirical Methods in Natural Language Processing Philadelphia, US, 79–86
Patten DM, Na Z (2014) Standalone CSR reporting by U.S. retail companies. Account Forum 38:132–144Petr H, Vladimir O, Renata M (2014) Forecasting corporate financial performance using sentiment in annual reports for
stakeholders’ decision-making. Technol Econ Dev Econ 20(4):721–738Robert P, Schumaker, Chen H (2009) Textual analysis of stock market prediction using breaking financial news: the Azfin
text system. ACM Trans Inf Syst 27(2):1139–1141Safaee M, Gerayli MS (2017) Family control and corporate social responsibility: evidence from Iranian companies. Int J
Fin Engineering 04(04)Srinivasan R, Pradnya C, Asha N (2014) Corporate social responsibility (CSR) in market driven environment. Procedia
Economics and Finance 11:68–75Te Liew W, Adhitya A, Srinivasan R (2014) Sustainability trends in the process industries: a text mining-based analysis.
Comput Ind 65:393–400Whitelaw C, Garg N & Argamon S (2005). Using appraisal groups for sentiment analysis. Proc. Of the 14th ACM Int. Conf.
on Information and Knowledge Management, 625-631Zhao-guo Z, Liang Z-g, Kai-guo Y (2012) Research on corporate social responsibility from the stakeholder perspective.
China Soft Science 02:139–146 (in Chinese)Zhang Zhao-guo, Jin Xiao-cui, Li Geng-qin (2013). An empirical study on the interactive and inter-temporal influence
between corporate social responsibility and corporate financial performance. Accounting Research, 08, 32–39+96. (inChinese)
Zheng LJ (2014) Users’ sentiment analysis and application of Chinese online reviews. Tongji University
Song et al. Financial Innovation (2018) 4:2 Page 14 of 14