sustainable remediation and rehabilitation of biodiversity ... · sustainable remediation and...
TRANSCRIPT
1
SUSTAINABLE REMEDIATION AND
REHABILITATION OF BIODIVERSITY AND HABITATS
OF OIL SPILL SITES IN THE NIGER DELTA
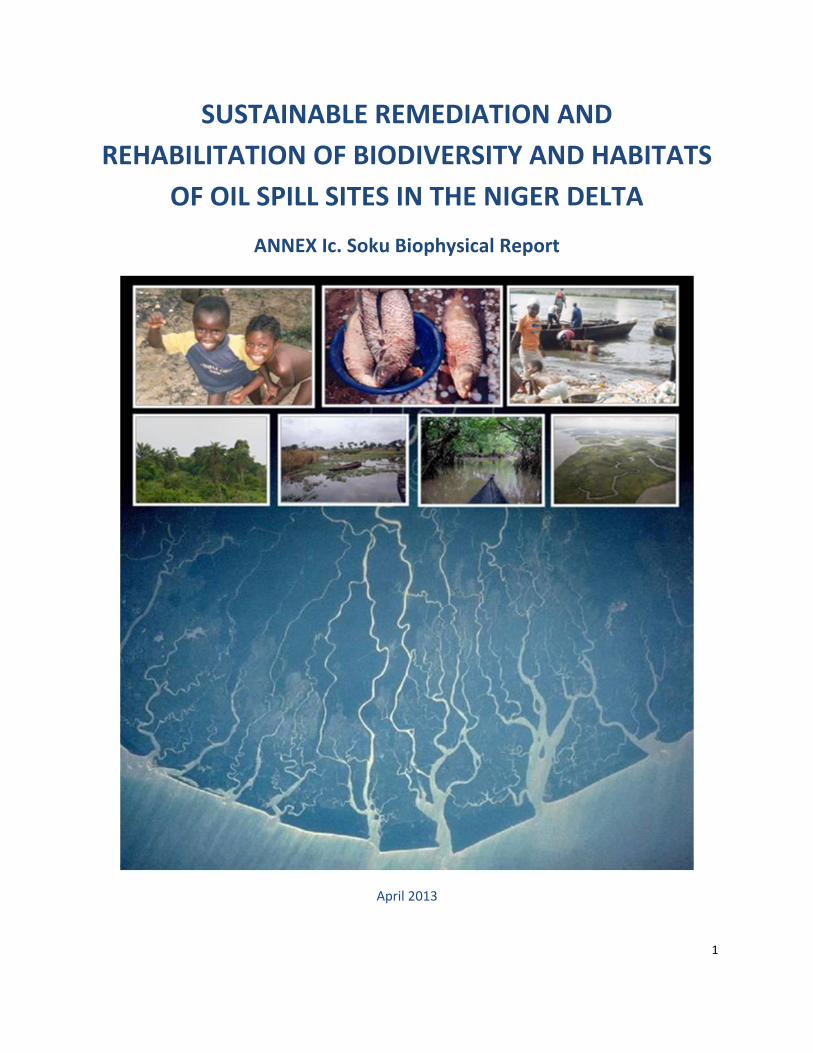
ANNEX Ic. Soku Biophysical Report
April 2013
2
SOKU FIELD REPORT
TABLE OF CONTENTS
TABLE OF CONTENTS .................................................................................................................2
LIST OF TABLES ............................................................................................................................5
LIST OF FIGURES ..........................................................................................................................6
LIST OF PLATES ............................................................................................................................7
EXECUTIVE SUMMARY ...............................................................................................................8
LIST OF ABBREVIATIONS AND ACRONYMS ........................................................................................ 14
CHAPTER ONE ............................................................................................................................ 17
1.0 BACKGROUND INFORMATION ..................................................................................... 17
1.1 LOCATION AND ATTRIBUTES OF SOKU COMMUNITY ................................................................................ 17
1.2 POST IMPACT ASSESSMENT ........................................................................................... 18
1.3 STUDY OBJECTIVES AND WORK SCOPE ...................................................................... 19
1.4 THE CHOICE OF SOKU FIELD FOR IMPACT ASSESSMENT ........................................ 19
STUDY .......................................................................................................................................... 19
1.5 LEGAL AND ADMINISTRATIVE FRAMEWORK FOR EA IN NIGERIA..................... 21
1.5.1 NATIONAL ENVIRONMENTAL POLICY ......................................................................................... 23
1.5.2 NATIONAL EFFLUENT LIMITATION REGULATION .......................................................................... 23
1.5.3 POLLUTION ABATEMENT IN INDUSTRIES AND FACILITIES GENERATING WASTES REGULATION23
1.5.4 MANAGEMENT OF HAZARDOUS AND SOLID WASTES REGULATION ........................................... 23
1.5.5 LAND USE ACT ............................................................................................................................... 23
1.5.6 FORESTRY ACT ............................................................................................................................... 24
1.5.7 CRIMINAL CODE ............................................................................................................................ 24
1.5.8 CONSTITUTION OF THE FEDERAL REPUBLIC OF NIGERIA ............................................................ 24
1.5.9 NUCLEAR SAFETY AND RADIATION PROTECTION ACT ................................................................. 24
1.5.11 INTERNATIONAL CONVENTIONS AND GUIDELINES .................................................................. 25
3
1.5.12 NATIONAL REGULATORY BODIES .................................................................................... 25
1.5.12.1 Federal Ministry of Environment (FMEnv) ......................................................................... 25
1.5.12.2 National Inland Waterways Authority (NIWA) ................................................................ 26
CHAPTER TWO ........................................................................................................................... 28
2.0 OIL SPILL HISTORY OF THE AREA ................................................................................ 28
CHAPTER THREE ........................................................................................................................ 30
3.0 METHODOLGY ................................................................................................................... 30
3.1 SAMPLING STRATEGY ..................................................................................................... 30
3.2 WATER QUALITY ............................................................................................................... 33
3.2.1 FIELD DATA GATHERING (METHODOLOGY) ............................................................................... 33
3.2.2 QUALITY ASSURANCE/QUALITY CONTROL ................................................................................ 34
3.2.3 LABORATORY (ANALYTICAL) PROCEDURES ................................................................................ 34
3.2.4 QUALITY ASSURANCE/QUALITY CONTROL ................................................................................ 36
3.3 SOIL QUALITY .................................................................................................................... 37
3.3.1 FIELD METHODS ............................................................................................................................. 37
3.3.2 QUALITY ASSURANCE/QUALITY CONTROL ................................................................................ 38
3.3.3 LABORATORY ANALYSIS ............................................................................................................... 38
3.4 HYDROBIOLOGICAL ......................................................................................................... 39
3.4.1 ZOOPLANKTON/ PHYTOPLANKTON STUDIES ............................................................................. 39
3.4.2 FIELD METHODOLOGY ............................................................................................................ 40
3.4.2.1 Phytoplankton .......................................................................................................................... 40
3.4.2.2 Zooplankton: ............................................................................................................................. 40
3.4.2.3 Pelagic Microalgae ................................................................................................................... 41
3.4.2.4 Benthic macrofauna ................................................................................................................. 41
3.5 WILDLIFE ............................................................................................................................. 43
3.5.1 INTRODUCTION .............................................................................................................................. 43
3.5.2 METHODS ...................................................................................................................................... 44
CHAPTER FOUR .......................................................................................................................... 45
4.0 RESULTS AND DISCUSSION .......................................................................................... 45
4.1 SURFACE AND GROUND WATER QUALITY ................................................................. 45
4.1.1 PH ................................................................................................................................................... 45
4
4.1.2 TEMPERATURE ................................................................................................................................ 46
4.1.3 ELECTRICAL CONDUCTIVITY (EC) ............................................................................................... 46
4.1.4 DISSOLVED OXYGEN (DO) ........................................................................................................... 46
4.1.5 TOTAL DISSOLVED SOLIDS (TDS) ................................................................................................. 46
4.1.6 BIOCHEMICAL OXYGEN DEMAND (BOD) ................................................................................... 47
4.1.7 NUTRIENTS .................................................................................................................................... 47
4.1.8 CHLORIDE/ OIL/GREASE ............................................................................................................ 47
4.2 SEDIMENT QUALITY ......................................................................................................... 47
4.3 SOIL QUALITY .................................................................................................................... 49
4.4 HYDROBIOLOGICAL STATUS ........................................................................................ 52
4.4.1 PHYTOPLANKTON COMMUNITY........................................................................................ 52
4.4.2 PERIPHYTON ................................................................................................................................... 55
4.4.3 AQUATIC MACROPHYTES .............................................................................................................. 57
4.4.4 ZOOPLANKTON .............................................................................................................................. 59
4.4.5 MACROBENTHOS ........................................................................................................................... 61
4.5 WILDLIFE ............................................................................................................................. 64
4.5.1 MAMMALS ...................................................................................................................................... 64
4.5.2 AVIFAUNA ...................................................................................................................................... 66
4.5.3 REPTILES ......................................................................................................................................... 69
4.6 FISH AND FISHERIES......................................................................................................... 70
4.6.1 FISH SPECIES COMPOSITION ......................................................................................................... 71
4.6.2 FISHING GEAR TYPES ..................................................................................................................... 72
4.6.3 ROLE OF VARIOUS PEOPLE IN THE FISHERIES ............................................................................. 73
4.6.4 FISHING CYCLES AND SEASONALITY ............................................................................................ 73
4.6.5 SHRIMP FISHERY ............................................................................................................................ 73
CHAPTER FIVE ............................................................................................................................ 75
5.0 CONCLUSIONS ................................................................................................................... 75
Appendix 1. STANDARD OPERATING PROCEDURE FOR ANALYSIS IN ROFNEL LABORATORY
5
LIST OF TABLES
TABLE PAGE
3.1 Co-ordinates of water sampling stations and in situ measurements at Soku Gas Plant Sampling Sites, October 2012
33
3.2 Location and co-ordinates of soil sampling stations at Soku Gas Plant Area, October 2012
37
3.3 Summary of Measurement Methods for Soil Physico-Chemical Parameters
39
4.1 Results for physicochemical parameters of water samples from
Soku Gas Plant area field, October 2012. 45
4.2 Results for physicochemical parameters of sediment samples from Soku Gas Plant Area, October 2012
48
4.3 Results for physicochemical parameters of sediment samples from Soku Gas Plant Area, October 2012 (FROM ALTERNATE LABORATORY)
49
4.4 Results for physicochemical parameters of soil samples from Soku Gas Plant area Field, October 2012
52
4.5 Results for physicochemical parameters of soil samples from Soku Gas Plant Area, October 2012 (FROM ALTERNATE LABORATORY)
52
4.6 Phytoplankton density and distribution for Soku Gas Plant Area, October 2012
54
4.7 Periphyton density and distribution for Soku Gas Plant Area, October 2012
56
4.8 Zooplankton density and distribution Soku Gas Plant Area, October 2012
60
4.9 Species Composition of Benthic Organisms in Soku Field, October 2012
62
4.10 Mammalian wildlife occurring in Soku Gas Plant area, October 2012
64
4.11 Avian wildlife species occurring in Soku gas Plant area, October 2012
66
4.12 Common reptiles of the Soku Gas Plant area, October 2012 69 4.13 Common fish species in Soku Gas Plant Area, October 2012 71
6
LIST OF FIGURES
FIGURE PAGE
1.1 The Niger Delta Region showing key towns/LGAs and Soku the Study area
17
3.1
Map of Soku Area showing the Sampling Stations
32
4.1 Relative abundance of phytoplankton taxa from Soku Field
area, October 2012 53
4.2 Relative abundance of Periphyton taxa from Soku Gas Plant area, October 2012
57
4.3 Relative abundance of Zooplankton taxa from Soku Gas Plant area, October 2012
61
4.4 Relative abundance of Benthic fauna from Soku Gas Plant area, October 2012
62
7
LIST OF PLATES
PLATE PAGE
1.1 Approach to Soku Community Landing Jetty 21 1.2 Approach to Soku Community 21 1.3 Remediated Site behind the Gas Plant 21
2.1 Approach to Soku Gas Plant 29 2.2 Site behind Soku Gas Plant 29 2.3 Oil covering crab holes at remediated site 29 2.4 Oil sheen on water surface at remediated site 29
3.1 IUCN Panel Members, some Chiefs representing the
Traditional Council of Chiefs and representatives of the Youths after consultations with the Panel
31
3.2 Oil contaminated soils in Soku Gas Plant Area, October 2012 33 3.3 Collection of soil samples at Soku Field 39 3.4 Sieving for benthos at one of the sampling stations in Soku 43 3.5 Oiled mangrove roots at Soku 43
3.6 Sampling macrophytic weeds at Soku 43
4.1 Floating macrophytes (water lily) 59 4.2 Impacted vegetation 59
8
EXECUTIVE SUMMARY
Background Information
Soku Flow station and the nearby Gas Plant is one of the major oil field facilities in the Niger Delta that supply the bulk of the gas to NLNG at Bonny for export. Therefore the Gas Plant is a very important asset to the National economy. The flow station and the Gas Plant are surrounded by a number of tidal estuarine water bodies, namely Sombreiro and Saint Batholomeau Rivers.
With the expansion of oil exploration and production, the incidence of oil spills has
increased considerably within the region. Spills occur accidentally and through the
deliberate actions of the local people, who sabotage pipelines to steal oil or in protest
against the operations of the Federal Government and oil companies.
This study was carried out to establish the extent of damage on the environment
following the oil spillages in the area; ascertain the effectiveness of remediation
activities carried out and to assess the status of ecosystem rehabilitation and recovery.
Choice of Soku Field for the Study
The IUCN-NDP choice of Soku Field for field study was made for the following reasons:
the area is within a mangrove swamp ecosystem, one of the chosen four ecological areas identified by the Panel for special attention;
there had been several spillages in recent time around the area arising from disruption of pipeline activities and condensate theft; and
there had been recent remediation activities within the polluted area and hence the need to ascertain the effectiveness / adequacy of the remediation methods and efforts.
Legal and Administrative framework for the study
The impact assessment study was carried out within the framework of national environmental guidelines and regulations, which include those of National legislation and guidelines such as; the Federal Ministry of Environment (FMEnv), Department of Petroleum Resources (DPR) and Rivers State Ministry of Environment.
Pollution of the Soku Gas Plant Environment
9
Gas condensate is a by-product of gas plant production of LNG. Since many years there
has been a shortage of this product on the market and as a result an illegal trade has
developed based on stolen condensate. The pipelines carrying the condensate are cut
through to get hold of the gas condensate and this activity often triggers fires which
blast through the mangrove forest. Spills and fire incidents have occurred frequently in
the vicinity of Soku Gas Plant. Some of these spills have not adequately been cleaned up
and remediation was ongoing at the time of the fieldwork by the IUCN-NDP and the
task force.
Field Methodologies
To establish the impact of oil and gas condensate-spill incidences on the environment, it was pertinent to estimate the qualitative and quantitative effects of the spillage within the study area. Therefore, information was gathered through extensive multi-disciplinary studies that comprised surface and ground water quality assessment, soil, quality, vegetation and biodiversity, and socio-economic / community. The baseline data acquisition exercise involved a multi-disciplinary approach and was executed within the framework of a QHSE management system approach. This approach assured that the required data and samples were collected in accordance with agreed requirements (scientific and regulatory) using the best available equipment, materials and personnel. To compliment information obtained from review of existing data on the project area and close out identified information gaps, field sampling and measurement exercise was conducted between 16th and 18th October 2012. To ensure effective quality assurance and control on the laboratory analysis, two
separate laboratories were used and data obtained identified (Institute of Pollution
Studies in Rivers State University of Science and Technology and Rofnel Energy
Services Ltd, Port Harcourt). The methodology used Rofnel Laboratory for the analysis
of hydrocarbons, grease and total hydrocarbons is given in annex 1 at the end of this
document.
Results and discussion
Physicochemistry of surface water
Results indicate a DO (dissolved oxygen) range of 2.92-4.33mg/l; pH (7.17-7.50); EC (conductivity) (51.2-52.5 µS/cm); TDS (total dissolved solids) (35.1-38.7); BOD (biochemical oxygen demand) (0.8 – 2.40mg/l), nitrate levels (0.41 to 0.57mg/l); phosphate levels (<0.05mg/l) and sulphate levels (<1.0 – 1.2mg/l). These results were
10
all within the regulatory limits, whilst the oil and grease concentrations of 1.15 – 9.15mg/l recorded within the investigated area were higher than those previously recorded in polluted sites elsewhere in the Niger Delta. Hydrocarbon levels in sediments The (TPH) (total petroleum hydrocarbon) concentrations for stations 1 and 2 were 1472 and 1198mg/kg respectively; the polyaromatic hydrocarbons (PAH) were 402.390 and 567.902mg/kg respectively for the 2 stations; total hydrocarbon concentration (THC) were 15,875 and 26,375mg/kg whilst the oil and grease concentrations were 65,062 and 67,437.12mg/kg respectively for the two stations. These levels of THC were above the DPR target level and intervention levels of 50mg/kg and 5,000mg/kg respectively. Hydrocarbon levels in Soils The total hydrocarbon contents (THC) in the soils of Soku Gas Plant area field were generally high and often exceeded the biogenic threshold and DPR target and intervention limits of 50 mg/kg and 5000mg/kg respectively. They ranged from 11.85 mg/kg recorded at station 4 within the town, (which served as control) to above 6500mg/kg at stations 1 and 2. The results show that the remediation activity carried in the area was not adequate as the THC levels still remained at such high levels that could not guarantee ecosystem recovery over a long time. Hydrobiological Status
Phytoplankton
The abundance and distribution of phytoplankton community within the study sites at Soku Gas Plant area showed a checklist of 22 species representing 5 families respectively, with an overall density of 1060 cells/ml. The result showed that within the study site the Bacillarophyceae (diatoms) had the highest abundance and distribution (65.85%), followed by Chlorophyceae (23.68%), then Cyanophyceae (7.36%) , Xanthophyceae (2.45%) and Pyrrophyceae (0.66%).
Periphyton
The abundance and distribution of Periphyton community within the study stations at Soku Gas Plant area identified a total of 17 species representing 4 families, namely Bacillarophyceae, Chlorophyceae, Cyanophyceae and Xanthophyceae with an overall density of 521 cells/ml. Bacillarophyeae were the most dominant family followed by the Cyanohyceae, then the Chlorophyceae and the least dominant group, the Xanthophyceae. Vegetation and Macrophytes
11
The vegetation of this area is generally mangrove intertidal forest with patches of fresh water forest blocks existing in between. The intertidal mud flat plant consists of Rhizophora racemosa, Rhizophora mangle, Rhizophora harmnsonii, Avecenia africana, Laguncularia racemosa, and Acrosticum aureom. The macrophytes commonly found in the area include Nymphae spp., Eichornia crassipes, Vossia cuspidate, Chrysohalanus sp. Zooplankton The zooplankton fauna in any aquatic environment is usually categorized into Rotifers, Cladocera, Calanoid, Harpaticoid and Cyclopoid Copepods, Shrimps, Decapod crustaceans, and larval forms of bivalve molluscs and various fishes. The zooplankton species obtained in this study were represented by Copepoda (74.02%), Cladocera (14.89%), Rotifera (4.23%), Ostracoda (2.12%), Isopoda, Crustacea and Pisces (1.59% each). Macrobenthos Nineteen (19) taxomomic groups of zoobenthos fauna from six classes were recorded: the class crustacean had 7 representatives taxa which accounted for 75% of species (12.2%), gastropod with 3 species (7.9%), bivalves and insecta were represented by 2 species each (4.4% and 1.8% respectively), while oligachaetae had only one representative taxa. The crustacean also showed class dominance with regards to abundance with 83 individuals/m2. However, there was a slight shift in the pattern of class abundance relative to species composition (fish – 14 individuals/m2 > gastropoda – 9 individuals/m2 > bivalvia – 5 individuals/m2 > insecta – 2 individuals/m2 > oligochaeta – 1 individual/m2.
Wildlife
The wildlife of the Soku Field area recorded ninety-eight (98) wildlife species during the study period. These were made up of Nineteen (19) species of mammals representing Twelve (12) families; Sixty Two (62) species of birds representing Thirty (30) families and Seventeen (17) reptilian species representing Ten (10) families. The study area shows a fairly high taxonomic diversity of wildlife species which have been described within the given subheading. Three primates were recorded present in the study area; one of the primates is listed as vulnerable in IUCN, Red list. Red-Capped Mangabey (Cercocebus torquatus) also endangered in Nigeria endangered species Decree Act No 11 of (1985) schedule I. Two species of Otter found in some parts of the Niger Delta area are present in the study area. They are: African Clawless Otter (Aonyx capensis) and Spott necked Otter (Lutra maculicollis) all are listed as endangered in Decree No 11 of Nigeria.
12
The Red river hog (Polamochoerus porcus) and Sitatunga (Tragelaphus spekei) are the major animals hunted for bush meat because of their sizes. The African Manatee (Trichechus senegalensis) is seen occasionally in the creeks, they are globally threatened species. The dominant animals in the study area are the Large spotted Genet, African Clawless Otter and Marsh Mongoose. A good number of Grey Parrot (Psittacus erithacus) are still surviving in the islands, they are globally threatened species and also Endangered in Nigeria endangered species Act 11 of 1985. Some palearctic migrant bird species are also recorded in the study area, thus confirming the island as part of African Eurasian migratory flyway system. Fish and Fisheries The common fisheries of the area include the sardines (Pellonula sp.), bonga (Ethmolosa fimbriata), mullets (various species), croakers, groupers, tilapia, flat fish, grunters, catfish, mudskippers and others. Seasonality of exploitation of the different fish species in the area is indicated. The peak period for clupeids including sardines, shad and bonga is between October to about February/March corresponding to dry season period. During this time, considerable catches of the clupeids contribute significantly to income of fisherfolk. Freshwater prawns, Macrobrachium are predominant harvest during the rainy season between June and November. Palaemon, Penaeus and Atya species are also exploited during this period. From December to May is the peak period of estuarine white shrimp Nematopalaemon sp. Conclusions
The total hydrocarbon concentration (THC) recorded for the surface water samples
were in the range of 1.15 – 9.15mg/l indicated high levels of hydrocarbon
contamination of the sampled area. This is also indicated unsatisfactory remediation
efforts, which will not guarantee speedy ecosystem recovery and overall impact on the
public health of the community due to indirect impact on the aquatic biological
resources.
The hydrocarbon levels in the sediments indicated TPH (1190 – 1472mg/kg), PAH (402
– 567mg/kg), THC (15,875 – 26,375mg/kg) and oil and grease (65,062 – 67,437mg/kg)
for Stations 1 and 2. The hydrocarbon levels recorded for soils at the same stations were;
THC (27,843 – 69,075mg/kg) at 0-30cm depth, 9,597 – 20,023mg/kg at 30-60cm depth
and 213 – 4,502mg/kg at 60 – 100cm depth.

13
All these values were above the DPR target level limit of 50mg/kg and intervention
limits of 5,000mg/kg. Therefore it is indicative that the sediments and soils of these sites
were not properly remediated and hence would not guarantee quick recovery of the
ecosystem.
14
LIST OF ABBREVIATIONS AND ACRONYMS
AAS Atomic Absorption Spectrophotometer
AG Associated Gas
ALARP As Low as Reasonably Practicable
APHA American Public Health Association
B Barium
BaCl2 Barium Chloride
BaSO4 Barium Sulphate
BOD Biochemical Oxygen Demand
CaCO3 Calcium Carbonate
Cd Cadmium
CDC Community Development Committees
CO Carbon monoxide
CO2 Carbon dioxide
COD Chemical Oxygen Demand
Cr Chromium
Cu Copper
DPR Department of Petroleum Resources
DS Direct Sighting
DO Dissolved Oxygen
EC Electrical Conductivity
EGASPIN Environmental Guidelines, standards for Petroleum Industries in
Nigeria
EIA Environmental Impact Assessment
FAO Food and Agricultural Organisation
Fe Iron
FEPA Federal Environmental Protection Agency
FMENV Federal Ministry of Environment
15
GPS Global Positioning System
HCl Hydrogen Chloride
HNO3 Hydrogen Nitrate
H2S Hydrogen Sulphide
H2SO4 Hydrogen Sulphate
HSE Health, Safety & Environment
IITA International Institute for Tropical Agriculture
IUCN International Union for Conservation of Nature
K Potassium
KWW Kentucky Water Watch
LGAs Local Government Areas
LNG Liquefied Natural Gas
MG/L Milligram per Litre
ML Millilitre
MM Millimetre
N Nitrogen
NA Not Applicable
NDP Niger Delta Panel
NDDC Niger Delta Development Commission
NH3 Ammonia
Ni Nickel
NIWA National Inland Water Authority
NLNG Nigeria Liquefied Natural Gas Plant
NNPC Nigerian National Petroleum Company
NO2 Nitrogen dioxide
NO3 Nitrates
NM Nanometre
NTU Nerphelometric Turbidity Unit
16
NW Northwest
0C Degree Celsius
OML Oil Mining Lease
PAH Polyaromatic Hydrocarbon
pH Hydrogen Iron Concentration
PIAS Post Impact Assessment
PPE Personal Protective Equipment
QA/QC Quality Assurance/Quality Control
QHSE Quality Health Safety and Environment
RPI Research Planning Institute
ROW Right – of – way
SPDC Shell Petroleum Development Company
S-R Sedgewick Rafter
SS Sample Station
T Temperature
TDS Total Dissolved Solids
THC Total Hydrocarbon Concentration
TN Total Nitrogen
TPH Total Petroleum Hydrocarbon
TOR Terms of References
TSS Total Suspended Solids
UNDP United Nations Development Programme
UNESCO United Nations Education Scientific and Cultural Organisation
USDA United States Department of Agriculture
UV Ultra Violet
WHO World Health Organization
17
CHAPTER ONE
1.0 BACKGROUND INFORMATION
1.1 Location and Attributes of Soku Community
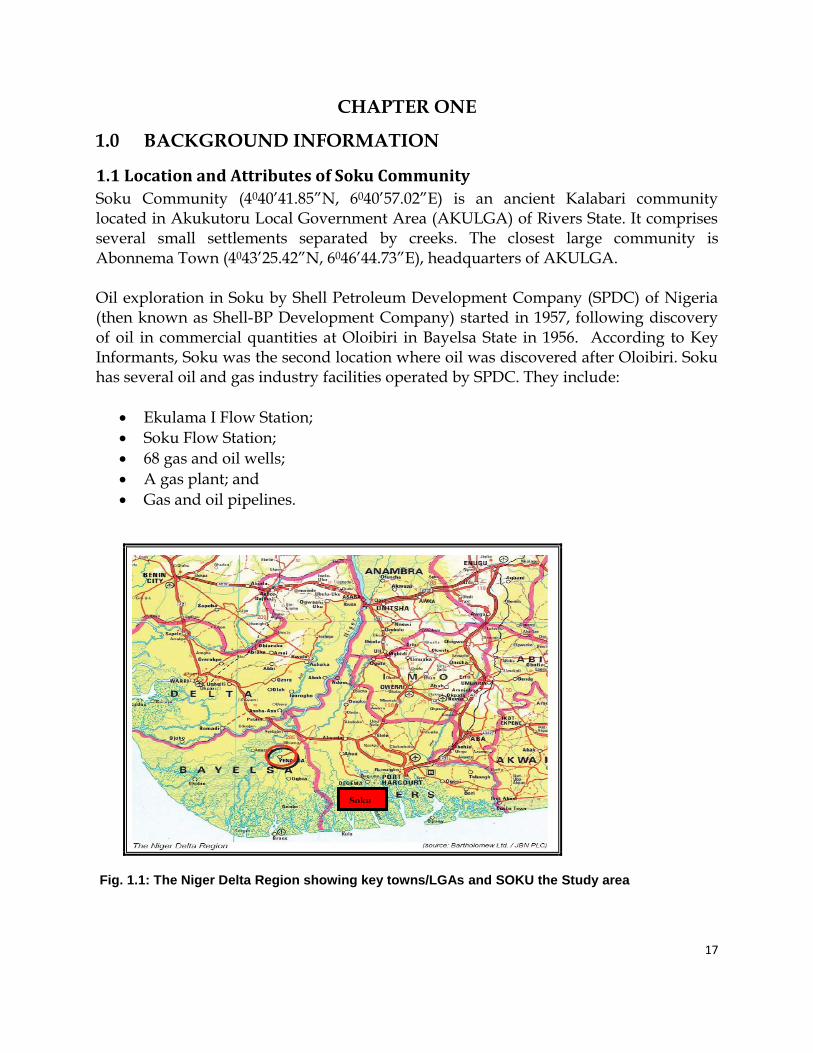
Soku Community (4040’41.85”N, 6040’57.02”E) is an ancient Kalabari community located in Akukutoru Local Government Area (AKULGA) of Rivers State. It comprises several small settlements separated by creeks. The closest large community is Abonnema Town (4043’25.42”N, 6046’44.73”E), headquarters of AKULGA. Oil exploration in Soku by Shell Petroleum Development Company (SPDC) of Nigeria (then known as Shell-BP Development Company) started in 1957, following discovery of oil in commercial quantities at Oloibiri in Bayelsa State in 1956. According to Key Informants, Soku was the second location where oil was discovered after Oloibiri. Soku has several oil and gas industry facilities operated by SPDC. They include:
Ekulama I Flow Station;
Soku Flow Station;
68 gas and oil wells;
A gas plant; and
Gas and oil pipelines.
Fig. 1.1: The Niger Delta Region showing key towns/LGAs and SOKU the Study area
Soku
18
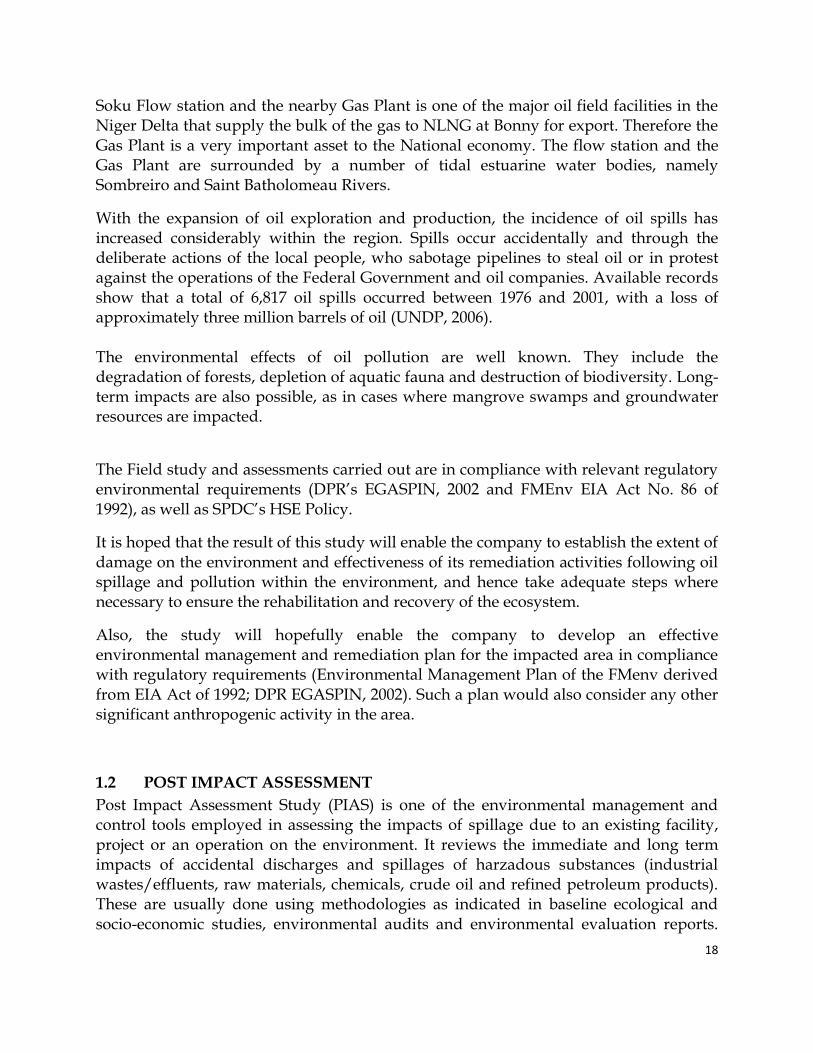
Soku Flow station and the nearby Gas Plant is one of the major oil field facilities in the Niger Delta that supply the bulk of the gas to NLNG at Bonny for export. Therefore the Gas Plant is a very important asset to the National economy. The flow station and the Gas Plant are surrounded by a number of tidal estuarine water bodies, namely Sombreiro and Saint Batholomeau Rivers.
With the expansion of oil exploration and production, the incidence of oil spills has increased considerably within the region. Spills occur accidentally and through the deliberate actions of the local people, who sabotage pipelines to steal oil or in protest against the operations of the Federal Government and oil companies. Available records show that a total of 6,817 oil spills occurred between 1976 and 2001, with a loss of approximately three million barrels of oil (UNDP, 2006). The environmental effects of oil pollution are well known. They include the degradation of forests, depletion of aquatic fauna and destruction of biodiversity. Long-term impacts are also possible, as in cases where mangrove swamps and groundwater resources are impacted.
The Field study and assessments carried out are in compliance with relevant regulatory environmental requirements (DPR’s EGASPIN, 2002 and FMEnv EIA Act No. 86 of 1992), as well as SPDC’s HSE Policy.
It is hoped that the result of this study will enable the company to establish the extent of damage on the environment and effectiveness of its remediation activities following oil spillage and pollution within the environment, and hence take adequate steps where necessary to ensure the rehabilitation and recovery of the ecosystem.
Also, the study will hopefully enable the company to develop an effective environmental management and remediation plan for the impacted area in compliance with regulatory requirements (Environmental Management Plan of the FMenv derived from EIA Act of 1992; DPR EGASPIN, 2002). Such a plan would also consider any other significant anthropogenic activity in the area.
1.2 POST IMPACT ASSESSMENT
Post Impact Assessment Study (PIAS) is one of the environmental management and control tools employed in assessing the impacts of spillage due to an existing facility, project or an operation on the environment. It reviews the immediate and long term impacts of accidental discharges and spillages of harzadous substances (industrial wastes/effluents, raw materials, chemicals, crude oil and refined petroleum products). These are usually done using methodologies as indicated in baseline ecological and socio-economic studies, environmental audits and environmental evaluation reports.
19
The studies are carried out in accordance with the standards and guidelines laid out by the Federal Ministry of Environment (FMEnv) and the Department of Petroleum Resources (DPR). The PIAS also enables the industry, the operator and the government to understand the state of the polluted or impacted areas and develop strategies for protection and restoration of the affected areas.
The assessment by NDP has been carried out to determine the impacts of the spillages that have occurred in this site, the remediation efforts that has been carried out and their impacts on the environment leading to recommendations for the rehabilitation and restoration of the impacted sites.
1.3 STUDY OBJECTIVES AND WORK SCOPE
As earlier indicated, the general objectives for carrying out this assessment study is to:
determine the existing ecological and socio-economic conditions of the project area;
determine the effect of oil spills on sensitive areas determine the effect of oil spills on important species assess the effects of remediation activities on soil quality assess the effects of remediation activities on water quality establish the sensitivity of the various environmental components of the area; identify and evaluate the impact of the oil spillage and remediation activities on
the socio-ecological environment; develop control and rehabilitation strategies with a view to mitigating and
ameliorating significant adverse impacts, which the spillage and its remediation activities had on the biophysical and socio-environmental characteristics;
To achieve these objectives a detailed fieldwork was carried between 18th and 21st October 2012, during which water, sediment and soil samples were collected, vegetation, wildlife/biodiversity and socioeconomic / health studies were also carried out. Based on the results from these investigations an assessment was made of ecological and socioeconomic/health impacts.
1.4 THE CHOICE OF SOKU FIELD FOR IMPACT ASSESSMENT
STUDY
The choice of Soku Field by IUCN-NDP for field study was predicated by the fact that the area was within a mangrove swamp ecosystem, one of the chosen four ecological areas identified by the Panel for special attention during the Fieldwork activities.
20
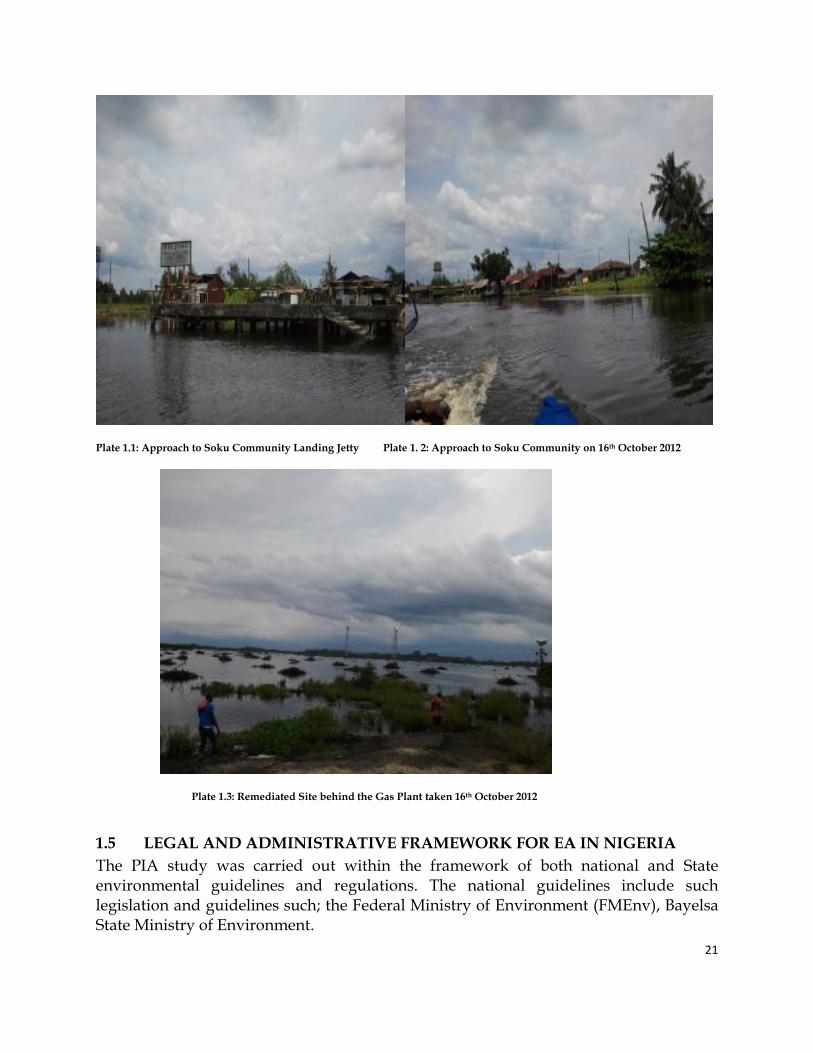
The mangrove swamp zone occurs immediately behind the barrier islands. They are the swampiest of the ecological zones, and consist of a massive swamp dotted with islands of dry land covering about 10,240 square kilometers. Most of the zone is at elevations of less than one meter, and it is generally muddy and under tidal influence. Another reason for selecting this site for the studies was that Soku Field and in particular the Gas Plant area had been exposed to several spillages in recent time arising from disruption of pipeline activities and condensate theft. A third reason was also because of the remediation activities of the polluted area following a recent condensate spillage in the area, and hence the need to ascertain the effectiveness of the remediation methods and efforts.
21
Plate 1.1: Approach to Soku Community Landing Jetty Plate 1. 2: Approach to Soku Community on 16th October 2012
Plate 1.3: Remediated Site behind the Gas Plant taken 16th October 2012
1.5 LEGAL AND ADMINISTRATIVE FRAMEWORK FOR EA IN NIGERIA
The PIA study was carried out within the framework of both national and State environmental guidelines and regulations. The national guidelines include such legislation and guidelines such; the Federal Ministry of Environment (FMEnv), Bayelsa State Ministry of Environment.
22
Reviews of Nigerian legislation, guidelines and international conventions that are relevant to the Project have been provided below. These legislation and guidelines are derived from Nigerian Government laws and regulations, and international conventions/ agreements/requirements.
The requirements for compliance with Environmental Audit in all parts of Nigeria
derive from the following general laws and enactments that stipulate and mandated
project proponents to abide by the standard requirements for Sustainable Development.
- National Environmental (Sanitation and Wastes Control) Regulations, S.I. No.28 of 2009
- National Environmental (Noise Standards and Control) Regulations, S.I. No.35 of 2009
- National Environmental (Permitting and Licensing System) Regulations, S.I. No.29 of 2009
- National Policy on Environment (1989) - Environmental Audit (EA) Act No.86 ,1992 - The defunct FEPA (now Federal Ministry of Environment) Act No. 58 of1988. - The Oil in Water Act,1986 - National Environmental Protection (Effluent Limitation) regulation S.I.8 of
1991. Pollution Abatement for Industries and Facilities Generating Wastes Regulations) FMENV, 1991.
- The Harmful Wastes ( Criminal Provisions) Act No.42,1988 - National guidelines and standard for Environmental Pollution Control in
Nigeria 1991 (The Green Book) - National Environmental Protection (Pollution Abatement in industries and
facilities generating wastes) Regulation S.I. 9 of 1991. - Pollution Abatement in Industries and Facilities Generating Wastes,
Regulation,S.1.9 of 1991. - National Environmental Protection (Management of Solid and Hazardous
wastes) Regulation S.I.15 of 1991. - Waste Management Regulations S.1.15 of 1991 - Act No 101 of 23 August 1993: Water Resources Act - Environmental Guidelines and Standards for the Petroleum Industry 2002 - NESREA Act of 2010 series on biodiversity - NOSDRA Act of 2006 - SPDC’s Policy on Safety Health and Environment
23
1.5.1 National Environmental Policy
The National Policy on Environment, 1991, defines guidelines and strategies for achieving the policy goal of sustainable development by:
Securing for all Nigerians a quality of environment adequate for their health and well-being.
Conserving and using the natural resources for the benefit of present and future generations.
Restoring, maintaining and enhancing the ecosystem and ecological processes essential for the preservation of biological diversity.
Raising public awareness and promoting understanding of the essential linkages between the environment, resources and development.
1.5.2 National Effluent Limitation Regulation
The National Effluent Limitation Regulation, S.1.8 of 1991 (No. 42, Vol. 78, August, 1991) makes it mandatory for industries as waste generating facilities to install anti-pollution and pollution abatement equipment on site.
1.5.3 Pollution Abatement in Industries and Facilities Generating Wastes Regulation
The Pollution Abatement Regulation, S.1.9 of 1991 (No.42, Vol. 78, August, 1991) imposes restrictions on the release of toxic substances and stipulates requirements for pollution monitoring units, machinery for combating pollution and contingency plan by industries; protection of workers and safety requirements; environmental audit (or environmental impact assessment for new industries) and penalty for contravention.
1.5.4 Management of Hazardous and Solid Wastes Regulation
The Management of hazardous and Solid Waste Regulation, S.1.15 of 1991 (No.102, Vol. 78, August, 1991) defines the requirements for groundwater protection, surface impoundment, land treatment, waste piles, landfills, incinerators etc. It states procedure for inspection, enforcement and penalty.
1.5.5 Land use Act
The Land use Act of 1978 protects the rights of all Nigerians to use and enjoy land in Nigeria which must be protected and preserved. Land acquisition must follow all the due process of law.
24
1.5.6 Forestry Act
This Act of 1958 provides for the preservation of forests and the setting up of forest reserves. It is an offence, punishable with up to 6 months imprisonment, to cut down trees over 2ft in height or to set fire to the forest except under special circumstances.
1.5.7 Criminal Code
The Nigerian Criminal Code makes it an offence punishable with up to 6 months imprisonment for any person who:
Violates the atmosphere in any place so as to make it noxious to the health of persons in general dwelling or carrying on business in the neighborhood, or passing along a public way.
1.5.8 Constitution of the Federal Republic of Nigeria
The Constitution of the Federal Republic of Nigeria expressly provides for a number of rights, which are recognized as inalienable to every citizen of the country. Deriving from this, the Consumer Affairs Bureau of the Nigerian Communication Commission (NCC) has listed some rights (Consumer Bill of Rights) which every consumer is entitled to. Two of such are: 1)The Right to be informed: This non-negotiable right impels service providers to factually and comprehensively inform consumers about a product or service devoid of falsehood, deceit, half-truth, misleading information and advertisement. 2)The Right to be heard: This provides ample opportunities and channels of expressing grievances, opinions, lodging of complain, suggesting ways and means of improving services delivery to customers.
1.5.9 Nuclear Safety and Radiation Protection Act
The Nuclear Safety and Radiation Protection Act No. 19 of 1995 established the Nigerian Nuclear Regulatory Authority is charged with the following responsibilities, among others:
Regulate the possession and application of radioactive substances and devices emitting ionizing radiation.
Ensure protection of life, health, property and the environment from the harmful effects of ionizing radiation while allowing beneficial practices involving exposure to ionizing radiation.
Regulate the introduction of radioactive sources, equipment or practices and of existing sources, equipment and practices involving exposure of workers and the general public to ionizing radiation.
1.5.10 River State Environmental Protection Edict of 1993
25
This covers Forestry management, environmental sanitation and waste management
establishes such environmental criteria, guidelines/specifications or standards for the
protection of the state’s air, lands and waters as may be necessary to protect the health
and welfare of the people.
1.5.11 International Conventions and Guidelines
United Nations Guiding Principles on the Human Environment in 1972, and the Rio Declaration on Environment and Development 1992 are key. Nigeria is signatory to these guiding principles and declarations.
United Nations Convention on Climate Change The convention on climate change was signed in 1992 during the Rio Earth Summit but put into force in 1994; to limit Green House Gas (GHG) emissions, which cause global warming.
Convention on Conservation of Migratory Species of Wild Animals This convention also known as the Bonn Convention of 1979 stipulates actions for the conservation and management of migratory species including habitat conservation.
Vienna Convention for the Protection of the Ozone Layer The convention was instituted in 1985 and places general obligations on countries to make appropriate measures to protect human health and the environment against adverse effects resulting from human activities which tend to modify the ozone layer.
Montreal Protocol on Substances that Deplete the Ozone Layer The protocol was adopted in 1987 as an international treaty to eliminate ozone depleting chemicals production and consumption.
1.5.12 NATIONAL REGULATORY BODIES
1.5.12.1 Federal Ministry of Environment (FMEnv)
The Federal Environmental Protection Agency (FEPA), which is now under the Federal Ministry of Environment with the enactment of democratic rule in May 1999, was set up by Act 58 of 1988. FMEnv is responsible for the Nigerian environment protection and conservation. The FMEnv is the major authority that has the statutorily responsibility of ensuring environmental compliance of development projects in Nigeria. FMEnv has put in place statutory documents to aid the control and abatement of industrial wastes ad indiscriminate pollution of the environment. Statutory documents prepared towards this end include:
26
S.1.8 - National Environmental Protection (Effluent Limitations) Regulations of 1991.
S.1.9 - National Environmental Protection (Pollution Abatement in Industries and Facilities Generating Wastes).
S.1.15 - National Environmental Protection Management of Solid and Hazardous Wastes Regulations of 1991.
EIA Act No 86 of 1992. The Harmful Wastes (Criminal Provisions) Act 42 of 1988. The 1989 National Policy on the Environment. The 1992 National Guidelines and Standards for Waste Management in the Oil
and Gas Industry.
These statutory documents spelt out clearly the restrictions imposed on the release of toxic substances into the environment and the responsibilities of all industries whose operations are likely to pollute the environment. Such responsibilities include provision of anti-pollution equipment, adequate treatment of effluent before discharge into the environment, etc. (S.I.8 and 9). For example, paragraph 15(2) of S.I.9 states that “no oil in any form shall be discharged into public drain, rivers, lakes, seas, atmosphere or underground injection without permit being issued by FMEnv or any organisation designated by the Ministry.” Also paragraph 17 states that an industry or a facility which is likely to release gaseous, particulate, liquid or solid untreated discharges shall install into its system, appropriate abatement equipment in such a manner as may be determined by the Ministry.
Specifically, S.I.15 provides a comprehensive list of wastes that are classified as being dangerous to the environment. It also gives detail on the contingency planning and emergency procedure to be followed in case of sudden release of any of these hazardous wastes into the environment.
1.5.12.2 National Inland Waterways Authority (NIWA) The National Inland Waterways Agency (NIWA) was established by the National Inland Waterways Act No. 31 of 1997 with the statutory mandate to oversee the improvement and development of the inland waterways for navigation. The agency is also responsible for the provision of alternative mode of transportation for the evacuation of economic goods and persons as well as to execute the objectives of the national transport policy as they concern inland waterways. The specific functions of NIWA relevant to this study are to:
provide regulations for inland navigation;
27
ensure the development of infrastructural facilities for a national inland waterways network connecting the creeks and the rivers with the economic centres using the river-ports as nodal points for intermodal exchange; and
Ensure the development of indigenous technical and managerial skill to meet the challenges of modern inland waterways transportation.
undertake capital and maintenance dredging; undertake hydrological and hydrographic survey: design ferry routes: survey, remove, and receive derelicts, wrecks and other obstructions from in
land waterways; operate ferry services within the inland waterways system; undertake installation and maintenance of lights, buoys and all navigational aids
along water channels and banks; issue and control licences for inland navigation, piers, jellies, dockyards; grant
permit and licences for sand dredging, pipeline construction, dredging of slots; and crossing of waterways by utility lines, water intake, rock blasting and removal;
approve and control all jetties, dockyards, piers within the inland waterways; reclaim land within the right-of-way; provide hydraulic structures for river and dams, bed and bank stabilisation,
barrages, groynes;
implement the Environmental Management Plan developed for the site in
accordance to FMEnv regulations;
undertake erection and maintenance of gauges, kilometre boards, horizontal and
vertical control marks;
advise government on all border mailers that relate to the inland waters;
undertake acquisition, leasing and hiring of properties;
dear water hyacinth and other aquatic weeds
28
CHAPTER TWO
2.0 OIL SPILL HISTORY OF THE AREA
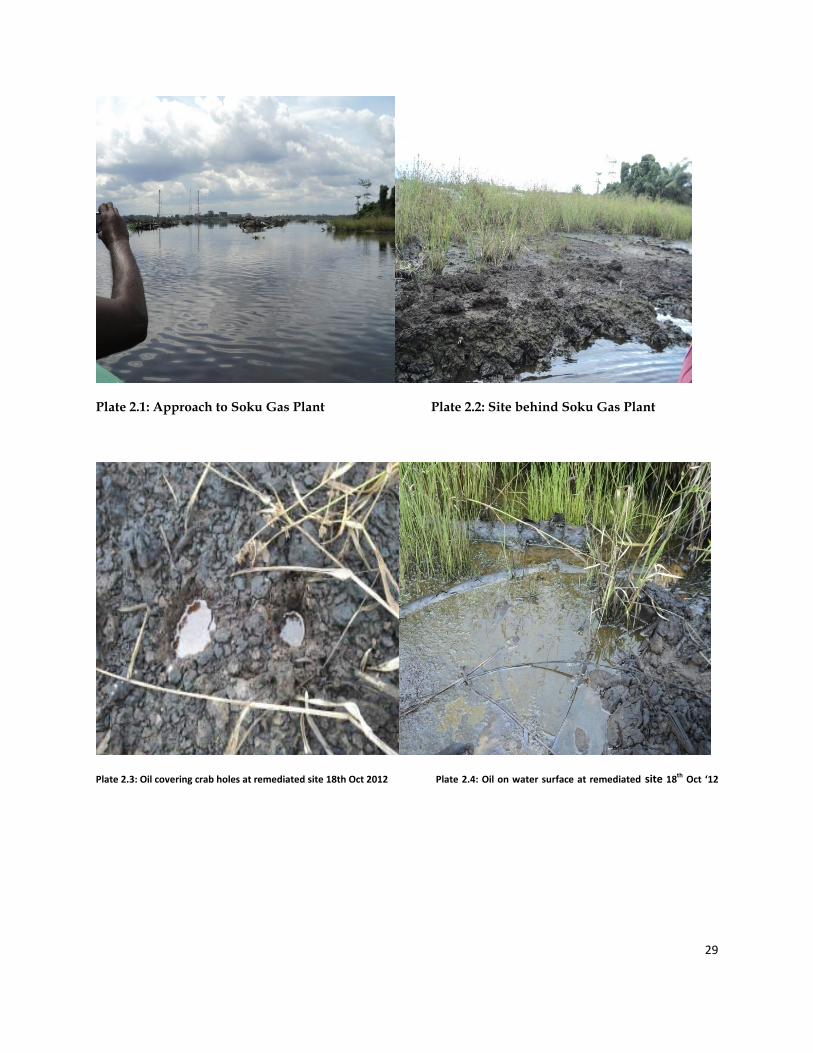
From the commencement of oil and gas exploration and production in Soku, there have been several periodic oil spills occurring from oil wells and pipelines. Gas flaring at the flow stations has also adversely affected the environment and negatively influenced the ecosystem. In April 2001, an oil spill was reported which was claimed to be as a result of sabotage. Subsequently a clean-up exercise was carried out. Community sources reported that they were not adequately compensated. Another spill occurred in 2003, which also was followed by clean-up activities. There was yet another occurrence of an oil spill in 2005 that was again attributed to sabotage. Adequate clean-up and compensation was reportedly carried out. Apart from crude oil spills that have occurred over the period, the area has experienced explosions and fire outbreaks. The current surge for condensate, which is a byproduct of gas production and is used by most people as fuel (PMS) during the shortage of petroleum, has created an illegal market for condensate. This trade often starts with people cutting the pipelines to get access to the product. Leaks, as result of this activity have been the source of fire and explosions that has consumed the mangrove forest in the vicinity of Soku Gas Plant. Some of the damaged areas have not been adequately cleaned up and in some areas remediation has been carried out or remediation is still on-going at the time of the fieldwork by the IUCN-NDP and the task force.
29
Plate 2.1: Approach to Soku Gas Plant Plate 2.2: Site behind Soku Gas Plant
Plate 2.3: Oil covering crab holes at remediated site 18th Oct 2012 Plate 2.4: Oil on water surface at remediated site 18th Oct ‘12
30
CHAPTER THREE
3.0 METHODOLGY
In order to establish the impact of oil-spill incidence on the ecological status of the environment, it was pertinent to estimate the qualitative and quantitative effects of the spillage within the study area. Therefore, information regarding surface and ground water, soil, sediment, vegetation, biodiversity and socio-economic / community health were gathered through extensive multi-disciplinary investigations in the field. The Baseline data acquisition exercise involved a multi-disciplinary approach and was executed within the framework of a QHSE management system approach. This approach assured that the required data and samples were collected in accordance with agreed requirements (scientific and regulatory) using the best available equipment, materials and personnel. Elements of this approach included: review of existing reports on the environment of the project area; designing and development of field sampling strategy to meet work scope and
regulatory requirements; review/confirmation of the work scope and sampling design and locations by
IUCN-NDP; pre-mobilisation activities (assembling of field team, sampling
equipment/materials, calibrations/checks, review of work plan and schedule with team, and job hazard analysis);
mobilisation to field; fieldwork implementation - sample collection (including positioning and field observations), handling, documentation and storage protocols and procedures; and
demobilisation from field; transfer of sample custody to the laboratory for analysis.
3.1 SAMPLING STRATEGY
The study was divided basically into: Physico-chemical parameters – soil, water and sediment will help to analyze the
standards/level of contamination after remediation Public / Ecosystem health issues – sampling of groundwater, surface water and
aquatic resources (particularly totemic species) to ascertain level of contamination and possible transfer through foodchain
Biodiversity – sampling of flora and fauna to establish impact and possible recolonization / regeneration following remediation. Data on density and
31
relative abundance will help to establish species richness and hence biodiversity in each ecosystem.
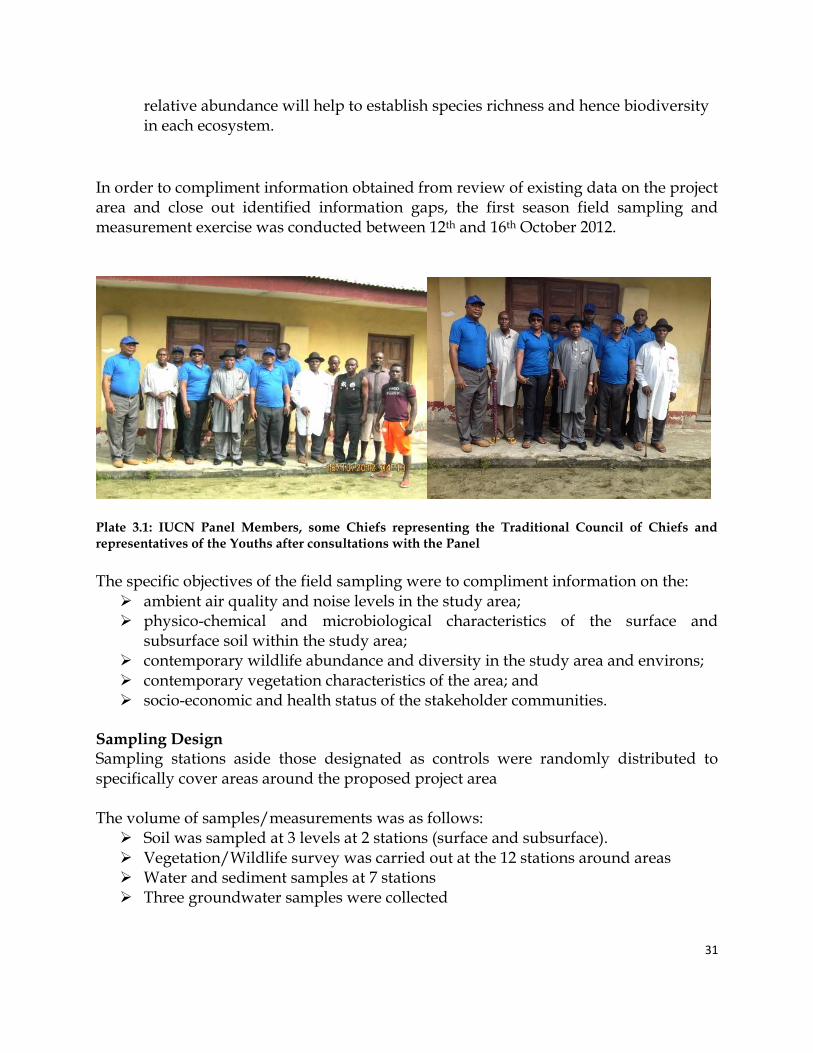
In order to compliment information obtained from review of existing data on the project area and close out identified information gaps, the first season field sampling and measurement exercise was conducted between 12th and 16th October 2012.
Plate 3.1: IUCN Panel Members, some Chiefs representing the Traditional Council of Chiefs and representatives of the Youths after consultations with the Panel
The specific objectives of the field sampling were to compliment information on the: ambient air quality and noise levels in the study area; physico-chemical and microbiological characteristics of the surface and
subsurface soil within the study area; contemporary wildlife abundance and diversity in the study area and environs; contemporary vegetation characteristics of the area; and socio-economic and health status of the stakeholder communities.
Sampling Design Sampling stations aside those designated as controls were randomly distributed to specifically cover areas around the proposed project area The volume of samples/measurements was as follows: Soil was sampled at 3 levels at 2 stations (surface and subsurface). Vegetation/Wildlife survey was carried out at the 12 stations around areas Water and sediment samples at 7 stations Three groundwater samples were collected
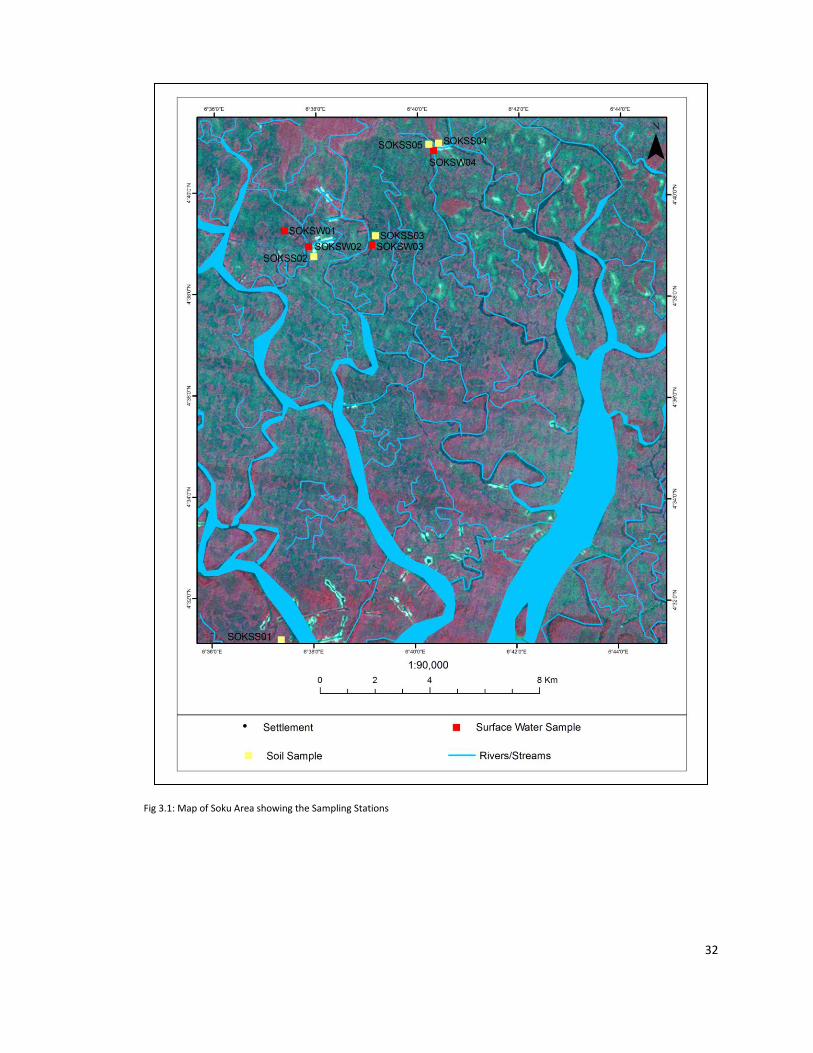
32
Fig 3.1: Map of Soku Area showing the Sampling Stations
33
Hydrobiological samples including phytoplankton, zooplankton and periphyton
and macrophytes were collected. Positioning During fieldwork activities, positioning at each sampling station was carried out with the aid of Global Positioning Systems (GPS) which was hand carried by the different groups of the study team. At each station, coordinates at which sampling actually took place was marked with the GPS and subsequently transferred into a field notebook.
3.2 WATER QUALITY
3.2.1 Field Data Gathering (Methodology)
The aquatic studies were undertaken to determine the effect of the remediation activities on the water quality after detailed reconnaissance visit. To be able to predict the activities of the remediation exercises on the environmental quality, sampling stations were established in such a manner as to adequately represent the area of operations. Sampling stations were chosen, marked and geolocated using Geographical Positioning System (Germin-12 GPS) including: Upstream, for the surface water, fishpond and groundwater.
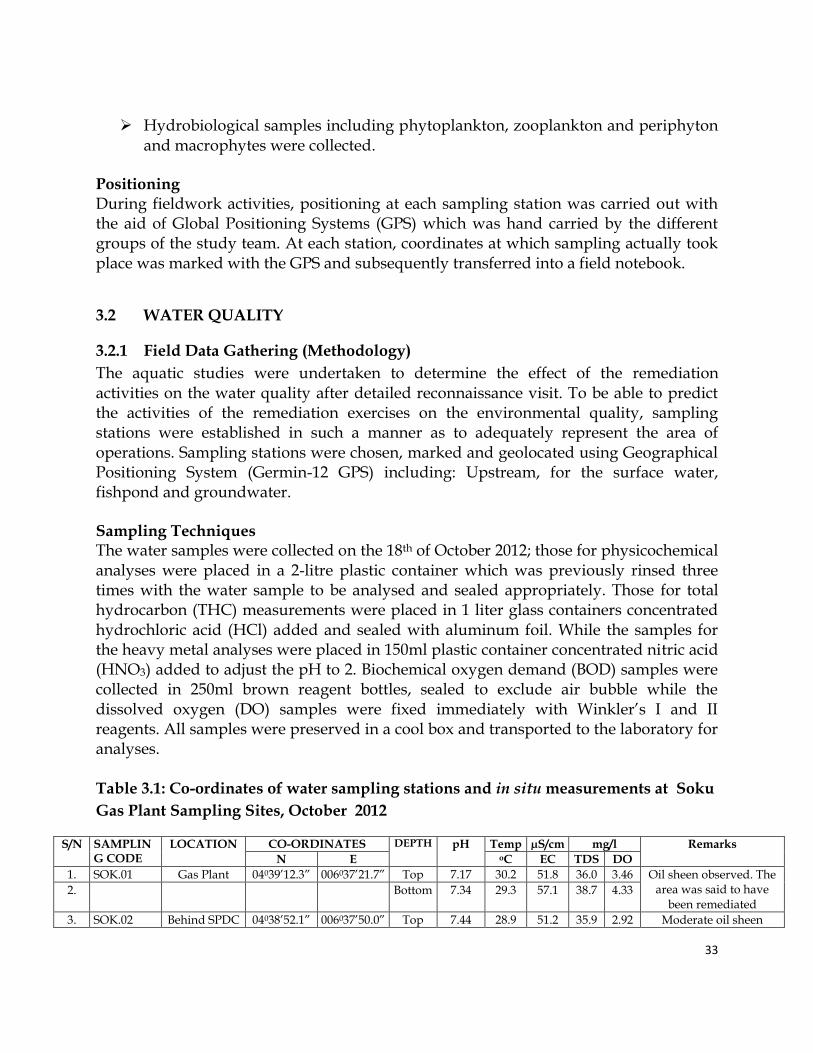
Sampling Techniques The water samples were collected on the 18th of October 2012; those for physicochemical analyses were placed in a 2-litre plastic container which was previously rinsed three times with the water sample to be analysed and sealed appropriately. Those for total hydrocarbon (THC) measurements were placed in 1 liter glass containers concentrated hydrochloric acid (HCl) added and sealed with aluminum foil. While the samples for the heavy metal analyses were placed in 150ml plastic container concentrated nitric acid (HNO3) added to adjust the pH to 2. Biochemical oxygen demand (BOD) samples were collected in 250ml brown reagent bottles, sealed to exclude air bubble while the dissolved oxygen (DO) samples were fixed immediately with Winkler’s I and II reagents. All samples were preserved in a cool box and transported to the laboratory for analyses. Table 3.1: Co-ordinates of water sampling stations and in situ measurements at Soku
Gas Plant Sampling Sites, October 2012
S/N SAMPLING CODE
LOCATION CO-ORDINATES DEPTH pH Temp µS/cm mg/l Remarks
N E oC EC TDS DO
1. SOK.01 Gas Plant 04039’12.3” 006037’21.7” Top 7.17 30.2 51.8 36.0 3.46 Oil sheen observed. The area was said to have
been remediated 2. Bottom 7.34 29.3 57.1 38.7 4.33
3. SOK.02 Behind SPDC 04038’52.1” 006037’50.0” Top 7.44 28.9 51.2 35.9 2.92 Moderate oil sheen
34
Plat form observed in the sampling area. 4. Bottom 7.50 29.0 51.6 35.1 3.83
5. SOK.03 Russian Camp
04039’01.4” 006039’10.1” Top 7.33 29.2 51.8 36.2 3.02 Fresh water ecology, no visible oil sheen, lightly
impacted 6. Bottom 7.25 28.8 51.2 35.6 3.62
7. SOK.04 Buffer Zone 04040’55.8” 006040’23.2” Top 7.28 28.9 52.5 36.4 3.14 Mangrove transitional area 8. Bottom 7.17 28.6 52.8 36.4 3.60
FMEnv Limits 6-9 <40 N/A 2000 N/A
DPR Limits 6.5-9.5 <40 N/A 2000 N/A
WHO Limits 6.5-8.5 N/A N/A 1000 5.0
Source: IUCN Taskforce Fieldstudy, 2012
3.2.2 Quality Assurance/Quality Control Standard field methods were used in the sample collection at the site as recommended by DPR (EGASPIN, 2002). To ensure the integrity of some unstable physicochemical parameters in-situ measurements of temperature, pH, electrical conductivity (EC), dissolved oxygen (DO), turbidity, salinity and total dissolved solids (TDS) were carried out in the field using water quality checker Horiba U-10. Sample Preservation and Storage The water samples collected were stored in ice-packed coolers and preserved in accordance with Part VII Section D of the DPR Environmental Guidelines and Standards (EGASPIN, 2002). All water samples for heavy metals were preserved by the addition of concentrated HN03, while to the samples for total hydrocarbon concentrated HCl was added.
3.2.3 Laboratory (Analytical) Procedures
Laboratory analyses of the physicochemical parameters were carried out in keeping with standard practice specified in DPR Environmental Guidelines and Standards (EGASPIN, 2002). Except otherwise stated, the laboratory methodologies for wastewater are from Standard Methods for the Examination of Water and Wastewater 19th Edition, 1998. Investigations involving heavy metals concentrations were carried out using atomic spectrophotometer (AAS Unicam 969). Exchangeable cations and anions measured using flame photometer and UV/Visible spectrometer (Unicam Helios Gamma, UVG 073201; Spectronic 21D). Briefly, the methods employed are as follows: pH, Electrical conductivity, Turbidity, Dissolved solids, Temperature and Salinity Measured using Horiba Water Checker (Model U-10) after calibrating the instrument with the standard Horiba solution. The units of measurement are µS/cm, NTU, mg/l, 0C and ‰; respectively for conductivity, turbidity, temperature and salinity. Dissolved Oxygen (APHA-4500 C)
35
The dissolved oxygen (DO) was determined by the Modified Azide or Winkler’s method (APHA 1998). To a 70ml BOD bottle filled with sample. 0.5ml manganous sulphate (Winkler I) solution and 0.5ml alkali-iodide-azide reagent (Winkler II) were added, stopper (excluding air bubbles) and mixed by several inversions. After about 10minutes, 0.5ml conc. H2SO4 is added, re-stopper and mixed for complete dissolution of precipitate. The fixed sample is taken to the laboratory for further analysis. Bio-chemical Oxygen Demand (APHA-5210-B) Known portion of the water sample collected is diluted with oxygenated and incubated at 20oC for five days. At the end of the incubation period the samples were treated in the same manner as the DO samples stated above. Detection limits 2.0mg/l. Total Alkalinity (API-RP 45) Bicarbonate determination is by titration with 0.02N H2SO4 using methyl orange indicator. The detection limit is 1.0mg/l as CaCO3 (APHA, 1985). Chloride (APHA 4500 – Cl- B) Chloride is titrimetrically determined by the Argentometric method in the presence of potassium chromate as indicator. Limit of detection is 1.0mg/l Sulfate (APHA 4500-SO42- E/AST MID 516) Sulphate determination is by the turbidimetric method (APHA 1998). To a 50ml sample or portion diluted to 50-ml contained in a conical flask, 2.5-ml of conditioning reagent (i.e. a mixture of 50ml glycerol with a solution of 30ml concentrated hydrochloric acid, 300ml distilled water, 100ml 95% ethanol and 75g sodium chloride) and a quarter spatula full barium chloride (BaCl2). The mixture is swirled for a minute and the barium sulphate (BaSO4) turbidity read at fifth minute on Spectronic 21D at 420nm against water. Sulphate level was read from a calibration curve prepared for known sulphate standards treated the same way as the samples. The detection limit is 1.0mg/l. Phosphate (APHA 4500-P E/ASTM D 515) Phosphate is determined using the stannous chloride method (APHA, 1998). To 50ml sample, the following were added with mixing 2.0ml ammonium molybdate reagent and 0.2ml stannous chloride reagent. After 10 minutes but before 12 minutes from addition of stannous chloride, the absorption of the treated sample is read on Spectronic 21D at 690nm. Phosphate level is obtained by reading off absorption level from standards curve of known standards treated as the samples. The detection limit is 0.05mg/l. Nitrate Nitrate measurement is by Ultraviolet Spectrophotometric screening method. To 50ml clear sample, 1ml HCl solution was added and mixed thoroughly. Absorbance
36
measurements made at the wavelength of 220nm and the nitrate concentration obtained from the standard curve. Limit of detection is 0.05mg/l. Total Hydrocarbon Content (THC) ASTM D3921 (Extraction/Spectrophotometry) A known volume of the sample was well agitated and poured into a separatory funnel. A known quantity of sodium chloride was added to prevent emulsification. Fifty millilitres (50ml) of xylene was added to the sample container and then shaken properly to rinse the container before transferring into the separatory funnel. The funnel was corked and shaken vigorously for about 1 minute. The mixture was allowed to stand for separation. The sample portion was run-off by opening the tap and then the extract transferred into a 100ml centrifuge tube by passing it through a filter paper containing 1g of sodium sulphate. The extraction process was repeated with another 50ml of xylene. The xylene layer was then collected into same centrifuge tube containing the first extract. The separatory funnel was rinsed with 10ml xylene before transferring into the centrifuge tube. The extract was centrifuge for 15mins at 1500 rpm and placed in a standard cuvette with a light path of 10mm. The spectrophotometer was standardized and sample readings taken. THC concentration was calculated with reference to the standard curve and multiplication by the appropriate dilution factor. Detection limit is 0.01mg/l. Heavy metals (Cr, Cu, Pb, Fe, Cd) APHA 3111-B (AAS) Heavy metals were determined using an Atomic Absorption Spectrophotometer (AAS) as described in APHA 3111B and ASTM D3651. This involved direct aspiration of the sample into an air/acetylene or nitrous oxide/acetylene flame generated by a hollow cathode lamp at a specific wavelength peculiar only to the metal programmed for analysis. For every metal investigated, standards and blanks were prepared and used for calibration before samples were aspirated. Concentrations at specific absorbance displayed on the data system monitor for printing. Limit of detection is <0.001mg/l.
3.2.4 Quality Assurance/Quality Control
Quality measures adopted for the laboratory analyses were in accordance with the recommendation of DPR Guidelines and Standards for Petroleum Industry in Nigeria (EGASPIN, 2002). To maintain analytical accuracy duplicate and blank samples were included in the analyses. Distilled water used for analysis conforms to ASTM D 1193 Type 1. Only qualified and trained personnel were employed in the laboratory work.
37
Also, analysis for hydrocarbons and heavy metals were carried out in two laboratories to ensure that dependable results were obtained. The laboratories used were the Institute of Pollution Studies in Rivers State University of Science and Technology and Rofnel Energy Services Ltd, Port Harcourt
3.3 SOIL QUALITY
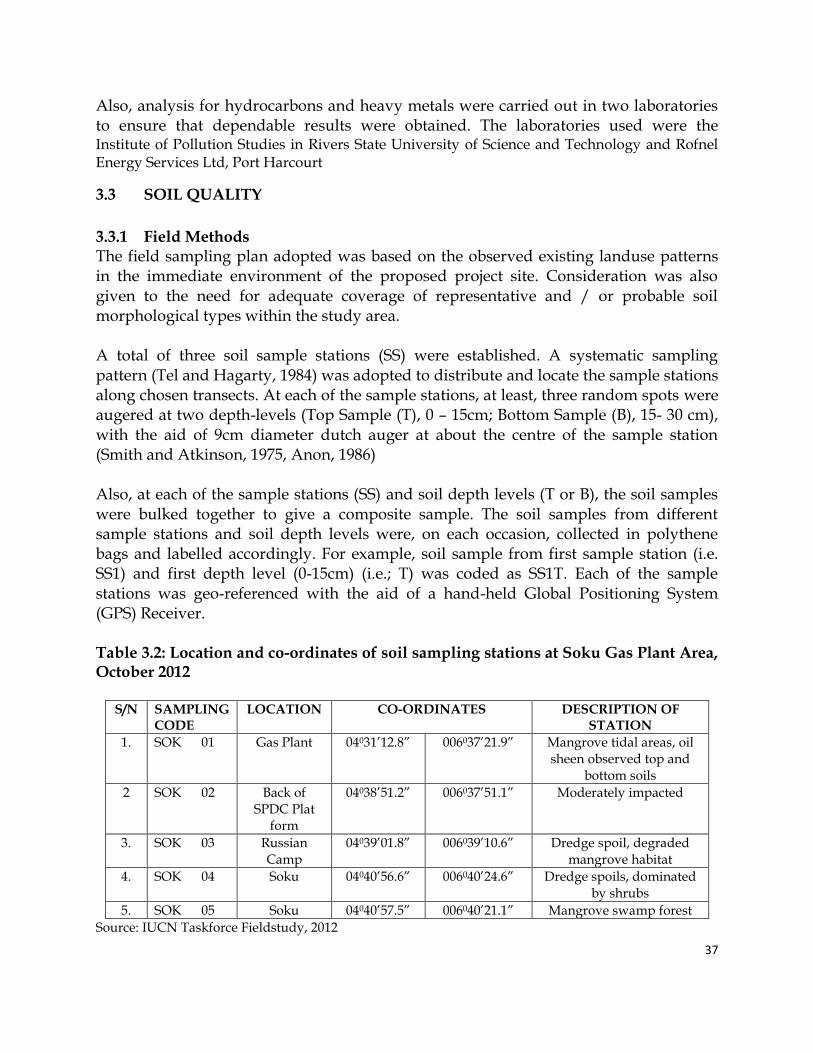
3.3.1 Field Methods The field sampling plan adopted was based on the observed existing landuse patterns in the immediate environment of the proposed project site. Consideration was also given to the need for adequate coverage of representative and / or probable soil morphological types within the study area. A total of three soil sample stations (SS) were established. A systematic sampling pattern (Tel and Hagarty, 1984) was adopted to distribute and locate the sample stations along chosen transects. At each of the sample stations, at least, three random spots were augered at two depth-levels (Top Sample (T), 0 – 15cm; Bottom Sample (B), 15- 30 cm), with the aid of 9cm diameter dutch auger at about the centre of the sample station (Smith and Atkinson, 1975, Anon, 1986) Also, at each of the sample stations (SS) and soil depth levels (T or B), the soil samples were bulked together to give a composite sample. The soil samples from different sample stations and soil depth levels were, on each occasion, collected in polythene bags and labelled accordingly. For example, soil sample from first sample station (i.e. SS1) and first depth level (0-15cm) (i.e.; T) was coded as SS1T. Each of the sample stations was geo-referenced with the aid of a hand-held Global Positioning System (GPS) Receiver. Table 3.2: Location and co-ordinates of soil sampling stations at Soku Gas Plant Area, October 2012
S/N SAMPLING CODE
LOCATION CO-ORDINATES DESCRIPTION OF STATION
1. SOK 01 Gas Plant 04031’12.8” 006037’21.9” Mangrove tidal areas, oil sheen observed top and
bottom soils
2 SOK 02 Back of SPDC Plat
form
04038’51.2” 006037’51.1” Moderately impacted
3. SOK 03 Russian Camp
04039’01.8” 006039’10.6” Dredge spoil, degraded mangrove habitat
4. SOK 04 Soku 04040’56.6” 006040’24.6” Dredge spoils, dominated by shrubs
5. SOK 05 Soku 04040’57.5” 006040’21.1” Mangrove swamp forest
Source: IUCN Taskforce Fieldstudy, 2012
38
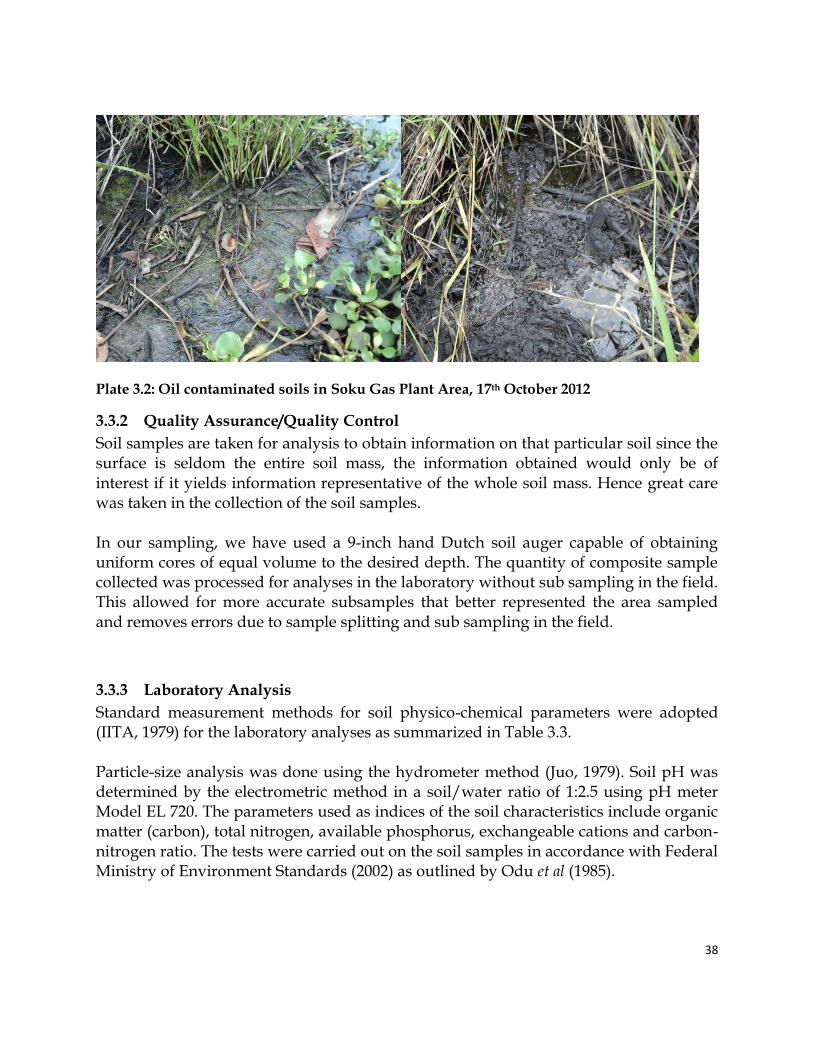
Plate 3.2: Oil contaminated soils in Soku Gas Plant Area, 17th October 2012
3.3.2 Quality Assurance/Quality Control
Soil samples are taken for analysis to obtain information on that particular soil since the surface is seldom the entire soil mass, the information obtained would only be of interest if it yields information representative of the whole soil mass. Hence great care was taken in the collection of the soil samples. In our sampling, we have used a 9-inch hand Dutch soil auger capable of obtaining uniform cores of equal volume to the desired depth. The quantity of composite sample collected was processed for analyses in the laboratory without sub sampling in the field. This allowed for more accurate subsamples that better represented the area sampled and removes errors due to sample splitting and sub sampling in the field.
3.3.3 Laboratory Analysis
Standard measurement methods for soil physico-chemical parameters were adopted (IITA, 1979) for the laboratory analyses as summarized in Table 3.3. Particle-size analysis was done using the hydrometer method (Juo, 1979). Soil pH was determined by the electrometric method in a soil/water ratio of 1:2.5 using pH meter Model EL 720. The parameters used as indices of the soil characteristics include organic matter (carbon), total nitrogen, available phosphorus, exchangeable cations and carbon-nitrogen ratio. The tests were carried out on the soil samples in accordance with Federal Ministry of Environment Standards (2002) as outlined by Odu et al (1985).

39
Table 3.3: Summary of Measurement Methods for Soil Physico-Chemical Parameters.
S/N Parameter Method
1. Particle Size Distribution (Sand, Silt and Clay)
Bouyoucos Hydrometer Method
2. Textural Classification Textural Triangle Method
3. pH pH Meter Measurement (on 1:1 soil solution mixture)
4. Electrical Conductivity Conductivity Meter Measurement
5. Total Organic Carbon/Organic Matter Content
Walkley-Black Method
6. Total Nitrogen Macro-Kjedahl Method
7. Ammonium Nitrogen Nessler’s Colorimetric method
8. Nitrate Nitrogen Color development and spectrophotometry
9. Available Phosphorus Bray No. 1 Method
10. Exchangeable Cations (K+, Ca2+, Mg2+, Na+)
Ammonium Acetate Extraction Method
11. Exchangeable Acidity (H+Al) KCl Exchange Method plus NaOH titration
12. Total Hydrocarbon Contents Spectrophotometry
13. Heavy Metals/Micronutrients
Perchloric acid digestion and Atomic Absorption Spectrophotometry
3.4 HYDROBIOLOGICAL
3.4.1 Zooplankton/ Phytoplankton studies
The distribution, composition and abundance of the biotic components of any aquatic system are intimately that to change with environmental parameters like temperature, dissolved oxygen, alkalinity and salinity, have been used as indices of environmental changes. This study was aimed at the identification and enumeration of the plankton communities within the study area, with a view to ascertaining their taxonomic
40
composition and spatial distribution. Also, it was aimed at the monitoring of any likely changes due to environmental stress. The plankton of mangrove creeks, fresh water creeks and swamps includes permanent forms and several temporary components including newly-hatched shellfish larvae leaving the creeks and returning post larvae juveniles, and strived-up benthic forms. The composition and abundance varies considerably according to diurnal, tidal and semi-lunar cycle.
3.4.2 FIELD METHODOLOGY
3.4.2.1 Phytoplankton Samples were collected in sub-surface (20cm) water. One litre of water was collected and preserved in 30ml of 4%formalin and stored in the dark at room temperature. In the laboratory samples were concentrated to about 50m1 by sedimentation over a period of 48hours. Further concentration was done using a centrifuge at a speed of 100 rev/mm. From the concentration, 1ml of the sample was taken and transferred to a Sedgwick rafter cell and a preliminary scan was made under a microscope. In all samples 1ml of the concentrate was diluted because of the large number of cells in the concentration 1ml of the concentrate was diluted with 9m1 of the diluted water. The sample was thoroughly mixed and five sub-samples of 1ml each were placed Sedgwick rafter cell and viewed under a binocular microscope (x200), cells viewed under the microscope were identified with the aid of keys to plankton identification, cells were enumerated and the total number of the cells per litre of samples was estimated from the relationship;
N/L =C (1000mm3) ---------------(1) LDWS Where C= mean number of organisms or cell in the sample viewed L= Length of Sedgwick rafter cell D= Depth of Sedgwick rafter cell W = Width of strip viewed S = Number of trips
3.4.2.2 Zooplankton:
Plankton net of mesh size of 30–50 µm was towed for a minimum of 3 minutes at a maximum speed of 5km/h. The zooplankton on the sides of the net was washed down into the collection bottle. Samples were then put in a 250 ml labelled container and preserved with 5% ethanol and kept in the dark. In the laboratory the samples
41
were concentrated immediately and preserved with 70% ethanol (5% glycerine also added) and volume made up to 100ml. The size of the sub-sample was 1/100. In the laboratory analysis, the plankton population was enumerated using a counting chamber {Sedgwick – Rafter (S-R) counting cell} which limits the volume and area for the ready calculation of population densities. The tally system was also adopted in this method, after counting; the number of cell per ml was then multiplied by a correction factor so as to adjust for dilution of the sample. The organisms were identified using standard bench references (Pourriot, 1980) and reported as number of individuals per mL. The individual organisms were identified with the aid of a Ziess binocular microscope at x40/100x, a standard bench references and CD–ROM from the Intergovernmental Oceanographic Commission of U.N.E.S.C.O.
3.4.2.3 Pelagic Microalgae
A plankton net (mesh aperture = 30 – 70 µm) was used for the quantitative (10l) tow-sampling of the microalgae. The microalgae on the sides of the net were watched down into the collection bottle with the water from the outside. Samples were put in a 250 ml labelled container and preserved with 5% neutral formalin and kept in the dark. On getting to the laboratory, the samples were filtered through a 0.45μm membrane filter paper (with a vacuum of less than 0.5 atm.) and preserved with 70% ethanol. Volume was made up to 100 ml . The size of the sub-sample was 1/100. The microalgae population was enumerated using a counting chamber {Sedgwick – Rafter (S-R) counting cell}. The tally system was adopted in this method, after counting, the number of cells per ml was then multiplied by a correction factor so as to adjust for dilution of the sample. The individual organisms were identified with the aid of a Zeiss binocular microscope at x40/x100, a standard bench references (see reference section) and a CD–ROM from U.N.E.S.C.O, while an Olympus CX3, Hypercrystal LCD binocular microscope was deployed for the photo-microscopy of the samples from this study.
For the Aquatic macrophytic studies, the vegetation samples were as much as possible identified on the field to the species level with the aid of Akobundu and Agbakwa (1998), “A handbook of West African weeds and the life form spectrum”, the floristic structure and composition of the various plant community samples were worked out using the Raunkaerium (1934) life form classification scheme.
3.4.2.4 Benthic macrofauna
Sampling started from 17 October 2012, four sampling stations were selected. Three replicates of benthic samples were collected from each station within a one-meter
42
square quadrat and composited to form one sample. The intertidal samples were collected from each station with Ekman’s grab. Samples were sieved using 0.65” mesh and the residues in the sieve were emptied into wide mouth well labelled plastic containers. The samples were then preserved with 10% formalin to which Rose bengal stain was added (Hart and Zabbey, 2005). Another set of samples (macrophyte associated fauna) were also collected within the 4 stations. The modified kick sampling technique as described by Victor and Ogbeibu (1985) was used in the collection of benthic macro fauna from the macrophyte roots within the biotope of each station of one meter square. A hand-net (0.65” mesh size) was used in sampling of the substratum; three different points were pooled to form one composite sample per station (Ogbeibu and Oribhabor, 2001). The samples were preserved in the same way as earlier mentioned in separate containers, sorting was performed in the laboratory, the macro fauna were sorted in white tray containing water. The sorted stained faunal species were removed and further preserved in 50% Propyl alcohol in vial containers. These were identified to the lowest possible taxonomic level under a stereo and compound microscope and individuals of each taxonomic group connected and recorded. Identification was done using different keys such as: Day (1967), Mellanby (1975); Young (1976), Edmon (1978); Powell (1980); and FAO (1990) etc.
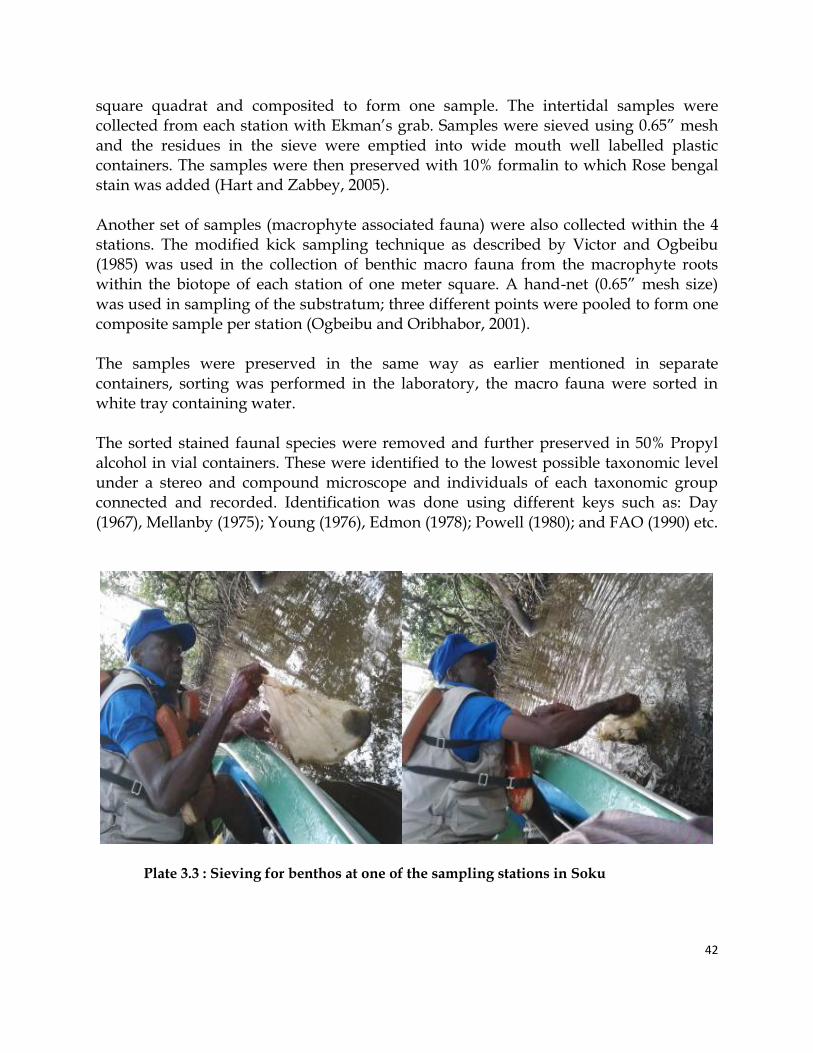
Plate 3.3 : Sieving for benthos at one of the sampling stations in Soku
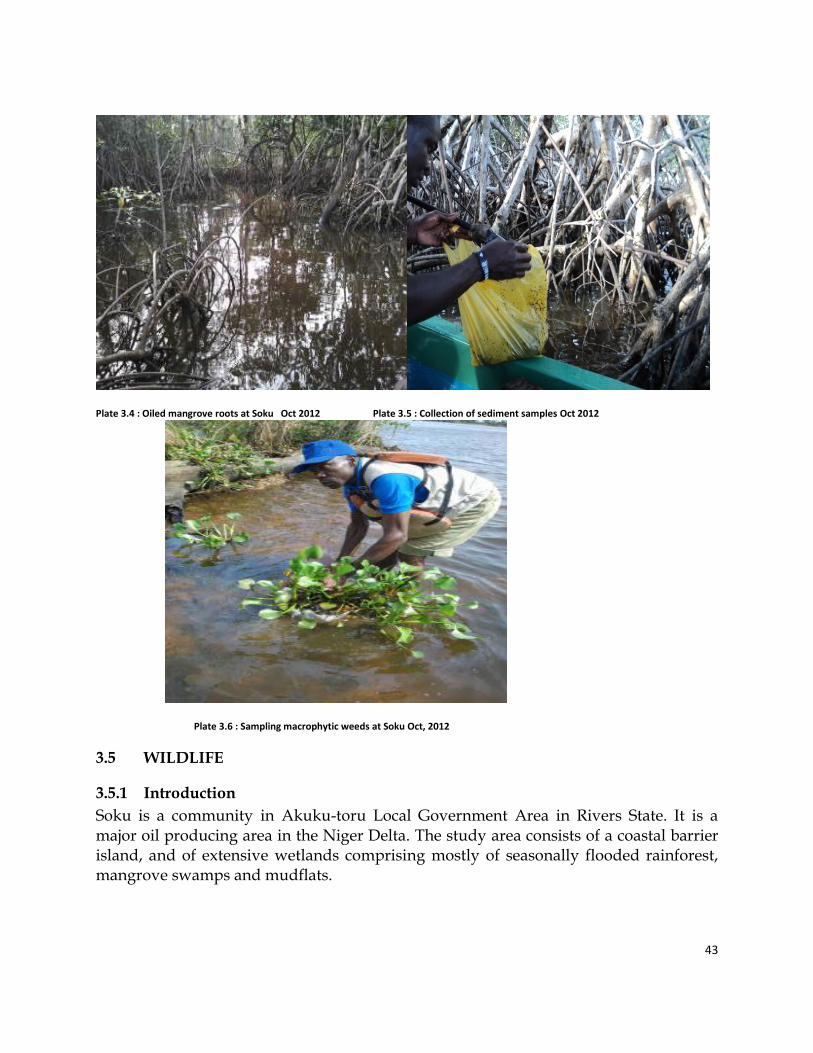
43
Plate 3.4 : Oiled mangrove roots at Soku Oct 2012 Plate 3.5 : Collection of sediment samples Oct 2012
Plate 3.6 : Sampling macrophytic weeds at Soku Oct, 2012
3.5 WILDLIFE
3.5.1 Introduction
Soku is a community in Akuku-toru Local Government Area in Rivers State. It is a major oil producing area in the Niger Delta. The study area consists of a coastal barrier island, and of extensive wetlands comprising mostly of seasonally flooded rainforest, mangrove swamps and mudflats.

44
The juxtaposition and interspersion of these habitat types and the geographical location of the island on one of the coastal flyways of the Afro-European migratory bird system, is probably responsible for the diversity and abundance of bird life in the area. 3.5.2 Methods Two major method were used in the study namely; Direct and indirect methods. The direct is by the use of 42 x 10 Bushnell binocular for identification of mammals, birds and reptiles in the field. Other methods used are footprints, droppings, vocalization, and nest and burrow in tree trunks and on ground. Indirect is by interviews with local hunters and farmer using the study area in the community. During the interviews, field guide books were used of mammals, birds and reptiles for confirmation of species.
45
CHAPTER FOUR
4.0 RESULTS AND DISCUSSION
4.1 SURFACE AND GROUND WATER QUALITY
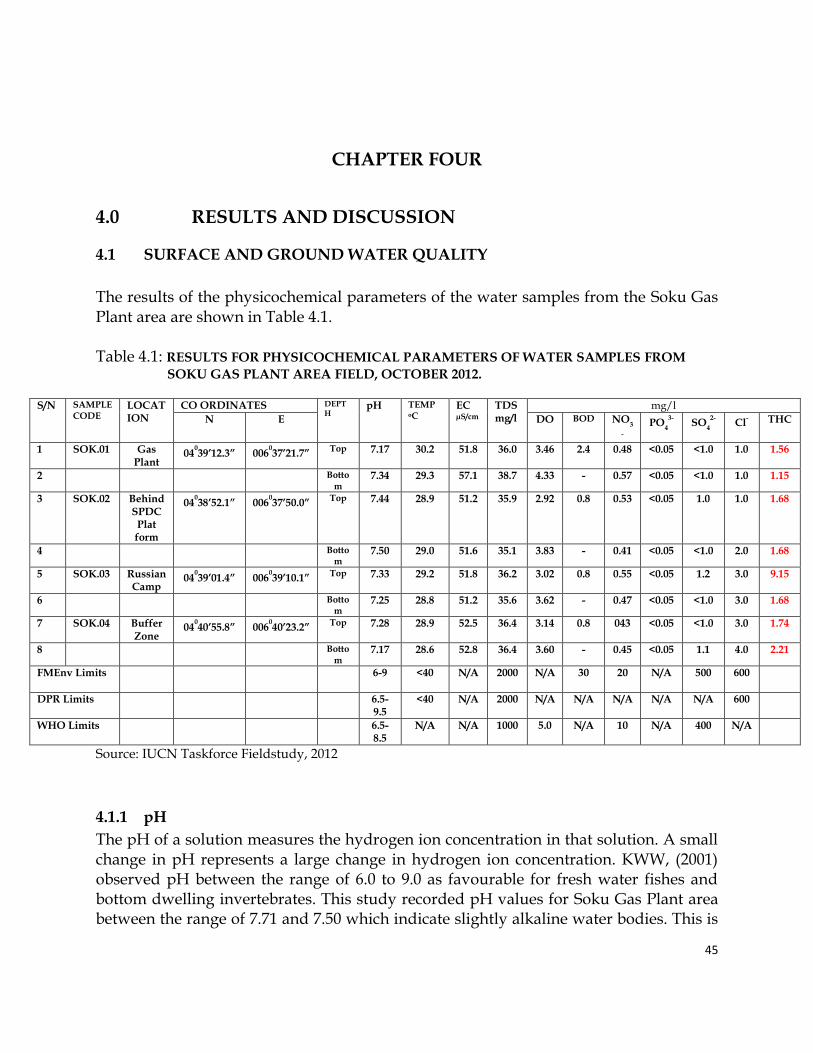
The results of the physicochemical parameters of the water samples from the Soku Gas Plant area are shown in Table 4.1. Table 4.1: RESULTS FOR PHYSICOCHEMICAL PARAMETERS OF WATER SAMPLES FROM
SOKU GAS PLANT AREA FIELD, OCTOBER 2012.
S/N SAMPLE CODE
LOCATION
CO ORDINATES DEPTH
pH TEMP oC
EC µS/cm
TDS mg/l
mg/l
N E DO BOD NO3
-
PO4
3- SO
4
2- Cl
- THC
1 SOK.01 Gas Plant
04039’12.3” 006
037’21.7” Top 7.17 30.2 51.8 36.0 3.46 2.4 0.48 <0.05 <1.0 1.0 1.56
2 Bottom
7.34 29.3 57.1 38.7 4.33 - 0.57 <0.05 <1.0 1.0 1.15
3 SOK.02 Behind SPDC
Plat form
04038’52.1” 006
037’50.0” Top 7.44 28.9 51.2 35.9 2.92 0.8 0.53 <0.05 1.0 1.0 1.68
4 Bottom
7.50 29.0 51.6 35.1 3.83 - 0.41 <0.05 <1.0 2.0 1.68
5 SOK.03 Russian Camp
04039’01.4” 006
039’10.1” Top 7.33 29.2 51.8 36.2 3.02 0.8 0.55 <0.05 1.2 3.0 9.15
6 Bottom
7.25 28.8 51.2 35.6 3.62 - 0.47 <0.05 <1.0 3.0 1.68
7 SOK.04 Buffer Zone
04040’55.8” 006
040’23.2” Top 7.28 28.9 52.5 36.4 3.14 0.8 043 <0.05 <1.0 3.0 1.74
8 Bottom
7.17 28.6 52.8 36.4 3.60 - 0.45 <0.05 1.1 4.0 2.21
FMEnv Limits 6-9 <40 N/A 2000 N/A 30 20 N/A 500 600
DPR Limits 6.5-9.5
<40 N/A 2000 N/A N/A N/A N/A N/A 600
WHO Limits 6.5-8.5
N/A N/A 1000 5.0 N/A 10 N/A 400 N/A
Source: IUCN Taskforce Fieldstudy, 2012
4.1.1 pH
The pH of a solution measures the hydrogen ion concentration in that solution. A small change in pH represents a large change in hydrogen ion concentration. KWW, (2001) observed pH between the range of 6.0 to 9.0 as favourable for fresh water fishes and bottom dwelling invertebrates. This study recorded pH values for Soku Gas Plant area between the range of 7.71 and 7.50 which indicate slightly alkaline water bodies. This is
46
capable of protecting fishes and bottom dwelling invertebrates in the area. The values are within the DPR regulatory limits of 6-9/6.5-9.5 respectively.
4.1.2 Temperature
According to Bradford (1993) temperature influences the distribution many aquatic organisms; that many cannot survive very high or low temperatures. Surface water temperature in the study area ranged from 28.6oC to 30.2oC. This signifies the most favorable condition for the survival of aquatic life (RPI, 1985; Osibanjo and Ajayi, 1981).
4.1.3 Electrical Conductivity (EC)
Electrical Conductivity (EC) is related to the concentration of ionized substances in water or the measure of ionic richness in a river course. In the study area EC varied
from 51.2 S/cm to 57.1S/cm. The recorded values compared well with EC level recorded earlier within the Niger Delta Region (RPI, 1995).
4.1.4 Dissolved Oxygen (DO)
Dissolved oxygen (DO) is the measure of the amount of gaseous oxygen dissolved in an aqueous solution. It is one of the most important parameters in aquatic life as it is an absolute requirement for the metabolism of aerobic organisms and also influences inorganic chemical reactions. The concentration of DO vary daily and seasonally and depends on the species of phytoplankton present, light penetration, nutrient availability, temperature, salinity, water movement, partial pressure of atmospheric oxygen in contact with the water, thickness of the surface film and the bio-depletion rates (Emerson and Abell, 2001). The DO levels of the surface waters in the area ranged from 2.92 mg/l to 4.33mg/l which is slightly below WHO regulatory limits of 5 mg/l. Odiete, (1999) confirms level above those recorded to be favourable for the survival of aquatic organisms within Niger Delta. The dissolved oxygen concentrations, consumption and demand vary between aquatic organisms especially fish species. Ophiocephalus obscura, the snakehead, Clarias gariepinus and other catfish species among others can survive with DO ranged from 0.5 to 4mg/l while very large amounts of DO (7 to 11mg/l) is required to keep species such as Palaemonetes africana, Paeneus kerathurus (shrimps) alive.
4.1.5 Total Dissolved Solids (TDS)
Excess TDS discharge in water bodies are of concern due to its potential for causing unfavourable physiological reactions in aquatic organisms (EBM, 1994). However, in the study area the total dissolved solids varied from 3.51 mg/l to 38.7mg/l. These values are lower than the DPR limit of 2000mg/l for surface water and 1000 mg/l WHO
47
limits for drinking water. Any noticeable increase in this value may be associated with increasing runoff (occasioned by regular rainfall) and vigorous anthropogenic activities as well as disturbances of the waterways by boats and fishing activities.
4.1.6 Biochemical Oxygen Demand (BOD)
Biochemical oxygen demand (BOD) is an indirect measure for the amount of biologically degradable organic materials in water, and is an indicator of the amount of dissolved oxygen that will be depleted from water during natural biological assimilation of organic pollutants. Excess BOD in water therefore could adversely affect the survival of aquatic organisms within that ecosystem. The BOD recorded in this study ranged from 0.8 – 2.4 mg/l and are all below the FMEnv limits of 30mg/1.
4.1.7 Nutrients
While nitrogen and phosphorus occur in nature and are critical to plant life in the aquatic environment, too much of the nutrients cause an excessive growth of phytoplankton and other organisms, which deprive aquatic life including fish and plants of oxygen (Enger and Smith, 2004). The concentration of nitrates (NO3-) ranged from 0.41 mg/l to 0.57mg/l as against the FMENV limits of 20mg/l while Sulphates (SO42-) recorded values were between <1.0mg/l and 1.1mg/l very much lower and highly insignificant compared to the FMEnv regulatory limits of 500mg/l. Phosphate values were lower than 0.05mg/l. The values were consistent with Niger Delta swamp water environment (RPI, 1985).
4.1.8 Chloride/ Oil/Grease
The chloride levels of the water bodies in the study area were between 1.0 mg/l and 4.0mg/l. The values below the FMEnv/DPR regulatory limits of 600mg/l. Oil and grease varied from 1.15 mg/l to 9.15mg/l indicating high level of hydrocarbon contamination and were higher than those previously recorded in polluted sites elsewhere in the Niger Delta (Ekweozor, 1989, Agbozu and Ekweozor, 2002 and Ekweozor et al., 2004).
4.2 SEDIMENT QUALITY
Sediment Characteristics Sediment characteristics of Soku Gas Plant area from the two laboratories used in the analysis are presented in Tables 4.2 and 4.3. pH, Conductivity and THC Sediment samples are moderately acidic with a pH range of 4.48 to 6.12; the sediment conductivity ranged from 171 to 412µS/cm; whilst the total hydrocarbon content
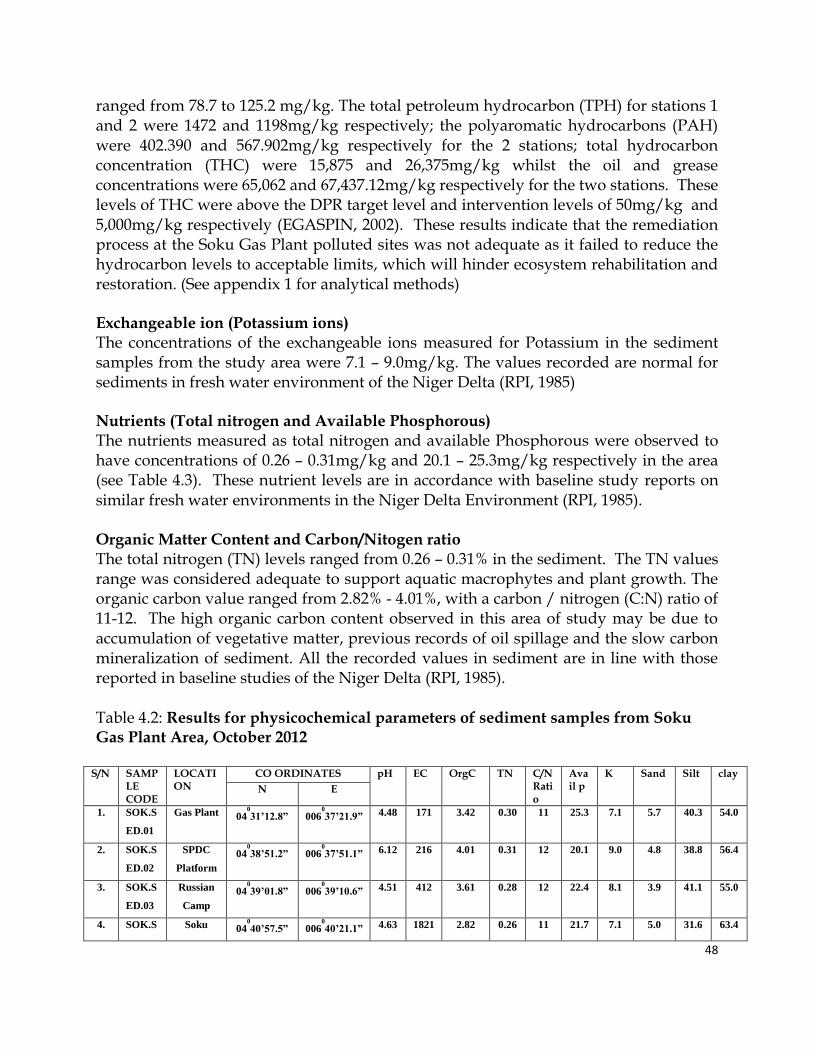
48
ranged from 78.7 to 125.2 mg/kg. The total petroleum hydrocarbon (TPH) for stations 1 and 2 were 1472 and 1198mg/kg respectively; the polyaromatic hydrocarbons (PAH) were 402.390 and 567.902mg/kg respectively for the 2 stations; total hydrocarbon concentration (THC) were 15,875 and 26,375mg/kg whilst the oil and grease concentrations were 65,062 and 67,437.12mg/kg respectively for the two stations. These levels of THC were above the DPR target level and intervention levels of 50mg/kg and 5,000mg/kg respectively (EGASPIN, 2002). These results indicate that the remediation process at the Soku Gas Plant polluted sites was not adequate as it failed to reduce the hydrocarbon levels to acceptable limits, which will hinder ecosystem rehabilitation and restoration. (See appendix 1 for analytical methods) Exchangeable ion (Potassium ions) The concentrations of the exchangeable ions measured for Potassium in the sediment samples from the study area were 7.1 – 9.0mg/kg. The values recorded are normal for sediments in fresh water environment of the Niger Delta (RPI, 1985) Nutrients (Total nitrogen and Available Phosphorous) The nutrients measured as total nitrogen and available Phosphorous were observed to have concentrations of 0.26 – 0.31mg/kg and 20.1 – 25.3mg/kg respectively in the area (see Table 4.3). These nutrient levels are in accordance with baseline study reports on similar fresh water environments in the Niger Delta Environment (RPI, 1985).
Organic Matter Content and Carbon/Nitogen ratio The total nitrogen (TN) levels ranged from 0.26 – 0.31% in the sediment. The TN values range was considered adequate to support aquatic macrophytes and plant growth. The organic carbon value ranged from 2.82% - 4.01%, with a carbon / nitrogen (C:N) ratio of 11-12. The high organic carbon content observed in this area of study may be due to accumulation of vegetative matter, previous records of oil spillage and the slow carbon mineralization of sediment. All the recorded values in sediment are in line with those reported in baseline studies of the Niger Delta (RPI, 1985).
Table 4.2: Results for physicochemical parameters of sediment samples from Soku Gas Plant Area, October 2012
S/N SAMP
LE CODE
LOCATION
CO ORDINATES pH EC OrgC TN C/N Ratio
Avail p
K Sand Silt clay
N E
1. SOK.S
ED.01
Gas Plant 040
31’12.8” 0060
37’21.9” 4.48 171 3.42 0.30 11 25.3 7.1 5.7 40.3 54.0
2. SOK.S
ED.02
SPDC
Platform
040
38’51.2” 0060
37’51.1” 6.12 216 4.01 0.31 12 20.1 9.0 4.8 38.8 56.4
3. SOK.S
ED.03
Russian
Camp
040
39’01.8” 0060
39’10.6” 4.51 412 3.61 0.28 12 22.4 8.1 3.9 41.1 55.0
4. SOK.S Soku 040
40’57.5” 0060
40’21.1” 4.63 1821 2.82 0.26 11 21.7 7.1 5.0 31.6 63.4
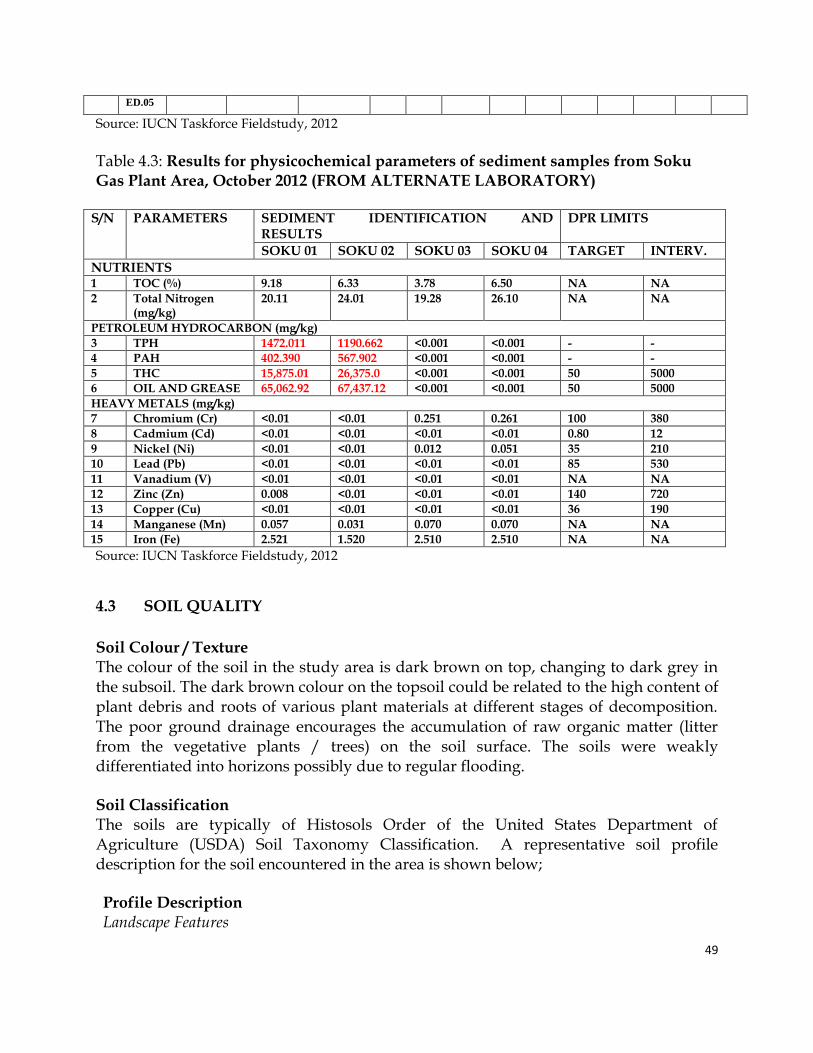
49
ED.05
Source: IUCN Taskforce Fieldstudy, 2012
Table 4.3: Results for physicochemical parameters of sediment samples from Soku Gas Plant Area, October 2012 (FROM ALTERNATE LABORATORY)
S/N PARAMETERS SEDIMENT IDENTIFICATION AND RESULTS
DPR LIMITS
SOKU 01 SOKU 02 SOKU 03 SOKU 04 TARGET INTERV.
NUTRIENTS 1 TOC (%) 9.18 6.33 3.78 6.50 NA NA
2 Total Nitrogen (mg/kg)
20.11 24.01 19.28 26.10 NA NA
PETROLEUM HYDROCARBON (mg/kg)
3 TPH 1472.011 1190.662 <0.001 <0.001 - -
4 PAH 402.390 567.902 <0.001 <0.001 - -
5 THC 15,875.01 26,375.0 <0.001 <0.001 50 5000
6 OIL AND GREASE 65,062.92 67,437.12 <0.001 <0.001 50 5000
HEAVY METALS (mg/kg)
7 Chromium (Cr) <0.01 <0.01 0.251 0.261 100 380
8 Cadmium (Cd) <0.01 <0.01 <0.01 <0.01 0.80 12
9 Nickel (Ni) <0.01 <0.01 0.012 0.051 35 210
10 Lead (Pb) <0.01 <0.01 <0.01 <0.01 85 530
11 Vanadium (V) <0.01 <0.01 <0.01 <0.01 NA NA
12 Zinc (Zn) 0.008 <0.01 <0.01 <0.01 140 720
13 Copper (Cu) <0.01 <0.01 <0.01 <0.01 36 190
14 Manganese (Mn) 0.057 0.031 0.070 0.070 NA NA
15 Iron (Fe) 2.521 1.520 2.510 2.510 NA NA
Source: IUCN Taskforce Fieldstudy, 2012
4.3 SOIL QUALITY
Soil Colour / Texture The colour of the soil in the study area is dark brown on top, changing to dark grey in the subsoil. The dark brown colour on the topsoil could be related to the high content of plant debris and roots of various plant materials at different stages of decomposition. The poor ground drainage encourages the accumulation of raw organic matter (litter from the vegetative plants / trees) on the soil surface. The soils were weakly differentiated into horizons possibly due to regular flooding. Soil Classification The soils are typically of Histosols Order of the United States Department of Agriculture (USDA) Soil Taxonomy Classification. A representative soil profile description for the soil encountered in the area is shown below;
Profile Description Landscape Features
50
Physiography Almost flat with very insignificant micro relief of undulating geomorphology
Drainage Poorly drained. The high fractions of loam on the surface soil may have given rise to the slow rate of inundation and low gradient which allows tidal waters remain in the swamp for long periods.
Land Quality Evaluation
Prime land that could be used for lumbering constrained to agricultural use due to inundated surface; unstable physical characteristics threat of erosion
Particle size distribution, textural class of soils of the study area are presented in Table 4.4. Soil texture was mainly clay. The preponderance of clayish nature of the soil may be due to the mangrove estuarine nature of the creek area. That could also have influence on the water holding capacity of the swamp soils. The high fractions of silt and clay in most stations probably result from the slow rate of inundation and low gradient which allows seasonally flooded waters to remain in the swamp for long periods. The stable nature of drainage pattern and silting process in the swamp resulted in a uniform pattern of textural layers in the stations sampled. The high sand content in the station close to the town (90% sand) could be attributed to sand filling of the area and turbulence which permits coarse fractions to settle out of suspension at the channel margins. Effiong et al., (2010) reported similar results in some soils of the Niger Delta. Particle size distribution showed similarity from those previously reported for soils in the estuarine Niger Delta region. In this study, high clay content (66.5%) occurred in most of the stations sampled. Clay made up 60-66.5 %, the silt constitutes 29.0-32 % and the sand comprises 3.0 – 5.0%. This trend is maintained in all the soil samples besides station 4. Particle sorting is affected by soil type, rainfall intensity/frequency, random roughness, slope length/gradient/shape of the topography. Silty clay to clay textured soils have the highest water holding capacity. This implies that in the case of spillages, while the soil prevents easy seepage to the groundwater it retains the spilled oil for longer period. The dominant colours in the soil varied from brownish grey to dark grey in all the stations. This observation implies that the soil being regularly flooded was very weakly differentiated into horizons. The colour of these soils is influenced by the extent of oxidation of iron and manganese salts (Gigholi and Thornton, 1965). As a result of permanently waterlogged conditions, soil of the study area showed little variation in colours.
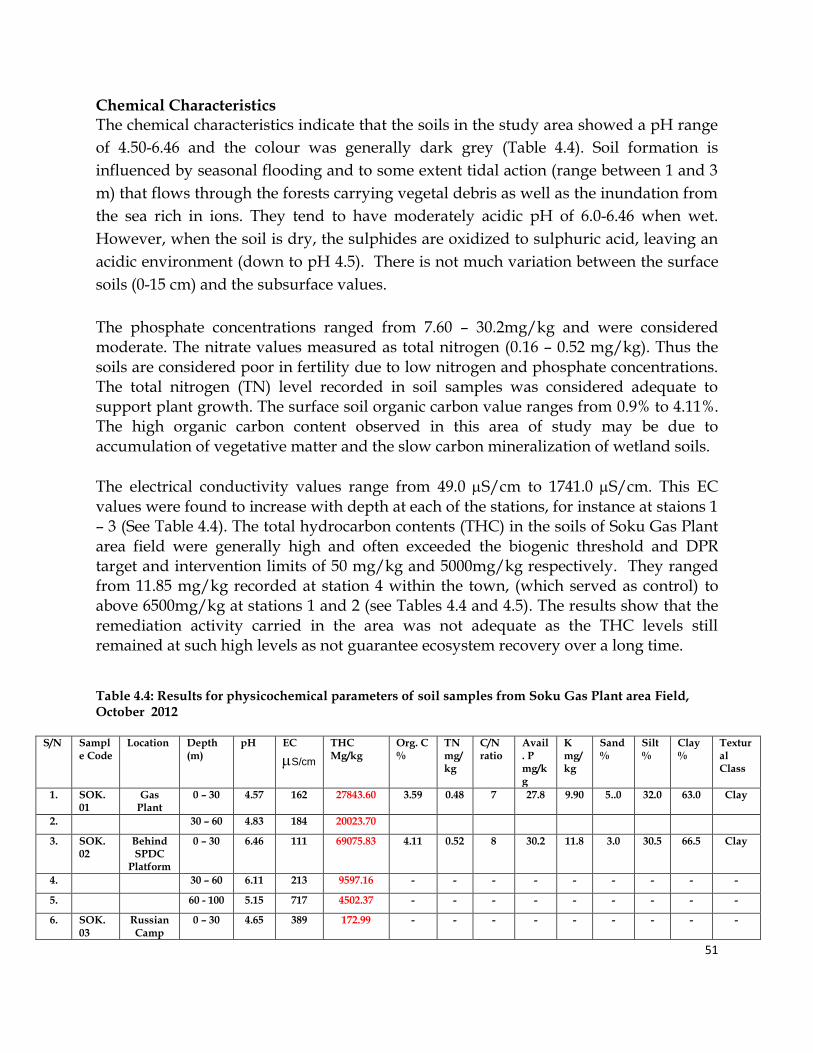
51
Chemical Characteristics The chemical characteristics indicate that the soils in the study area showed a pH range
of 4.50-6.46 and the colour was generally dark grey (Table 4.4). Soil formation is
influenced by seasonal flooding and to some extent tidal action (range between 1 and 3
m) that flows through the forests carrying vegetal debris as well as the inundation from
the sea rich in ions. They tend to have moderately acidic pH of 6.0-6.46 when wet.
However, when the soil is dry, the sulphides are oxidized to sulphuric acid, leaving an
acidic environment (down to pH 4.5). There is not much variation between the surface
soils (0-15 cm) and the subsurface values.
The phosphate concentrations ranged from 7.60 – 30.2mg/kg and were considered moderate. The nitrate values measured as total nitrogen (0.16 – 0.52 mg/kg). Thus the soils are considered poor in fertility due to low nitrogen and phosphate concentrations. The total nitrogen (TN) level recorded in soil samples was considered adequate to support plant growth. The surface soil organic carbon value ranges from 0.9% to 4.11%. The high organic carbon content observed in this area of study may be due to accumulation of vegetative matter and the slow carbon mineralization of wetland soils.
The electrical conductivity values range from 49.0 S/cm to 1741.0 S/cm. This EC values were found to increase with depth at each of the stations, for instance at staions 1 – 3 (See Table 4.4). The total hydrocarbon contents (THC) in the soils of Soku Gas Plant area field were generally high and often exceeded the biogenic threshold and DPR target and intervention limits of 50 mg/kg and 5000mg/kg respectively. They ranged from 11.85 mg/kg recorded at station 4 within the town, (which served as control) to above 6500mg/kg at stations 1 and 2 (see Tables 4.4 and 4.5). The results show that the remediation activity carried in the area was not adequate as the THC levels still remained at such high levels as not guarantee ecosystem recovery over a long time.
Table 4.4: Results for physicochemical parameters of soil samples from Soku Gas Plant area Field, October 2012
S/N Sample Code
Location Depth (m)
pH EC
S/cm
THC Mg/kg
Org. C %
TN mg/kg
C/N ratio
Avail. P mg/kg
K mg/kg
Sand %
Silt %
Clay %
Textural Class
1. SOK. 01
Gas Plant
0 – 30 4.57 162 27843.60 3.59 0.48 7 27.8 9.90 5..0 32.0 63.0 Clay
2. 30 – 60 4.83 184 20023.70
3. SOK. 02
Behind SPDC
Platform
0 – 30 6.46 111 69075.83 4.11 0.52 8 30.2 11.8 3.0 30.5 66.5 Clay
4. 30 – 60 6.11 213 9597.16 - - - - - - - - -
5. 60 - 100 5.15 717 4502.37 - - - - - - - - -
6. SOK. 03
Russian Camp
0 – 30 4.65 389 172.99 - - - - - - - - -
52
7. 30 – 60 5.14 831 213.27 - - - - - - - - -
8. 60 - 100 4.55 431 75.83 - - - - - - - - -
9. SOK. 04
Soku town
0 – 30 4.89 72 11.85 0.98 0.16 6 7.6 2.7 90.0 3.2 6.8 Sandy
10. 30 – 60 5.12 49 135.07 - - - - - - - - -
11. 60 - 100 4.57 131 59.24 - - - - - - - - -
12. SOK. 05
Soku 0 – 30 5.08 1507 56.87 3.82 0.46 8 26.4 10.7 4.9 29.8 65.3 Clay
13. 30 – 60 4.50 1741 454.98 - - - - - - - - -
14. 60 - 100 6.31 2597 52.13 - - - - - - - - -
Source: IUCN Taskforce Fieldstudy, 2012
Table 4.5: Results for physicochemical parameters of soil samples from Soku Gas Plant Area, October 2012 (FROM ALTERNATE LABORATORY)
S/N
PARAMETER SOIL SAMPLE IDENTIFICATION AND RESULTS DPR LIMITS
SOKU 1 SOKU 2 SOKU 3 SOKU 4 TARGET INTERV
TOP BOTTOM TOP BOTTOM TOP BOTTOM TOP BOTTOM
PETROLEUM HYDROCARBONS (mg/kg)
1 TPH 3.510 2.008 31.2 89.46 <0.01 <0.01 <0.01 <0.01
2 PAH 1.142 <0.01 9.02 17.201 <0.01 <0.01 <0.01 <0.01
3 THC 4775.0 693.75 310.99 625.26 <0.01 <0.01 <0.01 <0.01 50 5000
4 OIL AND GREASE
8881.25 3575.0 2104.48 2262.0 <0.01 <0.01 <0.01 <0.01 50 5000
HEAVY METALS (mg/kg)
5 Chromium (Cr) 0.245 0.275 <0.01 <0.01 <0.01 <0.01 0.255 <0.01 100 380
6 Cadmium (Cd) <0.01 <0.01 <0.01 <0.01 <0.01 <0.01 <0.01 <0.01 0.80 12
7 Nickel (Ni) <0.01 <0.01 <0.01 <0.01 1.011 0.012 <0.01 0.502 35 210
8 Lead (Pb) <0.01 <0.01 <0.01 <0.01 <0.01 <0.01 <0.01 0.178 85 530
9 Vanadium (V) <0.01 <0.01 <0.01 <0.01 <0.01 <0.01 <0.01 <0.01 NA NA
10 Zinc (Zn) 0.019 0.131 0.017 0.221 0.031 0.023 0.020 0.031 140 720
11 Copper (Cu) <0.01 <0.01 <0.01 <0.01 <0.01 <0.01 <0.01 <0.01 36 190
12 Manganese (Mn) 0.057 0.178 0.071 0.055 0.061 0.071 0.055 0.033 NA NA
13 Iron (Fe) 2.467 2.671 2.190 1.521 2.210 3.102 1.761 2.101 NA NA
Source: IUCN Taskforce Fieldstudy, 2012
4.4 HYDROBIOLOGICAL STATUS
4.4.1 PHYTOPLANKTON COMMUNITY
The abundance and distribution of phytoplankton community within the study sites at Soku Gas Plant area showed a checklist of 22 species representing 5 families respectively, with an overall density of 1060 cells/ml as shown in Table 4.6. The result indicate that within the study site the Bacillarophyceae (diatoms) had the highest abundance and distribution (65.85%), followed by Chlorophyceae (23.68%), then Cyanophyceae (7.36%) , Xanthophyceae (2.45%) and Pyrrophyceae (0.66%). The contribution of each of the major families of phytoplankton in the sampled Soku Gas Plant environment is shown in Fig 4.1. Five (5) major families of phytoplankton
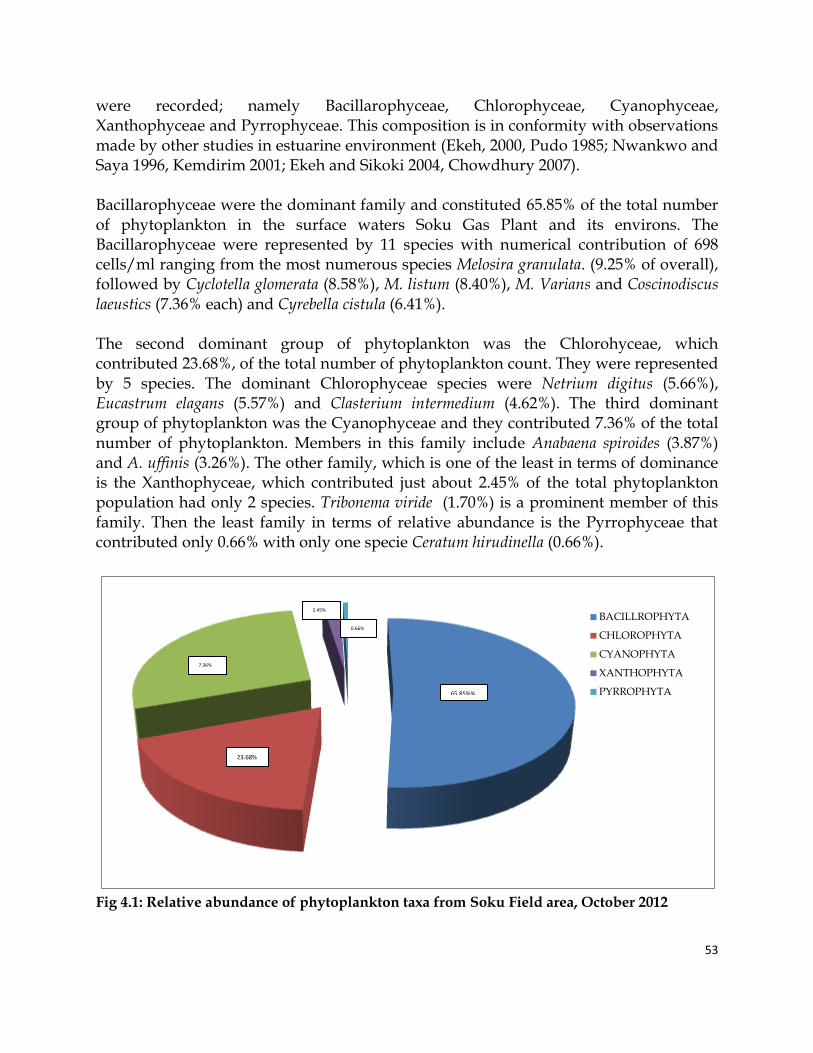
53
were recorded; namely Bacillarophyceae, Chlorophyceae, Cyanophyceae, Xanthophyceae and Pyrrophyceae. This composition is in conformity with observations made by other studies in estuarine environment (Ekeh, 2000, Pudo 1985; Nwankwo and Saya 1996, Kemdirim 2001; Ekeh and Sikoki 2004, Chowdhury 2007). Bacillarophyceae were the dominant family and constituted 65.85% of the total number of phytoplankton in the surface waters Soku Gas Plant and its environs. The Bacillarophyceae were represented by 11 species with numerical contribution of 698 cells/ml ranging from the most numerous species Melosira granulata. (9.25% of overall), followed by Cyclotella glomerata (8.58%), M. listum (8.40%), M. Varians and Coscinodiscus laeustics (7.36% each) and Cyrebella cistula (6.41%). The second dominant group of phytoplankton was the Chlorohyceae, which contributed 23.68%, of the total number of phytoplankton count. They were represented by 5 species. The dominant Chlorophyceae species were Netrium digitus (5.66%), Eucastrum elagans (5.57%) and Clasterium intermedium (4.62%). The third dominant group of phytoplankton was the Cyanophyceae and they contributed 7.36% of the total number of phytoplankton. Members in this family include Anabaena spiroides (3.87%) and A. uffinis (3.26%). The other family, which is one of the least in terms of dominance is the Xanthophyceae, which contributed just about 2.45% of the total phytoplankton population had only 2 species. Tribonema viride (1.70%) is a prominent member of this family. Then the least family in terms of relative abundance is the Pyrrophyceae that contributed only 0.66% with only one specie Ceratum hirudinella (0.66%).
BACILLROPHYTA
CHLOROPHYTA
CYANOPHYTA
XANTHOPHYTA
PYRROPHYTA
Fig 4.1: Relative abundance of phytoplankton taxa from Soku Field area, October 2012
65.85%%
7.36%
23.68%
2.45%
0.66%
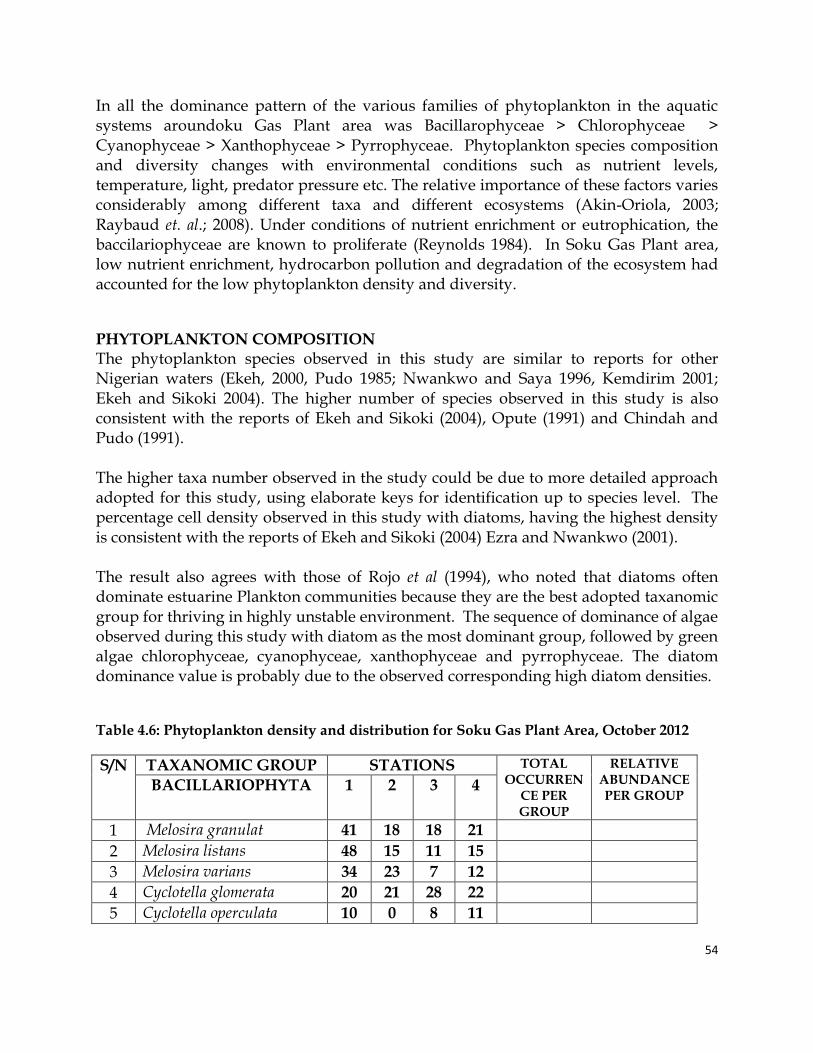
54
In all the dominance pattern of the various families of phytoplankton in the aquatic systems aroundoku Gas Plant area was Bacillarophyceae > Chlorophyceae > Cyanophyceae > Xanthophyceae > Pyrrophyceae. Phytoplankton species composition and diversity changes with environmental conditions such as nutrient levels, temperature, light, predator pressure etc. The relative importance of these factors varies considerably among different taxa and different ecosystems (Akin-Oriola, 2003; Raybaud et. al.; 2008). Under conditions of nutrient enrichment or eutrophication, the baccilariophyceae are known to proliferate (Reynolds 1984). In Soku Gas Plant area, low nutrient enrichment, hydrocarbon pollution and degradation of the ecosystem had accounted for the low phytoplankton density and diversity.
PHYTOPLANKTON COMPOSITION The phytoplankton species observed in this study are similar to reports for other Nigerian waters (Ekeh, 2000, Pudo 1985; Nwankwo and Saya 1996, Kemdirim 2001; Ekeh and Sikoki 2004). The higher number of species observed in this study is also consistent with the reports of Ekeh and Sikoki (2004), Opute (1991) and Chindah and Pudo (1991). The higher taxa number observed in the study could be due to more detailed approach adopted for this study, using elaborate keys for identification up to species level. The percentage cell density observed in this study with diatoms, having the highest density is consistent with the reports of Ekeh and Sikoki (2004) Ezra and Nwankwo (2001). The result also agrees with those of Rojo et al (1994), who noted that diatoms often dominate estuarine Plankton communities because they are the best adopted taxanomic group for thriving in highly unstable environment. The sequence of dominance of algae observed during this study with diatom as the most dominant group, followed by green algae chlorophyceae, cyanophyceae, xanthophyceae and pyrrophyceae. The diatom dominance value is probably due to the observed corresponding high diatom densities.
Table 4.6: Phytoplankton density and distribution for Soku Gas Plant Area, October 2012
S/N TAXANOMIC GROUP STATIONS TOTAL OCCURREN
CE PER GROUP
RELATIVE ABUNDANCE PER GROUP
BACILLARIOPHYTA 1 2 3 4
1 Melosira granulat 41 18 18 21
2 Melosira listans 48 15 11 15
3 Melosira varians 34 23 7 12
4 Cyclotella glomerata 20 21 28 22
5 Cyclotella operculata 10 0 8 11
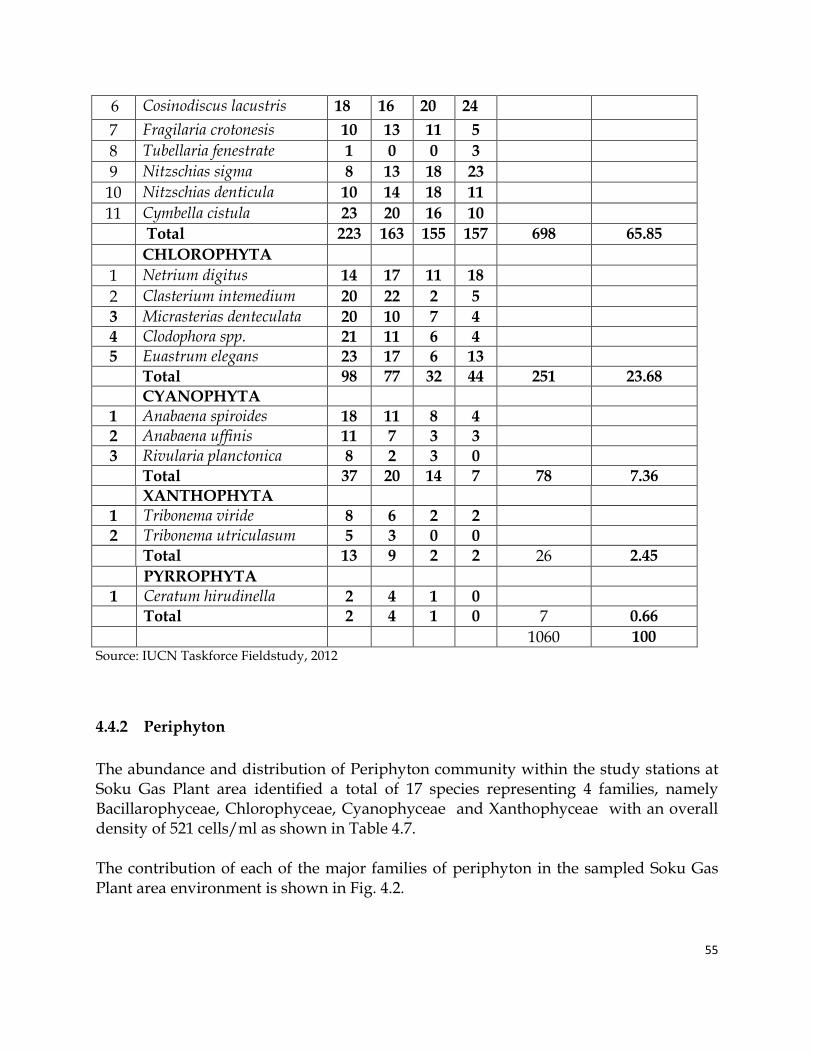
55
6 Cosinodiscus lacustris 18 16 20 24
7 Fragilaria crotonesis 10 13 11 5
8 Tubellaria fenestrate 1 0 0 3
9 Nitzschias sigma 8 13 18 23
10 Nitzschias denticula 10 14 18 11
11 Cymbella cistula 23 20 16 10
Total 223 163 155 157 698 65.85
CHLOROPHYTA
1 Netrium digitus 14 17 11 18
2 Clasterium intemedium 20 22 2 5
3 Micrasterias denteculata 20 10 7 4
4 Clodophora spp. 21 11 6 4
5 Euastrum elegans 23 17 6 13
Total 98 77 32 44 251 23.68
CYANOPHYTA
1 Anabaena spiroides 18 11 8 4
2 Anabaena uffinis 11 7 3 3
3 Rivularia planctonica 8 2 3 0
Total 37 20 14 7 78 7.36
XANTHOPHYTA
1 Tribonema viride 8 6 2 2
2 Tribonema utriculasum 5 3 0 0
Total 13 9 2 2 26 2.45
PYRROPHYTA
1 Ceratum hirudinella 2 4 1 0
Total 2 4 1 0 7 0.66
1060 100 Source: IUCN Taskforce Fieldstudy, 2012
4.4.2 Periphyton
The abundance and distribution of Periphyton community within the study stations at Soku Gas Plant area identified a total of 17 species representing 4 families, namely Bacillarophyceae, Chlorophyceae, Cyanophyceae and Xanthophyceae with an overall density of 521 cells/ml as shown in Table 4.7. The contribution of each of the major families of periphyton in the sampled Soku Gas Plant area environment is shown in Fig. 4.2.
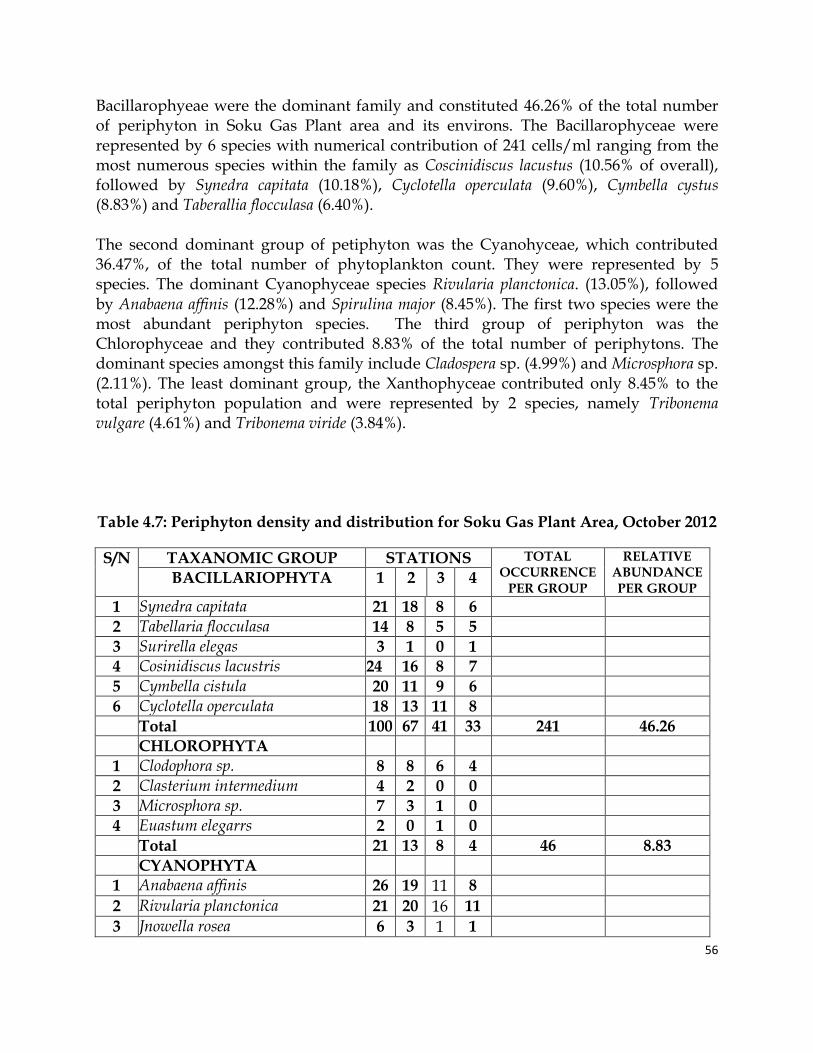
56
Bacillarophyeae were the dominant family and constituted 46.26% of the total number of periphyton in Soku Gas Plant area and its environs. The Bacillarophyceae were represented by 6 species with numerical contribution of 241 cells/ml ranging from the most numerous species within the family as Coscinidiscus lacustus (10.56% of overall), followed by Synedra capitata (10.18%), Cyclotella operculata (9.60%), Cymbella cystus (8.83%) and Taberallia flocculasa (6.40%). The second dominant group of petiphyton was the Cyanohyceae, which contributed 36.47%, of the total number of phytoplankton count. They were represented by 5 species. The dominant Cyanophyceae species Rivularia planctonica. (13.05%), followed by Anabaena affinis (12.28%) and Spirulina major (8.45%). The first two species were the most abundant periphyton species. The third group of periphyton was the Chlorophyceae and they contributed 8.83% of the total number of periphytons. The dominant species amongst this family include Cladospera sp. (4.99%) and Microsphora sp. (2.11%). The least dominant group, the Xanthophyceae contributed only 8.45% to the total periphyton population and were represented by 2 species, namely Tribonema vulgare (4.61%) and Tribonema viride (3.84%). Table 4.7: Periphyton density and distribution for Soku Gas Plant Area, October 2012
S/N TAXANOMIC GROUP STATIONS TOTAL OCCURRENCE
PER GROUP
RELATIVE ABUNDANCE PER GROUP
BACILLARIOPHYTA 1 2 3 4
1 Synedra capitata 21 18 8 6
2 Tabellaria flocculasa 14 8 5 5
3 Surirella elegas 3 1 0 1
4 Cosinidiscus lacustris 24 16 8 7
5 Cymbella cistula 20 11 9 6
6 Cyclotella operculata 18 13 11 8
Total 100 67 41 33 241 46.26
CHLOROPHYTA
1 Clodophora sp. 8 8 6 4
2 Clasterium intermedium 4 2 0 0
3 Microsphora sp. 7 3 1 0
4 Euastum elegarrs 2 0 1 0
Total 21 13 8 4 46 8.83
CYANOPHYTA
1 Anabaena affinis 26 19 11 8
2 Rivularia planctonica 21 20 16 11
3 Jnowella rosea 6 3 1 1
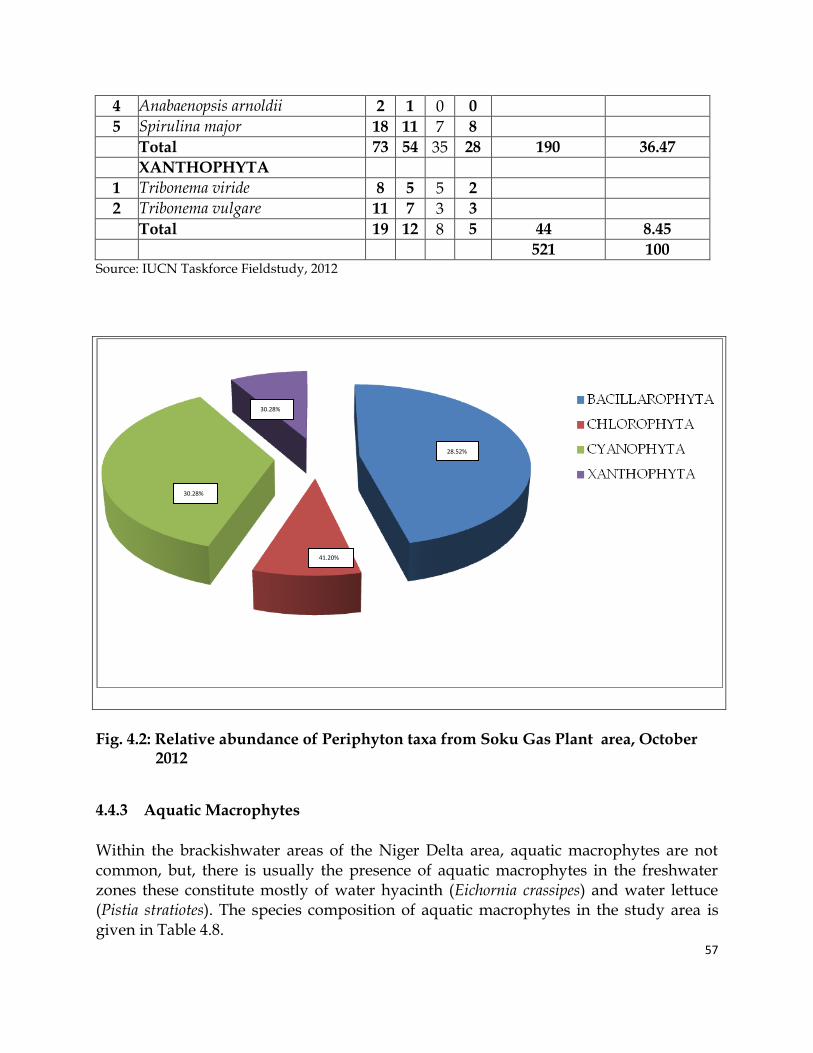
57
4 Anabaenopsis arnoldii 2 1 0 0
5 Spirulina major 18 11 7 8
Total 73 54 35 28 190 36.47
XANTHOPHYTA
1 Tribonema viride 8 5 5 2
2 Tribonema vulgare 11 7 3 3
Total 19 12 8 5 44 8.45
521 100 Source: IUCN Taskforce Fieldstudy, 2012
Fig. 4.2: Relative abundance of Periphyton taxa from Soku Gas Plant area, October 2012
4.4.3 Aquatic Macrophytes
Within the brackishwater areas of the Niger Delta area, aquatic macrophytes are not common, but, there is usually the presence of aquatic macrophytes in the freshwater zones these constitute mostly of water hyacinth (Eichornia crassipes) and water lettuce (Pistia stratiotes). The species composition of aquatic macrophytes in the study area is given in Table 4.8.
30.28%
41.20%
28.52%
30.28%
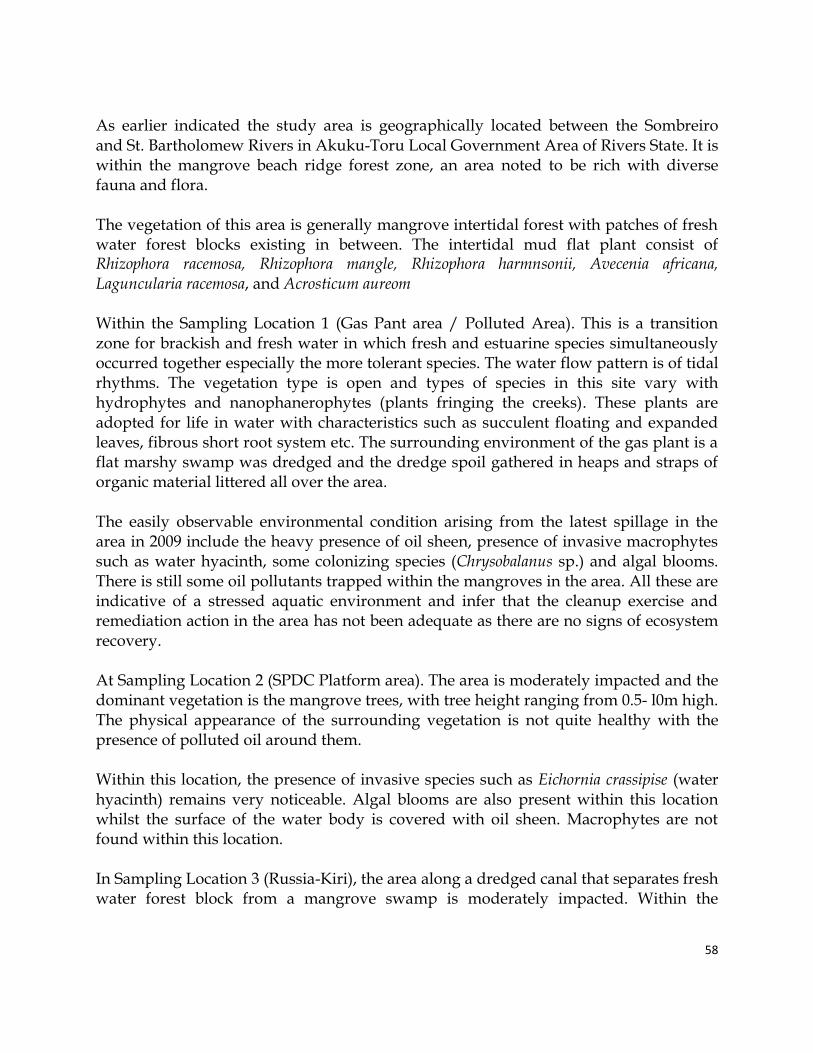
58
As earlier indicated the study area is geographically located between the Sombreiro and St. Bartholomew Rivers in Akuku-Toru Local Government Area of Rivers State. It is within the mangrove beach ridge forest zone, an area noted to be rich with diverse fauna and flora. The vegetation of this area is generally mangrove intertidal forest with patches of fresh water forest blocks existing in between. The intertidal mud flat plant consist of Rhizophora racemosa, Rhizophora mangle, Rhizophora harmnsonii, Avecenia africana, Laguncularia racemosa, and Acrosticum aureom Within the Sampling Location 1 (Gas Pant area / Polluted Area). This is a transition zone for brackish and fresh water in which fresh and estuarine species simultaneously occurred together especially the more tolerant species. The water flow pattern is of tidal rhythms. The vegetation type is open and types of species in this site vary with hydrophytes and nanophanerophytes (plants fringing the creeks). These plants are adopted for life in water with characteristics such as succulent floating and expanded leaves, fibrous short root system etc. The surrounding environment of the gas plant is a flat marshy swamp was dredged and the dredge spoil gathered in heaps and straps of organic material littered all over the area. The easily observable environmental condition arising from the latest spillage in the area in 2009 include the heavy presence of oil sheen, presence of invasive macrophytes such as water hyacinth, some colonizing species (Chrysobalanus sp.) and algal blooms. There is still some oil pollutants trapped within the mangroves in the area. All these are indicative of a stressed aquatic environment and infer that the cleanup exercise and remediation action in the area has not been adequate as there are no signs of ecosystem recovery. At Sampling Location 2 (SPDC Platform area). The area is moderately impacted and the dominant vegetation is the mangrove trees, with tree height ranging from 0.5- l0m high. The physical appearance of the surrounding vegetation is not quite healthy with the presence of polluted oil around them. Within this location, the presence of invasive species such as Eichornia crassipise (water hyacinth) remains very noticeable. Algal blooms are also present within this location whilst the surface of the water body is covered with oil sheen. Macrophytes are not found within this location. In Sampling Location 3 (Russia-Kiri), the area along a dredged canal that separates fresh water forest block from a mangrove swamp is moderately impacted. Within the
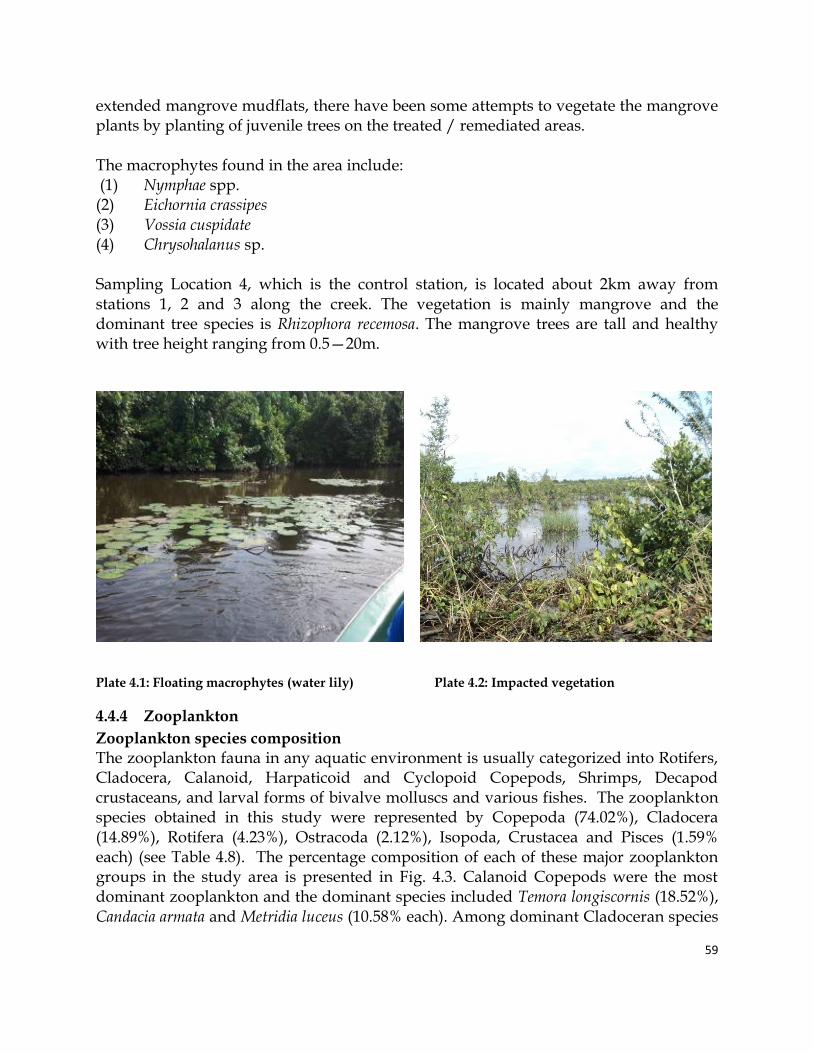
59
extended mangrove mudflats, there have been some attempts to vegetate the mangrove plants by planting of juvenile trees on the treated / remediated areas. The macrophytes found in the area include: (1) Nymphae spp. (2) Eichornia crassipes (3) Vossia cuspidate (4) Chrysohalanus sp. Sampling Location 4, which is the control station, is located about 2km away from stations 1, 2 and 3 along the creek. The vegetation is mainly mangrove and the dominant tree species is Rhizophora recemosa. The mangrove trees are tall and healthy with tree height ranging from 0.5—20m.
Plate 4.1: Floating macrophytes (water lily) Plate 4.2: Impacted vegetation
4.4.4 Zooplankton
Zooplankton species composition The zooplankton fauna in any aquatic environment is usually categorized into Rotifers, Cladocera, Calanoid, Harpaticoid and Cyclopoid Copepods, Shrimps, Decapod crustaceans, and larval forms of bivalve molluscs and various fishes. The zooplankton species obtained in this study were represented by Copepoda (74.02%), Cladocera (14.89%), Rotifera (4.23%), Ostracoda (2.12%), Isopoda, Crustacea and Pisces (1.59% each) (see Table 4.8). The percentage composition of each of these major zooplankton groups in the study area is presented in Fig. 4.3. Calanoid Copepods were the most dominant zooplankton and the dominant species included Temora longiscornis (18.52%), Candacia armata and Metridia luceus (10.58% each). Among dominant Cladoceran species
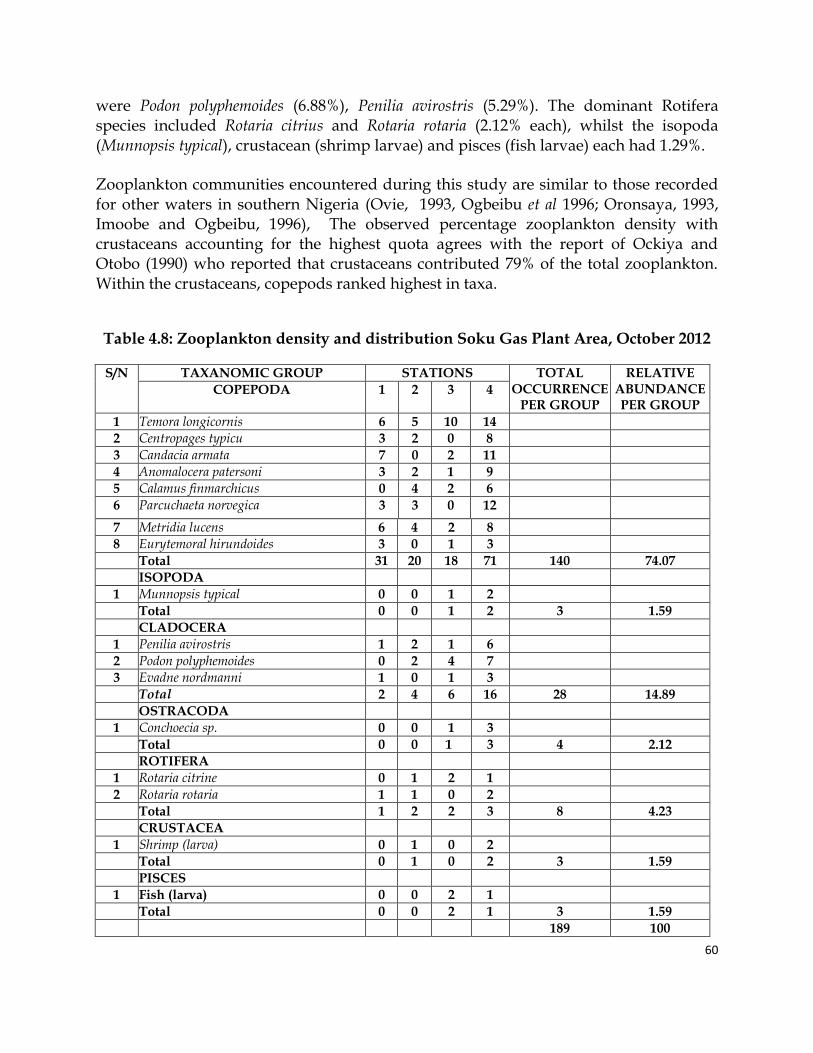
60
were Podon polyphemoides (6.88%), Penilia avirostris (5.29%). The dominant Rotifera species included Rotaria citrius and Rotaria rotaria (2.12% each), whilst the isopoda (Munnopsis typical), crustacean (shrimp larvae) and pisces (fish larvae) each had 1.29%. Zooplankton communities encountered during this study are similar to those recorded for other waters in southern Nigeria (Ovie, 1993, Ogbeibu et al 1996; Oronsaya, 1993, Imoobe and Ogbeibu, 1996), The observed percentage zooplankton density with crustaceans accounting for the highest quota agrees with the report of Ockiya and Otobo (1990) who reported that crustaceans contributed 79% of the total zooplankton. Within the crustaceans, copepods ranked highest in taxa.
Table 4.8: Zooplankton density and distribution Soku Gas Plant Area, October 2012
S/N TAXANOMIC GROUP STATIONS TOTAL OCCURRENCE
PER GROUP
RELATIVE ABUNDANCE PER GROUP
COPEPODA 1 2 3 4
1 Temora longicornis 6 5 10 14
2 Centropages typicu 3 2 0 8
3 Candacia armata 7 0 2 11
4 Anomalocera patersoni 3 2 1 9
5 Calamus finmarchicus 0 4 2 6
6 Parcuchaeta norvegica 3 3 0 12
7 Metridia lucens 6 4 2 8
8 Eurytemoral hirundoides 3 0 1 3
Total 31 20 18 71 140 74.07
ISOPODA
1 Munnopsis typical 0 0 1 2
Total 0 0 1 2 3 1.59
CLADOCERA
1 Penilia avirostris 1 2 1 6
2 Podon polyphemoides 0 2 4 7
3 Evadne nordmanni 1 0 1 3
Total 2 4 6 16 28 14.89
OSTRACODA
1 Conchoecia sp. 0 0 1 3
Total 0 0 1 3 4 2.12
ROTIFERA
1 Rotaria citrine 0 1 2 1
2 Rotaria rotaria 1 1 0 2
Total 1 2 2 3 8 4.23
CRUSTACEA
1 Shrimp (larva) 0 1 0 2
Total 0 1 0 2 3 1.59
PISCES
1 Fish (larva) 0 0 2 1
Total 0 0 2 1 3 1.59
189 100
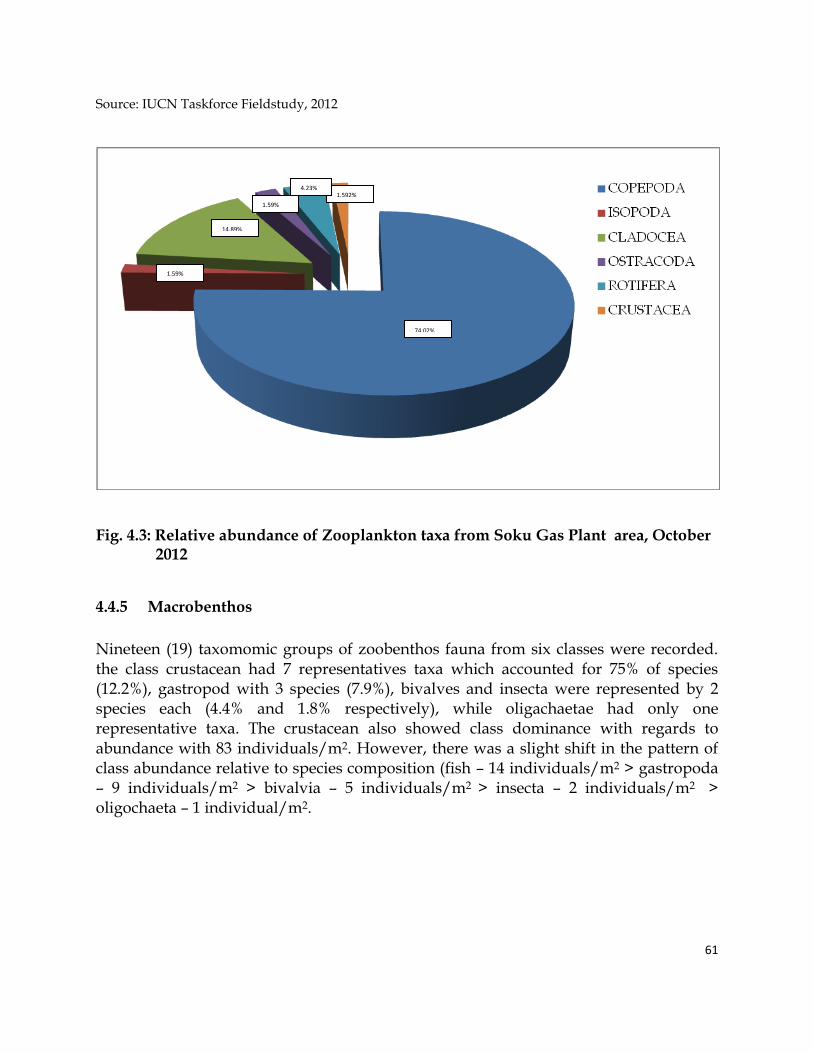
61
Source: IUCN Taskforce Fieldstudy, 2012
Fig. 4.3: Relative abundance of Zooplankton taxa from Soku Gas Plant area, October 2012
4.4.5 Macrobenthos
Nineteen (19) taxomomic groups of zoobenthos fauna from six classes were recorded. the class crustacean had 7 representatives taxa which accounted for 75% of species (12.2%), gastropod with 3 species (7.9%), bivalves and insecta were represented by 2 species each (4.4% and 1.8% respectively), while oligachaetae had only one representative taxa. The crustacean also showed class dominance with regards to abundance with 83 individuals/m2. However, there was a slight shift in the pattern of class abundance relative to species composition (fish – 14 individuals/m2 > gastropoda – 9 individuals/m2 > bivalvia – 5 individuals/m2 > insecta – 2 individuals/m2 > oligochaeta – 1 individual/m2.
1.592%
1.59%
14.89%
74.02%
4.23%
1.59%
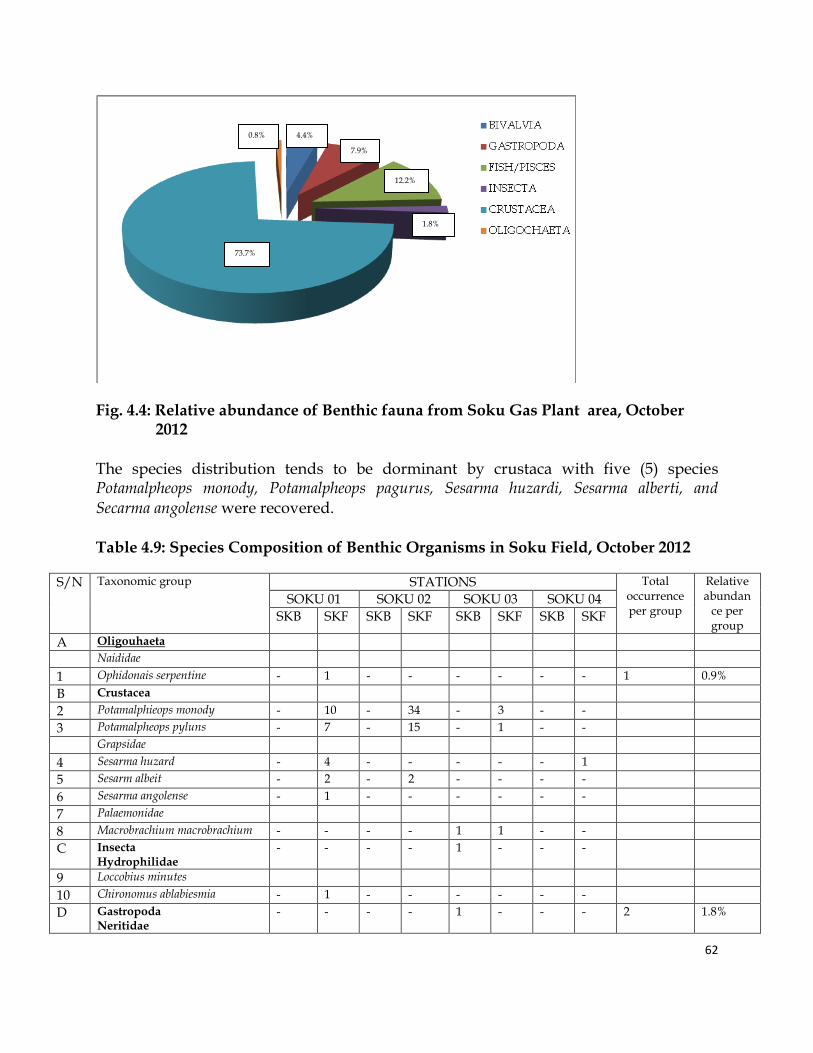
62
Fig. 4.4: Relative abundance of Benthic fauna from Soku Gas Plant area, October 2012 The species distribution tends to be dorminant by crustaca with five (5) species Potamalpheops monody, Potamalpheops pagurus, Sesarma huzardi, Sesarma alberti, and Secarma angolense were recovered. Table 4.9: Species Composition of Benthic Organisms in Soku Field, October 2012
S/N Taxonomic group STATIONS Total occurrence per group
Relative abundan
ce per group
SOKU 01 SOKU 02 SOKU 03 SOKU 04
SKB SKF SKB SKF SKB SKF SKB SKF
A Oligouhaeta
Naididae
1 Ophidonais serpentine - 1 - - - - - - 1 0.9%
B Crustacea
2 Potamalphieops monody - 10 - 34 - 3 - -
3 Potamalpheops pyluns - 7 - 15 - 1 - -
Grapsidae
4 Sesarma huzard - 4 - - - - - 1
5 Sesarm albeit - 2 - 2 - - - -
6 Sesarma angolense - 1 - - - - - -
7 Palaemonidae
8 Macrobrachium macrobrachium - - - - 1 1 - -
C Insecta Hydrophilidae
- - - - 1 - - -
9 Loccobius minutes
10 Chironomus ablabiesmia - 1 - - - - - -
D Gastropoda Neritidae
- - - - 1 - - - 2 1.8%
1.8%
12.2%
7.9%
4.4% 0.8%
73.7%
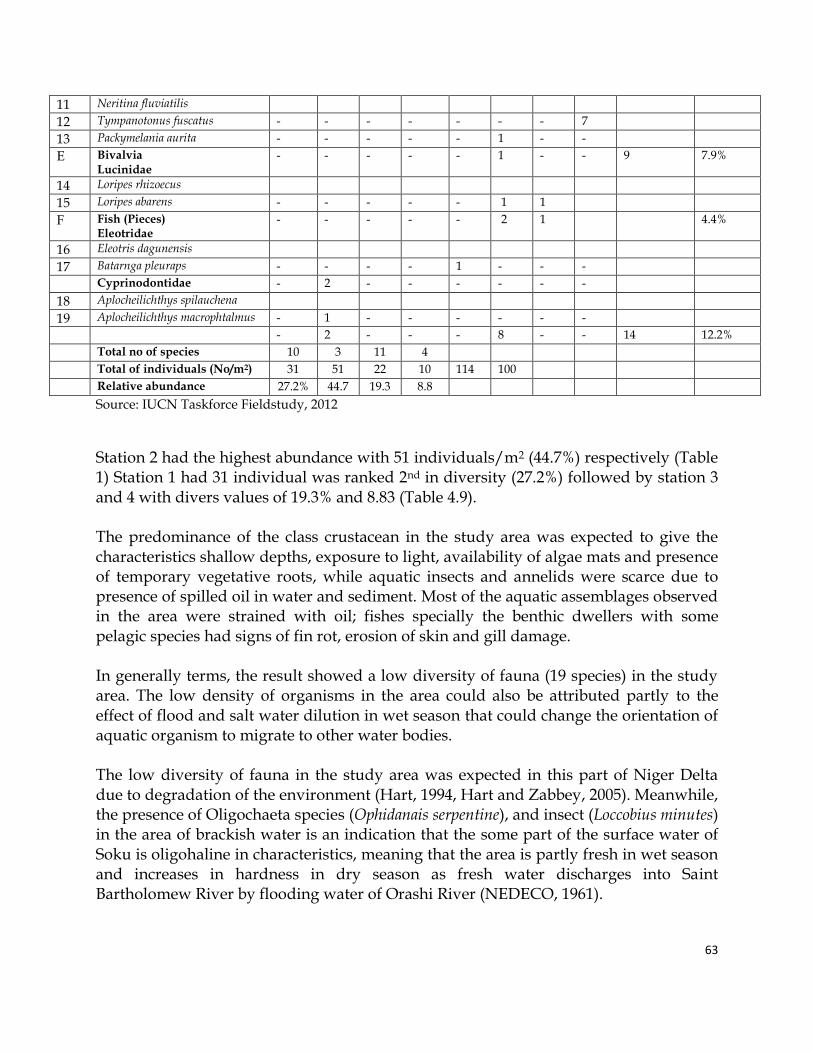
63
11 Neritina fluviatilis
12 Tympanotonus fuscatus - - - - - - - 7
13 Packymelania aurita - - - - - 1 - -
E Bivalvia Lucinidae
- - - - - 1 - - 9 7.9%
14 Loripes rhizoecus
15 Loripes abarens - - - - - 1 1
F Fish (Pieces) Eleotridae
- - - - - 2 1 4.4%
16 Eleotris dagunensis
17 Batarnga pleuraps - - - - 1 - - -
Cyprinodontidae - 2 - - - - - -
18 Aplocheilichthys spilauchena
19 Aplocheilichthys macrophtalmus - 1 - - - - - -
- 2 - - - 8 - - 14 12.2%
Total no of species 10 3 11 4
Total of individuals (No/m2) 31 51 22 10 114 100
Relative abundance 27.2% 44.7 19.3 8.8
Source: IUCN Taskforce Fieldstudy, 2012
Station 2 had the highest abundance with 51 individuals/m2 (44.7%) respectively (Table 1) Station 1 had 31 individual was ranked 2nd in diversity (27.2%) followed by station 3 and 4 with divers values of 19.3% and 8.83 (Table 4.9). The predominance of the class crustacean in the study area was expected to give the characteristics shallow depths, exposure to light, availability of algae mats and presence of temporary vegetative roots, while aquatic insects and annelids were scarce due to presence of spilled oil in water and sediment. Most of the aquatic assemblages observed in the area were strained with oil; fishes specially the benthic dwellers with some pelagic species had signs of fin rot, erosion of skin and gill damage. In generally terms, the result showed a low diversity of fauna (19 species) in the study area. The low density of organisms in the area could also be attributed partly to the effect of flood and salt water dilution in wet season that could change the orientation of aquatic organism to migrate to other water bodies. The low diversity of fauna in the study area was expected in this part of Niger Delta due to degradation of the environment (Hart, 1994, Hart and Zabbey, 2005). Meanwhile, the presence of Oligochaeta species (Ophidanais serpentine), and insect (Loccobius minutes) in the area of brackish water is an indication that the some part of the surface water of Soku is oligohaline in characteristics, meaning that the area is partly fresh in wet season and increases in hardness in dry season as fresh water discharges into Saint Bartholomew River by flooding water of Orashi River (NEDECO, 1961).
64
4.5 WILDLIFE
The wildlife of the Soku Field area recorded ninety eight (98) wildlife species during the study period. These were made up of Nineteen (19) species of mammals representing Twelve (12) families; Sixty Two (62) species of birds representing Thirty (30) families and Seventeen (17) reptiles species representing Ten (10) families.. The study area shows a fairly high taxonomic diversity of wildlife species which have been described within the underlisted subheading.
4.5.1 Mammals
The study revealed that diversity of mammal species are few in the island compared to other study sites. But wildlife in the area is very unique because of the habitat types, and the endangered species present in the area (Table 4.10). Direct observation and assessment of large mammals were extremely difficult because of the short time that the survey team had for their activities. So the results of mammals are therefore mostly qualitative, crosschecking a checklist of animals that were confirmed to be present rather than those which were actually sighted like birds. Three primates were recorded present in the study area; one of the primates is listed as vulnerable in IUCN, Red list. Red-Capped Mangabey (Cercocebus torquatus) also endangered in Nigeria endangered species Decree Act No 11 of (1985) schedule I. Two species of Otter found in some parts of the Niger Delta area are present in the study area. They are: African Clawless Otter (Aonyx capensis) and Spott necked Otter (Lutra maculicollis) all are listed as endangered in Decree No 11 of Nigeria. The Red river hog (Polamochoerus porcus) and Sitatunga (Tragelaphus spekei) are the major animals hunted for bush meat because of their sizes. The African Manatee (Trichechus senegalensis) are seen occasionally in the creeks, they are globally threatened species. The dominant animals in the study area are the Large spotted Genet, African Clawles Otter and Marsh Mongoose. Table 4.10: Mammalian wildlife occurring in Soku Gas Plant area, October 2012
COMMON NAMES SCIENTIFIC NAMES IUCN D 11 1985
ORDER PRIMATES Family Cercopithecidae Mona Monkey Cercopithecus mona - - Putty-nosed Monkey Cercopithecus nictitans - E
Red Capped Mangabey Cercopithecus torquatus VU ORDER HOLIDOTA
65
Family Manidae Tree pangolin Phataginus tricuspis - E
ORDER CARNIVORE
Family Herpestidae Marsh mongoose Atilax paludinosus - - Family canidae African clawless otter Anoyx capensis - E Spot necked otter Lutra maculicollis - E Family Viverridae African civet Civettictis civetta - - Large-spotted Genet Genetta tigrina - -
ORDER RODENTIA Family Sciuridae Red legged sun – squirrel Heliosciurus rufobrachium - - Giant forest squirrel Protexerus strangeri - - Family Thryonomidae Cane rat Thryonomys swinderianus - - Family Hystricidae Brush-tailed porcupine Atherurus africanus - E Family Muridae Black House rat Ratus ratus - - Norway rat Rattus norvegicus - -
ORDER ARTIONDACTYLA
Family Bovidae Maxwell’s duiker Cephalophus maxwelli Sitatunga Tragelaphus spekei - - Family Suidae Red River hog Potamochoerus porcus - - Family Tricheechidae African Manatee Trichechus senegalensis VU E
KEY IUCN 2010 Red List E N = Endangered V U = Vulnerable NT = Near Threatened
Nigeria 1985 Decree II E = Endangered
Source: IUCN Taskforce Fieldstudy, 2012
66
4.5.2 Avifauna
Birds of the study area is divided in to three units, namely; Birds of the coastline and mud flats, birds of mangrove forest-and creeks and Birds of the rainforest.
a) The Birds of the Coastline and Mud Flats are: Caspian tern, Common tern, African skimmer, Whimbrel, Eurosian Curlew, Osprey, Water Thick-knee, Common Sandpiper, Collared Pratincole
b) Mangrove Forest and Creeks are: Long-tailed Cormorant, Western Reaf Egret, Great Egret, Hammerkop, Wood land kingfisher, Red eyed dove, Grey parrot,
c) Birds of Rainforest are: Little Green bull, Piping Hornbill, Senegal Coucal, Palm-nut Vulture, African Goshawk, African Green Pigeon, Tinker birds.
A good number of Grey Parrot (Psittacus erithacus) are still surviving in the island, they are globally threatened species and also Endangered in Nigeria endangered species Act 11 of 1985. Some palearctic migrant bird species are also recorded in the study area, thus confirming the island as part of African Eurasian migratory flyway system.
Table 4.11: Avian wildlife species occurring in Soku gas Plant area, October 2012 COMMON NAMES SCIENTIFIC NAMES IUCN D 11 1985
Family Sternidae Caspian tern Sterna caspia - - Little tern Sterna albifrons - - Damara tern Sterna balaenarum EN - Common tern Sterna hirundo Family Rynchopidae African Skimmer Rybchops flovirostris VU -
Family Pandioniae Osprey Pandion haliaetus - -
Family Scolopacidae Whimbrel Numenius phaeopus - - Eurasian curlew Numenius arguata - - Common sandpiper Atitis hypoteucos - - Family Burhinidae
67
Water Thick-knee Burhinus vermicu latus - - Family Phalacrocoracidae Long-tailed cormorant Phalacrocorar africanus - - Family Ardeidae Western Reef Egret Egretta gullaris - - Great Egret Egretta alba - - Little Egret Egretta garzetta - - Black-headed heron Ardea melanocephala - - Cattle Egret Bubulcus ibis - - Family Scopidae Hammerkop Scopus umbrella - - Family Sturnidae Violet-backed starling Cinnyricinclus leucogaster - - Family Cuculidae Yellow bill Ceuthmochares aereus - - Senegal Coucal Centropus senegalensis - - Family Pycnonotidae Western Nicator Nicator chloris - - Common Garden Bulbul Pynonotus barbatus - - Little Green bulbul Andropadus virens - - Leaf love Pyrrhuru scandens - - Family Psittacidae Grey parrot Psittacus erithacus VU E Family Columbidae Red-eyed Dove Streptoplia semitorguata - - Laughing Dove Streptoplia senegalansis - - Blue-spotted wood dove Turtur afer - - Green fruit pigeon Treron calva - - Family Buceratidae Piping Hornbill Bycanistes fistulator - - Pied Hornbill Tockus fasciatus - - Family Accipitridae Lizard Buzzard Kaupifalco monogrammicus - - African Goshawk Accipiter tachiro - E Palm Nut-vulture Gypohierax angolensis - E Family Sturnidae Splendid Glossy starling Lamprotornis splendius - -
68
Family Dicruiridae Fork tailed Drongo Dicrurus adsimilis - - Family Charadriidae Common sandpiper Actitis hypoleucos - - Family Capitonidae Yellow-rumped Tinkerbird Pogoniulus bilineatus - - Family Hirundinidae Lesser striped swallow Hirundo abyssinica - - House martin Delichon urbica - - Family Ardeidae Little egret Egretta garzetta - - Great White Egret Egretta alba - - Cattle Egret Bubulcus ibis - - Green-backed heron Butorides striatus - - Family Estrildidae Orange-checked waxbill Estrilda melpoda - - Magpie Mannikin Lonchura fringilloides - - Bronze mannikin Lonchura cucullata - - Black Grey-crowed Negro-finch Nigrita canicapilla - - Family Ploceidae Village weaver Ploceus cucullatus - - Vieillot’s Back weaver Ploceus nigerrimus - - Grey-Headed sparrow Passer grisenus - - Family Viduidae Pin-tailed whydah Vidua macroura - - Family Nectariniidae Green Headed sunbird Cyanomitra verticalis - - Copper Sunbird Cinnyris cupreus - - Yellow bellied sunbird Nectarinia venusta - - Family Alcedinidae Giant Kingfisher Megaceryle maxima - - Blue-breasted king fisher Halcyon malimbica - - Senegal king fisher Halcyon senegalensis - - Family Platysteiridae Common Wattle eye Platysteira cyanea - -
69
Family Jacanidae African Jacana Actophilornis africana - - Family Numididae Crested Guineafowl Guttera pucherani - - Family Picidae Grey wood pecker Dendropicos goertae - -
KEY:
IUCN 2010 Red List
E N = Endangered V U = Vulnerable NT = Near Threatened
Nigeria 1985 Decree II
E = Endangered
Source: IUCN Taskforce Fieldstudy, 2012
4.5.3 Reptiles
Thirteen (13) reptile’s species were also recorded in the study. Three (3) were sighted in the field, Nile Monitor lizard (Various niloticus) Grey skink (Mabuya blanding) and Agama lizard (Agama agama) some of the reptiles listed are Dwarf crocodile, Rock python, Gaboon viper, Green mamba and Black forest turtle.
Table 4.12: Common reptiles of the Soku Gas Plant area, October 2012
COMMON NAMES SCIENTIFIC NAMES IUCN D 11 1985
Family Chelonidae Logger head turtle Caretta caretta EN E Green turtle Chelona mydas EN E Oliver Ridley Lepidochelys olivacea EN E Leatherback Dermochelys cariacea cariacea EN E Hawksbill turtle Eretmochelys imbricate EN E Family Python Biodae Rock Python Python Sebae Emerald snake Gastropyxis smaragdina - -
70
Family Elapidae Green mambas Dendroaspis viridis - - Black cobra Naja melanoleuca - - Family Viperidae Gaboon Viper Bitis gabonica - - Carpet Viper Echis carinatus - - Family Crocodylidae Dwarf crocodile Osteolaemus tetraspis - E Family Varanidae Nile monitor lizard Varanus niloticus - E Family Scincidae Grey skink Mabuya blandingi - - Family Agamidae Agama lizard Agama agama - - Family Pelomedusidae West African Black Forest Turtle Pelusios niger - E Family Testudiniae Serrated Hinge Back Tortoise Kinixys erosa EN -
KEY
IUCN 2010 Red List
E N = Endangered V U = Vulnerable NT = Near Threatened
Nigeria 1985 Decree II
E = Endangered
Source: IUCN Taskforce Fieldstudy, 2012
4.6 FISH AND FISHERIES
Fishing is one of the major occupations of the inhabitants within the study area, which is carried out at both commercial and subsistence levels. The fish and fisheries of the project area will be discussed under the following headings:
71
Exploited Fish Species Composition Gear types in the area Different fisheries types The role of women and children Seasonality in catches Fishing cycles and fisheries seasonality
4.6.1 Fish Species Composition
The composition of fish species from the general study area is listed in Table 4.13 which indicates their common and local names preferred fishing location and peak periods of exploitation in the area. The fishery is generally a multi-species stock largely exploited by artisanal fishers operating dug-out wooden canoes or motorized engine boats of various sizes. The common fisheries of the area include the sardines (Pellonula sp.), bonga (Ethmolosa fimbriata), mullets (various species), croakers, groupers, tilapia, flat fish, grunters, catfish, mudskippers and others as listed in Table 4.13. Table 4.13: Common fish species in Soku Gas Plant Area, October 2012.
S/N COMMON NAME
LOCAL NAME SCIENTIFIC NAME
STATUS FISHING GEAR PEAK PERIOD
FISHING GEAR
1 Sardines Afaru Pellonula sp Common River & Inland creeks.
February to July
Cast and seine Net
2 Bonga Kigbo Ethmalosa fimbriata
Common Saint Bartholomew River
August to March
Cast/seine Net
3 Shad Isongu Ilisha sp Common Saint Bartholomew River & Creeklets
August to March
Cast Net
4 Mullet Edegge Mugil sp Common Rivers and Creeks November to July
Cast net
5 Mangrove Mullet
Akuro edegge Mugil sp Common Mangrove Creeks November to May
Hook
6 Round head mullet
Gbolo edegge Mugil sp Common River mouth November to July
Cast net & Hook
7 Flat/long shaped mullet
Gbuopakalama edegge
Mugil sp Common River mouth November to July
Cast net
8 White coloured mullet
Abaraka edegge Mugil sp Common River mouth November to July
Cast net
9 Dark back mullet
Nyonkiri edegge Mugil sp Common River mouth November to July
Cast net
10 Croakers Ona Pseudotolithus sp Common Ocean, River mouth, Creeks
November to March
Seine net & Hook
11 Croaker Osimamumbo Pseudotolithus sp Common Ocean & Saint Bartholomew /Sombreiro Rivers
November to July
Cast net & Hook
12 Croaker Gbo Pseudotolithus sp Common Ocean November Cast net &
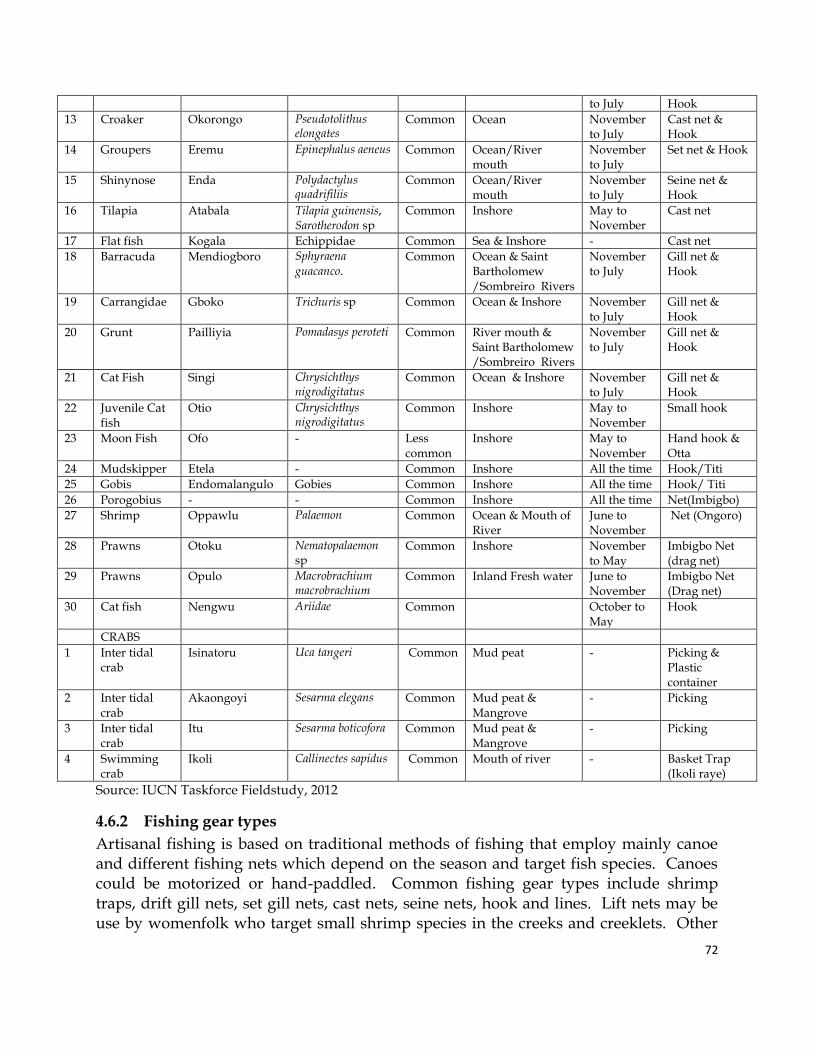
72
to July Hook
13 Croaker Okorongo Pseudotolithus elongates
Common Ocean November to July
Cast net & Hook
14 Groupers Eremu Epinephalus aeneus Common Ocean/River mouth
November to July
Set net & Hook
15 Shinynose Enda Polydactylus quadrifiliis
Common Ocean/River mouth
November to July
Seine net & Hook
16 Tilapia Atabala Tilapia guinensis, Sarotherodon sp
Common Inshore May to November
Cast net
17 Flat fish Kogala Echippidae Common Sea & Inshore - Cast net
18 Barracuda Mendiogboro Sphyraena guacanco.
Common Ocean & Saint Bartholomew /Sombreiro Rivers
November to July
Gill net & Hook
19 Carrangidae Gboko Trichuris sp Common Ocean & Inshore November to July
Gill net & Hook
20 Grunt Pailliyia Pomadasys peroteti Common River mouth & Saint Bartholomew /Sombreiro Rivers
November to July
Gill net & Hook
21 Cat Fish Singi Chrysichthys nigrodigitatus
Common Ocean & Inshore November to July
Gill net & Hook
22 Juvenile Cat fish
Otio Chrysichthys nigrodigitatus
Common Inshore May to November
Small hook
23 Moon Fish Ofo - Less common
Inshore May to November
Hand hook & Otta
24 Mudskipper Etela - Common Inshore All the time Hook/Titi
25 Gobis Endomalangulo Gobies Common Inshore All the time Hook/ Titi
26 Porogobius - - Common Inshore All the time Net(Imbigbo)
27 Shrimp Oppawlu Palaemon Common Ocean & Mouth of River
June to November
Net (Ongoro)
28 Prawns Otoku Nematopalaemon sp
Common Inshore November to May
Imbigbo Net (drag net)
29 Prawns Opulo Macrobrachium macrobrachium
Common Inland Fresh water June to November
Imbigbo Net (Drag net)
30 Cat fish Nengwu Ariidae Common October to May
Hook
CRABS
1 Inter tidal crab
Isinatoru Uca tangeri Common Mud peat - Picking & Plastic container
2 Inter tidal crab
Akaongoyi Sesarma elegans Common Mud peat & Mangrove
- Picking
3 Inter tidal crab
Itu Sesarma boticofora Common Mud peat & Mangrove
- Picking
4 Swimming crab
Ikoli Callinectes sapidus Common Mouth of river - Basket Trap (Ikoli raye)
Source: IUCN Taskforce Fieldstudy, 2012
4.6.2 Fishing gear types
Artisanal fishing is based on traditional methods of fishing that employ mainly canoe and different fishing nets which depend on the season and target fish species. Canoes could be motorized or hand-paddled. Common fishing gear types include shrimp traps, drift gill nets, set gill nets, cast nets, seine nets, hook and lines. Lift nets may be use by womenfolk who target small shrimp species in the creeks and creeklets. Other
73
fishing methods include hand-picking for different types of molluscs by the womenfolk and children such as periwinkles, oysters and other shellfish. Prominent among the fishing devices are the edek, a type of fish fence used in the creeks; alot, a large trap used on sand and mud-banks in inland waters. Teams using these devices either operate from their home villages, where they exploit the nearby waters, or stage long distance fishing expeditions, during which they live in camps or house-boats often far beyond the bounds of their homeland. Fishing gears are largely made of long setlines, circling nets and seine nets of different mesh sizes varying between ½”, 1”, 1½”, 2”, 2½ and 3” (1.0mm to 5.0mm). Gears measure 6-12m in length and 2-4 meters in width. Nets are manually operated. They are set and allowed to stay for up to one hour before they are removed with the catch.
4.6.3 Role of various People in the Fisheries
Motorized fishing around the larger water bodies and nearshore areas are the domain of male fishers. Oyster harvesting is mostly carried out by women and children and men who lack the boat infrastructure to engage in other demanding type of artisanal fishing. Fish processing based mainly on smoke-drying is predominantly a female occupation. For this purpose practically every family in each community has a fish smoking altar within or outside of the living premises.
4.6.4 Fishing cycles and seasonality
Seasonality of exploitation of the different fish species in the area is indicated in Table 4.13. The peak period for clupeids including sardines, shad and bonga is between October to about February/March corresponding to dry season period. During this time, considerable catches of the clupeids contribute significantly to income of fisherfolk. Freshwater prawns, Macrobrachium are predominant harvest during the rainy season between June and November. Palaemon, Penaeus and Atya species are also exploited during this period. From December to May is the peak period of estuarine white shrimp Nematopalaemon sp.
4.6.5 Shrimp Fishery
Shrimp is one of the leading highly priced sea foods that is harvested by fishers in Soku Gas Plant area and associated creeks and creeklets and it is largely accounted for by small scale fishers. This involves numerous rural persons operating motorized and non-motorized boats to catch shrimp. Most of the shrimps caught in the small scale sector are consumed internally. Gears for shrimping include stake or grass woven traps of

74
different dimension, scoop net. Drag nets are also in use. Fishing with these gears takes place in un-motorized wooden boats, which involves manual rowing with paddles. One fisher may conveniently employ traps and baskets usually engaged in macrobranchuim fishery. Traps with single and multiple compartments are also used in the sector. Dragnet or hand seine requires two operators, each holding the wooden pole (handle) as the net is dragged along in the river channel.
75
CHAPTER FIVE
5.0 CONCLUSIONS
The results of the observations on water quality based on the in situ analysis indicate
that the pH values and temperature values were within the permissible limits for
freshwater, the dissolved oxygen (DO) were within the range of 2.92 – 4.33mg/l. The
BOD values were quite low with levels of 0.8 – 2.4 mg/l, which is indicative of low
biological activity. Nutrient levels were also at 0.41 – 0.57 (NO3), <0.05 (PO4) and <1.0 -
1.2 (SO4), these values were within acceptable limits.
The total hydrocarbon concentration (THC) recorded for the surface water samples
were in the range of 1.15 – 9.15mg/l indicated high levels of hydrocarbon
contamination of the sampled area. This is also indicated unsatisfactory remediation
efforts, which will not guarantee speedy ecosystem recovery and overall impact on the
public health of the community due to indirect impact on the aquatic biological
resources.
The hydrocarbon levels in the sediments indicated TPH (1190 – 1472mg/kg), PAH (402
– 567mg/kg), THC (15,875 – 26,375mg/kg) and oil and grease (65,062 – 67,437mg/kg)
for Stations 1 and 2. The hydrocarbon levels recorded for soils at the same stations were;
THC (27,843 – 69,075mg/kg) at 0-30cm depth, 9,597 – 20,023mg/kg at 30-60cm depth
and 213 – 4,502mg/kg at 60 – 100cm depth. All these values were above the DPR target
level limit of 50mg/kg and intervention limits of 5,000mg/kg. Therefore it is indicative
that the sediment and soil of these sites were not properly remediated even though the
site had been signed off by all authorities and hence would not guarantee quick
recovery of the ecosystem.
The biological indicators of the health of the environment judged by the species richness and diversity of the flora and fauna of the area were low; The recorded phytoplankton total abundance were 1060 cells/ml, species richness of 22 and only 5 taxonomic group; Periphyton – only 4 major taxa, 17 species and overall abundance of 521 and Zooplankton – only 6 major taxa, 17 species, overall abundance of 189 individuals/ml and near absence of fish and molluscan larvae (mainly due to the impact of oil spillage), compared to the expected higher populations for such water bodies indicate the impact of the spillages on the environment.
76
Also, the buoyant fisheries activities of the area could be affected with impact on the larvae and juvenile fishes, which will indirectly affect recruitment and eventual fisheries productivity of the area and overall income of the fishing populations in the community.
These findings indicate that the remediation efforts within the Soku Gas Plant area were not adequate and hence will not guarantee environmental rehabilitation and ecosystem recovery in the nearest future.

77
78
REFERENCES
Akin-Oriola G. A. (2003): On the phytoplankton of Awba reservoir, Ibadan, Nigeria. Rev. Biol. Trop. 51(1): 99-106.
Akpan-Idiok, A. U. and I. E. Esu (2001). Morphological Characteristics and Classification
of Mangrove Swamp Soils in Cross River Estuary, Southeast Nigeria. Proceedings of the 27th Annual Conference of Soil Science Society of Nigeria, Pp. 60-68.
American Public Health Association (1995). Standard Methods for the Examination of
Water and Wastewater, APHA, AWWA and WPCE, 19th Edition, EPS Group Inc., Hanover, Maryland, U.S.A.
American Public Health Association (APHA, 1998). Standard Methods for the
Examination of water and wastewater, 19th Edition. American Public Health Association., Byrd Progress, Springfield, New York.
Anon (1986). Laboratory Manual for Agronomic Studies in Soil, Plant and
Microbiology. Contributors: C. T. I. Odu (Soil Microbiology), O. Babalola (Soil
Physics), E. J. Udo (Soil Chemistry), A. O. Ogunkunle (Soil Morphology &
Description), T. A. Bakare (Plant Analysis), G. O. Adeoye (Coordinator).
Department of Agronomy, University of Ibadan, Nigeria. 83pp.
Bohn, H.L., B. L. McNeal and G.A O`Connor (1979). Soil Chemistry, A Wiley-Inter
science Publication. John Wiley and Sons, New York.
Bradford, S.A. (1993). Corrosion control, New York: van Nostrand. Cansdale, G.S. (1991). West African Snakes. Longman, London – UK.
Chowdhury, M.M.R.; Mondol M.R.K. and Sarker, C. (2007): Seasonal variation of
plankton population of Borobila beel in Rangpur district Univ. j. zool. Rajshahi Univ. Vol. 26, pp. 49-54.
Collins, C.H. and Lyne, P.M. (1980): Microbiological Methods. Butterworth and Co.
Limited, London. pp. 125 – 300.
Coultas, C. L. and F. G. Calhoun (1976). Properties of some tidal marsh Soil of Florida. Soil Map of Africa. 5th Revision, Leopoldville.
79
Davies O.A., Abowei, J.F.N and Tawari, C.C. (2009): Phytoplankton Community of Elechi
Creek, Niger Delta, Nigeria-A Nutrient-Polluted Tropical Creek. American Journal of Applied Sciences 6 (6): 1143-1152.
Day, J.H. (1959). The biology of langeban lagoon: study of the effect of shelter from
wave action. Trans Roy Soc. S. Africa 35. 475 – 547. Day, J.H. (1967). A monograph on the polychaeta of Southern Africa, Part 1. Errantia,
Part 2. Sedentaria. British museum of Nat. Hist. London, UK. Department of Petroleum Resources (DPR) (2002) Environmental Guidelines and
Standards for the Petroleum Industry in Nigeria (EGASPIN), pp 59 – 66. Department of Petroleum Resources (DPR) (1991). Environmental Guidelines and Standard for the Petroleum Industries in Nigeria.
EBM, (1994) Environmentally Benign Manufacturing: Publications Edmond, J. (1978). Sea shells and other mollusks found on West African shores and
estuaries-Ghana University Press. 146pp. Ekeh, J. B. and F. D. Sikoko (2004) Diversity and spatial distributor of phytoplankton in
New Calabar River, Nigeria Liv. System sus. Dev. 1(3) 25-31.
Effiong, G. S. and G. A. Ayolagha (2010). Characteristics, Constraints and Management of Mangrove Soils for Sustainable Crop Production. EJEAFChe, 9(6), 2010, (977-996).
Emerson, S. and Abell, J. (2001). The Biological Pump in the Subtropical North Pacific
Ocean. Chicago: USA: Pretence Inc. Enger and Smith, 2004)Environmental Science; A study of Interrelationships. ; McGraw
Hill Evans, L.G., B.D. Kay and R.L. Thomas (1982). Soil Science. A Study Guide and
Laboratory Exercise Manual. Dept of Guelph, Ontario, Canada 365pp. FAO, (1990). Field guide to the commercial marine resources of the gulf of guinea. FAO
regional office for Africa. 229pp. FMENV (1991) . Federal Ministry of Environment Interim Guidelines and Standards
80
for Industrial Effluents , Gaseous Emmissions and Hazardous Waste Manaagement In Nigeria .
Federal Ministry of Environmental Sectoral Guidelines for Oil and Gas Industry Project
(1995) Hamadina, MK, Otobotekere, D. and Anyanwu DI (2007). Impact Assessment and
Biodiversity Considerations in Nigeria. A Case Study of Niger Delta University Campus Project on Wildlife in Nun River Forest Reserve. Management of Environmental Quality: An International Journal 18(2): 179-197
Happold, D.C.D. (1987). The Mammals of Nigeria. Oxford University Press, New York USA. Hart, A.I. (1994). The ecology of the communities of benthic macro-fauna in the
mangrove swamps of Port Harcourt area of the Niger Delta. Doctoral thesis, Univ. of Port Harcourt, Rivers State, Nigeria.
Hart, A.I. and Zabbey, N. (2005). Physico-chemical and benthic fauna of Woji creek in
the lower Niger Delta, Nigeria. Environment. Hodgson, J.M, (1983). Soil Sampling and Soil Descriptions. Monograph on soil Survey. Clarendon Press, 120-130pp Institute of Pollution Studies, IPS, (1988). Rivers State University of Science and
Technology, Port Harcourt, Nigeria.
International Union for the Conservation of Nature and Natural Resources (IUCN) (1992) Coastal and marine biodiversity report for UNEP: Identification, establishment, and management of specially protected areas in the WACAF region. Gland, Switzerland.
Juo, A.S.R (1979). Selected Methods for soil and plant analysis. IITA Manual Series I Kiel, G. (1997). Environmental Engineering McGraw-Hill International, U.K
Kingdom, J. ed. (1997) The Kingdom field guide to African mammals. Academic Press Ltd, Oval Road London NW1 70X
Kentucky Water Watch (KWW) (2001): Dissolved Oxygen and Water Quality:
http://.fluid. Stateky. Us/www/ramp/rms2.htm.
81
Mellanby, H. (1986). Animal life in fresh water. A guide to fresh water invertebrates. Chapman & Hall, London. 308p.
Narayanan, P. (2007). Environmental Pollution. Principles, analysis and control.
CBS Publishers and Distributors, India. NEDECO, (1969). The waters of the Niger Delta. Report of an investigation by NEDECO
(Netherlands Engineering Consultants), The Haque, 210 – 228.
Niger Delta Environmental Survey (NDES) (1997) :Final Report of Phase 1. Volume 1.
Oates, J. F., Bergl, R.A. and Linder, J.M. (2004) Africa’s Gulf of Guinea Forests: Biodiversity patterns and Conservation priorities. Advances in Applied Biodiversity Science No. 6, Center for Applied Biodiversity, Washington, 90pp.
Oates, J. F,. (2011). Primates of West Africa Pocket Identification Guide. Arlington VA 222022 USA. Obire, O. and Wemedo, S.A. (1996): The effect of oilfield wastewater on the microbial
populations of a soil in Nigeria. Niger Delta Biologia. 1:77-85. Odiete W. O. (1999). Environmental Physiology of animals and pollution of Africa. 5th
Revision, Leopoldville. Official Gazette No. 75, Vol. 79, A1269 Lagos 1992
Odu, C.T.I., O.F Esuruso, L.C Nwoboshi and J.A Ogunwale (1985). Environmental
Study of the Nigerian Agip Oil Company Operational Area. Soil and Freshwater Vegetation. Milan. Italy.
Ogbeibu, A.E. and Oribhabor, B.J. (2001). The ecological impact of stream regulation
using benthic macroinner tebrates as indicators. Journal of Aquatic Science 16(2): 132 – 134.
Olomukoro, J. O. and Ezemonye, L. I. N. (2007): Assessment of the macro-invertebrate
fauna of rivers in southern Nigeria. African Zoology 42(1):1-11. Osibanjo, O. and Ajayi, S.O. (1981). Pollution studies on Nigeria Rivers II, Water Quality of
some Nigeria Rivers, Environmental Research Series 2B: 87-95
Pourriot, R. (1980): Rotifers. In Durrand, J-R and Leveque, C. (eds) (1990): Flore et faune aquatiques de l’ Afrique Sahelo-Soudanienne. Editions de ORSTOM documentations Technique no. 44 Paris. 219-2328pp.
82
Powell, C.B (1980). The decapods crustaceans of the Niger Delta. A paper presented to
the workshop on the Niger Delta mangrove ecosystem, University of Port Harcourt, May, 1980, Abstract No. 29, 124pp.
Powell, C.B. (1995). Wildlife Study I: Report to the Environmental Afairs
Department, Shell Petroleum Development Company of Nigeria, Port Harcourt, Nigeria.
Raybaud,V., Tunin-Ley, A., Ritchie, M. E., and Dolan, J. R. (2008): Similar patterns of
community organization characterize distinct groups of different trophic levels in the plankton of the NW Mediterranean Sea. Biogeosciences Discuss., 5, 4897–4917.
Research Planning Institute (RPI) (1995) Environmental Baseline Studies for the
Establishment of Control Criteria and Standards against Petroleum Related Pollution in Nigeria
Reynolds, C.S. (1984): Phytoplankton periodicity: The interaction of form, function and
environmental variability. Freshwater Biology, 14: 111–142. Sanders, H.L. (1968). Marine benthic diversity. A comparative study. The American
Nat. 102. Sanders, H.L. (1986). Marine benthic diversity. A comparative study. The American
Nat. 102. Sikoki, F.D. and Zabbey, N. 2006. Environmental gradients and benthic community of
the middle reaches of Imo river, South-Eastern Nigeria Smith, R.T. and K. Atkinson (1975). Techniques in Pedelogy. A handbook for
Environmental and Resource Studies, Elek Science. London. Pp 24 – 31. Tel, D.A and Hagarty, M. (1984). Soil and Plant Analysis: study guide for Agricultural
laboratory,Directors and Technologist working in tropical regions. International
Institute of Tropical Agriculture and University of Guelph, Canada. 277pp.
Umeozor, O.C. 1996. Benthic fauna of new Calabar river, Nigeria. Trop. fresh water Biol. 4: 41 – 51.
United Nations Development Programme (UNDP) (2006). Niger Delta Human Development Report. 2006 UNDP, Nigeria, Abuja.
83
Victor, R and Ogeibu, A. E. (1985): Macrobenthic invertebrates of a stream flowing through farmland in southern Nigeria. Environmental Pollution, Series A 39: 333-347.
World Health Organizations (1996): Guidelines for drinking water quality. Vol. 3. Geneva. Young, C.M. and Barrett, J.H. (1970). Collins guide to the sea shore, Collins, St. James’s
place, London. 272p. Zabbey, N. 2002. An ecological survey of benthic macroinvetebrates of Woji creek off
the Bonny river system, Rivers State. M.Sc. Thesis, Univ. Port Harcourt, Nigeria.
84
Annex 1.
STANDARD OPERATING PROCEDURE FOR ANALYSIS IN ROFNEL LABORATORY
DETERMINATION OF HYDROCARBON IN SOIL AND EFFLUENT WATER.OIL AND GREASE and TOTAL PETROLIUM HYDROCARBON. ASTM D3921-09 SCOPE OF THE TEST Hydrocarbon in the context of this test is all substance extractible by TETRE CHLORO ETHYLENE in water sample of interest as an estimate of combined OIL and GREASE and the PETROLIUM HYDROCARBON INTERFERENCES Organic solvents and certain other organic compounds not considered as oil and grease on the basis of chemical structure may be extracted and measured as oil and grease. Using a pure and appropriate solvent will minimize additional hydrocarbon. Also zeroing the solvent in the instrument before reading samples will eliminate additional hydrocarbon. APPARATUS REQUIRED - -Infrared Spectrophotometer. HC 404 - -Weighing Balance, - -100ml Volumetric Flask, - -1ml Pipette, - -Cells made of quartz,10mm path length. At least 2 required. - -Filter Paper, IPS (Interphase Separator) - -Glass bottle, - -Measuring Cylinder,1litre - -Separating Funnel - Glass Funnel. REAGENTS - -Dehydrated crude oil, or Calibration Standard . - -Tetrachloroethylen. Solvent. - Silica gel. - Hydrochloric acid, Mixed 1:1 with distilled water - -Sodium Sulphate anhydrous and granular. PROCEDURE
85
Before Measurement - -Ensure that all that materials required in terms of reagents and apparatus are available – - -Put on the infrared spectrophotometer, HC 404 and allow to warm up for 30 minutes. - The extraction process - Weigh 10g of soil - Add 200ml of distilled water and shake properly - Decant into a 500ml bottle - -Put 20ml of solvent into the 500ml bottle (glass sampling bottle) - -Add a few quantity of HCl to adjust the pH to 2. - -Close the sampling bottle and shake vigorously for 2minutes - -Allow the bottle to stand until the contents settle and the bubble disappear. - -Open it with care to release any pressure build-up. - -Transfer the content of the bottle to a clean separatory funnel, using a glass funnel and recap the empty bottle - -Wash down the transfer funnel with clean solvent - -Allow the contents of the separatory funnel to settle. - -Transfer the bottom layer into a clean 50ml volumetric flask, through an IPS filter paper containing 1g of sodium sulphate. - -Add another 25ml of solvent to the original empty sample bottle, recap and shake the container to obtain good contact between the liquid and all inner surfaces. - -Transfer this new wash into the seperatory funnel, replace the stopper and shake the mixture vigorously for 2minutes - -Allow the content to settle, remove the stopper to release any pressure - -Transfer the bottom layer through the same IPS / sodium sulphate filter into the same 50ml volumetric flask. - -Wash down the filter assembly with fresh solvent and bring the liquid level to the mark in the flask. - (This is the volume of extraction solvent V1) Taking the water volume Drain the remaining contents of the separatory funnel into a 1000ml graduated cylinder and record the volume. For water calculation (This is the volume used, V2) Measurement of Oil and Grease Take some of the extract in V1 above and measure the absorbance in the infrared spectrophotometer. (This is A1) If the gross absorbance exceeds 0.6, dilute one part of the extract to ten parts
86
total volume with solvent and take the absorbance reading. Remember to multiply with this dilution factor later in the calculation (X.10) Measurement of petroleum hydrocarbon Take about 25ml (V3) of the extract Put about 5 grams of FLORISIL in the glass column of florisil by passing pure solvent through it. Pass the 25ml extract through the FLORISIL column, into a 50ml volumetric flask Pass fresh solvent through the FLORISIL column (to wash down) until the solvent gets to the 50ml mark on the flask. (This is V4) Take a portion of the 50ml obtained above and measure the absorbance (This I A2) CALIBRATION PROCEDURE Weigh 0.1g of Calibration standard in a 100ml volumetric flask make up to mark with tetrachloroethylene. STANDARDS - -Take 10ml, 8ml, 5ml, 4ml, & 2ml from the stock into another 5 of 100ml volumetric flask and make up to mark with the solvent. - -Introduce each of these standards into the cuvette and measure the respective absorption values. - -Plot a calibration graph of concentration versus absorbance, to get an R2
value as close as possible to 1. (0.999xx) and note the equation of the line NOTE: The coefficient of X in the line equation will be used in the calculation as ‘B’ CALCULATION Oil and Grease mg/l = A1 x V1 x B V2
Petroleum Hydrocarbon = A2 x V1 x V4 x B V2 x V3
Where A1 = Absorbance value of oil and grease Extract A2 = Absorbance value petroleum Hydrocarbon B = Coefficient of X in the line equation relating absorbance to concentration V1 = Volume of solvent sample used for extraction 50ml V2 = Volume of water sample used for extraction as measured in the cylinder for chromatography, 25ml V4 = Final diluted volume of petroleum hydrocarbon, 50ml
87
QA/QC - Analyze at least four working standards containing concentration of hydrocarbon in solvent within the expected sample concentration prior to the analysis of the sample to calibrate the equipment. - Verify instrument calibration after standardization by analyzing the standard at the concentration of one the calibration standards. - If the calibration cannot be verified, recalibrate the instrument. - A laboratory control sample should be analyzes with each batch of sample at a minimum frequency of 10%. - Wear correct PPE - Shake vigorously for clear separation - Adhere to equipment instrument instruction manual before & during use - Turn on the instrument and allow to stabilize. DETERMINATION OF BTEX IN SOIL. BY GAS CHROMATOGRAPHY (FID) TEST METHOD. ASTM D5790 - 95 SCOPE OF THE TEST This test method covers the identification and simultaneous measurement of purgeable volatile organic compounds, it is validated for treating drinking water, waste water and ground water. This test method is applicable to a wide range of organic compounds that have sufficiently high volatility and low water solubility to be efficiently removed from water samples. INTERFERENCES During analysis major contaminant sources are volatile materials in the laboratory or impurities in the inert purging gas in the sorbent trap. Avoid the use of plastic tubing or thread sealants order than PTFE. Contamination by carryover can occur whenever high and low concentrations are analysed in sequence, to reduce the potential for carry over the sample syringe must be rinsed out between samples with an appropriate solvent. Whenever an unusually concentrated sample is encountered, it should be followed by injection of a solvent blank to check for cross contamination. APPARATUS Gas chromatograph flame ionization detector (FID): which has capillary
88
column inlet, a data system that measures peak area and is capable of performing a baseline subtraction, liquid sample injector, Sampling Containers 40 to 120ml screw-cap glass vials equipped with a PTFE-faced silicon septum. The vials must contain at least twice the volume of water required for the analysis. QA/QC Prior to use, wash vials with detergent and rinse with tap and reagent water, air dry vials and septa at room temperature, dry in an oven for 1hour at 105OC and allow to cool in an area known to be free of organics. Syringes and syringe valves: microsyringes of 10 and 100μl. Resort stand: to hold the column during separation extraction bottle: to receive the elute column separator: for solid phase separation weighing balance: for weighing the salts spatular: for scooping salts Seperatory funnel: for clear separation Bottles: these are standard solution storage bottles of 4ml capacity. REAGENTS - SODIUM SULFATE : To trap the water - GLASS WOOL: To prevent the silica gel and sodium sulphate salt from entering into the extractant. - SILICAL GEL: The main extracting agent
- DICHLOROMETHANE: extracting solvent. Store away from other solvents.
SOLVENT QA/QC Test every batch with GC-FID to make sure that there are no contaminants like an extra peak that can contribute to the measurement. PROCEDURE Sampling stage The samples are transported chilled between 0oC and 6oC in pre-cleaned amber bottles. Column preparation (silica gel column) - Clamp the separating column in a retort stand,
89
- put approximately 1cm of activated glass wool at the base of the separating column with the aid of a glass rod - Put 4g activated silica gel gently and well packed, - put 0.5g of sodium sulphate on top of the silica gel. - Pour in 10ml of dichloromethane gently and elute. Extraction stage The sample is extracted chilled between 0oC and 6oC - For this determination 100 ml of sample is extracted with 10 ml of DCM (dichloromethane) in a 250 ml separating funnel. Allow for frequent release of pressure from the funnel. The clear extract (oil phase) is separated from the water phase. - Clean up: A silica gel column is pre-wetted with DCM and the extract is passed over the silica gel column to remove polar compounds. 2 ml of DCM is used to flush the last of the sample out. - The cleaned-up extract is allowed to reduce to 1,0ml by cold evaporation of the DCM. As soon as the volume of the extract gets to 1ml, the bottle is capped and the sample is ready for processing in the GC. CALIBRATION AND STANDARDS The instrument is calibrated using the manufactures standard calibration solution (Accustandard containing hexadecane extraction volatiles CLP.BTEX. 2.0mg/ml in MeOH) QA/QC Before any samples are analysed, it must show that a lab reagent blank is free of contamination that would prevent determination of any analyte of concern. Analyse three to five replicate of a lab fortified blank containing each analyte of concern at low concentration. Develop and maintain a system of control chart to plot the precision and accuracy of analytes and surrogate measurement as a function of time. Monitor the integrated areas of the quantisation ions of the internal standards and solugates in continuing calibration checks. This should remain relatively constant over time. Any drift of more than 50% in area is indicative of a loss in sensitivity, problem must be found and corrected. When each batch of samples is processed as a group within a work shift, analyse a laboratory reagent blank to determine the background system contamination. Instrument should be calibrated be analysis of samples to make sure that the retention time has not been affected by the temperature. DETERMINATION OF TPH AND PAH IN SOIL. BY GAS CHROMATOGRAPHY (FID) TEST METHOD. ASTM D7363 - 07
90
SCOPE OF THE TEST This method describes the procedure for analysis of extractable total petroleum hydrocarbon (ETPH) and polycyclic aromatic hydrocarbon (PAH) in surface and ground water. This conditions are designed to measure hydrocarbons. INTERFERENCES Contamination by carryover can occur whenever high and low concentrations are analysed in sequence, to reduce the potential for carry over the sample syringe must be rinsed out between samples with an appropriate solvent. During analysis major contaminant sources are volatile materials in the laboratory or impurities in the inert purging gas in the sorbent trap. Avoid the use of plastic tubing or thread sealants order than PTFE. Whenever an unusually concentrated sample is encountered, it should be followed by injection of a solvent blank to check for cross contamination. APPARATUS Gas chromatograph flame ionization detector (FID):which has capillary column inlet, a data system that measures peak area and is capable of performing a baseline subtraction, liquid sample injector, Sampling Containers 40 to 120ml screw-cap glass vials equipped with a PTFE-faced silicon septum. The vials must contain at least twice the volume of water required for the analysis. QA/QC Prior to use, wash vials with detergent and rinse with tap and reagent water, air dry vials and septa at room temperature, dry in an oven for 1hour at 105OC and allow to cool in an area known to be free of organics. Syringes and syringe valves: microsyringes of 10 and 100μl. Resort stand: to hold the column during separation Extraction bottle: to receive the elute Column separator: for solid phase separation weighing balance: for weighing the salts spatular: for scooping salts Seperatory funnel: for clear separation Bottles: these are standard solution storage bottles of 4ml capacity. REAGENTS
91
- SODIUM SULFATE : To trap the water - GLASS WOOL: To prevent the silica gel and sodium sulphate salt from entering into the extractant. - SILICAL GEL: The main extracting agent
- DICHLOROMETHANE: extracting solvent.
Store away from other solvents. SOLVENT QA/QC Test every batch with GC-FID to make sure that there are no contaminants like an extra peak that can contribute to the measurement. PROCEDURE Sampling stage The samples are transported chilled between 0oC and 6oC in pre-cleaned amber bottles. Column preparation (silica gel column) - Clamp the separating column in a retort stand, - put approximately 1cm of activated glass wool at the base of the separating column with the aid of a glass rod - Put 4g activated silica gel gently and well packed, - Put 0.5g of sodium sulphate on top of the silica gel. - Pour in 10ml of dichloromethane gently and elute. Extraction stage The sample is extracted chilled between 0oC and 6oC - Weigh 2g of soil, add 20ml of solvent and stir. The clear extract (oil phase) is separated from the soil. - Clean up: A silica gel column is pre-wetted with DCM and the extract is passed over the silica gel column to remove polar compounds. 2 ml of DCM is used to flush the last of the sample out. - The cleaned-up extract is allowed to reduce to 1,0ml by cold evaporation of the DCM. As soon as the volume of the extract gets to 1ml, the bottle is capped and the sample is ready for processing in the GC.
- CALIBRATION AND STANDARDS - The instrument is calibrated using the manufactures standard calibration solution (Accustandard containing Akanes mix 0.6 mg/mL and Accustandard PAH solution mix0.2 mg/mL CH2Cl2:MeOH (1:1)) QA/QC
92
- Before any samples are analysed, it must show that a lab reagent blank is free of contamination that would prevent determination of any analyte of concern. - Analyse three to five replicate of a lab fortified blank containing each analyte of concern at low concentration. - Develop and maintain a system of control chart to plot the precision and accuracy of analytes and surrogate measurement as a function of time. - Monitor the integrated areas of the quantization ions of the internal standards and solugates in continuing calibration checks. This should remain relatively constant over time. Any drift of more than 50% in area is indicative of aloss in sensitivity, problem must be found and corrected. - When each batch of samples is processed as a group within a work shift, analyse a laboratory reagent blank to determine the background system contamination. - Instrument should be calibrated be analysis of samples to make sure that the retention time has not been affected by the temperature.