sustainable or not? · sustainable or not? nyc pension cost projections through 2060 new york city...
TRANSCRIPT

JUNE 2011New York City ComptrollerJohn C. Liu
SUStaiNablE or Not?
PENSioN CoSt ProJECtioNSthroUgh 2060
NYC

JohN C. liUComptroller
First Deputy ComptrollerEric V. Eve
Deputy Comptroller for Accountancy & Budget
Simcha Felder
Assistant Comptroller for Budget & Chief Policy Officer
Ari Hoffnung
Executive Director, BudgetJonathan Rosenberg
Executive Director, Corporate GovernanceMichael Garland
Chief EconomistFrank Braconi, Ph.D.
Bureau Chief, Fiscal & Budget Studies Eng-Kai Tan
Bureau Chief, Financial AnalysisKirk Parks
Assistant Bureau Chief, Fiscal & Budget StudiesManny Kwan
Senior Advisor to the ComptrollerSharon Lee
Mercy Asare Kettly Bastien
Amitabha BasuMillicent Budhai-Robinson
Rosa Charles John Choe
Carmen Cruz Robert DeLaurentis
Andrew Elcock Peter E. Flynn
Jacqueline GoldMichele Griffin Michael Hecht
Farid Heydarpour, Ph.D.Dahong Huang
Amna KhanMabel LawPui Chi Law
Marcia MurphyPaula Murrien
Albert NgConnor Osetek
Andrew RosenthalSusan Scheer
Kenneth SylvesterMichelle Taylor
Orlando Vasquez
JUNE 2011Published by the
New York City Comptroller’s office budget & Policy bureau
1
4
ovErviEw
about the New York City Comptroller’s officeThe New York City Comptroller, an independently elected official, is the Chief Financial Officer of the City of New York. The mission of the office is to ensure the financial health of New York City by advising the Mayor, the City Council, and the public of the City’s financial condition. The Comptroller also makes recommendations on City programs and operations, fiscal policies, and financial transactions. In addition, the Comptroller manages the assets of the five New York City Pension Funds, performs budgetary analysis, keeps the City’s accounts, audits City agencies, and registers proposed contracts. His office employs a workforce of more than 700 professional staff members. These employees include accountants, attorneys, computer analysts, economists, engineers, budget, financial and investment analysts, claim specialists, and researchers in addition to clerical and administrative support staff.
about retirement Security NYC Retirement Security NYC is a major initiative launched by Comptroller John C. Liu to protect the retirement security of public employees while ensuring the City’s financial health.
about the Cover The cover of this report was designed to convey the economic concept of “consumption smoothing.” Within the context of pensions, consumption smoothing allows individuals to redistribute income from their younger to older self.
The images featured on the cover of this report represent the work of Stephen Mancusi, a New York City-based forensic artist since 1984, who utilized a technique known as age progression. All four images are of Josiel Estrella. The first image (far left) is a present-day headshot while the three images that follow are photographs that were digitally altered to represent aging of approximately 10, 25, and 40 years.
MANCUSI served the City of New York for almost 27 years in the New York City Police Department as Senior Forensic Artist and Detective, and is a member of the New York City Police Pension Fund. Mancusi conducted composite sketches with countless victims and witnesses for various crimes resulting in the identification of many suspects, including in such high-profile cases as the Stuyvesant Town Serial Rapist and the Central Park Assault Case. He is the author of The Police Composite Sketch published by Humana Press, and is the current Chair of the International Association for Identification’s Forensic Art Certification Board. For more information about the artist, visit www.forartist.com.
ESTRELLA is a Press Officer in the New York City Comptroller’s Office. She is also a member of the New York City Employees’ Retirement System.
CoNtENtSPagE
loNg-tErM ProJECtioNS of PENSioN CoStS
12 PENSioN CoStS rElativE to CitY rESoUrCES
17 CoNClUSioN
18 aPPENdix
NYC
SUStaiNablE or Not?
PENSioN CoSt ProJECtioNSthroUgh 2060
RETIREMENT SECURITY NYC
SUStaiNablE or Not? NYC PeNsioN Cost ProjeCtioNs through 2060
New York City ComptrollerJohn C. Liu
1JUNE, 2011
overview
Perhaps the most important consideration in evaluating proposals to alter the pension benefits offered to City employees is the long-term sustainability of the financial obligation entailed. If realistic projections indicate that pensions will absorb a rapidly-rising and ever-greater share of City expenditures, the City may be compelled to dramatically reduce its pension commitments. If, on the other hand, financial projections indicate that currently high pension costs are likely to quickly subside, there may be no imperative to curtail benefits at all. This study was initiated by the New York City Comptroller’s Office to inform the debate over municipal employee compensation with projections of the long-run trajectory of the City’s pension obligations.
A previous study by the Comptroller’s Office documented the rapid rise of the City’s pension costs over the past ten years and quantified the major reasons for its growth (The $8 Billion Question: An Analysis of NYC Pension Costs Over the Past Decade, Office of the New York City Comptroller, April 2011). From Fiscal Year (FY) 2001 through FY 2010, employer contributions to the New York City pension funds1 increased from $1.2 billion to $7.7 billion. The Comptroller’s analysis found that about 48 percent of the increase in contributions was caused by unexpectedly poor market performance, about 44 percent due to benefit enhancements (almost all of which were enacted in 2000), and about 3 percent due to unanticipated investment and administrative expenses. That study, however, did not address the impact of employee pensions on future City budgets.
This study provides projections of employer and City contributions2 to the five employee pension funds through FY 2060 made by actuaries from the Hay Group. The Hay Group’s long-term forecasts were based on the pension benefits provided under current law and on actuarial assumptions and methods that are consistent with those currently utilized by the New York City Office of the Actuary. The resulting pension contribution costs were put into an economic and budgetary context by the Comptroller’s Bureau of Fiscal and Budget Studies.
Since the rate of investment return assumed (and ultimately realized) on pension fund assets is a major determinant of the employers’ level of contributions, the
1 The City’s five pension funds are: The New York City Employees’ Retirement System (NYCERS), the New York City Teachers’ Retirement System-Qualified Pension Plan (TRS), the New York City Board of Education Retirement System-Qualified Pension Plan (BERS), the New York City Police Pension Fund (POLICE), and the New York City Fire Department Pension Fund (FIRE).
2 City contributions are a subset of employer contributions because NYCERS, TRS, and BERS are cost-sharing, public employee retirement systems, i.e., employers other than the City of New York also contribute to these retirement systems.

RETIREMENT SECURITY NYC
SUStaiNablE or Not? NYC PeNsioN Cost ProjeCtioNs through 2060
New York City ComptrollerJohn C. Liu
2 JUNE, 2011
Hay Group estimated four different pension cost scenarios.3 Three scenarios projected employer and City contribution costs using an 8.0 percent, 7.5 percent, and 7.0 percent rate of return, with modest growth in the active membership of the pension funds. There is also a fourth scenario that held active membership constant with an 8.0 percent rate of return. Unless otherwise specified, discussions in the report refer to projections based on an 8.0 percent rate of return with a 0.25 percent annual rate of growth in pension fund active membership. This is referred to as the “baseline” scenario in the report text. The NYC Office of the Actuary also currently utilizes an 8.0 percent rate of return to calculate employer contributions to the pension funds.
The reader should bear in mind that these projections are not intended to represent a most likely scenario or any other judgment concerning the city’s actual economic growth and fiscal status over the next 50 years. The next half century will most likely contain boom times and asset bubbles, recessions and market panics, just as past decades have. It will contain changes in elected administrations, reversals of governing philosophies, and fluctuations of the political climate. The actual course of economic and fiscal events will undoubtedly diverge from the smooth, straight-line projections presented here. Rather, this analysis intends to provide a baseline projection for understanding how pension obligations will affect the City’s budget, if all current laws relating to municipal pensions are left in place and if historical economic trends remain largely intact.
The analysis indicates that required City contributions to employee pension funds will peak in FY 2016, when they will reach approximately $8.3 billion, or 11.4 percent of total City expenditures. They will then level off, and even decline somewhat, during the period from FY 2016 to FY 2027. Thereafter, contributions will decrease slowly in inflation-adjusted dollars, while falling both as a percentage of payroll4 and as a percentage of City expenditures, through FY 2060.
The major findings of the study are:• City contributions to employee pension funds will increase through FY 2016, after
which they will decline as a percentage of the City’s expenditures and revenues.• Pension costs as a percent of the City’s budget will continue to run above typical
historical levels until about 2022, at which point they will return to levels below those of the early 1980s.
3 Hay Group’s Scenario 1 assumes level workforce and 8 percent investment return, which they refer to as their “base-line” scenario because it projects no workforce growth; Scenario 2 assumes workforce increases of 0.25 percent per year from FY 2014 and 8 percent investment return; Scenario 3 assumes workforce increases of 0.25 percent per year from FY 2014 and 7.5 percent investment return from FY 2012; and Scenario 4 assumes workforce increases of 0.25 percent per year from FY 2014 and 7.0 percent investment return from FY 2012. The body of this report only discusses Hay Group’s Scenarios 2, 3, and 4, with Hay Group’s Scenario 2 referred to as this report’s “baseline” scenario because it reflects the 8.0 percent investment return assumption which is currently used by the pension funds.
4 Payroll, in the context of this report, refers to “covered payroll,” i.e., the payroll of the active members of the pension funds on the specified date. In other words, salaries of City employees who are not members of the pension funds are not included.
RETIREMENT SECURITY NYC
SUStaiNablE or Not? NYC PeNsioN Cost ProjeCtioNs through 2060
New York City ComptrollerJohn C. Liu
3JUNE, 2011
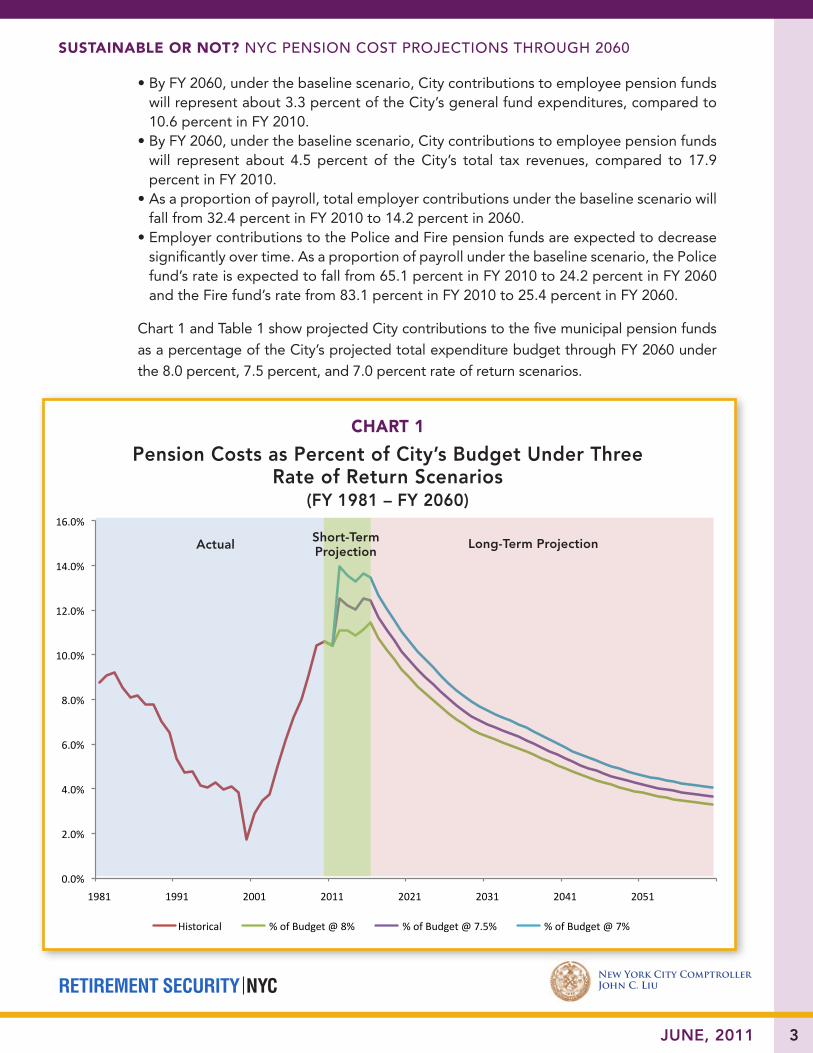
• By FY 2060, under the baseline scenario, City contributions to employee pension funds will represent about 3.3 percent of the City’s general fund expenditures, compared to 10.6 percent in FY 2010.
• By FY 2060, under the baseline scenario, City contributions to employee pension funds will represent about 4.5 percent of the City’s total tax revenues, compared to 17.9 percent in FY 2010.
• As a proportion of payroll, total employer contributions under the baseline scenario will fall from 32.4 percent in FY 2010 to 14.2 percent in 2060.
• Employer contributions to the Police and Fire pension funds are expected to decrease significantly over time. As a proportion of payroll under the baseline scenario, the Police fund’s rate is expected to fall from 65.1 percent in FY 2010 to 24.2 percent in FY 2060 and the Fire fund’s rate from 83.1 percent in FY 2010 to 25.4 percent in FY 2060.
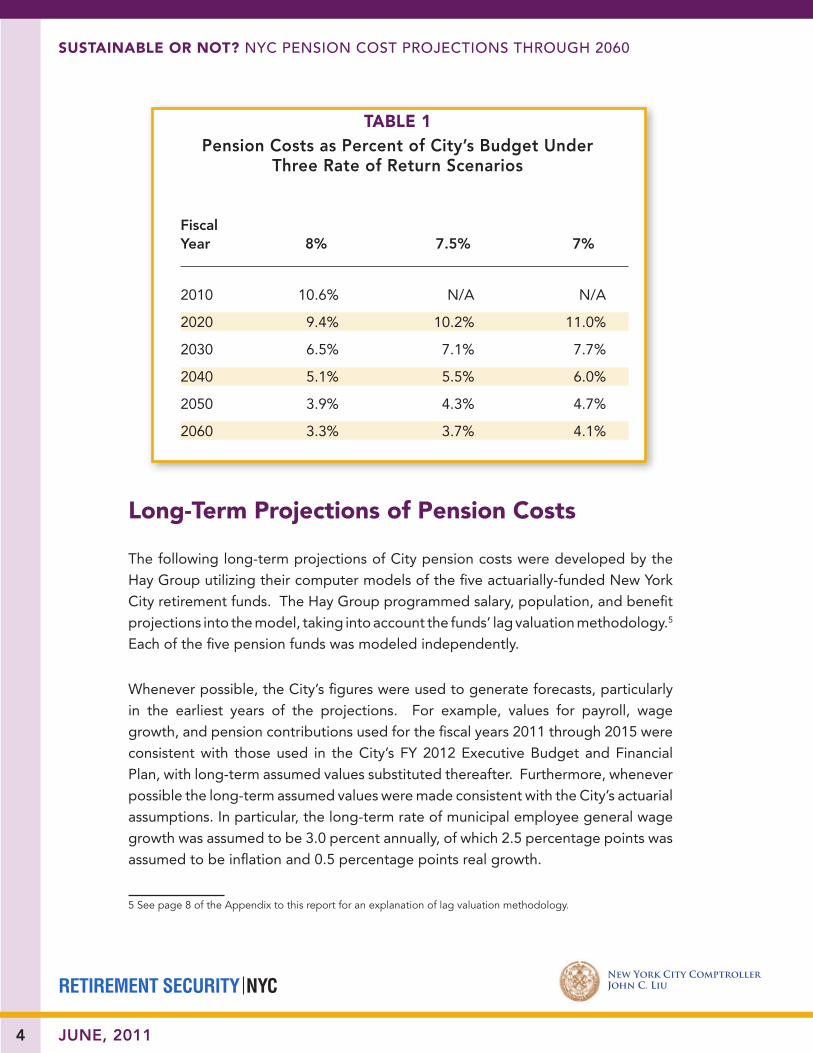
Chart 1 and Table 1 show projected City contributions to the five municipal pension funds as a percentage of the City’s projected total expenditure budget through FY 2060 under the 8.0 percent, 7.5 percent, and 7.0 percent rate of return scenarios.
Chart 1
Pension Costs as Percent of City’s Budget Under Three Rate of Return Scenarios
(FY 1981 – FY 2060)
0.0%
2.0%
4.0%
6.0%
8.0%
10.0%
12.0%
14.0%
16.0%
1981 1991 2001 2011 2021 2031 2041 2051
Historical %ofBudget@8% %[email protected]% %ofBudget@7%
Long-Term ProjectionShort-TermProjectionActual
RETIREMENT SECURITY NYC
SUStaiNablE or Not? NYC PeNsioN Cost ProjeCtioNs through 2060
New York City ComptrollerJohn C. Liu
4 JUNE, 2011
long-term Projections of Pension Costs
The following long-term projections of City pension costs were developed by the Hay Group utilizing their computer models of the five actuarially-funded New York City retirement funds. The Hay Group programmed salary, population, and benefit projections into the model, taking into account the funds’ lag valuation methodology.5 Each of the five pension funds was modeled independently.
Whenever possible, the City’s figures were used to generate forecasts, particularly in the earliest years of the projections. For example, values for payroll, wage growth, and pension contributions used for the fiscal years 2011 through 2015 were consistent with those used in the City’s FY 2012 Executive Budget and Financial Plan, with long-term assumed values substituted thereafter. Furthermore, whenever possible the long-term assumed values were made consistent with the City’s actuarial assumptions. In particular, the long-term rate of municipal employee general wage growth was assumed to be 3.0 percent annually, of which 2.5 percentage points was assumed to be inflation and 0.5 percentage points real growth.
5 See page 8 of the Appendix to this report for an explanation of lag valuation methodology.
tablE 1Pension Costs as Percent of City’s Budget Under
Three Rate of Return Scenarios
Fiscal Year 8% 7.5% 7%
2010 10.6% N/A N/A
2020 9.4% 10.2% 11.0%
2030 6.5% 7.1% 7.7%
2040 5.1% 5.5% 6.0%
2050 3.9% 4.3% 4.7%
2060 3.3% 3.7% 4.1%

RETIREMENT SECURITY NYC
SUStaiNablE or Not? NYC PeNsioN Cost ProjeCtioNs through 2060
New York City ComptrollerJohn C. Liu
5JUNE, 2011
The projections include a 0.25 percent annual growth in the City’s workforce starting in FY 2014, leading to an increase of “active” participants in the five pension plans to 411,168 by FY 2060, compared to 365,639 in FY 2010. The Comptroller’s Office believes this slight growth in active membership increases the realism of the forecasting exercise by allowing the municipal “headcount” to increase with the projected increase in the City’s resident population, while still allowing for anticipated increases in labor productivity. However, all categories of employees were assumed to increase in number at the same rate; consequently, the share of active members employed by the City directly and employed by other public agencies is held constant throughout the forecast period. Similarly, the distribution of City employees by function was held constant throughout the period. The constant employment mix assumption was made because it was deemed too speculative to project how future social conditions and technological innovations might alter the municipal government employment mix.
An important variable used in projecting the pension contribution costs to the City was the rate of return expected on pension fund assets. The baseline projections were calculated using an 8.0 percent annual rate of return, which is identical to that currently used by the City. The compounded annual average rate of return on the assets of the five pension funds combined was 9.37 percent for the 30-year period FY 1981 - FY 2010. However, the Hay Group also projected employer contributions under 7.5 percent and 7.0 percent rate of return assumptions for each of the funds. The different rate of return assumptions begin with the first forecasted period, i.e., FY 2012. In other words, no “catch-up” in fund asset values is assumed to offset the unusually poor investment returns experienced during the past decade.
According to the baseline projection using an 8.0 percent return on pension fund investments, the City net contributions to the five pension funds will continue to increase through FY 2016, although at a much slower rate than they have in recent years. They will then remain below the FY 2016 figure until FY 2034, after which they will again rise slowly in nominal (unadjusted for inflation) dollars. The projected annual rate of increase between FY 2034 and FY 2060 is 1.5 percent, well below the rate of inflation anticipated for that period.
The projected annual rate
of increase between FY
2034 and FY 2060 in City
net contributions to the
five pension funds is 1.5
percent, well below the
rate of inflation anticipated
for that period.

RETIREMENT SECURITY NYC
SUStaiNablE or Not? NYC PeNsioN Cost ProjeCtioNs through 2060
New York City ComptrollerJohn C. Liu
6 JUNE, 2011
Chart 2 shows the City’s projected contributions to the five pension funds, in nominal dollars, for each rate of return scenario for the period FY 2010 to FY 2060. It is a mathematical necessity that the pattern of growth is similar in each scenario, and that the 7.0 percent return scenario results in a higher level of City contributions. By 2060, the 7.0 percent return scenario results in City contributions that are $2.7 billion, or 22.4 percent, higher than if the realized rate of return over that period is 8.0 percent.
Although the costs plotted in Chart 2 appear to be growing continuously, in reality, beyond 2026 the curves essentially plot the rate of inflation. It is instructive to look at the projected pension costs in inflation-adjusted dollars. That is done in Chart 3.
($ in Billions)
$0
$2
$4
$6
$8
$10
$12
$14
$16
2010
2012
2014
2016
2018
2020
2022
2024
2026
2028
2030
2032
2034
2036
2038
2040
2042
2044
2046
2048
2050
2052
2054
2056
2058
2060
8.0% 7.5% 7.0%
Chart 2
Projected City Pension Contributions with Three Rate of Return Scenarios
(FY 2010 – FY 2060)

RETIREMENT SECURITY NYC
SUStaiNablE or Not? NYC PeNsioN Cost ProjeCtioNs through 2060
New York City ComptrollerJohn C. Liu
7JUNE, 2011
Chart 3 shows that the real, or inflation-adjusted, pension costs to the City are projected to rise under the baseline scenario until FY 2016, and then to decline through 2060. In the 7.5 percent and 7.0 percent rate of return scenarios, pension costs in real dollars peak in FY 2012. Under each rate of return scenario, City pension contributions will be roughly 50 percent lower in real terms in FY 2060 compared to the projected costs in FY 2016. Those declining real costs are projected to occur without any further changes to employee pension benefits and while allowing for a 0.25 percent annual increase in the City’s workforce. Moreover, if a 7.0 percent annual return were to be realized over the period FY 2012 through FY 2060, the least favorable scenario modeled, real pension costs to the City would still be 34.6 percent lower in FY 2060 than in FY 2010.
Chart 3
Projected City Pension Contribution with Three Rate of Return Scenarios (Inflation-Adjusted)
Chart 3
Projected City Pension Contributions in Real Dollars (FY 2010 – FY 2060)($ in
Billions)
$0
$1
$2
$3
$4
$5
$6
$7
$8
$9
$10
2010
2012
2014
2016
2018
2020
2022
2024
2026
2028
2030
2032
2034
2036
2038
2040
2042
2044
2046
2048
2050
2052
2054
2056
2058
2060
Real$s@8% [email protected]% [email protected]%

RETIREMENT SECURITY NYC
SUStaiNablE or Not? NYC PeNsioN Cost ProjeCtioNs through 2060
New York City ComptrollerJohn C. Liu
8 JUNE, 2011
There are two reasons for the projected long-term decline in real contribution costs. First, pursuant to the funds’ method of phasing in investment shortfalls over a six-year period, the adverse impact from the asset value declines of 2008-2009 will be fully realized in the actuarial asset values by FY 2016. However, the cost of funding those shortfalls will be felt throughout the time period studied, with the actual dollar amount declining each year until it eventually becomes financially insignificant. That effect will reduce the rate of contribution growth each year beyond FY 2016.
Far more important is the effect of the phasing in of new pension plans, which are generally less favorable for employees and less expensive for the City. Some of these plans have been in place for some time, such as the “Tier 4, 57/5 Plan” into which new civilian employees have been enrolled since June 29, 1995. This pension plan is less expensive to the City than earlier plans, primarily because of the higher rate of employee contribution required. Although participants in this plan are eligible to retire at age 57, compared to the earlier plan under which the retirement age was 62, participants in the current plan contribute an additional 1.85 percent of their salary to their pension fund for the first 30 years of service. The increased employee contribution makes the plan slightly less expensive to the City than the earlier “62/5” plan. Charts showing the major features of the current plans can be found as Exhibits D, E, and F in the Appendix to this report.
More financially significant changes have been implemented for the Police and Fire pension plans in recent years. Since July 1, 2009, new uniformed Police and Fire Department hires are required to join a “Tier 3” pension plan. Among the significant changes from the earlier Police and Fire pension plans, Tier 3 extends the years of service necessary to receive a 50 percent-of-salary pension benefit, changes the determination of final pensionable salary, and reduces disability benefits. Those changes make pension benefits significantly less expensive to the City, as is evident from Table 2.
The projected long-term
decline in the City’s
inflation-adjusted pension
costs is largely due to the
phasing-in of new, less
costly pension plans.

RETIREMENT SECURITY NYC
SUStaiNablE or Not? NYC PeNsioN Cost ProjeCtioNs through 2060
New York City ComptrollerJohn C. Liu
9JUNE, 2011
Table 2 shows the entry age normal rates for civilian workers, police, firefighters, and teachers under the current and previous pension plans. Entry age normal is an actuarial cost method designed to estimate a member’s total plan benefit over the course of his or her career. It can be used to design an employer’s contribution rate that produces contributions equal to a fixed percentage of an employee’s salary throughout their job tenure. The percentages shown in Table 2 are the entry age normal rates for a 30-year-old male or female entering each type of City employment.
tablE 2
Entry Age Normal Rates for City Pension Contributions Under Current and Previous Pension Plans
Open to New Hires
Plan Male Female
NYCERS (Civilians)Former Plan: “Tier 4, 62/5” 5.71% 6.36%Current Plan: “Tier 4, 57/5” 5.41% 6.17%
POLICEFormer Plan: “Tier 2” 25.56% 26.25%Current Plan: “Tier 3” 12.56% 13.07%
FIREFormer Plan: “Tier 2” 27.17% 27.47%Current Plan: “Tier 3” 11.81% 11.98%
TRSFormer Plan: “Tier 4, Teachers’ 62/5” 8.61% 9.07%Current Plan: “Tier 4, Teachers’ 55/27” 6.39% 6.79%
BERSFormer Plan: “Former Plan: “Tier 4, 62/5” 5.88% 6.63%Current Plan: “Current Plan: “Tier 4, 55/27” 4.00% 4.63%
Source: Office of the NYC Actuary For 30-year-old males and females
RETIREMENT SECURITY NYC
SUStaiNablE or Not? NYC PeNsioN Cost ProjeCtioNs through 2060
New York City ComptrollerJohn C. Liu
10 JUNE, 2011
Changes have also been made to teachers’ pension plans in recent years.6 Effective December 11, 2009, new teachers entering the Teachers’ Retirement System are required to contribute 4.85 percent of salary until they have 27 years of credited service, and 1.85 percent thereafter. This lowers the City’s costs, as 62/5 members were only required to contribute 3.0 percent of salary for the first ten years of service. The new teachers’ plan also raised the vesting period from five to ten years of credited service.
As more senior employees enrolled in earlier pension plans retire and are replaced with employees enrolled in the newer plans, the real cost of pensions to the City will decline. Because the changes made to the pension plans offered to various classes of municipal employees differ, the trajectory of the City’s future pension costs for each of the respective funds will also differ. Chart 4 shows projected employer contribution costs as a percent of payroll for each of the five funds. If no further adjustments to pension benefits are made, other assumptions are accurate, and investment returns are equal to the assumed rate (in Chart 4, 8.0 percent), the gap between contributions7 as a percentage of salary and the entry-age normal rate will narrow.
6 These changes were made in two steps, from the 62/5 Plan to the 55/27 Plan by Chapter 19 of the Laws of
2008, effective Feb. 28, 2008, followed by a modification of the 55/27 Plan by Chapter 504 of the Laws of 2009, effective Dec. 11, 2009.
7 Employer contributions shown in Chart 4, and elsewhere in the body of this study, include costs for administra-tion of four of the pension funds (excluding FIRE), investments, Variable Supplements Funds (VSFs), and the impact of the One-Year Lag methodology used by the City.
As more senior employees enrolled
in earlier pension plans retire
and are replaced with employees
enrolled in the newer plans, the real
cost of pensions to the City
will decline.

RETIREMENT SECURITY NYC
SUStaiNablE or Not? NYC PeNsioN Cost ProjeCtioNs through 2060
New York City ComptrollerJohn C. Liu
11JUNE, 2011
In Chart 4 it can be seen that employer pension contributions as a percentage of payroll is presently much higher for the Fire and Police funds than it is for TRS, BERS, or NYCERS. In FY 2010, the ratio was 83.1 percent for the Fire fund and 65.1 percent for the Police fund, compared to 20.6 percent for NYCERS. However, primarily because the newly-implemented Tier 3 plans for Police and Firefighters represent larger benefit reductions compared to earlier plans, the projected ratios for POLICE and FIRE drop more dramatically than for the other three funds. By FY 2060, it is projected that the contributions/salary ratios for the Fire and Police funds will be 25.4 and 24.2 percent, respectively, while for TRS, BERS and NYCERS it will be 14.1, 12.7, and 11.4 percent, respectively.
0%
10%
20%
30%
40%
50%
60%
70%
80%
90%
100%
2010
2012
2014
2016
2018
2020
2022
2024
2026
2028
2030
2032
2034
2036
2038
2040
2042
2044
2046
2048
2050
2052
2054
2056
2058
2060
NYCERS TRS BERS POLICE FIRE
Chart 4
Projected Employer Pension Contributions as Percent of Payroll
(FY 2010 – FY 2060)

RETIREMENT SECURITY NYC
SUStaiNablE or Not? NYC PeNsioN Cost ProjeCtioNs through 2060
New York City ComptrollerJohn C. Liu
12 JUNE, 2011
Pension Costs relative to City resources
When evaluating long-term public budget projections, it is useful to relate them to the productive capacity of the economy or to some other measure of potential resources. When projected far out into the future, dollar values (especially when distorted by inflation) can be misleading as the future values are made larger by long-term compounding. For example, to get a clear picture of the long-term budget implications of various policies, the federal government often expresses budget items as a share of the projected total federal budget or as a percentage of Gross Domestic Product (GDP). In this section we provide a similar approach to the City’s future pension contributions as projected by the Hay Group.
0.0%
0.2%
0.4%
0.6%
0.8%
1.0%
1.2%
1.4%
1.6%
1981 1991 2001 2011 2021 2031 2041 2051
Actual %ofGCP@8% %[email protected]% %ofGCP@7%
Chart 5
Actual and Projected City Pension Contributions as Percent of Gross City Product
(FY 1981 – FY 2060)

RETIREMENT SECURITY NYC
SUStaiNablE or Not? NYC PeNsioN Cost ProjeCtioNs through 2060
New York City ComptrollerJohn C. Liu
13JUNE, 2011
Chart 5 plots historical City pension contributions through FY 2010 as a percentage of Gross City Product (GCP), and projected contributions for each of the three rate of return scenarios, for the period FY 2011 to FY 2060. GCP is a measure of the total economic output of the city, analogous to the national GDP figure. There is no federal data series for GCP for New York City or any other cities, except Washington, D.C. The historical figures are estimated by the Comptroller’s Office from: figures on national output; Gross State Product; Gross Regional Product (metropolitan areas) and Local Area Personal Income from the Bureau of Economic Analysis (BEA); employment figures and wage data from the Bureau of Labor Statistics (BLS); and various other local area economic indicators. The Comptroller’s historical GCP estimates, adjusted to fiscal years, correspond closely to similar estimates constructed by the City’s Office of Management and Budget in terms of dollar magnitude and long-term growth rate.
According to the Comptroller’s estimates of GCP, the city’s real economic output increased at a rate slightly faster than the rate of national GDP during the period FY 1981 to FY 2010 (3.1 percent versus 2.8 percent). For purposes of its own long-term budget analysis, the Federal Office of Management and Budget (OMB) projects real GDP to increase at approximately a 2.2 percent rate over the period 2010 through 2060. In order to build into our analysis conservative estimates of the city’s economic growth, we have assumed that real GCP will grow at a rate two-thirds as fast as real GDP,
or by approximately 1.5 percent annually, during the period FY 2016 to FY 2060. For the years through FY 2015, we have used the same short-term GCP forecasts utilized in other of the Comptroller’s budget reports and tax revenue forecasts.
The principal reason we project the city’s rate of real economic growth to be lower than the national rate is the difference in projected population growth rates. From 1980 to 2010, the city’s population grew at less than half the rate of the nation’s (0.5 compared to 1.1 percent). If that growth differential persists until 2060, and there is no widening of the difference in per capita output in New York City and per capita
In order to build into our analysis
conservative estimates of the
city’s economic growth, we have
assumed that real GCP will grow
at a rate two-thirds as fast as
real GDP, or by approximately
1.5 percent annually, during the
period FY 2016 to FY 2060.
RETIREMENT SECURITY NYC
SUStaiNablE or Not? NYC PeNsioN Cost ProjeCtioNs through 2060
New York City ComptrollerJohn C. Liu
JUNE, 201114
output in the rest of the United States, the difference in real economic growth should be about 0.6 percent.
The OMB anticipates a rate of inflation over the 50-year period of 2.5 percent, which is the same as that utilized by the Hay Group in its analysis of City pension contributions. Consequently, we also use an inflation assumption of 2.5 percent in our projections of long-term nominal GCP growth. Combining these assumptions (1.5 percent real GCP and 2.5 percent inflation), we anticipate an average annual growth rate of 4.0 percent for nominal GCP during the forecast period.
Chart 5 shows that the City’s actual pension contributions of $6.7 billion in FY 2010 represented a sum equal to 1.10 percent of GCP for that year. That is slightly above the previous high level of 1.07 percent in FY 1981, and dramatically above the low point of 0.17 percent reached in FY 2000. Based on our short- and long-term projections of GCP growth, the FY 2010 percentage is expected to be the peak share if the current 8.0 percent rate of return assumption is maintained. If City contributions were to be determined using a 7.5 percent or 7.0 percent rate of return assumption (effective FY 2012, but retaining current lag methodologies), the contributions/GCP ratio would begin to trend downward after FY 2012.
If the pension funds realize an 8.0 percent rate of return on investments during the 50-year forecasting period, the analysis indicates that City pension contributions as a share of GCP will fall to 0.27 percent by 2060. That is approximately the percentage experienced in FY 2001. Over the entire forecast period FY 2011 - FY 2060, the ratio would average 0.56 percent, substantially lower than the historical 0.68 percent average experienced from FY 1981 to FY 2010. Under the less-favorable rate of return scenario of 7.0 percent, the ratio would drop to 0.33 percent by FY 2060, and average 0.66 percent over the forecast period.
Based on our short- and long-term
projections of GCP growth, the
FY 2010 percentage is expected to
be the peak share if the current 8.0
percent rate of return assumption
is maintained.
RETIREMENT SECURITY NYC
SUStaiNablE or Not? NYC PeNsioN Cost ProjeCtioNs through 2060
New York City ComptrollerJohn C. Liu
15JUNE, 201115
It is also instructive to look at City pension contributions relative to tax revenues and as a share of total revenues or expenditures.8 This is done for the 8.0 percent rate of return scenario in Chart 6. In forecasting tax revenues and expenditures additional assumptions are needed. The City’s current tax revenue figures were used for the period FY 2011 through FY 2015; thereafter, they were assumed to grow at the same rate as GCP. Due to the City’s graduated income tax rate and its reliance on other economically-sensitive taxes, tax revenues as a percent of GCP tend to increase during economic expansions and fall during recessions. Overall, however, there has been no clear trend in the recent historical data, with tax revenues having averaged 6.22 percent of GCP during the period FY 1981 to FY 2010, quite close to the 6.15 percent figure in FY 2010.
Over the same period total City revenue (and expenditures) has trended downward, from 12.21 percent of GCP in FY 1981 to 10.39 percent in FY 2010. The differing trend between tax revenue and total expenditures was a result of a greater reliance on own-tax revenue to fund City operations during the past few decades. Federal categorical grants, State categorical grants, City fines, fees for service, and other revenues have all fallen as a share of the City’s revenue base. Given the long-term budgetary problems of the federal and state governments, and the anticipated political climate for managing those budgetary problems, we anticipate that those trends will continue. Consequently,
in the forecast years after FY 2015, we assume that federal and state categorical grants to the City will grow at the same real rate they have grown during the FY 1981 to FY 2010 period (0.4 percent and 1.0 percent, respectively), and other City revenues will grow at the same ratio to tax revenues as they have historically. Price inflation in all dollar variables is assumed to be 2.5 percent annually.
8 The City is required by law to run a balanced budget, so total revenues and total expenditures are equal. In practice, the City usually records a $5 million surplus on its final budget accounts.
Federal categorical grants, State
categorical grants, and City fines,
fees for service, and other revenues
have all fallen as a share of the
City’s revenue base. Given the
long-term budgetary problems of
the federal and state governments,
and the anticipated political climate
for managing those budgetary
problems, we anticipate that those
trends will continue.

RETIREMENT SECURITY NYC
SUStaiNablE or Not? NYC PeNsioN Cost ProjeCtioNs through 2060
New York City ComptrollerJohn C. Liu
16 JUNE, 2011
Chart 6 shows the same declining trend as most other measures of City pension obligations. Pension contributions peak at 17.9 percent of tax revenues in FY 2010 and 11.44 percent of total revenues in FY 2016 and both decline every year after FY 2016. By FY 2060, City pension contributions are projected to be 4.51 percent and 3.31 percent of tax revenues and total revenues, respectively.
0%
2%
4%
6%
8%
10%
12%
14%
16%
18%
20%
1981 1991 2001 2011 2021 2031 2041 2051
%ofTaxes %ofRevenues
Chart 6
Pension Contributions as Percent of Taxes & Revenues (FY 1981 – FY 2060)

RETIREMENT SECURITY NYC
SUStaiNablE or Not? NYC PeNsioN Cost ProjeCtioNs through 2060
New York City ComptrollerJohn C. Liu
17JUNE, 2011
Conclusion
This report presents long-term projections of all employer and City contributions to the five pension funds constituting the New York City Retirement System. The projections were made by the Hay Group, based on the firm’s actuarial software, and on actuarial assumptions currently used by the City’s retirement systems. For analytical perspective, the Hay Group’s projections were combined with the New York City Comptroller’s projections of the city’s economy and tax and other revenues.
The analysis shows that the City’s pension contributions will, if no changes are made to existing pension benefits promised to employees, reach a peak dollar amount in FY 2016, will decline for several years, and then will grow slowly through FY 2060. From FY 2016 through 2060, pension contributions will grow at a slower rate than the city’s economy, the City’s tax revenues, and its total revenues. By FY 2060, pension contributions as a share of Gross City Product, as a share of tax revenues, and as a share of total revenues or expenditures will be at levels below those of the mid-1990s. The primary reason for the declining burden of pension contributions is the phasing-in of new employees who are only eligible, under current law, for pension benefits less costly to the City than those offered to earlier cohorts of municipal workers.
This report makes no judgment about whether the overall level of City pension obligations are too high, whether the decline relative to other variables will be fast enough to accommodate other fiscal objectives, or whether the balance between the current wages of City employees and their deferred wages, in the form of pensions, is appropriate. Also, it does not make a judgment as to what the appropriate rate of return assumption for calculating City contributions to the pension funds should be. Its purpose is to inform discussion of City pension policy with reasonable long-term projections of the cost of existing pension benefits under alternative rate of return assumptions.
The primary reason for the declining
burden of pension contributions is
the phasing-in of new employees
who are only eligible, under current
law, for pension benefits less costly
to the City than those offered to
earlier cohorts of municipal workers.

RETIREMENT SECURITY NYC
SUStaiNablE or Not? NYC PeNsioN Cost ProjeCtioNs through 2060
New York City ComptrollerJohn C. Liu
18 JUNE, 2011
appendix

RETIREMENT SECURITY NYC
SUStaiNablE or Not? NYC PeNsioN Cost ProjeCtioNs through 2060
New York City ComptrollerJohn C. Liu
19JUNE, 2011
I:/benefits/client/nyc/hay group 50 year projection methodology 052711.doc
Dear Ari:
Hay Group is providing certain retirement program consulting services to the Office of the Comptroller (OC) of the City of New York (CONY). A key deliverable of this engagement isto project future annual contributions to the New York City Retirement Systems (NYCRS) under four scenarios, and to provide computations of the Systems’ projected funding ratios in future years.
Data
The projections are based on census data for the NYCRS as of June 30, 2008, supplementedwith additional data provided to us by the OC. We believe that these data are appropriate for use in these projections.
Methods and Assumptions
The calculation of the statutory employer contribution is substantially similar for each of the NYCRS. Thus, in the discussion that follows, the description of Hay Group’s methodologyapplies to all the Systems. Unless otherwise specified, the methodologies and assumptions used to produce the projections are the same as those used by CONY’s Office of the Actuary (OA) to calculate the fiscal year 2010 employer contributions to the NYCRS. The current funding method (Frozen Initial Liability), actuarial asset valuation method (graded six-year smoothing), and actuarial assumptions (with the exceptions of the variations in discount rate, and the addition of future new hires in the census projection) were used for each Scenario listed below, throughout the projection period. These are respectively described in detail in Exhibits A, B, and C.
The projections were performed under the following scenarios:
Scenario 1: “Baseline case”: level workforce assumption, current discount rate of 8.0%. In this scenario, we used the City’s actual contributions for FY 2010, and followed the City’s FY 2012
Hay GroupHarborside Financial Center2310 Plaza FiveJersey City, NJ 07311-4012USA
tel +1.201.557.8400fax +1.201.557.8444
www.haygroup.com
May 27, 2011
Mr. Ari HoffnungAssistant Comptroller for BudgetChief Policy OfficerThe City of New YorkMunicipal BuildingOne Centre StreetNew York, NY 10007

RETIREMENT SECURITY NYC
SUStaiNablE or Not? NYC PeNsioN Cost ProjeCtioNs through 2060
New York City ComptrollerJohn C. Liu
20 JUNE, 2011
I:/benefits/client/nyc/hay group 50 year projection methodology 052711.doc May 27, 2011 2
Executive Budget Financial Plan for employer contributions from FY 2011 to FY 2015. Contributions calculated for FY 2016 and beyond are based solely on Hay Group projections.
Scenario 2: Increasing workforce assumption – by ¼% per year from FY 2014, and 8.0% discount rate. In this scenario, contributions match the baseline case projection for FYs 2010 through FY 2015.
Scenario 3: Increasing workforce assumption – by ¼% per year from FY 2014, and 7.5% discount rate. In this scenario, the FY 2010 and FY 2011 employer contributions match the baseline projection because the earliest any change to the actuarial interest rate can occur is in FY 2012.
Scenario 4: Increasing workforce assumption – by ¼% per year from FY 2014, and 7.0% discount rate. In this scenario, the FY 2010 and FY 2011 employer contributions match the baseline projection because the earliest any change to the actuarial interest rate can occur is in FY 2012.
The “baseline case” and subsequent scenarios produced sets of estimated projected future contributions for the fiscal years through 2060. The current plan provisions for each of the NYCRS which apply to new entrants were assumed for all future new entrants; these plan provisions are summarized in Exhibits D, E and F. Members in the census as of June 30, 2008 were assumed to continue in their current benefit tier.
Census projections
As the workforce is projected into the future (even under the level workforce assumption), members are assumed to leave the workforce by reason of termination (either vested or non-vested), disability (either accidental or ordinary), service retirement, or death (either accidental or ordinary). As noted in the list of scenarios above, Hay Group was requested to either project the censuses such that the active workforce was either to remain level (Scenario 1) or increase by ¼% each year beginning at June 30, 2014, so that the first impact of the increasing workforce would occur with respect to contributions calculated for FY 2016 (Scenarios 2, 3, and 4). This means that we needed to add new hires to replace (or more than replace, if the workforce is increasing) those members who exited the workforce. Thus, at each projection year, we created new members (based on the demographics in the assumptions listed below in Exhibit C), and projected each cohort of new entrants into future years, subject to the same probabilities of exiting the workforce as those members in the original census.
RETIREMENT SECURITY NYC
SUStaiNablE or Not? NYC PeNsioN Cost ProjeCtioNs through 2060
New York City ComptrollerJohn C. Liu
21JUNE, 2011
I:/benefits/client/nyc/hay group 50 year projection methodology 052711.doc May 27, 2011 3
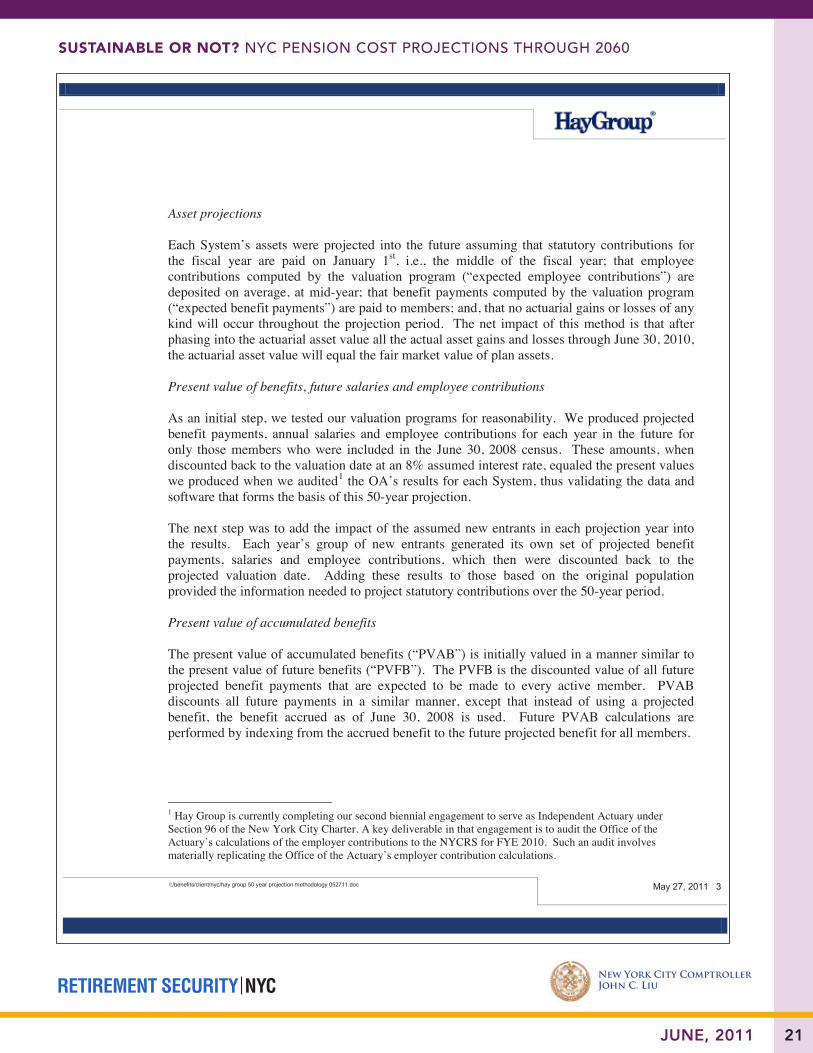
Asset projections
Each System’s assets were projected into the future assuming that statutory contributions for the fiscal year are paid on January 1st, i.e., the middle of the fiscal year; that employee contributions computed by the valuation program (“expected employee contributions”) are deposited on average, at mid-year; that benefit payments computed by the valuation program (“expected benefit payments”) are paid to members; and, that no actuarial gains or losses of any kind will occur throughout the projection period. The net impact of this method is that after phasing into the actuarial asset value all the actual asset gains and losses through June 30, 2010,the actuarial asset value will equal the fair market value of plan assets.
Present value of benefits, future salaries and employee contributions
As an initial step, we tested our valuation programs for reasonability. We produced projected benefit payments, annual salaries and employee contributions for each year in the future foronly those members who were included in the June 30, 2008 census. These amounts, when discounted back to the valuation date at an 8% assumed interest rate, equaled the present values we produced when we audited1 the OA’s results for each System, thus validating the data and software that forms the basis of this 50-year projection.
The next step was to add the impact of the assumed new entrants in each projection year into the results. Each year’s group of new entrants generated its own set of projected benefit payments, salaries and employee contributions, which then were discounted back to the projected valuation date. Adding these results to those based on the original population provided the information needed to project statutory contributions over the 50-year period.
Present value of accumulated benefits
The present value of accumulated benefits (“PVAB”) is initially valued in a manner similar to the present value of future benefits (“PVFB”). The PVFB is the discounted value of all future projected benefit payments that are expected to be made to every active member. PVAB discounts all future payments in a similar manner, except that instead of using a projected benefit, the benefit accrued as of June 30, 2008 is used. Future PVAB calculations are performed by indexing from the accrued benefit to the future projected benefit for all members.
1 Hay Group is currently completing our second biennial engagement to serve as Independent Actuary under Section 96 of the New York City Charter. A key deliverable in that engagement is to audit the Office of the Actuary’s calculations of the employer contributions to the NYCRS for FYE 2010. Such an audit involves materially replicating the Office of the Actuary’s employer contribution calculations.

RETIREMENT SECURITY NYC
SUStaiNablE or Not? NYC PeNsioN Cost ProjeCtioNs through 2060
New York City ComptrollerJohn C. Liu
22 JUNE, 2011
I:/benefits/client/nyc/hay group 50 year projection methodology 052711.doc May 27, 2011 4
Observations
Based on the projections of assets and liabilities under each scenario, for each System, we observed that the funded status (assets divided by liabilities) improves gradually over time.
PVFB
The present value of future benefits, as a measure of plan obligations, may not be entirely appropriate to determine funded status, because it includes the discounted value of benefits not yet earned. The PVFB is the highest measure of plan obligations, and thus would be the most difficult measure against which to achieve a high funded status. If a plan’s assets equal or exceed the PVFB under the methodology used to determine the employer contributions to the NYCRS, the contribution (exclusive of expense loads and any amortizations of unfunded actuarial accrued liabilities) would be zero.
PVAB
The present value of accumulated benefits provides a clearer picture of a System’s funded status based on benefits earned to date. The projected funded status for each System based on PVAB shows that each System is projected to attain a strong (90+%), but not excessive, funded status in the future.
Other measures of actuarial liabilities
Other measures of actuarial liabilities, such as Entry Age Normal or Projected Unit Credit accrued liabilities, would fall between the PVFB and PVAB. Thus, the projected future funded statuses under these methods would be greater than those using PVFB, and less than those using PVAB.
The detailed results of the projections are shown in Exhibits G thru J. Furthermore, as a reasonableness check of the results, we reconciled the year 50 normal cost rates to sample Entry Age Normal normal cost rates for new entrants calculated by the OA. This reconciliation is shown in Exhibit K.
In Conclusion
The results shown herein depict the funded status of the NYCRS under given plan provisions, methods and assumptions. In general, over the projection period, employer contributions as a percentage of covered salary is projected to decline and the funded status for each of the Systems is projected to improve.
RETIREMENT SECURITY NYC
SUStaiNablE or Not? NYC PeNsioN Cost ProjeCtioNs through 2060
New York City ComptrollerJohn C. Liu
23JUNE, 2011
I:/benefits/client/nyc/hay group 50 year projection methodology 052711.doc May 27, 2011 5
There are several reasons why the decline in employer contributions as a percent of salary takes place. A key reason for this pattern is the fact that projected new entrants being added into future valuations (as replacements for those members leaving active service) are all assumed to be subject to the most recent (and hence “less expensive”) tier of benefit plan provisions in each System. A second reason for this pattern relates to actuarial losses incurred prior to fiscal year 2011. The funding methodology in use for determining employer contributions to the NYCRS provides a mechanism for amortizing actuarial losses over time. There are historical actuarial losses that are currently affecting the normal contribution rate. However, as these losses are amortized during the projection period, they have less of a pronounced effect on the employer contribution rate.
If you have any questions, or would like to discuss any issue in this report, please contact us. We thank you for allowing us to partner with you on this project.
Sincerely,
Adam Meyers, FSA, EA, MAAA Craig R. Graby, EA, MAAAVice President Senior Consultant
Leslie H. Richmond, ASA, EA, MAAASenior Principal
cc: Amitabha BasuVadim Shulman, ASA, MAAA

RETIREMENT SECURITY NYC
SUStaiNablE or Not? NYC PeNsioN Cost ProjeCtioNs through 2060
New York City ComptrollerJohn C. Liu
24 JUNE, 2011
I:/benefits/client/nyc/hay group 50 year projection methodology 052711.doc May 27, 2011 6
List of Exhibits
Exhibit A: Funding Method......................................................................................................... 7
Exhibit B: Asset Valuation Method............................................................................................. 9
Exhibit C: Actuarial Assumptions ............................................................................................. 10
Exhibit D: New Entrant Plan Provision Summary - Civilian .................................................... 11
Exhibit E: New Entrant Plan Provision Summary - Teachers ................................................... 13
Exhibit F: New Entrant Plan Provision Summary - Uniformed ................................................ 16
Exhibit G: Projection Results - Scenario 1 ................................................................................ 19
Exhibit H: Projection Results - Scenario 2 ................................................................................ 26
Exhibit I: Projection Results - Scenario 3.................................................................................. 33
Exhibit J: Projection Results - Scenario 4.................................................................................. 40
Exhibit K: Reconciliation of Projection Results to EAN Rates................................................. 47

RETIREMENT SECURITY NYC
SUStaiNablE or Not? NYC PeNsioN Cost ProjeCtioNs through 2060
New York City ComptrollerJohn C. Liu
25JUNE, 2011
I:/benefits/client/nyc/hay group 50 year projection methodology 052711.doc May 27, 2011 7
Exhibit A: Funding Method
The OA, as required by applicable statutes, uses the Frozen Initial Liability (“FIL”) actuarial funding method for determining the annual employer contributions to the Systems. In the general application of the FIL method, employer contributions are the sum of the Normal Cost and amortizations of unfunded actuarial accrued liabilities (“UAAL”) determined under the Entry Age Normal (“EAN”) actuarial funding method. In determining employer contributions to the Systems, the OA adds administrative and investment expenses to the contributions.
The Normal Cost is determined by (i) subtracting the Actuarial Asset Value, the present value of future member contributions, and the unamortized portion of the UAAL from the total present value of benefits1, and (ii) dividing the difference by a factor that will approximate the average future working lifetime of the active employee population. For pension plans (such as NYCRS) in which benefits are determined by a formula applied to members’ salaries, it is common and appropriate to determine the factor by dividing the present value of future salaries for the current active employee population by that population’s current salaries. This is the procedure being used by the OA in applying the FIL method.
UAALs may be established upon certain events: plan inception, changing the funding method to FIL, and when plan amendments are enacted by New York State law2. The “frozen initial” UAAL is calculated as the difference between the EAN actuarial accrued liability and the Actuarial Asset Value as of the date of plan inception, the change in method to FIL, or the reestablishment of the UAAL. When a plan amendment occurs, the UAAL associated with it is the difference in EAN actuarial accrued liabilities before and after the plan amendment. Once the UAAL has been calculated, the length of time over which it is amortized must be established, as must the pattern of amortization. In public sector pension funding, there are no specific guidelines that pertain to the length of the amortization period, but most employers use a period of 30 years or less.3 The pattern of amortization can either be level dollar (much like a fixed-rate mortgage), or can increase annually at some pre-determined percentage.4
1 Though not part of the general application of FIL, the OA also subtracts the discounted value of the previous year’s contribution (due to the one-year lag methodology).2 In the general application of FIL, plan amendments give rise to a UAAL. However, in NYCRS case, the method of amortizing the effect of benefit changes is sometimes specified in the law establishing the benefit change. 3 Before the advent of the Pension Protection Act of 2006, private sector pension plans subject to ERISA funding requirements were required to use a 30-year amortization (level dollar) for changes in UAAL attributable to plan inception, plan changes, and funding method changes. GASB 27, paragraph 10(f)(1) and GASB 25, paragraph 36 (f) (1) state that the maximum amortization period is 40 years, during the first 10 years following the effective date of GASB 25 (which was for periods beginning after June 15, 1996), and then 30 years.4 The percentage increase is usually a rough approximation of estimated future salary increases.
RETIREMENT SECURITY NYC
SUStaiNablE or Not? NYC PeNsioN Cost ProjeCtioNs through 2060
New York City ComptrollerJohn C. Liu
26 JUNE, 2011
I:/benefits/client/nyc/hay group 50 year projection methodology 052711.doc May 27, 2011 8
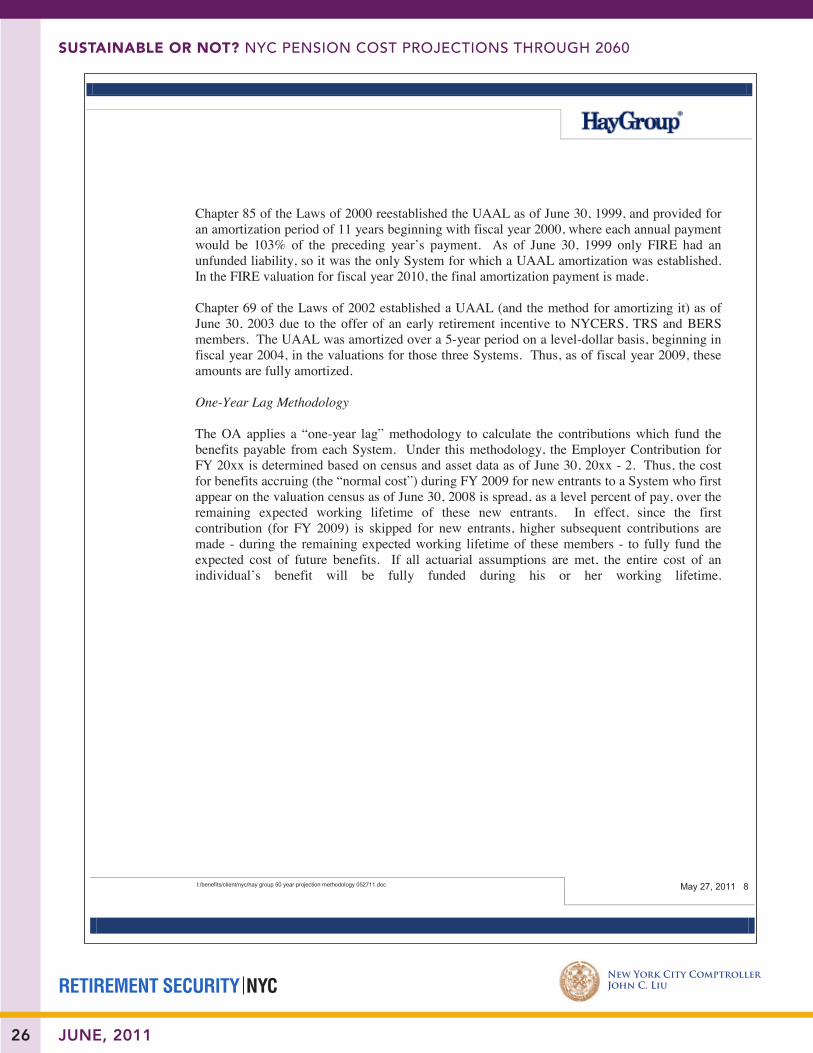
Chapter 85 of the Laws of 2000 reestablished the UAAL as of June 30, 1999, and provided for an amortization period of 11 years beginning with fiscal year 2000, where each annual payment would be 103% of the preceding year’s payment. As of June 30, 1999 only FIRE had an unfunded liability, so it was the only System for which a UAAL amortization was established. In the FIRE valuation for fiscal year 2010, the final amortization payment is made.
Chapter 69 of the Laws of 2002 established a UAAL (and the method for amortizing it) as of June 30, 2003 due to the offer of an early retirement incentive to NYCERS, TRS and BERS members. The UAAL was amortized over a 5-year period on a level-dollar basis, beginning in fiscal year 2004, in the valuations for those three Systems. Thus, as of fiscal year 2009, these amounts are fully amortized.
One-Year Lag Methodology
The OA applies a “one-year lag” methodology to calculate the contributions which fund the benefits payable from each System. Under this methodology, the Employer Contribution for FY 20xx is determined based on census and asset data as of June 30, 20xx - 2. Thus, the cost for benefits accruing (the “normal cost”) during FY 2009 for new entrants to a System who first appear on the valuation census as of June 30, 2008 is spread, as a level percent of pay, over the remaining expected working lifetime of these new entrants. In effect, since the first contribution (for FY 2009) is skipped for new entrants, higher subsequent contributions are made - during the remaining expected working lifetime of these members - to fully fund the expected cost of future benefits. If all actuarial assumptions are met, the entire cost of an individual’s benefit will be fully funded during his or her working lifetime.
RETIREMENT SECURITY NYC
SUStaiNablE or Not? NYC PeNsioN Cost ProjeCtioNs through 2060
New York City ComptrollerJohn C. Liu
27JUNE, 2011
I:/benefits/client/nyc/hay group 50 year projection methodology 052711.doc May 27, 2011 9
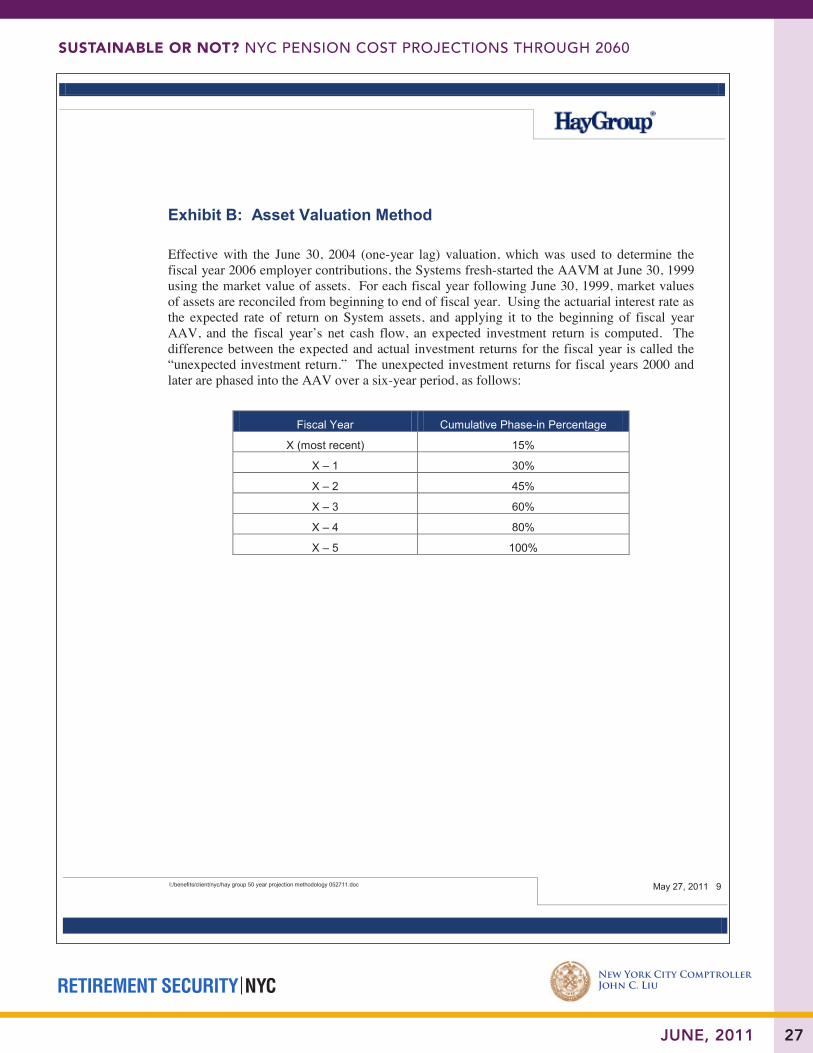
Exhibit B: Asset Valuation Method
Effective with the June 30, 2004 (one-year lag) valuation, which was used to determine the fiscal year 2006 employer contributions, the Systems fresh-started the AAVM at June 30, 1999 using the market value of assets. For each fiscal year following June 30, 1999, market values of assets are reconciled from beginning to end of fiscal year. Using the actuarial interest rate as the expected rate of return on System assets, and applying it to the beginning of fiscal year AAV, and the fiscal year’s net cash flow, an expected investment return is computed. The difference between the expected and actual investment returns for the fiscal year is called the “unexpected investment return.” The unexpected investment returns for fiscal years 2000 and later are phased into the AAV over a six-year period, as follows:
Fiscal Year Cumulative Phase-in Percentage
X (most recent) 15%
X – 1 30%
X – 2 45%
X – 3 60%
X – 4 80%
X – 5 100%

RETIREMENT SECURITY NYC
SUStaiNablE or Not? NYC PeNsioN Cost ProjeCtioNs through 2060
New York City ComptrollerJohn C. Liu
28 JUNE, 2011
I:/benefits/client/nyc/hay group 50 year projection methodology 052711.doc May 27, 2011 10
Exhibit C: Actuarial Assumptions
In Scenarios 1 and 2, in each valuation in the projection, the same economic and demographic assumptions used by the OA to perform the FY 2010 valuation were used. In Scenarios 3 and 4, the only assumption that varied from the actuarial assumptions used by the OA was the discount rate, which was varied to 7.5% and 7.0%, respectively.
In projecting the census to future years, we assumed that new employees would enter the workforce for each System. The number of new entrants entering a System for a given year was based on how many active employees exited from active employment based on the demographic assumptions used by the OA in the FY 2010 valuation. We assumed that thesefuture new employees would be:
• Based on actual new entrant demographics for the fiscal year ending June 30, 2008.Summary average demographics are as follows:
NYCERS TRS BERS POLICE FIREAverage Age 37.6 33.1 42.2 26.3 28.2
% Male 57% 23% 28% 83% 99%Average Salary $44,544 $47,888 $34,193 $42,318 $42,392
• Valued based on the “most recent” tier of benefits (i.e., the tier of benefits current new hires in each System would enter) for their respective System
We did not assume any changes to the plan provisions in the future.
Each System’s assets were projected based on an investment rate of return equal to the discount rate being used in that scenario.
We assumed that each System’s administrative expenses increased by 3% per year. We further assumed that investment expenses would remain level as a percentage of the beginning of year market value of assets.
The “net City contributions” were calculated based on percentages, provided by the OC, applied to each year’s total contribution including administrative and investment expenses.

RETIREMENT SECURITY NYC
SUStaiNablE or Not? NYC PeNsioN Cost ProjeCtioNs through 2060
New York City ComptrollerJohn C. Liu
29JUNE, 2011
I:/benefits/client/nyc/hay group 50 year projection methodology 052711.doc May 27, 2011 11
Exhibit D: New Entrant Plan Provision Summary - Civilian
Defined Benefit Pension Plan
Normal Retirement Eligibility
• Age 57 and 5 years of service
Service Retirement Benefits
If < 20 years service: 1-2/3% x FAS-3 x service.If ≥ 20 years service: 2% x FAS-3 x service up to 30 years, plus 1.5% x FAS-3 x service > 30 years.
Early Retirement Age 55 and 5 years of service
Early retirement reduction
6% per year for ages 60-62, and 3% per year for ages 55-60.
Member Contributions 4.85% of compensation for first 10 years, 1.85% of compensation for 10-29 years, 0% of compensation at 30 and future years
Ordinary Disability Eligibility
10 years credited service.
Ordinary Disability Benefit
Greater of 1/3 x FAS or 1-2/3% x FAS-3 x credited service or Service Retirement Benefits, if eligible for it.
Accidental Disability Eligibility
Job-related accident - immediateEMT Presumptive for HIV,TB, etal5.
Accidental Disability Benefits
Same as ordinary disability above.
Ordinary Death Eligibility Members who elected Death Benefit 1 receive greater of Death Benefit 1 or Death Benefit 2.
Vested with 10 years of service for death benefit after termination before retirement benefit commences
RETIREMENT SECURITY NYC
SUStaiNablE or Not? NYC PeNsioN Cost ProjeCtioNs through 2060
New York City ComptrollerJohn C. Liu
30 JUNE, 2011
I:/benefits/client/nyc/hay group 50 year projection methodology 052711.doc May 27, 2011 12
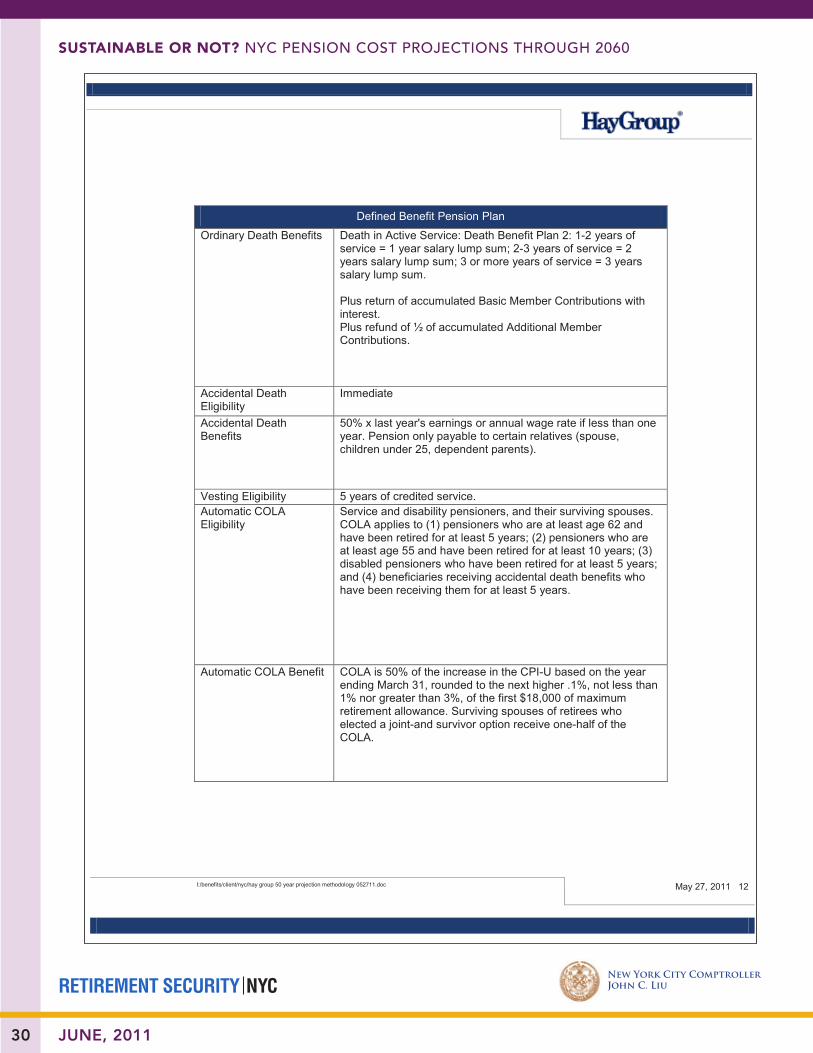
Defined Benefit Pension Plan
Ordinary Death Benefits Death in Active Service: Death Benefit Plan 2: 1-2 years of service = 1 year salary lump sum; 2-3 years of service = 2 years salary lump sum; 3 or more years of service = 3 years salary lump sum.
Plus return of accumulated Basic Member Contributions with interest.Plus refund of ½ of accumulated Additional Member Contributions.
Accidental Death Eligibility
Immediate
Accidental Death Benefits
50% x last year's earnings or annual wage rate if less than one year. Pension only payable to certain relatives (spouse, children under 25, dependent parents).
Vesting Eligibility 5 years of credited service.Automatic COLA Eligibility
Service and disability pensioners, and their surviving spouses. COLA applies to (1) pensioners who are at least age 62 and have been retired for at least 5 years; (2) pensioners who are at least age 55 and have been retired for at least 10 years; (3) disabled pensioners who have been retired for at least 5 years; and (4) beneficiaries receiving accidental death benefits who have been receiving them for at least 5 years.
Automatic COLA Benefit COLA is 50% of the increase in the CPI-U based on the year ending March 31, rounded to the next higher .1%, not less than 1% nor greater than 3%, of the first $18,000 of maximum retirement allowance. Surviving spouses of retirees who elected a joint-and survivor option receive one-half of the COLA.

RETIREMENT SECURITY NYC
SUStaiNablE or Not? NYC PeNsioN Cost ProjeCtioNs through 2060
New York City ComptrollerJohn C. Liu
31JUNE, 2011
I:/benefits/client/nyc/hay group 50 year projection methodology 052711.doc May 27, 2011 13
Exhibit E: New Entrant Plan Provision Summary - Teachers
Defined Benefit Pension PlanNormal Retirement Eligibility
• Age 55 and 27 years of service • or Age 62 and 10 years of service
Service Retirement Benefits
If < 20 years service: 1-2/3% x FAS-3 x service.If ≥ 20 years credited service: 2% x FAS-3 x service up to 30 years, plus 1.5% x FAS-3 x service > 30 years.
Early Retirement Age 55 and 10 years of service
Early retirement reduction 6% per year for ages 60-62, and 3% per year for ages 55-60.
Member Contributions 4.85% of compensation for first 27 years, 1.85% of compensation after 27 years
Ordinary Disability Eligibility
10 years credited service.
Ordinary Disability Benefit Greater of 1/3 x FAS-3 or1-2/3% x FAS-3 x credited service. If eligible for service retirement, choice of either disability benefit or service retirement benefit.
Accidental Disability Eligibility
Job-related accident - immediate
Accidental Disability Benefits
2/3 x FAS-3.
Ordinary Death Eligibility Members who elected Death Benefit 1 receive greater of Death Benefit 1 or Death Benefit 2.
Vested with 10 years of service for death benefit after termination before retirement benefit commences.
RETIREMENT SECURITY NYC
SUStaiNablE or Not? NYC PeNsioN Cost ProjeCtioNs through 2060
New York City ComptrollerJohn C. Liu
32 JUNE, 2011
I:/benefits/client/nyc/hay group 50 year projection methodology 052711.doc May 27, 2011 14
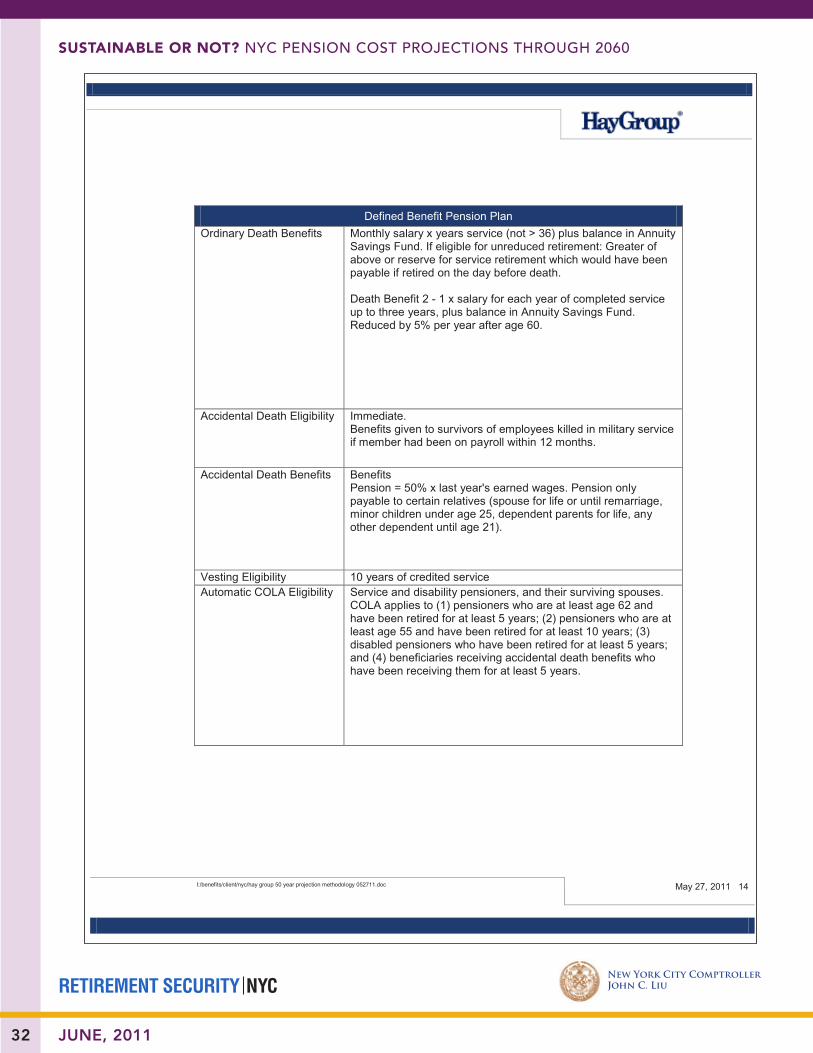
Defined Benefit Pension PlanOrdinary Death Benefits Monthly salary x years service (not > 36) plus balance in Annuity
Savings Fund. If eligible for unreduced retirement: Greater of above or reserve for service retirement which would have been payable if retired on the day before death.
Death Benefit 2 - 1 x salary for each year of completed service up to three years, plus balance in Annuity Savings Fund. Reduced by 5% per year after age 60.
Accidental Death Eligibility Immediate.Benefits given to survivors of employees killed in military service if member had been on payroll within 12 months.
Accidental Death Benefits BenefitsPension = 50% x last year's earned wages. Pension only payable to certain relatives (spouse for life or until remarriage, minor children under age 25, dependent parents for life, any other dependent until age 21).
Vesting Eligibility 10 years of credited serviceAutomatic COLA Eligibility Service and disability pensioners, and their surviving spouses.
COLA applies to (1) pensioners who are at least age 62 and have been retired for at least 5 years; (2) pensioners who are at least age 55 and have been retired for at least 10 years; (3) disabled pensioners who have been retired for at least 5 years; and (4) beneficiaries receiving accidental death benefits who have been receiving them for at least 5 years.

RETIREMENT SECURITY NYC
SUStaiNablE or Not? NYC PeNsioN Cost ProjeCtioNs through 2060
New York City ComptrollerJohn C. Liu
33JUNE, 2011
I:/benefits/client/nyc/hay group 50 year projection methodology 052711.doc May 27, 2011 15
Defined Benefit Pension PlanAutomatic COLA Benefit COLA is 50% of the increase in the CPI-U based on the year
ending March 31, rounded to the next higher .1%, not less than 1% nor greater than 3%, of the first $18,000 of maximum retirement allowance. Surviving spouses of retirees who elected a joint-and survivor option receive one-half of the COLA.
RETIREMENT SECURITY NYC
SUStaiNablE or Not? NYC PeNsioN Cost ProjeCtioNs through 2060
New York City ComptrollerJohn C. Liu
34 JUNE, 2011
I:/benefits/client/nyc/hay group 50 year projection methodology 052711.doc May 27, 2011 16
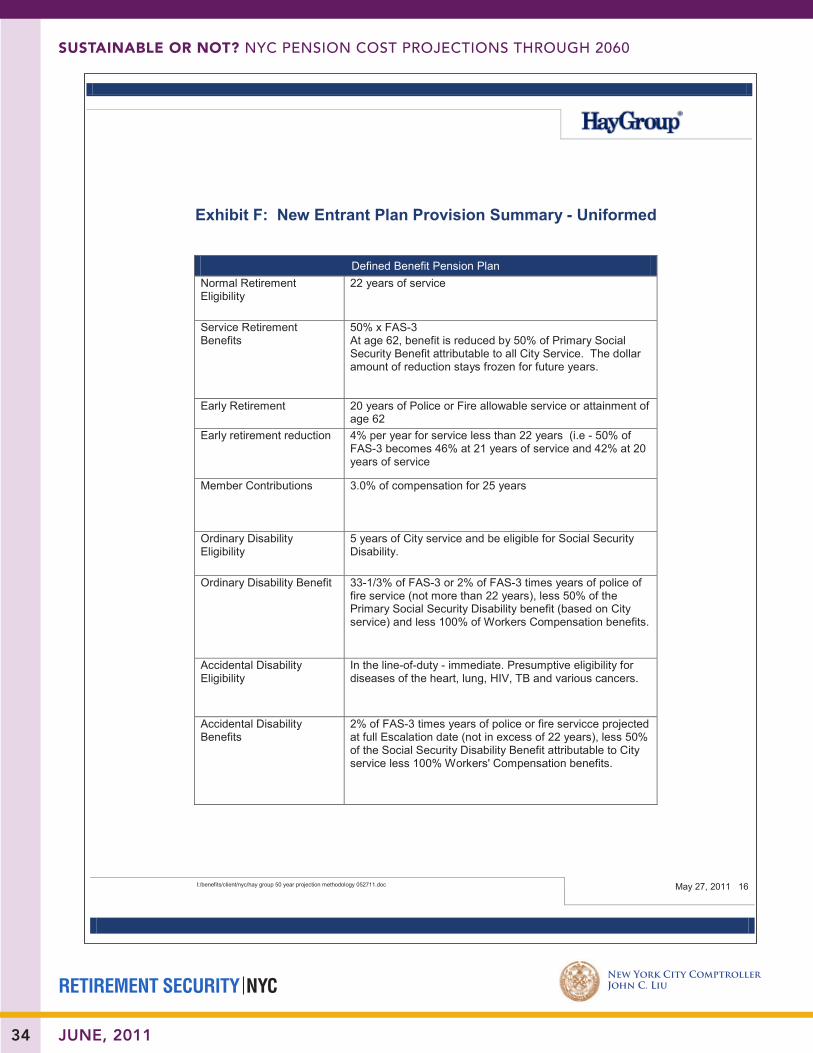
Exhibit F: New Entrant Plan Provision Summary - Uniformed
Defined Benefit Pension PlanNormal Retirement Eligibility
22 years of service
Service Retirement Benefits
50% x FAS-3At age 62, benefit is reduced by 50% of Primary Social Security Benefit attributable to all City Service. The dollar amount of reduction stays frozen for future years.
Early Retirement 20 years of Police or Fire allowable service or attainment of age 62
Early retirement reduction 4% per year for service less than 22 years (i.e - 50% of FAS-3 becomes 46% at 21 years of service and 42% at 20 years of service
Member Contributions 3.0% of compensation for 25 years
Ordinary Disability Eligibility
5 years of City service and be eligible for Social Security Disability.
Ordinary Disability Benefit 33-1/3% of FAS-3 or 2% of FAS-3 times years of police of fire service (not more than 22 years), less 50% of the Primary Social Security Disability benefit (based on City service) and less 100% of Workers Compensation benefits.
Accidental Disability Eligibility
In the line-of-duty - immediate. Presumptive eligibility for diseases of the heart, lung, HIV, TB and various cancers.
Accidental Disability Benefits
2% of FAS-3 times years of police or fire servicce projected at full Escalation date (not in excess of 22 years), less 50% of the Social Security Disability Benefit attributable to City service less 100% Workers' Compensation benefits.

RETIREMENT SECURITY NYC
SUStaiNablE or Not? NYC PeNsioN Cost ProjeCtioNs through 2060
New York City ComptrollerJohn C. Liu
35JUNE, 2011
I:/benefits/client/nyc/hay group 50 year projection methodology 052711.doc May 27, 2011 17
Defined Benefit Pension PlanOrdinary Death Eligibility 90 days service for death in active service (gets return of
accumulated contributions, if dies earlier).
Vested with 10 years of service for death benefit after termination before retirement benefit commences.
Ordinary Death Benefits Death in active service equal to 3 x final year salary, raised to next highest multiple of $1,000, plus return of member accumulated contributions.
If death occurs after age 61, death benefit reduced to 90% of such and 10% reduction/yr thereafter (minimum deathbenefit is 10% of above amount).
Accidental Death Eligibility (1) In the line-of-duty - immediate(2) Dies on active military duty for other than training purposes.
Accidental Death Benefits NY State benefit – Pension to surviving widow(life) or children(until 18 or 23 if students) = 100% x final yr's salary offset by NYC accidental death benefit, Social Security and Workers’ Compensation death benefits. Subject to annual 3% COLA (applied to 100% of final salary before offset). May not be payable if NYC benefit paid is the Death Gamble for Ordinary death.
POLICE (City benefit): Pension equal to 50% x FAS3. Pension only payable to certain relatives (spouse, minor children, dependent parents).
Vesting Eligibility 5 years of qualifying serviceAutomatic COLA Eligibility Service and disability pensioners, and their surviving
spouses. COLA applies to (1) pensioners who are at least age 62 and have been retired for at least 5 years; (2) pensioners who are at least age 55 and have been retired for at least 10 years; (3) disabled pensioners who have been retired for at least 5 years; and (4) beneficiaries receiving accidental death benefits who have been receiving them for at least 5 years.
RETIREMENT SECURITY NYC
SUStaiNablE or Not? NYC PeNsioN Cost ProjeCtioNs through 2060
New York City ComptrollerJohn C. Liu
36 JUNE, 2011
I:/benefits/client/nyc/hay group 50 year projection methodology 052711.doc May 27, 2011 18
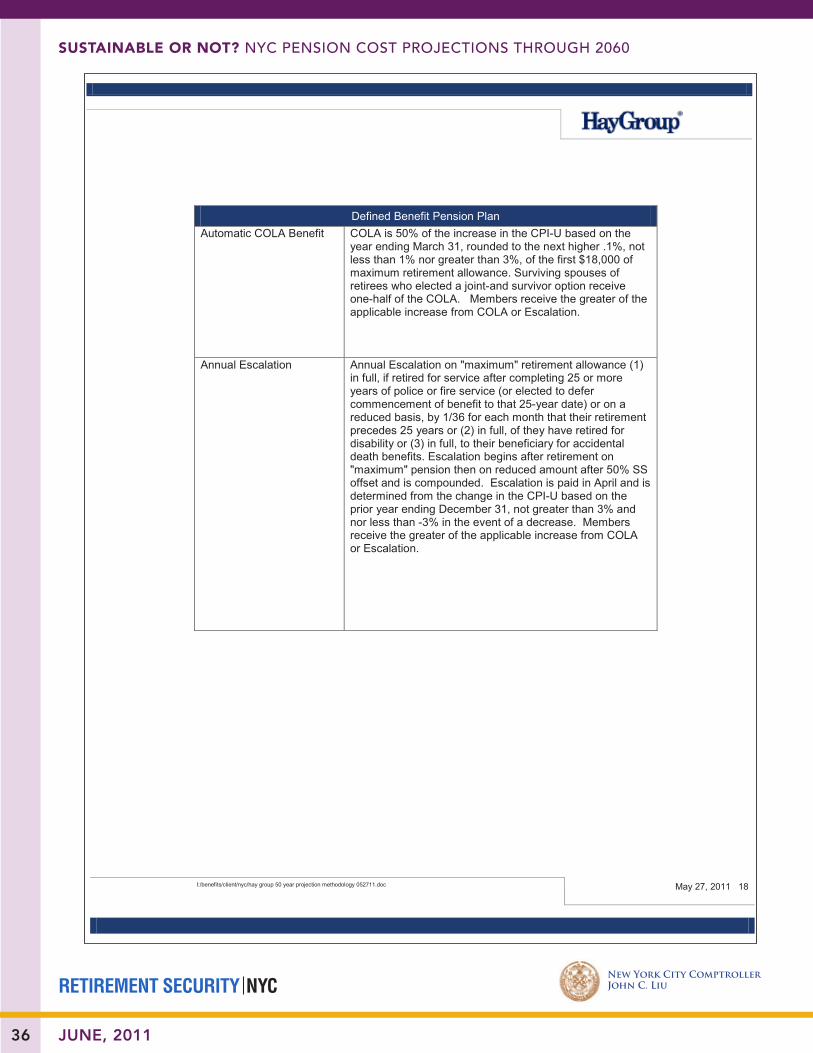
Defined Benefit Pension PlanAutomatic COLA Benefit COLA is 50% of the increase in the CPI-U based on the
year ending March 31, rounded to the next higher .1%, not less than 1% nor greater than 3%, of the first $18,000 of maximum retirement allowance. Surviving spouses of retirees who elected a joint-and survivor option receive one-half of the COLA. Members receive the greater of the applicable increase from COLA or Escalation.
Annual Escalation Annual Escalation on "maximum" retirement allowance (1) in full, if retired for service after completing 25 or more years of police or fire service (or elected to defer commencement of benefit to that 25-year date) or on a reduced basis, by 1/36 for each month that their retirement precedes 25 years or (2) in full, of they have retired for disability or (3) in full, to their beneficiary for accidental death benefits. Escalation begins after retirement on "maximum" pension then on reduced amount after 50% SS offset and is compounded. Escalation is paid in April and is determined from the change in the CPI-U based on the prior year ending December 31, not greater than 3% and nor less than -3% in the event of a decrease. Members receive the greater of the applicable increase from COLA or Escalation.

RETIREMENT SECURITY NYC
SUStaiNablE or Not? NYC PeNsioN Cost ProjeCtioNs through 2060
New York City ComptrollerJohn C. Liu
37JUNE, 2011
I:/benefits/client/nyc/hay group 50 year projection methodology 052711.doc May 27, 2011 19
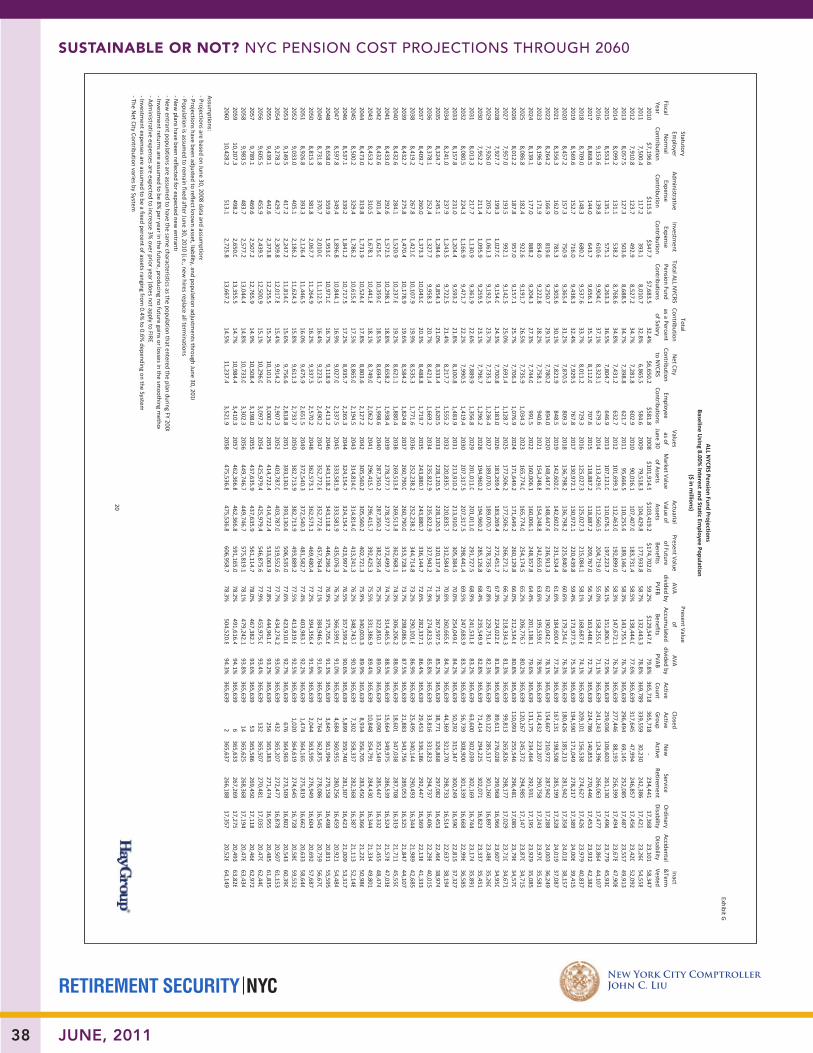
Exhibit G: Projection Results - Scenario 1
“Baseline case”: level workforce assumption, current discount rate of 8.0%
RETIREMENT SECURITY NYC
SUStaiNablE or Not? NYC PeNsioN Cost ProjeCtioNs through 2060
New York City ComptrollerJohn C. Liu
38 JUNE, 2011
Exhibit G
Fiscal Year
Statutory Em
ployer Norm
al Contribution
Administrative
Expense Contribution
Investment
Expense Contribution
Total ALL NYCRS
Pension Fund Contributions
Total Contribution as a Percent of Salary
Net City
Contribution to N
YCRSEm
ployee Contributions
Values as of
June 30Market Value of Assets
Actuarial Value of Assets
Present Value of Future Benefits
AVA divided by
PVFB
Present Value of
Accumulated
Benefits
AVA divided by PVAB
Active Count
Closed Active Group
New
Active
Service Retirem
entOrdinary
DisabilityAccidental Disability
Inact &Term
Vested
2010$7,196.6
$115.5$347.7
$7,683.532.4%
$6,650.2$581.8
2008$101,914.9
$103,419.2$174,702.0
59.2%$129,547.6
79.8%365,718
365,718‐
234,441
17,368
23,101
58,347
20117,500.4
117.2393.1
8,010.732.8%
6,865.5584.6
200979,518.3
104,429.8177,933.8
58.7%132,443.3
78.8%369,789
339,55930,230
242,386
17,421
23,260
54,558
20127,910.8
123.7492.9
8,527.234.7%
7,281.8602.9
201090,016.1
107,407.0183,731.4
58.5%138,444.0
77.6%365,639
317,64547,994
246,857
17,456
23,420
52,092
20138,057.5
127.3503.6
8,688.534.7%
7,398.8621.7
201195,666.5
110,255.6189,146.7
58.3%143,755.1
76.7%365,639
296,49469,145
252,085
17,487
23,557
49,913
20148,099.2
131.1538.2
8,768.634.8%
7,431.2632.7
2012101,699.3
112,463.0192,899.0
58.3%147,672.1
76.2%365,639
277,44688,193
256,399
17,494
23,678
47,908
20158,553.1
135.1575.1
9,263.336.5%
7,804.7646.9
2013107,121.0
110,676.1197,223.7
56.1%151,806.7
72.9%365,639
259,036106,603
261,130
17,496
23,779
45,9302016
9,153.6139.8
610.69,904.0
37.1%8,323.1
679.32014
113,429.0112,560.5
204,719.055.0%
158,255.071.1%
365,639241,243
124,396266,063
17,477
23,864
44,107
20178,868.5
144.0643.7
9,656.135.1%
8,112.0707.6
2015118,887.2
118,887.2209,767.0
56.7%163,448.6
72.7%365,639
224,786140,853
270,446
17,453
23,932
42,3822018
8,709.0148.3
680.29,537.6
33.7%8,011.2
729.32016
125,027.3125,027.3
215,084.158.1%
168,687.674.1%
365,639209,101
156,538274,627
17,426
23,979
40,837
20198,569.6
152.7716.0
9,438.332.4%
7,929.5767.8
2017130,972.1
130,972.1220,439.8
59.4%173,977.5
75.3%365,639
194,590171,049
278,217
17,389
24,006
39,4152020
8,457.2157.3
750.99,365.4
31.2%7,870.5
809.32018
136,798.2136,798.2
225,840.860.6%
179,254.076.3%
365,639180,426
185,213281,942
17,358
24,018
38,157
20218,356.3
162.0785.3
9,303.630.1%
7,821.9848.5
2019142,602.0
142,602.0231,324.4
61.6%184,600.4
77.2%365,639
167,131198,508
285,199
17,328
24,019
37,0872022
8,264.2166.9
819.69,250.7
29.1%7,780.2
894.02020
148,447.6148,447.6
236,913.362.7%
190,042.078.1%
365,639154,667
210,972287,942
17,288
24,003
36,249
20238,196.9
171.9854.0
9,222.828.2%
7,758.1940.6
2021154,248.8
154,248.8242,655.0
63.6%195,559.0
78.9%365,639
142,432223,207
290,758
17,243
23,970
35,5812024
8,139.1177.0
888.29,204.3
27.3%7,744.0
991.52022
160,006.1160,006.1
248,357.864.4%
201,138.179.6%
365,639131,175
234,464292,931
17,195
23,929
35,085
20258,086.8
182.4922.6
9,191.726.5%
7,735.91,034.3
2023165,774.0
165,774.0254,174.5
65.2%206,776.7
80.2%365,639
120,267245,372
294,985
17,147
23,870
34,7152026
8,012.2187.8
957.09,157.1
25.7%7,706.3
1,076.92024
171,649.2171,649.2
260,129.866.0%
212,534.680.8%
365,639110,093
255,546296,481
17,085
23,796
34,570
20277,957.0
193.5992.1
9,142.525.0%
7,691.41,128.7
2025177,506.2
177,506.2266,271.2
66.7%218,334.3
81.3%365,639
99,813
265,826298,177
17,029
23,710
34,671
20287,927.7
199.31,027.0
9,154.024.3%
7,700.81,183.0
2026183,269.4
183,269.4272,451.7
67.3%224,022.6
81.8%365,639
89,611
276,028299,968
16,966
23,607
34,950
20297,926.0
205.21,061.3
9,192.523.7%
7,735.31,236.4
2027189,070.7
189,070.7278,735.9
67.8%229,751.4
82.3%365,639
80,122
285,517301,260
16,897
23,486
35,260
20307,952.2
211.41,095.9
9,259.523.1%
7,796.71,296.2
2028194,960.2
194,960.2285,126.8
68.4%235,549.9
82.8%365,639
71,414
294,225302,071
16,823
23,337
35,451
20318,013.3
217.71,130.9
9,361.922.6%
7,889.91,356.8
2029201,011.0
201,011.0291,727.5
68.9%241,531.8
83.2%365,639
63,600
302,039302,169
16,744
23,174
35,891
20328,080.5
224.31,166.9
9,471.722.2%
7,990.51,419.4
2030207,317.5
207,317.5298,441.4
69.5%247,683.9
83.7%365,639
56,739
308,900301,339
16,668
22,996
36,585
20338,157.8
231.01,204.4
9,593.221.8%
8,100.81,483.9
2031213,910.2
213,910.2305,384.5
70.0%254,049.0
84.2%365,639
50,292
315,347300,249
16,590
22,815
37,327
20348,241.0
237.91,243.5
9,722.521.4%
8,217.71,555.2
2032220,835.7
220,835.7312,584.0
70.6%260,665.6
84.7%365,639
44,369
321,270298,733
16,514
22,637
38,194
20358,324.7
245.11,284.6
9,854.321.0%
8,333.41,620.5
2033228,120.5
228,120.5320,137.4
71.3%267,597.5
85.2%365,639
38,771
326,868297,082
16,453
22,466
38,974
20368,378.1
252.41,327.7
9,958.320.7%
8,421.41,669.2
2034235,822.9
235,822.9327,943.2
71.9%274,823.5
85.8%365,639
33,816
331,823294,737
16,406
22,298
40,015
20378,409.7
260.01,373.3
10,043.020.3%
8,488.81,719.7
2035243,880.7
243,880.7336,144.7
72.6%282,337.1
86.4%365,639
29,453
336,186292,447
16,369
22,138
41,333
20388,419.2
267.81,421.0
10,107.919.9%
8,535.31,771.6
2036252,238.2
252,238.2344,714.8
73.2%290,101.6
86.9%365,639
25,495
340,144290,493
16,344
21,989
42,685
20398,432.7
275.81,470.4
10,178.919.6%
8,584.21,824.8
2037260,790.0
260,790.0353,728.1
73.7%298,086.5
87.5%365,639
21,883
343,756289,053
16,325
21,847
44,107
20408,432.6
284.11,520.9
10,237.619.2%
8,621.11,880.4
2038269,513.8
269,513.8362,968.1
74.3%306,206.2
88.0%365,639
18,601
347,038287,708
16,319
21,711
45,550
20418,433.0
292.61,572.5
10,298.118.8%
8,658.21,938.4
2039278,377.7
278,377.7372,499.7
74.7%314,465.5
88.5%365,639
15,664
349,975286,539
16,324
21,578
47,038
20428,432.6
301.41,625.0
10,359.018.5%
8,694.71,998.6
2040287,350.2
287,350.2382,295.4
75.2%322,850.7
89.0%365,639
13,090
352,549285,447
16,332
21,455
48,474
20438,453.2
310.51,678.1
10,441.818.1%
8,749.02,062.2
2041296,415.7
296,415.7392,425.3
75.5%331,386.9
89.4%365,639
10,848
354,791284,430
16,344
21,334
49,801
20448,473.0
319.81,731.9
10,524.617.8%
8,803.62,127.2
2042305,560.2
305,560.2402,721.3
75.9%340,003.3
89.9%365,639
8,934
356,705283,450
16,366
21,220
50,986
20458,500.2
329.41,786.2
10,615.817.5%
8,865.02,194.5
2043314,814.0
314,814.0413,241.3
76.2%348,743.7
90.3%365,639
7,302
358,337282,368
16,387
21,113
52,148
20468,537.1
339.21,841.2
10,717.517.2%
8,935.72,265.3
2044324,154.7
324,154.7423,997.4
76.5%357,599.2
90.6%365,639
5,899
359,740281,307
16,423
21,009
53,317
20478,597.8
349.41,896.8
10,844.116.9%
9,027.02,337.5
2045333,581.9
333,581.9435,076.3
76.7%366,599.0
91.0%365,639
4,684
360,955280,256
16,459
20,921
54,484
20488,658.0
359.91,953.0
10,971.016.7%
9,118.92,413.2
2046343,118.2
343,118.2446,296.2
76.9%375,705.6
91.3%365,639
3,645
361,994279,158
16,498
20,831
55,595
20498,731.8
370.72,010.0
11,112.516.4%
9,223.52,490.2
2047352,772.6
352,772.6457,764.4
77.1%384,946.5
91.6%365,639
2,764
362,875278,086
16,545
20,759
56,670
20508,815.3
381.82,067.7
11,264.916.2%
9,337.52,570.2
2048362,573.1
362,573.1469,480.4
77.2%394,356.4
91.9%365,639
2,044
363,595276,949
16,604
20,692
57,687
20518,926.8
393.32,126.4
11,446.516.0%
9,475.92,651.5
2049372,540.3
372,540.3481,582.7
77.4%403,983.7
92.2%365,639
1,474
364,165275,819
16,662
20,633
58,644
20529,033.0
405.12,186.2
11,624.315.8%
9,611.32,733.7
2050382,713.9
382,713.9493,889.2
77.5%413,819.6
92.5%365,639
1,020
364,619274,645
16,728
20,580
59,552
20539,149.5
417.22,247.2
11,814.015.6%
9,756.62,818.8
2051393,130.6
393,130.6506,535.0
77.6%423,910.6
92.7%365,639
676
364,963273,509
16,802
20,543
60,390
20549,278.3
429.72,309.8
12,017.815.4%
9,914.22,907.3
2052403,787.0
403,787.0519,552.6
77.7%434,274.2
93.0%365,639
432
365,207272,477
16,878
20,507
61,153
20559,439.1
442.62,373.8
12,255.515.2%
10,101.03,000.2
2053414,722.4
414,722.4533,063.9
77.8%444,961.0
93.2%365,639
256
365,383271,474
16,955
20,485
61,835
20569,605.5
455.92,439.5
12,500.915.1%
10,296.03,097.3
2054425,979.4
425,979.4546,875.6
77.9%455,975.0
93.4%365,639
132
365,507270,481
17,035
20,470
62,440
20579,789.1
469.62,507.2
12,765.914.9%
10,508.43,198.0
2055437,635.9
437,635.9561,114.7
78.0%467,382.7
93.6%365,639
53
365,586269,450
17,118
20,466
62,972
20589,983.5
483.72,577.2
13,044.414.8%
10,733.03,302.3
2056449,746.7
449,746.7575,819.1
78.1%479,242.1
93.8%365,639
14
365,625268,368
17,194
20,476
63,434
205910,207.3
498.22,650.0
13,355.514.7%
10,984.43,410.3
2057462,366.8
462,366.8591,165.0
78.2%491,616.4
94.1%365,639
6
365,633267,269
17,275
20,493
63,826
206010,428.2
513.12,725.8
13,667.214.5%
11,237.43,521.9
2058475,536.8
475,536.8606,958.7
78.3%504,520.8
94.3%365,639
2
365,637266,188
17,357
20,526
64,149
Assumptions:
‐ Projections are based on June 30, 2008 data and assumptions
‐ Projections have been adjusted to reflect known asset, liability, and population adjustm
ents through June 30, 2010‐ Population is assum
ed to remain fixed after June 30, 2010 (i.e., new
hires replace all terminations
‐ New
plans have been reflected for expected new entrants
‐ New
entrant populations are assumed to have the sam
e characteristics as the population that entered the plan during FY 2008‐ Investm
ent returns are assumed to be 8%
per year in the future, producing no future gains or losses in the smoothing m
ethod‐ Adm
inistrative expenses are expected to increase 3% over prior year (does not apply to FIRE)
‐ Investment expenses are assum
ed to be a fixed percent of assets ranging from 0.4%
to 0.6% depending on the System
‐ The Net City Contribution varies by System
ALL NYCRS Pension Fund Projections
Baseline Using 8.00%
Interest and Static Employee Population
($ in millions)
20

RETIREMENT SECURITY NYC
SUStaiNablE or Not? NYC PeNsioN Cost ProjeCtioNs through 2060
New York City ComptrollerJohn C. Liu
39JUNE, 2011
Exhibit G
Fiscal Year
Statutory Em
ployer Norm
al Contribution
Administrative
Expense Contribution
Investment
Expense Contribution
Total NYCERS
Pension Fund Contribution
Total Contribution as a Percent of Salary
Net City
Contribution to N
YCERSEm
ployee contributions
Values as of
June 30Market value of assets
Actuarial value of assets
Present Value of Future Benefits
AVA divided by
PVFB
Present Value of
Accumulated
Benefits
AVA divided by PVAB
Active Count
Closed Active Group
New
Active
Service Retirem
entOrdinary
DisabilityAccidental Disability
Inact &Term
Vested
2010$2,012.0
$51.2$134.5
$2,197.720.6%
$1,205.6$310.8
2008$39,716.8
$40,771.6$60,264.2
67.7%$42,940.1
94.9%183,607
183,6070
117,6739,076
3,69933,029
20112,172.8
53.2161.1
2,387.221.1%
1,293.0318.3
200931,903.4
41,710.262,607.0
66.6%45,223.6
92.2%186,288
169,00117,287
121,6949,191
3,66530,917
20122,327.9
55.1204.4
2,587.422.6%
1,403.3330.9
201035,407.9
42,556.464,689.5
65.8%47,462.8
89.7%184,982
156,68228,300
124,2309,295
3,64229,158
20132,416.8
56.8206.4
2,679.922.8%
1,452.9345.6
201137,737.4
43,664.767,020.0
65.2%49,793.9
87.7%184,982
145,03539,947
126,9729,388
3,60827,557
20142,493.5
58.5220.1
2,772.023.2%
1,499.5359.4
201240,224.5
44,591.768,885.5
64.7%51,787.0
86.1%184,982
134,79050,192
128,9989,466
3,57726,022
20152,721.0
60.2234.6
3,015.824.8%
1,626.6372.4
201342,104.0
43,654.071,101.5
61.4%54,028.0
80.8%184,982
125,08459,898
131,0929,529
3,53824,496
20163,076.3
62.0248.9
3,387.227.0%
1,858.2383.9
201444,338.0
44,100.273,321.4
60.1%56,260.4
78.4%184,982
115,73069,252
133,2619,575
3,50423,129
20172,980.6
63.9262.9
3,307.425.6%
1,814.4402.8
201546,823.2
46,823.275,595.7
61.9%58,542.5
80.0%184,982
107,07577,907
135,2329,609
3,46821,852
20182,920.5
65.8281.2
3,267.424.6%
1,792.5417.1
201649,571.1
49,571.177,928.6
63.6%60,864.1
81.4%184,982
98,80486,178
137,2079,642
3,43020,734
20192,862.4
67.8297.7
3,227.923.6%
1,770.9435.4
201752,239.6
52,239.680,235.7
65.1%63,155.5
82.7%184,982
91,12593,857
138,9649,657
3,39219,783
20202,812.4
69.8314.2
3,196.422.7%
1,753.6451.6
201854,880.0
54,880.082,585.6
66.5%65,457.9
83.8%184,982
83,606101,376
140,9199,673
3,35218,991
20212,763.7
71.9330.8
3,166.421.9%
1,737.1466.3
201957,527.7
57,527.784,979.9
67.7%67,793.1
84.9%184,982
76,585108,397
142,6799,680
3,31918,379
20222,718.8
74.1347.4
3,140.321.1%
1,722.7485.4
202060,178.0
60,178.087,420.8
68.8%70,146.5
85.8%184,982
69,888115,094
144,3839,673
3,28017,953
20232,685.7
76.3364.0
3,126.020.4%
1,714.9507.2
202162,811.7
62,811.789,920.9
69.9%72,521.7
86.6%184,982
63,411121,571
146,1379,657
3,24217,690
20242,655.6
78.6380.6
3,114.819.7%
1,708.8530.2
202265,444.4
65,444.492,430.2
70.8%74,900.2
87.4%184,982
57,479127,503
147,6169,632
3,20617,581
20252,624.9
80.9397.3
3,103.119.1%
1,702.4546.5
202368,092.4
68,092.494,980.7
71.7%77,301.2
88.1%184,982
51,922133,060
148,9159,596
3,16917,595
20262,592.9
83.4414.0
3,090.318.6%
1,695.3564.6
202470,762.3
70,762.397,577.8
72.5%79,721.2
88.8%184,982
46,718138,264
150,0169,549
3,13117,792
20272,572.4
85.9430.9
3,089.118.0%
1,694.7586.3
202573,407.0
73,407.0100,242.0
73.2%82,135.4
89.4%184,982
41,433143,549
151,3339,496
3,09518,150
20282,555.7
88.4447.7
3,091.917.5%
1,696.2608.6
202676,025.6
76,025.6102,905.3
73.9%84,514.5
90.0%184,982
36,481148,501
152,4679,434
3,06118,610
20292,543.6
91.1464.4
3,099.117.1%
1,700.1628.0
202778,641.3
78,641.3105,591.3
74.5%86,886.7
90.5%184,982
31,923153,059
153,3309,361
3,02819,159
20302,534.5
93.8481.1
3,109.416.7%
1,705.8648.5
202881,262.2
81,262.2108,301.1
75.0%89,260.3
91.0%184,982
27,780157,202
153,9109,286
2,99119,729
20312,533.1
96.6497.9
3,127.616.3%
1,715.8668.6
202983,889.7
83,889.7111,078.3
75.5%91,658.6
91.5%184,982
24,120160,862
154,2959,198
2,96020,420
20322,531.5
99.5514.7
3,145.815.9%
1,725.8688.9
203086,541.2
86,541.2113,880.8
76.0%94,066.9
92.0%184,982
20,880164,102
154,3819,112
2,92721,227
20332,534.3
102.5531.8
3,168.615.6%
1,738.3709.9
203189,216.8
89,216.8116,741.4
76.4%96,493.4
92.5%184,982
17,849167,133
154,3599,019
2,89322,104
20342,539.0
105.6549.0
3,193.515.2%
1,752.0731.8
203291,932.7
91,932.7119,666.7
76.8%98,956.9
92.9%184,982
15,146169,836
154,1008,918
2,86023,074
20352,551.5
108.8566.4
3,226.715.0%
1,770.2753.8
203394,689.5
94,689.5122,691.8
77.2%101,472.5
93.3%184,982
12,640172,342
153,7528,820
2,83024,050
20362,563.7
112.0584.2
3,259.914.7%
1,788.4774.7
203497,504.6
97,504.6125,778.4
77.5%104,035.8
93.7%184,982
10,532174,450
153,1648,723
2,79925,030
20372,579.1
115.4602.3
3,296.714.4%
1,808.6797.4
2035100,390.5
100,390.5128,959.0
77.8%106,667.3
94.1%184,982
8,801176,181
152,4058,624
2,76726,112
20382,596.5
118.8620.9
3,336.314.2%
1,830.3819.9
2036103,349.5
103,349.5132,242.2
78.2%109,374.3
94.5%184,982
7,310177,672
151,5208,527
2,73827,243
20392,621.4
122.4639.9
3,383.814.0%
1,856.3843.3
2037106,389.4
106,389.4135,663.7
78.4%112,176.5
94.8%184,982
6,031178,951
150,5348,430
2,71028,469
20402,645.3
126.1659.5
3,430.913.7%
1,882.2867.2
2038109,517.3
109,517.3139,176.9
78.7%115,060.3
95.2%184,982
4,948180,034
149,4548,334
2,68129,730
20412,672.1
129.9679.6
3,481.613.5%
1,910.0892.3
2039112,744.1
112,744.1142,816.3
78.9%118,042.7
95.5%184,982
4,022180,960
148,2978,243
2,65331,064
20422,700.6
133.8700.4
3,534.713.4%
1,939.1918.3
2040116,071.8
116,071.8146,588.2
79.2%121,130.0
95.8%184,982
3,238181,744
147,0908,153
2,62632,445
20432,737.1
137.8721.8
3,596.713.2%
1,973.1945.3
2041119,504.7
119,504.7150,529.9
79.4%124,337.0
96.1%184,982
2,577182,405
145,8618,069
2,59733,822
20442,772.4
141.9743.8
3,658.113.0%
2,006.8973.1
2042123,049.7
123,049.7154,587.3
79.6%127,653.5
96.4%184,982
2,031182,951
144,6077,988
2,57335,153
20452,809.8
146.2766.6
3,722.612.9%
2,042.21,001.7
2043126,720.5
126,720.5158,797.2
79.8%131,096.6
96.7%184,982
1,593183,389
143,3307,908
2,54636,457
20462,849.4
150.5790.1
3,790.112.7%
2,079.21,031.4
2044130,514.2
130,514.2163,164.0
80.0%134,667.3
96.9%184,982
1,236183,746
142,0727,835
2,51837,749
20472,897.0
155.1814.5
3,866.512.6%
2,121.21,062.1
2045134,432.5
134,432.5167,726.1
80.2%138,376.4
97.1%184,982
945184,037
140,8397,765
2,49339,034
20482,942.9
159.7839.6
3,942.112.5%
2,162.71,093.8
2046138,477.4
138,477.4172,419.2
80.3%142,211.7
97.4%184,982
713184,269
139,6547,697
2,46540,249
20492,991.9
164.5865.5
4,021.912.4%
2,206. 41,126.7
2047142,658.8
142,658.8177,278.4
80.5%146,184.4
97.6%184,982
530184,452
138,5067,630
2,44241,421
20503,042.8
169.4892.3
4,104.512.3%
2,251.71,160.6
2048146,976.5
146,976.5182,309.4
80.6%150,298.3
97.8%184,982
387184,595
137,4047,573
2,41842,522
20513,103.1
174.5919.9
4,197.512.2%
2,302.81,195.5
2049151,434.2
151,434.2187,554. 0
80.7%154,563.3
98.0%184,982
276184,706
136,3577,518
2,39343,565
20523,160.5
179.8948.4
4,288.712.1%
2,352.81,231.4
2050156,034.5
156,034.5192,941.1
80.9%158,971.6
98.2%184,982
193184,789
135,3687,469
2,36744,553
20533,221.2
185.1977.9
4,384.212.0%
2,405.21,268.6
2051160,788.2
160,788.2198,511.5
81.0%163,532. 4
98.3%184,982
132184,850
134,4457,423
2,34545,477
20543,284.3
190.71,008.3
4,483.311.9%
2,459.51,306.9
2052165,693.2
165,693.2204,269.3
81.1%168,249.0
98.5%184,982
89184,893
133,5947,382
2,31946,329
20553,356.6
196.41,039.7
4,592.711.9%
2,519.51,346.3
2053170,753.5
170,753.5210,262. 6
81.2%173,129.0
98.6%184,982
56184,926
132,8047,344
2,29747,116
20563,426.3
202.31,072.0
4,700.711.8%
2,578.81,386.7
2054175,971.5
175,971.5216,409.6
81.3%178,167.6
98.8%184,982
33184,949
132,0847,311
2,27547,838
20573,499.4
208.41,105.4
4,813.211.7%
2,640.51,428.4
2055181,358.0
181,358.0222,755.0
81.4%183,372.3
98.9%184,982
18184,964
131,4367,281
2,25648,498
20583,574.2
214.61,139.9
4,928.711.6%
2,703.91,471.4
2056186,910.9
186,910.9229,303.2
81.5%188,746.5
99.0%184,982
9184,973
130,8547,254
2,23949,101
20593,660.1
221.11,175.4
5,056.511.6%
2,774.01,515.7
2057192,634.2
192,634.2236,108.2
81.6%194,296.3
99.1%184,982
4184,978
130,3397,230
2,22449,646
20603,742.5
227.71,212.0
5,182.211.5%
2,842.91,561.3
2058198,530.7
198,530.7243,079.4
81.7%200,020.5
99.3%184,982
2184,980
129,8857,207
2,21250,140
Assumptions:
‐ Projections are based on June 30, 2008 data and assumptions
‐ Projections have been adjusted to reflect known asset, liability, and population adjustm
ents through June 30, 2010‐ Population is assum
ed to remain fixed after June 30, 2010 (i.e., new
hires replace all terminations
‐ New
plans have been reflected for expected new entrants
‐ New
entrant populations are assumed to have the sam
e characteristics as the population that entered the plan during FY 2008‐ Investm
ent returns are assumed to be 8%
per year in the future, producing no future gains or losses in the smoothing m
ethod‐ Adm
inistrative expenses are expected to increase 3% over prior year (does not apply to FIRE)
‐ Investment expenses are assum
ed to be a fixed percent of assets ranging from 0.4%
to 0.6% depending on the System
‐ The Net City Contribution is assum
ed to be 54.86% of the Total Pension Fund Contribution
NYCERS Pension Fund Projections
Baseline Using 8.00%
Interest and Static Employee Population
($ in millions)21
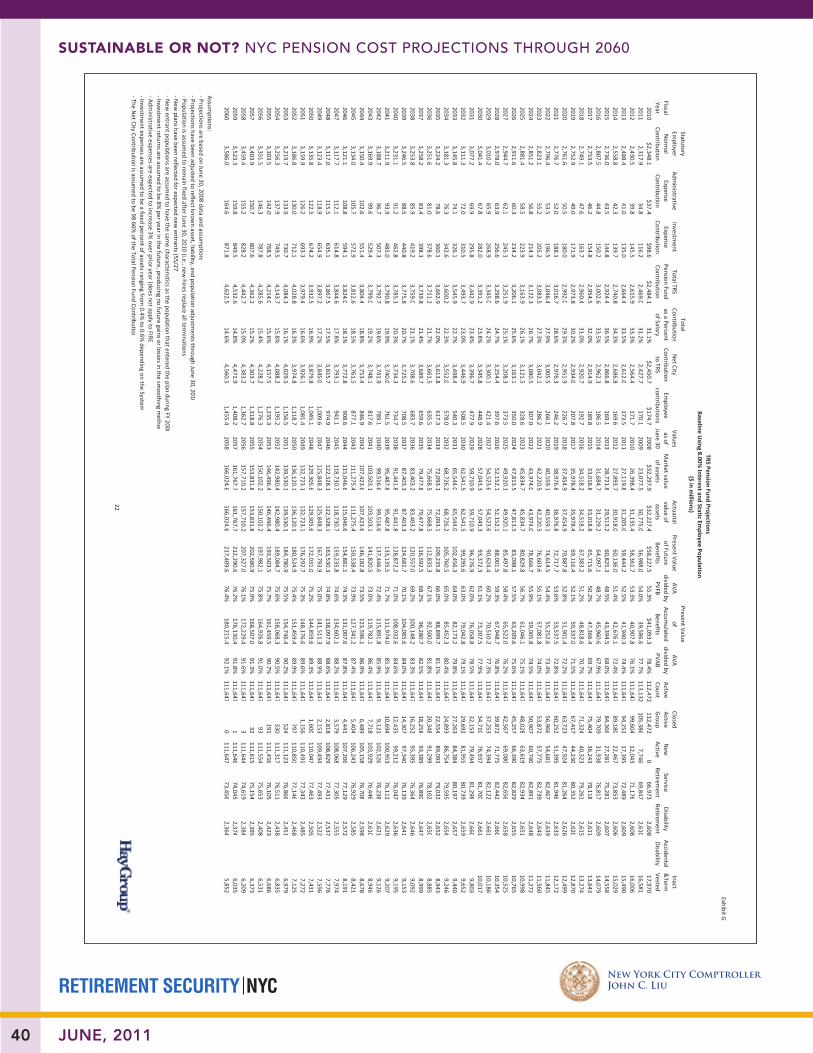
RETIREMENT SECURITY NYC
SUStaiNablE or Not? NYC PeNsioN Cost ProjeCtioNs through 2060
New York City ComptrollerJohn C. Liu
40 JUNE, 2011
Exhibit G
Fiscal Year
Statutory Em
ployer Norm
al Contribution
Administrative
Expense Contribution
Investment
Expense Contribution
Total TRS Pension Fund Contribution
Total Contribution as a Percent of Salary
Net City
Contribution to TRS
Employee
contributions
Values as of
June 30Market value of assets
Actuarial value of assets
Present Value of Future Benefits
AVA divided by
PVFB
Present Value of
Accumulated
Benefits
AVA divided by PVAB
Active Count
Closed Active Group
New
Active
Service Retirem
entDisability Retirem
entAccidental Disability
Inact &Term
Vested
2010$2,348.1
$37.4$98.6
$2,484.131.1%
$2,450.7$174.7
2008$32,297.9
$32,227.4$58,227.5
55.3%$41,093.3
78.4%112,472
112,4720
66,9732,608
17,9702011
2,317.934.8
116.22,469.0
31.2%2,427.7
170.12009
23,077.530,775.0
56,988.054.0%
39,586.677.7%
113,132105,386
7,74669,847
2,61016,581
20122,430.5
39.8145.5
2,615.933.3%
2,564.4171.7
201026,398.4
31,135.458,361.7
53.3%40,907.8
76.1%111,647
99,60412,043
71,1762,608
16,0062013
2,488.441.0
135.02,664.4
33.5%2,612.0
173.52011
27,119.831,205.0
59,444.252.5%
41,940.374.4%
111,64794,252
17,39572,489
2,60915,490
20142,558.8
42.3139.7
2,740.834.3%
2,686.8169.6
201227,893.7
30,918.060,136.0
51.4%42,676.1
72.4%111,647
89,18022,467
73,8532,606
15,0292015
2,736.043.5
144.82,924.4
36.5%2,866.8
169.12013
28,721.829,513.2
60,825.348.5%
43,394.568.0%
111,64784,366
27,28175,281
2,60714,558
20162,807.5
44.8150.2
3,002.633.5%
2,962.3186.5
201431,684.7
31,229.264,097.1
48.7%45,960.6
67.9%111,647
79,70931,938
76,8172,609
14,0792017
2,753.546.2
154.82,954.5
32.0%2,914.9
189.82015
33,018.833,018.8
65,715.650.2%
47,366.469.7%
111,64775,404
36,24378,118
2,61113,643
20182,749.1
47.6163.7
2,960.431.0%
2,920.7192.7
201634,518.2
34,518.267,383.2
51.2%48,818.6
70.7%111,647
71,32440,323
79,2612,615
13,2742019
2,752.949.0
171.92,973.8
30.2%2,934.0
207.82017
35,978.435,978.4
69,116.452.1%
50,337.071.5%
111,64767,417
44,23080,352
2,62012,870
20202,761.6
50.5180.0
2,992.029.3%
2,951.9226.7
201837,454.9
37,454.970,887.8
52.8%51,901.4
72.2%111,647
63,72347,924
81,2642,626
12,4992021
2,776.752.0
188.13,016.7
28.6%2,976.3
246.22019
38,976.838,976.8
72,717.753.6%
53,537.572.8%
111,64760,252
51,39581,946
2,63312,172
20222,796.4
53.5196.5
3,046.427.9%
3,005.5266.1
202040,559.1
40,559.174,614.5
54.4%55,252.6
73.4%111,647
56,96654,681
82,4672,639
11,8452023
2,823.155.2
205.23,083.5
27.3%3,042.1
286.22021
42,220.542,220.5
76,603.655.1%
57,081.874.0%
111,64753,872
57,77582,739
2,64311,560
20242,851.2
56.8214.3
3,122.326.7%
3,080.5307.0
202243,974.0
43,974.078,666.7
55.9%59,005.8
74.5%111,647
50,90760,740
82,8912,648
11,2722025
2,881.458.5
223.93,163.9
26.1%3,121.5
328.62023
45,834.745,834.7
80,829.856.7%
61,046.175.1%
111,64748,028
63,61982,934
2,65110,998
20262,911.6
60.3234.2
3,206.125.6%
3,163.1350.0
202447,813.5
47,813.583,098.1
57.5%63,209.6
75.6%111,647
45,25766,390
82,8292,655
10,7652027
2,944.762.1
245.13,251.9
25.1%3,208.3
373.52025
49,920.149,920.1
85,497.858.4%
65,522.076.2%
111,64742,567
69,08082,656
2,65810,525
20282,978.0
63.9256.6
3,298.624.7%
3,254.4397.6
202652,152.1
52,152.188,001.5
59.3%67,948.7
76.8%111,647
39,87271,775
82,4422,660
10,3542029
3,010.265.9
268.93,345.0
24.2%3,300.1
421.42027
54,523.654,523.6
90,624.460.2%
70,510.277.3%
111,64737,253
74,39482,122
2,66110,186
20303,041.4
67.8282.0
3,391.223.8%
3,345.8448.9
202857,043.3
57,043.393,372.3
61.1%73,207.5
77.9%111,647
34,71076,937
81,7002,661
10,0172031
3,077.269.9
295.83,442.9
23.4%3,396.7
477.92029
59,710.959,710.9
96,276.962.0%
76,058.878.5%
111,64732,153
79,49481,298
2,6609,803
20323,111.3
72.0310.5
3,493.723.0%
3,446.9508.5
203062,541.5
62,541.599,295.6
63.0%79,042.8
79.1%111,647
29,69281,955
80,7392,659
9,6522033
3,145.874.1
326.13,545.9
22.7%3,498.4
540.32031
65,544.065,544.0
102,456.364.0%
82,173.279.8%
111,64727,263
84,38480,197
2,6579,440
20343,181.3
76.3342.6
3,600.222.3%
3,552.0578.0
203268,726.2
68,726.2105,760.5
65.0%85,452.3
80.4%111,647
24,89386,754
79,5952,654
9,2462035
3,224.278.6
360.13,662.9
22.0%3,613.8
617.32033
72,093.172,093.1
109,235.866.0%
88,899.781.1%
111,64722,554
89,09379,032
2,6528,943
20363,251.6
81.0378.6
3,711.221.7%
3,661.5635.5
203475,668.5
75,668.5112,835.3
67.1%92,500.0
81.8%111,647
20,34891,299
78,1022,650
8,8852037
3,258.283.4
398.33,739.8
21.4%3,689.7
659.62035
79,477.879,477.8
116,592.568.2%
96,280.782.5%
111,64718,258
93,38976,890
2,6478,999
20383,253.8
85.9419.2
3,759.021.1%
3,708.6683.7
203683,403.2
83,403.2120,557.0
69.2%100,148.2
83.3%111,647
16,25295,395
76,3642,646
9,0922039
3,246.588.5
440.83,775.8
20.7%3,725.2
708.52037
87,403.387,403.3
124,681.770.1%
104,085.684.0%
111,64714,307
97,34076,139
2,6419,153
20403,231.1
91.2462.8
3,785.120.3%
3,734.3734.7
203891,441.8
91,441.8128,872.2
71.0%108,032.6
84.6%111,647
12,43599,212
76,0472,636
9,1952041
3,211.993.9
485.03,790.8
19.9%3,740.0
761.52039
95,487.895,487.8
133,135.571.7%
111,974.085.3%
111,64710,694
100,95376,112
2,6299,207
20423,188.7
96.7507.3
3,792.719.6%
3,741.9789.1
204099,516.6
99,516.6137,446.6
72.4%115,891.8
85.9%111,647
9,121102,526
76,2382,621
9,1262043
3,169.999.6
529.43,799.0
19.2%3,748.1
817.62041
103,503.1103,503.1
141,820.573.0%
119,782.186.4%
111,6477,718
103,92976,446
2,6108,946
20443,150.4
102.6551.4
3,804.418.8%
3,753.4846.9
2042107,423.6
107,423.6146,182.8
73.5%123,596.1
86.9%111,647
6,489105,158
76,7082,598
8,6782045
3,134.0105.7
572.93,812.6
18.5%3,761.5
877.12043
111,275.4111,275.4
150,538.473.9%
127,341.287.4%
111,6475,404
106,24376,929
2,5858,421
20463,121.1
108.8594.1
3,824.018.1%
3,772.8908.6
2044115,046.6
115,046.6154,881.1
74.3%131,007.6
87.8%111,647
4,441107,206
77,1292,572
8,1912047
3,117.7112.1
614.83,844.6
17.8%3,793.1
941.12045
118,730.7118,730.7
159,235.874.6%
134,602.188.2%
111,6473,579
108,06877,305
2,5557,974
20483,117.0
115.5635.1
3,867.517.5%
3,815.7974.9
2046122,328.1
122,328.1163,530.3
74.8%138,097.9
88.6%111,647
2,818108,829
77,4312,537
7,7762049
3,123.4118.9
654.93,897.2
17.2%3,845.0
1,009.62047
125,848.3125,848.3
167,793.975.0%
141,511.388.9%
111,6472,153
109,49477,493
2,5227,596
20503,135.8
122.5674.2
3,932.516.9%
3,879.81,045.1
2048129,305. 6
129,305.6172,031.0
75.2%144,859.6
89.3%111,647
1,600110,047
77,4632,505
7,4312051
3,159.9126.2
693.33,979.4
16.6%3,926.1
1,081.42049
132,723.1132,723.1
176,292.775.3%
148,176.689.6%
111,6471,156
110,49177,343
2,4857,272
20523,186.8
130.0712.1
4,028.816.3%
3,974.81,118.7
2050136,120.1
136,120.1180,524.9
75.4%151,459.4
89.9%111,647
797110,850
77,1462,468
7,1252053
3,219.7133.9
730.74,084.3
16.1%4,029.5
1,156.52051
139,530.1139,530.1
184,780.975.5%
154,746.490.2%
111,647524
111,12376,866
2,4516,979
20543,256.3
137.9749.5
4,143.715.8%
4,088.21,195.2
2052142,980.4
142,980.4189,084.7
75.6%158,068.3
90.5%111,647
330111,317
76,5112,438
6,8352055
3,303.5142.0
768.54,214.0
15.6%4,157.5
1,235.32053
146,496.4146,496.4
193,503.575.7%
161,459.590.7%
111,647191
111,45676,105
2,4236,686
20563,351.5
146.3787.8
4,285.615.4%
4,228.21,276.3
2054150,102.2
150,102.2197,982.1
75.8%164,926.8
91.0%111,647
93111,554
75,6532,408
6,5312057
3,403.9150.7
807.64,362.2
15.2%4,303.7
1,318.82055
153,831.8153,831.8
202,580.975.9%
168,507.091.3%
111,64732
111,61575,154
2,3956,373
20583,459.4
155.2828.2
4,442.715.0%
4,383.21,362.7
2056157,710.2
157,710.2207,327.0
76.1%172,229.4
91.6%111,647
3111,644
74,6192,384
6,2092059
3,523.3159.8
849.54,532.6
14.8%4,471.9
1,408.22057
161,767.7161,767.7
212,290.676.2%
176,130.491.8%
111,6471
111,64674,045
2,3746,035
20603,586.0
164.6871.8
4,622.514.6%
4,560.51,455.4
2058166,024.6
166,024.6217,409.6
76.4%180,215.4
92.1%111,647
0111,647
73,4562,364
5,852
Assumptions:
‐ Projections are based on June 30, 2008 data and assumptions
‐ Projections have been adjusted to reflect known asset, liability, and population adjustm
ents through June 30, 2010‐ Population is assum
ed to remain fixed after June 30, 2010 (i.e., new
hires replace all terminations
‐ New
plans have been reflected for expected new entrants (55/27)
‐ New
entrant populations are assumed to have the sam
e characteristics as the population that entered the plan during FY 2008‐ Investm
ent returns are assumed to be 8%
per year in the future, producing no future gains or losses in the smoothing m
ethod‐ Adm
inistrative expenses are expected to increase 3% over prior year (does not apply to FIRE)
‐ Investment expenses are assum
ed to be a fixed percent of assets ranging from 0.4%
to 0.6% depending on the System
‐ The Net City Contribution is assum
ed to be 98.66% of the Total Pension Fund Contribution
TRS Pension Fund Projections
($ in millions)
Baseline Using 8.00%
Interest and Static Employee Population
22

RETIREMENT SECURITY NYC
SUStaiNablE or Not? NYC PeNsioN Cost ProjeCtioNs through 2060
New York City ComptrollerJohn C. Liu
41JUNE, 2011
Exhibit G
Fiscal Year
Statutory Em
ployer Norm
al Contribution
Administrative
Expense Contribution
Investment
Expense Contribution
Total BERS Pension Fund Contribution
Total Contribution as a Percent of Salary
Net City
Contribution to BERS
Employee
contributions
Values as of
June 30Market value of assets
Actuarial value of assets
Present Value of Future Benefits
AVA divided by
PVFB
Present Value of
Accumulated
Benefits
AVA divided by PVAB
Active Count
Closed Active Group
New
Active
Service Retirem
entDisability Retirem
entAccidental Disability
Inact &Term
Vested
2010$132.9
$9.2$5.3
$147.317.9%
$139.5$25.9
2008$2,021.9
$2,084.1$3,429.5
60.8%$2,315.9
90.0%22,728
22,728
012,483
7094,282
2011167.2
9.83.2
180.220.6%
170.526.5
20091,536.6
1,963.73,612.1
54.4%2,423.0
81.0%23,303
20,777
2,52613,513
7203,943
2012157.4
9.44.7
171.519.9%
161.726.5
20101,785.9
2,092.23,679.2
56.9%2,502.6
83.6%23,333
19,301
4,03214,016
7323,732
2013161.9
9.78.2
179.819.9%
169.528.2
20111,934.0
2,191.13,835.2
57.1%2,643.0
82.9%23,333
17,880
5,45314,539
7453,521
2014170.3
10.010.0
190.320.4%
179.429.5
20122,072.9
2,260.73,991.4
56.6%2,784.3
81.2%23,333
16,516
6,81715,059
7573,330
2015186.3
10.311.9
208.521.6%
196.630.6
20132,215.5
2,274.24,149.8
54.8%2,927.9
77.7%23,333
15,181
8,15215,589
7723,161
2016196.8
10.612.8
220.121.0%
208.533.2
20142,414.4
2,401.94,394.0
54.7%3,133.6
76.6%23,333
13,910
9,42316,112
7833,021
2017194.7
10.913.6
219.220.2%
207.534.6
20152,594.8
2,594.84,590.5
56.5%3,306.7
78.5%23,333
12,755
10,57816,621
7962,897
2018194.4
11.215.3
220.919.6%
209.235.8
20162,789.6
2,789.64,795.2
58.2%3,485.4
80.0%23,333
11,639
11,69417,134
8072,784
2019194.5
11.516.4
222.519.0%
210.736.8
20172,986.5
2,986.55,007.4
59.6%3,671.2
81.3%23,333
10,615
12,71817,606
8172,679
2020194.9
11.917.5
224.418.5%
212.437.8
20183,187.5
3,187.55,226.1
61.0%3,861.1
82.6%23,333
9,633
13,70018,077
8242,591
2021195.5
12.218.7
226.418.0%
214.439.3
20193,393.5
3,393.55,451.6
62.2%4,057.5
83.6%23,333
8,740
14,59318,503
8342,512
2022196.3
12.619.8
228.817.6%
216.640.8
20203,603.6
3,603.65,684.4
63.4%4,259.4
84.6%23,333
7,899
15,43418,903
8412,458
2023197.6
13.021.0
231.617.2%
219.342.4
20213,818.0
3,818.05,925.5
64.4%4,467.6
85.5%23,333
7,114
16,21919,290
8462,400
2024199.0
13.422.2
234.516.8%
222.144.1
20224,037.3
4,037.36,172.3
65.4%4,680.7
86.3%23,333
6,392
16,94119,641
8502,357
2025200.7
13.823.4
237.916.5%
225.345.7
20234,261.2
4,261.26,426.1
66.3%4,898.9
87.0%23,333
5,717
17,61619,971
8542,322
2026202.8
14.224.7
241.716.2%
228.847.3
20244,490.8
4,490.86,687.1
67.2%5,123.4
87.7%23,333
5,106
18,22720,269
8532,284
2027205.4
14.626.0
246.015.9%
233.048.9
20254,726.5
4,726.56,957.6
67.9%5,355.8
88.3%23,333
4,542
18,79120,535
8552,250
2028208.0
15.127.3
250.415.7%
237.150.6
20264,968.6
4,968.67,234.6
68.7%5,594.0
88.8%23,333
4,030
19,30320,762
8542,245
2029210.7
15.528.7
254.915.4%
241.452.2
20275,218.5
5,218.57,520.1
69.4%5,840.1
89.4%23,333
3,568
19,76520,957
8522,247
2030213.6
16.030.1
259.715.2%
245.953.9
20285,475.1
5,475.17,814.3
70.1%6,093.1
89.9%23,333
3,139
20,19421,131
8482,256
2031216.9
16.531.6
264.915.0%
250.855.6
20295,739.2
5,739.28,119.4
70.7%6,354.8
90.3%23,333
2,749
20,58421,282
8472,263
2032220.2
17.033.1
270.214.9%
255.957.3
20306,010.5
6,010.58,432.0
71.3%6,622.9
90.8%23,333
2,394
20,93921,411
8442,274
2033223.7
17.534.6
275.714.7%
261.159.1
20316,289.2
6,289.28,753.9
71.8%6,898.4
91.2%23,333
2,068
21,26521,514
8382,302
2034227.2
18.036.2
281.314.5%
266.460.9
20326,576.7
6,576.79,085.5
72.4%7,182.4
91.6%23,333
1,783
21,55021,583
8342,330
2035231.2
18.537.8
287.614.4%
272.362.7
20336,870.8
6,870.89,428.6
72.9%7,474.1
91.9%23,333
1,513
21,82021,645
8282,367
2036235.3
19.139.4
293.814.3%
278.264.6
20347,172.6
7,172.69,779.7
73.3%7,773.1
92.3%23,333
1,282
22,05121,682
8262,403
2037239.6
19.741.2
300.414.2%
284.566.5
20357,482.7
7,482.710,140.9
73.8%8,080.5
92.6%23,333
1,084
22,24921,701
8212,440
2038244.0
20.242.9
307.114.1%
290.868.5
20367,801.2
7,801.210,512.2
74.2%8,396.3
92.9%23,333
910
22,42321,694
8162,478
2039248.8
20.844.7
314.414.0%
297.770.5
20378,128.5
8,128.510,896.9
74.6%8,722.3
93.2%23,333
760
22,57321,671
8102,520
2040253.6
21.546.6
321.713.9%
304.672.7
20388,463.7
8,463.711,290.4
75.0%9,055.8
93.5%23,333
628
22,70521,639
8072,567
2041258.7
22.148.4
329.213.8%
311.874.8
20398,807.2
8,807.211,694.6
75.3%9,397.8
93.7%23,333
514
22,81921,591
8022,614
2042263.8
22.850.4
337.013.7%
319.177.1
20409,159.3
9,159.312,109.8
75.6%9,748.8
94.0%23,333
421
22,91221,534
7992,661
2043269.7
23.552.4
345.513.6%
327.279.4
20419,519.2
9,519.212,538.7
75.9%10,108.9
94.2%23,333
339
22,99421,470
7922,712
2044275.4
24.254.4
354.013.6%
335.281.8
20429,887.7
9,887.712,976.7
76.2%10,477.8
94.4%23,333
271
23,06221,393
7902,760
2045281.4
24.956.5
362.713.5%
343.584.2
204310,264.8
10,264.813,426.1
76.5%10,855.4
94.6%23,333
214
23,11921,313
7832,811
2046287.5
25.658.6
371.713.4%
351.986.8
204410,649.9
10,649.913,886.5
76.7%11,241.8
94.7%23,333
168
23,16521,229
7812,861
2047294.3
26.460.7
381.513.4%
361.289.4
204511,043.2
11,043.214,361.6
76.9%11,637.6
94.9%23,333
130
23,20321,143
7762,910
2048301.0
27.262.9
391.213.3%
370.492.1
204611,444.4
11,444.414,845.0
77.1%12,041.6
95.0%23,333
100
23,23321,055
7742,957
2049308.0
28.065.2
401.213.3%
379.994.9
204711,854.1
11,854.115,339.9
77.3%12,454. 4
95.2%23,333
76
23,25720,966
7703,001
2050315.2
28.967.5
411.613.2%
389.797.8
204812,271.3
12,271.315,846.2
77.4%12,875.5
95.3%23,333
56
23,27720,884
7693,044
2051323.2
29.769.8
422.813.2%
400.3100.7
204912,697.1
12,697.116,367.7
77.6%13,306.4
95.4%23,333
42
23,29120,802
7663,084
2052331.1
30.672.2
434.013.2%
410.9103.8
205013,131.4
13,131.416,898.1
77.7%13,746.2
95.5%23,333
30
23,30320,721
7633,121
2053339.3
31.574.7
445.513.1%
421.8106.9
205113,574.7
13,574.717,440.9
77.8%14,195.3
95.6%23,333
20
23,31320,64 6
7633,156
2054347.7
32.577.1
457.313.1%
433.0110.1
205214,026.6
14,026.617,996.0
77.9%14,653.9
95.7%23,333
13
23,32020,576
7603,187
2055357.1
33.579.7
470.213.1%
445.2113.4
205314,487.7
14,487.718,567. 8
78.0%15,122.9
95.8%23,333
9
23,32420,510
7583,214
2056366.2
34.582.3
483.013.0%
457.3116.8
205414,958.4
14,958.419,149.7
78.1%15,602.0
95.9%23,333
6
23,32720,449
7583,240
2057375.8
35.584.9
496.213.0%
469.9120.3
205515,439.5
15,439.519,745.5
78.2%16,091.9
95.9%23,333
3
23,33020,393
7573,262
2058385.6
36.687.6
509.713.0%
482.7123.9
205615,930.8
15,930.820,355.4
78.3%16,593.0
96.0%23,333
2
23,33120,344
7543,280
2059396.4
37.790.4
524.413.0%
496.6127.6
205716,433.3
16,433.320,984.8
78.3%17,106.1
96.1%23,333
1
23,33220,299
7523,298
2060407.0
38.893.2
539.012.9%
510.4131.5
205816,947.0
16,947.021,625.7
78.4%17,631.3
96.1%23,333
0
23,33320,258
7503,311
Assumptions:
‐ Projections are based on June 30, 2008 data and assumption s
‐ Projections have been adjusted to reflect known asset, liability, and population adjustm
ents through June 30, 2010‐ Population is assum
ed to remain fixed after June 30, 2010 (i.e., new
hires replace all terminations
‐ New
plans have been reflected for expected new entrants
‐ New
entrant populations are assumed to have the sam
e characteristics as the population that entered the plan during FY 2008‐ Investm
ent returns are assumed to be 8%
per year in the future, producing no future gains or losses in the smoothing m
ethod‐ Adm
inistrative expenses are expected to increase 3% over prior year (does not apply to FIRE)
‐ Investment expenses are assum
ed to be a fixed percent of assets ranging from 0.4%
to 0.6% depending on the System
‐ The Net City Contribution is assum
ed to be 94.69% of the Total Pension Fund Contribution
BERS Pension Fund ProjectionsBaseline U
sing 8.00% Interest and Static Em
ployee Population($ in m
illions)
23

RETIREMENT SECURITY NYC
SUStaiNablE or Not? NYC PeNsioN Cost ProjeCtioNs through 2060
New York City ComptrollerJohn C. Liu
42 JUNE, 2011
Exhibit G
Fiscal Year
Statutory Em
ployer Norm
al Contribution
Administrative
Expense Contribution
Investment
Expense Contribution
Total POLICE
Pension Fund Contribution
Total Contribution as a Percent of Salary
Net City
Contribution to PO
LICEEm
ployee contributions
Values as of
June 30Market value of assets
Actuarial value of assets
Present Value of Future Benefits
AVA divided by
PVFB
Present Value of
Accumulated
Benefits
AVA divided by PVAB
Active Count
Closed Active Group
New
Active
Service Retirem
entOrdinary
DisabilityAccidental Disability
Inact &Term
Vested
2010$1,877.9
$17.7$84.4
$1,980.165.1%
$1,980.1$55.8
2008$21,061.0
$21,393.2$37,586.8
56.9%$30,355.3
70.5%35,337
35,337
029,346
3,69111,253
2,9812011
1,978.319.3
86.02,083.6
64.3%2,083.6
55.52009
17,424.122,676.2
39,079.158.0%
31,888.571.1%
35,608
33,2712,337
29,5393,661
11,4383,022
20122,079.3
19.3105.1
2,203.767.1%
2,203.758.7
201019,985.1
23,943.640,785.0
58.7%33,656.3
71.1%34,597
31,376
3,22129,801
3,62411,615
3,0892013
2,094.619.8
116.62,231.0
67.0%2,231.0
58.92011
21,895.925,184.5
42,401.859.4%
35,204.871.5%
34,597
29,1315,466
30,5513,590
11,7833,227
20142,004.2
20.4127.7
2,152.466.4%
2,152.458.4
201223,931.8
26,361.443,320.5
60.9%36,103.6
73.0%34,597
27,224
7,37331,063
3,55211,935
3,3972015
2,020.721.1
139.62,181.3
68.8%2,181.3
58.72013
25,927.626,823.9
44,350.560.5%
36,921.372.7%
34,597
25,1119,486
31,8573,512
12,0793,574
20162,116.6
22.3151.2
2,290.273.8%
2,290.259.3
201426,693.8
26,583.445,708.9
58.2%37,985.8
70.0%34,597
23,045
11,55232,665
3,47012,202
3,7232017
2,012.823.0
161.82,197.7
69.5%2,197.7
63.22015
27,695.227,695.2
46,385.659.7%
39,011.271.0%
34,597
21,16613,431
33,3393,431
12,3143,825
20181,939.7
23.7165.1
2,128.565.9%
2,128.565.8
201628,898.2
28,898.247,206.8
61.2%39,997.9
72.2%34,597
19,416
15,18133,949
3,38912,408
3,8692019
1,874.824.4
172.32,071.5
63.2%2,071.5
69.12017
30,040.530,040.5
48,016.862.6%
40,991.073.3%
34,597
17,96416,633
34,2823,351
12,4893,899
20201,825.1
25.1179.1
2,029.360.4%
2,029.373.7
201831,082.7
31,082.748,788.8
63.7%41,918.5
74.2%34,597
16,440
18,15734,729
3,32012,560
3,8882021
1,778.625.9
185.41,989.9
57.9%1,989.9
76.22019
32,057.132,057.1
49,535.564.7%
42,814.074.9%
34,597
14,98419,613
35,1593,291
12,6163,830
20221,732.2
26.7191.2
1,950.155.9%
1,950.180.7
202033,016.7
33,016.750,268.2
65.7%43,713.0
75.5%34,597
13,803
20,79435,309
3,26712,663
3,7912023
1,690.627.5
196.91,915.0
53.7%1,915.0
83.42021
33,881.433,881.4
50,993.066.4%
44,549.476.1%
34,597
12,36222,235
35,7523,251
12,7003,725
20241,656.2
28.3202.1
1,886.751.9%
1,886.788.7
202234,718.1
34,718.151,687.6
67.2%45,363.4
76.5%34,597
11,168
23,42935,963
3,23812,728
3,6662025
1,625.629.1
207.11,861.9
50.0%1,861.9
91.32023
35,472.835,472.8
52,364.167.7%
46,113.576.9%
34,597
9,82724,770
36,3413,234
12,7423,594
20261,574.0
30.0211.7
1,815.748.5%
1,815.792.4
202436,219.5
36,219.553,032.7
68.3%46,859.6
77.3%34,597
8,719
25,87836,509
3,23212,746
3,5182027
1,523.530.9
216.11,770.5
47.0%1,770.5
96.72025
36,875.936,875.9
53,693.068.7%
47,516.077.6%
34,597
7,43227,165
36,7783,235
12,7413,531
20281,493.1
31.8220.1
1,745.045.3%
1,745.0101.7
202637,367.7
37,367.754,305.6
68.8%48,008.0
77.8%34,597
5,835
28,76237,394
3,24412,723
3,5212029
1,483.432.8
223.01,739.2
43.6%1,739.2
108.42027
37,783.637,783.6
54,888.468.8%
48,430.678.0%
34,597
4,41630,181
37,9223,255
12,6893,444
20301,495.4
33.8225.5
1,754.642.2%
1,754.6116.3
202838,154.4
38,154.455,437.0
68.8%48,802.9
78.2%34,597
3,229
31,36838,386
3,26712,637
3,2222031
1,525.334.8
227.71,787.8
41.0%1,787.8
123.92029
38,545.238,545.2
55,974.868.9%
49,189.178.4%
34,597
2,38732,210
38,3593,280
12,5683,174
20321,560.8
35.8230.1
1,826.740.0%
1,826.7131.6
203039,013.3
39,013.356,500.6
69.0%49,617.4
78.6%34,597
1,894
32,70337,922
3,29512,492
3,1972033
1,599.536.9
232.91,869.4
39.1%1,869.4
139.22031
39,574.339,574.3
57,059.369.4%
50,103.079.0%
34,597
1,51433,083
37,3573,315
12,4153,239
20341,640.0
38.0236.3
1,914.338.4%
1,914.3146.8
203240,244.4
40,244.457,666.9
69.8%50,659.7
79.4%34,597
1,204
33,39336,713
3,34312,343
3,2952035
1,664.739.2
240.31,944.2
37.8%1,944.2
147.72033
41,041.741,041.7
58,349.470.3%
51,311.080.0%
34,597
95033,647
36,0013,380
12,2763,357
20361,675.0
40.3245.2
1,960.537.2%
1,960.5153.3
203441,983.5
41,983.559,098.3
71.0%52,058.3
80.6%34,597
744
33,85335,237
3,42612,216
3,4312037
1,682.141.6
250.81,974.5
36.4%1,974.5
154.32035
42,962.442,962.4
59,977.271.6%
52,843.181.3%
34,597
58034,017
34,9713,484
12,1643,507
20381,676.6
42.8256.7
1,976.135.8%
1,976.1156.9
203644,040.6
44,040.660,905.0
72.3%53,709.3
82.0%34,597
449
34,14834,523
3,54712,121
3,5872039
1,670.444.1
263.21,977.7
35.0%1,977.7
158.82037
45,145.945,145.9
61,948.872.9%
54,619.182.7%
34,597
34434,253
34,3723,620
12,0853,670
20401,660.2
45.4269.9
1,975.534.3%
1,975.5161.0
203846,283.6
46,283.663,046.1
73.4%55,565.9
83.3%34,597
260
34,33734,264
3,69712,056
3,7532041
1,651.246.8
276.81,974.7
33.5%1,974.7
163.92039
47,438.747,438.7
64,215.273.9%
56,546.183.9%
34,597
19434,403
34,2623,782
12,0323,838
20421,643.8
48.2283.7
1,975.732.7%
1,975.7167.3
204048,600.9
48,600.965,443.8
74.3%57,553.7
84.4%34,597
141
34,45634,324
3,86612,014
3,9162043
1,643.249.6
290.71,983.6
32.0%1,983.6
171.82041
49,773.849,773.8
66,737.374.6%
58,596.984.9%
34,597
10134,496
34,3983,956
11,9993,986
20441,644.3
51.1297.8
1,993.231.3%
1,993.2176.1
204250,957.6
50,957.668,068.5
74.9%59,665.7
85.4%34,597
70
34,52734,483
4,04411,987
4,0522045
1,647.052.6
304.92,004.5
30.7%2,004.5
180.82043
52,169.152,169.1
69,444.375.1%
60,774.185.8%
34,597
4734,550
34,5244,137
11,9794,107
20461,653.5
54.2312.2
2,020.030.0%
2,020.0186.7
204453,401.8
53,401.870,877.7
75.3%61,920.3
86.2%34,597
29
34,56834,588
4,23111,974
4,1572047
1,664.755.8
319.72,040.2
29.5%2,040.2
191.52045
54,659.254,659.2
72,382.475.5%
63,112.186.6%
34,597
1734,580
34,6504,326
11,9724,200
20481,674.6
57.5327.3
2,059.429.0%
2,059.4197.5
204655,960.7
55,960.773,926.1
75.7%64,354.7
87.0%34,597
9
34,58834,662
4,42011,971
4,2402049
1,687.159.2
335.12,081.4
28.5%2,081.4
202.92047
57,293.857,293.8
75,544.275.8%
65,644.187.3%
34,597
434,593
34,7204,518
11,9714,273
20501,701. 0
61.0343.1
2,105.128.0%
2,105.1209.3
204858,674.6
58,674.677,224.9
76.0%66,993.1
87.6%34,597
1
34,59634,745
4,61611,976
4,3062051
1,719.662.8
351.52,133.9
27.6%2,133.9
215.02049
60,097.160,097.1
79,003.876.1%
68,403.887.9%
34,597
034,597
34,8044,714
11,9804,334
20521,733.2
64.7360.0
2,158.027.2%
2,158.0219.4
205061,579.4
61,579.480,839.8
76.2%69,882.5
88.1%34,597
0
34,59734,825
4,81111,985
4,3592053
1,746.566.7
368.92,182.1
26.9%2,182.1
224.82051
63,112.863,112.8
82,766.976.3%
71,426.188.4%
34,597
034,597
34,8884,908
11,9954,379
20541,764.7
68.7378.2
2,211.626.5%
2,211.6231.3
205264,669.6
64,669.684,790.2
76.3%73,018.3
88.6%34,597
0
34,59735,051
5,00312,004
4,3992055
1,792.670.7
387.62,250.9
26.2%2,250.9
239.42053
66,258.266,258.2
86,906.976.2%
74,665.688.7%
34,597
034,597
35,2225,096
12,0184,412
20561,827.0
72.9397.1
2,297.025.9%
2,297.0249.2
205467,893.2
67,893.289,077.2
76.2%76,371.8
88.9%34,597
0
34,59735,369
5,18612,032
4,4222057
1,869.475.0
407.02,351.4
25.6%2,351.4
259.72055
69,603.769,603.7
91,315.176.2%
78,156.789.1%
34,597
034,597
35,4525,274
12,0504,428
20581,916.2
77.3417.3
2,410.825.3%
2,410.8270.8
205671,419.5
71,419.593,626.9
76.3%80,043.7
89.2%34,597
0
34,59735,449
5,35512,074
4,4312059
1,970.079.6
428.22,477.8
25.1%2,477.8
282.42057
73,358.473,358.4
96,052.476.4%
82,049.889.4%
34,597
034,597
35,4025,437
12,1024,433
20602,025.1
82.0439.8
2,547.024.8%
2,547.0294.4
205875,435.4
75,435.498,567.2
76.5%84,185.8
89.6%34,597
0
34,59735,326
5,51612,137
4,432
Assumptions:
‐ Projections are based on June 30, 2008 data and assumptions
‐ Projections have been adjusted to reflect known asset, liability, and population adjustm
ents through June 30, 2010‐ Population is assum
ed to remain fixed after June 30, 2010 (i.e., new
hires replace all terminations
‐ New
plans have been reflected for expected new entrants (Tier 3 PO
LICE)‐ N
ew entrant populations are assum
ed to have the same characteristics as the population that entered the plan during FY 2008
‐ Investment returns are assum
ed to be 8% per year in the future, producing no future gains or losses in the sm
oothing method
‐ Administrative expenses are expected to increase 3%
over prior year (does not apply to FIRE)‐ Investm
ent expenses are assumed to be a fixed percent of assets ranging from
0.4% to 0.6%
depending on the System‐ The N
et City Contribution is assumed to be 100%
of the Total Pension Fund Contribution
POLICE Pension Fund Projections
Baseline Using 8.00%
Interest and Static Employee Population
($ in millions)24
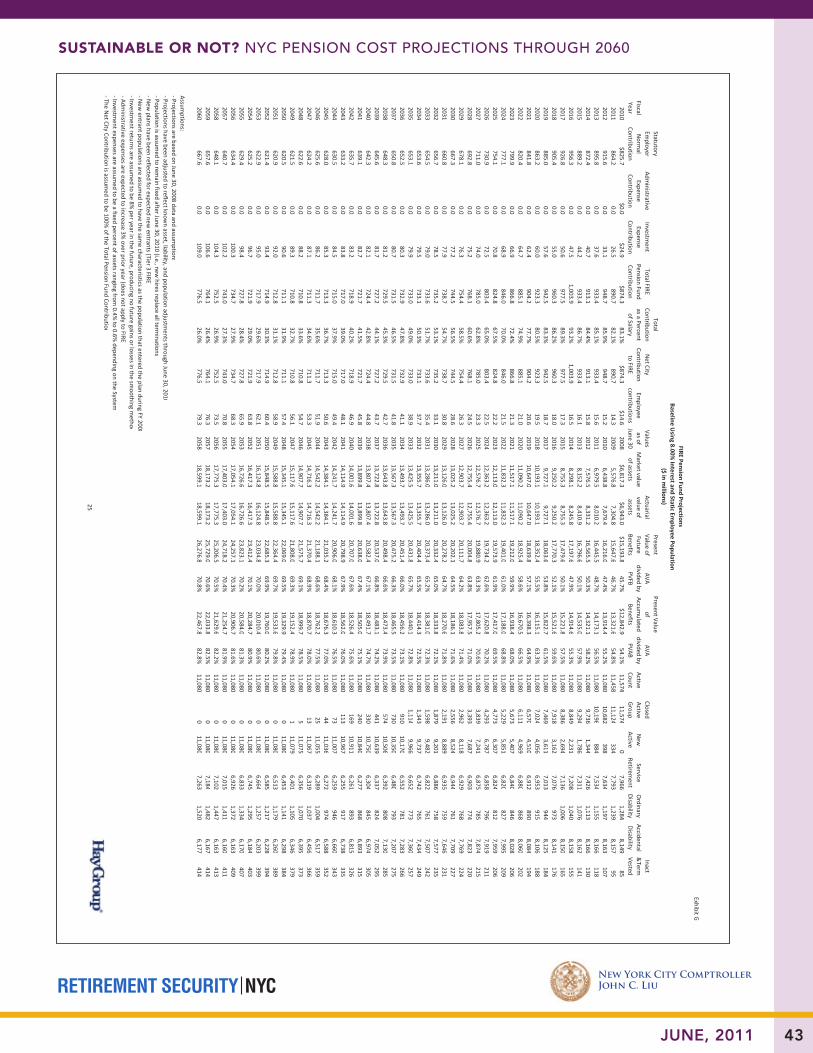
RETIREMENT SECURITY NYC
SUStaiNablE or Not? NYC PeNsioN Cost ProjeCtioNs through 2060
New York City ComptrollerJohn C. Liu
43JUNE, 2011
Exhibit G
Fiscal Year
Statutory Em
ployer Norm
al Contribution
Administrative
Expense Contribution
Investment
Expense Contribution
Total FIRE Pension Fund Contribution
Total Contribution as a Percent of Salary
Net City
Contribution to FIRE
Employee
contributions
Values as of
June 30Market value of assets
Actuarial value of assets
Present Value of Future Benefits
AVA divided by
PVFB
Present Value of
Accumulated
Benefits
AVA divided by PVAB
Active Count
Closed Active Group
New
Active
Service Retirem
entOrdinary
DisabilityAccidental Disability
Inact &Term
Vested
2010$825.7
$0.0$24.9
$874.383.1%
$874.3$14.6
2008$6,817.3
$6,943.0$15,193.8
45.7%$12,842.9
54.1%11,574
11,574
07,966
1,2848,149
852011
864.20.0
26.5890.7
82.1%890.7
14.32009
5,576.87,304.8
15,647.646.7%
13,321.654.8%
11,458
11,124334
7,7931,239
8,15795
2012915.6
0.033.1
948.785.9%
948.715.2
20106,438.8
7,679.416,216.0
47.4%13,914.4
55.2%11,080
10,682
3987,634
1,1978,163
1072013
895.80.0
37.6933.4
85.1%933.4
15.62011
6,979.58,010.2
16,445.548.7%
14,173.156.5%
11,080
10,196884
7,5341,155
8,166118
2014872.4
0.040.7
913.184.4%
913.115.8
20127,576.5
8,331.216,565.5
50.3%14,321.1
58.2%11,080
9,736
1,3447,426
1,1138,166
1302015
889.20.0
44.2933.4
86.7%933.4
16.12013
8,152.28,410.9
16,796.650.1%
14,535.057.9%
11,080
9,2941,786
7,3111,076
8,162141
2016956.3
0.047.5
1,003.993.2%
1,003.916.5
20148,298.1
8,245.817,197.6
47.9%14,914.6
55.3%11,080
8,849
2,2317,208
1,0408,158
1552017
926.80.0
50.6977.5
89.3%977.5
17.32015
8,755.38,755.3
17,479.650.1%
15,221.857.5%
11,080
8,3862,694
7,1361,006
8,150165
2018905.4
0.055.0
960.386.2%
960.318.0
20169,250.2
9,250.217,770.3
52.1%15,521.6
59.6%11,080
7,918
3,1627,076
9738,141
1762019
885.00.0
57.6942.5
83.3%942.5
18.72017
9,727.19,727.1
18,063.653.8%
15,822.761.5%
11,080
7,4693,611
7,013944
8,125184
2020863.2
0.060.0
923.380.5%
923.319.5
201810,193.1
10,193.118,352.4
55.5%16,115.1
63.3%11,080
7,024
4,0566,953
9158,106
1882021
841.80.0
62.4904.2
77.7%904.2
20.62019
10,647.010,647.0
18,639.857.1%
16,398.364.9%
11,080
6,5704,510
6,912890
8,084194
2022820.4
0.064.7
885.174.9%
885.121.0
202011,090.2
11,090.218,925.4
58.6%16,670.5
66.5%11,080
6,111
4,9696,880
8688,060
2022023
799.90.0
66.9866.8
72.4%866.8
21.32021
11,517.111,517.1
19,212.059.9%
16,938.468.0%
11,080
5,6735,407
6,840846
8,028206
2024777.1
0.068.9
846.070.0%
846.021.5
202211,832.3
11,832.319,401.0
61.0%17,188.0
68.8%11,080
5,229
5,8516,820
8277,995
2092025
754.10.0
70.8824.8
67.5%824.8
22.22023
12,113.012,113.0
19,573.961.9%
17,417.069.5%
11,080
4,7736,307
6,824812
7,959206
2026730.9
0.072.5
803.465.0%
803.422.5
202412,363.2
12,363.219,734.2
62.6%17,620.8
70.2%11,080
4,293
6,7876,858
7967,919
2112027
711.00.0
74.0785.0
62.8%785.0
23.32025
12,576.712,576.7
19,880.963.3%
17,805.270.6%
11,080
3,8397,241
6,875785
7,874215
2028692.8
0.075.2
768.160.6%
768.124.5
202612,755.4
12,755.420,004.8
63.8%17,957.5
71.0%11,080
3,393
7,6876,903
7747,823
2202029
678.10.0
76.3754.4
58.5%754.4
26.32027
12,903.712,903.7
20,111.764.2%
18,083.871.4%
11,080
2,9628,118
6,929768
7,769224
2030667.3
0.077.2
744.556.5%
744.528.6
202813,025.2
13,025.220,202.1
64.5%18,186.1
71.6%11,080
2,556
8,5246,944
7617,709
2272031
660.80.0
77.9738.7
54.7%738.7
30.82029
13,126.013,126.0
20,278.264.7%
18,270.671.8%
11,080
2,1918,889
6,935759
7,646231
2032656.7
0.078.5
735.253.1%
735.233.1
203013,211.0
13,211.020,332.4
65.0%18,333.8
72.1%11,080
1,879
9,2016,886
7587,577
2352033
654.50.0
79.0733.6
51.7%733.6
35.42031
13,286.013,286.0
20,373.465.2%
18,381.072.3%
11,080
1,5989,482
6,822761
7,507242
2034653.6
0.079.5
733.150.3%
733.137.7
203213,355.7
13,355.720,404.4
65.5%18,414.3
72.5%11,080
1,343
9,7376,742
7657,434
2492035
653.10.0
79.9733.0
49.0%733.0
38.92033
13,425.513,425.5
20,431.865.7%
18,440.172.8%
11,080
1,1149,966
6,652773
7,360257
2036652.5
0.080.3
732.947.8%
732.941.1
203413,493.7
13,493.720,451.4
66.0%18,456.2
73.1%11,080
910
10,1706,552
7817,283
2662037
650.80.0
80.7731.5
46.5%731.5
41.82035
13,567.313,567.3
20,475.266.3%
18,465.573.5%
11,080
73010,350
6,480793
7,207275
2038648.3
0.081.2
729.545.3%
729.542.7
203613,643.8
13,643.820,498.4
66.6%18,473.4
73.9%11,080
574
10,5066,392
8087,130
2852039
645.60.0
81.7727.2
44.1%727.2
43.72037
13,722.813,722.8
20,537.066.8%
18,483.174.2%
11,080
44110,639
6,337824
7,052295
2040642.3
0.082.1
724.442.8%
724.444.8
203813,807.4
13,807.420,582.4
67.1%18,491.7
74.7%11,080
330
10,7506,304
8456,974
3052041
639.10.0
82.7721.7
41.5%721.7
45.82039
13,899.813,899.8
20,638.067.4%
18,505.075.1%
11,080
24010,840
6,277868
6,893315
2042635.7
0.083.2
718.940.2%
718.946.9
204014,001.6
14,001.620,707.0
67.6%18,526.4
75.6%11,080
169
10,9116,261
8936,815
3262043
633.20.0
83.8717.0
39.0%717.0
48.12041
14,114.914,114.9
20,798.967.9%
18,562.076.0%
11,080
11310,967
6,255917
6,738335
2044630.5
0.084.5
715.037.9%
715.049.4
204214,241.7
14,241.720,906.0
68.1%18,610.3
76.5%11,080
73
11,0076,259
9466,660
3432045
628.00.0
85.3713.3
36.7%713.3
50.62043
14,384.114,384.1
21,035.268.4%
18,676.377.0%
11,080
4411,036
6,272974
6,588352
2046625.6
0.086.2
711.735.6%
711.751.9
204414,542.2
14,542.221,188.1
68.6%18,762.2
77.5%11,080
25
11,0556,289
1,0046,517
3592047
624.20.0
87.1711.3
34.6%711.3
53.32045
14,716.314,716.3
21,370.468.9%
18,870.778.0%
11,080
1311,067
6,3191,037
6,456366
2048622.6
0.088.2
710.833.6%
710.854.7
204614,907.7
14,907.721,575.7
69.1%18,999.7
78.5%11,080
5
11,0756,356
1,0706,395
3732049
621.50.0
89.3710.8
32.7%710.8
56.12047
15,117. 615,117.6
21,808.069.3%
19,152.478.9%
11,080
111,079
6,4011,105
6,346379
2050620.5
0.090.6
711.131.9%
711.157.4
204815,345.1
15,345.122,069.0
69.5%19,329.9
79.4%11,080
0
11,0806,453
1,1416,298
3842051
620.90.0
92.0712.8
31.1%712.8
58.92049
15,588. 815,588.8
22,364.469.7%
19,533.679.8%
11,080
011,080
6,5131,179
6,260389
2052621.4
0.093.4
714.930.3%
714.960.4
205015,848.5
15,848.522,685.3
69.9%19,760.0
80.2%11,080
0
11,0806,585
1,2176,228
3942053
622.90.0
95.0717.9
29.6%717.9
62.12051
16,124. 816,124.8
23,034.870.0%
20,010.480.6%
11,080
011,080
6,6641,257
6,203399
2054625.2
0.096.7
721.929.0%
721.963.8
205216,417.3
16,417.323,412.4
70.1%20,284.7
80.9%11,080
0
11,0806,745
1,2956,184
4032055
629.40.0
98.4727.8
28.4%727.8
65.92053
16,726. 616,726.6
23,823.170.2%
20,584.081.3%
11,080
011,080
6,8331,334
6,170407
2056634.4
0.0100.3
734.727.9%
734.768.3
205417,054.1
17,054.124,257.1
70.3%20,906.7
81.6%11,080
0
11,0806,926
1,3726,163
4092057
640.70.0
102.2743.0
27.3%743.0
70.82055
17,403.017,403.0
24,718.270.4%
21,254.781.9%
11,080
011,080
7,0151,411
6,160411
2058648.1
0.0104.3
752.526.9%
752.573.5
205617,775.3
17,775.325,206.5
70.5%21,629.6
82.2%11,080
0
11,0807,102
1,4476,163
4132059
657.60.0
106.6764.1
26.4%764.1
76.32057
18,173.218,173.2
25,729.070.6%
22,033.882.5%
11,080
011,080
7,1841,482
6,167414
2060667.6
0.0109.0
776.526.0%
776.579.3
205818,599.1
18,599.126,276.8
70.8%22,467.8
82.8%11,080
0
11,0807,263
1,5206,177
414
Assumptions:
‐ Projections are based on June 30, 2008 data and assumption s
‐ Projections have been adjusted to reflect known asset, liability, and population adjustm
ents through June 30, 2010‐ Population is assum
ed to remain fixed after June 30, 2010 (i.e., new
hires replace all terminations
‐ New
plans have been reflected for expected new entrants (Tier 3 FIRE)
‐ New
entrant populations are assumed to have the sam
e characteristics as the population that entered the plan during FY 2008‐ Investm
ent returns are assumed to be 8%
per year in the future, producing no future gains or losses in the smoothing m
ethod‐ Adm
inistrative expenses are expected to increase 3% over prior year (does not apply to FIRE)
‐ Investment expenses are assum
ed to be a fixed percent of assets ranging from 0.4%
to 0.6% depending on the System
‐ The Net City Contribution is assum
ed to be 100% of the Total Pension Fund Contribution
FIRE Pension Fund ProjectionsBaseline U
sing 8.00% Interest and Static Em
ployee Population($ in m
illions)25
RETIREMENT SECURITY NYC
SUStaiNablE or Not? NYC PeNsioN Cost ProjeCtioNs through 2060
New York City ComptrollerJohn C. Liu
44 JUNE, 2011
I:/benefits/client/nyc/hay group 50 year projection methodology 052711.doc May 27, 2011 26
Exhibit H: Projection Results - Scenario 2
Increasing workforce assumption – by ¼% per year from FY 2014, and 8.0% discount rate
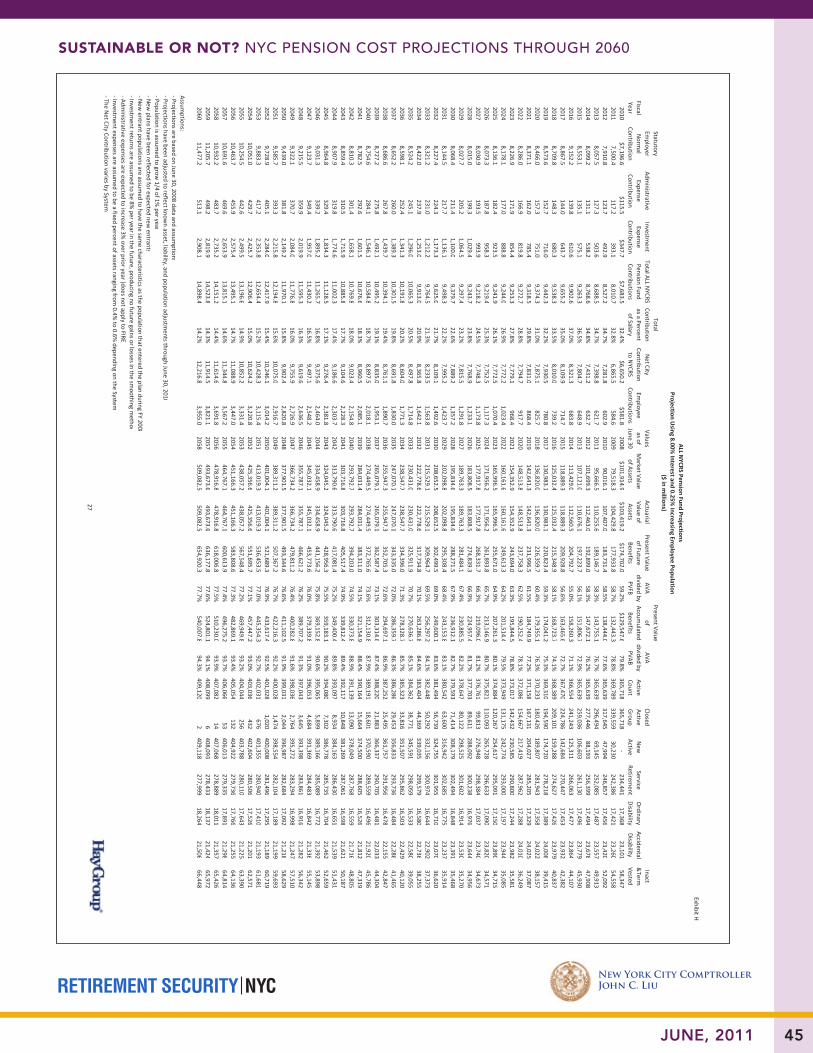
RETIREMENT SECURITY NYC
SUStaiNablE or Not? NYC PeNsioN Cost ProjeCtioNs through 2060
New York City ComptrollerJohn C. Liu
45JUNE, 2011
Exhibit H
Fiscal Year
Statutory Em
ployer Norm
al Contribution
Administrative
Expense Contribution
Investment
Expense Contribution
Total ALL NYCRS
Pension Fund Contributions
Total Contribution as a Percent of Salary
Net City
Contribution to N
YCRSEm
ployee Contributions
Values as of
June 30Market Value of Assets
Actuarial Value of Assets
Present Value of Future Benefits
AVA divided by
PVFB
Present Value of
Accumulated
Benefits
AVA divided by PVAB
Active Count
Closed Active Group
New
Active
Service Retirem
entOrdinary
DisabilityAccidental Disability
Inact &Term
Vested
2010$7,196.6
$115.5$347.7
$7,683.532.4%
$6,650.2$581.8
2008$101,914.9
$103,419.2$174,702.0
59.2%$129,547.6
79.8%365,718
365,718‐
234,441
17,368
23,101
58,347
2011
7,500.4117.2
393.18,010.7
32.8%6,865.5
584.62009
79,518.3104,429.8
177,933.858.7%
132,443.378.8%
369,789339,559
30,230
242,386
17,421
23,260
54,558
20127,910.8
123.7492.9
8,527.234.7%
7,281.8602.9
201090,016.1
107,407.0183,731.4
58.5%138,444.0
77.6%365,639
317,64547,994
246,857
17,456
23,420
52,092
2013
8,057.5127.3
503.68,688.5
34.7%7,398.8
621.72011
95,666.5110,255.6
189,146.758.3%
143,755.176.7%
365,639296,494
69,145
252,085
17,487
23,557
49,913
20148,099.2
131.1538.2
8,768.634.8%
7,431.2632.7
2012101,699.3
112,463.0192,899.0
58.3%147,672.1
76.2%365,639
277,44688,193
256,399
17,494
23,678
47,908
2015
8,553.1135.1
575.19,263.3
36.5%7,804.7
648.92013
107,121.0110,676.1
197,223.756.1%
151,806.772.9%
365,639259,036
106,603261,130
17,496
23,779
45,930
2016
9,152.2139.8
610.69,902.6
37.0%8,321.3
683.82014
113,429.0112,560.5
204,792.755.0%
158,260.371.1%
366,554241,243
125,311266,063
17,477
23,864
44,107
2017
8,867.5144.0
643.79,655.2
35.0%8,109.9
714.72015
118,889.3118,889.3
209,928.856.6%
163,465.672.7%
367,470224,786
142,684270,447
17,453
23,932
42,382
2018
8,709.8148.3
680.39,538.3
33.5%8,010.0
739.22016
125,032.4125,032.4
215,348.958.1%
168,723.774.1%
368,389209,101
159,288274,627
17,426
23,979
40,837
2019
8,573.6152.7
716.09,442.3
32.2%7,930.5
780.82017
130,983.1130,983.1
220,823.459.3%
174,041.275.3%
369,310194,590
174,720278,218
17,389
24,008
39,415
2020
8,466.0157.3
751.09,374.3
31.0%7,875.1
825.72018
136,820.0136,820.0
226,359.760.4%
179,355.176.3%
370,233180,426
189,807281,943
17,358
24,022
38,157
2021
8,371.1162.0
785.49,318.5
29.8%7,831.0
868.42019
142,641.3142,641.3
231,996.561.5%
184,749.977.2%
371,158167,131
204,027285,205
17,329
24,025
37,087
2022
8,286.0166.9
819.89,272.7
28.8%7,794.7
917.72020
148,513.8148,513.8
237,758.362.5%
190,252.478.1%
372,086154,667
217,419287,962
17,288
24,010
36,249
2023
8,226.9171.9
854.49,253.3
27.8%7,779.1
968.42021
154,352.9154,352.9
243,694.063.3%
195,844.578.8%
373,017142,432
230,585290,800
17,244
23,982
35,581
2024
8,178.1177.0
888.89,244.0
26.9%7,772.2
1,023.42022
160,161.6160,161.6
249,613.364.2%
201,514.479.5%
373,949131,175
242,774293,000
17,197
23,944
35,085
2025
8,136.1182.4
923.59,241.9
26.1%7,772.5
1,070.42023
165,996.5165,996.5
255,671.064.9%
207,261.380.1%
374,884120,267
254,617295,091
17,150
23,890
34,715
2026
8,073.3187.8
958.39,219.4
25.3%7,752.5
1,117.32024
171,956.2171,956.2
261,893.865.7%
213,146.980.7%
375,821110,093
265,728296,633
17,090
23,820
34,571
2027
8,030.9193.5
993.99,218.2
24.5%7,748.3
1,173.82025
177,917.8177,917.8
268,331.766.3%
219,096.081.2%
376,76199,813
276,948
298,384
17,037
23,740
34,673
20288,015.0
199.31,029.4
9,243.723.8%
7,768.91,233.1
2026183,808.5
183,808.5274,839.3
66.9%224,957.4
81.7%377,703
89,611
288,092300,238
16,976
23,644
34,956
2029
8,027.7205.2
1,064.59,297.4
23.2%7,815.5
1,291.82027
189,763.3189,763.3
281,484.167.4%
230,885.582.2%
378,64780,122
298,525
301,602
16,914
23,530
35,270
20308,068.4
211.41,100.0
9,379.722.6%
7,889.21,357.2
2028195,834.6
195,834.6288,271.5
67.9%236,912.1
82.7%379,593
71,414
308,179302,494
16,848
23,391
35,468
2031
8,144.5217.7
1,136.19,498.3
22.2%7,995.2
1,423.72029
202,098.8202,098.8
295,308.468.4%
243,153.883.1%
380,54263,600
316,942
302,685
16,775
23,237
35,914
20328,227.4
224.31,173.3
9,625.021.7%
8,109.11,492.6
2030208,652.5
208,652.5302,499.5
69.0%249,600.1
83.6%381,494
56,739
324,755301,955
16,710
23,070
36,620
2033
8,321.2231.0
1,212.29,764.5
21.3%8,233.5
1,563.82031
215,529.1215,529.1
309,964.769.5%
256,297.284.1%
382,44850,292
332,156
300,974
16,644
22,902
37,373
20348,422.0
237.91,253.0
9,913.020.9%
8,365.81,642.1
2032222,778.6
222,778.6317,734.8
70.1%263,286.8
84.6%383,404
44,369
339,035299,579
16,580
22,736
38,255
2035
8,524.2245.1
1,296.010,065.3
20.5%8,497.8
1,714.82033
230,431.0230,431.0
325,911.970.7%
270,636.785.1%
384,36238,771
345,591
298,059
16,533
22,580
39,055
20368,598.1
252.41,341.3
10,191.820.2%
8,604.01,771.3
2034238,547.7
238,547.7334,396.0
71.3%278,328.7
85.7%385,323
33,816
351,507295,862
16,503
22,429
40,120
2037
8,652.2260.0
1,389.310,301.5
19.8%8,691.8
1,830.02035
247,070.1247,070.1
343,335.072.0%
286,359.786.3%
386,28629,453
356,833
293,736
16,484
22,286
41,465
20388,686.6
267.81,439.7
10,394.119.4%
8,761.11,890.7
2036255,947.3
255,947.3352,705.3
72.6%294,697.1
86.9%387,252
25,495
361,757291,956
16,478
22,155
42,847
2039
8,727.2275.8
1,492.110,495.2
19.1%8,835.0
1,953.12037
265,079.1265,079.1
362,587.473.1%
303,314.687.4%
388,22021,883
366,337
290,705
16,481
22,033
44,304
20408,754.6
284.11,546.1
10,584.818.7%
8,897.52,018.1
2038274,449.5
274,449.5372,765.6
73.6%312,130.8
87.9%389,191
18,601
370,590289,559
16,496
21,920
45,786
2041
8,782.5292.6
1,601.510,676.6
18.3%8,960.5
2,085.12039
284,031.4284,031.4
383,311.074.1%
321,154.988.4%
390,16415,664
374,500
288,605
16,526
21,812
47,319
20428,810.3
301.41,658.1
10,769.818.0%
9,023.42,154.8
2040293,792.7
293,792.7394,203.0
74.5%330,373.8
88.9%391,139
13,090
378,049287,768
16,559
21,716
48,805
2043
8,859.4310.5
1,715.910,885.8
17.7%9,104.6
2,228.32041
303,716.8303,716.8
405,517.474.9%
339,812.489.4%
392,11710,848
381,269
287,061
16,598
21,621
50,187
20448,907.9
319.81,774.6
11,002.317.4%
9,186.62,303.7
2042313,790.6
313,790.6417,081.4
75.2%349,400.4
89.8%393,097
8,934
384,163286,430
16,651
21,539
51,431
2045
8,964.8329.4
1,834.311,128.5
17.1%9,276.4
2,381.82043
324,045.2324,045.2
428,956.375.5%
359,183.190.2%
394,0807,302
386,778
285,735
16,704
21,462
52,659
20469,031.3
339.21,895.2
11,265.716.8%
9,375.62,464.0
2044334,458.9
334,458.9441,156.2
75.8%369,152.8
90.6%395,065
5,899
389,166285,089
16,772
21,392
53,898
2047
9,123.7349.4
1,957.011,430.2
16.5%9,497.1
2,548.22045
345,032.1345,032.1
453,773.676.0%
379,339.891.0%
396,0534,684
391,369
284,483
16,842
21,336
55,145
20489,215.5
359.92,019.9
11,595.316.3%
9,619.62,636.5
2046355,787.1
355,787.1466,621.2
76.2%389,707.2
91.3%397,043
3,645
393,398283,861
16,916
21,282
56,342
2049
9,322.1370.7
2,084. 011,776.8
16.0%9,755.9
2,726.92047
366,734.2366,734.2
479,811.276.4%
400,282.891.6%
398,0362,764
395,272
283,294
16,998
21,247
57,510
20509,439.0
381.82,149.2
11,970.115.8%
9,902.42,820.8
2048377,901.5
377,901.5493,344.6
76.6%411,102.5
91.9%399,031
2,044
396,987282,684
17,092
21,218
58,629
2051
9,585.7393.3
2,215.812,194. 8
15.6%10,075.0
2,916.72049
389,311.2389,311.2
507,367.276.7%
422,216.392.2%
400,0281,474
398,554
282,104
17,189
21,199
59,693
20529,728.9
405.12,284.0
12,417.915.4%
10,246.13,014.2
2050401,004.1
401,004.1521,689.3
76.9%433,617.4
92.5%401,028
1,020
400,008281,496
17,295
21,189
60,719
2053
9,883.3417.2
2,353.812,654. 4
15.2%10,428.3
3,115.42051
413,019.3413,019.3
536,453.577.0%
445,354.392.7%
402,031676
401,355
280,940
17,410
21,193
61,681
205410,051.0
429.72,425.7
12,906.415.0%
10,624.23,220.8
2052425,356.6
425,356.6551,695.7
77.1%457,447.2
93.0%403,036
432
402,604280,506
17,526
21,201
62,571
2055
10,254.5442.6
2,499.513,196. 6
14.9%10,852.2
3,331.42053
438,057.2438,057.2
567,548.477.2%
469,949.893.2%
404,044256
403,788
280,110
17,643
21,225
63,390
205610,463.7
455.92,575.4
13,495.114.7%
11,088.93,447.0
2054451,166.3
451,166.3583,808.6
77.3%482,869.1
93.4%405,054
132
404,922279,736
17,766
21,255
64,136
2057
10,691.6469.6
2,653.913,815.1
14.6%11,344.8
3,567.22055
464,767.1464,767.1
600,613.977.4%
496,275.293.7%
406,06653
406,013
279,335
17,891
21,298
64,814
205810,932.2
483.72,735.2
14,151.214.4%
11,614.63,691.8
2056478,916.8
478,916.8618,006.8
77.5%510,230.0
93.9%407,082
14
407,068278,889
18,011
21,357
65,426
2059
11,205.7498.2
2,819.914,523.8
14.3%11,914.5
3,821.12057
493,673.6493,673.6
636,177.877.6%
524,801.194.1%
408,0996
408,093
278,433
18,137
21,424
65,972
206011,477.2
513.12,908.1
14,898.414.2%
12,216.83,955.0
2058509,082.5
509,082.5654,920.3
77.7%540,007.8
94.3%409,120
2
409,118277,999
18,264
21,506
66,448
Assumptions:
‐ Projections are based on June 30, 2008 data and assumption s
‐ Projections have been adjusted to reflect known asset, liability, and population adjustm
ents through June 30, 2010‐ Population is assum
ed to grow 1/4 of 1%
per year‐ N
ew plans have been reflected for expected new
entrants‐ N
ew entrant populations are assum
ed to have the same characteristics as the population that entered the plan during FY 2008
‐ Investment returns are assum
ed to be 8% per year in the future, producing no future gains or losses in the sm
oothing method
‐ Administrative expenses are expected to increase 3%
over prior year (does not apply to FIRE)‐ Investm
ent expenses are assumed to be a fixed percent of assets ranging from
0.4% to 0.6%
depending on the System‐ The N
et City Contribution varies by System
ALL NYCRS Pension Fund Projections
Projection Using 8.00%
Interest and 0.25% Increasing Em
ployee Population($ in m
illions)
27

RETIREMENT SECURITY NYC
SUStaiNablE or Not? NYC PeNsioN Cost ProjeCtioNs through 2060
New York City ComptrollerJohn C. Liu
46 JUNE, 2011
Exhibit H
Fiscal Year
Statutory Em
ployer Norm
al Contribution
Administrative
Expense Contribution
Investment
Expense Contribution
Total NYCERS
Pension Fund Contribution
Total Contribution as a Percent of Salary
Net City
Contribution to N
YCERSEm
ployee contributions
Values as of
June 30Market value of assets
Actuarial value of assets
Present Value of Future Benefits
AVA divided by
PVFB
Present Value of
Accumulated
Benefits
AVA divided by PVAB
Active Count
Closed Active Group
New
Active
Service Retirem
entOrdinary
DisabilityAccidental Disability
Inact &Term
Vested
2010$2,012.0
$51.2$134.5
$2,197.720.6%
$1,205.6$310.8
2008$39,716.8
$40,771.6$60,264.2
67.7%$42,940.1
94.9%183,607
183,6070
117,6739,076
3,69933,029
20112,172.8
53.2161.1
2,387.221.1%
1,293.0318.3
200931,903.4
41,710.262,607.0
66.6%45,223.6
92.2%186,288
169,00117,287
121,6949,191
3,66530,917
20122,327.9
55.1204.4
2,587.422.6%
1,403.3330.9
201035,407.9
42,556.464,689.5
65.8%47,462.8
89.7%184,982
156,68228,300
124,2309,295
3,64229,158
20132,416.8
56.8206.4
2,679.922.8%
1,452.9345.6
201137,737.4
43,664.767,020.0
65.2%49,793.9
87.7%184,982
145,03539,947
126,9729,388
3,60827,557
20142,493.5
58.5220.1
2,772.023.2%
1,499.5359.4
201240,224.5
44,591.768,885.5
64.7%51,787.0
86.1%184,982
134,79050,192
128,9989,466
3,57726,022
20152,721.0
60.2234.6
3,015.824.8%
1,626.6373.5
201342,104.0
43,654.071,101.5
61.4%54,028.0
80.8%184,982
125,08459,898
131,0929,529
3,53824,496
20163,077.1
62.0248.9
3,388.127.0%
1,858.7386.2
201444,338.0
44,100.273,351.3
60.1%56,261.9
78.4%185,444
115,73069,714
133,2619,575
3,50423,129
20172,982.9
63.9262.9
3,309.725.5%
1,815.7406.4
201546,824.3
46,824.375,661.6
61.9%58,548.5
80.0%185,908
107,07578,833
135,2339,609
3,46821,852
20182,924.7
65.8281.2
3,271.724.5%
1,794.8422.2
201649,575.2
49,575.278,037.1
63.5%60,878.0
81.4%186,373
98,80487,569
137,2079,642
3,43020,734
20192,869.1
67.8297.8
3,234.623.5%
1,774.5442.1
201752,249.8
52,249.880,393.5
65.0%63,181.2
82.7%186,839
91,12595,714
138,9659,657
3,39319,783
20202,821.9
69.8314.3
3,206.022.5%
1,758.8460.0
201854,899.9
54,899.982,800.0
66.3%65,499.8
83.8%187,306
83,606103,700
140,9209,673
3,35418,991
20212,776.3
71.9330.9
3,179.121.7%
1,744.0476.6
201957,561.9
57,561.985,258.6
67.5%67,856.5
84.8%187,774
76,585111,189
142,6849,680
3,32118,379
20222,735.0
74.1347.6
3,156.720.9%
1,731.8497.6
202060,232.0
60,232.087,772.5
68.6%70,237.2
85.8%188,244
69,888118,356
144,3999,673
3,28317,953
20232,705.9
76.3364.4
3,146.520.2%
1,726.2521.6
202162,891.8
62,891.890,354.9
69.6%72,646.2
86.6%188,714
63,411125,303
146,1709,657
3,24717,690
20242,680.1
78.6381.1
3,139.819.5%
1,722.5546.6
202265,557.9
65,557.992,956.5
70.5%75,065.9
87.3%189,186
57,479131,707
147,6719,632
3,21217,581
20252,654.0
80.9397.9
3,132.918.9%
1,718.7564.8
202368,247.7
68,247.795,610.2
71.4%77,516.2
88.0%189,659
51,922137,737
149,0009,596
3,17617,595
20262,627.1
83.4415.0
3,125.418.3%
1,714.6584.9
202470,968.3
70,968.398,322.1
72.2%79,994.4
88.7%190,133
46,718143,415
150,1379,549
3,13917,793
20272,612.0
85.9432.2
3,130.117.8%
1,717.2608.8
202573,673.5
73,673.5101,114.2
72.9%82,476.7
89.3%190,608
41,433149,175
151,4989,498
3,10518,151
20282,600.9
88.4449.3
3,138.717.3%
1,721.9633.3
202676,363.6
76,363.6103,918.9
73.5%84,934.6
89.9%191,085
36,481154,604
152,6829,437
3,07318,613
20292,595.1
91.1466.4
3,152.616.8%
1,729.5655.2
202779,062.9
79,062.9106,761.1
74.1%87,397.5
90.5%191,563
31,923159,640
153,6039,368
3,04219,164
20302,592.1
93.8483.6
3,169.616.4%
1,738.8678.2
202881,780.2
81,780.2109,643.0
74.6%89,874.6
91.0%192,042
27,780164,262
154,2499,296
3,00819,737
20312,597.4
96.6501.0
3,195.016.0%
1,752.8700.9
202984,518.6
84,518.6112,609.7
75.1%92,390.5
91.5%192,522
24,120168,402
154,7089,212
2,98020,433
20322,603.0
99.5518.5
3,221.015.6%
1,767.1724.1
203087,296.2
87,296.2115,619.8
75.5%94,931.5
92.0%193,003
20,880172,123
154,8769,132
2,94821,246
20332,613.1
102.5536.3
3,251.915.3%
1,784.0748.1
203190,114.5
90,114.5118,707.6
75.9%97,507.0
92.4%193,485
17,849175,636
154,9429,045
2,91822,131
20342,625.6
105.6554.4
3,285.515.0%
1,802.4773.0
203292,991.3
92,991.3121,881.0
76.3%100,137.3
92.9%193,969
15,146178,823
154,7818,951
2,88823,111
20352,645.9
108.8572.8
3,327.514.7%
1,825.4798.2
203395,928.2
95,928.2125,177.3
76.6%102,838.8
93.3%194,454
12,640181,814
154,5398,861
2,86124,101
20362,666.4
112.0591.6
3,370.114.4%
1,848.8822.4
203498,943.4
98,943.4128,558.4
77.0%105,607.5
93.7%194,940
10,532184,408
154,0738,773
2,83425,097
20372,690.3
115.4611.0
3,416.614.2%
1,874.4848.6
2035102,049.7
102,049.7132,058.4
77.3%108,465.1
94.1%195,428
8,801186,627
153,4498,684
2,80526,198
20382,716.8
118.8630.9
3,466.513.9%
1,901.7874.7
2036105,250.7
105,250.7135,686.6
77.6%111,419.6
94.5%195,916
7,310188,606
152,7108,597
2,77927,352
20392,751.4
122.4651.4
3,525.113.7%
1,933.9902.0
2037108,555.1
108,555.1139,481.1
77.8%114,492.0
94.8%196,406
6,031190,375
151,8818,511
2,75528,603
20402,784.8
126.1672.5
3,583.413.5%
1,965.8930.0
2038111,971.2
111,971.2143,395.0
78.1%117,669.8
95.2%196,897
4,948191,949
150,9678,426
2,73029,894
20412,821.5
129.9694.4
3,645.713.3%
2,000.0959.4
2039115,510.8
115,510.8147,464.5
78.3%120,970.5
95.5%197,389
4,022193,367
149,9918,347
2,70631,262
20422,860.8
133.8717.0
3,711.513.1%
2,036.1989.8
2040119,175.8
119,175.8151,697.3
78.6%124,401.2
95.8%197,883
3,238194,645
148,9798,270
2,68432,682
20432,908.5
137.8740.4
3,786.713.0%
2,077.41,021.5
2041122,971.2
122,971.2156,132.7
78.8%127,977.2
96.1%198,377
2,577195,800
147,9598,199
2,65934,102
20442,955.0
141.9764.6
3,861.612.8%
2,118.51,054.3
2042126,905.3
126,905.3160,715.2
79.0%131,689.3
96.4%198,873
2,031196,842
146,9248,133
2,64035,481
20453,004.7
146.2789.7
3,940.612.7%
2,161.81,088.0
2043130,992.4
130,992.4165,484.0
79.2%135,555.3
96.6%199,371
1,593197,778
145,8788,066
2,61736,837
20463,056.7
150.5815.8
4,023.012.5%
2,207.01,122.9
2044135,229.8
135,229.8170,444.3
79.3%139,577.1
96.9%199,869
1,236198,633
144,8608,009
2,59438,186
20473,117.9
155.1842.8
4,115.712.4%
2,257.91,159.2
2045139,620.4
139,620.4175,637.4
79.5%143,766.3
97.1%200,369
945199,424
143,8777,954
2,57339,535
20483,177.4
159.7870.7
4,207.812.3%
2,308.41,196.8
2046144,166.7
144,166.7180,996.9
79.7%148,111.5
97.3%200,870
713200,157
142,9527,901
2,55040,821
20493,241.2
164.5899.6
4,305.312.2%
2,361.91,235.8
2047148,880.0
148,880.0186,560.7
79.8%152,624.7
97.5%201,372
530200,842
142,0727,850
2,53242,069
20503,307. 0
169.4929.6
4,406.012.1%
2,417.11,276.2
2048153,760.3
153,760.3192,335.5
79.9%157,310.7
97.7%201,875
387201,488
141,2457,808
2,51343,254
20513,383.1
174.5960.6
4,518.212.0%
2,478.71,317.8
2049158,812.5
158,812.5198,366.7
80.1%162,180.1
97.9%202,380
276202,104
140,4827,770
2,49344,387
20523,457.7
179.8992.7
4,630.211.9%
2,540.11,360.8
2050164,039.7
164,039.7204,580.0
80.2%167,226.1
98.1%202,886
193202,693
139,7847,738
2,47345,473
20533,535.7
185.11,025.9
4,746.711.8%
2,604.11,405.3
2051169,453.9
169,453.9211,019.7
80.3%172,458.9
98.3%203,393
132203,261
139,1577,709
2,45646,501
20543,616.5
190.71,060.3
4,867.411.8%
2,670.31,451.4
2052175,054.6
175,054.6217,691.2
80.4%177,882.8
98.4%203,901
89203,812
138,6097,684
2,43547,463
20553,708.7
196.41,095.8
5,001.011.7%
2,743.51,498.9
2053180,846.4
180,846.4224,647.2
80.5%183,506.7
98.6%204,411
56204,355
138,1267,664
2,41948,366
20563,798.4
202.31,132.6
5,133.411.6%
2,816.21,547.8
2054186,832.4
186,832.4231,801.8
80.6%189,327.0
98.7%204,922
33204,889
137,7187,649
2,40249,210
20573,892.0
208.41,170.6
5,270.911.6%
2,891.61,598.3
2055193,026.1
193,026.1239,204.2
80.7%195,352.5
98.8%205,435
18205,417
137,3887,636
2,38849,995
20583,988.5
214.61,209.9
5,413.011.5%
2,969.61,650.5
2056199,426.2
199,426.2246,860.5
80.8%201,588.3
98.9%205,948
9205,939
137,1267,627
2,37750,726
20594,097.5
221.11,250.5
5,569.111.5%
3,055.21,704.4
2057206,037.7
206,037.7254,830.8
80.9%208,041.9
99.0%206,463
4206,459
136,9347,621
2,36751,401
20604,204.0
227.71,292.4
5,724.111.4%
3,140.21,760.1
2058212,865.3
212,865.3263,019.2
80.9%214,713.9
99.1%206,979
2206,977
136,8077,616
2,36052,027
Assumptions:
‐ Projections are based on June 30, 2008 data and assumptions
‐ Projections have been adjusted to reflect known asset, liability, and population adjustm
ents through June 30, 2010‐ Population is assum
ed to grow 1/4 of 1%
per year‐ N
ew plans have been reflected for expected new
entrants‐ N
ew entrant populations are assum
ed to have the same characteristics as the population that entered the plan during FY 2008
‐ Investment returns are assum
ed to be 8% per year in the future, producing no future gains or losses in the sm
oothing method
‐ Administrative expenses are expected to increase 3%
over prior year (does not apply to FIRE)‐ Investm
ent expenses are assumed to be a fixed percent of assets ranging from
0.4% to 0.6%
depending on the System‐ The N
et City Contribution is assumed to be 54.86%
of the Total Pension Fund Contribution
NYCERS Pension Fund Projections
Projection Using 8.00%
Interest and 0.25% Increasing Em
ployee Population($ in m
illions)28
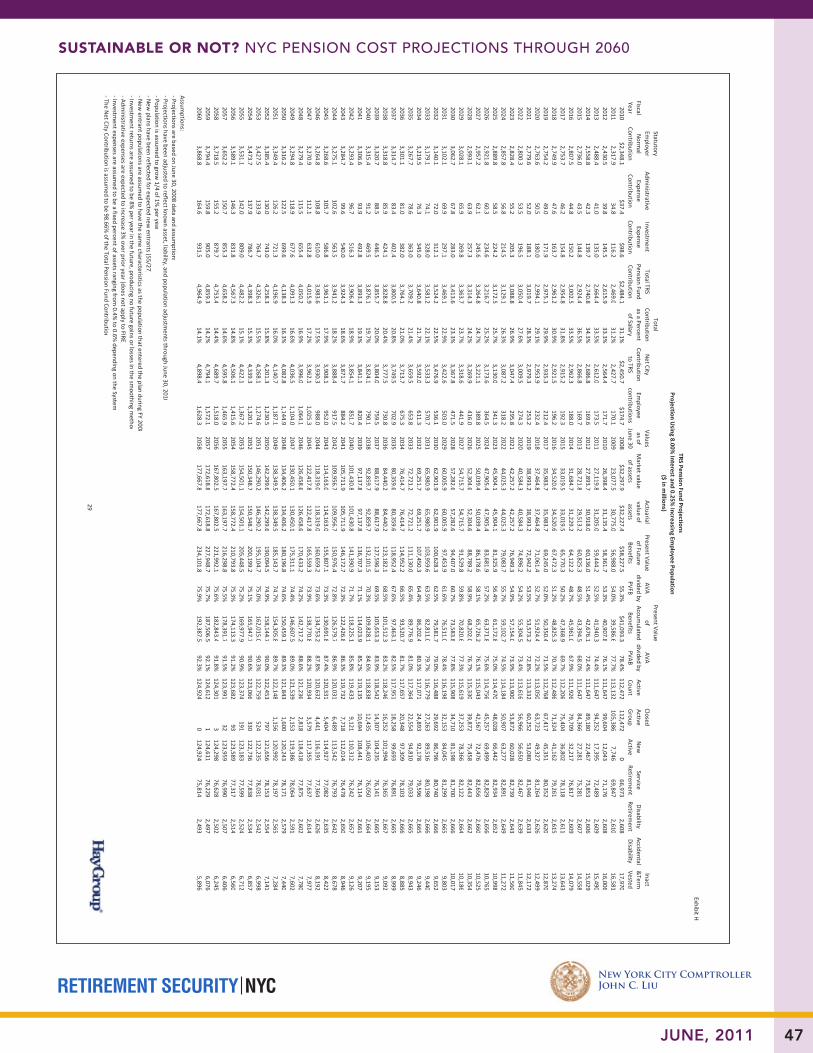
RETIREMENT SECURITY NYC
SUStaiNablE or Not? NYC PeNsioN Cost ProjeCtioNs through 2060
New York City ComptrollerJohn C. Liu
47JUNE, 2011
Exhibit H
Fiscal Year
Statutory Em
ployer Norm
al Contribution
Administrative
Expense Contribution
Investment
Expense Contribution
Total TRS Pension Fund Contribution
Total Contribution as a Percent of Salary
Net City
Contribution to TRS
Employee
contributions
Values as of
June 30Market value of assets
Actuarial value of assets
Present Value of Future Benefits
AVA divided by
PVFB
Present Value of
Accumulated
Benefits
AVA divided by PVAB
Active Count
Closed Active Group
New
Active
Service Retirem
entDisability Retirem
entAccidental Disability
Inact &Term
Vested
2010$2,348.1
$37.4$98.6
$2,484.131.1%
$2,450.7$174.7
2008$32,297.9
$32,227.4$58,227.5
55.3%$41,093.3
78.4%112,472
112,4720
66,9732,608
17,9702011
2,317.934.8
116.22,469.0
31.2%2,427.7
170.12009
23,077.530,775.0
56,988.054.0%
39,586.677.7%
113,132105,386
7,74669,847
2,61016,581
20122,430.5
39.8145.5
2,615.933.3%
2,564.4171.7
201026,398.4
31,135.458,361.7
53.3%40,907.8
76.1%111,647
99,60412,043
71,1762,608
16,0062013
2,488.441.0
135.02,664.4
33.5%2,612.0
173.52011
27,119.831,205.0
59,444.252.5%
41,940.374.4%
111,64794,252
17,39572,489
2,60915,490
20142,558.8
42.3139.7
2,740.834.3%
2,686.8169.6
201227,893.7
30,918.060,136.0
51.4%42,676.1
72.4%111,647
89,18022,467
73,8532,606
15,0292015
2,736.043.5
144.82,924.4
36.5%2,866.8
169.72013
28,721.829,513.2
60,825.348.5%
43,394.568.0%
111,64784,366
27,28175,281
2,60714,558
20162,807.5
44.8150.2
3,002.533.5%
2,962.3188.0
201431,684.7
31,229.264,122.2
48.7%45,961.0
67.9%111,926
79,70932,217
76,8172,609
14,0792017
2,753.746.2
154.82,954.8
31.8%2,915.2
192.32015
33,019.533,019.5
65,770.350.2%
47,368.969.7%
112,20675,404
36,80278,118
2,61113,643
20182,749.9
47.6163.7
2,961.230.9%
2,921.5196.2
201634,520.6
34,520.667,472.3
51.2%48,825.3
70.7%112,486
71,32441,162
79,2612,615
13,2742019
2,754.249.0
171.92,975.1
29.9%2,935.3
212.42017
35,983.735,983.7
69,245.052.0%
50,350.471.5%
112,76867,417
45,35180,352
2,62012,870
20202,763.6
50.5180.0
2,994.129.1%
2,953.9232.4
201837,464.8
37,464.871,061.4
52.7%51,924.4
72.2%113,050
63,72349,327
81,2642,626
12,4992021
2,779.652.0
188.13,019.7
28.3%2,979.3
253.22019
38,993.238,993.2
72,942.253.5%
53,573.272.8%
113,33260,252
53,08081,946
2,63312,172
20222,800.3
53.5196.5
3,050.427.6%
3,009.5274.3
202040,584.3
40,584.374,896.2
54.2%55,304.5
73.4%113,616
56,96656,650
82,4672,639
11,8452023
2,828.455.2
205.33,088.8
26.9%3,047.4
295.82021
42,257.242,257.2
76,949.354.9%
57,154.073.9%
113,90053,872
60,02882,739
2,64311,560
20242,857.8
56.8214.5
3,129.126.3%
3,087.2318.2
202244,025.3
44,025.379,083.7
55.7%59,102.7
74.5%114,184
50,90763,277
82,8912,649
11,2722025
2,889.858.5
224.23,172.5
25.7%3,130.0
341.32023
45,904.145,904.1
81,325.956.4%
61,172.875.0%
114,47048,028
66,44282,934
2,65210,998
20262,921.8
60.3234.6
3,216.725.2%
3,173.6364.5
202447,905.4
47,905.483,681.9
57.2%63,371.8
75.6%114,756
45,25769,499
82,8292,656
10,7652027
2,957.262.1
245.63,264.8
24.7%3,221.1
389.82025
50,039.450,039.4
86,178.658.1%
65,726.276.1%
115,04342,567
72,47682,656
2,66010,525
20282,993.1
63.9257.3
3,314.324.2%
3,269.9416.0
202652,304.6
52,304.688,789.2
58.9%68,202.0
76.7%115,330
39,87275,458
82,4432,662
10,3542029
3,028.165.9
269.83,363.7
23.7%3,318.6
441.92027
54,715.754,715.7
91,529.859.8%
70,820.677.3%
115,61937,253
78,36682,122
2,66410,186
20303,062.7
67.8283.0
3,413.623.3%
3,367.8471.5
202857,282.6
57,282.694,407.0
60.7%73,583.8
77.8%115,908
34,71081,198
81,7002,666
10,0172031
3,102.169.9
297.13,469.1
22.9%3,422.6
503.02029
60,005.960,005.9
97,453.961.6%
76,511.078.4%
116,19832,153
84,04581,299
2,6659,803
20323,140.1
72.0312.1
3,524.222.5%
3,476.9536.1
203062,901.9
62,901.9100,628.3
62.5%79,581.7
79.0%116,488
29,69286,796
80,7402,666
9,6522033
3,179.174.1
328.03,581.2
22.1%3,533.3
570.72031
65,980.965,980.9
103,959.663.5%
82,811.079.7%
116,77927,263
89,51680,198
2,6669,440
20343,219.5
76.3345.0
3,640.821.7%
3,592.0611.3
203269,251.7
69,251.7107,450.3
64.4%86,202.4
80.3%117,071
24,89392,178
79,5962,665
9,2462035
3,267.778.6
363.03,709.2
21.4%3,659.5
653.82033
72,721.272,721.2
111,130.065.4%
89,776.981.0%
117,36422,554
94,81079,033
2,6658,943
20363,301.1
81.0382.0
3,764.121.0%
3,713.7675.3
203476,414.7
76,414.7114,952.2
66.5%93,520.7
81.7%117,657
20,34897,309
78,1032,666
8,8852037
3,314.783.4
402.43,800.5
20.8%3,749.5
702.92035
80,359.680,359.6
118,952.467.6%
97,463.182.5%
117,95118,258
99,69376,891
2,6658,999
20383,318.8
85.9424.1
3,828.820.4%
3,777.5730.8
203684,440.2
84,440.2123,182.1
68.5%101,512.3
83.2%118,246
16,252101,994
76,3652,667
9,0922039
3,320.788.5
446.53,855.7
20.0%3,804.0
759.52037
88,617.988,617.9
127,596.369.5%
105,653.383.9%
118,54214,307
104,23576,141
2,6659,153
20403,315.4
91.2469.5
3,876.119.7%
3,824.1790.1
203892,859.7
92,859.7132,101.5
70.3%109,828.1
84.6%118,838
12,435106,403
76,0502,664
9,1952041
3,306.693.9
492.83,893.3
19.3%3,841.1
820.42039
97,137.897,137.8
136,707.371.1%
114,023.985.2%
119,13510,694
108,44176,114
2,6619,207
20423,293.4
96.7516.3
3,906.418.9%
3,854.1851.7
2040101,430.8
101,430.8141,390.9
71.7%118,225.1
85.8%119,433
9,121110,312
76,2422,657
9,1262043
3,284.799.6
540.03,924.3
18.6%3,871.7
884.22041
105,711.9105,711.9
146,172.772.3%
122,426.886.3%
119,7327,718
112,01476,478
2,6508,946
20443,275.1
102.6563.5
3,941.218.2%
3,888.4917.5
2042109,956.7
109,956.7150,976.4
72.8%126,579.7
86.9%120,031
6,489113,542
76,7932,642
8,6782045
3,268.6105.7
586.83,961.1
17.9%3,908.1
952.02043
114,163.0114,163.0
155,807.173.3%
130,691.887.4%
120,3315,404
114,92777,082
2,6358,422
20463,264.8
108.8610.0
3,983.617.5%
3,930.3988.0
2044118,319.0
118,319.0160,659.2
73.6%134,753.2
87.8%120,632
4,441116,191
77,3642,626
8,1922047
3,270.9112.1
632.84,015.9
17.2%3,962.1
1,025.32045
122,417.8122,417.8
165,559.373.9%
138,770.888.2%
120,9343,579
117,35577,637
2,6147,977
20483,279.4
115.5655.4
4,050.216.9%
3,996.01,064.1
2046126,458.6
126,458.6170,433.2
74.2%142,717.2
88.6%121,236
2,818118,418
77,8752,602
7,7802049
3,294.8118.9
677.64,091.3
16.6%4,036.5
1,104.02047
130,450.1130,450.1
175,311.174.4%
146,607.589.0%
121,5392,153
119,38678,064
2,5917,602
20503,316.2
122.5699.6
4,138.316.3%
4,082.81,144.9
2048134,406.2
134,406.2180,196.8
74.6%150,459.1
89.3%121,843
1,600120,243
78,1712,579
7,4402051
3,349.4126.2
721.34,196.9
16.0%4,140.7
1,187.12049
138,349.5138,349.5
185,143.774.7%
154,305.889.7%
122,1481,156
120,99278,197
2,5657,284
20523,385.4
130.0743.0
4,258.315.8%
4,201.31,230.5
2050142,299.6
142,299.6190,094.5
74.9%158,144.7
90.0%122,453
797121,656
78,1532,554
7,1412053
3,427.5133.9
764.74,326.1
15.5%4,268.1
1,274.62051
146,290.2146,290.2
195,104. 775.0%
162,015.090.3%
122,759524
122,23578,031
2,5426,998
20543,473.7
137.9786.7
4,398.315.3%
4,339.31,320.1
2052150,348.7
150,348.7200,199.2
75.1%165,947.7
90.6%123,066
330122,736
77,8382,534
6,8572055
3,531.1142.0
809.04,482.2
15.1%4,422.1
1,367.22053
154,501.1154,501.1
205,448.575.2%
169,977.990.9%
123,37 4191
123,18377,599
2,5246,712
20563,589.1
146.3831.8
4,567.314.8%
4,506.11,415.6
2054158,772.4
158,772.4210,793.8
75.3%174,113.3
91.2%123,682
93123,589
77,3172,514
6,5602057
3,652.2150.7
855.34,658.2
14.6%4,595.8
1,465.92055
163,197.7163,197.7
216,298.875.5%
178,391.791.5%
123,99132
123,95976,990
2,5076,406
20583,718.5
155.2879.7
4,753.414.4%
4,689.71,518.0
2056167,802.5
167,802.5221,992.1
75.6%182,843.4
91.8%124,301
3124,298
76,6282,502
6,2452059
3,794.4159.8
905.04,859.3
14.2%4,794.1
1,572.12057
172,618.8172,618.8
227,948.775.7%
187,506.592.1%
124,6121
124,61176,229
2,4976,076
20603,868.8
164.6931.5
4,964.914.1%
4,898.41,628.3
2058177,667.8
177,667.8234,101.8
75.9%192,387.5
92.3%124,924
0124,924
75,8142,493
5,896
Assumptions:
‐ Projections are based on June 30, 2008 data and assumption s
‐ Projections have been adjusted to reflect known asset, liability, and population adjustm
ents through June 30, 2010‐ Population is assum
ed to grow 1/4 of 1%
per year‐ N
ew plans have been reflected for expected new
entrants (55/27)‐ N
ew entrant populations are assum
ed to have the same characteristics as the population that entered the plan during FY 2008
‐ Investment returns are assum
ed to be 8% per year in the future, producing no future gains or losses in the sm
oothing method
‐ Administrative expenses are expected to increase 3%
over prior year (does not apply to FIRE)‐ Investm
ent expenses are assumed to be a fixed percent of assets ranging from
0.4% to 0.6%
depending on the System‐ The N
et City Contribution is assumed to be 98.66%
of the Total Pension Fund Contribution
TRS Pension Fund ProjectionsProjection U
sing 8.00% Interest and 0.25%
Increasing Employee Population
($ in millions)
29

RETIREMENT SECURITY NYC
SUStaiNablE or Not? NYC PeNsioN Cost ProjeCtioNs through 2060
New York City ComptrollerJohn C. Liu
48 JUNE, 2011
Exhibit H
Fiscal Year
Statutory Em
ployer Norm
al Contribution
Administrative
Expense Contribution
Investment
Expense Contribution
Total BERS Pension Fund Contribution
Total Contribution as a Percent of Salary
Net City
Contribution to BERS
Employee
contributions
Values as of
June 30Market value of assets
Actuarial value of assets
Present Value of Future Benefits
AVA divided by
PVFB
Present Value of
Accumulated
Benefits
AVA divided by PVAB
Active Count
Closed Active Group
New
Active
Service Retirem
entDisability Retirem
entAccidental Disability
Inact &Term
Vested
2010$132.9
$9.2$5.3
$147.317.9%
$139.5$25.9
2008$2,021.9
$2,084.1$3,429.5
60.8%$2,315.9
90.0%22,728
22,728
012,483
7094,282
2011167.2
9.83.2
180.220.6%
170.526.5
20091,536.6
1,963.73,612.1
54.4%2,423.0
81.0%23,303
20,777
2,52613,513
7203,943
2012157.4
9.44.7
171.519.9%
161.726.5
20101,785.9
2,092.23,679.2
56.9%2,502.6
83.6%23,333
19,301
4,03214,016
7323,732
2013161.9
9.78.2
179.819.9%
169.528.2
20111,934.0
2,191.13,835.2
57.1%2,643.0
82.9%23,333
17,880
5,45314,539
7453,521
2014170.3
10.010.0
190.320.4%
179.429.5
20122,072.9
2,260.73,991.4
56.6%2,784.3
81.2%23,333
16,516
6,81715,059
7573,330
2015186.3
10.311.9
208.521.6%
196.630.7
20132,215.5
2,274.24,149.8
54.8%2,927.9
77.7%23,333
15,181
8,15215,589
7723,161
2016197.0
10.612.8
220.321.0%
208.633.4
20142,414.4
2,401.94,396.8
54.6%3,133.7
76.6%23,392
13,910
9,48216,112
7833,021
2017195.0
10.913.6
219.520.1%
207.834.9
20152,594.9
2,594.94,596.6
56.5%3,307.3
78.5%23,450
12,755
10,69516,621
7962,897
2018194.9
11.215.3
221.519.5%
209.736.3
20162,790.1
2,790.14,805.1
58.1%3,486.8
80.0%23,509
11,639
11,87017,134
8072,784
2019195.3
11.516.4
223.318.9%
211.437.5
20172,987.7
2,987.75,021.5
59.5%3,673.6
81.3%23,568
10,615
12,95317,606
8172,679
2020196.0
11.917.5
225.418.4%
213.438.6
20183,189.8
3,189.85,245.2
60.8%3,865.0
82.5%23,626
9,633
13,99318,077
8242,591
2021196.8
12.218.7
227.717.9%
215.640.2
20193,397.4
3,397.45,476.1
62.0%4,063.4
83.6%23,686
8,740
14,94618,504
8352,512
2022197.9
12.619.9
230.417.5%
218.142.0
20203,609.5
3,609.55,715.3
63.2%4,267.7
84.6%23,745
7,899
15,84618,907
8412,458
2023199.5
13.021.0
233.517.1%
221.143.7
20213,826.6
3,826.65,963.5
64.2%4,479.0
85.4%23,804
7,114
16,69019,298
8462,400
2024201.2
13.422.3
236.916.7%
224.345.5
20224,049.1
4,049.16,218.3
65.1%4,695.6
86.2%23,864
6,392
17,47219,655
8502,357
2025203.4
13.823.5
240.716.3%
227.947.3
20234,276.9
4,276.96,481.0
66.0%4,918.0
87.0%23,923
5,717
18,20619,992
8552,322
2026205.8
14.224.8
244.916.0%
231.849.1
20244,511.2
4,511.26,751.9
66.8%5,147.5
87.6%23,983
5,106
18,87720,299
8542,284
2027208.9
14.626.1
249.715.7%
236.450.9
20254,752.4
4,752.47,033.5
67.6%5,385.8
88.2%24,043
4,542
19,50120,576
8562,250
2028212.0
15.127.5
254.615.5%
241.052.7
20265,000.9
5,000.97,322.7
68.3%5,630.7
88.8%24,103
4,030
20,07320,815
8552,246
2029215.2
15.528.9
259.615.2%
245.954.6
20275,258.1
5,258.17,621.8
69.0%5,884.5
89.4%24,163
3,568
20,59521,024
8532,248
2030218.6
16.030.4
265.015.0%
250.956.5
20285,523.2
5,523.27,930.9
69.6%6,146.3
89.9%24,224
3,139
21,08521,213
8502,258
2031222.5
16.531.9
270.814.8%
256.458.4
20295,796.8
5,796.88,252.4
70.2%6,417.8
90.3%24,284
2,749
21,53521,382
8492,265
2032226.4
17.033.4
276.714.6%
262.160.3
20306,078.9
6,078.98,582.9
70.8%6,697.1
90.8%24,345
2,394
21,95121,529
8472,277
2033230.5
17.535.0
283.014.5%
268.062.3
20316,369.7
6,369.78,924.5
71.4%6,985.0
91.2%24,406
2,068
22,33821,653
8422,305
2034234.6
18.036.7
289.314.3%
273.964.3
20326,670.7
6,670.79,277.5
71.9%7,283.0
91.6%24,467
1,783
22,68421,744
8382,335
2035239.4
18.538.4
296.314.2%
280.666.4
20336,979.9
6,979.99,643.9
72.4%7,590.1
92.0%24,528
1,513
23,01521,830
8332,374
2036244.2
19.140.1
303.414.1%
287.368.6
20347,298.4
7,298.410,020.4
72.8%7,906.3
92.3%24,589
1,282
23,30721,893
8322,412
2037249.3
19.741.9
310.913.9%
294.470.8
20357,626.9
7,626.910,409.1
73.3%8,232.5
92.6%24,651
1,084
23,56721,939
8282,451
2038254.5
20.243.8
318.513.8%
301.673.1
20367,965.6
7,965.610,810.2
73.7%8,569.0
93.0%24,713
910
23,80321,960
8242,491
2039260.2
20.845.7
326.813.7%
309.475.5
20378,315.2
8,315.211,227.1
74.1%8,917.7
93.2%24,774
760
24,01421,968
8202,536
2040265.9
21.547.7
335.113.6%
317.377.9
20388,674.6
8,674.611,655.3
74.4%9,275.9
93.5%24,836
628
24,20821,967
8172,586
2041271.9
22.149.7
343.813.5%
325.580.4
20399,044.6
9,044.612,096.8
74.8%9,644.8
93.8%24,898
514
24,38421,952
8142,637
2042278.0
22.851.8
352.713.5%
333.983.1
20409,425.3
9,425.312,552.0
75.1%10,024.9
94.0%24,961
421
24,54021,930
8122,688
2043285.0
23.554.0
362.413.4%
343.285.8
20419,816.1
9,816.113,023.9
75.4%10,416.5
94.2%25,023
339
24,68421,903
8062,743
2044291.7
24.256.2
372.113.3%
352.388.6
204210,217.9
10,217.913,507.6
75.6%10,819.2
94.4%25,086
271
24,81521,864
8062,795
2045298.8
24.958.5
382.213.3%
361.991.5
204310,630.8
10,630.814,005.9
75.9%11,233.2
94.6%25,148
214
24,93421,823
8012,851
2046306.1
25.660.8
392.613.2%
371.794.5
204411,054.2
11,054.214,518.2
76.1%11,658.4
94.8%25,211
168
25,04321,781
8002,906
2047314.2
26.463.2
403.813.1%
382.497.6
204511,488.3
11,488.315,048.6
76.3%12,095.7
95.0%25,274
130
25,14421,737
7972,961
2048322.2
27.265.6
415.013.1%
393.0100.8
204611,933.0
11,933.015,590.5
76.5%12,543.8
95.1%25,337
100
25,23721,691
7963,014
2049330.5
28.068.1
426.613.0%
404.0104.1
204712,388.9
12,388.916,147.3
76.7%13,003.5
95.3%25,401
76
25,32521,647
7943,065
2050339.1
28.970.7
438.713.0%
415.4107.5
204812,855.2
12,855.216,719.1
76.9%13,474. 4
95.4%25,464
56
25,40821,611
7943,114
2051348.6
29.773.3
451.713.0%
427.7111.0
204913,332.8
13,332.817,309.9
77.0%13,957.9
95.5%25,528
42
25,48621,576
7933,161
2052358.1
30.676.0
464.712.9%
440.0114.7
205013,821.9
13,821.917,913.2
77.2%14,453.4
95.6%25,592
30
25,56221,542
7923,205
2053367.9
31.578.8
478.212.9%
452.8118.4
205114,323.0
14,323.018,532.7
77.3%14,961.2
95.7%25,656
20
25,63621,515
7943,248
2054378.0
32.581.6
492.012.8%
465.9122.3
205214,835.9
14,835.919,168.6
77.4%15,481.7
95.8%25,720
13
25,70721,495
7933,286
2055389.1
33.584.5
507.112.8%
480.1126.3
205315,361.2
15,361.219,825.5
77.5%16,015.8
95.9%25,784
9
25,77521,479
7933,321
2056400.2
34.587.4
522.112.8%
494.3130.4
205415,899.3
15,899.320,496.6
77.6%16,563.4
96.0%25,849
6
25,84321,469
7943,354
2057411.6
35.590.5
537.612.7%
509.1134.7
205516,451.4
16,451.421,186.0
77.7%17,125.3
96.1%25,913
3
25,91021,464
7953,383
2058423.4
36.693.6
553.612.7%
524.2139.1
205617,017.3
17,017.321,894.2
77.7%17,702.0
96.1%25,978
2
25,97621,466
7943,410
2059436.4
37.796.8
570.812.7%
540.5143.6
205717,597.9
17,597.922,626.8
77.8%18,294.4
96.2%26,043
1
26,04221,473
7943,436
2060449.2
38.8100.1
588.012.7%
556.8148.2
205818,193.6
18,193.623,375.6
77.8%18,902.9
96.2%26,108
0
26,10821,484
7943,458
Assumptions:
‐ Projections are based on June 30, 2008 data and assumptions
‐ Projections have been adjusted to reflect known asset, liability, and population adjustm
ents through June 30, 2010‐ Population is assum
ed to grow 1/4 of 1%
per year‐ N
ew plans have been reflected for expected new
entrants‐ N
ew entrant populations are assum
ed to have the same characteristics as the population that entered the plan during FY 2008
‐ Investment returns are assum
ed to be 8% per year in the future, producing no future gains or losses in the sm
oothing method
‐ Administrative expenses are expected to increase 3%
over prior year (does not apply to FIRE)‐ Investm
ent expenses are assumed to be a fixed percent of assets ranging from
0.4% to 0.6%
depending on the System‐ The N
et City Contribution is assumed to be 94.69%
of the Total Pension Fund Contribution
BERS Pension Fund ProjectionsProjection U
sing 8.00% Interest and 0.25%
Increasing Employee Population
($ in millions)30

RETIREMENT SECURITY NYC
SUStaiNablE or Not? NYC PeNsioN Cost ProjeCtioNs through 2060
New York City ComptrollerJohn C. Liu
49JUNE, 2011
Exhibit H
Fiscal Year
Statutory Em
ployer Norm
al Contribution
Administrative
Expense Contribution
Investment
Expense Contribution
Total POLICE
Pension Fund Contribution
Total Contribution as a Percent of Salary
Net City
Contribution to PO
LICEEm
ployee contributions
Values as of
June 30Market value of assets
Actuarial value of assets
Present Value of Future Benefits
AVA divided by
PVFB
Present Value of
Accumulated
Benefits
AVA divided by PVAB
Active Count
Closed Active Group
New
Active
Service Retirem
entOrdinary
DisabilityAccidental Disability
Inact &Term
Vested
2010$1,877.9
$17.7$84.4
$1,980.165.1%
$1,980.1$55.8
2008$21,061.0
$21,393.2$37,586.8
56.9%$30,355.3
70.5%35,337
35,337
029,346
3,69111,253
2,9812011
1,978.319.3
86.02,083.6
64.3%2,083.6
55.52009
17,424.122,676.2
39,079.158.0%
31,888.571.1%
35,608
33,2712,337
29,5393,661
11,4383,022
20122,079.3
19.3105.1
2,203.767.1%
2,203.758.7
201019,985.1
23,943.640,785.0
58.7%33,656.3
71.1%34,597
31,376
3,22129,801
3,62411,615
3,0892013
2,094.619.8
116.62,231.0
67.0%2,231.0
58.92011
21,895.925,184.5
42,401.859.4%
35,204.871.5%
34,597
29,1315,466
30,5513,590
11,7833,227
20142,004.2
20.4127.7
2,152.466.4%
2,152.458.4
201223,931.8
26,361.443,320.5
60.9%36,103.6
73.0%34,597
27,224
7,37331,063
3,55211,935
3,3972015
2,020.721.1
139.62,181.3
68.8%2,181.3
58.82013
25,927.626,823.9
44,350.560.5%
36,921.372.7%
34,597
25,1119,486
31,8573,512
12,0793,574
20162,115.3
22.3151.2
2,288.873.7%
2,288.859.6
201426,693.8
26,583.445,720.6
58.1%37,988.1
70.0%34,683
23,045
11,63832,665
3,47012,202
3,7232017
2,010.723.0
161.82,195.5
69.2%2,195.5
63.62015
27,695.327,695.3
46,411.559.7%
39,016.871.0%
34,770
21,16613,604
33,3393,431
12,3143,825
20181,937.2
23.7165.1
2,126.065.6%
2,126.066.4
201628,897.2
28,897.247,249.5
61.2%40,008.2
72.2%34,857
19,416
15,44133,949
3,38912,408
3,8692019
1,872.624.4
172.32,069.3
62.7%2,069.3
69.92017
30,037.630,037.6
48,079.062.5%
41,007.373.2%
34,944
17,96416,980
34,2823,351
12,4903,899
20201,823.8
25.1179.1
2,028.159.9%
2,028.174.8
201831,077.5
31,077.548,873.3
63.6%41,942.3
74.1%35,032
16,440
18,59234,729
3,32012,562
3,8882021
1,778.825.9
185.31,990.0
57.3%1,990.0
77.52019
32,049.932,049.9
49,645.164.6%
42,847.174.8%
35,119
14,98420,135
35,1593,291
12,6193,830
20221,734.0
26.7191.2
1,951.855.2%
1,951.882.3
202033,008.5
33,008.550,405.9
65.5%43,757.6
75.4%35,207
13,803
21,40435,309
3,26712,667
3,7912023
1,694.427.5
196.91,918.8
53.0%1,918.8
85.42021
33,873.833,873.8
51,162.266.2%
44,607.875.9%
35,295
12,36222,933
35,7533,252
12,7063,725
20241,662.2
28.3202.1
1,892.651.1%
1,892.690.9
202234,713.0
34,713.051,891.8
66.9%45,438.0
76.4%35,383
11,168
24,21535,963
3,23912,736
3,6662025
1,634.129.1
207.11,870.4
49.2%1,870.4
93.92023
35,472.635,472.6
52,607.067.4%
46,207.476.8%
35,472
9,82725,645
36,3413,235
12,7533,594
20261,585.6
30.0211.7
1,827.347.7%
1,827.395.4
202436,227.2
36,227.253,318.4
67.9%46,975.8
77.1%35,560
8,719
26,84136,510
3,23412,760
3,5182027
1,538.530.9
216.21,785.6
46.2%1,785.6
100.02025
36,894.836,894.8
54,026.068.3%
47,658.177.4%
35,649
7,43228,217
36,7783,238
12,7583,532
20281,511.7
31.8220.2
1,763.744.4%
1,763.7105.4
202637,402.0
37,402.054,690.7
68.4%48,179.8
77.6%35,738
5,835
29,90337,395
3,24712,744
3,5222029
1,505.432.8
223.21,761.4
42.8%1,761.4
112.62027
37,838.337,838.3
55,330.768.4%
48,636.577.8%
35,828
4,41631,412
37,9233,260
12,7143,448
20301,520.5
33.8225.8
1,780.141.3%
1,780.1121.0
202838,234.9
38,234.955,942.0
68.3%49,047.5
78.0%35,917
3,229
32,68838,387
3,27312,667
3,2282031
1,553.434.8
228.21,816.4
40.1%1,816.4
129.12029
38,657.238,657.2
56,548.668.4%
49,477.678.1%
36,007
2,38733,620
38,3603,288
12,6033,181
20321,591.6
35.8230.7
1,858.239.2%
1,858.2137.3
203039,162.5
39,162.557,149.6
68.5%49,955.5
78.4%36,097
1,894
34,20337,923
3,30512,534
3,2082033
1,633.236.9
233.81,903.9
38.3%1,903.9
145.52031
39,766.639,766.6
57,790.468.8%
50,496.878.8%
36,187
1,51434,673
37,3583,327
12,4643,253
20341,676.5
38.0237.5
1,952.037.5%
1,952.0153.7
203240,486.2
40,486.258,487.5
69.2%51,116.0
79.2%36,278
1,204
35,07436,714
3,35812,399
3,3122035
1,704.639.2
241.81,985.6
36.9%1,985.6
155.22033
41,339.741,339.7
59,267.969.8%
51,837.279.7%
36,369
95035,419
36,0033,398
12,3403,378
20361,718.8
40.3246.9
2,006.136.3%
2,006.1161.6
203442,345.1
42,345.160,123.1
70.4%52,662.6
80.4%36,459
744
35,71535,239
3,44712,289
3,4572037
1,730.741.6
253.02,025.2
35.5%2,025.2
163.32035
43,395.843,395.8
61,117.671.0%
53,534.181.1%
36,551
58035,971
34,9743,509
12,2483,538
20381,730.2
42.8259.3
2,032.334.9%
2,032.3166.6
203644,555.1
44,555.162,171.0
71.7%54,496.6
81.8%36,642
449
36,19334,526
3,57612,215
3,6232039
1,729.744.1
266.32,040.1
34.1%2,040.1
169.32037
45,752.445,752.4
63,351.572.2%
55,513.082.4%
36,734
34436,390
34,3753,654
12,1903,712
20401,724.8
45.4273.5
2,043.733.4%
2,043.7172.1
203846,993.9
46,993.964,596.5
72.7%56,577.7
83.1%36,825
260
36,56534,267
3,73612,174
3,8012041
1,720.546.8
281.02,048.3
32.6%2,048.3
175.72039
48,266.048,266.0
65,925.773.2%
57,687.883.7%
36,918
19436,724
34,2663,826
12,1653,892
20421,718.0
48.2288.7
2,054.831.9%
2,054.8179.8
204049,554.7
49,554.767,329.4
73.6%58,835.1
84.2%37,010
141
36,86934,348
3,91712,161
3,9772043
1,722.149.6
296.52,068.2
31.2%2,068.2
185.02041
50,863.450,863.4
68,811.473.9%
60,028.084.7%
37,102
10137,001
34,4514,014
12,1614,054
20441,728.1
51.1304.3
2,083.530.5%
2,083.5190.1
204252,192.6
52,192.670,343.4
74.2%61,256.4
85.2%37,195
70
37,12534,569
4,11012,166
4,1262045
1,735.652.6
312.42,100.6
29.9%2,100.6
195.62043
53,559.053,559.0
71,933.174.5%
62,534.585.6%
37,288
4737,241
34,6494,211
12,1754,188
20461,747.5
54.2320.6
2,122.329.3%
2,122.3202.4
204454,956.1
54,956.173,593.5
74.7%63,860.7
86.1%37,381
29
37,35234,755
4,31412,189
4,2452047
1,764.155.8
329.02,148.9
28.7%2,148.9
208.22045
56,387.756,387.7
75,339.274.8%
65,243.186.4%
37,475
1737,458
34,8624,418
12,2054,295
20481,779.7
57.5337.6
2,174.828.2%
2,174.8215.2
204657,873.3
57,873.377,136.9
75.0%66,687.0
86.8%37,568
9
37,55934,923
4,52212,224
4,3432049
1,798.259.2
346.62,204. 0
27.8%2,204.0
221.62047
59,401.059,401.0
79,023.375.2%
68,188.987.1%
37,662
437,658
35,0344,630
12,2454,383
20501,818.3
61.0355.8
2,235.027.3%
2,235.0229.2
204860,986.9
60,986.980,986.6
75.3%69,762.0
87.4%37,757
1
37,75635,114
4,73812,271
4,4232051
1,843.562.8
365.32,271.7
26.9%2,271.7
236.02049
62,625. 862,625.8
83,063.975.4%
71,408.887.7%
37,851
037,851
35,2314,847
12,2974,458
20521,864.0
64.7375.2
2,303.926.5%
2,303.9241.6
205064,335.9
64,335.985,213.2
75.5%73,136.2
88.0%37,946
0
37,94635,312
4,95512,326
4,4912053
1,884.766.7
385.52,336.9
26.2%2,336.9
248.42051
66,109.366,109.3
87,469.775.6%
74,941. 688.2%
38,040
038,040
35,4385,065
12,3594,519
20541,910.6
68.7396.2
2,375.425.9%
2,375.4256.2
205267,919.0
67,919.089,839.2
75.6%76,809.2
88.4%38,135
0
38,13535,666
5,17212,393
4,5462055
1,946.570.7
407.02,424.3
25.6%2,424.3
265.82053
69,774.369,774.3
92,320.975.6%
78,746.588.6%
38,231
038,231
35,90 45,277
12,4334,567
20561,989.3
72.9418.2
2,480.425.2%
2,480.4277.1
205471,690.5
71,690.594,873.6
75.6%80,758.0
88.8%38,326
0
38,32636,120
5,38112,473
4,5852057
2,040.175.0
429.72,544.9
25.0%2,544.9
289.22055
73,697.573,697.5
97,513.475.6%
82,864.588.9%
38,422
038,422
36,2745,482
12,5184,600
20582,095.8
77.3441.8
2,614.924.7%
2,614.9302.0
205675,826.1
75,826.1100,247.3
75.6%85,090.1
89.1%38,518
0
38,51836,344
5,57712,570
4,6122059
2,158.979.6
454.62,693.1
24.5%2,693.1
315.42057
78,094.578,094.5
103,117.775.7%
87,452.889.3%
38,615
038,615
36,3725,674
12,6274,624
20602,223.7
82.0468.3
2,773.924.2%
2,773.9329.3
205880,518.7
80,518.7106,098.1
75.9%89,964.4
89.5%38,711
0
38,71136,372
5,76712,690
4,631
Assumptions:
‐ Projections are based on June 30, 2008 data and assumption s
‐ Projections have been adjusted to reflect known asset, liability, and population adjustm
ents through June 30, 2010‐ Population is assum
ed to grow 1/4 of 1%
per year‐ N
ew plans have been reflected for expected new
entrants (Tier 3 POLICE)
‐ New
entrant populations are assumed to have the sam
e characteristics as the population that entered the plan during FY 2008‐ Investm
ent returns are assumed to be 8%
per year in the future, producing no future gains or losses in the smoothing m
ethod‐ Adm
inistrative expenses are expected to increase 3% over prior year (does not apply to FIRE)
‐ Investment expenses are assum
ed to be a fixed percent of assets ranging from 0.4%
to 0.6% depending on the System
‐ The Net City Contribution is assum
ed to be 100% of the Total Pension Fund Contribution
POLICE Pension Fund Projections
Projection Using 8.00%
Interest and 0.25% Increasing Em
ployee Population($ in m
illions)31

RETIREMENT SECURITY NYC
SUStaiNablE or Not? NYC PeNsioN Cost ProjeCtioNs through 2060
New York City ComptrollerJohn C. Liu
50 JUNE, 2011
Exhibit H
Fiscal Year
Statutory Em
ployer Norm
al Contribution
Administrative
Expense Contribution
Investment
Expense Contribution
Total FIRE Pension Fund Contribution
Total Contribution as a Percent of Salary
Net City
Contribution to FIRE
Employee
contributions
Values as of
June 30Market value of assets
Actuarial value of assets
Present Value of Future Benefits
AVA divided by
PVFB
Present Value of
Accumulated
Benefits
AVA divided by PVAB
Active Count
Closed Active Group
New
Active
Service Retirem
entOrdinary
DisabilityAccidental Disability
Inact &Term
Vested
2010$825.7
$0.0$24.9
$874.383.1%
$874.3$14.6
2008$6,817.3
$6,943.0$15,193.8
45.7%$12,842.9
54.1%11,574
11,574
07,966
1,2848,149
852011
864.20.0
26.5890.7
82.1%890.7
14.32009
5,576.87,304.8
15,647.646.7%
13,321.654.8%
11,458
11,124334
7,7931,239
8,15795
2012915.6
0.033.1
948.785.9%
948.715.2
20106,438.8
7,679.416,216.0
47.4%13,914.4
55.2%11,080
10,682
3987,634
1,1978,163
1072013
895.80.0
37.6933.4
85.1%933.4
15.62011
6,979.58,010.2
16,445.548.7%
14,173.156.5%
11,080
10,196884
7,5341,155
8,166118
2014872.4
0.040.7
913.184.4%
913.115.8
20127,576.5
8,331.216,565.5
50.3%14,321.1
58.2%11,080
9,736
1,3447,426
1,1138,166
1302015
889.20.0
44.2933.4
86.7%933.4
16.12013
8,152.28,410.9
16,796.650.1%
14,535.057.9%
11,080
9,2941,786
7,3111,076
8,162141
2016955.3
0.047.5
1,002.993.0%
1,002.916.5
20148,298.1
8,245.817,202.0
47.9%14,915.6
55.3%11,108
8,849
2,2597,208
1,0408,158
1552017
925.10.0
50.6975.7
88.9%975.7
17.42015
8,755.38,755.3
17,488.850.1%
15,224.157.5%
11,136
8,3862,750
7,1361,006
8,150165
2018903.1
0.055.0
958.085.6%
958.018.2
20169,249.3
9,249.317,784.9
52.0%15,525.5
59.6%11,163
7,918
3,2457,076
9738,141
1762019
882.40.0
57.6940.0
82.6%940.0
18.92017
9,724.49,724.4
18,084.353.8%
15,828.761.4%
11,191
7,4693,722
7,013944
8,125184
2020860.8
0.060.0
920.879.6%
920.819.8
201810,188.0
10,188.018,379.8
55.4%16,123.6
63.2%11,219
7,024
4,1956,953
9158,106
1882021
839.60.0
62.4902.0
76.7%902.0
21.02019
10,639.010,639.0
18,674.657.0%
16,409.764.8%
11,247
6,5704,677
6,912890
8,085194
2022818.8
0.064.6
883.473.8%
883.421.5
202011,079.4
11,079.418,968.4
58.4%16,685.5
66.4%11,276
6,111
5,1656,880
8688,060
2022023
798.80.0
66.8865.6
71.3%865.6
21.92021
11,503.611,503.6
19,264.159.7%
16,957.667.8%
11,304
5,6735,631
6,840846
8,029206
2024776.8
0.068.8
845.668.8%
845.622.2
202211,816.3
11,816.319,463.0
60.7%17,212.1
68.7%11,332
5,229
6,1036,820
8277,996
2092025
754.80.0
70.7825.5
66.3%825.5
23.02023
12,095.212,095.2
19,647.061.6%
17,446.869.3%
11,360
4,7736,587
6,824812
7,961206
2026732.8
0.072.4
805.263.7%
805.223.4
202412,344.2
12,344.219,819.4
62.3%17,657.2
69.9%11,389
4,293
7,0966,858
7977,921
2112027
714.20.0
73.8788.0
61.5%788.0
24.32025
12,557.612,557.6
19,979.462.9%
17,849.270.4%
11,417
3,8397,578
6,876785
7,877215
2028697.3
0.075.1
772.459.3%
772.425.6
202612,737.4
12,737.420,117.9
63.3%18,010.2
70.7%11,446
3,393
8,0536,903
7757,827
2212029
683.90.0
76.2760.1
57.2%760.1
27.62027
12,888.212,888.2
20,240.863.7%
18,146.471.0%
11,474
2,9628,512
6,930769
7,774224
2030674.4
0.077.1
751.555.2%
751.530.0
202813,013.8
13,013.820,348.6
64.0%18,259.8
71.3%11,503
2,556
8,9476,945
7637,716
2282031
669.20.0
77.9747.0
53.4%747.0
32.42029
13,120.413,120.4
20,443.864.2%
18,356.871.5%
11,532
2,1919,341
6,936761
7,654232
2032666.4
0.078.5
744.951.8%
744.934.8
203013,213.0
13,213.020,518.9
64.4%18,434.2
71.7%11,561
1,879
9,6826,887
7607,588
2372033
665.40.0
79.0744.5
50.4%744.5
37.32031
13,297.413,297.4
20,582.764.6%
18,497.271.9%
11,589
1,5989,991
6,823764
7,520244
2034665.8
0.079.6
745.449.0%
745.439.8
203213,378.7
13,378.720,638.5
64.8%18,548.2
72.1%11,618
1,343
10,2756,744
7687,449
2512035
666.60.0
80.0746.7
47.7%746.7
41.12033
13,462.113,462.1
20,692.965.1%
18,593.672.4%
11,648
1,11410,534
6,654776
7,379259
2036667.5
0.080.5
748.046.5%
748.043.5
203413,546.1
13,546.120,741.9
65.3%18,631.6
72.7%11,677
910
10,7676,554
7857,306
2692037
667.30.0
81.1748.3
45.1%748.3
44.42035
13,638.113,638.1
20,797.565.6%
18,665.073.1%
11,706
73010,976
6,483798
7,233279
2038666.3
0.081.6
747.944.0%
747.945.5
203613,735.6
13,735.620,855.3
65.9%18,699.5
73.5%11,735
574
11,1616,395
8147,161
2892039
665.30.0
82.2747.5
42.7%747.5
46.82037
13,838.513,838.5
20,931.466.1%
18,738.673.9%
11,764
44111,323
6,340831
7,088300
2040663.7
0.082.8
746.541.5%
746.548.0
203813,950.1
13,950.121,017.3
66.4%18,779.4
74.3%11,794
330
11,4646,308
8537,016
3102041
662.00.0
83.5745.5
40.2%745.5
49.22039
14,072.214,072.2
21,116.766.6%
18,828.074.7%
11,823
24011,583
6,282878
6,941321
2042660.1
0.084.2
744.439.0%
744.450.4
204014,206.2
14,206.221,233.4
66.9%18,887.4
75.2%11,853
169
11,6846,269
9036,871
3322043
659.10.0
85.1744.2
37.8%744.2
51.82041
14,354.214,354.2
21,376.767.1%
18,963.975.7%
11,882
11311,769
6,270929
6,801342
2044658.0
0.086.0
743.936.7%
743.953.3
204214,518.1
14,518.121,538.7
67.4%19,055.9
76.2%11,912
73
11,8396,280
9606,733
3512045
657.00.0
86.9744.0
35.6%744.0
54.82043
14,699.914,699.9
21,726.267.7%
19,168.376.7%
11,942
4411,898
6,303991
6,670361
2046656.3
0.088.0
744.334.6%
744.356.3
204414,899.8
14,899.821,941.1
67.9%19,303.4
77.2%11,972
25
11,9476,329
1,0236,609
3692047
656.60.0
89.3745.8
33.6%745.8
58.02045
15,117.815,117.8
22,189.268.1%
19,463.977.7%
12,002
1311,989
6,3701,059
6,558377
2048656.8
0.090.6
747.432.7%
747.459.7
204615,355.6
15,355.622,463.7
68.4%19,647.6
78.2%12,032
5
12,0276,420
1,0956,508
3842049
657.50.0
92.0749.5
31.8%749.5
61.32047
15,614.215,614.2
22,768.968.6%
19,858.178.6%
12,062
112,061
6,4771,133
6,470391
2050658.5
0.093.6
752.130.9%
752.163.0
204815,893. 0
15,893.023,106.6
68.8%20,096.2
79.1%12,092
0
12,0926,543
1,1736,434
3982051
661.00.0
95.2756.2
30.2%756.2
64.82049
16,190.616,190.6
23,482.968.9%
20,363.779.5%
12,122
012,122
6,6181,214
6,409403
2052663.8
0.097.0
760.829.5%
760.866.7
205016,506.9
16,506.923,888.4
69.1%20,657.0
79.9%12,153
0
12,1536,705
1,2566,390
4092053
667.50.0
98.9766.5
28.8%766.5
68.72051
16,843.016,843.0
24,326.769.2%
20,977.780.3%
12,183
012,183
6,7991,300
6,378415
2054672.2
0.0101.0
773.228.2%
773.270.8
205217,198.4
17,198.424,797.5
69.4%21,325.9
80.6%12,213
0
12,2136,898
1,3436,373
4192055
679.00.0
103.1782.1
27.7%782.1
73.32053
17,574.117,574.1
25,306.369.4%
21,702.981.0%
12,244
012,244
7,0021,385
6,373424
2056686.7
0.0105.4
792.027.1%
792.076.1
205417,971.7
17,971.725,842.8
69.5%22,107.3
81.3%12,275
0
12,2757,112
1,4286,380
4272057
695.70.0
107.7803.5
26.7%803.5
79.12055
18,394.418,394.4
26,411.569.6%
22,541.281.6%
12,305
012,305
7,2191,471
6,392430
2058706.0
0.0110.3
816.326.2%
816.382.3
205618,844.6
18,844.627,012.7
69.8%23,006.3
81.9%12,336
0
12,3367,325
1,5116,410
4332059
718.40.0
113.0831.4
25.8%831.4
85.62057
19,324.719,324.7
27,653.769.9%
23,505.482.2%
12,367
012,367
7,4251,551
6,430435
2060731.6
0.0115.9
847.425.4%
847.489.1
205819,837.1
19,837.128,325.5
70.0%24,039.1
82.5%12,398
0
12,3987,522
1,5946,456
436
Assumptions:
‐ Projections are based on June 30, 2008 data and assumptions
‐ Projections have been adjusted to reflect known asset, liability, and population adjustm
ents through June 30, 2010‐ Population is assum
ed to grow 1/4 of 1%
per year‐ N
ew plans have been reflected for expected new
entrants (Tier 3 FIRE)‐ N
ew entrant populations are assum
ed to have the same characteristics as the population that entered the plan during FY 2008
‐ Investment returns are assum
ed to be 8% per year in the future, producing no future gains or losses in the sm
oothing method
‐ Administrative expenses are expected to increase 3%
over prior year (does not apply to FIRE)‐ Investm
ent expenses are assumed to be a fixed percent of assets ranging from
0.4% to 0.6%
depending on the System‐ The N
et City Contribution is assumed to be 100%
of the Total Pension Fund Contribution
FIRE Pension Fund ProjectionsProjection U
sing 8.00% Interest and 0.25%
Increasing Employee Population
($ in millions)32

RETIREMENT SECURITY NYC
SUStaiNablE or Not? NYC PeNsioN Cost ProjeCtioNs through 2060
New York City ComptrollerJohn C. Liu
51JUNE, 2011
I:/benefits/client/nyc/hay group 50 year projection methodology 052711.doc May 27, 2011 33
Exhibit I: Projection Results - Scenario 3
Increasing workforce assumption – by ¼% per year from FY 2014, and 7.5% discount rate

RETIREMENT SECURITY NYC
SUStaiNablE or Not? NYC PeNsioN Cost ProjeCtioNs through 2060
New York City ComptrollerJohn C. Liu
52 JUNE, 2011
Exhibit I
Fiscal Year
Statutory Em
ployer Norm
al Contribution
Administrative
Expense Contribution
Investment
Expense Contribution
Total ALL NYCRS
Pension Fund Contributions
Total Contribution as a Percent of Salary
Net City
Contribution to N
YCRSEm
ployee Contributions
Values as of
June 30Market Value of Assets
Actuarial Value of Assets
Present Value of Future Benefits
AVA divided by
PVFB
Present Value of
Accumulated
Benefits
AVA divided by PVAB
Active Count
Closed Active Group
New
Active
Service Retirem
entOrdinary
DisabilityAccidental Disability
Inact &Term
Vested
2010$7,196.6
$115.5$347.7
$7,683.532.4%
$6,650.2$581.8
2008$101,914.9
$103,419.2$174,702.0
59.2%$129,547.6
79.8%365,718
365,718‐
234,441
17,368
23,101
58,347
2011
7,500.4117.2
393.18,010.7
32.8%6,865.5
584.62009
79,518.3104,429.8
177,933.858.7%
132,443.378.8%
369,789339,559
30,230
242,386
17,421
23,260
54,558
20129,015.1
123.7492.9
9,632.238.8%
8,211.4609.6
201090,016.1
107,407.0194,630.2
55.2%147,472.3
72.8%365,639
317,64547,994
246,857
17,456
23,420
52,092
2013
8,978.8127.3
503.69,610.3
38.3%8,152.2
623.92011
95,405.0109,994.1
200,236.054.9%
152,788.672.0%
365,639296,494
69,145
252,085
17,487
23,557
49,913
20149,070.9
131.1538.2
9,740.838.5%
8,224.7635.2
2012102,053.7
112,817.4205,954.4
54.8%158,104.0
71.4%365,639
277,44688,193
256,399
17,494
23,678
47,908
2015
9,727.3135.1
575.110,437.9
40.2%8,773.9
662.32013
108,493.8112,048.8
211,943.552.9%
163,401.368.6%
365,639259,036
106,603261,130
17,496
23,779
45,930
2016
10,033.6139.8
610.610,784.0
40.3%9,036.9
683.82014
114,592.2113,723.7
218,050.852.2%
168,695.367.4%
366,554241,243
125,311266,063
17,477
23,864
44,107
2017
9,736.8144.0
643.710,524.5
38.1%8,815.1
714.72015
120,541.1120,541.1
223,529.153.9%
174,050.569.3%
367,470224,786
142,684270,447
17,453
23,932
42,382
2018
9,565.5148.3
689.910,403.7
36.5%8,711.4
739.22016
127,151.8127,151.8
229,317.855.4%
179,460.970.9%
368,389209,101
159,288274,627
17,426
23,979
40,837
2019
9,417.7152.7
728.310,298.7
35.1%8,624.1
780.82017
133,553.4133,553.4
235,162.356.8%
184,931.772.2%
369,310194,590
174,720278,218
17,389
24,008
39,415
2020
9,301.6157.3
765.910,224.9
33.8%8,563.6
825.72018
139,839.1139,839.1
241,081.558.0%
190,402.173.4%
370,233180,426
189,807281,943
17,358
24,022
38,157
2021
9,199.5162.0
803.010,164.5
32.5%8,515.6
868.42019
146,102.4146,102.4
247,107.959.1%
195,957.074.6%
371,158167,131
204,027285,205
17,329
24,025
37,087
2022
9,108.5166.9
839.910,115.3
31.4%8,476.3
917.72020
152,412.5152,412.5
253,262.160.2%
201,622.775.6%
372,086154,667
217,419287,962
17,288
24,010
36,249
2023
9,045.4171.9
877.110,094.3
30.3%8,459.1
968.42021
158,686.0158,686.0
259,607.061.1%
207,382.976.5%
373,017142,432
230,585290,800
17,244
23,982
35,581
2024
8,994.4177.0
913.910,085.4
29.4%8,452.0
1,023.42022
164,887.7164,887.7
265,898.562.0%
213,225.477.3%
373,949131,175
242,774293,000
17,197
23,944
35,085
2025
8,950.9182.4
951.110,084.3
28.5%8,452.8
1,070.42023
171,151.3171,151.3
272,380.762.8%
219,151.478.1%
374,884120,267
254,617295,091
17,150
23,890
34,715
2026
8,885.2187.8
988.510,061.5
27.6%8,431.9
1,117.32024
177,540.6177,540.6
279,033.163.6%
225,222.078.8%
375,821110,093
265,728296,633
17,090
23,820
34,571
2027
8,840.8193.5
1,026.510,060.8
26.8%8,427.3
1,173.82025
183,933.1183,933.1
285,922.664.3%
231,363.279.5%
376,76199,813
276,948
298,384
17,037
23,740
34,673
20288,826.8
199.31,064.5
10,090.526.0%
8,450.81,233.1
2026190,254.8
190,254.8292,907.5
65.0%237,428.0
80.1%377,703
89,611
288,092300,238
16,976
23,644
34,956
2029
8,843.9205.2
1,102.110,151.2
25.3%8,502.6
1,291.82027
196,641.6196,641.6
300,039.365.5%
243,570.180.7%
378,64780,122
298,525
301,602
16,914
23,530
35,270
20308,892.0
211.41,140.0
10,243.424.7%
8,584.21,357.2
2028203,149.5
203,149.5307,320.4
66.1%249,822.1
81.3%379,593
71,414
308,179302,494
16,848
23,391
35,468
2031
8,977.8217.7
1,178.610,374.2
24.2%8,700.2
1,423.72029
209,857.0209,857.0
314,856.166.7%
256,299.981.9%
380,54263,600
316,942
302,685
16,775
23,237
35,914
20329,071.9
224.31,218.4
10,514.623.7%
8,825.41,492.6
2030216,863.3
216,863.3322,543.4
67.2%262,994.6
82.5%381,494
56,739
324,755301,955
16,710
23,070
36,620
2033
9,178.4231.0
1,260.010,669.4
23.3%8,962.3
1,563.82031
224,203.3224,203.3
330,513.967.8%
269,953.083.1%
382,44850,292
332,156
300,974
16,644
22,902
37,373
20349,292.5
237.91,303.4
10,833.822.8%
9,107.41,642.1
2032231,927.6
231,927.6338,796.9
68.5%277,217.8
83.7%383,404
44,369
339,035299,579
16,580
22,736
38,255
2035
9,407.5245.1
1,349.111,001.7
22.4%9,251.9
1,714.82033
240,066.7240,066.7
347,497.869.1%
284,856.184.3%
384,36238,771
345,591
298,059
16,533
22,580
39,055
20369,492.7
252.41,397.2
11,142.422.0%
9,368.71,771.3
2034248,681.5
248,681.5356,512.2
69.8%292,851.8
84.9%385,323
33,816
351,507295,862
16,503
22,429
40,120
2037
9,557.1260.0
1,448.111,265.2
21.7%9,465.9
1,830.02035
257,711.5257,711.5
366,013.770.4%
301,205.385.6%
386,28629,453
356,833
293,736
16,484
22,286
41,465
20389,601.2
267.81,501.4
11,370.421.3%
9,543.81,890.7
2036267,103.3
267,103.3375,975.4
71.0%309,880.1
86.2%387,252
25,495
361,757291,956
16,478
22,155
42,847
2039
9,652.1275.8
1,556.811,484.8
20.9%9,626.8
1,953.12037
276,754.5276,754.5
386,492.471.6%
318,852.186.8%
388,22021,883
366,337
290,705
16,481
22,033
44,304
20409,690.6
284.11,613.8
11,588.520.5%
9,699.02,018.1
2038286,647.7
286,647.7397,334.9
72.1%328,039.3
87.4%389,191
18,601
370,590289,559
16,496
21,920
45,786
2041
9,731.0292.6
1,672.111,695.8
20.1%9,772.7
2,085.12039
296,755.5296,755.5
408,579.372.6%
337,450.387.9%
390,16415,664
374,500
288,605
16,526
21,812
47,319
20429,771.9
301.41,731.8
11,805.219.7%
9,846.82,154.8
2040307,046.2
307,046.2420,203.8
73.1%347,072.4
88.5%391,139
13,090
378,049287,768
16,559
21,716
48,805
2043
9,835.9310.5
1,792.611,938.9
19.4%9,940.7
2,228.32041
317,503.9317,503.9
432,284.873.4%
356,929.889.0%
392,11710,848
381,269
287,061
16,598
21,621
50,187
20449,901.4
319.81,854.5
12,075.619.0%
10,037.12,303.7
2042328,115.5
328,115.5444,649.0
73.8%366,953.9
89.4%393,097
8,934
384,163286,430
16,651
21,539
51,431
2045
9,976.2329.4
1,917.312,222.9
18.7%10,142.2
2,381.82043
338,913.6338,913.6
457,352.274.1%
377,189.789.9%
394,0807,302
386,778
285,735
16,704
21,462
52,659
204610,062.9
339.21,981.3
12,383.418.4%
10,258.72,464.0
2044349,878.1
349,878.1470,413.7
74.4%387,630.2
90.3%395,065
5,899
389,166285,089
16,772
21,392
53,898
2047
10,176.5349.4
2,046.412,572.2
18.2%10,398.3
2,548.22045
361,010.5361,010.5
483,926.274.6%
398,305.690.6%
396,0534,684
391,369
284,483
16,842
21,336
55,145
204810,291.9
359.92,112.5
12,764.217.9%
10,540.92,636.5
2046372,334.9
372,334.9497,698.4
74.8%409,181.0
91.0%397,043
3,645
393,398283,861
16,916
21,282
56,342
2049
10,423.8370.7
2,179.812,974.3
17.6%10,698.8
2,726.92047
383,862.4383,862.4
511,848.975.0%
420,285.491.3%
398,0362,764
395,272
283,294
16,998
21,247
57,510
205010,568.1
381.82,248. 4
13,198.317.4%
10,868.72,820.8
2048395,623.7
395,623.7526,373.4
75.2%431,655.1
91.7%399,031
2,044
396,987282,684
17,092
21,218
58,629
2051
10,743.0393.3
2,318.513,454.8
17.2%11,065.6
2,916.72049
407,642.3407,642.3
541,422.775.3%
443,341.291.9%
400,0281,474
398,554
282,104
17,189
21,199
59,693
205210,916.6
405.12,390.2
13,711.817.0%
11,262.73,014.2
2050419,961.2
419,961.2556,802.9
75.4%455,338.5
92.2%401,028
1,020
400,008281,496
17,295
21,189
60,719
2053
11,102.8417.2
2,463.713,983.7
16.8%11,472.0
3,115.42051
432,620.2432,620.2
572,662.775.5%
467,696.992.5%
402,031676
401,355
280,940
17,410
21,193
61,681
205411,304.4
429.72,539.2
14,273.416.6%
11,697.03,220.8
2052445,620.8
445,620.8589,042.4
75.7%480,437.9
92.8%403,036
432
402,604280,506
17,526
21,201
62,571
2055
11,543.6442.6
2,616.914,603.1
16.5%11,955.7
3,331.42053
459,005.5459,005.5
606,072.075.7%
493,614.993.0%
404,044256
403,788
280,110
17,643
21,225
63,390
205611,791.4
455.92,696.8
14,944.216.3%
12,225.83,447.0
2054472,821.5
472,821.5623,545.5
75.8%507,236.9
93.2%405,054
132
404,922279,736
17,766
21,255
64,136
2057
12,061.4469.6
2,779.415,310.3
16.1%12,517.8
3,567.22055
487,153.2487,153.2
641,598.075.9%
521,374.293.4%
406,06653
406,013
279,335
17,891
21,298
64,814
205812,345.3
483.72,865.0
15,693.916.0%
12,825.23,691.8
2056502,060.1
502,060.1660,270.5
76.0%536,089.6
93.7%407,082
14
407,068278,889
18,011
21,357
65,426
2059
12,664.0498.2
2,954.016,116.2
15.9%13,164.3
3,821.12057
517,603.1517,603.1
679,756.676.1%
551,451.793.9%
408,0996
408,093
278,433
18,137
21,424
65,972
206012,983.0
513.13,046.8
16,542.915.8%
13,507.93,955.0
2058533,827.5
533,827.5699,851.1
76.3%567,482.0
94.1%409,120
2
409,118277,999
18,264
21,506
66,448
Assumptions:
‐ Projections are based on June 30, 2008 data and assumptions
‐ Projections have been adjusted to reflect known asset, liability, and population adjustm
ents through June 30, 2010‐ Population is assum
ed to grow 1/4 of 1%
per year‐ N
ew plans have been reflected for expected new
entrants‐ N
ew entrant populations are assum
ed to have the same characteristics as the population that entered the plan during FY 2008
‐ Investment returns are assum
ed to be 7.5% per year in the future, producing no future gains or losses in the sm
oothing method
‐ Administrative expenses are expected to increase 3%
over prior year (does not apply to FIRE)‐ Investm
ent expenses are assumed to be a fixed percent of assets ranging from
0.4% to 0.6%
depending on the System‐ The N
et City Contribution varies by System
ALL NYCRS Pension Fund Projections
Projection Using 7.50%
Interest and 0.25% Increasing Em
ployee Population($ in m
illions)
34
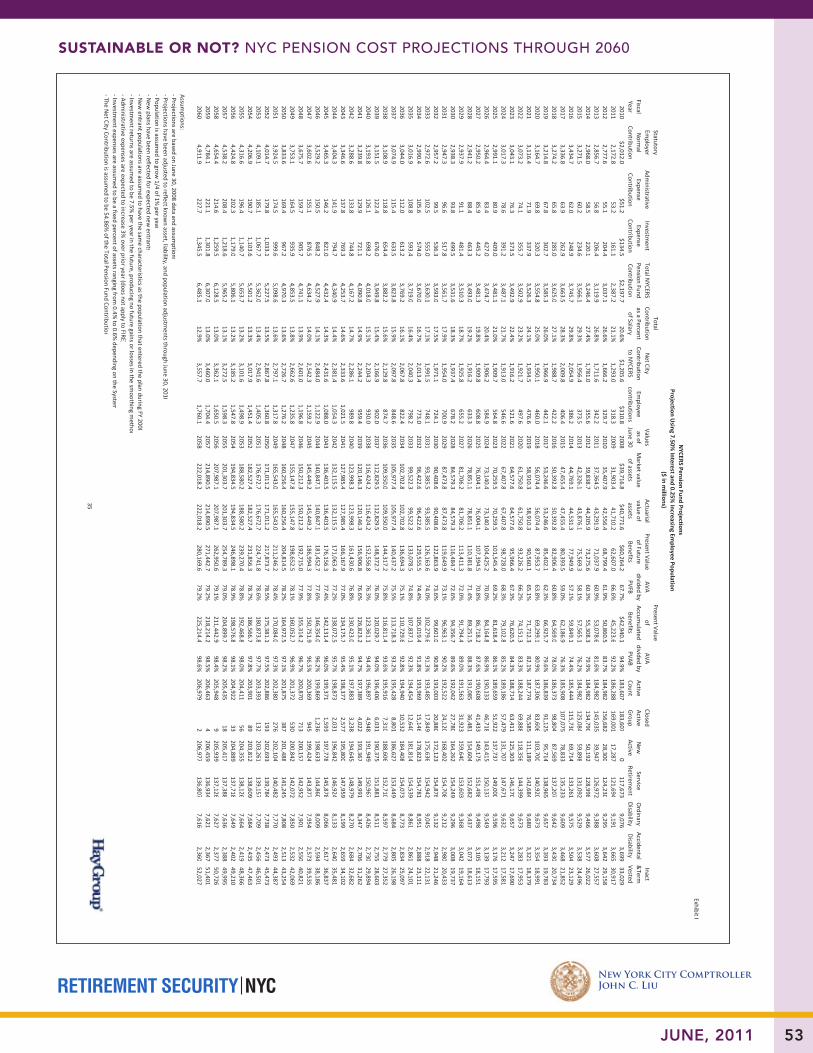
RETIREMENT SECURITY NYC
SUStaiNablE or Not? NYC PeNsioN Cost ProjeCtioNs through 2060
New York City ComptrollerJohn C. Liu
53JUNE, 2011
Exhibit I
Fiscal Year
Statutory Em
ployer Norm
al Contribution
Administrative
Expense Contribution
Investment
Expense Contribution
Total NYCERS
Pension Fund Contribution
Total Contribution as a Percent of Salary
Net City
Contribution to N
YCERSEm
ployee contributions
Values as of
June 30Market value of assets
Actuarial value of assets
Present Value of Future Benefits
AVA divided by
PVFB
Present Value of
Accumulated
Benefits
AVA divided by PVAB
Active Count
Closed Active Group
New
Active
Service Retirem
entOrdinary
DisabilityAccidental Disability
Inact &Term
Vested
2010$2,012.0
$51.2$134.5
$2,197.720.6%
$1,205.6$310.8
2008$39,716.8
$40,771.6$60,264.2
67.7%$42,940.1
94.9%183,607
183,6070
117,6739,076
3,69933,029
20112,172.8
53.2161.1
2,387.221.1%
1,293.0318.3
200931,903.4
41,710.262,607.0
66.6%45,223.6
92.2%186,288
169,00117,287
121,6949,191
3,66530,917
20122,777.6
55.1204.4
3,037.126.6%
1,666.2329.7
201035,407.9
42,556.468,799.4
61.9%50,860.5
83.7%184,982
156,68228,300
124,2309,295
3,64229,158
20132,856.7
56.8206.4
3,119.926.8%
1,711.6342.2
201137,364.5
43,291.971,037.9
60.9%53,078.6
81.6%184,982
145,03539,947
126,9729,388
3,60827,557
20142,968.0
58.5220.1
3,246.427.4%
1,781.0355.6
201239,838.7
44,205.973,275.6
60.3%55,308.3
79.9%184,982
134,79050,192
128,9989,466
3,57726,022
20153,271.5
60.2234.6
3,566.129.3%
1,956.4373.5
201342,326.1
43,876.175,569.3
58.1%57,565.1
76.2%184,982
125,08459,898
131,0929,529
3,53824,496
20163,434.7
62.0248.9
3,745.729.8%
2,054.9386.2
201444,769.1
44,531.377,949.9
57.1%59,849.1
74.4%185,444
115,73069,714
133,2619,575
3,50423,129
20173,336.8
63.9262.9
3,663.528.3%
2,009.8406.4
201547,455.4
47,455.480,393.5
59.0%62,186.9
76.3%185,908
107,07578,833
135,2339,609
3,46821,852
20183,274.2
65.8285.0
3,625.027.1%
1,988.7422.2
201650,392.8
50,392.882,906.4
60.8%64,569.0
78.0%186,373
98,80487,569
137,2079,642
3,43020,734
20193,214.8
67.8302.7
3,585.326.0%
1,966.9442.1
201753,246.6
53,246.685,402.1
62.3%66,925.7
79.6%186,839
91,12595,714
138,9659,657
3,39319,783
20203,164.7
69.8320.3
3,554.825.0%
1,950.1460.0
201856,074.4
56,074.487,953.7
63.8%69,299.1
80.9%187,306
83,606103,700
140,9209,673
3,35418,991
20213,116.4
71.9337.9
3,526.324.1%
1,934.5476.6
201958,910.3
58,910.390,560.1
65.1%71,712.3
82.1%187,774
76,585111,189
142,6849,680
3,32118,379
20223,073.2
74.1355.7
3,502.923.2%
1,921.7497.6
202061,750.8
61,750.893,226.2
66.2%74,151.3
83.3%188,244
69,888118,356
144,3999,673
3,28317,953
20233,043.1
76.3373.5
3,492.922.4%
1,916.2521.6
202164,577.6
64,577.695,966.4
67.3%76,620.5
84.3%188,714
63,411125,303
146,1709,657
3,24717,690
20243,017.3
78.6391.2
3,487.121.7%
1,913.0546.6
202267,407.8
67,407.898,728.0
68.3%79,102.8
85.2%189,186
57,479131,707
147,6719,632
3,21217,581
20252,991.1
80.9409.0
3,481.121.0%
1,909.7564.8
202370,259.5
70,259.5101,545.4
69.2%81,618.4
86.1%189,659
51,922137,737
149,0009,596
3,17617,595
20262,964.4
83.4427.0
3,474.720.4%
1,906.2584.9
202473,140.4
73,140.4104,425.2
70.0%84,164.8
86.9%190,133
46,718143,415
150,1379,549
3,13917,793
20272,950.2
85.9445.2
3,481.319.8%
1,909.8608.8
202576,004.1
76,004.1107,394.5
70.8%86,718.2
87.6%190,608
41,433149,175
151,4989,498
3,10518,151
20282,941.2
88.4463.3
3,493.019.2%
1,916.2633.3
202678,851.1
78,851.1110,381.8
71.4%89,251.5
88.3%191,085
36,481154,604
152,6829,437
3,07318,613
20292,937.9
91.1481.4
3,510.318.7%
1,925.8655.2
202781,706.2
81,706.2113,411.3
72.0%91,794.4
89.0%191,563
31,923159,640
153,6039,368
3,04219,164
20302,938.3
93.8499.5
3,531.618.3%
1,937.4678.2
202884,579.3
84,579.3116,484.7
72.6%94,356.7
89.6%192,042
27,780164,262
154,2499,296
3,00819,737
20312,947.3
96.6517.8
3,561.717.9%
1,954.0700.9
202987,473.8
87,473.8119,649.9
73.1%96,963.1
90.2%192,522
24,120168,402
154,7089,212
2,98020,433
20322,957.2
99.5536.3
3,593.017.5%
1,971.1724.1
203090,408.6
90,408.6122,863.9
73.6%99,601.0
90.8%193,003
20,880172,123
154,8769,132
2,94821,246
20332,972.6
102.5555.0
3,630.117.1%
1,991.5748.1
203193,385.5
93,385.5126,163.6
74.0%102,279.6
91.3%193,485
17,849175,636
154,9429,045
2,91822,131
20342,990.4
105.6574.0
3,670.016.7%
2,013.4773.0
203296,422.6
96,422.6129,555.5
74.4%105,019.4
91.8%193,969
15,146178,823
154,7818,951
2,88823,111
20353,016.9
108.8593.4
3,719.016.4%
2,040.3798.2
203399,522.3
99,522.3133,078.5
74.8%107,837.1
92.3%194,454
12,640181,814
154,5398,861
2,86124,101
20363,044.0
112.0613.2
3,769.216.1%
2,067.8822.4
2034102,702.8
102,702.8136,694.3
75.1%110,729.6
92.8%194,940
10,532184,408
154,0738,773
2,83425,097
20373,074.9
115.4633.5
3,823.815.9%
2,097.8848.6
2035105,977.4
105,977.4140,437.2
75.5%113,718.3
93.2%195,428
8,801186,627
153,4498,684
2,80526,198
20383,108.9
118.8654.4
3,882.215.6%
2,129.8874.7
2036109,350.0
109,350.0144,317.2
75.8%116,811.4
93.6%195,916
7,310188,606
152,7108,597
2,77927,352
20393,151.5
122.4676.0
3,949.815.4%
2,166.9902.0
2037112,829.5
112,829.5148,372.7
76.0%120,029.7
94.0%196,406
6,031190,375
151,8818,511
2,75528,603
20403,193.8
126.1698.2
4,018.015.1%
2,204.3930.0
2038116,424.2
116,424.2152,556.8
76.3%123,361.1
94.4%196,897
4,948191,949
150,9678,426
2,73029,894
20413,239.8
129.9721.1
4,090.814.9%
2,244.2959.4
2039120,146.3
120,146.3156,906.8
76.6%126,823.2
94.7%197,389
4,022193,367
149,9918,347
2,70631,262
20423,288.6
133.8744.8
4,167.214.7%
2,286.1989.8
2040123,998.3
123,998.3161,430.6
76.8%130,423.0
95.1%197,883
3,238194,645
148,9798,270
2,68432,682
20433,346.6
137.8769.3
4,253.714.6%
2,333.61,021.5
2041127,985.4
127,985.4166,167.9
77.0%134,175.7
95.4%198,377
2,577195,800
147,9598,199
2,65934,102
20443,404.3
141.9794.7
4,340.914.4%
2,381.41,054.3
2042132,115.5
132,115.5171,063.4
77.2%138,072.5
95.7%198,873
2,031196,842
146,9248,133
2,64035,481
20453,465.3
146.2821.0
4,432.414.3%
2,431.61,088.0
2043136,403.5
136,403.5176,156.3
77.4%142,131.4
96.0%199,371
1,593197,778
145,8788,066
2,61736,837
20463,529.2
150.5848.2
4,527.914.1%
2,484.01,122.9
2044140,847.1
140,847.1181,452.7
77.6%146,354.0
96.2%199,869
1,236198,633
144,8608,009
2,59438,186
20473,602.6
155.1876.5
4,634.214.0%
2,542.31,159.2
2045145,449.2
145,449.2186,994.3
77.8%150,751.9
96.5%200,369
945199,424
143,8777,954
2,57339,535
20483,675.7
159.7905.7
4,741.113.9%
2,601.01,196.8
2046150,212.3
150,212.3192,715.0
77.9%155,314.2
96.7%200,870
713200,157
142,9527,901
2,55040,821
20493,753.1
164.5935.9
4,853.513.8%
2,662.61,235.8
2047155,147. 8
155,147.8198,652.5
78.1%160,052.7
96.9%201,372
530200,842
142,0727,850
2,53242,069
20503,833.6
169.4967.2
4,970.313.6%
2,726.71,276.2
2048160,256.4
160,256.4204,814.5
78.2%164,972.5
97.1%201,875
387201,488
141,2457,808
2,51343,254
20513,924.5
174.5999.6
5,098.613.6%
2,797.11,317.8
2049165,543.0
165,543.0211,246.2
78.4%170,084.0
97.3%202,380
276202,104
140,4827,770
2,49344,387
20524,014.7
179.81,033.1
5,227.513.5%
2,867.81,360.8
2050171,011.2
171,011.2217,873.7
78.5%175,381.1
97.5%202,886
193202,693
139,7847,738
2,47345,473
20534,109.1
185.11,067.7
5,362. 013.4%
2,941.61,405.3
2051176,672.7
176,672.7224,741.8
78.6%180,873.8
97.7%203,393
132203,261
139,1577,709
2,45646,501
20544,206.9
190.71,103.6
5,501.213.3%
3,017.91,451.4
2052182,527.4
182,527.4231,856.3
78.7%186,566.7
97.8%203,901
89203,812
138,6097,684
2,43547,463
20554,316.6
196.41,140.7
5,653.713.2%
3,101.61,498.9
2053188,580.2
188,580.2239,270. 4
78.8%192,468.8
98.0%204,411
56204,355
138,1267,664
2,41948,366
20564,424.8
202.31,179.0
5,806.113.2%
3,185.21,547.8
2054194,834.5
194,834.5246,898.1
78.9%198,576.8
98.1%204,922
33204,889
137,7187,649
2,40249,210
20574,538.2
208.41,218.6
5,965.213.1%
3,272.51,598.3
2055201,303.7
201,303.7254,789.3
79.0%204,899.7
98.2%205,435
18205,417
137,3887,636
2,38849,995
20584,654.4
214.61,259.5
6,128.513.0%
3,362.11,650.5
2056207,987.1
207,987.1262,950.6
79.1%211,442.9
98.4%205,948
9205,939
137,1267,627
2,37750,726
20594,784.1
221.11,301.8
6,307.013.0%
3,460.01,704.4
2057214,890.5
214,890.5271,442.7
79.2%218,214.2
98.5%206,463
4206,459
136,9347,621
2,36751,401
20604,911.9
227.71,345.5
6,485.112.9%
3,557.71,760.1
2058222,018.2
222,018.2280,169.6
79.2%225,214.4
98.6%206,979
2206,977
136,8077,616
2,36052,027
Assumptions:
‐ Projections are based on June 30, 2008 data and assumption s
‐ Projections have been adjusted to reflect known asset, liability, and population adjustm
ents through June 30, 2010‐ Population is assum
ed to grow 1/4 of 1%
per year‐ N
ew plans have been reflected for expected new
entrants‐ N
ew entrant populations are assum
ed to have the same characteristics as the population that entered the plan during FY 2008
‐ Investment returns are assum
ed to be 7.5% per year in the future, producing no future gains or losses in the sm
oothing method
‐ Administrative expenses are expected to increase 3%
over prior year (does not apply to FIRE)‐ Investm
ent expenses are assumed to be a fixed percent of assets ranging from
0.4% to 0.6%
depending on the System‐ The N
et City Contribution is assumed to be 54.86%
of the Total Pension Fund Contribution
NYCERS Pension Fund Projections
Projection Using 7.50%
Interest and 0.25% Increasing Em
ployee Population($ in m
illions)35
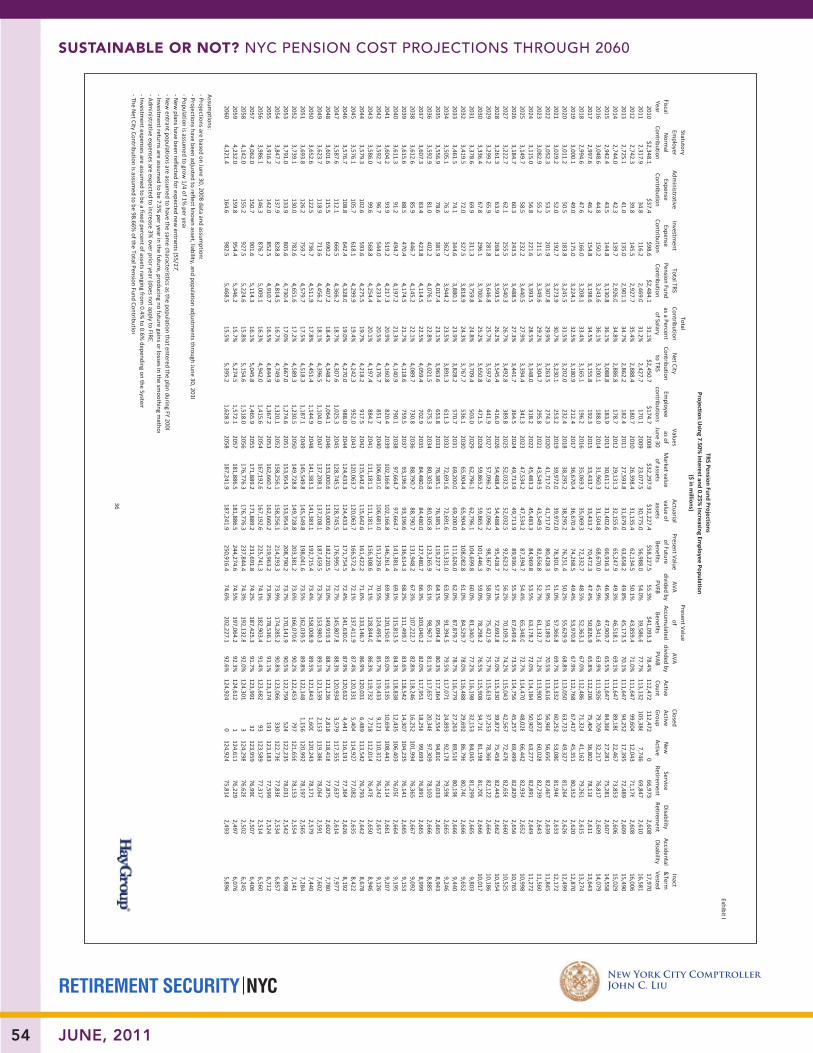
RETIREMENT SECURITY NYC
SUStaiNablE or Not? NYC PeNsioN Cost ProjeCtioNs through 2060
New York City ComptrollerJohn C. Liu
54 JUNE, 2011
Exhibit I
Fiscal Year
Statutory Em
ployer Norm
al Contribution
Administrative
Expense Contribution
Investment
Expense Contribution
Total TRS Pension Fund Contribution
Total Contribution as a Percent of Salary
Net City
Contribution to TRS
Employee
contributions
Values as of
June 30Market value of assets
Actuarial value of assets
Present Value of Future Benefits
AVA divided by
PVFB
Present Value of
Accumulated
Benefits
AVA divided by PVAB
Active Count
Closed Active Group
New
Active
Service Retirem
entDisability Retirem
entAccidental Disability
Inact &Term
Vested
2010$2,348.1
$37.4$98.6
$2,484.131.1%
$2,450.7$174.7
2008$32,297.9
$32,227.4$58,227.5
55.3%$41,093.3
78.4%112,472
112,4720
66,9732,608
17,9702011
2,317.934.8
116.22,469.0
31.2%2,427.7
170.12009
23,077.530,775.0
56,988.054.0%
39,586.677.7%
113,132105,386
7,74669,847
2,61016,581
20122,742.3
39.8145.5
2,927.735.4%
2,888.4180.7
201026,398.4
31,135.462,134.5
50.1%43,859.4
71.0%111,647
99,60412,043
71,1762,608
16,0062013
2,725.141.0
135.02,901.1
34.7%2,862.2
182.42011
27,593.831,679.0
63,658.249.8%
45,173.570.1%
111,64794,252
17,39572,489
2,60915,490
20142,744.0
42.3139.7
2,926.034.8%
2,886.8178.7
201229,131.3
32,155.665,247.9
49.3%46,518.1
69.1%111,647
89,18022,467
73,8532,606
15,0292015
2,942.443.5
144.83,130.8
36.1%3,088.8
183.92013
30,611.231,402.6
66,916.346.9%
47,909.765.5%
111,64784,366
27,28175,281
2,60714,558
20163,048.6
44.8150.2
3,243.636.1%
3,200.1188.0
201431,960.3
31,504.868,670.0
45.9%49,341.6
63.9%111,926
79,70932,217
76,8172,609
14,0792017
2,997.646.2
154.83,198.6
34.5%3,155.8
192.32015
33,433.733,433.7
70,472.347.4%
50,826.965.8%
112,20675,404
36,80278,118
2,61113,643
20182,994.6
47.6166.0
3,208.133.4%
3,165.1196.2
201635,069.3
35,069.372,332.7
48.5%52,363.1
67.0%112,486
71,32441,162
79,2612,615
13,2742019
3,000.149.0
175.03,224.1
32.5%3,180.9
212.42017
36,670.436,670.4
74,268.549.4%
53,970.867.9%
112,76867,417
45,35180,352
2,62012,870
20203,011.2
50.5183.8
3,245.531.5%
3,202.0232.4
201838,295.2
38,295.276,251.4
50.2%55,629.9
68.8%113,050
63,72349,327
81,2642,626
12,4992021
3,029.252.0
192.73,273.9
30.7%3,230.1
253.22019
39,972.039,972.0
78,301.651.0%
57,366.869.7%
113,33260,252
53,08081,946
2,63312,172
20223,052.3
53.5201.9
3,307.829.9%
3,263.5274.3
202041,717.0
41,717.080,428.3
51.9%59,189.2
70.5%113,616
56,96656,650
82,4672,639
11,8452023
3,082.955.2
211.53,349.6
29.2%3,304.7
295.82021
43,549.543,549.5
82,656.852.7%
61,132.771.2%
113,90053,872
60,02882,739
2,64311,560
20243,115.0
56.8221.6
3,393.528.5%
3,348.0318.2
202245,483.3
45,483.384,969.8
53.5%63,178.2
72.0%114,184
50,90763,277
82,8912,649
11,2722025
3,149.758.5
232.23,440.5
27.9%3,394.4
341.32023
47,534.247,534.2
87,394.754.4%
65,348.072.7%
114,47048,028
66,44282,934
2,65210,998
20263,184.7
60.3243.5
3,488.527.3%
3,441.7364.5
202449,713.9
49,713.989,936.7
55.3%67,649.6
73.5%114,756
45,25769,499
82,8292,656
10,7652027
3,222.762.1
255.53,540.3
26.7%3,492.8
389.82025
52,032.552,032.5
92,623.256.2%
70,109.274.2%
115,04342,567
72,47682,656
2,66010,525
20283,261.3
63.9268.3
3,593.526.2%
3,545.4416.0
202654,488.4
54,488.495,428.7
57.1%72,692.8
75.0%115,330
39,87275,458
82,4432,662
10,3542029
3,299.265.9
281.83,646.8
25.7%3,597.9
441.92027
57,096.257,096.2
98,367.658.0%
75,421.975.7%
115,61937,253
78,36682,122
2,66410,186
20303,336.4
67.8296.1
3,700.425.2%
3,650.8471.5
202859,865.2
59,865.2101,446.3
59.0%78,298.2
76.5%115,908
34,71081,198
81,7002,666
10,0172031
3,378.669.9
311.33,759.8
24.8%3,709.4
503.02029
62,796.162,796.1
104,699.860.0%
81,340.777.2%
116,19832,153
84,04581,299
2,6659,803
20323,419.5
72.0327.5
3,818.924.3%
3,767.7536.1
203065,904.4
65,904.4108,082.8
61.0%84,529.7
78.0%116,488
29,69286,796
80,7402,666
9,6522033
3,461.574.1
344.63,880.1
23.9%3,828.2
570.72031
69,200.069,200.0
111,626.062.0%
87,879.778.7%
116,77927,263
89,51680,198
2,6669,440
20343,505.1
76.3362.7
3,944.223.5%
3,891.3611.3
203272,691.6
72,691.6115,331.0
63.0%91,394.5
79.5%117,071
24,89392,178
79,5962,665
9,2462035
3,556.978.6
381.94,017.4
23.1%3,963.6
653.82033
76,385.176,385.1
119,227.764.1%
95,094.880.3%
117,36422,554
94,81079,033
2,6658,943
20363,592.9
81.0402.2
4,076.122.8%
4,021.5675.3
203480,305.8
80,305.8123,265.9
65.1%98,967.1
81.1%117,657
20,34897,309
78,1032,666
8,8852037
3,607.383.4
423.84,114.5
22.5%4,059.4
702.92035
84,480.084,480.0
127,480.766.3%
103,040.282.0%
117,95118,258
99,69376,891
2,6658,999
20383,612.6
85.9446.7
4,145.222.1%
4,089.7730.8
203688,790.7
88,790.7131,948.2
67.3%107,222.7
82.8%118,246
16,252101,994
76,3652,667
9,0922039
3,615.688.5
470.44,174.5
21.7%4,118.6
759.52037
93,196.693,196.6
136,614.368.2%
111,499.783.6%
118,54214,307
104,23576,141
2,6659,153
20403,611.3
91.2494.7
4,197.221.3%
4,140.9790.1
203897,664.7
97,664.7141,381.4
69.1%115,813.5
84.3%118,838
12,435106,403
76,0502,664
9,1952041
3,604.293.9
519.24,217.3
20.9%4,160.8
820.42039
102,166.8102,166.8
146,261.469.9%
120,150.685.0%
119,13510,694
108,44176,114
2,6619,207
20423,592.7
96.7544.0
4,233.420.5%
4,176.7851.7
2040106,681.0
106,681.0151,229.6
70.5%124,495.8
85.7%119,433
9,121110,312
76,2422,657
9,1262043
3,586.099.6
568.84,254.4
20.1%4,197.4
884.22041
111,181.1111,181.1
156,308.671.1%
128,844.086.3%
119,7327,718
112,01476,478
2,6508,946
20443,579.3
102.6593.6
4,275.519.7%
4,218.2917.5
2042115,642.6
115,642.6161,422.2
71.6%133,146.7
86.9%120,031
6,489113,542
76,7932,642
8,6782045
3,576.1105.7
618.14,299.9
19.4%4,242.3
952.02043
120,063.7120,063.7
166,572.472.1%
137,411.987.4%
120,3315,404
114,92777,082
2,6358,422
20463,576.7
108.8642.4
4,328.019.0%
4,270.0988.0
2044124,433.3
124,433.3171,754.5
72.4%141,630.0
87.9%120,632
4,441116,191
77,3642,626
8,1922047
3,587.6112.1
666.54,366.2
18.7%4,307.6
1,025.32045
128,745.5128,745.5
176,995.772.7%
145,807.888.3%
120,9343,579
117,35577,637
2,6147,977
20483,601.6
115.5690.2
4,407.218.4%
4,348.21,064.1
2046133,000.6
133,000.6182,220.5
73.0%149,919.3
88.7%121,236
2,818118,418
77,8752,602
7,7802049
3,623.7118.9
713.64,456.2
18.1%4,396.5
1,104.02047
137,208.1137,208.1
187,459.573.2%
153,980.389.1%
121,5392,153
119,38678,064
2,5917,602
20503,652.6
122.5736.7
4,511.917.8%
4,451. 41,144.9
2048141,383.1
141,383.1192,715.4
73.4%158,008.9
89.5%121,843
1,600120,243
78,1712,579
7,4402051
3,693.8126.2
759.74,579.7
17.5%4,518.3
1,187.12049
145,549.8145,549.8
198,041.673.5%
162,039.589.8%
122,1481,156
120,99278,197
2,5657,284
20523,739.1
130.0782.6
4,651.617.2%
4,589.31,230.5
2050149,728.8
149,728.8203,381.2
73.6%166,070.6
90.2%122,453
797121,656
78,1532,554
7,1412053
3,791.0133.9
805.64,730.4
17.0%4,667.0
1,274.62051
153,954.5153,954.5
208,790.273.7%
170,141.990.5%
122,759524
122,23578,031
2,5426,998
20543,847.7
137.9828.8
4,814.516.7%
4,749.91,320.1
2052158,256.1
158,256.1214,293.3
73.9%174,285.2
90.8%123,066
330122,736
77,8382,534
6,8572055
3,916.2142.0
852.54,910.7
16.5%4,844.9
1,367.22053
162,660.2162,660.2
219,963.273.9%
178,536.191.1%
123,374191
123,18377,599
2,5246,712
20563,986.1
146.3876.7
5,009.116.3%
4,942.01,415.6
2054167,192.6
167,192.6225,741.3
74.1%182,903.4
91.4%123,682
93123,589
77,3172,514
6,5602057
4,062.0150.7
901.65,114.3
16.1%5,045.8
1,465.92055
171,889.2171,889.2
231,691.874.2%
187,425.391.7%
123,99132
123,95976,990
2,5076,406
20584,142.0
155.2927.5
5,224.615.8%
5,154.61,518.0
2056176,776.3
176,776.3237,844.4
74.3%192,132.8
92.0%124,301
3124,298
76,6282,502
6,2452059
4,232.0159.8
954.45,346.2
15.7%5,274.5
1,572.12057
181,886.5181,886.5
244,274.674.5%
197,064.292.3%
124,6121
124,61176,229
2,4976,076
20604,321.4
164.6982.5
5,468.515.5%
5,395.21,628.3
2058187,241.9
187,241.9250,916.4
74.6%202,227.1
92.6%124,924
0124,924
75,8142,493
5,896
Assumptions:
‐ Projections are based on June 30, 2008 data and assumptions
‐ Projections have been adjusted to reflect known asset, liability, and population adjustm
ents through June 30, 2010‐ Population is assum
ed to grow 1/4 of 1%
per year‐ N
ew plans have been reflected for expected new
entrants (55/27)‐ N
ew entrant populations are assum
ed to have the same characteristics as the population that entered the plan during FY 2008
‐ Investment returns are assum
ed to be 7.5% per year in the future, producing no future gains or losses in the sm
oothing method
‐ Administrative expenses are expected to increase 3%
over prior year (does not apply to FIRE)‐ Investm
ent expenses are assumed to be a fixed percent of assets ranging from
0.4% to 0.6%
depending on the System‐ The N
et City Contribution is assumed to be 98.66%
of the Total Pension Fund Contribution
TRS Pension Fund ProjectionsProjection U
sing 7.50% Interest and 0.25%
Increasing Employee Population
($ in millions)
36
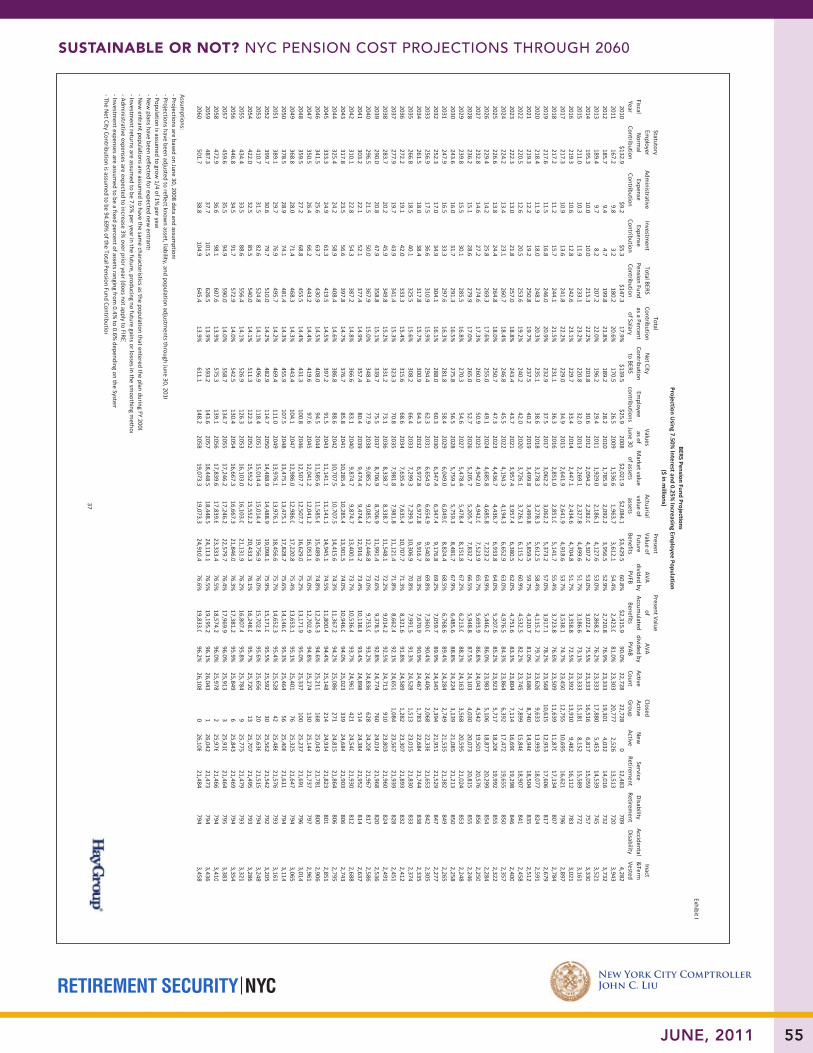
RETIREMENT SECURITY NYC
SUStaiNablE or Not? NYC PeNsioN Cost ProjeCtioNs through 2060
New York City ComptrollerJohn C. Liu
55JUNE, 2011
Exhibit I
Fiscal Year
Statutory Em
ployer Norm
al Contribution
Administrative
Expense Contribution
Investment
Expense Contribution
Total BERS Pension Fund Contribution
Total Contribution as a Percent of Salary
Net City
Contribution to BERS
Employee
contributions
Values as of
June 30Market value of assets
Actuarial value of assets
Present Value of Future Benefits
AVA divided by
PVFB
Present Value of
Accumulated
Benefits
AVA divided by PVAB
Active Count
Closed Active Group
New
Active
Service Retirem
entDisability Retirem
entAccidental Disability
Inact &Term
Vested
2010$132.9
$9.2$5.3
$147.317.9%
$139.5$25.9
2008$2,021.9
$2,084.1$3,429.5
60.8%$2,315.9
90.0%22,728
22,728
012,483
7094,282
2011167.2
9.83.2
180.220.6%
170.526.5
20091,536.6
1,963.73,612.1
54.4%2,423.0
81.0%23,303
20,777
2,52613,513
7203,943
2012185.7
9.44.7
199.821.8%
189.228.2
20101,785.9
2,092.23,956.5
52.9%2,720.8
76.9%23,333
19,301
4,03214,016
7323,732
2013189.4
9.78.2
207.222.0%
196.229.4
20111,929.0
2,186.14,127.6
53.0%2,868.2
76.2%23,333
17,880
5,45314,539
7453,521
2014195.3
10.010.0
215.322.2%
203.830.6
20122,094.2
2,282.04,307.2
53.0%3,022.4
75.5%23,333
16,516
6,81715,059
7573,330
2015211.0
10.311.9
233.123.2%
220.832.0
20132,269.1
2,327.84,499.6
51.7%3,186.6
73.1%23,333
15,181
8,15215,589
7723,161
2016219.3
10.612.8
242.623.1%
229.733.4
20142,447.1
2,434.64,704.8
51.7%3,358.8
72.5%23,392
13,910
9,48216,112
7833,021
2017217.3
10.913.6
241.822.2%
229.034.9
20152,641.9
2,641.94,918.6
53.7%3,538.1
74.7%23,450
12,755
10,69516,621
7962,897
2018217.2
11.215.7
244.121.5%
231.136.3
20162,851.0
2,851.05,141.7
55.4%3,723.8
76.6%23,509
11,639
11,87017,134
8072,784
2019217.6
11.516.8
246.020.9%
232.937.5
20173,062.2
3,062.25,373.2
57.0%3,917.1
78.2%23,568
10,615
12,95317,606
8172,679
2020218.4
11.918.0
248.320.3%
235.138.6
20183,278.3
3,278.35,612.5
58.4%4,115.2
79.7%23,626
9,633
13,99318,077
8242,591
2021219.3
12.219.2
250.819.7%
237.540.2
20193,499.8
3,499.85,859.5
59.7%4,320.7
81.0%23,686
8,740
14,94618,504
8352,512
2022220.5
12.620.5
253.619.2%
240.242.0
20203,726.1
3,726.16,115.2
60.9%4,532.5
82.2%23,745
7,899
15,84618,907
8412,458
2023222.3
13.021.8
257.018.8%
243.443.7
20213,957.4
3,957.46,380.5
62.0%4,751.6
83.3%23,804
7,114
16,69019,298
8462,400
2024224.2
13.423.1
260.718.4%
246.845.5
20224,194.3
4,194.36,652.9
63.0%4,976.5
84.3%23,864
6,392
17,47219,655
8502,357
2025226.6
13.824.4
264.818.0%
250.747.3
20234,436.7
4,436.76,933.8
64.0%5,207.6
85.2%23,923
5,717
18,20619,992
8552,322
2026229.4
14.225.8
269.317.6%
255.049.1
20244,685.8
4,685.87,223.2
64.9%5,446.2
86.0%23,983
5,106
18,87720,299
8542,284
2027232.8
14.627.2
274.617.3%
260.050.9
20254,942.0
4,942.07,523.9
65.7%5,693.9
86.8%24,043
4,542
19,50120,576
8562,250
2028236.2
15.128.6
279.917.0%
265.052.7
20265,205.7
5,205.77,832.7
66.5%5,948.8
87.5%24,103
4,030
20,07320,815
8552,246
2029239.8
15.530.1
285.516.8%
270.354.6
20275,478.4
5,478.48,151.8
67.2%6,213.0
88.2%24,163
3,568
20,59521,024
8532,248
2030243.6
16.031.7
291.316.5%
275.856.5
20285,759.3
5,759.38,481.7
67.9%6,485.6
88.8%24,224
3,139
21,08521,213
8502,258
2031247.9
16.533.3
297.616.3%
281.858.4
20296,049.0
6,049.08,824.4
68.5%6,768.6
89.4%24,284
2,749
21,53521,382
8492,265
2032252.3
17.034.9
304.116.1%
288.060.3
20306,347.4
6,347.49,176.8
69.2%7,059.7
89.9%24,345
2,394
21,95121,529
8472,277
2033256.9
17.536.6
310.915.9%
294.462.3
20316,654.9
6,654.99,540.8
69.8%7,360.0
90.4%24,406
2,068
22,33821,653
8422,305
2034261.5
18.038.4
317.815.7%
300.964.3
20326,972.8
6,972.89,916.7
70.3%7,670.9
90.9%24,467
1,783
22,68421,744
8382,335
2035266.8
18.540.1
325.515.6%
308.266.4
20337,299.3
7,299.310,306.9
70.8%7,991.5
91.3%24,528
1,513
23,01521,830
8332,374
2036272.2
19.142.0
333.315.4%
315.668.6
20347,635.4
7,635.410,707.7
71.3%8,321.6
91.8%24,589
1,282
23,30721,893
8322,412
2037277.9
19.743.9
341.415.3%
323.370.8
20357,981.8
7,981.811,121.4
71.8%8,662.4
92.1%24,651
1,084
23,56721,939
8282,451
2038283.7
20.245.9
349.815.2%
331.273.1
20368,338.7
8,338.711,548.1
72.2%9,014.2
92.5%24,713
910
23,80321,960
8242,491
2039290.0
20.847.9
358.815.1%
339.775.5
20378,706.9
8,706.911,991.4
72.6%9,378.5
92.8%24,774
760
24,01421,968
8202,536
2040296.5
21.550.0
367.915.0%
348.477.9
20389,085.2
9,085.212,446.8
73.0%9,753.0
93.2%24,836
628
24,20821,967
8172,586
2041303.2
22.152.1
377.414.9%
357.480.4
20399,474.4
9,474.412,916.2
73.4%10,138.8
93.4%24,898
514
24,38421,952
8142,637
2042310.1
22.854.3
387.214.8%
366.683.1
20409,874.7
9,874.713,400.1
73.7%10,536.4
93.7%24,961
421
24,54021,930
8122,688
2043317.8
23.556.6
397.814.7%
376.785.8
204110,285.4
10,285.413,901.5
74.0%10,946.0
94.0%25,023
339
24,68421,903
8062,743
2044325.4
24.258.9
408.414.6%
386.888.6
204210,707.5
10,707.514,415.6
74.3%11,367.2
94.2%25,086
271
24,81521,864
8062,795
2045333.3
24.961.3
419.514.5%
397.291.5
204311,141.1
11,141.114,945.1
74.5%11,800.4
94.4%25,148
214
24,93421,823
8012,851
2046341.5
25.663.7
430.914.5%
408.094.5
204411,585.6
11,585.615,489.6
74.8%12,245.3
94.6%25,211
168
25,04321,781
8002,906
2047350.5
26.466.2
443.214.4%
419.697.6
204512,041.2
12,041.216,053.1
75.0%12,702.9
94.8%25,274
130
25,14421,737
7972,961
2048359.5
27.268.8
455.514.4%
431.3100.8
204612,507.7
12,507.716,629.0
75.2%13,171.9
95.0%25,337
100
25,23721,691
7963,014
2049368.8
28.071.4
468.314.3%
443.4104.1
204712,986.0
12,986.017,220.8
75.4%13,653.1
95.1%25,401
76
25,32521,647
7943,065
2050378.5
28.974.1
481.414.3%
455.9107.5
204813,475.1
13,475.117,828.7
75.6%14,146.0
95.3%25,464
56
25,40821,611
7943,114
2051389.1
29.776.9
495.714.2%
469.4111.0
204913,976.1
13,976.118,456.6
75.7%14,652.3
95.4%25,528
42
25,48621,576
7933,161
2052399.7
30.679.7
510.014.2%
482.9114.7
205014,488.9
14,488.919,098.1
75.9%15,171.0
95.5%25,592
30
25,56221,542
7923,205
2053410.7
31.582.6
524.814.1%
496.9118.4
205115,014. 4
15,014.419,756.9
76.0%15,702.8
95.6%25,656
20
25,63621,515
7943,248
2054422.0
32.585.5
540.014.1%
511.3122.3
205215,552.2
15,552.220,433.3
76.1%16,248.0
95.7%25,720
13
25,70721,495
7933,286
2055434.4
33.588.6
556.414.1%
526.9126.3
205316,103. 0
16,103.021,131.9
76.2%16,807.4
95.8%25,784
9
25,77521,479
7933,321
2056446.8
34.591.7
572.914.0%
542.5130.4
205416,667.3
16,667.321,846.0
76.3%17,381.2
95.9%25,849
6
25,84321,469
7943,354
2057459.6
35.594.9
590.014.0%
558.7134.7
205517,246.2
17,246.222,579.7
76.4%17,969.9
96.0%25,913
3
25,91021,464
7953,383
2058472.9
36.698.1
607.613.9%
575.3139.1
205617,839.6
17,839.623,333.4
76.5%18,574.2
96.0%25,978
2
25,97621,466
7943,410
2059487.3
37.7101.5
626.513.9%
593.2143.6
205718,448.5
18,448.524,113.1
76.5%19,195.2
96.1%26,043
1
26,04221,473
7943,436
2060501.7
38.8104.9
645.413.9%
611.1148.2
205819,073.3
19,073.324,910.4
76.6%19,833.0
96.2%26,108
0
26,10821,484
7943,458
Assumptions:
‐ Projections are based on June 30, 2008 data and assumption s
‐ Projections have been adjusted to reflect known asset, liability, and population adjustm
ents through June 30, 2010‐ Population is assum
ed to grow 1/4 of 1%
per year‐ N
ew plans have been reflected for expected new
entrants‐ N
ew entrant populations are assum
ed to have the same characteristics as the population that entered the plan during FY 2008
‐ Investment returns are assum
ed to be 7.5% per year in the future, producing no future gains or losses in the sm
oothing method
‐ Administrative expenses are expected to increase 3%
over prior year (does not apply to FIRE)‐ Investm
ent expenses are assumed to be a fixed percent of assets ranging from
0.4% to 0.6%
depending on the System‐ The N
et City Contribution is assumed to be 94.69%
of the Total Pension Fund Contribution
BERS Pension Fund ProjectionsProjection U
sing 7.50% Interest and 0.25%
Increasing Employee Population
($ in millions)37
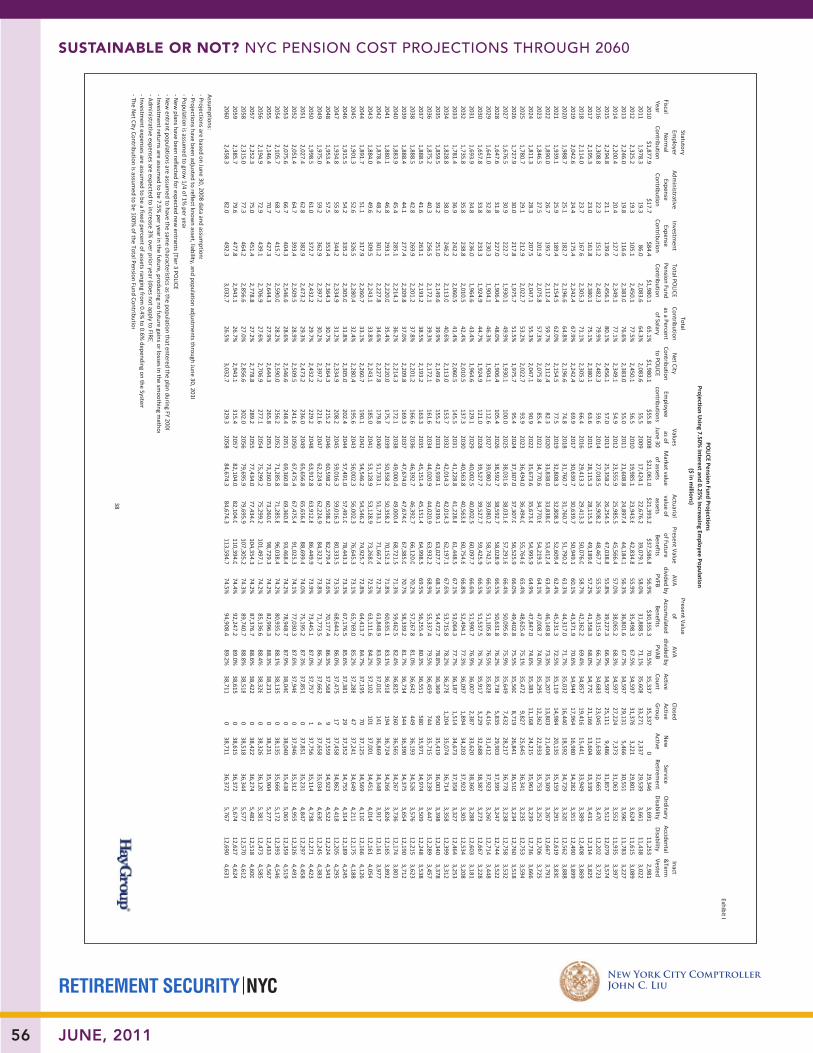
RETIREMENT SECURITY NYC
SUStaiNablE or Not? NYC PeNsioN Cost ProjeCtioNs through 2060
New York City ComptrollerJohn C. Liu
56 JUNE, 2011
Exhibit I
Fiscal Year
Statutory Em
ployer Norm
al Contribution
Administrative
Expense Contribution
Investment
Expense Contribution
Total POLICE
Pension Fund Contribution
Total Contribution as a Percent of Salary
Net City
Contribution to PO
LICEEm
ployee contributions
Values as of
June 30Market value of assets
Actuarial value of assets
Present Value of Future Benefits
AVA divided by
PVFB
Present Value of
Accumulated
Benefits
AVA divided by PVAB
Active Count
Closed Active Group
New
Active
Service Retirem
entOrdinary
DisabilityAccidental Disability
Inact &Term
Vested
2010$1,877.9
$17.7$84.4
$1,980.165.1%
$1,980.1$55.8
2008$21,061.0
$21,393.2$37,586.8
56.9%$30,355.3
70.5%35,337
35,337
029,346
3,69111,253
2,9812011
1,978.319.3
86.02,083.6
64.3%2,083.6
55.52009
17,424.122,676.2
39,079.158.0%
31,888.571.1%
35,608
33,2712,337
29,5393,661
11,4383,022
20122,325.2
19.3105.1
2,450.177.5%
2,450.156.5
201019,985.1
23,943.642,834.8
55.9%35,498.3
67.5%34,597
31,376
3,22129,801
3,62411,615
3,0892013
2,246.019.8
116.62,383.0
76.6%2,383.0
55.02011
21,608.824,897.4
44,184.156.3%
36,801.667.7%
34,597
29,1315,466
30,5513,590
11,7833,227
20142,200.4
20.4127.7
2,349.177.1%
2,349.154.9
201223,555.9
25,985.545,566.4
57.0%38,065.2
68.3%34,597
27,224
7,37331,063
3,55211,935
3,3972015
2,294.821.1
139.62,456.1
80.1%2,456.1
57.02013
25,358.226,254.5
47,038.855.8%
39,227.366.9%
34,597
25,1119,486
31,8573,512
12,0793,574
20162,308.8
22.3151.2
2,482.379.9%
2,482.359.6
201427,018.5
26,908.248,467.7
55.5%40,315.9
66.7%34,683
23,045
11,63832,665
3,47012,202
3,7232017
2,195.323.0
161.82,380.1
75.1%2,380.1
63.62015
28,115.328,115.3
49,189.657.2%
41,358.368.0%
34,770
21,16613,604
33,3393,431
12,3143,825
20182,114.0
23.7167.6
2,305.371.1%
2,305.366.4
201629,413.3
29,413.350,076.0
58.7%42,362.2
69.4%34,857
19,416
15,44133,949
3,38912,408
3,8692019
2,042.624.4
175.42,242.4
67.9%2,242.4
69.92017
30,639.730,639.7
50,949.160.1%
43,371.970.6%
34,944
17,96416,980
34,2823,351
12,4903,899
20201,988.7
25.1182.7
2,196.664.8%
2,196.674.8
201831,760.7
31,760.751,790.2
61.3%44,317.0
71.7%35,032
16,440
18,59234,729
3,32012,562
3,8882021
1,939.125.9
189.42,154.5
62.0%2,154.5
77.52019
32,808.332,808.3
52,609.462.4%
45,231.372.5%
35,119
14,98420,135
35,1593,291
12,6193,830
20221,890.0
26.7195.7
2,112.459.7%
2,112.482.3
202033,838.0
33,838.053,412.4
63.4%46,149.8
73.3%35,207
13,803
21,40435,309
3,26712,667
3,7912023
1,846.527.5
201.92,075.8
57.3%2,075.8
85.42021
34,770.634,770.6
54,219.564.1%
47,008.774.0%
35,295
12,36222,933
35,7533,252
12,7063,725
20241,811.3
28.3207.5
2,047.155.3%
2,047.190.9
202235,673.6
35,673.654,995.9
64.9%47,847.0
74.6%35,383
11,168
24,21535,963
3,23912,736
3,6662025
1,780.729.1
212.92,022.7
53.2%2,022.7
93.92023
36,494.036,494.0
55,764.665.4%
48,625.475.1%
35,472
9,82725,645
36,3413,235
12,7533,594
20261,727.9
30.0217.8
1,975.751.5%
1,975.795.4
202437,307.0
37,307.056,525.9
66.0%49,402.8
75.5%35,560
8,719
26,84136,510
3,23412,760
3,5182027
1,676.530.9
222.71,930.1
49.9%1,930.1
100.02025
38,031.638,031.6
57,291.666.4%
50,095.675.9%
35,649
7,43228,217
36,7783,238
12,7583,532
20281,647.6
31.8227.0
1,906.448.0%
1,906.4105.4
202638,592.7
38,592.758,028.9
66.5%50,631.8
76.2%35,738
5,835
29,90337,395
3,24712,744
3,5222029
1,641.032.8
230.31,904.1
46.3%1,904.1
112.62027
39,080.239,080.2
58,742.566.5%
51,105.876.5%
35,828
4,41631,412
37,9233,260
12,7143,448
20301,657.8
33.8233.3
1,924.944.7%
1,924.9121.0
202839,527.7
39,527.759,425.9
66.5%51,537.5
76.7%35,917
3,229
32,68838,387
3,27312,667
3,2282031
1,693.934.8
236.01,964.6
43.4%1,964.6
129.12029
40,002.540,002.5
60,097.766.6%
51,990.776.9%
36,007
2,38733,620
38,3603,288
12,6033,181
20321,735.8
35.8238.8
2,010.542.4%
2,010.5137.3
203040,563.8
40,563.860,754.6
66.8%52,494.1
77.3%36,097
1,894
34,20337,923
3,30512,534
3,2082033
1,781.436.9
242.22,060.5
41.4%2,060.5
145.52031
41,228.841,228.8
61,448.567.1%
53,064.377.7%
36,187
1,51434,673
37,3583,327
12,4643,253
20341,828.8
38.0246.2
2,113.040.6%
2,113.0153.7
203242,014.3
42,014.362,197.1
67.6%53,715.8
78.2%36,278
1,204
35,07436,714
3,35812,399
3,3122035
1,859.539.2
251.02,149.6
39.9%2,149.6
155.22033
42,939.142,939.1
63,027.768.1%
54,472.778.8%
36,369
95035,419
36,0033,398
12,3403,378
20361,875.2
40.3256.5
2,172.139.3%
2,172.1161.6
203444,020.9
44,020.963,932.2
68.9%55,337.4
79.5%36,459
744
35,71535,239
3,44712,289
3,4572037
1,888.541.6
263.12,193.2
38.5%2,193.2
163.32035
45,151.445,151.4
64,998.569.5%
56,255.480.3%
36,551
58035,971
34,9743,509
12,2483,538
20381,888.5
42.8269.9
2,201.237.8%
2,201.2166.6
203646,392.7
46,392.766,120.0
70.2%57,267.8
81.0%36,642
449
36,19334,526
3,57612,215
3,6232039
1,888.444.1
277.42,209.8
37.0%2,209.8
169.32037
47,674.047,674.0
67,385.070.7%
58,339.281.7%
36,734
34436,390
34,3753,654
12,1903,712
20401,883.9
45.4285.1
2,214.336.2%
2,214.3172.1
203849,000.4
49,000.468,721.5
71.3%59,462.5
82.4%36,825
260
36,56534,267
3,73612,174
3,8012041
1,880.146.8
293.12,220.0
35.4%2,220.0
175.72039
50,358.250,358.2
70,152.371.8%
60,635.183.1%
36,918
19436,724
34,2663,826
12,1653,892
20421,878.4
48.2301.2
2,227.834.6%
2,227.8179.8
204051,733.1
51,733.171,667.4
72.2%61,848.9
83.6%37,010
141
36,86934,348
3,91712,161
3,9772043
1,884.049.6
309.52,243.1
33.8%2,243.1
185.02041
53,128.953,128.9
73,268.072.5%
63,111.684.2%
37,102
10137,001
34,4514,014
12,1614,054
20441,891.7
51.1317.9
2,260.733.1%
2,260.7190.1
204254,546.2
54,546.274,925.7
72.8%64,413.7
84.7%37,195
70
37,12534,569
4,11012,166
4,1262045
1,901.352.6
326.52,280.4
32.4%2,280.4
195.62043
56,002.356,002.3
76,645.373.1%
65,769.085.2%
37,288
4737,241
34,6494,211
12,1754,188
20461,915.5
54.2335.2
2,305.031.8%
2,305.0202.4
204457,491.0
57,491.078,443.3
73.3%67,176.5
85.6%37,381
29
37,35234,755
4,31412,189
4,2452047
1,934.855.8
344.22,334.9
31.2%2,334.9
208.22045
59,016.359,016.3
80,333.573.5%
68,644.286.0%
37,475
1737,458
34,8624,418
12,2054,295
20481,953.4
57.5353.4
2,364.330.7%
2,364.3215.2
204660,598.2
60,598.282,279.4
73.6%70,177.4
86.3%37,568
9
37,55934,923
4,52212,224
4,3432049
1,975.059.2
362.92,397.2
30.2%2,397.2
221.62047
62,224.962,224.9
84,323.773.8%
71,773.586.7%
37,662
437,658
35,0344,630
12,2454,383
20501,998.5
61.0372.7
2,432.229.7%
2,432.2229.2
204863,912. 8
63,912.886,449.9
73.9%73,445.1
87.0%37,757
1
37,75635,114
4,73812,271
4,4232051
2,027.462.8
382.92,473.2
29.3%2,473.2
236.02049
65,656.865,656.8
88,699.474.0%
75,195.287.3%
37,851
037,851
35,2314,847
12,2974,458
20522,051.4
64.7393.4
2,509.528.9%
2,509.5241.6
205067,475.4
67,475.491,025.3
74.1%77,030.3
87.6%37,946
0
37,94635,312
4,95512,326
4,4912053
2,075.666.7
404.32,546.6
28.6%2,546.6
248.42051
69,360.869,360.8
93,468.474.2%
78,948.787.9%
38,040
038,040
35,4385,065
12,3594,519
20542,105.7
68.7415.7
2,590.028.2%
2,590.0256.2
205271,285.8
71,285.896,038.4
74.2%80,935.2
88.1%38,135
0
38,13535,666
5,17212,393
4,5462055
2,146.470.7
427.32,644.3
27.9%2,644.3
265.82053
73,260.073,260.0
98,729.374.2%
82,996.388.3%
38,231
038,231
35,9045,277
12,4334,567
20562,194.9
72.9439.1
2,706.927.6%
2,706.9277.1
205475,299.2
75,299.2101,497.1
74.2%85,136.6
88.4%38,326
0
38,32636,120
5,38112,473
4,5852057
2,252.375.0
451.42,778.8
27.2%2,778.8
289.22055
77,434.077,434.0
104,354.374.2%
87,376.788.6%
38,422
038,422
36,2745,482
12,5184,600
20582,315.0
77.3464.2
2,856.627.0%
2,856.6302.0
205679,695.9
79,695.9107,305.2
74.3%89,740.7
88.8%38,518
0
38,51836,344
5,57712,570
4,6122059
2,385.779.6
477.82,943.1
26.7%2,943.1
315.42057
82,104.082,104.0
110,394.074.4%
92,247.289.0%
38,615
038,615
36,3725,674
12,6274,624
20602,458.3
82.0492.3
3,032.726.5%
3,032.7329.3
205884,674.3
84,674.3113,594.7
74.5%94,908.4
89.2%38,711
0
38,71136,372
5,76712,690
4,631
Assumptions:
‐ Projections are based on June 30, 2008 data and assumptions
‐ Projections have been adjusted to reflect known asset, liability, and population adjustm
ents through June 30, 2010‐ Population is assum
ed to grow 1/4 of 1%
per year‐ N
ew plans have been reflected for expected new
entrants (Tier 3 POLICE)
‐ New
entrant populations are assumed to have the sam
e characteristics as the population that entered the plan during FY 2008‐ Investm
ent returns are assumed to be 7.5%
per year in the future, producing no future gains or losses in the smoothing m
ethod‐ Adm
inistrative expenses are expected to increase 3% over prior year (does not apply to FIRE)
‐ Investment expenses are assum
ed to be a fixed percent of assets ranging from 0.4%
to 0.6% depending on the System
‐ The Net City Contribution is assum
ed to be 100% of the Total Pension Fund Contribution
POLICE Pension Fund Projections
Projection Using 7.50%
Interest and 0.25% Increasing Em
ployee Population($ in m
illions)38
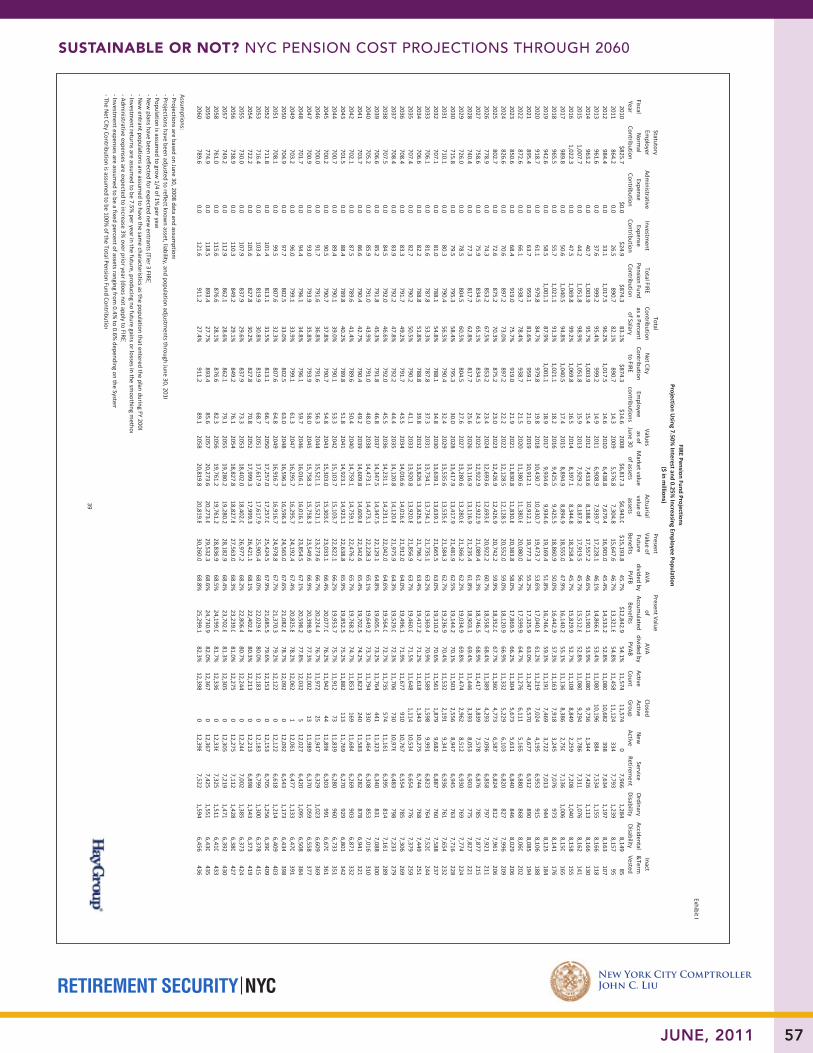
RETIREMENT SECURITY NYC
SUStaiNablE or Not? NYC PeNsioN Cost ProjeCtioNs through 2060
New York City ComptrollerJohn C. Liu
57JUNE, 2011
Exhibit I
Fiscal Year
Statutory Em
ployer Norm
al Contribution
Administrative
Expense Contribution
Investment
Expense Contribution
Total FIRE Pension Fund Contribution
Total Contribution as a Percent of Salary
Net City
Contribution to FIRE
Employee
contributions
Values as of
June 30Market value of assets
Actuarial value of assets
Present Value of Future Benefits
AVA divided by
PVFB
Present Value of
Accumulated
Benefits
AVA divided by PVAB
Active Count
Closed Active Group
New
Active
Service Retirem
entOrdinary
DisabilityAccidental Disability
Inact &Term
Vested
2010$825.7
$0.0$24.9
$874.383.1%
$874.3$14.6
2008$6,817.3
$6,943.0$15,193.8
45.7%$12,842.9
54.1%11,574
11,574
07,966
1,2848,149
852011
864.20.0
26.5890.7
82.1%890.7
14.32009
5,576.87,304.8
15,647.646.7%
13,321.654.8%
11,458
11,124334
7,7931,239
8,15795
2012984.4
0.033.1
1,017.596.2%
1,017.514.6
20106,438.8
7,679.416,905.0
45.4%14,533.2
52.8%11,080
10,682
3987,634
1,1978,163
1072013
961.60.0
37.6999.2
95.4%999.2
14.92011
6,908.97,939.7
17,228.146.1%
14,866.653.4%
11,080
10,196884
7,5341,155
8,166118
2014963.2
0.040.7
1,003.995.7%
1,003.915.4
20127,433.6
8,188.417,557.2
46.6%15,190.1
53.9%11,080
9,736
1,3447,426
1,1138,166
1302015
1,007.70.0
44.21,051.8
98.9%1,051.8
15.92013
7,929.28,187.8
17,919.545.7%
15,512.652.8%
11,080
9,2941,786
7,3111,076
8,162141
20161,022.3
0.047.5
1,069.899.2%
1,069.816.5
20148,397.1
8,344.818,258.4
45.7%15,829.9
52.7%11,108
8,849
2,2597,208
1,0408,158
1552017
989.80.0
50.61,040.5
94.8%1,040.5
17.42015
8,894.98,894.9
18,555.047.9%
16,140.255.1%
11,136
8,3862,750
7,1361,006
8,150165
2018965.5
0.055.7
1,021.191.3%
1,021.118.2
20169,425.5
9,425.518,860.9
50.0%16,442.9
57.3%11,163
7,918
3,2457,076
9738,141
1762019
942.60.0
58.51,001.1
87.9%1,001.1
18.92017
9,934.69,934.6
19,169.451.8%
16,746.459.3%
11,191
7,4693,722
7,013944
8,125184
2020918.7
0.061.1
979.884.7%
979.819.8
201810,430.7
10,430.719,473.7
53.6%17,040.8
61.2%11,219
7,024
4,1956,953
9158,106
1882021
895.40.0
63.7959.1
81.6%959.1
21.02019
10,912.110,912.1
19,777.355.2%
17,325.963.0%
11,247
6,5704,677
6,912890
8,085194
2022872.6
0.066.1
938.778.4%
938.721.5
202011,380.6
11,380.620,080.0
56.7%17,599.9
64.7%11,276
6,111
5,1656,880
8688,060
2022023
850.60.0
68.4919.0
75.7%919.0
21.92021
11,830.811,830.8
20,383.858.0%
17,869.566.2%
11,304
5,6735,631
6,840846
8,029206
2024826.6
0.070.6
897.273.0%
897.222.2
202212,128.5
12,128.520,552.0
59.0%18,120.9
66.9%11,332
5,229
6,1036,820
8277,996
2092025
802.70.0
72.6875.2
70.3%875.2
23.02023
12,426.912,426.9
20,742.259.9%
18,352.067.7%
11,360
4,7736,587
6,824812
7,961206
2026778.9
0.074.3
853.267.5%
853.223.4
202412,693.6
12,693.620,922.2
60.7%18,558.7
68.4%11,389
4,293
7,0966,858
7977,921
2112027
758.60.0
75.9834.5
65.1%834.5
24.32025
12,922.912,922.9
21,089.461.3%
18,746.568.9%
11,417
3,8397,578
6,876785
7,877215
2028740.4
0.077.3
817.762.8%
817.725.6
202613,116.9
13,116.921,235.4
61.8%18,903.1
69.4%11,446
3,393
8,0536,903
7757,827
2212029
726.00.0
78.5804.5
60.5%804.5
27.62027
13,280.613,280.6
21,366.262.2%
19,034.969.8%
11,474
2,9628,512
6,930769
7,774224
2030715.8
0.079.5
795.358.4%
795.330.0
202813,417.9
13,417.921,481.9
62.5%19,144.2
70.1%11,503
2,556
8,9476,945
7637,716
2282031
710.10.0
80.3790.4
56.5%790.4
32.42029
13,535.613,535.6
21,584.362.7%
19,236.970.4%
11,532
2,1919,341
6,936761
7,654232
2032707.1
0.081.0
788.154.8%
788.134.8
203013,639.1
13,639.121,665.5
63.0%19,310.2
70.6%11,561
1,879
9,6826,887
7607,588
2372033
706.10.0
81.6787.8
53.3%787.8
37.32031
13,734.113,734.1
21,735.163.2%
19,369.470.9%
11,589
1,5989,991
6,823764
7,520244
2034706.6
0.082.2
788.851.8%
788.839.8
203213,826.3
13,826.321,796.7
63.4%19,417.2
71.2%11,618
1,343
10,2756,744
7687,449
2512035
707.40.0
82.7790.2
50.5%790.2
41.12033
13,920.813,920.8
21,856.963.7%
19,460.071.5%
11,648
1,11410,534
6,654776
7,379259
2036708.4
0.083.3
791.749.2%
791.743.5
203414,016.6
14,016.621,912.0
64.0%19,496.1
71.9%11,677
910
10,7676,554
7857,306
2692037
708.40.0
83.9792.2
47.8%792.2
44.42035
14,120.814,120.8
21,975.964.3%
19,529.072.3%
11,706
73010,976
6,483798
7,233279
2038707.5
0.084.5
792.046.6%
792.045.5
203614,231.1
14,231.122,042.0
64.6%19,564.0
72.7%11,735
574
11,1616,395
8147,161
2892039
706.60.0
85.2791.8
45.3%791.8
46.82037
14,347.514,347.5
22,129.164.8%
19,605.073.2%
11,764
44111,323
6,340831
7,088300
2040705.2
0.085.9
791.043.9%
791.048.0
203814,473.1
14,473.122,228.3
65.1%19,649.2
73.7%11,794
330
11,4646,308
8537,016
3102041
703.70.0
86.6790.4
42.7%790.4
49.22039
14,609.814,609.8
22,342.665.4%
19,702.574.2%
11,823
24011,583
6,282878
6,941321
2042702.1
0.087.5
789.641.4%
789.650.4
204014,759.1
14,759.122,476.2
65.7%19,768.2
74.7%11,853
169
11,6846,269
9036,871
3322043
701.50.0
88.4789.8
40.2%789.8
51.82041
14,923.114,923.1
22,638.865.9%
19,852.575.2%
11,882
11311,769
6,270929
6,801342
2044700.7
0.089.4
790.139.0%
790.153.3
204215,103.7
15,103.722,822.1
66.2%19,953.7
75.7%11,912
73
11,8396,280
9606,733
3512045
700.20.0
90.5790.7
37.8%790.7
54.82043
15,303.015,303.0
23,033.166.4%
20,077.076.2%
11,942
4411,898
6,303991
6,670361
2046700.0
0.091.7
791.636.8%
791.656.3
204415,521.1
15,521.123,273.6
66.7%20,224.4
76.7%11,972
25
11,9476,329
1,0236,609
3692047
700.90.0
93.0793.9
35.8%793.9
58.02045
15,758.315,758.3
23,549.666.9%
20,398.977.3%
12,002
1311,989
6,3701,059
6,558377
2048701.7
0.094.4
796.134.8%
796.159.7
204616,016.1
16,016.123,854.5
67.1%20,598.2
77.8%12,032
5
12,0276,420
1,0956,508
3842049
703.20.0
96.0799.1
33.9%799.1
61.32047
16,295.716,295.7
24,192. 467.4%
20,825.878.2%
12,062
112,061
6,4771,133
6,470391
2050704.9
0.097.7
802.533.0%
802.563.0
204816,596.3
16,596.324,565.0
67.6%21,082.6
78.7%12,092
0
12,0926,543
1,1736,434
3982051
708.10.0
99.5807.6
32.3%807.6
64.82049
16,916.716,916.7
24,978. 867.7%
21,370.379.2%
12,122
012,122
6,6181,214
6,409403
2052711.8
0.0101.4
813.131.5%
813.166.7
205017,257.0
17,257.025,424.5
67.9%21,685.5
79.6%12,153
0
12,1536,705
1,2566,390
4092053
716.40.0
103.4819.9
30.8%819.9
68.72051
17,617.917,617.9
25,905. 468.0%
22,029.680.0%
12,183
012,183
6,7991,300
6,378415
2054722.2
0.0105.6
827.830.2%
827.870.8
205217,999.3
17,999.326,421.1
68.1%22,402.8
80.3%12,213
0
12,2136,898
1,3436,373
4192055
730.00.0
107.9837.9
29.6%837.9
73.32053
18,402. 018,402.0
26,977.268.2%
22,806.480.7%
12,244
012,244
7,0021,385
6,373424
2056738.9
0.0110.3
849.229.1%
849.276.1
205418,827.8
18,827.827,563.0
68.3%23,239.0
81.0%12,275
0
12,2757,112
1,4286,380
4272057
749.20.0
112.9862.1
28.6%862.1
79.12055
19,280.219,280.2
28,182.968.4%
23,702.681.3%
12,305
012,305
7,2191,471
6,392430
2058761.0
0.0115.6
876.628.1%
876.682.3
205619,761.2
19,761.228,836.9
68.5%24,199.0
81.7%12,336
0
12,3367,325
1,5116,410
4332059
774.90.0
118.5893.4
27.7%893.4
85.62057
20,273.620,273.6
29,532.368.6%
24,730.982.0%
12,367
012,367
7,4251,551
6,430435
2060789.6
0.0121.6
911.227.4%
911.289.1
205820,819.8
20,819.830,260.0
68.8%25,299.1
82.3%12,398
0
12,3987,522
1,5946,456
436
Assumptions:
‐ Projections are based on June 30, 2008 data and assumption s
‐ Projections have been adjusted to reflect known asset, liability, and population adjustm
ents through June 30, 2010‐ Population is assum
ed to grow 1/4 of 1%
per year‐ N
ew plans have been reflected for expected new
entrants (Tier 3 FIRE)‐ N
ew entrant populations are assum
ed to have the same characteristics as the population that entered the plan during FY 2008
‐ Investment returns are assum
ed to be 7.5% per year in the future, producing no future gains or losses in the sm
oothing method
‐ Administrative expenses are expected to increase 3%
over prior year (does not apply to FIRE)‐ Investm
ent expenses are assumed to be a fixed percent of assets ranging from
0.4% to 0.6%
depending on the System‐ The N
et City Contribution is assumed to be 100%
of the Total Pension Fund Contribution
FIRE Pension Fund ProjectionsProjection U
sing 7.50% Interest and 0.25%
Increasing Employee Population
($ in millions)39

RETIREMENT SECURITY NYC
SUStaiNablE or Not? NYC PeNsioN Cost ProjeCtioNs through 2060
New York City ComptrollerJohn C. Liu
58 JUNE, 2011
I:/benefits/client/nyc/hay group 50 year projection methodology 052711.doc May 27, 2011 40
Exhibit J: Projection Results - Scenario 4
Increasing workforce assumption – by ¼% per year from FY 2014, and 7.0% discount rate

RETIREMENT SECURITY NYC
SUStaiNablE or Not? NYC PeNsioN Cost ProjeCtioNs through 2060
New York City ComptrollerJohn C. Liu
59JUNE, 2011
Exhibit J
Fiscal Year
Statutory Em
ployer Norm
al Contribution
Administrative
Expense Contribution
Investment
Expense Contribution
Total ALL NYCRS
Pension Fund Contributions
Total Contribution as a Percent of Salary
Net City
Contribution to N
YCRSEm
ployee Contributions
Values as of
June 30Market Value of Assets
Actuarial Value of Assets
Present Value of Future Benefits
AVA divided by
PVFB
Present Value of
Accumulated
Benefits
AVA divided by PVAB
Active Count
Closed Active Group
New
Active
Service Retirem
entOrdinary
DisabilityAccidental Disability
Inact &Term
Vested
2010$7,196.6
$115.5$347.7
$7,683.532.4%
$6,650.2$581.8
2008$101,914.9
$103,419.2$174,702.0
59.2%$129,547.6
79.8%365,718
365,718‐
234,441
17,368
23,101
58,347
2011
7,500.4117.2
393.18,010.7
32.8%6,865.5
584.62009
79,518.3104,429.8
177,933.858.7%
132,443.378.8%
369,789339,559
30,230
242,386
17,421
23,260
54,558
201210,185.4
123.7492.9
10,802.443.5%
9,171.6609.6
201090,016.1
107,407.0207,952.6
51.6%158,568.7
67.7%365,639
317,64547,994
246,857
17,456
23,420
52,092
2013
10,080.2127.3
503.610,711.7
42.7%9,053.2
623.92011
94,889.7109,478.8
213,934.451.2%
164,026.666.7%
365,639296,494
69,145
252,085
17,487
23,557
49,913
201410,105.4
131.1538.2
10,775.342.6%
9,068.4635.2
2012102,183.4
112,947.0220,020.6
51.3%169,484.9
66.6%365,639
277,44688,193
256,399
17,494
23,678
47,908
2015
10,700.9135.1
575.111,411.6
43.9%9,566.3
662.32013
109,229.0112,784.1
226,382.449.8%
174,922.564.5%
365,639259,036
106,603261,130
17,496
23,779
45,930
2016
10,964.9139.8
610.611,715.3
43.8%9,793.4
683.82014
115,910.7115,042.2
232,889.049.4%
180,358.863.8%
366,554241,243
125,311266,063
17,477
23,864
44,107
2017
10,655.9144.0
643.711,443.5
41.5%9,561.0
714.72015
122,395.0122,395.0
238,752.951.3%
185,858.165.9%
367,470224,786
142,684270,447
17,453
23,932
42,382
2018
10,471.2148.3
700.711,320.2
39.8%9,454.7
739.22016
129,518.1129,518.1
244,954.352.9%
191,415.567.7%
368,389209,101
159,288274,627
17,426
23,979
40,837
2019
10,312.0152.7
742.211,206.9
38.2%9,360.1
780.82017
136,412.5136,412.5
251,212.454.3%
197,034.569.2%
369,310194,590
174,720278,218
17,389
24,008
39,415
2020
10,188.2157.3
782.611,128.2
36.7%9,295.3
825.72018
143,188.8143,188.8
257,560.055.6%
202,657.070.7%
370,233180,426
189,807281,943
17,358
24,022
38,157
2021
10,079.5162.0
822.511,064.0
35.4%9,244.1
868.42019
149,934.6149,934.6
264,022.056.8%
208,368.172.0%
371,158167,131
204,027285,205
17,329
24,025
37,087
2022
9,983.7166.9
862.211,012.8
34.2%9,202.9
917.72020
156,722.1156,722.1
270,614.357.9%
214,193.873.2%
372,086154,667
217,419287,962
17,288
24,010
36,249
2023
9,917.5171.9
902.110,991.5
33.0%9,185.1
968.42021
163,468.6163,468.6
277,416.558.9%
220,119.674.3%
373,017142,432
230,585290,800
17,244
23,982
35,581
2024
9,865.6177.0
941.710,984.4
32.0%9,179.0
1,023.42022
170,104.6170,104.6
284,130.959.9%
226,133.275.2%
373,949131,175
242,774293,000
17,197
23,944
35,085
2025
9,822.2182.4
981.610,986.1
31.0%9,181.8
1,070.42023
176,835.3176,835.3
291,087.860.7%
232,237.876.1%
374,884120,267
254,617295,091
17,150
23,890
34,715
2026
9,754.6187.8
1,021.710,964.1
30.1%9,161.0
1,117.32024
183,692.4183,692.4
298,220.561.6%
238,493.877.0%
375,821110,093
265,728296,633
17,090
23,820
34,571
2027
9,709.7193.5
1,062.410,965.5
29.2%9,157.2
1,173.82025
190,553.8190,553.8
305,615.062.4%
244,829.077.8%
376,76199,813
276,948
298,384
17,037
23,740
34,673
20289,699.3
199.31,103.1
11,001.628.4%
9,185.31,233.1
2026197,344.0
197,344.0313,134.8
63.0%251,100.6
78.6%377,703
89,611
288,092300,238
16,976
23,644
34,956
2029
9,722.9205.2
1,143.411,071.5
27.6%9,244.2
1,291.82027
204,200.0204,200.0
320,811.963.7%
257,461.579.3%
378,64780,122
298,525
301,602
16,914
23,530
35,270
20309,780.4
211.41,184.0
11,175.827.0%
9,335.61,357.2
2028211,181.8
211,181.8328,644.5
64.3%263,945.6
80.0%379,593
71,414
308,179302,494
16,848
23,391
35,468
2031
9,878.4217.7
1,225.411,321.5
26.4%9,463.9
1,423.72029
218,370.5218,370.5
336,736.564.8%
270,667.380.7%
380,54263,600
316,942
302,685
16,775
23,237
35,914
20329,986.2
224.31,267.9
11,478.425.9%
9,602.71,492.6
2030225,867.4
225,867.4344,975.6
65.5%277,619.5
81.4%381,494
56,739
324,755301,955
16,710
23,070
36,620
2033
10,107.5231.0
1,312.311,650.8
25.4%9,754.0
1,563.82031
233,709.4233,709.4
353,507.166.1%
284,850.182.0%
382,44850,292
332,156
300,974
16,644
22,902
37,373
203410,237.4
237.91,358.6
11,834.024.9%
9,914.61,642.1
2032241,947.8
241,947.8362,359.2
66.8%292,402.6
82.7%383,404
44,369
339,035299,579
16,580
22,736
38,255
2035
10,367.8245.1
1,407.312,020.2
24.5%10,073.6
1,714.82033
250,613.0250,613.0
371,640.867.4%
300,343.883.4%
384,36238,771
345,591
298,059
16,533
22,580
39,055
203610,467.1
252.41,458.4
12,177.924.1%
10,203.41,771.3
2034259,765.8
259,765.8381,242.6
68.1%308,659.5
84.2%385,323
33,816
351,507295,862
16,503
22,429
40,120
2037
10,544.2260.0
1,512.412,316.6
23.7%10,312.2
1,830.02035
269,343.6269,343.6
391,369.368.8%
317,354.684.9%
386,28629,453
356,833
293,736
16,484
22,286
41,465
203810,600.8
267.81,568.9
12,437.523.2%
10,401.31,890.7
2036279,290.7
279,290.7401,990.4
69.5%326,388.2
85.6%387,252
25,495
361,757291,956
16,478
22,155
42,847
2039
10,664.5275.8
1,627.512,567.8
22.8%10,495.5
1,953.12037
289,502.2289,502.2
413,217.870.1%
335,738.586.2%
388,22021,883
366,337
290,705
16,481
22,033
44,304
204010,717.0
284.11,687.6
12,688.822.4%
10,579.92,018.1
2038299,959.8
299,959.8424,805.1
70.6%345,322.8
86.9%389,191
18,601
370,590289,559
16,496
21,920
45,786
2041
10,772.3292.6
1,749.312,814.3
22.0%10,666.5
2,085.12039
310,635.3310,635.3
436,835.171.1%
355,149.187.5%
390,16415,664
374,500
288,605
16,526
21,812
47,319
204210,829.1
301.41,812.3
12,942.821.6%
10,754.22,154.8
2040321,497.6
321,497.6449,284.1
71.6%365,205.2
88.0%391,139
13,090
378,049287,768
16,559
21,716
48,805
2043
10,910.9310.5
1,876.413,097.7
21.3%10,863.4
2,228.32041
332,531.2332,531.2
462,229.371.9%
375,514.188.6%
392,11710,848
381,269
287,061
16,598
21,621
50,187
204410,996.5
319.81,941.5
13,257.820.9%
10,977.12,303.7
2042343,723.5
343,723.5475,496.5
72.3%386,009.5
89.0%393,097
8,934
384,163286,430
16,651
21,539
51,431
2045
11,092.8329.4
2,007.713,429.9
20.6%11,100.5
2,381.82043
355,108.6355,108.6
489,134.872.6%
396,735.689.5%
394,0807,302
386,778
285,735
16,704
21,462
52,659
204611,203.0
339.22,075.1
13,617.420.3%
11,237.22,464.0
2044366,668.2
366,668.2503,169.6
72.9%407,686.3
89.9%395,065
5,899
389,166285,089
16,772
21,392
53,898
2047
11,341.6349.4
2,143.613,834.6
20.0%11,398.3
2,548.22045
378,405.1378,405.1
517,693.473.1%
418,891.690.3%
396,0534,684
391,369
284,483
16,842
21,336
55,145
204811,483.8
359.92,213.2
14,056.919.7%
11,563.82,636.5
2046390,345.1
390,345.1532,510.2
73.3%430,318.7
90.7%397,043
3,645
393,398283,861
16,916
21,282
56,342
2049
11,645.1370.7
2,284.114,300. 0
19.4%11,747.0
2,726.92047
402,500.8402,500.8
547,746.373.5%
441,997.891.1%
398,0362,764
395,272
283,294
16,998
21,247
57,510
205011,820.6
381.82,356.4
14,558.819.2%
11,943.72,820.8
2048414,904.4
414,904.4563,390.3
73.6%453,965.8
91.4%399,031
2,044
396,987282,684
17,092
21,218
58,629
2051
12,028. 0393.3
2,430.214,851.5
19.0%12,168.6
2,916.72049
427,581.9427,581.9
579,598.673.8%
466,274.691.7%
400,0281,474
398,554
282,104
17,189
21,199
59,693
205212,236.4
405.12,505.7
15,147.218.8%
12,395.53,014.2
2050440,577.9
440,577.9596,172.8
73.9%478,920.9
92.0%401,028
1,020
400,008281,496
17,295
21,189
60,719
2053
12,459.1417.2
2,583.115,459.5
18.6%12,636.1
3,115. 42051
453,933.3453,933.3
613,268.374.0%
491,955.892.3%
402,031676
401,355
280,940
17,410
21,193
61,681
205412,699.8
429.72,662.8
15,792.318.4%
12,894.63,220.8
2052467,651.6
467,651.6630,930.7
74.1%505,402.5
92.5%403,036
432
402,604280,506
17,526
21,201
62,571
2055
12,979.5442.6
2,744.616,166.7
18.2%13,188.3
3,331. 42053
481,776.7481,776.7
649,285.974.2%
519,313.992.8%
404,044256
403,788
280,110
17,643
21,225
63,390
205613,272.2
455.92,828.8
16,556.918.0%
13,497.13,447.0
2054496,358.1
496,358.1668,125.3
74.3%533,700.8
93.0%405,054
132
404,922279,736
17,766
21,255
64,136
2057
13,589.0469.6
2,915.816,974.3
17.9%13,829.9
3,567.22055
511,481.1511,481.1
687,580.474.4%
548,633.893.2%
406,06653
406,013
279,335
17,891
21,298
64,814
205813,922.0
483.73,006.0
17,411.717.8%
14,180.03,691.8
2056527,208.6
527,208.6707,690.2
74.5%564,176.7
93.4%407,082
14
407,068278,889
18,011
21,357
65,426
2059
14,291.7498.2
3,099.817,889.6
17.6%14,563.3
3,821.12057
543,603.0543,603.0
728,651.774.6%
580,399.193.7%
408,0996
408,093
278,433
18,137
21,424
65,972
206014,664.6
513.13,197.5
18,375.317.5%
14,953.93,955.0
2058560,710.6
560,710.6750,261.9
74.7%597,324.8
93.9%409,120
2
409,118277,999
18,264
21,506
66,448
Assumptions:
‐ Projections are based on June 30, 2008 data and assumption s
‐ Projections have been adjusted to reflect known asset, liability, and population adjustm
ents through June 30, 2010‐ Population is assum
ed to grow 1/4 of 1%
per year‐ N
ew plans have been reflected for expected new
entrants‐ N
ew entrant populations are assum
ed to have the same characteristics as the population that entered the plan during FY 2008
‐ Investment returns are assum
ed to be 7.0% per year in the future, producing no future gains or losses in the sm
oothing method
‐ Administrative expenses are expected to increase 3%
over prior year (does not apply to FIRE)‐ Investm
ent expenses are assumed to be a fixed percent of assets ranging from
0.4% to 0.6%
depending on the System‐ The N
et City Contribution varies by System
ALL NYCRS Pension Fund Projections
Projection Using 7.00%
Interest and 0.25% Increasing Em
ployee Population($ in m
illions)
41

RETIREMENT SECURITY NYC
SUStaiNablE or Not? NYC PeNsioN Cost ProjeCtioNs through 2060
New York City ComptrollerJohn C. Liu
60 JUNE, 2011
Exhibit J
Fiscal Year
Statutory Em
ployer Norm
al Contribution
Administrative
Expense Contribution
Investment
Expense Contribution
Total NYCERS
Pension Fund Contribution
Total Contribution as a Percent of Salary
Net City
Contribution to N
YCERSEm
ployee contributions
Values as of
June 30Market value of assets
Actuarial value of assets
Present Value of Future Benefits
AVA divided by
PVFB
Present Value of
Accumulated
Benefits
AVA divided by PVAB
Active Count
Closed Active Group
New
Active
Service Retirem
entOrdinary
DisabilityAccidental Disability
Inact &Term
Vested
2010$2,012.0
$51.2$134.5
$2,197.720.6%
$1,205.6$310.8
2008$39,716.8
$40,771.6$60,264.2
67.7%$42,940.1
94.9%183,607
183,6070
117,6739,076
3,69933,029
20112,172.8
53.2161.1
2,387.221.1%
1,293.0318.3
200931,903.4
41,710.262,607.0
66.6%45,223.6
92.2%186,288
169,00117,287
121,6949,191
3,66530,917
20123,231.0
55.1204.4
3,490.630.6%
1,914.9329.7
201035,407.9
42,556.473,363.0
58.0%54,657.9
77.9%184,982
156,68228,300
124,2309,295
3,64229,158
20133,289.3
56.8206.4
3,552.430.5%
1,948.8342.2
201137,154.7
43,082.175,740.0
56.9%56,919.9
75.7%184,982
145,03539,947
126,9729,388
3,60827,557
20143,379.6
58.5220.1
3,658.030.9%
2,006.8355.6
201239,868.9
44,236.278,113.8
56.6%59,197.1
74.7%184,982
134,79050,192
128,9989,466
3,57726,022
20153,662.3
60.2234.6
3,956.932.5%
2,170.8373.5
201342,587.1
44,137.080,542.2
54.8%61,499.3
71.8%184,982
125,08459,898
131,0929,529
3,53824,496
20163,811.3
62.0248.9
4,122.232.8%
2,261.5386.2
201445,256.9
45,019.183,067.8
54.2%63,829.8
70.5%185,444
115,73069,714
133,2619,575
3,50423,129
20173,709.8
63.9262.9
4,036.531.1%
2,214.4406.4
201548,160.6
48,160.685,659.5
56.2%66,215.7
72.7%185,908
107,07578,833
135,2339,609
3,46821,852
20183,643.0
65.8289.2
3,998.029.9%
2,193.3422.2
201651,301.1
51,301.188,324.9
58.1%68,647.5
74.7%186,373
98,80487,569
137,2079,642
3,43020,734
20193,580.0
67.8308.1
3,955.928.7%
2,170.2442.1
201754,349.9
54,349.990,975.4
59.7%71,055.0
76.5%186,839
91,12595,714
138,9659,657
3,39319,783
20203,527.2
69.8326.9
3,924.027.6%
2,152.7460.0
201857,371.1
57,371.193,688.5
61.2%73,481.0
78.1%187,306
83,606103,700
140,9209,673
3,35418,991
20213,476.5
71.9345.7
3,894.126.6%
2,136.3476.6
201960,395.9
60,395.996,459.5
62.6%75,948.8
79.5%187,774
76,585111,189
142,6849,680
3,32118,379
20223,431.7
74.1364.6
3,870.325.6%
2,123.3497.6
202063,421.7
63,421.799,295.0
63.9%78,444.7
80.8%188,244
69,888118,356
144,3999,673
3,28317,953
20233,401.1
76.3383.5
3,860.924.8%
2,118.1521.6
202166,429.8
66,429.8102,211.3
65.0%80,973.1
82.0%188,714
63,411125,303
146,1709,657
3,24717,690
20243,375.7
78.6402.4
3,856.624.0%
2,115.7546.6
202269,438.1
69,438.1105,151.2
66.0%83,517.7
83.1%189,186
57,479131,707
147,6719,632
3,21217,581
20253,350.2
80.9421.2
3,852.323.2%
2,113.4564.8
202372,465.6
72,465.6108,151.4
67.0%86,098.8
84.2%189,659
51,922137,737
149,0009,596
3,17617,595
20263,323.8
83.4440.3
3,847.422.6%
2,110.7584.9
202475,520.5
75,520.5111,218.5
67.9%88,714.1
85.1%190,133
46,718143,415
150,1379,549
3,13917,793
20273,311.1
85.9459.5
3,856.521.9%
2,115.7608.8
202578,556.5
78,556.5114,386.1
68.7%91,340.2
86.0%190,608
41,433149,175
151,4989,498
3,10518,151
20283,304.9
88.4478.6
3,872.021.3%
2,124.2633.3
202681,573.6
81,573.6117,577.7
69.4%93,951.2
86.8%191,085
36,481154,604
152,6829,437
3,07318,613
20293,305.1
91.1497.7
3,893.820.8%
2,136.2655.2
202784,597.8
84,597.8120,816.7
70.0%96,577.0
87.6%191,563
31,923159,640
153,6039,368
3,04219,164
20303,309.2
93.8516.9
3,919.920.3%
2,150.4678.2
202887,640.2
87,640.2124,104.3
70.6%99,228.3
88.3%192,042
27,780164,262
154,2499,296
3,00819,737
20313,323.0
96.6536.2
3,955.819.8%
2,170.1700.9
202990,704.6
90,704.6127,491.6
71.1%101,929.9
89.0%192,522
24,120168,402
154,7089,212
2,98020,433
20323,338.0
99.5555.6
3,993.219.4%
2,190.7724.1
203093,810.2
93,810.2130,933.6
71.6%104,670.2
89.6%193,003
20,880172,123
154,8769,132
2,94821,246
20333,359.1
102.5575.4
4,037.019.0%
2,214.7748.1
203196,959.5
96,959.5134,470.4
72.1%107,458.2
90.2%193,485
17,849175,636
154,9429,045
2,91822,131
20343,383.2
105.6595.4
4,084.218.6%
2,240.6773.0
2032100,171.0
100,171.0138,106.6
72.5%110,314.9
90.8%193,969
15,146178,823
154,7818,951
2,88823,111
20353,416.4
108.8615.9
4,141.018.3%
2,271.7798.2
2033103,447.6
103,447.6141,883.3
72.9%113,256.7
91.3%194,454
12,640181,814
154,5398,861
2,86124,101
20363,451.2
112.0636.7
4,199.918.0%
2,304.1822.4
2034106,807.5
106,807.5145,761.4
73.3%116,281.8
91.9%194,940
10,532184,408
154,0738,773
2,83425,097
20373,490.2
115.4658.1
4,263.717.7%
2,339.1848.6
2035110,264.5
110,264.5149,775.8
73.6%119,411.4
92.3%195,428
8,801186,627
153,4498,684
2,80526,198
20383,533.1
118.8680.1
4,332.117.4%
2,376.6874.7
2036113,823.3
113,823.3153,937.2
73.9%122,653.9
92.8%195,916
7,310188,606
152,7108,597
2,77927,352
20393,584.7
122.4702.8
4,409.917.2%
2,419.3902.0
2037117,492.7
117,492.7158,284.3
74.2%126,029.3
93.2%196,406
6,031190,375
151,8818,511
2,75528,603
20403,637.0
126.1726.1
4,489.216.9%
2,462.8930.0
2038121,281.8
121,281.8162,770.4
74.5%129,526.5
93.6%196,897
4,948191,949
150,9678,426
2,73029,894
20413,693.2
129.9750.2
4,573.316.7%
2,508.9959.4
2039125,202.5
125,202.5167,433.6
74.8%133,162.8
94.0%197,389
4,022193,367
149,9918,347
2,70631,262
20423,752.9
133.8775.1
4,661.816.5%
2,557.4989.8
2040129,257.8
129,257.8172,282.4
75.0%136,945.4
94.4%197,883
3,238194,645
148,9798,270
2,68432,682
20433,822.4
137.8800.9
4,761.016.3%
2,611.91,021.5
2041133,452.9
133,452.9177,356.9
75.2%140,889.1
94.7%198,377
2,577195,800
147,9598,199
2,65934,102
20443,892.1
141.9827.5
4,861.516.1%
2,667.01,054.3
2042137,796.1
137,796.1182,601.7
75.5%144,985.9
95.0%198,873
2,031196,842
146,9248,133
2,64035,481
20453,966.0
146.2855.1
4,967.216.0%
2,725.01,088.0
2043142,302.5
142,302.5188,056.6
75.7%149,253.3
95.3%199,371
1,593197,778
145,8788,066
2,61736,837
20464,043.0
150.5883.6
5,077.215.8%
2,785.41,122.9
2044146,970.0
146,970.0193,728.3
75.9%153,693.3
95.6%199,869
1,236198,633
144,8608,009
2,59438,186
20474,130.4
155.1913.2
5,198.715.7%
2,852.01,159.2
2045151,801.8
151,801.8199,659.0
76.0%158,317.2
95.9%200,369
945199,424
143,8777,954
2,57339,535
20484,217.8
159.7943.8
5,321.315.6%
2,919.31,196.8
2046156,800.4
156,800.4205,782.8
76.2%163,114.5
96.1%200,870
713200,157
142,9527,901
2,55040,821
20494,310.5
164.5975.4
5,450.415.4%
2,990.11,235.8
2047161,977.6
161,977.6212,137.6
76.4%168,097.2
96.4%201,372
530200,842
142,0727,850
2,53242,069
20504,406.9
169.41,008.2
5,584.515.3%
3,063.71,276.2
2048167,334. 0
167,334.0218,731.6
76.5%173,270.2
96.6%201,875
387201,488
141,2457,808
2,51343,254
20514,514.1
174.51,042.1
5,730.615.2%
3,143.81,317.8
2049172,875.1
172,875.1225,610.4
76.6%178,644.0
96.8%202,380
276202,104
140,4827,770
2,49344,387
20524,621.8
179.81,077.1
5,878.615.1%
3,225.01,360.8
2050178,604.6
178,604.6232,700.2
76.8%184,213.0
97.0%202,886
193202,693
139,7847,738
2,47345,473
20534,734.3
185.11,113.3
6,032.715.1%
3,309.51,405.3
2051184,534.2
184,534.2240,046.4
76.9%189,987.2
97.1%203,393
132203,261
139,1577,709
2,45646,501
20544,851.0
190.71,150.8
6,192.515.0%
3,397.21,451.4
2052190,664.6
190,664.6247,655.3
77.0%195,971.5
97.3%203,901
89203,812
138,6097,684
2,43547,463
20554,980.0
196.41,189.5
6,365.914.9%
3,492.41,498.9
2053197,000.8
197,000.8255,580.5
77.1%202,174.8
97.4%204,411
56204,355
138,1267,664
2,41948,366
20565,108.9
202.31,229.5
6,540.714.8%
3,588.21,547.8
2054203,546.7
203,546.7263,736.2
77.2%208,594.4
97.6%204,922
33204,889
137,7187,649
2,40249,210
20575,243.2
208.41,270.9
6,722.414.8%
3,687.91,598.3
2055210,315.4
210,315.4272,172.9
77.3%215,239.5
97.7%205,435
18205,417
137,3887,636
2,38849,995
20585,381.4
214.61,313.6
6,909.614.7%
3,790.61,650.5
2056217,307.1
217,307.1280,897.7
77.4%222,115.7
97.8%205,948
9205,939
137,1267,627
2,37750,726
20595,533.8
221.11,357.8
7,112.614.6%
3,902.01,704.4
2057224,527.6
224,527.6289,971.8
77.4%229,231.0
97.9%206,463
4206,459
136,9347,621
2,36751,401
20605,685.5
227.71,403.4
7,316.614.6%
4,013.91,760.1
2058231,981.5
231,981.5299,299.8
77.5%236,586.8
98.1%206,979
2206,977
136,8077,616
2,36052,027
Assumptions:
‐ Projections are based on June 30, 2008 data and assumptions
‐ Projections have been adjusted to reflect known asset, liability, and population adjustm
ents through June 30, 2010‐ Population is assum
ed to grow 1/4 of 1%
per year‐ N
ew plans have been reflected for expected new
entrants‐ N
ew entrant populations are assum
ed to have the same characteristics as the population that entered the plan during FY 2008
‐ Investment returns are assum
ed to be 7.0% per year in the future, producing no future gains or losses in the sm
oothing method
‐ Administrative expenses are expected to increase 3%
over prior year (does not apply to FIRE)‐ Investm
ent expenses are assumed to be a fixed percent of assets ranging from
0.4% to 0.6%
depending on the System‐ The N
et City Contribution is assumed to be 54.86%
of the Total Pension Fund Contribution
NYCERS Pension Fund Projections
Projection Using 7.00%
Interest and 0.25% Increasing Em
ployee Population($ in m
illions)42

RETIREMENT SECURITY NYC
SUStaiNablE or Not? NYC PeNsioN Cost ProjeCtioNs through 2060
New York City ComptrollerJohn C. Liu
61JUNE, 2011
Exhibit J
Fiscal Year
Statutory Em
ployer Norm
al Contribution
Administrative
Expense Contribution
Investment
Expense Contribution
Total TRS Pension Fund Contribution
Total Contribution as a Percent of Salary
Net City
Contribution to TRS
Employee
contributions
Values as of
June 30Market value of assets
Actuarial value of assets
Present Value of Future Benefits
AVA divided by
PVFB
Present Value of
Accumulated
Benefits
AVA divided by PVAB
Active Count
Closed Active Group
New
Active
Service Retirem
entDisability Retirem
entAccidental Disability
Inact &Term
Vested
2010$2,348.1
$37.4$98.6
$2,484.131.1%
$2,450.7$174.7
2008$32,297.9
$32,227.4$58,227.5
55.3%$41,093.3
78.4%112,472
112,4720
66,9732,608
17,9702011
2,317.934.8
116.22,469.0
31.2%2,427.7
170.12009
23,077.530,775.0
56,988.054.0%
39,586.677.7%
113,132105,386
7,74669,847
2,61016,581
20123,035.5
39.8145.5
3,220.938.9%
3,177.7180.7
201026,398.4
31,135.466,645.4
46.7%47,406.9
65.7%111,647
99,60412,043
71,1762,608
16,0062013
3,008.341.0
135.03,184.3
38.1%3,141.6
182.42011
27,456.631,541.7
68,325.346.2%
48,790.964.6%
111,64794,252
17,39572,489
2,60915,490
20143,015.4
42.3139.7
3,197.538.0%
3,154.6178.7
201229,147.3
32,171.670,073.4
45.9%50,207.3
64.1%111,647
89,18022,467
73,8532,606
15,0292015
3,203.943.5
144.83,392.3
39.1%3,346.8
183.92013
30,778.531,569.9
71,901.943.9%
51,672.961.1%
111,64784,366
27,28175,281
2,60714,558
20163,305.5
44.8150.2
3,500.539.0%
3,453.6188.0
201432,281.4
31,825.973,827.1
43.1%53,181.2
59.8%111,926
79,70932,217
76,8172,609
14,0792017
3,257.546.2
154.83,458.5
37.3%3,412.1
192.32015
33,908.233,908.2
75,803.644.7%
54,745.361.9%
112,20675,404
36,80278,118
2,61113,643
20183,255.8
47.6168.6
3,472.036.2%
3,425.5196.2
201635,693.5
35,693.577,842.4
45.9%56,363.0
63.3%112,486
71,32441,162
79,2612,615
13,2742019
3,263.049.0
178.43,490.4
35.1%3,443.6
212.42017
37,447.437,447.4
79,961.846.8%
58,054.764.5%
112,76867,417
45,35180,352
2,62012,870
20203,276.4
50.5188.0
3,514.934.2%
3,467.8232.4
201839,231.2
39,231.282,131.7
47.8%59,800.7
65.6%113,050
63,72349,327
81,2642,626
12,4992021
3,296.952.0
197.93,546.8
33.2%3,499.2
253.22019
41,071.841,071.8
84,371.848.7%
61,627.266.6%
113,33260,252
53,08081,946
2,63312,172
20223,322.9
53.5208.0
3,584.532.4%
3,536.4274.3
202042,986.2
42,986.286,691.5
49.6%63,542.3
67.6%113,616
56,96656,650
82,4672,639
11,8452023
3,356.855.2
218.53,630.4
31.6%3,581.8
295.82021
44,993.944,993.9
89,115.750.5%
65,581.468.6%
113,90053,872
60,02882,739
2,64311,560
20243,392.3
56.8229.5
3,678.730.9%
3,629.4318.2
202247,109.2
47,109.291,627.5
51.4%67,725.3
69.6%114,184
50,90763,277
82,8912,649
11,2722025
3,430.558.5
241.23,730.2
30.2%3,680.3
341.32023
49,347.949,347.9
94,255.352.4%
69,996.370.5%
114,47048,028
66,44282,934
2,65210,998
20263,469.0
60.3253.5
3,782.729.6%
3,732.0364.5
202451,721.8
51,721.897,003.5
53.3%72,402.0
71.4%114,756
45,25769,499
82,8292,656
10,7652027
3,510.462.1
266.63,839.1
29.0%3,787.6
389.82025
54,241.154,241.1
99,900.054.3%
74,968.272.4%
115,04342,567
72,47682,656
2,66010,525
20283,552.8
63.9280.4
3,897.128.4%
3,844.9416.0
202656,903.8
56,903.8102,921.1
55.3%77,661.3
73.3%115,330
39,87275,458
82,4432,662
10,3542029
3,594.265.9
295.13,955.1
27.9%3,902.1
441.92027
59,724.159,724.1
106,079.156.3%
80,502.574.2%
115,61937,253
78,36682,122
2,66410,186
20303,635.1
67.8310.6
4,013.527.4%
3,959.7471.5
202862,711.4
62,711.4109,380.0
57.3%83,493.6
75.1%115,908
34,71081,198
81,7002,666
10,0172031
3,681.069.9
327.04,077.8
26.9%4,023.2
503.02029
65,865.865,865.8
112,861.558.4%
86,653.576.0%
116,19832,153
84,04581,299
2,6659,803
20323,725.9
72.0344.3
4,142.226.4%
4,086.7536.1
203069,202.5
69,202.5116,474.2
59.4%89,962.7
76.9%116,488
29,69286,796
80,7402,666
9,6522033
3,771.974.1
362.74,208.7
25.9%4,152.3
570.72031
72,730.872,730.8
120,250.760.5%
93,435.977.8%
116,77927,263
89,51680,198
2,6669,440
20343,819.8
76.3382.1
4,278.225.5%
4,220.9611.3
203276,459.1
76,459.1124,191.4
61.6%97,076.9
78.8%117,071
24,89392,178
79,5962,665
9,2462035
3,876.478.6
402.64,357.6
25.1%4,299.2
653.82033
80,392.980,392.9
128,327.062.6%
100,906.179.7%
117,36422,554
94,81079,033
2,6658,943
20363,916.0
81.0424.2
4,421.324.7%
4,362.0675.3
203484,556.5
84,556.5132,602.5
63.8%104,910.4
80.6%117,657
20,34897,309
78,1032,666
8,8852037
3,932.383.4
447.14,462.8
24.4%4,403.0
702.92035
88,976.288,976.2
137,053.164.9%
109,118.481.5%
117,95118,258
99,69376,891
2,6658,999
20383,939.6
85.9471.5
4,496.924.0%
4,436.7730.8
203693,532.8
93,532.8141,784.5
66.0%113,439.0
82.5%118,246
16,252101,994
76,3652,667
9,0922039
3,944.588.5
496.54,529.5
23.5%4,468.8
759.52037
98,182.898,182.8
146,731.766.9%
117,857.683.3%
118,54214,307
104,23576,141
2,6659,153
20403,942.5
91.2522.1
4,555.823.1%
4,494.7790.1
2038102,892.8
102,892.8151,792.4
67.8%122,316.7
84.1%118,838
12,435106,403
76,0502,664
9,1952041
3,938.193.9
548.04,579.9
22.7%4,518.6
820.42039
107,634.0107,634.0
156,980.668.6%
126,802.284.9%
119,13510,694
108,44176,114
2,6619,207
20423,929.0
96.7574.1
4,599.822.3%
4,538.2851.7
2040112,384.8
112,384.8162,269.9
69.3%131,299.4
85.6%119,433
9,121110,312
76,2422,657
9,1262043
3,925.699.6
600.24,625.4
21.9%4,563.4
884.22041
117,119.1117,119.1
167,685.369.8%
135,802.886.2%
119,7327,718
112,01476,478
2,6508,946
20443,923.1
102.6626.2
4,651.921.5%
4,589.5917.5
2042121,812.1
121,812.1173,150.6
70.4%140,264.8
86.8%120,031
6,489113,542
76,7932,642
8,6782045
3,924.4105.7
652.04,682.2
21.1%4,619.4
952.02043
126,462.9126,462.9
178,664.070.8%
144,693.487.4%
120,3315,404
114,92777,082
2,6358,422
20463,930.5
108.8677.6
4,717.020.7%
4,653.8988.0
2044131,061.5
131,061.5184,221.8
71.1%149,079.1
87.9%120,632
4,441116,191
77,3642,626
8,1922047
3,947.4112.1
702.94,762.4
20.4%4,698.6
1,025.32045
135,602.5135,602.5
189,851.471.4%
153,429.088.4%
120,9343,579
117,35577,637
2,6147,977
20483,968.6
115.5727.9
4,812.020.1%
4,747.51,064.1
2046140,087.4
140,087.4195,476.3
71.7%157,718.4
88.8%121,236
2,818118,418
77,8752,602
7,7802049
3,998.8118.9
752.64,870.3
19.7%4,805.1
1,104.02047
144,526.8144,526.8
201,127.171.9%
161,963.789.2%
121,5392,153
119,38678,064
2,5917,602
20504,036.9
122.5777.0
4,936.319.4%
4,870.21,144.9
2048148,937.0
148,937.0206,804.9
72.0%166,183.9
89.6%121,843
1,600120,243
78,1712,579
7,4402051
4,087.7126.2
801.25,015.1
19.1%4,947.9
1,187.12049
153,343.7153,343.7
212,563.172.1%
170,413.790.0%
122,1481,156
120,99278,197
2,5657,284
20524,143.8
130.0825.5
5,099.318.9%
5,030.91,230.5
2050157,768.8
157,768.8218,345.3
72.3%174,653.4
90.3%122,453
797121,656
78,1532,554
7,1412053
4,207.5133.9
849.85,191.2
18.6%5,121.6
1,274.62051
162,247.5162,247.5
224,207. 472.4%
178,943.090.7%
122,759524
122,23578,031
2,5426,998
20544,276.8
137.9874.4
5,289.118.4%
5,218.31,320.1
2052166,810.5
166,810.5230,174.6
72.5%183,315.2
91.0%123,066
330122,736
77,8382,534
6,8572055
4,358.2142.0
899.55,399.7
18.1%5,327. 4
1,367.22053
171,485.5171,485.5
236,321.372.6%
187,806.091.3%
123,374191
123,18377,599
2,5246,712
20564,442.5
146.3925.3
5,514.117.9%
5,440.21,415.6
2054176,299.2
176,299.2242,589.5
72.7%192,425.4
91.6%123,682
93123,589
77,3172,514
6,5602057
4,533.6150.7
951.75,636.0
17.7%5,560.5
1,465.92055
181,287.7181,287.7
249,043.972.8%
197,212.191.9%
123,99132
123,95976,990
2,5076,406
20584,629.4
155.2979.2
5,763.717.5%
5,686.51,518.0
2056186,479.0
186,479.0255,715.4
72.9%202,197.7
92.2%124,301
3124,298
76,6282,502
6,2452059
4,735.8159.8
1,007.75,903.3
17.3%5,824.2
1,572.12057
191,906.3191,906.3
262,679.873.1%
207,420.992.5%
124,6121
124,61176,229
2,4976,076
20604,842.5
164.61,037.6
6,044.717.1%
5,963.71,628.3
2058197,592.1
197,592.1269,872.6
73.2%212,890.1
92.8%124,924
0124,924
75,8142,493
5,896
Assumptions:
‐ Projections are based on June 30, 2008 data and assumption s
‐ Projections have been adjusted to reflect known asset, liability, and population adjustm
ents through June 30, 2010‐ Population is assum
ed to grow 1/4 of 1%
per year‐ N
ew plans have been reflected for expected new
entrants (55/27)‐ N
ew entrant populations are assum
ed to have the same characteristics as the population that entered the plan during FY 2008
‐ Investment returns are assum
ed to be 7.0% per year in the future, producing no future gains or losses in the sm
oothing method
‐ Administrative expenses are expected to increase 3%
over prior year (does not apply to FIRE)‐ Investm
ent expenses are assumed to be a fixed percent of assets ranging from
0.4% to 0.6%
depending on the System‐ The N
et City Contribution is assumed to be 98.66%
of the Total Pension Fund Contribution
TRS Pension Fund ProjectionsProjection U
sing 7.00% Interest and 0.25%
Increasing Employee Population
($ in millions)
43

RETIREMENT SECURITY NYC
SUStaiNablE or Not? NYC PeNsioN Cost ProjeCtioNs through 2060
New York City ComptrollerJohn C. Liu
62 JUNE, 2011
Exhibit J
Fiscal Year
Statutory Em
ployer Norm
al Contribution
Administrative
Expense Contribution
Investment
Expense Contribution
Total BERS Pension Fund Contribution
Total Contribution as a Percent of Salary
Net City
Contribution to BERS
Employee
contributions
Values as of
June 30Market value of assets
Actuarial value of assets
Present Value of Future Benefits
AVA divided by
PVFB
Present Value of
Accumulated
Benefits
AVA divided by PVAB
Active Count
Closed Active Group
New
Active
Service Retirem
entDisability Retirem
entAccidental Disability
Inact &Term
Vested
2010$132.9
$9.2$5.3
$147.317.9%
$139.5$25.9
2008$2,021.9
$2,084.1$3,429.5
60.8%$2,315.9
90.0%22,728
22,728
012,483
7094,282
2011167.2
9.83.2
180.220.6%
170.526.5
20091,536.6
1,963.73,612.1
54.4%2,423.0
81.0%23,303
20,777
2,52613,513
7203,943
2012212.2
9.44.7
226.324.6%
214.228.2
20101,785.9
2,092.24,245.3
49.3%2,952.0
70.9%23,333
19,301
4,03214,016
7323,732
2013215.1
9.78.2
233.024.7%
220.629.4
20111,918.3
2,175.44,429.8
49.1%3,104.0
70.1%23,333
17,880
5,45314,539
7453,521
2014220.2
10.010.0
240.124.8%
227.430.6
20122,099.3
2,287.14,623.1
49.5%3,263.1
70.1%23,333
16,516
6,81715,059
7573,330
2015235.1
10.311.9
257.225.6%
243.632.0
20132,289.9
2,348.74,829.6
48.6%3,432.4
68.4%23,333
15,181
8,15215,589
7723,161
2016243.0
10.612.8
266.325.4%
252.233.4
20142,483.6
2,471.15,050.0
48.9%3,610.2
68.4%23,392
13,910
9,48216,112
7833,021
2017241.1
10.913.6
265.624.4%
251.534.9
20152,693.8
2,693.85,279.6
51.0%3,795.4
71.0%23,450
12,755
10,69516,621
7962,897
2018241.0
11.216.0
268.223.7%
254.036.3
20162,918.0
2,918.05,519.2
52.9%3,987.3
73.2%23,509
11,639
11,87017,134
8072,784
2019241.4
11.517.3
270.322.9%
255.937.5
20173,144.0
3,144.05,767.6
54.5%4,187.1
75.1%23,568
10,615
12,95317,606
8172,679
2020242.3
11.918.6
272.822.3%
258.338.6
20183,375.2
3,375.26,024.5
56.0%4,392.3
76.8%23,626
9,633
13,99318,077
8242,591
2021243.4
12.219.9
275.521.7%
260.940.2
20193,612.0
3,612.06,289.4
57.4%4,605.1
78.4%23,686
8,740
14,94618,504
8352,512
2022244.9
12.621.2
278.721.1%
263.942.0
20203,853.6
3,853.66,563.6
58.7%4,824.6
79.9%23,745
7,899
15,84618,907
8412,458
2023246.8
13.022.6
282.420.6%
267.443.7
20214,100.4
4,100.46,848.1
59.9%5,051.9
81.2%23,804
7,114
16,69019,298
8462,400
2024249.0
13.423.9
286.420.2%
271.245.5
20224,352.9
4,352.97,140.1
61.0%5,285.3
82.4%23,864
6,392
17,47219,655
8502,357
2025251.8
13.825.4
290.919.7%
275.547.3
20234,611.0
4,611.07,441.3
62.0%5,525.5
83.5%23,923
5,717
18,20619,992
8552,322
2026254.9
14.226.8
295.919.4%
280.249.1
20244,876.1
4,876.17,751.5
62.9%5,773.6
84.5%23,983
5,106
18,87720,299
8542,284
2027258.7
14.628.3
301.719.0%
285.750.9
20255,148.5
5,148.58,073.6
63.8%6,031.3
85.4%24,043
4,542
19,50120,576
8562,250
2028262.6
15.129.9
307.518.7%
291.252.7
20265,428.7
5,428.78,404.2
64.6%6,296.7
86.2%24,103
4,030
20,07320,815
8552,246
2029266.6
15.531.5
313.618.4%
297.054.6
20275,718.2
5,718.28,745.7
65.4%6,571.9
87.0%24,163
3,568
20,59521,024
8532,248
2030271.0
16.033.1
320.018.1%
303.056.5
20286,016.1
6,016.19,098.6
66.1%6,856.1
87.7%24,224
3,139
21,08521,213
8502,258
2031275.7
16.534.8
327.017.9%
309.658.4
20296,323.2
6,323.29,465.0
66.8%7,151.1
88.4%24,284
2,749
21,53521,382
8492,265
2032280.7
17.036.5
334.117.7%
316.460.3
20306,639.3
6,639.39,841.7
67.5%7,454.9
89.1%24,345
2,394
21,95121,529
8472,277
2033285.9
17.538.3
341.617.5%
323.562.3
20316,964.7
6,964.710,230.8
68.1%7,768.4
89.7%24,406
2,068
22,33821,653
8422,305
2034291.1
18.040.2
349.217.3%
330.764.3
20327,300.9
7,300.910,632.3
68.7%8,093.1
90.2%24,467
1,783
22,68421,744
8382,335
2035297.0
18.542.1
357.617.1%
338.666.4
20337,646.0
7,646.011,048.9
69.2%8,428.0
90.7%24,528
1,513
23,01521,830
8332,374
2036303.1
19.144.0
366.217.0%
346.768.6
20348,001.0
8,001.011,476.8
69.7%8,773.2
91.2%24,589
1,282
23,30721,893
8322,412
2037309.5
19.746.0
375.116.8%
355.270.8
20358,366.7
8,366.711,918.3
70.2%9,129.7
91.6%24,651
1,084
23,56721,939
8282,451
2038316.0
20.248.1
384.316.7%
363.973.1
20368,743.3
8,743.312,373.6
70.7%9,497.7
92.1%24,713
910
23,80321,960
8242,491
2039323.1
20.850.2
394.216.6%
373.375.5
20379,131.4
9,131.412,846.2
71.1%9,878.9
92.4%24,774
760
24,01421,968
8202,536
2040330.4
21.552.4
404.316.4%
382.877.9
20389,530.0
9,530.013,331.8
71.5%10,271.0
92.8%24,836
628
24,20821,967
8172,586
2041337.9
22.154.7
414.716.3%
392.780.4
20399,939.9
9,939.913,832.2
71.9%10,674.9
93.1%24,898
514
24,38421,952
8142,637
2042345.7
22.857.0
425.416.2%
402.983.1
204010,361.3
10,361.314,348.0
72.2%11,091.3
93.4%24,961
421
24,54021,930
8122,688
2043354.3
23.559.4
437.116.1%
413.985.8
204110,793.5
10,793.514,882.3
72.5%11,520.3
93.7%25,023
339
24,68421,903
8062,743
2044362.8
24.261.8
448.816.1%
425.088.6
204211,237.4
11,237.415,430.3
72.8%11,961.5
93.9%25,086
271
24,81521,864
8062,795
2045371.7
24.964.3
461.016.0%
436.591.5
204311,693.2
11,693.215,994.5
73.1%12,415.3
94.2%25,148
214
24,93421,823
8012,851
2046381.0
25.666.9
473.515.9%
448.394.5
204412,160.3
12,160.316,574.8
73.4%12,881.6
94.4%25,211
168
25,04321,781
8002,906
2047391.0
26.469.5
487.015.8%
461.197.6
204512,639.0
12,639.017,175.2
73.6%13,361.0
94.6%25,274
130
25,14421,737
7972,961
2048401.1
27.272.2
500.515.8%
473.9100.8
204613,129.1
13,129.117,789.0
73.8%13,852.6
94.8%25,337
100
25,23721,691
7963,014
2049411.6
28.075.0
514.615.7%
487.3104.1
204713,631.4
13,631.418,419.8
74.0%14,356.9
94.9%25,401
76
25,32521,647
7943,065
2050422.5
28.977.8
529.215.7%
501.1107.5
204814,144.9
14,144.919,067.9
74.2%14,873.7
95.1%25,46 4
56
25,40821,611
7943,114
2051434.4
29.780.7
544.815.6%
515.8111.0
204914,670.9
14,670.919,737.2
74.3%15,404.5
95.2%25,528
42
25,48621,576
7933,161
2052446.2
30.683.7
560.515.6%
530.7114.7
205015,209.4
15,209.420,421.2
74.5%15,948.5
95.4%25,592
30
25,56221,542
7923,205
2053458.6
31.586.7
576.815.5%
546.2118.4
205115,761.1
15,761.121,123.9
74.6%16,506.2
95.5%25,656
20
25,63621,515
7943,248
2054471.3
32.589.8
593.615.5%
562.1122.3
205216,325.7
16,325.721,845.5
74.7%17,078.1
95.6%25,720
13
25,70721,495
7933,286
2055485.2
33.593.0
611.615.4%
579.2126.3
205316,903.9
16,903.922,590.6
74.8%17,664.9
95.7%25,784
9
25,77521,479
7933,321
2056499.1
34.596.2
629.815.4%
596.3130.4
205417,496.4
17,496.423,352.6
74.9%18,266.9
95.8%25,849
6
25,84321,469
7943,354
2057513.5
35.599.6
648.615.4%
614.2134.7
205518,104.1
18,104.124,135.7
75.0%18,884.7
95.9%25,913
3
25,91021,464
7953,383
2058528.4
36.6103.0
668.015.3%
632.5139.1
205618,727.2
18,727.224,940.4
75.1%19,519.0
95.9%25,978
2
25,97621,466
7943,410
2059544.6
37.7106.5
688.715.3%
652.2143.6
205719,366.5
19,366.525,772.5
75.1%20,170.8
96.0%26,043
1
26,04221,473
7943,436
2060560.7
38.8110.1
709.615.3%
671.9148.2
205820,022.6
20,022.626,623.9
75.2%20,840.3
96.1%26,108
0
26,10821,484
7943,458
Assumptions:
‐ Projections are based on June 30, 2008 data and assumptions
‐ Projections have been adjusted to reflect known asset, liability, and population adjustm
ents through June 30, 2010‐ Population is assum
ed to grow 1/4 of 1%
per year‐ N
ew plans have been reflected for expected new
entrants‐ N
ew entrant populations are assum
ed to have the same characteristics as the population that entered the plan during FY 2008
‐ Investment returns are assum
ed to be 7.0% per year in the future, producing no future gains or losses in the sm
oothing method
‐ Administrative expenses are expected to increase 3%
over prior year (does not apply to FIRE)‐ Investm
ent expenses are assumed to be a fixed percent of assets ranging from
0.4% to 0.6%
depending on the System‐ The N
et City Contribution is assumed to be 94.69%
of the Total Pension Fund Contribution
BERS Pension Fund ProjectionsProjection U
sing 7.00% Interest and 0.25%
Increasing Employee Population
($ in millions)44

RETIREMENT SECURITY NYC
SUStaiNablE or Not? NYC PeNsioN Cost ProjeCtioNs through 2060
New York City ComptrollerJohn C. Liu
63JUNE, 2011
Exhibit J
Fiscal Year
Statutory Em
ployer Norm
al Contribution
Administrative
Expense Contribution
Investment
Expense Contribution
Total POLICE
Pension Fund Contribution
Total Contribution as a Percent of Salary
Net City
Contribution to PO
LICEEm
ployee contributions
Values as of
June 30Market value of assets
Actuarial value of assets
Present Value of Future Benefits
AVA divided by
PVFB
Present Value of
Accumulated
Benefits
AVA divided by PVAB
Active Count
Closed Active Group
New
Active
Service Retirem
entOrdinary
DisabilityAccidental Disability
Inact &Term
Vested
2010$1,877.9
$17.7$84.4
$1,980.165.1%
$1,980.1$55.8
2008$21,061.0
$21,393.2$37,586.8
56.9%$30,355.3
70.5%35,337
35,337
029,346
3,69111,253
2,9812011
1,978.319.3
86.02,083.6
64.3%2,083.6
55.52009
17,424.122,676.2
39,079.158.0%
31,888.571.1%
35,608
33,2712,337
29,5393,661
11,4383,022
20122,630.4
19.3105.1
2,755.387.1%
2,755.356.5
201019,985.1
23,943.645,666.6
52.4%38,015.5
63.0%34,597
31,376
3,22129,801
3,62411,615
3,0892013
2,520.619.8
116.62,657.6
85.4%2,657.6
55.02011
21,489.524,778.1
47,072.152.6%
39,337.963.0%
34,597
29,1315,466
30,5513,590
11,7833,227
20142,447.0
20.4127.7
2,595.785.2%
2,595.754.9
201223,619.5
26,049.148,503.6
53.7%40,617.1
64.1%34,597
27,224
7,37331,063
3,55211,935
3,3972015
2,517.321.1
139.62,678.5
87.3%2,678.5
57.02013
25,580.826,477.1
50,030.652.9%
41,793.163.4%
34,597
25,1119,486
31,8573,512
12,0793,574
20162,512.5
22.3151.2
2,686.186.4%
2,686.159.6
201427,381.4
27,271.151,517.3
52.9%42,894.4
63.6%34,683
23,045
11,63832,665
3,47012,202
3,7232017
2,389.723.0
161.82,574.5
81.2%2,574.5
63.62015
28,583.528,583.5
52,277.154.7%
43,947.865.0%
34,770
21,16613,604
33,3393,431
12,3143,825
20182,300.4
23.7170.4
2,494.576.9%
2,494.566.4
201629,986.6
29,986.653,218.8
56.3%44,961.6
66.7%34,857
19,416
15,44133,949
3,38912,408
3,8692019
2,221.924.4
178.82,425.1
73.5%2,425.1
69.92017
31,306.731,306.7
54,141.357.8%
45,979.368.1%
34,944
17,96416,980
34,2823,351
12,4903,899
20202,162.8
25.1186.7
2,374.770.1%
2,374.774.8
201832,516.3
32,516.355,036.0
59.1%46,932.1
69.3%35,032
16,440
18,59234,729
3,32012,562
3,8882021
2,108.725.9
194.02,328.5
67.0%2,328.5
77.52019
33,646.233,646.2
55,909.560.2%
47,853.770.3%
35,119
14,98420,135
35,1593,291
12,6193,830
20222,055.2
26.7200.7
2,282.664.5%
2,282.682.3
202034,753.6
34,753.656,760.5
61.2%48,778.2
71.2%35,207
13,803
21,40435,309
3,26712,667
3,7912023
2,007.727.5
207.42,242.6
61.9%2,242.6
85.42021
35,760.035,760.0
57,626.062.1%
49,644.072.0%
35,295
12,36222,933
35,7533,252
12,7063,725
20241,969.6
28.3213.4
2,211.359.7%
2,211.390.9
202236,733.0
36,733.058,456.0
62.8%50,488.7
72.8%35,383
11,168
24,21535,963
3,23912,736
3,6662025
1,936.629.1
219.22,185.0
57.5%2,185.0
93.92023
37,620.037,620.0
59,286.463.5%
51,275.073.4%
35,472
9,82725,645
36,3413,235
12,7533,594
20261,879.5
30.0224.6
2,134.155.7%
2,134.195.4
202438,497.5
38,497.560,104.9
64.1%52,060.4
73.9%35,560
8,719
26,84136,510
3,23412,760
3,5182027
1,823.830.9
229.82,084.5
53.9%2,084.5
100.02025
39,284.839,284.8
60,937.564.5%
52,763.374.5%
35,649
7,43228,217
36,7783,238
12,7583,532
20281,792.8
31.8234.5
2,059.251.9%
2,059.2105.4
202639,905.5
39,905.561,759.0
64.6%53,314.3
74.8%35,738
5,835
29,90337,395
3,24712,744
3,5222029
1,786.332.8
238.22,057.3
50.0%2,057.3
112.62027
40,449.740,449.7
62,557.664.7%
53,806.675.2%
35,828
4,41631,412
37,9233,260
12,7143,448
20301,805.3
33.8241.5
2,080.648.3%
2,080.6121.0
202840,953.7
40,953.763,323.8
64.7%54,260.1
75.5%35,917
3,229
32,68838,387
3,27312,667
3,2282031
1,845.034.8
244.52,124.3
47.0%2,124.3
129.12029
41,486.741,486.7
64,069.764.8%
54,738.075.8%
36,007
2,38733,620
38,3603,288
12,6033,181
20321,891.1
35.8247.7
2,174.645.8%
2,174.6137.3
203042,110.0
42,110.064,789.1
65.0%55,268.7
76.2%36,097
1,894
34,20337,923
3,30512,534
3,2082033
1,941.136.9
251.52,229.5
44.8%2,229.5
145.52031
42,842.142,842.1
65,541.865.4%
55,869.776.7%
36,187
1,51434,673
37,3583,327
12,4643,253
20341,993.3
38.0255.9
2,287.243.9%
2,287.2153.7
203243,700.4
43,700.466,347.2
65.9%56,556.1
77.3%36,278
1,204
35,07436,714
3,35812,399
3,3122035
2,026.939.2
261.12,327.2
43.2%2,327.2
155.22033
44,703.444,703.4
67,232.866.5%
57,351.577.9%
36,369
95035,419
36,0033,398
12,3403,378
20362,044.4
40.3267.1
2,351.942.6%
2,351.9161.6
203445,868.8
45,868.868,190.9
67.3%58,258.8
78.7%36,459
744
35,71535,239
3,44712,289
3,4572037
2,059.741.6
274.22,375.4
41.7%2,375.4
163.32035
47,086.647,086.6
69,337.767.9%
59,227.679.5%
36,551
58035,971
34,9743,509
12,2483,538
20382,060.4
42.8281.5
2,384.640.9%
2,384.6166.6
203648,417.4
48,417.470,535.1
68.6%60,294.6
80.3%36,642
449
36,19334,526
3,57612,215
3,6232039
2,061.044.1
289.52,394.6
40.1%2,394.6
169.32037
49,790.349,790.3
71,895.769.3%
61,426.581.1%
36,734
34436,390
34,3753,654
12,1903,712
20402,057.2
45.4297.8
2,400.439.2%
2,400.4172.1
203851,209.2
51,209.273,335.8
69.8%62,614.5
81.8%36,825
260
36,56534,267
3,73612,174
3,8012041
2,054.346.8
306.32,407.4
38.4%2,407.4
175.72039
52,660.352,660.3
74,882.270.3%
63,856.282.5%
36,918
19436,724
34,2663,826
12,1653,892
20422,054.0
48.2315.1
2,417.237.5%
2,417.2179.8
204054,129.2
54,129.276,524.3
70.7%65,143.5
83.1%37,010
141
36,86934,348
3,91712,161
3,9772043
2,061.349.6
323.92,434.8
36.7%2,434.8
185.02041
55,619.755,619.7
78,260.371.1%
66,483.483.7%
37,102
10137,001
34,4514,014
12,1614,054
20442,071.3
51.1332.9
2,455.336.0%
2,455.3190.1
204257,133.0
57,133.080,061.4
71.4%67,867.0
84.2%37,195
70
37,12534,569
4,11012,166
4,1262045
2,083.452.6
342.02,478.0
35.2%2,478.0
195.62043
58,686.758,686.7
81,929.271.6%
69,307.884.7%
37,288
4737,241
34,6494,211
12,1754,188
20462,100.7
54.2351.4
2,506.334.6%
2,506.3202.4
204460,275.1
60,275.183,884.2
71.9%70,805.2
85.1%37,381
29
37,35234,755
4,31412,189
4,2452047
2,123.455.8
360.92,540.2
34.0%2,540.2
208.22045
61,902.461,902.4
85,939.172.0%
72,367.385.5%
37,475
1737,458
34,8624,418
12,2054,295
20482,145.3
57.5370.7
2,573.533.4%
2,573.5215.2
204663,589.1
63,589.188,053.6
72.2%73,999.3
85.9%37,568
9
37,55934,923
4,52212,224
4,3432049
2,170.959.2
380.92,611. 0
32.9%2,611.0
221.62047
65,323.765,323.7
90,277.972.4%
75,699.586.3%
37,662
437,658
35,0344,630
12,2454,383
20502,198.5
61.0391.3
2,650.832.4%
2,650.8229.2
204867,122.6
67,122.692,589.3
72.5%77,479.9
86.6%37,757
1
37,75635,114
4,73812,271
4,4232051
2,231.862.8
402.12,696.8
31.9%2,696.8
236.02049
68,981.268,981.2
95,034.572.6%
79,344.186.9%
37,851
037,851
35,2314,847
12,2974,458
20522,259.9
64.7413.3
2,737.931.5%
2,737.9241.6
205070,917.9
70,917.997,561.1
72.7%81,298.2
87.2%37,946
0
37,94635,312
4,95512,326
4,4912053
2,288.266.7
425.02,779.9
31.2%2,779.9
248.42051
72,925. 472,925.4
100,216.072.8%
83,341.387.5%
38,040
038,040
35,4385,065
12,3594,519
20542,323.2
68.7437.1
2,828.930.8%
2,828.9256.2
205274,976.1
74,976.1103,013.9
72.8%85,458.8
87.7%38,135
0
38,13535,666
5,17212,393
4,5462055
2,369.570.7
449.42,889.7
30.5%2,889.7
265.82053
77,079. 677,079.6
105,942.172.8%
87,656.387.9%
38,231
038,231
35,9045,277
12,4334,567
20562,424.8
72.9462.0
2,959.730.1%
2,959.7277.1
205479,252.5
79,252.5108,953.6
72.7%89,938.4
88.1%38,326
0
38,32636,120
5,38112,473
4,5852057
2,489.875.0
475.13,040.0
29.8%3,040.0
289.22055
81,526.281,526.2
112,056.472.8%
92,325.488.3%
38,422
038,422
36,2745,482
12,5184,600
20582,560.7
77.3488.8
3,126.829.5%
3,126.8302.0
205683,933.0
83,933.0115,251.5
72.8%94,841.4
88.5%38,518
0
38,51836,344
5,57712,570
4,6122059
2,639.879.6
503.33,222.6
29.3%3,222.6
315.42057
86,492.886,492.8
118,585.472.9%
97,505.588.7%
38,615
038,615
36,3725,674
12,6274,624
20602,721.5
82.0518.6
3,322.129.0%
3,322.1329.3
205889,221.8
89,221.8122,032.8
73.1%100,330.5
88.9%38,711
0
38,71136,372
5,76712,690
4,631
Assumptions:
‐ Projections are based on June 30, 2008 data and assumption s
‐ Projections have been adjusted to reflect known asset, liability, and population adjustm
ents through June 30, 2010‐ Population is assum
ed to grow 1/4 of 1%
per year‐ N
ew plans have been reflected for expected new
entrants (Tier 3 POLICE)
‐ New
entrant populations are assumed to have the sam
e characteristics as the population that entered the plan during FY 2008‐ Investm
ent returns are assumed to be 7.0%
per year in the future, producing no future gains or losses in the smoothing m
ethod‐ Adm
inistrative expenses are expected to increase 3% over prior year (does not apply to FIRE)
‐ Investment expenses are assum
ed to be a fixed percent of assets ranging from 0.4%
to 0.6% depending on the System
‐ The Net City Contribution is assum
ed to be 100% of the Total Pension Fund Contribution
POLICE Pension Fund Projections
Projection Using 7.00%
Interest and 0.25% Increasing Em
ployee Population($ in m
illions)45

RETIREMENT SECURITY NYC
SUStaiNablE or Not? NYC PeNsioN Cost ProjeCtioNs through 2060
New York City ComptrollerJohn C. Liu
64 JUNE, 2011
Exhibit J
Fiscal Year
Statutory Em
ployer Norm
al Contribution
Administrative
Expense Contribution
Investment
Expense Contribution
Total FIRE Pension Fund Contribution
Total Contribution as a Percent of Salary
Net City
Contribution to FIRE
Employee
contributions
Values as of
June 30Market value of assets
Actuarial value of assets
Present Value of Future Benefits
AVA divided by
PVFB
Present Value of
Accumulated
Benefits
AVA divided by PVAB
Active Count
Closed Active Group
New
Active
Service Retirem
entOrdinary
DisabilityAccidental Disability
Inact &Term
Vested
2010$825.7
$0.0$24.9
$874.383.1%
$874.3$14.6
2008$6,817.3
$6,943.0$15,193.8
45.7%$12,842.9
54.1%11,574
11,574
07,966
1,2848,149
852011
864.20.0
26.5890.7
82.1%890.7
14.32009
5,576.87,304.8
15,647.646.7%
13,321.654.8%
11,458
11,124334
7,7931,239
8,15795
20121,076.4
0.033.1
1,109.5104.9%
1,109.514.6
20106,438.8
7,679.418,032.3
42.6%15,536.4
49.4%11,080
10,682
3987,634
1,1978,163
1072013
1,047.00.0
37.61,084.6
103.5%1,084.6
14.92011
6,870.77,901.5
18,367.243.0%
15,873.949.8%
11,080
10,196884
7,5341,155
8,166118
20141,043.2
0.040.7
1,083.9103.3%
1,083.915.4
20127,448.4
8,203.218,706.7
43.9%16,200.3
50.6%11,080
9,736
1,3447,426
1,1138,166
1302015
1,082.40.0
44.21,126.6
105.9%1,126.6
15.92013
7,992.88,251.4
19,078.243.3%
16,524.749.9%
11,080
9,2941,786
7,3111,076
8,162141
20161,092.6
0.047.5
1,140.2105.7%
1,140.216.5
20148,507.4
8,455.119,426.7
43.5%16,843.1
50.2%11,108
8,849
2,2597,208
1,0408,158
1552017
1,057.80.0
50.61,108.4
101.0%1,108.4
17.42015
9,048.99,048.9
19,733.145.9%
17,153.952.8%
11,136
8,3862,750
7,1361,006
8,150165
20181,031.0
0.056.5
1,087.597.2%
1,087.518.2
20169,618.9
9,618.920,048.9
48.0%17,456.2
55.1%11,163
7,918
3,2457,076
9738,141
1762019
1,005.70.0
59.51,065.2
93.6%1,065.2
18.92017
10,164.510,164.5
20,366.449.9%
17,758.457.2%
11,191
7,4693,722
7,013944
8,125184
2020979.5
0.062.4
1,041.890.1%
1,041.819.8
201810,695.1
10,695.120,679.4
51.7%18,050.9
59.2%11,219
7,024
4,1956,953
9158,106
1882021
954.00.0
65.11,019.1
86.7%1,019.1
21.02019
11,208.711,208.7
20,992.053.4%
18,333.261.1%
11,247
6,5704,677
6,912890
8,085194
2022929.1
0.067.7
996.883.3%
996.821.5
202011,707.0
11,707.021,303.7
55.0%18,604.0
62.9%11,276
6,111
5,1656,880
8688,060
2022023
905.10.0
70.2975.3
80.3%975.3
21.92021
12,184.512,184.5
21,615.556.4%
18,869.364.6%
11,304
5,6735,631
6,840846
8,029206
2024879.0
0.072.5
951.577.4%
951.522.2
202212,471.4
12,471.421,756.1
57.3%19,116.1
65.2%11,332
5,229
6,1036,820
8277,996
2092025
853.10.0
74.6927.7
74.5%927.7
23.02023
12,790.812,790.8
21,953.458.3%
19,342.266.1%
11,360
4,7736,587
6,824812
7,961206
2026827.5
0.076.5
904.071.6%
904.023.4
202413,076.5
13,076.522,142.2
59.1%19,543.7
66.9%11,389
4,293
7,0966,858
7977,921
2112027
805.60.0
78.2883.8
69.0%883.8
24.32025
13,323.013,323.0
22,317.759.7%
19,726.067.5%
11,417
3,8397,578
6,876785
7,877215
2028786.1
0.079.7
865.866.4%
865.825.6
202613,532.4
13,532.422,472.8
60.2%19,877.1
68.1%11,446
3,393
8,0536,903
7757,827
2212029
770.70.0
81.0851.6
64.0%851.6
27.62027
13,710.213,710.2
22,612.860.6%
20,003.468.5%
11,474
2,9628,512
6,930769
7,774224
2030759.8
0.082.0
841.961.8%
841.930.0
202813,860.4
13,860.422,737.8
61.0%20,107.3
68.9%11,503
2,556
8,9476,945
7637,716
2282031
753.80.0
82.9836.7
59.8%836.7
32.42029
13,990.213,990.2
22,848.761.2%
20,194.969.3%
11,532
2,1919,341
6,936761
7,654232
2032750.6
0.083.7
834.358.1%
834.334.8
203014,105.4
14,105.422,937.0
61.5%20,263.1
69.6%11,561
1,879
9,6826,887
7607,588
2372033
749.60.0
84.4834.0
56.4%834.0
37.32031
14,212.214,212.2
23,013.461.8%
20,317.969.9%
11,589
1,5989,991
6,823764
7,520244
2034750.2
0.085.0
835.254.9%
835.239.8
203214,316.4
14,316.423,081.8
62.0%20,361.8
70.3%11,618
1,343
10,2756,744
7687,449
2512035
751.20.0
85.7836.8
53.4%836.8
41.12033
14,423.214,423.2
23,148.862.3%
20,401.470.7%
11,648
1,11410,534
6,654776
7,379259
2036752.3
0.086.3
838.752.1%
838.743.5
203414,531.9
14,531.923,210.9
62.6%20,435.4
71.1%11,677
910
10,7676,554
7857,306
2692037
752.50.0
87.0839.5
50.6%839.5
44.42035
14,649.514,649.5
23,284.462.9%
20,467.671.6%
11,706
73010,976
6,483798
7,233279
2038751.8
0.087.7
839.549.3%
839.545.5
203614,773.9
14,773.923,360.1
63.2%20,503.1
72.1%11,735
574
11,1616,395
8147,161
2892039
751.10.0
88.4839.5
48.0%839.5
46.82037
14,905.014,905.0
23,460.063.5%
20,546.172.5%
11,764
44111,323
6,340831
7,088300
2040749.9
0.089.2
839.246.6%
839.248.0
203815,045.9
15,045.923,574.8
63.8%20,594.2
73.1%11,794
330
11,4646,308
8537,016
3102041
748.80.0
90.1838.9
45.3%838.9
49.22039
15,198.615,198.6
23,706.464.1%
20,652.973.6%
11,823
24011,583
6,282878
6,941321
2042747.6
0.091.0
838.644.0%
838.650.4
204015,364.6
15,364.623,859.5
64.4%20,725.6
74.1%11,853
169
11,6846,269
9036,871
3322043
747.40.0
92.0839.4
42.7%839.4
51.82041
15,546.115,546.1
24,044.564.7%
20,818.674.7%
11,882
11311,769
6,270929
6,801342
2044747.2
0.093.1
840.341.5%
840.353.3
204215,744.9
15,744.924,252.4
64.9%20,930.3
75.2%11,912
73
11,8396,280
9606,733
3512045
747.40.0
94.3841.7
40.3%841.7
54.82043
15,963.215,963.2
24,490.565.2%
21,065.875.8%
11,942
4411,898
6,303991
6,670361
2046747.8
0.095.6
843.439.2%
843.456.3
204416,201.3
16,201.324,760.6
65.4%21,227.1
76.3%11,972
25
11,9476,329
1,0236,609
3692047
749.30.0
97.1846.4
38.1%846.4
58.02045
16,459.416,459.4
25,068.665.7%
21,417.176.9%
12,002
1311,989
6,3701,059
6,558377
2048751.0
0.098.6
849.637.1%
849.659.7
204616,739.0
16,739.025,408.6
65.9%21,633.8
77.4%12,032
5
12,0276,420
1,0956,508
3842049
753.30.0
100.3853.6
36.2%853.6
61.32047
17,041.317,041.3
25,783.966.1%
21,880.577.9%
12,062
112,061
6,4771,133
6,470391
2050755.9
0.0102.1
858.135.3%
858.163.0
204817,365. 8
17,365.826,196.6
66.3%22,158.1
78.4%12,092
0
12,0926,543
1,1736,434
3982051
760.10.0
104.1864.2
34.5%864.2
64.82049
17,711.017,711.0
26,653.466.4%
22,468.378.8%
12,122
012,122
6,6181,214
6,409403
2052764.8
0.0106.2
870.933.8%
870.966.7
205018,077.2
18,077.227,145.1
66.6%22,807.8
79.3%12,153
0
12,1536,705
1,2566,390
4092053
770.60.0
108.4878.9
33.1%878.9
68.72051
18,465.118,465.1
27,674.666.7%
23,177.979.7%
12,183
012,183
6,7991,300
6,378415
2054777.5
0.0110.7
888.232.4%
888.270.8
205218,874.6
18,874.628,241.6
66.8%23,578.9
80.0%12,213
0
12,2136,898
1,3436,373
4192055
786.60.0
113.2899.8
31.8%899.8
73.32053
19,306.819,306.8
28,851.466.9%
24,011.980.4%
12,244
012,244
7,0021,385
6,373424
2056796.9
0.0115.8
912.631.3%
912.676.1
205419,763.3
19,763.329,493.5
67.0%24,475.6
80.7%12,275
0
12,2757,112
1,4286,380
4272057
808.80.0
118.5927.3
30.8%927.3
79.12055
20,247.720,247.7
30,171.567.1%
24,972.181.1%
12,305
012,305
7,2191,471
6,392430
2058822.2
0.0121.4
943.630.3%
943.682.3
205620,762.3
20,762.330,885.2
67.2%25,502.9
81.4%12,336
0
12,3367,325
1,5116,410
4332059
837.80.0
124.5962.3
29.9%962.3
85.62057
21,309.721,309.7
31,642.167.3%
26,071.081.7%
12,367
012,367
7,4251,551
6,430435
2060854.4
0.0127.8
982.229.5%
982.289.1
205821,892.6
21,892.632,432.9
67.5%26,677.1
82.1%12,398
0
12,3987,522
1,5946,456
436
Assumptions:
‐ Projections are based on June 30, 2008 data and assumptions
‐ Projections have been adjusted to reflect known asset, liability, and population adjustm
ents through June 30, 2010‐ Population is assum
ed to grow 1/4 of 1%
per year‐ N
ew plans have been reflected for expected new
entrants (Tier 3 FIRE)‐ N
ew entrant populations are assum
ed to have the same characteristics as the population that entered the plan during FY 2008
‐ Investment returns are assum
ed to be 7.0% per year in the future, producing no future gains or losses in the sm
oothing method
‐ Administrative expenses are expected to increase 3%
over prior year (does not apply to FIRE)‐ Investm
ent expenses are assumed to be a fixed percent of assets ranging from
0.4% to 0.6%
depending on the System‐ The N
et City Contribution is assumed to be 100%
of the Total Pension Fund Contribution
FIRE Pension Fund ProjectionsProjection U
sing 7.00% Interest and 0.25%
Increasing Employee Population
($ in millions)46
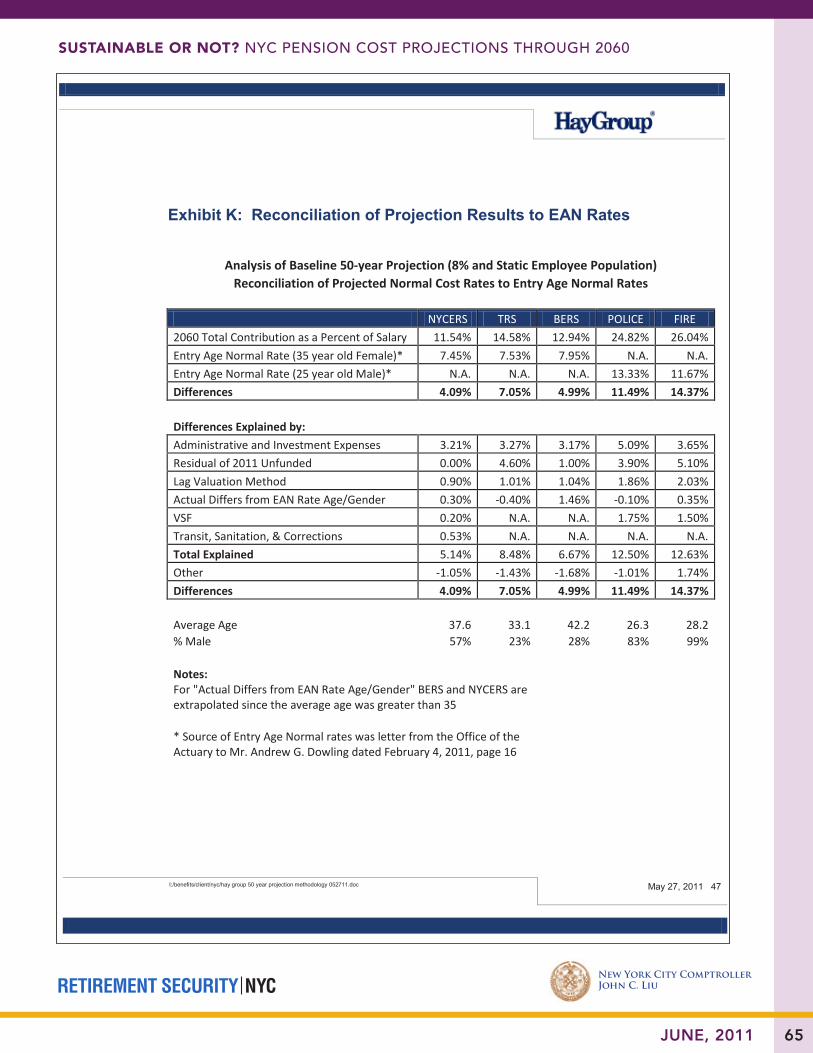
RETIREMENT SECURITY NYC
SUStaiNablE or Not? NYC PeNsioN Cost ProjeCtioNs through 2060
New York City ComptrollerJohn C. Liu
65JUNE, 2011
I:/benefits/client/nyc/hay group 50 year projection methodology 052711.doc May 27, 2011 47
Exhibit K: Reconciliation of Projection Results to EAN Rates
Analysis of Baseline 50-year Projection (8% and Static Employee Population) Reconciliation of Projected Normal Cost Rates to Entry Age Normal Rates
NYCERS TRS BERS POLICE FIRE 2060 Total Contribution as a Percent of Salary 11.54% 14.58% 12.94% 24.82% 26.04% Entry Age Normal Rate (35 year old Female)* 7.45% 7.53% 7.95% N.A. N.A. Entry Age Normal Rate (25 year old Male)* N.A. N.A. N.A. 13.33% 11.67% Differences 4.09% 7.05% 4.99% 11.49% 14.37%
Differences Explained by: Administrative and Investment Expenses 3.21% 3.27% 3.17% 5.09% 3.65%
Residual of 2011 Unfunded 0.00% 4.60% 1.00% 3.90% 5.10% Lag Valuation Method 0.90% 1.01% 1.04% 1.86% 2.03% Actual Differs from EAN Rate Age/Gender 0.30% -0.40% 1.46% -0.10% 0.35% VSF 0.20% N.A. N.A. 1.75% 1.50% Transit, Sanitation, & Corrections 0.53% N.A. N.A. N.A. N.A. Total Explained 5.14% 8.48% 6.67% 12.50% 12.63% Other -1.05% -1.43% -1.68% -1.01% 1.74% Differences 4.09% 7.05% 4.99% 11.49% 14.37%
Average Age 37.6 33.1 42.2 26.3 28.2 % Male 57% 23% 28% 83% 99%
Notes: For "Actual Differs from EAN Rate Age/Gender" BERS and NYCERS are
extrapolated since the average age was greater than 35
* Source of Entry Age Normal rates was letter from the Office of the Actuary to Mr. Andrew G. Dowling dated February 4, 2011, page 16

RETIREMENT SECURITY NYC
Comptroller of the City of New York
1 Centre Street, New York, NY 10007
comptroller.nyc.gov
New York City ComptrollerJohn C. Liu