sustainable nitrate-contaminated water treatment using multi cycle ion-exchange/bioregeneration of...
TRANSCRIPT
Accepted Manuscript
Title: Sustainable nitrate-contaminated water treatment usingmulti cycle ion-exchange/bioregeneration of nitrate selectiveresin
Author: Shelir Ebrahimi Deborah J. Roberts
PII: S0304-3894(13)00669-9DOI: http://dx.doi.org/doi:10.1016/j.jhazmat.2013.09.025Reference: HAZMAT 15405
To appear in: Journal of Hazardous Materials
Received date: 30-5-2013Revised date: 11-9-2013Accepted date: 12-9-2013
Please cite this article as: S. Ebrahimi, Sustainable nitrate-contaminated water treatmentusing multi cycle ion-exchange/bioregeneration of nitrate selective resin, Journal ofHazardous Materials (2013), http://dx.doi.org/10.1016/j.jhazmat.2013.09.025
This is a PDF file of an unedited manuscript that has been accepted for publication.As a service to our customers we are providing this early version of the manuscript.The manuscript will undergo copyediting, typesetting, and review of the resulting proofbefore it is published in its final form. Please note that during the production processerrors may be discovered which could affect the content, and all legal disclaimers thatapply to the journal pertain.
Page 1 of 28
Accep
ted
Man
uscr
ipt
1
Sustainable nitrate-contaminated water treatment using multi cycle ion-1
exchange/bioregeneration of nitrate selective resin2
Shelir Ebrahimi1, Deborah J. Roberts1*3
1 School of Engineering, University of British Columbia, EME 3218, 3333 University Way, 4
Kelowna, BC Canada V1V 1V7. [email protected]
* Corresponding author: School of Engineering, University of British Columbia, EME 4261, 6
3333 University Way, Kelowna, BC Canada V1V 1V7. [email protected], Phone (001)7
250 807-8722 | Fax (001) 250 807-98508
9
Page 2 of 28
Accep
ted
Man
uscr
ipt
2
9
Abstract10
The sustainability of ion-exchange treatment processes using high capacity single use 11
resins to remove nitrate from contaminated drinking water can be achieved by regenerating the 12
exhausted resin and reusing it multiple times. In this study, multi cycle loading and 13
bioregeneration of tributylamine strong base anion (SBA) exchange resin was studied. After each 14
cycle of exhaustion, biological regeneration of the resin was performed using a salt-tolerant, 15
nitrate-perchlorate-reducing culture for 48 hours. The resin was enclosed in a membrane to avoid 16
direct contact of the resin with the culture. The results show that the culture was capable of 17
regenerating the resin and allowing the resin to be used in multiple cycles. The concentrations of 18
nitrate in the samples reached a peak in first 0.5 to 1 hour after placing the resin in medium 19
because of desorption of nitrate from resin with desorption rate of 0.099±0.003 hr-1. After this 20
time, since microorganisms began to degrade the nitrate in the aqueous phase, the nitrate 21
concentration was generally non-detectable after 10 hours. The average of calculated specific 22
degradation rate of nitrate was -0.015 mg NO3- /mg VSS.hr.23
Applying 6 cycles of resin exhaustion/ regeneration shows resin can be used for 4 cycles 24
without a loss of capacity, after 6 cycles only 6% of the capacity was lost. This is the first 25
published research to examine the direct regeneration of a resin enclosed in a membrane, to 26
allow reuse without any disinfection or cleaning procedures. 27
28
Keywords: Denitrification, drinking water, ion exchange, biological treatment, resin 29
regeneration30
31
Page 3 of 28
Accep
ted
Man
uscr
ipt
4
32
1. Introduction33
Nitrate contamination of groundwater from agricultural activities, discharges of 34
municipal and industrial wastewaters, processed food, dairy and meat products, and the 35
decomposition of decaying buried organic matter is a growing concern worldwide [1, 2, 3, 4, 5, 36
6]. Excess nitrate can cause several environmental and health problems [1]. An intake of high 37
concentrations of nitrate can cause many effects including birth defects, spontaneous abortions, 38
increased infant mortality, abdominal pains, diarrhea, vomiting, and changes to the immune 39
system. Nitrate is converted to nitrite in the stomach, which is the main cause of 40
methemoglobinemia and is suspected as a causative agent of human cancer. Methemoglobinemia 41
results in a lack of oxygen in body tissues, especially blood cells [2]. Additionally, nitrate can 42
cause heavy growth of algae in the water bodies ultimately resulting in eutrophication. Nitrate 43
has also been known to poison cattle if they ingest significant concentrations (3000 ppm nitrate 44
from food and water) [3]. To limit the risk to human health from nitrate in drinking water, the 45
maximum acceptable concentration (MAC) was set to be 10 mg-N/L (45 mg NO3-/L) in Canada 46
and the United States, while the World Health Organization (WHO) and the European 47
Community have set the MAC at 11.3 mg-N/L (50 mg NO3-/L) [7, 8].48
The most common treatment processes used to remove nitrate are zero-valent iron, zero-49
valent magnesium, reverse osmosis, ion exchange, electro dialysis, activated carbon adsorption 50
in conjunction with pH adjustment and biological treatments methods [9-12]. There are 51
disadvantages with many of these methods that limit their utility, such as, the expense of 52
operation, and the requirement for disposal of the waste brine or by-products. A sustainable 53
solution to the nitrate problem would most likely involve a combination of physical-chemical 54
Page 4 of 28
Accep
ted
Man
uscr
ipt
5
systems such as, reverse osmosis or ion exchange (IX) and a biological system to treat the 55
contaminated resin or brine of these systems [9-12].56
One of the most commonly used methods for the removal of nitrate from drinking water 57
is ion exchange [13-18]. Industry is trending toward the use of nitrate selective single use resins. 58
These resins have a great capacity for nitrate but since there are no economically viable methods 59
for regenerating them, they are replaced after exhaustion and incinerated or disposed of in a 60
landfill. The production of greenhouse gases and re-contamination of the environment are very61
important disadvantages of incineration and landfill, respectively, not to mention the 62
environmental cost of resin production, the cost of the resin itself, and the environmental costs of 63
shipping the resin to each treatment site.64
The wide use of ion-exchange processes to remove nitrate from drinking water creates 65
an urgency for development of a process for the regeneration of these resins. Since these resins 66
cost in the thousands of dollars per cubic foot, the ability to reuse the resin for even a few times, 67
will increase the economic viability and sustainability of nitrate-contaminated water treatment 68
processes. 69
Venkatesan et al. [19] and Xiao et al. [20] studied the direct bioregeneration of 70
perchlorate-selective resin. The resin was in direct contact with the culture in both of these 71
papers and so at the end of each cycle, bio-fouling removal and disinfection of resin was 72
performed before the resin was reused in another cycle. Also, because of the direct contact of 73
biomass with resin there is a possibility biomass effecting the desorption of perchlorate from the 74
resin. These factors result in increasing the cost and time required for each regeneration cycle75
[19].76
Page 5 of 28
Accep
ted
Man
uscr
ipt
6
In this study we perform multi-cycle exhaustion/ regeneration of trybutylamine strong 77
base anion (SBA) exchange resin with nitrate enclosed in a membrane to eliminate direct contact 78
of the biological system with the resin. The specific objectives of this research are to determine: 79
the feasibility of multi cycle regeneration of nitrate-selective resin, the capacity loss of the resin 80
after several IX/ bioregeneration cycles, the kinetics observed during each of the processes, and 81
to evaluate the results in the context of the literature to date. 82
2. Materials & Methods83
2.1. Resin84
This research was performed using ion exchange resin commercially available as highly 85
nitrate selective product (CalRez 2190). This resin is classified as a macroporous styrene strong 86
base anion (SBA) resin with N-tributylamine functional groups. The resin beads are 0.77±0.06 87
mm. Based on previous studies the nitrate-chloride separation factor and capacity of the resin 88
was identified as 780 and 1.48 meq/g, respectively [21]. The resin was conditioned and 89
converted to the chloride form using HCl (1N) and NaOH (1N) using 3 cycles of acid- base 90
cycling. One g of the washed resin was enclosed in a membrane (Spectrum Spectra/por 6RC91
Dialysis membrane tubing 50,000 Dalton molecular weight cut-off) to avoid direct contact of the 92
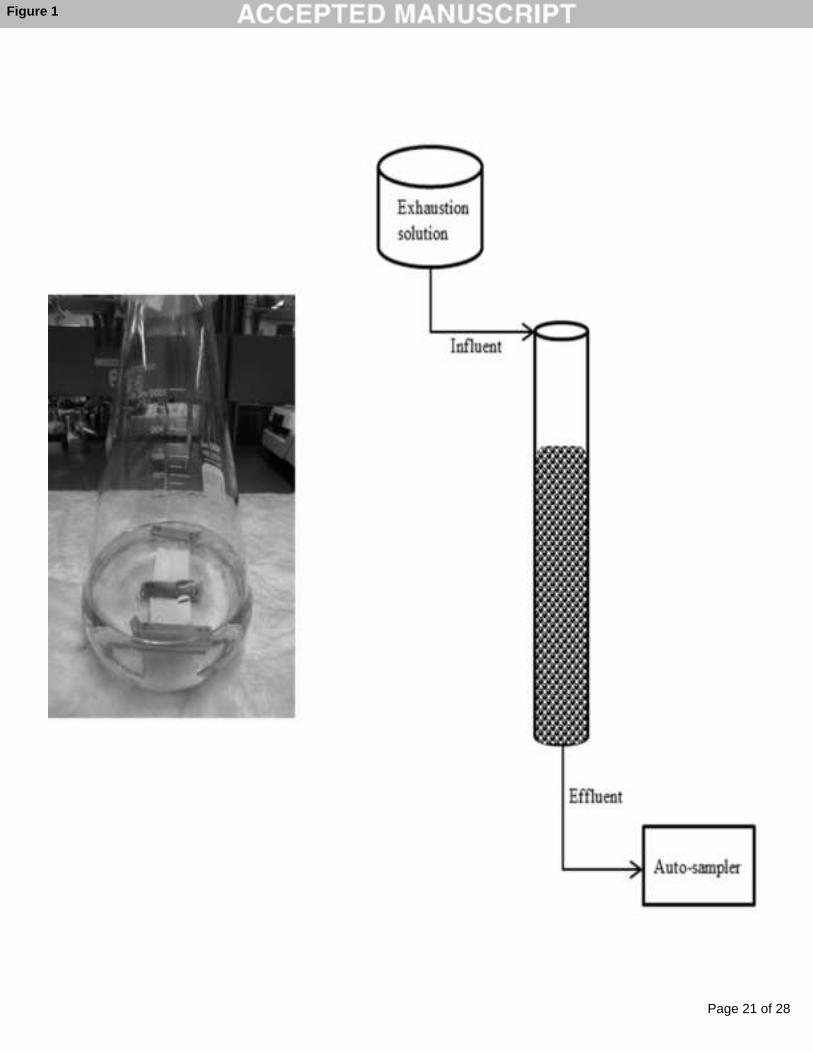
resin with the culture. Figure 1-a shows resin enclosed in the membrane (using clamps) in the 93
reactor (1 litre flask). The mass of resin was chosen to present as close to a monolayer of resin as 94
possible to maximize the transfer of nitrate out of the resin and in to the culture. 95
2.2. Culture96
A mixed perchlorate- and nitrate-reducing bacterial culture (NP30) was enriched from 97
marine sediment in previous research [22]. The culture was adapted to 6% salt and 500 mg/L 98
Page 6 of 28
Accep
ted
Man
uscr
ipt
7
nitrate using synthetic medium based on general marine medium composition with the addition 99
of a group of trace metals as reported previously [22]. The medium contained 23 g/L 100
MgCl2•6H2O, 1.4 g/L CaCl2•2H2O, 0.72 g/L KCl, 60 g/L NaCl, 3.9 g/L CH3COONa•3H2O, 0.3 101
g/L NaHCO3, 0.48 g/L NH4Cl, 1 mL/L 67 mM Na2S•9H2O, 1 mL/L phosphate solution (50 g/L 102
KH2PO4), 1 mL/L mineral solution (which contained 50 g/L (NH4)6Mo7O24•4H2O, 0.05 g/L 103
ZnCl2, 0.3 g/L H3BO3, 1.5 g/L FeCl2•4H2O, 10 g/L CoCl2•6H2O, 0.03 g/L MnCl2•6H2O, and 104
0.03 g/L NiCl2•6H2O). Acetate was applied to achieve 1.5 acetate to nitrate ratio as the carbon 105
and electron source. Strict anaerobic technique was used in medium preparation. 106
2.3. Exhaustion/ Regeneration107
In this research, 3 test (biological regeneration) and 3 control (salt only regeneration) 108
samples were studied using 6 cycles of exhaustion/ regeneration. Tests and controls were treated 109
identically during exhaustion. The resin was exhausted in glass columns in the first and last cycle 110
to reveal the breakthrough curve and capacity for this resin using glass columns with 5cm 111
diameter and 50cm length (figure 1-b). To do this, nitrate solution (500 mg/L) was used as 112
influent with a flow rate of 2.5 ml/min to obtain an empty bed contact time (EBCT) of 10 min. 113
Samples of the effluent were collected periodically and analysed for nitrate concentration. The 114
resin was considered as exhausted when nitrate appeared in the effluent. The resin operating 115
capacity was estimated from the breakthrough curve by calculating the area above the curve and 116
the mass of resin loaded. 117
Exhaustion for cycles 2-5 were done as a batch where both control and test samples 118
were enclosed in membranes and placed in 1 litre flasks with 300 ml of 700 mg/L nitrate solution 119
and mixed on a rotary shaker (110 RPM & 23°C) for 3 days to ensure complete exhaustion. A 120
sample of the aqueous phase was analysed for nitrate before and after exhaustion. 121
Page 7 of 28
Accep
ted
Man
uscr
ipt
8
During regeneration studies the test membranes containing resin were placed in 1 litre 122
flasks with 250 ml of mixed synthetic medium and culture (2500 mg/L VSS) and mixed by 123
shaking on a rotary shaker (110 RPM & 23°C) for 48 hours. In addition to the 3 replicates of test 124
conditions, 3 replicates of control conditions were placed in the same medium without the 125
culture to show nitrate desorption from resin due to the salt. For the controls the medium was 126
replaced with new medium at the beginning of each regeneration cycle. For the tests the culture 127
was settled and about 90% of the medium above the biomass was replaced with fresh medium. 128
Biomass concentrations were measured based on the volatile suspended solids (VSS) 129
before the first cycle and after the last cycle. Aqueous phase samples were taken in intervals 130
during regeneration for nitrate analysis. After each complete cycle, 0.1 g of resin was taken for 131
analysis of the nitrate attached to the resin.132
2.4. Analytical Methods133
Nitrate in the aqueous phase was measured using the nitrate test kit and an Orion 134
9512BNWP ammonia ion selective electrode (Thermo Fisher Scientific) when the concentration 135
of nitrate was higher than 1 mg/L. Lower concentrations of nitrate and chloride concentrations136
were measured using a Dionex ICS-2100 with KOH eluent using a multi-step gradient of 1, 1,137
30, 60, 1, and 1 mM respectively at time of 0, 8, 28, 38, 38, and 43 minutes and flow rate of 1.5 138
ml/min. Calibration curves were established using nitrate standard solutions of 250 µg/L, 500 139
µg/L, 750 µg/L and 1 mg/L and chloride standard solutions of 750 µg/L, l mg/L, 10 mg/L, 100 140
mg/L, and 500 mg/L.141
The measurement of nitrate attached to the resin was carried out by resin combustion in 142
a calorimeter (Bomb calorimeter). After combustion the combustion chamber was rinsed 143
thoroughly with Type 1 (18.2 MOhm/cm2) water. The rinsate was analysed using the IC and the 144
Page 8 of 28
Accep
ted
Man
uscr
ipt
9
difference of the chloride concentration in samples and samples from the resin in complete 145
chloride form was used to calculate the nitrate attached to the resin. The subtractive method was 146
applied because the nitrogen backbone of the resin formed nitrate on combustion and prevented 147
the direct measurement of nitrate on the resin. The method was verified by combustion of resin 148
with known nitrogen loading prior to the use of the technique for samples.149
Volatile suspended solids (VSS, biomass) was measured using Standard Methods 254-E 150
[23]. A sample volume of two ml was filtered through a glass fiber filter. The filter was dried and 151
then combusted. 152
2.5. Statistical Analysis153
Statistical analysis was performed to determine whether there is a significant difference 154
in nitrate concentration between the different processes. The statistical significance of the 155
differences was determined using one way ANOVA test (p=0.05) and a Student Neuman Keuls 156
test when the ANOVA showed significant differences using SPSS Statistic 20 software.157
3. Results158
3.1. Resin Exhaustion159
Before and after each exhaustion cycle nitrate was measured in the aqueous phase of 160
each test and control reactor. Based on the difference of nitrate concentration before and after 161
exhaustion and the mass of applied resin, the amount of nitrate absorbed on the resin was 162
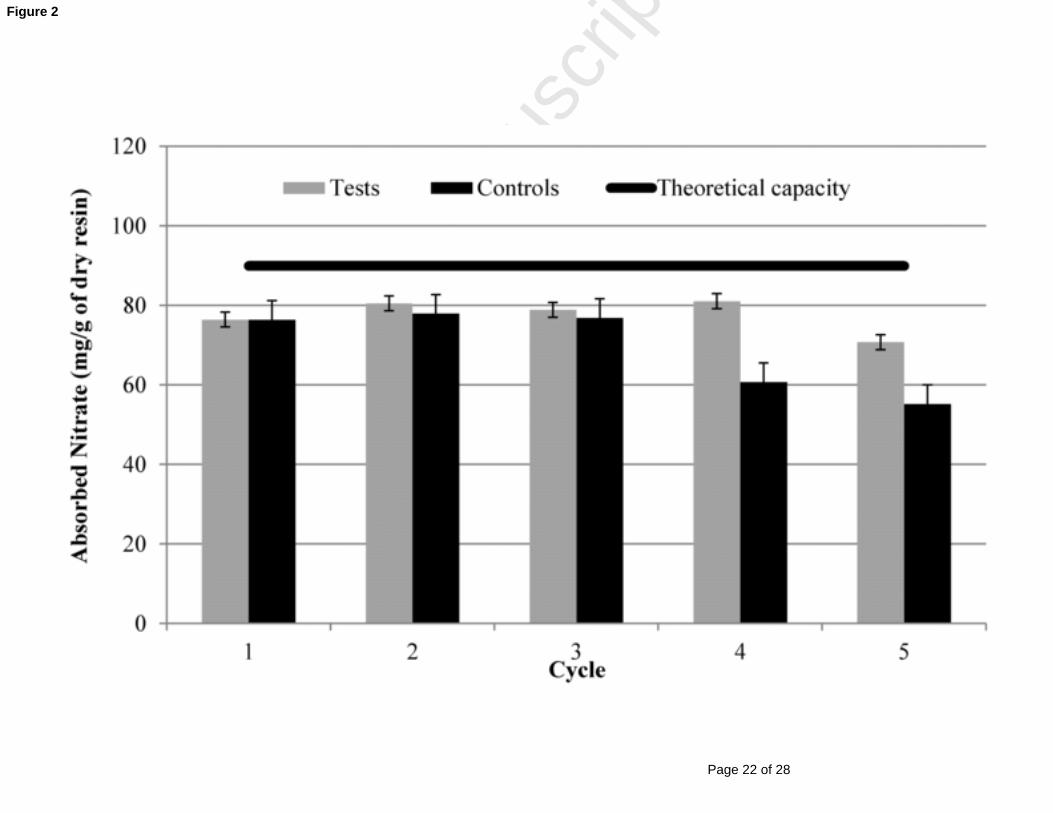
calculated. Figure 2 presents the nitrate absorbed in test and control reactors for each cycle 163
compared to theoretical capacity. Since at the end of each cycle a sample was taken out from 164
resin absorbed nitrate has been normalized based on mass of resin at each cycle.165
Page 9 of 28
Accep
ted
Man
uscr
ipt
10
Statistical analysis revealed there was no significant difference in the absorbed nitrate 166
over the first 4 cycles. For cycle 5, the difference is significant, a 12% reduction in absorbed 167
nitrate was observed in cycle 5 compare to other cycles. There was also no significant difference 168
in absorbed nitrate in the controls in first 3 cycles, the amount of absorbed nitrate decreased 169
significantly in cycles 4 and 5. The statistical analysis also showed that there was significantly170
more nitrate adsorbed in the tests than in the controls for the 4th and 5th cycle. 171
3.2. Resin Bio-Regeneration172
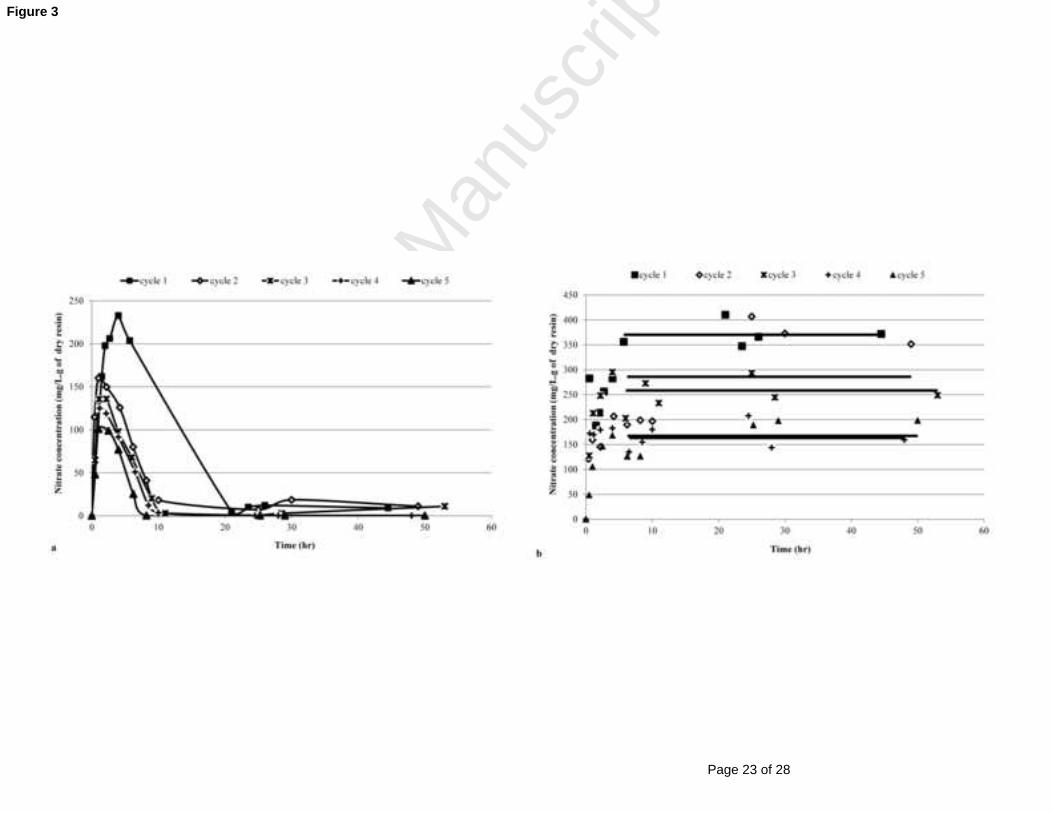
During each bioregeneration cycle, the nitrate concentration in the aqueous phase was 173
measured periodically during the 48 hours of bioregeneration. Figure 3 shows the normalized 174
nitrate concentration (mg of nitrate per gram of dry resin) for test and control reactors in each 175
cycle. The concentrations of nitrate in the test reactors reached a peak in first 0.5 to 1 hour after 176
placing the resin in medium because of desorption of nitrate from resin. After this time the177
microorganisms began to degrade the nitrate in the aqueous phase and so the nitrate 178
concentration decreases rapidly over the next 9 hours. The nitrate concentration was generally 179
non-detectable after 10 hours. Although nitrate is no longer measurable in the aqueous phase, the 180
resin was left in flask for 48 hours to ensure that the nitrate attached to the resin had time to 181
completely desorb.182
In the control reactors, the nitrate concentration in the aqueous phase reached183
equilibrium by about 10 hours. A statistical analysis of the nitrate concentration in controls 184
showed that the equilibrium concentration in control samples in cycle 1 and 2 are not 185
significantly different but they are different from cycle 4 and 5. 186
The peak concentrations shown in Figure 3 decrease in each cycle because the 187
biodegradation rate is increasing. To further demonstrate this, the cultures were incubated with a 188
Page 10 of 28
Accep
ted
Man
uscr
ipt
11
direct nitrate spike with no resin. Biomass was spiked with nitrate to measure the direct nitrate 189
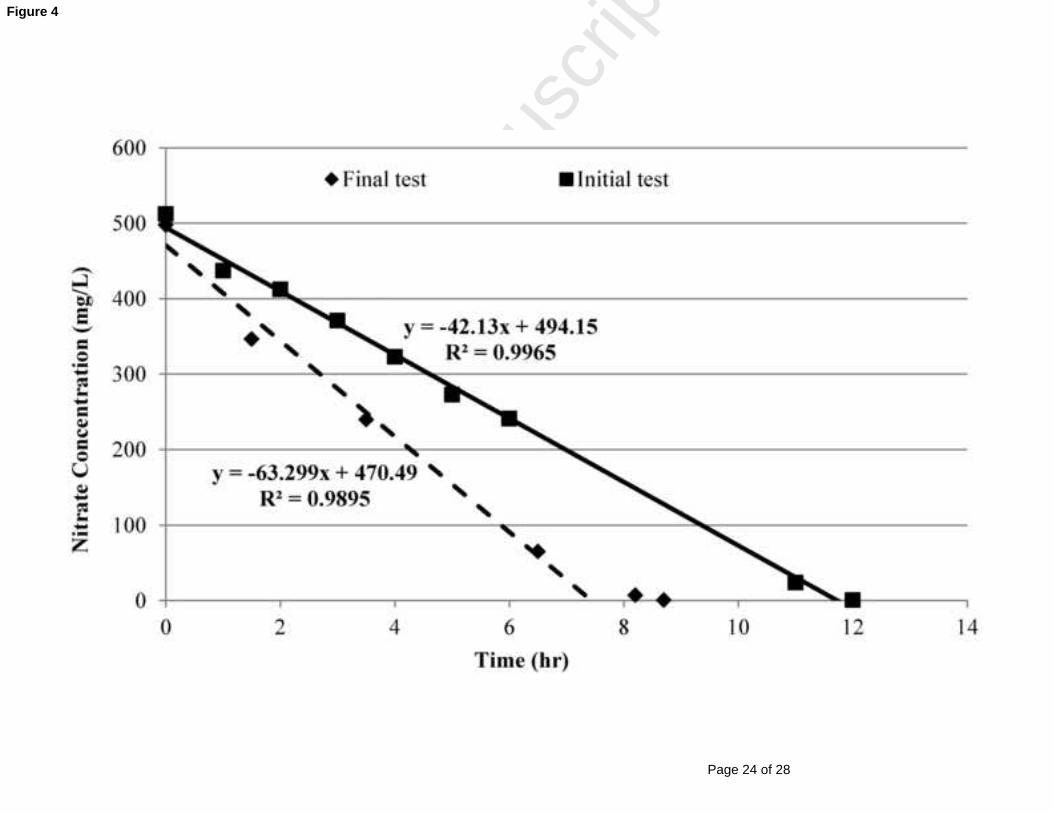
degradation rate of the biomass. Figure 4 presents the concentrations of nitrate removed. Initially 190
the culture was able to remove 500 mg/L of nitrate from the aqueous phase experiment in 12 191
hours and after using the culture for 6 bioregeneration cycles it was able to remove the same 192
amount of nitrate in <8 hours. This can be explained by an increase in biomass (VSS increased 193
from 2500 mg/L to 5400±600 mg/L). As the number of cycles increased the biomass also 194
increased the biodegradation of nitrate in the aqueous phase occurred before the first sampling 195
point. 196
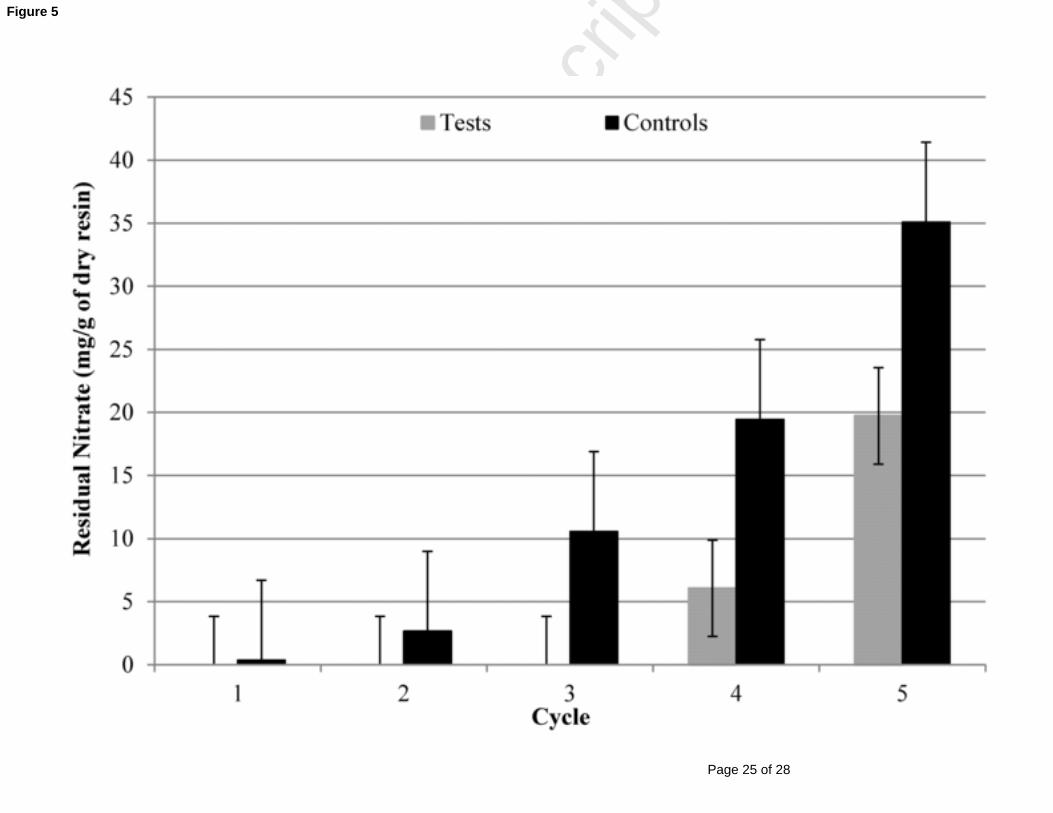
At the end of each regeneration cycle, samples of resin were taken to determine the 197
mass of nitrate attached to the resin using the bomb calorimeter to combust the resin. Figure 5198
presents the results of these analyses. There was insignificant nitrate left on the resin in test 199
samples for the 1st three cycles. After cycle 4 some nitrate residual remained attached to the 200
resin. The culture achieved more than 94% and 78% nitrate removal from resin in cycle 4 and 5, 201
respectively. There was always some residual nitrate attached to the resin in control reactors. 202
This increased with each cycle. Through cycle 1-5, for control samples, removal of nitrate 203
attached to the resin was 99%, 96%, 89%, 79% & 59%, respectively. 204
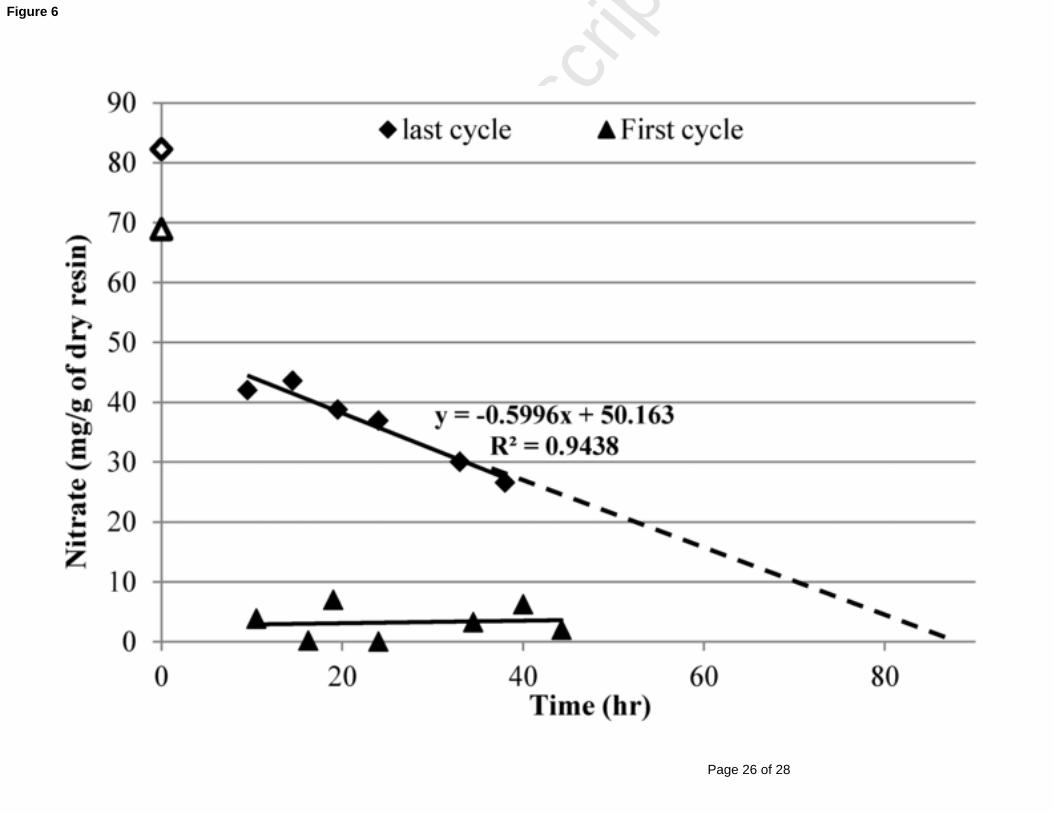
3.3. Time Series Resin Analysis205
During regeneration, nitrate was removed from the aqueous phase within 10 hours, but 206
the samples were incubated for 48 hours as a factor of safety. In order to understand the exact 207
time when nitrate was completely removed from the resin (i.e. no new nitrate desorbed from the 208
resin) in cycle 6, samples of resin were taken at different times and analysed for nitrate attached 209
to the resin using the bomb calorimeter. The results (Figure 6) show that for fresh resin the 210
nitrate in the resin was removed to non-detectable levels within 10 hours, but after six cycles of 211
Page 11 of 28
Accep
ted
Man
uscr
ipt
12
exhaustion/bioregeneration the process was much slower. A projection of the slope of line 212
suggests that it would have taken 80 hours to completely regenerate the resin.213
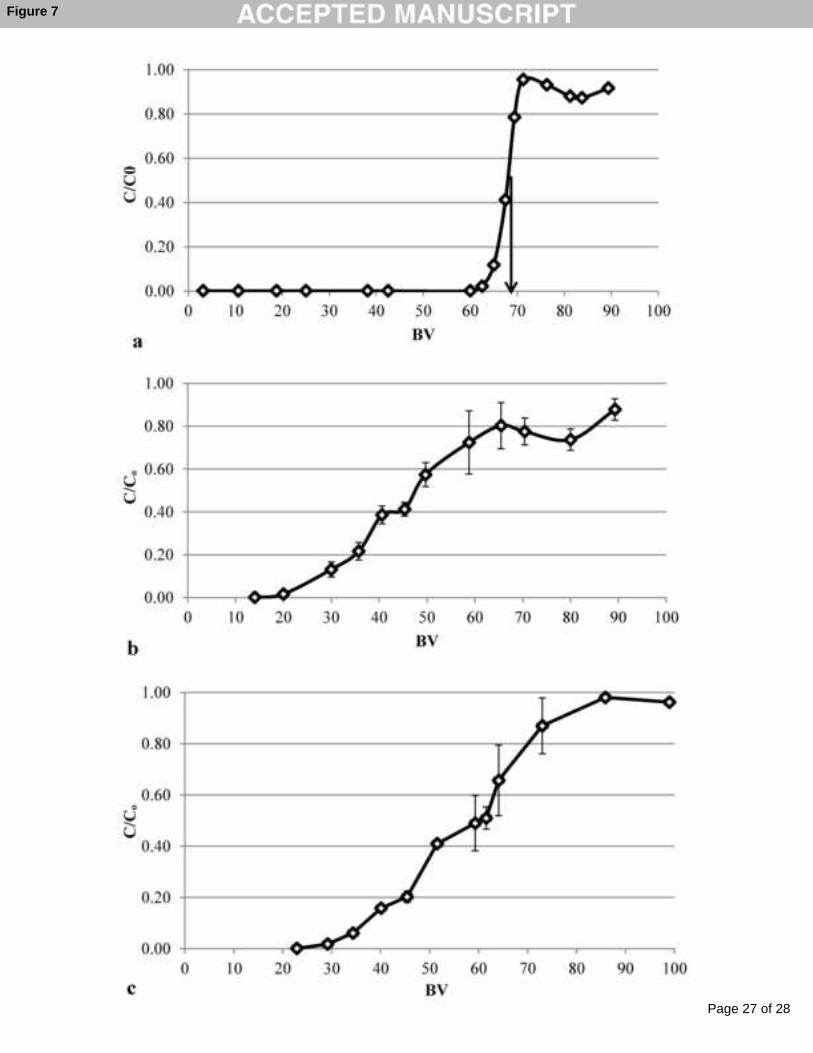
3.4. Resin Capacity214
Column experiments were conducted as the first and last exhaustion cycle in order to 215
observe resin performance and determine resin capacity and obtain a breakthrough curve. The 216
result of the column exhaustion test is shown in Figure 7. The bed volume of the exhaustion 217
solution at which the nitrate concentration in the effluent was half of the influent, was considered 218
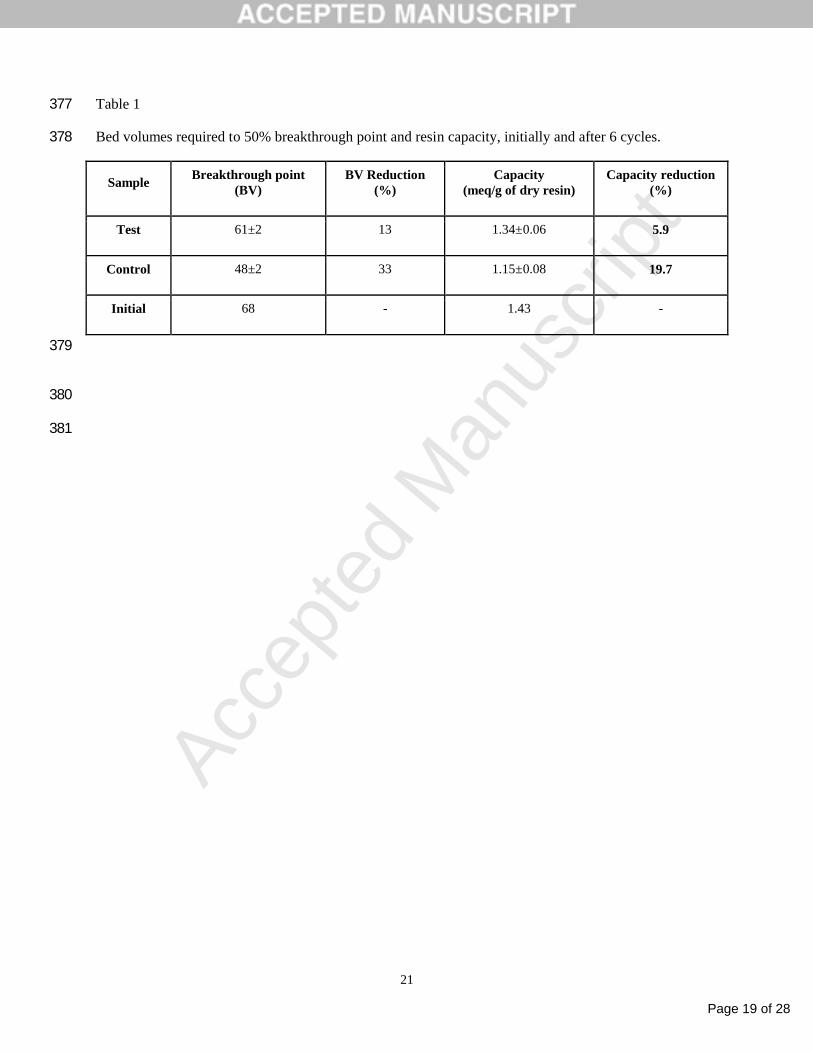
as the 50% breakthrough point of the resin. Table 1 summarizes the change in bed volume to the219
50% breakthrough point and the calculated capacity of resin. Initially the 50% breakthrough 220
point was at 68 bed volumes (BV) of resin. After using resin in 6 exhaustion/ bioregeneration 221
cycles, less than 6% of the resin capacity was lost while in the controls without bioregeneration, 222
the resin lost 20% of its capacity. 223
4. Discussion224
One major concern of multi-cycle use of resin in ion-exchange processes is resin 225
capacity loss. In this research the capacity of resin during 6 exhaustion/bioregeneration cycles 226
(test samples) was compared to the capacity of resin in control samples (no biological reduction).227
During regeneration cycles in control samples desorption of nitrate from the resin continued to 228
the point when the nitrate concentration in aqueous phase reached equilibrium with the nitrate 229
concentration on the resin. 230
The desorption rate can be presented by a single kinetic model for both test and control231
samples [20, 21, 24]:232
����������= ��������(����− ����) (1)233
Page 12 of 28
Accep
ted
Man
uscr
ipt
13
The difference between the final equilibrium concentration (Ce, mg/L) and the aqueous 234
phase concentration of nitrate at any time (Ct, mg/L) can be considered as the driving force, 235
which allows the incorporation of the concepts of kinetic limitations and end point equilibrium 236
(Kdes, t-1, is the desorption kinetic constant).237
In control samples, using equation 1 and based on the equilibrium concentration of 238
nitrate at each cycle an average kdes of 0.099±0.003 hr-1 was calculated. In test samples the 239
equilibrium concentration is changing continually as the desorption rate and the degradation rate 240
change due to the concentration in the aqueous phase. At low concentrations, and early in the 241
process, desorption is favored, as higher concentrations develop in the aqueous phase 242
degradation becomes favored. So the test samples never reach the equilibrium concentration of 243
control samples at each cycle.244
Additionally, nitrate was removed faster from the test samples with each test cycle. This 245
is reflected in the reduction in the peak concentration of nitrate in each cycle. It is generally 246
accepted that anion (nitrate, perchlorate) degradation follows Monod’s kinetics [19]:247
��������= − ������������+ �� (2)248
Where S is the nitrate concentration (mg/L); t is the time (hr); µm is the maximum specific nitrate249
removal rate (hr-1); Ks is the half saturation constant for nitrate (mg/L); and X is the microbial 250
concentration (mg VSS/L). A calculated specific degradation rate of - 0.017 and - 0.012 mg NO3-251
/mg VSS.hr respectively for initial and final tests shows that since the rates were very 252
comparable, the increasing biomass must be responsible for the increased removal from the 253
system. 254
Based on these results, the resin did not lose significant capacity until after 4 cycles. 255
The capacity in cycle 5 and 6 was still much better in biologically regenerated resin than for 256
Page 13 of 28
Accep
ted
Man
uscr
ipt
14
resin that had not undergone biological regeneration. There appears to be an increase in the non-257
regenerable sites in the resin in each cycle. Because of the degradation of nitrate in the aqueous 258
phase, the maximum concentration of nitrate in test samples never reaches the equilibrium 259
concentration of nitrate in controls. So, the nitrate accumulation in the less regenerable sites is 260
decreased and the capacity is maintained. Increasing the non-regenerable sites of the resin in 261
each cycle can also be explained based by the shrinking core model which was developed for ion 262
uptake by resins [19, 24]. The model shows that ions first occupy the outer region of the resin, 263
and progressively moves to the inner unused resin core with time. Based on this model, it is 264
reasonable to assume that nitrate ions in the outer region of the resin becomes available to 265
biomass more easily when compared to nitrate ions present in the inner core of the resin. So, in 266
each cycle, as more and more nitrate is loaded in to the core, more time is required for the nitrate 267
to dissolve out of the core. The calorimeter results suggest that leaving the resin in the bioreactor 268
for a longer time would allow complete regeneration of resin.269
Sharbatmaleki and Batista [24] reported that the capacity loss was more significant 270
through the first cycles and stabilized after a few cycles which differs significantly from the 271
results reported here. However, the results are difficult to compare directly since their272
experiment was done using perchlorate and the resin was in direct contact with the culture.273
The ultimate application of the process would see resin sold in membrane cartridges that 274
could be plugged in to the ion exchange column housing for exhaustion, then removed and put in 275
a bioregeneration tank for regeneration. This would probably be done in regional facilities where 276
the culture can be maintained, rather than at each site. This would require shipping the resin to 277
and from the regional facility and the treatment sites but would still result in a net savings due to 278
the ability to reuse the resin several times. A full cost benefit analysis would be performed for 279
Page 14 of 28
Accep
ted
Man
uscr
ipt
15
each site to account for the cost of using fresh resin for each use, as well as incineration or 280
transport of the exhausted resin to the landfill, as compared to the costs associated with housing 281
the resin in a membrane and applying bioregeneration process along with losing some capacity 282
of resin after 6 cycles. 283
5. Conclusion284
The main objective of this study was to investigate the potential of multi-cycle use of 285
resin for removal of nitrate from drinking water by bioregeneration of strong base nitrate 286
selective resin. The results of this research show:287
Nitrate selective resin can be bioregenerated and reloaded for at least 6 cycles,288
Nitrate can be removed from drinking water without producing any brine,289
Resin can be used in 4 cycles of IX/ bioregeneration for nitrate removal without losing 290
any capacity, and,291
Using resin in 6 cycles resulted in losing about 6% of the resin capacity.292
6. Acknowledgments293
This research was done in Biological Solutions Laboratory of University of British 294
Columbia. We thank Dr. Bailey from The Barber School of Arts and Sciences for providing the295
bomb calorimeter for this research and Dr. Xiao for his valuable assistance with process and data 296
evaluation. This research was funded by the Natural Sciences and Engineering Research Council 297
of Canada (NSERC) through the Discovery Grant Program.298
299
Page 15 of 28
Accep
ted
Man
uscr
ipt
16
299
Figure Captions300
Fig. 1. Schematic of exhaustion apparatus. a) resin enclosed in membrane in the reactor (1 liter 301
flask), b) column exhaustion used for the first and last cycle of exhaustion.302
Fig. 2. Nitrate absorbed onto the resin during exhaustion for each cycle for tests and controls. 303
The data are calculated from the difference between nitrate concentrations in the aqueous phase 304
before and after exhaustion. The bar heights indicate the average and the error bars indicate one 305
standard deviation of triplicate test or controls.306
Fig. 3. Nitrate concentration in the aqueous phase during regeneration a) test b) control; nitrate 307
concentrations in aqueous phase are normalized by dividing to the mass of resin in each sample. 308
The data points represent the average of three replicates of each test and control samples. The 309
error bars are omitted to avoid crowding in the figure. 310
Fig. 4. Nitrate degradation in aqueous phase cultures used during the initial and final cycle. 311
Fig. 5. Residual nitrate on resin after each cycle as determined from the rinsate from ignition of 312
the resin. The bar height presents the average and the error bars present one standard deviation of 313
triplicate results. 314
Fig. 6. Residual nitrate (as determined from the rinsate from ignition of the resin) on resin at 315
different intervals during the first and last regeneration cycle. 316
Fig. 7. Column exhaustion breakthrough curve. a) first cycle of all samples, b) last cycle of 317
control samples, c) last cycle of test samples. The data points represent the normalized (C/Co) 318
nitrate concentrations in the effluent of columns fed with 500 mg/L nitrate using an EBCT of 10 319
minutes. 320
Page 16 of 28
Accep
ted
Man
uscr
ipt
18
321
References322
[1] M. Islam, R. Patel, Synthesis and physicochemical characterization of Zn/Al chloride layered 323
double hydroxide and evaluation of its nitrate removal efficiency. Desalination. 256 (2010) 120-324
135. 325
[2] C. Campbell, F. Selles, R. P. Zentner, R. De Jong, R. Lemke, C. Hamel, Nitrate leaching in 326
the semiarid prairie: Effect of cropping frequency, crop type, and fertilizer after 37 years. J Soil 327
Sci. 86 (2006) 701-712. 328
[3] N. Romano, C. Zeng, Evaluating the newly proposed protocol of incorporated potassium in 329
nitrate toxicity experiments at different anilities: A case study with the tiger prawn, penaeus 330
monodon, juveniles. Aquaculture. 289 (2009) 304-312. 331
[4] P.F. Hudak, Regional trends in nitrate content of texas ground water. J Hydrol. 228 (2000) 332
37-52. 333
[5] M. D. Hall, M. J. Shaffer, R. M. Waskom, Delgado JA. Regional nitrate leaching variability: 334
What makes a difference in northeastern colorado. J AM Water Resour As. 37 (2001) 139-151. 335
[6] K. E. Schilling, C. F. Wolter, Contribution of base flow to nonpoint source pollution loads in 336
an agricultural watershed Ground Water. 39 (2001) 49-63. 337
[7] W. H. O. Revisions of the WHO guidelines for drinking-water uality - report on a WHO 338
consultation. 2010. 339
Page 17 of 28
Accep
ted
Man
uscr
ipt
19
[8] USEPA. National primary drinking water regulations: Maximum contaminant levels for 340
inorganic contaminants. .2004;Title 40, part 141.62 (b). 341
[9] P. Westerhoff, Reduction of nitrate, bromate, and chlorate by zero valent iron (Fe0). J 342
Environ Eng. 129 (2003) 10-21. 343
[10] S. H. Choe, H. M. Ljestrand, J. Khim, Nitrate reduction by zerovalent iron under different 344
pH regimes. Appl Geochem. 19 (2004) 335-372. 345
[11] T. M. Gingras, J. R. Batista, Biological reduction of perchlorate in ion exchange regenerant 346
solutions containing high salinity and ammonium levels. J Environ Monit. 4 (2002) 96-101. 347
[12] S. Biswas, P. Bose. Zero-valent iron-assisted autotrophic denitrification. J Environ Eng. 131348
(2005) 1212-1223. 349
[13] B. U. Baea, Y. H. Junga, W. W. Hana, H. S. Shin, Improved brine recycling during nitrate 350
removal using ion exchange. Water Res. 36 (2002) 3330-3340. 351
[14] J. Kim, M. M. Benjamin, Modeling a novel ion exchange process for arsenic and nitrate 352
removal. Water Res. 38 (2004) 2053-2062. 353
[15] A. Pintar, J. Batista, J. Levec, Integrated ion exchange/catalytic process for efficient 354
removal of nitrates from drinking water. Chem Eng Sci. 56 (2001) 1551-1559. 355
[16] O. Primo, M. J. Rivero, A. M. Urtiaga, I. Ortiz, Nitrate removal from electro-oxidized 356
landfill leachate by ion exchange. J Hazard Mater. 164 (2009) 389-393. 357
Page 18 of 28
Accep
ted
Man
uscr
ipt
20
[17] A. R. Ricardo, G. Carvalho, S. Velizarov, J. G. Crespo, M. A. Reis, Kinetics of nitrate and 358
perchlorate removal and biofilm stratification in an ion exchange membrane bioreactor. Water 359
Res. 46 (2012) 4556-4568. 360
[18] S. Samatya, N. Kabay, U. Yüksel, M. Arda, M. Yüksel, Removal of nitrate from aqueous 361
solution by nitrate selective ion exchange resins. React Func Polym. 66 (2006) 1206-1214.S. 362
[19] A. K. Venkatesan, M. Sharbatmaleki, J. R. Batista, Bioregeneration of perchlorate-laden 363
gel-type anion-exchange resin in a fluidized bed reactor. J Hazard Mater. 117 (2010) 730-737. 364
[20] Y. Xiao, A. Basu, V. Kashyap and D. J. Roberts. 2010. Experimental and Numerical 365
Analysis of Biological Regeneration of Perchlorate Laden Ion-Exchange Resins in Batch 366
Reactors. Environmental Engineering Science 27:(2010) 75-84. 367
[21] J. Faccini, Sustainable treatment of perchlorate contaminated water. [MSC]. University of 368
British Columbia; 2011. 369
[22] Y. Cang, D. J. Roberts, D.A. Clifford, Development of cultures capable of reducing 370
perchlorate and nitrate in high salt solutions. Water Res. 38 (2004) 3322-3330. 371
[23] A. D. Eaton, L. S. Clesceri, E. W. Rice, A. E. Greenburg, Solid matters. Standard Methods 372
for the Examination of Water and Wastewater, APHA, AWWA, WEF, 21th Edition, (2005) 2-373
55-2-60.374
[24] M. Sharbatmaleki, J. R. Batista, Multi-cycle bioregeneration of spent perchlorate-containing 375
macroporous selective anion-exchange resin. Water Res. 46 (2012) 21-32. 376
377
Page 19 of 28
Accep
ted
Man
uscr
ipt
21
Table 1377
Bed volumes required to 50% breakthrough point and resin capacity, initially and after 6 cycles.378
SampleBreakthrough point
(BV)BV Reduction
(%)Capacity
(meq/g of dry resin)Capacity reduction
(%)
Test 61±2 13 1.34±0.06 5.9
Control 48±2 33 1.15±0.08 19.7
Initial 68 - 1.43 -
379
380
381
Page 20 of 28
Accep
ted
Man
uscr
ipt
22
Highlights381
IX/bioregeneration of resin is a sustainable method for nitrate removal382
Nitrate selective resin can be bioregenerated and reloaded for 6 IX cycles383
Nitrate can be removed from drinking water without producing any brine384
Resin can be used in 4 IX cycles without losing any capacity385
Using resin in 6 IX cycles resulted in losing less than 6% of the resin capacity386
387
Page 21 of 28
Accep
ted
Man
uscr
ipt
Figure 1
Page 22 of 28
Accep
ted
Man
uscr
ipt
Figure 2
Page 23 of 28
Accep
ted
Man
uscr
ipt
Figure 3
Page 24 of 28
Accep
ted
Man
uscr
ipt
Figure 4
Page 25 of 28
Accep
ted
Man
uscr
ipt
Figure 5
Page 26 of 28
Accep
ted
Man
uscr
ipt
Figure 6
Page 27 of 28
Accep
ted
Man
uscr
ipt
Figure 7
Page 28 of 28
Accep
ted
Man
uscr
ipt
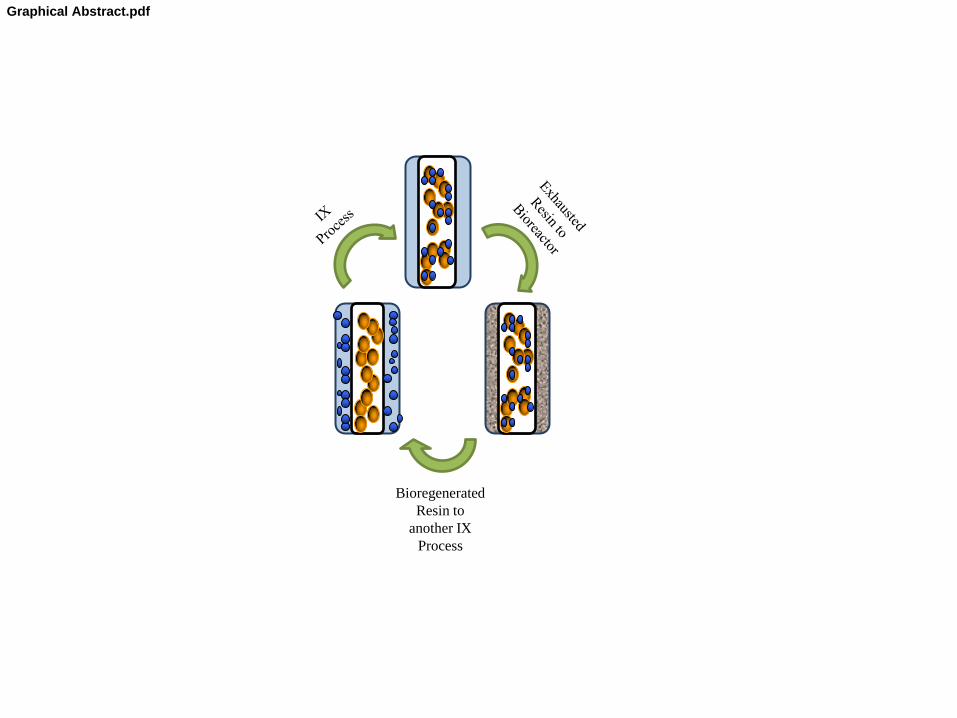
Bioregenerated
Resin to
another IX
Process
Graphical Abstract.pdf