sustainable energy and human development - annex
TRANSCRIPT

Annex 1: Energy Access - Overview of data gaps
Significant data gaps were identified throughout the research and analysis process, these data
gaps are summarised below:
Table A1.1: Data Gaps
Data Gap Possible solutions
Insufficient information on absolute
number of people without access to
electricity and their effect upon poverty
and economic development in the
region.
Collection of this information by
government agencies through national
household surveys, processing of this
information by governments and
development agencies. This information
will be needed in order to track progress
towards achieving the goals of SE4ALL
Insufficient data on the frequency and
duration of blackouts and supply
interruptions and their effect upon
poverty and economic development
(with the exception of Tajikistan and
Kyrgyzstan).
Collection of this information by
government agencies through national
household surveys and also from utility
providers will be needed in order to track
progress towards achieving the goals of
SE4ALL
Insufficient information to calculate the
“Index of Access” to electricity as
outlined by the tracking methodology
publication1
The information required includes the
annual average household consumption of
electricity in Kilowatt Hours and can be
supplied from utility companies. In
addition the suggested household survey
in Annex 5 can be used.
1 See: World Bank 2013 SE4ALL Tracking methodology

Annex 2: Energy Access - Tracking
Tracking Access to Electricity: Firstly, the existing definition and proposed methods for
measuring access to electricity under the Tracking Methodology,2 such as household surveys
(see Annex 3), which commonly ask respondents questions such as “Do you have grid-supplied
electricity access?” although convenient, fail to capture several important aspects of electricity
supply problems, such as interruptions, and off-grid solutions, such as diesel generators, which
are both common in the region. Secondly, a ranking tier system of access to electricity is
proposed whereby greater levels of electricity access, assessed by the ability to operate
appliances with increasingly higher electricity requirements, means the higher the tier ranking
of the country. Ranking levels of access in this manner would tend to indicate higher
consumption as favourable clashing with the energy efficiency goals of the region. The tier
ranking methodology, whilst providing a convenient means for measuring aspects of access to
electricity and ranking countries accordingly, can fail to capture important aspects of supply
and may provide misleading measures of electricity access.
The World Bank 2013 SE4ALL Tracking Methodology proposes a multi-tier measurement, which
attempts to encompass the following tracking indicators for access to modern cooking solutions
in the immediate and medium term.
Table A2.1: Tracking Framework for Access to Cooking
Immediate Medium Term
Global Tracking • Use of non-solid
fuels in cooking
fuel = access
Measuring Technical Performance:
Multi-tier technical measurement of the
primary cooking solution in two steps. First at
global level tracking.
1) Three level measurement based on
cookstove type:
• Self-made cookstove
• Manufactured cookstove
• BLEN cookstove
and
Fuel type:
• Biogas/LPG/Electricity/
Natural gas
• Biomass/coal/charcoal/
Kerosene/ethanol
Country Level Tracking • Nil Measuring Technical Performance:
Secondly at country level tracking
2) According to certification Manufactured
and BLEN cookstoves are categorised in
three grades based on four technical
attributes:
2 World Bank 2013 SE4ALL Tracking methodology

• Efficiency
• Indoor Pollution
• Overall Pollution
• Safety
Measuring Practicality:
Measurement of additional aspects of access
beyond technical performance by three
attributes:
• Conformity
• Convenience
• Adequacy (Fuel stacking)
Source: World Bank 2013 SE4ALL Tracking methodology
Access to Modern Cooking Solutions: The tracking indicators of access to modern cooking
solutions evaluate on the one hand the technical performance of the primary cooking solution
(including the fuel and the cookstove itself), and on the other hand assess how this solution fits
with households’ daily life. The combination of the two metrics offers a comprehensive
measurement of access to cooking. As with electricity, the methodology is based on multiple
tiers and is fuel neutral. The immediate and medium-term tracking indicators for access to
modern cooking solutions can be found in: Annex 3. Unfortunately the existing definition and
measurement of access to cooking is confined to fuel type, and omits the role of the cookstove.
This fails to capture important information related to the human development goals of SE4ALL,
such as reducing associated negative health effects, increasing energy efficiency and decreasing
greenhouse gas emissions through employing different types of cookstove. It is the
combination of the fuel and cookstove type that determines the levels of efficiency, pollution
and safety outcomes of the cooking solutions.3 Furthermore, limiting the definition and
measurement of access to cooking solely to the primary cooking solution will fail to capture the
complex phenomenon of fuel stacking, when multiple fuels may be used, therefore additional
measures are needed to capture and ensure the ongoing monitoring of this data.
In the medium term, the global tracking framework recommends the following additional
methodologies be developed for tracking access to energy, including access to electricity and
cooking solutions:
Access to Heating:
As case studies have shown, energy for heating is a major requirement in the ECIS region.
Unfortunately the tracking framework identifies no suitable data on energy for heating that
would allow the compilation of a global database.4 In the medium term SE4ALL envisions the
development of a tracking framework to measure access to heating.5
3 World Bank 2013 SE4ALL Tracking methodology 4 Ibid 5 Ibid

Community Energy and Productive Uses of Energy:
The household-based definition of access to energy excludes the opportunity to measure access
to energy used for community services such as health and education and productive uses such
as enterprises.6 The Tracking Methodology identifies lack of data as a major constraint in
measuring access to energy for community services and productive uses. Only recently have
attempts been made by the IEA, WHO, USAID and UNESCO to measure access to energy for
public services and productive uses.7 The methodology suggests no immediate term data
indicators, whilst in the medium term it will be necessary to develop frameworks to measure
energy access across community services and productive uses.
The World Bank 2013 SE4ALL Tracking Methodology proposes a multi-tier measurement, which
attempts to encompass the following tracking indicators for access to electricity in the
immediate and medium term:
Table A2.2: Tracking Framework for Access to Electricity
Immediate Medium Term
Global Tracking • Household
connection rates
Source of Electricity:
To be defined by the following three
categories:
• No electricity
• Solar Lantern
• Home system
• Mini grid or grid connection
Country Level Tracking • Household
connection rates
(regardless of the
type of electricity
supply or the type
of electricity
services)
Access to Electricity Supply:
Based on a Five Tier framework ranked on the
following six attributes of electricity supply
• Quantity of supply (W)
• Duration of Supply (Hrs)
• Evening Supply (Hrs)
• Quality of Supply (Voltage)
• Affordability
• Legality of connection
Access to Electricity Services:
Defined by the use of an increasing number of
key electricity services. This is measured by the
ownership of increasingly advanced appliances
following the equivalent tier of electricity
supply needed for their adequate operation.
*Depending on availability of data, it is
suggested these indicators are customized for
country level tracking.
6 World Bank 2013 SE4ALL Tracking methodology 7 UNDP 2010 Energy and Communal Services in Kyrgyzstan and Tajikistan: A Poverty and Social Impact Assessment

* It is suggested a similar framework for
heating, productive uses and community
services are envisaged to be developed and
implemented over the medium-term.
Source: World Bank 2013 SE4ALL Tracking methodology
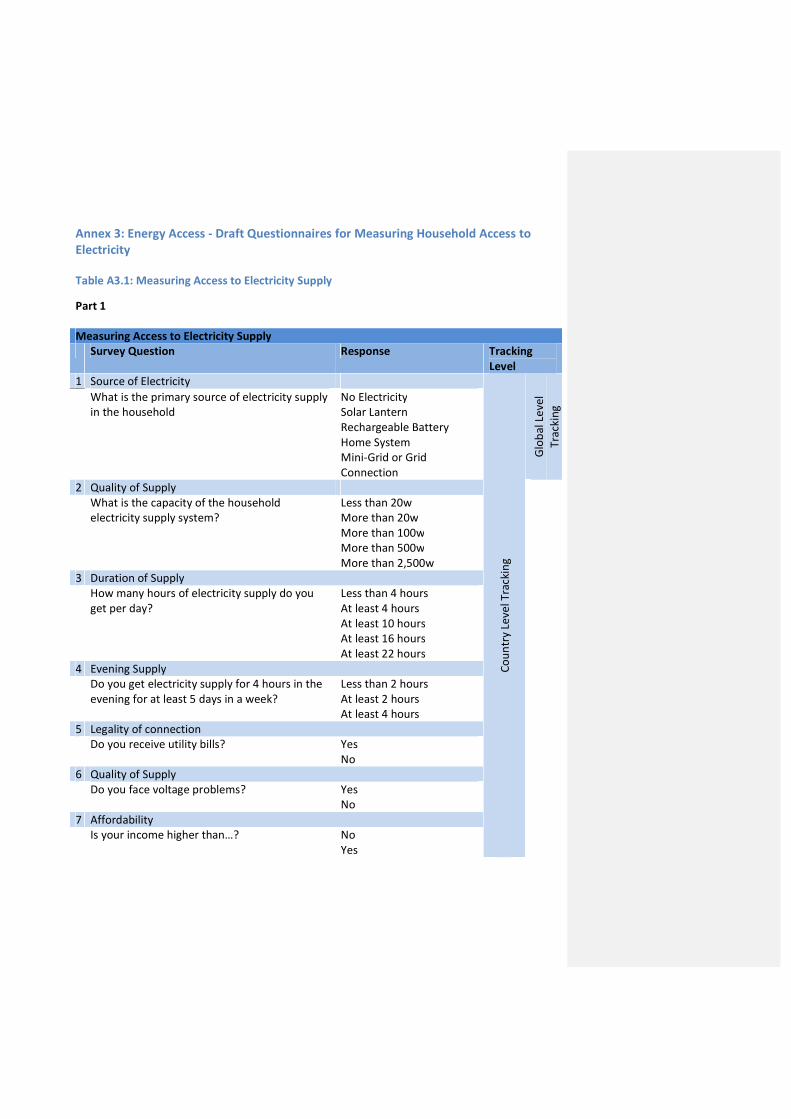
Annex 3: Energy Access - Draft Questionnaires for Measuring Household Access to
Electricity
Table A3.1: Measuring Access to Electricity Supply
Part 1
Measuring Access to Electricity Supply
Survey Question Response Tracking
Level
1 Source of Electricity
Co
un
try
Leve
l Tra
ckin
g
Glo
ba
l Le
vel
Tra
ckin
g What is the primary source of electricity supply
in the household
No Electricity
Solar Lantern
Rechargeable Battery
Home System
Mini-Grid or Grid
Connection
2 Quality of Supply
What is the capacity of the household
electricity supply system?
Less than 20w
More than 20w
More than 100w
More than 500w
More than 2,500w
3 Duration of Supply
How many hours of electricity supply do you
get per day?
Less than 4 hours
At least 4 hours
At least 10 hours
At least 16 hours
At least 22 hours
4 Evening Supply
Do you get electricity supply for 4 hours in the
evening for at least 5 days in a week?
Less than 2 hours
At least 2 hours
At least 4 hours
5 Legality of connection
Do you receive utility bills? Yes
No
6 Quality of Supply
Do you face voltage problems? Yes
No
7 Affordability
Is your income higher than…? No
Yes

Part 2
Survey Question Response
Does your house own
1 Task lighting Yes/no
2 Electric Radio Yes/no
3 Phone Charging Yes/no
4 General Lighting Yes/no
5 Television Yes/no
6 Electric fan Yes/no
7 Light and discontinuous load of thermal or mechanical applications (e.g.
washing machine, food processor, rice cooking, etc.)
Yes/no
8 Medium and/or continuous load of thermal applications (e.g. refrigeration, etc.) Yes/no
9 Heavy and/or continuous load of thermal or mechanical applications (Air
conditioning)
Yes/no
Source: World Bank 2013 SE4ALL Tracking Methodology
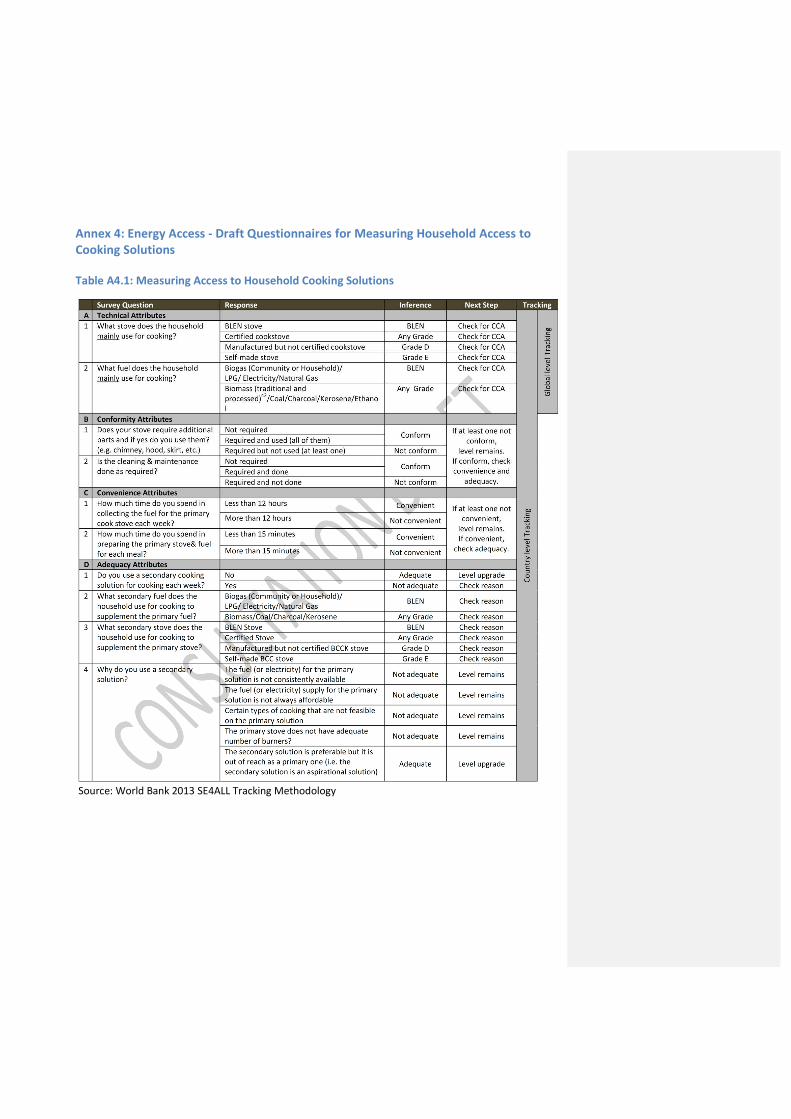
Annex 4: Energy Access - Draft Questionnaires for Measuring Household Access to
Cooking Solutions
Table A4.1: Measuring Access to Household Cooking Solutions
Source: World Bank 2013 SE4ALL Tracking Methodology

Annex 5: Energy Access - Mapping Data
REGION Country
Immediate tracking
Eletrification Cooking Solution Solid Cooking Solution
rural/urban
Total Use of solid
fuel Use of non-
solid fuel Rural Urban
EU
Bulgaria 99
Cyprus 100
Czech Republic 99 1.73 97.43 4.51 0.94
Hungary 99
Lithuania 99
Poland 100
Slovakia 98 2.88 93.49 4.16 2.11
Romania 99 22.9 77.1 41.8 2.5
CENTRAL ASIA
Kazakhstan 100 19.03 80.98 40.79 6.85
Kyrgyzstan 100 37.26 62.4 56.2 12.36
Tajikistan 97.3 34.98 64.98 48.42 7.54
Turkmenistan 100 0.2 99.8 0.5 0
Uzbekistan 99.7 15.67 84.27 24.75 0.66
WESTERN
BALKANS AND
TURKEY
Albania 100
Croatia 99 12.22 86.9 23.68 6.87
Bosnia and Herzegovina 98.5 48.7 51.29 67.15 18.47
Kosovo
Montenegro 31.86 68.15 56.22 17.86
Serbia 100 33.54 66.14 61.3 13.75
Macedonia 97.4 36.49 63.38 55.13 24.46
Turkey 99.9 11 89
WESTERN CIS
Ukraine 100 4.16 95.63 8.66 2.23
Moldova 98.6 14.72 84.97 23.77 1.17
Russian Federation 99 3.43 96.57 9.33 0.4
Belarus 100 3.42 96.58 9.3 0.4
CAUCASUS
Armenia 99.8 4.4 95.47 11.77
Azerbaijan 100 9.79 90.07 22.65 0.87
Georgia 100 41.97 56.22 77.21 8.57
Formatted: Font: +Body, 11 pt, Font color:Background 1, English (United States)

Annex 6: Energy Access - Additional Regional Data and Information

Table A6.1: Regional Data
Year Event Remarks 2008/2009 Kyrgyzstan:
Drought conditions
reduced water volumes
at Toktogul to
extremely low levels
In 2008, there was a decrease in the water reserves at the Naryn
hydropower plants. This led to a sharp decline in electricity
production and resulted in systematic scheduled power cut-offs
in businesses and houses across the country for a couple of
months. This occurred again in 2009.
2009/2010 Kyrgyzstan:
Blackouts during winter
Growing public dissatisfaction in the Kyrgyz Republic, in part due
to rolling blackouts and energy price hikes during the winter of
2009-2010, culminated in the violent replacement of President
Kurmanbek Bakiyev with a new interim government. The shock
of these events suggests that a stable and affordable electricity
supply, particularly during the winter, will acquire even greater
precedence for the Kyrgyz leadership and efforts to achieve this
are likely to include stricter management of the various
hydropower stations throughout the country.
2007/2008 Tajikistan:
Unusually cold winter
brought the energy
sector to the brink of
collapse
In the winter of 2007-2008 unusually cold weather brought the
energy sector to the brink of collapse with rolling/scheduled and
unscheduled blackouts. The international financial crisis and
rising food prices compounded the crisis, the most pronounced
adverse effects of which were felt by the poor and vulnerable. 2011 Tajikistan:
Energy rationing due to
cold winter
An unexpected cold snap led to the reintroduction of nation-
wide electricity rationing in March 2011. Increased electricity
imports were not an option due to the collapse of the Central
Asia distribution network. 2000/2001
2006/2007
Albania:
Power crises due to lack
of rainfall
Since nearly all domestic production comes from hydropower
plants, the power system is vulnerable to variations in rainfall.
Lack of rainfall caused a power crisis characterised by severe
load-shedding from 2000 to 2002 and a second crisis from late
2006 through 2007. Seasonal variances in river flow volumes
also affect the country’s electricity generation, with August and
September historically being “dry” months. The second crisis
was exacerbated by a steep increase in the price of imported
electricity. Average daily electricity outages amounted to 3.7
hours in 2007, with a daily shortfall of approximately 2.5 GW.
2008/2009 Ukraine, Slovakia,
Hungary, Czech
Republic and 13 other
European countries
Gas dispute with between Ukraine and Gazprom in January
2009. This disagreement resulted in supply disruptions in many
European nations, with 18 European countries reporting major
drops or complete cut-offs of their gas supplies transported
through Ukraine from Russia. Ukraine, Slovakia, Hungary and the
Czech Republic were most affected.

Source: All information obtained from REEEP/Reegle 2013 Clean Energy Info Portal – Country Source: Profiles
adapted from http://www.reegle.info/countries

Annex 7: Energy Efficiency - Additional Regional Data Figure A7.1: Compound annual growth rates of the total primary energy supply (TPES) by decade, 1990-2010
Source: Author’s calculations based on (IEA online).
Figure A7.2: Contribution of energy-using sectors to final energy consumption by region, 1990 - 2010
Notes: a) for Central Asia, 1995 data is used instead of 1990 data,
b) no data for the commercial and public buildings sector of Kyrgyzstan.
Source: Author’s calculations based on (IEA online).
3.8%
-2.5%
-3.5%
-9.9%
-4.0%
-4.1%
3.3%
2.1%
3.3%
0.7%
1.0%
1.3%
Turkey
Western Balkans
Central Asia
Caucauses
Other CIS
Total, exc. Turkey
2000-2010
1990-2000
152028
679
85
5
192432
155190
178
1120
23
105
6
133
1
2619
30
289162
157
912
15
44
7
41
3
89
10
13685
108
0% 10% 20% 30% 40% 50% 60% 70% 80% 90% 100%
199020002010
199020002010
199020002010
199020002010
199020002010
Tur
key
Wes
tern
B
alka
nsC
auca
sus
Cen
tral
Asi
aO
ther
C
IS
Share of final energy consumption
Fin
al e
ner
gy
con
sum
pti
on
by
sect
or,
mto
e
buildings industry transport agriculture & fishery non-energy & non-specified

Figure A7.3: Contribution of energy-using sectors to final electricity consumption, 1990 - 2010
Notes: a) for Central Asia, 1995 data is used instead of 1990 data,
b) no data for the commercial and public buildings sector of Kyrgyzstan.
Source: Author’s calculations based on (IEA online).
Energy consumption by the agricultural sector represents a region-specific challenge in Central
Asia. In 2010, the agricultural sector consumed 23-33% of national electricity in Uzbekistan,
Turkmenistan, Tajikistan and Kyrgyzstan. Unequal distribution of water resources and poor
water management represents one of the most acute problems in the Central Asia region.
While Kyrgyzstan and Tajikistan have abundant water resources and generate about 90% of
their electricity from hydropower stations (IEA online), Uzbekistan and Turkmenistan
experience ongoing water shortages especially during the peak irrigation season. As a result,
the countries are involved in transboundary disputes over water resources and have tense
geopolitical relationships. Energy efficiency in agriculture is therefore a priority in Central Asia.
Figure A7.4: Share of electricity for agriculture in total final electricity consumption, 2010
Source: Author’s calculations based on (IEA online).
1.44.0
7.4
2.13.3
4.2
0.61.5
1.4
1.91.92.4
16.621.2
30.7
2.44.0
6.6
2.51.11.8
1.70.20.4
4.34.0
6.0
54.332.1
33.8
0.2
10.26.0
8.1
0.60.1
0.1
2.92.2
2.0
8.43.0
1.6
0% 10% 20% 30% 40% 50% 60% 70% 80% 90% 100%
199020002010
199020002010
199020002010
199020002010
199020002010
Tur
key
Wes
tern
B
alka
nsC
auca
sus
Cen
tral
Asi
aO
ther
C
IS
Share of final electricity consumption
Fin
a el
ectr
icit
y co
nsu
mp
tio
n b
y se
cto
r, m
toe
buildings industry transport agriculture & fishery non-specified
23%
31%
32%
33%
Kyrgyzstan
Turkmenistan

Annex 8: Energy Efficiency – Sector
Transformation sector
The efficiency of the energy transformation sector could be measured as the ratio of final to
primary energy consumed by economies.
and illustrates that the efficiency of the transformation sector increa
Macedonia, Moldova, and Georgia during 1990
the transformation sector declined during this period of time. The changes in the efficiency
levels of the transformation sector could be
its final energy products (electricity vs
energy carriers consumed (fossil fuels, biomass, nuclear vs
efficiency of primary energy carriers into final energy carriers at respective facilities.
Figure A8.1: Ratio of the total final energy consumption to the total primary energy supply, 1990 vs
the direction of time)
Source: World Bank, 2013
84%
50%
72%
61% 61%
74%
0%
10%
20%
30%
40%
50%
60%
70%
80%
90%
100%
Alb
ania
Bos
nia
and
Her
zego
vina
Cro
atia
Ser
bia
Mac
edon
ia, F
YR
Western Balkans
94%
76%
63%63%
70%
81%
Sector-Specific Data (other than the Building Sector)
The efficiency of the energy transformation sector could be measured as the ratio of final to
primary energy consumed by economies. Figure A8.1 presents these ratios for ECIS countries
illustrates that the efficiency of the transformation sector increased in Albania, Croatia,
Macedonia, Moldova, and Georgia during 1990-2010. In all other countries, the efficiency of
the transformation sector declined during this period of time. The changes in the efficiency
levels of the transformation sector could be explained through the changes in the structure of
its final energy products (electricity vs. heat vs. refinery products), the structure of primary
energy carriers consumed (fossil fuels, biomass, nuclear vs. hydro), and the transformation
imary energy carriers into final energy carriers at respective facilities.
: Ratio of the total final energy consumption to the total primary energy supply, 1990 vs. 2010 (arrows indicate
74% 72%
64%
57%
67%
87%
71%
58%
89%
57%
Tur
key
Bel
arus
Rus
sian
Fed
erat
ion
Ukr
aine
Mol
dova
, Rep
ublic
of
Taj
ikis
tan
Uzb
ekis
tan
Kaz
akhs
tan
Kyr
gyzs
tan
Tur
kmen
ista
n
CIS Central Asia
70%
81%75%
88%
70%
60%
71%76%76%
92%
Specific Data (other than the Building Sector)
The efficiency of the energy transformation sector could be measured as the ratio of final to
presents these ratios for ECIS countries
sed in Albania, Croatia,
2010. In all other countries, the efficiency of
the transformation sector declined during this period of time. The changes in the efficiency
explained through the changes in the structure of
refinery products), the structure of primary
hydro), and the transformation
imary energy carriers into final energy carriers at respective facilities.
2010 (arrows indicate
73% 72%
58%
Arm
enia
Geo
rgia
Aze
rbai
jan
Caucasus
84%
61%
84%

Commercial and public buildings sector
Figure A8.2 illustrates the energy intensity of
sector value added and its compounded annual growth rates in 1990
significant decline in commercial and public sector energy intensity throughout the whole
region, except Turkey and Western Balkans.
Figure A8.2: Energy intensity of the commercial and public buildings sector per sector value added and its
annual growth rate (CAGR)
Source: Author’s calculations based on
Note: The figure does not contain the data for all Western Balkans without Turkey (1990),
Kosovo (2000, 2010), Bosnia and Herzegovina (2000, 2010), Montenegro (2000, 2010),
Kyrgyzstan (1990, 2000, 2010) and
11
34
21
15
17
7
11
18
3
20
Turkey
Other CIS
Western Balkans
Caucasus
Central Asia
EU-27
Se
rvic
es
en
erg
y in
ten
sity
,
ko
e/1
00
0 U
S$
PP
P 2
00
5
EI 1990
mmercial and public buildings sector
llustrates the energy intensity of the commercial and public buildings sector per
sector value added and its compounded annual growth rates in 1990 - 2010. The
significant decline in commercial and public sector energy intensity throughout the whole
region, except Turkey and Western Balkans.
: Energy intensity of the commercial and public buildings sector per sector value added and its
based on (IEA online), (World Bank online) and (WEC online)
igure does not contain the data for all Western Balkans without Turkey (1990),
0), Bosnia and Herzegovina (2000, 2010), Montenegro (2000, 2010),
and Kazakhstan (1990).
11
34
21
15
90
17
37
11
50
109
18
55
70
141
20
4%
-1%
-11%
-2%
-1%
-4%
-3%
-3%
-1%
EI 2000 EI 2010 CAGR 1990-2000 CAGR 2000-2010
commercial and public buildings sector per
2010. The figure shows a
significant decline in commercial and public sector energy intensity throughout the whole
: Energy intensity of the commercial and public buildings sector per sector value added and its compounded
(WEC online).
igure does not contain the data for all Western Balkans without Turkey (1990),
0), Bosnia and Herzegovina (2000, 2010), Montenegro (2000, 2010),
4%
7%
9%C
AG
R o
f se
rvic
es
en
erg
y in
ten
sity

Industry sector
Figure A8.3 illustrates the energy intensity of industry in the ECIS region and its compounded
annual growth rates in 1990 - 2010.
energy intensity during the last two decades
intensity grew in 1990-2000 and then declined in 2000
intensities in Central Asia and the Other CIS
Figure A8.3: Energy intensity of the industry and its compo
Source: Author’s calculations based on
Notes: The figure does not contain data for Kosovo (1990, 2000, 2010), Bosnia and Herzegovina
(1990), Montenegro (1990, 2000), Croatia (1990), Serbia (1990)
105
26
115
91
112
103
80
108
Turkey
Other CIS
Caucasus
Western Balkans
Central Asia
EU-27
Ind
ust
ry e
ne
rgy
inte
nsi
ty,
ko
e/1
00
0 U
S$
PP
P 2
00
5
EI 1990
illustrates the energy intensity of industry in the ECIS region and its compounded
2010. The Caucasus experienced a sharp decline in industrial
energy intensity during the last two decades, while in the other regions industria
2000 and then declined in 2000-2010. In 2010, the industrial energy
intensities in Central Asia and the Other CIS regions were more than double that of
: Energy intensity of the industry and its compounded annual growth rate (CAGR)
based on (IEA online), (World Bank online) and (WEC online)
igure does not contain data for Kosovo (1990, 2000, 2010), Bosnia and Herzegovina
(1990), Montenegro (1990, 2000), Croatia (1990), Serbia (1990) and Kazakhstan (1990).
105
220
26
115
248
91
112
330
207
133
384
103
80
283
522
108
228
131
-1%
-4%
-19%
-1%
-4%
-1%
-9%
-2%
EI 2000 EI 2010 CAGR 1990-2000 CAGR 2000-2010
illustrates the energy intensity of industry in the ECIS region and its compounded
Caucasus experienced a sharp decline in industrial
regions industrial energy
2010. In 2010, the industrial energy
that of the EU-27.
(WEC online).
igure does not contain data for Kosovo (1990, 2000, 2010), Bosnia and Herzegovina
Kazakhstan (1990).
3%
2%
2%
5%
CA
GR
of
ind
ust
ry e
ne
rgy
inte
nsi
ty

Transport sector
Figure A8.4 illustrates the energy intensity of transport in the ECIS region and its compounded
annual growth rates in 1990- 2010. The
intensity of GDP in all regions, except
the Other CIS region, Central Asia, and
the EU-27.
Figure A8.4: Energy intensity of transport and its compounded annual growth rate (CAGR)
Source: Author’s calculations based on
Notes: The figure does not contain data for Kosovo (1990, 2000, 2010), Bosnia and Herzegovina
(1990), Montenegro (1990, 2000)
Turkey
Western Balkans
Caucasus
Other CIS
Central Asia
EU-27
Tra
nsp
ort
en
erg
y in
ten
sity
, ko
e/10
00 U
S$
PP
P 2
005
EI 1990 EI 2000
illustrates the energy intensity of transport in the ECIS region and its compounded
2010. The figure illustrates the declining transport energy
intensity of GDP in all regions, except the Western Balkans. The transport energy intensity of
the Other CIS region, Central Asia, and the Western Balkans is considerably higher than that of
: Energy intensity of transport and its compounded annual growth rate (CAGR)
based on (IEA online), (World Bank online) and (WEC online)
igure does not contain data for Kosovo (1990, 2000, 2010), Bosnia and Herzegovina
(1990), Montenegro (1990, 2000) and Croatia (1990).
16
30
26
46
33
23
19
25
34
58
62
25
21
17
52
59
64
27
-2%
-3%
-2%
-6%
-1%
-1%
-4%
0%
0%
-1%
EI 2000 EI 2010 CAGR 1990-2000 CAGR 2000-2010
illustrates the energy intensity of transport in the ECIS region and its compounded
igure illustrates the declining transport energy
ans. The transport energy intensity of
Western Balkans is considerably higher than that of
(WEC online).
igure does not contain data for Kosovo (1990, 2000, 2010), Bosnia and Herzegovina
2%4%
CA
GR
of
tran
spo
rt e
ner
gy
inte
nsi
ty

Agriculture sector
Figure A8.5 presents the energy intensity of agriculture in the ECIS region and its compounded
annual growth rates in 1990 - 2010. The energy intensity in the Other CIS region, Central Asia,
and the Western Balkans grew in 1990
intensity in the Caucasus declined in
agricultural energy intensity experienced steady growth during the last two decades.
Figure A8.5: Energy intensity of agriculture and its compounded annua
Source: Author’s calculations based on
Notes: The figure does not contain data for Kosovo (1990, 2000, 2010), Bosnia and Herzegovina
(1990, 2000), Montenegro (1990, 2000), Croatia (1990)
30
14
26
Western Balkans
Turkey
Caucasus
Other CIS
Central Asia
EU-27
Ag
ricu
ltu
re e
ner
gy
inte
nsi
ty,
koe/
1000
US
$ P
PP
200
5
EI 1990 EI 2000
presents the energy intensity of agriculture in the ECIS region and its compounded
2010. The energy intensity in the Other CIS region, Central Asia,
and the Western Balkans grew in 1990 – 2000 and then declined in 2000 – 2010
Caucasus declined in the 1990s and increased in the 2000s. In Turkey,
agricultural energy intensity experienced steady growth during the last two decades.
: Energy intensity of agriculture and its compounded annual growth rate (CAGR)
based on (IEA online), (World Bank online), and (WEC online)
igure does not contain data for Kosovo (1990, 2000, 2010), Bosnia and Herzegovina
(1990, 2000), Montenegro (1990, 2000), Croatia (1990) and Serbia (1990).
30
64
64
118
112
89
40
46
37
152
146
105
14
26
96
83
145
119
-3%
3%
6%
-2%
-3%
-2%
6%
-9%
6%
0%
-1%
EI 2000 EI 2010 CAGR 1990-2000 CAGR 2000-2010
presents the energy intensity of agriculture in the ECIS region and its compounded
2010. The energy intensity in the Other CIS region, Central Asia,
0, while the
2000s. In Turkey,
agricultural energy intensity experienced steady growth during the last two decades.
(WEC online).
igure does not contain data for Kosovo (1990, 2000, 2010), Bosnia and Herzegovina
3%
6%
11%
6%
6%
0%
CA
GR
of
agri
cult
ure
en
erg
y in
ten
sity

Annex 9: Energy Efficiency - Residential Buildings Sector
The intensity of the residential sector could be measure
of the residential sector per capita or, better, per household.
available as an indicator than household number statistics because the l
census frequency (typically one per decade).
residential sector per capita in 1990, 2000, and 2010 as well
rates in the regions. Analysis reveals
capita is considerably lower for all
region.
Figure A9.1: Energy intensity of the residential sector
Source: Author’s calculations based on
online).
Notes: a) For Central Asia, the figure contains 1995 data instead of 1990;
b) The figure does not contain the data for: Kosovo (1990, 2000, 2010) and Montenegro
(1990, 2000, 2010).
Figure A9.2 plots the energy intensity of the residential sector per ho
data available, it is possible to conclude that the energy intensity per household decline
beginning of 1990s, but changed
2010 was more available than for 1990
intensity per household increased in Kazakhstan, Armenia,
and Bosnia and Herzegovina, while in
Table A9.1 for the annual rates of decline). The difference
interplay of factors such as population changes, person per household changes, the growth of
Turkey
Other CIS
Western Balkans
Caucasus
Central Asia
EU-27
Re
sid
en
tia
l en
erg
y in
ten
sity
,
ko
e/c
ap
ita
EI 1990
Residential Buildings Sector-Specific Data
The intensity of the residential sector could be measured in the total final energy consumption
of the residential sector per capita or, better, per household. Population statistics
indicator than household number statistics because the latter is dependent on
census frequency (typically one per decade). Figure A9.1 presents the energy intensity of the
in 1990, 2000, and 2010 as well as its compounded annual growth
Analysis reveals that final energy consumption of the residential sector
is considerably lower for all the ECIS regions than for the EU-27, except for the
Energy intensity of the residential sector per capita
based on (IEA online), (World Bank online)
For Central Asia, the figure contains 1995 data instead of 1990;
igure does not contain the data for: Kosovo (1990, 2000, 2010) and Montenegro
plots the energy intensity of the residential sector per household. From the limited
data available, it is possible to conclude that the energy intensity per household decline
beginning of 1990s, but changed to an upward trend at the end of 1990s. The data for 2000
2010 was more available than for 1990-2010 and revealed different trends. The energy
intensity per household increased in Kazakhstan, Armenia, Azerbaijan, Belarus, Ukraine, Turkey,
, while in Georgia, Tajikistan, Russia, and Kyrgyzstan it declined (see
the annual rates of decline). The difference in trends could be explained
as population changes, person per household changes, the growth of
309
715
307
277
307
613
277
816
280
249
318
596
268
571
262
384
307
580
1%
-1%
1%
1%
0%
0%
0%
4%
1%
-4%
1%
0%
EI 2000 EI 2010 CAGR 1990-2000 CAGR 2000-2010
in the total final energy consumption
opulation statistics are more
is dependent on
presents the energy intensity of the
as its compounded annual growth
that final energy consumption of the residential sector per
for the Other CIS
and (EUROSTAT
igure does not contain the data for: Kosovo (1990, 2000, 2010) and Montenegro
usehold. From the limited
data available, it is possible to conclude that the energy intensity per household declined in the
at the end of 1990s. The data for 2000-
different trends. The energy
Belarus, Ukraine, Turkey,
Georgia, Tajikistan, Russia, and Kyrgyzstan it declined (see
trends could be explained by the
as population changes, person per household changes, the growth of
CA
GR
of
the
re
sid
en
tia
l e
ne
rgy
inte
nsi
ty

living area, penetration of end-use technologies, fuel switching, energy efficiency, and
interruptions of energy supply.
Figure A9.2: Energy intensity of the residential sector per household
Source: Author’s calculations based on (IEA online) and (UNECE online).
Table A9.1: Annual growth rates of energy intensity per household during 2000-2010
Country Time interval CAGR
Kazakhstan 2000-2010 12%
Armenia 2001-2008 11%
Turkey 2002-2008 4%
Belarus 2000-2009 3%
Bosnia and Herzegovina 2000-2007 2%
Azerbaijan 2000-2010 1%
Ukraine 2000-2010 1%
Georgia 2000-2010 -1%
Tajikistan 2000-2010 -2%
Russian Federation 2002-2010 -3%
Kyrgyz Republic 2000-2009 -6%
Source: Author’s calculations based on (IEA online) and (UNECE online).
0
500
1000
1500
2000
2500
3000
1990 1995 2000 2005 2010
Res
iden
tial
sec
tor
ener
gy
inte
nsi
ty,
koe/
ho
use
ho
ld
Armenia
Azerbaijan
Belarus
Bosnia and Herzegovina
Croatia
Georgia
Kazakhstan
Kyrgyz Republic
Macedonia, FYR
Moldova
Russian Federation
Serbia
Tajikistan
Turkey
Ukraine

Figure A9.3 provides an estimate of space heating intensities per household and per m2 in
Russia during 1993-2010. During this period space heating intensity per household declined by
2.4%/year and in 2010 was 65% of its 1993 level. The space heating intensity per m2
declined
by 4.0%/year and in 2010 was 50% of its 1993 level. The intensity per household differed from
the intensity per m2 because the living area per person changed significantly (increased) during
the last two decades.
Figure A9.3: Dynamics of estimated space heating intensity per household and per m
2, Russia, 1993 - 2010
Source and notes:
The space heating intensity per household was calculated as the residential energy consumption (IEA online)
divided by the number of households (UNECE online) minus residential electricity consumption per household for
electrical appliances and lighting (WEC online). Since the number of persons per household available for 2002 and
2009 has not changed significantly, the constant number of 2.7 person/household was assumed for the whole
period. For the space heating intensity per m2, the obtained space heating intensity per household was
recalculated back to intensity per person and divided by the living space per person (Rosstat 2012).
0
5
10
15
20
25
30
35
0
100
200
300
400
500
600
700
800
1993 1994 1995 1996 1997 1998 1999 2000 2001 2002 2003 2004 2005 2006 2007 2008 2009 2010M
Wh
/ho
use
ho
ld
KW
h/m
2
Space heating intensity per m2 Space heating intensity per household

Electrical intensity per household increased during 1990 – 2010 in the countries for which
information was available (Figure A9.4). This is because the growing number of electrical
appliances and equipment outweighed electrical efficiency gains achieved in the sector.
Figure A9.4: Electrical intensity of households and its compounded growth annual rates, 1990 - 2010
Source: (WEC online).
As a result of the growing number of electrical appliances and equipment over the last two
decades, electricity consumption in the residential buildings of the ECIS region grew
1.34.6 times (Figure A9.5).
Figure A9.5: Index of total final electricity consumption in the residential and commercial and public sectors (1990 = 1.0)
Source: Author’s calculations based on (IEA online).
1978
718
2113
1992
1154
1683
2675
2297
1961
2781
2378
2536
-5.2%
8.9%
2.4%
1.4%
5.4%
5.1%
-1.2%
1.0%
Kazakhstan
Turkey
Russia
European Union
CAGR, %kWh/household
2010 2000 1990 2000-2010 1990-2000
0.0
1.0
2.0
3.0
4.0
5.0
6.0
7.0
1990 1995 2000 2005 2010
Households
Turkey
Western BalkansCentral Asia
Caucauses
Other CIS
0.0
1.0
2.0
3.0
4.0
5.0
6.0
7.0
1990 1995 2000 2005 2010
Commercial and public sectors
Turkey
Western BalkansCentral Asia
Caucauses
Other CIS
0.0
1.0
2.0
3.0
4.0
5.0
6.0
7.0
1990 1995 2000 2005 2010
Households
Turkey
Western BalkansCentral Asia
Caucauses
Other CIS
0.0
1.0
2.0
3.0
4.0
5.0
6.0
7.0
1990 1995 2000 2005 2010
Commercial and public sectors
Turkey
Western BalkansCentral Asia
Caucauses
Other CIS

Figure A9.6 represents the dynamics of energy efficiency on the refrigerator market in Western
Europe, Eastern Europe, and Russia. The figure reveals that in Russia during 2004 – 2011 the
share of A+ class refrigerators increased from 2% to 21% and the share of A class refrigerators
grew from 35% to 55%. In contrast, in Western Europe and Eastern Europe, A+ class
refrigerators were already dominating the market by 2011 (46% and 65% respectively).
Figure A9.6: Dynamics of energy efficiency on the refrigerator market over time in Western Europe, Eastern Europe, and
Russia
Source: based on (GfK, 2011) and (UNDP, Government of Russian Federation, and GEF 2009).
A UNEP country lighting assessment of the Russian Federation (UNEP, 2012) concluded that the
transition to energy efficient lighting in the residential, commercial, and industrial sectors as
well as outdoor uses may result in numerous benefits. More specifically, exchanging lamps on a
national scale (see Figure A9.7 for installed stock of lamps before and after transition) allows
reducing electricity consumption for lighting by 46.3% or 5.8% of total national electricity
consumption (see Figure A9.8 for details).
Figure A9.7: Installed Stock of Lamps (by sector, by lamp type)
0%
20%
40%
60%
80%
100%
Wes
tern
Eur
ope
Eas
tern
Eur
ope
Rus
sia
Wes
tern
Eur
ope
Eas
tern
Eur
ope
Rus
sia
Wes
tern
Eur
ope
Eas
tern
Eur
ope
Rus
sia
Wes
tern
Eur
ope
Eas
tern
Eur
ope
Rus
sia
2004 2007 2010 2011
A++
A+
A
B
Other

Source: UNEP, 2012
Figure A9.8: Total Electricity Consumption (by sector, by lamp type)
Source: UNEP, 2012

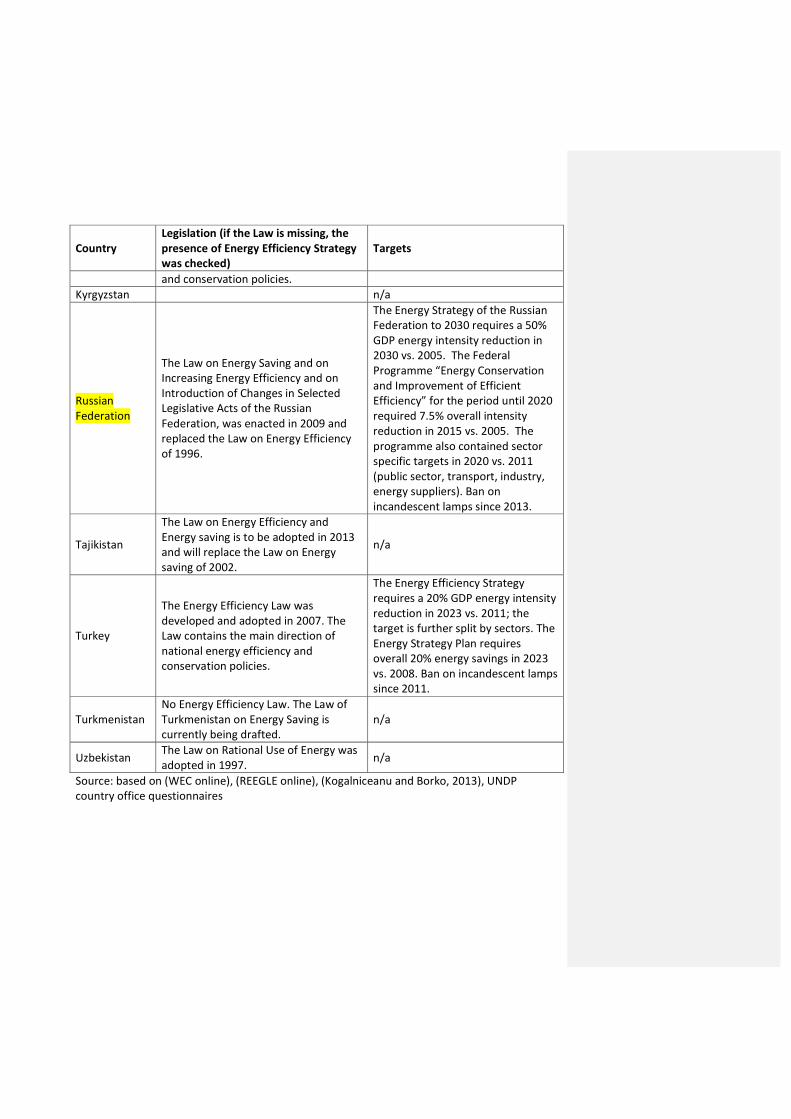
Annex 10: Energy Efficiency - Legislation and Policies in the ECIS Region
Table A10.1: Overview of energy efficiency legislation and targets in the ECIS region
Country
Legislation (if the Law is missing, the
presence of Energy Efficiency Strategy
was checked)
Targets
Albania,
Bosnia and
Herzegovina,
Kosovo, fYR
Macedonia,
Montenegro,
Serbia,
Moldova,
Ukraine
These countries are Contracting
Members of the Energy Community
Treaty and thus are obliged to
introduce EU energy efficiency
legislation. By today, they have
adopted or in the process of adoption
of three EU energy efficiency
Directives: 2006/32/EC on Energy End-
Use Efficiency and Energy Services
(ESD), 2010/31/EU on the Energy
Performance of Buildings (EPBD) –
Recast 2002/91/EC, 2010/30/EU on
Labeling of Energy-Related Products
(Recast Directive 92/75/EEC) and
implementing directives and delegated
acts.
The targets of the EU Energy
Services Directive 2006/32/EC
(European Commission 2006) apply,
namely energy savings as 9% of total
energy sales in 2018 vs. 2010
(delayed implementation as
compared to the EU by 2 years).
Albania The Energy Efficiency Law was adopted
in 1995.
Bosnia and
Herzegovina
As of 2013, the Energy Efficiency Law
was in the public hearing procedure.
Croatia
As a Member of the European Union
since July 2013, the EU’s energy
efficiency legislation is mandatory for
Croatia. This includes the key directives
listed above and Energy Efficiency
Directive 2012/27/EU (European
Commission 2012). Additionally, the
Energy Strategy of Croatia adopted in
2002 contains energy efficiency
provisions.
The targets of the EU Energy
Services Directive 2006/32/EC
(European Commission 2006) apply,
namely energy savings as 9% of total
energy sales in 2016 vs. 2008.
Following the adoption of Energy
Efficiency Directive, 1.5%/yr. energy
(sales) savings vs. recent 3 year-
period should be achieved with
utility obligation or alternative
approach. Ban on incandescent
lamps in the residential sector since
2013.
Serbia The Energy Law adopted in 2004
contains some energy efficiency
Additionally to above, the Energy
Sector Development Strategy

Country
Legislation (if the Law is missing, the
presence of Energy Efficiency Strategy
was checked)
Targets
provisions. The Law on Efficient Use of
Energy was adopted in 2013.
requires the intensity reduction
2%/yr. in 2005-2015.
fYR
Macedonia
The Energy Law adopted in 2011
contains some energy efficiency
provisions.
Montenegro The Law On Energy Efficiency was
adopted in 2010.
Kosovo The Law on Energy Efficiency was
adopted in 2011.
Moldova The Energy Efficiency Law was adopted
in 2010
Ukraine
The Energy Strategy of Ukraine to 2030
adopted in 2006 contains some energy
efficiency provisions.
The Economic Programme on
Energy Efficiency for 2010-2015
requires a 20% reduction in GDP
energy intensity (or 3.3%/yr.) by
2015 vs. 2005.
The 2006 Energy Strategy to 2030
required that the Government of
Ukraine set a 50% reduction target
for energy intensity by 2030.
Armenia
No Energy Efficiency Law. The National
Security Strategy of RA (2007) contains
the aim of maximal possible utilisation
of energy saving potential.
n/a
Azerbaijan
No Energy Efficiency Law. The National
Strategy in the field of alternative and
renewable energy sources until 2020
was developed, but has yet to be
adopted. The Strategy contains energy
efficiency provisions.
The mentioned Strategy also
contains the target of a 20%
improvement in energy efficiency by
2020.
Belarus
The Law On Energy Saving, enacted in
1998 and last amended in 2006,
requires that the Government establish
the promotion of energy efficiency as a
national priority.
The National Energy Saving
Programme for 2011-2015 requires
reducing GDP energy intensity by
29-32% during 2011-2015.
Georgia n/a n/a
Kazakhstan
The Law on Energy Saving and Energy
Efficiency Improvement was adopted in
2012. The Law contains the main
directions of national energy efficiency
The Energy Saving Plan adopted in
2011 requires a 10% reduction of
energy intensity in 2015 vs. 2008.
Country
Legislation (if the Law is missing, the
presence of Energy Efficiency Strategy
was checked)
Targets
and conservation policies.
Kyrgyzstan n/a
Russian
Federation
The Law on Energy Saving and on
Increasing Energy Efficiency and on
Introduction of Changes in Selected
Legislative Acts of the Russian
Federation, was enacted in 2009 and
replaced the Law on Energy Efficiency
of 1996.
The Energy Strategy of the Russian
Federation to 2030 requires a 50%
GDP energy intensity reduction in
2030 vs. 2005. The Federal
Programme “Energy Conservation
and Improvement of Efficient
Efficiency” for the period until 2020
required 7.5% overall intensity
reduction in 2015 vs. 2005. The
programme also contained sector
specific targets in 2020 vs. 2011
(public sector, transport, industry,
energy suppliers). Ban on
incandescent lamps since 2013.
Tajikistan
The Law on Energy Efficiency and
Energy saving is to be adopted in 2013
and will replace the Law on Energy
saving of 2002.
n/a
Turkey
The Energy Efficiency Law was
developed and adopted in 2007. The
Law contains the main direction of
national energy efficiency and
conservation policies.
The Energy Efficiency Strategy
requires a 20% GDP energy intensity
reduction in 2023 vs. 2011; the
target is further split by sectors. The
Energy Strategy Plan requires
overall 20% energy savings in 2023
vs. 2008. Ban on incandescent lamps
since 2011.
Turkmenistan
No Energy Efficiency Law. The Law of
Turkmenistan on Energy Saving is
currently being drafted.
n/a
Uzbekistan The Law on Rational Use of Energy was
adopted in 1997. n/a
Source: based on (WEC online), (REEGLE online), (Kogalniceanu and Borko, 2013), UNDP
country office questionnaires

Table A10.2: Policy tools except Labels and Minimum Energy Performance Standards (to be cont.)
Typ
e Measure Sector
Alban
ia Croatia Serbia Turkey Ukraine
Russian
Federation
Fin
an
cia
l
Energy audits
Households Y
Commercial and
public Y
Industry Y Y
Subsidies
Household
equipment Y (SWH) Y (lamps)
Dwellings Y (existing)
Commercial and
public Y (existing) Y (existing)
Industry Y (el. motors)
Soft loans
Households Y (refr., AC, Lamps,
SWH, wood stoves)
Dwellings Y (existing)
Commercial and
public Y (existing)
Industry Y (el.motors) Y (el.
motors)
Fis
cal Tax reduction
Dwellings Existing:
VATL
SWH (import tax,
VAT)
New
dwellings
Transport Cars: purchase tax, incl.
VAT
Accelerate
depreciation Industry Y
Re
gu
lati
on
(e
xce
pt
lab
els
an
d M
EP
S)
Other
regulatory
instruments
Households MEA MEA MEA MCR
Industry MEA, MCR MEM,MCR MEA,MEM
Transport MCR
Public MEA MEA,M
CR MEM,MCR MCR
Commercial MEA MEA,M
CR MEM,MCR
Incandescent
lamps phase-
out
N Y (2013) Y (2011) N Y (2014)
Mandatory
training for
professionals
N Y (engineers) Y (audit,
managers)
Oth
ers
me
asu
res
Voluntary
agreement
Industry VA (1175 Co)
Transport Y
Public Y
Commercial VA (890 Co)
ESCO Number 2 10 37 30
Turnover € 10 mil
Certification Auditor
certification N Y Y Y Y
Source: based on (WEC online)

Table A10.3: Labels and Minimum energy efficiency performance standards (to be cont.)
Sector Households Transp
ort
Indust
ry
Commercial and public
End-use
Re
frig
era
tors
Wa
shin
g
ma
chin
es
Air
co
nd
itio
nin
g
Lam
ps
So
lar
wa
ter
he
ate
rs
Ca
rs
Ind
ust
ria
l e
lect
ric
mo
tors
Air
co
nd
itio
nin
g
Off
ice
eq
uip
me
nt
Ne
w d
we
llin
g
Ne
w c
om
me
rcia
l
Ne
w p
ub
lic
Ex
isti
ng
dw
ell
ing
Ex
isti
ng
com
me
rcia
l
Ex
isti
ng
pu
bli
c
Country Labels
Albania LB(M) LB(M) LB(
M)
LB(
M)
LB(M) LB(M) LB(M) LB(M)
Croatia LB(M,20
07)
LB(M,20
07)
LB(M,20
07)
LB(M,20
07)
LB(M) LB(
M)
LB(M,20
09)
LB(M,20
09)
LB(M) LB(M,20
09)
Serbia
Turkey LB(M,20
02)
LB(M,20
03)
LB(M) LB(
M)
LB(M,20
08)
LB(M,20
08)
LB(P,20
17)
LB(P,20
17)
Ukraine LB(V) LB(V) LB(P) LB(P
)
LB(P) LB(P)
Russian
Federation
LB(M,20
11)
LB(M,20
11)
LB(M,20
11)
LB(P
)
LB(V,20
10)
LB(V,20
10)
Country Minimum energy efficiency standards
Albania MS MS MS MS MS MS
Croatia MS(P) MS(P) MS(P) MS(P) MS(
P)
MS(20
08)
MS(200
8)
MS(200
8)
Serbia MS(P) MS(P) MS(P) MS(P) MS(
P)
MS MS(P) MS(P)
Turkey MS(200
5)
MS(201
1)
MS(200
3)
MS(20
12)
MS(20
00)
MS(200
0)
MS(200
0)
Ukraine MS(P) MS(P) MS(P) MS(P) MS(P) MS(P)
Russian
Federation
MS(201
1)
MS(20
03)
MS(20
03)
Source: based on (WEC online)
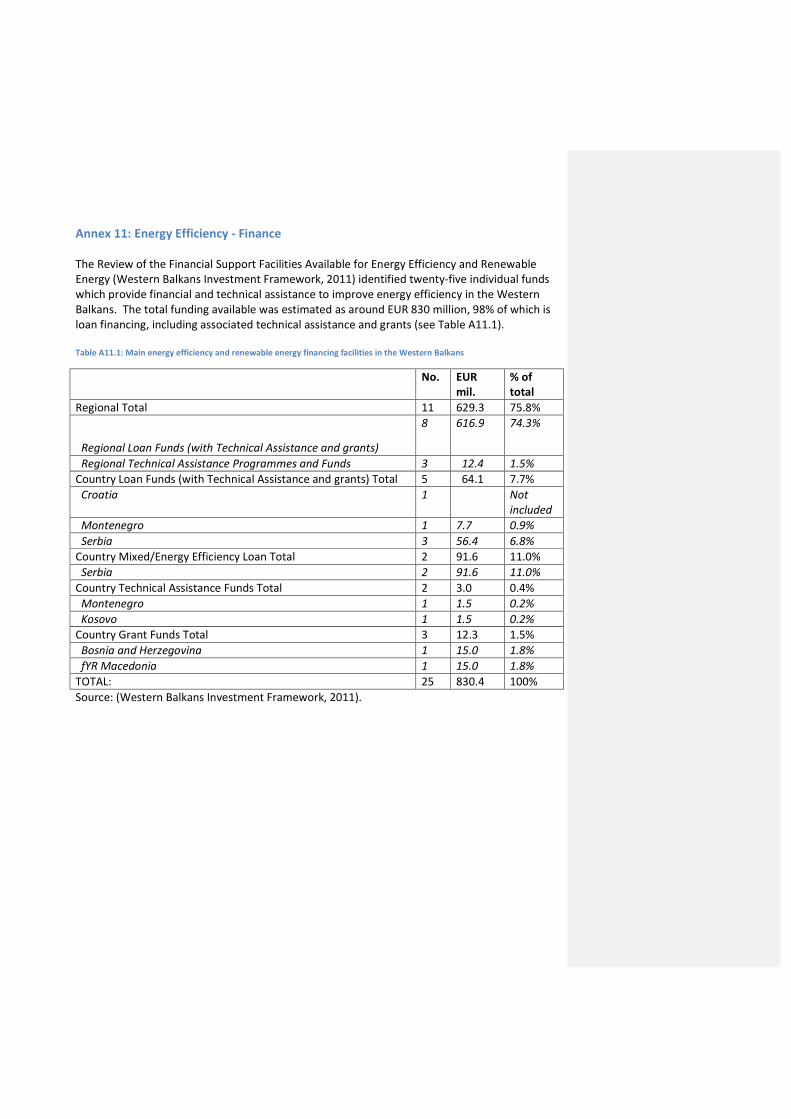
Annex 11: Energy Efficiency - Finance
The Review of the Financial Support Facilities Available for Energy Efficiency and Renewable
Energy (Western Balkans Investment Framework, 2011) identified twenty-five individual funds
which provide financial and technical assistance to improve energy efficiency in the Western
Balkans. The total funding available was estimated as around EUR 830 million, 98% of which is
loan financing, including associated technical assistance and grants (see Table A11.1).
Table A11.1: Main energy efficiency and renewable energy financing facilities in the Western Balkans
No. EUR
mil.
% of
total
Regional Total 11 629.3 75.8%
Regional Loan Funds (with Technical Assistance and grants)
8 616.9 74.3%
Regional Technical Assistance Programmes and Funds 3 12.4 1.5%
Country Loan Funds (with Technical Assistance and grants) Total 5 64.1 7.7%
Croatia 1 Not
included
Montenegro 1 7.7 0.9%
Serbia 3 56.4 6.8%
Country Mixed/Energy Efficiency Loan Total 2 91.6 11.0%
Serbia 2 91.6 11.0%
Country Technical Assistance Funds Total 2 3.0 0.4%
Montenegro 1 1.5 0.2%
Kosovo 1 1.5 0.2%
Country Grant Funds Total 3 12.3 1.5%
Bosnia and Herzegovina 1 15.0 1.8%
fYR Macedonia 1 15.0 1.8%
TOTAL: 25 830.4 100%
Source: (Western Balkans Investment Framework, 2011).

Annex 12: Renewable Energy – Total energy supply
Table A12.1: Total of renewable energy in total primary energy supply (TJ) and share of RE (%)
SUB-
REGION Country
Total of All
Energy Sources
(TJ)
Total of
Renewable
Energy Sources
(TJ)
Total of
Renewable Energy
excluding hydro
power (TJ)
Share of RE
including
hydropower
(%)
Share of
hydro
power (%)
Share of RE
excluding hydro
power (%)
WESTERN
BALKANS
AND
TURKEY
Albania 86,972.73 36,151.59 8,862.28 41.57% 31.38% 10.19%
Bosnia and
Herzegovina 268,161.11 36,552.31 7,653.51 13.63% 10.78% 2.85%
Croatia 357,356.61 47,389.51 17,399.71 13.26% 8.39% 4.87%
Kosovo n/a n/a n/a n/a n/a n/a
Montenegro n/a n/a n/a n/a n/a n/a
Serbia 653,595.61 85,986.99 43,171.69 13.16% 6.55% 6.61%
fYR Macedonia 120,979.85 17,853.69 9,107.71 14.76% 7.23% 7.53%
Turkey 4,401,713.01 486,741.33 300,242.17 11.06% 4.24% 6.82%
CAUCASUS
Armenia 102,381.91 9,270.45 67.2 9.05% 8.99% 0.07%
Azerbaijan 495,640.71 12,411.43 3.6 2.50% 2.50% 0.00%
Georgia 130,555.85 50,678.03 16,950.76 38.82% 25.83% 12.98%
WESTERN
CIS
Belaurus 1,161,001.94 61,470.51 61,308.49 5.29% 0.01% 5.28%
Ukraine 5,464,495.85 109,320.87 61,965.14 2.00% 0.87% 1.13%
Moldova 108,967.37 3,281.87 2,997.41 3.01% 0.26% 2.75%
RF Russian Federation 29,371,365.68 740,871.89 141,425.21 2.52% 2.04% 0.48%
CENTRAL
ASIA
Kazakhstan 3,140,432.47 30,994.00 2,109.60 0.99% 0.92% 0.07%
Kyrgyzstan 122,177.57 37,344.67 149.97 30.57% 30.44% 0.12%
Tajikistan 96,627.53 57,052.27 0 59.04% 59.04% 0.00%
Turkmenistan 892,072.06 10.8 0 0.00% 0.00% 0.00%
Uzbekistan 1,833,287.18 39,041.03 10.01 2.13% 2.13% 0.00%
ECIS Region 48,807,785.04 1,862,423.24 673,424.466 3.82% 2.44% 1.38%
Source: IEA (2010).

Annex 13: Renewable Energy – Total RES electric installed capacity by technology
SUB-
REGION Country Hydroelectricity Biomass Solar Wind SHPP Geothermal
CENTRAL
ASIA
Kazakhstan 2,217 0 < 1 MW 2 115 0
Kyrgyzstan 2910 0 0 0 41 0
Tajikistan 4,037 0 < 1 MW 0 132 0
Turkmenistan 1 0 0 0 5 0
Uzbekistan 1,736 2 < 1MW < 1MW 394 0
WESTERN
BALKANS
AND
TURKEY
Albania 1475 0 0 0 44 0
Bosnia and
Herzegovina 2117 0 < 1 0 60 0
Croatia 1,918 7 5 217 3 3
Kosovo n.a
Montenegro 658 0 < 1 < 1 9 0
Serbia 2,225 0 2 0 31 0
Macedonia 573 0 7 0 60 0
Turkey 17,887 0 9 2,312 1,490 238
WESTERN
CIS
Belarus 30 6 < 1 2 16 0
Ukraine 5,600 8 373 276 112 0
Moldova 64 3 < 1 < 1 0 0
RF Russian Federation
46,892 0 < 1 17 250 82
CAUCASUS
Armenia 1207 < 1MW <1 MW 3 218 0
Azerbaijan 977 0 2 3 n.a 0
Georgia 2850 0 < 1 <1 50 0
ECIS Region 95,374 25 398 2,831 3,030 323
Annex 13 is based on data accessed from the following sites:
Albania
Renewable Facts, 2014. <available online at: http://www.renewablefacts.com/country/albania
Albania Energy Association (AEA), 2013: Albania Wind Energy. Available at: http://aea-al.org/albania-wind-energy/
National Agency of Natural Resources, 2012. Hydropower Situation – Albania. <Available online at:
http://www.akbn.gov.al/images/pdf/hidroenergjetike/Hydropower_Situation_and_Current_Situation.pdf Republic of Albania, The GEF and UNDP, 2012: Draft Albanian Renewable Energy Action Plan.
Armenia
Babayan, T., 2012: Renewable Energy in Armenia. Available at: http://www.energy-
community.org/pls/portal/docs/1668199.PDF
UNDP and The GEF, 2012: Armenia: Situational analysis and assessment in the context of Sustainable Energy for All Initiative:
Rapid Assessment – 2012. Available at: http://www.nature-
ic.am/res/Third%20National%20Communication/WEB/SE4ALL%20Armenia_Report%20_ENG_.pdf

Renewable Facts, 2014. <available online at: http://www.renewablefacts.com/country/armenia
The Ministry of Energy and Natural Resources of the Republic of Armenia, 2013. Available at: http://www.minenergy.am/
Azerbaijan
Renewable Facts, 2014. Available at: http://www.renewablefacts.com/country/azerbaijan
State Agency on Alternative and Renewable Energy Sources of the Republic of Azerbaijan (ARES), 2013: Experimental Hybrid
Polygon. Available at: http://ares.az/gobustan-polygon/
The World Wind Energy Association (WWEA), 2013: 2012 Annual Report.
Available at: http://www.wwindea.org/webimages/WorldWindEnergyReport2012_final.pdf
Belarus
Energy Charter Secretariat (ECS) 2013: In-Depth Review of the Energy Efficiency Policy of the Republic of Belarus, available at:
http://www.encharter.org/fileadmin/user_upload/Publications/Belarus_EE_2013_ENG.pdf
Raslavicius, L., 2012: Renewable Energy Sector in Belarus – A review, in: Renewable and Sustainable Energy Reviews (16): 5399-
5413.
Renewable Facts, 2014. Available at: http://www.renewablefacts.com/country/belarus
The World Wind Energy Association (WWEA), 2013: 2012 Annual Report.
Bosnia and Herzegovina
Bosnia and Herzegovina State Electricity Regulatory Commission, 2012. Report On Activities of the State Electricity Regulatory
Commission. Tuzla, Bosnia and Herzegovina.
Pavlovic, T. M., Milosavljevic, D. D., Mirjanic, D., Pantic, L. S., Radonjic, I. S., and D. Pirsl, 2013: Assessments and perspectives of
PV solar power engineering in the Republic of Srpska (Bosnia and Herzegovina). In: Renewable and Sustainable Energy Reviews,
18: 119-133.
http://www.renewablefacts.com/country/bosnia-and-herzegovina
State Electricity Regulator Commission (SERC), 2012: Report on Activities of the State Electricity Regulatory Commission.
Available at:
http://www.derk.ba/DocumentsPDFs/DERK_izvjestaj_o_radu_2012-en.pdf
The European Wind Energy Association (EWEA), 2013: Annual Report 2012. Available at:
http://www.ewea.org/fileadmin/files/library/publications/reports/EWEA_Annual_Report_2012.pdf
Croatia
The Ministry of Economy, Labour and Entrepreneurship (2013): Interactive Renewable Map. Available at: http://oie-
aplikacije.mingo.hr/InteraktivnaKarta/
Renewable Facts, 2014. Available at: http://www.renewablefacts.com/country/croatia
Georgia
Energy Charter Secretariat (ECS), 2012: In-Depth Review of Energy Efficiency Policies and Programmes: Georgia. Available at:
http://www.encharter.org/fileadmin/user_upload/Publications/Georgia_EE_2012_ENG.pdf
Green Georgia. Available at: http://www.greengeorgia.ge/
Ministry of Economy and Sustainable Development of Georgia (MESD) – Sustainable Development Department, 2013:
Renewable Energy. Available at: http://www.greengeorgia.ge/
Renewable Facts, 2014. Available at: http://www.renewablefacts.com/country/georgia
The World Wind Energy Association (WWEA), 2013: 2012 Annual Report.
Available at: [http://www.wwindea.org/webimages/WorldWindEnergyReport2012_final.pdf Promotion of Small Hydro retrofitting and Implementation in the Caucasus and Carpathian region (SHYCA), 2010: Existing and
prospected small hydro power plants in the Caucasus and Carpathians – SHP state-of-the-art in Georgia. Available at:
http://www.shyca.org/results/WP2/wp2surveyGE.pdf
Kazakhstan
Energy Charter Secretariat (ECS), 2013: Investment Climate and Market Structure Review in the Energy Sector of Kazakhstan.
Available at:
http://www.encharter.org/fileadmin/user_upload/Publications/Kazakhstan_ICMS_2013_ENG.pdf
Energy Charter Secretariat (ECS), 2013: Investment Climate and Market Structure Review in the Energy Sector of Kazakhstan.
Available at:
http://www.encharter.org/fileadmin/user_upload/Publications/Kazakhstan_ICMS_2013_ENG.pdf

(based on cf =0.4 with o.4 bln kw-h produced electricity from SHPP)
Renewable Facts, 2014. Available at: http://www.renewablefacts.com/country/kazakhstan
The World Wind Energy Association (WWEA), 2013: 2012 Annual Report.
Available at: [http://www.wwindea.org/webimages/WorldWindEnergyReport2012_final.pdf
Kyrgyzstan
Desertec Knowledge Platform. 2012: Available at: http://knowledge.desertec.org/wiki/index.php5/Kyrgyzstan#Electricity
Renewable Facts, 2014. Available at: http://www.renewablefacts.com/country/kyrgyzstan
fYR Macedonia
Energy Agency of the Republic of Macedonia, 2013: Register of Plants for the production of electricity from RES. Available at:
http://www.ea.gov.mk/index.php?option=com_content&view=article&id=679&Itemid=124&lang=mk
EVN Macedonia, 2013: Generation. Available at: http://www.evn.mk/Za-nas/Proizvodstvo.aspx
See -Change Network (SEECN) c, 2013: Invest in Haste, Repent at Leisure - Are IFIs behaving as if EU accession criteria and
extreme energy losses do not exist in South East Europe. Available at: http://bankwatch.org/sites/default/files/SEE-IFI-
energy.pdf
EVN Group EVN Macedonia, 2013: Generation. Available at: http://www.evn.mk/Za-nas/Proizvodstvo.aspx
Renewable Facts, 2014. Available at: http://www.renewablefacts.com/country/macedonia
Moldova
UNECE, 2009: RES Development and Potential Moldova. Available at:
http://www.unece.org/fileadmin/DAM/energy/se/pp/ee21_sc/20scJune09/4_june_morn/8_ceban_e.pdf Renewable Facts, 2014. Available at: http://www.renewablefacts.com/country/moldova
Montenegro
United Nations Development Programme, 2012. Montenegro in the context of Sustainable Energy for All Initiative: Rapid
Assessment and Gap Analysis.
Ministry of Economy, 2012: Update / Upgrade of “Energy Development Strategy of Montenegro by 2030. (Green Book and draft
White Book). Available at: http://www.seaeds.me/images/120627_Output_3-1_Green_Book_final_draft_ENG.pdf Renewable Facts, 2014. Available at: http://www.renewablefacts.com/country/montenegro
Russian Federation
Ministry of Energy of the Russian Federation, 2013. Available at: http://minenergo.gov.ru/activity/vie/
Renewable Energy Policy Network for the 21th Century (Ren21), 2013: Renewables 2013 Global Status Report. Available at:
http://www.ren21.net/REN21Activities/GlobalStatusReport.aspx
Renewable Facts, 2014. Available at: http://www.renewablefacts.com/country/russia
Tatiana, D., 2010: Renewable Energy in Republic of Moldova. Available at:
http://www.potsdam.ihk24.de/linkableblob/1071254/.4./data/Praesentation_ConsultGroup-
data.pdf;jsessionid=FC02A719B44F8ACB8038450F1B51EAD3.repl2
UNECE, 2009: RES Development and Potential Moldova. Available at:
http://www.unece.org/fileadmin/DAM/energy/se/pp/ee21_sc/20scJune09/4_june_morn/8_ceban_e.pdf
Serbia
European Wind Energy Association (EWEA), 2013: Eastern winds – Emerging European wind power markets. Available at:
http://www.ewea.org/fileadmin/files/library/publications/reports/Eastern_Winds_emerging_markets.pdf
Katic, V., Corba, Z., Milicevic, D., Dumnic, B., Popdic, B., and A. Evgenije, 2013: Overview of Solar PV Energy in Market in Serbia.
Presented at the 6th PSU-UNS International Conference on Engineering and Technology (ICET-2013), Available at:
http://www.psu-uns2013.com/material/papers/Session13/Session13-13807.pdf
Panic, M., Urosec, M., Milanovic, A., Brankov, J., and Z. Bjeljac, 2013: Small hydropower plants in Serbia: Hydropower potential,
current state and perspectives. In: Renewable and Sustainable Energy Reviews, 23: 341-3149.
Renewable Facts, 2014. Available at: http://www.renewablefacts.com/country/serbia
Tajikistan
Energy Charter Secretariat (ECS), 2010: Tajikistan - In-Depth Review of the Investment Climate and Market Structure on the
Energy Sector. Available at:
http://www.encharter.org/fileadmin/user_upload/Publications/Tajikistan_ICMS_2010_ENG.pdf
Renewable Facts, 2014. Available at: http://www.renewablefacts.com/country/tajikistan

United Nations Development Programme (UNDP), 2013. Sustainable Energy for All Regional Questionnaire on Renewable
Energy, Tajikistan
Turkey
Benli, H. 2013: Potential of renewable energy in electrical energy production and sustainable energy development of Turkey:
Performance and policies. In: Renewable Energy, 50: 33-46.
British Petroleum (BP), 2013: BP Statistical Review of World Energy 2013. Available at:
http://www.bp.com/en/global/corporate/about-bp/statistical-review-of-world-energy-2013/review-by-energy-
type/renewable-energy/solar-energy.html
Capik, M., Yilmaz, A. O., and I. Cavusoglu, 2012: Hydropower for sustainable energy development in Turkey: The small
hydropower case of the Eastern Black Sea Region. In: Renewable and Sustainable Energy Reviews, 16: 6160-6172.
Renewable Facts, 2014. Available at: http://www.renewablefacts.com/country/turkey
The World Wind Energy Association (WWEA), 2013: 2012 Annual Report.
Available at: [http://www.wwindea.org/webimages/WorldWindEnergyReport2012_final.pdf
Turkmenistan
INOGATE, 2012: Energy Portal – Energy cooperation between the EU, Eastern Europe, the Caucasus and Central Asia. Available
at: http://www.inogate.org/index.php?option=com_inogate&view=countrysector&id=85&lang=en
Renewable Facts, 2014. Available at: http://www.renewablefacts.com/country/turkmenistan
Ukraine
European Photovoltaic Industry Association (EPIA), 2013: Global Market Outlook For Photovoltaics 2013-2017. Available at:
[http://www.epia.org/index.php?eID=tx_nawsecuredl&u=0&file=/uploads/tx_epiapublications/GMO_2013_-
_Final_PDF_01.pdf&t=1371545969&hash=b8a6b70a25a6f556f849eef7de6b2b44033e143a]
Institute for Renewable Energy at NAS of Ukraine, 2012: Development or renewable energy in Ukraine as a contribution to
environmental stability in Europe and development of new models of cooperation in energy sector. Presented at the 21st OSCE
Economic And Environmental Forum first Preparatory meeting. Available at: http://www.osce.org/eea/99193
Renewable Facts, 2014. Available at: http://www.renewablefacts.com/country/ukraine
Uzbekistan
UNDP, 2007: The Outlook for Development of Renewable Energy in Uzbekistan. Available at:
http://www.undp.uz/en/publications/publication.php?id=79 The American Uzbekistan Chamber of Commerce (AUCC), 2012: Uzbekistan starts construction of new hydro power station.
Available at: http://www.aucconline.com/news.php?news_id=319
The Governmental Portal of the Republic of Uzbekistan, 2010: Wind Energy Plant Built in Tashkent Region. Available at:
http://www.gov.uz/en/press/economics/5442
Renewable Facts, 2014. Available at: http://www.renewablefacts.com/country/uzbekistan

Annex 14: Renewable Energy – Potential for renewable energy in thousands of MW by type
of technology
Table A14.1: Renewable Energy Potential
Region Country Potential in MW Total
Potential
(MW) Biomass Solar Wind SHPP Geothermal
WESTERN
BALKANS
AND
TURKEY
Albania 423 26,155 2,000 4,500 n/a 33,078
Bosnia and
Herzegovina 600 48,682 2,000 571 6 51,859
Croatia 1,490 53,416 6,900 177 n/a. 61,983
Kosovo n/a. 10,392 n/a. n/a n/a 10,392
Montenegro 578 12,839 400 232 n/a 14,049
Serbia 5,438 83,485 390 4,514 0.1 93,828
fYR Macedonia 462 24,074 375 225 n/a 25,136
Turkey 15,995 3,871,472
114,17
3 6,849 1,500 4,009,989
WESTERN
CIS
Belarus 2,399 282,844 96,757 297 n/a 382,297
Ukraine 24,481 807,537 26,793 1,963 14,855 875,629
Moldova 800 45,796 2,733 251 n/a 49,580
Russian Federation 55,984 22,828,364 39,048
35,16
0 3,000 22,961,556
CAUCASUS
Armenia n/a 39,699 495 305 n/a 40,499
Azerbaijan 1,500 115,220 4,500 350 800 122,370
Georgia 1,719 96,865 2,300 4,452 n/a 105,336
CENTRAL
ASIA
Kazakhstan 320 3,763,218
354,00
0 4,795 n/a 4,122,333
Kyrgyzstan 179 267,358 1,500 1,826 15 270,878
Tajikistan 275 195,096 2,000
22,83
1 n/a 220,202
Turkmenistan n/a 655,054 10,000 1,324 6,600 672,978
Uzbekistan 800 592,982 1,562 1,826 304 597,474
ECIS Region 113,443
33,820,54
8
667,92
6
92,44
8 27,081 34,721,447
Annex 14 is based on data accessed from the following sites:
World Bank, 2011. World development indicators: Land area (sq. km) <available online at:
http://data.worldbank.org/indicator/AG.LND.TOTL.K2>
Energy Information Administration (EIA), 2011. Electric Power Annual 2009. Assistant Administrator for Energy Statistics. Office of Electricity,
Renewables, and Uranium Statistics, U.S. Department of Energy. Washington – US.
Reference for solar energy
The technical solar potential is estimated by using Hoogwijk & Graus (2008) and Hoogwijk (2004) average land use factors for centralised solar
PV installations and JRC’s (2011) assumption that 1 KW installed capacity requires a surface 6.6 m². This equalises an average conversion
efficiency factor of about 16%.
Due to illustrative reasons the technical solar PV potential for the Russian Federation is cut at 5,000 GW. However it is around 22,000 GW.

Albania
Biomass: Karaj, S., Rehl, T., Leis, H., Muller, J. 2009. Analysis of biomass residues potential for electrical energy generation in Albania.
Universita¨t Hohenheim, Institute of Agricultural Engineering (440e), Garbenstr. 9, 70599 Stuttgart, Germany. Renewable and Sustainable
Energy Reviews, ELSEVIER.
Wind: Albania Energy Association (AEA), 2012: Renewable Energy Resources and Energy Efficiency in Albania, available at: <http://aea-
al.org/wp-content/uploads/2012/04/RENEWABLE-ENERGY-ALBANIA.pdf>
SHPP: WBC-INCO, 2012: National background report on Energy for Albania. Available at:
<http://wbc-inco.net/attach/WBC-INCO.net_AL-Report_Energy_2012_v02.pdf>
Armenia
Wind: Armenia Renewable Resources and Energy Efficiency Fund (R2E2) and The GEF, 2008: Wind Power Development in Armenia. Available
at: <http://r2e2.am/wp-content/uploads/Windpower_in_Armenia.pdf>
SHPP: Danish Energy Management A/S, 2011: Renewable Energy Roadmap for Armenia. Available at:
<http://reweek.am/UserFiles/45567aaef3822f38dfd12365719112eeRenewable%20Energy%20Roadmap%20for%20Armenia.pdf>
Azerbaijan
Biomass, wind, Geothermal and SHPP: United Nations Development Programme (UNDP), 2013. Sustainable Energy for All Regional
Questionnaire on Renewable Energy, Azerbaijan
Belarus
Biomass: European Bank for Reconstruction and Development, 2002: Renewable Energy Resource Assessment - Renewable Energy Country
Profile Belarus. Available at:
<http://ws2-23.myloadspring.com/sites/renew/Shared%20Documents/Country%20Notes/old%20website%20country%20profiles/Belarus.pdf>
Wind and SHPP: Raslavicius, L., 2012: Renewable Energy Sector in Belarus – A review, in: Renewable and Sustainable Energy Reviews (16): 5399-
5413.
Bosnia and Herzegovina
Biomass: Energy Charter Secretariat (ECS), 2012: In-Depth Review of Energy Efficiency Policy and Programmes – Bosnia And Herzegovina.
Available at: http://www.encharter.org/fileadmin/user_upload/Publications/BiH_EE_2012_ENG.pdf
Wind and SHPP: Karakosta, C., Flouri, M., Dimopoulou, S. and J. Psarras, 2012: Analysis of renewable energy progress in the western Balkan
countries: Bosnia–Herzegovina and Serbia. In: Renewable and Sustainable Energy Reviews, 16: 5166-5175
Geothermal: Karakosta, C., Flouri, M., Dimopoulou, S. and Psarras, J. Analysis of renewable energy progress in the western Balkan countries:
Bosnia–Herzegovina and Serbia. Renewable and Sustainable Energy Reviews 16 (2012) 5166–5175. ELSEVIER.
Croatia
Biomass and SHPP: Lalic, D., Popowski, K., Gecevska, V., Vasilevska, S. P., and Z. Tesic 2011: Analysis of the opportunities and challenges for
renewable energy market in the Western Balkan countries. In: Renewable and Sustainable Energy Reviews, 15: 3187-3195.
Wind: Krajacic, G., Drazen, L., Duic, N., Zeljko, M., Arantegui, R. L., Loisel, R., and I. Raguzin, 2013: Analysis of financial mechanisms in support to
new pumped hydropower storage projects in Croatia. In: Applied Energy, 101: 161-171.
Geothermal: Lalic, D., Popovsk, K., Gecevska, V., Popovska, V. and Tesi, Z. Analysis of the opportunities and challenges for renewable energy
market in the Western Balkan countries. Renewable and Sustainable Energy Reviews 15 (2011) 3187– 3195. ELSEVIER.
Georgia
Biomass: USAID, 2008: Renewable Energy Potential in Georgia and the Policy Options for its Utilization. Available at:
http://www.greengeorgia.ge/?q=node/123
Wind and SHPP: Raslavicius, L., 2012: Renewable Energy Sector in Belarus – A review, in: Renewable and Sustainable Energy Reviews (16): 5399-
5413.
Kazakhstan
Biomass: The European Bank for Reconstruction and Development (EBRD), 2009: Kazakhstan – Country Profile. Available at: <http://ws2-
23.myloadspring.com/sites/renew/countries/kazakhstan/profile.aspx>
Wind: UNDP and The Gef, 2012: Transforming on-Grid Renewable Energy Markets – A Review of UNDP-GEF Support for Feed-in Tariffs and
Related Price and Market-Access Instruments. Available at:
http://web.undp.org/gef/document/UNDP_FIT_Port_TransformingREMarkets_15oct2012.pdf
SHPP: Energy Charter Secretariat (ECS), 2013: Investment Climate and Market Structure Review in the Energy Sector of Kazakhstan. Available at:
<http://www.encharter.org/fileadmin/user_upload/Publications/Kazakhstan_ICMS_2013_ENG.pdf>
Kyrgyzstan
Biomass and SHPP: Ministry of Energy of the Kyrgyz Republic, 2010: Development of the Renewable Energy Sector in the Kyrgyz Republic.
Available at: http://www.unece.org/fileadmin/DAM/energy/se/pp/eneff/Astana_EEForum_Sep2010/d2s2_3_Stamaliev.pdf
Wind: The European Bank for Reconstruction and Development (EBRD), 2009: Kyrgyzstan – Country Profile. Available at:
http://ws2-23.myloadspring.com/sites/renew/countries/kyrgyzstan/profile.aspx#solar
fYR Macedonia:

Biomass and SHPP: Lalic, D., Popowski, K., Gecevska, V., Vasilevska, S. P., and Z. Tesic, 2011: Analysis of the opportunities and challenges for
renewable energy market in the Western Balkan countries. In: Renewable and Sustainable Energy Reviews, 15: 3187-3195.
Wind: Government of the Republic of Macedonia, 2010: The strategy for renewable energy resources exploitation up to 2020. Available at:
http://www.uncsd2012.org/content/documents/677Strategy_for_utilization_RES_Macedonia.pdf
Moldova
Biomass and Wind: Republic of Moldavia, 2011: Energy policy of Republic of Moldova. Available at: http://eneken.ieej.or.jp/data/3923.pdf
SHPP: United Nations Economic Commission for Europe (UNECE) Energy Efficiency 21 Programme, 2009: Republic of Moldova – Energy Profile.
Available at: http://energyeficiency.clima.md/public/files/EnergyProfileMoldova.pdf
Montenegro:
Biomass: Kovacevic, I., 2010: Renewable Energy Sources in Montenegro. Available at: http://www.energy-
community.org/pls/portal/docs/566194.PDF
Wind: Republic of Moldavia, 2011: Energy policy of Republic of Moldova. Available at: http://eneken.ieej.or.jp/data/3923.pdf
SHPP: United Nations Development Programme, 2012. Montenegro in the context of Sustainable Energy for All Initiative: Rapid Assessment and
Gap Analysis.
Russian Federation:
Biomass, Wind and SHPP: The European Bank for Reconstruction and Development (EBRD), 2009: Russia – Country Profile available at:
http://www.ebrdrenewables.com/sites/renew/countries/Russia/default.aspx
Serbia:
Biomass, Wind and SHPP: Republic of Serbia, 2013: National Renewable Energy Action plan of the Republic of Serbia. Available at:
http://www.energy-community.org/pls/portal/docs/2144185.PDF
All energies: Karakosta, C., Flouri, M., Dimopoulou, S. and Psarras, J. Analysis of renewable energy progress in the western Balkan countries:
Bosnia–Herzegovina and Serbia. Renewable and Sustainable Energy Reviews 16 (2012) 5166–5175. ELSEVIER.
Tajikistan:
Biomas: Doukas, H., Marinakis, V., Karakosta, C., and J. Psarras, 2012: Promoting Renewables in the energy sector of Tajikistan. In: Renewable
Energy, 39: 411-418.
Wind: The European Bank for Reconstruction and Development (EBRD), 2009: Tajikistan – Country Profile. Available at: http://ws2-
23.myloadspring.com/sites/renew/countries/tajikistan/profile.aspx
SHPP: Eurasian Development Bank (EBD), 2011: Small Hydropower in the CIS – Current Status and Development Prospects. Available at:
http://www.eabr.org/general//upload/reports/full%20version_14.pdf
Turkey
Biomass and SHPP: Benli, H. 2013: Potential of renewable energy in electrical energy production and sustainable energy development of
Turkey: Performance and policies. In: Renewable Energy, 50: 33-46.
Wind and SHPP: Baris, K., and S. Kucukali, 2012: Availability of renewable energy sources in Turkey: Current situation, potential, government
policies and the EU perspective. In: Energy Policy, 42: 377-391
Turkmenistan:
Wind: Deutsche Gesellschaft für Technische Zusammenarbeit (GTZ), 2009: Country Chapter – Republic of Turkmenistan. Available at:
http://www.giz.de/Themen/en/dokumente/gtz2009-en-regionalreport-turkmenistan.pdf
SHPP: Food and Agriculture Organization of the United Nations (FAO), 2012: Aquastat – Turkmenistan Country Profile. Available at:
http://www.fao.org/nr/water/aquastat/countries_regions/TKM/index.stm.
Geothermal: Deutsche Gesellschaft für Technische Zusammenarbeit (GTZ), 2009. Country Chapter: Republic of Turkmenistan. Department
Water, Energy, Transport Dag-Hammarskjöld-Weg 1-5. Eschborn, Germany
Ukraine:
Biomass, Wind and SHPP: Institute for Renewable Energy at NAS of Ukraine, 2013: Development or renewable energy in Ukraine as a
contribution to environmental stability in Europe and development of new models of cooperation in energy sector. Presented at the 21st OSCE
Economic And Environmental Forum First Preparatory meeting. Available at: http://www.osce.org/eea/99193.
Uzbekistan:
Biomass: Center for Economic Research (CER), 2011: Renewable Energy Potential. Available at:
http://www.cer.uz/upload/iblock/b28/pb_2011_03_energiy.pdf.
Wind: UNDP, 2007: The Outlook for Development of Renewable Energy in Uzbekistan. Available at:
http://www.undp.uz/en/publications/publication.php?id=79
SHPP: Deutsche Gesellschaft für Technische Zusammenarbeit (GTZ), 2009: Country Chapter – Republic of Uzbekistan. Available at:
http://www.giz.de/Themen/en/dokumente/gtz2009-en-regionalreport-uzbekistan.pdf

Annex 15: Renewable Energy - RES Policy instruments in the ECIS Region
Albania
International Energy Agency (IEA), 2013. Law 053-2012 on general regulation of the electricity sub sector. Policy
and measurements: Renewable energy, 2013.
Republic of Albania, 2013: Law No. 138/2013 On Renewable Energy Sources.
Renewable Energy Policy Network for the 21th Century (Ren21), 2013: Renewables Interactive Map Renewables
Policy Table: Renewable Energy Promotion Policies. <Available online at:
http://www.map.ren21.net/pdf/renewablepolicytable.aspx>
Armenia
Ministry of Energy and Natural Resources. The Action Plan of the Government of Republic of Armenia Aimed at the
Implementation of the National Program on Energy Saving and Renewable Energy of Republic of Armenia.
Ministry of Energy and Natural Resources, 2007. National Program on Energy Saving and Renewable Energy of
Republic of Armenia. <Available online at
http://www.minenergy.am/images/stories/documents/national__program_english.pdf>
Ministry of Energy and Natural Resources, 2004. The Law of the Republic of Armenia on Energy Saving And
Renewable Energy. <Available online at:
http://www.parliament.am/legislation.php?sel=show&ID=2119&lang=eng>
UNDP and The GEF, 2012: Armenia: Situational analysis and assessment in the context of Sustainable Energy for All
Initiative: Rapid Assessment – 2012. <Available online at: http://www.nature-
ic.am/res/Third%20National%20Communication/WEB/SE4ALL%20Armenia_Report%20_ENG_.pdf>
Azerbaijan
Energy Charter Secretariat (ECS), 2013: In-Depth Review of the Energy Efficiency Policy of Azerbaijan. <Available
online at:
http://www.encharter.org/fileadmin/user_upload/Publications/Azerbaijan_EE_2013_ENG.pdf>
INOGATE, 2012. Status report 2011: An Energy Review of the Inogate Partner Countries. Brussels, Belgium.
<Available online at: http://www.inogate.org/media/documents/INOGATE%20Status%20Report%20EN.pdf>
Ministry of Industry and Energy, 2010. Rules of Issuing Special Permission to Activity Concerning Alternative and
Renewable Energy Source.
Ministry of Industry and Energy of the Republic of Azerbaijan, 2004. The State Program on Use of Alternative and
Renewable Energy Sources. <Available online at: http://www.carecprogram.org/uploads/docs/AZE-Renewable-
Energy-Strategy-en.pdf>
Belarus
Council of Ministers of Belarus, 2011. National Energy Saving Programme 2011-2015. <Available online at:
http://www.pravo.by/main.aspx?guid=3871&p0=C21001882&p2={NRPA}>
Economy Committee of Minsk, 2007. Hydropower and wind development programme - Minsk Oblast. <Available
online at: http://law.by/work/EnglPortal.nsf/0/959590399A7CC2BCC225734000457E6F?OpenDocument>
European Bank for Reconstruction and Development, 2002: Renewable Energy Resource Assessment - Renewable
Energy Country Profile Belarus. <Available online at:

http://ws2-
23.myloadspring.com/sites/renew/Shared%20Documents/Country%20Notes/old%20website%20country%20profile
s/Belarus.pdf>
Ministry of Economy of Belarus, 2011. Resolution on Feed-in Tariffs for electricity generated from renewable energy
sources.
Bosnia and Herzegovina
Government of Federation BiH, 2011. Regulation amending regulation on use of renewable energy and co-
generation <Available online at: http://www.fbihvlada.gov.ba/bosanski/zakoni/2011/uredbe/11hrv.html>
International Energy Agency (IEA), 2012. Decision on the amount of the fee to encourage electricity generation
from renewable energy sources and efficient co-generation, Republic of Srpska. Policy and measurements:
Renewable energy, 2013.
Renewable Energy Policy Network for the 21th Century (Ren21), 2013: Renewables Interactive Map Renewables
Policy Table: Renewable Energy Promotion Policies. <Available online at:
http://www.map.ren21.net/pdf/renewablepolicytable.aspx>
Croatia
Renewable Energy Policy Network for the 21th Century (Ren21), 2013: Renewables Interactive Map Renewables
Policy Table: Renewable Energy Promotion Policies. <Available online at:
http://www.map.ren21.net/pdf/renewablepolicytable.aspx>
The Government of the Republic of Croatia, 2012: The Tariff System for Electricity Production from Renewable
Energy Sources and CHP. <Available online at:
http://narodne-novine.nn.hr/clanci/sluzbeni/2012_06_63_1508.html>
The Government of the Republic of Croatia, 2007. Regulation on Incentive Fees to Promote Electricity Production
from RES and cogeneration. Pursuant to Article 28, paragraph 3 of the Energy Act (Official Gazette 68/2001 and
177/2004). <Available online at: http://releel.mingorp.hr/UserDocsImages/2_Incentives_for_RES_CHP_33_07.pdf>
The Republic of Croatia Ministry of Economy, Labour and Entrepreneurship, 2009. Energy Strategy of The Republic
Of Croatia. Zagreb, Croatia
Georgia
Energy Charter Secretariat, 2012. In-Depth Review of Energy Efficiency Policies and Programmes: Georgia. Brussels,
Belgium. <Available online at:
http://www.encharter.org/fileadmin/user_upload/Publications/Georgia_EE_2012_ENG.pdf>
INOGATE, 2012. Status report 2011: An Energy Review of the Inogate Partner Countries. Brussels, Belgium.
<Available online at: http://www.inogate.org/media/documents/INOGATE%20Status%20Report%20EN.pdf>
Tbilisi, Ivane Javakhishvili, 2011. Renewable Energy in EU – Georgia: Legal and Regulatory Perspective. State
University-Institute of European Studies, Khatuna Didbaridze.
USAID, 2008: Renewable Energy Potential in Georgia and the Policy Options for its Utilization <Available online at:
http://www.greengeorgia.ge/?q=node/123>
Kazakhstan
INOGATE, 2012. Status report 2011: An Energy Review of the Inogate Partner Countries. Brussels, Belgium.
<Available online at: http://www.inogate.org/media/documents/INOGATE%20Status%20Report%20EN.pdf>

Republic of Kazakhstan, 2012: The Law of the Republic of Kazakhstan on Amending Certain Legislative Acts
Regarding the Improvement of the Regulatory Approval System. Available at:
http://www.mondaq.com/x/179854/Law+On+Amending+Certain+Legislative+Acts+Regarding+Improvement+Of+T
he+Regulatory+Approval+System+Changes+In+Law+On+Architecture+TownPlanning+And+Construction+Activity
Republic of Kazakhstan, 2009: The Law of the Republic of Kazakhstan about support of use of Sources of Energy.
Available at:
http://www.kazembassy.org.uk/img/001%20Law%20of%20the%20RK%20on%20support%20of%20use%20of%20r
enewable%20sources%20of%20energy(1).pdf
Kyrgyzstan
Kyrgyz Republic, 1996: Law on Energy. Available at: http://www.hydroinvest.biz/en/laws-and-regulations/136-
energy-law-kyrgyzstan
Kyrgyz Republic, 2008: Law of the Kyrgyz Republic on Renewable Energy Sources. Available at:
http://www.hydroinvest.biz/en/laws-and-regulations/138-res-law-kyrgyzstan
Kyrgyz Republic, 2008: National Energy Programme, Available at:
http://www.carecprogram.org/uploads/pages/countries/KGZ-National-Energy-Program-2008-2010-en.pdf
fYR Macedonia
Energy Regulatory Commission of the Republic of Macedonia, 2013: Tariffs for Renewable Energy Sources 2013.
<Available online at: http://www.erc.org.mk/pages_en.aspx?id=162>
Government of the Republic of Macedonia, 2010: The strategy for renewable energy resources exploitation up to
2020. <Available online at:
http://www.uncsd2012.org/content/documents/677Strategy_for_utilization_RES_Macedonia.pdf>
Renewable Energy Policy Network for the 21th Century (Ren21), 2013: Renewables Interactive Map Renewables
Policy Table: Renewable Energy Promotion Policies. <Available online at:
http://www.map.ren21.net/pdf/renewablepolicytable.aspx>
See -Change Network (SEECN) c, 2013: Invest in Haste, Repent at Leisure - Are IFIs behaving as if EU accession
criteria and extreme energy losses do not exist in South East Europe. <Available online at:
http://bankwatch.org/sites/default/files/SEE-IFI-energy.pdf>
Moldova
Republic of Moldavia, 2011: Energy policy of Republic of Moldova. <Available online at:
http://eneken.ieej.or.jp/data/3923.pdf>
Renewable Energy Policy Network for the 21th Century (Ren21), 2013: Renewables Interactive Map Renewables
Policy Table: Renewable Energy Promotion Policies. <Available online at:
http://www.map.ren21.net/pdf/renewablepolicytable.aspx>
Montenegro
Regulatory Energy Agency of Montenegro, 2011. Regulatory framework for renewable. <Available online at:
http://www.oie-res.me/index.php?page=zakon-o-energetici>
The Government of Montenegro, 2011. Decree on Tariff Incentives for Renewable Energy and Efficient
Cogeneration. Pursuant to Article 20, Paragraph 2 of the Energy Law (“Official Gazette of
Montenegro”, No. 28/10). <Available online at: http://www.oie-
res.me/uploads/archive/News%202010/E_Decree%20on%20the%20tariff%20system.pdf>

Russian Federation
Ministry of Energy of the Russian Federation, 2010. Energy Strategy of Russia for the Period up to 2030. Approved
by Decree N°1715-r of the Government of the Russian Federation dated 13 November, 2009 – Moscow, Russia
Federation. <Available online at: http://www.energystrategy.ru/projects/docs/ES-2030_(Eng).pdf>
Ministry of Energy of the Russian Federation, 2009. State Policy Guidelines for Promoting Renewable Energy in the
Power Sector.
Renewable Energy Policy Network for the 21th Century (Ren21), 2013: Renewables Interactive Map Renewables
Policy Table: Renewable Energy Promotion Policies. <Available online at:
http://www.map.ren21.net/pdf/renewablepolicytable.aspx>
Serbia
Ministry of Infrastructure and Energy, 2009. Feed-in tariffs for renewable energy sources and combined heat and
power generation. <Available online at: http://www.ssl-
link.com/mre/cms/mestoZaUploadFajlove/Decree_on_feed_in_tariffs_-_OJ_99-2009.pdf>
Republic of Serbia, 2013: National Renewable Energy Action plan of the Republic of Serbia. <Available online at:
http://www.energy-community.org/pls/portal/docs/2144185.PDF>
Renewable Energy Policy Network for the 21th Century (Ren21), 2013: Renewables Interactive Map Renewables
Policy Table: Renewable Energy Promotion Policies. <Available online at:
http://www.map.ren21.net/pdf/renewablepolicytable.aspx>
Serbian Energy Agency (AERS), 2013: Decree on incentive measures for privileged power producers. <Available
online at:
http://www.aers.rs/FILES/OIE/Eng/2013-02-
02%20Decree%20on%20Incentive%20Measures%20for%20Privileged%20Power%20Producers.pdf>
Tesic, M., Kiss, F., and Z. Zavargo, 2011: Renewable energy policy in the Republic of Serbia. In: Renewable and
Sustainable Energy Reviews, 15: 752-758.
Tajikistan
The European Bank for Reconstruction and Development (EBRD), 2009: Tajikistan – Country Profile. Available at:
http://ws2-23.myloadspring.com/sites/renew/countries/tajikistan/profile.aspx
UNDP, 2012: Sustainable Energy For All –Tajikistan Rapid Assessment and Gap Analysis. Available at:
http://www.undp.tj/files/reports/SE4ALL_TAJ_Rapid_Assessment_Final_English.pdf
Turkmenistan
Renewable Energy Policy Network for the 21th Century (Ren21), 2013: Renewables 2013 Global Status Report.
Available at:
http://www.ren21.net/REN21Activities/GlobalStatusReport.aspx
Turkey
Benli, H. 2013: Potential of renewable energy in electrical energy production and sustainable energy development
of Turkey: Performance and policies. In: Renewable Energy, 50: 33-46.
KPMG International Cooperative, 2012. Taxes and incentives for renewable energy. <Available online at:
http://www.kpmg.com/Global/en/IssuesAndInsights/ArticlesPublications/Documents/taxes-incentives-renewable-
energy-2012v3.pdf>

The Republic of Turkey Prime Ministry Investment Support and Promotion Agency, 2005. LawNo.6094: Law on
Amendments on the Law on Utilization of Renewable Energy: Resources for the Purpose of Generating Electrical
Energy. Turkey. <Available online at: http://www.invest.gov.tr/en-
US/infocenter/publications/Documents/RENEWABLE.ENERGY.pdf>
Renewable energy policy database and support (ResLegal), 2013: An initiative of the European Commission –
Turkey. <Available online at: http://www.res-legal.eu>
Renewable Energy Policy Network for the 21th Century (Ren21), 2013: Renewables Interactive Map Renewables
Policy Table: Renewable Energy Promotion Policies. <Available online at:
http://www.map.ren21.net/pdf/renewablepolicytable.aspx>
Republic of Turkey, 2005: Law on Utilization of RES for the Purpose of Generating Electrical Energy <Available
online at: http://www.eie.gov.tr/eie-
web/english/announcements/YEK_kanunu/LawonRenewableEnergyReources.pdf>
Republic of Turkey, 2002: Electricity Market Licensing Regulation. <Available online at:
http://www.ongurergan.av.tr/en-EN/mevzuat/Electric%20Market%20Licensing%20Regulation.doc>
Turkish Electricity Transmission Company (TEIAS), 2013: Turkish Electricity Production Planning Study (2005-2020).
<Available online at: http://www.teias.gov.tr/Eng/apkuretimplani/veriler.htm#_Toc86219420>
Ukraine
International Energy Agency (IEA), 2005. Law on Combined Heat and Power (cogeneration) and Waste Energy
Potential in Ukraine. <Available online at:
http://www.iea.org/policiesandmeasures/pams/ukraine/name,38647,en.php>
Ministry of Fuel and Energy, 2003. Law on Alternative Energy Sources. <Available online at:
http://zakon1.rada.gov.ua/laws/show/555-15>
OECD, 2012: Private Sector Development Policy Handbook - Attracting Investment in Renewable Energy in Ukraine.
<Available online at: http://www.oecd.org/countries/ukraine/UkraineRenewableEnergy.pdf>
Renewable Energy Policy Network for the 21th Century (Ren21), 2013: Renewables Interactive Map Renewables
Policy Table: Renewable Energy Promotion Policies. <Available online at:
http://www.map.ren21.net/pdf/renewablepolicytable.aspx>
Uzbekistan
Republic of Uzbekistan, 1997: Law on the Rational Use of Renewable Energy Source, Available at:
http://www.unescap.org/esd/publications/energy/compend/ceccpart4chapter12.htm#3 Economic

Annex 16: Renewable Energy - RES Policy instruments in the ECIS Region Indicator Definition
Capital subsidy, grant, or
rebate
One-time payments by the government to
cover a percentage of the capital cost of an
investment.
Tax incentives
Includes all tax incentives such as: investment
tax credits, production tax credits or
reductions in sales, energy, carbon, excise,
VAT, etc.
Public competitive
bidding
Tendering system for contracts to construct
and operate a particular project, or a fixed
quantity of renewable capacity in a country or
state.
Public investment, loans
or financing
Provides infrastructure projects and use of
public benefits, funds, loans etc.
Feed-in-tariff
Set a fixed, guaranteed rate that power
producers will be paid through a standard PPA
for every kWh fed into the grid and usually
guarantees grid access to RE generators.
Electric utility quota
obligation/ RPS
Generally called Renewable Portfolio Standard
(RPS), renewables obligations or quota
policies. A standard requiring that a minimum
percentage of generation sold or capacity
installed be provided by renewable energy.
Obligated utilities are required to ensure that
the target is met.
Tradable renewable
Certificates provide a tool for trading and
meeting renewable energy obligations among
consumers and/or producers, and also a
means for voluntary green power purchases.
They operate by offering 'green certificates'
for every kWh or MWh generated by a
renewable producer. The value of these
certificates, which can be traded on a market,
is added to the basic payment for the
renewably generated electricity.
Law in renewable energy
The “Law on renewable energy” is considered
a specific legislation such as legally binding
targets for RE, defined feed-in-tariffs for RES,
preferential grid-access for RES or as part of
other legislation on energy.
Source: Author’s creation.

Annex 17: Renewable Energy – Renewable Energy Targets
Annex 17 is based on data accessed from the following sites:
Albania, Bosnia and Herzegovina, Croatia, Former Yugoslav Republic of Macedonia, Moldova, Montenegro, Serbia, Ukraine and Kosovo:
Energy Community (EC), 2012: Energy Community Ministerial Council adopts Renewable Energy 2020 targets. <Available online at:
http://www.energy-community.org/portal/page/portal/ENC_HOME/NEWS/News_Details?p_new_id=6342>
Belarus:
Republic of Belarus, 2013. In-Depth Review of the Energy Efficiency Policy of THE REPUBLIC OF BELARUS. Available online at <
http://www.encharter.org/fileadmin/user_upload/Publications/Belarus_EE_2013_ENG.pdf>
Kazakhstan:
United Nations Development Programme (UNDP), 2013. Sustainable Energy for All Regional Questionnaire on Renewable Energy, Kazakhstan.
Programme for Energy Generation Development of RK , 2010-2014. (http://www.mint.gov.kz/)
Turkey:
Republic of Turkey Prime Ministry Undersecretariat of State Planning Organization, 2009. Electricity Energy Market and Supply Security Strategy
Paper. Secretariat of the Higher Board of Planning. <Available online at:
http://www.enerji.gov.tr/yayinlar_raporlar_EN/Arz_Guvenligi_Strateji_Belgesi_EN.pdf>
Azerbaijan:
Renewable Energy Target of Azerbaijan, 2011. Available at:
http://www.abemda.az/uploads/ABEMDA%20prezintation.pdf
Russian Federation:
International Financial Corporation, 2011, Renewable Energy Policy in Russia -Waking the Green Giant. Russia Renewable Energy Programm and
The GEF.

Annex 18: Renewable Energy – Evolution of renewable energy in the ECIS Region
Table A18.1: Evolution of renewable energy between 2000 and 2010 and the component annual growth
Source: IEA (2010).
Sub-region Hydroelectricity Solar Wind Geothermal Biomass
2000 2010 CAGR 2000 2010 CAGR 2000 2010 CAGR 2000 2010 CAGR 2000 2010 CAGR
WB and Turkey 214,638 324,238 4.2% 11,011 18,582 5.4% 119 11,000 57.3% 28,618 83,309 11.3% 348,265 269,666 -2.5%
WCIS 40,900 47,802 1.6% 0 0 0.0% 22 184 23.9% 0 0 0.0% 47,551 124,599 10.1%
Caucasus 31,164 55,338 5.9% 0 0 0.0% 0 29 0.0% 250 0 -100% 27,051 15,070 -5.7%
Central Asia 148,069 162,173 0.9% 0 0 0.0% 0 0 0.0% 0 0 0.0% 3,228 2,270 -3.5%
Russia 590,784 599,447 0.1% 0 0 0.0% 7 14 7.2% 0 17,988 0.0% 163,082 123,423 -2.7%
ECIS Region 1,025,555 1,188,999 1.5% 11,011 18,582 5.4% 148 11,227 54.2% 28,867 101,297 13.4% 589,177 535,028 -1.0%
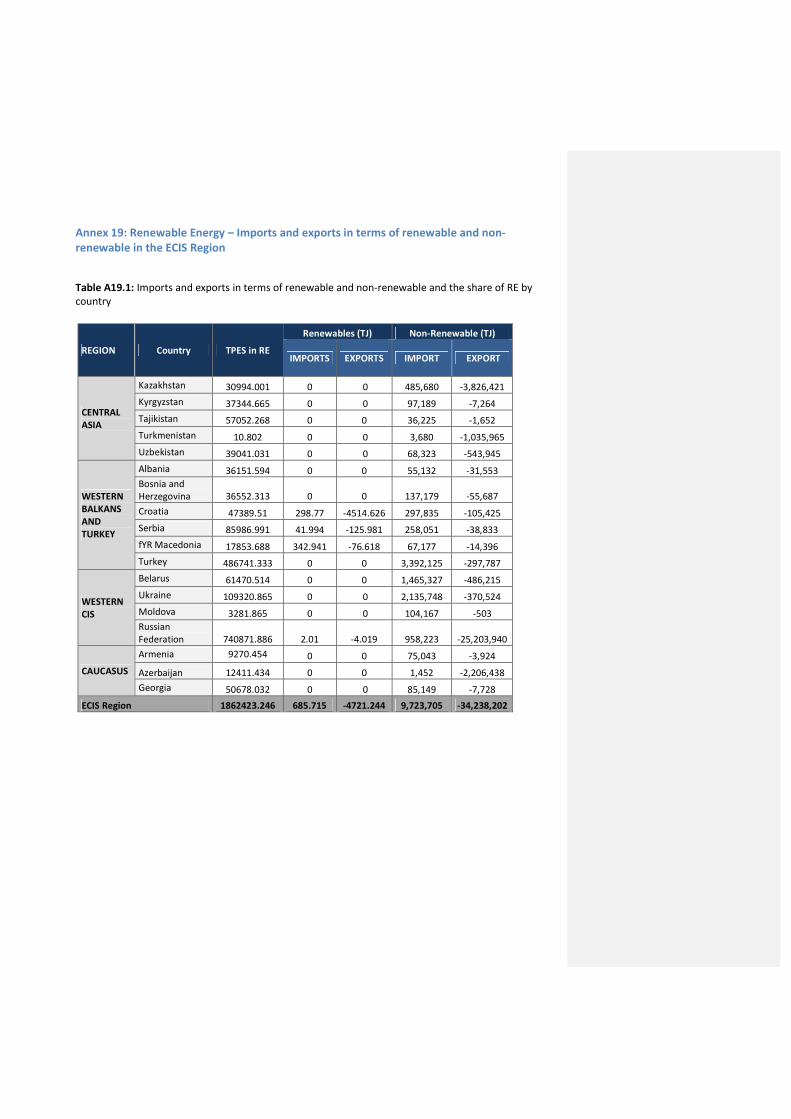
Annex 19: Renewable Energy – Imports and exports in terms of renewable and non-
renewable in the ECIS Region
Table A19.1: Imports and exports in terms of renewable and non-renewable and the share of RE by
country
REGION Country TPES in RE
Renewables (TJ) Non-Renewable (TJ)
IMPORTS EXPORTS IMPORT EXPORT
CENTRAL
ASIA
Kazakhstan 30994.001 0 0 485,680 -3,826,421
Kyrgyzstan 37344.665 0 0 97,189 -7,264
Tajikistan 57052.268 0 0 36,225 -1,652
Turkmenistan 10.802 0 0 3,680 -1,035,965
Uzbekistan 39041.031 0 0 68,323 -543,945
WESTERN
BALKANS
AND
TURKEY
Albania 36151.594 0 0 55,132 -31,553
Bosnia and
Herzegovina 36552.313 0 0 137,179 -55,687
Croatia 47389.51 298.77 -4514.626 297,835 -105,425
Serbia 85986.991 41.994 -125.981 258,051 -38,833
fYR Macedonia 17853.688 342.941 -76.618 67,177 -14,396
Turkey 486741.333 0 0 3,392,125 -297,787
WESTERN
CIS
Belarus 61470.514 0 0 1,465,327 -486,215
Ukraine 109320.865 0 0 2,135,748 -370,524
Moldova 3281.865 0 0 104,167 -503
Russian
Federation 740871.886 2.01 -4.019 958,223 -25,203,940
CAUCASUS
Armenia 9270.454 0 0 75,043 -3,924
Azerbaijan 12411.434 0 0 1,452 -2,206,438
Georgia 50678.032 0 0 85,149 -7,728
ECIS Region 1862423.246 685.715 -4721.244 9,723,705 -34,238,202

Source: IEA (2010)
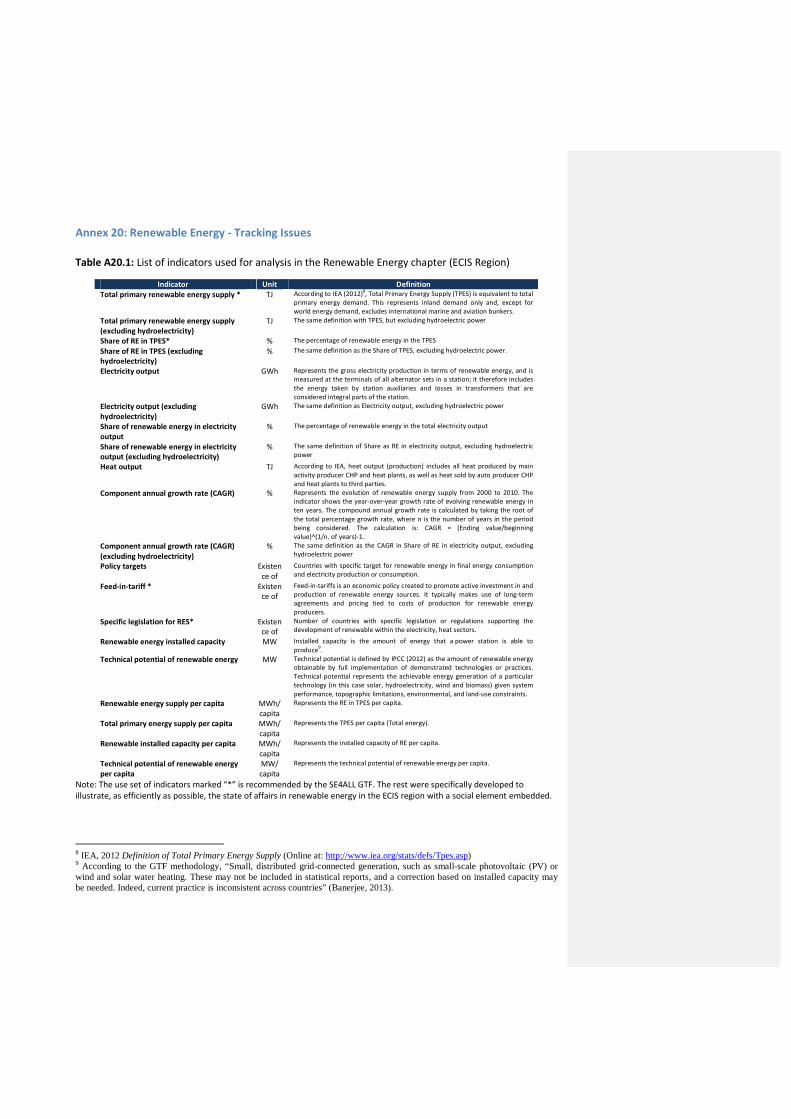
Annex 20: Renewable Energy - Tracking Issues
Table A20.1: List of indicators used for analysis in the Renewable Energy chapter (ECIS Region)
Indicator Unit Definition
Total primary renewable energy supply * TJ According to IEA (2012)8, Total Primary Energy Supply (TPES) is equivalent to total
primary energy demand. This represents inland demand only and, except for
world energy demand, excludes international marine and aviation bunkers.
Total primary renewable energy supply
(excluding hydroelectricity)
TJ The same definition with TPES, but excluding hydroelectric power
Share of RE in TPES* % The percentage of renewable energy in the TPES
Share of RE in TPES (excluding
hydroelectricity)
% The same definition as the Share of TPES, excluding hydroelectric power.
Electricity output GWh Represents the gross electricity production in terms of renewable energy, and is
measured at the terminals of all alternator sets in a station; it therefore includes
the energy taken by station auxiliaries and losses in transformers that are
considered integral parts of the station.
Electricity output (excluding
hydroelectricity)
GWh The same definition as Electricity output, excluding hydroelectric power
Share of renewable energy in electricity
output
% The percentage of renewable energy in the total electricity output
Share of renewable energy in electricity
output (excluding hydroelectricity)
% The same definition of Share as RE in electricity output, excluding hydroelectric
power
Heat output TJ According to IEA, heat output (production) includes all heat produced by main
activity producer CHP and heat plants, as well as heat sold by auto producer CHP
and heat plants to third parties.
Component annual growth rate (CAGR) % Represents the evolution of renewable energy supply from 2000 to 2010. The
indicator shows the year-over-year growth rate of evolving renewable energy in
ten years. The compound annual growth rate is calculated by taking the root of
the total percentage growth rate, where n is the number of years in the period
being considered. The calculation is: CAGR = (Ending value/beginning
value)^(1/n. of years)-1.
Component annual growth rate (CAGR)
(excluding hydroelectricity)
% The same definition as the CAGR in Share of RE in electricity output, excluding
hydroelectric power
Policy targets Existen
ce of
Countries with specific target for renewable energy in final energy consumption
and electricity production or consumption.
Feed-in-tariff * Existen
ce of
Feed-in-tariffs is an economic policy created to promote active investment in and
production of renewable energy sources. It typically makes use of long-term
agreements and pricing tied to costs of production for renewable energy
producers.
Specific legislation for RES* Existen
ce of
Number of countries with specific legislation or regulations supporting the
development of renewable within the electricity, heat sectors.
Renewable energy installed capacity MW Installed capacity is the amount of energy that a power station is able to
produce9.
Technical potential of renewable energy MW Technical potential is defined by IPCC (2012) as the amount of renewable energy
obtainable by full implementation of demonstrated technologies or practices.
Technical potential represents the achievable energy generation of a particular
technology (in this case solar, hydroelectricity, wind and biomass) given system
performance, topographic limitations, environmental, and land-use constraints.
Renewable energy supply per capita MWh/
capita
Represents the RE in TPES per capita.
Total primary energy supply per capita MWh/
capita
Represents the TPES per capita (Total energy).
Renewable installed capacity per capita MWh/
capita
Represents the installed capacity of RE per capita.
Technical potential of renewable energy
per capita
MW/
capita
Represents the technical potential of renewable energy per capita.
Note: The use set of indicators marked “*” is recommended by the SE4ALL GTF. The rest were specifically developed to
illustrate, as efficiently as possible, the state of affairs in renewable energy in the ECIS region with a social element embedded.
8 IEA, 2012 Definition of Total Primary Energy Supply (Online at: http://www.iea.org/stats/defs/Tpes.asp) 9 According to the GTF methodology, “Small, distributed grid-connected generation, such as small-scale photovoltaic (PV) or wind and solar water heating. These may not be included in statistical reports, and a correction based on installed capacity may be needed. Indeed, current practice is inconsistent across countries” (Banerjee, 2013).

Table A20.2: List of indicators used for the Renewable Energy chapter (ECIS Region) and the indicators
suggested from the Global Tracking Framework.
Indicator Definition Unit Year Source GTF
10
Situation
Total primary renewable energy
supply (TPES)
According to IEA, Total Primary
Energy Supply is equivalent to
total primary energy demand.
This represents inland demand
only and, except for world energy
demand, excludes international
marine and aviation bunkers.
TJ 2010 IEA X Utilised
Total final energy consumption
(TFEC)
Total Final Energy Consumption
(TFEC) figures heat and electricity
are reported directly in the form
ready for consumption. 11
TJ - IEA X Not utilised
Deployment diversification According to GTF “Number of
countries exceeding threshold
capacity levels for key
technologies, which would
identify only those countries with
a larger absolute and globally
significant level of production
(100 MW)”.
MW 2010 IEA X Utilised
Total primary renewable energy
supply (excluding
hydroelectricity)
The same definition of total
primary energy supply, but
excluding hydroelectricity.
TJ 2010 IEA Utilised
Share of RE in TPES The % of renewable energy in the
total primary energy supply % 2010 IEA X Utilised
Share of RE in TPES (excluding
hydroelectricity)
The same definition of Share of
TPES, but excluding
hydroelectricity of the account.
% 2010 IEA Utilised
Electricity output Represent the gross electricity
production in terms of renewable
energy, and is measured at the
terminals of all alternator sets in
a station; it therefore includes the
energy taken by station auxiliaries
and losses in transformers that
are considered integral parts of
the station.
GWh 2010 IEA X Utilised
Electricity output (excluding
hydroelectricity)
The same definition of Electricity
output, but excluding
hydroelectricity.
GWh 2010 IEA Utilised
Share of renewable energy in
electricity output
The % of renewable energy in the
total electricity output % 2010 IEA Utilised
Share of renewable energy in
electricity output (excluding
hydroelectricity)
The same definition of Share of
RE in electricity output, but
excluding hydroelectricity.
% 2010 IEA Utilised
Heat output According to IEA, heat output
(production) includes all heat
produced by main activity
producer CHP and heat plants, as
well as heat sold by auto
producer CHP and heat plants to
third parties.
TJ 2010 IEA Utilised
Component annual growth rate Represents the evolution of % 2000- IEA Utilised
10 Represents the indicator suggested in the Global Tracking Framework (GTF). 11 According to GTF, advantages of TFC are: heat and electricity in form ready for consumption; closer to useful energy output valued by end-users and better balance for directly produced RE. Disadvantages are: Losses need to be allocated.

(CAGR) renewable energy supply from
2000 to 2010. The indicator
shows the year-over-year growth
rate of evolving renewable
energy in ten years. The
compound annual growth rate is
calculated by taking the root of
the total percentage growth rate,
where n is the number of years in
the period being considered. The
calculation is: CAGR = (Ending
value/beginning value)^(1/n. of
years)-1.
2010
Component annual growth rate
(CAGR) (excluding
hydroelectricity)
The same definition of
Component annual growth rate
(CAGR) Share of RE in electricity
output, but excluding
hydroelectricity.
% 2000-
2010 IEA Utilised
Number of countries with policy
targets
Countries with specific targets for
renewable energy in final energy
consumption and electricity
production or consumption.
- - Many
sources X Utilised
Technology costs Costs of equipment for each
technology - - - X Not available
Total installed project cost Total installed project cost,
including fixed financing costs - - - X Not available
The levelised cost of energy
(LCOE)
The levelised cost of energy
(LCOE) - - - X Not available
Investment on renewable
energy
- - - X Not available
Number of countries with Feed-
in-tariff
Set a fixed, guaranteed rate that
power producers will be paid
through a standard PPA for every
kWh fed into the grid and usually
guarantees grid access to RE
generators.
- - Many
sources Utilised
Number of countries with a
specific legislation for
renewables
Number of countries with specific
legislation or regulations
supporting the development of
renewables within the electricity,
heat sectors.
- - Many
sources X Utilised
Renewable installed capacity
(excluding large hydroelectricity
and including small
hydroelectricity)
Installed capacity is the amount
of energy that a power station is
able to produce.12
MW 2012
Many
sources
Utilised
Renewable installed capacity
(including large hydroelectricity
and excluding small
hydroelectricity)
MW 2012
Renew
able
Facts
Utilised
Technical potential in terms of
renewable energy
Technical potential is defined by
IPCC (2012) as the amount of
renewable energy obtainable by
full implementation of
demonstrated technologies or
practices. Technical potential
represents the achievable energy
generation of a particular
technology (in this case solar,
hydroelectricity, wind and
biomass) given system
performance, topographic
MW 2012 Many
sources
Utilised
12 According to the GTF methodology: “Small, distributed grid-connected generation, such as small-scale photovoltaic (PV) or wind and solar water heating. These may not be included in statistical reports, and a correction based on installed capacity may be needed. Indeed, current practice is inconsistent across countries”.

limitations, environmental, and
land-use constraints
Renewable energy supply per
capita
Represents the RE in TPES per
capita.
kWh/
capita 2010
IEA,
World
Bank
Utilised
Technical potential in terms of
renewable energy per capita
Represents the technical
potential of renewable energy
per capita.
MW/
capita 2000-
2012
World
Bank,
many
sources
Utilised
Source: Authors creation based on (2013)

Annex 21: UNDP - SE4ALL Regional Questionnaire on Renewable Energy (Indicator
Definitions and Units for Renewable Energy)
1. Renewable Energy policy instruments
a. Financial incentives: adoption of fiscal, financial and economic incentives at the country level (please
describe the financial incentive);
b. Regulatory policies in Renewable Energy: specific legislation or regulation supporting the
development of the renewables within the electricity, heat and transport sector (please specify the
legislation);
c. Policy targets (%/year): policy target in renewable energy and level of that target in each country
2. Countries reaching target levels of renewable energy as a proportion (%) of energy demand: If a country
proportion (%) target for renewable energy exists, is this target yet achieved? (yes/no)
3. Technology progress
a. Technology cost (USD):
- Equipments costs (USD): average of equipment cost for each renewable technology;
- Total installed project cost (USD): total installed project cost, including fixed financing costs;
- The levelised costs of electricity – LCOE (USD): is the price of electricity required for a project
where revenue would equal costs.
b. Evolution of renewable energy per technology (GWh/year): The progress of technology for each
renewable in the past of years
4. Investment in Renewable Energy (USD): Total investment in renewable energy from public and private
sector;
5. Potential for Renewable Energy (GWh/year): Potential for renewable energy in terms of hydro, biomass,
solar, geothermal and wind;
6. Information on Bioenergy use: Particularly relating to “traditional biomass13
” Issues with Biomass –
Traditional versus Modern:
a. Biomass used for cooking and heating (GWh/year);
b. Biomass used to produce household electricity more efficiently – via improved cooking and heating
appliances. And if possible, to produce heat efficiently for commercial and industrial needs, as well
as electricity and transport (GWh/year).
13
Traditional solid fuels consisting of: wood, charcoal, coal, dung, crop wastes