sustainable development linking energy and the environment washington u. carbon impact rudolf b....
Post on 19-Dec-2015
214 views
TRANSCRIPT
Sustainable Development
Linking Energy and the Environment
Washington U. Carbon Impact
Rudolf B. Husar & Erin RobinsonDirector, Center for Air Pollution and Trends Analysis (CAPITA)
Professor, Department of Energy, Environmental & Chemical Engineering
EECE Seminar, Friday, November 2, 2007, 11:00am,
Lopata 101, Washington University
Integrative Science and Engineering for‘Grand Challenges’
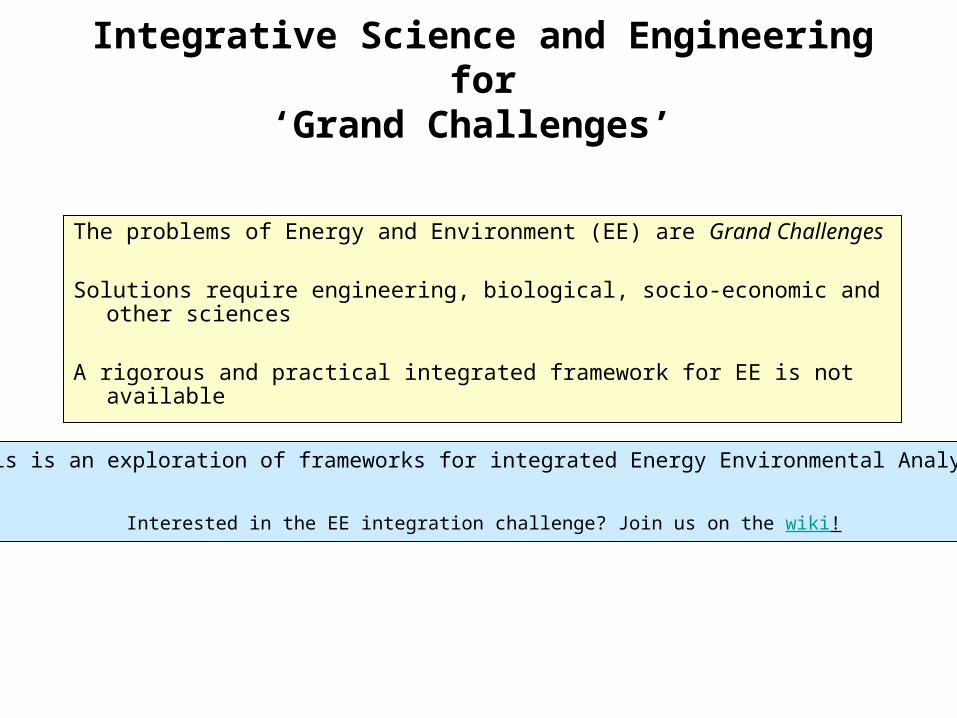
The problems of Energy and Environment (EE) are Grand Challenges
Solutions require engineering, biological, socio-economic and other sciences
A rigorous and practical integrated framework for EE is not available
This is an exploration of frameworks for integrated Energy Environmental Analysis
Interested in the EE integration challenge? Join us on the wiki!
Sustainable Development (SD)
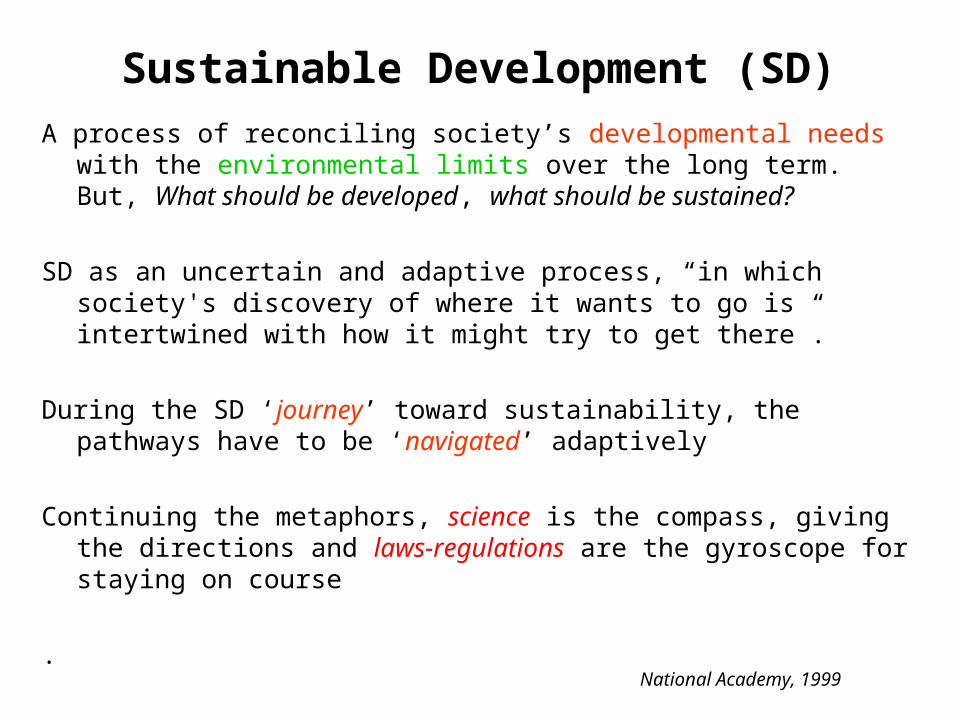
A process of reconciling society’s developmental needs with the environmental limits over the long term. But, What should be developed, what should be sustained?
SD as an uncertain and adaptive process, “in which society's discovery of where it wants to go is intertwined with how it might try to get there”.
During the SD ‘journey’ toward sustainability, the pathways have to be ‘navigated’ adaptively
Continuing the metaphors, science is the compass, giving the directions and laws-regulations are the gyroscope for staying on course
.
National Academy, 1999
Life and non-life on Earth form a combined system (Gaia Theory)
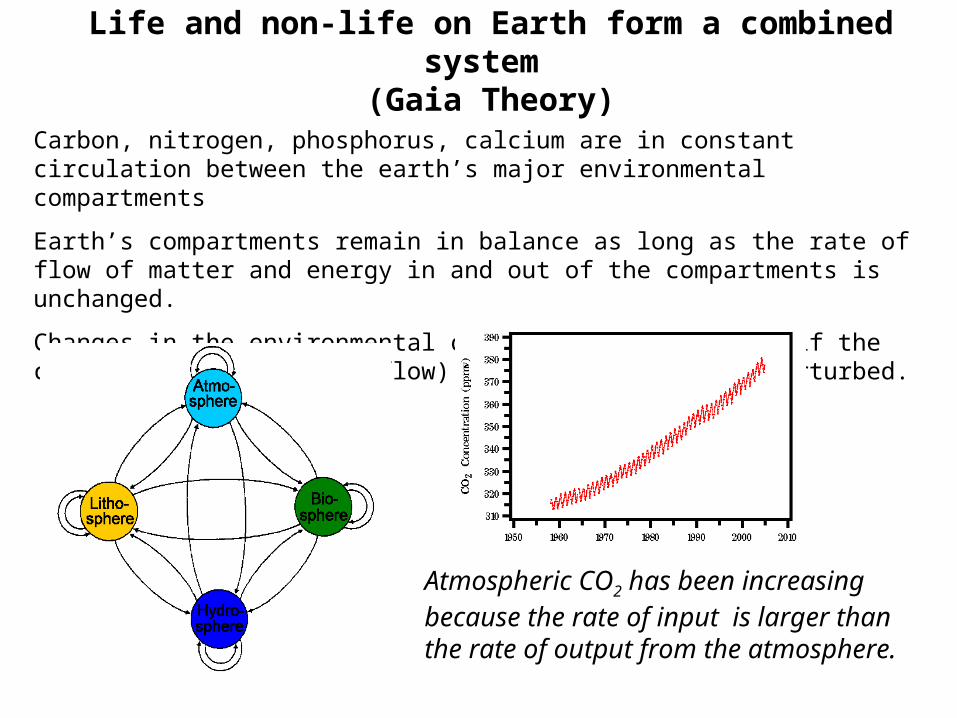
Carbon, nitrogen, phosphorus, calcium are in constant circulation between the earth’s major environmental compartments
Earth’s compartments remain in balance as long as the rate of flow of matter and energy in and out of the compartments is unchanged.
Changes in the environmental compartments will occur if the circulation (in and out flow) of the substances is perturbed.
Atmospheric CO2 has been increasing because the rate of input is larger than the rate of output from the atmosphere.
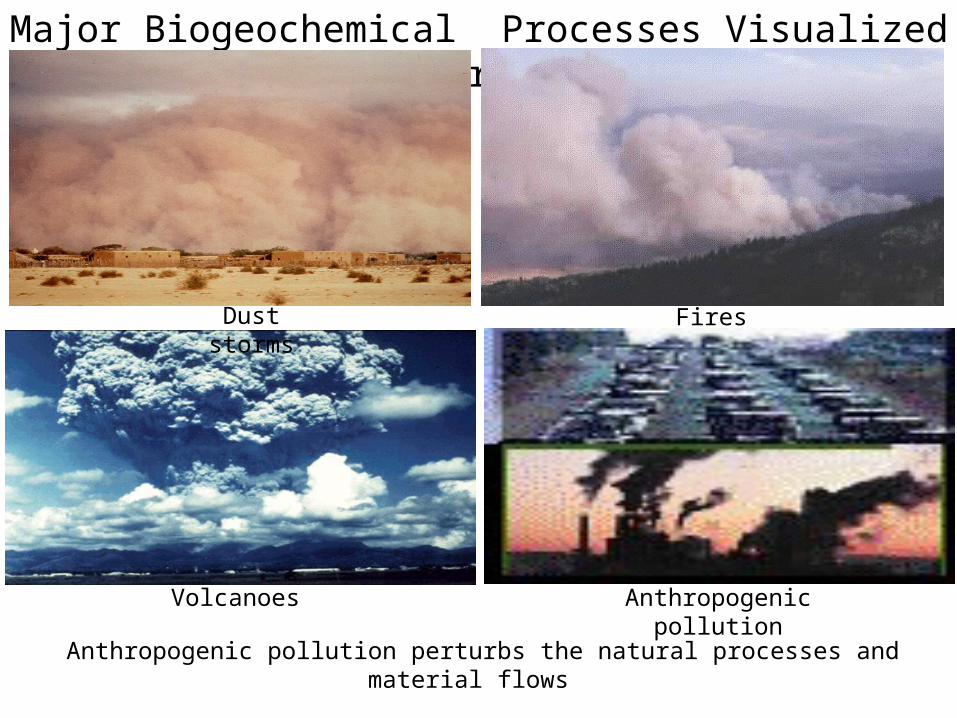
Major Biogeochemical Processes Visualized by Aerosols
Dust storms
Volcanoes Anthropogenic pollution
Fires
Anthropogenic pollution perturbs the natural processes and material flows

Ice extent during the Last Glacial Maximum
Is our climate changing?

Northern Hemisphere Sea Ice Extent
(1979 versus 2003)Image courtesy of NASA-Goddard Space Flight Center
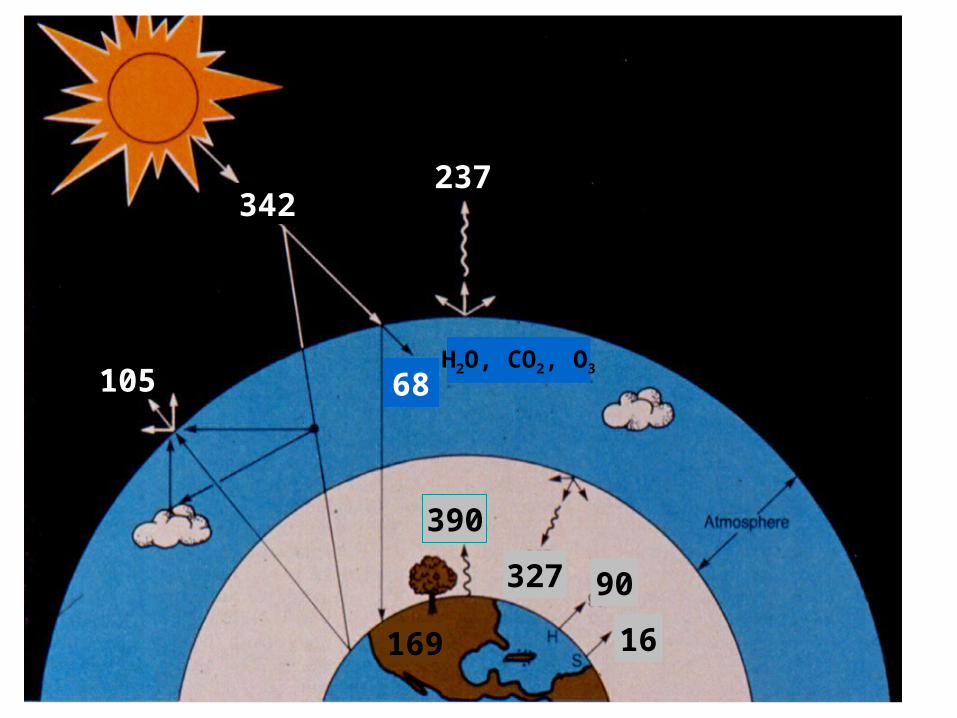
237
105
342
68
169
390
327 90
16
H2O, CO2, O3
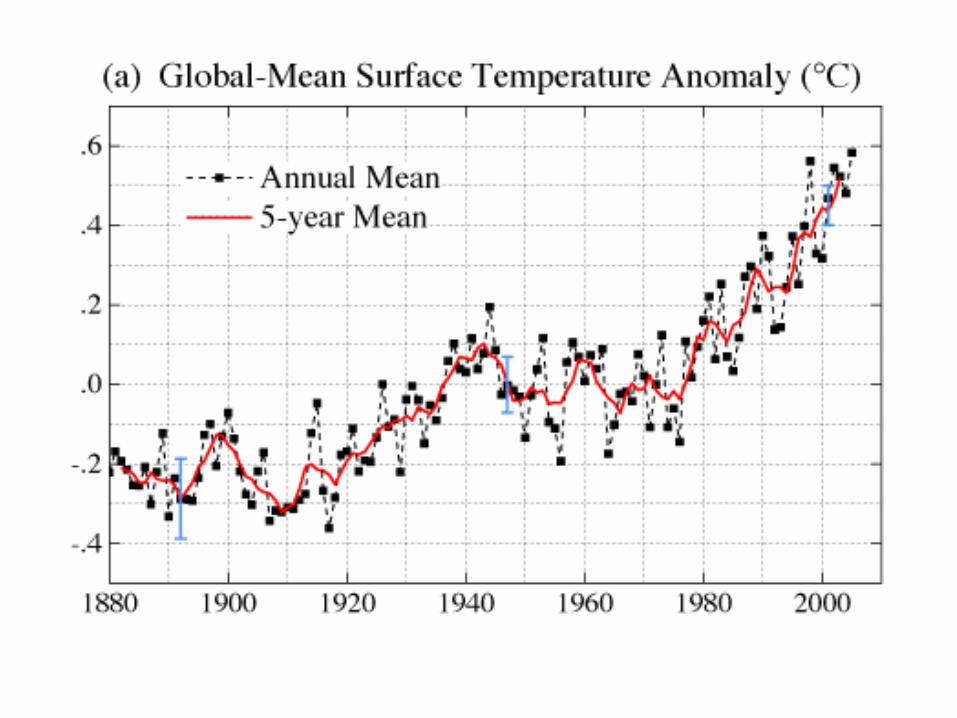

[Hansen and Sato (2004)]
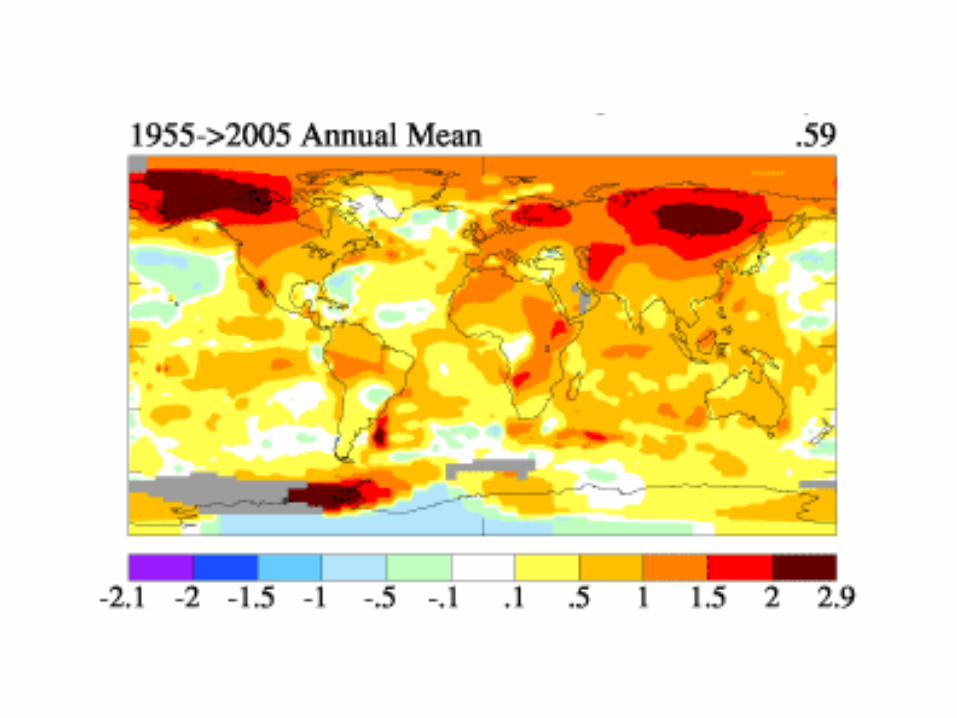
Last 50 Years Surface Temperature Change Based on Linear Trends (oC)

0.0
0.2
0.4
0.6
0.8
1.0
1.2
1.4
1.6
1.8
Ra
dia
tiv
e F
orc
ing
(Wa
tts
pe
r s
qu
are
me
ter)
CO2 CH4 N2O CFC12 CFC11 Other
Source: NOAA ESRL Global Monitoring Division
2004 Radiative forcing from well-mixed greenhouse gases

Human activities generate CO2
Global CO2 emissions from fossil fuel burning, cement production, and gas flaring for 1751-2002
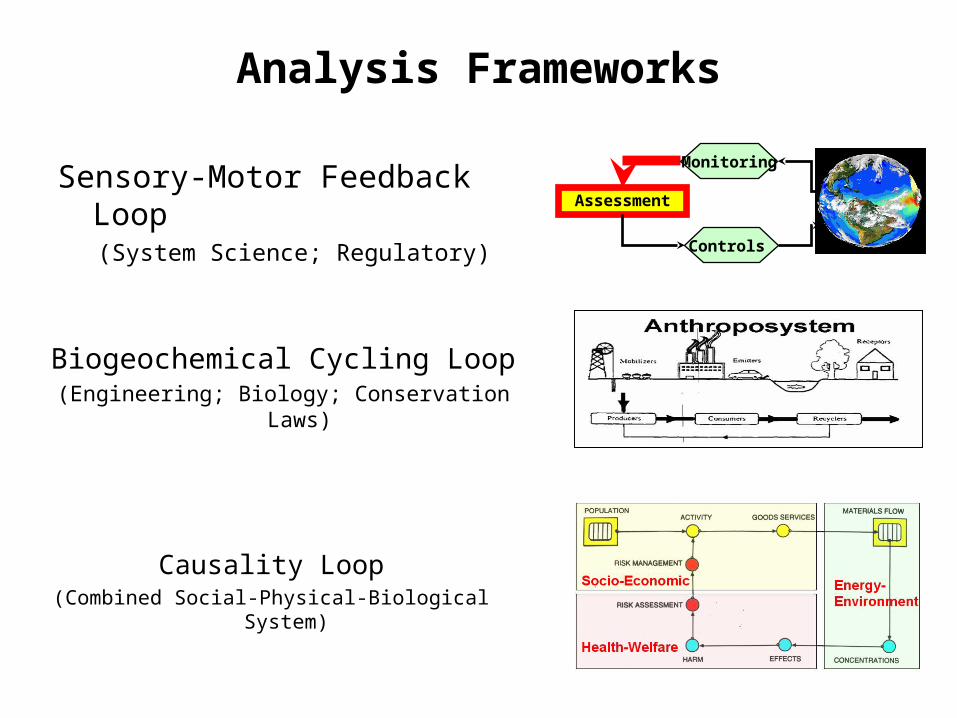
Analysis Frameworks
Sensory-Motor Feedback Loop (System Science; Regulatory)
Assessment
Controls
Monitoring
Causality Loop(Combined Social-Physical-Biological System)
Biogeochemical Cycling Loop(Engineering; Biology; Conservation Laws)
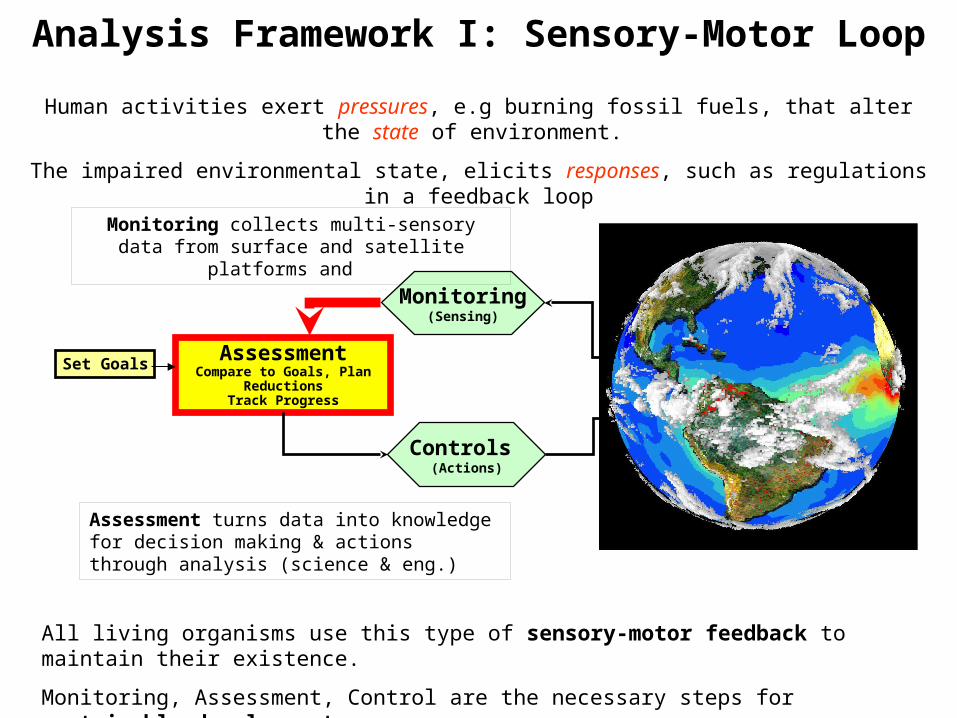
Analysis Framework I: Sensory-Motor Loop
AssessmentCompare to Goals, Plan Reductions
Track Progress
Controls (Actions)
Monitoring(Sensing)
Set Goals
Assessment turns data into knowledge for decision making & actions through analysis (science & eng.)
Monitoring collects multi-sensory data from surface and satellite platforms and
Human activities exert pressures, e.g burning fossil fuels, that alter the state of environment.
The impaired environmental state, elicits responses, such as regulations in a feedback loop
All living organisms use this type of sensory-motor feedback to maintain their existence.
Monitoring, Assessment, Control are the necessary steps for sustainable development.

Monitoring:New Global Measurements - Satellites
ERBS
Terra
Aqua
Grace
IceSat
QuikScatSage
SeaWinds
TRMM
Toms-EP
UARS Jason
Landsat 7
SORCE
SeaWiFS
ACRIMSAT
TOPEX/Poseidon
EO-1
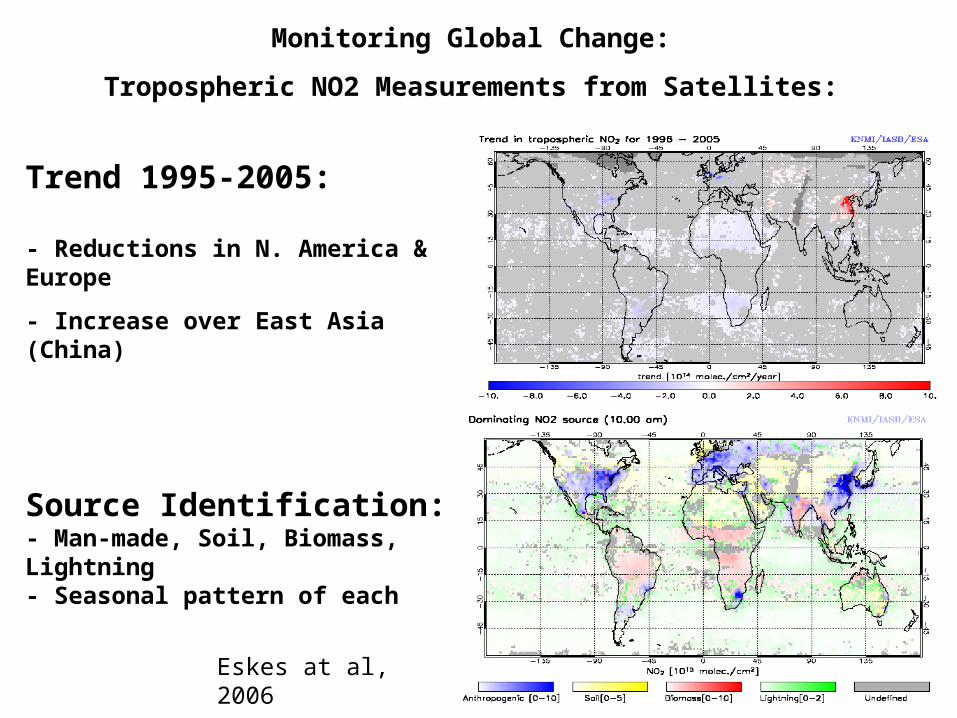
Eskes at al, 2006
Source Identification:- Man-made, Soil, Biomass, Lightning- Seasonal pattern of each
Trend 1995-2005:
- Reductions in N. America & Europe
- Increase over East Asia (China)
Monitoring Global Change:
Tropospheric NO2 Measurements from Satellites:
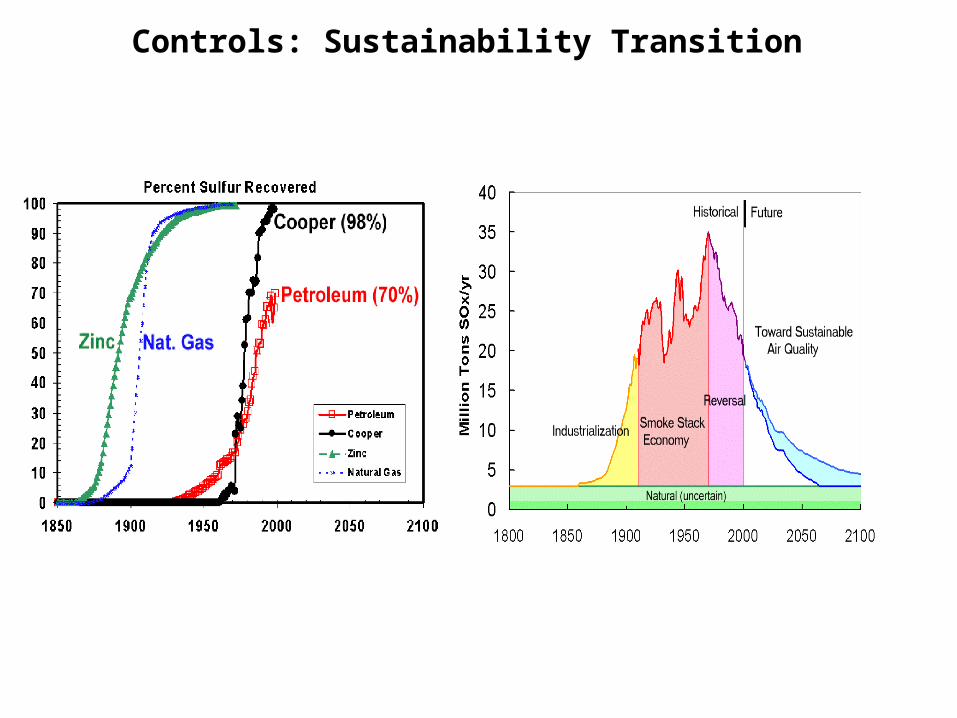
Controls: Sustainability Transition
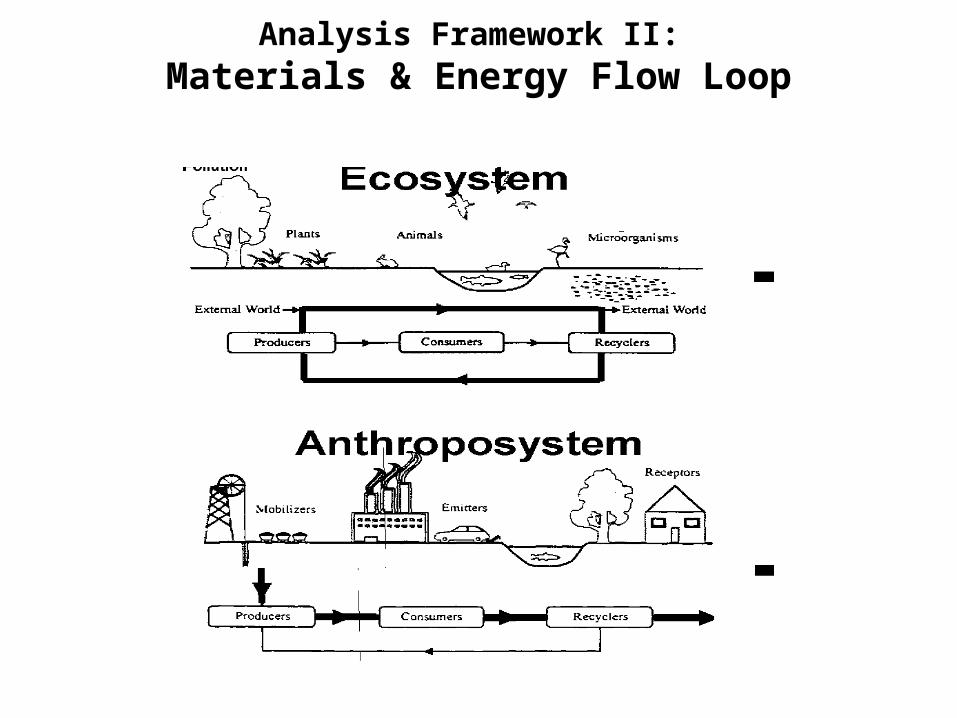
Analysis Framework II: Materials & Energy Flow Loop
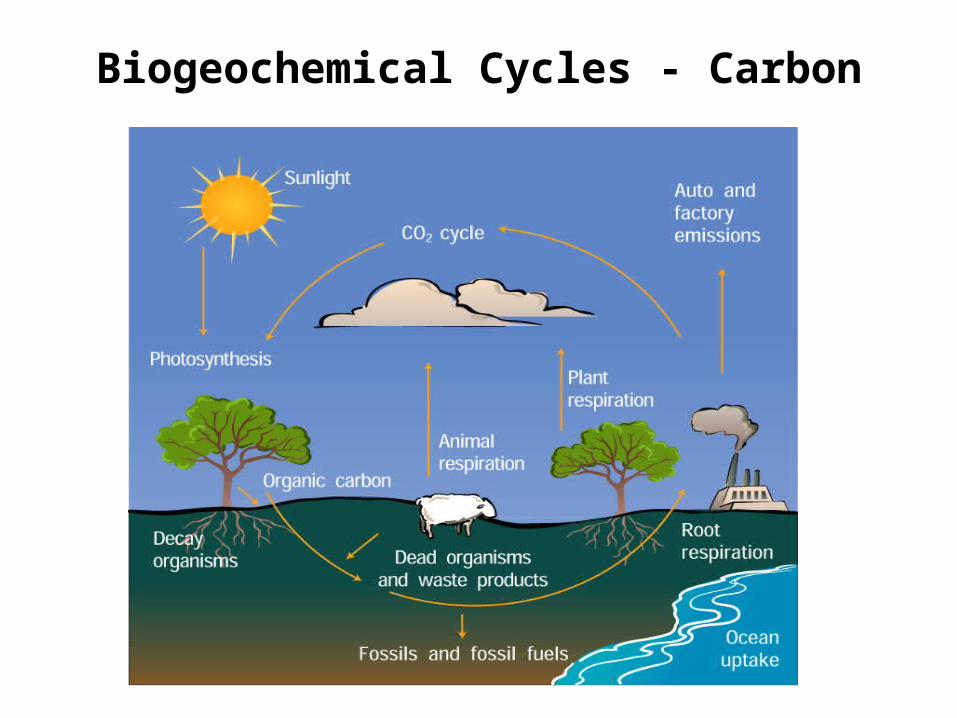
Biogeochemical Cycles - Carbon
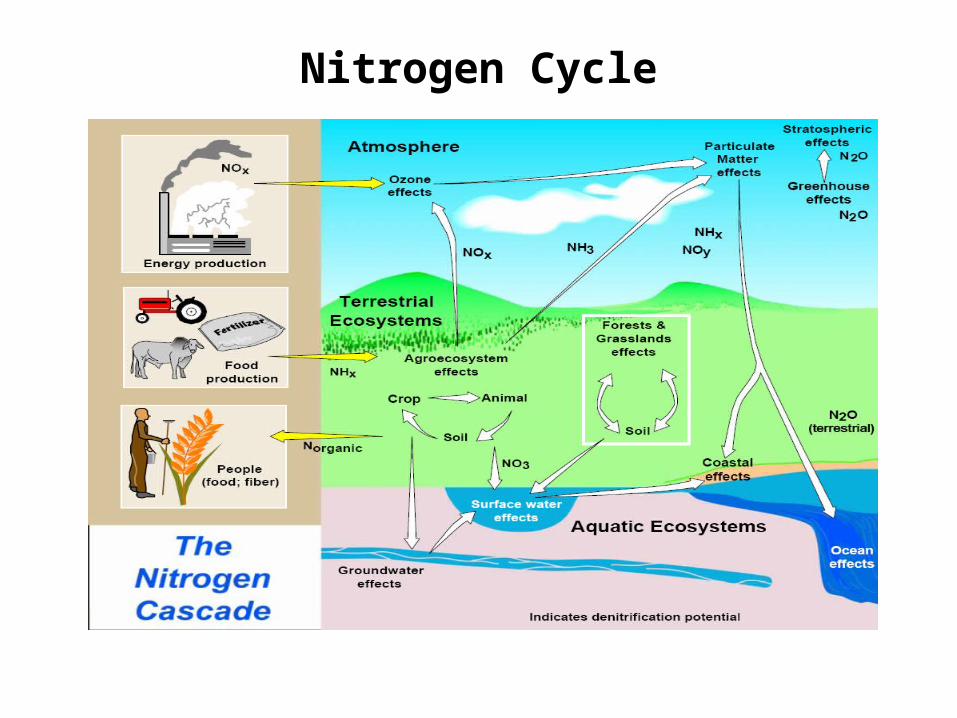
Nitrogen Cycle
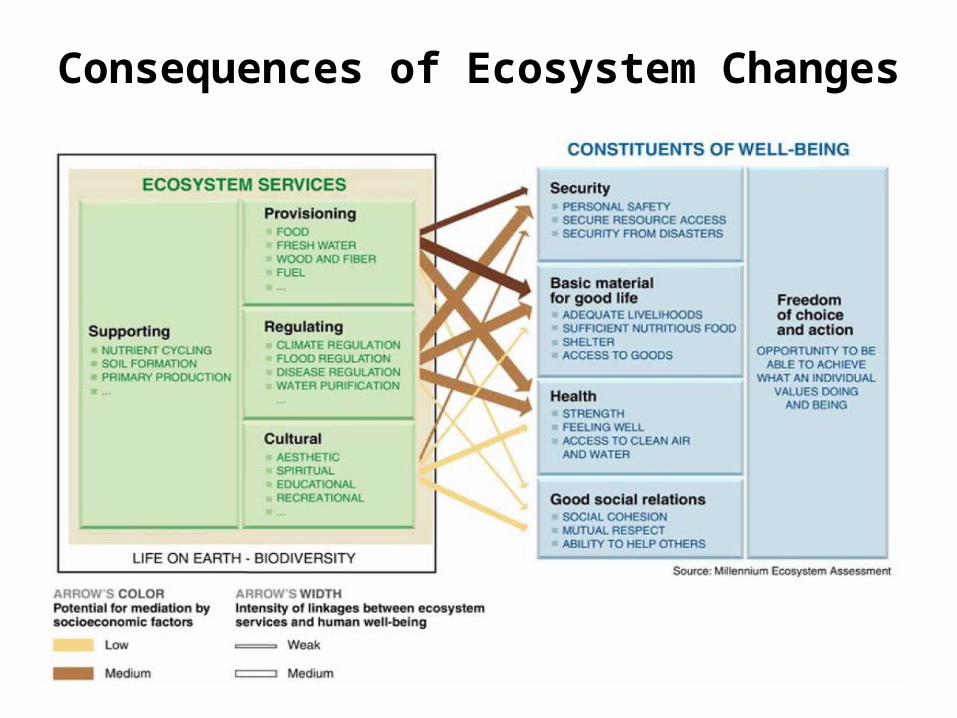
Consequences of Ecosystem Changes

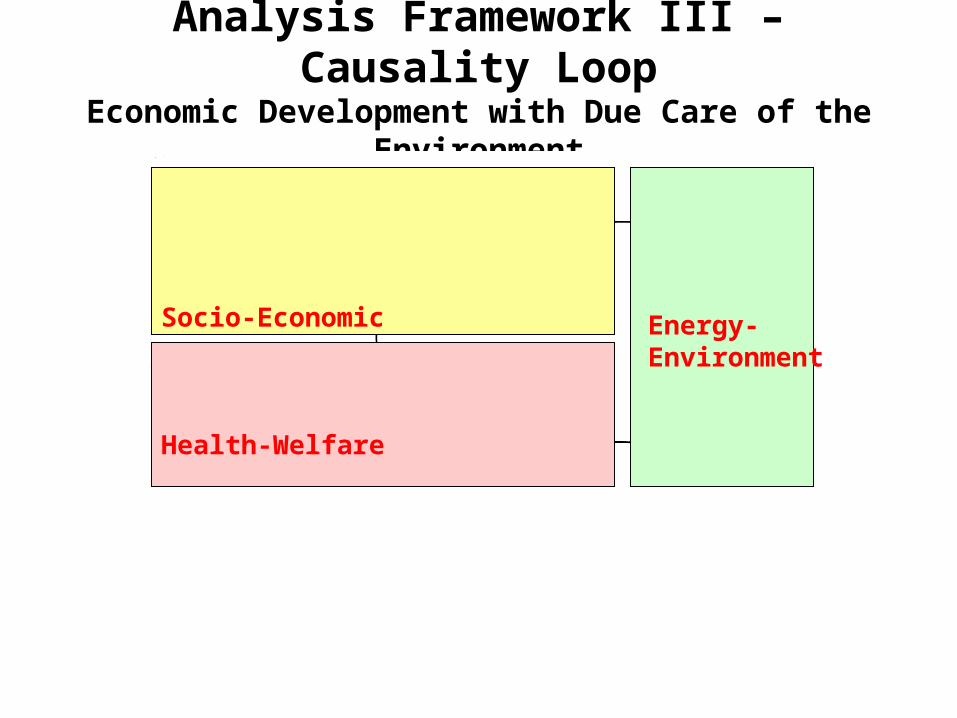
How and what to Control?? Analysis Framework III – Causality Loop
Economic Development with Due Care of the Environment
The system approach links human activities and their consequences in closed loop
It is the minimum set of linked components – if any missing, the system is crippled
Each component depends on its causal upstream driver – and external environment
The causal loop can be used as an organizing principle for sustainability analysis
Analysis Framework III – Causality LoopEconomic Development with Due Care of the
Environment
Health-Welfare
Energy-Environment
Socio-Economic

Causality: Linear System Model

Trend of Indicators
SOx = Pop x GDP/P x Btu/GDP x Sox/Btu
1960s
1980s
1990s
0
0.5
1
1.5
2
2.5
3
1900 1920 1940 1960 1980 2000 2020 2040
GDP(Mill$)/PersonEnergy(Bbtu)/GDP(Mill$)SOx/Energy(Bbtu)PopulationSOX Emiss
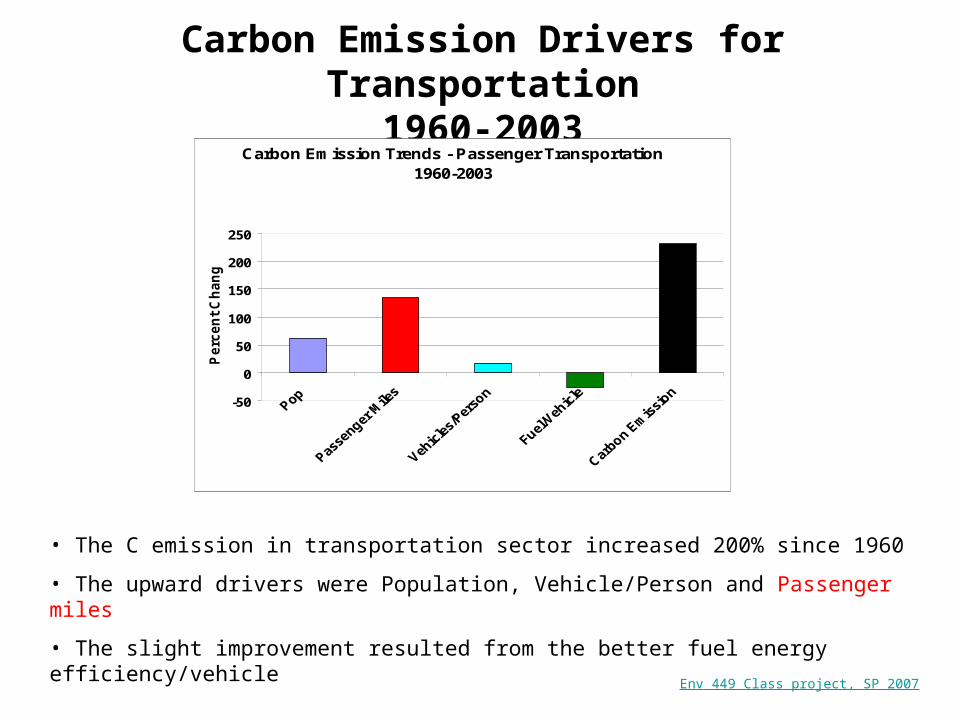
Carbon Emission Drivers for Transportation1960-2003
Carbon Emission Trends - Passenger Transportation 1960-2003
-50
0
50
100
150
200
250
Perc
en
t C
han
ge
Env 449 Class project, SP 2007
• The C emission in transportation sector increased 200% since 1960
• The upward drivers were Population, Vehicle/Person and Passenger miles
• The slight improvement resulted from the better fuel energy efficiency/vehicle
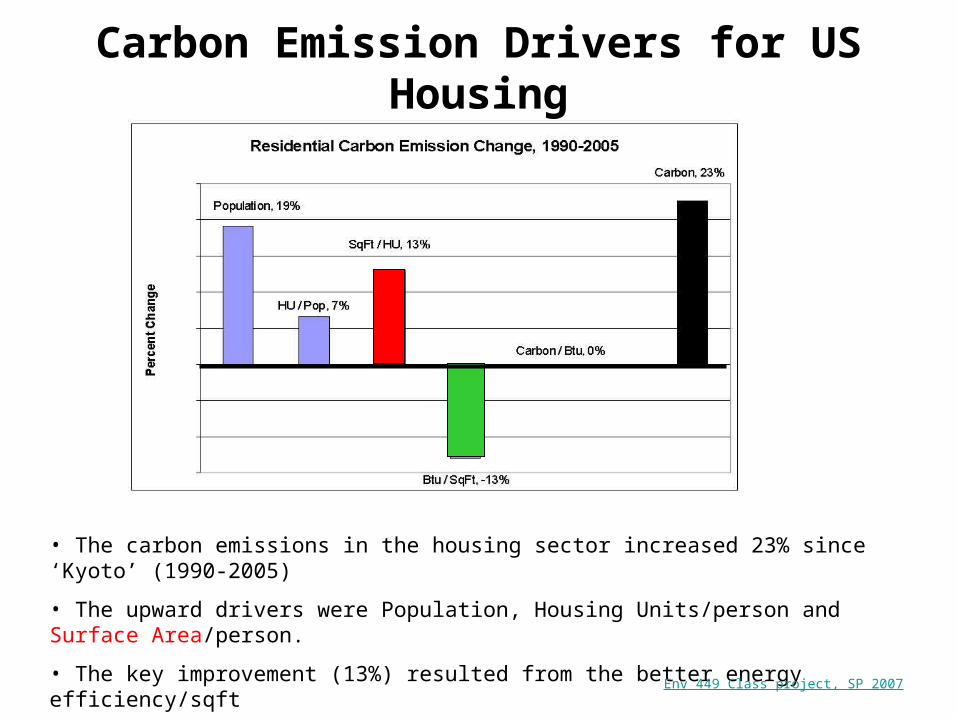
Carbon Emission Drivers for US Housing
• The carbon emissions in the housing sector increased 23% since ‘Kyoto’ (1990-2005)
• The upward drivers were Population, Housing Units/person and Surface Area/person.
• The key improvement (13%) resulted from the better energy efficiency/sqft
Env 449 Class project, SP 2007

Summary
• Frameworks for Energy-Environment Integration:– Sensory-Motor Feedback Loop (System Science)
– Biogeochemical Cycling Loop (Materials Balance)
– Causality Loop (Socio-economic, Physical, Heatlh/Welfare Sciences)
• Opportunities:– There is a sensing revolution for monitoring energy-environmental systems
– The web facilitates accessing and metabolizing the new observations
– There is a more collaborative culture for faster, adoptive learning
• Key Challenges:– Augmenting reductionist science with integrative systems science
– Enhancing information exchange and synergy between disciplines
– Inherent structural and dynamic complexity of environmental systems