sustainable consumption in tourism? -...
TRANSCRIPT

SUSTAINABLE CONSUMPTION IN TOURISM?
THE RELATIONSHIP BETWEEN PLACE ATTACHMENT AND
PRO-ENVIRONMENTAL BEHAVIOUR IN NATIONAL PARKS
Doctoral dissertation
Supervisor:
Dr. Ágnes Hofmeister-Tóth
Professor
©Kata Kasza-Kelemen
Budapest, September, 2015
Corvinus University of Budapest,
Doctoral School of Management and
Business Administration


INSTITUTE OF MARKETING AND MEDIA
DEPARTMENT OF MARKETING RESEARCH AND CONSUMER BEHAVIOUR
SUSTAINABLE CONSUMPTION IN TOURISM?
THE RELATIONSHIP BETWEEN PLACE ATTACHMENT AND
PRO-ENVIRONMENTAL BEHAVIOUR IN NATIONAL PARKS
Doctoral dissertation
Supervisor:
Dr. Ágnes Hofmeister-Tóth
Professor
©Kata Kasza-Kelemen
Budapest, September, 2015


TABLE OF CONTENT
TABLE OF CONTENT .................................................................................................... 5
LIST OF FIGURES .......................................................................................................... 7
LIST OF TABLES ............................................................................................................ 8
LIST OF ANNEXES ........................................................................................................ 9
INTRODUCTION .......................................................................................................... 13
1. OBJECTIVE AND STRUCTURE OF THE DISSERTATION ........................... 15
2. TOURISM AND SUSTAINABILITY ................................................................. 18
2.1. Development theories in tourism .......................................................................... 20
2.2. Sustainable development as a framework ............................................................. 23
2.3. Definition and principles of sustainable tourism ................................................... 23
2.4. The role of stakeholders in enhancing sustainable tourism ................................... 27
3. SUSTAINABLE CONSUMPTION AND ITS CHALLENGES .......................... 32
4. CONSUMERS’ ENVIRONMENTAL RESPONSIBILITY................................. 34
4.1. Individual’s responsibility ..................................................................................... 34
4.2. The definition of socially responsible consumer ................................................... 35
4.3. Pro-environmental behaviour and its forms .......................................................... 35
4.4. Pro-environmental behaviour in leisure travel ...................................................... 36
4.5. The ideal visitor and the way towards them .......................................................... 40
5. MAJOR THEORIES OF PRO-ENVIRONMENTAL BEHAVIOUR .................. 41
5.1. Rational decision making and its limitations ........................................................ 41
5.2. Approaches of self-interest or pro-social motives ................................................. 42
5.3. The influence of habits and routines in behaviour ................................................ 48
5.4. The influence of the individual’s social integration on behaviour ........................ 50
5.5. The influence of person−environment on behaviour ............................................ 53
5.5.1. The tripartite model of place attachment ............................................................... 55
5.5.2. The interaction between place attachment and pro-environmental behaviour ...... 59
6. PRELIMINARY RESEARCH STUDIES ............................................................ 60
6.1. Qualitative examination of place attachment and pro-environmental behaviour .. 61
6.1.1. Circumstances of the qualitative research ............................................................. 61
6.1.2. Applied methodology ............................................................................................ 62
6.1.3. Results of the content analysis .............................................................................. 64
6.1.4. Conclusions on narrative interviews ..................................................................... 70
6.2. Quantitative examination of place attachment and pro-environmental behaviour 72
6.2.1. Testing place attachment scale .............................................................................. 72
6.2.2. The examination of pro-environment behavioural intention scale ........................ 74

6.2.3. Conclusions of scale testing ................................................................................... 77
7. EMPIRICAL RESEARCH .................................................................................... 78
7.1. Objective of the research ....................................................................................... 78
7.2. Sample and sampling ............................................................................................. 79
7.3. Theoretical model .................................................................................................. 84
7.4. Description and measurement of model variables ................................................. 86
7.4.1. Place attachment and its measurability .................................................................. 86
7.4.2. Pro-environmental behaviour, the definitions and measurability of behavioural
intentions ................................................................................................................ 91
7.4.3. Measuring predictors of place attachment ............................................................. 95
7.5. Hypotheses of the research .................................................................................... 96
7.6. Preparation of statistical analysis ......................................................................... 102
7.7. Results of the research ......................................................................................... 102
7.7.1. General characteristics of visitation to national parks ......................................... 102
7.7.2. Patterns of attachment to national parks .............................................................. 104
7.7.3. Forms of pro-environmental behaviour ............................................................... 110
7.7.4. Examination of external variables of place attachment ....................................... 117
7.7.5. The relationship between place attachment and pro-environmental behavioural
intention ............................................................................................................... 125
7.7.6. Validating the measurement model ..................................................................... 126
7.7.7. Fit indices of the structural model ....................................................................... 132
7.7.8. Results of the structural model ............................................................................ 134
8. EVALUATION OF RESULTS, CONCLUSIONS ............................................. 139
8.1. Summary of results .............................................................................................. 139
8.2. Theoretical and practical significance of my research ......................................... 143
8.3. Conclusions on the measurement of place attachment ........................................ 144
8.4. Limitations of research and future research possibilities ..................................... 145
REFERENCES .............................................................................................................. 147
ANNEX ......................................................................................................................... 166

LIST OF FIGURES
Figure 1: Research focus and theoretical background of the dissertation ...................... 16
Figure 2: Development theories in tourism .................................................................... 20
Figure 3: Stakeholders’ interactions in consumer ........................................................... 31
Figure 4: Experiences - Consumer’s decision - Consequences ...................................... 37
Figure 5: Theory of Reasoned Action (TRA) ................................................................. 43
Figure 6: Theory of Planned Behaviour (TPB) .............................................................. 44
Figure 7: Norm Activation Model .................................................................................. 46
Figure 8: Value - Belief - Norm Model .......................................................................... 48
Figure 9: The tripartite model of place attachment ......................................................... 56
Figure 10: Summary of the results of narrative interviews ............................................ 71
Figure 11: Euclidean distance model: speciality – difficulty ......................................... 75
Figure 12: Theoretical model of my research ................................................................. 85
Figure 13: Recent visitations to the given national park in monthly breakdown ......... 105
Figure 14: The distance from the place of residence to the selected national park ...... 106
Figure 15: Duration of visitation in the national park (categories per capita and in
%) .................................................................................................................................. 107
Figure 16: Final measurement model ........................................................................... 130
Figure 17: Structural model .......................................................................................... 133
Figure 18: Illustration of effects in a structural model ................................................. 134
Figure 19: Mediating effect .......................................................................................... 136
Figure 20: Illustration of effects in a structural model (model B and C) ...................... 138
LIST OF TABLES
Table 1: Milestones in sustainable tourism development ............................................... 26
Table 2: Major guidelines to influence the flow and decisions of visitors ..................... 40 Table 3: Corner stones of the new patterns of consumer commitment ........................... 52 Table 4: Definitions of place attachment ........................................................................ 55 Table 5: Formulation of the focal topic ........................................................................... 63 Table 6: Process of the analysis of the narratives ........................................................... 63
Table 7: Results of the a priori factor analysis regarding the place attachment scale ..... 73 Table 8: Internal consistency of park-specific pro-environmental behavioural scale ..... 76 Table 9: Whole sample broken down by demographical variables ................................ 82 Table 10: Major studies examining the dimensionality of place attachment .................. 88 Table 11: Environmentally significant behaviour ........................................................... 93
Table 12: Classification of predictors of place attachment ............................................. 97 Table 13: Summary of research hypotheses .................................................................. 101
Table 14: Visitation frequency to domestic national parks ........................................... 103 Table 15: Number and proportion of mentions in the sample about the favourite national
parks visited during the past 12 months ........................................................................ 105 16. Table:Visitations to national parks under the age of 14 in the sampleTable .......... 107
Table 17: Description of the scale measuring place attachment ................................... 108 Table 18: Demographical differences in the values of place attachment ...................... 109 Table 19: Pro-environmental behaviour and behavioural intention in national parks .. 112
Table 20: Demographical differences in the values of pro-environmental behaviour
concerning national parks .............................................................................................. 114
Table 21: Pro-environmental behaviour at the place of residence (N=264) ................. 115 Table 22: Summary of the independent variables examined ........................................ 117
Table 23: Differences in the values of place attachment based on the frequency of
visitations to the national park ...................................................................................... 118
Table 24: Differences in the values of place attachment based on the duration of
visitations to the national park ...................................................................................... 119 Table 25: Differences in the values of place attachment based on the distance between
the national park and the place of residence ................................................................. 120 Table 26: Influence of visitations characteristics on place attachment, two-way ANOVA
....................................................................................................................................... 121 Table 27: Interaction between variables, significant main and partial effects .............. 122 Table 28: Differences in the values of place attachment based on childhood visitations
to the national park ........................................................................................................ 123 Table 29: Place attachment values in the dimension of age and the length of relationship
variables ........................................................................................................................ 124 Table 30: The influence of external variables on place attachment based on hierarchical
analysis of variance ....................................................................................................... 125 Table 31: Aspects of defining the sample size .............................................................. 126 Table 32: Results of confirmatory factor analysis, scale reliability and validity
calculations .................................................................................................................... 131 Table 33: Fit indices of the measurement model .......................................................... 132
Table 34: Fit indices of the structural model ................................................................. 133 Table 35: Fit indices of alternative models examined ................................................... 136 Table 36: Total, direct and indirect effects between the variables ................................ 137 Table 37: Summary of research hypotheses .................................................................. 142
LIST OF ANNEXES
Annex 1: UNWTO programmes 2002-2015 ................................................................ 167
Annex 2: Definitions or tourism intentions set out for sustainability ........................... 168 Annex 3: Instructions of qualitative research ............................................................... 169 Annex 4: Three sub-dimension place attachment scale of Halpenny ........................... 170 Annex 5: Descriptive statistics of place attachment ..................................................... 171 Annex 6: Descriptive statistics of park-specific pro-environmental behaviour ........... 171
Annex 7: Results of a priori factor analysis of the park-specific pro-environmental
behavioural scale ........................................................................................................... 172 Annex 8: The four sub-dimension scale of Ramkissoon et al. (2013) .......................... 173 Annex 9: Brief introduction of the national parks ........................................................ 173
Annex 10: Visual presentation of national parks in the questionnaire ......................... 175 Annex 11: The questionnaire of empirical ................................................................... 175 Annex 12: Validated scale of Ramkissoon et al. (12 items, 4 sub-dimensions) ........... 190
Annex 13: Testing the normality of variables involved in the analysis........................ 191 Annex 14: Frequency of visitations to certain national parks ...................................... 191 Annex 15: Place of residence and national park specific descriptive statistics of place
attachment ..................................................................................................................... 192
Annex 16: Averages and variations of residential pro-environmental behaviour ........ 192 Annex 17: Examination of the variance homogeneity and normality of place
attachment ..................................................................................................................... 193
Annex 18: Tables of one-way analysis of variance ...................................................... 193 Annex 19: Tables of two-way and multiple analysis of variance ................................. 204
Annex 20: Exploratory factor analysis (EFA) results of park-specific pro-environmental
behavioural intentions ................................................................................................... 209
Annex 21: Initial confirmatory factor model ................................................................ 210


Acknowledgements
I would like to thank my supervisor, Dr. Hofmeister-Tóth Ágnes for her support and guidance
through the past years. I am thankful to my family for allowing me time to spend on scientific
work and to all my colleagues and friends who supported me in writing the dissertation. I
would like to express the deepest appreciation to Marianna Piskóti for her valuable help and
for accompanying me along the way.

“The place should not be mistaken with the space. The difference is
between the space and the place that the space has a number, the place
has a face. The space, if only not exceptional, can be defined by accurate
lines in coordinates, its area can be measured by square millimetre and
hits shape can be sketched with compass and a ruler. The space is always
a geometric figure. The place is always a painting and drawing, and that
is the only one in the eye of the beholder. The space defined by formulas,
but the place is the achievement of a genius.
Béla Hamvas

13
INTRODUCTION
The World Tourism Organization reported 1.133 million international tourism arrivals in
2014. This is a 4.4% decrease compared to the previous year's survey. Tourism marks the
fifth consecutive year of robust growth above the long-term average (+3.3% a year) since
the financial crisis of 2009 (UNWTO, 2015). This positive perspective is somewhat
overshadowed by a concern of how this drastically growing industry may cope with the
consequences of operation in the future. As estimated by the Forum for the Future (2009),
the world’s population will reach 8 billion by the second half of 2020 resulting in 1.2
billion individual demand on the global market. This will be complemented by the
envisaged strengthening of the Chinese and Indian middle class which may
fundamentally reshape the flow of tourists. By 2023, when, how, and where one can travel
(if at all) could be called into question by the increasingly serious impact of climate
change unfolding in parallel with the aforementioned phenomena.
The tourism industry is a bit more optimistic, it, however, was recognized that the
restructuring of its operation toward a sustainable direction is indispensable. The industry
is on the brink of profound changes. The process will produce winners and losers. There
will be service providers who will adapt the concept of sustainability in a more efficient
way than others: for them sustainability would mean new opportunities to explore, new
consumers to get, new products to develop and new markets to create. There will be
countries who will succeed in the implementation of this process. Their economy will be
positioned as a sustainability hub thus gaining new competitive advantages. WEF1 (2011)
similarly emphasizes that companies and countries becoming part of the transformation
of global economy into a sustainable form will more probably be prosperous.
However, the citizens themselves are the driving factors behind sustainable development
of any nation. As consumers, investors, voters or employees citizens have the power to
act for a change to happen. The reality however shows that individual commitment toward
a shift of world economy into a sustainable form is happening slowly, in small steps.
Some consumers pro-actively take part in this process although their number is too low
to reach the critical mass. Most of them are confused about the terminology of sustainable
1 World Economic Forum

14
production and consumption and have doubts whether they can influence the economy as
a whole with their individual decisions, behaviour (WEF, 2011; National Geographics
and Globescan, 2010).
Tourism has a unique potential to draw the attention of visitors to development related
environmental and ethical issues and also it can shape their mind-set about this topic.
Millions are travelling every year by stepping out of their routines in order to be more or
less open to new impressions. Tourism may ensure an ideal atmosphere to develop
environmental awareness. Nature or culture related values, services and experiences one
can meet during a travel may enhance the awareness of a problem and this can be
channelled into a process of changing consumer habits (UNWTO, 2010a; Amendah and
Park, 2008). The information gained this way may encourage a change in behaviour that
would not appear in the regular living environment of an individual. Possible forms of
behaviour may affect individual’s lifestyle and consumer decision-making, and as such,
it affects the demand for tourism. This path, however, is only a chance whereby recreation
may reflect to relaxation, having rest where individuals may not care much about their
sense of responsibility. It is therefore necessary to make the conditions of relaxation
attractive but they should act as a mean of pressure at the same time. The role of tourism
in sustainable development is not only an opportunity but rather a responsibility. Bearing
this responsibility in mind should have a serious focus in the course of the development
of national tourism development strategies, thus ensuring a supportive environment to
industry players, consumers so that their commitment toward sustainable tourism could
be accomplished at a level of real actions.

15
1. OBJECTIVE AND STRUCTURE OF THE DISSERTATION
The research was made in frame of the project TÁMOP-4.2.1/B-09/1/KMR-2010-0005:
Sustainable development, liveable region. During my research I was interested to know
what factors could encourage sustainable development of tourism, more closely
consumers’ commitment. The objective of the dissertation is to summarize the factors
influencing consumers’ pro-environmental behaviour as well as to point out their
relationship with leisure travel. The research of the dissertation will focus on the
characteristics of visitations to national park, the attachment to the parks and the
examination of pro-environmental behaviour in parks. I determined the research direction
by taking the following aspects into consideration:
Stimulating domestic tourism is a stated objective in Hungarian national tourism
development (Magyar Turizmus Zrt., 2015).
The core task of sustainable tourism is to shift tourism demand towards “pro-
environmental products” (UNEP and WTO, 2005; WEF, 2011), in which national
parks play a prominent role (Michalkó, 2007).
A better understanding of consumers’ preferences and commitment to pro-
environmental behaviour is a valuable contribution to the management of national
parks.
Examining consumption in the context of tourism enables us to better understand
consumption outside of the place of residence (and/or private property) and to
understand the process of environmental commitment.
A promising way to understand the process of commitment to pro-environmental
behaviour is to examine how the relationship between the individual and the place is
establishing. Relph (1976) suggests that a certain place can awake individuals’ sense of
responsibility. Beyond emotional bonding, the thorough knowledge of the place
(destination) increases the probability that the individual will demonstrate a protecting
behaviour regarding the aforementioned place (Kals et al., 1999; Schultz, 2000; Pooley
and O’Connor, 2000). The positive effect of place attachment on pro-environmental
behaviour, including the context of leisure activities has been proven by several studies
(Halpenny, 2010; Scannell and Gifford, 2010; Ramkissoon et al., 2013). At the same time,
knowledge of the spillover effect of such changes in behaviour remains limited. My
research aims to contribute to filling this research gap by further examining this field. The
practical significance of the research is to obtain a clearer picture on how to enhance
visitors’ commitment to pro-environmental behaviour during visitations to national parks

16
by learning the effect of place attachment on pro-environmental behaviour. All this can
contribute to a more sustainable management of national parks.
The basis of my dissertation was marked by alternative development2 including the
theoretical frame of sustainable development3. The theoretical background of my work
and the research focus is shown in Figure 1.
Figure 1: Research focus and theoretical background of the dissertation
Source: Own elaboration
In order to support the outlined research objectives, I will describe the main theoretical
approaches in tourism development in Chapter 2., detailing the principles of sustainable
development as a background of the dissertation, and also their implementation and
challenges in tourism. This chapter points out the role of stakeholders in this process,
more specifically the consumers.
2Alternative development - by resisting the traditions of linear growth theories - reflects to a resource based
approach which takes the environmental, social, economical, ethical and cultural consequences of growth
into consideration. Thus alternative paradigm focuses on humans and natural environments (Holden, 2006). 3Sustainable development is a concept of the link between human development and the conservation of
natural resources. As such, this is a central but not exclusive topic of alternative development theories.
Practical
Theoretical
Possibilities to enhance pro-
environmental behaviour in
tourism
The influence of place
attachment on pro-
environmental behavioural
intentions in context of
tourism
Alternative development theory
Sustainable development
Consumer
(citizen)
Theoretical
background
Research
focus
Contribution
to the topic
Pro-environmental behaviour
Sustainable tourism
Sustainable consumption

17
Chapter 3 describes the re-interpretation of consumption, the difficulties and challenges
of its transformation into a sustainable model, as all as the role of consumption in a
modern society.
After the description of relevant characteristics of tourism relating to this topic, the
environmental responsibility of consumers is detailed in Chapter 4 including the
difficulties in individual responsibility and the conflicts between the individualist and
collectivist preferences. The chapter explains the substantive definition of pro-
environmental behaviour and its diverse and complex forms. It also defines the profile of
a pro-environmental tourist and outlines the conditions of an ideal tourist visit.
The theoretical approaches serving as a background to my planned research and the
results of earlier studies in this field are summarized in Chapter 5. The chapter organizes
the factors influencing pro-environmental behaviour and mentions major models
describing their relationships. The questions of rationality, the role of moral and
prevailing norms as well as the importance of habits and routines are also mentioned here.
The relationship between the society and individual, the place and the role of commitment
to the place will also be discussed.
Chapters 6-7 will detail the empirical researches on this topic. The results of the relating
preliminary studies are summarized in Chapter 6, where the conclusions of the qualitative
research and on-line survey made among students to examine place attachment and pro-
environmental behavioural intentions will be discussed. Chapter 7 of the dissertation will
focus on the introduction of the empirical research. The hypothesis of the research will
be defined followed by the operationalization of key constructs and the description of the
conditions and circumstances of the empirical work. The chapter covers methodologies
applied during the research and the results thereof, Chapter 8 will present the conclusions
of the dissertation, the evaluations of results and their practical implications as well as the
limitations of the research and opportunities for future research.

18
2. TOURISM AND SUSTAINABILITY
The changes of tourism in time, space and volume have a complex impact on our world
both in terms of the shape of the environment and on the development of human society.
Economic, environmental and socio-cultural capital are all affected by the industry.
The economic role of tourism can be characterised by several factors, in particular
employability, contribution to GDP and capital investments as well as its multiplicator
effect on other sectors. As Tasnádi (2002) points out, this sector can be a fundamental
source for currencies, furthermore it means investment possibilities and economic
development potential on less developed regions. From the economic perspective,
tourism plays a role in traditional settling of the balance of payments, employment,
increasing revenue, production, and in mid or less developed countries, market expansion,
structure improvement (Tasnádi, 2002. p. 58.) According to the UNWTO (2015) report,
tourism accounted for 9% of the world GDP in a direct or indirect way. Based on the
estimates, 6% of the total export revenue in 2014 derived from international visitations
(UNWTO, 2015). Tourism expenditures mean important revenue sources in directly
related sectors such as catering (HORECA), transport or infrastructure (Tasnádi, 2002).
In addition to the listed economic advantages, there are some factors that jeopardize the
industry. Less favourable tax regimes, foreign ownership, the import of luxury products
often lead to the leakage of industry revenue from the region or from the country (Ap and
Crompton, 1998). Such pure economic approach fundamentally challenges long term
sustainability of resources ensuring the attraction.
The presence of tourism inevitably entails the change in environment and natural capital,
partially through interventions helping tourism development and through tourism
production process (Fletcher, 2008). Certain changes, such as the improvement of
infrastructure (road/cycle route building, sewage water and waste management etc.),
conservation and development of protected areas, natural parks have a positive effect on
the population’s lives and result in a more efficient system in terms of environment
protection. The consumption and impact of physical (water, land, raw material) and
abstract resources (beauty of nature, cleanliness, quietness etc.) may radically increase
with the appearance of tourism. Natural systems however are capable of absorbing a
certain amount of pollutant without being damaged functionally but beyond the

19
ecological capacity the resources are irreversibly damaged (Vargáné Csobán and Bauerné
Gáthy, 2009; Vargáné Csobán, 2007). By irresponsible and partial planning tourism risks
the most important attraction of the product, that is the natural capital, and compromises
long term viability of the destination.
Two issues closely relating to natural capital, climate change and the decrease in
biodiversity4 also have a radical influence on tourism. The industry, due to its close link
with transportation, is a main generator of greenhouse gas emissions causing climate
change (Budeanu, 2007a). Provided that global warming will progress as projected, the
existing popular destinations will need to face a radical increase in temperature and sea
level within 100 years (Malcolm et al., 2002).
Societies are more aware of the threats and consequences of climate change. Therefore
the concern relating to this topic is increasing worldwide (National Geographics and
Globescan, 2010). 2010 put a new problem in the focus, namely the decrease in
biodiversity.5 Tourism is closely related to biodiversity since biodiversity directly
contributes to human welfare by providing intellectual, aesthetic and spiritual experience
(EEA, 2010; Mace et al., 2010). On this basis tourism mean an important source of
income in poorer countries. A decisive proportion of the world biodiversity is present in
emerging countries enabling these regions closer to tourism competitive advantages as
well as social and economic benefits (UNWTO, 2007a). Preserving biodiversity is our
own interest. In order to help this, a network of 25,000 protected areas within the
Members States of the European Union was established during the past 30 years. The
network known as Natura 2000 covers 17% of the area of Europa and forms the biggest
system of protected areas in the world6. It has an inevitable importance in developing
tourism and re-shaping individual’s way of life, as it may create such bonds in the visitors
that can encourage a more complex view of system by recognizing the individual’s
(limited) role in nature.
Tourism as a service industry is also distinct in that the consumption of its products is
being intrinsically linked to the specific location of their production. Nonetheless, tourism
is a personal service and can be consumed by those who visit the given destination.
4Biodiversity consists of genes, species and ecosystems forming life on Earth (EEA, 2010).
6In Hungary, currently there are 467 special nature conservation areas and appr. 50 areas for the
protection of birds belonging to this network.
20
Tourism therefore not only influences economy and nature but entails an ever changing
environment with new visitors (Fletcher, 2008). Based on this, it has two consequences
from the aspect of society and culture. On one hand, economic growth and development
influences locals’ decisions regarding expenses and life style. Another dimension of
socio-cultural changes is the interface between arriving visitors and locals. The
interaction between tourists and locals can be useful or detrimental depending on the
cultural differences and the nature of the relationship. In this respect, researchers have
been primarily focusing on locals (UNESCO, 1976; Dogan, 1989; Lankford and Howard,
1994; Besculides et al., 2002). As we are talking about a relationship, its effects are
determining from the visitors’ side, too. The knowledge on habits, religious traditions,
architectural memories and other heritage influences the picture a visitor may create on
the world and on themselves, thus influencing the individual’s relationship with
environment and different cultures.
The above description intended to give a comprehensive overview of the complex
relationship of tourism with the economic infrastructure, biodiversity, natural resources
and human population. The global and local role of tourism can be interpreted in light of
these factors, for the definition of development paths the complex system should be taken
into consideration.
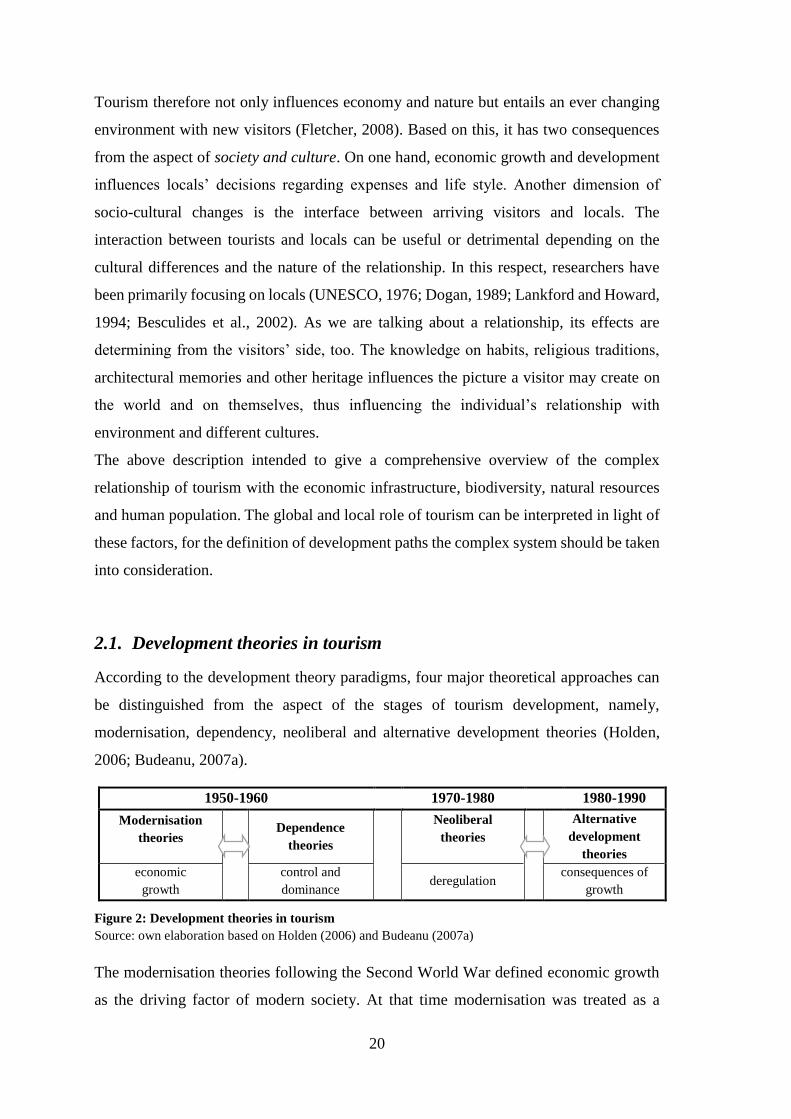
2.1. Development theories in tourism
According to the development theory paradigms, four major theoretical approaches can
be distinguished from the aspect of the stages of tourism development, namely,
modernisation, dependency, neoliberal and alternative development theories (Holden,
2006; Budeanu, 2007a).
1950-1960 1970-1980 1980-1990
Modernisation
theories Dependence
theories
Neoliberal
theories
Alternative
development
theories
economic
growth
control and
dominance deregulation
consequences of
growth
Figure 2: Development theories in tourism
Source: own elaboration based on Holden (2006) and Budeanu (2007a)
The modernisation theories following the Second World War defined economic growth
as the driving factor of modern society. At that time modernisation was treated as a

21
development of traditional society and economy following an evolutionary and linear
path. In countries following the economic and social modernisation tourism received
significant incentive due to its economic advantages. The positive effects of these
advantages were mainly manifested in growing employment and income rates produced
by the industry, as well as in triggering a multiplier effect. This sector of relatively low
investment costs and easily accessible, constant resources (like the beauty of nature)
meant an attractive perspective in those countries where there were only limited amount
of raw materials necessary for industrial production. The potential revenue from foreign
exchange entailed the idea of international expansion along with an intention to extend
the positive influence of investments on less developed regions (Oppermann, 1993). As
a result, modernization meant the extension of structures following the western pattern of
development onto less developed countries (Harrison, 1992 in: Holden, 2006). Following
a similar pattern to colonisation the presence on the foreign market affected countries like
India or Mexico (Holden, 2006). Modern tourism generated by western societies had to
face a number of problems, such as unexpected costs, lower ROIs, negative effects of
seasonality, increasing inflation and a segregation in developing countries due to tourism.
All of the above-mentioned called the attention to the short-sightedness of modernist
approach of development (Holden, 2006).
In parallel with the modernization theories prevailing between the 1950th an 1960th
dependence theories appeared. Such view on tourism development is critical in that
tourism perpetuates the colonization attitude of western societies by splitting the world
into a central and a peripheral part (Budeanu, 2007a). Based on the dependence theories,
tourism, similarly to its role in agricultural colonization, means a new opportunity to the
power elite to extend its power to peripheral areas, too (Weaver, 2006). Britton (1982)
suggests that developed countries treated tourism as a tool to join into the global system
with by allowing the sector to become a product of metropolitan capitalist companies.
When examining the issues of control and dominance, dependence theories pointed out
the influences of tourism on less developed societies. Milne and Ateljevic (2004) however
emphasize that, similarly to modernist approach, the dependence theories examine
tourism from a quite narrow perspective focusing on its international impact only. These
theories do not cover local aspects of tourism development and also, the complex system
of tourism is only examined from the aspect of capital.

22
The next significant paradigm of tourism development theories is built on the
liberalization of international trade (Sharpley, 2004). The neoliberal view of free market
in the field of tourism was associated with the roll-back of state intervention and
regulation (Holden, 2006) and with the global competition. The paradigm defined the
basis of international development as the identification of competitive advantage and the
international trade built on this. In this global system several countries specialized in
producing their primary product for export with ignoring their internal market (Brohman,
1996). As a result, several sectors were put in the centre of economic interest which had
been less known before. International tourism was one of them. The deregulation of this
era as well as the external development strategy supported by IMF did not only create
market for these countries but contributed to the increase of negative effects of tourism
and the degradation of several destinations (Weaver, 2006). Butler’s life cycle model of
destination is a good example for this (Butler, 1980 in: Papatheodorou, 2004), as this
describes the destination life cycles with the following stages: growth, involvement,
development, consolidation, stagnation, decline or renewal. Mentioning renewal
possibilities raise a view point that carries us over the next stage of tourism theories that
are the alternative development theories.
As we saw, modernisation and neoliberal development theories supported by the Bretton
Woods Trio and the western societies were mainly characterized with the belief in
economic growth and the bottom-up diffusion processes. In parallel with this, new
approaches appeared that defined development in context if different strategies. They are
uniformly called alternative development theories. Tefler (2002) states that they are
pragmatic, broad-minded approaches that were the outcome of the criticism of earlier
models.
Alternative development - by resisting the traditions of linear growth theories - reflects
to a resource based approach which takes the environmental, social, economic, ethical
and cultural consequences of growth into consideration. Accordingly, the alternative
paradigm focuses on humans and the natural environment. Its foundations are provided
by democratic structure and community development (Sharpley, 2004). Societal
advances, in this light, are characterized by indicators such as HDI (Human Development
Index) or HPI (Human Poverty Index). This theoretical framework is at the origin of the
concept of sustainable development (Kocsis, 2012).

23
Although it should be emphasized that sustainable development does not equal to
alternative development. Sustainable development is a concept that can be described with
the link between human development and the conservation of natural resources. As such,
this is a central but not exclusive topic of alternative development theories.
2.2. Sustainable development as a framework
The idea of sustainable development dates back to the Club of Rome. In a 1972 report
entitled ‘The Limits to Growth’ it was submitted by the Club’s scientists that the current
trends in the depletion of natural resources are not sustainable in the long term
(Hofmeister-Tóth et al., 2009). The term itself was introduced in the 80th. World
Commission on Environment and Development of the United Nations defined this term
in its report Our Common Future in 1987 (NFFT, 2010, p. 11.):
“Sustainable development is a development that meets the needs of the present without
compromising the ability of future generations to meet their own needs”
Main principles of sustainability can be characterized by the holistic approach of planning
and strategy making, the protection of biodiversity and cultural heritage, the protection
of fundamental ecological processes, the encouragement of social involvement, the
creation of commitment, the long term assurance of productivity, and the balancing
between equity between countries and chances (Fletcher, 2008).
2.3. Definition and principles of sustainable tourism
Sustainability has been the most widely discussed subject of tourism development. Its
specific contradiction is that there has been no consensus so far regarding its content
either in the academic sphere or in business. The differences may be caused by the fact
the sustainability covers a wide area including economic, environmental, social and
cultural aspects. Sustainability also extends to ethical questions and equality within and
between generations (Kelemen et al., 2010).
The principles of sustainability have roots going back to 19th century when the first
national parks protecting its environment and population appeared (Yellowstone National
Park, USA, 1872; Royal Society for the Protection of Birds, GB, 1889; National Trust,

24
GB, 1894). Later this intention spilled over to Australia, Canada and New-Zealand
(Fletcher, 2008). The tourism industry was equally late in facing, in a serious manner, the
environmental and social problems by the 1980s, only when the negative effects of mass
tourism had come to focus of attention due to their volume. In 1980, the Manila
Declaration (UNWTO, 1980) already mentioned the importance of state involvement
insofar as tourism development should be defined from environmental, social and ethical
aspect, too, in addition to economic guidelines. Bases on the report of the Brundtland
Commitee, there has been significant progress in tourism regarding the adaptation of
agreed guidelines to the sector (Brundtland, 1987). It was however unclear how the
designated programs can be implemented in the tourism practice. Unfortunately no
industry specific guidelines were given. As a result, two different interpretations were
established: a reformist and a radical one. Reformists argued in favour of protecting the
status quo, the existing economic and political system and proposed slight changes only.
Radical approach emphasized that the paradigm of economy, society and politics should
be changed. The following efforts and the overgrown definitions derive from these
differences.
The Hague Declaration was a major contribution to clarifying the concept (UNWTO-IPU,
1989 in: Tasnádi, 2002), whose third main principle emphasizes that the fundamental
responsibility of tourism is the preservation of integrity of natural, cultural and human
environment. The drafted proposals included the following areas in particular: raising of
awareness among tourists and locals, inclusion of constant development into an integrated
planning, definition of capacities of tourism areas, respecting environmental and other
aspects and the awareness raising of forms of alternative tourism (Tasnádi, 2002).
Globe 90’ and Globe 92’ Conferences were suitable platforms for the representatives of
tourism and academic sector to share views. These conferences declared further
guidelines to the relationship between environment and tourism. The main topics
discussed were as follows: facilitating knowledge and understanding, clarification of the
environmental and economic effect of tourism, enhancing equality and development,
increasing the living standard of the host communities, providing high quality experience
to visitors, protecting the quality of environment (Theobald, 1998; Sharpley, 2009).

25
The next milestone was the UNCED Conference7 organized in Rio de Janeiro in 1992
and its outcome, the „AGENDA 21”. Agenda 21 addresses the pressing problems of
tourism and aims at preparing the world for the challenges of the next century. As a result,
by 1996 WTTC8, UNWTO9 and the Earth Council10 elaborated the framework for tourism
guidelines (Agenda 21 for the Travel and Tourism Industry), in which sustainable tourism
was defined as follows (WTO, 1998, p. 21.):
“Sustainable tourism development meets the needs of present tourists and host regions
while protecting and enhancing opportunities for the future. It is planned to manage
resources in a way that people can fulfil their economic, social and aesthetic needs while
preserving basic ecological processes, biodiversity, life supporting systems and cultural
integrity of different peoples and groups.”
Beyond the definition of sustainable development of tourism the next step is the
acceptance of Global Code of Conduct. The Code covers the role of tourism in
suppressing poverty and improving quality of life as well as the facilitating roles of the
stakeholders. In addition, it gives guidelines how to encourage sustainability principles
(UNWTO, 2001).
Two years later the UNWTO Millennium Conference of Tourism Leaders, which
concluded in Osaka, adopted a declaration laying down sustainable development as the
only alternative of tourism development. A year later, the Johannesburg Summit targeted
the clarification of tasks and set up priorities of international tourism tailored to
stakeholders such as tourism industry, governments, international and non-profit
organizations (Tasnádi, 2002).
7 United Nations Conference on Environment and Development 8 World Travel and Tourism Council 9 World Tourism Organization 10World Council

26
Year Event Main contribution to the topic
1980 Manila Declaration Reference to the importance of state involvement in the social and
ethical supplement to tourism development
1987
UN’s World Commission
on Environment and
Development
Our common future / establishing major guidelines
1989 The Hague Declaration Emphasis of the preservation of integrity of natural, cultural and
human environment
1990 Globe’90 and 92’ Clarification of the relationship between environment and tourism
1992 UNCED Agenda 21 Further clarification of the guidelines of sustainable development, its
breakdown into sectors
1996 Agenda 21 for the Travel
and Tourism Industry
Definition of sustainable tourism, adaptation of sustainable
development guidelines to tourism
1999 Global Code of Conduct Outlining the role of tourism in suppressing poverty and in improving
quality of life
2001 Osaka Millennium
Declaration
Sustainable development as the only alternative of tourism
development
2002 Johannesburg Summit Definition of the priorities of international tourism focusing on the
stakeholders
2007 Davos Declaration Greenhouse gases and climate change
2010 Hainan Tourism
Declaration
Coping strategies to tackle the difficulties caused by the crisis,
defining millennium goals
2012 RIO+20 Evaluation of tasks undertaken in Agenda 21, ensuring the political
support of fair and sustainable future
Table 1: Milestones in sustainable tourism development
Source: Own elaboration
After the Johannesburg Summit, the practical issues of sustainable tourism were dominant
(the detailed description of the events is summarized in Annex 1). The issues of the setting
up a regulatory framework, developing indicators and measuring tools, encouraging
partnership and cooperation were often discussed between 2008 and 2010. Tourism has
also been committed to the awareness-raising of several issues. The UNWTO made steps
toward the reduction of poverty and inequalities in frame of the ST-EP programme
(Sustainable Tourism-Eliminating Poverty) launched in 2002. In 2007, Davos
Declaration outlined several actions in context of greenhouse gas emission and climate
change (UNWTO, 2007a). The preservation of natural resources of tourism and
biodiversity have become a focus of attention in 2010 (UNWTO, 2010b). 2010 was the
year of summary and foresight. In Hainan Tourism Decleration coping strategies to tackle
the difficulties caused by the crisis, positive conditions of development and the
importance of cooperation were emphasized (UNWTO, 2010b). The Millennium
Development Goals of UNWTO for 2015 called the attention to the role of tourism in
eliminating extreme poverty and hunger, facilitating gender equality, environmental
sustainability and global partnership (UNWTO, 2010c).
In addition to clarifying and regulating the frames of the demand side, tourism also
addressed the supply side. Several programmes have emerged which support the

27
understanding and commitment of consumers (eg.: The International Ecotourism Society,
Green Travel Guides, or Responsible Tourism Networking). Their importance is
inevitable, their significance will intensify with the development of communication
technology and the paradigm of new management. As Prahalad and Ramaswamy (2000)
states, the consumers stepped out of their traditional role and fundamentally change the
dynamics of the market. Nowadays the consumer is not only a buyer but a partner in value
creation. He is not a single individual but part of an evolving social and cultural
establishment. As such, the consumer has a fundamental role in the implementation of
sustainability principles.
2.4. The role of stakeholders in enhancing sustainable tourism
The concept of sustainability ensures the consideration of economic, environmental,
social, cultural and ethical aspects of development only with the involvement of a wider
range of stakeholders. The implementation of such principles into practice is based on the
encouragement of bottom-up organization, democratic structure and the enhancement of
community development. The examination of tourism cooperation and partnerships
therefore has been an area of emphasis for the past decades.
The high number of stakeholders in the sector poses a plethora of challenges in
determining objectives and responsibilities of each of them. This is caused, in one part,
by the constant turnover of concerned parties and, in another part, by the situational nature
of their influencing power. Nevertheless, major tasks can be outlined at group level, to
see how the consumer fits into the system.
Based on Heiland (1999 in: Strasdas, 2001), Stasdas classifies the stakeholders of tourism
development along their political activity and power of influence. Along these
dimensions, he distinguishes between policy decision makers (control subjects;
Steuerungssubjekte), policy influencers, and policy addressees (control objects;
Steuerungsobjekte). Policy decision makers are state actors such as the government,
public administration, the parliament, or political parties. Also, NGOs with increasing
governmental responsibilities can also be classified here. Political interest groups and the
population through public disclosure make up the group of policy influencing
stakeholders. These stakeholders do not necessarily actively shape tourism-related

28
processes, but can influence them through their activities, votes and public opinion. The
third group is made up of actors executing political decisions.
The political and economic actions of each individual actor are defined by their respective
interests and goals. Strasdas (2001) uses the following classification for these interests:
Material vs. ideal interests: Material interests are primarily of economic nature
(e.g. satisfaction of basic needs, risk minimization), but they equally include
elements such as the preservation of the natural environment in order to assure
healthy living conditions. Ideal interests are psychological, socio-cultural, or
religious in nature. They are typically based on specific values or attitudes, and
are at the source of goals such as freedom, pleasure, recognition, or power. In
certain cases ideal interest can go hand in hand with material interests, allowing
for potential overlaps between the two categories.
Individual vs. collective interests: Certain actors’ or interest groups’ individual
interests can often conflict with other actors’ interests or with those of the general
public. The role of managing these conflicts of interest generally falls back to the
state, or social control at large through providing an appropriate regulatory
environment.
Tangible interests vs. self-interests: Collective actors such as special government
departments seek to assert in their carrying out of their functions interests that
pertain to both the common good and their own particular sake (such as the
maintaining or increasing of their activity, power and influence).
Short-term vs. long-term interests: The actions of actors can often be described as
primarily motivated by the realization of short-term interests. However when
taking limited resources into consideration, this approach may interfere with the
stakeholders’ long-term interests. Putting long-term interests above short-term
interests is only rational if the latter are not considerably impaired and if sufficient
predictability is ensured.
Direct and indirect interests: The ultimate goal of all action is the realization of
direct interests. Since the direct path is not always possible, actors may choose
instrumental indirect paths to support the realization of the direct interests. An
example of instrumental indirect goals is the gathering of power or knowledge in
possession of which the realization of direct objectives becomes more likely.

29
In another approach, Inskeep (1994) defines the government, the tourism industry, local
and international advocacy organizations, the local population and visitors as the most
influential actors in the development of tourism.
In the implementation of sustainability principles into practice governments play the most
important role since they can regulate the market and encourage stakeholders through the
political innovations. In order to preserve a good shape of environment, the government
should ensure that the environmental damage caused by corporations and locals for the
sake of developing the economy will be compensated from natural investments financed
by tax revenues (Kerekes, 2011). It is the government’s responsibility to integrate the
principle of sustainable development into the general planning process. To achieve this a
cooperation is necessary with governmental and non-governmental international
organizations, with NGOs, tourism industrial representative and with the population
(Puczkó és Rátz, 2005).
The OECD lists the following policy instruments governments can take into account to
influence consumer decision-making and to promote more sustainable consumption:
economic instruments (waste fees, taxes on energy and water use, subsidies for
green energy, tradable permits, etc.);
regulatory instruments (waste management directives, energy-efficiency
standards, extended producer responsibility regulation, regulations on
environmental labels, water quality standards, etc.);
social instruments (public information and environmental awareness campaigns,
education, public debate and participatory decision-making processes, support to
voluntary citizen initiatives, partnership with other actors, etc.);
other tools (development of sustainable consumption indicators, incentives for
environmentally superior technological innovation and diffusion, infrastructure
provision, etc.) (OECD, 2002).
In summary, governments are responsible for creating an environment to support
sustainable decisions and for enhancing new social norms and values. As a result, the
society will demonstrate support as responsible consumers and as active citizens for
sustainability measures.

30
Corporate players are the driving factors of an economy built on sustainable consumption
through their investments and innovations. They can follow and shape the awareness of
consumers on sustainability with their educational programmes addressing the social
consequences of consumption, value chain cooperation, their sustainable value
propositions, products, services and communication (WEF, 2011). Its first and the most
generic step of this process is to integrate the principles of sustainable development into
the management system of tourism companies thus ensuring that the whole operation of
the company meets the dedicated principles in all areas (Puczkó and Rátz, 2005).
A further step is to make marketing activities of tourism companies transparent which is
indispensable for creating trust in this field. Standards such as the Framework for
Responsible Environmental Marketing Communication give basic guidelines for changes
in tourism (ICC, 2010).
Choice editing11 is a mutual responsibility of the government and corporations.
Producer/service provider and selling companies (tourism wholesalers, hereinafter tour
operators and agencies) are shaping consumers’ decisions through activities such as
rejecting to sale certain tourism products/deals. The government supports this with the
regulation of the sector detailed above.
Local and international advocacy organisations support the above-mentioned processes
and interactions. They facilitate
consumers’ commitment and access to information, and when necessary, exert pressure
on the government and market actors. Regarding tourism development, these institutions
mainly represent the interests of the industry, public opinion and local populationss, as
well as the protection of natural and cultural heritage (Puczkó and Rátz, 2005).
Local population has a liaising, regulating and cultural mediating role between the
destination and other players. As citizens, it is their responsibility to protect the
environment, to encourage actions for sustainability and the voluntary participation
thereof.
11 Sustaining choices aims at the withdrawal of unnecessary harmful products and solutions. This intends
to make consumers’ decisions easier.

31
Beyond their responsible behaviour and purchase decisions, visitors equally play a role
in diffusing innovation and influence the market through formulating their needs as agents
of the demand side. As citizens, they can further support state initiatives and regulations.
In case of a higher involvement, their participation can also be extended to include social
work.
A long term economic, environmental, social and political well-being of the stakeholders
require everybody’s commitment.
Figure 3: Stakeholders’ interactions in consumer
Source: WEF (2011)
Concerning the common responsibility Budeanu (2007b) pointed out that compared to
state and corporate efforts consumers show a significantly lower level of commitment
toward sustainable life style and the support of responsible tourism services. This is
reflected in the fact that the tools (financial incentives, eco-labels, certificates, marks,
communication, promotional campaigns) applied to achieve consumer responsibility had
less results in tourism than in other industries (Martens and Spaargaren, 2005). This is
supported by Chafe’s (2005) results whereby tourists demonstrated a positive attitude
Social influence
Companies
Branding Pricing Promotion
Government
Family
Friends, age group
Culture/values
Education
Choise editing
Investments
Co-operations
of leading
companies
Choise editing
Legislation
Taxing / aids
Social and mainstream media
Trade unions
NGOs
OUR WORLD

32
toward sustainable tourism, still, only one of 20 travellers acted accordingly and chose a
responsible deal, pro-environmental travel or purchased local products.
Taking into consideration that the primary goal of leisure travel is relaxation,
entertainment and the leaving of problems behind, and also venue is usually a new
environment which is often associated with a low level of the individual’s perceived
behavioural control, the above trend is less than surprising. The task is therefore given to
the industry to change this. Governmental and corporate actions addressing this issue
require a deeper understanding of tourism consumption. Bearing this goal in mind the
following chapters will detail the main features and relationship of sustainable tourism
consumption.
3. SUSTAINABLE CONSUMPTION AND ITS CHALLENGES
According to the traditional economics, the basic goal of consumption is to create
individual and collective welfare so that the consumed products and services help the
individual meet their needs and desires. Based on the individual’s rationality, traditional
economics assumes that the consumed goods contribute the individual’s welfare through
their usefulness.
In context of the above-mentioned links, we have to emphasize that a person struggling
to meet his/her vital needs can be associated with pure rational behaviour but citizens
living in well-being is characterized with a more complex motivation system. The
exercise of the quality of life can be described with several factors. This is confirmed by
the results of Donovan et al. (2002) whereby consumption costs almost doubled in Great-
Britain in the past 30 years but this was slightly reflected in the satisfaction of the admitted
life.
The realization of the fact that consumption often meets false needs lead to the criticism
of consumer society. Scitovsky (1990) suggests that the commercial interests of modern
society generated artificial needs that removed the individual from his/her own well-
being. “Super consumption” as a reference to buying large volumes of fast moving goods
made the individual critical regarding his/her own decisions (WEF, 2011). The concern

33
appearing after gaining the goods (see the „keep up with the Jones” phenomenon12)
encourages the consumer to constantly review the correctness of his/her buying decision.
The comparison is carried out on a quite broad spectrum since consumption has several
other roles in modern society than its basic function. Beyond meeting the needs it
contributes to forming an identity, social differentiation as well as the identification of
the rationale of certain things (Jackson, 2005). As Kozák (2008) states, consumption
gives a real picture on the self. Consumption makes it clear where the person is positioned
in society.
The closeness of such modern society into unsustainable consumption patterns can be
derived from habits, routines, social norms and expectations, conservation effect of
dominant cultural values, structure of incentives, institutional conditions, difficulties in
accessing alternatives and limited choices (Jackson, 2005). The restructuring of such
complex system based on sustainability aspects requires the re-interpretation of our
existing consumption model. The first step is to introduce the concept of sustainable
consumption.
According to the official definition of CSD (1995), sustainable consumption can be
described as follows:
"Sustainable production and consumption is the use of goods and services that respond
to basic needs and bring a better quality of life, while minimizing the use of natural
resources, toxic materials and emissions of waste and pollutants over the life cycle, so as
not to jeopardize the needs of future generations.“ (Norwegian Ministry of the
Environment, 1994 in: Valkó, 2003, p. 12.)
The above definition highlights the main challenge of sustainable consumption: bring a
better quality of life while ensuring the individual’s and social well-being (Hofmeister-
Tóth et al., 2011a).
In order for sustainability criteria to prevail in tourism consumption, factors that most
determine tourism consumption need to be identified. The following chapter is dedicated
to the study of these factors.
12American saying, meaning our achieved results, acquired goods are constantly compared with the
reference group.

34
4. CONSUMERS’ ENVIRONMENTAL RESPONSIBILITY
The theory of transitive actions states that consumer as a mediator gives market signals
through his/her decisions which affect supply. According to this theory responsible
behaviour and the empowerment of consumers can be achieved by information sharing,
education and by fiscal incentives (Rumpala, 2011). It is a general approach that pro-
environmental behaviour is facilitated by awareness and public education (Devine-
Wright et al., 2004). The recognition of individual’s responsibility is an important stage
on the way to commitment. The gained knowledge and the overview of connections play
a role in this process.
4.1. Individual’s responsibility
Based on the approach of normative ethics, the socially responsible form of consumer
behaviour raises questions such as how the “good” can be defined, how we can act and
how we can think of consumption and environmental protection. This is a philosophical
question which concerns personal and social moral. Its complexity is reflected in the
various ways of responsible behaviour, thus its motivations may vary in a wide spectrum.
Responsible consumption entails two different motivations associated with consumption
intention (Moisander, 2007). The individual is on one hand driven by individual goals
and on the other by social goals that take into account the collective, long-term interests
of society at large. Since the situations allowing responsible behaviour often represent a
form of social dilemma (even a trap) or iterated prisoners' dilemma of multiple actors, the
reconciliation of private and collective consumption goals poses several difficulties
(Uusitalo, 1990). As Dawes (1980) points out, if we ignore how other players of the
society behave, each individual consumer reaches higher social payment if they do not
cooperate. At the same time, each member of the society gets no payment if nobody is
engaged in cooperative strategy.
Moisander (2007) proves the theory above with the example of the consumption of public
goods such as air which can be used by anybody but its maintenance requires the
cooperation of the society. The more consumers are engaged in this process, the better
the quality of air will be. It is the interest of responsible consumer is to cooperate in the
preservation of the quality of air. On the other hand, an individual may decide to behave
like a free-rider and just enjoy others’ contributions. Taking into account the responsible

35
behaviour usually requires more investment in terms of time, money or other resource,
the above-mentioned behaviour may happen with committed consumers, too.
In addition to the paradox detailed above, responsible consumption causes a complex
moral issue which requires a deeper understanding of the ethical side. This highlights the
ethical side of values and beliefs determining the interpretation of the question. Social
justice, personal rights, different perceptions of the good and the society are behind the
debates (Des Jardins, 1997).
4.2. The definition of socially responsible consumer
Responsibility in ethical sense is necessarily present in all decision making situations
where the decision has long term, significant consequences and besides the decision
maker others are also concerned in the outcome of the decision (Zsolnai, 2007). When
examining the influence of society on the environment, consumer has an utmost
importance. The way an individual behaves or decides (preference of certain products or
services based on the individual’s consideration) influences the environment and the
individual’s well-being (Jackson, 2005).
The prevalence of the social responsibility or the consumer dates back to the 70th.
Anderson and Cunningham (1972) made a distinction between high and low social
awareness based on certain demographical, socio-psychological and social economic
factors (Hofmeister-Tóth et al., 2006). The definition of a socially responsible consumer
is as follows (Webster, 1975, p. 188.):
“The socially conscious consumer can be defined as a consumer who takes into account
the public consequences of his or her private consumption or who attempts to use his or
her purchasing power to bring about social change.“
Based on the individual’s commitment, socially responsible consumption may appear in
different areas and forms. Pro-environmental behaviour belongs to these options. In the
following section I will detail this topic.
4.3. Pro-environmental behaviour and its forms
Environmental responsibility extends over several issues. Our decisions may cover the
following considerations: the cleanness of air or water, the preservation of oceans, wild
36
areas, energy resources, raw materials and endangered species as well as waste
management. In order to set up priorities in our behaviours, we should be capable of
identifying those behaviours that best influence environment.
Stern (2000a) suggests that pro-environmental behaviour may appear in four forms.
Besides pro-environmental behaviour in private sphere (consumption, usage, waste
management) an individual may be an activist representing a pro-environmental
organization or demonstration. He/she can have an indirect effect on the quality of
environment by supporting relevant regulations and being willing to pay higher tax.
Although this type of behaviour does not require such level of active involvement than a
behaviour change within the household, its effect is still more significant due to the fact
that the supported regulatory formats may modify the behaviour of several consumers
and corporations. Workplace is another space of pro-environmental behaviour. Since the
direct source of several environmental issues can be traced back to corporate behaviour,
the behaviour and responsibility of individuals within the organization can equally bear
have significant impact on social shift.
The environmental awareness of individuals as tourists can equally be manifested on
several levels.he commitment to this topic can be expressed in forms such as volunteering
or other activist duties (rescuing sea turtles in Mexico, working in a non-profit
organization to help pro-environmental behaviour, boycotting destinations endangering
wildlife etc.). The initiatives on sustainable development and the individual support of
tourism regulations represent a significant contribution. The individual may express
his/her responsibility as an employee of tourism sector or as a stakeholder of destination.
The most fundamental involvements, however, are the decisions and behaviour made as
a tourist.
4.4. Pro-environmental behaviour in leisure travel
The tourist’s commitment to pro-environmental behaviour can be determined by his/her
choice of service provider before the travel and by his/her behaviour during travelling.
Such decisions are highly influenced by the traveller’s expectations to gain experiences
and this can have an impact on the consequences of behaviour (see Figure 4.)

37
Figure 4: Experiences - Consumer’s decision - Consequences Source: own elaboration: Williams (1998,p. 15.) and Budeanu (2007b,p. 501.)
Past memories Others’ memories Promotions
Motives Costs
PLANNING
TRAVEL TO DESTINATION
SELECTING DESTINATION
EXPERIENCES GAINED AT THE DESTINATION
City tour Activities Shopping
Accommodation Local transport
TRAVELLING HOME
RECALLING
Dialogue
Videos, photos Souvenirs
Memories
Needs and desires
Satisfaction
TRAVELLING AND EXPERIENCING TRAVEL DECISIONS CONSEQUENCES OF THE
DECISION
Air pollution
Congestion
Noise
Excessive use of local
resources
Waste generation habits
Resource consumption
Conflict with locals
Disturbing locals’ living
space
Leakage
Smuggling dangerous
species
Decision on the travel deal
Decision on accommodation
Decision on the means of transportation
Decision on the way of
entertainment Decision on products and services
Visitor’s behaviour
Daily routine
routine

38
Decisions on travel starts with the selection and planning of destination, means of travel
and accommodation (Seddighi and Theocharous, 2002). Decisions on the elements of
the travel deal (train or air plane, green hotel or not etc.) highly influence the extent of
consumers’ environmental impact. Pro-environmental consumption in tourism can only
be achieved by the inclusion of efficient means of transportation (Martens and
Spaargaren, 2005) and by reducing travel distance (van den Bergh and Verbruggen,
1999). Budeanu (2007b) added a few more aspects to this statement: preferring
environmentally friendly hotels, non-intrusive visitors’ behaviour respecting locals’
interests, avoiding littering, lower resource consumption, reducing disturbing
entertainment, rejecting endangered species as a souvenir. Several researchers put the
focus on technological development instead voluntarily reducing consumption.
Kornevall (2002) state that the reduction of environmental impact can be achieved
through robust technology solutions.
In the view of the author of the present dissertation (In our view? / In my view?) change
ought to occur alongside choice editing (see Chapter 2.4.) in a mutually reinforcing
process, rather than separately. This approach requires that consumers should be willing
to cooperate.
The importance thereof is highlighted in Hertwich’s (2005) research, who identifies a
rebound effect in case of pro-environmental hotels. His results suggest that consumers
tend to use the cost savings from reduced consumption to pay for supplementary
consumption, therefore the overall environmental impact does not necessarily decrease
in most cases, but rather increases (Zsóka et al., 2011). Provided that the consumer is
aware of the fact that he/she chose an environmentally-friendly accommodation, he/she
tends to use resources in a more intense way. The examination of consumers’ behaviour
therefore cannot be limited to the choice of services providers during their holiday, their
behaviour on the spot is similarly significant. The traveller makes several further
decisions on the spot. These can be as follows (Budeanu, 2007b):
(1) decision on entertainment
(2) decision relating to services and products on the spot,
(3) behaviour on the spot,
(4) preservation of daily routines.

39
Entertainment facilities on the spot can be associated with serious environmental, social
and cultural impact. Environmental impacts may include the negative effect on
biodiversity, the air pollution of means of local transport, ignoring a well-established
waste management system, littering.
The quality of life of the locals influenced by tourism is a social and cultural aspect.
Cultural, status related, economical and religious differences between locals and tourists
may lead to conflicts and divide locals as well as generate negative attitude towards
tourism (Holloway, 1998 in: Budeanu, 2007b). The money of tourists spent on the spot
determines if the given destination is forced to import certain products or if the destination
can meet the needs by utilizing local resources. It seem now obvious that these tiny
decisions (eg. buying food, souvenirs, cosmetics) may be associated with serious impact.
Swarbrooke and Horner (2007) concluded in their definition on pro-environmental tourist
profile that travelers of higher environmental awareness do not choose far destinations,
they protect the harmony of environment and avoid typical negative behavioural forms.
In contrast, the less committed are only superficially concerned about the impact of their
visitation.
Dolnicar (2004) examined travellers with low carbon footprint and found that for these
people wild nature means an important attraction. Crouch et al. (2005) outlined a broader
picture. Their results conclude that a pro-environmental tourist is between 46-55 and
he/she spends less of his/her discretionary income on home decoration or overseas trips.
Obtaining his/her travel related information is based on travel guides, he/she is not
concerned about advertisements. His/her driving factors are cultural offers, sport, the
sense of light and free movement, learning, avoiding traffic and familiarizing with locals’
life style. The biocentric segment of Fairweather et al. (2005) highlights another aspect
of pro-environmental tourist. The members of this group are characterized with pro-
environmental attitude, interest in eco-labels which they also try. If choosing an
environmentally-friendly accommodation, they are willing to pay premium price.
Depending on how pro-environmental tourist is defined, their image can be quite diverse.
Dolnicar (2010) reviewed the literature on pro-environmental tourism and concluded that
pro-environmental tourists have a stronger pro-environmental attitude, they have a higher
concern on environment and they belong to the upper category in terms of income and
qualification.

40
4.5. The ideal visitor and the way towards them
Based on the guidelines drafted by UNEP and WTO (2005) the incentive of sustainable
consumption in tourism can be described with influencing travel decisions and regulating
visitors’ flow and behaviour. As a result they determine supported and non-supported
visitations as well as they offer an option for feedback through a benchmark to measure
travellers’ decisions and behaviour.
Concerning the influence on visitors’ flow and decisions, the UNEP and the WTO
outlined the following areas (UNEP and WTO, 2005).
Date of travel Expanding the season and stimulating off-season travels can encourage
sustainability.
The place visited
The determination of the number of visitors at certain areas based on
strategic aspects. The aspects should take the supporting capacity of the
place into consideration.
Means of transportation
used
Encouraging transportation of less environmental impact. Reduction of
the use of aircraft or own car.
Selected tour operators and
enterprises
Encouraging consumers to buy from operators representing
sustainability.
Group size Limiting the number of tourists arriving at the same time.
Duration of stay A longer stay is more advantageous for the host community and has less
environmental impact than shorter and more frequent travels.
Table 2: Major guidelines to influence the flow and decisions of visitors
Source: UNEP and WTO (2005)
In summary, ideal visitors engaged in sustainable tourism behave in a way that
demonstrates respect for host communities, they do not generate aversion, do not generate
aversion, buy local products, are interested in natural, cultural and historical attraction of
the destination, reduce personal environmental impact (reduce water and energy
consumption, littering, collect waste selectively), support social and preserving initiatives
(financially, voluntarily or in other ways), make less frequent but longer trips, buy travel
products form sustainable operators.
The scope of tourism concepts based on the principles of sustainability is embarrassingly
wide. Consumers should be supported to find, assess, choose and use these services.
Beyond the easy access to and the transparency of the information and products, the
traveller should be ensured about their credibility. Certifying and labelling systems play

41
an important role in this. Ensuring proper infrastructure, sharing best practices and
codifications as well as regular feedback also contribute to progress.
This supporting system is indeed an effective tool in facilitating sustainable tourism, but
we should also bear in mind how and when the consumer reacts. The following theories
will therefore explain which factors influence the individual in developing pro-
environmental behaviour.
5. MAJOR THEORIES OF PRO-ENVIRONMENTAL BEHAVIOUR
5.1. Rational decision making and its limitations
Economics is based on the fact that consumer is a rational entity. As such, consumer
pursues self-interest and profit maximizing (Székely, 2003). Based on the rational choice
model, the decision maker maximizes its own utility function. In order to do his, the
decision maker’s preferences should be transitive and complete in the dimension of
available decision alternatives (Zsolnai, 2007). The above-mentioned approach of
rationality raises several questions. These questions cover the over-expectation relating
to the decision maker’s cognitive capability and the limitation of information.
As Kahneman (1997) suggests that decision makers are not capable of estimating the
realistic future value of their actions and they seem to be wrong in judging their past
decisions.
Another limiting factor of the individual’s rational behaviour is emotion. In several cases
where rational choice model leads to irreconcilable conflicts it is the emotional
commitment that finally makes the decision (Frank, 1988).
The self-interest focused interpretation of rationality therefore does not reflect the
complex motivation background of human decision making since in addition to self-
interest, obligation, loyalty and goodwill also play role in decision making (Zsolnai,
2007). Human behaviour is characterized by social, moral and altruistic elements as well
as following self-interests.

42
This was proven by Weber’s (1967) statement on social action which describes individual
behaviour from the aspect of zweckrational (purposive), wertrational, (value-oriented),
affective and traditional driving factors. In case of zweckrational behaviour, the action is
mainly determined by the expectations relating to the behaviour of the outside world. The
individual considers this expectation as a “tool” or “condition” to successfully achieve
his/her rationally chosen and revised goals. On the contrary, wertrational behaviour
determines action based on the individual’s belief in ethical, aesthetic, religious or other
values of a certain behaviour independently of the success. Affective behaviour defines
action based on emotional situations. Traditional behaviour highlights the long
established traditions, habits.
It seems now obvious that rationality plays an important role in decision making
processes, although this is only a starting point in comprehending socially responsible
behaviour. This approach does not aim to give a comprehensive explanation on the
normative, affective and cognitive dimensions of behaviour (Hofmeister-Tóth et al.,
2009).
5.2. Approaches of self-interest or pro-social motives
According to the early models, the development of environment related attitudes is often
explained by ecological knowledge (Dispoto, 1977; Lounbury and Tournatsky, 1977 in:
Zsóka, 2007). Empirical researches although pointed out that environmental attitudes as
a result of ecological knowledge do no obviously lead to pro-environmental behaviour.
As a result, the focus of examinations had been put on the relationship between attitude
and action.
Depending on the motives of pro-environmental behaviour, the examination of this
relationship can rely on two theoretical frame (Bamberg and Möser, 2007). Those who
trace pro-environmental behaviour back to pro-social motivation, relied on the norm-
activation model of Schwartz and Leonard (1977) and further results based on this model.
On the contrary, all who considered self-interest as a more important motive, rely on the
rational choice models, such as Ajzen’s (1991) planned behaviour model. The following
part of my dissertation will detail these two approaches and the relating models.
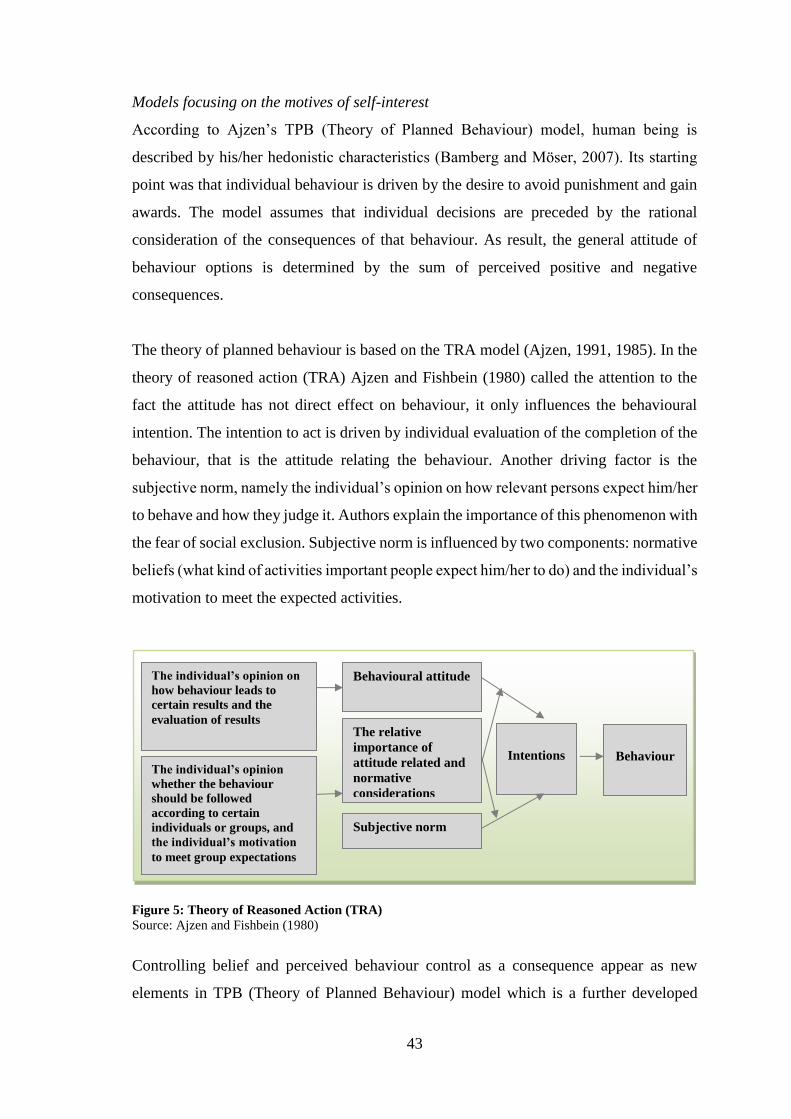
43
Models focusing on the motives of self-interest
According to Ajzen’s TPB (Theory of Planned Behaviour) model, human being is
described by his/her hedonistic characteristics (Bamberg and Möser, 2007). Its starting
point was that individual behaviour is driven by the desire to avoid punishment and gain
awards. The model assumes that individual decisions are preceded by the rational
consideration of the consequences of that behaviour. As result, the general attitude of
behaviour options is determined by the sum of perceived positive and negative
consequences.
The theory of planned behaviour is based on the TRA model (Ajzen, 1991, 1985). In the
theory of reasoned action (TRA) Ajzen and Fishbein (1980) called the attention to the
fact the attitude has not direct effect on behaviour, it only influences the behavioural
intention. The intention to act is driven by individual evaluation of the completion of the
behaviour, that is the attitude relating the behaviour. Another driving factor is the
subjective norm, namely the individual’s opinion on how relevant persons expect him/her
to behave and how they judge it. Authors explain the importance of this phenomenon with
the fear of social exclusion. Subjective norm is influenced by two components: normative
beliefs (what kind of activities important people expect him/her to do) and the individual’s
motivation to meet the expected activities.
Figure 5: Theory of Reasoned Action (TRA)
Source: Ajzen and Fishbein (1980)
Controlling belief and perceived behaviour control as a consequence appear as new
elements in TPB (Theory of Planned Behaviour) model which is a further developed
The individual’s opinion on
how behaviour leads to
certain results and the
evaluation of results
Subjective norm
The individual’s opinion
whether the behaviour
should be followed
according to certain
individuals or groups, and
the individual’s motivation
to meet group expectations
The relative
importance of
attitude related and
normative
considerations
Behavioural attitude
Intentions
Behaviour

44
version of the theory of reasoned action. In the course of defining behavioural intention,
the individual takes his/her behavioural attitude into account and also considers the
chance to change this behaviour. Ajzen’s model puts significant focus on the role of
perceived behaviour control which influences behaviour not only through the intention to
act but in a direct manner, too.
Figure 6: Theory of Planned Behaviour (TPB)
Source: Ajzen (1985, 1991)
This theory has been applied in several areas of tourism for choosing destination (Lam
and Hsu, 2006; Sparks and Pan, 2009), examining risk and uncertainty experienced when
travelling (Quintal et al., 2009) and for the satisfaction relating to holiday experiences
(Bigné et al., 2005). Han et al. (2010) used this theoretical framework to explore
consumers’ intentions relating to eco-hotels. Results show that attitude, subjective norm
and perceived behaviour control positively influenced the eco-hotel related intentions.
After examining the relationship between influencing factors and intentions they
concluded that there is no significant difference between active and passive pro-
environmental consumers in this respect.
Models emphasizing pro-social motives
Several researches on pro-environmental behaviour came to the conclusion that such
behaviour can sometimes be an outcome of altruistic and moral reasons. Jackson (2005)
Intentions
Behaviour
Belief about
behaviour
Behavioural
attitude
Normative
belief
Subjective
norms
Belief on
control Perceived
behavioural
control
Actual behavioural control

45
added that although there are situations whereby pro-environmental behaviour is driven
by self-interest, usually these behaviour are caused by moral reasons.
The negative impact of an individual’s behaviour on environment is not always imputable
to the actor but to someone else and at a different time. It is possible therefore that the
individual is not concerned directly about the impact of his/her behaviour on others, still
his/her need to integrate into the society forces him/her not to behave in the antisocial
way. The presence of others’ expectations in the individual’s behaviour points out to the
relationship between pro-environmental behaviour and norms (Jackson, 2005).
Biospheric value theories based on New Environmental Paradigm of Dunlap and Van
Liere (1978) play an outstanding role in theories explaining moral and normative
dimensions of human behaviour. Early normative models trace pro-environmental
behaviour back to its value orientation. As a result, pro-environmental behaviour is
primarily based on pro-social and moral values. Schwartz and Leonard (1977)
distinguished mainly between a ‘self-enhancement’ value orientation and a ‘self-
transcendent’ value orientation. Biospheric value model is built on a hypothesis saying
that people characterized with self-enhancement values show less commitment to pro-
environmental behaviour than those people who are mainly characterized with self-
transcendent values. Following researches pointed out to a third dimension namely the
values focusing on environment separately from altruistic and pro-social behaviour.
Dunlap and Liere (1978) elaborated the New Environmental Paradigm (NEP) based on
biospheric value orientation. They believed that environmental issues are partially caused
by values, attitudes and beliefs prevailing in a society. Ecological crisis is caused by the
dominant social paradigm (DSP) that can be described with the belief in well-being, over-
trust in technology and science, private property, limited state interventions and the
commitment to a laissez-faire type economic management (Dunlap and Liere, 1978). As
environmental issues became more visible, these guiding principles were questioned from
many aspects. As a result, an ecosystem shaping beliefs had been identified by the 70th
which treated humans as part of nature and not as someone living above all living
organism. Such environmental paradigm was associated with fundamental values which
put the focus on the limits of nature and the preservation of natural balance.

46
Several researches examined the relationship between biospheric, altruistic, egoistic
value orientation and pro-environmental behaviour (Snelgar, 2006; Schultz et al., 2005;
Schultz, 2000, 2001; Stern et al., 1993; Stern et al., 1993, 1995). However, no obvious
correlation was identified between certain value orientations and pro-environmental
behaviour. Pro-environmental behaviour may appear relating to all three value
orientations. Biospheric value theory is partially explained by the differences, mentioned
earlier, between attitude and actual behaviour. The fact that an individual has pro-social
or pro-environmental values and attitudes will not necessary mean that all these will be
reflected in his/her actual behaviour. The dominance of egoistic values may lead to pro-
environmental behaviour, provided that environmental degradation can influence the
quality of the individual’s life. A further difficulty is that disposition factors influencing
behaviour can hardly be separated from situational and contextual variables (Jackson,
2005). Individual’s values may vary depending on context or situation. This is proved by
the results of Biel and Nilsson (2004, in: Jackson, 2005) whereby individual’s
environmental values can be significantly different at work place and in the personal
environment. We can assume that such differences appear on the spot of leisure travel but
this assumption has been proven, yet.
Another example for such theories is the Norm Activation Model of Schwartz and
Leonard (1977). Schwartz suggests that the only direct element of pro-social behaviour
is the personal norm. He believes that this relationship is not influenced by behavioural
intention. He defines personal norm as a sense of moral obligation which a human can
feel in order to commit to pro-social behaviour.
Figure 7: Norm Activation Model
Source: Schwartz (1977)
Awareness of Consequences
(AC)
Ascription of Responsibility
(AR)
Personal norm Behaviour

47
The norm concept created by Schwartz is different from the subjective norm defined in
the theory of reasoned action. According to the Norm Activation Model, personal norm
is directly influenced by two psychological factors: the individual is aware of the
consequences caused by his/her behaviour (awareness of consequences or AC13) and the
acceptance of the fact that the individual is responsible for the consequences (ascription
of responsibility or AR14).
The models underlines that the awareness of consequences and ascription of
responsibility is not only a cause of personal norm but their strength moderate the
relationship between personal norm and behaviour.
Similarly to the planned behaviour model, norm activation theory focuses on the
interaction between personal norm and its influencing psychological factors as well as on
the assumption that personal norm is sufficient to pursuit a behaviour. Jackson (2005)
however points out that external contextual and situational factors cannot be excluded
when examining the relationship between personal norm and behaviour since their
interaction may influence the relationship.
There is a more complex view in the Value-Belief-Norm Model (VPN) of Stern et al.
(1999) which links biospheric value model with the norm activation model of Schwartz.
Their approach is that the acceptance of ecological world-view, and NEP, precedes the
knowledge of consequences in the norm activation model.
13 Awareness of Consequences 14 Ascription of Responsibility

48
Figure 8: Value - Belief - Norm Model
Source: Stern (2000a)
Their results show that the rate of acceptance of the NEP is related to related to biospheric,
altruistic and egoistic values. The relationship is positive in the two former cases, while
it is negative in the latter. The more the individual shares egoistic values, the less he can
accept the new environment paradigm. The acceptance of the paradigm is in positive
interaction with the knowledge of consequences (AC). The more an individual accepts
NEP worldview, the more he is aware of the consequences. This has and impact on the
recognition of responsibility relating to the individual’s activity (AR). The process
continues with the integration in the personal norm which finally leads to pro-
environmental behaviour.
5.3. The influence of habits and routines in behaviour
Human behaviour in general is target oriented. This does not mean that the individual’s
each action is preceded by conscious cognitive evaluation. In many cases the consumer
can be characterized with instinctive, automatic and emotional behaviour which cannot
be associated with the presence of conscious control. This explains that in some cases we
act against our well defined intention (Jackson, 2005). In other words, no matter if we
have a positive attitude towards pro-environmental behaviour and no matter if we learn
pro-environmental social norms, it is by no means certain that this will be reflected in our
_
+
+
VALUES BELIEFS NORM BEHAVIOUR
Biospheric
Altruistic
Ecological
world-view
NEP
Egoistic
Awareness of
Consequences
Ascription of
Responsibility
Personal
norm
Activist
Non-activist,
public sphere
related
behaviour
Behaviour
in the private
sphere.
Organisational
behaviour

49
actual behaviour. This phenomenon challenges the models mentioned above which
examines behaviour based on behavioural intention or values.
According to cognitive psychology mental processes can be automatic and controlled
(Johnson and Hasher, 1987). Controlled processes involve intention, control, efficient use
of cognitive resources and awareness. These characteristics do not appear in automatic
processes (Jackson, 2005). There is no strict borderline between controlled and automatic
processes. Controlled processes often become automatic as soon as we learnt them.
Kahneman and Treisman (1984) emphasized that both automatic and controlled attributes
appear in mental processes.
The rate of control and automatism applied in our decisions depends on the action itself
and its context. Jackson (2005) suggests that the balance of control and automatism is
determined by three factors: by the degree of involvement, by the degree of perceived
complexity of the decision and by the degree of importance of the decision. As the
involvement of the decision maker gets higher, the rate of control increases. As a
consequence, the actor’s concern is higher if the consequences of the action is more
significant. If individuals can have different choices and these choices are characterized
with several attributes and if the consequences of these attributes cannot be predicted then
the decision will be made under more control due to the complexity of the situation.
Finally, time limitation, cognitive capacity and the access to information also influence
the rate of cognitive control in the decisions.
Besides controlled and automatic processes heuristics should also be mentioned. They are
simple instructions or cognitive signs that do not require a whole cognitive evaluation.
Consumer behaviour reflects this in choices based on brand, eco-label (eg.: certificate) or
price. This however leads us to decision making based on routine and habits.
We have a lot of repetitive actions in our daily life which become part of the routine and
do not require cognitive effort. This is due to the fact the routine actions are typically
automated.
On the basis of the theory of rational decision, the habitual behaviour is considered to be
irrational. If we dig down to examine the habitual actions we can conclude that several

50
advantages are caused by the fact that we make our daily decisions based on heuristics or
routines with low cognitive process. Such available cognitive resources can be spent on
major decisions (Baumeister et al., 1998). Habitual behaviour proves to be a proper
strategy insofar as the decision situation does not change much.
Habitual behaviour is also associated with short-term awards and incentives. Routines
can therefore overwrite the long term advantages of behavioural change or intensive
intention through the immediate sense of award. Habits contrary to the intention entails a
cognitive trap that may lock the individual into his/her own routine (Verplanken and Faes,
1999).
It is therefore easy to understand that the examination of the individual’s behaviour in the
context of tourism should be extended beyond his/her behaviour as a tourist. Provided
that pro-environmental behaviour is not part of our routines actions, it will be less
probable that the individual will start new behavioural patterns on the spot of vacation
where the different environment is already associated with bigger cognitive workload
than that of the home environment. It should also be noted that the individual’s
consumption habits become visible during holiday as well as the place related norms and
expectations can also influence how the individual can optimize his/her cognitive
capacity in relation to the adaptation to the place and the tasks to obtain experiences.
5.4. The influence of the individual’s social integration on behaviour
An individual basically lives embedded into a social system. His/her actions are
determined by the expectations and norms of the given area where decisions are made. In
other words, how the individual undertakes the difficulties in behavioural change depends
on how the surrounding supports him/her in this goal. The influence of society on
individual’ behaviour cannot be ignored when examining pro-environmental behaviour.
A common feature of the theories discussed earlier is that they treat humans as
individuals. As a result, the research on the environmental commitment process focuses
on the following factors: consumer’s attitude, values, beliefs and personal consideration
aspects. The TRA and TPB models described above attempt to demonstrate the effect of

51
social influence on individual decision-making via the subjective norm. Normative
theories make a further step to integrate social influences into their models.
The way an individual thinks of himself/herself determines his/her behavioural intention.
This idea is based on Festinger’s (1957) Theory of Cognitive Dissonance which suggests
that we experience dissonance in any situation where two cognitions are inconsistent.
Since we cannot cope with a persistent state of tension we are motivated to reduce or
eliminate it. As Mérő (2007) suggests, the individual following the least resistance will
change those cognitions causing cognitive dissonance that can be easier to change in order
to reduce the sense of inner tension.
The Spillover Effect by Thøgersen’ (1999) is built on cognitive dissonance. Based on this
theory, an individual’s pro-environmental attitude or behaviour in an area can be a good
predictor of his or her general environmental attitude and pro-environmental behaviour
in other areas. Following this logic we can assume that it is more likely for a person being
pro-environmental at home to act similarly at other places compared to the one who is not
concerned even at home. Positive attitude may extend to other actions and areas this the
pro-environmental behaviour can have a positive spillover effect. It is important to bear
in mind that the attempt to eliminate dissonant cognition may cause damage in our attitude
towards pro-environmental behaviour. In such cases the outlined process may shift into a
negative direction. This puts a further emphasis on the role of social norms and external
factors.
Another important aspect of this theory relating to this subject is that the behaviour itself
can shape positive attitude. As Thøgersen and Ölander (2003) pointed out people
collecting waste selectively will be more likely to demonstrate positive attitude towards
environmental behaviour independently of their attitude in collecting waste selectively.
Infrastructural and other investments into selective waste collection can be associated
with positive consequences such as the increasing number of the ones who collect waste
selectively and the improvement of the general environmental attitude of the participants
which can influence behavioural patterns.
In the same line of thought, Higgins’s (1987) self-discrepancy theory is based on the
differences between the ideal and the actual self-concept. In total Higgins identifies six

52
distinct types of self-concept: actual-own, actual-other, ideal own, ideal-other and ought-
own, ought-other. There can be further distinctions within these self-concepts which can
be associated with guilt, shame, confusion or other pleasant feelings. These feelings
motivate the individual to reduce him/her perceived differences. The reduction of
differences in a modern society is however often associated with the buying of material
goods (Hamilton, 2003). Hirsch (1977) suggests that a major rate of consumption focuses
on the individual’s positioning within the society. The quantity and quality of the owned
goods serve to express the consumer’s status and personal values (Csutora, 2012). This
thought brings us back to the root: How can the critical mass be developed if the society
we live in intensively promotes the obtained material goods?
Shaping the existing practice requires new forms of consumer commitment. Within this
process, consumer should be treated as a citizen or a member of a broader community
and not as an individual. This idea itself cannot be considered as a radical change.
However, in light of the fact that marketing has been focusing on strengthening the
individual’s individualist side for decades, new challenges arise when aiming to develop
new types of interactions with the consumers as citizens. Due to the technological
development of communication, several new initiatives appeared which already represent
a cultural move into a direction to sharing consumption instead of individually using them
in areas like transport (Uber car sharing), accommodation (Airbnb, CouchSurfig) or
sharing meals at home (Yummber).
Social networks The recognition of human relationships (families,
friends etc.) and the importance of place (place of
residence, workplaces, schools etc.)
The power of new communities and
networks
Opportunities due to the development of
communication technology (virtual spaces, network)
Cultural shifting from “me” to “we” Understanding and acting
Shared responsibility Creating value together
Table 3: Corner stones of the new patterns of consumer commitment
Source: own elaboration, based on WEF (2011)
The question on the form and type of actions an individual may engage in commitment
points out to the importance of another factor, namely the place.
53
5.5. The influence of person−environment on behaviour
Our behaviour is influenced by our physical environment. Dúll (2009) concludes that
environment similarly to language is a complex phenomenon that can be interpreted
through its molar units. Place is the unit of this analysis. Place is more than a pure
geographical location since this determines the interaction between space and people.
This interaction has three dimensions: perceived physical attributes, activities and
regulations at the given place and evaluations (affective components) (Dúll, 2009).
According to the person-environment theory there is a correlation between the
behavioural patterns and specific environmental conditions (Dúll, 1998). As Gump
(1990) points out, two persons behave more similarly on a given place than one person at
two different places. Brigham (1991) explains this observation with the fact that the
interaction between the individual and the environment entails an alignment between the
individual’s purposes and the environmental setup. The structure of the physical
environment influences social interactions thus effecting the locals’ coping strategies
(Evans et al., 1996, in: Dúll, 2009). Places inhibiting interactions may cause the lack of
interpersonal communication and alienation. The lack is such collective approach may
mean an important obstacle of sustainable behaviour (eg.: sharing goods, responsible use
of community goods). This can explain other cases whereby the same person follows
different consumption and behavioural patterns at different places. It is however more
important to study the influence of the given destination on arriving visitors’ behaviour,
whether this influence can cause changes and if yes, what reasons and directions stand
behind this change.
The difference between environmental attitude and actual behaviour can further be
explained with considering the place and its related personal relationship. Place
researches assumed that care for a certain place is caused by the constant interaction with
it (Tuan, 1977). Relph (1976) suggests that place can facilitate the sense of commitment
and responsibility. Beyond emotional bond the thorough knowledge of the place increases
the probability that the individual will demonstrate a protecting behaviour regarding the
aforementioned place (Kals et al., 1999; Pooley and O’Connor, 2000).

54
Place as an environment of experiences, social connections, emotions and ideas has an
important role in defining what taking care means (Tuan 1977). Place determines not only
the physical location of a space but human actions, social and psychological processes
happening there (Brandenburg and Carroll, 1995; Dúll, 2009). As a result, place is the
location of space which the society or the individual associate with meaning and
values (Halpenny, 2010).
A more specific definition of place leads to two approaches based on researches on
geography and sociology (Lewicka, 2011). The classic interpretation (Relph, 1976;
Tuan, 1977) suggests that place is a well-defined entity which is characterized with
special identity and historical permanence. Beyond this, it gives the opportunity for
pleasant recreation and for protection from dangerous and strange outer world. On the
contrary, liberal approach reflecting the global world states that place is a crossroad or
meeting point that enables interaction (Milligan, 1998 in: Lewicka, 2011) and cultural
diversity (Massey, 2004 in: Lewicka, 2011).
Various definitions of place are caused by the diverse and multidisciplinary examination
of its related phenomenon. The interaction between the individual and the meaningful
environment is discussed in environmental and community psychology, sociology,
cultural anthropology, gerontology, social geography, urban science, ecology and
economics. Due to its importance, this topic also appears in architecture and urban
planning, and also in the relationship between tourism and recreation (Lewicka, 2011).
As a consequence of different researches this topic entails several inconsistent
approaches. Several researches has focused on the clarification and on setting up a
common theory base since 1990 (Lalli, 1992; Giuliani and Feldman, 1993; Giuliani,
2003; Farnum et al., 2005; Trentelman, 2009; Scannell and Gifford, 2010b; Lewicka,
2011). Hereinafter I will discuss the definition and theoretical background of place
attachment as an interaction between the individual and his important environment on the
basis of the PPP (Person-Process-Place) tripartite model of Scannel and Gifford (2010b).

55
5.5.1. The tripartite model of place attachment
Place attachment refers to a positive emotional bond between an individual and a
particular place (Low and Altman, 1992). The term has become a focus of interest for the
past forty years (Sennett, 2000; Scannell and Gifford, 2010b). The following changes are
standing behind place attachment: globalization, increasing mobility, threats to the
beloved environment, losing cultural attributes (Relph, 1976; Sennett, 2000). Place
attachment is also put into the focus when other phenomena are examined. Place
attachment positively influences the visitations to public places and national parks (Kyle
et al., 2005; Moore and Graefe, 1994; Williams and Stewart, 1998; Scannell and Gifford,
2010b). Place attachment is also expressed in the pain and sense of loss that victims of
disasters experienced and in the process of moving or losing home (Billig, 2006; Guest
and Lee, 1983). The associated relationship between place attachment, environmental risk
perception and environmental attitude contributes to the explanation of pro-
environmental behaviour, too (Kyle et al., 2004a; Nordenstam, 1994; Vorkinn and Riese,
2001; Stedman, 2002).
The comprehensive explanation of place attachment in context of philosophy does not
seem to be consistent. The different approaches are summarized in Table 4.
Definitions Representatives
Place attachment is a multi-dimensional concept describing the bond
between the individual and the important places
Giuliani and Feldman (1993)
Low and Altman (1992 )
Place means a universal emotional bond that meets humans’ basic
needs.
Relph (1976)
Tuan (1974)
Place may include more sub-concepts such as place identity, place
attachment and place dependence. Jorgensen and Stedman (2006)
Place is an ancient bond creating the sense of belonging and the
desire to staying there. Hay (1998)
A bond on the level of city, home and neighbourhood. Kasarda and Janowitz (1974)
Place attachment is a bond determined by social factors. Woldoff (2002)
Place attachment is a bond determined by physical factors. Stokols and Shumaker (1981)
Place attachment is a bond determined by social and physical
factors. Riger and Lavrakas (1981)
Table 4: Definitions of place attachment
Source: own elaboration based on Scannell and Gifford (2010b)

56
Research directions relating to the different definitions indicate the broadening of the
theoretical background of this area. Scannell and Gifford (2010b) suggested a three-
dimensional theoretical framework to channel certain trends into structure and synthesis.
According to their model, place attachment is a multidimensional concept including the
dimensions of person, place and process (See Figure 9.).
Figure 9: The tripartite model of place attachment
Source: Scannel and Gifford (2010b, p. 2.)
The first dimension of the model is the person who is attached to a given place and refers
to its individually or collectively determined meanings. In other words, the individual
level is the relationship between the person and the place through events such as important
experiences, satisfactions or milestones in the individual’s life. In contrast, social level
refers to the symbolic meaning of the place shared by others (Low and Altman, 1992).
This is a starting point in studies on cultural, religious and gender differences.
By judging the overemphasis of individual differences Droseltis and Vignoles (2010)
called the attention to the importance of the examination of attachment to different places.
Examinations on place basically expressed two approaches by making distinction
between social and physical place attachment. Social attachment expresses the sense of
belonging or membership (eg.: friendship, family) and the emotional bond deriving from
Place
attachment
Person Place Process
Culture / group
religion
history
Individual
experience
realization
milestones
Social
social arena
social symbol
Physical
natural
built
Emotion
happiness
pride
love
Cognition
memory
knowledge
schemes
report
Behaviour maintenance of
proximity
place reconstruction

57
common past, interests or concerns (Raymond et al., 2010). Several researches
emphasized the social aspect of place attachment. Based on this, individuals attached to
places which help them enhance their social integration and group identity. Place
attachment at the same time can be traced back to the physical quality, characteristics of
the place. This physical quality may reflect built (houses, streets, buildings, non-living
internal spaces) or natural (lakes, parks, woods, mountains) attributes of the place
(Scannell and Gifford, 2010b). Attachment to the physical attributes of a place may vary
depending on the fact whether individual’s attachment to an attribute relates to general
place attachment or to a specific place. (Williams et al., 1992) brought an example to
point out that the interchangeability of a given place may vary depending on the fact
whether the individual is attached to the physical attributes (of a given wood) of a specific
place or he/she is attached to physical characters (of a wild landscape) of places in
general. Their results show that people who are attached to wild places in general more
often visited other similar places.
Regarding the influence of physical attributes on place attachment Stedman (2003) notes
that it is not merely the physical attributes that shape individuals’ place attachment but
more importantly it is what they symbolize. For instance, a developed environment
represents community, whereas a less developed one represents the wild. This finding
brought us back to the statement of Scannell and Gifford (2010b) whereby physical and
social aspects of the place may overlap.
The third dimension of place attachment is the psychological process. This dimension
aims to explain the psychological process along which the individual is attached to a given
place. According to Scannell and Gifford (2010b) process dimension is built on three
factors: affective, conative and cognitive components.
The most essential element of the relationship between a person and a place is emotional
attachment which appears in the majority of place attachment definitions. The
individual’s emotions relating to a place may come in different forms: love, satisfaction,
fear or hatred (Manzo, 2005). In spite of the fact that important places can be associated
with negative feelings, the literature on place attachment mainly focus on positive
emotions (Scannell and Gifford, 2010b; Halpenny, 2006).

58
The interaction between the individual and the place relies on cognitive elements. Such
elements may include memories, beliefs, information or meaning related to a place. Along
these elements, individuals give meanings to a certain place by making it part of their
self. Scannell and Gifford (2010b) suggest the following explanation for this: individuals
structure social information to be processed easily and to fit into the existing information
in a coherent manner. These pieces of information are ordered into cognitions or schemes
including subject or self related information and beliefs. Referring to the general place
dependence theory by Stokolos and Shumaker (1981), the authors argue that in case of
such attachments the scheme contains information that is common at places where the
individual wishes to attach to. Favourite place therefore means a scheme comprising the
knowledge and beliefs relating to that place and describing the individual’s relationship
with that special place. As a result, these cognitions form part of the self-concept.
The third process element is behaviour that is the attachment expressed through activities.
Place attachment is a positive emotional relationship between a special place and a person
which encourages the individual to stay nearby (Hidalgo and Hernandez, 2001). Place
attachment therefore is associated with a behaviour that maintains proximity. The
literature on homesickness shows that some individuals who have been absent from their
homes for an extended period of time express a great desire to return to or visit the place
(Riemer, 2000). This behaviour appears in different forms in case of the rebuilding of
disaster areas. As Francavigila (1978 in: Scannell and Gifford, 2010b) noted in relation
to the rebuilding of a destroyed area that although the reconstruction gave the community
an opportunity to reorganize and avoid already existing problems, it was still restored
based on the old structure.
In context of the place attachment related behaviour we have to point out that although
there might be some overlapping with territorial behaviour they are different types of
behaviour. While territorial behaviour is based on property and assumes control on the
place, place attachment behaviours are an emotional relationship even without any control
such as in case of community areas or sacred places. In addition, territorial behaviours
include marking, personalization, aggression, and territorial defence, whereas place
attachment behaviours include pilgrimages, social support, and place restoration
(Scannell and Gifford, 2010b). In the following, the review of place attachment
behaviours will be directed to the context of pro-environmental behaviour.

59
5.5.2. The interaction between place attachment and pro-environmental
behaviour
In the study of the relationship between place attachment and human behaviour, Vaske
and Kobrin (2001) observe a strong relationship between positive place attachment and
environmentally responsible behaviour. The authors point out that the relationship
between self and place identities influences behaviours ensuring the sustainability of the
given location as well as pro-environmental behaviour in other areas. With regard to the
latter, it should be noted that the spillorver effect is not clearly established and requires
further research. We can however state that positive place attachment is in relationship
with the individual’s intention to participate in the protection of the place (Williams and
Vaske, 2003).
The relationship between place attachment, behaviour and behavioural intention was
founded in the literature on community attachment. Based on the research by Wakefield
et al. (2001), those residents who had higher place attachment with their neighbourhood
are more likely to participate in civil initiatives than those who have lower attachment.
Mesch (1996) verifies the positive relationship stating that people with higher attachment
to neighbours are more likely to take action against social or physical change of their
environment. In their research on the same phenomenon, Sampson and Groves (1998)
concluded that higher attachment to neighbours encouraged locals to create norms in
accordance with the place and to support actions against criminality.
In the study of the relationship of residents with the local archipelago15 Kaltenborn (1998)
found three groups representing three levels of sense of place. After segmenting local
residents, the author compared the environmental intentions of the groups by drawing up
different scenarios on how their recreation decisions and pro-environmental behaviour
may influence the archipelago. Based on his results, the extent of place attachment had
an effect on residents’ reactions on environmental effects. Stronger place attachment was
associated with lower tolerance for increasing tourism and a higher concern about solving
environmental issues.
15 Femundsmarka National Park in Norway

60
Stedman (2002) studied the effect of place attachment on environmental behavioural
intention and showed that place related, emotional and identity based attachments
influence temporary and permanent residents in their commitment to place protecting
behaviour. Walker and Chapman (2003) concluded that almost all environmental
behavioural intentions were significantly influenced by place attachment.
Beyond the place of residence, Borrie and Roggenbuck (2001) in their study on care for
the wilderness found that following the visitation to a national park, visitors had higher
care for the environment than before the visit. Kyle et al. (2004b) in their study of
recreationists concluded that place identity increased during hiking and this was
associated with a more intense perception of negative environmental conditions.
Halpenny (2010) examined the interaction between place attachment and pro-
environmental behaviour in the context of national parks, and concluded that the
attachment to a national park positively influenced both the park-related and the general
pro-environmental behaviour.
6. PRELIMINARY RESEARCH STUDIES
A multi-stage preliminary study was conducted to support the final research phase. A
qualitative methodology was used in the aim of facilitating the selection of measurement
tools to be used in the final study and in the aim of outlining the research context. The
objective was to gain a better understanding of the dimensionality and structure of place
attachment as well as of appearing pro-environmental behaviours. As a next step, selected
scales were tested. Halpenny’s (2006) three-dimension place attachment, and park-
specific pro-environmental behaviour scales were tested. Based the results, a small-
sample survey was performed among university students to test and ameliorate scale
items for clarity and final structure. In the following I will proceed to the presentation of
each related study and the main conclusions thereof.

61
6.1. Qualitative examination of place attachment and pro-environmental
behaviour
An exploratory qualitative study was undertaken with the aim of gaining deeper insight
into place attachment and behaviour during the visit. The general research questions
guiding this phase were:
(1) What are the main topics with relevance to the place of visit mentioned during the
description of a holiday?
(2) What is the nature of the respondent’s relationship with the place?
a. Is the respondent attached to that place?
b. If yes, how is this manifested?
(3) By which types of pro-environmental behaviour can respondents be
characterized?
a. What kinds of activities did appear in responses and how can they be
categorized into groups?
b. Are there any activities that are mentioned but are not typical of the
respondent?
(4) Which types of environmentally harmful behaviour do characterize respondents?
a. Do respondents provide justification for these behaviours; if yes, how?
b. How can mentioned activities be categorized into groups?
6.1.1. Circumstances of the qualitative research
The qualitative study was conducted in the second quarter of 2011 among MA students
of the Consumption Theory and Customer Behavior course. Participation in the study was
voluntary, students were awarded extra points in class for participating in the study.
A total of 23 narratives were collected. Interviewees were between the ages of 23-25. In
terms of gender breakdown, there were 15 female and 8 male respondents. 11 respondents
indicated the capital, Budapest as their place of residence, 5 respondents indicated a
county seat and 7 respondents other towns. No respondent selected villages or large
villages as their place of residence.

62
6.1.2. Applied methodology
Narrative analysis was selected as the primary analytic framework for the research.
Narrative as genre is present in literature and in life alike. It is none else than a
chronologically structured story or tale (Szokolszky, 2004). The approach according to
which narrative understanding is a fundamental form of human thinking appeared in the
1980s. Born of this view, the field of narrative psychology is based on the assumption
that people construct meanings about themselves and the world by telling stories. Thus,
narrative analysis is a text-based empirical form of research which focuses on the ways
in which people make and use stories and how stories function (Szokolszky, 2004).
The application of this methodology was motivated by the criticism of question/answer-
type interviews. According to the criticism, interviews influence the respondent from
three aspects, namely: selected topics, order of questions, formulation of questions
(expressed in words), thus rendering research result biased.
The method is based on the assumption that minimizing the role of the interviewer will
allow the researcher to get access to a less influenced and more reliable picture from the
respondent’s perspective. The best possible tool to achieve this is a special manifestation
of everyday communication, namely storytelling (Jovchelovitch and Bauer, 2000). Based
on the above, respondents were asked to tell the story of a vacation that was particularly
determining to them mostly because of the particular place they visited. Since the
presentation of the core topic of a narrative interview significantly affects the
interviewee’s successfully achieving the given task, the guidelines by Jovchelovitch and
Bauer (2000) were followed during the formulation of the study’s question (See Table 5).

63
Guidelines Lessons for the focal topic
Informants should have some experience in the
initial topic.
This can ensure informants’ motivation to
share their stories in detail.
General context of tourism context, without
further thematic
The broad scope of available destinations
allows the interviewee to tell a story that
they can genuinely fill with a lot of
memories and experience.
The initial topic must be of personal and of social or
communal significance
Going on holiday as the most common
form of leisure travel
Informant's interest and investment in the topic
should not be mentioned
This would lead them to take an initial
position during their storytelling
Informants are asked to recall the most
determining vacation in terms of the
location rather than the most visited place
The theme should cover a broad scope to allow the
informant to develop a long story
The story telling of the holiday was
narrowed down to the most decisive
place so that place specific factors could
come out. No further limitations were
applied, providing further details is
within respondents’ discretion.
No further limitations were applied, providing
further details is within respondents’ discretion.
The central theme did not provided
guidance relating to dates, specific places
or travel mates or other company.
Table 5: Formulation of the focal topic
Source: own elaboration
Concerning the types of stories, the research relied on personal stories that the students
shared in writing. In order to receive a detailed story, respondents were instructed as
follows: as for a good talk, a story should have no limits, we ask you to write in a manner
and as much as you please. The given task’s formatting served the same purpose:
respondents were provided a given space to write their story (See Annex 3). The given
area visually supported the instruction to tell the story more in detail. Since interviewees
received the task in an electronic format, they had not limitations in terms of length. The
steps of the data collections are summarized in Table 6.
Decision points Choice
Defining types of stories Personal story
Identifying the source of stories
Corvinus University of Budapest, MA students in
Marketing
Choosing the context of the stories Interview
Triggering story telling Reminder, designated volume of text
Collecting stories In writing, in form of an essay
Table 6: Process of the analysis of the narratives
Source: Own editing based on Czarniaswska (2004, p. 15. in: Mitev, 2008)

64
Responses were processed with a thematic analysis using Atlas Ti 5.2 software. As a first
step, whole paragraphs were evaluated with some summary sentences. These sentences
were then broken down into keywords. Following the thematic breakdown a classification
system was set up to code each interview. For doing so, each interview was categorized
individually. The resulting categories were further classified into a coherent and
comprehensive system of categories which was capable of handling all the interviews.
6.1.3. Results of the content analysis
Most stories were characterized by two main structural units. In a first stance, respondents
reported on the context of their journey, followed by a detailed account of their holiday
experience.
In the course of defining the context, respondents mentioned the date and place of the
holiday and pointed out the reasons why they chose to write about that particular journey.
In addition, the means of travel, the route and the travel mates were also introduced.
The majority of the stories were linked to European locations. Two respondents reported
about oversees journeys, namely in to the USA and Mexico. While the former was a
family visit, the latter one referred to an adventure shared by friends. Within Europe, most
respondents mentioned Croatia and Montenegro and popular metropolises such as
Barcelona, Paris, Amsterdam or Prague. Popular holiday resorts (Corfu, Crete, Mallorca)
constituted another category of memorable locations indicated domestic places:
Kunfehértó (a village in Bács-Kiskun county, in the Southern Great Plain region of
Hungary), as a childhood holiday place and Szigetköz (an island bordered by the Danube
and its branches in North-Western Hungary). Responses also mentioned Greece, Italy,
Poland and Transcarpathia (or Carpathian Ruthenia, a historical region of Hungary, now
Zakarpattia Oblast, the westernmost oblast or province of Ukraine). Regarding the listed
places we can state the respondents did not think in reduced geographical units, they
rather shared their experiences based on a country level.
Respondents mainly selected journeys within the past five years. Only four of them
reported experiences dating back to childhood or teenage memories. Some of these

65
experiences were reward travels after final exams in secondary school, while others
related to family memories.
Respondents mentioned no travelling alone. Most of them visited the chosen place with
family members. This was followed by travels with friends and companions.
Visits were mainly motivated by the need for attractive beach environment but cultural,
historical and natural journeys were equally mentioned. As for the means of travel, road
and air transportation represented more or less the same proportion.
After laying down the context, interviewees detailed their experiences. The most frequent
topics were the lifestyle of and the relationship with the locals. Each respondent reported
their experiences positively with local service providers and residents, they often admired
the lifestyle they encountered during their visit.
“It was amazing when we spotted a small snack bar at the edge of the island where we were offered grilled
lunch. Snack bar could be a bit of an exaggeration since this place was operated by two people only, mainly
as a hobby. They had a maximum of 10-20 guests every day so they spent much of their time surfing.”
(male, capital)
In addition to the relationship with locals, experiences relating to natural or built
environment (nice beaches, liveable cities) and gastronomic adventures were also
emphasized. In this regard exploration and learning new things played the major role.
“Since I favour Mediterranean taste, I particularly enjoyed local seafood specialities, fruits and vegetables.
I am an adventurous type of person both in terms of gastronomy and leisure activities.” (female, capital)
Finally, shopping and entertainment facilities should also be mentioned as factors
influencing travel experiences. Several respondents emphasized their habit of buying
food and souvenirs from locals.
Following the thematic breakdown of the stories we examined the main categories
appearing within the texts. In addition to place related experiences, we also included pro-
environmental and harmful activities into the analysis.

66
In the context of the place, the following four categories were identified which later
served as a basis for codes: location, characteristics of the place, frequency of visit and
the relationship with the place.
Location was examined as the distance between the selected place and the place of
residence. The mentioned places were mostly European destinations accessible via road
or air transport. The distance from the place of residence was big enough not to treat those
places as targets of frequent visits. Only one exception was mentioned where the
mentioned place was the grandparents’ cottage.
Visited places in many cases shaped the intention to maintain proximity (to be able to
spend more time there, the most often possible. This was reflected in the sense of longing
and the desire to permanently return.
“People, food, drinks, climate and the atmosphere left their own mark on me forever and I always long to
be there.” (female, capital)
“I simply fell in love with this city and I came home with a desire to go back and live there for a while”
(female, city)
Characteristics of the place
The next category refers to the characteristics of the destination in terms of physical,
social and cultural features. During the description of the physical environment
respondents put more emphasis on the natural environment than on the built one. Several
respondents mentioned architectural landmarks of the visited cities but these experiences
were never detailed as much as those related to nature.
“...I felt to have been brought back to the pure nature of sea, mountains, sunshine and trees (female, capital)
The attachment to the natural settings of the place was associated with the sense of leaving
behind-arrival, deliberation and wondering. The sense of fear also appeared. As an
interviewee mentioned, during their hike they were overtaken by a storm and the
realization that they had nowhere to escape from the lightning frightened them. Besides
this memory, the relationship with nature was always associated with positive
experiences.

67
As for the built environment, symbolic buildings and urban structure played a greater role
such as the stadium of the favourite team or houses of literary experiences, churches.
We visited Nou Camp, the stadium of Barca. The visit of my favourite team’s stadium was incredible.... The
Barca Museum was also part of our programme so I had a chance to learn about the history and present
of the team. (male, county seat)
“The whole city feels like being in the Lord of Rings.” Houses were built into the slopes and peaks were
hardly seen due to the humidity.... The main square was amazing with full of silver stores and a wonderful
church.” (male, city)
Besides this example there were no other longer description on built environment.
Examining these two examples in more details, in the first case we can highlight the
cohesion power of the building, the common meaning, while the latter case may entail
the accordance with nature.
Finally, we should mention the depth of experiencing the place. Respondents recalled
unforgettable memories in relation to the visited destination however it did not mean a
milestone in their lives. No story in the sample expressly mentioned the expansion of
one’s individual capabilities or the revelation of deeper contexts.
Frequency of visitations
Apart from two cases, respondents were first time visitors and did not show attachment
to the place. However these two outlier cases provide interesting insights for our research.
The first case referred to a repeated visit of the destination while the second case reported
a regular relationship with the place.
“We so much liked this small city so we decided to go there next time.” (female, city)
The respondent explained their second visit with the special features of the place such as
the gradually deepening sea which was an important factor for his/her family. The
interviewee also mentioned place related leisure activities. In this case place attachment
was caused by the functional feature of the place which could be related to place
dependence. We should also highlight that good relationship with the host had an
influence on returning back thus a slight social attachment also played role in the decision.

68
In case of returning visits, family related childhood experiences meant the basis of the
relationship. The role of childhood memories in fostering place attachment later appeared
in the narratives of pro-environmental consumers and people committed to sustainability
(Hofmeister-Tóth et al., 2012).
“When I was a little child my grandmother used to take me to the cottage for weeks and while grandma
was making the meal or working in the garden, we, children, built a shelter from the wood and fought with
the guy next door. We used to bath in the lake, played with our water guns with children of the family and
we built mud castles on the lake beach. We used to wander a lot in the wood and screamed about the tack
weed sticking into our feet. Well, of course we left our proper shoes at home.” (female, county seat)
The interviewee also reported that her cottage related experiences were reshaped as time
went on, instead of the family and nature related programs entertainment with friends
became more important.
“When I got older, I visited the cottage with my friends and instead of playing we rather focused on
parties and entertainment. Nowadays I only see the edge of the wood.” (female, county seat)
Relationship with the place
Functional attachment appeared in many cases during place visitation. Selected places
had such features that offered recreational activities. The role of place in identity and the
feelings in relation to the place were left unsaid. We rarely found a few references to
emotions or content relating to identity.
“For me it was a delightful experience to visit Verecke Pass for its historical importance. The beautiful
landscape was just an addition.” (male, county seat)
“I simply fell in love with with this city.” (female, city)
The relationship with the place was most intensively manifested in the description of
respondents’ relationships with the locals. This sometimes led to the identification with
them. Identification with the place could be observed at a social level rather than at a
physical level.
“It is easy to get good experiences if you try to identify with the locals and you try to imagine how they
live.” (female, city)

69
Scope of environment damaging behaviours
We also asked about those behaviours which the respondent considered to be harmful for
the given place. Responses followed two patterns. They either stated that they did not
behave like that, or at least not intentionally, or listed those activities that could be harmful
to the environment. These activities were the following: means of travel (air-plane, car
renting), handling packaging when shopping (accepting bags, over packaging, throwing
out recycle glasses) and the indifference towards the improper behaviour of the locals.
An interviewee mentioned in connection with the USA that simply following locals’
lifestyle is already an environmentally harmful activity.
“I believe that the huge portions in restaurants and the unnecessary packaging can cause damage to the
place in the United States. Their lavish lifestyle can contribute to damage of that place which unfortunately
I was part of.” (male, capital)
The emotions relating to a place were a bit neglected when sharing experiences and were
emphasized in case of a threat to the place. All of these were associated with the intention
to protect the place. It should be noted the in such cases no mention of any proactive
action was observed
“I did not do anything harmful to the place since I admired and respected the attractions. I believe it is
important to protect such beautiful places.” (female, city)
Pro-environmental behaviour at the place
Respondents demonstrated a general approach to act according to the expectations of the
place and no further efforts were made to protect the environment.
“I don’t really know if besides avoiding bad behaviour what else I can do to protect the environment.”
(female, capital)
“I did not make extra efforts but this is exactly why I like this area and local people that if we lived as
they do, we would not need to make efforts afterwards just enjoy the balance on its own.” (female,
capital)
Provided that an active involvement appeared, it was realized mainly in physical activities
associated with less effort.
If a bag was swimming in the water we would pick it and throw it in a dustbin.” (female, capital)

70
Respondents listed the following types of pro-environmental behaviours: transport
(public transport, biking, walking), preservation of nature and was management (avoiding
littering, selective waste collection). Buying local products, rejecting irresponsible
service providers (for example the coachman ignoring the capacity of the horse) and
following the pro-environmental programme of the accommodation were also mentioned.
6.1.4. Conclusions on narrative interviews
As a summary of the interviews we can conclude that the relationship with the place
appeared both at social and physical levels in accordance with the approach of Riger and
Lavrakas (1981). After the comparison of the results with the PPP model of Scannel egy
Giffod (2010b) we found that the person, the place and the process sub-dimensions also
appeared in the narratives although with different emphases. Not surprisingly place was
described in the most detailed manner. This can be caused by the nature of the task since
interviewees had to report their most memorable holiday.
Concerning the description of the place, both social and physical aspects appeared. Social
factors were brought by examples such as the emotional attachment to a city hosting the
favourite sports team or the identification with local youth. As far as physical factors are
concerned we can state that the natural settings were a bit more detailed than the built
environment.
Concerning the individual level of person sub-dimension we can give two examples: the
possibility of the visitation of the place especially in case of overseas destinations and the
situation when the travel was a reward for the respondent (such as a family trip to a desired
place after the final exams). Social level was mentioned by explaining symbolic
meanings.
The sub-dimension of place attachment process consists of affective, conative and
cognitive elements. These factors were identified in the interviews. Emotions - according
to the literature - entailed positive feelings. The conative factor was mainly associated
with the intention to return or preserve. The conative element appeared in form of
preserved and outstanding memories and information.

71
Apart from the factors of the PPP model, we might also highlight the location and the
frequency of visitations. These two factors however do not exceed the model provided
that we accept that the frequency of visitations is in correlation with the maintenance of
proximity, particularly with the conative element, and location also plays role in shaping
this correlation.As a step forward to the scope of pro-environmental and harmful
behaviours we found that the appearing actions were limited to the level of physical and
financial activities based on the breakdown of Smith-Sebasto (1992a) (cf. Chapter 7.4.2.).
Such behaviours that would require a more active involvement or more efforts did not
appear in the context of the visited place. Main topics of the interviews are summarized
in Figure 10.
Figure 10: Summary of the results of narrative interviews
Source: own elaboration
I would like to conclude with an interviewee’s opinion which well reflects the ambiguity
of the responsibility for the place of residence–visited place.
Environment damaging
behaviour
Method of travel
Handling packages of bought
products
Indifference relating to
locals’ harmful behaviour.
Pro-environmental
behaviour
Local transport
Waste management
Conservation of the eco-
system
Buying local products
Respecting the operators’
pro-environmental
programme
Rejecting
irresponsible
service
provider
Location the distance
from the
place of
residence
Frequency of
visitations repeated visit
long relationship
Relationship with
the place functional
emotional
identity related
social
Characteristics of
the place physical environment social environment
Attachment
to a place
72
“For me it is more important to protect the environment where I live than other places. If we are doing
well at local level, we can move on to other areas.” (female, city)
This ambiguity also appeared in our previous similar research (Kelemen et al., 2010).
6.2. Quantitative examination of place attachment and pro-
environmental behaviour
To test the scales to be applied during the research a preliminary student survey was
conducted in the fourth quarter of 2011. The objective of this study was to apply place
attachment and pro-environmental behaviour scales to the focal research topic and to
perform a reliability test thereof.
Completing the questionnaires was made on a voluntary basis, responses beyond the
obligatory performance were honoured with credit points. Altogether we received 298
answers. After data cleaning 254 responses were analysed. Taking the guidelines of
Tinsley and Tinsley (1987) into consideration, whereby at least five respondents per item
are needed to perform factor analysis properly, this quantity proved to be sufficient for
scale testing.
6.2.1. Testing place attachment scale
For measuring place attachment I applied the 16-item scale of Halpenny (2006) (see
Annex 4) which measures place dependence with four items, place identity with six items
and the place affect with six items. Respondents gave their answers in context of their
favourite national park or conservation area. Scale items were assessed using a 5-point
Likert scale (1 = “not at all true of me”; 5 = “very true of me”).
Based on the results, items measuring emotions were given the highest scores. Four out
of the five items having the highest average score referred to place affect, this was
followed by items measuring identity and dependence in a mixed order (see Annex 5).
In order to prove the three-dimensional construct determined by the theory I completed
an a priory factor analysis with principal component analysis and varimax rotation.

73
In case of the three-factor solution, the third factor had an own value of 0.858 so I move
on to examining the two-factor solution. In this factor structure two items did not reach
the desired value of 0.5, so I excluded them based on the guidelines of (Hair et al., 2006).
Then I used the two factors to check items representing significant overlapping (>0.35).
As a result, I excluded three further items (sense of self at the place, strong identification
with the place, sense of happiness at the place). The two-dimensional model accounted
for 62.98% of the total variance. Based on the 0.926 value of KMO test and the Bartlett
test (p<0.001) the result can be accepted.
Dimensions* Items Component
1 2
PD XXX National Park is the best place for what I like to
do. 0.821 0.183
PA XXX National Park is my favourite place to be. 0.817 0.201
PA I really miss XXX National Park when I am away too
long. 0.789 0.277
PD I get more satisfaction out of visiting XXX National
Park than any other parks. 0.777 0.292
PI Visiting XXX national park. says a lot about who I
am 0.772 0.047
PI I feel XXX National Park is part of me. 0.765 0.23
PI When I visit XXX National Park, others see me the
way I want them to see me. 0.649 0.23
PD The things I do at XXX National Park I would enjoy
doing just as much at a similar site. 0.644 0.164
PD I wouldn’t substitute any other area for doing the
types of things I do at XXX National Park. 0.643 0.193
PA I feel relaxed when I am in XXX National Park. 0.15 0.875
PA I feel strong, positive feelings for XXX National Park 0.279 0.809
Table 7: Results of the a priori factor analysis regarding the place attachment scale
*PD= place dependence; PA= place affect; PI= place identity
(N=256)
Source: Own elaboration
During the examination of the scales, the expected three sub-dimensions did not appear
in the sample. According to the two-factor structure, the items of certain sub-dimensions
were organized in the first factor in a mixed order, whereas the second factor consisted

74
of the item measuring two emotions. These results may have partially been caused by the
translation of the items into Hungarian and partially by the special features of the sample.
6.2.2. The examination of pro-environment behavioural intention scale
Park-specific pro-environmental behavioural intentions were measured with Halpenny’s
(2006) 12-item scale. Respondents were asked to evaluate how likely they will carry out
the given activity in the forthcoming twelve months. The values of the scale items were
evaluated by using a 5-point Likert-scale where 1 meant “extremely unlikely” and 5
meant “ extremely likely”.
Based on the results respondents reported an intention weaker than medium in case of
most items (See Annex 6). The following activities meant exceptions: support of
petitions, pick up litter left by others, encourage others to reduce waste and the gain more
knowledge in this field. These are all general, low effort but socially highly expected
activities. Environmental activism (community activism, correspondence) was the least
typical type of activity. In summary, high effort activities consistently received lower
scores.
Items (see also Table 19) were determined based on the generality and the degree of
difficulty of activities. I applied a multidimensional scaling to examine how the items are
categorized in the sample. MDS (Multidimensional Scaling) is a mathematical statistical
process for testing data structure and for visually displaying differences between the data.
Objects appear as points of the status space in the scaling models where similar objects
get closer to each other (Füstös et al., 2004). The model allows to get a spatial figure
which contains the geometrical shape of the variables and helps to explore the linking
system of data (Füstös et al., 2004).
I applied ALSCAL process to determine the two-dimensional model. The goodness of fit
index of this model (Stress=0.0444; RSQ=0.992) is sufficient based on the stress value
and the model accounts for 99.2% of the total variance of the 12 variables involved in the
analysis. The results show that the first dimension was the degree of speciality of the
activity and the second dimension was the degree of difficulty.

75
Figure 11: Euclidean distance model: speciality – difficulty
(N=256)
Source: own elaboration
The results showed several differences compared to the original categorisation of the
items. The most salient difference was the expansion of the scope of special activities
such as donation (categorised as general/easy), writing letters (general/difficult),
participation in community meetings (general/difficult), time spent on the project,
voluntary discontinuation and reduction of visitations of the park. There were differences
based on the level of difficulty. Broadening knowledge, donation, voluntary
discontinuation and limitation were categorized as more difficult activities while the
writing letters originally categorised as difficult was re-considered as easy but special
behaviour. Any further item was placed according to its category.
The main reason for the listed differences are linked to cultural differences. Several
activities do not have such tradition in Hungary than in Canada where the scale was
developed and this fact naturally entails differences in the evaluation. Another potential
reason could be its incorrect translation. After a careful examination of the items, I
decided to re-word the translation of three items (voluntary discontinuation, limitation,
community meeting) to be make them more accurate and understandable.
DIFFICULT
EASY
GENERAL SPECIAL
Price
Litter left by others
Encourage waste reduction
Petition
Broadening knowlegde Donation
Time spent on project
Correspondence Feeding animals
Voluntary
discontinuation
Community
meeting

76
Following the aforementioned categorisation of the items I carried out an a priori factor
analysis to confirm the two-factor construct whereby I applied principal component
analysis with varimax rotation. The factor weigh of the items, except for the price, reached
the value of 0.5 in this factor structure (Hair et al., 2006). Higher entry price had a value
above 0.4 on both factors so I excluded this item from further analyses. Then I identified
an item (writing support letters) which showed significant overlapping with two factors
(>0.35). This item was also ignored.
Such two-factor model (see Annex 7) accounted for 58.37% of the total variance. Based
on the 0.835 value of KMO test and the Bartlett test (p<0.001) the result can be accepted.
Afterwards I examined scale reliability. As a first step I determined the item-total
correlation. Results always exceeded the value of 0.3.
Scale items
Mean if
deleted
Item-total
correlation
Alpha if
item
deleted
Low effort park-specific pro-environmental behavioural intentions (α=, 735, 5 items)
Pick up litter at XXX National Park left by other visitors.
11.12 0.494 0.691
Tell my friends not to feed the animals in XXX National Park
or similar parks 11.71 0.482 0.695
Sign petitions in support of XXX National Park and similar
protected areas. 10.67 0.418 0.723
Learn more about the natural settings of XXX National Park.
11.25 0.508 0.686
Encourage others to reduce their waste and pick up their litter
when they are in XXX National Park.
11.20 0.594 0.650
High effort park-specific pro-environmental behavioural intentions (α=, 868, 5 items)
Volunteer my time to projects that help XXX National Park or
similar parks and nature areas. 6.29 0.716 0.835
Participate in a public meetings about managing XXX
National Park. 6.63 0.665 0.851
Volunteer to stop visiting a favourite spot in XXX Park if it
needs recover from environmental damage.
6.43 0.767 0.821
Volunteer to reduce my use of a favourite spot in XXX Park if
it needs recover from environmental damage.
6.45 0.753 0.825
Contribute donations to ensure protection of places like XXX
Park.
6.32 0.590 0.868
Table 8: Internal consistency of park-specific pro-environmental behavioural scale
(N=256)
Source: own elaboration

77
This was followed by the determination of Crombach-alfa values of the sub-scales which
were above 0.7 in both cases (see Table 8), thus they proved to be sufficient (Hair et al.,
2010).
6.2.3. Conclusions of scale testing
I concluded the testing of the place attachment scale as follows:
1. It is advisable to test further scales besides the place attachment scale of Halpenny
(2006). The appearance of social attachment sub-dimension is an aspect of the
selection of the proper scale. Social attachment like emotional attachment is a
less examined sub-dimension of place attachment. However, more empirical
research confirmed the importance of this sub-dimension (Brocato, 2006;
Raymond et al., 2010; Kyle et al., 2005; Ramkissoon et al., 2013) and our own
qualitative research resulted in similar findings. The measurement of sub-
dimensions with at least three items is an important aspect in meeting the criteria
of future research methodology (Hair et al., 2010).
2. The accurate adaptation of the translation of the selected scale requires two
exports in addition to the translation of items from English into Hungarian and
then from Hungarian into English.
The pro-environmental behaviour scale performed well, its further use in the research was
justified, although I considered it necessary to involve two exports in the translation of
scale items.
Based on this, a comprehensive classification and evaluation of the place attachment
scales were carried out (see Chapter 7.4.3). The four-sub-dimension scale selected this
way (Ramkissoon et al., 2013) was examined in 2013 among students in frame of a
quantitative survey of small sample size. I received 74 responses, out of which 5
respondents did not evaluate place attachment scale items. The objective of the current
stage of research, in addition to the examination of alternative place attachment was
primarily to check the questionnaire structure and to map tools helping to complete the
questionnaire. I asked the students to indicate if the completion of the questionnaire
requires further explanation or visual support at any point. In this stage I checked the final
translation of the scales and involved a linguist and an expert from the national park
auditing organization. Comments in the questionnaire can be summarized as follows:

78
(1) scale items proved to be clear, understandable
(2) the structure of the questionnaire proved to be clear,
(3) completing the questionnaire was facilitated by a map indicating the location of
national parks
The averages and the standard deviations of place attachment scale, as well as the
reliability statistics are summarized in Annex 8. In summary, the use of the present scale
was decided instead of Halpenny’s (2006) scale presented beforehand, which was also
supported by the results of the preliminary qualitative research.
7. EMPIRICAL RESEARCH
7.1. Objective of the research
The central purpose of this study is to examine the relationship between an individual’s
place attachment and pro-environmental behavioural intentions as well as to have a
deeper understanding of the connections between variables. The analysis of factors
enhancing place attachment including park visitation characteristics and park relationship
variables also forms part of the research. In order to clarify my research, the following
research questions were formulated:
(1) What is the extent of place attachment regarding visitors of the domestic national
parks in the sample?
(2) How to describe the pro-environmental activities and behavioural patterns related
to the national parks in question?
(3) What differences can be identified between pro-environmental behaviours in
national parks and at the place of residence?
(4) What is the effect of place attachment on pro-environmental behavioural
intentions in the context of national parks?
(5) How do high and low effort behaviours interact with each other? Which
behavioural type can be used to describe the effect of place attachment?
(6) To what extent can certain visitation patterns, relationship and socio-demographic
variables predict place attachment?

79
7.2. Sample and sampling
I examined the relationship between place attachment and pro-environmental behavioural
intentions in context of the Hungarian visitors of domestic national parks. Unlike the
practice of preliminary researches on this subject (Ramkissoon et al., 2013; Halpenny,
2006) the sample examines the visitors of several domestic national parks at the same
time and it does focus on one particular national park only. My decision was caused by
my intention to study place attachment in a diverse spectrum thus my results could be of
more general use. Ten Hungarian national parks of different characteristics allowed me
to carry out such research. This is detailed in Annex 9.
Due to the number of venues to be studied, the data collection was carried out in the form
of an on-line survey (CAWI). The reason for such on-line survey was also the fact that
the respondents had a chance to answer it at the most convenient time. This also increased
the chance to get a fully completed questionnaire.
A sample size of 300 was determined following various guidelines on research objective
feasibility (for a detailed description, see the description of measurement model
validation – p. 126.). As a first step of data cleansing, respondents providing the same
answer for all questions were excluded, thus reducing the sample size to 264. For the
purpose of structural equations modelling, an outlier detection of was conducted
Mahalanobis distance calculation using AMOS 22.0 software (Weiber and Mühlhaus,
2010). The final sample size applied in the correlation analysis was 240. This number is
sufficient for structural equation modelling where Hair et al. (2010) determined the
expected minimum sample size to be 200.
When selecting the date of data collection my primary objective was that the respondents
should have recent experiences, it should be easy for them to recall the details of their
visitations. I tried to find a date that is particularly typical regarding the visitations of
national parks. Therefore I decided on the week of national parks.16 The data collection
was carried out between June 17-28, 2015.
16The Week of Hungarian National Parks was organized between June 12-21, 2015. During this period,
national parks offered a wide range of programs to visitors interested in nature related experiences. The
opening weekend of the event was hosted by Békéscsaba between June 12-14.

80
The electronic survey was forwarded by market research company NRC to its panel
members.17 The survey was carried out by an independent market research company in
order to get a more objective research process. Invitees were sent to the representative
population aged 15-69. A filter question was applied as a condition of participation. The
survey involved all respondents who have visited any of the domestic national parks
during the 12 months preceding the survey. Visual support was used to enhance the
recalling of national parks whereby respondents could use a map to recall the location of
the national parks (see Annex 10).
The questionnaire consisted of 34 questions, 15 of which referred to demographical
figures. The survey required approximately 15-20 minutes. Questions equally covered the
relationship with the place of residence and the pro-environmental behaviour there (K1-
K6 questions). The research, however, was focused on unveiling visitation patterns of
national parks, the quality of the relationship with the parks, and the tendencies of park
specific pro-environmental behaviour (questions K7-K19).
Certain elements of place attachment and park specific behavioural intention scales
appeared in a randomized manner in front of the respondents. Some questions of the
questionnaire were obligatory to answer (place attachment, pro-environmental behaviour
and behavioural intention in national parks). This helped me to avoid missing data of the
scales concerned. In case of pro-environmental behaviour relating to the place of
residence, I corrected the distortive effect of the binding response (in accordance with the
suggested use of the scale) with adding the option of “not relevant to me”. This was not
required in case of national parks since the given activity should be evaluated whether it
is carried out by the respondent or not. The structure of the questionnaire is shown in
Annex 11.
In case of ethical issues of the research I followed the guidelines of Singleton et al. (1993)
who recommend to inform the participants of the research about the circumstances,
objectives and confidentiality of the research. Misleading respondents or causing any
17The NRC establishes its base research sample with regular mail shots by using layered random sampling
of people in the NetPanel system containing more than 227,000 people. According to international
standards, the sample was established based on 5 major demographical features (gender, age, education,
type of place, region).

81
damage to them should also be avoided. Research participants were panel members of
NRC 18who were allowed to decide on their participation based on the information in their
invitation letter. Respondents were informed about the research objective and
confidentiality in the questionnaire. Completing the whole questionnaire meant the
confirmation of the intention to participate in the research. Respondents participated in a
draw by completing the questionnaire, no individual award was given to them.
Research sample
The sample size was 264 after the first step of data cleaning. The sample with the
demographical attributes is shown in Table 9. The sample cannot be deemed to be
representative either in terms of the Hungarian population or in terms of the visitors
visiting Hungarian national parks, however it clearly reflects the scope of visitors visiting
domestic national parks in the year preceding the study. Compared to the figures of the
population census in 2011 (KSH, 2013), the proportion of older age group (60-69) and
higher education (particularly people having degree) in the sample was higher than the
national average.
The composition of the sample by genders is balanced, the proportion of men (49.6%)
and women (50.4) are nearly the same. This ratio is different from the preliminary
research in domestic national parks, whereby women’s responsiveness was typically
higher (2013: women: 60.6% male 37.6%; 2012: female: 53.8%, male: 42.9%) (Ministry
of Agriculture and Pannon University, 2015; Ministry of Rural Development and Pannon
University, 2012).
18NetPanel is a website audited by PPOS and ensures that personal data of panel members are handled in
compliance with the laws and with the highest confidentiality.

82
Sample
size
Percentage
distribution
Summarized
percentage
distribution G
EN
DE
R
N=
26
4 male 131 49.6 49.6
female 133 50.4 100.0
AG
E
N=
264
15-29 26 9.8 9.8
30-39 48 18.2 28.0
40-49 54 20.5 48.5
50-59 48 18.2 66.7
60-69 88 33.3 100.0
ED
UC
AT
ION
AL
AT
TA
INM
EN
T
N=
26
4
Completed primary school 4 1.5 1.5
Completed vocational school 32 12.1 13.6
Final exams (completed secondary school) 94 35.6 49.2
Bachelor degree 75 28.4 77.7
Master degree 59 22.3 100.0
PL
AC
E -
TY
PE
N=
26
4
Budapest 45 17.0 17.0
city 140 53.0 70.1
village 79 29.9 100.0
RE
GIO
N O
F
PL
AC
E O
F
RE
SID
EN
CE
N=
26
4
Middle 80 30.3 30.3
East 106 40.2 70.5
West 78 29.5 100.0
FA
MIL
Y
ST
AT
US
N=
26
4
Single 29 11.0 11.0
In a relationship but living separately 19 7.2 18.2
Married or in a partnership 179 67.8 86.0
Divorced 27 10.2 96.2
Widow 10 3.8 100.0
NU
MB
ER
OF
PE
OP
LE
IN
TH
E
HO
US
EH
OL
D
N=
26
4
1 person 39 14.8 14.8
2 persons 103 39.0 53.8
3 persons 53 20.1 73.9
4 persons 45 17.0 90.9
5 persons or more 24 9.1 100.0
PE
R C
AP
ITA
IN
CO
ME
OF
A H
OU
SE
HO
LD
N=
19
7
under HUF 100,000 28 10.6 10.6
HUF 100,000 - 200,000 51 19.3 29.9
HUF 200,001 - 300,000 53 20.1 50.0
HUF 300,001 - 400,000 35 13.3 63.3
above HUF 400,000 30 11.4 74.6
I do not know/respond 67 25.4 100.0
Table 9: Whole sample broken down by demographical variables
N=264
Source: own elaboration
83
Respondents’ age was between 16-69 with an average of 49.64 (SD=13.818).
Respondents aged above 60 represent the higher proportion in the sample (33.3%)
whereas younger age group represent 9.8%. The over-representation of the senior age
group also appeared in Halpenny’s study (2006) where silver group similarly represented
a bigger proportion. The average age of the respondents in a Canadian research was 52.83
(SD=13.8). On the contrary, Ramkissoon et al. (2013) concluded the opposite result, his
sample showed younger age group in a higher proportion, more than half of the
respondents were below 35. In a research on national parks commissioned by the Ministry
of Agriculture in 2013 it was also the younger age group representing bigger proportion
(0-14: 8.5%; year 15-34: 29.9%; year 35-54: 41.1%; above 55: 16%) (Ministry of
Agriculture and Pannon University, 2015). The research involving 1546 respondents and
applying simple random sampling process carried out the survey among visitors of
Hungarian eco-tourism show places. A number of reasons might account for the
differences between the samples, out of which the differing circumstances of sampling
should be highlighted.
Concerning the level of education, 50.7% of the respondents have higher education:
28.4% of them have BA degree, 22.3% of them have MA degree or diploma. The results
of Halpenny (2006) and Ramkissoon et al. (2013) showed similar tendencies. In a
Canadian research, 75% of the respondents had higher education, whereas in Australia
this ratio was 70%.
Based on the region of place of residence and the type of locality, 40.2% of the
respondents live in East-Hungary, 30.3% in Mid-Hungary and 29.5% in West-Hungary.
17% of the Mid-Hungarian respondents live in Budapest. Besides the ones living in the
capital, 53% of the respondents live in cities and 29.9% in villages. The ratio of
respondents in the Eastern region living in cities is 72.6%, the Western region reflects
53.8%. Respondents living in villages represent 27.4% (east) and 46.2% (west).
As for the family status, 67.8% of the respondents are married or live in partnership.
Examining the size of the household in the group, we have seen that the proportion of the
two-person households represent a quite high value, 48%.

84
25.4% of the respondents did not answer the question on the per capita income of their
household. 10.6% of the respondents had an income below 100,000 HUF, 20.1% of them
had an income between 100,000-200,000 HUF and 44.8% of them had an income above
200,000 HUF.
In summary, visitors of national parks has the following demographical profile:
overrepresented in the sample compared to the domestic population.
older generation;
highly qualified;
and all living in the Eastern region.
7.3. Theoretical model
By relying on the results of environmental psychology (Bonnes and Secchiaroli, 1995)
the theoretical frame of the research is partially based on the TRA (Theory of Reasoned
Action) model Ajzen and Fishbein (1975). The theory suggests that behaviour can be
clearly projected based on the behavioural intention to act. Behavioural intention is
among other factors (see Chapter 5) determined by the individual’s attitude of behaviour.
By interpreting place attachment as an attitude, in my research I assume that an
individual’s pro-environmental behavioural intentions concerning a certain place can be
originated partially from past experiences relating to the place and from the place
attachment arising from these experiences (Halpenny, 2010). The theoretical model of
my research is shown in Figure 12.

85
Figure 12: Theoretical model of my research
Source: own elaboration
During my research I tested part of the TRA model, more precisely the effect of the
attitude concerning the place (place attachment) on pro-environmental behavioural
intentions. Based on the findings of Ramkissoon et al. (2013) I made a distinction between
high and low effort pro-environmental behaviours and studied the interaction between
certain behaviours. Preliminary studies on this topic confirmed that place attachment has
a positive effect on pro-environmental behavioural intentions both in terms of the place
examined and of the level of general intention (Halpenny, 2006). Furthermore Ramkisson
et al. (2013) proved that place attachment has a considerable influence on high effort
behavioural types (for example participation in community events, volunteering in
projects) than on low effort activities (waste management, decreasing consumption etc.).
The link between behaviour types making commitment stronger (high effort) or weaker
(low effort) will also be discussed here. Another theoretical basis of this research reflects
to Spillover Effect by Thøgersen (1999) that enables us to further explain the patterns of
the commitment process. Based on this theory, an individual’s pro-environmental attitude
Affective component
Emotional bonds
Cognitive component
Place identity
Social bonds
Conative component
Place dependence
Place
attachment
Pro-
environment
behavioural
intentions
Exte
rnal
fact
ors
en
han
cin
g p
lace
att
ach
men
t:
Vis
itat
ion c
har
acte
rist
ics,
par
k r
elat
ionsh
ip
H1-H5
H6
86
or behaviour in an area can be a good predictor of his or her general environmental
attitude and pro-environmental behaviour in other areas. Provided that place attachment
generates pro-environmental behavioural pattern, that is the high effort pro-
environmental behaviour in our case, as a result, this effect may spill over to other areas
such as to low effort behaviours. Thøgersen and Ölander (2003), although in context of
selective waste management, did verify the relationship.
7.4. Description and measurement of model variables
7.4.1. Place attachment and its measurability
A number of definitions and subsequent measurement tools exist for place attachment in
several disciplines. Most conceptualizations of the construct associate it with a range of
feelings associated by individuals with specific environments (Kyle et al., 2005). Low
and Altman (1992) made a comprehensive analysis on the literature of place attachment
and highlighted the following common features:
(1) Most studies examining the human-place relationship focus on affect, emotion
and feeling.
(2) The subject of attitude or the focus of sense refer to a special environment or
settings that can differ in many ways (by size, known or unknown, symbolic or
tangible etc.).
(3) The analysis of place attachment from the perspective of the individual or the
community allows us to group certain approaches. While environmental
psychology examines the relationship between the individual and the place,
sociology, anthropology or social geography examine collective or consensual
attachment of couples, families, communities or cultures to a given place. The
importance of social relationship is emphasized by approaches whereby place
attachment covers other relationships (for example family, community, culture)
or it is based on this relationship.
(4) Place attachment is also determined by the variation over time, such as cyclical
pattern or fluctuation.
In addition to place attachment, the literature often cites a number of analogous terms:
community attachment (Kasarda and Janowitz, 1974), sense of place (Hay, 1998), place
identity (Proshansky, 1978), place dependence (Stokols and Shumaker, 1981), rootedness
(Hummon, 1992).

87
The dimensionality of place attachment does not show a consistent picture either. Early
studies measured place attachment with proxy variables that is the length of stay or
property (Riger and Lavrakas, 1981), nowadays several one- or multidimensional scales
have been developed. Major multidimensional scales are shown in Table 10.
In context of recreation I would outline the scale of Willams and Roggenbuck (1989)
from the measurement tools of place attachment, which appeared in a number of further
studies (Jorgensen and Stedman, 2001; Williams and Vaske, 2003), in some cases in a
further developed version (Kyle et al., 2005; Halpenny, 2006, 2010; Ramkissoon et al.,
2012, 2013; Ramkissoon and Mavondo, 2015). Williams and Roggenbuck, (1989)
suggest that the human-place relationship can be described with the following two
dimensions: place dependence and place identity.
The theoretically most well-founded and researched dimension of place attachment is
place identity (Jorgensen and Stedman 2001; Stedman, 2002; Kyle et al.., 2003; Kyle et
al., 2004a; Kyle et al., 2004c; Knez, 2005). Proshansky, (1978, p. 155.) states that “those
dimensions of self that define the individual’s personal identity in relation to the physical
environment by means of a complex pattern of conscious and unconscious ideals, beliefs,
preferences, feelings, values, goals, and behavioural tendencies and skills relevant to this
environment.”
88
Author(s) Year Dimensions Context
Williams and
Roggenbuck
1989 2 dimensions
place dependence (functional relationship)
place identity (emotional relationship)
Recreational
venues
Williams and Vaske 2003 2 dimensions: testing scale dimensionality
place dependence (functional relationship)
place identity (emotional relationship)
Recreational
venues
Kyle et al. 2005 3 dimensions:
place dependence
place identity
social bonds
Recreational
venues
Lewicka 2005 3 dimensions:
place of origin
discovered place
relativity of place
Urban
environment
Hammitt et al. 2006 5 dimensions:
skills
belonging there
identity
dependence
origin
Recreational
venues
Jorgensen and Stedman 2006 Treating the sense of place as an attitude with 3 sub-
dimensions
place attachment
place identity
place dependence
Property at the
lake
Brehm et al. 2006 Separating physical and social meaning of the place Communities’
relationship
with nature
Halpenny 2006 Interpretation of place attachment as attitude with 3
sub-dimensions
place dependence
place identity
place affect
National parks
Brocato 2006 Place attachment is defined as an emotional
relationship between the individual and the place
which affects physical and social environment of
the place. 4 dimensions are distinguished:
place dependence
place identity
emotional bonds
social bonds
Restaurants
Hidalgo and Hernandez 2007 Distinction of place attachment and place identity Permanent
residents
Scannell and Gifford
2010a
Separation of citizenship or nature related
attachment
Permanent
residents
Ramkissoon et al. 2012
2013
Interpretation of place attachment as attitude with 4
sub-dimensions
place attachment
place identity
place affect
social bonds
National parks
Table 10: Major studies examining the dimensionality of place attachment
Source: own elaboration

89
In this sense, the conditions of the place ensure the individual to express and confirm
his/her identity. In other words, place identity is part of the self-identity which helps to
organize experiences relating to a different physical environment (Shumaker and Taylor,
1983). Researchers trace back place identity to several reasons. By highlighting two
examples, Moore and Graefe (1994) suggest that place identity is formed as an influence
of place dependence as a result of place related interactions. Stedman (2002) however
traces it back to the symbolic relationship between the individual and the conditions of
place.
The functional nature of place attachment appears as place dependence (Stokolos and
Shumaker, 1981; Kyle et al., 2004a). Place dependence determines to what extent the
individual can perform certain activities at the given place. In other words, how do the
conditions and factors contribute to the achievement of certain goals compared to other
places (Jorgensen and Stedman, 2001). Unlike further dimensions determining place
attachment (such as place identity, social bonds) place dependence can be negative
(Brocato, 2006). If all the alternatives are negative, the selected option can even be the
least bad version (Jorgensen and Stedman, 2001). Place dependence is influenced by two
major factors: the quality of place and the relative quality of alternative places serving for
comparison (Brocato, 2006; Halpenny, 2010).
Vaske and Kobrin (2001) made a distinction between the dimensions of place dependence
and place identity and stated the following correlations:
(1) if place dependence increases, so does place identity,
(2) if place identity increases, so does the admitted pro-environmental behaviour,
(3) a place identity mediates between place dependence and the admitted pro-
environmental behaviour.
The place attachment concept of Williams and Roggenbuck (1989) was applied by several
researches (Kyle et al., 2003; Moore and Graefe, 1994; Vaske and Kobrin, 2001). Since
the majority of studies did not put significant focus on testing place attachment scale of
validity or scalability, Williams and Vaske (2003) tested the scale in 2003. They
confirmed the existence of the two sub-dimensions of the scale by measuring them at four
different places.

90
Later Kyle et al. (2005) completed the scale with social bonds sub-dimension (Hidalgo
and Hernandez, 2001; Low and Altman, 1992; Mesch and Manor, 1998), by interpreting
place attachment as attitude according to Jorgensen and Stedman (2001)19.
Social bonding can be described as the overall interpersonal relationships occurring at the
given place. If the individual establishes or maintains important relationships at a given
place, since the place ensures the context of shared experiences, we can assume that place
represents part of this importance. In other words, the individual’s attachment to a
particular place can partially be expressed and shaped by his/her social relationships being
built at that place. This was supported by the remark of Mensch and Manor (1998) which
suggests that the closer friendship or neighbourhood characterized respondents, the
higher place attachment values were observed.
Several authors in environmental psychology called the attention to the importance of
emotions in individual’s place attachment (Giuliani, 2003; Kals et al., 1999). These
studies mention place related emotions (place affect/affective attachment) as the fourth
dimension of place attachment, separating it from identity, which summarizes
individual’s emotions and feelings in relation to a particular place. Although emotional
sub-dimension is less well-founded than the three other sub-dimensions discussed earlier,
several empirical researches argued for handling this dimension separately. Milligan
(1998) studied the students’ relationship to cafeterias and concluded that the dimension
of emotional attachment clearly appeared and increased with the frequency of visitations.
Halpenny (2006) examined the attachment to national parks and established a three-
dimensional scale which determines place attachment by place identity, place dependence
and place affect sub-dimensions.
Regarding place attachment scales applied for national parks we can highlight Halpenny’s
(2006) three-dimensional scale. The author developed the scale of Williams and
Roggenbuck (1989)20 by considering place attachment as an attitude and integrated
19 Jorgensen and Stedman (2001) defined place attachment as a separate dimension (first-order component
of the sense of place) and not as a comprehensive term (second-order factor).
20This scale is based on the theory of Prohansky (1978) and Stokols and Shumaker (1981). While Prohansky
emphasized the role of place identity in place attachment whereby there is a cognitive Relationship between

91
affective component in addition to cognitive (PI, place identity) and conative (PD, place
dependence) domains. Ramkissoon et al. (2013) further developed this into a four sub-
dimensional scale which includes the term of social bonds. Since my preliminary studies
(Kasza-Kelemen, 2012) as well as other researches in this field (Brocato, 2006; Kyle et
al., 2005) indicated the existence and importance of sub-dimension I applied the validated
scale of 12 items, 4 sub-dimensions of Ramkissoon et al. (2013) to measure place
attachment (see scale items in Annex 12).
In my dissertation, I examine place attachment as a second-order factor having four sub-
dimensions, namely place dependence (PD), place identity (PI), place affect (PA) and
place social bonding (PSB). The author defines place attachment as attitude according to
Jorgensen and Stedeman (2001) with four sub-dimensions (conative (PD), cognitive (PI
and PSB) and affective (PA)).
7.4.2. Pro-environmental behaviour, the definitions and measurability of
behavioural intentions
Sivek (1987 in: Sivek and Hungerford, 1990) defines pro-environmental behaviour as
individual or group activities that support or facilitate sustainable use of natural resources.
Regarding the definition of pro-environmental behaviours Stern (1997) suggests to
examine the effects of a behaviour by answering the following two questions:
(1) What is the impact of behaviour on the accessibility to available raw materials or
energy resources?
(2) What is the impact of behaviour on the structure and dynamics of ecosystem and
biosphere?
According to Snelgar (2006) pro-environmental behaviour may come in the following
forms:
personal shopping behaviour
travelling habits
selective collection
usage of resources
physical environment and self, Stokols and Shumaker pointed out the functional nature of place (place
dependence) (Halpenny, 2006).

92
active participation in environmental organizations
The theoretical framework of Smith-Sebasto (1992) and Smith-Sebasto and D’Acosta
(1995) provides a wider interpretation of consumption by defining six forms of pro-
environmental behaviour: civic, learning, financial, legal, physical and convincing
actions. The content and form of actions can be as follows:
Civic action: all kinds of individual or group activities (not monetary or not caused by
any influencing strategy) which represent the efforts to protect nature in a political
manner.
Forms or actions: vote, participate in public hearings, sign petitions, passive resistance or
protest.
Learning action: all kinds of individual or group activities aiming at learning about
environmental issues.
Forms of action: Watch TV programmes, read books, articles, participate in courses
Financial actions: activities to facilitate or prevent financial transactions which express
the pro-environmental intention of an individual or group.
Forms of actions: buy or boycott a product or service depending on their pro-
environmental features, financial support to NGOs, invest into responsible companies,
support pro-environmental campaigns.
Legal actions: any individual or group activity that relates to legislation facilitating
environmental laws and regulations or legal restrictions of unwanted environmental
behaviour.
Forms of actions: civil lawsuits, prohibiting orders.
Physical action: any individual or group activities that serve to protect environment
without financial means.
Forms of actions: pick up waste, selective collection for recycling, participate in
environment cleaning, supply household with energy saving appliances.

93
Convincing actions: any non-monetary means whereby individuals or groups may
encourage other people, organizations, industry or the government to conduct pro-
environmental behaviour.
Forms of actions: letters to competent persons, speeches, informal talks, lobbying.
Stern provides a framework to integrate and handle the actions types listed above (Stern,
2000a, Stern, 2000b). The author identified four main areas taking the rate of
commitment, and the differences between private and public sphere into account: pro-
environmental behaviour in private sphere(shopping, usage, waste management), act as
an environmental activist (as participant in a pro-environmental organization or
demonstration), non-activist behaviour in public sector (support relating legislation,
paying taxes), and other important pro-environmental behaviour (in workplace).
1. Pro-environmental behaviour in private sphere.
consumer shopping behaviour
usage of household appliances
change in the usage of appliances and in lifestyle
waste management
“green” consumption
2. Non-activist behaviour in public sphere
environmental citizenship (participate in petitions, join groups)
governmental support regarding these issues
3. Other environmentally significant behaviour
any behaviour that influences decision making at an organization
4. Acting as a pro-environmental activist
Table 11: Environmentally significant behaviour
Source: Stern (2000a)
In order to measure the aforementioned behavioural types Stern et al. (1999) applied the
pro-environmental behaviour scale. In this scale pro-environmental behaviour is
measured by the following sub-scales: consumer behaviour (CB), willingness to sacrifice
(WS) and environmental citizenship (EC). Based on Stern’s (2000a, 2000b) results the
scale was later completed by Dono et al. (2009) with environmental activism scale and
they also confirmed that environmental activism is a sub-type of pro-environmental
behaviour. The internal reliability of the sub-scales were shown in each examined study.

94
Since this research topic covers the behaviour in national parks, the scales listed above
require a slight re-wording. As a further filter, certain items are hard to interpret in
recreational context. Halpenny (2006) decided to fill this gap and developed a 12-item
scale21 using a 5-point Likert scale in relation to visitations and protection of national
parks. When selecting or modifying items Halpenny (2010) followed the following
three principles:
(1) universality (commitment to behaviour should be available for as many people as
possible in the examined context),
(2) diversity (items should include several different behavioural types),
(3) specificity (the listed items are in accordance with items measuring place
attachment).
Regarding national park related questions I relied on Halpenny’s (2006) pro-
environmental behavioural intentions scale which was primarily justified by scale
specificity. Olli et al. (2001) found that attitude-behaviour relationship is stronger
statistically and empirically if both variables are measured by the same specificity, that is
pro-environmental behaviour and place attachment (attitude) are applied in protected
environmental areas.
Research also covered pro-environmental behaviour demonstrated at the place of
residence. For measuring this I applied the self-reported pro-environmental behaviour
scale of Schultz and Zelezny (1998). The 10-item scale put questions in relations to the
frequency of activities in the past 12 months (optional answers: daily, weekly, monthly,
never, not relevant). In this scale the level or pro-environmental behaviour is measured
by the following habits: selective waste collection, conservation behaviours, consumer
behaviour and transportation. In my research, similarly to the practice of Schultz et al.
(2005) I applied the 5-point Likert scale allowing the option of not relevant to me. The
reason behind my decision was the need for a measurement level suitable for further
analyses.
21 During scale development the author of the present dissertation relied mainly on the related scales by
Schultz and Zelezny (1998), Smith-Sebato and D’Costa (1995), Stern et al. (1999), Van Liere and Dunlap
(1981), and Vaske and Korbin (2001). Following the study of the above source scales and in the aim of
providing greater comparability of pro-environmental behaviour at home and at national parks the scale by
Schultz and Zelezny (1998) was used to measure general behavioural intentions.

95
7.4.3. Measuring predictors of place attachment
Individual patterns may show differences concerning the characteristics of visitations to
national parks Frequency and length of visitations, length of relationship with the park,
distance from the place of residence, childhood visitations to national parks can predict
place attachment (Halpenny, 2006). Demographical attributes such as gender, age,
education and income also has an impact on the level of place attachment, although their
predictive power is debated in the literature. My research covered the examination of the
following variables:
Frequency of visitations was measured with two variables. First I identified the frequency
of visitations to national parks (K8) then I asked about the frequency of visitations to the
selected national park (K15). While the first variable measuring the frequency with
categories from “1-never” to “5-very much” reflects a subjective judgement, the second
variable gives a more objective picture by using the given categories („1=within this year”
„5=at least once a month”).
I measured the duration of visitation based on Halpenny’s (2006) categories. The variable
(K18) determines the duration of visitation based on the last visit during the past 12
months by making distinction between one-day or multi-day visits and between the ways
of accommodation.
The distance between the place of residence and the national park was also measured in
a categorical variable (K14). The ideal solution would have been to check zip codes of
places of residence and national parks, unfortunately the technical background of the data
collection did not allow this automation. At the same time the development of categories
enabled us to determine the scope of visitation and distinguish between local (within 40
km) and non-local respondents. Besides Halpenny (2006) Manzo (2005) also emphasized
the importance of the variable. Based on his results, his respondents often indicated
natural settings being close to their homes, differing from their place of residence and
workplace and being easily accessible as their favourite places.
To measure childhood visitations the frequency of visitation under the age of 14 was
determined by using a 5-point Likert- scale where 1 meant “not visited at all” and 5 meant

96
“ frequently visited” (K17). The question also covered the given national park and the
visitation to domestic national parks in general.
Length of relationship refers to the relationship between the national park and the
individual. The variable was determined in years based on the time spent since the first
visit (K16).
7.5. Hypotheses of the research
Hypotheses were discussed under two topics. The first group of hypotheses (H1-H5)
examines the effect of external variables forecasting place attachment. They are meant to
give a wider picture on the relationship between visitation characteristics and place
attachment. This was followed by the examination of the relationship between place
attachment and pro-environmental behavioural intention (H6).
Predictors of place attachment and their influence in context of national parks
Predictors are factors that can be examined independently of the sense of place
attachment, with the individual being unaware of a potential positive interaction between
the predictor and the strength of place attachment. Unlike the dimensions of place
attachment, which themselves serve as predictors for major behaviours (for example pro-
environmental behaviour), predictors help to unveil possible mechanisms of the
attachment (Lewicka, 2010), and the major motives of their development.
According to Lewicka (2010), there are three types of predictors of place attachment:
socio-demographical, social and physical. The summary is shown in Table 12.

97
Category Main predictors Attributes
So
cio
-dem
og
rap
hic
pre
dic
tors
Duration of stay The length of stay is a place attachment predictor in case
of stays of both residential and recreational purposes.
It may predict attachment directly or indirectly (Lewicka,
2010)
Not every study found significant relationship between
place attachment and duration of stay (Bolan, 1997;
Scannell and Gifford, 2010a)
Mobility Has several forms that assess and measure place
attachment in different ways (Gustafson, 2002)
Forms: frequent change of permanent address, there is a
permanent place but due to the work one has to spend
longer periods in other cities or countries (van der Klis
and Karsten, 2009), in-country business trips or longer
stays abroad (Gustafson, 2009), frequency and length of
tourism related visits (Halpenny, 2006)
Mainly examined in context of the attachment to the place
of residence
Lewicka (2011) suggests that mobility is a weaker
predictor of place attachment than the duration of stay.
Owing a real estate Consistent predictors
Some researchers apply it as a proxy variable during the
examination of place attachment (Taylor et al., 1985)
Other Social and economic situation, age, qualification, place of
residence
Uncertain predictors whereby the relationship is typically
mediated or moderated by other variables (Lewicka,
2011)
So
cia
l p
red
icto
rs
Community
relationships
Predictor determined by the measures of local social
capital such as the extension of relationship prevailing in
the residential environment.
The closeness of community relationships is a consistent
positive predictor of place attachment (Lewicka, 2011)
Organizational membership (Halpenny, 2006)
Sense of Security It is a consistent positive predictor of place attachment
(Brown et al., 2003; Lewicka, 2010)
Length of relationship with the place, childhood
relationship (Halpenny, 2006)
Ph
ysi
cal
pre
dic
tors
Can be measured by
wider categories
(natural settings, built
environment, urban
environment)
Difficult to operationalize, determined by several factors
GIS (Hur et al., 2010)
PREQ (Perceived Residental Environment Quality) -
(Bonaiuto et al., 2003)
Building size - Lewicka, 2010
In context of tourism, the distance between the place of
residence and the destination (Halpenny, 2006)
Table 12: Classification of predictors of place attachment
Source: own elaboration

98
Consumers may show differences concerning the characteristics of visitations to national
parks. Frequency and length of visitations, length of relationship with parks and
childhood visitations to these national parks are factors which can predict place
attachment (Halpenny, 2006). The objective of the first hypothesis group is to determine
the relationship between the visitation, relationship pattern (frequency of visitations,
duration of visitation, length of relationship with the national park, childhood
interactions) and place attachment.
Previous recreational studies found a strong positive interaction between the frequency of
visitations and place attachment (Moore and Graefe, 1994; Williams et al., 1992),
Halpenny, 2006). According to Moore and Graefe (1994) frequent visitation first
establishes the individual’s place dependence, the visitor realizes that special
circumstances relating to the place can only be available there. This is followed by place
identity due to the memories, meanings during the visitations.
H1: There is a positive relationship between the frequency of visitations to
national parks and the extent of place attachment.
Longer stays enable deeper interactions with the place thus a positive relationship can be
assumed between the multi-day visitations of national parks and place attachment.
Williams et al. (1992) examined the relationship between variables and confirmed a
significant positive interaction with the attachment to the wild area. Having made a
distinction between the duration of the last visit and the duration of visitations in general,
they found that the relationship between the average length of the multi-day visitations
and place attachment is stronger than in case of the last visit. Halpenny (2006) studied a
Canadian national park and also confirmed this significant relationship.
H2: There is a positive relationship between the duration of visitations to
national parks and the extent of place attachment.
The importance of distance from the place of residence was pointed out in several
researches. Based on the results of Manzo (2005), respondents often indicated natural
settings being close to their homes, differing from their place of residence and workplace
and being easily accessible as their favourite places. Halpenny (2006) found a significant
relationship between place attachment and the distance from the place of residence

99
however she pointed out that the explanatory power of the variable is low for the changes
of place attachment.
H3: There is a negative relationship between the distance from the place of
residence to the national park and the extent of place attachment.
The influence of childhood visitations to national parks on place attachment and its
indirect effect on pro-environmental behaviour have not been extensively explored
(Halpenny, 2006; Chawla, 1992; Lee and Allen, 1999; Hofmeister-Tóth et al., 2012). The
studies by Chawla (1992) and Hofmeister-Tóth et al.. (2012) both identify, childhood
experiences in natural settings as a key factor in the commitment to pro-environmental
behaviour.
H4a: Childhood relationship with a given national park has a positive effect
on the extent of place attachment.
H4b: In general, childhood relationship with national parks has a positive
effect on the extent of place attachment.
The effect of the length of relationship with the place on place attachment is in the focus
of several researches (Moore and Graefe, 1994; Kaltenborn, 1997; Mesch and Manor,
1998, Halpenny, 2006). Moore and Graefe (1994) found that the length of relationship
positively influences place identity, while this relationship does not appear in case of
place dependence. Halpenny (2006) confirmed that the length of relationship is a positive
predictor of place attachment.
H5: The length of the relationship with the national park has a positive effect
on the extent of place attachment.
The relationship between place attachment and pro-environmental behavioural
intentions
Based on the findings of Dann (1977, 1981) regarding tourism motivation, consumers are
partially encouraged to travel by the attraction of the destination (pull factors). Visitation
of certain destinations are motivated by the possible interaction with the environment
there and this fact may bring special psychological, social and physiological benefits. As
a result of the interactions the tourism resources of the destination, visitors may associate

100
the place, that was privileged before, with meaning and an attachment can develop to the
place/type of place (Tuan, 1977; Kyle et al., 2004a). Literature on place attachment
however points out that care for the place is rising as place attachment increases. In this
vein, the hypothesis group examines if a more intense attachment to national parks affects
pro-environmental behavioural intentions. Answering this question may serve several
purposes. The results of studies on the effect of place attachment on behaviour are not
consistent. Vaske and Kobrin (2001) found that stronger emotional place attachment
stimulates self-reported commitment to pro-environmental behaviour. Clayton (2003)
and Piskóti (2015) pointed out that those who have a stronger identity with natural setting
have significantly carried out more pro-environmental actions than those who have lower
environmental identity. Scannell and Gifford (2010a) split civic-based and natural-based
attachment and pointed out that those who are more attached to their local natural settings
are more committed to pro-environmental behaviour, while civic based attachment does
not predict pro-environmental behaviour. Contrary to the results listed above Uzzell et al.
(2002) found negative interaction between attachment to the place of residence and pro-
environmental behaviour. Beyond the differences in literature, further studies of place
attachment and pro-environmental behavioural intentions are justified since this issue
relates to tourism and the approach from the visitors’ point of view is still not intensively
researched (Halpenny, 2010). In light of the aforementioned facts, I have the following
assumptions concerning the relationship between place attachment and pro-
environmental behavioural intention:
H6: Place attachment as a second-order factor positively influences visitor’s
pro-environmental behavioural intentions.
H6a: Place attachment as a second-order factor positively influences the
visitor’s low effort pro-environmental behavioural intentions.
H6b: Place attachment as a second-order factor positively influences the
visitor’s high effort pro-environmental behavioural intentions.
H6c: Low effort pro-environmental behavioural intentions mediate the effect
of place attachment on high effort pro-environmental behavioural intentions.

101
H6d: High effort pro-environmental behavioural intentions mediate the
effect of place attachment on low effort pro-environmental behavioural
intentions.
In summary, the hypotheses of the research were as follows:
H Content of the hypothesis
Method of
testing
hypothesis
H1 There is a positive relationship between the frequency of visitations to national
parks and the extent of place attachment.
analysis of
variance
H2 There is a positive relationship between the duration of visitations to national
parks and the extent of place attachment.
analysis of
variance
H3 There is a negative relationship between the distance from the place of
residence to the national park and the extent of place attachment.
analysis of
variance
H4a: Childhood relationship with a given national park has a positive effect on the
extent of place attachment.
analysis of
variance
H4b: In general, childhood relationship with national parks has a positive effect on
the extent of place attachment.
analysis of
variance
H5 The length of the relationship with the national park has a positive effect on
the extent of place attachment.
analysis of
variance
H6 Place attachment as a second-order factor positively influences visitor’s pro-
environmental behavioural intentions. SEM
H6a: Place attachment as a second-order factor positively influences the visitor’s
low effort pro-environmental behavioural intentions. SEM
H6b: Place attachment as a second-order factor positively influences the visitor’s
high effort pro-environmental behavioural intentions. SEM
H6c: Low effort pro-environmental behavioural intentions mediate the effect of
place attachment on high effort pro-environmental behavioural intentions. SEM
H6d: High effort pro-environmental behavioural intentions mediate the effect of
place attachment on low effort pro-environmental behavioural intentions. SEM
Table 13: Summary of research hypotheses
Source: own elaboration

102
7.6. Preparation of statistical analysis
The first step towards performing the analyses was the verification of the database, data
cleansing and the treatment of missing values. The latter one is particularly important for
structural equation modelling since ignoring missing values, especially the systematically
missing ones may lead to the distortion of the model (Weiber and Mühlhaus, 2010). As I
already referred, items measuring latent variables in the model were obligatory resulting in
no missing values in case of the mentioned variables.
I examined the distribution of variables with checking the data. I tested normal
distribution of individual variables with SPSS 22.0 software and Kolgromorov-Spirnov
and Shapiro-Vilk test (Sajtos and Mitev, 2007). Based on the results, variables did not
show normal distribution (see Annex 13). Scholderer et al. (2006, p. 62.) however call
the attention to the fact that evaluation scales of economic and sociology related
researches usually do not show normal distribution. Kolgromorov-Spirnov and Shapiro-
Vilk tests have a quite rigid interpretation of the criteria of normal distribution, such strict
evaluation is not needed for applied research methods (Weiber and Mühlhaus, 2010).
Following the normality test of individual variables I tested the normality of changing
structure (multi-normality) with AMOS 22.0 software. I examined cases differing
significantly from the others by using Mahalanobis distance (Weiber and Mühlhaus,
2010). I identified 24 cases where the distance indicator stood out, I excluded them from
further analyses. The indicator of multi-normal distribution was above the expected
threshold but as the applied estimating methods are quire robust, it did not influence the
fitting of the model (Weiber and Mühlhaus, 2010).
7.7. Results of the research
7.7.1. General characteristics of visitation to national parks
In order to understand respondents’ visitation patterns, visitation frequency to certain
domestic national parks as well as parks visited between July 2014 and July 2015 were
examined. I also wished to explore how often the respondents visit foreign parks in
addition to the domestic ones and how much time they spent in national parks during their
childhood.

103
As already seen in the description of the sampling procedure, only respondent who, at
least once, visited any of the Hungarian national parks during the given 12 months were
eligible to participate in the study. Since the sampled population covered regular or
occasional visitors, first I was interested to know what are the general visitation patterns
of national parks. Respondents evaluated the values of the scale items by using a 5-point
Likert-scale where 1 meant “not at all true of me” and 5 meant “completely true of me”.
Visitations of domestic national parks were given a M=3.65 (SD=1.002) average score
while visitations to foreign parks had an average value of M=2.16 (SD=1.214).
Besides the aforementioned, I analysed the frequency of visitations to certain national
parks. I put this question in general and did not tie it to time intervals. Survey participants
rated the frequency of their visitation ranging from 1 (never) to 5 (very often). The
majority of the respondents in the sample visit Bükk, Balaton-felvidék, Aggtelek and
Hortobágy National Parks in their leisure time. In light of the visitation frequency it can
be stated that while Hortobágy and Aggtelek National Parks attract ad hoc visitations,
Bükk and Balaton-felvidék National Parks are featured by a large number of returning,
frequent visitors.
Regular Occasional Total visitors Total non-
visitors
Bükk National Park 58 162 220 44
Balatoni-felvidék National Park 62 157 219 45
Aggtelek National Park 23 192 215 49
Hortobágy National Park 16 194 210 54
Kiskunság National Park 23 163 186 78
Duna-Ipoly National Park 37 125 162 102
Fertő-Hanság National Park 13 147 160 104
Őrség National Park 21 133 154 110
Körös-Maros National Park 22 126 148 116
Duna-Dráva National Park 17 127 144 120
Table 14: Visitation frequency to domestic national parks
(N=264) Source: own elaboration
*The category of ‘frequent’ is a result of merging 4=often and 5=very often, while the category ‘occasional’
merges 2=rarely and 3=sometimes.

104
Most of the respondents never visited Duna-Dráva, Körös-Maros and Őrségi National
Parks. Frequency of visitations to certain national parks are detailed in Annex 14.
I found a similar trend in case of national parks visited during the past 12 months. The
average number of the parks visited during the reference period is 2.08 (SD= 1.15). 37.5
% of the respondents (n=99) visited one, 33.3% (n=88) visited two, 18.6% (n=49) visited
three, 6.4% (n=17) visited four, and the rest 4.2% (n=11) visited five or more parks during
the past year. Most of the respondents visited Balaton-felvidék National Park (37.9%,
n=100) in the given period. This was followed by Bükk (33%, n=87), Hortobágy (31.1%,
n=82) and Duna-Ipoly (19.7, n=52) National Park. Further researches (Ministry of
Agriculture, former Ministry of Rural Development and Pannon Egyetem 2012, 2015)
show that the mentioned parks were mainly characterized with shorter visits as a result of
their proximity from sending points and their potential to make travels more colourful.
Their frequent occurrence in the answers is therefore probably a result of their geographic
location. Duna-Dráva and Fertő-Hanság National Parks were given the least mentions
(12.1%, n=32).
7.7.2. Patterns of attachment to national parks
In the study of place attachment to national parks respondents were asked to mark the one
national park visited in the past 12 months that they felt the closest to. Although the time
frame limited the respondents in choosing their favourite park to use for completing the
questionnaire, several further research questions (pro-environmental behaviour in the
park) required exact recalling of the details of the visitation. During the selection phase I
wanted to ensure that the visitor evaluates the most favourite park visited within one year
so as to be able to give more nuanced answers regarding the attachment to the place.
Based on respondents’ answers relating to their favourite parks, Bükk, Balaton-felvidék
and Hortobágy National Parks received the most mentions. Mentions of national parks by
numbers and proportions are summarized in Table 15.

105
Name of the national park
Number of
visitors in the
sample
Proportion of
visitors in the
sample
Bükk National Park 50 18.9%
Balatoni-felvidék National Park 46 17.4%
Hortobágy National Park 30 11.4%
Duna-Ipoly National Park 29 11.0%
Körös-Maros National Park 24 9.1%
Duna-Dráva National Park 22 8.3%
Kiskunság National Park 18 6.8%
Őrség National Park 18 6.8%
Aggtelek National Park 17 6.4%
Fertő-Hanság National Park 10 3.8%
Table 15: Number and proportion of mentions in the sample about the favourite national parks
visited during the past 12 months
(N=264) Source: own elaboration
Almost half of the respondents (47.3%) visited the given national park within three month
before the questionnaire. At the same time, 51.9% of them completed the survey based
on their experiences gained during the previous year.
Figure 13: Recent visitations to the given national park in monthly breakdown
(N=264)
Source: own elaboration
Preliminary researches (Kaltenborn and Williams, 2002; Syme et al., 2002) pointed out
that those who lived near the national park or other conservation area were willing to
demonstrate higher place attachment to a nearby park/conservation area. To study this
relationship, the proportion of locals in the sample was first determined. 34.5% (91
16
34
42
24
13
7
1 20
14
29
36
46

106
persons) of the respondents were local visitors that is the given national park was located
in a range of 40 km from their place of residence. 33% of the respondents (87 persons)
travelled 40-150 km, 22% (58 persons) travelled 151-250 km and 8% (22 persons)
travelled more than 250 km to visit the given national park. 6 respondents did not answer
this question.
Figure 14: The distance from the place of residence to the selected national park
(N=264)
Source: own elaboration
139 persons (52.7 %) were frequent visitors of the given park, out of which 39.4% had a
few visits per year and 13.3% of the visitors visited the park at least every month. Further
categories showed the following breakdown: a few visits per year: 104 persons (39.4%),
one visit per year: 64 persons (24.2%), one visit in every three years: 28 persons (10.6%),
one visit in more than three years: 19 persons (7.2%); no answer: 14 persons (5.3%).
Almost two third of the respondents were day visitors. 49.9% of them stayed the night at
home, 14% of them stayed overnight within the range of 40 km and 10.6% of them were
passing through to another destination. 21.6% of the respondents spent several days there
and stayed within a range of 40 km. The rest 3.8% indicated other categories (daily
visitors, multiple day visitors staying within a range of 60km or further etc.).
35%
33%
22%
8%
2%
0% within 40 km
40-150 km
151-250 km
over 250 km
I do not know
no answer

107
Figure 15: Duration of visitation in the national park (categories per capita and in %)
(N=264)
Source: own elaboration
80.3% of the respondent visited the given national park with four or less travel mates.
35.9% of them arrived with children company aged 1-3. The occurrence of group visits
(over 10 persons) was 8%.
The relationship with the national park, that is the period of time since the first visit was
19.92 years on average (SD= 15.15). Answers varied between 0 (first visitation to the
park happened this year) and 65. 18 persons (6.8%) reported on first visitation. Based on
the age of respondents and the number of years since the first visit I identified the age of
respondents at the time of their first visit which was 29.72 years on average (SD=18.12).
The majority of the respondents listed those parks that they visited as adults. This was
supported by the questions concerning visitations during childhood. Having examined
the characteristics of visitations to a given national park and to national parks in general
during childhood I found that children under the age of 14 appeared to visit parks in
general rather than a specific park (see Table 16)
under the age of 14
in the given
national park in national parks in general
N % N %
visitations were not common 167 63% 132 50%
visitations were moderately common 40 15% 71 27%
visitations were common 57 22% 61 23%
Total 264 100% 264 100%
16. Table:Visitations to national parks under the age of 14 in the sampleTable
(N=264)
Source: own elaboration
50%
14%
10%
22%4%
Day visitor, staying at home
Day visitor, staying with 40 km
Day visitor, passing through toanother destination
Multiple day visitor, staying with40 km
Other

108
Having understood the main patterns of the recent visitations, I examined the attachment
to the selected park. A 12-item scale by Ramkissoon et al. (2013) presented earlier was
used to measure place attachment. The scale measures place dependence, place identity,
place affect and social bonds sub-dimensions with 3 items each. Respondents evaluated
the values of the scale items by using a 5-point Likert-scale where 1 meant “not at all true
of me” and 5 meant “completely true of me”.
Sub-
dimensions Items Average
Standard
deviation
Place
dependence α=0.836 M=2.902; N=264
PD1
This national park has the best settings and facilities for
activities that entertain me the most. 2.82 1.125
PD2
I cannot imagine better settings and facilities for my
activities than this national park. 2.85 1.126
PD3
A visitation to XXX National Park brings more
entertainment than other places. 3.03 1.147
Place affect α=0.877 M=3.249, N=264
PA1 This national park means a lot to me. 3.57 1.051
PA2 I am attached to this national park. 3.26 1.218
PA3
I feel I belong to this national park and to its
settings/facilities. 2.92 1.258
Place identity α=0.854 M=2.971, N=264
PI1 I strongly identify with this national park. 3.08 1.270
PI2 I feel that this national park has become part of my life. 2.98 1.270
PI3
The fact that I visit this national park tells a lot about who I
am. 2.85 1.226
Social bonds α=0.773
M=2.218, N=264
PSB1
I would lose several friendships if I did not visit this national
park any longer. 1.92 1.139
PSB2
My friends/family would be disappointed if I were to visit
areas of other settings and facilities. 2.07 1.116
PSB3
Most of my friends/relatives prefer this national park to
others. 2.66 1.229
Table 17: Description of the scale measuring place attachment
The Cronbach α value of the whole scale was 0.933
Source: own elaboration
The average of the items in the sample was MItem= 2.83 (SD=1.18). Two out of the five
items having the highest average score referred to place affect, this was followed by items

109
measuring identity and dependence in a mixed order. The smallest values were assigned
to social bonds items (see Table 17).
I determined the strength of commitment to a national park based on the values of the
place attachment scale by adding up the evaluation figures given to the scale items for
each individual. Based on this, the average score can be between 12-60. The average
value of the place attachment scale was MScale=34.02 (SD=10.767) which reflects a
slightly stronger commitment to national parks than the medium level 22.
In order to understand the demographical differences of place attachment, I examined the
following variables: gender, age, region and type of the place of residence, family status,
size of the household, number of children under 14 in the household, qualification,
income and childhood place of residence. Significant difference was shown based on
1. age (F(4.259)=3.131; p=0.015),
2. region of place of residence (F(2.261)=6.195; p=0.02) and
3. income (F(4.192)=5.543; p=0.000).
Average and variance values are summarized in Table 18.
N Average
Standard
deviation
Ag
e
15-29 26 32.35 10.15
30-39 48 32.29 11.36
40-49 54 32.85 11.15
50-59 48 32.02 10.57
60-69 88 37.26 9.94
Total 264 34.02 10.77
Reg
ion
Middle 80 32.40 10.19
East 106 36.80 10.84
West 78 31.90 10.55
Total 264 34.02 10.77
Inco
me
under HUF 100,000 28 38.68 11.91
HUF 100,000 - 200,000 51 38.08 10.32
HUF 200,001 - 300,000 53 35.79 8.84
HUF 300,001 - 400,000 35 30.49 10.33
above HUF 400,000 30 30.20 10.28
Total 197 35.00 10.65
Table 18: Demographical differences in the values of place attachment
Source: own elaboration
22Average place attachment of the sample to the place of residence was MScale=37.57 (SD=10.182).

110
People between the age of 60-69 demonstrated the strongest attachment to national parks
among other age groups (M=37.26, SD=9.94). As a result of the Tukey HSD Post-hoc
test there is a significant difference between them and people aged 50-59. The relationship
between age and place attachment was more obvious among returning visitors and locals
than among occasional visitors (Mesch and Manor, 1998; Shumaker and Taylor, 1983;
Williams et al., 1992). I shall mention further studies on this during the multiple analysis
of variance. As far as region is concerned, people living in the eastern region had higher
average values and showed significantly stronger place attachment than people in mid-
or western region. It is however important to point out that the difference could have been
caused by the higher proportion of respondents aged above 60 in that region. Based on
the per capita income of a household, place attachment is decreasing as the income
increases. There was a significant difference between the category under 100,000 HUF
and the category above 300,000 HUF. This can be explained by the fact that lower income
people are less mobile and this increases place dependence to recreation venues within
their region that is the functional attachment to a place (Halpenny, 2006).
Place attachment items in relation to the place of residence were also asked in the study.
Having seen the answers relating to national parks, the place of residence, as expected,
had a higher average value in each item (MSacelLakhely=37.57, SD=10.182) except for the
place dependence item relating to the entertaining nature of the place. The national park
was given a slightly higher average (see Annex 15). During the comparison of attachment
to two places the biggest differences appeared in case of items referring to social bonds
dimension, emotions (I feel I belong to the environment of my place of residence) and
identity (I feel the place of residence and the surroundings are part of me).
7.7.3. Forms of pro-environmental behaviour
Respondents’ pro-environmental behaviour was examined both in relation to the given
national park and to the place of residence. Park-specific pro-environmental behavioural
intentions in national parks were measured using Halpenny’s (2006) previously described
12-item scale. Respondents considered the items from two aspects. First, whether they
performed the given action during their last visit (yes/no), second, how likely they will
perform these actions during the next visit (1=very unlikely, 5=very likely).

111
The reliability of pro-environmental behaviour scales was examined using the same
procedure that was described previously in connection with place attachment. The
Cronbach alfa value of Halpenny’s (2006) behavioural intention scale in national parks
was 0.909, the item-total correlation reached the value of 0.3 in all cases. In case of the
pro-environmental behaviour scale of Schultz and Zelezny (1998) the Cronbach alfa
value exceeded the expected value of 0.7 (α=0,825). The item-total correlation for 10
items was between r=0.5364 and 0.662, within the range of acceptance (r >0.3).
Respondents mainly conducted 4-5 types of actions out of the 12 pro-environmental
actions relating to national parks. The scale average was M=4.76 (SD=2.82). The number
of realized action, as well as the associated individual scores varied between 0-12 in the
sample. The most frequent actions were categorised as low effort, easy and general types
resulting in quite mixed categories (see Table 19). Most respondents mentioned the
information before visitation (n=219), this was followed by picking up litter (n=158),
encouraging others (n=146), protecting favourite spot is if it needs to recover from
environmental damage. High effort behavioural types (environmental activism, civic
actions) had lower ranking and less mentions.

112
Ca
teg
ory
Gen
era
lity
Dif
ficu
lty
Items N
Did you
carry out
such
activity
during
your last
visit?
(persons)
Probability
of the
activity
during the
next visit
Average
Probability
of the
activity
during the
next visit
Standard
deviation
Learning
behaviour G E
Learn more about XXX National
Park’s natural environment. 264 219 3.56 1.098
Pro-environmental
citizen / physical
activity
G E
Pick up litter at this National
Park left by other visitors. 264 158 3.35 1.282
Consumer
behaviour S E
Volunteer to stop visiting a
favourite spot in the Park if it
needs to recover from
environmental damage.
264 154 3.50 1.345
Convincing
behaviour G E
Encourage others to reduce their
waste and pick up their litter
when they are in this National
Park.
264 146 3.55 1.182
Consumer
behaviour S E
Volunteer to reduce my use of a
favourite spot in the Park if it
needs to recover from
environmental damage.
264 129 3.47 1.319
Convincing
behaviour G E
Tell my friends not to feed the
animals in this National Park or
similar parks. 264 111 3.21 1.272
Environmental
activist G D
Sign petitions in support of XXX
National Park and similar
protected areas. 264 89 3.34 1.307
Financial activity G D
Pay increased park fees if they
were introduced for this national
park’s programs. 264 76 2.97 1.238
Environmental
activist/
physical activity
S D
Volunteer my time to projects
that help this national park or
similar national parks and
conservation areas.
264 52 2.69 1.200
Financial activity G E
I donate money to protect places
such as the XXX National Park. 264 52 2.55 1.095
Citizens’ activity G D
I participate in public meetings
regarding the operation of XXX
National Park. 264 41 2.28 1.159
Environmental
activist G D
I urge to support XXX National
Park (eg.: I write a letter, support
online petition).
264 31 2.29 1.215
Table 19: Pro-environmental behaviour and behavioural intention in national parks
S: specific, G: general, E:easy, D:difficult
Source: own elaboration

113
Demographical differences were examined using one-way ANOVA in the aim of gaining
a deeper understanding of pro-environmental behaviour patterns. The following variables
were incorporated into the study: gender, age, region and type of place of residence,
family status, size of household, number of children under 14 in the household, education,
income, place of residence, and place of childhood. Significant difference was shown
based on
1. age (F(4.259)=12.904; p=0.000),
2. region (F(2.261)=3.493; p=0.032),
3. income (F(4.192)=4.453; p=0.002),
4. presence of children under 14 in the household (F(1.262)=10.017; p=0.002).
Respondents aged 60-69 were mainly characterized with pro-environmental behaviour in
national parks, they were followed by the age group of 15-29 then 50-59. The lowest
average appeared amongst people between 40-49. Based on the Tukey HSD post-hoc test
there is a significant difference between the age group of 60-69 and other age groups. By
examining eastern, mid and western regions, it seemed clear that respondents in the
Eastern region performed significantly more actions compared to other regions. Based on
the breakdown of incomes, people possessing 300,000-400,000 HUF per capita income
demonstrated the least pro-environmental behaviour. Significant difference was detected
between them and the category of 100,000-300,000 HUF. In general we can state that
pro-environmental behaviour is less common in category above 300,000 HUF. I
experienced significant difference based on the presence of a child under 14 in a
household. Among people with children in a household, pro-environmental behaviour
was significantly lower. Average and variance values are detailed in Table 20. The
related ANOVA tables and Turkey HSD post-hoc tests can be found in Annex 18.

114
N Average Standard
deviation
Ag
e
15-29 26 4.54 2.92
30-39 48 3.44 2.57
40-49 54 3.91 2.68
50-59 48 4.33 2.18
60-69 88 6.32 2.66
Total 264 4.77 2.82
Reg
ion
Middle 80 4.30 2.92
East 106 5.31 2.78
West 78 4.50 2.67
Inco
me
Total 264 4.77 2.82
under HUF 100,000 28 5.64 3.23
HUF 100,000 - 200,000 51 5.55 2.45
HUF 200,001 - 300,000 53 5.66 3.23
HUF 300,001 - 400,000 35 3.77 2.24
above HUF 400,000 30 3.93 2.48
Total 197 5.03 2.87
Ch
ild
ren
in
the
ho
use
ho
ld
no children under 14 207 5.05 2.82
children under 14 57 3.74 2.59
Total 264 4.77 2.82
Table 20: Demographical differences in the values of pro-environmental behaviour concerning
national parks
Source: own elaboration
Following the study of activities during the last visit, behavioural intentions were
examined. The average score of the pro-environmental behavioural intentions scale was
MScale=36.77 (SD=10.42), while the average of the items was MItem= 3.06 (SD=1.509)23.
Individual values higher than the average of MItem were reached by easily accessible,
general activities. Compared to the actual behaviour, less change was observed, typically
in regard to the management scattered waste. In case of pro-environmental intentions,
warning other has a higher average score (M=3.55, SD=1.118) than that of the own
behaviour (M=3.35, SD=1.282). This phenomenon can be explained by the fact that own
behaviour item referred to the scattered litter and warning others can reduce or prevent
this action. This reflects a more conscious behaviour as we have seen that warning others
had far less mentions (n=146) than own behaviour (n=219).
23 Halpenny (2006) M=3.7, SD= 0.68

115
Having compared the research results of behavioural intention with Halpenny’s (2006)
Canadian research, similarly low average values appeared in case of high effort political
and activism actions, while easier, socially more expected forms (picking up waste,
information etc.) received higher values. Differences were rather related to deviations:
while the present research showed lower variance in case of committed actions, the
Canadian study observed this relationship in connection with easier forms.This can be
caused by the fact that in Hungary, the encouragement of this forms of behaviour has
started much later, they have not been fully integrated into social expectations. The lower
ranking of financial actions in the Hungarian sample was considered to be another
difference. This can be explained by the price sensitivity of the Hungarian population
(Hofmeister-Tóth et al., 2011b; Nagy and Piskóti, 2011), and with the changed economic
climate between the dates of the two researches.
Behaviour at the place of residence was equally studied in the aim of comparing pro-
environmental behaviour patterns in national parks.
Items Average Standard
deviation NV
Recycled newspapers 4.23 1.116 4
I collect cans and bottles selectively. 4.08 1.121 4
Looked for ways to reuse thing 3.82 0.926 4
I saved fuel and I was walking or riding a bike instead. 3.52 1.164 5
Purchased products in reusable or recyclable containers 3.39 0.902 6
Encouraged friends or family to recycle. 3.32 1.187 5
Picked up litter that was not your own 3.23 1.026 12
I voted for a candidate who supports environmental issues. 3.1 1.406 19
Composted food scraps 2.77 1.503 21
Written a letter supporting an environmental issues 2.21 1.242 34
Table 21: Pro-environmental behaviour at the place of residence (N=264)
Source: own elaboration
The average of the self-reported pro-environmental behaviour scale of Schultz and
Zelezny (1998) in the sample was MScale=33.67 volt. The 10-item scale on the realized
behaviour put questions in relation to the frequency of activities in the past 12 months.
Respondents evaluated the values of the scale items in relation to the frequency of the
actions by using a 5-point Likert-scale where 1 meant “never” and 5 meant “always” and
99 meant “not relevant to me”. Provided that the respondent was unable to perform the
action at his/her place of residence (no car was available thus saving fuel was not an
116
appropriate option) 99=not relevant to me was an option. The average of scale items
MItem=3.367 (SD=1.377)
Like in case of behaviours in national parks, among behaviours at the place of residence
easier, socially more expected actions got higher ranking such as selective waste
collection, recycling, discontinuation of consumption. Actions at the place of residence
were less characterized with environmental activism. The option “not relevant to me” was
mostly selected in case of the following items: urge to support environmental issues,
composting, voting on environmentalist MPs.
As a next step, following the guidelines by Schultz and Zelezny (1998), the average
(hereinafter referred to as ‘score’) of the answers given to the scale was computed.
Authors recommended that individual average could range from 1 to 5 with considering
items “not relevant to me” as missing values. Scale score for the whole sample was
MScore=3.359. I analysed the differences in pro-environmental behaviour with
demographical variables. By applying a one-way analysis of variance significant
difference was detected in age groups only (F(4.259)=5.671; p=0.000). Respondents aged
15-29 were less characterized with pro-environmental actions (M=3.15), the age group of
60-69 was most characterized with pro-environmental actions (M=3.65) and it increased
as people got older (see Annex 16). Based on the Tukey HSD post-hoc test there is a
significant difference between the age group of 60-69 and other age groups. We have seen
it when discussing typical behaviours in national parks that this age group performed
significantly more actions during their visitations compared to other age groups. This
tendency was reflected in several previous national studies, in which also the younger
population demonstrated less environmental awareness (Piskóti, 2015; Hofmeister-Tóth
et al., 2013). I also found that the following two items entailed significant differences
between the age group of 60-69 and other age groups: voting for a representative
supporting environmental issues and composting. While “composting” is significantly
frequent in age group 60-69 compared to the age group 15-49, “voting for candidate”
brings significant difference compared to the age group 30-59. The age group 60-69
demonstrated significantly lower value in case of item referring to buying recyclable,
selective package compared to the age group 30-39.

117
In summary, behavioural patterns in national parks and at the places of residence were
limited to low-effort behaviours whereas dynamic activities less expected by society and
requiring activism were more characteristic in the age group above 60. It can be stated
that demographical variables showed more significant differences in pro-environmental
behaviour in national parks than at the place of residence. While the differences were
noticeable based on age only at the place of residence, national parks however
demonstrated more differences based on region, income and the presence of children
under 14.
7.7.4. Examination of external variables of place attachment
Hypotheses H1-H5 aimed to study the relationship between external factors and place
attachment. While hypotheses H1, H2 and H3 analyse the predicting effect of certain
visitation characteristics on place attachment, hypotheses H4a, H4b and H5 describe the
development of place attachment from the aspect of the relationship with the national park.
The classification of involved variables is shown in Table 22.
EXTERNAL FACTORS
Characteristics of the visit Characteristics of the
relationship
H1: Frequency of visitations H4a: Childhood visitations to the
given park
H2: Duration of visit H4b: Childhood visitations to
national parks
H3: The distance from the place
of residence to the national park H5: Length of relationship
Table 22: Summary of the independent variables examined
Source: own elaboration
Due to the level of measurement, a one-way analysis of variance was used to measure the
variables. A two-way analysis of variance was conducted to test for interations. IBM
SPSS 22.0 software was used for statistical analyses. As an initial condition of the
analysis, the normal distribution of the dependent variable as well as variance
homogeneity were examined. For examining normality I applied Kolmogorov-Smirnov
and Shapiro-Wilk tests. The null hypothesis of the tests is true if the distribution is
different from normal distribution (Sajtos and Mitev, 2007). This could not be rejected

118
for the sampled dependent variable, that is the place attachment scale value, therefore the
variable cannot be considered to have normal distribution (see test results in Annex 17).
As far as the F-test is concerned, Sajtos and Mitev (2007) point out that due to its robust
nature, the non-compliance with the criteria do not have much impact on first-order of
second-order error probability, thus this does not harm the validity of conclusions. To
estimate variance homogeneity the Levene's test was applied. The goal of this test is to
determine whether the dependent variable has the same variation with different levels of
the independent variable. Null hypothesis is true if the variance of dependent variables is
uniform with different levels if independent variables (Katz et al., 2009) In case of
independent variables involved in the analysis null hypothesis was rejected at a threshold
value of 0.1. The criteria of variance homogeneity was met in case of all variables.
After ensuring that the required conditions were met, a one-way analysis of variance was
conducted to evaluate the relationships between the variables. Among sampled visitation
characteristics, the variables of frequency of visitations and distance from national parks
had significant effect.
Frequency of visitations
I found a significant difference between place attachment and frequency of visitations
(F(4.245)=10.008; p=0.000).
Variable
Sample
size Average
Standard
deviation
Fre
qu
ency
of
vis
ita
tio
ns
Less than once in 3 years 19 25.53 9.65
Once in three years 28 29.11 9.06
Once a year 64 32.91 10.76
Few times a year 104 36.44 9.46
At least once a month 35 40.00 10.57
Total 250 34.38 10.63
Table 23: Differences in the values of place attachment based on the frequency of visitations to the
national park
Source: own analysis
Place attachment had higher and higher values in the sample as the frequency of visitation
increased (see Table 23). Based on Tukey HSD post-hoc test, a significant difference is
shown between rare visitors (visiting less than once in three years) and visitors visiting at
least once a year. A significant difference was equally found between the group visiting
once in three years and the group visiting several times a year, as well as between visitors

119
visiting once a year and visitors visiting at least once a month. In a next step, explained
variance was computed. The influence of the frequency of visitations on place attachment
was Eta²=0.14. In other words, the frequency of visitations accounted for 14% of the
variation of place attachment.
Based on the results, hypothesis H1 is accepted as a positive relationship was found
between place attachment and the frequency of visitations.
Duration of visit
A longer visit to the national park may be associated with more complex experiences and
wider information so a positive relationship was assumed between multiple day
visitations to national parks and place attachment. Based on the duration of stay, however,
I did not find significant difference in place attachment (F (3.249) =1.164; p=0.324). It
can partially derive from the fact that the variable was defined for the last visit. According
to Williams et al. (1992), this relationship can be better understood if this variable
determines the average duration of visitations calculated from the average of the total
visitations during the examined time period.
Variable
Sample
size Average
Standard
deviation
Du
rati
on
of
vis
it
Day visitor, staying at home 131 34.69 11.16
Day visitor, staying with 40 km 37 31.11 10.69
Day visitor, passing through to another
destination 28 34.43 9.89
Multiple day visitor, staying with 40 km 57 34.37 8.86
Total 253 34.06 10.49
Table 24: Differences in the values of place attachment based on the duration of visitations to the
national park
Source: own analysis
Based on the average values of place attachment it seems clear that one-day visitors
staying within 40 km were characterized with the lowest place attachment value. We can
assume that the driving factor behind this type of visitation is to make leisure time more
colourful and recreation appears as a secondary element only during a long vacation.
Regarding shorter visits similar conclusions were drawn in a study on the visitations to
Hungarian national parks (2013) (Ministry of Agriculture and Pannon University, 2015).

120
Based on the results, I reject H2 hypothesis as I did not find significant relationship
between place attachment and the duration of the stay.
The distance from the place of residence to the national park
Concerning place attachment and the distance to the national park a significant
relationship was only found in the context of locality. Respondents could choose from
four categories when specifying the distance between the national park and their place of
residence: the first category related to local visitors (place of residence within 40 km), the
others related to visitors coming from further distances. The analysis of variance on
between the four categories did not result in significant difference for place attachment
(FDistance (3.254)=2.113; p=0.099). After separating local and non-local distance
categories, I found significant differences between the groups (FLocal (1.256)=5.857;
p=0.016), local visitors were marked by stronger place attachment regarding the selected
national park. A more detailed differentiation of distances allows us to notice that the
value of place attachment becomes bigger as the distance increases. It is worth further
examining this issue by excluding local visitations. In this case, even a narrowed
examination of visitors coming from farther that 40 km did not result in significant
difference.
Variable
Sample
size Average
Standard
deviation
Lo
cali
ty Local visitor
(living within 40 km) 91 36.32 10.82
Non-local visitor 167 32.96 10.57
Total 258 34.14 10.76
Dis
tan
ce f
rom
th
e
na
tio
na
l p
ark
within 40 km 91 36.32 10.82
40-150 km 87 32.39 10.78
151-250 km 58 33.53 10.09
over 250 km 22 33.68 11.29
Total 258 34.14 10.76
Table 25: Differences in the values of place attachment based on the distance between the national
park and the place of residence
Source: own elaboration
Taking the above-mentioned into account, I reject H3 hypothesis. No significant
relationship was found between the distance from the place of residence and place
attachment. However, a positive interaction appeared between place attachment and the
local attribute of visitations. The influence of the local attribute of visitations on place

121
attachment was Eta²=0.22 Therefore the local attribute of visitations accounted for 22%
of the variation of place attachment scale.
To study the interactions between the visitation features and to identify partial effects a
two-way hierarchical analysis of variance was conducted with locality as the first
predictor variable. Significant main effects appeared when examining locality and the
frequency of visitations together (FLocal(1.240)=7.616; p=0.06; FFrequency(4.240)=8.328;
p=0.000). The interaction between the two variables was not significant, thus the two
variables have their each (partial) effect on place attachment. The examination of partial
effects shows that the effect of locality weakens (Beta²=0.002), the effect of frequent
visitations grows (Beta²=0.163), if the effect of the other variable on place attachment is
kept under control. In other words, if we exclude the effect of frequency of visitations,
the effect of locality on place attachment decreases, so as its explanatory power, its
examination in addition to frequency of visitations is progressive. The partial effects of
the variables are summarized in Table 26.
ETA BETA BETA²
Locality 0.164 0.05 0.002
Frequency 0.378 0.404 0.163
Table 26: Influence of visitations characteristics on place attachment, two-way ANOVA
Source: own elaboration
Locality and the frequency of visitations together account for 14.5% of place attachment
strength (R²=0.145).
Potential further interactions were investigated by involving demographical attributes
known to be in significant relationship with place attachment. I completed the analysis
with age, region and income related variables. Here too, no significant interactions were
apparent between variables. The significant main and partial effects are detailed in Table
27.

122
Significant main effects
Inte
ract
ion
ETA BETA BETA²
R2
Variable-
pair
Main effect of
variable 1.
Main effect of
variable 2.
Variab
le 1.
Variab
le 2.
Variab
le 1.
Variab
le 2.
Variab
le 1.
Variab
le 2. (in %)
age-locality
F(5.248)=4.159
p=0.01
F(4.248)=3.381;
p=0.007 - 0.223 0.150 0.233 0.164 0.054 0.027 7.70%
income-
locality
F(4.185)=5.871
p=0.000
F(1.185)=4.168;
p=0.043 - 0.329 0.161 0.320 0.140 0.102 0.019 12.80%
region-
locality
F(2.252)=5.607
p=0.01
F(1.252)=6.292;
p=0.02 - 0.215 0.150 0.200 0.130 0.040 0.017 6.20%
age-
frequency
F(4.225)=3.548
p=0.08
F(4.225)=9.530;
p=0.000 - 0.222 0.375 0.205 0.365 0.042 0.133 18.00%
income-
frequency
F(4.166)=6.495
p=0.000
F(4.166)=10.189;
p=0.000 - 0.326 0.435 0.293 0.414 0.086 0.171 27.30%
region-
frequency
F(2.235)=6.009
p=0.003
F(4.235)=9.519;
p=0.000 - 0.203 0.375 0.176 0.362 0.031 0.131 17.10%
Table 27: Interaction between variables, significant main and partial effects
Source: own elaboration
Income and frequency of visitations have the strongest total explanatory power (27.3%)
among the variable pairs examined. We have seen it earlier that as the frequency of
visitations rises, place attachment increases. By clarifying this connection further we see
that as a result of frequent visitations, place attachment increases more significantly in
lower income categories than among visitors of higher income. In terms of locality, local
visitors represent stronger attachment than non-locals in each income category, however,
this difference was especially visible in income categories under HUF 100,000 and above
HUF 400,000.
Concerning the partial effects of variable pairs examined, the effect of certain variables
decreases, except for age-locality, provided we keep the other variable under control. In
case of age and locality, explanatory power of both variables increases by excluding the
effect of the other one. Local visitors above the age of 30 show stronger place attachment
as age increases than visitors coming from farther. Previous studies on age also reported
stronger place attachment among locals (Mesch and Manor, 1998; Shumaker and Taylor,
1983, Williams et al., 1992).

123
Similar results were found in case of returning visitors, too. Results of the two-way
analysis of variance showed that in the combined impact of locality and frequent
visitations, locality had less explanatory power. Based on the combined impact of these
two variables, visitors from a further distance showed higher place attachment in all
frequency related categories than local people. However, local population represented
frequent visitors. By completing this with the effect of age I can conclude that the
frequency of visitations and ageing in the age groups above 30 increased the value of
place attachment. This relationship addresses the significance of length of the relationship
with the national park.
The role of childhood visitations
During the analysis of the relationship between childhood visitations and place
attachment I found significant effects regarding the given park (Fgiven park (2.261)=4.536;
p=0.012) and national parks in general (Fin general (2.261)=3.719; p=0.026).
under the age of 14
in the given
national park in national parks in general
Average Sample size Average Sample size
visitations were not common 32.54 167 32.60 132
visitations were moderately common 35.83 40 34.01 71
visitations were common 37.07 57 37.10 61
Total 34.02 264 34.02 264
Table 28: Differences in the values of place attachment based on childhood visitations to the
national park
Source: own elaboration
The bigger role visitations to a given park or to national parks in general played in
respondents’ childhood, the higher values of place attachment appeared. Childhood
visitations to national parks accounted for 2.8% of the variation of place attachment and
visitations to a given park accounted for 3.4% of the same variation. As a result of the
Tukey HSD post-hoc test in both cases significant difference was noticed between groups
visiting national parks in childhood and groups not visiting them in childhood. The
combined examination of the two variables resulted in significant main effect only in case
of the variable of childhood visitation to national parks (F (2.255)=3.713; p=0.026), there
were no interaction between the two variables. This can be caused by the fact that
respondents primarily listed those parks that they had relationship with as adults.

124
I accept H4a and H4b hypotheses with the above-mentioned comments. Both childhood
relationship with a given national park and the childhood relationship with national parks
in general positively affect the extent of place attachment.
Significant differences were found in the relationship between the length of the
relationship with the national park and place attachment (F (5.258)= 4.307; p=0.01)
among first time visitors and visitors of more than 6 years of visitation. The variable
accounted for 7.7% of the variation of place attachment (R²-=0.077). Since the
relationship of elderly people with the national park can be longer due to their age, I
examined the interaction between the two variables. Results confirmed that beside the
significant main effect of the two variables (Frelationship(5.235)=4.696, p=0.000; Fage
(4.235)=3.425, p=0.006) the interaction (F(19.235)=1.653, p=0.045) is also significant,
thus the two variables represent a joint explanatory power. Regarding place attachment
values, a salient connection has become clear in the dimension of age and the length of
relationship. First, a stronger bond of the older age group appeared again. Place
attachment values of the age group 60-69 as already referred to them, were higher in all
relationship related category except for two cases. The two exceptions were such
relationship-age combinations where the visitor had a childhood bond (age group 30-39
had 26-35 year relationship, age group 40-49 had a relationship of more than 35 years).
Thus the importance of childhood visitations was taking more and more shape when
examining the two variables.
Length of relationship with the park
Age first visit 1-5 years 6-15
years
16-25
years
26-35
years 35+ years
15-29 20.33 26.00 34.80 38.57 32.00
30-39 18.00 31.50 33.00 28.60 39.67 20.00
40-49 24.80 31.78 35.30 31.40 30.25 41.75
50-59 28.00 25.40 34.21 26.00 34.67 35.93
60-69 28.00 37.12 37.00 42.40 39.00 35.67
Total 24.17 32.41 34.97 33.96 36.00 36.49
Table 29: Place attachment values in the dimension of age and the length of relationship variables
Source: own elaboration
In order to better understand the higher values appearing consequently in the age group
60-69, I involved another variable, namely the active/inactive employment status into the
analysis. I assumed that variations in place attachment values were caused by the fact that

125
elderly people have more leisure time due to their inactive status. Active/inactive status
had no significant effect (F(1.253)=0.986,p=0.322) on place attachment within the
dimension defined by these three variables.
As a last step in the examination of predictors hierarchical analysis of variance was
performed to identify partial effects of visitation (frequency of visitations), relationship
(length of relationship) and demographical (income, age) variables. I integrated the most
powerful variables into the analysis based on the explanatory powers found in the one-
way analysis of variance. As a result, the variables examined accounted for 33.3% of the
strength of place attachment (R²=0.333).
Eta Beta Beta2
Frequency ,435 ,355 0.126
Income ,326 ,288 0.083
Age ,216 ,201 0.040
Relationship ,279 ,187 0.035
Table 30: The influence of external variables on place attachment based on hierarchical analysis of
variance
Source: own elaboration
According to partial effects, the frequency of visitations has the biggest specific effect
(12.6%) and this is followed by the income (8.3%). However, in the dimension defined
by the four variables, age and the relationship with the national park has lost its significant
effect on place attachment (See Annex 19).
7.7.5. The relationship between place attachment and pro-environmental
behavioural intention
In the next research phase the method of structural equation modelling (hereinafter
referred to as SEM) was applied to test for relationships between place attachment and
pro-environmental behavioural intentions. A covariance-based covariance-based
structural equation modelling was preferred instead of the differentiated variance
technique. The reason behind this decision is that variance based PLS (Partial Least
Square) only allows for the testing of correlations between latent variables, while

126
covariance-based AMOS (Analysis of Moment Structures) allows for the testing of the
whole model (Hair et al., 2011), allowing for the testing of the entire model’s fit
(Neumann-Bódi, 2012). The present research is aimed at testing a theory-based model,
which lead to using reflective measurement models during the analyses, i.e. the causal
processes are directed in the model from the latent variable (construct) towards the
indicators (measurement variables). In other words, changes of latent variables are
determined by measured variables (Henseler et al., 2009). I analysed and tested the
structural model with maximum-likelihood estimate by using AMOS 22.0 software. The
Cronbach alpha indicators were calculated with SPSS 22.0 software. The size of sample
was 240 persons. Compared to the different views in the literature regarding the minimum
sample size, my sample size met the expected level in almost each case based on the
criteria summarized in Table 34. The samples size was only once below the recommended
value, which was Kline’s (2005) ideal value, however the sample still met the minimum
requirements. Based on this, I considered the sample size sufficient.
Author Year Definition of the expected
minimum sample size*
Expected minimum sample
size
Bentler and Chou 1978 n/q>5, >165
Kline 2005
ideally n/q>10, but at least
n/q>5 ideally >330, but at least >165
Bagozzi, 1975 1981 n-q>50 >88
Hair et al. 2010 minimum 200 persons >200
Table 31: Aspects of defining the sample size
* where n= sample size, q= estimated number of parameters of the model (33 in our case)
Source: own elaboration
7.7.6. Validating the measurement model
As the first step of the correlation analysis, I tested the reliability and validity of the scales
and measuring model. Reliability means the exclusion of accidental errors, the
repeatability of results under the same conditions (Homburg and Krohmer, 2003). The
examination of internal consistency is a possible procedure for reliability where
Cronbach-alpha is the most common measure. The indicator provides a reliability
estimate as an average of correlation coefficients deriving from various splitting of scale
items (Cronbach, 1951). Since the alpha coefficient increases as the scale items grow
(Malhotra and Simon, 2008), and also in case of latent variables it may underestimate or
overestimate the rate of internal consistency, besides Cronbach-alpha, the literature also
recommends CR (composit reliability) as another reliability indicator relating to one

127
indicator (Fornell and Larcker, 1981; Hair et al., 2010). Similarly to Cronbach-alpha, the
value of CR indicator can be accepted above 0.7 (Hair et al., 2010). Beyond the definition
of Cronbach-alpha and CR-indicators, testing the reliability of indicators is another task.
The proper process aims to get the factor weighs of certain indicators reach 0.7 (Henseler
et al., 2009; Hair et al., 2010).
Based on these findings, the measurement model and the scale reliability can be deemed
reliable upon the following conditions (Cronbach, 1951; Henseler et al., 2009; Hair et al.,
2010; Nyírő, 2011):
(1) Cronbach- alfa coefficient > 0.7
(2) CR (Composite reliability) coefficient > 0.7
(3) Factor weigh of the indicators > 0.7
Besides scale reliability, we have to test scale validity, too, by excluding system errors
thus ensuring that we measure what we actually wanted to measure (Homburg and
Krohmer, 2003). One can distinguish between several types of validity. Henseler et al.
(2009) suggest differentiation between content validity, convergent validity and
discriminant validity. Furthermore, Hair et al. (2010) mention construct validity and
nomological validity. In the following the various validity concepts will be discussed in
detail, with special attention to the related indicators.
Content validity is subjective, but an expert evaluation on how a given scale reflects the
measurement task (Malhorta and Simon, 2008). In other words, content validity gives us
the opportunity to test if scale items fully cover the meaning of the variable to be
measured. As such, this only requires qualitative approach (Nyírő, 2011). A review in the
literature on this topic as well as my qualitative research among the students contributed
to the content validity of the scales.
Besides content validity, construct validity equally needs to be tested. A necessary
condition for testing construct validity is that convergent, discriminant and nomological
validities be confirmed.
Convergent validity appears if measuring results of two variables will be the same in case
of two different measuring methods (Weiber and Mühlhaus, 2010). AVE (average
variance extracted) indicator is a suitable tool to declare convergent validity (Fornell and

128
Lacker, 1981). AVE is the average amount of variance in indicator variables that a
construct is managed to explain.Sufficient convergent validity means a value above 0.5
(Fornell and Larcker, 1981).
The criteria of discriminant validity fulfills if the measurements of certain variables
significantly differ from each other. For measuring discriminant validity in case of
reflective structural equality model, Henseler et al. (2009) recommend the use of the
Fornell-Larcker criterion and that of cross-loadings. Fornell and Larcker (1981) suggest
that discriminant validity exists if the own indicators account for higher percentage of the
variance of a latent variable than that of the variance of any other latent variable. A
precondition to verify this criterion is that the square root of AVE of all latent variables
be larger than its correlations with the other latent variables (Nyírő, 2011). The Fornell-
Larcker criterion examines discriminant validity in context of the latent variables. On the
contrary, cross-loadings validation determines the existence of discriminant validity in
context of the indicators. According to the criteria, the correlation between the indicator
and the relating latent variable should be higher than the correlation between the indicator
and other variables (Fornell and Larcker, 1981).
In summary, the validity of the measurement model and the scales can be defined upon
the following conditions (Henseler et al., 2009; Fornell and Larcker, 1981):
(1) In case of convergent validity: AVE > 0.5
(2) In case of discriminant validity
a. AVE > R² with any variables (Fornell-Larcker criterion)
b. correlation between the indicator and its own latent variable > correlation
between the indicator and other latent variable (cross-loadings criterion)
Hereinafter to test for construct validity a confirmatory factor analysis (CFA) was carried
out. The initial measurement model involving each indicator contained place attachment
construct (Ramkissoon et al., 2013) comprising four sub-dimensions with 3-3 items,
while park specific pro-environmental behavioural intentions (Halpenny, 2006)
comprised high and low effort action types with four or five items. In order to confirm
the dimensionality of pro-environmental behavioural intentions scale I carried out
exploratory factor analysis (EFA) before the analysis, applying main component
procedure besides varimax rotation. The reason for a preliminary EFA was that I made

129
some fine-tuning after the scale test, thus scale items slightly changed for a better
understanding. Based on the factor analysis, three statement were deleted since they
showed significant overlapping with both factors, and also, two of them did not reach the
desired factor weigh of 0.5 (paying higher entrance fee, acquiring more knowledge before
the visit, signing petitions). The various types of activities were differentiated along
Ramkissoon et al.’s (2013) guidelines, which was equally in line with the observations
made during the pre-test of the scale in the present study. This initial confirmatory factor
model is described in Annex 21.
The initial model was not acceptable since the variance of the place identity random error
was negative. Such cases are called Heywood cases (Hair et al., 2010) which is logically
impossible since the model assigns a value under 0 to the random error, as a result, more
than 100% of the explained variance is associated to the relating variable or construction.
Hair et al. (2010) suggest they construct validity should be ensured in such cases. A
potential way to do this is to ignore the variable in question with keeping the three-
indicator rule. Since the identity dimension was measured with three indicators, this
solution needed deeper consideration. In order to settle further steps, I examined the first-
order, four-dimension factor solution of place attachment (see Annex 21). Based on the
results it became obvious that cross-loadings validity was harmed in identity and
emotions sub-dimensions, the correlation between indicator and emotion sub-dimensions
was higher than the correlation between the sub-dimensions and their own indicators.
Although at a smaller extent but a similar issue occurred between identity and place
attachment sub-dimensions. The over sliding of sub-dimensions mentioned above is not
a unique case, Halpenny (2006) obtained similar results. If we look back to the scale
evolution, it becomes visible that the emotion and identity statements of the scale we
applied in our research and which was based on the one Ramkissoon et al. (2013)
suggested, were apparently moved from the scale items of Kyle et al (2004c). Dimensions
of the scale measuring emotion and identity were distinguished in both researches (Kyle
et al., 2004c; Ramkissoon et al., 2013), however both studies emphasize that further
testing is needed in different context of the scale. Later Kyle et al. (2005), to fill this gap,
examined and confirmed the already separated emotion and identity statements in a
sliding over manner in the course of the overall examination of place attachment
dimensionality, and differentiated place identity, place dependence and social bonds. This
can be explained by the fact that early scales measuring place attachment in context of

130
place dependence and place identity considered emotional component as part of the
identity. This theoretical approach allowed me to continue testing the model with
combining emotion and identity sub-dimensions. Afterwards, while examining the
outliers indicated by the modification indices I examined the measurement model fit by
picking the lowest factor weigh variable from its confirmatory factor structure, as well as
the above-mentioned indicators of reliability and validity. Through this process I finally
reached a proper measurement model fit taking always into consideration that the
reliability of indicators should not go under the value of 0.7. This measurement model is
shown in Figure 16.
Figure 16: Final measurement model
where PAtt= place attachment, LPBI= low effort pro-environmental behavioural intentions, HPBI= high
effort pro-environmental behavioural intentions, PAI= place affect-identity, PSB= place social bonding,
PD= place dependence
Source: AMOS/own elaborattion

131
Compliance indicators of the final confirmatory factor model is detailed in Table 32. I
applied the formulas defined by Fornell and Larcker (1981) to calculate AVE and CE
indicators in an excel spreadsheet.
Name of variable / Indicators
Factor
weight
(>0,7)
CR
(>0,7) AVE
(>0,5)
Cronbach-
alfa
(>0,7)
Place attachment 0.91 0.77 0,903
Place dependence 0.83 0.62 0.832
PD1 0.78
PD2 0.80
PD3 0.79
Place affect-identity 0.89 0.74 0.893
PI1 0.84
PI2 0.87
PA2 0.87
Place social bonding 0.77 0.52 0.767
PSB1 0.70
PSB2 0.73
PSB3 0.74
Low effort pro-environmental behavioural
intentions 0.75 0.60 0.745
PBI1 0.74
PBI7 0.81
High effort pro-environmental behavioural
intentions 0.79 0.65 0.770
PBI6 0.88
PBI12 0.73
Table 32: Results of confirmatory factor analysis, scale reliability and validity calculations
Source: own elaboration
The following indicators were defined to test model fit: Chi-square, RMSEA (Root Mean
Square Error of Approximation), CMIN/d.f. (χ2/degree of freedom), NFI (Normed Fit Index),
TLI (Tucker-Lewis Index) and CFI (Comparative Fit Index).
AMOS 22.0 software was used for calculation. Certain indicated can be interpreted as
follows:
(1) Chi-square test: null hypothesis is true if empirical model fits to the data (Hair et al.,
2010). Since the test is sensitive to large sample size, further indices are
recommended for analytical parameters and the normality of variables (Jöreskog and
Sörbom, 1993).

132
(2) CMIN/d.f: absolute fit indices measuring the goodness of the model compared to
when there is “no model” (Byrne, 2001).
(3) RMSEA: indicator based on the analysis of residues. Enables to examine differences
between the observed correlation/covariance and the reproduced values.
(4) CFI, NFI and TLI: incremental and comparative indicators which compare with the
specified base model (Neumann-Bódi, 2012).
Fit indices of the model and the range of acceptance of certain indicators are shown in
Table 33.
Range of acceptance Estimated
value Evaluation
CMIN/d.f ≤ 3 (Bentler, 1990) 1.973 criteria matched
RMSEA
≤ 0.08 , if CFI ≥0.95 (Hair et al.,
2010)*
≤ 0.08 acceptable, ≥0,1 non-
acceptable (Backhaus et al.,
2005) 0.064 criteria matched
TLI
≥ 0.90
(Baumgartner and Homburg,
1996) 0.952 criteria matched
CFI
≥ 0.90
(Baumgartner and Homburg,
1996) 0.964 criteria matched
NFI ≥ 0.90 (Hair et al., 1992) 0.930 criteria matched
Table 33: Fit indices of the measurement model
* Range of acceptance for sample less than 250, observed variables less than 30
Source: own editing
Based on the results, all sampled indicators were within the range of acceptance. In
summary, the fit indices of the measurement model can be accepted.
7.7.7. Fit indices of the structural model
Following the measurement model I examined the fit indices of the structural model. The
objective of the model is to get a deeper understanding of the effect of place attachment on
pro-environmental behavioural intentions. Structural model is shown in Figure 17.

133
Figure 17: Structural model
Source: AMOS/ own elaboration
Fit indices of the structural model were as follows:
Range of acceptance Estimated
value Evaluation
CMIN/d.f ≤ 3 (Bentler, 1990) 2.748 criteria matched
RMSEA
≤ 0.08 , if CFI ≥0.95 (Hair et al.,
2010)*
≤ 0.08 acceptable, ≥0.1 non-
acceptable model (Backhaus et
al., 2005) 0.086
criteria
matched**
TLI
≥ 0.90
(Baumgartner and Homburg,
1996) 0.915 criteria matched
CFI
≥ 0.90
(Baumgartner and Homburg,
1996) 0.934 criteria matched
NFI ≥ 0.90 (Hair et al., 1992) 0.901 criteria matched
Table 34: Fit indices of the structural model
* Range of acceptance for sample less than 250, observed variables less than 30
** According to Backhaus et al. (2005)
Source: own elaboration
Fit indices of the structural model were within the range of acceptance. We can state that
the model fits to data properly. In the following section I will detail the results.

134
7.7.8. Results of the structural model
The effects (standardized regression coefficients) were examined using the maximum
likelihood estimation method with AMOS software. Results are summarized in Table 18.
Figure 18: Illustration of effects in a structural model
Significant paths are marked with solid lines. *p˂0, 001
Source: own elaboration
Based on the results the effect of place attachment proved to be significant for both pro-
environmental behavioural intentions. Place attachment positively influences the visitor’s
high effort pro-environmental behavioural intentions (t=5.28, p˂0.001,β=0.54) and has a
weaker influence on low effort pro-environmental behavioural intentions (t=5.58,
p˂0.001,β=0.49).24Place attachment accounts for 29% of the variation of high effort
behavioural intentions while it accounts for 24% of the variation of low effort behavioural
intentions. This is another validation of the early theories of Relph (1976) and Tuan
(1974) whereby place attachment is associated with the intention of protection of the
place. The result is also in line with the findings by Ramkissoon et al (2013) who showed
that place attachment had a stronger effect on high-effort behavioural intentions.
Hypothesis H6 assuming that place attachment as a second-order factor positively
influences pro-environmental behavioural intentions was confirmed by the results, thus
this hypothesis is accepted. By distinguishing high- and low-commitment patterns of
behavioural intention, the following can be stated:
24Cohen (1988) recommends that weak effect happens if the absolute value of the standardized path
coefficient is below 0.1, medium effect has a value of approximately 0.3 and strong effect appears above
0.5.
Place
attachment
High effort pro-
environmental
behavioural
intentions
Low effort pro-
environmental
behavioural
intentions
H6a:0.49*
(t=5.58)
H6b:0.54*
(t=5.28)
R²=0.29
R²=0.24

135
H6a: Place attachment as a second-order factor medium-strongly and positively
influences the visitor’s low effort pro-environmental behavioural intentions. I accept the
hypothesis.
H6b: Place attachment as a second-order factor strongly and positively influences the
visitor’s high effort pro-environmental behavioural intentions. I accept the hypothesis.
In the context of the connection between the variables discussed, I analysed the direct and
indirect effects between the various behavioural intentions and place attachment. My aim
was to provide a deeper understanding on the patterns of pro-environmental behavioural
intention as a result of place attachment. In other words, I wished to analyse the strength
of effects between the variables in light of each commitment path.
The study is based on the so-called Spillover Effect (Thøgersen, 1999) whereby an
individual’s pro-environmental attitude or behaviour in one area can be a good predictor
of their pro-environmental behaviour in other areas. This relationship among behavioural
patterns at the place of residence and while away is supported by a number of previous
studies (Vaske and Korbin, 2001; Halpenny, 2006; 2010). Provided that place attachment
generates pro-environmental behavioural pattern, that is the low effort pro-environmental
behaviour in our case, as a result, this effect may spill over to other areas such as to high
effort behaviours. The theory however does not cover the potential direction of this
process therefore it is more appropriate to refer to patterns rather than a hierarchical way
of a given direction. This was confirmed by Hofmeister-Tóth et al. (2012) in their research
on commitment process to pro-environmental behaviour. They examined the narratives
of persons committed to sustainability based on the main motivations of their
commitment. As a result of the content analysis of the interviews, three life path patterns
have become visible: commitment after a turning point, challenging commitment and
community focused commitment. Depending on the realized actions each life path had its
own way. While challenging commitment was unfolding with high effort actions,
commitment after a turning point was a step-by-step commitment process from the easier
actions towards the harder ones. There can be no single way in this process but the
understanding of certain areas (such as national park in our case) has a high impact on
incentive programs facilitating changes in behaviour and on drafting policy proposals.

136
Since the applied theory suggested a two-way mediating effect between low- and high-
effort pro-environmental behavioural intentions, I tested alternative models and defined
a basic model (without mediating effect, A) as well as other models analysing the
mediating effect of high (model B) and low (model C) effort behavioural intentions.
„ A variable functions as a mediator when it meets the following conditions:
variations in levels of the independent variable significantly account for variations
in the presumed mediator (i.e., Path a)
variations in the mediator significantly account for variations in the dependent
variable ( i.e., Path b), and
when paths a and b are controlled, a previously significant relation between the
independent and dependent variables is no longer significant, with the strongest
demonstration of mediation occurring when Path c is zero” (Baron and Kenny,
1986, p. 1176).
Figure 19: Mediating effect
Source: Baron and Kenny (1986)
By introducing the mediating effect, the fit of the structural model greatly improved.
Hereinafter I relied on this result when examining the direct and indirect effects relating
to models B and C. The fit indices of the models are summarized by Table 35.
Range of acceptance
Basic
model
(A)
Alternative
models
(B and C)
CMIN/d.f ≤ 3 (Bentler, 1990) 2.748 1.973
RMSEA
≤ 0.08 , if CFI ≥0.95 (Hair et al.,
2010) 0.086 0.064
TLI
≥ 0.90
(Baumgartner and Homburg, 1996) 0.915 0.952
CFI
≥ 0.90
(Baumgartner and Homburg, 1996) 0.934 0.964
NFI ≥ 0.90 (Hair et al., 1992) 0.901 0.930
Table 35: Fit indices of alternative models examined
Source: own elaboration
independent
variable dependent
variable
mediator a b
c

137
The direct and indirect effects relating to models B and C were examined in the following
based on the above. The results are summarized in Table 36.
MODEL A: No mediating effect
Latent variable Direction of effect Latent variable TOTAL DIRECT INDIRECT
Place attachment
Low EBI 0,486
Place attachment
High EBI 0.538
MODEL B: Low EBI mediating effect
Latent variable Direction of effect Latent variable TOTAL DIRECT INDIRECT
Place attachment
Low EBI 0.435
Low EBI
High EBI 0,573
Place attachment
High EBI 0.521 0.272 0.249
MODEL C: High EBI mediating effect
Latent variable Direction of effect Latent variable TOTAL DIRECT INDIRECT
Place attachment
Low EBI 0.435 0.103 0.332
High EBI
Low EBI 0.637
Place attachment
High EBI 0.521
Table 36: Total, direct and indirect effects between the variables
Italic, highlighted parts p<0.01 refer to the level of significance
Source: own elaboration
In case of model B (see Figure 19) the full effects between the sampled latent variables
proved to be significant in all cases. The level of significance of the indirect effect was
also p˂0.01. It can be stated that this case shows a partial mediating effect. Place
attachment has a significant strong effect (t=3.378, p˂0.001, β=0.521) on high effort
behavioural patterns, and has a medium strong effect on low effort behavioural patterns
(t=4.953, p˂0.001,β=0.435). Place attachment equally shows a significant effect
(t=5.686, p˂0.001, β=0.573) on high-effort pro-environmental behavioural intentions
through the low-effort pro-environmental behavioural intentions. Place attachment
accounts for 7.3% (R²=0.073) of the variation of high-effort behavioural intentions while
it accounts for 18.9% (R²=0.189) of the variation of low-effort behavioural intentions.
Low-effort behavioural intentions account for 32.8% of the variation of high-effort
behavioural intentions.

138
Figure 20: Illustration of effects in a structural model (model B and C)
Significant paths are marked with solid lines while non-significant paths are marked with dashed lines.
*p˂0.001
Source: own editing
Based on model C place attachment remains to have a strong significant effect on high-
effort behavioural intentions (t=5.504, p˂0.001, β=0.52), while its significant effect on
low-effort activities disappears (t=1.2, p>0.05, β=0.10). In order to define the significance
of the indirect effect I applied bootstrapping (MacKinnon et al., 2002) by using AMOS
software. Results suggest that the significant effect between the two variables observed
earlier (in the basic model) was a result of the indirect effect (see Table 36). In case of
model B the significant effect of place attachment on low-effort pro-environmental
behavioural intentions is only manifested through high-effort intentions. Place attachment
accounts for 27.1% (R²=0.271) of the variation of high-effort behavioural intentions while
it accounts for 1.1% of the variation of low-effort behavioural intentions. High effort
behavioural intentions accounts for 40.6% of the variation of low effort behavioural
intentions.
In summary, based on the fit indices of models B and C, as well as the total direct and
indirect effects between the variables it can be concluded that a spillover effect appears
in case of both commitment paths. While for model B the mediating effect is only partial,
for model C the mediating effect is full. In other words, the desired behavioural intention
can be better projected if the effect of place attachment unfolds in case of high effort
activities, for example through the participation of a project relating to the operation of a
Place
attachment
High effort
behavioural
intentions
Low effort
behavioural
intentions
R²=0,189 R²=0,328
H6b=0,272*
H6a=0,435*
R²=0,073 0,573* Place
attachment
High effort behavioural
intentions
Low effort
behavioural
intentions
R²=0,011
R²=0,271
H6b=0,521*
H6a=0,103*
0,637*
R²=0,406
Model B Model C

139
national park. In addition to these activities, new low effort patterns may also disappear
such as picking up garbage left by others. In terms of the hypotheses, the following
conclusions can be drawn.
H6c: Low-effort pro-environmental behavioural intentions partially mediate the effect of
place attachment on high-effort pro-environmental behavioural intentions. Hypothesis
H6c is partially accepted.
H6d: High effort pro-environmental behavioural intentions mediate the effect of place
attachment on low-effort pro-environmental behavioural intentions. The hypothesis is
accepted.
8. EVALUATION OF RESULTS, CONCLUSIONS
8.1. Summary of results
The core of the research was the study of the relationship between place attachment and
pro-environmental behavioural intentions by linking the TRA model and spillover effect
theory. In addition to the study of the relationship between place attachment and pro-
environmental behaviour the study equally analyzes the factors facilitating place
attachment to national parks.
After the investigation of the main characteristics of visitations to national parks, the
major forms of attachment to parks and pro-environmental behaviour were examined.
Respondents were characterized with a slightly weaker than medium attachment to the
given park. Concerning the demographical differences of place attachment I found
significant differences in age, income and the region of the place of residence. People
between the age of 60-69 demonstrated the strongest attachment to national parks. Based
on the per capita income of a household, place attachment is decreasing as the income
increases. There was a significant difference between the category under 100,000 HUF
and the category above 300,000 HUF based on the per capita income of a household.
Regarding the region of the place of residence, respondents of the eastern region showed
significantly higher place attachment.

140
In the study of pro-environmental behaviour and behavioural intentions, behavioural
patterns in national parks and at the places of residence turned out to be limited to low-
effort behaviours whereas dynamic activities less expected by society and requiring
activism were more characteristic in the age group above 60. It can be stated that
demographical variables showed more significant differences in pro-environmental
behaviour in national parks than at the place of residence. While the differences were
noticeable based on the age only at the place of residence, national parks however
demonstrated more differences based on region, income and the presence of children
under 14.
In the study of hypotheses H1-H5 related to the relationship between place attachment
and visitation and park related characteristics (relationship with the park) a one-way and
a multi-way analyses of variance (ANOVA) were performed. Based on the results, among
other visitation-related attributes a significant difference in place attachment was found
in connection with the frequency of visitations (H1). The higher the frequency of
visitation was, the higher the value of place attachment became, with the former variable
accounting for 14% of the variation of place attachment. No significant relationship was
found between place attachment and the duration of the stay (H2) and between place
attachment and the distance from the place of residence (H3). By examining the distance
from the park in terms of locality (by separating places of residence within and outside of
the range of 40 km) a positive significant interaction between place attachment and
locality appeared. The local feature of the visitation accounted for 22% of the variation
of place attachment. I performed a two-way hierarchical analysis of variance to identify
partial effects and to study the interactions between the visitation features. Results
showed a lower explanatory power of locality in the combined effect of locality and
frequent visitations. Based on the combined effect of these two variables, visitors from a
further distance showed higher place attachment in all frequency-related categories than
local people. However, regular visitors were mostly originating from among the local
population. By completing this result with the effect of age one can conclude that in the
age group above 30 both the frequency of visitations and ageing increased the value of
place attachment. This relationship addresses the importance of the length of the
relationship with the national park.

141
The analysis of the relationship between childhood visitations (H4a and H4b) and place
attachment revealed significant effects regarding both the given park and national parks
in general. The bigger role visitations to a given park or to national parks in general played
in respondents’ childhood, the higher values of place attachment appeared to be.
Childhood visitations to international parks accounted for 2.8% of the variance of place
attachment and visitations to a given park accounted for 3.4% of the same variance.
In connection with the length of the relationship with the national park, as expected,
significant differences were found in the values of place attachment, and these variations
appeared between first-time visitors and returning visitors with more than 6 years of
relationship with the park. The variable accounted for 7.7% of the variation of place
attachment. Since the relationship of elderly people with the national park can be longer
due to their age, I examined the interaction between the two variables. Results confirmed
that beside the significant main effect of the two variables the interaction is equally
significant, the two variables thus bear a joint explanatory power. Regarding place
attachment values, two marked relationships emerged in the dimension of age and the
length of relationship. First, a stronger bond of the older age group appeared again. Place
attachment values of the aforementioned 60-69 age group were higher in all relationship-
related categories except for two cases. The two exceptions were such relationship-age
combinations where the visitor had a childhood bond (with the 30-39 age group having a
26-35 year relationship and the 40-49 age group having a relationship of more than 35
years). This also confirmed the importance of childhood interactions.
In the next phase of the study, the method of structural equation modelling (hereinafter
referred to as SEM) was applied for testing the interaction between place attachment and
pro-environmental behavioural intentions (H6). SEM model comprises a measurement
and a structural model (Backhaus et al., 2005). As a first step, I performed a confirmatory
factor analysis to validate applied scales and to determine quality compliance of the
measurement model. This was followed by the establishment of a structural model which
I considered valid based on the fit indices recommended in the literature. I used this model
to examine the effect of place attachment on low and high effort pro-environmental
behavioural intentions. My results confirmed that place attachment positively influences
pro-environmental behavioural intentions and its effect was stronger in case of high effort

142
pro-environmental behavioural intentions than in case of low effort pro-environmental
behavioural intentions.
The evaluations of research hypotheses can be summarized as follows:
Hypothesis Evaluation Final thesis
H1: There is a positive relationship
between the frequency of visitations to
national parks and the extent of place
attachment.
Support Having examined the external factors predicting
place attachment, there is a positive significant
relationship between place attachment and the
frequency of visitations as far as visitation features
are concerned.
By observing the distance from the place of
residence only the local nature of the visitation
implies the positive relationship (between people
living within or outside of the range of 40 km).
All relationship attributes have a significant
positive effect on place attachment. The strongest
effect appears in the context of the relationship with
the national park.
H2: There is a positive relationship
between the duration of visitations to
national parks and the extent of place
attachment.
No support
(no
detectable
effect)
H3: There is a negative relationship
between the distance from the place of
residence to the national park and the
extent of place attachment.
Partial
support
H4a: Childhood relationship with a
given national park has a positive effect
on the extent of place attachment.
Support
H4b: Childhood relationship with
national parks in general has a positive
effect on the extent of place attachment.
Support
H5: The length of the relationship with
the national park has a positive effect on
the extent of place attachment.
Support
H6: Place attachment as a second-order
factor positively influences pro-
environmental behavioural intentions.
Support
SEM analysis confirmed the positive effect of place
attachment on pro-environmental behavioural
intention that unfolds in case of low-and high-effort
behavioural intentions.
It can be stated that place attachment has a stronger
effect on high-effort pro-environmental behaviour
than on low-effort pro-environmental behaviour.
Spillover effect: The study of the total direct and
indirect effects between the variables revealed that
model B implicates a partial mediating effect and
model C implicates a full mediating effect. The
desired behavioural intention can be better
projected if the effect of place attachment on
behavioural intention unfolds in case of high-effort
activities.
H6a: Place attachment as a second-order
factor positively influences the visitor’s
low effort pro-environmental
behavioural intentions.
Support
H6b: Place attachment as a second-
order factor positively influences the
visitor’s high effort pro-environmental
behavioural intentions.
Support
H6c: Low effort pro-environmental
behavioural intentions mediate the
effect of place attachment on high effort
pro-environmental behavioural
intentions.
Partial
support
H6d: High effort pro-environmental
behavioural intentions mediate the
effect of place attachment low effort
pro-environmental behavioural
intentions.
Support
Table 37: Summary of research hypotheses
Source: own elaboration

143
8.2. Theoretical and practical significance of my research
The development of appropriate habits and behaviour of visitors plays an important role
in preserving national parks. Individuals, through their leisure activities, may cause
serious damage to the environment of parks, thus contributing to the degradation of
protected areas. Fostering pro-environmental behaviour of visitors is a strategic goal that
plays an important role in the preservation of parks (Halpenny, 2006), in promoting
sustainability (Ballantyne et al., 2009; Ramkissoon et al., 2012), and in the long term, in
the establishment of sustainable tourism (López-Mosquera and Sánchez, 2011).
Visitation to national parks, in appropriate circumstances, may allow visitors to develop
responsible behaviour. This is associated with several positive impacts. Pro-
environmental behaviour in national parks may trigger individuals to better appreciate
natural resources (Baral et al., 2008), and in addition, the experiences and knowledge
gained here may lead to the recognition of further relationships. Pro-environmental
behaviour enhanced by visitations to national parks ensures the preservation of natural
and cultural heritage to the next generations (Ramkissoon et al., 2012).
A deeper understanding of place attachment and pro-environmental behaviour as well as
the study of factors enhancing place attachment can substantially contribute to the
elaboration of policy proposals and strategies regarding the management of national
parks. The dissertation’s results confirmed the positive effect of place attachment on pro-
environmental behaviour. By differentiating high- and low-effort behavioural patterns,
place attachment was confirmed to have a stronger effect on high-effort behavioural
intentions. By examining pro-environmental behaviour patterns appearing in the sample
it became visible that pro-environmental behaviour both at the place of residence and in
national parks was primarily limited to low-effort activities (expected by society) while
activity patterns requiring environmental activity showed less appearance. The results
equally pointed out that increasing place attachment could be a promising way to enhance
high-effort activities (such as donating to or volunteering in national park related
projects). In the context of visitation, relationship and demographical attributes as
predictors of place attachment one can conclude that the frequency of visitations, income
and age had the highest explanatory power concerning place attachment, however a
significant interaction appeared in case of the region of residence, the length of
relationship with the national park, childhood visitations and the local nature of

144
visitations. Well-planned marketing programs that take these factors into consideration
may increase visitors’ place attachment more efficiently and thereby their pro-
environmental behavioural intention.
8.3. Conclusions on the measurement of place attachment
Based upon the environmental psychology approach, place attachment was interpreted in
the dissertation as bond to a certain place which can be described with functional,
cognitive and affective attributes (Jorgensen and Stedman, 2001; Halpenny, 2006; Yuksel
et al., 2010). As such, place attachment was considered an attitude in the dissertation.
According to Ramkissoon et al. (2013), I examined place attachment as a second-order
factor having four sub-dimensions, namely place dependence (conative range), place
identity (cognitive range), place affect (affective range) and place social bonding
(cognitive range). Confirmatory factor analysis (CFA) was performed to test construct
validity of the measurement model, place attachment construct of four sub-dimensions
was not acceptable since the variance of the place identity random error was negative.
Hair et al. (2010) suggest that the measurement of a latent variable with less than three
indicators and small sample size (n˂300) may cause Heywood cases. In our case the rule
of three indicators (each latent variable should be measured with at least three indicators)
was met although sample size was below 300. The exclusion of this variable can solve
this problem. In our case it would have meant the exclusion of a whole dimension so I
continued with the examination of the interactions between the four sub-dimensions in
order to improve the construct. I concluded that the discriminant validity of the construct
is harmed in identity and emotions sub-dimensions, cross-loadings validity revealed that
the correlation between identity and emotions sub-dimensions was higher than that of
between the sub-dimensions and their own indicators. Having examined the evolution of
the scale I found that the emotions and identity items of the 12-item, 4 sub-dimension
scale of Ramkissoon et al. (2013) were based on the scale items of Kyle et al. (2004a).
Dimensions of the scale measuring emotion and identity were distinguished in both
researches (Kyle et al., 2004c, Ramkissoon et al, 2013), however both studies emphasize
that further testing of the scale is needed. Later Kyle et al. (2005) examined and confirmed
the already separated emotion and identity statements merged together in the course of
the overall examination of place attachment dimensionality, and differentiated place

145
identity, place dependence and social bonds. We have seen that consideration of the
distinction of the two sub-dimensions in the literature is not consistent. The present
research confirmed the three sub-dimensional, second-order factor solution of place
attachment which is built on place dependence, place identity-emotions (Kyle et al.
(2005) cite it as place identity) and place related social bonds sub-dimensions.
8.4. Limitations of research and future research possibilities
One limitation of my research is that its analysis is limited to one part of the TRA model
by Ajzen and Fisbein (1980), namely the relationship between attitude and behavioural
intention which is completed by the examination of the spillover effect between high- and
low-effort pro-environmental behaviours. A study of pro-environmental behaviour in
national parks by involving further factors may demonstrate a higher predicting value
while a more complex picture can be drawn by involving perceived and actual
behavioural control.
It should be emphasised that further testing of the place attachment construct on a bigger
sample is recommended due to the overlapping of the emotional and identity sub-
dimensions. Moreover a further qualitative examination of certain sub-dimensions,
including the content validity of the emotional dimension, may contribute to the
identification and clarification of the construct.
I would recommend a more in-depth examination of two particular age groups in further
studies. First, the examination of the bond of children, teenagers and young people to
national parks: as priority target groups of environmental education, analysing the
identification of childhood interactions with protected places in particular, in connection
with the effects of family, schools and NGOs is recommended. Second, in order to better
understand the relationship with parks of the senior age group as a target group
demonstrating closer bond as a result of their early socialization, I would emphasize the
understanding of the narratives of this age group including their commitment paths.
The examination of non-visitors may contribute to a better understanding of the
enhancing effect of pro-environmental behaviour in national parks, by enabling a

146
comparability between the behaviour of visitors and non-visitors. A further research
direction concerns segmentation based on visitors’ place attachment. This approach
would allow to study how behaviours may spill over in different place attachment groups,
what types of commitment patterns are taking shape within the groups. Moreover, it
would allow, along with a joint measurement of environmental identity, for the analysis
of relationships between place attachment and pro-environmental behavioural intentions
of groups with different environmental identities

147
REFERENCES
AJZEN, I. (1985). From intentions to actions: A theory of planned behaviour. In
KUHL, K. and BECKMANN, J. (Eds.), Action-Control: From cognition to
behaviour Heidelberg: Springer.
AJZEN, I. (1991). The Theory of Planned Behavior. Organizational Behavior and
Human Decision Processes, 50, 179-211. doi: 10.1016/0749-5978(91)90020-T
AJZEN, I. and FISHBEIN, M. (1980). Understanding Attitudes and Predicting Social
Behaviour. Englewood Cliffs, New Jersey: Prentice-Hall Inc.
AMENDAH, E. and PARK, J. (2008) Consumer involvement and psychological
antecedents on eco-friendly destinations: Willingness to pay more. Journal of
Hospitality & Leisure Marketing, 17(3), 262 - 283. doi:
10.1080/10507050801984859
ANDERSON, T. W. and CUNNINGHAM, W. H. (1972). The Socially Conscious
Consumer. Journal of Marketing, 36(3), 23-31. doi: 10.2307/1251036
AP, J. and CROMPTON, J. L. (1998). Developing and testing a tourism impact scale.
Journal of Travel Research, 37(2), 120-130. doi: 10.1177/004728759803700203
BACKHAUS, K., ERICHSON, B., PLINKE, W. and WEIBER, R. (2005). Multivariate
Analysemethoden - Eine anwendungsorientierte Einführung. Berlin, Heidelberg:
Springer.
BAGOZZI, R. P. (1975). Marketing as Exchange. Journal of Marketing, 69(4), 32-39.
doi: 10.2307/1250593
BALLANTYNE, R., PACKER, J. and HUGHES, K. (2009). Tourists' support for
conservation messages and sustainable management practices in wildlife tourism
experiences. Tourism Management, 30(5), 658-664. doi:
http://dx.doi.org/10.1016/j.tourman.2008.11.003
BAMBERG, S. and MÖSER, G. (2007). Twenty years after Hines, Hungerford, and
Tomera: A new meta-analysis of psycho-social determinants of pro-
environmental behaviour. Journal of Environmental Psychology, 27(1), 14-25.
doi: 10.1016/j.jenvp.2006.12.002
BARAL, N., STERN, M. J. and BHATTARAI, R. (2008). Contingent valuation of
ecotourism in Annapurna conservation area, Nepal: Implications for sustainable
park finance and local development. Ecological Economics, 66(2–3), 218-227.
doi: http://dx.doi.org/10.1016/j.ecolecon.2008.02.004
BARON, R. M. és KENNY, D. (1986). The Moderator–Mediator Variable Distinction
in Social Psychological Research: Conceptual, Strategic, and Statistical
Considerations, Journal of Personality and Social Psychology, 51(6), 1173-
1182. doi: 10.1037/0022-3514.51.6.1173
BAUMEISTER, R., BRATSLAVSKY, E., MURAVEN, M. and TICE, D. (1998). Ego
depletion: Is the active self a limited resource? Journal of Personality and Social
Psychology, 74(5), 1252-1265. . doi: http://dx.doi.org/10.1037/0022-
3514.74.5.1252

148
BAUMGARTNER, H. and HOMBURG, C. (1996). Applications of structural equation
modeling in marketing and consumer research: A review. International Journal
of Research in Marketing, 13(2), 139-161. doi: http://dx.doi.org/10.1016/0167-
8116(95)00038-0
BENTLER, P. M. (1990). Comparative fit indexes in structural models. Psychological
bulletin, 107(2), 238-246. doi: 10.1037/0033-2909.107.2.238
BENTLER, P. M. and CHOU, C.-P. (1987). Practical Issues in Structural Modeling.
Sociological Methods & Research, 16(1), 78-117.
10.1177/0049124187016001004
BESCULIDES, A., LEE, M. E. and MCCORMICK, P. J. (2002). Residents' perceptions
of the cultural benefits of tourism. Annals of Tourism Research, 29(2), 303-319.
doi: 10.1016/S0160-7383(01)00066-4
BIGNÉ, J. E., ANDREU, L. and GNOTH, J. (2005). The theme park experience: An
analysis of pleasure, arousal and satisfaction. Tourism Management, 26(6), 833-
844. doi: 10.1016/j.tourman.2004.05.006
BILLIG, M. (2006). Is My Home My Castle? Place Attachment, Risk Perception, and
Religious Faith. Environment and Behavior, 38(2), 248-265. doi:
10.1177/0013916505277608
BOLAN, M. (1997). The mobility experience and neighborhood attachment.
Demography, 34(2), 225-237. doi: 10.2307/2061701
BONAIUTO, M., FORNARA, F. and BONNES, M. (2003). Indexes of perceived
residential environment quality and neighbourhood attachment in urban
environments: a confirmation study on the city of Rome. Landscape and Urban
Planning, 65(1-2), 41-52. doi: 10.1016/S0169-2046(02)00236-0
BONNES, M. and SECCHIAROLI, G. (1995). Environmental psychology: A psycho-
social introduction. Thousand Oaks, CA: Sage.
BORRIE, W. T. and ROGGENBUCK, J. W. (2001). The dynamic, emergent, and
multi-phasic nature of on-site wilderness experiences. Journal of Leisure
Research, 33(2), 202-228.
BOXILL, I. (2003). Towards an alternative tourism for Belize. International Journal of
Contemporary Hospitality Management, 15(3), 147-150. doi:
10.1108/09596110310470167
BRANDENBURG, A. M. and CARROLL, M. S. (1995). Your place or mine?: The
effect of place creation on environmental values and landscape meanings.
Society & Natural Resources, 8(5), 381-398. doi: 10.1080/08941929509380931
BREHM, J. M., EISENHAUER, B. W. and KRANNICH, R. S. (2006). Community
Attachments as Predictors of Local Environmental Concern. American
Behavioral Scientist, 50(2), 142-165. doi: 10.1177/0002764206290630
BRIGHAM, J. C. (1991). Social psychology. New York: HarperCollins.
BRITTON, S. G. (1982). The political economy of tourism in the third world. Annals of
Tourism Research, 9(3), 331-358. doi: 10.1016/0160-7383(82)90018-4
BROCATO, E. D. 2006. Place Attachment: an investigation of environments and
outcomes in a service context. The University of Texas at Arlington.

149
BROHMAN, J. (1996). Popular development:rethinking the theory and practice of
development. Oxford: Wiley-Blackwell.
BROWN, B., PERKINS, D. D. and BROWN, G. (2003). Place attachment in a
revitalizing neighborhood: Individual and block levels of analysis. Journal of
Environmental Psychology, 23(3), 259-271. doi: 10.1016/S0272-
4944(02)00117-2
BRUNDTLAND, G. H. E. (1987). Our Common Future: The World Commission on
Environment and Development. Oxford-New York: Oxford University Press.
BUDEANU, A. (2007a). Facilitating Transitions to Sustainable Tourism. The role of
the tour operator. Doctoral dissertation, Lund University.
BUDEANU, A. (2007b). Sustainable tourist behaviour – a discussion of opportunities
for change. International Journal of Consumer Studies, 31(5), 499-508. doi:
10.1111/j.1470-6431.2007.00606.x
BYRNE, B. M. (2001). Structural equation modeling with Amos: Basic concepts,
applications and programming. London: Lawrence Erlbaum Associates.
CHAFE, Z. (2005). Consumer Demand and Operator Support for Socially and
Environmentally Responsible Tourism. Available:
http://www.responsibletravel.org/resources/documents/reports/Consumer_Dema
nd_April_2005.pdf
CHAWLA, L. (1992). Research Priorities in Environmental Education. Children's
Environments, 9(1), 68-71. doi: 10.2307/41514851
CLAYTON, S. (2003). Environmental identity: conceptual and operational definition.
In CLAYTON, S. and OPOTOW, S. (Eds.), Identity and the natural
environment: The psychological significance of nature Cambridge, MA: MIT
Press.
COHEN, J. W. (1988). Statistical power analysis for the behavioral sciences. Hillsdale,
New Jersey: Lawrence Erlbaum Associates.
CRONBACH, L. (1951). Coefficient alpha and the internal structure of tests.
Psychometrika, 16(3), 297-334. doi: 10.1007/bf02310555
CROUCH, G., DEVINNEY, T., DOLNICAR, S., HUYBERS, T., LOUVIERE, J. and
OPPEWAL, H. Year. New horses for old courses. Questioning the limitations of
sustainable tourism to supply-driven measures and the nature-based contexts. In:
ANZMAC, 2005. CD proceedings
CSUTORA, M. (2012). Fenntartható fogyasztás: közösségi, válllati és egyéni kibúvó
stratégiák. [Sustainable consumption: corporate and individual loophole
strategies] In KEREKES, S. and CSUTORA, M. (Eds.), Fenntartható
fogyasztás? [Sustainable consumption?] Budapest: Aula.
DANN, G. M. S. (1977). Anomie, ego-enhancement and tourism. Annals of Tourism
Research, 4(4), 184-194. doi: 10.1016/0160-7383(77)90037-8
DANN, G. M. S. (1981). Tourist motivation an appraisal. Annals of Tourism Research,
8(2), 187-219. doi: 10.1016/0160-7383(81)90082-7
DAWES, R. (1980). Social dilemmas. Annual Review of Psychology, 31, 69-93. doi:
10.1146/annurev.ps.31.020180.001125

150
DES JARDINS, J. R. (1997). Environmental Ethics. Belmont: Wadsworth Publishing
Co.
DEVINE-WRIGHT, P., DEVINE-WRIGHT, H. and FLEMING, P. D. (2004).
Situational influences upon children's beliefs about global warming and energy.
Environmental Education Research, 10(4), 493-506. doi:
10.1080/1350462042000291029
DISPOTO, R. G. (1977). Moral valuing and environmental variables. Journal of
Research in Science Teaching, 14(4), 273-280. doi: 10.1002/tea.3660140402
DOGAN, H. Z. (1989). Forms of adjustment: Sociocultural impacts of tourism. Annals
of Tourism Research, 16(2), 216-236. doi: 10.1016/0160-7383(89)90069-8
DOLNICAR, S. (2004). Insights into sustainable tourists in Austria: A data-based a
priori segmentation approach. Journal of Sustainable Tourism, 12(3), 209 - 218.
doi: 10.1080/09669580408667234
DOLNICAR, S. (2010). Identifying tourists with smaller environmental footprints.
Journal of Sustainable Tourism, 18(6), 717-734. doi:
10.1080/09669581003668516
DONO, J., WEBB, J. and RICHARDSON, B. (2009). The relationship between
environmental activism, pro-environmental behaviour and social identity.
Journal of Environmental Psychology, 30(2), 178-186. doi:
10.1016/j.jenvp.2009.11.006
DONOVAN, N., HALPERN, D. and SARGEANT, R. (2002). Life Satisfaction: the
state of knowledge and implications for government. London: Cabinet Office
Strategy Unit.
DROSELTIS, O. and VIGNOLES, V. L. (2010). Towards an integrative model of place
identification: Dimensionality and predictors of intrapersonal-level place
preferences. Journal of Environmental Psychology, 30(1), 23-34. doi:
10.1016/j.jenvp.2009.05.006
DÚLL, A. (1998). Hétköznapi otthoni rutinok környezetpszichológiai vizsgálata.
[Environmental social study on daily home routines.] Doctoral dissertation,
Budapesti Eötvös Loránd Tudományegyetem.
DÚLL, A. (2009). A környezetpszichológia alapkérdései - Helyek, tárgyak, viselkedés.
[Fundamentals of Environmental Psychology - Places, articles, behaviour]
Budapest: L'Harmattan.
DUNLAP, R. E. and VAN LIERE, K. D. (1978). The New Environmental Paradigm – a
proposed measuring instrument and preliminary results. Journal of
Environmental Education, 40(1), 10-19. doi:
EEA (2010). EEA Jelzések 2010, A biológiai sokféleség és az éghajlatváltozás szerepe
a te életedben [EEA Signals 2010 - Biodiversity, climate change and you]
Available: http://www.eea.europa.eu/publications/signals-2010. doi:
FAIRWEATHER, J. R., MASLIN, C. and SIMMONS, D. G. (2005). Environmental
values and response to ecolabels among international visitors to New Zealand.
Journal of Sustainable Tourism, 13(1), 82-98. doi:
10.1080/17501220508668474

151
FARNUM, J., HALL, T. and KRUGER, L. E. (2005). Sense of place in natural
resource recreation and tourism: an evaluation and assessment of research
findings. General Technical Report, PNW-GRT-660.United States Department
of Ariculture, Pacific Northwestern Research Station.
FESTINGER, L. (1957). A Theory of Cognitive Dissonance. Stanford: University of
California Press.
FISHBEIN, M. and AJZEN, I. (1975). Belief, attitude, intention, and behaviour: An
introduction to theory and research. Reading, MA: Addison-Wesley.
FLETCHER, J. (2008). Sustainable tourism. In COOPER, C., FLETCHER, J., FYALL,
A., GILBERT, D. and WANHILL, S. (Eds.), Tourism: principles and practice
Essex: Pearson.
FORNELL , C. and LARCKER, D. F. (1981). Evaluating structural equation models
with unobservable variables and measurement error. Journal of Marketing
Research, 18(1), 39-50. doi: 10.2307/3151312
FORUM FOR THE FUTURE. (2009). Tourism 2023. Four scenarios, a vision and a
strategy for uk outbond travel and toursim. Available:
http://www.forumforthefuture.org/sites/default/files/project/downloads/tourism2
023fullreportwebversion.pdf
FÖLDMŰVELÉSÜGYI MINISZTÉRIUM [MINISTRY OF AGRICULTURE] AND
PANNON UNIVERSITY (2015). A magyarországi nemzeti parkok látogatóinak
jellemzői 2012-ben.[Visitations to Hungarian national parks in 2012.] Research
methods Veszprém.
FRANK, R. (1988). Passions Within Reason. New York: W. W. Norton.
FÜSTÖS, L., KOVÁCS, E., MESZÉNA, G. and SIMONNÉ MOSOLYGÓ, N. (2004).
Alakfelismerés [Shape Recognition] Budapest: Új Mandátum Könyvkiadó.
GIULIANI, M. V. (2003). Place attachment and community attachment: In BONNES,
M., LEE, J. A. and BONAIUTO, M. (Eds.), Psycholoical theories for
environmental issues Hants: Ashgate.
GIULIANI, M. V. and FELDMAN, R. (1993). Place attachment in a developmental and
cultural context. Journal of Environmental Psychology, 13(3), 267-274. doi:
10.1016/S0272-4944(05)80179-3
GUEST, A. M. and LEE, B. A. (1983). Sentiment and evaluation as ecological
variables. Sociological Perspectives, 26(2), 159-184. doi: 10.2307/1389089
GUMP, P. V. (1990). a short history of the midwest psychological field station.
Environment and Behavior, 22(4), 436-457. doi: 10.1177/0013916590224002
GUSTAFSON, P. (2002). Place, place attachment and mobility: Three sociological
studies., Goteborg Studies in Sociology, No 6.: Department of Sociology:
Gotenburg University.
GUSTAFSON, P. (2009). More cosmopolitan, no less local. European Societies, 11(1),
25-47. doi: 10.1080/14616690802209689
HAIR, J. F., JR. BLACK, W. C., BABIN, B. J., ANDERSON, R. E. and TATHAM, R.
L. (2006). Multivariate data analysis. (6.ed). New Jersey: Prentice Hall.

152
HAIR, J. F., RINGLE, C. M. and SARSTEDT, M. (2011). PLS-SEM: Indeed a silver
bullet. Journal of Marketing Theory and Practice, 19(2), 139-152. doi:
10.2753/mtp1069-6679190202
HAIR, J. F. J., BLACK, W. C., BABIN, B. J. and ANDERSON, R. E. (2010).
Multivariate data analysis: A global perspective. 7th ed. New Jersey: Pearson
Education Inc.
HALPENNY, E. A. 2006. Environmental behaviour, place attachment and park
visitation: A casestudy of visitors to Point Pelee National Park. Doctoral
dissertation, University of Waterloo.
HALPENNY, E. A. (2010). Pro-environmental behaviours and park visitors: The effect
of place attachment. Journal of Environmental Psychology, In Press, Corrected
Proof. doi: 10.1016/j.jenvp.2010.04.006
HAMILTON, C. (2003). Growth Fetish. London and Melbourne: Berg Publishers.
HAMMITT, W. E., BACKLUND, E. A. and BIXLER, R. D. (2006). place bonding for
recreation places: Conceptual and empirical development. Leisure Studies,
25(1), 17-41. doi: 10.1080/02614360500098100
HAN, H., HSU, L.-T. and SHEU, C. (2010). Application of the Theory of Planned
Behavior to green hotel choice: Testing the effect of environmental friendly
activities. Tourism Management, 31(3), 325-334. doi:
10.1016/j.tourman.2009.03.013
HAY, R. (1998). SENSE OF PLACE IN DEVELOPMENTAL CONTEXT. Journal of
Environmental Psychology, 18(1), 5-29. doi: 10.1006/jevp.1997.0060
HENSELER, J., RINGL, C. M. and SINKOVICS, R. R. (2009). The use of partial least
squares path modeling in international marketing. Advances in International
Marketing, 20, 277-320. doi: 10.1108/S1474-7979(2009)0000020014
HERTWICH, E. G. (2005). Consumption and the Rebound Effect: An industrial
ecology perspective. Journal of Industrial Ecology, 9(1-2), 85-98. doi:
10.1162/1088198054084635
HIDALGO, M. C. and HERNANDEZ, B. (2001). Place attachment: conceptual and
empirical questions. Journal of Environmental Psychology, 21(3), 273-281. doi:
10.1006/jevp.2001.0221
HIGGINS, T. (1987). Self-discrepancy: a theory relating self to affect. Psychological
Review, 94., 319-340. doi: 10.1037//0033-295X.94.3.319
HIRSCH, F. (1977). Social Limits of Growth. London: Routledge.
HOFMEISTER-TÓTH, Á., KASZA-KELEMEN, K. and PISKÓTI, M. (2013). A
környezetbarát fogyasztói magatartás formái, motivációi és a hátterükben álló
pszichográfiai tényezők vizsgálata Magyarországon. [Forms of pro-
environmental behaviour, the motivations and the psycho-graphic factors behind
them.] Conference article at the Conference of the Club of Marketing Educators,
Budapest.
HOFMEISTER-TÓTH, Á., KELEMEN, K. and PISKÓTI, M. (2009). A fogyasztói
magatartásminták változása a fenntarthatóság tükrében. [Changes in consumer
behaviour patterns in the light of sustainability] Conference article at the
Conference of the Club of Marketing Educators, Kaposvár.

153
HOFMEISTER-TÓTH, Á., KELEMEN, K. and PISKÓTI, M. (2011a).
Environmentally Conscious Consumption Patterns in Hungarian Households.
Society and Economy in Central and Eastern Europe, 1, 51-68.
HOFMEISTER-TÓTH, Á., KELEMEN, K. and PISKÓTI, M. (2011b).
Characterization of Hungarian Consumer Segments according to their
Environmental Consciousness. Conference article at Sustainabe Consumption
Conference, 2011, Budapest.
HOFMEISTER-TÓTH, Á., KELEMEN, K. and PISKÓTI, M. (2012). Life paths in
Hungary in the light of commitment to sustainability. Interdisciplinary
Environmental Review, 13(4), 323 - 339.
HOFMEISTER-TÓTH, Á., SIMON, J. and NEUMANN-BÓDI, E. (2006). A
fogyasztók társadalmi felelősségének kérdései, az egyetemista fiatalok
fenntartható fogyasztással kapcsolatos attitüdjének vizsgálata Q-módszerrel.
[Social responsibility of consumers, examination of the sustainable consumption
related attitudes among university students with Q-method.] Conference article
at the Conference of the Club of Marketing Educators, Budapest.
HOLDEN, A. (2006). Tourism studies and the social sciences. Cornwall and New
York: Routledge.
HOMBURG, C. and KROHMER, H. (2003). Marketing management: Strategie -
Instrumente - Umsetzung - Unternehmensführung. Wiesbaden: Gabler.
HUMMON, D. (1992). Community Attachment. In ALTMAN, I. and LOW, S. (Eds.),
Place Attachment: Springer US.
HUR, M., NASAR, J. L. and CHUN, B. (2010). Neighborhood satisfaction, physical
and perceived naturalness and openness. Journal of Environmental Psychology,
30(1), 52-59. doi: 10.1016/j.jenvp.2009.05.005
ICC (2010). Framework for Responsible Environmental Marketing Communications.
http://www.iccwbo.org/uploadedFiles/ICC/policy/marketing/pages/557_FRAM
EWORK_ENVIRONMENTAL_CLAIMS_FINAL_140110.pdf. Available:
INSKEEP, E. (1994). National and regional tourism planning: Methodologies and case
studies. London: Routledge.
JACKSON, T. 2005. Motivating Sustainable Consumption: A Review of Evidence on
Consumer Behaviour and Behavioural Change. Available:
http://www.sustainablelifestyles.ac.uk/sites/default/files/motivating_sc_final.pdf
JOHNSON, M. K. and HASHER, L. (1987). Human learning and memory. Annual
Review of Psychology, 38, 631-668. doi: 10.1146/annurev.ps.38.020187.003215
JORGENSEN, B. S. and STEDMAN, R. C. (2001). Sense of place as an attitude:
Lakeshore owners attitudes toward their properties. Journal of Environmental
Psychology, 21(3), 233-248. doi: 10.1006/jevp.2001.0226
JORGENSEN , B. S. and STEDMAN, R. C. (2006). A comparative analysis of
predictors of sense of place dimensions: Attachment to, dependence on, and
identification with lakeshore properties. Journal of Environmental Management,
79, 316–327. doi: 10.1016/j.jenvman.2005.08.003

154
JOVCHELOVITCH, S. and BAUER, M. W. (2000). Narrative interviewing. In
BAUER, M. W. and GASKELL, G. (Eds.), Qualitative researching with text,
image and sound : a practical handbook London: SAGE Publications.
JÖRESKOG, K. G. and SÖRBOM, D. (1993). LISREL 8: Structural equation modeling
with the SIMPLIS command language. Lincolnwood, Illinois: Scientific
Software International.
KAHNEMAN, D. (1997). New challenges to the rationality assumption. Legal Theory,
3, 105-124. doi: 10.1017/S1352325200000689
KAHNEMAN, D. and TREISMAN, A. (1984). Changing views of attention and
automaticity. In PARASURAMAN, R. (Eds.), Varieties of Attention New York:
Academic Press.
KALS, E., SCHUMACHER, D. and MONTADA, L. (1999). Emotional affinity toward
nature as a motivational basis to protect nature. Environment and Behavior,
31(2), 178-202. doi: 10.1177/00139169921972056
KALTENBORN, B. P. (1998). Effects of sense of place on responses to environmental
impacts: A study among residents in Svalbard in the Norwegian high Arctic.
Applied Geography, 18(2), 169-189. doi:
KALTENBORN, B. P. and WILLIAMS, D. R. (2002). The meaning of place:
Attachments to Femundsmarka National Park, Norway, among tourists and
locals. Norsk Geografisk Tidsskrift, 56(3), 189-198. doi:
10.1080/00291950260293011
KALTENBORN, B. R. P. (1997). Nature of place attachment: A study among
recreation homeowners in Southern Norway. Leisure Sciences, 19(3), 175-189.
doi: 10.1080/01490409709512248
KASARDA, J. D. and JANOWITZ, M. (1974). Community Attachment in Mass
Society. American Sociological Review, 39(3), 328-339. doi:
KASZA-KELEMEN, K. (2012). Examining the Dimensionality of Place Attachment
and its Relation to Pro-environmental Behaviour in Tourism Settings. Global
Business & Economics Anthology, 1, 265-275.
KATZ, G. S., RESTORI, A. F. and LEE, H. B. (2009). A Monte Carlo Study
Comparing the Levene Test to Other Homogeneity of Variance Tests. North
American Journal of Psychology, 11(3), 511-521 doi:
KELEMEN, K., HOFMEISTER-TÓTH, Á. and PISKÓTI, M. (2010). Környezettudatos
fogyasztói magatartás a turizmusban. [Pro-environmental consumer behaviour in
tourism.] Conference article at International Conference on Tourism and Sports
Management, Debrecen.
KEREKES, S. (2011). Boldogság, környezetvédelem és piacgazdaság. [Happiness,
environmental protection and market economy.] In CSUTORA, M. and
HOFMEISTER-TÓTH, Á. (Eds.), Fenntartható fogyasztás? [Sustainable
consumption?] Budapest: AULA.
KLINE, R. B. (2005). Principles and practices of structural equation modeling. New
York: The Guilford Press.

155
KNEZ, I. (2005). Attachment and identity as related to a place and its perceived
climate. Journal of Environmental Psychology, 25(2), 207-218. doi:
10.1016/j.jenvp.2005.03.003
KOCSIS, T. (2012). Föld és Ég. [Earth and Sky.] Az ember és a természeti környezet
közötti kapcsolat jellemzése az adatnégyzetek módszerével. [Description of the
relationship between humans and natural settings with the square method.] In
KEREKES, S. and JÁMBOR, I. (Eds.), Fenntartható fejlődés, élhető régió,
élhető települési táj Budapest: Budapesti Corvinus University.
KORNEVALL, C. (2002). Sustainability is everybody’s business. Industry and
Environment (UNEP), 25., 30-32.
KOZÁK, Á. (2008). Kincskeresők - a magyar fogyasztói szokásról. [Teasure hunters -
on Hungarian consumer habits] Budapest: HVG.
KSH (2013). 2011. évi népszámlálás. [Population census 2011] 3. országos adatok.
[National data.] Budapest: KSH.
KYLE, G., ABSHER, J. and GRAEFE, A. (2003). The moderating role of place
attachment on the relationship between attitudes toward fees and spending
preferences. Leisure Sciences, 25(1), 33-50. doi: 10.1080/01490400306552
KYLE, G., GRAEFE, A. and MANNING, R. (2005). Testing the dimensionality of
place attachment in recreational settings. Environment and Behavior, 37(2), 153-
177. doi: 10.1177/0013916504269654
KYLE, G., GRAEFE, A., MANNING, R. and BACON, J. (2004a). Effects of place
attachment on users' perceptions of social and environmental conditions in a
natural setting. Journal of Environmental Psychology, 24(2), 213-225. doi:
10.1016/j.jenvp.2003.12.006
KYLE, G., GRAEFE, A., MANNING, R. and BACON, J. (2004b). Effect of activity
involvement and place attachment on recreationists' perceptions of setting
density. Journal of Leisure Research, 36(2), 209-231.
KYLE, G. T., MOWEN, A. J. and TARRANT, M. (2004c). Linking place preferences
with place meaning: An examination of the relationship between place
motivation and place attachment. Journal of Environmental Psychology, 24(4),
439-454. doi: 10.1016/j.jenvp.2004.11.001
LALLI, M. (1992). Urban-related identity: Theory, measurement, and empirical
findings. Journal of Environmental Psychology, 12(4), 285-303. doi:
10.1016/S0272-4944(05)80078-7
LAM, T. and HSU, C. H. C. (2006). Predicting behavioral intention of choosing a travel
destination. Tourism Management, 27(4), 589-599. doi:
10.1016/j.tourman.2005.02.003
LANKFORD, S. V. and HOWARD, D. R. (1994). Developing a tourism impact attitude
scale. Annals of Tourism Research, 21(1), 121-139. doi: 10.1016/0160-
7383(94)90008-6
LEE, C. and ALLEN, L. (1999). Understanding individuals' attachment to selected
destinations: an application of place attachment. Tourism Analysis, 4(3/4), 173-
185. doi:

156
LEWICKA, M. (2005). Ways to make people active: The role of place attachment,
cultural capital, and neighborhood ties. Journal of Environmental Psychology,
25(4), 381-395. doi: 10.1016/j.jenvp.2005.10.004
LEWICKA, M. (2010). What makes neighborhood different from home and city?
Effects of place scale on place attachment. Journal of Environmental
Psychology, 30(1), 35-51. doi: 10.1016/j.jenvp.2009.05.004
LEWICKA, M. (2011). Place attachment: How far have we come in the last 40 years?
Journal of Environmental Psychology, 31(3), 207-230. doi:
10.1016/j.jenvp.2010.10.001
LÓPEZ-MOSQUERA, N. and SÁNCHEZ, M. (2011). The influence of personal values
in the economic-use valuation of peri-urban green spaces: An application of the
means-end chain theory. Tourism Management, 32(4), 875-889. doi:
http://dx.doi.org/10.1016/j.tourman.2010.08.003
LOW, S. M. and ALTMAN, I. (1992 ). Place attachment: A conceptual inquiry. New
York: Plenum Press
MACE, G. M., CRAMER, W., DÍAZ, S., FAITH, D. P., LARIGAUDERIE, A., LE
PRESTRE, P., PALMER, M., PERRINGS, C., SCHOLES, R. J., WALPOLE,
M., WALTHER, B. A., WATSON, J. E. M. and MOONEY, H. A. (2010).
Biodiversity targets after 2010. Current Opinion in Environmental
Sustainability, 2(1-2), 3-8. doi: 10.1016/j.cosust.2010.03.003
MACKINNON, D. P., LOCKWOOD, C. M., HOFFMAN, J. M., WEST, S. G. and
SHEETS, V. (2002). A comparison of methods to test mediation and other
intervening variable effects. Psychological methods, 7(1), 83. doi:
10.1037/1082-989X.7.1.83
MAGYAR TURIZMUS ZRT. (2015). Marketingstratégia 2015-2017. [Marketing
strategy 2015-2017.] Available:
http://szakmai.itthon.hu/documents/28123/15005854/MTZrt-
Marketingstrategia_2015-2017.pdf/eb13a95e-11c4-47e5-b457-d7fdd74a1c97.
doi:
MALCOLM, J. R., LIU, C., MILLER, L. B., ALLNUTT, T. and HANSEN, L. (2002).
Habitats at Risk. Global Warming and Species Loss in Globally Significant
Terrestrial Ecosystems. Gland: WWF:
MALHOTRA, N. K. and SIMON, J. (2008). Marketingkutatás. [Marketing research]
Budapest: Geomédia Kiadó.
MANZO, L. C. (2005). For better or worse: Exploring multiple dimensions of place
meaning. Journal of Environmental Psychology, 25(1), 67–86. doi:
10.1016/j.jenvp.2005.01.002
MARTENS, S. and SPAARGAREN, G. (2005). The politics of sustainable
consumption: the case of the Netherlands. Sustainability: Science, Practice and
Policy, 1(1), 29-42.
MÉRŐ, L. (2007). A pénz evolúciója. [The Evolution of Money.] Budapest: Tericum.
MESCH, G. S. (1996). The effect of environmental concerns and governmental
incentives on organized action in local areas. Urban Affairs Review, 31(3), 346-
366. doi: 10.1177/107808749603100303

157
MESCH, G. S. and MANOR, O. (1998). Social ties, environmental perception, and
local attachment. Environment and Behavior, 30(4), 504-519. doi:
10.1177/001391659803000405
MICHALKÓ, G. (2007). A turizmusföldrajz és humánökológia [Tourism geography
and human ecology.]. Székesfehérvár: KJF-MTA Földrajztudományi Kutató
Intézet.
MILLIGAN, M. J. (1998). Interactional Past and Potential: The Social Construction of
Place Attachment. Symbolic Interaction, 21(1), 1-33. doi:
10.1525/si.1998.21.1.1
MILNE, S. and ATELJEVIC, I. (2004). Tourism, economic development and the
globallocal nexus: theory embracing complexity. In WILLIAMS, S. (Ed.),
Tourism: Critical Concepts in Social Sciences London: Routledge.
MOISANDER, J. (2007). Motivational complexity of green consumerism. International
Journal of Consumer Studies, 31(4), 404-409. doi: 10.1111/j.1470-
6431.2007.00586.x
MOORE, R. L. and GRAEFE, A. R. (1994). Attachments to recreation settings: The
case of rail-trail users. Leisure Sciences, 16(1), 17 - 31. doi:
10.1080/01490409409513214
NAGY, S. and PISKÓTI, I. (2011). Fenntartható Fogyasztás [Sustainable
Consumption]. Budapest: Nemzeti Tankönyvkiadó.
NATIONALGEOGRAPHICS and GLOBESCAN. (2010). Greendex 2010: Consumer
Choice and the Environment - A Worldwide Tracking Survey. Available:
http://images.nationalgeographic.com/wpf/media-
live/file/GS_NGS_2010GreendexHighlights-cb1275487974.pdf
NEUMANN-BÓDI, E. (2012). Vevőértékelés egyéni és szervezeti vásárlók esetében.
[Evaluation of buyers in case of individal or organizational buyers.] Az
ajánlással szerzett ügyfelek jellemzői és hatásuk a vevőértékre szervezetközi
viszonylatban.[Clients acquired through references and their influence on
buyers’ value in the inter-organizational context.] Doctoral dissertation,
Corvinus University of Budapest.
NFFT (2010). Future hunting. Report of National Council for Sustainable Development
to the Hungarian Society. Available:
http://www.nfft.hu/dynamic/Jovokereso_Hosszu_Screen.pdf
NORDENSTAM, B. J. (1994). When communities say NIMBY to their LULUs: factors
influencing environmental and social impact perception. Irvine: University of
California.
NYÍRŐ, N. (2011). Médiatechnológiai innovációk elfogadása és terjedése. Doctoral
dissertation, Corvinus University of Budapest.
OECD (2002). Towards Sustainable Household Consumption? Trends and Policies in
OECD Countries. Paris: OECD.
OLLI, E., GRENDSTAD, G. and WOLLEBAEK, D. (2001). Correlates of
Environmental Behaviors. Environment and Behavior, 33(2), 181-208. doi:
10.1177/0013916501332002

158
OPPERMANN, M. (1993). Tourism space in developing countries. Annals of Tourism
Research, 20(3), 535-556. doi: 10.1016/0160-7383(93)90008-Q
PAPATHEODOROU, A. (2004). Exploring the evolution of tourism resorts. Annals of
Tourism Research, 31(1), 219-237. doi: 10.1016/j.annals.2003.10.004
PISKÓTI, M. 2015. A Környezeti Identitás szerepe a környezettudatos viselkedés
kialakulásában. [The Role of Environmental Identity in the Development of Pro-
environmental Behaviour]. Doctoral dissertation, Corvinus University of
Budapest
POOLEY, J. A. and O’CONNOR, M. (2000). Environmental education and attitudes:
Emotions and beliefs are what is needed. Environment and Behavior, 32(5),
711-723. doi: 10.1177/0013916500325007
PRAHALAD, C. K. and RAMASWAMY, V. (2000). Co-opting customer competence.
Harvard Business Review, 78(1), 79.87. doi: 10.1225/R00108
PROSHANSKY, H. M. (1978). The city and self-identity. Environment and Behavior,
10(2), 147-169. doi: 10.1177/0013916578102002
PUCZKÓ, L. and RÁTZ, T. (2005). A turizmus hatásai. [The influences of tourism.]
Budapest: Aula Kiadó.
QUINTAL, V. A., LEE, J. A. and SOUTAR, G. N. (2009). Risk, uncertainty and the
theory of planned behavior: A tourism example. Tourism Management, 31(6),
797-805. doi: 10.1016/j.tourman.2009.08.006
RAMKISSOON, H., GRAHAM SMITH, L. D. and WEILER, B. (2013). Testing the
dimensionality of place attachment and its relationships with place satisfaction
and pro-environmental behaviours: A structural equation modelling approach.
Tourism Management, 36, 552-566. doi:
http://dx.doi.org/10.1016/j.tourman.2012.09.003
RAMKISSOON, H. and MAVONDO, F. T. (2015). The satisfaction–place attachment
relationship: Potential mediators and moderators. Journal of Business Research.
doi: 10.1016/j.jbusres.2015.05.002
RAMKISSOON, H., WEILER, B. and SMITH, L. D. G. (2012). Place attachment and
pro-environmental behaviour in national parks: the development of a conceptual
framework. Journal of Sustainable Tourism, 20(2), 257-276. doi:
10.1080/09669582.2011.602194
RAYMOND, C. M., BROWN, G. and WEBER, D. (2010). The measurement of place
attachment: Personal, community, and environmental connections. Journal of
Environmental Psychology, 30(4), 422-434. doi: 10.1016/j.jenvp.2010.08.002
RELPH, E. (1976). Place and placelessness. London: Pion Limited.
RIEMER, J. W. (2000). Job relocation, sources of stress, and sense of home.
Community, Work & Family, 3(2), 205-217. doi: 10.1080/713658901
RIGER, S. and LAVRAKAS, P. J. (1981). Community ties: Patterns of attachment and
social interaction in urban neighborhoods. American Journal of Community
Psychology, 9(1), 55-66. doi: 10.1007/bf00896360
RUMPALA, Y. (2011). “Sustainable consumption” as a new phase in a
governmentalization of consumption. Theory and Society, 40(6), 669-699. doi:
10.1007/s11186-011-9153-5

159
RYAN, C. (2002). Equity, management, power sharing and sustainability-issues of the
'new tourism'. Tourism Management, 23(1), 17-26. doi: 10.1016/S0261-
5177(01)00064-4
SAJTOS, L. and MITEV, A. (2007). SPSS kutatási és adatelemzési kézikönyv [SPSS
guide to research and data analysis] Budapest: Alinea.
SAMPSON, R. J. and GROVES, B. W. (1998). Community structure and crime: testing
social disorganization theory. American Journal of Sociology 94., 74–80. doi:
10.1086/229068
SCANNELL, L. and GIFFORD, R. (2010a). The relations between natural and civic
place attachment and pro-environmental behavior. Journal of Environmental
Psychology, 30(3), 289-297. doi: 10.1016/j.jenvp.2010.01.010
SCANNELL, L. and GIFFORD, R. (2010b). Defining place attachment: A tripartite
organizing framework. Journal of Environmental Psychology, 30(1), 1-10. doi:
10.1016/j.jenvp.2009.09.006
SCHOLDERER, J., BALDERJAHN , I. and PAULSSEN, M. (2006). Kausalität,
Linearität, Reliabilität: Drei Dinge, die Sie nie über Strukturgleichungsmodelle
wissen wollten. DBW – Die Betriebswirtschaft-online, Elérhető:
http://www.dbwnet.de/hits.php?docID=1308_12&pageID=34&local=1&first=3
4&last=44
SCHULTZ, P. W. (2000). Empathizing with nature: The effects of perspective talking
on concern for environmental issues. Journal of Social Issues, 56(3), 391-406.
doi: 10.1111/0022-4537.00174
SCHULTZ, P. W. (2001). The structure of environmental concern: concern for self,
other people, and the biosphere. Journal of Environmental Psychology, 21(4),
327-339. doi: 10.1006/jevp.2001.0227
SCHULTZ, P. W., GOUVEIA, V. V., CAMERON, L. D., TANKHA, G., SCHMUCK,
P. and FRANAK, M. (2005). Values and their relationship to environmental
concern and conservation behavior. Journal of Cross-Cultural Psychology,
36(4), 457-475. doi: 10.1177/0022022105275962
SCHULTZ, P. W. and ZELEZNY, L. C. (1998). Values and proenvironmental
behavior: a five-country survey. Journal of Cross-Cultural Psychology, 29(4),
540-558. doi: 10.1177/0022022198294003
SCHWARTZ, S. H.and LEONARD, B. (1977). Normative influences on altruism. In:
Advances in Experimental Social Psychology: Academic Press.
SCITOVSKY, T. (1990). Az örömtelen gazdaság. [The unhappy economy.]
Gazdaságlélektani alapvetések. [Guidelines to the psychology of economy.]
Budapest: KJK.
SEDDIGHI, H. R. and THEOCHAROUS, A. L. (2002). A model of tourism destination
choice: a theoretical and empirical analysis. Tourism Management, 23(5), 475-
487. doi: 10.1016/S0261-5177(02)00012-2
SENNETT, R. (2000). New capitalism, new isolation: A flexible city of strangers. Le
Monde Diplomatique. (English Edition).

160
SGUIN, C., PELLETIER, L. G. and HUNSLEY, J. (1998). Toward a model of
environmental activism. Environment and Behavior, 30(5), 628-652. doi:
10.1177/001391659803000503
SHARPLEY, R. (2004). Tourism and sustainable development: exploring the
theoretical divide. In WILLIAMS, S. (Ed.), Tourism: Critical Concepts in Social
Sciences London: Routledge.
SHARPLEY, R. (2009). Tourism development and the environment: beyond
sustainability? London: Earthscan.
SHUMAKER, S. A. and TAYLOR, R. B. (1983). Toward a clarification of people place
relationships: a model of attachment to place. In FEIMER, N. R. and GELLER,
E. S. (Eds.), Environmental psychology: Directions and perspectives New York:
Praeger.
SIVEK, D. J. and HUNGERFORD, H. (1990). Predictors of responsible behavior in
members of three wisconsin conservation organizations. The Journal of
Environmental Education, 21(2), 35-40. doi: 10.1080/00958964.1990.9941929
SMITH-SEBASTO, N. J. (1992). Design, development, and validation of an instrument
to assess the relationship between locus of control of reinforcement and
environmentally responsible behavior in university undergraduate students.
Unpublished doctoral dissertation. Columbus: The Ohio State University.
SMITH-SEBASTO, N. J. and D'ACOSTA, A. (1995). Designing a Likert-type scale to
predict environmentally responsible behavior in undergraduate. Journal of
Environmental Education, 27(1), 14. doi: 10.1080/00958964.1995.9941967
SNELGAR, R. S. (2006). Egoistic, altruistic, and biospheric environmental concerns:
Measurement and structure. Journal of Environmental Psychology, 26(2), 87-99.
doi: 10.1016/j.jenvp.2006.06.003
SPARKS, B. and PAN, G. W. (2009). Chinese outbound tourists: Understanding their
attitudes, constraints and use of information sources. Tourism Management,
30(4), 483-494. doi: 10.1016/j.tourman.2008.10.014
STEDMAN, R. C. (2002). Toward a Social Psychology of Place. Environment and
Behavior, 34(5), 561-581. doi: 10.1177/0013916502034005001
STEDMAN, R. C. (2003). Sense of place and forest science: toward a program of
quantitative research. Forest Science, 49(6), 822–829.
STERN, P. C. (1997). Toward a working definition of consumption for environmental
research and policy. In STERN, P. C., DIETZ, T., RUTTAN, V. R.,
SOCOLOW, R. H. and SWEENEY, J. L. (Eds.), Environmentally significant
consumption: Research directions Washington, DC: National Academy Press.
STERN, P. C. (2000). New Environmental Theories: Toward a Coherent Theory of
Environmentally Significant Behavior. Journal of Social Issues, 56(3), 407-424.
doi: 10.1111/0022-4537.00175
STERN, P. C., DIETZ, T., ABEL, T., GUAGNANO, G. A.and KALOF, L. (1999). A
value-belief-norm theory of support for social movements: the case of
environmentalism. Research in Human Ecology, 6(2), 81-97.

161
STERN, P. C., DIETZ, T. and KALOF, L. (1993). Value Orientations, Gender, and
Environmental Concern. Environment and Behavior, 25(5), 322-348. doi:
10.1177/0013916593255002
STERN, P. C., KALOF, L., DIETZ, T. and GUAGNANO, G. A. (1995). Values,
beliefs, and proenvironmental action: attitude formation toward emergent
attitude objects. Journal of Applied Social Psychology, 25(18), 1611-1636. doi:
10.1111/j.1559-1816.1995.tb02636.x
STOKOLOS, D. and SHUMAKER, S. A. (1981). People in places: a transactional view
of settings. In HARVEY, J. H. (Ed.), Cognition, social behavior and
environment Hillsdale, NJ: Erlbaum.
STRASDAS, W. (2001). Ökotourismus in der Praxis - Zur Umsetzung der sozio-
ökonomischen und naturschutzpolitischen Ziele eines anspruchsvollen
Tourismuskonzeptes in Entwicklungsländern. Studienkreis für Tourismus und
Entwicklung. Ammerland/Starnberger See.
SWARBROOKE, J. and HORNER, S. (2007). Consumer Behaviour in Tourism.
Second Edition. Oxford-Burlington: Elsevier.
SYME, G. J., NANCARROW, B. E. and JORGENSEN, B. S. (2002). The Limits of
Environmental Responsibility: A Stormwater Case Study. Environment and
Behavior, 34(6), 836-847. doi: 10.1177/001391602237251
SZÉKELY, M. (2003). A fogyasztói magatartás alapjai: a lélek- és a gazdaságtan
alapfeltevései a fogyasztásról. [The basics of consumer behaviour: assumptions
of mind and economy on consumptions.] In HUNYADI, G. and SZÉKELY, M.
(Eds.), Gazdaságpszichológia Budapest: Osiris.
SZOKOLSZKY, Á. (2004). Kutatómunka a pszichológiában.[Research in psychology.]
Budapest: Osiris.
TASNÁDI, J. (2002). A turizmus rendszere. [The system of tourism.] Budapest: Aula.
TAYLOR, R. B., GOTTFREDSON, S. D. and BROWER, S. (1985). Attachment to
place: Discriminant validity, and impacts of disorder and diversity. American
Journal of Community Psychology, 13(5), 525-542. doi: 10.1007/bf00923265
TEFLER, D. J. (2002). The Evolution of Tourism and Development Theory. In
SHARPLEY, R. and TEFLER, D. J. (Eds.), Tourism and development. Concepts
and Issues Clevedon: Chanel View Publication.
THEOBALD, W. F. (1998). Global tourism. Oxford; Boston: Butterworth-Heinemann.
THØGERSEN, J. (1999). Spillover Processes in the Development of a Sustainable
Consumption Pattern. Journal of Economic Psychology, 20, 53-81. doi:
10.1016/S0167-4870(98)00043-9
THØGERSEN, J. and ÖLANDER, F. (2003). Spillover of environment-friendly
consumer behaviour. Journal of Environmental Psychology, 23, 225-236. doi:
10.1016/S0272-4944(03)00018-5
TINSLEY, H. E. and TINSLEY, D. J. (1987). Uses of factor analysis in counseling
psychology research. Journal of Counseling Psychology, 34(4), 414-424. doi:
10.1037/0022-0167.34.4.414

162
TRENTELMAN, C. K. (2009). Place attachment and community attachment: A Primer
grounded in the lived experience of a community sociologist. Society & Natural
Resources, 22(3), 191-210. doi: 10.1080/08941920802191712
TUAN, Y.-F. (1974). Topophilia: a study of environmental perception, attitudes, and
values. New York: Prentice Hall.
TUAN, Y. F. (1977). Space and place: The perspective of experience. Minneapolis:
University of Minnesota Press.
UNEP (2015). The sustainable tourism programme. Elérhető:
http://www.unep.org/10yfp/Portals/50150/downloads/publications/10YFP/6.%2
0Brochure_10YFP%20Sust%20Tour%20Prog.pdf
UNEP and WTO (2005). Making tourism more sustainable: a guide for policy makers.
Available: http://www.unep.fr/shared/publications/pdf/DTIx0592xPA-
TourismPolicyEN.pdf
UNESCO (1976). The effects of tourism on socio-cultural values. Annals of Tourism
Research, 4(2), 74-105.
UNWTO (1980). Manila declaration on world tourism. Madrid: WTO.
UNWTO (2001). Global code of ethics for tourism. Available:
http://www.unwto.org/ethics/full_text/en/pdf/Codigo_Etico_Ing.pdf
UNWTO (2002). Contributions of the world tourism organization to the world summit
on sustainable development. Available: http://www.e-
unwto.org/content/p99m85/
UNWTO (2003). Sustainable development of ecotourism - A compilation of good
practices in SMEs. Available:
http://www.wtoelibrary.org/content/v65m80/?p=03b1a50988a5453aa8d48113e7
45fa17&pi=1
UNWTO (2004). Indicators of sustainable development for tourism destinations: A
Guidebook. Available:
http://www.wtoelibrary.org/content/x53g07/?p=41431a2526814051a9444b910e
44c829&pi=0
UNWTO (2005a). Making tourism more sustainable: a guide for policy makers.
Available:
http://www.wtoelibrary.org/content/w715w4/?p=ca59415b63f64c18ac8fe6b210
b4b8c0&pi=1
UNWTO (2005b). Tourism's potential as a sustainable development strategy. Available:
http://www.wtoelibrary.org/content/p21255/?p=c9184fee187442e8aac79794dc0
6d9c1&pi=0
UNWTO (2007a). Policies, strategies and tools for the sustainable development of
tourism. Available:
http://www.wtoelibrary.org/content/q78u17/fulltext?p=c332ed56eed34c958ff88
6f7cd42d0f5&pi=0#section=8660page=1
UNWTO (2007b). Climate change and tourism responding to global challanges.
Available: http://www.unwto.org/pdf/pr071046.pdf
UNWTO (2009). From davos to copenhagen and beyond: advancing tourism’s response
to climate change. Available:

163
http://www.unwto.org/pdf/From_Davos_to%20Copenhagen_beyond_UNWTOP
aper_ElectronicVersion.pdf
UNWTO (2010a). Tourism and biodiversity. Available:
http://www.unwto.org/worldtourismday/resources/pdf/WTDBackgroundPaper.p
df
UNWTO (2010b). Hainan Tourism Declaration. Available:
www.UNWTO.org/pdf/FINAL-2010_Hainan_Tourism_Declaration-
revised_March_20.pdf
UNWTO (2010c). Tourism and the Millennium Development Goals. Available:
http://www.unwto.org/tourism&mdgsezine/
UNWTO (2015). Tourism Highlights 2015. Available: http://www.e-
unwto.org/doi/pdf/10.18111/9789284416899
UUSITALO, L. (1990). Consumer preferences for environmental quality and other
social goals. Journal of Consumer Policy, 13(3), 231-251. doi:
10.1007/bf00411509
UZZELL, D., POL, E. and BADENAS, D. (2002). Place identification, social cohesion,
and enviornmental sustainability. Environment and Behavior, 34(1), 26-53. doi:
10.1177/0013916502034001003
VALKÓ, L. (2003). A fenntartható/környezetbarát fogyasztás és a magyar lakosság
környezeti tudata.[Sustainable/environmentally friendly consumption and the
environmental consciousness of the Hungarian population.] Budapest: Aula.
VAN DEN BERGH, J. C. J. M. and VERBRUGGEN, H. (1999). Spatial sustainability,
trade and indicators: an evaluation of the ‘ecological footprint’. Ecological
Economics, 29, 61–72. doi: 10.1016/S0921-8009(99)00032-4
VAN DER KLIS, M. and KARSTEN, L. (2009). Commuting partners, dual residences
and the meaning of home. Journal of Environmental Psychology, 29(2), 235-
245. doi: 10.1016/j.jenvp.2008.11.002
VARGÁNÉ CSOBÁN, K. (2007). A teherbíró képesség kérdésköre a turizmusban [The
topic of capacity in tourism] In: International Conference on Agricultural
Economics, Rural Development and Informatics, 20-21st March, 2007 2007
Debrecen.
VARGÁNÉ CSOBÁN, K. and BAUERNÉ GÁTHY, A. (2009). An analysis of the
strategies for sustainable development based on the principles of sustainable
tourism. Conference article at the 4th Aspects and Visions of Applied
Economics and Informatics Conference, Debrecen.
VASKE, J. J. and KOBRIN, K. C. (2001). Place attachment and environmentally
responsible behavior. The Journal of Environmental Education, 32(4), 16 - 21.
VERÉCZI, G. (2003). A Turisztikai Világszervezet ökoturizmus kutatási
programja.[The ecotourism research programme of the World Organization of
Tourism.] Turizmus Bulletin, 7(3), 19-24.
VERPLANKEN, B. and FAES, S. (1999). Good intentions, bad habits, and effects of
forming implementation intentions on healthy eating. European Journal of
Social Psychology, 29(5-6), 591-604. doi: 10.1002/(sici)1099-
0992(199908/09)29:5/6<591::aid-ejsp948>3.0.co;2-h

164
VIDÉKFEJLESZTÉSI MINISZTÉRIUM [MINISTRY OF RURAL DEVELOPMENT]
AND PANNON UNIVERSITY (2012). A magyarországi nemzeti parkok
látogatóinak jellemzői 2012-ben.[Visitations to Hungarian national parks in
2012.] Veszprém.
VORKINN, M. and RIESE, H. (2001). Environmental Concern in a Local Context.
Environment and Behavior, 33(2), 249-263. doi: 10.1177/00139160121972972
WAKEFIELD, S. E. L., ELLIOTT, S. J., COLE, D. C. and EYLES, J. D. (2001).
Environmental risk and (re)action: air quality, health, and civic involvement in
an urban industrial neighbourhood. Health & Place, 7(3), 163-177. doi:
10.1016/S1353-8292(01)00006-5
WALKER, G. J. és CHAPMAN, R. (2003). Thinking like a park: The effects of sense
of place, perspective-taking, and empathy on pro-environmental intentions.
Journal of Park & Recreation Administration, 21(4), 71-86.
WEARING, S. (2001). Volunteer tourism, experiences that make a difference. Oxon:
CABI Publishing.
WEAVER, D. (2006). Sustainable Tourism: Theory and Practice. Oxford: Elsevier
Butterworth-Heinemann.
WEBER, M. (1967). Gazdaság és társadalom. [Economy and society] Budapest:
Közgazdasági és Jogi Könyvkiadó.
WEBSTER, F. E., JR. (1975). Determining the Characteristics of the Socially
Conscious Consumer. The Journal of Consumer Research, 2(3), 188-196. doi:
10.1086/208631
WEEDEN, C. (2002). Ethical tourism: An opportunity for competitive advantage?
Journal of Vacation Marketing, 8(2), 141-153. doi:
10.1177/135676670200800204
WEF (2011). The consumption dilemma. Leverage points for accelerating sustainable
growth. Available:
http://www3.weforum.org/docs/WEF_ConsumptionDilemma_SustainableGrowt
h_Report_2011.pdf
WEIBER, R. and MÜHLHAUS, D. (2010). Strukturgleichungsmodellierun. Berlin-
Heidelberg: Springer
WILLIAMS, D. R., PATTERSON, M. E., ROGGENBUCK, J. W. and WATSON, A.
E. (1992). Beyond the commodity metaphor: Examining emotional and
symbolic attachment to place. Leisure Sciences, 14(1), 29-46. doi:
10.1080/01490409209513155
WILLIAMS, D. R. and ROGGENBUCK, J. W. (1989). Measuring place attachment:
Some preliminary results. Conference article at the Outdoor Planning and
Management NRPA Symposium on Leisure Research
Conference, San Antonio, Texas. Available:
http://www.fs.fed.us/rm/value/docs/nrpa89.pdf
WILLIAMS, D. R. and STEWART, S. I. (1998). Sense of Place: An elusive concept
that is finding a home in ecosystem management. Journal of Forestry, 96(5), 18-
23. doi:

165
WILLIAMS, D. R. and VASKE, J. W. (2003). The Measurement of place attachment:
validity and generalizability of a psychometric approach. Forest Science, 49(6),
830-840.
WILLIAMS, S. (1998). Tourism geography. London and New York: Routledge.
WOLDOFF, R. A. (2002). The effects of local stressors on neighborhood attachment.
Social Forces, 81(1), 87-116. doi: 10.1353/sof.2002.0065
WTO (1998). A fenntartható turizmus fejlesztése.[Development of sustainable tourism.]
Irányelvek a turizmus tervezőinek és szervezőinek.[Guidelines for planning and
managing tourism.] Budapest: Geomédia Kiadó.
YUKSEL, A., YUKSEL, F. and BILIM, Y. (2010). Destination attachment: Effects on
customer satisfaction and cognitive, affective and conative loyalty. Tourism
Management, 31(2), 274-284. doi: 10.1016/j.tourman.2009.03.007
ZSÓKA, Á. (2007). A fenntartható fogyasztás alapfeltétele: a környezettudatos egyéni
magatartás.[The basic condition of sustainable consumption: pro-environmental
individual behaviour.] Conference article at the Conference on Sustainable
Consumption in Hungary, 2007, Budapest. Available:
http://www.tve.hu/attachment/file/31/Fenntarthato_fogyasztas_konferenciakotet.
ZSÓKA, Á., MARJAINÉ SZERÉNYI, Z. and SZÉCHY, A. (2011). A környezeti
nevelés szerepe a fenntarthat fogyasztás és életmód kialakításában.[The role of
environmental education in sustainable consumption and life style.] In
CSUTORA, M. and HOFMEISTER-TÓTH, Á. (Eds.), Fenntartható fogyasztás?
[Sustainable consumption?] A fenntartható fogyasztás gazdasági kérdései
[Economical issues of sustainable consumption] Budapest: BCE Norway
Grants.
ZSOLNAI, L. (2007). Felelősség és döntés. [Responsibility and decision] Korunk, 5,
29-35.

166
ANNEX

167
Annex 1: UNWTO programmes 2002-2015
Source: own elaboration
Event Year Topic Focus Questions discussed
Johannesburg
Summit, 2002 2002
Summary of WTO
participation in the World
Business Council for
Sustainable Development
(UNWTO, 2002)
The role of WTO
• The role of WTO in the
development of sustainable
tourism
Publication 2003
Sustainable development of
ecotourism
(UNWTO, 2003)
Good practices
for SMEs
• the role of small and medium-
sized enterprises
• achieved good practices
• cross-border cooperation
• guidelines for practical
adaptation of ecotourism in
accordance with local
circumstances
Publication 2004
Indicators of sustainable
development of tourism
destinations
(UNWTO, 2004)
Measurement
questions relating
to destination
• summary of major
sustainability related questions
• recommendation for indicators
and measurement tools
• practical sources of information
Publication 2005
Making tourism more
sustainable - A guide for policy
makers
(UNWTO, 2005a)
Legislation
related questions
• guidelines for governments on
the development and application
of policies for sustainable
tourism
WTO Tourism Policy
Forum, 2004 2005
Tourism potential in the
sustainable development
strategy
(UNWTO, 2005b)
Policy and
strategy making
• strategic and policy questions
• knowledge management
• case studies
Publication 2007
Policies, strategies and
instruments enhancing
sustainable development in
tourism
(UNWTO, 2007a)
Policy and
strategy making
• strategic and policy questions
• cross-border cooperation
• the role of indicators
• summary of good practices and
techniques
International Year of
Deserts and
Desertification, 2006
2007
Sustainable development in
desert tourism
(UNWTO, 2007b)
Guidelines for
desert related
questions
• challenges of extreme climate
• desert specific adaptation of
sustainable development
Davos Declaration,
2007 2009
Tourism's response to climate
change
(UNWTO, 2009)
Climate change
and greenhouse
gases
• The influence of reducing GHG
emission on tourism
• governmental and corporate
responsibilities regarding climate
change
• raising social awareness
International Year of
Biodiversity, 2010
(WTD)
2010
Linking tourism and
biodiversity
(UNWTO, 2010b)
Natural capital of
tourism
• preserving biodiversity
• communication to the public,
increase knowledge
• feasibility issues
Tourism and
Millennium
Development Goals,
2010
2010 Designated tasks till 2015
(UNWTO, 2010d) CSR practice
• the role of tourism in
sustainable development
• summary of the forms of
corporate responsibility
Sustainable Tourism
Programme 2015
Framework of Programmes on
Sustainable Consumption and
Production Patterns catalyzes
changes in tourism operations
(UNEP, 2015)
The 10YFP
Sustainable
Public
Procurement
Programme
(SPPP)
• expanding the Programme in
areas of tourism

168
Annex 2: Definitions or tourism intentions set out for sustainability
Source: own elaboration
Pro-Poor Tourism
Such tourism products aim to strengthen the cooperation between tourism industry and people living in poverty. Pro-
poor tourism contributes to the reduction of poverty and addresses people living in poverty through product
development.
Source: http://www.propoortourism.org.uk
Community Tourism
Sum of initiatives that are based on the intense cooperation among the locals. A local community may better influence
tourism through the relations between companies, resulting in more significant benefits. Community organizations
play an integrating role in the development of local facilities and contribute to a legislative framework to tackle the
exploitation of the locals by foreign investors.
Source: Boxill ( 2003)
Social Tourism
The aim of the initiative is to enable social groups struggling with financial or other difficulties to travel thus ensuring
the right to travel for everybody. Special off-season deals help the disadvantaged social groups experience travelling
and also they ensure the possibility of season expansion.
Source: Ryan (2002)
Ethical Tourism
Ethical tourism assumes that each and every stakeholder is deemed to be responsible for their decisions. Ethical
tourism emphasizes the equality of stakeholders in decision making while examines the stakeholders’ needs from
ethical aspect.
Source: Weeden (2002)
Fair Tourism
The approach emphasizes the fair price of a tourism product and this enables local communities to have better living
conditions. Fair tourism focuses on people who have insufficient power and financial resources to control tourism.
This may include tourism companies without sufficient capital, local population, indigenous communities or tourism
workers.
Source: http://www.tourismconcern.org.uk/
Ecotourism
Ecotourism includes the following types of ‘products’:
(1) Each type of nature based tourism where travellers primarily wish to observe and experience nature and
cultures relating to the natural settings.
(2) Ecotourism typically include educational and interpretative elements:
(3) Eco tours generally but no exclusively are organized by highly specialized travel operators, typically for
small groups. The travel operator is usually in contact with local companies of the destination.
(4) Stakeholders of ecotourism strive to minimize the adverse affects on nature and socio-cultural
environment.
(5) Ecotourism contributes to the conservation of attractive natural areas by enabling to generate income for
communities living in natural settings and for organizations and authorities operating for environmental
purposes, it also help create jobs and income for local communities and increases awareness towards the
preservation of natural and cultural heritage amongst locals and tourists.
Source: Ecotourism Market Reports, 2002 in: Veréczi (2003)
Volunteer tourism
This a type of tourism whereby travel is associated with voluntary work. Tourists offer their time, money and other
human resources at destinations far from their place of residence in order to gain cultural, environmental and spiritual
experiences.
Source: Wearing (2001)
Gentle Tourism
Gentle tourism refers to the type of tourism that encourages mutual understanding between local people and
tourists, it does not endanger cultural heritage of the visited area and it enables to respect environment.
Source: CIPRA, 1985: Tasnádi (2002)

169
Annex 3: Instructions of qualitative research
Source: Own elaboration
QUALITATIVE RESEARCH IN THE CONTEXT OF PLACE ATTACHMENT
Dear Student,
Please see below a questionnaire relating to an essay listed in the programme of Consumption Theory
and Consumer Behaviour subject. Your participation in this research means a valuable contribution
the scientific work at our department.
Participation is voluntary, responses are honoured with 5 points. Please send your filled form to the
following address by 25 April, 2011:
Thank you for your cooperation!
Department of Marketing Research and Consumer Behaviour
Please recall any of your holidays which was your greatest experience due to its location. Describe
your stay there. Try to tell this as if you would be telling it to a friend of yours. As for a good talk, this
storytelling has no limits, tell us about it the way you like.
(one page available for description)
Have you done anything to conserve that given area? Please report on any of your activities at the place
or later that may have contributed to the conservation of the place.
(half page available for description)
Have you done anything to harm that given area? Please report on any of your activities at the place or
later that may have contributed to harming the place.
(half page available for description)
4, Demography
1. Your gender: ...........
2. Your age: ............
3. Your permanent address (please underline the correct answer):
a. capital
b. county seat
c. city
d. village
4. Have you lived abroad over a longer period (for more than 3 months)?
a. yes b. no
5. If you lived abroad for longer than 3 months, please specify the counrtry: .........................
Please give your Neptun code for calculating your points.
(Neptun codes and responses will not be linked, we need the codes only for the purpose of submitting
your points. Responses are treated confidentially and will be used only for the purpose of the research.)
THANK YOU FOR YOUR COOPERATION!

170
Annex 4: Three sub-dimension place attachment scale of Halpenny
Source: Halpenny (2006)
Place identity
When I visit XXX National Park, others see me the way I want them to see me.
I strongly identify with XXX National Park.
I feel that XXX National Park is part of me.
The fact that I visit XXX National Park says a lot about who I am.
XXX National Park means a lot to me.
I feel I can really be myself when I am in XXX National Park.
Place affect
I feel happier if I am in XXX National Park.
XXX National Park is my favourite place to be.
I feel strong, positive feelings for XXX National Park
I am fond of XXX National Park.
I feel relaxed when I am in XXX National Park.
I really miss XXX National Park when I am away too long.
Place dependence
I wouldn’t substitute any other area for doing the types of things I do at XXX National
Park.
The things I do at XXX National Park I would enjoy doing just as much at a similar site.
I get more satisfaction out of visiting XXX National Park than any other parks.
XXX National Park is the best place for what I like to do.

171
Annex 5: Descriptive statistics of place attachment
Source: own elaboration
Place attachment N M SD
I strongly identify with XXX National Park. 256 2.82 1.189
I feel happier if I am in XXX National Park. 256 3.39 1.170
The things I do at XXX National Park I would enjoy doing just as much at a
similar site. 256 2.40 1.140
I feel strong, positive feelings for XXX National Park 256 3.79 1.011
I wouldn’t substitute any other area for doing the types of things I do at XXX
National Park. 256 2.45 1.307
The fact that I visit XXX National Park says a lot about who I am. 256 2.13 1.177
I feel I can really be myself when I am in XXX National Park. 256 2.57 1.199
I really miss XXX National Park when I am away too long. 256 2.31 1.342
XXX National Park is the best place for what I like to do. 256 2.15 1.117
XXX National Park means a lot to me. 256 2.88 1.222
I get more satisfaction out of visiting XXX National Park than any other
parks. 256 2.25 1.161
I feel relaxed when I am in XXX National Park. 256 3.70 1.179
XXX National Park is my favourite place to be. 256 2.03 1.176
When I visit XXX National Park, others see me the way I want them to see
me. 256 2.25 1.128
I am fond of XXX National Park. 256 2.99 1.262
I feel that XXX National Park is part of me. 256 2.19 1.207
Annex 6: Descriptive statistics of park-specific pro-environmental behaviour
Source: own elaboration
Park-specific pro-environmental behaviour N M SD
Pick up litter at XXX National Park left by other visitors. 254 2.87 1.231
Tell my friends not to feed the animals in XXX National Park or similar parks 254 2.26 1.150
Sign petitions in support of XXX National Park and similar protected areas. 254 3.30 1.371
Learn more about the natural settings of XXX National Park. 254 2.74 1.198
Write letters of support of XXX National Park. 254 1.46 ,808
Volunteer my time to projects that help XXX National Park or similar parks
and nature areas. 254 1.74 ,963
Encourage others to reduce their waste and pick up their litter when they are in
XXX National Park. 254 2.78 1.299
Participate in a public meetings about managing XXX National Park. 254 1.39 ,707
Pay increased park fees in XXX National Park if they were introduced and
used for park programs. 254 2.41 1.296
Volunteer to reduce my use of a favourite spot in XXX National Park if it
needs to recover from environmental damage. 254 1.59 ,910
Volunteer to stop visiting a favourite spot in XXX National Park if it needs to
recover from environmental damage. 254 1.58 ,920
I donate money to protect places such as the XXX National Park. 254 1.70 ,949

172
Annex 7: Results of a priori factor analysis of the park-specific pro-environmental behavioural
scale
(N=256) Source: Own elaboration
Items
Component
1 2
Volunteer to stop visiting a favourite spot in XXX National Park if it needs
to recover from environmental damage.
0.891 0.054
Volunteer to reduce my use of a favourite spot in XXX National Park if it
needs to recover from environmental damage.
0.887 0.101
Participate in a public meetings about managing XXX National Park.
0.753 0.196
Volunteer my time to projects that help XXX National Park or similar
parks and nature areas. 0.752 0.345
I donate money to protect places such as the XXX National Park.
0.641 0.317
Encourage others to reduce their waste and pick up their litter when they
are in XXX National Park. 0.257 0.731
Pick up litter at XXX National Park left by other visitors.
0.082 0.706
Tell my friends not to feed the animals in XXX National Park or similar
parks 0.090 0.693
Learn more about the natural settings of XXX National Park. 0.186 0.679
Sign petitions in support of XXX National Park and similar protected
areas. 0.184 0.565

173
Annex 8: The four sub-dimension scale of Ramkissoon et al. (2013)
The Cronbach α value of the whole scale was 0.90
(N=69)
Source: Own elaboration
Sub-
dimensions Items Average
Standard
deviation
Sample
size
Place
dependence M=2.41 SD=1.27 α=0.791
PD1
This national park has the best settings and
facilities for activities that entertain me the
most.
2.61 1.36 69
PD2 I cannot imagine better settings and facilities
for my activities than this national park. 1.99 1.18 69
PD3 A visitation to XXX National Park brings
more entertainment than other places. 2.59 1.25 69
Place affect M=2.32 SD=1.17 α=0.849
PA1 This national park means a lot to me. 2.61 1.23 69
PA2 I am attached to this national park. 2.39 1.23 69
PA3 I feel I belong to this national park and to its
settings/facilities. 1.96 1.05 69
Place
identity M=2.00 SD=1.05 α=0.765
PI1 I strongly identify with this national park. 2.23 1.15 69
PI2 I feel that this national park has become part
of my life. 2.06 1.06 69
PI3 The fact that I visit this national park tells a lot
about who I am. 1.71 0.94 69
Social bonds M=1.51 SD=0.80 α=0.553
PSB1 I would lose several friendships if I did not
visit this national park any longer. 1.12 0.47 69
PSB2
My friends/family would be disappointed if I
were to visit areas of other settings and
facilities.
1.41 0.69 69
PSB3 Most of my friends/relatives prefer this
national park to others. 2.00 1.22 69
Annex 9: Brief introduction of the national parks
Edited based on the introductory materials of the website of Hungarian National Parks
Source: http://magyarnemzetiparkok.hu/
(1) Aggtelek National Park
280 caves located in this national parks have been part of UNESCO World Heritage since 1995. Baradla
cave is the most prominent one of the karst area among caves of different origin and shape (currently

174
available to visit: Meteor-, Vass Imre-, Kossuth-, Béke-, Rákóczi-cave). The whole cave system and water
catchment area have been under the scope of Ramsar Convention since 2001.
(2) Balatoni-felvidék National Park
Balaton-felvidéki National Park founded in 1997 consists of six landscape protection areas. One of its
regions, Kis-Balaton is also protected by the international Ramsar Convention, serving the protection of
wetland habitats. Tihany Peninsula - as a recognition of its outstanding geological values and the work of
nature conservation in that region - was awarded of European Diploma in 2003.
(3) Bükk National Park
Bükk is Hungary's highest mountain based on the average mountain height in Hungary, its limestone peaks
exceed the height of 800-900 m. Its steep slopes, “Chain of stones”, deep valleys, karstic terrains of Bükk
plateau, green pastures provide a rich habitat for local flora and fauna. The karstic mountains house an
extensive cave system.
(4) Duna-Dráva National Park Duna-Dráva National Park runs alongside the edge of these two rivers and is situated in an area of
approximately 50,000 hectares. There are wide range of habitats on the flood plains with a number of
protected species of flora and fauna. The authority of Duna-Dráva National Park covers the whole South
Transdanubia in addition to these two big rivers. Major part of the protected areas belongs to
NATURA2000, the ecological network of the EU.
(5) Duna-Ipoly National Park
Duna-Ipoly National park is lying in a central location of our country, to the north of Budapest and has a
few connecting points with the Hungarian-Slovak border. Certain areas of the national park are situated in
the immediate vicinity of the capital. Its unique diversity is reflected in the beautiful harmony of the
following regions: Pilis-Visegrad mountains, Börzsöny mountains, Ipoly valley and part of the Great Plain
near the Danube.
(6) Fertő-Hanság National Park
Fertő region is a meeting point of climate zones, flora and fauna borders. The natural conditions being
unique in Europe and the biological diversity of a small area determine the shape of this landscape. The
national park is characterized with a mosaic shape. Its main regions: Fertő region, Hanság with Tóköz and
Répce region.
(7) Hortobágy National Park
The national park of 80,135 hectares consists of Hortobagy, Nagykunság and some areas of the Tisza Lake.
Hortobagy, established in 1973, is one of the most diverse national parks in Hungary. As “The best
Hungarian destination maintaining live traditions” and “Excellent European Destination” (ÉDEN 2008), it
is still preserving its internationally renowned shepherd tradition.
(8) Kiskunság National Park
This national park was founded in 1975 as the second biggest national park in Duna-Tisza region. At the
time of foundation it consisted of 6 units which have grown to 9 units by now. Area: 50523 hectares The
mission of Kiskunsag National Park is to preserve the characteristic shape, natural assets, geological
formations and waters of Duna-Tisza region and to enhance scientific research, education and dissemination
of these values.
(9) Körös-Maros National Park
The national park consists of 13 mosaics, whereby certain parts are designated to reflect the ancient
landscape, typical habitats, rivers, moorland and heath.
(10) Őrség National Park
Őrség is the only region of Hungary where the population has been living in one place since the conquest
of Hungary. People living here has been shaping the landscape for hundreds of years with their parcel
farming, natural buildings by being in harmony with nature to preserve and maintain its diversity.

175
Annex 10: Visual presentation of national parks in the questionnaire
Source: http://www.mozaweb.hu/Lecke-BIO-Biologia_9-Termeszet_es_kornyezetvedelem-102487
Annex 11: The questionnaire of empirical
D1. Please mark your gender !
Obligatory:YES
1. Male
2. Female
D2. How old are you?
Please indicate the number of completed years.
Obligatory:YES
1. .................................................................year old Numeric:YES Min:15-69
D3. Please indicate your place of residence.
Click on the down arrow to open the drop down menu. You can select your place
from the drop down list by scrolling it down or you can start to type the name.
Obligatory:YES
1.
D4a. Is your temporary address the same as your permanent one?
Obligatory:YES
1. yes
2. no

176
D4. Please specify the place where you live. Click on the down arrow to open the
drop down menu. You can select your place from the drop down list by scrolling it
down or you can start to type the name.
Displayed if: D4a == 2
Obligatory:YES
1.
D9. Please indicate your highest completed education.
Obligatory:YES
1. Non-completed primary school
2. Completed primary school
3. Completed vocational school
4. Final exams (completed secondary school)
5. Bachelor degree
6. Master degree
SZ1. Have you visited a national park for the past 12 months?
Obligatory:YES
1. Yes, in my country
2. Yes, abroad 3. No
SZ1_1!=1 --> exit, not suitable
D5. How would you describe the building you live in now?
Obligatory:YES
1. Housing estate
2. Multi-apartment buildings in green area
3. Multi-apartment buildings in non-green area
4. One-story semi-detached or family house
5. Multi-story semi-detached or family house
6. Farmhouse of traditional build
7. Homestead
8. Other, building for non-living purposes

177
D6. How would you describe the area you live in now?
Obligatory:YES
1. Urban type (with traditional buildings)
2. Housing estate
3. Villas area, or villa type apartment houses
4. Apartment blocks
5. Detached houses
6. Village type
7. Periphery
8. Other
D7. What is your status at your place of residence?
Obligatory:YES
1. Owner / Shareholder
2. Relative of the owner
3. Tenant
4. Other
D8. Childhood place of residence until the age of 14.
If the place where you grown up had been upgraded since then, please indicate
initial category. If you are uncertain, please mark the answer ‘I do not know’.
Obligatory:YES
1. Budapest
2. County seat
3. City
4. Village
5. I do not know

178
D10. What do you do for a living?
Obligatory:YES
1. Director or top manager with staff of 6 or more
2. Director or top manager with staff of 5 or less
3. Self-employed
4. Employee
5. Middle management or other management function with staff of 6 or more
6. Middle management or other management function with staff of 5 or less
7. Company owner (stakeholder), entrepreneur with staff of 6 or more
8. Company owner (stakeholder), entrepreneur with staff of 5 or less
9. Office employee
10. Work involves travelling or service, not physical or intellectual worker
11. Farmer, fisherman
12. Qualified skilled worker, foreman
13. Non-skilled physical worker, household support staff
14. Housewife
15. Student
16. Pensioner, retired
17. Unemployed
D11. What is your family status?
Obligatory:YES
1. Single
2. In a relationship but living separately
3. Married or in a partnership
4. Divorced
5. Widow
D12. How many people live permanently in the household including yourself?
Obligatory:YES
1. 1 personDisplayed if: D11==1||D11==2||D11==4||D11==5
2. 2 persons
3. 3 persons
4. 4 persons
5. 5 persons or more
D13. Please specify the number of children under 14 in your household:
Displayed if: D12 == 2 || D12 == 3 || D12 == 4 || D12 == 5

179
Obligatory:YES
1. .................................................................persons Numeric:YES Min:0 Max:15
D14. Number of children between 14-18 in your household:
Displayed if: D12 == 2 || D12 == 3 || D12 == 4 || D12 == 5
Obligatory:YES
1. .................................................................persons Numeric:YES Min:0 Max:15
D15. Which category applies to you based on the monthly net income of the whole
household?
Obligatory:YES
1. under 80,000 HUF
2. 80,000 HUF- 100,000 HUF
3. 100,001 HUF- 150,000 HUF
4. 150,001 HUF- 200,000 HUF
5. 200,001 HUF- 250,000 HUF
6. 250,001 HUF- 300,000 HUF
7. 300,001 HUF- 350,000 HUF
8. 350,001 HUF- 400,000 HUF
9. 400,001 HUF- 450,000 HUF
10. 450.001 HUF - 500.000 HUF
11. 500.000 HUF -
99. I do not know/ respond
K1. How would you describe the surroundings of your place of residence?
Obligatory: YES
Interval:0-10; Min: far from nature; Max: close to nature, Min value displayed: YES; Max value displayed: YES; Initial value:5; Values displayed: YES; Values:0,1,2,3,4,5,6,7,8,9,10; Values displayed: YES
K2. How long have you been living at your place of residence?
Please mark zero if you have been living at your place of residence
for less than a year.
Obligatory: YES
1. .................................................................years ago Numeric: YES Min:0 Max:69

180
K3. Please indicate your level of agreement with the following statements
regarding your place of residence.
By living surroundings we mean the surrounding area of your place of residence,
places within 10-minute walking distance, eg. : streets, parks, stores, pubs, clubs
etc.
Please give you score by using a 5-point scale where 1 means
“completely disagree” and 5 means “fully agree”.
Obligatory:YES RANDOM
1. -
completel
y disagree
2 3 4 5- fully
agree
For the recreation
activities I enjoy the
most, the settings and
facilities provided by the
surrounding area of my
place of residence are the
best.
1 2 3 4 5
The surrounding area of
my place of residence
means a lot to me. 1 2 3 4 5
I feel that the
surrounding area of my
place of residence is a
part of me.
1 2 3 4 5
My friends/family would
be disappointed if I were
to move to an area of
other settings and
facilities.
1 2 3 4 5
For what I like to do, I
could not imagine
anything better than the
setting and facilities
provided by the
surrounding area of my
place of residence
1 2 3 4 5
I am very attached to the
surrounding area of my
place of residence. 1 2 3 4 5
I identify strongly with
the region of my place of
residence. 1 2 3 4 5

181
If I were to stop visiting
places around my place
of residence, I would
lose contact with a
number of friends
1 2 3 4 5
I feel a strong sense of
belonging to my place of
residence and its
settings/facilities.
1 2 3 4 5
Living here says a lot
about who I am. 1 2 3 4 5
Many of my
friends/family prefer the
surroundings of my
place of residence over
many other parks
1 2 3 4 5
I enjoy my place of
residence and its
environment more than
any other places.
1 2 3 4 5
K4. Please specify how often did you carry out the following activities during the
past 12 months? Choose ”Not relevant” option if you can not answer. (Eg.: for
questions “I saved fuel”, if you do not own a car.)
Obligatory: YES
never someti
mes
occasion
ally often always Not relevant
Looked for ways to
reuse things 1 2 3 4 5 99
Recycled
newspapers 1 2 3 4 5 99
Recycles cans or
bottles 1 2 3 4 5 99
Encouraged friends
or family to recycle 1 2 3 4 5 99
Purchased products
in reusable or
recyclable
containers
1 2 3 4 5 99
Picked up litter that
was not your own 1 2 3 4 5 99
Composted food
scraps 1 2 3 4 5 99

182
Conserved gasoline
by walking or
bicycling 1 2 3 4 5 99
Written a letter
supporting an
environmental issues 1 2 3 4 5 99
Voted for a
candidate who
supported
environmental issues
1 2 3 4 5 99
K5. Have you donated for initiatives to address environmental issues?
(eg.: On-line donation, offering of 1% of income tax)
1. yes
2. no
K6. Please mark which items are true of you.
Please give you score by using a 7-point scale where 1 means “Not at
all true of me” and 7 means “ Very true of me”.
Obligatory:YES
1-not at all
true of me 2 3 4 5 6
7-
completel
y true of
me
I spend a lot of
time in natural
settings (woods,
mountains,
desert,
lakes, ocean).
1 2 3 4 5 6 7
I think of myself
as a part of
nature,
not separate
from it.
1 2 3 4 5 6 7
If I had enough
time or money, I
would certainly
devote some of it
to working for
environmental
causes.
1 2 3 4 5 6 7

183
If I am upset or
stressed I can
feel better by
spending some
time outdoors
“communing
with nature.”
1 2 3 4 5 6 7
I feel that I have
a lot in common
with other
species.
1 2 3 4 5 6 7
Behaving
responsibly
toward the
Earth-living a
sustainable
lifestyle-is part
of my moral
code.
1 2 3 4 5 6 7
Learning about
the natural world
should be an
important part of
every
child’s
upbringing
1 2 3 4 5 6 7
I’d rather live in
a small room or
house with a
nice view than in
a bigger room or
house facing
other buildings.
1 2 3 4 5 6 7
I would feel that
an important part
of my life was
missing if I was
not able to get
out and enjoy
nature from
time to time
1 2 3 4 5 6 7

184
I have never
seen a work of
art that
is as beautiful as
a work of nature,
like a sunset or a
mountain range
1 2 3 4 5 6 7
I feel that I
receive spiritual
sustenance from
experiences with
nature.
1 2 3 4 5 6 7
The following questions will refer to visitations to protected natural areas, more
closely to national parks.
K7. Describe you habit of visitation to national parks!
Please give you score by using a 5-point scale where 1 means “not at
all true of me” and 5 means “ completely true of me”.
Obligatory:YES
1-not at
all true of
me
2 3 4 5-completely
true of me
Visitations to domestic
national parks 1 2 3 4 5
Visitations to national parks
abroad 1 2 3 4 5
How often do you visit the following domestic national parks? Page images:
L:\Corvinus\2015 \Questionnaire\terkep.png
K8. Please give you score by using a 5-point scale
Obligatory:YES
never sometimes occasion
ally often often
Hortobágy National Park 1 2 3 4 5
Kiskunság National Park 1 2 3 4 5
Bükk National Park 1 2 3 4 5
Aggtelek National Park 1 2 3 4 5
Fertő-Hanság National Park 1 2 3 4 5
Duna-Dráva National Park 1 2 3 4 5
Körös-Maros National Park 1 2 3 4 5

185
Balatoni-felvidék National
Park 1 2 3 4 5
Duna-Ipoly National Park 1 2 3 4 5
Őrség National Park 1 2 3 4 5
K9. Please mark the national park you visited during the past 12 months.
MULTIPLE ANSWERS ARE ALLOWED
Displayed if: SZ1_1
Obligatory:YES
Images of the question:
L:\Corvinus\2015\06_Aninosza\Questionnaire\terkep.png
1. Hortobágy National Park Displayed if: K8_1==2||K8_1==3||K8_1==4||K8_1==5
2. Kiskunság National Park Displayed if: K8_2==2||K8_2==3||K8_2==4||K8_2==5
3. Bükk National Park Displayed if: K8_3==2||K8_3==3||K8_3==4||K8_3==5
4. Aggtelek National Park Displayed if: K8_4==2||K8_4==3||K8_4==4||K8_4==5
5. Fertő-Hanság National Park Displayed if: K8_5==2||K8_5==3||K8_5==4||K8_5==5
6. Duna-Dráva National Park Displayed if: K8_6==2||K8_6==3||K8_6==4||K8_6==5
7. Körös-Maros National Park Displayed if: K8_7==2||K8_7==3||K8_7==4||K8_7==5
8. Balatoni-felvidék National Park Displayed if: K8_8==2||K8_8==3||K8_8==4||K8_8==5
9. Duna-Ipoly National Park Displayed if: K8_9==2||K8_9==3||K8_9==4||K8_9==5
10. Őrség National Park Displayed if: K8_10==2||K8_10==3||K8_10==4||K8_10==5

186
K10. Please mark the national park you visited during the past 12 months and
which you liked the best
Obligatory:YES
1. Hortobágy National Park Displayed if: K9_1
2. Kiskunság National Park Displayed if: K9_2
3. Bükk National Park Displayed if: K9_3
4. Aggtelek National Park Displayed if: K9_4
5. Fertő-Hanság National Park Displayed if: K9_5
6. Duna-Dráva National Park Displayed if: K9_6
7. Körös-Maros National Park Displayed if: K9_7
8. Balatoni-felvidék National Park Displayed if: K9_8
9. Duna-Ipoly National Park Displayed if: K9_9
10. Őrség National Park Displayed if: K9_10
K11. When did you last visit <K10a> National Park?
1. June 2014
2. July 2014
3. August 2014
4. September 2014
5. October 2014
6. November 2014
7. December 2014
8. January 2015
9. February 2015
10. March 2015
11. April 2015
12. May 2015
13. June 2015
K12. There are no good or bad answers to the following questions, we are
interested in your level of agreement with the following items concerning <K10a>
National Park Please give you score by using a 5-point scale where 1 means
“completely disagree” and 5 means “fully agree”.
Obligatory:YES RANDOM
1. -
completel
y disagree
2 3 4 5- fully
agree
For the recreation activities I
enjoy the most, the settings
and facilities provided by this
National Park are the best.
1 2 3 4 5

187
This National Park means a lot
to me. 1 2 3 4 5
I feel this National Park is a
part of me. 1 2 3 4 5
If I were to stop visiting this
park, I would lose contact with
a number of friends. 1 2 3 4 5
I am very attached to this park. 1 2 3 4 5
I identify strongly with this
park. 1 2 3 4 5
My fiends/family would be
disappointed if I were to start
to visiting other settings and
facilities.
1 2 3 4 5
For what I like to do, I could
not imagine anything better
than the setting and facilities
provided by this National Park.
1 2 3 4 5
I feel a strong sense of
belonging to this National Park
and its settings/facilities. 1 2 3 4 5
Visiting this National Park
says a lot about who I am. 1 2 3 4 5
Many of my friends/family
prefer this National Park over
many other parks. 1 2 3 4 5
I enjoy visiting this National
Park and its environment more
than any other parks. 1 2 3 4 5
K13. Please continue to think of <K10a> national park! We are interested in your
habits relating to the following activities.
Did you carry out such activity during your last visit or later?
Obligatory:YES RANDOM
yes no
Picked up litter at this National Park left by other
visitors. 1 2
Told my friends not to feed the animals in this
National Park or similar parks. 1 2
Signed petitions in support of XXX National Park
and similar protected areas. 1 2
Learnt more about XXX National Park’s natural
environment. 1 2
Wrote letters in support of XX Park 1 2

188
Volunteered my time to projects that help this
national park or similar parks and nature areas. 1 2
Encouraged others to reduce their waste and picked
up their litter when they are at this National Park. 1 2
Participated in a public meeting about managing of
XXX National Park. 1 2
Paid increased fees if they were introduced and
used for park programs 1 2
Volunteered to stop visiting a favorite spot in XXX
Park if it needs recover from environmental
damage. 1 2
Volunteered to reduce my use of a favorite spot in
XXX Park if it needs recover from environmental
damage. 1 2
Contributed donations to ensure protection of places
like XXX Park. 1 2
K13b. Please continue to think of <K10a> national park!
How likely would you carry out such activity during your next visit?
Please give you score by using a 5-point scale where 1 means “highly
unlikely” and 5 means “highly likely”.
Obligatory:YES RANDOM
1-highly
unlikely 2 3 4
5-highly
likely
Pick up litter at this National
Park left by other visitors. 1 2 3 4 5
Tell my friends not to feed
the animals in this National
Park or similar parks. 1 2 3 4 5
Sign petitions in support of
XXX National Park and
similar protected area. 1 2 3 4 5
Learn more about XXX
National Park natural
environment. 1 2 3 4 5
Write letters in support of
XXX National Park. 1 2 3 4 5
Volunteer my time to
projects that help XXX
National Park or similar
parks and nature areas
1 2 3 4 5
Encourage others to reduce
their waste and pick up their
litter when they are at XXX
National Park.
1 2 3 4 5

189
Participate in a public
meeting about managing
XXX National Park. 1 2 3 4 5
Pay increased fees if they
were introduced and used
for park programs. 1 2 3 4 5
Volunteer to stop visiting a
favorite spot in XXX
National Park if it needs
recover from environmental
damage.
1 2 3 4 5
Volunteer to reduce my use
of a favorite spot in XXX
National Park if it needs
recover from environmental
damage.
1 2 3 4 5
Contribute donations to
ensure protection of places
like XXX National Park. 1 2 3 4 5
K14. Please specify the distance between <K10a> national park and your place of
residence?
1. within 40 km
2. 40-150 km
3. 151-250 km
4. over 250 km
5. I do not know
K15. How often do you visit <K10a> National Park?
Please choose the option below best describing your habit!
Obligatory:YES
1. Less than once every 3 years
2. Once every three years
3. Once a year
4. Few times a year
5. At least once a month
6. I do not know
K16. When did you first visit <K10a> National Park?
Put zero if it was your first visit.
Obligatory:YES
1. .................................................................years ago Numeric:YES Min:0 Max:69

190
Describe you habit of visitation to national parks until the age of 14!
K17a. Visitation to <K10a> national park until the age of 14 Please give you score by using a 5-point scale where 1 means “not at
all true of me” and 5 means “ completely true of me”.
Obligatory:YES
1-not at
all true of
me
2 3 4
5-
completely
true of me
1 2 3 4 5
K17b. Visitation to national parks until the age of 14 in general
Obligatory:YES
1-not at
all true of
me
2 3 4 5-completely
true of me
1 2 3 4 5
K18. Now, please recall again your last visitation to <K10a> National Park!
Which of the below options describe you the best?
1. Day visitor, staying at home
2. Day visitor, staying with 40 km
3. Day visitor, passing through to another destination
4. Multiple day visitor, staying with 40 km
5. Other:................................................................. Length:50
K19. With how many visitors did you last visit <K10a> National Park?
1. .................................................................adult Numeric:YES Min:0 Max:100
2. .................................................................children Numeric:YES Min:0 Max:100
Annex 12: Validated scale of Ramkissoon et al. (12 items, 4 sub-dimensions)
Source: Based on the findings of Ramkissoon et al. (2013)
Sub-dimensions Items
Place dependence
PD1 For the recreation activities I enjoy the most, the settings and facilities provided
by this National Park are the best.
PD2 For what I like to do, I could not imagine anything better than the setting and
facilities provided by this National Park.
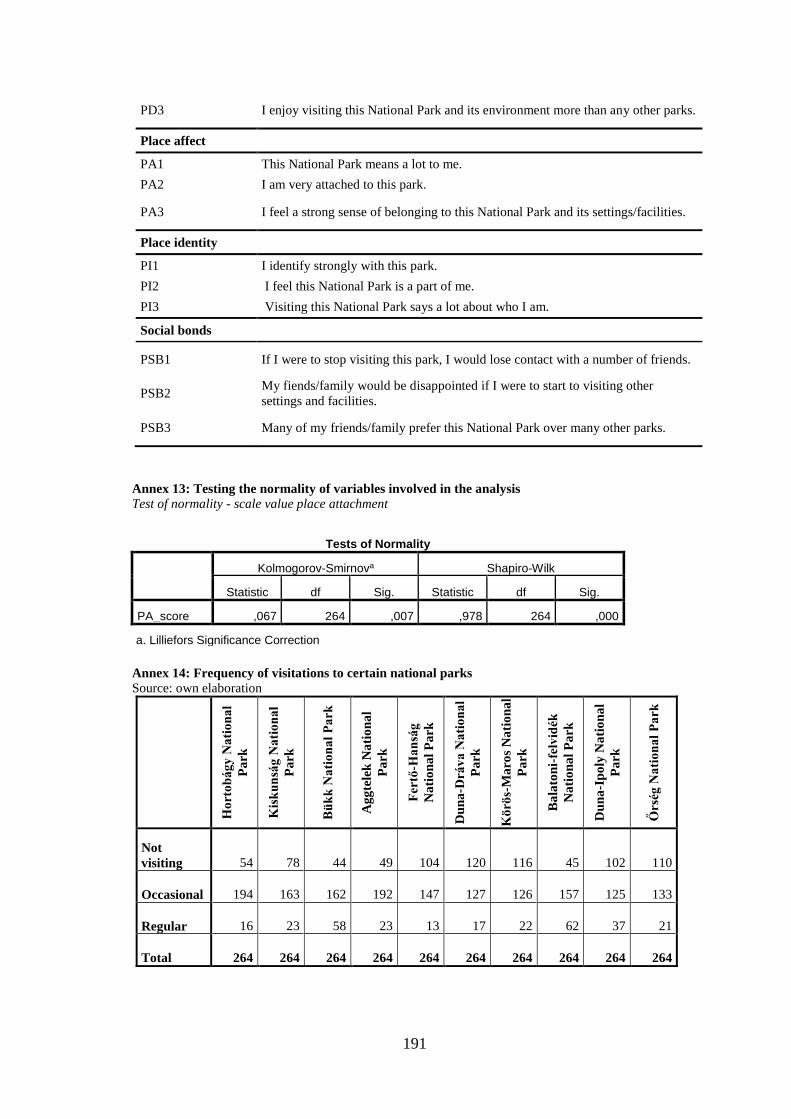
191
PD3 I enjoy visiting this National Park and its environment more than any other parks.
Place affect
PA1 This National Park means a lot to me.
PA2 I am very attached to this park.
PA3 I feel a strong sense of belonging to this National Park and its settings/facilities.
Place identity
PI1 I identify strongly with this park.
PI2 I feel this National Park is a part of me.
PI3 Visiting this National Park says a lot about who I am.
Social bonds
PSB1 If I were to stop visiting this park, I would lose contact with a number of friends.
PSB2 My fiends/family would be disappointed if I were to start to visiting other
settings and facilities.
PSB3 Many of my friends/family prefer this National Park over many other parks.
Annex 13: Testing the normality of variables involved in the analysis
Test of normality - scale value place attachment
Tests of Normality
Kolmogorov-Smirnova Shapiro-Wilk
Statistic df Sig. Statistic df Sig.
PA_score ,067 264 ,007 ,978 264 ,000
a. Lilliefors Significance Correction
Annex 14: Frequency of visitations to certain national parks
Source: own elaboration
Ho
rto
bá
gy
Na
tio
na
l
Pa
rk
Kis
ku
nsá
g N
ati
on
al
Pa
rk
Bü
kk
Na
tio
na
l P
ark
Ag
gte
lek
Na
tio
na
l
Pa
rk
Fer
tő-H
an
ság
Na
tio
na
l P
ark
Du
na
-Drá
va
Na
tio
na
l
Pa
rk
Kö
rös-
Ma
ros
Na
tio
na
l
Pa
rk
Ba
lato
ni-
felv
idék
Na
tio
na
l P
ark
Du
na
-Ip
oly
Na
tio
na
l
Pa
rk
Őrs
ég N
ati
on
al
Pa
rk
Not
visiting 54 78 44 49 104 120 116 45 102 110
Occasional 194 163 162 192 147 127 126 157 125 133
Regular 16 23 58 23 13 17 22 62 37 21
Total 264 264 264 264 264 264 264 264 264 264

192
Annex 15: Place of residence and national park specific descriptive statistics of place attachment
Source: own elaboration
Items relating to the place of residence
Average
for the
place of
residence
Standard
deviation
Average
for the
national
park
Standard
deviation
For the recreation activities I enjoy the most,
the settings and facilities provided by the
surrounding area of my place of residence are
the best.
2.84 1.090 2.82 1.125
The surrounding area of my place of residence
means a lot to me. 3.69 1.054 3.57 1.051
I feel that the surrounding area of my place of
residence is a part of me. 3.67 1.107 2.98 1.270
My friends/family would be disappointed if I
were to move to an area of other settings and
facilities.
2.82 1.254 2.07 1.116
For what I like to do, I could not imagine
anything better than the setting and facilities
provided by the surrounding area of my place
of residence.
3.06 1.191 2.85 1.126
I am very attached to the surrounding area of
my place of residence. 3.46 1.179 3.26 1.218
I identify strongly with the region of my place
of residence. 3.30 1.162 3.08 1.270
If I were to stop visiting places around my
place of residence, I would lose contact with a
number of friends.
2.45 1.250 1.92 1.139
I feel a strong sense of belonging to my place
of residence and its settings/facilities. 3.40 1.115 2.92 1.258
Living here says a lot about who I am. 2.95 1.307 2.85 1.226
Many of my friends/family prefer the
surroundings of my place of residence over
many other parks.
3.04 1.121 2.66 1.229
I enjoy my place of residence and its
environment more than any other places. 2.89 1.104 3.03 1.147
Annex 16: Averages and variations of residential pro-environmental behaviour
Source: own elaboration
Average
Standard
deviation N
Recycled newspapers 4.23 1.116 213
Recycles cans or bottles 4.08 1.121 213
Looked for ways to reuse things 3.82 ,926 213
Conserved gasoline by walking or bicycling 3.52 1.164 213
Purchased products in reusable or recyclable containers 3.39 ,902 213
Encouraged friends or family to recycle 3.32 1.187 213
Picked up litter that was not your own 3.23 1.026 213
Voted for a candidate who supported environmental issues 3.10 1.406 213
Composted food scraps 2.77 1.503 213
Written a letter supporting an environmental issues 2.21 1.242 213

193
Annex 17: Examination of the variance homogeneity and normality of place attachment
Source: own elaboration
PA_score
Levene Statistic df1 df2 Sig.
,866 4 245 ,485
Tests of Normality
Kolmogorov-Smirnova Shapiro-Wilk
Statistic df Sig. Statistic df Sig.
PA_score ,067 264 ,007 ,978 264 ,000
a. Lilliefors Significance Correction
Annex 18: Tables of one-way analysis of variance
Source: own elaboration
Pro-environmental behaviour in national parks, differences by age groups
Multiple Comparisons
Dependent Variable: PBI_Score
Tukey HSD
ANOVA
PBI_Score
Sum of
Squares df Mean
Square F Sig.
Between Groups 346.871 4 86.718 12.904 ,000
Within Groups 1740.569 259 6.720
Total 2087.439 263

194
Age category (I)
Mean Difference
(I-J) Std. Error Sig.
95% Confidence Interval
Lower Bound
Upper Bound
15-29 30-39 1.10096 ,63125 ,409 -,6332 2.8351
40-49 ,63105 ,61881 ,846 -1.0689 2.3310
50-59 ,20513 ,63125 ,998 -1.5290 1.9392
60-69 -1.77972* ,57866 ,020 -3.3693 -,1901
30-39 15-29 -1.10096 ,63125 ,409 -2.8351 ,6332
40-49 -,46991 ,51425 ,891 -1.8826 ,9428
50-59 -,89583 ,52916 ,440 -2.3495 ,5578
60-69 -2.88068* ,46516 ,000 -4.1585 -1.6028
40-49 15-29 -,63105 ,61881 ,846 -2.3310 1.0689
30-39 ,46991 ,51425 ,891 -,9428 1.8826
50-59 -,42593 ,51425 ,922 -1.8386 ,9868
60-69 -2.41077* ,44813 ,000 -3.6418 -1.1797
50-59 15-29 -,20513 ,63125 ,998 -1.9392 1.5290
30-39 ,89583 ,52916 ,440 -,5578 2.3495
40-49 ,42593 ,51425 ,922 -,9868 1.8386
60-69 -1.98485* ,46516 ,000 -3.2627 -,7070
60-69 15-29 1.77972* ,57866 ,020 ,1901 3.3693
30-39 2.88068* ,46516 ,000 1.6028 4.1585
40-49 2.41077* ,44813 ,000 1.1797 3.6418
50-59 1.98485* ,46516 ,000 ,7070 3.2627
*. The mean difference is significant at the 0.05 level.
Model Goodness of Fit
R R Squared
PBI_Score by age category ,408 ,166
Pro-environmental behaviour in a national park, differences by income
ANOVA
K13_Score
Sum of
Squares df Mean
Square F Sig.
Between Groups 136.836 4 34.209 4.453 ,002
Within Groups 1474.981 192 7.682
Total 1611.817 196
Multiple Comparisons
Dependent Variable: PBI_Score
Tukey HSD
(I) Income Std. Error Sig.
95% Confidence Interval

195
Mean Difference
(I-J) Lower Bound
Upper Bound
under HUF 100,000
HUF 100,000 - 200,000 ,09384 ,65192 1.000 -1.7015 1.8891
HUF 200,001 - 300,000 -,01752 ,64754 1.000 -1.8008 1.7657
HUF 300,001 - 400,000 1.87143 ,70275 ,063 -,0639 3.8067
above HUF 400,000 1.70952 ,72831 ,135 -,2962 3.7152
HUF 100,000 - 200,000
under HUF 100,000 -,09384 ,65192 1.000 -1.8891 1.7015
HUF 200,001 - 300,000 -,11136 ,54367 1.000 -1.6086 1.3858
HUF 300,001 - 400,000 1.77759* ,60838 ,032 ,1022 3.4530
above HUF 400,000 1.61569 ,63773 ,088 -,1406 3.3719
HUF 200,001 - 300,000
under HUF 100,000 ,01752 ,64754 1.000 -1.7657 1.8008
HUF 100,000 - 200,000 ,11136 ,54367 1.000 -1.3858 1.6086
HUF 300,001 - 400,000 1.88895* ,60369 ,017 ,2265 3.5514
above HUF 400,000 1.72704 ,63326 ,054 -,0169 3.4710
HUF 300,001 - 400,000
under HUF 100,000 -1.87143 ,70275 ,063 -3.8067 ,0639
HUF 100,000 - 200,000 -1.77759* ,60838 ,032 -3.4530 -,1022
HUF 200,001 - 300,000 -1.88895* ,60369 ,017 -3.5514 -,2265
above HUF 400,000 -,16190 ,68961 ,999 -2.0610 1.7372
above HUF 400,000
under HUF 100,000 -1.70952 ,72831 ,135 -3.7152 ,2962
HUF 100,000 - 200,000 -1.61569 ,63773 ,088 -3.3719 ,1406
HUF 200,001 - 300,000 -1.72704 ,63326 ,054 -3.4710 ,0169
HUF 300,001 - 400,000 ,16190 ,68961 ,999 -1.7372 2.0610
*. The mean difference is significant at the 0.05 level.
Model Goodness of Fit
R R Squared
PBI by D15a ,291 ,085
Pro-environmental behaviour in a national park, differences by regions
ANOVA
PBI_Score
Sum of
Squares df Mean
Square F Sig.
Between Groups 54.413 2 27.206 3.493 ,032
Within Groups 2033.026 261 7.789
Total 2087.439 263
Multiple Comparisons
Dependent Variable: PBI_Score

196
Tukey HSD
(I) Region of residence - 3 groups
Mean Difference
(I-J) Std. Error Sig.
95% Confidence Interval
Lower Bound
Upper Bound
Middle East -1.01132* ,41334 ,040 -1.9856 -,0370
West -,20000 ,44411 ,894 -1.2468 ,8468
East Middle 1.01132* ,41334 ,040 ,0370 1.9856
West ,81132 ,41635 ,127 -,1701 1.7927
West Middle ,20000 ,44411 ,894 -,8468 1.2468
East -,81132 ,41635 ,127 -1.7927 ,1701
*. The mean difference is significant at the 0.05 level.
Model Goodness of Fit
R R Squared
PBI_Score by Region of residence - 3 groups
,161 ,026
Pro-environmental behaviour in a national park, differences by the variable related to the presence of
children under 14 in a household
ANOVAa
Hierarchical Method
Sum of Squares df
Mean Square F Sig.
PBI_Score Main Effects
D13a 76.870 1 76.870 10.017 ,002
Model
76.870 1 76.870 10.017 ,002
Residual 2010.570 262 7.674
Total 2087.439 263 7.937
a. K13_Score by D13a
Model Goodness of Fit
R R
Squared
K13_Score by D13a ,192 ,037

197
Place attachment to the national parks, breakdown by age
ANOVA
PA_score
Sum of Squares df
Mean Square F Sig.
Between Groups 1406.321 4 351.580 3.131 ,015
Within Groups 29080.584 259 112.280
Total 30486.905 263
Tukey HSD
Age category (I)
Mean Difference
(I-J) Std. Error Sig.
95% Confidence Interval
Lower Bound
Upper Bound
15-29 30-39 ,05449 2.58024 1.000 -7.0337 7.1426
40-49 -,50570 2.52937 1.000 -7.4541 6.4427
50-59 ,32532 2.58024 1.000 -6.7628 7.4135
60-69 -4.91521 2.36524 ,233 -11.4128 1.5823
30-39 15-29 -,05449 2.58024 1.000 -7.1426 7.0337
40-49 -,56019 2,10201 ,999 -6.3346 5.2142
50-59 ,27083 2.16295 1.000 -5.6710 6.2127
60-69 -4.96970 1.90134 ,071 -10.1928 ,2535
40-49 15-29 ,50570 2.52937 1.000 -6.4427 7.4541
30-39 ,56019 2,10201 ,999 -5.2142 6.3346
50-59 ,83102 2,10201 ,995 -4.9434 6.6054
60-69 -4.40951 1.83171 ,117 -9.4414 ,6224
50-59 15-29 -,32532 2.58024 1.000 -7.4135 6.7628
30-39 -,27083 2.16295 1.000 -6.2127 5.6710
40-49 -,83102 2,10201 ,995 -6.6054 4.9434
60-69 -5.24053* 1.90134 ,049 -10.4637 ,0174
60-69 15-29 4.91521 2.36524 ,233 -1.5823 11.4128
30-39 4.96970 1.90134 ,071 -,2535 10.1928
40-49 4.40951 1.83171 ,117 -,6224 9.4414
50-59 5.24053* 1.90134 ,049 ,0174 10.4637
Model Goodness of Fit
R R
Squared
PBI_Score by age category ,215 ,046

198
Place attachment to the national parks, breakdown by region
ANOVA
PA_score
Sum of Squares df
Mean Square F Sig.
Between Groups 2299.947 4 574.987 5.543 ,000
Within Groups 19916.053 192 103.729
Total 22216.000 196
ANOVA
PA_score
Sum of Squares df
Mean Square F Sig.
Between Groups 1381.686 2 690.843 6.195 ,002
Within Groups 29105.219 261 111.514
Total 30486.905 263
Dependent Variable: Place attachment_score
Tukey HSD
(I) Region of residence - 3 groups
Mean Difference
(I-J) Std. Error Sig.
95% Confidence Interval
Lower Bound
Upper Bound
Middle East -4.40189* 1.56395 ,014 -8.0884 -,7154
West ,50256 1.68036 ,952 -3.4583 4.4634
East Middle 4.40189* 1.56395 ,014 ,7154 8.0884
West 4.90445* 1.57534 ,006 1.1911 8.6178
West Middle -,50256 1.68036 ,952 -4.4634 3.4583
East -4.90445* 1.57534 ,006 -8.6178 -1.1911
*. The mean difference is significant at the 0.05 level.
Model Goodness of Fit
R R
Squared
PA_Score by Region of residence - 3 groups
,213 ,045

199
Place attachment to the national parks, breakdown by income
ANOVA
PA_score
Sum of Squares df
Mean Square F Sig.
Between Groups 2299.947 4 574.987 5.543 ,000
Within Groups 19916.053 192 103.729
Total 22216.000 196
Multiple Comparisons
Tukey HSD
(I) Income
Mean Difference
(I-J) Std. Error Sig.
95% Confidence Interval
Lower Bound
Upper Bound
under HUF 100,000 HUF 100,000 - 200,000 ,60014 2.39552 ,999 -5.9968 7.1971
HUF 200,001 - 300,000 2.88612 2.37945 ,744 -3.6666 9.4388
HUF 300,001 - 400,000 8.19286* 2.58231 ,015 1.0815 15.3042
above HUF 400,000 8.47857* 2.67624 ,015 1.1085 15.8486
HUF 100,000 - 200,000
under HUF 100,000 -,60014 2.39552 ,999 -7.1971 5.9968
HUF 200,001 - 300,000 2.28598 1.99777 ,783 -3.2156 7.7876
HUF 300,001 - 400,000 7.59272* 2.23553 ,007 1.4363 13.7491
above HUF 400,000 7.87843* 2.34341 ,008 1.4250 14.3319
HUF 200,001 - 300,000
under HUF 100,000 -2.88612 2.37945 ,744 -9.4388 3.6666
HUF 100,000 - 200,000 -2.28598 1.99777 ,783 -7.7876 3.2156
HUF 300,001 - 400,000 5.30674 2.21830 ,122 -,8022 11.4157
above HUF 400,000 5.59245 2.32697 ,119 -,8157 12.0006
HUF 300,001 - 400,000
under HUF 100,000 -8.19286* 2.58231 ,015 -15.3042 -1.0815
HUF 100,000 - 200,000 -7.59272* 2.23553 ,007 -13.7491 -1.4363
HUF 200,001 - 300,000 -5.30674 2.21830 ,122 -11.4157 ,8022
above HUF 400,000 ,28571 2.53404 1.000 -6.6927 7.2641
above HUF 400,000 under HUF 100,000 -8.47857* 2.67624 ,015 -15.8486 -1.1085
HUF 100,000 - 200,000 -7.87843* 2.34341 ,008 -14.3319 -1.4250
HUF 200,001 - 300,000 -5.59245 2.32697 ,119 -12.0006 ,8157
HUF 300,001 - 400,000 -,28571 2.53404 1.000 -7.2641 6.6927
Model Goodness of Fit
R R Squared
Place attachment_score by Income
,322 ,104

200
Place attachment to the park, breakdown by frequency of visitations
ANOVAa
Hierarchical Method
Sum of Squares df
Mean Square F Sig.
PA_score Main Effects
How often do you visit <K10a> National Park? 3954.629 4 988.657 10.008 ,000
Model 3954.629 4 988.657 10.008 ,000
Residual 24202.507 245 98.786
Total 28157.136 249 113.081
a.PA_score How often do you visit <K10a> National Park?
Model Goodness of Fit
R R Squared
PA_score How often do you visit <K10a> National Park?
,375 ,140
Place attachment to the park, breakdown by locality
ANOVAa
Hierarchical Method
Sum of Squares df
Mean Square F Sig.
PA_score Main Effects
Local/non-local 665.229 1 665.229 5.857 ,016
Model 665.229 1 665.229 5.857 ,016
Residual 29076.465 256 113.580
Total 29741.694 257 115.726
a.PA_score by Local/non-local
Model Goodness of Fit
R R Squared
PA_score by Local/non-local
,150 ,022

201
Place attachment to the park, breakdown by the variable related to the visitations to the given national
park under the age of 14
ANOVAa
Hierarchical Method
Sum of Squares df
Mean Square F Sig.
PA_score Main Effects
K17akat 1023.998 2 511.999 4.536 ,012
Model 1023.998 2 511.999 4.536 ,012
Residual 29462.907 261 112.885
Total 30486.905 263 115.920
Tukey HSD
(I) K17akat
Mean Differenc
e (I-J) Std. Error Sig.
95% Confidence Interval
Lower Bound
Upper Bound
Not representative Moderately representative -3.28009 1.87031 ,187 -7.6887 1.1285
Representative -4.52527* 1.62984 ,016 -8.3671 ,6835
Moderately representative Not representative 3.28009 1.87031 ,187 -1.1285 7.6887
Representative -1.24518 2.19147 ,837 -6.4108 3.9205
Representative Not representative 4.52527* 1.62984 ,016 ,6835 8.3671
Moderately representative 1.24518 2.19147 ,837 -3.9205 6.4108
*. The mean difference is significant at the 0.05 level.
Model Goodness of Fit
R R
Squared
PA_score by K17akat
,183 ,034

202
Place attachment to the park, breakdown by the variable related to the visitations to national parks in
general under the age of 14
ANOVAa
Hierarchical Method
Sum of Squares df
Mean Square F Sig.
PA_score Main Effects
K17bkat 844.790 2 422.395 3.719 ,026
Model 844.790 2 422.395 3.719 ,026
Residual 29642.115 261 113.571
Total 30486.905 263 115.920
Tukey HSD
(I) K17bkat
Mean Difference
(I-J) Std. Error Sig.
95% Confidence Interval
Lower Bound
Upper Bound
Not representative
Moderately representative -1.41560 1.56843 ,639 -5.1127 2.2815
Representative
-4.49988* 1.64991 ,019 -8.3890 ,6108
Moderately representative
Not representative 1.41560 1.56843 ,639 -2.2815 5.1127
Representative
-3.08428 1.86049 ,224 -7.4698 1.3012
Representative Not representative 4.49988* 1.64991 ,019 ,6108 8.3890
Moderately representative 3.08428 1.86049 ,224 -1.3012 7.4698
*. The mean difference is significant at the 0.05 level.
Model Goodness of Fit
R R
Squared
PA_score by K17bkat ,166 ,028

203
Place attachment to the park, breakdown by length of relationship with the national park
ANOVAa
Hierarchical Method
Sum of Squares df
Mean Square F Sig.
PA_score Main Effects
Categorized relationship 2348.662 5 469.732 4.307 ,001
Model 2348.662 5 469.732 4.307 ,001
Residual 28138.243 258 109.063
Total 30486.905 263 115.920
Tukey HSD
(I) Categorized relationship
Mean Difference
(I-J) Std. Error Sig.
95% Confidence Interval
Lower Bound
Upper Bound
first visit 1-5-year-relationship -8.24242 2.92194 ,057 -16.6321 ,1473
6-15-year-relationship -10.80303* 2.77696 ,002 -18.7764 -2.8296
16-25-year-relationship -9.79487* 2.85594 ,009 -17.9950 -1.5947
26-35-year-relationship -11.83333* 2.97583 ,001 -20.3777 -3.2889
35+ year-relationship -12.32222* 2.91250 ,000 -20.6848 -3.9597
1-5-year-relationship first visit 8.24242 2.92194 ,057 ,1473 16.6321
6-15-year-relationship -2.56061 2.03253 ,806 -8.3965 3.2753
16-25-year-relationship -1.55245 2.13917 ,979 -7.6946 4.5897
26-35-year-relationship -3.59091 2.29678 ,623 -10.1856 3,0038
35+ year-relationship -4.07980 2.21412 ,440 -10.4371 2.2775
6-15-year-relationship first visit 10.80303* 2.77696 ,002 2.8296 18.7764
1-5-year-relationship 2.56061 2.03253 ,806 -3.2753 8.3965
16-25-year-relationship 1.00816 1.93645 ,995 -4.5519 6.5682
26-35-year-relationship -1.03030 2.10925 ,997 -7.0865 5.0259
35+ year-relationship -1.51919 2.01893 ,975 -7.3161 4.2777
16-25-year-relationship first visit 9.79487* 2.85594 ,009 1.5947 17.9950
1-5-year-relationship 1.55245 2.13917 ,979 -4.5897 7.6946
6-15-year-relationship -1.00816 1.93645 ,995 -6.5682 4.5519
26-35-year-relationship -2.03846 2.21220 ,941 -8.3903 4.3134
35+ year-relationship -2.52735 2.12626 ,842 -8.6324 3.5777
26-35-year-relationship first visit 11.83333* 2.97583 ,001 3.2889 20.3777
1-5-year-relationship 3.59091 2.29678 ,623 -3.0038 10.1856
6-15-year-relationship 1.03030 2.10925 ,997 -5.0259 7.0865
16-25-year-relationship 2.03846 2.21220 ,941 -4.3134 8.3903
35+ year-relationship -,48889 2.28476 1.000 -7.0490 6.0713

204
35+ year-relationship first visit 12.32222* 2.91250 ,000 3.9597 20.6848
1-5-year-relationship 4.07980 2.21412 ,440 -2.2775 10.4371
6-15-year-relationship 1.51919 2.01893 ,975 -4.2777 7.3161
16-25-year-relationship 2.52735 2.12626 ,842 -3.5777 8.6324
26-35-year-relationship -,48889 2.28476 1.000 -6.0713 7.0490
*. The mean difference is significant at the 0.05 level.
Model Goodness of Fit
R R
Squared
PA_score by Categorized relationship ,278 ,077
Annex 19: Tables of two-way and multiple analysis of variance
Source: own elaboration
Place attachment to the park, breakdown by locality and frequency of visitations
ANOVAa
Hierarchical Method
Sum of Squares df
Mean Square F Sig.
PA_score Main Effects
(Combined) 4053.008 5 810.602 8.186
Local/non-local 754.200 1 754.200 7.616 ,006
How often do you visit <K10a> National Park?
3298.808 4 824.702 8.328 ,000
2-Way Interactions
Local/non-local * How often do you visit <K10a> National Park?
207.410 3 69.137 ,698 ,554
Model 4260.417 8 532.552 5.378 ,000
Residual 23766.603 240 99.028
Total 28027.020 248 113.012
Factor Summarya
Eta
Beta
Adjusted for
Factors
PA_score Local/non-local ,164 ,050
How often do you visit <K10a> National Park? ,378 ,404
a. PA_score by Local/non-local, How often do you visit <K10a> National Park?

205
Local/non-local
Total Local visitor
Non-local visitor
How often do you visit <K10a> National Park?
Less than once every 3 years
Count 0 19 19
% within How often do you visit <K10a> National Park? 0.0% 100.0% 100.0%
Once every three years
Count 2 25 27
% within How often do you visit <K10a> National Park? 7.4% 92.6% 100.0%
Once a year Count 9 53 62
% within How often do you visit <K10a> National Park? 14.5% 85.5% 100.0%
Few times a year
Count 44 59 103
% within How often do you visit <K10a> National Park? 42.7% 57.3% 100.0%
At least once a month
Count 32 3 35
% within How often do you visit <K10a> National Park? 91.4% 8.6% 100.0%
Total Count 87 159 246
% within How often do you visit <K10a> National Park? 35.4% 64.6% 100.0%
Model Goodness of Fit
R R
Squared
PA_score by Local/non-local, How often do you visit <K10a> National Park? ,380 ,145

206
Place attachment to the park, breakdown by length of the relationship with the national park and by age
ANOVAa
Hierarchical Method
Sum of Squares df
Mean Square F Sig.
PA_score Main Effects (Combined) 3839.037 9 426.560 4.265 ,000
Categorized relationship
2348.662 5 469.732 4.696 ,000
Age category 1490.375 4 372.594 3.725 ,006
2-Way Interactions
Categorized relationship * Age category
3143.027 19 165.422 1.654 ,045
Model 6982.064 28 249.359 2.493 ,000
Residual 23504.842 235 100.021
Total 30486.905 263 115.920
a. K12_score by Categorized relationship, Age category
Factor Summarya
Eta
Beta
Adjusted for Factors
PA_score Categorized relationship
,278 ,286
Age category ,215 ,223
a. PA_score by Categorized relationship, Age category
Model Goodness of Fit
R R Squared
PA_score by Categorized relationship, Age category
,355 ,126

207
Place attachment to the park, breakdown by relationship with the national park, by age and by
active/inactive status
ANOVAa,b
Hierarchical Method
Sum of Squares df
Mean Square F Sig.
K12_score Main Effects
(Combined) 3942.485 10 394.249 3.758 ,000
Categorized relationship 2348.662 5 469.732 4.477 ,001
Age category 1490.375 4 372.594 3.551 ,008
D10a 103.448 1 103.448 ,986 ,322
Model 3942.485 10 394.249 3.758 ,000
Residual 26544.420 253 104.919
Total 30486.905 263 115.920
Factor Summarya
Eta
Beta
Adjusted for Factors
K12_score Categorized relationship
,278 ,291
Age category ,215 ,179
D10a
,155 ,078
a. PA_score by Categorized relationship, Age category, D10a
Model Goodness of Fit
R R Squared
PA_score by Categorized relationship, Age category, D10a
,360 ,129

208
Place attachment to the park, breakdown by relationship with the national park, by age and by
active/inactive status
ANOVAa,b
Hierarchical Method
Sum of Squares df
Mean Square F Sig.
PA_score Main Effects
(Combined) 6931.047 17 407.709 5.077 ,000
How often do you visit <K10a> National Park? 3934.890 4 983.723 12.249 ,000
D15a 1749.490 4 437.372 5.446 ,000
Age category 649.227 4 162.307 2.021 ,094
Categorized relationship 597.439 5 119.488 1.488 ,196
Model 6931.047 17 407.709 5.077 ,000
Residual 13894.116 173 80.313
Total 20825.162 190 109.606
a. PA_score by How often do you visit <K10a> National Park?, D15a, Age Category, Categorised relationship
Factor Summarya
Eta
Beta
Adjusted for Factors
PA_score How often do you visit <K10a> National Park?
,435 ,355
D15a ,326 ,288
Age category ,216 ,201
Categorized relationship ,279 ,187
Model Goodness of Fit
R R Squared
PA_score by How often do you visit <K10a> National Park?, D15a, Age Category, Categorised relationship ,577 ,333

209
Annex 20: Exploratory factor analysis (EFA) results of park-specific pro-environmental
behavioural intentions
Factors
1 2
Volunteer to reduce my use of a favorite spot in XX Park if it needs recover from
environmental damage ,864 ,118
Volunteer to stop visiting a favorite spot in XX Park if it needs recover from
environmental damage ,848 ,109
Encourage others to reduce their waste and pick up their litter when they are at
XX Park ,737 ,340
Pick up litter at XX Park left by other visitors. ,646 ,316
Tell my friends not to feed the animals in this National Park or similar parks. ,637 ,474
Sign petitions in support of XX Park and similar protected area. ,486 ,474
Participate in a public meeting about managing XX Park ,111 ,793
Volunteer my time to projects that help XX Park or similar parks and nature
areas ,307 ,787
Write letters in support of XX Park
,121 ,783
Contribute donations to ensure protection of places like XX Park ,371 ,729
Pay increased fees if they were introduced and used for park programs ,500 ,560
Learn more about XX Park natural environment ,423 ,483

210
Annex 21: Initial confirmatory factor model

211
Initial confirmatory factor model with the first-order, four sub-dimension factor solution of place
attachment scale.