sustainable consumption and production in south … sustainable consumption and production in...
TRANSCRIPT
Sustainable consumption and production in Southeast Europe and Eastern Europe, Caucasus and Central Asia152
Waste
8 Waste
Facts and figures
• Total waste generation per capita in EECCA countries is high compared with other regions in the world. It is estimated at 14 tonnes per year compared with 4 tonnes in the EU. Per capita waste generation in 2004 ranged from 285 kg in Azerbaijan to over 18 tonnes in the Russian Federation.
• A substantial part of waste generated in the EECCA countries is hazardous. Between 400 and 500 million tonnes of hazardous waste are generated in the EECCA countries every year, constituting 12–18 % of total waste generation.
• The average rate of generation of municipal waste per capita in the EECCA and SEE countries is between 250 and 280 kilograms per year, and is lower than the average level of 550 kg per capita in EU.
• Limited progress has been achieved in recent years in reuse or recovery of resources in municipal waste. The situation is somewhat better for industrial waste.
• Almost none of the landfills operated in the EECCA and SEE countries have an installation for landfill gas collection. Methane collection reduces greenhouse gas emissions and has a considerable value under the Kyoto protocol. The economic returns generated could offset investments in methane collection and finance additional improvements in landfill operations or other waste management initiatives.
• In many cases municipal waste management systems have to undergo major modifications. Lessons could be learned from the experiences in the EU concerning more SCP-oriented waste management.
8.1 Introduction
Waste is generated by almost all economic activities: extraction of resources, production and manufacturing activities, distribution and transport, consumption or even management of the waste itself.
Waste has many impacts on the environment, including pollution of air, surface water bodies and groundwater. Moreover, valuable space is taken up by landfills and poor waste management causes risks to public health. Waste generation and disposal represent a loss of natural resources. Therefore, sound management of waste can
protect public health and the environment while at the same time reducing the demand for natural resources.
Better management of waste — by ensuring higher standards at waste facilities, more effective waste prevention initiatives and increasing reuse or recovery of resources in waste — can result in a considerable reduction of direct emissions into the environment. In addition, it also safeguards renewable and non-renewable resources. Reducing the amounts of waste generated across all economic activities, including production and consumption phases requires a holistic approach for which SCP is particularly suitable.
K Y RGYZSTAN
U K R A I N E
10°0°-10°
20°
20°
30°
30°
40°
40°
50°
50° 60°
60°
70°
70°
80° 90° 100° 110°
40°40°
50°50°
0 50 1000 1500 Km
Dnipropetrovsk
Tbilisi
G E O R G I A
Bishkek
BelgradeDnipropetrovsk
Bishkek
Tbilisi
BelgradeSERBIA
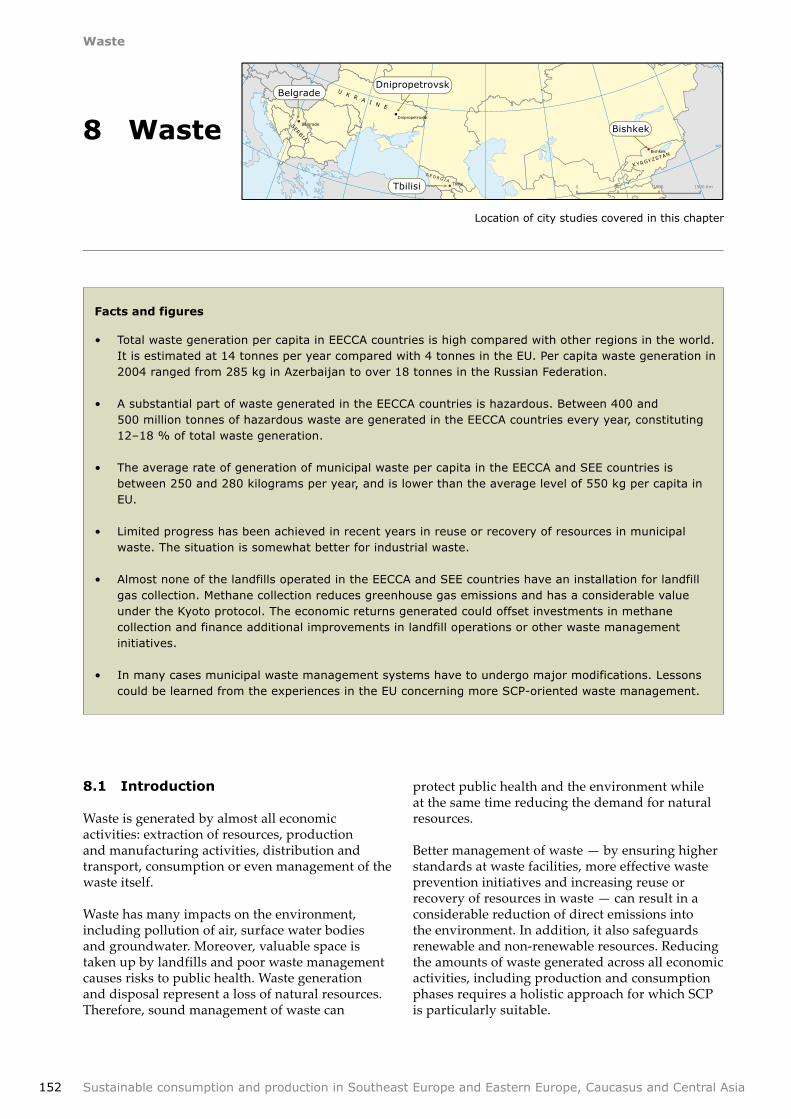
Location of city studies covered in this chapter
Waste
153Sustainable consumption and production in Southeast Europe and Eastern Europe, Caucasus and Central Asia
Objectives and approach
This chapter focuses primarily on the environmental pillar of sustainability. Economic and social issues related to waste remain an important concern and are also addressed where appropriate. The objectives of this chapter include:
1 Describing past trends and the present situation with respect to the generation and management of waste in the EECCA and SEE regions.
2 Assessing the status of municipal and hazardous waste management to present successes and failures of current practice and identify the main driving forces of development of waste management at the municipal level. Four major cities in SEE and EECCA are used as examples.
3 Determining the commonalities and differences among the countries which are currently making progress in waste management, and identifying opportunities for benchmarking and mutual learning.
Policies used in waste management — including waste prevention initiatives — are reviewed to demonstrate the opportunities that arise from the use of resources contained in waste, thus contributing to SCP.
Data used in this chapter are mainly drawn from a UN-led waste reporting study conducted in 2006, and complemented where appropriate with data from 'state of environment' reports published by individual countries. In general, information is presented at regional level, supplemented by more detailed examples at country level. However, it should be noted that the availability, quality and comparability of waste data are generally poor, and it has proved difficult to compile time series. Accurate data on the composition of industrial and manufacturing wastes were especially scarce.
The city studies were conducted for this report by local experts. They outline the situation and policy initiatives on waste in Belgrade (Serbia), Bishkek (Kyrgyzstan), Dnipropetrovsk (Ukraine) and Tbilisi (Georgia). These studies were carried out during the second half of 2006.
Radioactive waste is not dealt with in the chapter since its analysis demands a completely different approach.
8.2 Trends and the current situation
8.2.1 Legacy in waste management
In the centrally-planned economy of the former Soviet Union, waste management did not sit high on policy agenda. The Soviet Union generated large amounts of waste but failed to manage them in an appropriate manner. Significant amounts of radioactive waste, chemical weapons, toxic missile fuel and other hazardous waste were stored in mines and at industrial and military facilities. Almost all municipal waste was disposed of at poorly managed landfills or in city dumps which lacked basic sanitary and environmental provisions. Public awareness of waste issues was low, and there was no attempt to describe the cost of waste (Cherp and Mnatsakanian, 2003).
At the same time there were some positive aspects of the Soviet system with respect to waste management. Firstly, the generation of household and municipal waste and, especially, packaging waste was much lower than in most developed countries. Secondly, the rates of car ownership, and consequently the number of end-of-life waste vehicles, were also much lower. Thirdly, systems were in operation to recycle paper and ferrous metals as well as reuse glass bottles. Many materials were also reused and recycled in households.
The quantities of waste generated in EECCA decreased somewhat during the 1990s, although this was largely a result of the economic crisis rather than of an improved policy approach. Many of the existing reuse and recycling systems stopped functioning. Since the recycling industries no longer received sufficient quantities of materials and were not competitive in the newly opened international marketplace, many of these companies went out of business. After the break-up of the Soviet Union large amounts of waste no longer had 'an owner' and many industrial and military sites were abandoned with large stockpiles of hazardous waste.
Due to the economic recession and increasing decentralisation, most municipal waste management equipment has not been replaced since the early 1990s. The development of waste management strategies and regulations, and the progress made in municipal waste planning have all been slow. Waste was not — and is still not — regarded as a significant threat to the environment and human health, nor is it perceived as a potential source of valuable resources.
Waste
154 Sustainable consumption and production in Southeast Europe and Eastern Europe, Caucasus and Central Asia
In most SEE countries existing waste management systems were negatively affected by the break-up of the former Yugoslavia and the civil war that followed. Poorly operated or abandoned mining sites and associated processing activities (e.g. heavy metals and cyanide) have caused severe water pollution (UNEP, 2006c). Significant quantities of waste are dumped at illegal sites, and the existing capacity of legal landfills is not sufficient to handle the growing quantities of waste. The technical standards for landfills are not in compliance with international norms, and hazardous substances leach to soil and groundwater. A growth in migration from rural to urban areas is expected to lead to the increased generation of municipal waste in large cities. However, in general, the collection rate of municipal waste is low. Most rural areas do not have waste collection at all, and as these areas are often depopulated, it is relatively expensive to introduce waste collection schemes.
A further challenge has been the slow development of institutional capacities and the lack of adequate legislation and policies to manage waste and recover resources from it. Specific waste management and hazardous waste plans have yet to be approved in most countries. The level of environmental awareness concerning waste among citizens of the SEE countries is considered very low (REC, 2003; UNEP, 2006c).
The remainder of this section reviews past trends and the current situation using available statistics and information from the last ten years. However, as mentioned earlier, the availability of data on waste generation and management in the EECCA and the SEE countries is limited, and coverage was especially poor during the 1990s.
8.2.2 Total waste generation
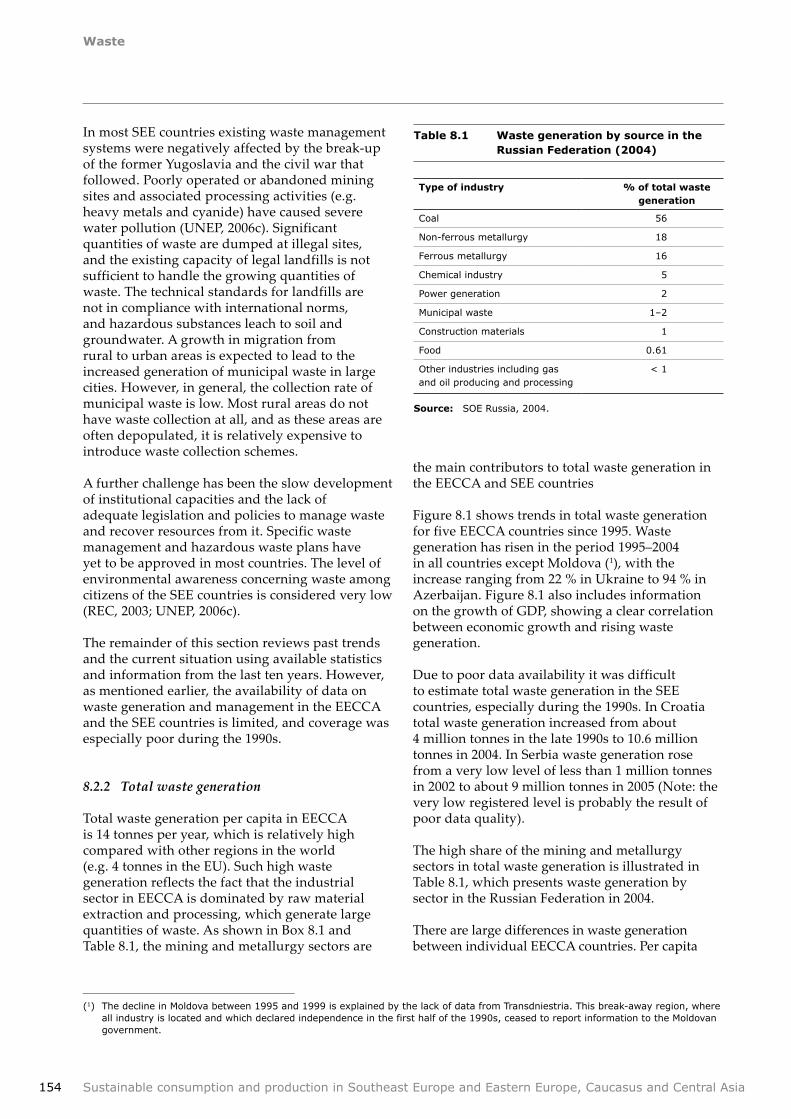
Total waste generation per capita in EECCA is 14 tonnes per year, which is relatively high compared with other regions in the world (e.g. 4 tonnes in the EU). Such high waste generation reflects the fact that the industrial sector in EECCA is dominated by raw material extraction and processing, which generate large quantities of waste. As shown in Box 8.1 and Table 8.1, the mining and metallurgy sectors are
Table 8.1 Waste generation by source in the Russian Federation (2004)
Type of industry % of total waste generation
Coal 56
Non-ferrous metallurgy 18
Ferrous metallurgy 16
Chemical industry 5
Power generation 2
Municipal waste 1–2
Construction materials 1
Food 0.61
Other industries including gas and oil producing and processing
< 1
Source: SOE Russia, 2004.
(1) The decline in Moldova between 1995 and 1999 is explained by the lack of data from Transdniestria. This break-away region, where all industry is located and which declared independence in the first half of the 1990s, ceased to report information to the Moldovan government.
the main contributors to total waste generation in the EECCA and SEE countries
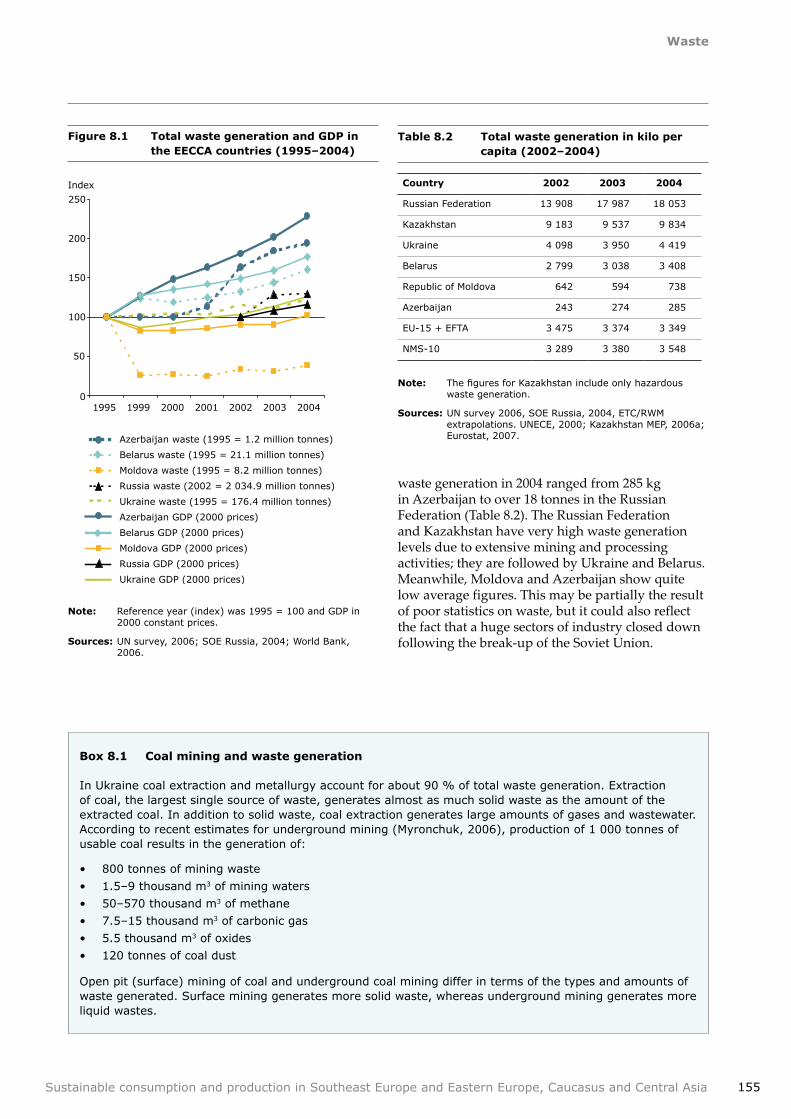
Figure 8.1 shows trends in total waste generation for five EECCA countries since 1995. Waste generation has risen in the period 1995–2004 in all countries except Moldova (1), with the increase ranging from 22 % in Ukraine to 94 % in Azerbaijan. Figure 8.1 also includes information on the growth of GDP, showing a clear correlation between economic growth and rising waste generation.
Due to poor data availability it was difficult to estimate total waste generation in the SEE countries, especially during the 1990s. In Croatia total waste generation increased from about 4 million tonnes in the late 1990s to 10.6 million tonnes in 2004. In Serbia waste generation rose from a very low level of less than 1 million tonnes in 2002 to about 9 million tonnes in 2005 (Note: the very low registered level is probably the result of poor data quality).
The high share of the mining and metallurgy sectors in total waste generation is illustrated in Table 8.1, which presents waste generation by sector in the Russian Federation in 2004.
There are large differences in waste generation between individual EECCA countries. Per capita
Waste
155Sustainable consumption and production in Southeast Europe and Eastern Europe, Caucasus and Central Asia
Box 8.1 Coal mining and waste generation
In Ukraine coal extraction and metallurgy account for about 90 % of total waste generation. Extraction of coal, the largest single source of waste, generates almost as much solid waste as the amount of the extracted coal. In addition to solid waste, coal extraction generates large amounts of gases and wastewater. According to recent estimates for underground mining (Myronchuk, 2006), production of 1 000 tonnes of usable coal results in the generation of:
• 800 tonnes of mining waste
• 1.5–9 thousand m3 of mining waters
• 50–570 thousand m3 of methane
• 7.5–15 thousand m3 of carbonic gas
• 5.5 thousand m3 of oxides
• 120 tonnes of coal dust
Open pit (surface) mining of coal and underground coal mining differ in terms of the types and amounts of waste generated. Surface mining generates more solid waste, whereas underground mining generates more liquid wastes.
Table 8.2 Total waste generation in kilo per capita (2002–2004)
Country 2002 2003 2004
Russian Federation 13 908 17 987 18 053
Kazakhstan 9 183 9 537 9 834
Ukraine 4 098 3 950 4 419
Belarus 2 799 3 038 3 408
Republic of Moldova 642 594 738
Azerbaijan 243 274 285
EU-15 + EFTA 3 475 3 374 3 349
NMS-10 3 289 3 380 3 548
Note: The figures for Kazakhstan include only hazardous waste generation.
Sources: UN survey 2006, SOE Russia, 2004, ETC/RWM extrapolations. UNECE, 2000; Kazakhstan MEP, 2006a; Eurostat, 2007.
waste generation in 2004 ranged from 285 kg in Azerbaijan to over 18 tonnes in the Russian Federation (Table 8.2). The Russian Federation and Kazakhstan have very high waste generation levels due to extensive mining and processing activities; they are followed by Ukraine and Belarus. Meanwhile, Moldova and Azerbaijan show quite low average figures. This may be partially the result of poor statistics on waste, but it could also reflect the fact that a huge sectors of industry closed down following the break-up of the Soviet Union.
Figure 8.1 Total waste generation and GDP in the EECCA countries (1995–2004)
0
50
100
150
200
250
1995 1999 2000 2001 2002 2003 2004
Index
Azerbaijan waste (1995 = 1.2 million tonnes)
Belarus waste (1995 = 21.1 million tonnes)
Moldova waste (1995 = 8.2 million tonnes)
Russia waste (2002 = 2 034.9 million tonnes)
Ukraine waste (1995 = 176.4 million tonnes)
Azerbaijan GDP (2000 prices)
Belarus GDP (2000 prices)
Moldova GDP (2000 prices)
Russia GDP (2000 prices)
Ukraine GDP (2000 prices)
Note: Reference year (index) was 1995 = 100 and GDP in 2000 constant prices.
Sources: UN survey, 2006; SOE Russia, 2004; World Bank, 2006.
Waste
156 Sustainable consumption and production in Southeast Europe and Eastern Europe, Caucasus and Central Asia
8.2.3 Hazardous waste
Hazardous waste contains substances which, even in small quantities, can be irritant, toxic, inflammable or otherwise harmful. So, proper collection and handling of hazardous waste is crucial for protecting the environment and public health.
Generation of hazardous waste
Between 400 and 500 million tonnes of hazardous waste are generated in the EECCA countries every year, constituting between 12 % and 18 % of total. In the EU-25, by comparison, hazardous waste accounts for approximately 3 % of total waste generation.
One of the reasons behind the high rate of hazardous waste generation in the EECCA countries is the structure of their economies, which contain many pollution-intensive industries and lack appropriate clean-up technologies (see Chapter 4). When comparing the EECCA figures with those of other countries, it is important to keep in mind that the definition of hazardous wastes is also quite broad in EECCA.
Most EECCA countries use a waste classification system based on the former Soviet system dating back to the early 1990s. The classification of waste is based on the hazardous nature of the compounds and the content of the dangerous substances. Wastes are classified according to different hazard classes, and not simply as 'hazardous' or 'non-hazardous' as in most of EU Member States. The classification rules used in EECCA
usually divide wastes into four, sometimes five, hazard classes, where hazardous class V waste is considered to be 'practically' non-hazardous. Most hazardous class IV and some hazardous class III wastes in EECCA would be considered non-hazardous in the EU and OECD Member States. For instance, mixed municipal waste is often classified as Class IV hazardous waste, and Russian Federation regulations permit the disposal of some hazardous class III and most hazardous class IV waste in municipal solid waste landfills.
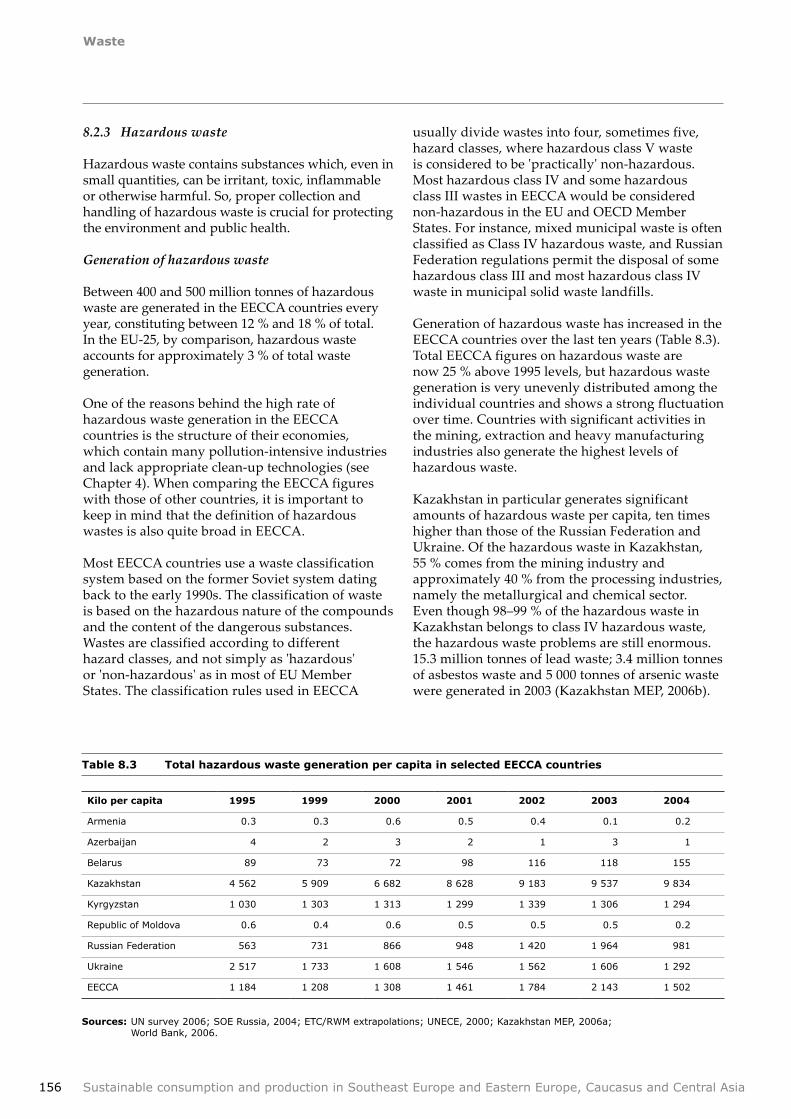
Generation of hazardous waste has increased in the EECCA countries over the last ten years (Table 8.3). Total EECCA figures on hazardous waste are now 25 % above 1995 levels, but hazardous waste generation is very unevenly distributed among the individual countries and shows a strong fluctuation over time. Countries with significant activities in the mining, extraction and heavy manufacturing industries also generate the highest levels of hazardous waste.
Kazakhstan in particular generates significant amounts of hazardous waste per capita, ten times higher than those of the Russian Federation and Ukraine. Of the hazardous waste in Kazakhstan, 55 % comes from the mining industry and approximately 40 % from the processing industries, namely the metallurgical and chemical sector. Even though 98–99 % of the hazardous waste in Kazakhstan belongs to class IV hazardous waste, the hazardous waste problems are still enormous. 15.3 million tonnes of lead waste; 3.4 million tonnes of asbestos waste and 5 000 tonnes of arsenic waste were generated in 2003 (Kazakhstan MEP, 2006b).
Table 8.3 Total hazardous waste generation per capita in selected EECCA countries
Kilo per capita 1995 1999 2000 2001 2002 2003 2004
Armenia 0.3 0.3 0.6 0.5 0.4 0.1 0.2
Azerbaijan 4 2 3 2 1 3 1
Belarus 89 73 72 98 116 118 155
Kazakhstan 4 562 5 909 6 682 8 628 9 183 9 537 9 834
Kyrgyzstan 1 030 1 303 1 313 1 299 1 339 1 306 1 294
Republic of Moldova 0.6 0.4 0.6 0.5 0.5 0.5 0.2
Russian Federation 563 731 866 948 1 420 1 964 981
Ukraine 2 517 1 733 1 608 1 546 1 562 1 606 1 292
EECCA 1 184 1 208 1 308 1 461 1 784 2 143 1 502
Sources: UN survey 2006; SOE Russia, 2004; ETC/RWM extrapolations; UNECE, 2000; Kazakhstan MEP, 2006a; World Bank, 2006.
Waste
157Sustainable consumption and production in Southeast Europe and Eastern Europe, Caucasus and Central Asia
Meanwhile, Moldova and Azerbaijan reported hardly any hazardous waste generation at all, although it is not clear whether this represents reality or is a reflection of deficient waste reporting systems.
Table 8.4 shows a breakdown of hazardous waste by the different hazard classes in five EECCA countries, based on information available for various periods between 1995 and 2004. Except for Armenia, most of the hazardous waste generated in the five EECCA countries belongs to the less harmful class IV.
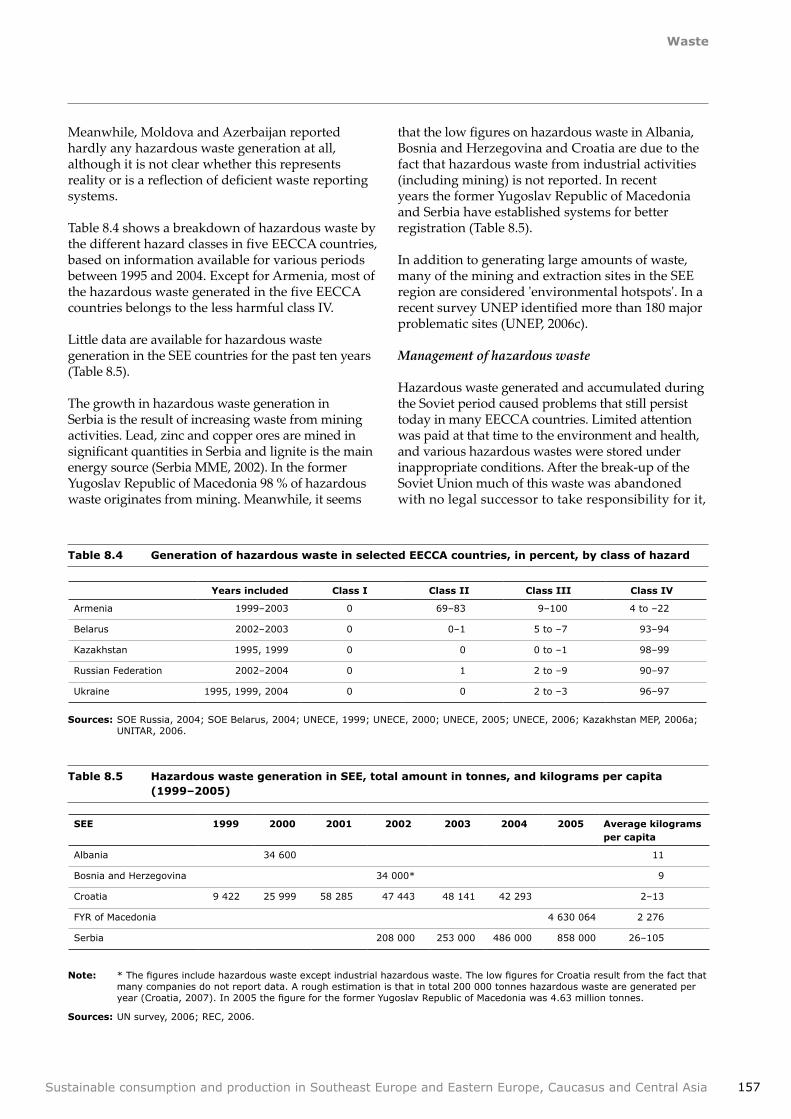
Little data are available for hazardous waste generation in the SEE countries for the past ten years (Table 8.5).
The growth in hazardous waste generation in Serbia is the result of increasing waste from mining activities. Lead, zinc and copper ores are mined in significant quantities in Serbia and lignite is the main energy source (Serbia MME, 2002). In the former Yugoslav Republic of Macedonia 98 % of hazardous waste originates from mining. Meanwhile, it seems
Years included Class I Class II Class III Class IV
Armenia 1999–2003 0 69–83 9–100 4 to –22
Belarus 2002–2003 0 0–1 5 to –7 93–94
Kazakhstan 1995, 1999 0 0 0 to –1 98–99
Russian Federation 2002–2004 0 1 2 to –9 90–97
Ukraine 1995, 1999, 2004 0 0 2 to –3 96–97
Table 8.4 Generation of hazardous waste in selected EECCA countries, in percent, by class of hazard
Sources: SOE Russia, 2004; SOE Belarus, 2004; UNECE, 1999; UNECE, 2000; UNECE, 2005; UNECE, 2006; Kazakhstan MEP, 2006a; UNITAR, 2006.
that the low figures on hazardous waste in Albania, Bosnia and Herzegovina and Croatia are due to the fact that hazardous waste from industrial activities (including mining) is not reported. In recent years the former Yugoslav Republic of Macedonia and Serbia have established systems for better registration (Table 8.5).
In addition to generating large amounts of waste, many of the mining and extraction sites in the SEE region are considered 'environmental hotspots'. In a recent survey UNEP identified more than 180 major problematic sites (UNEP, 2006c).
Management of hazardous waste
Hazardous waste generated and accumulated during the Soviet period caused problems that still persist today in many EECCA countries. Limited attention was paid at that time to the environment and health, and various hazardous wastes were stored under inappropriate conditions. After the break-up of the Soviet Union much of this waste was abandoned with no legal successor to take responsibility for it,
SEE 1999 2000 2001 2002 2003 2004 2005 Average kilograms per capita
Albania 34 600 11
Bosnia and Herzegovina 34 000* 9
Croatia 9 422 25 999 58 285 47 443 48 141 42 293 2–13
FYR of Macedonia 4 630 064 2 276
Serbia 208 000 253 000 486 000 858 000 26–105
Table 8.5 Hazardous waste generation in SEE, total amount in tonnes, and kilograms per capita (1999–2005)
Note: * The figures include hazardous waste except industrial hazardous waste. The low figures for Croatia result from the fact that many companies do not report data. A rough estimation is that in total 200 000 tonnes hazardous waste are generated per year (Croatia, 2007). In 2005 the figure for the former Yugoslav Republic of Macedonia was 4.63 million tonnes.
Sources: UN survey, 2006; REC, 2006.

Waste
158 Sustainable consumption and production in Southeast Europe and Eastern Europe, Caucasus and Central Asia
and often the qualified technical staff migrated to other countries. The smaller EECCA countries in particular have a limited capacity for dealing with this problem.
Ensuring proper management of hazardous waste remains a big challenge for the EECCA countries and only a small proportion of it is recycled or treated properly. Most of the hazardous waste currently generated in EECCA countries is landfilled or stored (category 'other' in Figure 8.2) on mining and industrial sites. It is estimated that in Kazakhstan 6.7 billion tonnes of hazardous waste has already been accumulated, and the quantities continue to grow (Kazakhstan MEP, 2006b).
Evidence suggests recycling and recovery of hazardous waste started to increase after 2000. In the Russian Federation and Ukraine, the countries with the largest generation of hazardous waste, between 30 % and 50 % of hazardous waste is now reported as recovered or recycled. This could in part be explained by the implementation of the Basel Convention and the Stockholm Convention (see Section 8.3.3).
Figure 8.2 Hazardous waste treatment/disposal in selected EECCA countries
0
20
40
60
80
100
Armen
ia, 2
000
Armen
ia, 2
004
Belaru
s, 200
1
Belaru
s, 200
2
Belaru
s, 200
4
Kaza
khstan
, 199
5
Kaza
khstan
, 200
0
Kaza
khstan
, 200
4
Kyrg
yzstan
, 199
5
Kyrg
yzstan
, 200
0
Kyrg
yzstan
, 200
4
Repu
blic
of M
oldo
va, 1
995
Repu
blic
of M
oldo
va, 2
000
Repu
blic
of M
oldo
va, 2
004
Russ
ian Fe
dera
tion,
199
5
Russ
ian Fe
dera
tion,
200
0
Russ
ian Fe
dera
tion,
200
4
Ukra
ine, 199
5
Ukra
ine, 200
0
Ukra
ine, 200
4
Recycling Incineration Recovery
Landfill Other
%
Note: The Russian Federation data only include figures for recovery and not for recycling and incineration. The category 'other' covers different kinds of disposal activities, i.e. not recovery treatment. Release into water bodies and permanent storage are included here.
Sources: UN survey, 2006; UNEP, 2006a.
In SEE countries, management of hazardous wastes also remains a challenge. Major problems include:
• continuing operation of unregulated facilities which pose a direct risk to the environment;
• hazardous waste lingering in several sites which need clean-up prior to future land restoration;
• poorly developed hazardous waste disposal and recovery technologies, offering few alternatives to landfilling;
• lack of regional facilities for the disposal of hazardous waste (landfills and incinerators) which comply with modern technical standards;
• poor economic performance and low production levels in many industrial enterprises hinder the construction of the necessary treatment and disposal facilities;
• inadequate hazardous waste legislation;
• lack of sufficient and reliable information on quantities, composition and characteristics of waste (REC, 2003).
By 2006, there was no sign of improvement in hazardous waste treatment facilities (REC, 2006). However, some progress had been made in developing strategies and legislation on hazardous waste. As with the EECCA countries, some of this progress could be seen as a consequence of international obligations under the Basel and Stockholm Conventions. For example, the former Yugoslav Republic of Macedonia submitted an implementation plan of the Stockholm Convention on persistent organic pollutants, while Albania implemented the amendments of the Basel Convention. The effort to join the EU has been a driving force in Croatia which transposed EU hazardous directives, implemented the European Waste Catalogue List and set up a hazardous waste charge system. Finally, Serbia adopted laws on the handling of hazardous waste products and established an Environment Protection Agency.
8.2.4 Industrial and manufacturing waste
Currently, the accumulation of industrial waste continues in much of the EECCA and SEE regions. This is a combination of new waste produced
Waste
159Sustainable consumption and production in Southeast Europe and Eastern Europe, Caucasus and Central Asia
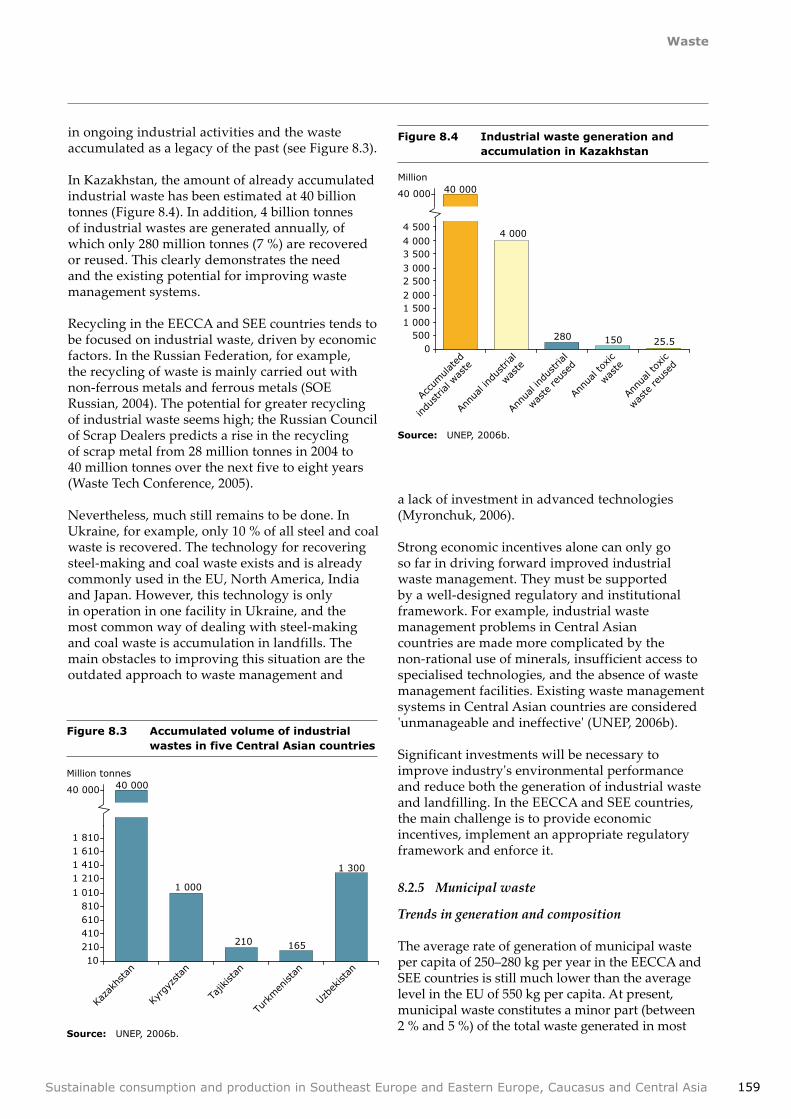
in ongoing industrial activities and the waste accumulated as a legacy of the past (see Figure 8.3).
In Kazakhstan, the amount of already accumulated industrial waste has been estimated at 40 billion tonnes (Figure 8.4). In addition, 4 billion tonnes of industrial wastes are generated annually, of which only 280 million tonnes (7 %) are recovered or reused. This clearly demonstrates the need and the existing potential for improving waste management systems.
Recycling in the EECCA and SEE countries tends to be focused on industrial waste, driven by economic factors. In the Russian Federation, for example, the recycling of waste is mainly carried out with non-ferrous metals and ferrous metals (SOE Russian, 2004). The potential for greater recycling of industrial waste seems high; the Russian Council of Scrap Dealers predicts a rise in the recycling of scrap metal from 28 million tonnes in 2004 to 40 million tonnes over the next five to eight years (Waste Tech Conference, 2005).
Nevertheless, much still remains to be done. In Ukraine, for example, only 10 % of all steel and coal waste is recovered. The technology for recovering steel-making and coal waste exists and is already commonly used in the EU, North America, India and Japan. However, this technology is only in operation in one facility in Ukraine, and the most common way of dealing with steel-making and coal waste is accumulation in landfills. The main obstacles to improving this situation are the outdated approach to waste management and
Figure 8.3 Accumulated volume of industrial wastes in five Central Asian countries
40 000
1 000
210 165
1 300
10210410610810
1 010
1 2101 4101 6101 810
Kaza
khstan
Kyrg
yzstan
Tajik
istan
Turk
men
istan
Uzbe
kistan
Million tonnes
40 000
Source: UNEP, 2006b.
Figure 8.4 Industrial waste generation and accumulation in Kazakhstan
40 000
4 000
280 150 25.50
5001 000
1 5002 000
2 5003 000
3 5004 000
4 500
Accu
mulated
indu
stria
l was
te
Annu
al in
dustria
l
was
te
Annu
al in
dustria
l
was
te re
used
Annu
al to
xic
was
te
Annu
al to
xic
was
te re
used
Million
40 000
Source: UNEP, 2006b.
a lack of investment in advanced technologies (Myronchuk, 2006).
Strong economic incentives alone can only go so far in driving forward improved industrial waste management. They must be supported by a well-designed regulatory and institutional framework. For example, industrial waste management problems in Central Asian countries are made more complicated by the non-rational use of minerals, insufficient access to specialised technologies, and the absence of waste management facilities. Existing waste management systems in Central Asian countries are considered 'unmanageable and ineffective' (UNEP, 2006b).
Significant investments will be necessary to improve industry's environmental performance and reduce both the generation of industrial waste and landfilling. In the EECCA and SEE countries, the main challenge is to provide economic incentives, implement an appropriate regulatory framework and enforce it.
8.2.5 Municipal waste
Trends in generation and composition
The average rate of generation of municipal waste per capita of 250–280 kg per year in the EECCA and SEE countries is still much lower than the average level in the EU of 550 kg per capita. At present, municipal waste constitutes a minor part (between 2 % and 5 %) of the total waste generated in most

Waste
160 Sustainable consumption and production in Southeast Europe and Eastern Europe, Caucasus and Central Asia
EECCA countries. This is due to the high generation of waste in mining and extraction. In 2004, the eight EECCA countries included in Figure 8.5 generated a total of approximately 66 million tonnes of municipal waste. The growth of municipal waste generation in the EECCA countries has been high since the late 1990s, and in several countries it has reached 8 to 10 % annually. The annual average increase in the eight EECCA countries as a group was 4 % for the period 1995–2004.
In the SEE countries, total municipal waste generation was approximately 7 million tonnes in 2004. The share of municipal waste in total waste is larger than in EECCA, accounting for between 10 % and 20 %. The amount of municipal waste generated in the SEE countries increased by 3 % in the period from 1999 to 2005. On the per capita basis, it was comparable to the levels in the EECCA countries.
The rising quantities of municipal waste are a problem exacerbated by existing shortcomings of the collection systems. In many countries little or no investment has been made since 1990 to upgrade municipal waste management systems. But in recent years there have been emerging examples of major cities in some EECCA countries, such as Tashkent
Figure 8.5 Municipal waste generation in kilograms per capita in the EECCA countries (1995–2004)
0
50
100
150
200
250
300
350
400
450
1995 1999 2000 2001 2002 2003 2004
Kilo per capita
Azerbaijan Belarus Georgia
Kyrgyzstan Moldova Russian Federation
Ukraine EECCA
Armenia
Note: Georgia has reported the same total MSW amount for the entire period.
Sources: UN survey, 2006; UNSD, 2004; SOE Russia, 2004; ETC/RWM extrapolation and calculation.
Figure 8.6 Municipal waste generation in kilograms per capita in the SEE countries (1999–2005)
0
50
100
150
200
250
300
350
400
450
500
1999 2000 2001 2002 2003 2004 2005
Kilo per capita
Albania Bosnia and Herzegovina
Croatia FYR of Macedonia
Serbia and Montenegro SEE
Note: For Bosnia and Herzegovina figures are only reported for 1999; for the former Yugoslav Republic of Macedonia only for 2005.
Sources: UN survey, 2006 and ETC/RWM extrapolations.
in Uzbekistan and Tbilisi in Georgia, making the necessary investments in new waste bins, collection trucks and transfer stations.
Experts often note that the composition of municipal waste is changing, and that there is an increasing share of plastic waste. For example, in Tbilisi, the amount of plastic waste (measured in volume) has increased considerably in the last 10–15 years. However, the data are generally quite patchy. From the reported national statistics measured in tonnes, it is not possible to assess conclusively whether the amount of plastics in municipal waste is indeed increasing. Meanwhile, the share of paper and cardboard is reasonably high even though it varies a great deal from country to country (Figure 8.7). The high proportion of paper and cardboard suggests a major potential for recycling.
The composition of household waste typically varies quite strongly by season (see Box 8.2).
Use of resources in municipal waste
Very limited progress has been made in the reuse or recovery of resources in municipal waste over
Waste
161Sustainable consumption and production in Southeast Europe and Eastern Europe, Caucasus and Central Asia
Box. 8.2 Seasonal changes in waste composition in Donetsk, Ukraine
More detailed studies have been made on the composition of household waste in the city of Donetsk in Ukraine, which has a population of approx. 1.5 million. Figure 8.8 shows how the composition of household waste varies with the season. The share of food waste is higher during the summer and autumn seasons than during the rest of the year due to the consumption of more vegetables at this time of year. The high share of residuals in the wintertime may be due to residues of heating, such as ash from the burning of coal. These seasonal changes in waste composition might determine how large a capacity is necessary in the waste management system to deal with the different waste streams.
Figure 8.7 Municipal waste composition in selected EECCA and SEE countries
0
20
40
60
80
100
Alba
nia, 200
1
Alba
nia, 200
4
Alba
nia, 200
5
Armen
ia, 1
990
Armen
ia, 1
999
Armen
ia, 2
004
Belaru
s, 200
4
Georg
ia, 2
005
Croa
tia, 1
999
Croa
tia, 2
004
Ukra
ine, 200
1
Yugo
slavia, 199
9
%
Other inorganic material Organic material Metals
Glass Plastics Textiles Paper, paperboard
Note: Some of the figures cover only larger cities. For example, Kiev represents Ukraine and Belgrade represents Yugoslavia.
Sources: UN survey 2006; COWI, 2004; Linzner, 2004.
Source: TACIS, 2002.
Figure 8.8 Seasonal changes in the composition of household waste in the region of Donetsk
38.647.3
36.6 33.3
5.6
6.2
6.4 5.5
3.2 2.6 2.7
8.2
6.4
9.7 7.4
3.22.6
2.7 3.2
9.25.4
6.4 7.4
1.4 2.0
1.6
2.2
23.6 21.729.8 23.1
4.1 3.3 6.6
0
20
40
60
80
100
Summer Autumn Winter SpringFood waste
Paper
Metal
Polymeric packages
Combined packages
Wood
Textile
Glass
Leather, rubber
Stones
Bones
Residues
Hazardous waste
Construction waste
%
the last few years, according to data reported to the UN (UN survey, 2006). In general, resources from municipal waste are not utilised. From a SCP perspective, there is a loss in economic resources when almost all municipal waste ends up in a landfill (which is the case throughout the SEE and EECCA countries). In addition, there is a higher risk of environmental pollution, including the release of climate change gases (Box 8.3).
As shown in Figures 8.7 and 8.8, municipal waste in EECCA and SEE countries contains large amounts of potentially reusable or recyclable materials such as organic waste, paper, plastic and metals. In the Russian Federation it is estimated that only 3 % to 4 % of municipal waste is reprocessed or recycled (Gonopolsky, 2006). Often the only 'permanent' recycling of municipal waste is conducted informally by waste scavengers who separate the waste either in the waste bins or at landfill sites.
Waste
162 Sustainable consumption and production in Southeast Europe and Eastern Europe, Caucasus and Central Asia
Box 8.3 Landfilling of municipal waste in the context of SCP
Landfill is by far the most common (between 90 % and 100 %) method of disposal of municipal waste in EECCA and SEE countries. However, almost all landfills in the region are outdated and do not conform to modern standards. Inspections have shown that 92 % of approved municipal waste landfills do not meet sanitary norms (UNEP, 2006a). Collection and management of landfill gases, which also contain the potent greenhouse gas methane, is rare, leading to a high risk of fires and explosions. Moreover, the growth in municipal waste generation is expected to cause a substantial rise in greenhouse gas emissions in the coming years because of the significant share of organic matter in municipal waste. Finally, leachate is generally not collected nor treated, posing a constant risk of pollution of soil and water sources, including drinking water. In some countries new legislation has been introduced which requires permits for landfilling of municipal solid waste. However, older landfills, established in the Soviet time, are normally exempt from environmental permits. This is, for example, the case in Georgia (Antadze and Gugushvili, 2006).
Recycling of some municipal waste streams, such as plastics and electric and electronic equipment, as well as incineration with energy recovery, require quite advanced technical capacity and considerable financial resources. Overall, however, the lack of recycling of municipal waste does not seem to be primarily caused by the lack of recycling capacity, at least not when it comes to more traditional recyclable waste such as glass, paper and cardboard (Gonopolsky, 2006). On the contrary, in some countries the existing recycling facilities need a much greater supply of recyclable waste. The shortages are caused by limited domestic supply and by the high demand for many recyclable waste materials from international markets.
The insufficient recycling of municipal waste should be seen primarily as the result of the low
priority given by governments and municipalities to implementation, combined with a low level of environmental public awareness (Antadze and Gugushvili, 2006). Nevertheless, the following three cases illustrate exceptions to the general picture (Boxes 8.4, 8.5 and 8.6).
The use of recycled municipal plastic waste in a new product often requires the sorting and separation of waste plastic into different plastic types. Thus, recycling of plastic can be more difficult than for other waste materials such as glass and paper. However, innovative technologies are being developed which can make use of mixed plastics waste (Box 8.6)
Finally, from an environmental point of view it is important to collect hazardous municipal waste
Box 8.4 Municipal waste management in Moscow, and potential for recycling and reuse
In Moscow 27 % of municipal waste is reprocessed or recycled. Moscow City Hall has issued regulations designed to increase recycling levels of municipal waste to 40 %.
In the Russian Federation the annual generation of packaging waste per capita is 50 kg, while in the EU-15 the average figure is about 175 kg. Certain types of packaging waste in Moscow already have quite high recycling rates, for example, a 90 % rate of recycling for aluminium packaging waste. On the other hand, recycling of plastic waste packaging is low, at about 5 %. This is the case despite the fact that the potential for plastic recycling in the Russian Federation, and especially in the Moscow region, is high. The greatest share of plastic packaging used in the Russian Federation consists of PET bottles which are simpler to recycle than other plastic wastes, since they are quite homogeneous and easy to clean (Gonopolsky, 2006).
It is worth noting that reuse systems are not usually counted as part of a recycling system. In the Russian Federation, for example, 60–70 % of glass packaging consists of bottles that can be returned to special collection sites for a refund; this system has existed since Soviet days. By contrast, in the EU and especially in the EU-15, much of the glass packaging waste is one-way packaging which goes into a melting process and thus contributes to a high recycling rate (Gonopolsky, 2006). When comparing recycling rates it is therefore important to know whether a country with a low recycling rate has a high reuse rate.
Waste
163Sustainable consumption and production in Southeast Europe and Eastern Europe, Caucasus and Central Asia
Box 8.6 Roof‑tiles in Ukraine made from plastic waste
'When the Soviet Union collapsed in the early 1990s, many heavy industries in Ukraine closed down, resulting in increasing unemployment and poverty. Housing was a particular problem, with many existing houses roofed with crumbling sheets of asbestos. Since then the transition to a market economy has increased incomes and fuelled demand for new and better housing. A joint venture company, Britannica JV, responded to this demand by making roof tiles from recycled plastic. To avoid the costs of sorting plastic waste, researchers in Ukraine developed a process for large-scale manufacture of good quality plastic from mixed plastics waste. The new product is strong, light, durable and fully waterproof — ideal for roof tiles. At the same time the venture is helping to ease pressure on landfills. The tiles are already in use throughout Ukraine. The UK is expected to start imports as soon as building regulation approval is obtained' (GEO Year Book, 2006 ). The contents of the tiles are 70 % sand and 30 % plastic (Britanica, 2007).
Box 8.5 Introduction of a successful packaging policy in Croatia
About 1.7 billion beverage units are sold each year in Croatia, with an ever-increasing part of the containers made of aluminium and PET. Even though these packaging materials are easily recyclable, more and more of this waste ends up in landfills and creates litter problems in parks, streets and the countryside.
In January 2006, the Croatian Government introduced an Ordinance on Packaging and Packaging Waste as a means of implementing the EU Packaging Directive. The Ordinance came after an amendment to the Waste Act was passed in 2004, and a waste strategy was prepared in 2005. The policy instruments used included introduction of the full-cost recovery mechanism for waste beverage containers. The 'polluters' are obliged to pay a contribution to a specialised fund whenever a beverage product is placed on the market. The payment consists of three kinds of fees:
i) A disposal fee for every unit, according to the packaging material used (about EUR 0.015/unit). The fee covers the expenses for managing the packaging waste, including collection, storage and transportation to the recovery location.
ii) A returnable fee (deposit) is collected to encourage final consumers to return the empty packaging (EUR 0.07/unit). This fee has a temporary character for the producer since it is reimbursed following the sale of the product.
iii) A 'stimulating' fee which should encourage the producers to use reusable packaging. This fee is paid by those producers who have not reached national targets for the use of returnable packaging.
In 2006 the target rate for use of returnable packaging was 10 % for all kinds of beverages, except for beer where the target was 65 %. The target was scheduled to increase progressively over the coming years and reach 60 % for all beverages in 2013, except for beer where the target is 90 %.
Until October 2006, approximately 650 million units had been returned, equivalent to 73 000 tonnes of packaging waste, according to the estimates of the Croatian Ministry of Environment. This included 14 000 tonnes of PET, 57 000 tonnes of glass and 1 400 tonnes of aluminium and steel. By way of comparison, in 2005 the amounts collected were 2 000 tonnes of PET and 14 000 tonnes of glass. So, the results of the ordinance have been exceptional. Furthermore, the litter problem has been significantly reduced. In addition, around 1 500 new jobs have been created to ensure the collection, storage, transportation and recycling of packaging waste. In October 2006, the Directorate for Environmental Protection of Serbia proposed to introduce the same deposit-refund system. Source: MOE Croatia, 2006.
separately, in order to prevent hazardous waste from ending up in landfills together with the rest of municipal waste. However, it would appear that at
present there are no separate collection systems in operation in EECCA and SEE.

Waste
164 Sustainable consumption and production in Southeast Europe and Eastern Europe, Caucasus and Central Asia
8.2.6 Waste management in four selected cities in the EECCA and SEE countries
In order to obtain more detailed information about trends, opportunities and barriers to better waste management in the EECCA and SEE countries, four major city studies on municipal waste practices were conducted for this report. The selected cities were: Belgrade, Dnipropetrovsk and Tbilisi (populations: 1.1–1.3 million) and Bishkek (population: 800 000). Three of the four cities are capitals, and represent the four country groups used in this report: Eastern Europe, Caucasus, Central Asia and SEE.
The city studies focused primarily on municipal waste and hazardous waste. A good part of the information was provided by local NGOs who have assisted UNEP-EEA by gathering key data and information. The NGOs have also conducted surveys and interviews with local administration
Table 8.6 Composition of municipal waste in four cities (indicated in %)
Belgrade (based on weight)
Bishkek (based on weight)
Dnipropetrovsk (based on weight)
Tbilisi, 1989 (based on volume)
Tbilisi, 2003 (based on volume)
Food waste 32 32 30 42 19
Paper and cardboard 27 26 19 34 19
Plastics 6 7 3 2 26
Glass 6 2 5 4 3
Metals 3 5 3
Ferrous metals 4
Wood 2 3
Textile 5 5 6
Litter 11
Residues 8 24
Others 26 15 36
Sources: Antadze and Gugushvili, 2006; Gvozdenovic and Scekic, 2006, Lytvynenko, 2006 and Peshenuk, 2006.
representatives. Similar to data collection at national level, it has proven difficult to obtain data at city level. However, it has been possible for all four cities to provide the most relevant data at least for some years (Tables 8.6 and 8.7).
Table 8.6. shows that the composition of municipal waste by weight is fairly similar in Belgrade, Bishkek and Dnipropetrovsk. In case of Tbilisi, the figures show the development from 1989 to 2003 based on volume of wastes. Even though the calculation methods used for 1989 and 2003 may differ, the figures indicate that plastic waste has increased considerably over the last 10–15 years in Tbilisi, which reflects increasing use of plastic packaging.
Table 8.6 and 8.7 indicate that the four cities face many similar problems despite their different location and socio-economic situation (Box 8.7).

Waste
165Sustainable consumption and production in Southeast Europe and Eastern Europe, Caucasus and Central Asia
Table 8.7 Waste characteristics of four cities in the EECCA and SEE countries
Characteristics of four large cities in the EECCA and SEE countries B
elgra
de
1999–2000
Bel
gra
de
2005–2006
Bis
hke
k
1999
Bis
hke
k
2006
Dnip
ro-p
etro
vsk
1999
Dnip
ro-p
etro
vsk
2006
Tbili
si
2000
Tbili
si
2005–2006
Population in 1 000 1 272 611 780 1 113 1 054 1 098 1 103
Number of households 588 674 495 649 248 855
Collection of MSW in 1 000 m3 597 853 1 600 1 095
Collection of MSW in 1 000 tonnes 360 679 467 204 149 213 316 310 315 216
Collection of MSW in kilo per capita 284 367 244 273 284 294 287 196
Percentage of population with MSW collection
84 No data No data No data No data 100 100
Kilo per m3 250 250 197 197
Separate collection of hazardous waste
None None None None No data No data None None
Number of trucks collecting MSW operating with compacting facilities
105 114 0 0 No data No data 0 68
Number of trucks collecting MSW operating without compacting facilities
0 0 201 63 321 308 231 250
% of collected MSW sent to landfill 100 100 100 No data No data 100 100
% of collected MSW sent to recycling, normally based on 'waste scavengers' at the landfill site
< 1 < 1 No data No data 0 0
% of collected MSW sent to incineration
0 0 0 0 36 33 0 0
Fee paid by household per year in euro
2.8 2.8 No data No data No data No data 4.3 4.3
Number of bins/containers within the collection area
18 400 31 000 4 646 5 962 No data No data 2 000 9 538
Number of landfills 2 1 1 1 1 1 3 2
Number of landfills with methane collection
0 0 0 0 0 0 0 0
Number of landfills in which methane collection is planned and financed under the mechanism in the Kyoto protocol
1 1 2
Number of illegal landfills Few hundreds
Few hundreds
No data No data 1 1
Gate fee per tonne/m3 MSW delivered
No data No data No data No data No data No data 0 1
Municipal waste strategy prepared None None None None None Yes None None
Sources: Antadze and Gugushvili, 2006; Gvozdenovic and Scekic, 2006; Lytvynenko, 2006; Peshenuk, 2006.

Waste
166 Sustainable consumption and production in Southeast Europe and Eastern Europe, Caucasus and Central Asia
Box 8.7 Comparison of the current waste situation in Belgrade, Bishkek, Dnipropetrovsk and Tbilisi
As demonstrated by Table 8.7 and Table 8.8 and other information from the city studies, waste management in the four cities shares some common characteristics:
• With the exception of Tbilisi, generation of municipal waste per capita increased in the last five to seven years, especially in Belgrade and Bishkek. The declining figures for Tbilisi are likely to be the result of incorrect reporting, since the number of inhabitants remained almost unchanged during this period.
• None of the four cities implemented separate collection of hazardous waste.
• All cities aside from Dnipropetrovsk have increased the number of waste bins and containers in the collection area during the last five to seven years.
• The situation differs concerning the number and quality of collection trucks, but in general it seems that the quality of the service has improved. In Belgrade two-thirds of all trucks are more than 12 years old, but all have a compacting facility. Additional new trucks have been acquired in recent years. In Tbilisi, a large part of the collection fleet was renewed in 2006 and the new trucks have compactor units. By contrast, in Bishkek no trucks have compactors and the number of collection vehicles declined between 2002 and 2005.
• In three of the cities all municipal waste is usually sent to landfills. Dnipropetrovsk has an incineration plant, where one-third of municipal waste is treated.
• Very limited amounts of recyclables are separated, normally by waste scavengers. It is estimated that the amount of separated waste is below 1 % of the landfilled quantities.
• The composition of waste in the four cities shows a large potential for sorting out recyclable materials, especially organic waste, paper and cardboard, but also plastics, textiles and metals. In Tbilisi, plastic is now a more significant waste component, reflecting the fact that plastic has become the predominant packaging for beverages.
• None of the existing landfills lives up to modern standards and at the moment none is equipped with a landfill gas collection system. However, methane collection is now planned for landfills in Bishkek, Dnipropetovsk and Tbilisi, financed through the mechanisms of the Kyoto Protocol.
• Ensuring funding for collection, recycling and disposal of municipal waste is a major problem in Bishkek, and it appears that the market for providing waste collection and disposal services is not economically attractive. Belgrade has received substantial foreign donations (e.g. new trucks and machines), and there are some indications that the public utility company will be reformed and partly privatised.
• In Tbilisi, significant municipal investments have been made in the last few years to improve waste management infrastructure. However, the currently used tariffs are based on old Soviet calculation methods and need to be revised to reflect the changes in service costs. No information is available about tariffs and investments in Dnipropetrovsk, but at national level expenditure on waste management has increased considerably over the last two years.
Sources: Antadze and Gugushvili, 2006; Gvozdenovic and Scekic, 2006; Lytvynenko, 2006 and Peshenuk, 2006.
Waste
167Sustainable consumption and production in Southeast Europe and Eastern Europe, Caucasus and Central Asia
8.3 Policy initiatives and innovative approaches
8.3.1 National waste policies or strategies
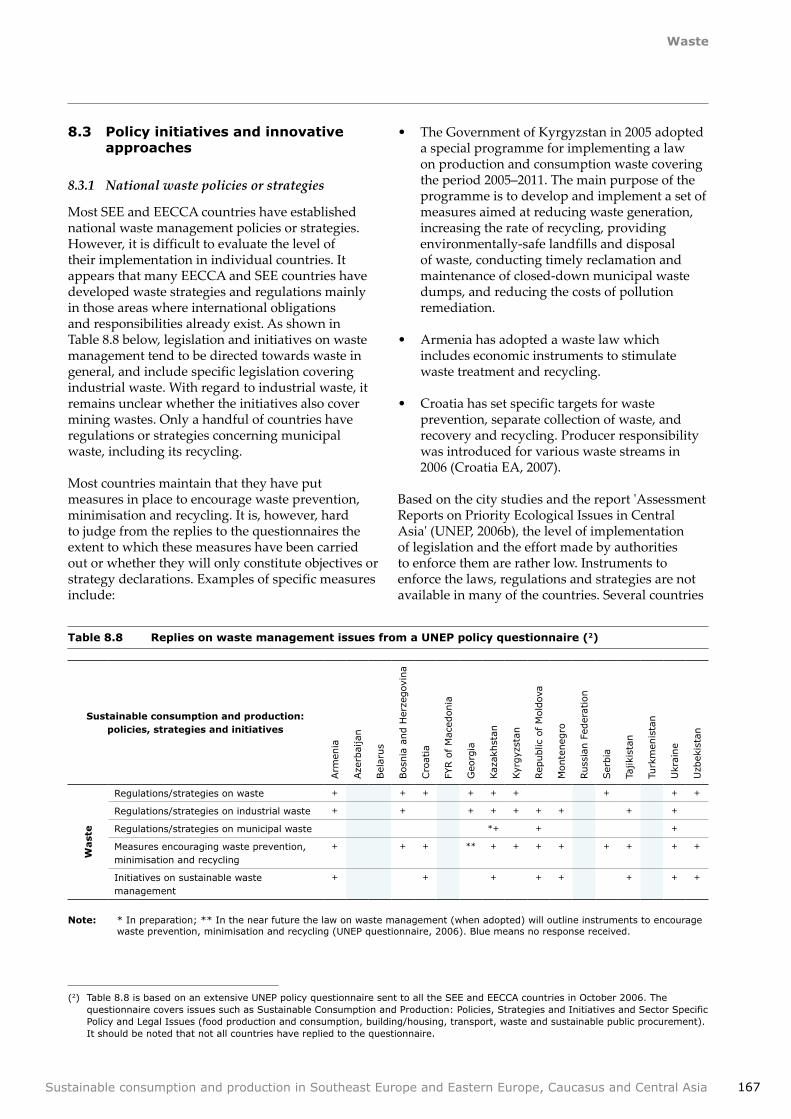
Most SEE and EECCA countries have established national waste management policies or strategies. However, it is difficult to evaluate the level of their implementation in individual countries. It appears that many EECCA and SEE countries have developed waste strategies and regulations mainly in those areas where international obligations and responsibilities already exist. As shown in Table 8.8 below, legislation and initiatives on waste management tend to be directed towards waste in general, and include specific legislation covering industrial waste. With regard to industrial waste, it remains unclear whether the initiatives also cover mining wastes. Only a handful of countries have regulations or strategies concerning municipal waste, including its recycling.
Most countries maintain that they have put measures in place to encourage waste prevention, minimisation and recycling. It is, however, hard to judge from the replies to the questionnaires the extent to which these measures have been carried out or whether they will only constitute objectives or strategy declarations. Examples of specific measures include:
• The Government of Kyrgyzstan in 2005 adopted a special programme for implementing a law on production and consumption waste covering the period 2005–2011. The main purpose of the programme is to develop and implement a set of measures aimed at reducing waste generation, increasing the rate of recycling, providing environmentally-safe landfills and disposal of waste, conducting timely reclamation and maintenance of closed-down municipal waste dumps, and reducing the costs of pollution remediation.
• Armenia has adopted a waste law which includes economic instruments to stimulate waste treatment and recycling.
• Croatia has set specific targets for waste prevention, separate collection of waste, and recovery and recycling. Producer responsibility was introduced for various waste streams in 2006 (Croatia EA, 2007).
Based on the city studies and the report 'Assessment Reports on Priority Ecological Issues in Central Asia' (UNEP, 2006b), the level of implementation of legislation and the effort made by authorities to enforce them are rather low. Instruments to enforce the laws, regulations and strategies are not available in many of the countries. Several countries
Table 8.8 Replies on waste management issues from a UNEP policy questionnaire (2)
Sustainable consumption and production: policies, strategies and initiatives
Arm
enia
Aze
rbai
jan
Bel
arus
Bosn
ia a
nd H
erze
gov
ina
Cro
atia
FYR o
f M
aced
onia
Geo
rgia
Kaz
akhst
an
Kyr
gyz
stan
Rep
ublic
of M
old
ova
Monte
neg
ro
Russ
ian F
eder
atio
n
Ser
bia
Tajiki
stan
Turk
men
ista
n
Ukr
aine
Uzb
ekis
tan
Wast
e
Regulations/strategies on waste + + + + + + + + +
Regulations/strategies on industrial waste + + + + + + + + +
Regulations/strategies on municipal waste *+ + +
Measures encouraging waste prevention, minimisation and recycling
+ + + ** + + + + + + + +
Initiatives on sustainable waste management
+ + + + + + + +
Note: * In preparation; ** In the near future the law on waste management (when adopted) will outline instruments to encourage waste prevention, minimisation and recycling (UNEP questionnaire, 2006). Blue means no response received.
(2) Table 8.8 is based on an extensive UNEP policy questionnaire sent to all the SEE and EECCA countries in October 2006. The questionnaire covers issues such as Sustainable Consumption and Production: Policies, Strategies and Initiatives and Sector Specific Policy and Legal Issues (food production and consumption, building/housing, transport, waste and sustainable public procurement). It should be noted that not all countries have replied to the questionnaire.
Waste
168 Sustainable consumption and production in Southeast Europe and Eastern Europe, Caucasus and Central Asia
have formulated waste management plans and programmes. However, the general lack of resources and of inter-agency coordination as well as the absence of analysis of socioeconomic and ecological problems related to waste are commonly cited as representing significant barriers to implementation. Some countries also stress the lack of economic incentives as a barrier to implementing waste management in municipalities.
While not shown in Table 8.8, feedback from the survey included the dates of development of policies and strategies. It showed a period of intensive activity during the mid-1990s, when many countries developed waste management policies and strategies, followed by a very slow period until 2004. From 2004 onwards, and especially in 2005 and 2006, many countries began to develop new waste strategies.
8.3.2 Municipality as a key player in waste management
One issue explored in the city studies was whether the progress made in waste management was driven by national policies or city initiatives.
In all four cities common problems were identified (see Box 8.8) concerning the organisation of the waste sector:
• Planning problems and the absence of a strategy for waste and local management schemes. By the autumn of 2006 none of the cities had developed a strategy for municipal waste management.
• Administrative problems, including funding problems, poor cooperation and coordination between the involved authorities, and a weak control and enforcement system.
• Unsustainable waste management methods, including: unsanitary landfills with frequent fires and leakages and no methane collection; illegal landfills and fly tipping; lack of waste recycling and waste prevention schemes; delays in waste collection, littered streets and overfilled containers.
• Low public interest in environmental issues even though, in the case of waste, economic and environmental interests often converge for the public.
The city studies also showed, however, that various positive initiatives have been taking place at municipal level despite a lack of waste management
regulation or strategy at either national, regional or municipal level.
In the case of Belgrade, slow progress has been linked to the situation at national level. Better cooperation between national agencies involved in waste management has to be achieved, and coordination is also needed between the waste initiatives at the state and municipal levels. Finally, the states of Serbia and Montenegro separated in May 2006, and such fundamental changes at national level will have a major impact at municipal level (Gvozdenovic and Scekic, 2006).
In Bishkek a municipal programme was approved in 2006 to implement the Law on Production and Consumption Waste. Progress was mostly driven by initiatives taken at national level. In 2005 the government adopted a package of programmes on waste management including the state programme on waste management to implement the law 'On Industrial and Residential Wastes'. Initiatives concerning Bishkek's municipal waste strategy are still only at the planning stage. Since almost half of the population in Kyrgyzstan lives below the poverty line, it seems that effective handling of municipal waste in the city of Bishkek will depend on international donor support or on income from selling the CO2 quota under the Kyoto Protocol (Peshenuk, 2006).
In Dnipropetrovsk, a strategy and programme for municipal waste was passed in December 2006. Covering the period 2007–2011, the strategy aims to support comprehensive waste collection, including sorting and recycling of waste as well as increasing the standards for landfills. Both collection of waste and the disposal activities have been outsourced, and significant investments made in new equipment such as waste bins and waste collection trucks. In the case of Dnipropetrovsk strong action was taken by NGOs and the political and administrative sector to develop a municipal waste strategy for 2007–2011. The initiatives taken were in line with the national strategic waste management programme, even though only a few decisions have been made until now to implement national principles at municipal level. In this respect the city of Dnipropetrovsk has been a front-runner.
In Tbilisi, the municipal authorities have given priority to waste management issues in recent years due to the critical sanitary situation in the city. In 2006, the city doubled the total budget for waste management to improve waste collection. Responsibilities for waste collection and disposal activities were centralised, although actual services
Waste
169Sustainable consumption and production in Southeast Europe and Eastern Europe, Caucasus and Central Asia
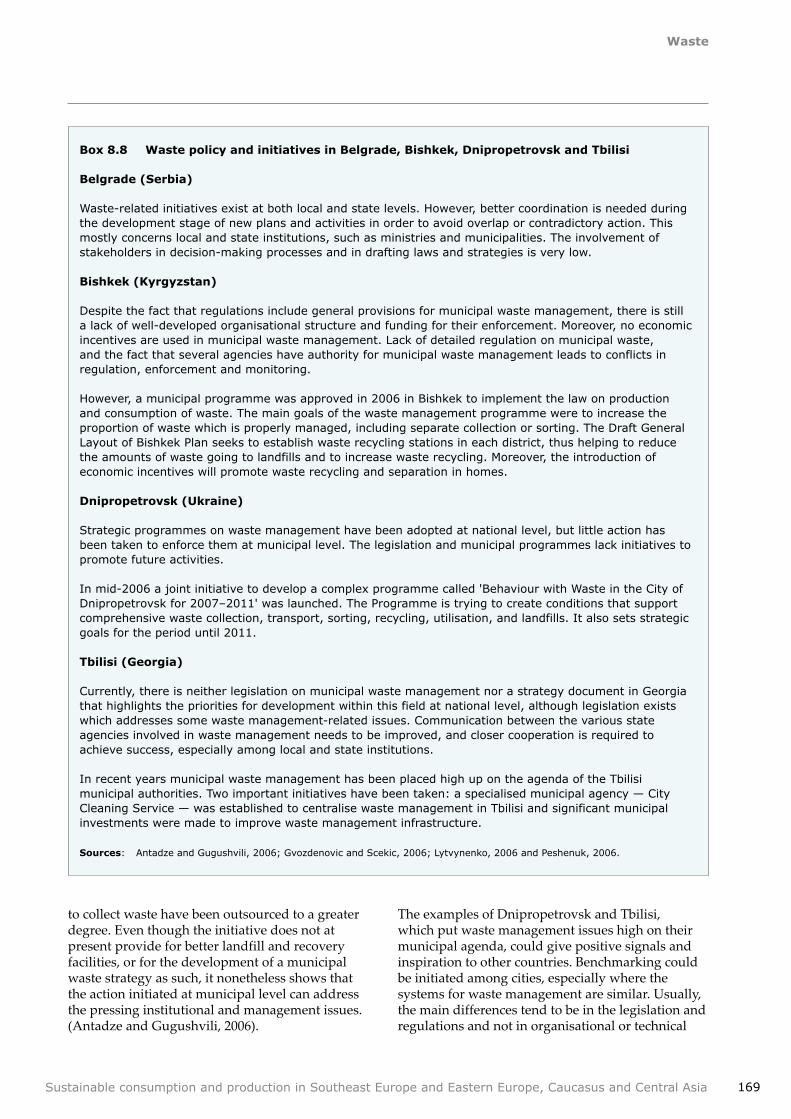
Box 8.8 Waste policy and initiatives in Belgrade, Bishkek, Dnipropetrovsk and Tbilisi
Belgrade (Serbia)
Waste-related initiatives exist at both local and state levels. However, better coordination is needed during the development stage of new plans and activities in order to avoid overlap or contradictory action. This mostly concerns local and state institutions, such as ministries and municipalities. The involvement of stakeholders in decision-making processes and in drafting laws and strategies is very low.
Bishkek (Kyrgyzstan)
Despite the fact that regulations include general provisions for municipal waste management, there is still a lack of well-developed organisational structure and funding for their enforcement. Moreover, no economic incentives are used in municipal waste management. Lack of detailed regulation on municipal waste, and the fact that several agencies have authority for municipal waste management leads to conflicts in regulation, enforcement and monitoring.
However, a municipal programme was approved in 2006 in Bishkek to implement the law on production and consumption of waste. The main goals of the waste management programme were to increase the proportion of waste which is properly managed, including separate collection or sorting. The Draft General Layout of Bishkek Plan seeks to establish waste recycling stations in each district, thus helping to reduce the amounts of waste going to landfills and to increase waste recycling. Moreover, the introduction of economic incentives will promote waste recycling and separation in homes.
Dnipropetrovsk (Ukraine)
Strategic programmes on waste management have been adopted at national level, but little action has been taken to enforce them at municipal level. The legislation and municipal programmes lack initiatives to promote future activities.
In mid-2006 a joint initiative to develop a complex programme called 'Behaviour with Waste in the City of Dnipropetrovsk for 2007–2011' was launched. The Programme is trying to create conditions that support comprehensive waste collection, transport, sorting, recycling, utilisation, and landfills. It also sets strategic goals for the period until 2011.
Tbilisi (Georgia)
Currently, there is neither legislation on municipal waste management nor a strategy document in Georgia that highlights the priorities for development within this field at national level, although legislation exists which addresses some waste management-related issues. Communication between the various state agencies involved in waste management needs to be improved, and closer cooperation is required to achieve success, especially among local and state institutions.
In recent years municipal waste management has been placed high up on the agenda of the Tbilisi municipal authorities. Two important initiatives have been taken: a specialised municipal agency — City Cleaning Service — was established to centralise waste management in Tbilisi and significant municipal investments were made to improve waste management infrastructure.
Sources: Antadze and Gugushvili, 2006; Gvozdenovic and Scekic, 2006; Lytvynenko, 2006 and Peshenuk, 2006.
to collect waste have been outsourced to a greater degree. Even though the initiative does not at present provide for better landfill and recovery facilities, or for the development of a municipal waste strategy as such, it nonetheless shows that the action initiated at municipal level can address the pressing institutional and management issues. (Antadze and Gugushvili, 2006).
The examples of Dnipropetrovsk and Tbilisi, which put waste management issues high on their municipal agenda, could give positive signals and inspiration to other countries. Benchmarking could be initiated among cities, especially where the systems for waste management are similar. Usually, the main differences tend to be in the legislation and regulations and not in organisational or technical
Waste
170 Sustainable consumption and production in Southeast Europe and Eastern Europe, Caucasus and Central Asia
matters. However, the main issue at this point is to secure interest and support at political level, and get the local authorities and state agencies to work together to achieve the necessary modernisation and improvements (Antadze and Gugushvili, 2006).
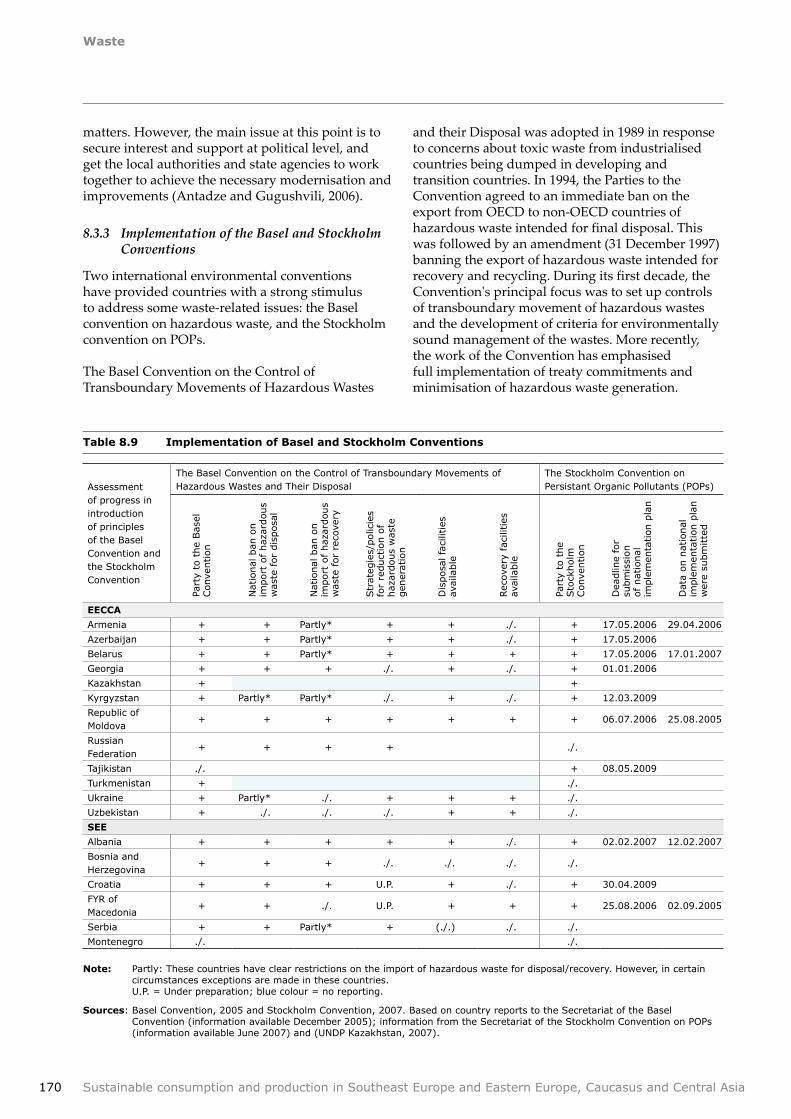
8.3.3 Implementation of the Basel and Stockholm Conventions
Two international environmental conventions have provided countries with a strong stimulus to address some waste-related issues: the Basel convention on hazardous waste, and the Stockholm convention on POPs.
The Basel Convention on the Control of Transboundary Movements of Hazardous Wastes
and their Disposal was adopted in 1989 in response to concerns about toxic waste from industrialised countries being dumped in developing and transition countries. In 1994, the Parties to the Convention agreed to an immediate ban on the export from OECD to non-OECD countries of hazardous waste intended for final disposal. This was followed by an amendment (31 December 1997) banning the export of hazardous waste intended for recovery and recycling. During its first decade, the Convention's principal focus was to set up controls of transboundary movement of hazardous wastes and the development of criteria for environmentally sound management of the wastes. More recently, the work of the Convention has emphasised full implementation of treaty commitments and minimisation of hazardous waste generation.
Table 8.9 Implementation of Basel and Stockholm Conventions
Assessment of progress in introduction of principles of the Basel Convention and the Stockholm Convention
The Basel Convention on the Control of Transboundary Movements of Hazardous Wastes and Their Disposal
The Stockholm Convention on Persistant Organic Pollutants (POPs)
Part
y to
the
Bas
el
Conve
ntion
Nat
ional
ban
on
import
of haz
ardous
was
te for
dis
posa
l
Nat
ional
ban
on
import
of haz
ardous
was
te for
reco
very
Str
ateg
ies/
polic
ies
for
reduct
ion o
f haz
ardous
was
te
gen
erat
ion
Dis
posa
l fa
cilit
ies
avai
lable
Rec
over
y fa
cilit
ies
avai
lable
Part
y to
the
Sto
ckholm
Conve
ntion
Dea
dlin
e fo
r su
bm
issi
on
of nat
ional
im
ple
men
tation p
lan
Dat
a on n
atio
nal
im
ple
men
tation p
lan
wer
e su
bm
itte
d
EECCA
Armenia + + Partly* + + ./. + 17.05.2006 29.04.2006
Azerbaijan + + Partly* + + ./. + 17.05.2006
Belarus + + Partly* + + + + 17.05.2006 17.01.2007
Georgia + + + ./. + ./. + 01.01.2006
Kazakhstan + +
Kyrgyzstan + Partly* Partly* ./. + ./. + 12.03.2009
Republic of Moldova
+ + + + + + + 06.07.2006 25.08.2005
Russian Federation
+ + + + ./.
Tajikistan ./. + 08.05.2009
Turkmenistan + ./.
Ukraine + Partly* ./. + + + ./.
Uzbekistan + ./. ./. ./. + + ./.
SEE
Albania + + + + + ./. + 02.02.2007 12.02.2007
Bosnia and Herzegovina
+ + + ./. ./. ./. ./.
Croatia + + + U.P. + ./. + 30.04.2009
FYR of Macedonia
+ + ./. U.P. + + + 25.08.2006 02.09.2005
Serbia + + Partly* + (./.) ./. ./.
Montenegro ./. ./.
Note: Partly: These countries have clear restrictions on the import of hazardous waste for disposal/recovery. However, in certain circumstances exceptions are made in these countries. U.P. = Under preparation; blue colour = no reporting.
Sources: Basel Convention, 2005 and Stockholm Convention, 2007. Based on country reports to the Secretariat of the Basel Convention (information available December 2005); information from the Secretariat of the Stockholm Convention on POPs (information available June 2007) and (UNDP Kazakhstan, 2007).
Waste
171Sustainable consumption and production in Southeast Europe and Eastern Europe, Caucasus and Central Asia
The Stockholm Convention on Persistent Organic Pollutants (POPs) was adopted in 2001 in response to the urgent need for global action to protect human health and the environment from 'POPs'. These chemicals are highly toxic and persistent; they bio-accumulate and move over long distances in the environment. The Convention seeks the elimination or restriction of production and use of all intentionally produced POPs (i.e. industrial chemicals and pesticides).
All EECCA and SEE countries except Tajikistan are party to the Basel Convention.
Nine countries are party to the Stockholm Convention (Table 8.9). In addition, Albania, Armenia, Bosnia and Herzegovina, the Republic of Moldova and the former Yugoslav Republic of Macedonia have submitted national implementation plans of the Stockholm Convention. All five plans have been developed with the support of the United Nations.
These international conventions seem to have motivated the EECCA and SEE countries to initiate and develop strategies, legislation and action plans regarding management of hazardous waste and chemicals, including pesticides. Much of this work was made possible through donor-funded programs and international aid.
8.4 Opportunities for improving waste management
Even though the situation in each individual EECCA and SEE country has its own characteristics, some similarities and differences in waste problems are highlighted in Table 8.10.
As shown, all EECCA and SEE countries would benefit from improvements in their waste management systems, both in the development of policies and the actual management of the waste. Some areas requiring attention include:
Similarities Differences
• All EECCA and SEE countries currently face problems with proper collection, treatment and disposal of waste.
• Some EECCA and SEE countries have in recent years made improvements in collecting data on generation and treatment of waste.
• Contrary to the situation in the EU, regulations and legal requirements have not resulted in significant improvements in waste management in the SEE and EECCA regions.
• Several countries have in recent years initiated activities to implement EU standards for waste facilities (e.g. Croatia and Ukraine).
• While some progress has been made in addressing hazardous and radioactive waste and certain industrial wastes, there has been no significant improvement in the municipal waste sector over the last 10–15 years. Most municipal waste is disposed of in landfills which do not meet even the lowest environmental standards.
• In addition to formulating framework waste strategies, several countries are now developing more detailed action plans and legislation for waste.
• The development of waste strategies and legislation, and their implementation have mainly progressed in those areas where countries have international obligations or responsibilities, for example, the Basel and Stockholm Conventions. Much of this work was carried out through donor-funded programs.
• Some countries have been subject to attempts to ship hazardous waste illegally.
• Under the centrally planned economy there was a tradition and a functioning system of recycling and reuse of waste. Today, recycling is mainly driven by economic incentives, and therefore has focused on industrial waste and not on municipal waste, where recycling and recovery is more complicated. At the same time, some existing recycling facilities face a shortage of recyclable waste necessary for their operation.
• A few countries have successfully introduced deposits on one-way packaging.
• In general, there is a lack of data (and lack of related data collection systems) on generation and treatment of waste, including municipal waste.
• Due to the financial difficulties which many municipalities face, simple but important routine tasks such as municipal waste collection often do not function reliably. In most cases, the service costs are not covered by the payments.
• While reuse of bottles still exists in many EECCA countries, single-use disposable packaging is increasingly taking over.
• Development and implementation of waste strategies and action plans still seem to depend largely on external assistance.
Table 8.10 Overview of similarities and differences in waste management

Waste
172 Sustainable consumption and production in Southeast Europe and Eastern Europe, Caucasus and Central Asia
• improving collection of data and information about the amounts and composition of waste;
• development and implementation of waste strategies and related legislation. This could include defining preferred treatment options for different waste streams, setting up goals for recycling, ensuring proper standards for disposal and recovery facilities;
• better enforcement of standards and regulations;
• reviewing the waste tariff system to implement the polluter-pays-principle and providing stronger financial incentives for better waste management and waste prevention;
• raising public awareness of waste issues and providing the mechanism for public involvement in waste management decisions;
• strengthening political commitment and coordination between the different authorities at national, regional and city levels.
Experience has shown that even if framework waste strategies are not yet in place, certain necessary elements have already been developed and various initiatives taken to improve waste management. Specifically:
• Some progress has been made in waste data collection, notably in Belarus, Croatia, the Russian Federation and Ukraine. Such information is a first and necessary step for developing both short-term and long-term waste strategies. Providing this information requires close cooperation between different authorities. At national level this would be between the environmental authorities and, for example, the statistics office; at the city level, between the waste management services and the financial, legal or policy departments.
• Hazardous waste strategies and chemical protection plans have already been developed or are being developed in many of the countries as a result of obligations under international treaties. While such strategies are often developed with the assistance of international organizations or donor programs, some examples presented in this chapter show that it is possible to initiate waste strategy development regardless of the source of financing.
• Vast amounts of waste in the EECCA and SEE countries are generated in resource mining and processing activities. Strategies for prevention and proper management of these kinds of waste, including recycling and resource recovery, can considerably reduce the amount of waste generated and its environmental impacts.
• When a country succeeds in combining economic incentives with legislative requirements, it is possible to manage effectively certain types of waste. The success of a packaging policy in Croatia is a good example of how a political goal, combined with the introduction of a deposit-refund system, can achieve excellent results.
• Functioning systems for reuse of packaging were in place in the former Soviet Union. To prevent the closing down of those reuse systems in the EECCA countries (due to the introduction of one-way packaging), ways need to be found to maintain or modernise them.
• In many municipalities in EECCA and SEE countries, only limited or minimal investments in waste management were made in the 1990s. The systems to collect waste need to be modernised, including waste bins and collection trucks. Recently, investments in new equipment have been made, for example, in Dnipropetrovsk (Ukraine), Tashkent (Uzbekistan) (EEA, 2007) and Tbilisi (Georgia). When such major investments are required, options should be considered not only to invest in new bins and trucks with compacting facilities, but also to include recycling and utilisation of the waste resources, e.g. waste bins for the separation of waste at source or trucks which are able to transport separately various recyclable waste materials in addition to collecting mixed waste.
• Municipal waste in the EECCA and SEE countries includes significant quantities of paper, cardboard and PET plastics. These kinds of waste have a measurable economic value and could be separated out and diverted away from landfills. This is especially relevant given that some existing recycling facilities (for example, those recycling waste paper) do not receive enough waste material necessary for their operations.
• Almost none of the landfills operated in the EECCA and SEE countries have methane collection or other higher-standard
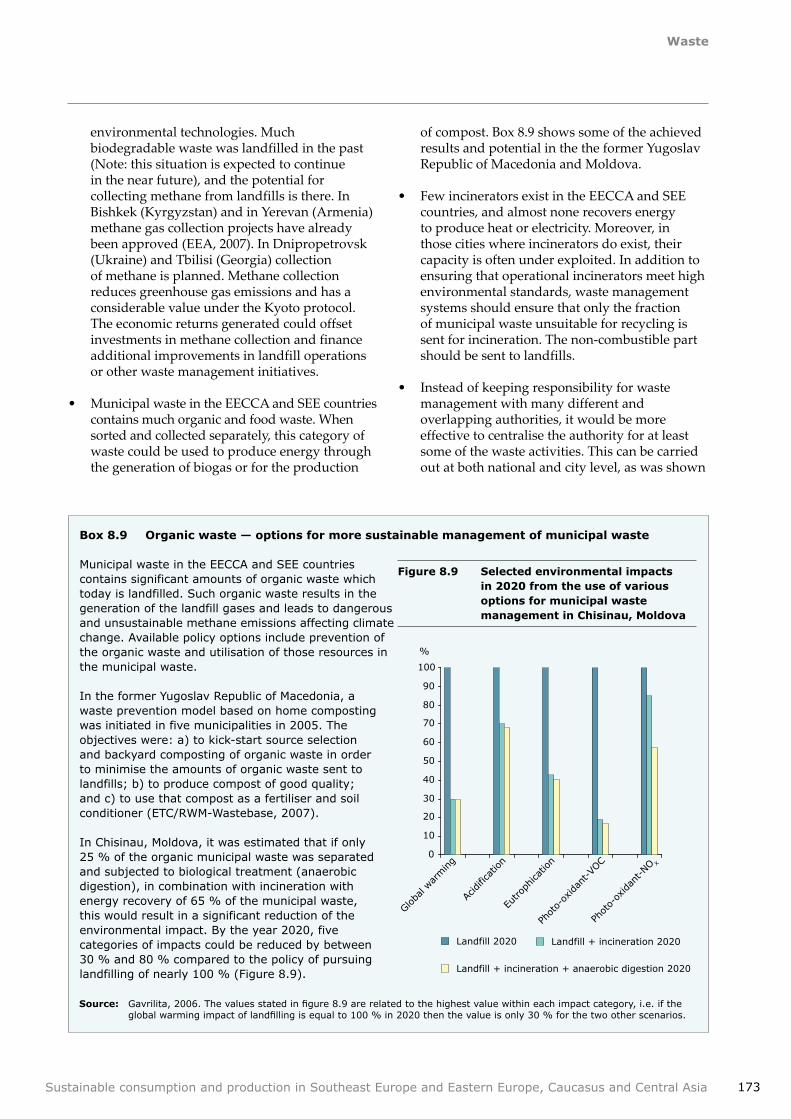
Waste
173Sustainable consumption and production in Southeast Europe and Eastern Europe, Caucasus and Central Asia
environmental technologies. Much biodegradable waste was landfilled in the past (Note: this situation is expected to continue in the near future), and the potential for collecting methane from landfills is there. In Bishkek (Kyrgyzstan) and in Yerevan (Armenia) methane gas collection projects have already been approved (EEA, 2007). In Dnipropetrovsk (Ukraine) and Tbilisi (Georgia) collection of methane is planned. Methane collection reduces greenhouse gas emissions and has a considerable value under the Kyoto protocol. The economic returns generated could offset investments in methane collection and finance additional improvements in landfill operations or other waste management initiatives.
• Municipal waste in the EECCA and SEE countries contains much organic and food waste. When sorted and collected separately, this category of waste could be used to produce energy through the generation of biogas or for the production
Box 8.9 Organic waste — options for more sustainable management of municipal waste
Municipal waste in the EECCA and SEE countries contains significant amounts of organic waste which today is landfilled. Such organic waste results in the generation of the landfill gases and leads to dangerous and unsustainable methane emissions affecting climate change. Available policy options include prevention of the organic waste and utilisation of those resources in the municipal waste.
In the former Yugoslav Republic of Macedonia, a waste prevention model based on home composting was initiated in five municipalities in 2005. The objectives were: a) to kick-start source selection and backyard composting of organic waste in order to minimise the amounts of organic waste sent to landfills; b) to produce compost of good quality; and c) to use that compost as a fertiliser and soil conditioner (ETC/RWM-Wastebase, 2007).
In Chisinau, Moldova, it was estimated that if only 25 % of the organic municipal waste was separated and subjected to biological treatment (anaerobic digestion), in combination with incineration with energy recovery of 65 % of the municipal waste, this would result in a significant reduction of the environmental impact. By the year 2020, five categories of impacts could be reduced by between 30 % and 80 % compared to the policy of pursuing landfilling of nearly 100 % (Figure 8.9).
Figure 8.9 Selected environmental impacts in 2020 from the use of various options for municipal waste management in Chisinau, Moldova
0
10
20
30
40
50
60
70
80
90
100
Globa
l war
ming
Acidifica
tion
Eutro
phica
tion
Phot
o-ox
idan
t-VOC
Phot
o-ox
idan
t-NO X
Landfill 2020 Landfill + incineration 2020
Landfill + incineration + anaerobic digestion 2020
%
Source: Gavrilita, 2006. The values stated in figure 8.9 are related to the highest value within each impact category, i.e. if the global warming impact of landfilling is equal to 100 % in 2020 then the value is only 30 % for the two other scenarios.
of compost. Box 8.9 shows some of the achieved results and potential in the the former Yugoslav Republic of Macedonia and Moldova.
• Few incinerators exist in the EECCA and SEE countries, and almost none recovers energy to produce heat or electricity. Moreover, in those cities where incinerators do exist, their capacity is often under exploited. In addition to ensuring that operational incinerators meet high environmental standards, waste management systems should ensure that only the fraction of municipal waste unsuitable for recycling is sent for incineration. The non-combustible part should be sent to landfills.
• Instead of keeping responsibility for waste management with many different and overlapping authorities, it would be more effective to centralise the authority for at least some of the waste activities. This can be carried out at both national and city level, as was shown

Waste
174 Sustainable consumption and production in Southeast Europe and Eastern Europe, Caucasus and Central Asia
by the experience of Tbilisi where collection and disposal of waste were coordinated in one unit.
• Benefits can also be gained from regional cooperation. A recent UNEP report recommended creating '… a single regional scheme of waste management for Central Asia Countries' (UNEP, 2006b).
8.5 Conclusions
The challenges of introducing effective and sustainable waste management in the EECCA and SEE countries are enormous. Available information shows that little improvement has been achieved in waste management over the last five to seven years:
• generation of all types of wastes, including hazardous waste, is increasing;
• proper collection systems of waste are lacking and there is no separate collection of municipal hazardous waste;
• although some industrial waste is recycled, most waste is landfilled on sites of low technological standards;
• progress has been limited in work on waste strategies, action plans and relevant legislation. However, since 2005 several countries have begun to develop new waste strategies;
• despite some improvements in the availability of waste data, collection and processing of data on waste generation and management need further improvement;
• price mechanisms used in waste management are still not effective in creating incentives for waste prevention.
However, there are also some positive signs. Concerning municipal waste, some improvements began emerging in 2006, especially at municipal as well as, in some cases, provincial level. As regards policy development, preparation of a new generation of waste strategies and legislation is under way although the results of these improvements are yet to be seen.
General improvements at national and city levels will require a step-wise approach and a long-term horizon. Individual countries in the EECCA and SEE regions have very different starting points
concerning existing waste management systems. However, there are also opportunities to draw from country experience to avoid common problems.
In many cases municipal waste management systems have to undergo major modifications, or even be completely rebuilt. Here, lessons could be learned from the experience within the EU concerning more SCP-oriented waste management. Initially, the policy goal at the EU was to ensure proper collection of mixed waste and to assure safe landfilling. The approach was subsequently adjusted to separate recyclable waste fractions from the mixed waste; firstly, to increase recycling or resource recovery from wastes, and then to limit landfilling to non-recyclable wastes only. The EECCA and SEE countries could draw on this experience, gaining both environmental and economic benefits in the process.
Many of the following considerations could prove useful in the effort to modernise waste management both at national and municipal level in EECCA and SEE.
Short term recommendations (1–5 years)
Efforts could focus on:
• improving data gathering and information collection, to provide the basis for development of waste policies at national and local levels;
• developing waste strategies which set short, medium and long-term goals, and which differentiate approaches for industrial and municipal waste;
• improving coordination and cooperation between the different authorities dealing with waste at national, regional and municipal level. This should include more clear division of tasks and allocation of responsibilities to avoid overlaps;
• demonstrating that waste is often a valuable raw material with a measurable economic value (including building and demolition waste), and increasing awareness among industries about recycling opportunities and technical options;
• better regulation of waste from industry, with management options reflecting an integrated pollution prevention and control approach, and improving enforcement and control systems;
Waste
175Sustainable consumption and production in Southeast Europe and Eastern Europe, Caucasus and Central Asia
• modernising existing systems for municipal waste management with a view to:
- providing a sufficient number of waste bins and ensure regular collection of waste;
- implementing separation of waste at source, to collect those waste fractions which can easily be reused or recycled;
- introduce collection trucks with compacting facility and, if possible, with the ability to collect separately different kinds of recyclable waste materials;
- improving the efficiency of street cleaning;- revising the tariff system for waste collection
and disposal, to improve payment collection rates and better link the fees with the actual waste generation;
- ensure regular collection of data on the quantity and composition of municipal waste and use the results in planning;
- introduce weighbridges at a minimum at the landfills, to collect data on the amounts of waste and to give a better basis for the calculation of disposal fees;
- separately collect and safely dispose of medical and hazardous waste;
- carry out better audits and inspections of the existing waste management facilities.
• making the most urgently needed improvements to ensure that the waste is landfilled in a proper way, to minimise illegal waste dumping, and to assure minimum technical standards for safe landfilling. The financing mechanisms under the Kyoto protocol (e.g. methane collection) could be used to cover part of the expenses;
• raising public awareness about waste issues and about concrete actions they can take;
• setting up legal requirements for the management of packaging wastes (for example, a deposit-refund system for beverage containers) and strengthening reuse of packaging;
• putting in place economic and legislative incentives to encourage reuse and recycling.
Medium term recommendations (6–10 years)
In addition to implementing the adopted waste strategies, waste management policies could aim at improving the situation through:
• achieving better cooperation between the public waste sector and the private sector. This could be achieved, for instance, by creating joint public
and private companies, and making provisions for private companies to invest in and operate the waste management sector;
• stopping completely the illegal landfilling and dumping of waste;
• ensuring that all new landfills are constructed in compliance with modern environmental standards. EU standards could provide a guidance in this respect;
• wider introduction of separate collection of certain recyclables in households and businesses;
• implementing more advanced recycling schemes and technologies for certain waste types, such as electrical and electronic waste; and
• ensuring that new and existing incinerators comply with high technical standards, such as those used in the European Union.
Regardless of whether the activities are to be implemented in the short or medium term, it is necessary to start planning their implementation today.
References
Antadze and Gugushvili, 2006. Characteristics of the Waste Management System in Tbilisi, Georgia. City study by Nino Antadze and Tamuna Gugushvili.
Basel Convention, 2005. The Secretary of the Basel Convention. http://www.unep.ch/.
Britanica, 2007. Manufacture company of plastic roofs, http://lugabrit.com.ua/en/company.php.
Cherp, A. and Mnatsakanian R., 2003. Environmental degradation in Eastern Europe, Caucasus and Central Asia: past roots, present transition and future hopes. http://www.ceu.hu/envsci/aleg/research/EnvDegradationEastEurope090903.pdf.
COWI, 2004. Ukraine National Municipal Solid Waste Strategy, 2004. Ministry of the Environment, Denmark and Ukraine State Committee for Housing and Municipal Services.
Croatia EA, 2007. Comments received from the Croatian Environment Agency through the review process (15 June 2007).
Waste
176 Sustainable consumption and production in Southeast Europe and Eastern Europe, Caucasus and Central Asia
EEA, 2007. Europe's environment —The fourth assessment, pp 251–289, The European Environment Agency, Copenhagen 2007.
ETC/RWM-wastebase, 2007. Success Stories on Waste Prevention Management, the European Topic Centre on Resource and Waste. http://waste.eionet.europa.eu/wastebase/prevention.
Eurostat, 2007. Environment and Energy, Waste http://epp.eurostat.ec.europa.eu/portal/page?_pageid=1996,45323734&_dad=portal&_schema=PORTAL&screen=welcomeref&open=/envir/env/env_wasr&language=en&product=EU_MAIN_TREE&root=EU_MAIN_TREE&scrollto=517.
Gavrilita, 2006. Environmental Systems Analysis of Municipal Solid Waste Management in Chisinau, Moldova-Current situation and future perspectives,. Master thesis made by Pavel Gavrilita, Stockholm 2006.
GEO Year Book, 2006. Global Environment Outlook 2006. United Nations Environment Programme. http://www.unep.org/geo/yearbook/yb2006/028.asp.
Gonopolsky, 2006. The Waste Recycling Industry in the Russian Federation: Challenges and Prospects. http://w2007.sibico.com/print.php?content=list§ion_id=12.
Gvozdenovic and Scekic, 2006. Characteristics of the Waste Management System in Belgrade, Serbia. City study by Milka Gvozdenovic and Jelena Scekic, Young researchers of Serbia, 2006.
Kazakhstan MEP, 2006a. Industrial and domestic wastes. Ministry of Environment Protection, 2006.
Kazakhstan MEP, 2006b. National Profile, Assessment of the national infrastructure on chemicals management in the Republic of Kazakhstan. Ministry of Environmental Protection of the Republic of Kazakhstan, 2006.
Linzner, 2004. Municipal solid waste management in the City of Belgrade‑Current situation and perspectives. Master Thesis, Vienna, 2004.
Lytvynenko, 2006. Characteristics of the Waste Management System in Dnipropetrovsk, Ukraine. City study by Alla Lytvynenko, Youth Environmental League of Prydniprovya (MELP), 2006.
Myronchuk, 2006. Industrial development in Donetsk Region. City Study by Maryna Myronchuk, National University of Donetsk, 2006.
MOE Croatia, 2006. Overhead presentation of the Ministry of Environmental Protection, Physical Planning and Construction.
Peshenuk, 2006. Characteristics of the Waste Management System in Bishkek, Kyrgyz Republic. City study by Oleg Peshenuk, Independent Ecological Expertise.
REC, 2003. Regional Approach to the Management of Hazardous Wastes in the Western Balkans. Regional Environmental Centre for Central and Eastern Europe, 2003.
REC, 2006. Advancement in hazardous waste management in Southern‑Eastern Europe between 2003 and 2005. Regional Environmental Centre for Central and Eastern Europe, draft, 2006.
Serbia MME, 2002. Mineral deposits and mining districts of Serbia, Compilation map and GIS databases by Monthel, J.; Vadala, P.; Leistel, J. M.; and Cottard, F. Ministry of Mining and Energy of the Republic of Serbia, 2002.
SOE Belarus, 2004. Environmental Conditions in Belarus 2003. Ministry of Natural Resources and Environmental Protection of the Republic of Belarus, 2004.
SOE Russia, 2004. State of the Environment in the Russian Federation. Russian Federation, 2004.
Stockholm Convention, 2007. The Secretary of the Stockholm Convention on Persistent Organic Pollutants: http://www.pops.int/siteinfo/
TACIS, 2002. Improvement of the Solid Domestic Waste Management in Donetsk Oblast of Ukraine.
UNDP Kazakhstan, 2007. Information received from Ms Aliya Tonkobayeva, UNDP's Office in Kazakhstan through the review process.
UNECE, 1999. Environmental Performance Review — Ukraine. United Nations Economic Commission for Europe.
UNECE, 2000. Environmental Performance Review — Kazakhstan. United Nations Economic Commission for Europe.
UNECE, 2005. Environmental Performance Review — Belarus. United Nations Economic Commission for Europe.
UNECE, 2006. Environmental Performance Review — Ukraine. United Nations Economic Commission for Europe.
UNEP, 2006a. Sustainable production and consumption: Policy of the Russian Federation.
UNEP, 2006b. Assessment Reports on priority Ecological Issues in Central Asia (Draft November 2006).
Waste
177Sustainable consumption and production in Southeast Europe and Eastern Europe, Caucasus and Central Asia
UNEP, 2006c: 'South Eastern European mining-related risks: Identification and verification of 'environmental hot spots'. Draft http://www.envsec.org/see/pub/Draft%20report%20of%20the%20SEE%20mining%20risks-%20Sept%202006%20.pdf
UNEP questionnaire, 2006. UNEP policy questionnaire sent to all the EECCA and SEE countries in October 2006.
UN survey, 2006. United Nations Statistics Division carried out in 2006 a waste survey covering the EECCA and SEE countries. Not published yet.
UNITAR, 2006. National profile of chemicals and waste management. Yerevan, 2005.
UNSD, 2004. UNSD waste survey, 2004. United Nations Statistics Division, 2004.
Waste Tech Conference, 2005. Scrap metal collection increased by 30%. http://www.sibico.com/waste-tech/2005/.
World Bank, 2006. World Bank World Development Indicators, GDP per Capita, (constant 2000 international dollars) and Population.