sustainable consumption and production: a handbook for policymakers
TRANSCRIPT


Released on World Environment Day 2015
Copyright © United Nations Environment Programme, 2015
This publication may be reproduced in whole or in part and in any form for educational or non-profit purposes without special permission from the copyright holder, provided acknowledgement of the source is made. UNEP would appreciate receiving a copy of any publication that uses this publication as a source.
No use of this publication may be made for resale or for any other commercial purpose whatsoever without prior permission in writing from the United Nations Environment Programme.
DisclaimerThe designations employed and the presentation of the material in this publication do not imply the expression of any opinion whatsoever on the part of the United Nations Environment Programme concerning the legal status of any country, territory, city or area or of its authorities, or concerning delimitation of its frontiers or boundaries. Moreover, the views expressed do not necessarily represent the decision or the stated policy of the United Nations Environment Programme, nor does citing of trade names or commercial processes constitute endorsement.
ISBN: 978-92-807-3364-8
UNEP promotes environ-
mentally sound practices globally and in its own activities.
This publication is printed on 100% eco-fibers paper, using vegetable
-based inks and other eco-friendly practices. Our distribution policy aims
to reduce UNEP’s carbon footprint.

Sustainable Consumptionand Production
Global edition
A Handbook for Policymakers

ContentsForeword 3
Acknowledgements 4
List of Acronyms 5
Introduction 7
Part A : AN INTRODUCTION TO SCP POLICY 8 1 Introduction to Sustainable Consumption and Production (SCP) 9 1.1 Defining SCP 10 1.2 Why is SCP important for sustainable development? 12 2 The Fundamentals of SCP 33 2.1 Linkages between poverty reduction and SCP 34 2.2 Life-cycle thinking and a systems approach 37 3 The 10YFP and International Collaboration on SCP 47 3.1 The evolution of SCP in international policy 48 3.2 International collaboration on SCP 53 4 Policy Development 61 4.1 The policy cycle 62 4.2 Policy tools and instruments for SCP 68 5 Policy Implementation 79 5.1 Obtaining political support and mainstreaming the SCP agenda 80 5.2 Structures and processes for policy implementation 86 6 Monitoring and Evaluation 93 6.1 Understanding monitoring and evaluation 94 6.2 SCP indicators 97
Part B : THEMATIC POLICY OPPORTUNITIES 106 7 Resource Efficiency and Cleaner Production 107 8 Sustainable Lifestyles 117 8.1 Supporting sustainable consumption choices 118 8.2 Choice editing and restrictions on advertising 128 8.3 Sustainable products and product information 131 9 Strategic Investments Towards Resource Efficient Cities 139 10 Sustainable Public Procurement (SPP) 157 11 Sustainable Tourism 167
Overarching policy opportunities 179
12 Fiscal Reforms 180 13 Redefining Education for SCP 188 14 Energy Efficiency 198
References 207

3page
Foreword
As the financial and environmental costs of resource depletion and negative ecological impacts begin to affect economic growth, countries around the world need to find ways to manage finite resources while meeting the needs of a growing and increasingly urban world population. By integrating sustainable consumption and production (SCP) patterns into national development planning and implementation, policymakers can make it easier and cheaper to produce goods and services more efficiently, with lower risks to humankind and the environment.
For example, recent research undertaken by United Nations Environment Programme (UNEP) shows that improved efficiency can reduce energy demand by 50 to 80 per cent for most production and utility systems. Some 60 to 80 per cent improvements in energy and water efficiency are commercially viable in sectors such as construction, agriculture, hospitality, industry and transport. The means to achieving such efficiency gains are outlined for the first time in this comprehensive publication. “Sustainable Consumption and Production : A Handbook for Policymakers” is launched at the occasion of World Environment Day 2015 and it is a direct contribution of UNEP towards the implementation of the 10-Year Framework of Programmes on SCP (10YFP), which was formed in response to the recommendations of the Rio+20 Summit. These called for greater support for developing countries to adopt more sustainable patterns of consumption and production.
The handbook contains a rich compilation of SCP definitions, case studies from all over the world, policy instruments, policy implementation processes, monitoring and evaluation methodologies and indicators. It also contains compelling data on both the impact of unsustainable consumption and production, and the efficiency gains to be made by mainstreaming SCP patterns.
Using this handbook, UNEP and its partners have already implemented capacity building activities that are leading to the development of SCP policies at national levels.
We hope that the guidance provided in this very practical publication will assist governments and other organizations to use SCP policies and tools to realize national development goals through greater resource efficiency gains, lower production costs and job creation. Better management of consumption patterns through smart policies and smart living will help create an alternative model of economic growth, in which the needs of the many are better met by the smarter management of precious resources.
Achim SteinerUnder-Secretary-General of the United Nationsand Executive Director, United Nations Environment Programme (UNEP)
4page
AcknowledgementsThis Handbook is an output of UNEP’s work towards the implementation of the 10-Year Framework of Programmes on Sustainable Consumption and Production (SCP). This global edition is based on a pilot edition for Asia and the Pacific region that was developed under the EU funded and UNEP managed Regional Policy Support Component of the SWITCH-Asia programme. The Handbook is based on original work authored by a group of senior experts and UNEP staff and previous work that UNEP has compiled on SCP over the last ten years. While any complete reference should acknowledge hundreds of individuals that have contributed to UNEP’s work on SCP, only the core team that developed and reviewed this work is acknowledged.
Concept, Supervision and Global Coordination: Stefanos Fotiou
Outline: Stefanos Fotiou, Lewis Akenji, Magnus Bengtsson, Emily Briggs
Regional Coordination and Inputs Africa: Patrick Mwesigye Asia and the Pacific: Stefanos Fotiou and Janet Salem Europe: Rie Tsutsumi Latin America and the Caribean: Ines Freier and Mara Murillo North America: Hilary French West Asia: Fareed Bushehri
Authors: Lewis Akenji, Magnus Bengtsson, Emily Briggs, Anthony Chiu, Giuseppe Daconto, Zinaida Fadeeva, Stefanos Fotiou, Rajan Gandhi, Charlie Mathews, Graciela Metternicht, Brahmanand Mohanty, Janet Salem, Janya Sang-Arun, Tunnie Srisakulchairak, Heinz Schandl, Mario Tabucanon
Editor: Emily Briggs
Reviewers and Contributors Khairoon Abbas, Charles Arden-Clarke, Sandra Averous, Garrette Clarke, Loraine Gatlabayan, Curt Garrigan, Arab Hoballah, Solange Montillaud-Joyel, Patrick Mwesigye, Soraya Smaoun, Anna Stabrawa, Sonia Valdivia, Farid Yaker, Adriana Zacarias
Logistic and Technical Support: Chanthakarn Junnatasna, Emee R. Tan
Design/Layout: Peerayot Sidonrusmee
Cover photo: Idris Prasetiawan

5page
List of Acronyms 10YFP 10 Year Framework Programmes 3R Reduce, Reuse, Recycle ADB Asian Development Bank AEEAP ASEAN Environmental Education Action Plan AfDB African Development Bank APELL Awareness and Preparedness for Emergencies at Local Level APFED Asia-Pacific Forum for Environment and Development ASEAN Association of Southeast Asian Nations CP Cleaner Production CP4BP Cleaner Production for Better Products CSR Corporate Social Responsibility D4S Design for Sustainability DE Domestic Extraction DMC Domestic Material Consumption EBTR Ecological Budget and Tax Reform ESD Education for Sustainable Development GDP Gross Domestic Product GHG Green House Gases GSTC Global Sustainable Tourism Council IMO International Maritime Organization LP Labour Productivity MEA Multilateral Environmental Agreement MP Marrakesh Process MTF Marrakesh Task Force NRDC Natural Resource Defence Council PPP Purchasing Power Parity OECD Organisation for Economic Co-operation and Development PSM Process Safety Management PTB Physical Trade Balance RE Resource Efficiency RECP Resource Efficiency and Cleaner Production SCP Sustainable Consumption and Production SPP Sustainable Public Procurement SPIN Sustainable Product Innovation TVET Technical and Vocational Education and Training TPES Total Primary Energy Supply UNEP United Nations Environment Programme UNESCAP United Nations Economic and Social Commission for Asia and the Pacific UNESCO United Nations Education, Scientific and Cultural Organization UNIDO United Nations Industrial Development Organization UNU/IAS United Nations University/Institute of Advanced Studies UNWTP United Nations World Tourism Organization WTO World Trade Organization

6page
© Stefanos Fotiou

7page
IntroductionThe last few decades have been a time of dynamic changes across the world, with millions of people lifted out of poverty and a number of countries reaching middle income status. However, these achievements and changes have come at a significant cost to the environment. Increasing demand for energy, food, water and other resources has resulted in resource depletion, pollution, environmental degradation and climate change, pushing the earth towards its environmental limits. With humans now consuming more resources than ever before, the current patterns of development across the world are not sustainable.
One of the key elements for achieving sustainable development is the transition towards Sustainable Consumption and Production (SCP). This need was first highlighted at the Rio Earth Summit in 1992 and was recently reiterated in the outcomes of the Rio +20 summit, with the adoption of the 10 Year Framework Programmes. SCP is about fulfilling the needs of all while using fewer resources, including energy and water, and producing less waste and pollution. It can contribute to poverty alleviation and the transition towards a low carbon, green economy and is essential for improving the lives of the world’s poorest people, who depend so closely on the natural resources provided by their environment. SCP can lead to an improved quality of life and greater employment opportunities, complementing poverty reduction strategies. In particular the continuing infrastructure developments required across the region provide immense opportunites for SCP.
As SCP cuts across all different sectors, it requires a holistic approach and the engagement of numerous stakeholders. Collaboration between multiples areas and levels within government is necessary to develop, implement, monitor and evaluate successful SCP policies. It requires policy to not just improve production, but also to support consumers to move towards sustainable consumption choices. Therefore everyone in society has a role to play in this transition including governments, educators, the private sector and each and every consumer.
This handbook is designed to assist policymakers in developing, implementing, monitoring and evaluating policies that support the transition towards SCP. It includes numerous case studies highlighting SCP opportunities and existing successful initiatives from across the world. Part A provides an introduction to the fundamentals of SCP and follows SCP through the policy cycle. Part B details specific thematic opportunities for SCP policy development including cleaner and safer production, sustainable lifestyles, sustainable cities, sustainable public procurement and sustainable tourism.

Part A :
AN INTRODUCTION TO SCP POLICY

9page
Part A
1 2 3 4 5 6 7 8 9 10 11 12 13 14
Introduction to Sustainable Consumption and Production (SCP)
1.1 Defining SCP 1.2 Why is SCP important for sustainable development?
SCP x
x
ExcellentGoodAveragePoor
SCP?
1

10page
1
SCP?
Introduction to Sustainable Consumption and Production (SCP)
Key Points• Definitions of SCP vary slightly but the underlying principles remain the
same.• The terms “SCP”, “Green Growth” and “Green Economy” are inextricably
linked and lead to the same overall objective which is sustainable development.
• SCP is closely linked to Resource Efficiency – the optimal usage of resources, particularly scarce and non-renewable resources.
This chapter provides an introduction to SCP and related terminology. The impacts of current consumption and production trends across the world are examined, highlighting the need for a transition towards SCP, as a key element for sustainable development.
1.1 Defining SCP Definition of Sustainable Consumption & Production (SCP): The concept of SCP has evolved over time and is defined in a number of ways.
A commonly used definition is: “the use of services and related products which respond to basic needs and bring a better quality of life while minimising the use of natural resources and toxic materials as well as the emission of waste and pollutants over the life cycle of the service or product so as not to jeopardise the needs of future generations” (ISSD 1994).
Another widely used and more recent definition is provided by UNEP: “SCP is a holistic approach to minimising the negative environmental impacts from consumption and production systems while promoting quality of life for all” (UNEP 2011).
The International Institute for Sustainable Development list 3 other definitions of sustainable consumption and/or production and doubtless there will be even more by other bodies. Regardless of definitions, the underlying principles of SCP must be clear.
Key principles of SCP:
1. Improving the quality of life without increasing environmental degradation and without compromising the resource needs of future generations.
2. Decoupling economic growth from environmental degradation by:
• Reducing material/energy intensity of current economic activities and reducing emissions and waste from extraction, production, consumption and disposal.
• Promoting a shift of consumption patterns towards groups of goods and services with lower energy and material intensity without compromising quality of life.
3. Applying life-cycle thinking which considers the impacts from all life-cycle stages of the production and consumption process.
4. Guarding against the re-bound effect, where efficiency gains are cancelled out by resulting increases in consumption (UNEP 2011).
11page
Part A
1 2 3 4 5 6 7 8 9 10 11 12 13 14
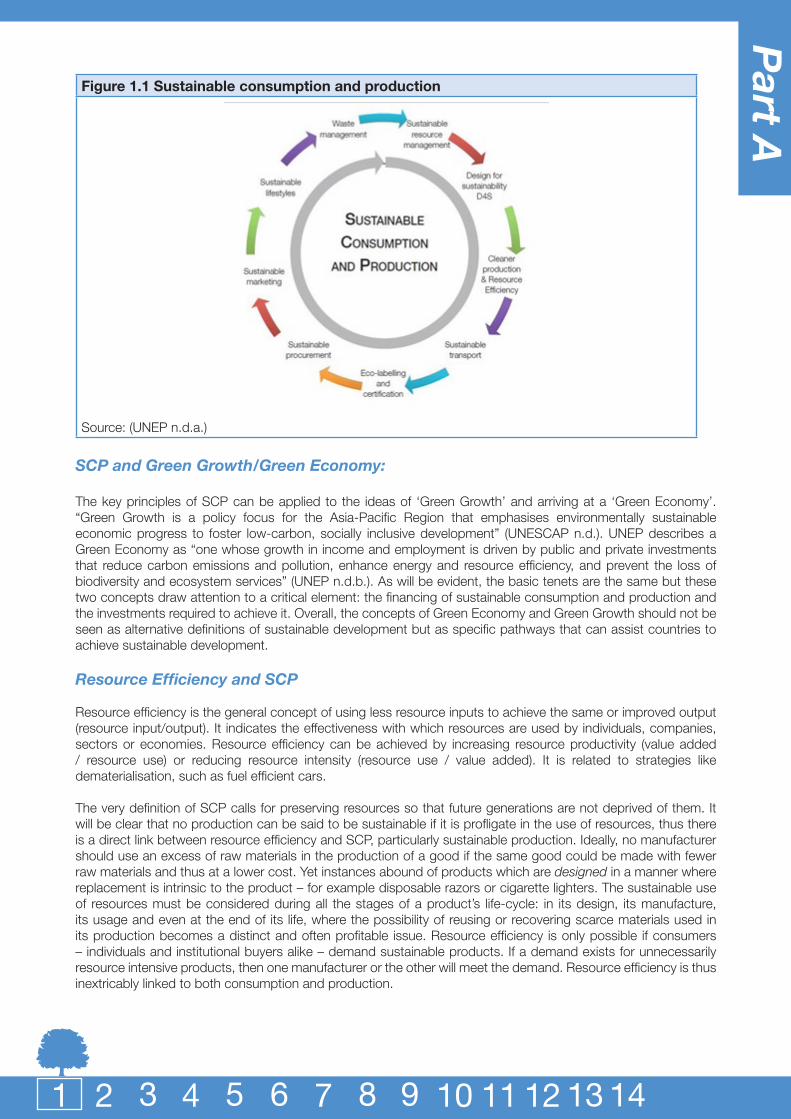
Figure 1.1 Sustainable consumption and production
Source: (UNEP n.d.a.)
SCP and Green Growth/Green Economy:
The key principles of SCP can be applied to the ideas of ‘Green Growth’ and arriving at a ‘Green Economy’. “Green Growth is a policy focus for the Asia-Pacific Region that emphasises environmentally sustainable economic progress to foster low-carbon, socially inclusive development” (UNESCAP n.d.). UNEP describes a Green Economy as “one whose growth in income and employment is driven by public and private investments that reduce carbon emissions and pollution, enhance energy and resource efficiency, and prevent the loss of biodiversity and ecosystem services” (UNEP n.d.b.). As will be evident, the basic tenets are the same but these two concepts draw attention to a critical element: the financing of sustainable consumption and production and the investments required to achieve it. Overall, the concepts of Green Economy and Green Growth should not be seen as alternative definitions of sustainable development but as specific pathways that can assist countries to achieve sustainable development.
Resource Efficiency and SCP
Resource efficiency is the general concept of using less resource inputs to achieve the same or improved output (resource input/output). It indicates the effectiveness with which resources are used by individuals, companies, sectors or economies. Resource efficiency can be achieved by increasing resource productivity (value added / resource use) or reducing resource intensity (resource use / value added). It is related to strategies like dematerialisation, such as fuel efficient cars.
The very definition of SCP calls for preserving resources so that future generations are not deprived of them. It will be clear that no production can be said to be sustainable if it is profligate in the use of resources, thus there is a direct link between resource efficiency and SCP, particularly sustainable production. Ideally, no manufacturer should use an excess of raw materials in the production of a good if the same good could be made with fewer raw materials and thus at a lower cost. Yet instances abound of products which are designed in a manner where replacement is intrinsic to the product – for example disposable razors or cigarette lighters. The sustainable use of resources must be considered during all the stages of a product’s life-cycle: in its design, its manufacture, its usage and even at the end of its life, where the possibility of reusing or recovering scarce materials used in its production becomes a distinct and often profitable issue. Resource efficiency is only possible if consumers – individuals and institutional buyers alike – demand sustainable products. If a demand exists for unnecessarily resource intensive products, then one manufacturer or the other will meet the demand. Resource efficiency is thus inextricably linked to both consumption and production.

12page
Box 1:1 Design for recycling
Recognising the great potential for recycling of discarded motor vehicles, the EU passed the Directive on End-of-Life Vehicles/2000/53/EC as far back as 2000, which set an ambitious target of 85% of passenger vehicles recycled and re-used by 2015. Although the target has proved difficult to meet, automobile manufacturers have made great strides in facilitating compliance for example, by using recycled material, improving material identification, improving ease of dismantling, ease of re-use and ease of recycling. Environmentally harmful materials and ingredients in materials are being eliminated entirely or their usage minimised. This currently affects between 7 – 8 million cars being sent every year to the scrap-yard in the EU.Source: (European Union n.d.)
1.2 Why is SCP important for sustainable development?Social and economic trends
The 20th century, and especially the second half of the century, was a time of remarkable change and progress for humankind. The world has seen global increases in population, average incomes (and consumption rates), urbanisation (and infrastructure investment) and huge growth in production activities. In many countries these trends have contributed immensely to economic development, creating jobs, increasing the material standard of living of many people, enabling investment in public infrastructure and reducing poverty levels. Many countries have modernised their societies and economies enabling the greatest level of material wellbeing ever experienced. These changes were most prevalent in OECD countries and in urban centres in developing countries.
The rapid economic growth and human development that has occurred since the 1950s has come at a cost, however, of very large and growing environmental pressures and impacts. The use of natural resources – biomass, fossil fuels, ores, minerals and water – has grown dramatically from less than 10 billion tonnes in 1950 to over 70 billion tonnes in 2010 (UNEP, 2011). This level of resource use was largely based on the assumption of limitless resources and overlooked the connections between resource use and environmental impacts. The rise in resource use has been coupled with growth in waste and emissions contributing to a series of pressure points including climate change, reduced food security, water scarcity and air pollution. It has also lead to supply insecurity for a number of resources that are strategically important in modern production and consumption systems (Weisz and Schandl, 2008).
In addition, since the 1980s there has been a growing gap between wealthy and poor people in both developing countries and across the OECD. More recently, the governance and functioning of the global economic systems has been challenged during the global financial crisis that started in 2008.
A modern lifestyle based on current patterns of consumption and production requires a large amount of natural resources, of between 25 and 30 tonnes of materials per capita, per annum (Wiedmann et al., 2013). Multiplied by the 9 billion people expected by 2050 this would mean a global material use of between 225 and 270 billion tonnes or three to four times the amounts of 2010. The investments needed to establish global extractive capacity adequate for such high levels of resource use would be huge and potentially unaffordable. Such quantities of resources are simply not available, and the absorptive capacity of the earth’s ecosystems are already stretched at much lower global levels of resource use. It is therefore evident that current patterns of consumption and production are environmentally unsustainable and socially inequitable.
To accommodate 9 billion people and allow for high human development for the majority a fundamental restructuring of current systems of production, provision and consumption is required. Economic growth, human development and wellbeing would need to be substantially decoupled from resource use and environmental impact (UNEP, 2011). Achieving gains in decoupling will not happen spontaneously, but will require well designed public policies that enable economic restructuring toward sustainable consumption and production and resource efficiency.
Current economic and business incentives are still tailored to the experience of the 20th century; a time of low resource prices that justified investing in labour productivity at the cost of resource productivity. The 21st century, however, presents a very different economic context of rising and more volatile resource prices, requiring a rethinking of political steering and business practices. Economic competitiveness and prosperity in the future will be underpinned by large investments into infrastructure and skills that enable a green and low carbon economy that services equitable opportunities for nations and people.

13page
Part A
1 2 3 4 5 6 7 8 9 10 11 12 13 14
The rise of global resource use
Global resource use grew from 24.8 billion tonnes in 1970 to 69.9 billion tonnes in 2008, corresponding to a yearly growth rate of 2.8% (West and Schandl, 2013). Over the past two decades most of the growth came from the Asia-Pacific region, driven by a fast transition in a number of rapidly developing economies, most notably China. A number of different models, each with a range of scenarios, have been developed to predict future global resource use.
UNEP (2011) has created three scenarios for global resource use and assumes a global resource use of 150 billion tonnes by 2050 in a business as usual scenario. Two alternative scenarios of moderate contraction and convergence and tough contraction and convergence of resource use result, according to UNEP, in much lower projections of below 70 billion tonnes in 2050.
Dittrich et al. (2012) assumed 180 billion tonnes of global resource use by 2050. A high population growth scenario, according to this study, would result in annual resource use of 200 billion tonnes. The study shows a number of alternatives to a business as usual scenario which could bring global resource use down to between 40 and 100 billion tonnes by 2050, depending on achievements in resource efficiency.
Schandl et al. (2013), based on a coupled economic and biophysical model, contrasted a baseline scenario of about 180 billion tonnes with a moderate resource efficiency scenario (based on a global carbon price of $30 per tonne) resulting in about 130 billion tonnes, and high resource efficiency scenario (based on a global carbon price of $50 per tonne) at 95 billion tonnes of global resource use by 2050.
Figure 1.2 Global resource use by 2050 under various scenarios
0
20000
40000
60000
80000
100000
120000
140000
160000
180000
200000
2008
2010
2012
2014
2016
2018
2020
2022
2024
2026
2028
2030
2032
2034
2036
2038
2040
2042
2044
2046
2048
2050
Mill
ion
tonn
es
Year
Comparing global resource use scenarios
Global BS
Global TS25
Global TS50
Source: (CSIRO Global Environment–Economy Model 2013)
Whilst the estimates from each of the models differ, they all point to significant rises in resource use, far beyond the carrying capacity of the planet, if immediate action is not taken to address resource efficiency.

14page
Regional Snapshots
Where possible, a snapshot of the state of resource use has been provided for each global region. Often full regional data is not available, so a snapshot for a country or group of countries from within the region has instead been provided. This simply represents the countries in question and is not necessarily indicative of the resource use across the region.
Box 1:2 Legend
GDP/cap ($) Gross Domestic Product (GDP)/capita in current
LP ($/h) Labour productivity (LP) = GDP/labour volume
PPP/cap (int. $) Purchasing Power Parities (PPP)/capita in current international $
MP ($/kg) Material productivity (MP) = GDP/DMC
DE (million t) Domestic extraction of materials (DE)
EP ($/MJ) Energy productivity (EP) = GDP/TPES.
PTB Physical trade balance (PTB) TPES/cap (GJ) Total primary energy supply (TPES)
DMC (million t) Domestic material consumption (DMC) = DE + PTB
Snapshot: AfricaAfrica has experienced high population growth since the 1970’s which went hand in hand with moderate or slow economic growth and a slow increase in the resource base. Per-capita DMC in Africa is very low at 3.7 tonnes and energy use is only 33 GJ/capita which reflects a low material standard of living. Per-capita material use has been stagnant since the 1980’s which shows that the material standard of living could not keep up with population growth.
Table 1:1 Headline indicators for Africa, 2010Population (million) 1,287 DE/cap (t) 4.1
GDP/cap ($) 1,683 PTB/cap (t) -0.4
PPP/cap (int. $) 4,366 DMC/cap (t) 3.7
DE (million t) 5,257 TPES/cap (GJ) 33.3
PTB (million t) -441 LP ($/h) 3.36
DMC (million t) 4,816 MP ($/kg) 0.45
TPES (PJ) 41,880 EP ($/MJ)Source: World Bank World Development Indicators 2013. Dittrich et al. 2012.
Over the whole period since the 1980’s Africa has been a net exporter of natural resources, in particular fossil fuels but also metal ores. Africa has seen some improvement in labour productivity especially since the year 2000, but has been stagnant in energy productivity since the 1990’s.
SCP?

15page
Part A
1 2 3 4 5 6 7 8 9 10 11 12 13 14
Figure 1.3 Africa snapshot
Source: (CSIRO & UNEP 2013a)
Construction minerals Metal ores and industrial mineralsFossil Fuels Biomass
0
1000
2000
3000
4000
5000
6000
1970 1980 1990 2000 2010
Mill
ion
tonn
es
Year
DMC Africa
Construction minerals Metal ores and industrial mineralsFossil Fuels Biomass
0
0.5
1
1.5
2
2.5
3
3.5
4
4.5
5
1970 1980 1990 2000 2010
Tonn
es/c
apita
Year
DE/capita Africa
Construction minerals Metal ores and industrial mineralsFossil Fuels Biomass
-0.6
-0.5
-0.4
-0.3
-0.2
-0.1
0
0.1
1970 1980 1990 2000 2010
Tonn
es/c
apita
Year
PTB/capita Africa
Construction minerals Metal ores and industrial mineralsFossil Fuels Biomass
0
0.5
1
1.5
2
2.5
3
3.5
4
4.5
1970 1980 1990 2000 2010
Tonn
es/c
apita
Year
DMC/capita Africa
Energy productivityMaterial productivity Labour productivity
0
20
40
60
80
100
120
140
160
180
1970 1980 1990 2000 2010
Inde
x (1
970
= 10
0)
Year
Factor productivities Africa

16page
Snapshot: Asia and the Pacific
In recent decades, but especially since the year 2000, Asia and the Pacific has been the most dynamic world region both economically and in terms of natural resource use. The achievements in human development and economic transition that have occurred have come at a cost of rising resource use, increases in waste and emissions and a growing dependency on resources from abroad. Growing net imports of natural resources indicate that the local resource base is no longer sufficient to support fast growing economic activity and emerging new lifestyles in the region. The efficiency with which materials are used has declined since 1990, meaning that extractive pressures on the environment will increase even more rapidly than the region’s rapid rate of economic growth. Population growth is now the least important driver of regional natural resource use.
Table 1:2 Headline indicators for Asia and the Pacific, 2010Population (million) 3,835 DE/cap (t) 10.30
GDP/cap ($) 4,784 PTB/cap (t) 0.26
PPP/cap (int. $) 6,884 DMC/cap (t) 10.56
DE (million t) 39,505 TPES/cap (GJ) 49.09
PTB (million t) 1,006 LP ($/h) 9.19
DMC (million t) 40,511 MP ($/kg) 0.10
TPES (PJ) 184,545 EP ($/MJ) 0.45Source: (World Bank 2013) & (CSIRO Global Material Flow Database 2013)
Domestic material consumption in Asia and the Pacific has grown from around 6 billion tonnes in 1970 to about 40 billion tonnes in 2010. This corresponds to a rise in per capita material use from 3 tonnes in 1970 to over 10 tonnes in 2010, or a threefold increase over the past four decades. While labour productivity improved by a factor of 2.5 over the same period, material productivity was stagnant until 1990 and has since declined. The region today uses more resources per unit of economic output than it did in the 1970s because of its transition to industrial production technologies and modern lifestyles.
In 2010, Asia-Pacific was home to 56% of the world population and earned a GDP of between 29%-34%. The region used one third of global energy and 58% of materials. Per capita-energy use was relatively low at 49GJ/capita. Labour productivity was lower than the world average and so were energy and materials productivities. This means that the region is using its resources less efficiently to support its economic growth and wellbeing.
Over the last 4 decades, labour productivity increased markedly in Asia-Pacific but at the cost of stagnant energy productivity and declining material productivity. If labour was the scarce factor in the region this development would be fine. However as labour is abundantly available and resources – materials and energy – are becoming more constrained the region should start to invest in resource productivity through changes in incentives (Schandl and West 2010).

17page
Part A
1 2 3 4 5 6 7 8 9 10 11 12 13 14
Figure 1.4 Asia and the Pacific snapshot
0
5000
10000
15000
20000
25000
30000
35000
40000
45000
1970 1980 1990 2000 2010
Mill
ion
tonn
es
Year
DMC Asia and the Pacific
Construction minerals Metal ores and industrial mineralsFossil Fuels Biomass
0
2
4
6
8
10
12
1970 1980 1990 2000 2010
Tonn
es/c
apita
Year
DE/capita Asia and the Pacific
Construction minerals Metal ores and industrial mineralsFossil Fuels Biomass
-0.1
-0.05
0
0.05
0.1
0.15
0.2
0.25
0.3
1970 1980 1990 2000 2010
Tonn
es/c
apita
Year
PTB/capita Asia and the Pacific
Construction minerals Metal ores and industrial mineralsFossil Fuels Biomass
0
2
4
6
8
10
12
1970 1980 1990 2000 2010
Tonn
es/c
apita
Year
DMC/capita Asia and the Pacific
Construction minerals Metal ores and industrial mineralsFossil Fuels Biomass
0
50
100
150
200
250
300
1970 1980 1990 2000 2010
Inde
x (1
970
= 10
0)
Year
Factor productivities Asia and the Pacific
Energy productivityMaterial productivity Labour productivitySource: (CSIRO & UNEP 2013a)

18page
Snapshot: Eastern Europe, Caucasus and Central Asia
Recent economic development in Eastern Europe has been determined by the economic and political restructuring that occurred in the former Soviet Union in the early 1990s. The closing of outdated industries and infrastructure as well as the independence of a number of countries resulted in a sharp decline in material use from 1990 to 2000. Since then, the economies in Eastern Europe and Central Asian countries have rebounded, resulting in growing resource use.
Table 1:3 Headline indicators Eastern Europe, Caucasus and Central Asia, 2010Population (million) 279 DE/cap (t) 5.24
GDP/cap ($) 7,051 PTB/cap (t) -0.88
PPP/cap (int. $) 13,447 DMC/cap (t) 5.17
DE (million t) 4,667 TPES/cap (GJ) 142.25
PTB (million t) -787 LP ($/h) 11.31
DMC (million t) 3,880 MP ($/kg) 0.05
TPES (PJ) 39,729 EP ($/MJ) 0.51Source: (World Bank 2013) & (CSIRO Global Material Flow Database 2013)
Today, per capita material use is around 15 tonnes, 5 tonnes up from the year 2000.
In 2010, the Eastern Europe, Central Asia and Caucasus was home to 4% of the world population and generated a GDP of 3%-5% of global GDP. Energy use was 8% and material use 6% of total global consumption. Per-capita energy use was comparably high (similar to that of the European Union) and as a consequence, energy productivity was very low at only half of the world average. Material productivity was similarly low, however labour productivity was around the world average.
The region is still recovering from the economic restructuring some 20 years ago. It has a focus on primary industries producing for export with few value adding industries within the region.
Productivity trends appear to be distorted in ECCAA caused by the massive economic restructuring that occurred in the 1990’s. Since 1990, however, resource productivity has grown faster than labour productivity which is very different from many other regions. To increase the competitiveness of the region, economic policy may aim to address the need for growth in labour productivity. Ideally however, such an increase would not happen on the back of declining resource productivity.

19page
Part A
1 2 3 4 5 6 7 8 9 10 11 12 13 14
Figure 1.5 Eastern Europe, Caucasus and Central Asia snapshot
0
1000
2000
3000
4000
5000
6000
7000
1970 1980 1990 2000 2010
Mill
ion
tonn
es
Year
DMC EECCA
Construction minerals Metal ores and industrial mineralsFossil Fuels Biomass
0
5
10
15
20
25
1970 1980 1990 2000 2010
Tonn
es/c
apita
Year
DE/capita EECCA
Construction minerals Metal ores and industrial mineralsFossil Fuels Biomass
-3.5
-3
-2.5
-2
-1.5
-1
-0.5
0
0.5
1970 1980 1990 2000 2010
Tonn
es/c
apita
Year
PTB/capita ECCA
Construction minerals Metal ores and industrial mineralsFossil Fuels Biomass
0
5
10
15
20
25
1970 1980 1990 2000 2010
Tonn
es/c
apita
Year
DMC/capita EECCA
Construction minerals Metal ores and industrial mineralsFossil Fuels Biomass
0
50
100
150
200
250
1970 1980 1990 2000 2010
Inde
x (1
970
= 10
0)
Year
Factor productivities EECCA
Energy productivityMaterial productivity Labour productivity
Source: (CSIRO and UNEP Eastern Europe Caucasus and Central Asia Material Flow and Resource Productivity Database)

20page
Snapshot: European Union
The European Union has been leading in developing policies for sustainable resource use, which is reflected in comparably low per-capita resource use levels. This is enabled, however, through the outsourcing of many resource and emission intensive processes to other countries and much of the high resource efficiency of Europe is bought through relocation of dirty industries.
Table 1:4 Headline indicators for the European Union, 2010Population (million) 502 DE/cap (t) 12.76
GDP/cap ($) 32,346 PTB/cap (t) 2.01
PPP/cap (int. $) 31,746 DMC/cap (t) 15.43
DE (million t) 6,407 TPES/cap (GJ) 146.95
PTB (million t) 1,008 LP ($/h) 83.30
DMC (million t) 7,746 MP ($/kg) 2.10
TPES (PJ) 73,323 EP ($/MJ) 0.22Source: (World Bank 2013) & (European Commission 2013)
In 2010, Europe was home to 7% of the world’s population and generated between 21%-26% of global GDP. To do so, Europe used 15% of the global energy use and 11% of primary materials. Europe’s labour productivity was 8 times the global average, and energy and material productivity were twice as good as the global average.
Many countries in Europe have achieved a highly resource efficient economy through abandoning their heavy industries and through importing many goods that are now produced outside of Europe helping to avoid environmental pressures within Europe’s boundaries. Hence, territorial energy and material use as well as emissions are comparably low. When natural resource use and emissions are attributed to final consumption in Europe, the amount of resource used more than doubles and resource efficiency is considerably lower. Despite this fact there are also examples of best practice in Europe such as the German investment and policy setting for an energy transition to renewable and distributed energy.
Snapshot: Latin America and the Caribbean
Since 1970, Latin America has undergone different phases of economic development including a phase of protectionist policies in the 1970s, a debt crisis in the early 1980s and a period of market opening and trade liberalism since the early 1990s increasing the production of primary resources for trade in many countries. Since 2000, there has been an obvious signal of Asian growth in the Latin American trade balance and material flow accounts, through the export of metals and fossil fuels to service infrastructure development and manufacturing in Asia.
Table 1:5 Headline indicators for Latin America and the Caribbean, 2010Population (million) 589 DE/cap (t) 15.02
GDP/cap ($) 8,698 PTB/cap (t) -1.21
PPP/cap (int. $) 11,431 DMC/cap (t) 13.81
DE (million t) 8,849 TPES/cap (GJ) 55.87
PTB (million t) -714 LP ($/h) 17.57
DMC (million t) 8,135 MP ($/kg) 0.63
TPES (PJ) 32,181 EP ($/MJ) 0.16Source: (World Bank 2013) & (CSIRO Global Material Flow Database 2013)
Domestic material consumption has grown fourfold over the past four decades, from 2 billion to 8 billion tonnes corresponding to a rise in material use from 8 to 14 tonnes per capita. Latin America has been a net exporter of primary materials since 1970 and today exports around 1 tonne per capita – mostly metal ores and fossil fuels, but also considerable quantities of biomass.
Material productivity has declined, linked to the fast growing mining and energy sector and related waste flows. Whereas labour productivity, after a long phase of stagnation and slow growth in the 1980s and 1990s, has surged since 2000.

21page
Part A
1 2 3 4 5 6 7 8 9 10 11 12 13 14
Figure 1.6 Latin America and the Caribbean snapshot
0
1000
2000
3000
4000
5000
6000
7000
8000
9000
1970 1980 1990 2000 2010
Mill
ion
tonn
es
Year
DMC Latin America
Construction minerals Metal ores and industrial mineralsFossil Fuels Biomass
0
2
4
6
8
10
12
14
16
1970 1980 1990 2000 2010
Tonn
es/c
apita
Year
DE/capita Latin America
Construction minerals Metal ores and industrial mineralsFossil Fuels Biomass
-1.4
-1.2
-1
-0.8
-0.6
-0.4
-0.2
0
0.2
1970 1980 1990 2000 2010
Tonn
es/c
apita
Year
PTB/capita Latin America
Construction minerals Metal ores and industrial mineralsFossil Fuels Biomass
0
2
4
6
8
10
12
14
16
1970 1980 1990 2000 2010
Tonn
es/c
apita
Year
DMC/capita Latin America
Construction minerals Metal ores and industrial mineralsFossil Fuels Biomass
0
20
40
60
80
100
120
140
160
180
200
1970 1980 1990 2000 2010
Inde
x (1
970
= 10
0)
Year
Factor productivities Latin America
Energy productivityMaterial productivity Labour productivity
Source: (CSIRO and UNEP 2013b)

22page
In 2010, Latin America and the Caribbean had 9% of the world population and generated 8%-9% of global GDP. The region used 7% of global energy and 12% of materials. Labour and energy productivity were above the world average, however material productivity was below average because of the large primary industry sector in many LAC countries.
In Latin America labour productivity has grown much faster than resource productivity, which has been stagnant. This development has been driven by the dominance of primary industries in many Latin American economies which drives the resource intensity of the economy upwards (West and Schandl, 2013).
Global demand for materials is going to grow in the future, therefore the extractive industries in Latin America will also expand. This will require polices that help avoid the negative economic and social effects summarised as ‘resource curse’ and to assist gain sharing among communities.
Snapshot: United States of America
The United States is still a global economic powerhouse, despite the economic downturn experienced during the recent global financial crisis. Due to the size of the country and the economy, a large amount of natural resources is sourced from within the country which results in a low dependency on foreign resources with the important exception of crude oil.
Table 1:6 Headline indicators for the United States of America, 2010Population (million) 309 DE/cap (t) 25.07
GDP/cap ($) 47,160 PTB/cap (t) 2.54
PPP/cap (int. $) 47,160 DMC/cap (t) 27.62
DE (million t) 7,755 TPES/cap (GJ) 313.50
PTB (million t) 787 LP ($/h) 100.87
DMC (million t) 8,542 MP ($/kg) 1.71
TPES (PJ) 95,335 EP ($/MJ) 0.15Source: (World Bank 2013), (Gierlinger and Krausmann 2012) & (CSIRO Global Material Flow Database 2013)
Overall material use in the United States grew from 5.5 billion tonnes in 1970 to over 8 billion tonnes in 2010. On a per capita basis, material use has been stable at around 25 to 30 tonnes per capita since the 1970s. Over the past four decades, the United States has been a net importer of materials. Net imports have grown fast since 1980, and reached 3 tonnes per capita by 2010. Fossil fuels account for the largest share, comprising over 80% of overall net imports.
In 2010, 4% of global population lived in the United States and the US generated 19%-23% of global GDP. The US used one fifth of global energy and 12% of materials. Labour productivity in the US was 10 times higher than the world average which is enabled through high level of capitalisation in the economy and high energy use. Energy productivity was around the world average and material productivity was double the world average. This demonstrates that the US uses materials quite efficiently, which is not the case for energy.
In the United States, the three productivities have moved in concert since the 1970’s which means that labour productivity was able to be increased without negatively impacting resource productivity gains.

23page
Part A
1 2 3 4 5 6 7 8 9 10 11 12 13 14
Figure 1.7 United States of America snapshot
Source: (Gierlinger and Krausmann 2012) & (CSIRO Global Material Flow Database 2013)
0
1000
2000
3000
4000
5000
6000
7000
8000
9000
10000
1970 1980 1990 2000 2010
Mill
ion
tonn
es
Year
DMC United States
Construction minerals Metal ores and industrial mineralsFossil Fuels Biomass
0
5
10
15
20
25
30
1970 1980 1990 2000 2010
Tonn
es/c
apita
Year
DE/capita United States
Construction minerals Metal ores and industrial mineralsFossil Fuels Biomass
-1
-0.5
0
0.5
1
1.5
2
2.5
3
3.5
1970 1980 1990 2000 2010
Tonn
es/c
apita
Year
PTB/capita United States
Construction minerals Metal ores and industrial mineralsFossil Fuels Biomass
0
5
10
15
20
25
30
35
1970 1980 1990 2000 2010
Tonn
es/c
apita
Year
DMC/capita United Sates
Construction minerals Metal ores and industrial mineralsFossil Fuels Biomass
0
50
100
150
200
250
1970 1980 1990 2000 2010
Inde
x (1
970
= 10
0)
Year
Factor productivities United States
Energy productivityMaterial productivity Labour productivity

24page
Declining environmental capacity to absorb waste and emissions
One constant throughout these shifts in resource use is the capacity of the receiving environment to absorb emissions, waste and land use changes. Fast growing global metabolism – now at 70 billion tonnes – has resulted in a number of environmental pressures and impacts and has increasingly led to overuse of environmental sinks. Since the 1970s the most important environmental impacts related to emissions have been climate change (caused by a number of greenhouse gas emissions), eutrophication (caused by the pollution of water bodies with nitrogen and phosphorus) and a number of human ecotoxic effects (cause by urban air pollution, indoor air pollution and toxic emissions).
A number of these impacts are directly related to resource use, including the depletion of non-renewable resources (such as fossil fuels and ores), depletion of renewable resources (especially timber and fish), and large scale land use change resulting in habitat loss. Many ecosystem thresholds are already at their limit, therefore the question remains, how will the world develop into the future, first and foremost to combat poverty and to meet the needs of its economies, while maintaining a functioning resource base and receiving environment.
Resource use and human development
The main challenge for economic and environmental policy making is the dual objectives of development and environment. Over the last half century, the world has made remarkable progress in human development and improving the material standard of living of many of its people. Despite these remarkable developments there remains much to be done in regard to further development, increasing opportunity and living standards for the many people who still live in poverty and disadvantage. Many countries across the globe will require future economic growth to enable an increasing standard of living for households and to combat poverty, which is still entrenched in many parts of the world. The challenge to improve human development and to combat poverty remains large, with an estimated 1.2 billion people still living in extreme poverty.
Human development depends on the timely availability of high quality natural resources. The overall material standard of living, the level of education and the quality of health care and hence the opportunity for a long, healthy and satisfying life require certain amounts of energy carriers, building materials, metals, food and water. Research has shown, however, that the relationships between human development and the amount of natural resources and emissions underpinning human development are highly nonlinear (Steinberger and Roberts 2010). At lower levels of natural resource use and emissions a small increment of additional resources can make a large difference in achieving human development outcomes. At very high levels of human development additional increments of natural resources usually make little or almost no difference at all.
Different aspects of human development – literacy, life expectancy, and per capita income – have different costs in terms of environmental pressure. High achievements in literacy and life expectancy are possible based on moderate levels of natural resource use. High per capita income, by contrast, almost always requires high levels of natural resource use and emissions.
A study by Steinberger and Roberts (2010) found that by the mid 1970’s, the global supply of natural resources was not sufficient to service high human development for every citizen. The same research found, analysing data for 2005, that if natural resources were equally distributed the energy and carbon levels in this year would have been more than sufficient to satisfy global human needs at high levels of human development. The authors also found that the global energy consumption and carbon emissions required to satisfy human needs will decrease with time, despite growth in population, due to overall efficiency gains in many systems of provision including housing, mobility, food, energy and water, in delivering a high material standard of living.
This does not mean, however, that the overall level of natural resource demand and the related level of emissions will start to reduce any time soon. This is dependent on achieving large investments in green technologies, buildings and infrastructure that need less materials and energy and produce less emissions and waste. Increasing the eco-efficiency of production
It is also obvious to many, that while poverty reduction and economic growth are a priority for many countries across the world, future growth models cannot mimic the historical growth model of today’s industrialised countries. There needs to be considerable innovation for establishing a new industrialised system that can fuel prosperity beyond the aggressive resource consumption of the old industrial system. SCP provides an opportunity for balancing the socio-economic driving forces with the environmental capacity of the globe.
One important aspect of SCP, which has been addressed by academic research and policy efforts since the
25page
Part A
1 2 3 4 5 6 7 8 9 10 11 12 13 14
1980s, is the potential for cleaner production and greater eco-efficiency of production. Reducing the natural resources used in production as well as related waste and emissions is beneficial for the environment and also saves production costs, which makes it an attractive strategy for businesses, particularly in material, energy and emission intensive industries.
The greatest potential for eco-efficiency often exists in the heavy industry sectors of steel and cement, the building and transport sectors, and in agriculture. Many other manufacturing activities also present large potential for saving resource use and emissions. Other important opportunities to increase the eco-efficiency of production systems include through implementing industrial symbiosis (refer to Chapter 7) and improving recycling rates.
Box 1:3 Eco-efficiency gains through recycling
Recycling is an important contributor to eco-efficiency. Many materials have a large recycling potential, and recycling industries, for example for metals, have been established across the world. Metals, especially, have excellent properties for recycling, and for metals such as iron and steel, copper and aluminium recycling has a long tradition. Steel is the most widely used metal and in 2009 more than 1.2 billion tonnes of steel were produced globally (UNEP, 2011). Recycling rates for steel are as high as 70 to 90%, which is one of the highest end-of-life recycling rates among all the industrially used metals. Recycling rates for lead are above 50% but those for copper and aluminium are only around 25 to 30%. For many other metals, however, the recycling potential is not sufficiently used.
Sustainable consumption
Sustainable consumption has two important aspects, the need to attend to under-consumption and on the other hand, the rising consumer classes in OECD and developing countries and their very high consumption levels. Lifestyles and consumption patterns of millions of consumers in developing countries are now converging with those of OECD countries. This is particularly the case among younger and well educated elites. This global consumer class already totalled 1.7 billion people in 2004 (Worldwatch Institute, 2004) of whom almost 40% (or 680 million) lived in Asia.
Following in the footsteps of already developed countries, the consumption patterns of the new consumer classes will result in larger houses and apartments fitted with new appliances, new modes of transport and increasing private car ownership, increased air travel, new diets based on much larger amounts of meat and dairy and a whole range of new manufactured goods. There is an important opportunity to guide the transition in consumption in OECD and developing countries toward sustainability through policy settings and frameworks that privilege environmentally friendly and socially just products and services. This can happen through labelling, subsidies and information campaigns, which are all areas in which government intervention will be of great importance. Chapter 8, Sustainable Lifestyles provides more information on such options.
Governments are able to showcase best practice in their own consumption behaviour through sustainable public procurement, investment in energy efficient and low material intensity public buildings such as government offices, schools and hospitals, and through investing in sustainable public infrastructure. These investments will greatly pay off in terms of sustainable natural resource use and climate change mitigation while promoting sustainable choices to the greater community.
It is important to note that most of the buildings and infrastructure that will be operated by 2050 do not exist today, which offers a large window of opportunity for investing today in the sustainable infrastructure that will have a lasting legacy towards the middle of the century. This is especially true for fast growing cities in developing countries across Asia, LAC and Africa. There is also great potential for urban infrastructure improvements in car based cities in North America, Canada and Australia and elsewhere in the world.
Identifying priority sectors for SCP
Identifying production processes and industry sectors that have the highest contribution to environmental pressures and impacts helps companies and policymakers to develop sustainability strategies for production processes. A report by UNEP (2010) identifies processes depending on fossil fuels, agriculture and fisheries as high impact sectors with regard to traditional environmental problems such as climate change, acidification of soils or eutrophication of water bodies.
26page
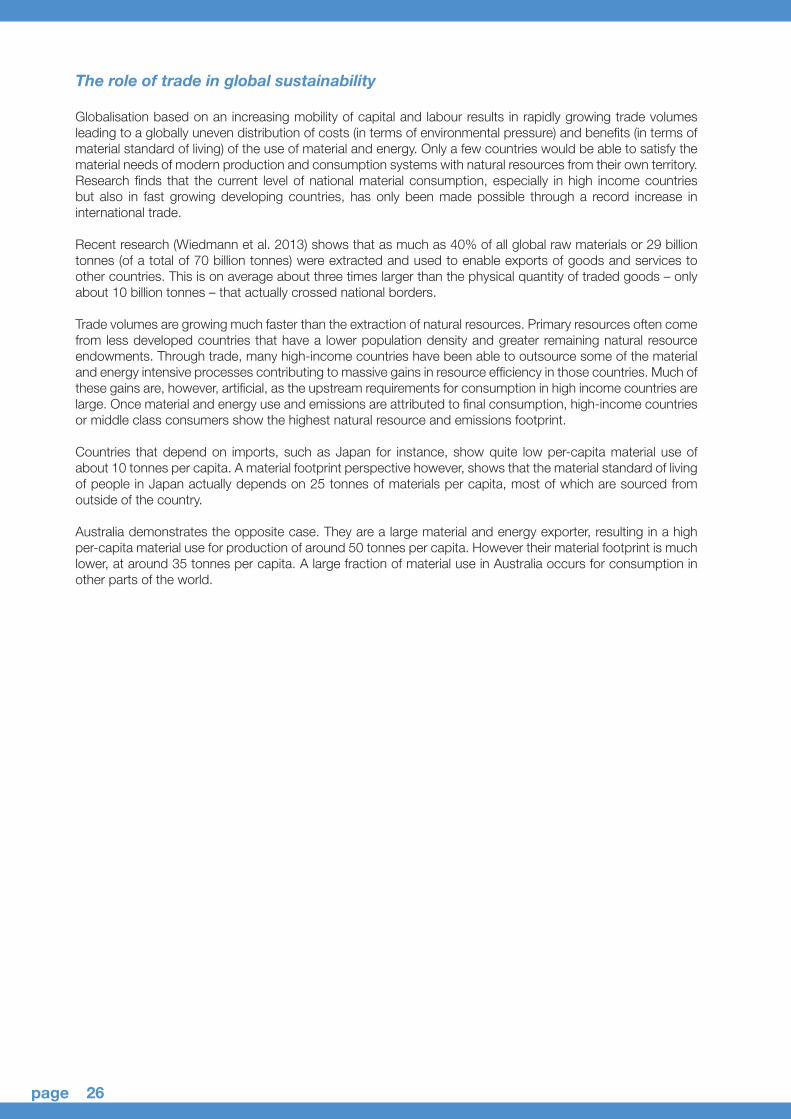
The role of trade in global sustainability
Globalisation based on an increasing mobility of capital and labour results in rapidly growing trade volumes leading to a globally uneven distribution of costs (in terms of environmental pressure) and benefits (in terms of material standard of living) of the use of material and energy. Only a few countries would be able to satisfy the material needs of modern production and consumption systems with natural resources from their own territory. Research finds that the current level of national material consumption, especially in high income countries but also in fast growing developing countries, has only been made possible through a record increase in international trade.
Recent research (Wiedmann et al. 2013) shows that as much as 40% of all global raw materials or 29 billion tonnes (of a total of 70 billion tonnes) were extracted and used to enable exports of goods and services to other countries. This is on average about three times larger than the physical quantity of traded goods – only about 10 billion tonnes – that actually crossed national borders.
Trade volumes are growing much faster than the extraction of natural resources. Primary resources often come from less developed countries that have a lower population density and greater remaining natural resource endowments. Through trade, many high-income countries have been able to outsource some of the material and energy intensive processes contributing to massive gains in resource efficiency in those countries. Much of these gains are, however, artificial, as the upstream requirements for consumption in high income countries are large. Once material and energy use and emissions are attributed to final consumption, high-income countries or middle class consumers show the highest natural resource and emissions footprint.
Countries that depend on imports, such as Japan for instance, show quite low per-capita material use of about 10 tonnes per capita. A material footprint perspective however, shows that the material standard of living of people in Japan actually depends on 25 tonnes of materials per capita, most of which are sourced from outside of the country.
Australia demonstrates the opposite case. They are a large material and energy exporter, resulting in a high per-capita material use for production of around 50 tonnes per capita. However their material footprint is much lower, at around 35 tonnes per capita. A large fraction of material use in Australia occurs for consumption in other parts of the world.

27page
Part A
1 2 3 4 5 6 7 8 9 10 11 12 13 14
Figure 1.8 Domestic Material Consumption (DMC) compared to Material Footprint (MF)
0
10
20
30
40
50
60
1990
1991
1992
1993
1994
1995
1996
1997
1998
1999
2000
2001
2002
2003
2004
2005
2006
2007
2008
Tonn
es p
er c
apita
Year
Australia
DMC
MF
0
5
10
15
20
25
30
1990
1991
1992
1993
1994
1995
1996
1997
1998
1999
2000
2001
2002
2003
2004
2005
2006
2007
2008
Tonn
es p
er c
apita
Year
Japan
DMC
MF
Source: (Wiedmann et al. 2013)
Most certainly, trade flows of material and energy will continue to grow, further contributing to the already uneven distribution of ‘costs’ and ‘benefits’ from resource use across the globe. This creates very distinct policy challenges.
Public policies for SCP will underpin the future prosperity of the globe and the competitiveness of nations
For a long time the majority of environmental pressures and impacts came from wealthy OECD countries. This has profoundly changed since the 1990’s and now developing countries especially in Asia but also in Latin America and Africa have been the motor of world economic development. Over the last two decades millions of people in developing countries were lifted out of poverty and living standards continue to grow steadily. The economic transition in the developing world is happening in an economic context that former World Bank economist Herman Daly has named ‘full world economics’ (Daly, 2007). This reflects on an economic context in which natural resources and the absorptive capacity of ecosystems have increasingly become the limiting factors in economic growth and human development. While labour is available in abundance, resources will need to be extracted at ever-higher effort and climate change is setting clear limits on emissions.
In this new economic context, governments, businesses and households need to care about resource efficiency,

28page
and change to new ways of producing and consuming in order to make room for further growth and prosperity. The changing context indicates that environment and development are no longer antagonistic goals but are intrinsically interrelated. Without resource efficiency and innovation for SCP, future prosperity will be increasingly difficult to achieve. Developing countries have a number of advantages in creating a green economy. These include their traditional culture, which affirms sustainability, its people, many of whom are well educated and ready for innovation, and the fact that a lot of the infrastructure required for the future has not yet been established, creating a huge window of opportunity to do things well. This will require additional investment for lower income countries and the redirection of existing investment in emerging economies to enable sustainable consumption and production that will underpin a transition to a green economy.
Box 1:4 What are decoupling and resource efficiency?
If world population and consumption rates continue according to business as usual, annual global resource extraction could triple from 2000 levels to 140 billion tons in 2050. This scenario would seem to represent an unsustainable future in terms of resource use, emissions and environmental impacts. To address this challenge, experts and decision makers have investigated decoupling as a framework for breaking the links between human well-being and economic growth on the one hand, and escalating resource use and environmental degradation on the other hand. Decoupling means two things: decoupling economic growth from resource consumption (“resource decoupling”) and from environmental impacts (“impact decoupling”). This means that resource decoupling efforts should be checked to see that they do not increase environmental impacts. For developing countries with low metabolic rates (see Box 1:7), the foremost priority is to improve levels of material well being and access to services. For these countries, innovative opportunities need to be found to ensure better delivery of services and access to resources in a way that conserves their natural resource base. In this case, resource productivity is an important strategy in addition to resource efficiency. Developed countries with high resource metabolisms will have an abundance of opportunities to restore their resource base, improve the quality of their environment and reduce GHG emissions through more efficient and better use of resources. In this case resource efficiency strategies will be highly effective, and can be complemented by resource productivity.
Decoupling
In general, decoupling means removing the link between two variables. The International Resource Panel often refers to resource decoupling (the delinking of economic growth and resource use) and impact decoupling (the delinking of economic growth and negative environmental impacts). Moreover, decoupling can be relative (e.g. the rate of resource use increase is lower than the rate of economic growth) or absolute (e.g. resource use declines while the economy grows).
Box 1:5 Resource efficiency and development
Assumptions about environment and development tend to reflect the hypothesis of the Environmental Kuznets curve. This hypothesis suggests that as economies develop, environmental problems initially increase in line with economic development, before decreasing in later stages of economic development. This has been the excuse behind ‘waiting until we can afford it’ before acting.
Recent studies have suggested that this relationship only relates to community level environmental problems, such as urban air pollution, whereas household level environmental problems only decrease and global environmental problems only increase (see the orange and green curves respectively). The International Resource Panel’s most recent report on decoupling has shown that metabolic rates, at least based on latitudinal data, follow the trend of the green line, continually increasing with economic growth. This indicates that it is difficult to reduce the severity of resource use once consumption levels are high, making it reasonable for policymakers to find resource efficient paths of development at earlier levels of economic wealth.
Source: (Adapted from Wilkinson et al., cited in UNEP 2011b)

29page
Part A
1 2 3 4 5 6 7 8 9 10 11 12 13 14
Figure 1.9 The global interrelation between resource use and income (175 countries in the year 2000)
Source: (Wiedmann et al. 2013)
Box 1:6 Metabolic rates
Metabolic rates can be measured using Domestic Material Consumption (DMC), which is the mass of resources extracted domestically (from mining and agriculture) + products and materials imported - products and materials exported. Figure 1:10 shows the correlation between DMC and GDP, which follows the green continually increasing line in the Environmental Kuznets Curve, indicating it is not an environmental pressure that can easily be reduced once a country reaches higher development levels.

30page
Part A
1 2 3 4 5 6 7 8 9 10 11 12 13 14
Further reading 1
Roadmap to a Resource Efficient Europe outlines a plan to transform Europe’s economy into a sustainable one by 2050. It proposes ways to increase resource productivity and decouple economic growth from resource use and its environmental impact. It illustrates how policies interrelate and build upon each other.
European Commission 2011, Communication from the Commission to the European Parliament, the Council, the European Economic and Social Committee and the Committee of the Regions: Roadmap to a Resource Efficient Europe, COM(2011) 571 final, EC, Brussels.
Resource Efficiency in Latin America: Economics and Outlook provides an understanding of the existing trends and challenges in terms of resource efficiency. From the trends observed, four regional scenarios were built for 2010-2030 in order to identify viable alternatives to eventually make the best use of the region’s potential.
PNUMA & Red Mercosur 2011, Resource Efficiency in Latin America: Economics and Outlook, PNUMA & Red Mercosur.
Africa Review Report on Sustainable Consumption and Production reviews progress achieved in the thematic SCP issues identified at CSD-18, in Agenda 21 and in the Johannesburg Programme of Implementation. It provides an in-depth review of concrete actions and achievements, identifies and documents implementation challenges and constraints, and proposes the way forward for accelerating implementation progress in the area of SCP in Africa.
UNECA n.d., Africa Review Report on Sustainable Consumption and Production, UNECA.
Indicators for a Resource Efficient and Green Asia and the Pacific - Measuring progress of sustainable consumption and production, green economy and resource efficiency policies in the Asia-Pacific region This report reveals the patterns and the evolution of natural resource use in the Asia and the Pacific region over the last 40 years. With more than 130 graphs and tables and 115,000 data points available, the report presents a comprehensive set of indicators of resource use at national and regional levels. By reading the full report each expert and decision maker will find information relevant to support decision-making for national policy priorities and development objectives.
UNEP 2015, Indicators for a Resource Efficient and Green Asia and the Pacific - Measuring progress of sustainable consumption and production, green economy and resource efficiency policies in the Asia-Pacific region, Schandl, H., West, J., Baynes, T., Hosking, K., Reinhardt, W., Geschke, A., Lenzen, M. United Nations Environment Programme, Bangkok.

31page
Part A
1 2 3 4 5 6 7 8 9 10 11 12 13 14
Part A
1 2 3 4 5 6 7 8 9 10 11 12 13 14
© Milton Grant


33page
Part A
1 2 3 4 5 6 7 8 9 10 11 12 13 14
The Fundamentals of SCP
2.1 Linkages between poverty reduction and SCP 2.2 Life-cycle thinking and a systems approach
SCP x
x
ExcellentGoodAveragePoor
SCP?
2

34page
The Fundamentals of SCPKey Points
• SCP is a critical element of poverty reduction that needs to be part of a holistic poverty alleviation policy.
• There is no real conflict in priorities between economic development and SCP.
• Sustainable economic growth need not be restrained – SCP calls for different growth paths, not curtailed growth.
• A vision that considers life cycle approaches is fundamental when moving towards SCP, as encouraged in the recently adopted document at Rio+20 on the 10YFP.
• Life-cycle thinking is one of the most important elements in the SCP approach. It provides the framework for a holistic assessment and can be applied to any kind of system or value chain.
• SCP takes a systems approach to sustainability. It means trying to address the underlying causes of an identified problem rather than just trying to alleviate its immediate symptoms.
This chapter introduces concepts and perspectives that are fundamental to SCP thinking and practice. It addresses some widely held misunderstandings, in particular the misconception that there is a conflict between SCP and poverty alleviation. The importance of considering products and services in terms of their complete lifecycle is introduced and explained.
2.1 Linkages between poverty reduction and SCP SCP and poverty reduction
In classic terms, the objective of SCP is to:
• Conserve natural resources through more efficient use so that human needs can be satisfied without exhausting the world’s finite supply of such resources, leaving behind enough for future generations.
• Ensure that the goods and services we produce and consume and the manner in which they are produced, used and discarded does not pollute the planet.
The most pressing issue for developing countries, including those in transition, is poverty alleviation. This remains the single most important of the Millennium Development Goals. Economic growth is thus of key importance to developing countries and many of their policymakers believe that developed countries, having already accomplished a high level of satisfaction of their needs, now wish to suggest frugality and restraint on consumption in the developing world. From a production standpoint, developed countries have shifted a large number of production activities to developing countries and transitional economies. China, for instance, is now considered the “factory to the world”. Industrial production necessarily involves some degree of energy consumption and effluent discharge, so developing countries are charged with exponentially increasing GHG emissions and pollution.
Clearly, there has to be some degree of equity. The onus of sustainability must be shared in an equitable manner, with both developing and developed countries contributing their fair share. Poverty and pollution
“Poverty is the greatest polluter”. This statement is attributed to the former Indian Prime Minister, Indira Gandhi, at a speech at the 1972 Conference on the Human Environment is Stockholm. She theorised that the poor were forced to pollute by poverty and unequal access to land, setting off a downward spiral where they were impelled to destroy the natural resources on which they depend, thus deepening their poverty (Lean, George, n.d).
While this is undoubtedly true, it must be placed in context. The statement was made in 1972, long before the world became conscious of acceleration in anthropogenic GHG emissions. The oil crisis of 1973 was perhaps the first shock that set off thinking about conservation of natural resources, and a few years later, ozone
2
SCP

35page
Part A
1 2 3 4 5 6 7 8 9 10 11 12 13 14
depletion came into public consciousness, setting off the alarm about atmospheric pollution. Nevertheless, Mrs Gandhi’s statement was one of the earliest to create a direct link between environmental concerns and poverty alleviation.
It can be readily accepted that the world’s poor, even in aggregate, are not leaders in depletion of non-renewable resources. Neither can the poor be held responsible for the major part of the GHG emissions. The culprits are over-consumption by the rich, irrespective of which country they belong to, and the design, production and promotion of plainly unsustainable products. The impact, however, is greatest on lower income groups, as illustrated in below.
Figure 2:1 Share of income derived from different capital stocks in country groupings
0%
20%
40%
60%
80%
100%
LowIncome
Lower-MidIncome
Upper-MidIncome
HighIncome
Intangible Capital
Produced Capital
Natural Capital
3991
1150
2075
14253
4962
4398
76193
16481
10921
35339
76193
9531
Natural Capital is the wealth derived from activities related to nature. Produced capital refers to wealth from the production of goods. Intangible capital is the difference between the total wealth and natural + produced capital.
Source: (Ferreira, Hamilton & World Bank 2006)
The poor depend much more on nature for their livelihoods than the rich. Thus “natural” changes – for instance those brought about by climate change due to man-made activities – are likely to hit the poor much harder than the rich, although ultimately they will affect all.
This underscores the need for countries to move towards a green economy – by investing in natural capital as a source of economic growth. Table 2:1 illustrates the link between poverty alleviation and wise management of natural resources and ecosystem services.
Table 2:1 Poverty alleviation and natural resources
Natural-resource dependent sectors and ecosystem services Brazil Indonesia India
Original share of GDP (%): agriculture, forestry, fisheries 6% 11% 17%
Adjusted share of GDP (%): including non market/ESS 17% 15% 20%
Share of ESS/non market goods of total income of the poor (%) 90% 75% 47%
Source: (TEEB 2010)
As can be seen, eco-system services and other ‘non-market’ goods can account for as much as 47-90% of the so-called “GDP of the poor”, highlighting their vulnerability. Needs and aspirations
It is not only the basic needs of the poor which have to be met; it is also essential that their aspirations be fulfilled. The desire to continuously improve the quality of life is inherent – Abraham Maslow’s theory of need hierarchy holds even today. The challenge therefore, is how to decouple the needs and aspirations from the effects on the environment, as illustrated in Figure 2:2.

36page
Figure 2:2 The decoupling challenge
Interpolated from: (UNEP 2011)
Sustainable practices in both consumption and production can permit the fulfilment of both needs and wants while minimising the effect on nature, i.e. with the minimum resource depletion and with minimum pollution. Pressure to improve sustainable practices can lead to employment generation and stimulate innovation while simultaneously protecting existing sources of income. It should be noted, however, that there are multiple reasons for continued poverty, including lack of education, poor healthcare, political crises, poor access to credit and the like. SCP alone cannot address all the causes of poverty; the solution lies in a holistic poverty alleviation programme which includes SCP as one of the more critical elements.
SCP practices contributing to poverty reduction:
There are a number of initiatives which countries can take in their search for increased sustainability in consumption and production. Many governments are adopting or have adopted sector-specific policies such as Sustainable Public Procurement (Chapter 10), codes and standards for Sustainable Cities (Chapter 9) or Sustainable Tourism (Chapter 11). Others have formulated policies which mandate land usage, waste disposal, effluent discharge, energy efficiency, minimum wages, working conditions and the like and have implemented these through legislation, fiscal incentives or a combination of both.
Simultaneously there are pressures on the private sector to exhibit a greater sense of Corporate Social and Environmental Responsibility while individuals are equipped with tools such as ecolabels to enable them to make the right/sustainable choice.
Most of these initiatives have been tried and stood the test of time. Chapter 10 on Sustainable Public Procurement provides examples of reductions in CO2 emissions in Europe and Asia and shows how a planned programme of increasing sustainability in public buying can lead to job creation, innovation and improved efficiency. “Poverty Alleviation Through Sustainable Tourism Development”, a UNESCAP Publication (2003) lays out how sustainable practices in the tourism sector can and do lead to a reduction in poverty. Virtually every sector, in every country will have success stories to tell of how SCP has helped in reducing poverty. Some of the SCP policy opportunities that can lead to a reduction in poverty are discussed further in Part B of the publication.
In summary, the link between SCP and poverty alleviation lies in:
• Reduced demand for depleting resources and therefore increased availability.• Reduced effect on the world’s climate - and thus protection of the livelihoods of those dependent
on nature.• Improved health – once again due to a reduction in aberrations in the climate, and also due to lower
levels of pollution of air, water and the earth.• Improved efficiency in the production of basic goods and services – and consequently improved
affordability for the poor.• Increased job creation due to newly created products and services and new methods of production.

37page
Part A
1 2 3 4 5 6 7 8 9 10 11 12 13 14
2.2 Life-cycle thinking and a systems approach The significance of life-cycle thinking
Modern urban lifestyles involve the daily use of a large number of products (including services) but few people reflect over how these products have been produced and what environmental and socio-economic impacts have been caused along the way. In addition, few people think of what will happen to the products they are currently using when they don’t need them anymore – how they can be reused, recycled, or taken care of safely as waste. When assessing the sustainability performance of a product it is essential to use a life-cycle perspective and consider all impacts associated with that product from “cradle to grave”, including consumption of natural resources as well as emission of pollutants. This means to consider not only the environmental and socio-econommic impacts of the product itself during its use phase, such as the energy consumption of a lap-top computer, but also the resource consumption and pollution associated with all stages of production as well as end-of-life management. In the case of a lap-top computer, large amounts of resources are consumed during the production stages – in fact, many times more than the weight of the computer itself – and if the recycling is not done properly there could be significant harm to humans and the environment and the depletion of already scarce metals.
Most products and services are part of increasingly complex industrial networks involving resource extraction and refining, component manufacturing, final assembly, distribution, retail, use and recycling and waste management. All of these processes consume energy and other resources, and most of them emit pollutants to the environment. Figure 2:3 shows in a schematic manner the different stages of a product life-cycle.
Figure 2:3 A schematic product life-cycle covering all the major phases from raw materials extraction to end-of-life management
Source: (UNEP/SETAC 2005)
A life-cycle perspective can be applied to product value chains as well as all kinds of systems (e.g. municipal infrastructure such as water water treatment systems and solid waste management systems). Many studies have been conducted of municipal infrastructure, such as wastewater treatment systems and solid waste management systems. Such studies can be of particular interest for governments since they often play a central role in decisions on investments in this kind of infrastructure.
A life-cycle perspective can reveal what stage of a product’s life-cycle is causing the largest environmental burden and thereby help in guiding improvement efforts. For example, most of the environmental impacts of automobiles are caused during the use phase (emissions of carbon dioxide and other pollutants) while for many food products the highest environmental impacts are caused through food and material losses, highlighting the importance of
Design and production
Packaging anddistribution
Use and maintenance
Reuse
Extraction ofraw materials
Incinerationand disposal
Reuse andrecycling
Recovery
Recyclingmaterials/components

38page
considering consumption behaviour when identifying the environmental hotspots of the food sector. Effective policy responses need to take such differences into account.
Box 2:1 Life cycle impacts of common products
A life-cycle perspective will often reveal surprising facts about the environmental impacts associated with products. For example, few consumers are aware of the huge amounts of water needed to produce cotton. Scientific studies have calculated that the production of one pair of jeans requires around 8000 litres of water (Water Footprint Network, 2012). Few people realise that when buying a pair of new jeans they are in fact using up as much water as they would normally be drinking over a period of almost 11 years (assuming that an average person drinks two litres of water per day). Similar calculations show for example that the production of one cup of coffee requires 130 litres of water (Water Footprint Network, 2012). Few couples that are getting married know that between 4 to 100 tonnes of rock (Valdivia & Ugaua 2012) had to be mined in order to provide the 10 grams of gold needed to make two plain wedding rings.
Other studies have investigated the greenhouse gas emissions caused by food production and found that a person’s climate impacts can differ quite significantly depending on his or her dietary habits. In general, high consumption of meat (especially beef) has a large climate impact while a vegetarian diet based on seasonal products grown locally is the most climate-friendly. Since food production is resource intensive, and treatment of organic waste generates greenhouse gases, waste of food is a major loss for society. For example, in the UK it has been estimated that the environmental benefit of reducing food waste from households to zero would be equivalent to reducing the number of cars by 20 per cent (WRAP 2011).
Burden shiftingLife-cycle thinking can also help in identifying when there is a risk for burden shifting, that is when a solution to a problem at one stage of the life-cycle is causing increasing problems elsewhere. The risk for burden shifting can be illustrated by the case of an energy efficient product that requires more materials for its production than a conventional option with lower energy efficiency. If the energy needed for extracting and processing the extra materials is taken into consideration, the more efficient product may not be using less energy over its life-cycle. It is only by considering the whole life-cycle that it’s possible to say whether there is a risk for significant burden shifting. It is of course essential that public policymakers are cognisant of when a policy intervention runs the risk of shifting environmental burdens rather than reducing overall environmental impacts.
Figure 2:4 Life cycle of a washing machine
EXTRACTION OFRAW MATERIALS
(metal ores, crude oil)
DESIGN AND PRODUCTION(refining materials, producing
component, assembly)
PACKAGING AND DISTRIBUTION
REUSE AND RECYCLE /FINAL DISPOSAL
USE AND MAINTENANCE
DISPOSAL AND INCINERATION

39page
Part A
1 2 3 4 5 6 7 8 9 10 11 12 13 14
Understanding life-cycle assessment
Life-cycle thinking is a way of looking at the environmental and socio-economic impacts of products from a broad perspective. This can be done in a qualitative manner, for example by discussing what burden shifting could occur from a certain design change or from the introduction of a new public policy. In contrast, life-cycle assessment (LCA) is a mainly quantitative methodology for compiling, analysing and generating life-cycle information. There are generally four main stages in an LCA study:
1. Goal and Scope Definition, where the objective and boundaries of the study are decided.2. Inventory Analysis, where a model of the life-cycle is made and data on environmental emissions
and resource consumption from the different processes across the life-cycle are collected or calculated. 3. Impact Assessment, where the impact on the environment is assessed.4. Interpretation, where significant issues are identified and conclusions are drawn. Sensitivity analyses,
identification of significant data gaps and major uncertainties can also be included.
Figure 2:5 LCA stages according to ISO 14040
Direct Applications:- Product development and improvement- Strategic planning- Public policy making
Goal and scopedefination
Inventory analysis
Impactassessment
Interpretation
An LCA can have a narrow focus on one single kind of impact, such as greenhouse gas emissions. This can be the case for example in studies to support carbon footprint labelling. However, in many cases, studies aim to be comprehensive and therefore include a very large number of resources and pollutants. A technique often used for dealing with this complexity is to group together all pollutants that cause similar kinds of harm, for example those that are toxic to humans, those that are related with climate change and those that can lead to eutrophication. Special factors are then used for converting the effect of different substances into a common unit. For example, all gases that contribute to climate change are converted into carbon dioxide equivalents. The results of these calculations are often given in the form of an environmental profile showing how a certain product contributes to a number of environmental problems. Comprehensive LCAs often require large amounts of data and take a fairly long time to conduct. It is therefore hardly surprising that most LCAs have been conducted by large companies, industry federations and academic institutions. However, as experiences of conducting such studies in different sectors and for different types of products have grown, an increasing amount of life-cycle information has become available to other groups and streamlined LCA approaches with lower data requirements have been developed. Based on the knowledge

40page
generated in a large number of independent studies it has also been possible to develop rules of thumb to help decision making. An example of this is the EU waste hierarchy which ranks a number of waste management options from the most favoured (prevention) to the least favoured (disposal). Chapter 9 provides more details on the role of the waste management hierarchy in policy.
Since the late 1980s a number of academic institutions, governments and private companies have been engaged in developing methods and tools for LCA. Refer to the further reading section at the end of this chapter for details of some of the key UNEP tools already available. A global community of researches and practitioners of LCA has also emerged, and in some countries there are national centres or networks – often involving academia and business as well as government. A series of international standards – the ISO 14040 series – has also been developed. These standards define among other things a common terminology, a systematic procedure and reporting requirements. At the global level, UNEP has been active in awareness raising and capacity development, especially in collaboration with the scientific association SETAC (Society for Environmental Toxicology and Chemistry) through the UNEP/SETAC Lifecycle Initiative.
LCA has traditionally focused only on environmental aspects, but in recent years there has been a growing interest in conducting similar studies including also the social dimension of sustainability. Environmental impacts – consumption of resources and emission of pollutants – are only one aspect of sustainable products. Social aspects, such as decent salaries and proper worker protection, are receiving increasing attention and attempts have been made to include such aspects in life-cycle studies in a systematic fashion. A recently published report from the UNEP/SETAC Life Cycle Initiative (2011) takes stock of emerging methods for such expanded sustainability assessments and provides a number of useful case studies. The cases illustrate how the assessment of social aspects can highlight inappropriate labour conditions both upstream in supply chains and downstream in recycling. Since responsible consumers may wish to avoid products that have been produced under poor social conditions, or that generate hazards and social problems at end-of-life, it is important that policymakers work to increase the transparency of product life-cycles and require the private sector to improve access to information on environmental as well as social aspects from a life-cycle perspective.
Box 2:2 LCA in developing countries
A challenge frequently faced when conducting LCAs in developing countries is that SMEs play a very significant role in the economy. Collecting data on resource consumption and emissions of environmental pollutants from such small enterprises often turns out to be difficult. Studies will therefore in many cases have to rely on guesses and rough estimations. If data is very uncertain, it can be a good idea to use a scenario approach and make calculations based on both best-case and worst-case assumptions. If it turns out that data from a certain production process is having a large influence on the overall conclusions of a study, and the best-case and worst-case assumptions lead to different overall results, it’s an indication that it might be worth spending more efforts to establish correct and representative data.
As more LCAs are becoming available through open source options or research institutions, relevant findings can be first identified before deciding on whether a full LCA is really needed for a better informed decision by business, governments or consumers; this approach is called LC knowledge mining and is helping to obtain good rules of thumb to assist decision making processes.
A systems approach to sustainability
It is possible to reduce the environmental impacts of most products quite substantially through design changes. To some extent this is already happening and LCA studies are providing valuable input to these improvement efforts. However, there is a limit to what can be achieved through an approach that basically takes existing consumption patterns for given and only concentrates of reducing the impacts of this consumption. Given the rapidly escalating consumption of natural resources and the increasing emission of greenhouse gases there is a need also for approaches that explore radically different ways of providing utility or wellbeing to citizens/consumers; we can call such changes systems innovations. Air quality is a big issue in many large cities, but the strategy for making improvements can be very different. Some strategies are more systems oriented and therefore more likely to be able to address the root causes. We can distinguish between three principally different ways of addressing the issue.
1. Improve the environmental performance of vehicles, for example by introducing and enforcing emission standards for cars.
2. Shift from modes of transportation with high environmental impacts, such as cars, to those with lower impacts.

41page
Part A
1 2 3 4 5 6 7 8 9 10 11 12 13 14
3. Reduce the need for transportation and mobility, for example through improved city planning and zoning.
Strategy number one is a kind of technical fix that can be made relatively easily. In fact, many countries already have emission regulations for vehicles in place. However, even so, the air in many cities remains highly polluted and the resulting negative impact on human health is considerable. In contrast, strategies number two and three are more systemic in nature and address the underlying drivers of the problem. By addressing the underlying drivers they can also generate additional social benefits, for example: increased use of public transportation reduces not only emissions but also congestion, reduced need for long-distance work commuting leads to shorter commuting time and potentially to more leisure time. These three strategies are of course not exclusive – in order to improve air quality substantially, governments will most likely have to pursue all three of them.
In essence, taking a systems approach means to look at an issue in a broader context. It aims to address the underlying causes of an identified problem rather than just trying to alleviate its immediate symptoms. It also means being aware of, and trying to avoid, any burden shifting that may occur, i.e. understanding the side-effects of a proposed solution. Biofuels offer a good example where such burden shifting can be significant. While it has been shown that certain kinds of biofuels can reduce emissions of greenhouse gases if they replace fossil fuels, it has also been shown that large scale expansion of biofuels could lead to reduced supply of food crops and feed crops and thereby result in increasing food prices. In order for governments to be able to promote sustainable development it is important that such systemic side-effects are identified at an early stage in the policy process. It is also important that credible science-based methods are used for quantifying such side-effects to the extent possible. These tools can help in making more informed decisions regarding policy options, however the studies can never replace political judgement.
Figure 2:6 Holistic systems approach to SCPThe below diagram visually represents the holistic systems approach to SCP. It demonstrates some of the many opportunities for intervention towards SCP throughout the life cycle of a product or service.

42page
Box 2:3 Complex value chains and multiple impacts – challenges for life-cycle thinking
In many cases, as a result of globalisation, the processes that are part of a product life-cycle are spread out geographically, often located even on different continents. Due to the complexity of these value chains – the many stages typically involved, the large number of materials and components that are often used in a single product, and the geographic dispersion of the production and end-of-life treatment processes – it is extremely difficult for consumers to understand the full environmental impact of products and of available options. Electronic products and cars are examples of complex products with highly globalised supply chains, but also many other consumer products, such as food, clothing and furniture are increasingly traded across borders.
Consumers who seek to understand the social conditions and environmental impacts in such global supply networks will usually have a hard time finding the information they would like to see. Governments are facing similar challenges when developing guidelines for green public procurement and when designing regulations and other policy instruments intended to shift patterns of consumption and production.
In addition, environmental impacts are not one-dimensional. In reality, products can impact the environment in many different ways such as through toxic releases, greenhouse gas emissions and nutrient discharges to water. A comprehensive view of products’ environmental impacts requires that all significant impacts be considered.
Why it is important to engage the private sector?
Most products and services are provided by the private sector. Businesses therefore play a pivotal role in society’s shift towards SCP. While consumers typically have limited knowledge on the full life-cycles of the products they buy, producers are in a much better position to apply a life-cycle perspective. Medium sized and large companies generally have capacity to scrutinise their value chains from a sustainability perspective, to compile relevant data, to engage with actors upstream (suppliers) and downstream (waste managers and recyclers) and to initiate improvements. Given the central role played by the private sector in managing product life-cycles, policymakers need to encourage and incentivise companies to adopt a life-cycle perspective.
For the private sector, taking a life-cycle perspective involves looking at their activities in a broader context. Life-cycle thinking requires investigation across the supply chains, not only of the direct suppliers but also several steps upstream. This approach can be further elaborated within a Life Cycle Management framework, that proposes the implementation of a management system towards continual improvements basing on life cycle based approaches. It will consider impacts caused after the product has been sold and when it eventually breaks or becomes obsolete. Companies that take a life-cycle perspective acknowledge that they have a certain responsibility for the total impacts caused throughout the product life-cycle. They are also acknowledging that they are in a position where they can influence the environmental impacts from the whole life-cycle through the way they design their products and through their procurement decisions. Companies that take a strategic approach to sustainability are usually very systematic in the way they investigate the life-cycles of their products and search for improvement opportunities. They are also typically good at communicating these improvements to the market and at translating their sustainability efforts into competitive advantages.
Businesses can gain significant triple bottom line benefits through adopting a life cycle perspective. Firms that incorporate resource efficiency and a green economy in their strategy often experience positive impacts in their financial metrics. As well as positive returns on investment in sustainable activities and improved financial performance, businesses can improve social and environmental conditions, hence contributing to the firm’s long term sustainability, growth and overall success. Through its extensive research and development for the green economy, UNEP (2012), has identified the following business drivers for resource efficient and sustainable business strategies:
• More resilient supply chains;• New investment opportunities;• Increased consumer demand for sustainable goods and services;• Sales growth and duration of sales;• Training and job creation;• Reduced dependency on natural resources;• Mitigation against the negative financial risk from environmental impact.

43page
Part A
1 2 3 4 5 6 7 8 9 10 11 12 13 14
Box 2:4 Private sector opportunities using life cycle thinking
Producers of laundry detergents were one of the first industries to conduct LCAs in order to see how their products could be reformulated for lower environmental impacts. It was soon found that a very significant environmental aspect of clothes washing is the energy consumption for water heating. Based on this insight, the manufacturers developed new detergents that would be effective at lower temperatures. This is a good example of a case where the producers saw their product as part of a larger system and explored both how the environmental impact of that larger system could be reduced and what role their particular product could play. By using life-cycle thinking to redesign their product they reduced the life-cycle environmental impact and at the same time managed to save money for their customers.Source: (European Commissions 2010b)
© Western Sahara

44page
Further reading 2
SCP for Poverty Alleviation explores the type and quality of the linkages between SCP and poverty alleviation. A theoretical framework is constructed and supported by a number of case studies, which identify and where possible quantify the combination of economic, social and environmental gains secured by transitioning towards SCP.
United Nations Environment Programme 2012, SCP for Poverty Alleviation, UNEP, Paris.
Growth, Poverty and the Environment is an excellent essay focussing on the links between growth, poverty reduction and environmental sustainability. It can be found in the ‘Global Monitoring Report’ 2007, assessing the contributions of countries and international financial institutions towards achieving the Millennium Development Goals.
The World Bank 2007, Global Monitoring Report 2007, The World Bank, Washington.
Towards a life cycle sustainability assessment: making informed choices on products provides a state-of-the-art introduction to Life Cycle Assessment (LCA). It covers both traditional LCA, which only analyses products’ environmental impacts, and new developments like Life Cycle Costing (LCC) and Social LCA. Social LCA uses a methodology similar to environmental LCA but focuses on practices that are socially unsustainable, such as dangerous and unfair working conditions and human rights violations. The report is written by a group of leading scholars in the field of LCA, but it is very accessible also for non-experts.
United Nations Environment Programme 2011. Towards a life cycle sustainability assessment: making informed choices on products, UNEP, Paris.
Global Guidance Principles for Life Cycle Assessment Databases – A Basis for Greener Processes and Products, provides guidance principles for Life Cycle Assessment (LCA) databases; this includes how to collect raw data, how to develop datasets and how to manage databases. It provides the bridge between the data users and the data providers, making basic information easily accessible for computing the environmental footprints of materials and products that are key to make and judge green claims and to allow institutional and individual consumers to make informed consumption choices.
UNEP/SETAC 2011, Global Guidance Principles for Life Cycle Assessment Databases - A Basis for Greener Processes and Products, Paris, France.

45page
Part A
1 2 3 4 5 6 7 8 9 10 11 12 13 14


47page
Part A
1 2 3 4 5 6 7 8 9 10 11 12 13 14
3 The 10YFP and International Collaboration on SCP
SCP x
x
ExcellentGoodAveragePoor
SCP?

48page
3 The 10YFP and International Collaboration on SCP
This chapter provides a brief history of SCP in international policy. It details the 10-year framework of programmes for SCP (10YFP) and concludes with a discussion of global collaboration on SCP policy.
3.1 The evolution of SCP in international policy The adoption of the 10-year framework of programmes for SCP (10YFP) at Rio+20, is the culmination of joint efforts for a strong international mandate to enhance collaboration and accelerate the transition towards SCP. Through initiatives at local and national level, sub-regional and regional platforms that highlighted common characteristics and the work of the Marrakech Process that galvanised and propelled the international SCP agenda, the 10YFP highlights both the needs and opportunities for governments, UN Agencies and stakeholders to operate in concert. To better understand the 10YFP, it is useful to know the evolution of SCP within the international policy agenda.
From Stockholm and the birth of UNEP to the Rio+20 conference
A fairly recent history of international sustainability policy can be dated from the 1972 UN Conference on the Human Environment. This was the same year as the release by the Club of Rome of the landmark publication The Limits to Growth with a clarion call to shift course away from the economic growth paradigm in order to avoid overshoot and collapse (Meadows et al. 1972). It wasn’t until 1992 at the UN Conference on Environment and Development held in Rio de Janeiro, that for the first time at a top level international agenda-setting policy meeting, world leaders acknowledged that “the major cause of the continued deterioration of the global environment is the unsustainable pattern of consumption and production” (UN 1992a). Seven years later, in 1999, the UN General Assembly updated its Guidelines for Consumer Protection to include a section on sustainable consumption (see Box 3.1).
Figure 3:1 A history of SCP in international policy
1972
73 74 75 76 77 78 79 80 81 82 83 84 85 86 87 88 89 90 91 92 93 94 95 96 97 98 99 00 01 02 03 04 05 06 07 08 09 10 11 12
1972UN Conference on the Human Environment (Stockholm conference) 1972Publication of "The Limits to Growth" by Club of Rome
1992UN Conference on Environment and Development (Rio Conference), Agenda 21
1995Oslo Ministerial Roundtable on Sustainable Production and Consumption, proposal for International Work Programme
1997CSD 5, Rio+5
1999 UN updates Guidelines for Consumer Protection to include sustainable consumption
2002UN World Summit on Sustainable Development, Johannesburg
2003Marrackech Process launched
2010CSD 18, review of 10YFP development
2012CSD 19, negotiated text for 10YFP (not adopted)2012UN Conference on Sustainable Development (Rio+20, 10YFP Adopted)
Key Points• The formal adoption of the 10YFP at Rio+20 showed strengthened
commitment from countries to shift towards SCP, and firmly established the role of SCP in sustainable development in the foreseeable future.
• The ‘10YFP is a global framework of action to enhance international cooperation to accelerate the shift towards SCP in both developed and developing countries (UNEP 2013).
• The Marrakech Process has, over the last decade, been the main channel for intergovernmental collaboration specifically on SCP.
• There are a number of regional platforms across the world collaborating to facilitate the implementation of SCP activities.

49page
Part A
1 2 3 4 5 6 7 8 9 10 11 12 13 14
Box 3:1 United Nations guidelines on sustainable consumption
In 1985, prior to the Rio conference in 1992, the UN General Assembly adopted the UN Guidelines for Consumer Protection, an international framework that provides support for activities of consumer organisations as well as guiding principles for the development of national consumer protection legislation (UN 2003). The guidelines included the rights to: safety, information, choice, representation, education, redress, a healthy environment and basic needs. In 1999, to reflect growing concerns in unsustainable patterns of consumption and production and the need to bolster government and other stakeholder efforts to promote sustainable consumption, the guidelines were expanded with Section G on “Promotion of Sustainable Consumption”. Recently, new developments in technology, forms of social organisation, and business practices, present new challenges that are not currently reflected in the Guidelines. The United Nations Conference on Trade and Development (UNCTAD) has announced that it will start a new revision of the guidelines, to be tabled for adoption in 2014.
The guidelines call on Governments (in partnership with other stakeholders) to take leadership in several actions, including:
• Developing and implementing strategies that promote sustainable consumption through a mix of policies.
• Removing subsidies that promote unsustainable patterns of consumption and production.• Encouraging the design, development and use of products and services that are safe and energy and
resource efficient, considering their full life-cycle impacts.• Impartial environmental testing of products.• Safely managing environmentally harmful uses of substances and encouraging the development of
environmentally sound alternatives for such uses.• Developing indicators, methodologies and databases for measuring progress towards sustainable
consumption at all levels.
The final Declaration from Rio (UN 1992b) proclaims that “to achieve sustainable development and a higher quality of life for all people, States should reduce and eliminate unsustainable patterns of production and consumption and promote appropriate demographic policies.” Chapter four of Agenda 21, the blueprint for action resulting from Rio, was dedicated to “changing consumption patterns”. To achieve SCP, Agenda 21 called for actions towards two broad objectives:
a. Promote patterns of consumption and production that reduce environmental stress and meet the basic needs of humanity.
b. Develop a better understanding of the role of consumption and how to bring about more sustainable consumption patterns.
Box 3:2 Under-consumers and over-consumers: A “multipronged” approach as identified in Agenda 21 (UN 1992)
International SCP policy recognises the imbalances in consumption patterns between developing countries and industrialised countries. Coming from the Rio conference, it was acknowledged through Agenda 21 that: “Although consumption patterns are very high in certain parts of the world, the basic consumer needs of a large section of humanity are not being met. This results in excessive demands and unsustainable lifestyles among the richer segments, which places immense stress on the environment. The poorer segments, meanwhile, are unable to meet food, health care, shelter and educational needs.”
It was cautioned that in pursuing sustainable development at the international level, any measures “must take fully into account the current imbalances in the global patterns of consumption and production”. It recommends a “multipronged strategy focusing on demand, meeting the basic needs of the poor, and reducing wastage and the use of finite resources in the production process”– this allows for populations that are over consuming to reduce their consumption levels, while those with populations that are yet to meet their basic needs should increase their consumption levels in order to have sustainable livelihoods and an improved quality of life.
Agenda 21 asks for special attention on extraction of, and efficient use of natural resources as well as pollution reduction. It further calls for research to “assess the relationship between production and consumption, environment, technological adaptation and innovation, economic growth and development, and demographic factors” (UN 1992b). One of the most notable propositions from Rio in 1992 that has come to be considered central to SCP is the call for “new systems of national accounts” that do not depend on economic growth but

50page
rather on “new concepts of wealth and prosperity which allow higher standards of living through changed lifestyles and are less dependent on the Earth’s finite resources and more in harmony with the Earth’s carrying capacity”. One response to the need for “higher standards of living through changed lifestyles” is taken up under the 10YFP through the programme on Sustainable Lifestyles and Education.
From Rio to Johannesburg: the beginning of the Marrakech Process on SCP
The central role of SCP in achieving sustainable development was reaffirmed at the World Summit for Sustainable Development in 2002 (Johannesburg). The Johannesburg Plan of Implementation stated that ‘poverty eradication, changing unsustainable patterns of production and consumption and protecting and managing the natural resource base of economic and social development are overarching objectives of, and essential requirements for, sustainable development’ (UN WSSD, 2002). To translate SCP objectives into action, the Johannesburg Plan of Implementation called for the development of: “a 10-year framework of programmes in support of regional and national initiatives to accelerate the shift towards sustainable consumption and production to promote social and economic development within the carrying capacity of ecosystems by addressing and, where appropriate, delinking economic growth and environmental degradation through improving efficiency and sustainability in the use of resources and production processes and reducing resource degradation, pollution and waste” (UN 2003). This would form the foundation of the so-called Marrakech Process.
Over the last decade, global efforts towards SCP have been mainly coordinated under the Marrakech Process (MP) – an informal multi-stakeholder process platform to promote the implementation of policies and capacity building on sustainable consumption and production (SCP) and to support the development of a 10 Year Framework of Programmes on SCP. The process was led by UNEP and UN DESA at the global level, with an active participation of national governments, development agencies businesses and other stakeholders. In June 2003 UNEP and UNDESA organised the first international meeting of 115 experts from 59 countries and 9 international organisations to start the process of developing the SCP global framework of programmes. As the meeting where the process began was held in Marrakech, it came to be called the Marrakech Process. For 10 years, the process involved regional consultations to identify priority issues and areas that would form the basis of programmes, formation of topical international task forces and dialogues with different stakeholder groups.
Under the MP, regional consultations were developed to promote awareness and identify priorities and needs for SCP. The main outcomes can be summarised as follows:
• Development of regional SCP Strategies in Africa, Asia-Pacific, Latin America, Europe and West Asia.
• Development of National SCP Programmes through capacity building and implementation across15 countries.
• Seven Task Forces, voluntary initiatives led by governments, in cooperation with multi-stakeholder partners that focus on developing and implementing SCP policies, business management practices, consumer action, capacity building and projects.
• Over 70 initiatives on SCP with 33 demonstration and pilot projects implemented worldwide.
For example, the following priorities for SCP were identified through Asian regional consultations under the Marrakech Process: energy, waste and water as critical sectors; poverty as a cross-cutting issue; and as approaches, green public procurement, development of fiscal instruments, resource efficient and cleaner production and greening business and markets. Some regions developed regional strategies and implementation mechanisms with regional and national ownership, which were then endorsed by the relevant regional institutions and countries.
Some of the main mechanisms for international collaboration under the MP were through the Marrakech Task Forces (MTF) – voluntary initiatives lead by countries and UN agencies and with a north-south multi-stakeholder participation. The MTFs networked key stakeholders, developed guidelines for key policy areas, and undertook concrete projects and programmes at global, regional, national and local levels in order to develop and/or improve SCP tools and methodologies. There were seven MTF as shown below, all voluntary, and each led by a national government.

51page
Part A
1 2 3 4 5 6 7 8 9 10 11 12 13 14
Figure 3:2 Task forces under the Marrakech Process
Source: (UNEP 2011)
Following the Johannesburg mandate, the Marrakech Process supported the regional SCP Strategies in most regions and in around 20 countries. Some countries have initiated SCP programmes, others specifically designed National Action Plans on SCP, most with laws, policies and programmes aimed at different sectors and elements such as waste reduction/disposal, pollution, resource conservation, public procurement, etc. Brazil, Burkina Faso, Colombia, Cote d’Ivoire, Croatia, Dominica, Ecuador, Ghana, Indonesia, Kazakhstan, Mali, Mauritius, Senegal, St Lucia, Tanzania, Uganda and Zambia have dedicated SCP or sustainable development strategies. China and the Republic of Korea have “Green Growth” strategies, which address several objectives towards SCP. The European Commission came out with the Sustainable Consumption and Production and Sustainable Industrial Policy (SCP/SIP) Action Plan in 2008. Canada, like many countries, does not have a national strategy for SCP but has specific policies for different sectors, such as the Canadian Green procurement Policy of 2006 which influences over 5 billion USD of commodities (UNEP 2012). These national programmes and initiatives open up gateways through which countries can directly participate and benefit in implementation of their strategies with support of the 10YFP (IISD 2010). The 10YFP will facilitate adaptation and replication of successful initiatives, as well as scaling them up where possible.
A review of the progress towards development of the 10YFP was done by the Commission for Sustainable Development (CSD) at the 18th session, in 2010. It examined some of the barriers and constraints in implementation, as well as lessons learned and best practices of SCP. Some of the challenges included dealing with the extremes of wealth – over-consumption on the one hand and under-consumption on the other hand – under a common programme. This was particularly important as poverty was becoming more visible in some industrialised countries while a new consumer class was over-consuming in some developing countries. SCP was identified as a pressing issue both for developed and developing countries. At the discussion there were challenges on how to concretely define the programmes – SCP being a broad area that covered many sectors and issues.
The following cycle (CSD 19) delegates negotiated and agreed upon a draft text for the 10YFP, including vision, goals, functions, organisation structure, means of implementation and an initial and not exhaustive list of 5 programmes.
Rio +20 and the 10YFP
At the UN Conference on Sustainable Development (Rio +20) in 2012 governments reiterated messages from Agenda 21 and the Johannesburg Plan of Implementation, and declared “We recognise that fundamental changes in the way societies consume and produce are indispensable for achieving global sustainable development” (UN 2012). The negotiated text of the 10YFP from the CSD was formally adopted! This concrete decision from Rio+20 showed strengthened commitment from countries to shift towards SCP, and firmly established the role of SCP in sustainable development in the foreseeable future.
Paragraph 226 of The Future We Want: Rio +20 Outcome Document reads “We adopt the 10-year framework of

52page
programmes on sustainable consumption and production patterns, as contained in document A/CONF.216/5, and highlight that the programmes included in the 10-year framework are voluntary” (UNEP 2012).
What is the 10YFP?
As defined by UNEP (2013) the “10YFP is a global framework of action to enhance international cooperation to accelerate the shift towards SCP in both developed and developing countries”. It aims to develop, replicate and scale up SCP and resource efficiency initiatives, at national and regional levels, decoupling environmental degradation and resource use from economic growth, and thus increase the net contribution of economic activities to poverty eradication and social development. The objectives of the 10YFP are listed as follows.
• Accelerate the shift towards SCP, supporting regional and national policies and initiatives.• Contributing to resource efficiency and decoupling economic growth from environmental degradation
and resource use, while creating decent job and economic opportunities and contributing to poverty eradication and shared prosperity.
• Mainstream SCP into sustainable development policies, programmes and strategies, as appropriate, including into poverty reduction strategies.
• Support capacity building and facilitate access to financial and technical assistance for developing countries, supporting the implementation of SCP activities at the regional, sub-regional and national levels.
• Serve as an information and knowledge platform on SCP to enable all stakeholders to share tools, initiatives and best practices, raising awareness and enhancing cooperation and development of new partnerships (Global SCP Clearinghouse).
Implementation will be governed by an organisational structure which includes: a Board, a UN Interagency Coordination Group, a small Board, National and Stakeholders Focal Points, and a Member State body to receive reports.
The means of implementation are through voluntary contributions from all sources, a Trust Fund administered by UNEP and the Global SCP Clearinghouse.
• The Trust Fund will receive and mobilise resources in to develop and support SCP programmes in developing countries and countries with economies in transition. It will mainly provide seed money for capacity building activities delivered through its programmes. The 10YFP will attract funding from a range of bilateral and multilateral sources.
• The online Global SCP Clearinghouse was launched in May 2013. It is an online community bringing together SCP stakeholders worldwide through information, knowledge sharing and cooperation on SCP. There are already more than 1,000 members worldwide signed up to the Global SCP Clearinghouse (www.scpclearinghouse.org).
Box 3:3 What are the 10YFP programmes?
Programmes are at the core of the 10YFP. They will contribute to further promoting SCP, bringing together existing initiatives and partnerships working in similar areas, building synergies and cooperation among stakeholders to leverage resources towards mutual objectives and minimise duplication of on-going efforts. The 10YFP adopted text includes an open and indicative list of five programmes, based on experience gained throughout the Marrakesh Process and other SCP initiatives. Additional programmes might be added based on countries’ demand, certain criteria and approval of the 10YFP Board.
1. Consumer information2. Sustainable lifestyles and education 3. Sustainable public procurement (SPP)4. Sustainable buildings and construction5. Sustainable tourism, including ecotourism

53page
Part A
1 2 3 4 5 6 7 8 9 10 11 12 13 14
3.2 International collaboration on SCP
Collaboration for successful SCP
Given the broad scope and challenges of shifting established patterns of consumption and production, collaboration – among various stakeholders, at different levels of governance and across sectors - has been very instrumental towards meeting SCP objectives. International collaboration has sought to establish a shared understanding among governments, industries and civil society actors of the need for SCP, as well as working mechanisms that should help deliver the global objectives. At the regional and sub-regional level collaboration has facilitated a contextual understanding of the specifics of SCP – to provide a working interpretation that reflects the cultural dynamics and behavioural patterns of each region. For example, while in Europe there has been extensive research on European consumer and producer behaviour and several related Directives by the European Union member states, in Asia part of the objective of collaboration has been to develop an operational framework for Asia rather than trying to fit it to a European model. In Africa, with support of Germany, governments have endorsed a regional 10-year framework of programmes.
Global Collaboration
At the international level, some of the key mechanisms of collaboration have been through multilateral environmental agreements (MEAs), the Marrakech Process and regional platforms addressing different sustainability issues.
The negotiation and implementation of MEAs are perhaps the most established mechanisms of global collaboration in changing existing patterns of consumption and production. MEAs usually have specific objectives, geared towards solutions for a clearly identified issue. Although quite often the MEAs do not expressly mention SCP, the objectives often reflect the cross-cutting characteristic of SCP and the solutions ultimately affect patterns of consumption and production. Some typical MEAs with SCP related objectives include the Basel Convention, the Stockholm Convention and the Convention on Biological Diversity.
Regional collaboration
The recent UNEP (2012) report “Global Outlook on Sustainable Consumption and Production Policies: Taking Action Together” provides a comprehensive account of collaborative initiatives on SCP at the regional levels, a few of which are mentioned below.
In 2000, the African network of National Cleaner Production Centres (NCPCs) started to convene regional roundtables on SCP (ARSCP). The ARSCP held in Casablanca, Morocco in 2004 developed the 10YFP on SCP in Africa as part of the global Marrakech Process on SCP. The African 10 YFP embodies four main thematic priority areas: energy; water and sanitation; habitat and sustainable urban development; and industrial development. The plan further points out priority projects and activities in each thematic area. Development and implementation of the African 10YFP was supported primarily by the Marrakech Taskforce on Cooperation with Africa, led by Germany. The African 10YFP on SCP was endorsed by the African Ministerial Conference on Environment (AMCEN), issuing the Dakar Declaration on the promotion of SCP in Africa. The Declaration emphasises the importance of linking SCP with the challenges of poverty and meeting basic needs. It calls upon nations to mainstream SCP in the national, sub-regional and regional activities.
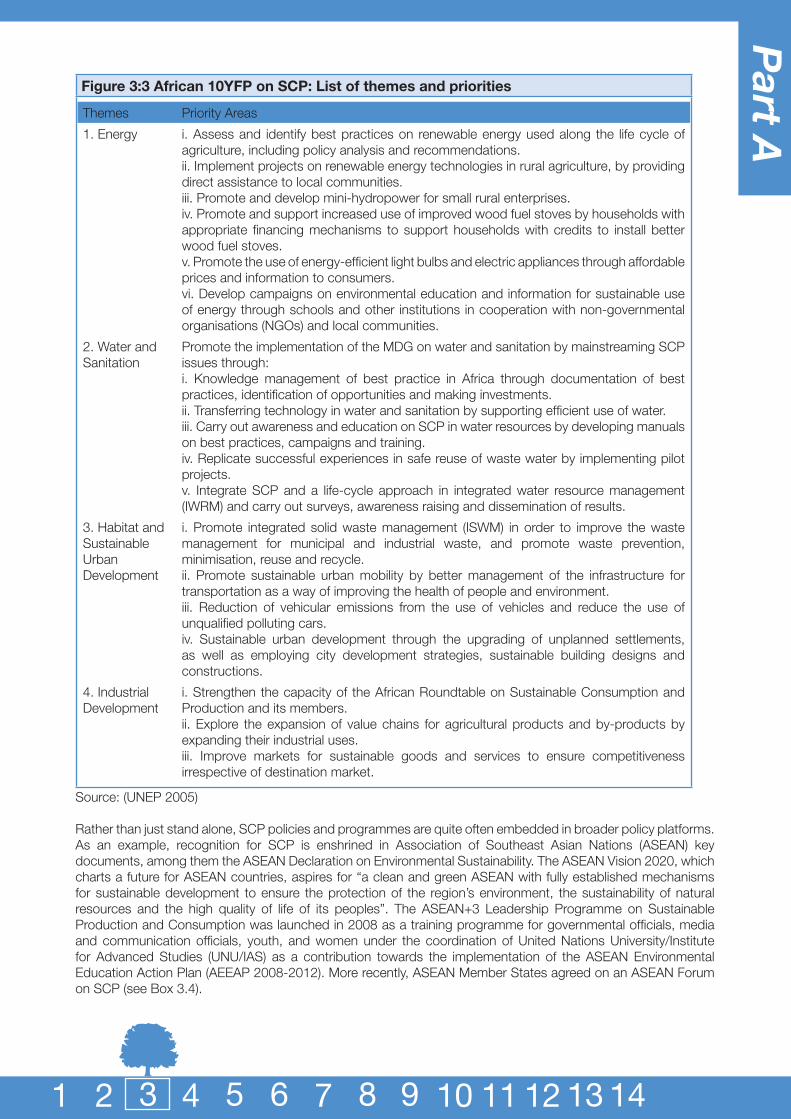
54page
Part A
1 2 3 4 5 6 7 8 9 10 11 12 13 14
Figure 3:3 African 10YFP on SCP: List of themes and priorities
Themes Priority Areas
1. Energy i. Assess and identify best practices on renewable energy used along the life cycle of agriculture, including policy analysis and recommendations.ii. Implement projects on renewable energy technologies in rural agriculture, by providing direct assistance to local communities.iii. Promote and develop mini-hydropower for small rural enterprises.iv. Promote and support increased use of improved wood fuel stoves by households with appropriate financing mechanisms to support households with credits to install better wood fuel stoves.v. Promote the use of energy-efficient light bulbs and electric appliances through affordable prices and information to consumers.vi. Develop campaigns on environmental education and information for sustainable use of energy through schools and other institutions in cooperation with non-governmental organisations (NGOs) and local communities.
2. Water and Sanitation
Promote the implementation of the MDG on water and sanitation by mainstreaming SCP issues through:i. Knowledge management of best practice in Africa through documentation of best practices, identification of opportunities and making investments.ii. Transferring technology in water and sanitation by supporting efficient use of water.iii. Carry out awareness and education on SCP in water resources by developing manuals on best practices, campaigns and training.iv. Replicate successful experiences in safe reuse of waste water by implementing pilot projects.v. Integrate SCP and a life-cycle approach in integrated water resource management (IWRM) and carry out surveys, awareness raising and dissemination of results.
3. Habitat and Sustainable Urban Development
i. Promote integrated solid waste management (ISWM) in order to improve the waste management for municipal and industrial waste, and promote waste prevention, minimisation, reuse and recycle.ii. Promote sustainable urban mobility by better management of the infrastructure for transportation as a way of improving the health of people and environment.iii. Reduction of vehicular emissions from the use of vehicles and reduce the use of unqualified polluting cars.iv. Sustainable urban development through the upgrading of unplanned settlements, as well as employing city development strategies, sustainable building designs and constructions.
4. Industrial Development
i. Strengthen the capacity of the African Roundtable on Sustainable Consumption and Production and its members.ii. Explore the expansion of value chains for agricultural products and by-products by expanding their industrial uses.iii. Improve markets for sustainable goods and services to ensure competitiveness irrespective of destination market.
Source: (UNEP 2005)
Rather than just stand alone, SCP policies and programmes are quite often embedded in broader policy platforms. As an example, recognition for SCP is enshrined in Association of Southeast Asian Nations (ASEAN) key documents, among them the ASEAN Declaration on Environmental Sustainability. The ASEAN Vision 2020, which charts a future for ASEAN countries, aspires for “a clean and green ASEAN with fully established mechanisms for sustainable development to ensure the protection of the region’s environment, the sustainability of natural resources and the high quality of life of its peoples”. The ASEAN+3 Leadership Programme on Sustainable Production and Consumption was launched in 2008 as a training programme for governmental officials, media and communication officials, youth, and women under the coordination of United Nations University/Institute for Advanced Studies (UNU/IAS) as a contribution towards the implementation of the ASEAN Environmental Education Action Plan (AEEAP 2008-2012). More recently, ASEAN Member States agreed on an ASEAN Forum on SCP (see Box 3.4).

55page
Part A
1 2 3 4 5 6 7 8 9 10 11 12 13 14
Part A
1 2 3 4 5 6 7 8 9 10 11 12 13 14
Box 3:4 ASEAN forum on SCP
Recognising the need for an ASEAN cooperation mechanism, Member States formed an ASEAN Forum on SCP in Indonesia in 2011. The Forum is a voluntary policy mechanism that will serve in the following ways:
• Provide a venue for policy dialogue and collaboration on SCP national and regional strategies, planning and implementation including technical support to AMS.
• Provide a venue for discussions on research and innovation for SCP patterns that can support tailored, effective policy design and actions.
• Develop a resource pool and explore opportunity for capacity building to support governments and other stakeholders at national and regional levels in a transition to SCP, and to support public awareness campaigns on SCP.
• Encourage discussion on emerging issues on SCP between AMS including the development of links with the relevant ASEAN Working Groups to promote cooperation on SCP between AMS and global/regional initiatives on SCP.
The establishment of the ASEAN Forum on SCP showcases the increased political interest of the South-East Asia countries on SCP issues.
Several sustainability policy platforms tend to be subregional in geographic focus. Examples include the Northeast Asian Sub-regional Programme of Environmental Cooperation, the North West Pacific Action Plan, the South Asia Cooperative Environment Programme and the Pacific Islands Forum. In Central America, the Sub-Regional Policy for Sustainable Public Procurement, steered by the Central American Commission for Environment and Development (CCAD), aims to redirect public procurement by governments in the region towards the purchase of products and services that integrate environmental and social criteria, as shown below.
© Lewis Akenji

56page
Part A
1 2 3 4 5 6 7 8 9 10 11 12 13 14
Box 3:5 The Central American Commission for Environment and Development initiative on sustainable public procurement
Recognising public procurement as a powerful tool, the Central American Commission for Environment and Development (CCAD) has launched an initiative to promote sustainable public procurement (SPP) at the regional level and by national governments. In response to the CCAD initiative, the organisation’s secretariat formulated a proposal for a Regional Policy on Public Procurement. This was developed with the purpose of ensuring cost efficiency in procurement by governmental institutions, while at the same time identifying opportunities for more efficient use of materials, resources and energy, contributing to the protection of human health and fostering the development of a regional market for sustainable and innovative goods and services. This proposal was further discussed with the members of the Regional Technical Committee on Cleaner Production, who supported the organisation of national consultations in the member countries of CCAD during 2010. Key national stakeholders involved in these consultations included representatives of the Ministries of Environment, Economy, Agriculture, Tourism, and Labour, national procurement authorities and civil society organisations. Recommendations from member countries were then incorporated to improve the final text of the Regional Policy.
The policy foresees national and regional interventions addressing four specific areas:I. institutional, to ensure that relevant information and methodologies are adapted to the specific context
of the countries; II. legal, ensuring that SPP is included in a coherent way in member country legislation and that their
approaches are harmonized; III. technical, providing support to the providers of goods and services in the shift towards more
sustainable production practices;IV. information and capacity building, to develop the essential technical skills for implementing SPP in
both the public and the private sector.
The regional procurement policy builds on a number of core sustainability practices, among them environmental responsibility, pollution prevention, extended producer liability, substitution of materials and substances using less polluting alternatives, and continuous improvement and innovation in product life cycles.
Having concentrated its efforts in 2010 on formulating this regional policy and getting it approved, CCAD is now focusing on its implementation in the Central American countries, in partnership with the UN and other institutions. This process will build on results already achieved in pilot projects within the sub-region. Particular reference will be paid to the Green Procurement guidelines developed by the Centro de Gestión Tecnológica e Informática Industrial (CEGESTI, Costa Rica), and to the Marrakech Task Force approach on Sustainable Public Procurement. Source: (UNEP 2012)
Some platforms of collaboration are created among countries of similar political and economic interests, where transboundary consumption and production issues play a facilitating role. Among Arab States, in its 2009 meeting the Council of Arab Ministers Responsible for Environment (CAMRE) endorsed the Arab Regional Strategy for SCP. The strategy identifies six priorities: energy; water resources management; waste management; rural development and eradication of poverty; education and sustainable lifestyles; and sustainable tourism. Three Roundtable meetings on SCP have been organised since it was developed in 2008.
In Asia, the Tripartite Environment Ministers Meeting (TEMM) has been bringing together Japan, the Republic of Korea and China since 1999 for cooperation concerning climate change, biodiversity conservation, pollution control and transboundary movement of e-waste, and most recently environmental labelling standards.
In the European Union, the SCP and Sustainable Industrial Policy (SCP/SIP) Action Plan (COM(2008) 397/3) build on the European Commission’s 2003 Integrated Product Policy, which focused on minimising the environmental impact of products by examining their life cycles and taking action wherever it can be most effective. The Integrated Product Policy uses both mandatory and voluntary tools, including economic instruments, substance bans, voluntary agreements, environmental labelling and product design guidelines while favouring market-driven approaches that take account of concerns over competitiveness. The 2008 SCP/SIP Action Plan is the major overarching SCP policy document at the EU level. It aims to foster SCP by improving the environmental performance of products throughout their life cycles and stimulating demand for more sustainable goods and

57page
Part A
1 2 3 4 5 6 7 8 9 10 11 12 13 14
Part A
1 2 3 4 5 6 7 8 9 10 11 12 13 14
production technologies. For example, the EU expects stronger and more far-reaching eco-labelling and energy labelling, under the EU Ecolabel regulation completed in 2009 (EC Regulation (EC) 66/2010) and the Energy Label Directive 2010/30/EU. The new EU Ecolabel regulation will include 40-50 product groups by 2015. It has a faster process for developing criteria and a simplified assessment procedure. Annual fees are reduced and there is more harmonisation with other national and global ecolabelling initiatives.
Other collaboration platforms are more focused on specific issues. A typical example is the Regional 3R Forum in Asia. It seeks to use the concept of reduce, reuse and recycle to bring together ministers of environment for high-level meetings and collaboration, on the problem of growing waste that has paralleled rapid urbanisation in the region.
One of the priority areas of the African 10YFP on SCP is energy. The Southern African Development Community (SADC) has a subregional framework on renewable energy. The framework recommends the use of fiscal incentives as drivers for renewable energy technology development and utilisation through developing a “level playing field” and adopting fair pricing mechanisms; the use of the polluter-pays principle in order to address externalities; gender mainstreaming and the creation of renewable energy enterprise zones’ and prioritisation of renewable energy technologies. The framework has set recommendations on how member states should align their policies in the sector; collectively develop and nurture skills to implement renewable energy projects; pool resources for development of appropriate renewable energy technologies; and facilitate trade in these technologies. The ultimate objective is to increase citizens’ access to affordable energy services and promote sustainable development.
The Arab Economic Summit held in Kuwait in January 2009 recognised the need for environmental preservation and cooperation on energy issues in the Kuwait Declaration. It emphasises the need for Arab cooperation in particular for using energy more efficiently as a means for realising SD. This should be achieved by strengthening the existing Arab power grid interconnections, establishing an Arab market for electricity, enhancing and widening natural gas networks, increasing the participation of the private sector in its investment and administration, broadening the usage of renewable energy technology and nuclear energy for peaceful purposes in production processes.
Financing for SCP also offers collaboration opportunities. Such is the case with the SWITCH-Asia Programme. It was set up by the European Commission in line with its Strategy Document for Regional Programming in Asia and provides funding opportunities of €152 million over the period 2007-2013. The aim is to promote SCP among small and medium enterprises and support Asian policymakers in shifting towards SCP practices. In addition to promoting specific SCP practices, the projects employ innovative replicating mechanisms such as voluntary agreements, public–private partnerships, and upgrading of technical standards or reinforcement of existing SCP service providers to make countries self-sustainable on the market.
Box 3:6 Three strategic components of SWITCH-Asia Programme:
Through project grants, projects are funded which can produce quantifiable reductions of CO2 emissions and consumption. So far, SWITCH-Asia has funded 47 projects in 15 Asian countries in areas such as greening supply chains, marketing for eco-products, green public procurement, cleaner production, eco-labelling and products for the poor.
The Network Facility provides support for projects funded under the SWITCH-Asia Programme in order to increase the quality and impact of project activities, along with facilitating the uptake of successful results by Asian policymakers.
The Policy Support component, launched in 2010, aims to strengthen the formulation and implementation of SCP policies in Asia. On a regional level this is done primarily through capacity building in collaboration with UNEP. Furthermore, national Policy Support components, managed by EU Delegations, focus on selected countries—Malaysia, Thailand, Indonesia and the Philippines—that have already gathered experience in applying SCP tools.
Although this part has focused on collaboration among governments, there are other types of effective, multistakeholder collaboration. An example is the International Standardisation Organisation (ISO), a network of national standards institutes, both public and private, from over 160 countries. ISO is the world’s largest developer and publisher of management systems and guidance standards - one of which is the SCP-relevant ISO 14000

58page
Part A
1 2 3 4 5 6 7 8 9 10 11 12 13 14
suite on environmental management. These standards enable both public and private organisations to identify and manage impacts of their operations from a life-cycle perspective.
IUCN (the International Union for Conservation of Nature) is an example of a network of collaboration among over 1,000 governments and NGOs, and 11,000 scientists in more than 160 countries. An example of how it supports SCP objectives is through its work on biodiversity and ecosystem services in which it supports national plans for more efficient use of natural resources in a range of industries and consumer groups, including mining and tourism.
An example of more regionally focused multistakeholder collaboration is in bringing together research, policy and practice communities. Examples include the North American Roundtable for SCP. As in most regions, there is an Asia-Pacific Roundtable for SCP (APRSCP). It was started in Bangkok in 1997 mainly to promote Cleaner Production. However, indicative of the general trend to shift from strictly technical approaches such as eco-efficiency to more socio-technical approaches that include consumer behaviour and psychology, the forum was renamed and given a new focus on the broader subject of SCP. The roundtable is held every 18-24 months, bringing together industrialists, environmental professionals, university academics and researchers, as well as policymakers.
Promoting SCP through regional collaboration
International collaboration has facilitated various stakeholders, at different levels of governance and across sectors to find meaningful ways of addressing the scope and challenge of shifting established patterns of consumption and production. At the regional and sub-regional levels, collaboration has allowed neighbouring countries, inter-related industries, similar production and consumer cultures, to develop working interpretations that reflect their cultural dynamics and behavioural patterns. It is therefore important that, in their development of national SCP programmes, countries should try to link this up to international platforms that can offer implementation support.
The 10YFP presents such an opportunity; for strengthened collaboration with a focus on implementation. Notably, the SCP Clearinghouse would rally experts needed to support implementation of initiatives, resources for training, provide options for seeking project partnerships and funding, and highlight a vast number of projects and experiences that stakeholders could learn from or adapt and replicate to suit their own context. Under the 10YFP it is also possible to set up programmes with a regional focus. Thus countries could champion programmes that immediately respond to regional priorities and further enhance regional collaboration, in the meantime having access to tools for policy implementation and political support from an international mandate.

59page
Part A
1 2 3 4 5 6 7 8 9 10 11 12 13 14
Part A
1 2 3 4 5 6 7 8 9 10 11 12 13 14
Further reading 3
Resolution A/CONF.216/5 – A 10-year framework of programmes on sustainable consumption and production patterns is the excerpt from the official resolution from The United Nations Conference on Sustainable Development (Rio+20), adopting the 10 Year Framework of Programmes on Sustainable Consumption and Production (SCP). Resolution A/CONF.216/5 – A 10-year framework of programmes on sustainable consumption and production patterns.
Asia-Pacific Roadmap for the Implementation of the 10YFP, The 10YFP Roadmap for Asia and the Pacific provides a clear blueprint for the region in shifting towards more resource efficient and sustainable production and consumption patterns for the coming years. More than 100 Government officials, civil society, academia and businesses along with experts from 25 countries in the region have contributed to the Roadmap.
UNEP 2014, Roadmap for the 10YFP implementation in Asia and the Pacific, United Nations Environment Programme, Bangkok
Global Outlook on Sustainable Consumption and Production Policies - Taking Action Together, identifies examples of effective policies and initiatives being implemented worldwide. It reviews 56 case studies ranging from global multilateral agreements and regional strategies to specific policies and initiatives and shows progress achieved in promoting SCP, highlighting best practices and offering recommendations to scale up and replicate these important efforts worldwide.
United Nations Environment Programme 2012, Global Outlook on Sustainable Consumption and Production Policies - Taking Action Together, UNEP, Paris.
The SCP Clearinghouse is a unique one-stop hub dedicated to advancing Sustainable Consumption and Production (SCP) worldwide. It offers the opportunity to share and find information on SCP around the world (initiatives, news, events, publications, etc.), build networks, identify partners, and strengthen capacities. It also serves as the information platform of the 10-Year Framework of Programmes on Sustainable Consumption and Production (10YFP).
http://www.scpclearinghouse.org/


61page
Part A
1 2 3 4 5 6 7 8 9 10 11 12 13 14
4 Policy Development
4.1 The policy cycle 4.2 Policy tools and instruments for SCP
SCP x
x
ExcellentGoodAveragePoor
SCP?

62page
Policy DevelopmentKey Points
• The policy cycle has four main stages, problem framing, policy framing, policy implementation and monitoring and evaluation.
• Successful policy requires coordination, integration and institutional change.
• Four groups of policy tools exist. • These tools can be combined into a policy mix to create more
effective policy packages towards SCP. • Participation, transparency and accountability and key to successful
policy. • Checklists and frameworks for policy analysis are included.
This chapter begins with an introduction to the policy cycle, specifically geared towards SCP policy. It provides a general overview of policy approaches and tools of particular relevance to SCP. It emphasises how policy tools in many cases become more effective when introduced as well designed policy-packages that provide support for more sustainable practices while at the same time discouraging less sustainable products, services and behaviours.
4.1 The policy cycle The four stages of the policy cycle
Good knowledge of the characteristics of the policy cycle will be very useful for policymakers and practitioners in designing and implementing successful SCP policies. This chapter provides an overview of the policy cycle (Dovers 2005) in an idealised way. In practice, the sequencing may look quite different, but all elements are of equal importance if SCP policy objectives are to be achieved. The 4 main stages of the policy cycle are distinguished below.
1. Problem framing2. Policy framing3. Policy implementation4. Monitoring and evaluation of policies
Figure 4:1 The policy cycle
Problem Framing
Policy Framing
Monitoring &Evaluation
Policy implementation
4

63page
Part A
1 2 3 4 5 6 7 8 9 10 11 12 13 14
Table 4:1 identifies a number of key steps for each stage of the policy cycle that should be considered to achieve good outcomes in policy making. Table 4:1 The four stages of the SCP policy cycle
Stage in the policy process Steps to be taken in each stage
Problem framing: The policy community and general public debate the issues related to SCP, gather information and agree on the nature of a policy problem.
• Discussion and identification of relevant social goals.
• Identification and monitoring of topicality (public concern).
• Identification of environmental degradation and social inequality.
• Understanding of underlying causes of environmental degradation and social inequality.
• Assessment of risk, uncertainty and ignorance.• Assessment of existing policy and institutional
settings.• Definition, framing and scaling of policy problems.
Policy framing: Guiding policy principles are identified, a policy position is developed and policy goals are defined.
• Development of guiding policy principles.• Construction of general policy statement.• Definition of measurable policy goals.
Policy implementation: Policy instruments are selected, resources allocated, communication and enforcement activities undertaken and monitoring mechanisms established.
• Selection of policy instruments and options.• Planning of implementation.• Planning of communication, education and
information strategies.• Progression of statutory, institutional and
resourcing requirements.• Establishment of enforcement and compliance
mechanisms.• Establishment of policy monitoring mechanisms.
Policy monitoring and evaluation: Ongoing monitoring and evaluation of a policy are undertaken to enable learning and enhance performance.
• Ongoing policy monitoring and routine data capture.
• Mandated evaluation and review process.• Extension, adaptation or cessation of policy and/
or goals.
The four main stages are described in greater detail in the following section, to provide guidance for policymakers and practitioners for planning SCP policies and ensuring successful implementation.
Policy and institutional challenges
SCP is still a relatively new policy domain and hence there is limited knowledge about the institutional requirements for enabling such policies. While policymakers have gained considerable experience about eco-efficiency and cleaner production policies, particularly policies in areas where end-of-the-pipe technologies were available, this is not the case for broader transformational policies and for policies that wish to deal with over-consumption or under-consumption. SCP policies need to emphasise time frames beyond the electoral cycle and require balancing of short-term versus long-term goals, sometimes even generational timeframes. Many SCP problems are of a global nature due to the increasingly global nature of production and consumption and product life cycles, however the main institutions are generally set up for dealing with national or sub-national issues. SCP policies force the integration of economic, environmental and social factors and therefore require the close collaboration of different agencies. The experience in cross-agency collaboration, especially horizontal collaboration, is often quite limited.
SCP policies profit from a large amount of information and from collaboration between science and policy. In the case of incomplete scientific knowledge they have to rely on precaution to avoid undesired consequences, which is not always easy to argue due to a lack of tradition in precautionary policy approaches. SCP policies require significant effort to encourage the participation of interested or affected members of the larger community, which

64page
needs to be enabled through well-designed engagement processes. Finally, SCP addresses policy problems that require innovative policy approaches and sets of policy instruments that work together to achieve the goal of SCP. All this requires tremendous effort in institutional development, capacity building and human resource development. This needs to be recognised from the outset and success will depend on proper resourcing and technical training.
Problem Framing
Policy Framing
Monitoring &Evaluation
Policy Implementation The problem framing phase
The first phase in the policy cycle seeks agreement on the nature of the SCP policy problem. SCP policies are characterised by the complexity of the issues involved and the plurality of values held by different groups in society. In the case of SCP, it is difficult to agree on what needs to be done and by whom. In other words, policymakers need to expect a high level of contestation. In many countries the development objectives and the need to increase material standards of living and alleviate poverty are so omnipresent, that the need for sustainability, enabled by sustainable consumption and production is not widely shared and often limited to urban and policy elites. The need for SCP, however, is not well linked to the everyday life experience of people and it should not wrongly be assumed that there would be broad societal agreement about the necessity of SCP. This is something which needs to be developed.
If SCP policy interventions are to be effective, in the sense of not attracting widespread criticism and non-compliance, then policymakers and government agencies need to have a good understanding of community opinion. It is essential to understand what society thinks about SCP problems and what kind of information the general public would need to appreciate the importance of SCP for the development of their nation. The understanding needs to be extended to:
• Why people perceive an issue as important?• On the basis of what knowledge and information do they make those judgments?• How they would frame that issue as a policy problem?• What policy responses they think would be appropriate?
A good understanding of this across the whole population and for major population segments will be very valuable before engaging in a national debate or starting to frame policy responses. A national debate about SCP would profit considerably from credible information provided by science and other sources of knowledge regarding the underlying causes of sustainability problems. It is also important to discuss the most promising solutions to mediate those problems. It is characteristic of SCP problems that policymakers will have to deal with ignorance, uncertainty and risk. It is important however, for policymakers to make decisions despite the undeniable fact that we cannot know everything beforehand. The precautionary principle gives a good lead into this. The precautionary principle argues that where there are threats of serious and irreversible environmental damage, a lack of scientific certainty should not be used as a reason for postponing measures to prevent potential environmental degradation.
Very importantly, SCP policymakers need to assess the policy environment based on an understanding that SCP policies cannot work in isolation. Individual or group behaviours that cause environmental degradation or present opportunities for improvement of the environment are shaped by multiple factors, including other policy settings. There may exist social and economic policies that determine patterns of consumption and production, that have unintended consequences for environment and sustainability. These will need to be adjusted to support SCP. The design of policy interventions has to identify other policy settings and the incentives and disincentives they create. This includes identifying existing policies that may be amenable for change via policy reform, in order to help progress SCP goals. All the steps outlined here help to shape the definition of a policy problem. Policy problems are for solving while issues are for debating. This step in the policy cycle, of problem definition, often involves breaking problems down into sub-sets that are more suitable for policy attention.
If the important steps in framing a problem and agreeing upon the nature of the problem are not attended to, the subsequent steps in the policy cycle, in particular policy implementation will become an increasingly difficult task to achieve.
65page
Part A
1 2 3 4 5 6 7 8 9 10 11 12 13 14
Problem Framing
Policy Framing
Monitoring &Evaluation
Policy Implementation The policy framing phase
Like all other policy decisions, a range of imperatives bear upon different policy actors influencing SCP policy decisions. For SCP policies, the considerations that determine the nature of the policy direction taken, need to be clearly stated and may take the form of policy principles. Well-articulated policy principles will have three benefits.
1. Ensure that actors within the policy network understand the drivers of the goal, by specifying the logic and meaning of the social goal that is guiding the economy and consumers towards higher resource efficiency and lower emissions.
2. Enable policymakers to widely communicate the meaning and importance of the SCP objectives to all members of the policy community. This will also help justify the policy decision and will profoundly enhance the transparency and accountability of the SCP policy proposals to the broader public.Enhance awareness of the relatively recent concepts of SCP, particularly across sectors which may have limited background knowledge or limited experience previously collaborating.
The policy and institutional challenges that need to be addressed by the guiding principles include: the long-term perspective of SCP policies, their global dimensions, the need for policy integration across different policy domains, a focus on scientific and other information, the application of the precautionary principle, the need for participation and the innovative character of policy approaches that will be underpinned by substantive material principles.
Policy principles provide guidance but they are not rules. Governments will require some flexibility to decide priorities in a given context and their priorities may favour or override some principles. Some of the principles may be conflicting and need to be balanced against each other and with policy objectives from other policy domains. In many policy-making situations, especially in developing countries, other social goals such as near-term economic growth may contradict SCP objectives, leading to trade-offs between development objectives and SCP objectives. Ideally, there should be integration between conflicting policy goals minimising the trade-offs as far as possible. Chapter 2.1 highlights how poverty reduction and SCP policies can work together.
The SCP policy statement
The most visible step in the policy process is the policy statement, which is usually publicly available. The policy statement makes policy decisions and directions, including the policy principles, a publicly accessible record. It is the nature of democratic politics that governments will issue policy positions or statements. The policy statement will:
• Identify the mandate and authority• Identify the problem• Explain the problem context• Detail implementation• Describe ongoing activities.
Measurable policy goals
An important element of the policy framing stage is the identification of measurable policy goals in relation to the identified SCP problems. Often at this stage these may be vague, but it is desirable that core parts of the goal set are measurable, so that later monitoring, evaluation and learning is possible.

66page
Problem Framing
Policy Framing
Monitoring &Evaluation
Policy Implementation
The policy implementation phase
The selection of policy instruments is the most critical step in the policy cycle and of greatest importance for achieving policy goals. This is also the step where causes of policy failure are often located. SCP policies are interventions into interdependent human-natural systems. This is a complex task and demands complex interventions, which may speak for a mix of policy tools. The fundamental task of SCP policies is to change individual or collective behaviours through policy instruments which are employed to guide or steer that change. Commonly policy instruments can be distinguished as regulatory instruments and standards, economic instruments, information-based instruments and voluntary agreements. These will be further explored in Chapter 4.2, Policy Tools and Instruments for SCP. Obviously, this can include a large variety of interventions available to SCP policy.
Table 4:2 Selection criteria for policy instruments
Criteria This includes
Effectiveness criteria: determining the likelihood of the SCP policy instrument achieving goals in the absence of constraints.
Information requirementsDependabilityCorrective versus antidotal focusSystemic potentialFlexibility in space and timeEfficiencyComplexity and cross-sectoral influence
Implementation criteria: determining the likelihood of the SCP policy instrument being successfully advocated and implemented.
Equity implicationsCostSocial and political feasibilityInstitutional feasibilityMonitoring requirementsEnforcement/avoidabilityCommunicability
Implementation plan
The plan of how to implement policies for SCP may be sufficiently incorporated in the policy statement and the associated discussion and documentation. However, the implementation plan needs careful attention as it is a dynamic process which may need continuous adjustment. Usually, the implementation plan will change and become more detailed once the role out of a policy has begun. Implementation planning, based on the instruments chosen, typically includes the following considerations:
• Is additional information required for key policy officials engaged in policy implementation? • Are there others who will be involved or affected by the policy that will need additional information?
How will this information will be generated and communicated? • Are all the statutory and administrative requirements and the resources in place that will be needed
during the implementation phase? • Are all issues of enforcement and compliance including resourcing and responsibilities in place? • Has a monitoring process been put in place, including defining routine data capture and responsibilities?
All these elements will be of particular importance in the SCP policy domain, due to the crosscutting nature of the SCP goals.
Communication and information plan
The specific information and communication needs will vary across SCP policy instruments and jurisdictions. However, key forms of information will typically include a detailed description of the main features of the instrument, variations across the context where the instrument will be applied and the organisational capacities and resource requirements for implementation.

67page
Part A
1 2 3 4 5 6 7 8 9 10 11 12 13 14
Table 4:3 Examples of information needs and main audiences for SCP policy instrumentsInstrument Information needs Main audiences
Regulatory standard for industrial pollution
• Technical details of the standard
• Compliance regime (licensing process, inspection regime)
• Sanctions (fines, license suspensions)
• Firms, operators, relevant agency staff
• All of the above and other enforcement agents
• All of the above and lawyers and courts
Carbon tax for large polluters with revenues invested to fund renewable, energy efficiency and to compensate lower-income households
• Intent and structure of the policy
• Tax rates, details of the payment schedule, compensation packages
• Industry, consumers, relevant departments
• Firms, tax officials, accounting professionals
Multiple tasks must be integrated in one communication strategy to engage with different audiences. Since many instruments will need to be implemented by actors distant from the policy process a two-way communication approach will be needed. This will encourage implementers to feed their experience back to the policymakers, to allow for adjustments. This will ensure that national policies are well understood and implemented at the provincial level and that the local experience is fed back to the relevant government departments.
Statutory, institutional and resource requirements
One major issue for policy implementation is often ensuring that the policy agency and other actors involved have the capacity to properly implement the policy instrument that has been selected. Key capacities include the legal competence, institutional and organisational capacity, financial resources and human resources. In the case of SCP polices, considerable capacity building may be required, which needs to be planned for in the early stages of the policy planning process.
Legal competence and defensibility
SCP policies, like any other public policies, must be legally defensible, i.e. not liable to challenge over their validity in the courts. To achieve this, the legal basis of SCP policies may need to be insured in statute law, common law and as is the case in many countries, also in customary law. Particularly with novel policy instruments and new organisational strategies, the adequacy of the statutory setting requires close attention.
Institutional and organisational capacity
SCP policy instruments are often new and unfamiliar or they may involve the application of traditional policy instruments in untried sectors of the society or economy. Special care needs to be taken to ensure that there is capacity to deliver. This concerns the government agency or organisation with primary responsibility for policy implementation and agencies and organisations or non-government groups who have delegated or subsidiary roles in policy implementation. In the case of very complex new policies, such as for instance, an ecological budget and tax reform, the tax department, the environment department and treasury would need to work together to implement the new policy instrument. Very often, those departments would not have a history of successful cooperation and collaborating would involve a steep learning curve for all involved.
Financial resources
The most commonly recognised cause of failure is inadequate funding. If the level of optimal funding cannot be achieved, it is important to idenfity the limits that the funding shortfall creates, relative to the problem, to avoid unrealistic expectations in the policy community. A realistic understanding of such financial limits may invite consideration of supplementary or additional policy initiatives. Sometimes, a poor analysis of costs may be the problem behind insufficient funding, highlighting the need for careful financial planning to reduce the chance of unforeseen deficiencies.

68page
Human resources
SCP is a relatively new domain of public policy. Therefore it is very likely that there will be a need for new or extended knowledge and skills on the part of agency staff responsible for planning, designing, and implementation of the policy. This may be relevant to the quantity of human resources, that is the number of staff available and the quality of human resources including knowledge, skills, and preparedness. There are three broad areas of skills and capacities that need to be addressed:
1. Background knowledge regarding the logic of the policy approach chosen, especially if the policy instrument is unfamiliar or substantially different from previous routine and experience.
2. Technical knowledge and skills concerning the policy instrument in question.3. Contextual knowledge of the sectors, regions, community subgroups or industries where the
instrument will be implemented.
Capacity building for human resources has traditionally been attended to within agencies. However, for SCP policies, capacity building needs to include the aspect of inter-agency and whole of government implementation as well as engagement with the wider policy community.
Enforcement and compliance
When the implementation of the policy instrument is designed, issues of compliance and enforcement measures need to be included. This will result in a better understanding of resourcing and communication requirements and of ongoing monitoring needs. There are three aspects of compliance:
1. Compliance in undertaking assigned responsibilities for implementation on the part of responsible authorities and others involved in the implementation such as government staff.
2. Compliance by those directly addressed by the instrument such as firms, individuals or households.3. Compliance with enabling or subsidiary aspects within and outside of government.
Problem Framing
Policy Framing
Monitoring &Evaluation
Policy implementation
Policy monitoring and evaluation phase
Provisions for policy monitoring should be integrated in the policy process as early as possible. They need to recognise the link between SCP monitoring through SCP indicators and monitoring of the effectiveness of the policy instruments chosen. Policy monitoring should be closely related to policy goals and should include routine data capture. It is important to set in place a timetable for review and evaluation of any SCP policy instrument. The policy monitoring and evaluation phase will be discussed in greater detail in Chapter 6.
4.2 Policy tools and instruments for SCP Policy tools and instruments
This section introduces some of the groups of policy tools that governments have at their disposal to influence consumption and production patterns. It covers regulatory tools, economic tools, information-based/educational tools and voluntary agreements. This is not an exhaustive list of policy tools; it is rather a categorisation of some of the more widely applied approaches. This chapter is based on Bengtsson et al. (2010).

69page
Part A
1 2 3 4 5 6 7 8 9 10 11 12 13 14
Figure 4.2: Policy tools and instruments
command and control
marketnegotiated
targetsetting
choice
Regulatory tools: command and control
Definition and Background
Regulatory tools have been used by governments for a long time and are the basis for environmental policy making all over the world. Regulations can mandate or prohibit specific behaviours or the use of a certain technology, define a level of sustainability performance to be achieved. They need to be used together with mechanisms for monitoring and sanctioning in order to ensure compliance. Regulatory tools are sometimes referred to as “command and control instruments”, reflecting the way they are implemented. Regulations that are of relevance for SCP can be divided into the following three general categories: environmental quality standards, technical/emission standards and restrictions and bans.
1. Environmental quality standards specify a minimum desired level of environmental quality, or the maximum level of pollution of a certain medium. An example is quality standards for urban air.
2. Technical/emissions standards specify either mandatory technical equipment to be used in certain applications, or maximum levels of emissions or resource consumption for specific products or systems. For example, many countries require automobiles to be equipped with catalytic converters (a technical standard) and, in addition, they regulate maximum emission values for certain pollutants for vehicles (an emission standard).
3. Restrictions and bans refer to the direct limitation of an undesirable behaviour or technology, or restrictions on the sale or use of certain products/substances with negative environmental and health impacts. An example is the prohibition of lead additives in gasoline or a ban on dumping end-of-life vehicles in nature.
In order to be effective, regulatory tools need to be complemented by some form of monitoring system. It is also necessary to specify who is responsible for taking action in case the regulations are violated. Some form of appropriate sanctions or penalties, such as fines or prison sentences, are also needed in order to deter violations. These enforcement measures can add considerable costs to the policy implementation.
Regulatory tools can be implemented as stand-alone tools, but many policy problems require a set of regulations to be put in place. For example, a ban on waste dumping would normally be associated with a requirement on some specific actor, typically local authorities, to collect waste and ensure proper treatment. Technical and performance standards may also be needed in order to make sure that the waste treatment has limited negative impacts on humans and environment.

70page
Box 4:1 Examples of regulatory tools for SCP
• Environmental control and enforcement (e.g. substance bans or phase outs, or mandatory environmental reporting for public and private organisations).
• Norms and standards such as regulatory requirements for energy performance of buildings. Source: (SWITCH-Asia 2012)
Strengths and limitations
There are several benefits of regulatory tools, which explain their dominant position in environmental policy making. For governments, the setting of targets/standards is inexpensive and the goals for policy achievement are clear. These tools have proven to be effective for addressing directly visible damages and point sources of pollution.
On the other hand, industry tends to be reluctant to submit to command and control regulation. Their argument is often that uniform regulation ignores the unique situation of each company, including differences in compliance costs and therefore leads to excessive overall costs. Such resistance has in many cases hindered the effective implementation of regulations. Another concern over these tools is that they are static, in the sense that they only require compliance with certain targets and therefore provide no incentives for further improvements beyond those targets. In addition, in cases where regulations are used for a few large entities, such as major industrial production plants, the compliance can easily be monitored, but in cases where the number of regulated entities is very large the enforcement costs can be excessive. This can be a challenge for regulations that target individual households or SMEs. However, the challenges of implementing regulatory tools effectively do not imply that they should be avoided or replaced with other tools. What it means is that to effectively regulate impacts of products with globalised life-cycles and to increase their resource efficiency, it is important to have more comprehensive, dynamic and flexible policy approaches. This can be achieved by introducing and using regulations in a more flexible manner and/or by combining them with other types of tools. Some examples of how this can be done are given in a later section - Diversifying the policy repertoire.
Box 4:2 Regulatory tools and the life cycle approach
Regulatory tools can be used at various points in products’ life-cycles. At the stage of resource extraction, a quota system to control the volume of resource extraction, and requirements to restore mining sites into green areas are two examples. At the production and consumption stages, technical standards can be used for example to promote energy efficiency, to mandate the procurement of products made of recycled materials, or to ban the use of certain materials or designs that are difficult to treat at end-of-life. Examples at the waste management and recycling stage can be prohibition of waste dumping and inappropriate waste treatment, rules mandating waste separation by households, or emission standards for waste disposal sites and recycling facilities. At all stages, from materials’ cradle to their grave, there is room for regulations to promote greener practices and to reduce unsustainable patterns of production and consumption.
Economic tools: creating market-based incentives
Definition and Background
Economic tools work by encouraging or discouraging certain behaviours and practices through economic incentives. Prices for products and services, set by the market, do not properly reflect environmental and social impacts. Therefore, these prices send the wrong signals to the market actors and encourage overconsumption of natural resources, low levels of efficiency, and unnecessary pollution. Governments are in a unique position to change these incentives so that the short-term self-interests of producers and consumers are better aligned with the long-term social objective of sustainable development.
I. One of the basic ideas behind economic tools is that by adjusting prices through policy interventions, so that environmental and social costs are to some extent reflected in the prices of materials and products, the decisions made by producers and consumers can be brought more in line with overall societal objectives. Such internalisation of societal costs, which is based on the widely accepted polluter-pays-principle, can be achieved through taxes or use charges, with supporting policy to ensure the poor’s access to resources for their basic needs.
II. Economic tools can also be used for facilitating the adoption of cleaner and more resource efficient technologies and practices through subsidies, soft loans and tax reductions.

71page
Part A
1 2 3 4 5 6 7 8 9 10 11 12 13 14
III. Tradable permit schemes allow market players to buy and sell permits to extract or use a specified amount of a resource or to emit a certain amount of a pollutant. These can be used in order to achieve a fixed environmental target, such as a maximum amount of air emissions, in a cost efficient way. Tradable permits are mainly applicable to larger companies.
IV. Deposit-refund schemes provide an economic incentive for the user of a product to return it to designated collection points at the end-of-life. Consumers pay an extra amount of money (a deposit) at the point of purchase but gets the money back (a refund) when he or she returns the product. Deposit-refund schemes are used by many governments for example to increase collection rates of empty beverage containers for reuse or recycling, and used car batteries for safe treatment.
The number of applications of economic tools to the policy field of SCP has grown steadily since the 1970’s. It is commonly argued that economic tools are currently underutilised and that a more wide-spread adoption would contribute to enhanced efficiency and effectiveness of environmental policy making. Economic tools and instruments are discussed further in Chapter 12, Fiscal Reform.
Box 4:3 Economic tools versus regulation - managing depleting aquifers
Economic tools differ from regulations in a number of significant ways. Here the example of water consumption is used to illustrate some of the key differences. A number of water-consuming industries are sourcing their water from the same groundwater aquifer and this resource is rapidly becoming overexploited.
One way of addressing the situation would be to regulate the amount of water that each industry has the right to withdraw (a regulatory tool). Another way would be to introduce a withdrawal charge (an economic tool). If regulation is used the government would have to assess the water need of each industry, including its potential for recycling and efficiency improvements. Once the system has been established the government would need to monitor withdrawal by all industries included and take action against violations. The government would also need to review and revise the allocation of withdrawal rights on a regular basis. In sum, the regulatory system would require a lot of administration and thereby incur significant costs for the government.
In contrast, if the government decided to use water withdrawal charges to address the water scarcity situation it wouldn’t need any information on the water need of each facility or the potential for efficiency improvements. However, they would need to establish how high the withdrawal charge should be in order to reduce the combined withdrawal to a sustainable level. If the charge is set too low it will be ineffective while if it is set too high it will place an unnecessarily high burden on the targeted industries. In order to set the charge at an appropriate level the government would need to have access to relevant data and have capacity to conduct economic modelling. Once the system has been established the withdrawal of each industry would need to be measured and the government would need to collect charges. Also a system based on economic tools would thus require significant administrative efforts of the government.
An effective and fair system that ensures sustainability without unreasonable economic consequences for the industries affected requires additional costs for governments. Good governance does not come for free – no matter what kind of policy tools are used.
Box 4:4 Examples of economic tools for SCP
• Environmental taxes• Fees and user charges• Certificate or permit trading schemes• Environmental financing• Subsidies
Source: (SWITCH-Asia 2012) Strengths and limitations
The two most commonly cited advantages of economic tools over regulation are their ability to provide incentives for innovation and improvement beyond a certain level of performance and their cost-effectiveness. Economic tools can have a more dynamic effect since they provide continuous incentives, which regulations and standards typically don’t. They can be more cost-effective than undifferentiated regulations that do not reflect that some industries may be able to improve at lower cost than others.

72page
However, as discussed in relation to the example above, economic instruments also require adequate institutions for design, implementation and enforcement. Charges and taxes need to be collected, and effective monitoring is needed to avoid free-riding. In general, the effects of economic tools on environmental quality and resource consumption are not as predictable as under a regulatory approach. Changing conditions and increasing incomes or profits may affect ability-to-pay and consumption levels. Regular assessments of the effects of these tools are therefore needed and frequent revisions may also be required.
Information-based tools: enabling informed choices
Definition and Background
Information-based policy tools have become more popular in recent years, partly because of the IT revolution which has decreased the costs of information dissemination. This is a very diverse group of tools, but two basic clusters can be distinguished.
I. The government provides information to some actor group or society at large. This can range from very general information on overall policy objectives, such as to increase energy efficiency in SMEs over the next five years, to highly specific and targeted information, such as technical training for SMEs in how to improve energy efficiency.
II. The government requires some actor to provide certain information (information disclosure), such as data on emissions of toxic substances from production facilities or on energy consumption of products during the use phase.
On a general level, information tools are intended to provide knowledge on the environmental performance of certain products, services or systems in a standardised manner so that stakeholders, such as consumers and investors, can make better informed choices – avoiding less sustainable options to the favour of more sustainable ones.
Box 4:5 Information based tools for SCP
• Ecolabelling• Sustainability reporting• Consumer advice centres and portals
Source: (SWITCH-Asia 2012) Strengths and limitations
One of the main advantages of information-based tools is the low implementation costs compared to the complex administration often needed in order for regulations and economic tools to work properly. However, the effectiveness of an information-based tool depends of course completely upon to what extent it actually influences behaviours and practices in a sustainable direction. Therefore, these tools are more likely to be effective in markets where consumers, investors, government officials and other key actors already have a high level of awareness on environmental issues and where there is a widespread demand for a clean environment. Without the existence of adequate background knowledge and basic sustainability values among the key actors, information on environmental performance is not likely to generate significant changes in behaviour. Another factor often seriously limiting the effectiveness of information as a policy tool is that economic factors usually pull consumers and other actors in an opposite direction. In situations where more sustainable products and services are much more expensive than comparable options with higher environmental impact, information disclosure, such as eco-labels, cannot be relied upon to bring about changes towards sustainability. In general, information-based tools cannot be expected to function as substitutes for other policy tools, but should rather be regarded as supplements, which can enable stakeholders to improve resource efficiency and pollution abatement. However, there are cases where information-based tools by themselves have been effective; in particular, requirements for industry to disclose information on environmental performance to the public have often led to significant improvements. Another area where information-based tools have been used with some success is for product labelling on energy efficiency. In this case, consumers usually have an economic incentive to buy more efficient products so there is no trade-off between sustainability concerns and economic considerations.
73page
Part A
1 2 3 4 5 6 7 8 9 10 11 12 13 14
Voluntary agreements: negotiated target-setting
Definition and Background
Voluntary agreements aim to promote environmental improvements through voluntary action. This usually implies that firms make commitments that go beyond legal requirements. Two well-known examples are the Responsible Care Program for chemical management developed by major chemical companies through their global industry association and the Zero Landfill programme of major manufacturers in Japan.
OECD (2003) distinguishes four types of voluntary agreements:
I. Unilateral commitments made by polluters or resource users.II. Private agreements between polluters or resource users and those who are negatively affected. III. Negotiated agreements between industry and a public authority. This negotiated kind of agreement has
a stronger legislative character than purely voluntary approaches. It is an agreement which can include legally binding obligations to follow an action plan established through negotiation. The agreement can even involve sanctions for non-compliance. However, the negotiation element makes these policies different from typical regulatory approaches.
IV. Voluntary programmes, in which “participating firms agree to standards (related to their performance, their technology or their management) which have been developed by public bodies.”
Also, management standards such as the ISO 14000 series can be understood as voluntary agreements of the first type. While such standards are not strictly policy tools, they can be used, for example by requiring that all major suppliers to governmental agencies be certified.
Governments can use voluntary agreements with the private sector to support corporate social responsibility (CSR) including supporting transparency in sustainability reporting. Sustainability reporting is particularly important, as it is increasingly recognised that financial reporting alone is not sufficient, and that reporting on sustainability can encourage more sustainable behaviour. Many larger organisations are already engaging is such reporting, often using methods based off the Global Reporting Initiative (GRI). However much work remains to be done to engage more organisations, including SMEs. Voluntary agreements can offer opportunities for supporting such reporting.
Box 4:6 Voluntary approaches for SCP
• Sectoral voluntary agreements• Public Private Partnerships• Awards for sustainable products or services.• Source: (SWITCH-Asia 2012)
Strengths and limitations
Voluntary agreements are obviously more flexible than command and control regulation and compliance can be less burdensome than for market based instruments. They are therefore commonly favoured by the business sector. However, the literature on SCP policy tools does not provide much evidence of voluntary agreements being particularly effective. In addition, there are concerns that such agreements can give undue benefits to large market-leading companies by promoting their business models and technologies. Voluntary agreements are likely to be more effective in situations where there is a high possibility of command and control regulation or economic tools being used. It is typically easier to convince industry to make strong “voluntary” commitments if there is a widespread perception in that industry that mandatory policy tools are otherwise likely to be introduced.
OECD argues that it is generally more effective to use regulatory tools with some flexibility, and based on discussions with the regulated industry or actor group, or to use market-based tools, than to encourage voluntary commitments. Negotiated agreements with binding targets and a phase-in period can be a compromise and a way to increase acceptance for regulation. As discussed further below, voluntary measures can play an important role for motivating additional efforts of companies that already have a high environmental performance, while legally binding measures may be the most effective for ensuring improvements of the majority of companies in a specific sector.

74page
Diversifying the policy tools repertoire
The majority of sustainability policies are based on regulatory tools. Significant improvements have been achieved through such policies, especially for local environmental impacts. However, regulatory approaches have also been successfully employed at the international level, for example in the phasing out of ozone-depleting substances and for reducing the use of hazardous substances in electronics. These tools are likely to remain the corner stone of environmental and resource policies.
However, regulations have a number of limitations and there are good reasons for governments to also consider other tools. This section discusses how regulatory tools can be combined with other tools for enhanced effectiveness and how they can be implemented in ways that reduce compliance costs and resistance amongst industry and consumers. Combining tools for enhanced effectiveness
Policy tools can be especially powerful when employed in combination. Such policy mixes can for example combine an economic incentive, such as an environmental tax or a use charge, with an information-based policy tool, which makes it easier for households or companies to change their behaviour. An example related to households’ energy consumption could be a combination of an electricity tax (economic tool providing incentive) with mandatory energy consumption labelling of electrical appliances (an information-based tool helping consumers to select better products and cut their energy bills).
SCP policy tools are used for shifting companies’ or households’ behaviour and consumption and production patterns into a more sustainable direction. This typically calls for a combined policy approach including both tools to phase out undesirable products and behaviours, and tools to expand the market for more sustainable products or to provide incentives for more sustainable behaviour. Figure 4:3 illustrates this need for multiple policies to edit out bad options (laggards), to increase the market share of better ones (frontrunners), and to stimulate innovation towards further improved products, systems and practices.
Figure 4:3 Three types of policy interventions aimed at improving the resource efficiency of products and systems
Market share
-
+
Resource efficiency +-
Laggards Frontrunners
1. Policies to phase out inefficient products and systems
2. Policies to promote efficient products and systems
3. Policies to stimulate innovation for improved performance
Products or systems currently on the market or in use
Adapted from ASCEE 2008
Source: (Adapted from ASCEE 2008)
Mar
ket s
hare

75page
Part A
1 2 3 4 5 6 7 8 9 10 11 12 13 14
Box 4.7 Japan’s Top Runner Programme
Japan’s ‘Top Runner’ programme was introduced in 1998 as part of the country’s Energy Conservation Law to improve the energy efficiency of products. The program is a regulatory approach administered by the Japanese Ministry of Economy, Trade and Industry (METI) and does not provide any economic incentives. The program focuses on the supply side of product markets. Stringent energy efficiency standards have been established for 21 product categories including passenger vehicles, air conditioners, refrigerators and television sets. Instead of setting a minimum energy efficiency standard, the current best energy efficiency of a product in an exact category is taken as the standard (the ‘Top Runner’). This standard represents the target for energy efficiency that has to be reached by all products of a product category within a certain time frame.
Since the introduction of the Top Runner programme, for each product category significant energy efficiency improvements have been achieved. For example, the energy efficiency of air conditioners improved by 68% between 1997 and 2004, electric refrigerators by 55% (1998-2004), passenger vehicles by23% (1995-2005) and computers by 99% (1997-2005). Overall, the Top Runner program is expected to achieve 0.35 exa Joules (eJ) of energy savings between 1998 and 2010.
Source: (ECCJ 2008)
These three types of policy intervention will generally require different policy tools. It is not realistic to expect that one single policy tool can effectively edit out an undesirable product from the market and at the same time stimulate innovation towards more sustainable options. In addition, certain policy tools may be effective in stimulating technical improvement of existing products, while other tools may be needed to encourage more radical innovations at the systems level. For example, technical standards can be important tools for improving the performance of an established kind of product or production process, but they typically don’t provide any incentives for systems innovation. In order to create drivers for such more fundamental innovations, including changes in consumer behaviour, other policy approaches and tools are required. For example, in addition to improving the fuel efficiency of automobiles there is a need to support a range of other developments, such as to stimulate new energy sources for private vehicles, to facilitate the dissemination of social innovations such as car sharing or to develop public transportation systems into viable alternatives to cars.
Ensuring policy integration and coherence
When a government reviews and strengthens its SCP policy portfolio it needs to consider how policies in non-environmental domains shape patterns of production and consumption. While there is a need for dedicated SCP policies, it is also important to assess the implications of policies in other areas for SCP objectives. There is often a tension between sector policies, for example industrial development, agriculture or construction, that generally aim to boost consumption and SCP policies that seek to moderate consumption levels and shift consumption patterns. In order to make significant progress towards SCP, governments need to understand how its sector policies and fiscal system influence patterns of production and consumption, and to make revisions where there are conflicts with sustainability objectives.
To effectively move society towards SCP, governments need to send coherent messages. Clear visions need to be established and communicated; consistent and well-coordinated policies, including sector policies as well as dedicated SCP policies, should create incentives and legal obligations towards that vision. This requires leadership from the highest political level and coordinated action by the governmental departments concerned.
Flexible implementation but firm long-term targets
Some of the actors affected by a new policy may be able to quickly adjust, while others may need a longer time. For example, a manufacturer that is just about to renew machinery is more flexible than one where a large investment has just been made. In order to be effective, and to reduce resistance to new policies, it is therefore desirable to leave room for some flexibility. This can be achieved in different ways.
The flexibility associated with economic tools is often mentioned as an argument for a more widespread use of these tools. Companies that can quickly and easily adjust their production processes and products need to pay less. Those who have difficulties in adjusting, or where the costs of making adjustments are high, will have to pay more. Each individual company is free to calculate what changes would be most beneficial for them and to make

76page
their decision accordingly. A uniform regulation, requiring the same performance level of all companies in an industry, could entail higher overall compliance costs and would cause stronger resistance.
However, it is possible to develop and implement also regulatory tools with a certain degree of flexibility. Involving the groups targeted by a proposed policy (such as companies, consumer groups, or farmers) in the drafting process can help build awareness, understanding and support. Consultation processes can also inform the policy design process on the circumstances of targeted groups and on obstacles to compliance. By being provided the opportunity to influence the policy design and the implementation schedule, companies and others can be expected to feel a higher ownership of the process and thus be more likely to respond positively. Finally, consultation processes provide “early warning” to the affected groups and make it possible for them to start preparing for expected future policies. Consultation processes require extra time, but the outcome can be better designed policies and more favourable conditions for successful implementation.
It can also be wise to announce planned policies well in advance so that the affected stakeholders have time to adjust. Similarly, a step-wise introduction can facilitate compliance and reduce related costs. Experiences from developed countries, for example in relation to automobile emission standards, show that clear long-term timelines with fixed tightening of performance standards can be an important driver of technological change. If future standards are set and announced several years in advance, industry has more time to innovate and invest. However, in order to be effective, long-term timelines and targets need to be robust to political changes. If there is some uncertainty whether an announced future policy will in fact be implemented or not, this can seriously reduce efforts (such as investments in product development and production facilities) needed for compliance.
© Lewis Akenji

77page
Part A
1 2 3 4 5 6 7 8 9 10 11 12 13 14
Further reading 4
Sustainable Consumption and Production Policies: a policy toolbox for practical use provides practical explanations of SCP policies and policy instruments. It further recommends instruments that could be applied to increase the positive environmental and social impacts of specific projects. Special attention is paid to small and medium size enterprises (SMEs), which often form the majority of business operations in developing countries.
SWITCH Asia Network Facility, n.d., Sustainable Consumption and Production Policies: a policy toolbox for practical use, United Nations Environment Programme, Paris.
Policy Instruments for Resource Efficiency: Towards Sustainable Consumption and Production, is a good starting point to understanding different types of policy tools, their advantages, disadvantages and where they can be applied towards SCP objectives. GTZ 2006, Policy Instruments for Resource Efficiency: Towards Sustainable Consumption and Production, GTZ, Germany.
Instrument Mixes for Environmental Policy is a comprehensive publication that provides descriptions and analysis of how various policy instruments can be combined to achieve higher impact. Chapters are organised to demonstrate combinations of policy instruments for different sectors and different points in the production-consumption system.
OECD 2007, Instrument Mixes for Environmental Policy, Organisation for Economic Co-operation and Development, Paris.
Integrated Assessment: Mainstreaming Sustainability into Policy Making is a guidance manual that provides support in using Integrated Assessment as a tool for mainstreaming sustainability into policymaking processes (policies,plans and programmes). In doing so, it uses international experiences in the area of Strategic Environmental Assessment (SEA) and IntegratedAssessment (IA).
UNEP 2009, Integrated Assessment: Mainstreaming Sustainability into Policy Making, A Guidance Manual, UNEP.


79page
Part A
1 2 3 4 5 6 7 8 9 10 11 12 13 14
5 Policy Implementation
5.1 Obtaining political support and mainstreaming the SCP agenda 5.2 Structures and processes for policy implementation
SCP x
x
ExcellentGoodAveragePoor
SCP?

80page
Policy ImplementationKey Points
• High level political support is necessary for successful SCP policy implementation.
• SCP policies are highly cross-cutting: their formulation, implementation and monitoring require a high degree of inter-agency collaboration within government.
• Integrating SCP policies into plans is preferable to formulating them as stand-alone policy areas.
• Adequate communication and education to all stakeholders increases the likelihood of successful implementation.
• The government can play multiple roles in pursuing SCP but has its limitations. SCP agendas need multi stakeholder engagement and partnerships.
• It is important to engage with the business community, civil society groups and other non-governmental organisations such as consumer groups and the media.
This chapter provides more detail on the policy implementation stage of the policy cycle. Complementing the theoretical approach outlined in the previous chapter, this chapter focuses on the practical and strategic side of implementation, considering the multiple dimensions of successful implementation.
5.1 Political support and mainstreaming SCPIntroduction
Efforts to promote SCP have a much higher chance of being successful if top-level political leaders understand the importance of changing patterns of production and consumption into a more sustainable direction. SCP is by its nature highly cross-cutting. Effective policies therefore often have to be developed in collaboration between line ministries. It is important to have effective mechanisms in place to support such collaboration. Establishing a coordinating body with sufficient authority and resources can be an essential step towards more coherent and effective policies. Such a body could be the central planning commission or planning ministry of a country.
At a formal level of policy formulation, countries need to review what policies, plans and strategies they already have in place and to explore how SCP can be integrated into these existing mechanisms rather than launching SCP as a new free-standing initiative. Some areas that may offer particular potential for integrating the SCP perspective include: climate change mitigation, energy security, food security, health, water and consumer safety/consumer rights. Many countries also develop overarching plans with a five year interval. It is of key importance to integrate SCP into such strategic economic planning, not only in chapters dealing with environmental protection as such but also in chapters related to major economic development.
Harnessing high level support for a complex reform agenda
The formulation and effective implementation of SCP policies and strategies affect the deeper structure of economies and societies. This involves therefore a very complex agenda of reorienting economic systems, consumer preferences and producer behaviours. The agenda embraces key economic sectors such as energy, agriculture and transport. It can offer opportunities for decoupling economic growth and social development from environmental degradation, thus strengthening the sustainability and resilience of a society. It can further help to seize new development opportunities that can contribute to growth and poverty alleviation. A coherent SCP policy agenda can support a triple dividend of greater wellbeing, increased competitiveness, and environmental integrity (CSIRO and IGES 2012).
In the real world, this agenda is likely to encounter resistance: this can be expressed openly or covertly by interest groups within the government apparatus, in the business community and beyond. In particular, lobbies, trade associations and other more or less transparent policy influence mechanisms can be very effective in working towards maintaining the existing systems though which wealth is generated and shared. Resistance and impasse may also arise from the sheer momentum required to bring change for example in complex production chains, which may have been structured according to unsustainable paradigms for a long time
5
x
x

81page
Part A
1 2 3 4 5 6 7 8 9 10 11 12 13 14
(e.g., involving costly industrial processing plants, large-scale agricultural input supply chains).
Production methods may also be driven by regional or global factors outside the influence of national policy making. Often manufacturing methods and parameters are set by multinational companies operating to home standards but manufacturing in still developing countries.
The demand side of the agenda is no less complex. Developing societies are changing rapidly. Average per capita consumption is rising fast, albeit across a wide range and increasing urbanisation reshapes consumption for food, transport and housing. Booming middle classes are driving urban consumption, increasingly shaped by globalising forces, and this to a large extent is compounded by the relative youth of the population in emerging economies. Aspirations of those emerging from below the poverty line cannot be ignored; unless it is checked, the natural inclination is to aspire to the lifestyles of higher income groups, regardless of country. Obtaining reform momentum and effectiveness therefore requires actions at multiple levels and across multiple sectors. A reform agenda of this nature is unlikely to proceed in a linear manner. It will rather be implemented as an iterative process, where regulatory interventions, fiscal and other incentives, voluntary agreements and interventions to support behavioural change in the public reinforce each other over time.
Pathways of change towards SCP goals may take multiple routes, from mainstream policy change, large scale investments or incentive schemes, to innovation in niches of production and/or consumption which may be scaled up after establishing initial success. Leadership support is therefore required at several levels and in a flexible way. A lead agency or an effective coordinating mechanism among line agencies and stakeholders become crucial. Above all, the reform process needs to maintain high visibility on the ultimate goals of the SCP strategies within the government administration and political leadership, the public, consumer’s bodies, and producers (these points will be elaborated in the following sections).
Box 5:1 Relevance of leadership and high level support in SCP implementation
A recent study in Asia shows the relevance of leadership and political support not just in the formulation of SCP policies but moreover to support their effective implementation. Lessons from around the region point out that:
• It is advantageous if there is a single responsible authority for coordinating SCP activities in a country to avoid confusion, duplication of efforts, conflicting activities, and inertia.
• The two main functions of the coordinating authority are to show leadership and capacity for decision making, in order to reduce complexity, and to help build linkages among all actors that need to be involved.
• Leadership and high level support are required to build the necessary human capital and knowledge about SCP issues and policies within central agencies as much as within state, local authorities and city governments. Capacity at these levels is crucial for successful implementation.
• High level support is also required to drive complex public policy reform and maintain incentives to favour SCP among business actors and consumers. Policymakers usually find it more difficult to shape consumption than regulating production; this is especially so in developing countries, where over and under consumption exist. Coherent choices in infrastructure development and urban planning can complement public awareness initiatives. SCP in public procurement can both shape a significant proportion of consumption and set a public example.
• For society at large it is crucial to have champions of SCP among community leaders and decision makers who promote innovative technologies for SCP and sustainable lifestyles.
Source: (CSIRO & IGES 2012) modified. A number of actions and strategies may facilitate obtaining and maintaining high level political support:
• Align or better integrate SCP goals within mainstream economic or sector development strategies to foster convergence and deleverage conflicting agendas (this will be reviewed in the following section).
• Identify explicit, easily communicable SCP long term goals to provide a sense of direction and focus on long term gains.
• Conduct an explicit stock-taking of multiple and potentially conflicting interests (e.g., via a robust initial stakeholder analysis) within economic sectors and identify coherent development opportunities and win-win reform options.
• Produce and disseminate easily communicable costs and benefit analyses of SCP initiatives and of risks associated with unsustainable production and consumption patterns.

82page
• Identify a high level institutional home of the SCP strategy. This may take the form of a government agency (not necessarily within environment line agencies, but perhaps within economic or industrial development agencies) and/or a coordinating platform (e.g., a high level interagency task-force) – this is further explored in section 5.2.
• Establish effective communication strategies able to produce public responses to policy change and even to pioneering achievements in niche sectors: the latter can help building momentum to scale up initial success.
• Support an effective process of dialogue and policy review about SCP initiatives and achievements, fed by adequate evidence of impacts and challenges, and leading to gradual adaptation of strategies and interventions.
• Maintain a clear focus on economic incentives and benefits, as well as on private investment and public funding opportunities.
Figure 5:1 Tips to strengthen policymakers involvement throughout the policy cycle
Problem Framing
Policy Framing
Monitoring &Evaluation
Policy Implementation
•assess policy choices and identify adequate policy options and incentives• balance content not to overload the policy dialogue - select priorities
• provide solid and credible analyses of the issue to be addressed• include lessons learnt from other countries or regions• manage information carefully
•support capacity building of policymakers• build trust and close relationships with the relevant policymakers• involve local actors
•involve the right players•gather relevant information and define the problem
Source: (Adapted from Müller et al. 2011)
Promoting SCP towards the strategic centre of policy making
Given the complexity and multi-sector nature of the SCP agenda, it is important to ensure that SCP policies are integrated and reflected in sector strategies and policies and moreover in cross-cutting development strategies. This can help minimise the risk of making the SCP agenda a marginal one, easily overcome by stronger development forces. Beyond the general principles of sustainability, SCP goals can be pursued only according to objectives and strategies that make sense in each society and economy. They need to take into account the development stage of a given economy, its trajectory, history and drivers and the underlying social realities and aspirations. This does not mean that only developed societies can afford SCP. It may actually mean exactly the opposite, as we shall briefly explore. In developed economies, SCP strategies usually pursue innovation and change in sectors where they have to overcome resistance offered by well-established investments (physical ones, like infrastructure, or immaterial ones, like knowledge and expectations). On the other hand, in developing countries and particularly in emerging economies, opportunities may exist to leapfrog development, i.e., to pursue innovative and sustainable solutions without the need for costly restructuring. However, such innovation inspired by SCP models needs to win over the tendency of replicating investment strategies from developed countries. Similar opportunities can also

83page
Part A
1 2 3 4 5 6 7 8 9 10 11 12 13 14
exist in the most vulnerable societies. In such societies, business models imported from developed countries are often not feasible: there can be more room to experiment and later scale-up innovative models (once these may prove to be capable of addressing unmet basic needs of the population) (Tukker, 2005). For the above reasons, in developing economies there is a further critical justification to move the SCP agenda towards the central strategic areas of policy making: it can open up opportunities to provide direction towards more sustainable and resilient development trajectories.
Therefore, to seize these SCP opportunities and counteract the tendency of replicating strategies which have already proven unsustainable in developed countries, it becomes imperative to provide long term vision and coherence to the development agenda. This means embedding SCP policies in the mainstream sector and developing cross-sector strategies and policies.
Figure 5:2 Key drivers and sources of resistance for SCP in different societies
Developed (consumers) societies
Well established systems of infrastructure, education, social values, etc. resist innovation
Innovation within the system promotes SCP
SCP = Maintain and grow wealth, reducing resource use
Emerging societies
National and foreign investments replicate unsustainable pathways
Long term visions, strategies and governance systems for SCP provide sense of forward direction
SCP = Opportunities to leapfrog development and
avoid dinosaur investments
Most vulnerable societies
National and foreign investments replicate unsustainable pathways (lower risk)
More freedom for experimenting with new opportunities
SCP = Meet primary needs and enable subsequent growth
SCP policies can be integrated in major national level frameworks and strategy documents, such as the National Sustainable Development Strategy or National Environmental Action Plan. Furthermore, they can be reflected in Poverty Reduction Strategy Papers or Millennium Development Goals Strategies. Their respective policy cycles can offer opportunities to review strategies and approaches through an SCP lens and to reflect relevant SCP goals and targets. This approach, rather than the approach of developing a stand-alone SCP framework, can provide prospects to strengthen the sustainability and resilience of mainstream economic and sectorial development strategies.
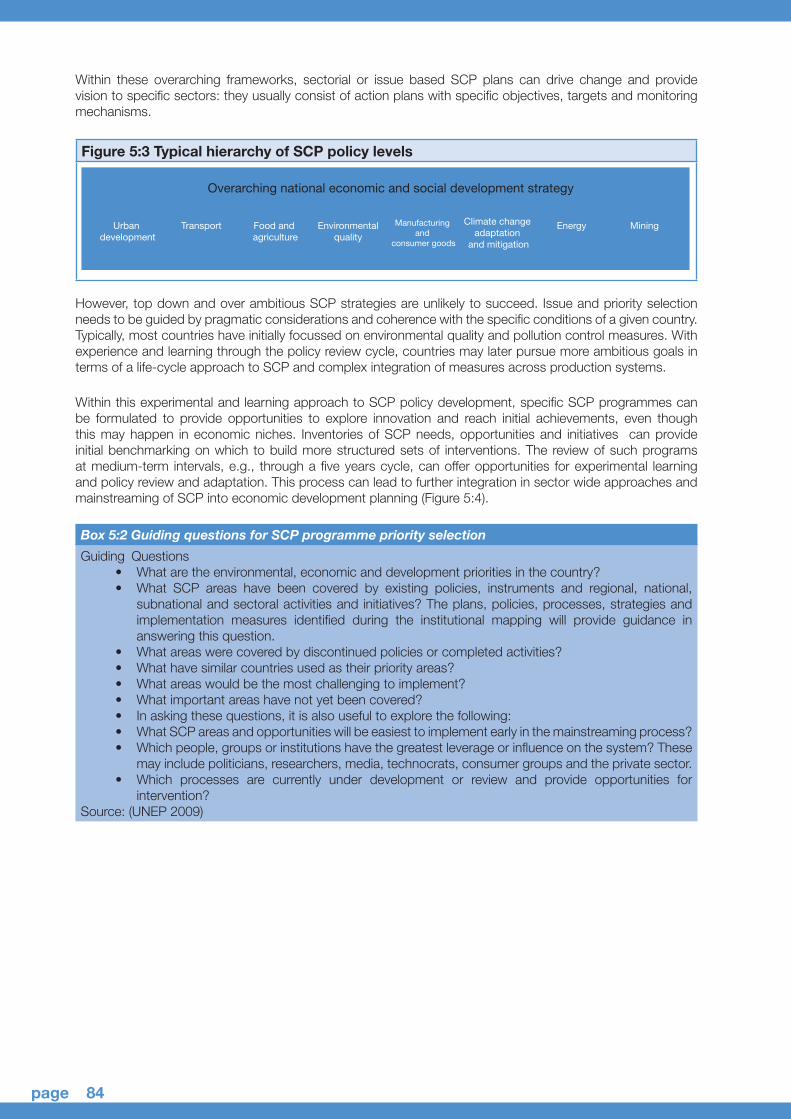
84page
Within these overarching frameworks, sectorial or issue based SCP plans can drive change and provide vision to specific sectors: they usually consist of action plans with specific objectives, targets and monitoring mechanisms.
Figure 5:3 Typical hierarchy of SCP policy levels
Overarching national economic and social development strategy
Urban development
Transport Food and agriculture
Environmental quality
Manufacturing and
consumer goods
Climate change adaptation
and mitigation
Energy Mining
However, top down and over ambitious SCP strategies are unlikely to succeed. Issue and priority selection needs to be guided by pragmatic considerations and coherence with the specific conditions of a given country. Typically, most countries have initially focussed on environmental quality and pollution control measures. With experience and learning through the policy review cycle, countries may later pursue more ambitious goals in terms of a life-cycle approach to SCP and complex integration of measures across production systems.
Within this experimental and learning approach to SCP policy development, specific SCP programmes can be formulated to provide opportunities to explore innovation and reach initial achievements, even though this may happen in economic niches. Inventories of SCP needs, opportunities and initiatives can provide initial benchmarking on which to build more structured sets of interventions. The review of such programs at medium-term intervals, e.g., through a five years cycle, can offer opportunities for experimental learning and policy review and adaptation. This process can lead to further integration in sector wide approaches and mainstreaming of SCP into economic development planning (Figure 5:4).
Box 5:2 Guiding questions for SCP programme priority selection
Guiding Questions • What are the environmental, economic and development priorities in the country?• What SCP areas have been covered by existing policies, instruments and regional, national,
subnational and sectoral activities and initiatives? The plans, policies, processes, strategies and implementation measures identified during the institutional mapping will provide guidance in answering this question.
• What areas were covered by discontinued policies or completed activities?• What have similar countries used as their priority areas?• What areas would be the most challenging to implement?• What important areas have not yet been covered? • In asking these questions, it is also useful to explore the following: • What SCP areas and opportunities will be easiest to implement early in the mainstreaming process?• Which people, groups or institutions have the greatest leverage or influence on the system? These
may include politicians, researchers, media, technocrats, consumer groups and the private sector. • Which processes are currently under development or review and provide opportunities for
intervention?Source: (UNEP 2009)

85page
Part A
1 2 3 4 5 6 7 8 9 10 11 12 13 14
Figure 5:4 National SCP programme cycle
Inventory
Framework of Programme
Sectoral /Issue-based
Plans
Action Plan /Strategy
National SCPProgramme Cycle
Integratedin NSDS,
NEAP, PRSP
Source : (Bentley 2008)
In the end, there is no single pathway towards mainstreaming SCP into economic development. As a possible conceptual model (Figure 5:5), we can consider that the reform agenda needs three broad pillars to unfold:
1. A process of action-learning (which can be facilitated by SCP programmes) which can help establish momentum, identify and pursue opportunities, test new systems and develop strategies;
2. A process to support policy formulation, implementation and gradual mainstreaming;3. A process of mobilising resources and building capacities to support implementation which fits the
national context and needs, and further enables monitoring and policy review and adaptation.
Figure 5:5 The program, mainstreaming and implementation continuum
Establishing SCP momentum via programs
Identify SCP priorities and opportunities
Find entry points in the policy process
Assess capacities and needs
Find champions of change
Build public awarness
Gather evidence of impacts
Mainstreaming SCP
Identify policy options and measures
Gather country specific evidence on SCP costs and benefits
Identify priorities, sequencing and promote vision
Build capacities within institutions
Identify avenues to influence mainstream (sector or economic)
development strategies
Implementation
Establish M&E system and capacity
Adequate resourcing of policy implementation and M&E
Link to budget allocation process
Strengthen insttutional framework for policy review, adaptation and
implementation cycle
Source : (Adapted from UNEP 2009)

86page
Mainstreaming and integrating SCP in the national policy framework can be strengthened through the following approaches:
• Minimise the risks that a proliferation of action plans may fragment the focus of attention and weaken momentum. Plans and targets need to be commensurate with the political momentum and implementation capacity, especially with regard to inter-agency coordination. In practice, this can prove difficult; implemention of action plans must necessarily be carried out by different sectoral government ministries, leading to a number of different action plans. The challenge lies in ensuring that such action plans are in consonance with an overall, holistic SCP policy, which in turn is integral to a country’s overall planning for development.
• Lack of monitoring mechanisms for policy implementation hampers the policy feedback and the possibility of developing an SCP framework in a gradual and experimental manner. With the growing complexity of SCP policy options (from regulatory guidance, to fiscal incentives to public awareness etc.) gathering evidence from policy implementation can be challenging.
• Monitoring enables evidence based policy review. The lack of a robust policy review system undermines both the gradual development of the SCP agenda and the progressive ironing out of conflicts which may exist among laws and plans as a consequence of SCP-led innovations. Line agencies and stakeholder clusters need to produce over time shared understanding and approaches towards SCP. Capacities within the public and private sector need to be built to meet policy goals. All these processes require time, sustained effort and above all, a feedback system.
• Enabling adequate public communication strategies may counter the risk of a weak demand side for SCP and therefore of a weak economic and political momentum towards sustainable solutions.
• Strengthening resourcing and addressing capacity constraints (finance, human resources, knowledge, technology, skills, tools, and networks) which may ultimately sustain policy implementation, underpinning the momentum towards mainstreaming. Resource/capacity constraints often form a complex and inter-linked web: for example, financial limitations can lead to capacity deficits in technical knowledge, skills and tools.
• Identifying laws and policies which are in conflict with SCP objectives and arriving at resolution of the conflicts. Such issues arise frequently since sustainability concerns may not have been integrated into existing legislation which may be been drafted decades ago. Typically, conflicts arise in issues such as land-use laws and insistence on public procurement at the lowest price, irrespective of environmental considerations, depleting natural resources and changed social conditions.
• Demonstrating good governance, which attracts inflow of funds and technology by aid agencies, multilateral funding bodies and foreign investors alike. Conversely, conflict and poor governance aggravate resource constraints.
5.2 Structures and processes for policy implementation
Introduction
Collaboration for SCP Policy implementation relies on structures and institutions and their roles and interaction. Government ministries in many cases have very limited resources for reaching out to society, especially to rural and remote areas. Implementation institutions properly staffed and equipped with sufficient resources, can play a key role as a link between the central government and on-the-ground projects and activities. Sub-national levels of government, such as municipal authorities clearly play an important role and need to have appropriate capacity and sufficient resources for effective policy implementation.
On the other hand, there is a limit to what governments can accomplish by themselves and hence there is a need to form partnerships with key actor groups. Stakeholder engagement and partnership are needed, depending on context, to guide choices, support visions and transitions and promote consultations and negotiations. Partnerships may assist with data collection, research, implementation and resource mobilisation and may be helpful for developing and testing pilot initiatives. It is paramount to engage with the business community, civil society groups and other non-governmental organisations such as consumer groups and the media. Adequate communication and education to all parties, including the community can increase the likelihood of successful implementation.
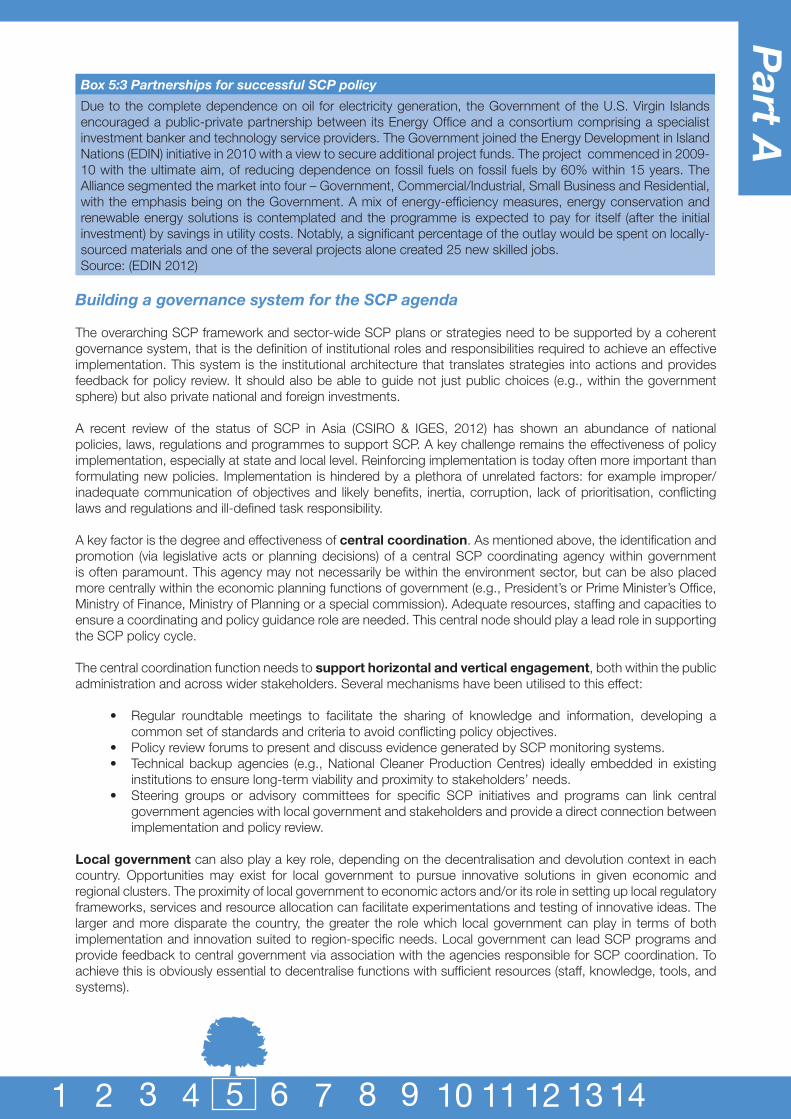
87page
Part A
1 2 3 4 5 6 7 8 9 10 11 12 13 14
Box 5:3 Partnerships for successful SCP policy
Due to the complete dependence on oil for electricity generation, the Government of the U.S. Virgin Islands encouraged a public-private partnership between its Energy Office and a consortium comprising a specialist investment banker and technology service providers. The Government joined the Energy Development in Island Nations (EDIN) initiative in 2010 with a view to secure additional project funds. The project commenced in 2009-10 with the ultimate aim, of reducing dependence on fossil fuels on fossil fuels by 60% within 15 years. The Alliance segmented the market into four – Government, Commercial/Industrial, Small Business and Residential, with the emphasis being on the Government. A mix of energy-efficiency measures, energy conservation and renewable energy solutions is contemplated and the programme is expected to pay for itself (after the initial investment) by savings in utility costs. Notably, a significant percentage of the outlay would be spent on locally-sourced materials and one of the several projects alone created 25 new skilled jobs.Source: (EDIN 2012)
Building a governance system for the SCP agenda
The overarching SCP framework and sector-wide SCP plans or strategies need to be supported by a coherent governance system, that is the definition of institutional roles and responsibilities required to achieve an effective implementation. This system is the institutional architecture that translates strategies into actions and provides feedback for policy review. It should also be able to guide not just public choices (e.g., within the government sphere) but also private national and foreign investments. A recent review of the status of SCP in Asia (CSIRO & IGES, 2012) has shown an abundance of national policies, laws, regulations and programmes to support SCP. A key challenge remains the effectiveness of policy implementation, especially at state and local level. Reinforcing implementation is today often more important than formulating new policies. Implementation is hindered by a plethora of unrelated factors: for example improper/inadequate communication of objectives and likely benefits, inertia, corruption, lack of prioritisation, conflicting laws and regulations and ill-defined task responsibility. A key factor is the degree and effectiveness of central coordination. As mentioned above, the identification and promotion (via legislative acts or planning decisions) of a central SCP coordinating agency within government is often paramount. This agency may not necessarily be within the environment sector, but can be also placed more centrally within the economic planning functions of government (e.g., President’s or Prime Minister’s Office, Ministry of Finance, Ministry of Planning or a special commission). Adequate resources, staffing and capacities to ensure a coordinating and policy guidance role are needed. This central node should play a lead role in supporting the SCP policy cycle.
The central coordination function needs to support horizontal and vertical engagement, both within the public administration and across wider stakeholders. Several mechanisms have been utilised to this effect:
• Regular roundtable meetings to facilitate the sharing of knowledge and information, developing a common set of standards and criteria to avoid conflicting policy objectives.
• Policy review forums to present and discuss evidence generated by SCP monitoring systems.• Technical backup agencies (e.g., National Cleaner Production Centres) ideally embedded in existing
institutions to ensure long-term viability and proximity to stakeholders’ needs. • Steering groups or advisory committees for specific SCP initiatives and programs can link central
government agencies with local government and stakeholders and provide a direct connection between implementation and policy review.
Local government can also play a key role, depending on the decentralisation and devolution context in each country. Opportunities may exist for local government to pursue innovative solutions in given economic and regional clusters. The proximity of local government to economic actors and/or its role in setting up local regulatory frameworks, services and resource allocation can facilitate experimentations and testing of innovative ideas. The larger and more disparate the country, the greater the role which local government can play in terms of both implementation and innovation suited to region-specific needs. Local government can lead SCP programs and provide feedback to central government via association with the agencies responsible for SCP coordination. To achieve this is obviously essential to decentralise functions with sufficient resources (staff, knowledge, tools, and systems).

88page
Box 5:4 Examples of local government role in SCP implementation across Asia
• In a Chinese project to enhance eco-friendly pro-poor bamboo production supply chains, the Sichuan Provincial Forestry Department supported SME capacity development by establishing cluster support centres, supporting study tours and policy dialogue with other provincial and national government agencies.
• In the Philippines, the introduction of a scheme to promote zero carbon tourism resorts has been facilitated by the multi-sector Palawan Council for Sustainable Development: this, acting directly under the Office of the President and in close coordination with the line agencies, implements a clearing system for new resorts. This system was established as a pioneering initiative through a national Act specific to Palawan.
• In Rayong, Thailand, the city government adopted an integrated plan for a community-based waste management scheme including recycling, production of organic fertiliser, and production of biogas to generate electricity. It led the project with national and international partnerships.
Source: (Muller et al 2011 & IGES 2010)
Reaching out to the wider society
Shaping and pursuing SCP goals and strategies cannot be left to government alone. Government’s outreach capacity and mandate in the market place are constrained in different forms: from resource availability to the often prevailing view that consumer choices should not be closely led. Furthermore, SCP agendas are not linear processes in pursuance of universally agreed values: in each society, they are affected by value systems, market factors, geopolitical factors, etc. Specific SCP goals and strategies, therefore, may find themselves in variable relation with mainstream values and forces. They can be contested among stakeholders. Figure 5:6 summarises three potential situations of SCP goals vis-à-vis social values and systems. We can note how, depending on the specific context, government action may pursue different strategies, ranging from guidance, to transition management to public consultations and deliberations. All these forms of interaction will require consistent mechanisms to engage stakeholders: these include market actors, public bodies, consumers, research institutions, etc.
Figure 5:6 Approaches to SCP in relation to social contexts
Substantial agreement on a SCP problem and solution Support short term measures
Establish supportive policy framework; abolish perverse subsidies; promote market transparency to counter monopolies/olygopolies
Rough agreement on ultimate goal, but road uncertain
Support medium-term transitionsCommand and control will not work; support envisioning; enable experimenting, policy review and social learning
SCP needs and opportunities clash with mainstream values and systems
Support consultations and deliberations
Show SCP costs and benefits; enable dicussions on fundamental paradigms; promote balance between government, consumers, producers
Source: (Adapted from Tukker et al, 2008)
Supporting the reform agenda with communication and public education
Policy implementation needs to leverage adequate communication strategies. These need to be tailored to a range of target groups, through specific communication approaches and means. Communication can :
• Assist public officials (at central, regional and local levels) and partners directly involved in SCP initiatives, to increase the understanding of SCP and support coordination and effectiveness.
• Reach out to market actors, to support engagement across value chains and the identification and seizing of opportunities.
• Target the general public, to increase support to SCP policies and awareness of consumption and production patterns and SCP opportunities.

89page
Part A
1 2 3 4 5 6 7 8 9 10 11 12 13 14
Figure 5:7 Options for communication strategies for key target groups
Consumers
Institutional players
Market actors
• Targeted media and education campaigns• Targeted advertising • Product certification schemes• Partnerships with consumers' organisations
• Policy and assessment briefs• Knowledge management solutions• Coordination and information events
• Trade events• Partnerships with trade associations• Public campaigns
A consistent communication strategy for the general public and market players is particularly important in those complex and frequent situations where there is a gap or conflict between SCP goals and opportunities on one hand, and social values and systems on the other hand. In these cases, demand side management via communication and media is paramount to incentivise progressive consumer action. Consumers’ behaviours are affected by factors playing out at multiple levels: from practical opportunities and needs to self awareness and individual value systems, to the way individual choices are shaped by institutions and rules, to the broader set of social and economic factors shaping societies.
Therefore, an effective approach to public education for sustainable consumption needs to support actions at these multiple levels. Figure 5:8 provides a conceptual model for this undertaking, identifying three layers of factors affecting consumers’ behaviour: a background level shaped by social, economic and political factors (this can be influenced via the SCP policy cycle and broader economic policies); a strategic planning level (where SCP strategic plans, practical opportunities and means, can reinforce and link policy implementation with the individual behaviour level); and finally a level acting on personal motivation and choices (where activities like public awareness campaigns can affect personal value systems and purchasing behaviour).
A classic case is the Indian Government’s energy Star scheme, administered by the Bureau of Energy Efficiency which mandates energy efficiency ratings for a number of consumer goods such as refrigerators and air conditioners. The launch of the Energy Star Rating scheme was accompanied by a large scale advertising campaign aimed at individual consumers which explained the rationale of the scheme and the benefits to the consumer. The label itself provides data on electricity consumed in KWh per annum by that particular model/make of appliance, leaving the consumer in no doubt of the benefits of the higher rating. The scheme has been an outstanding success and contrasts with the Indian ecolabelling scheme, which was never publicised and which has remained a non-starter for 20 years.
The Energy Star scheme has been assimilated into Indian buying habits for the prescribed range of electrcial applicances and amongst the first to embrace the scheme were institutational purchasers from both the public and private sectors.

90page
Figure 5:8. A multi-layer model of education for sustainable consumption
Influence social and political systems
Influence individual motivation and values
Catalyse practice of sustainable consumptionImplementation
of SCP policy tools
Policies a�ecting broader economic
development, social values
Promote responsible behaviour and
self-awarenes of purchasing decisions
Develop environmental
citizenship through value promotion
Overarching SCP strategic plan to reinforce SCP by enabling, encouraging, engaging, exemplifying
and catalysing sustainable consumption patterns
Source: (Based on IGES, 2010 which provides detailed guidance)
© Peerayot Sidonrusmee

91page
Part A
1 2 3 4 5 6 7 8 9 10 11 12 13 14
Further reading 5
Planning for change, Guidelines for national programmes on sustainable consumption and production provides an introductory framework for developing SCP programs through the policy cycle. It focuses on programs design and elaborates on the importance of coordination and high level support.
Bentley M 2008, Planning for change. Guidelines for national programmes on sustainable consumption and production. UNEP, Paris.
Mainstreaming sustainable consumption and production and resource efficiency into development planning presents detailed guidance on mainstreaming SCP goals and strategies throughout national planning systems. It is designed for officials involved in policy making and SCP practitioners. It covers the design of SCP policy measures and strategies to reflect them in mainstream development frameworks.
United Nations Environment Programme 2009, Mainstreaming sustainable consumption and production and resource efficiency into development planning, UNEP, Paris.
Capacity Building and Policy Needs Assessment for Sustainable Consumption and Production: Executive Summary is a recent report that provides an updated assessment of the status of SCP in Asia. It considers policy formulation, implementation capacities and lessons learnt from the first cycles of policy development and program implementation across the region.
CSIRO & IGES 2012, Capacity Building and Policy Needs Assessment for Sustainable Consumption and Production. Executive Summary, UNEP SWITCH Asia Policy Support, Commonwealth Scientific and Industrial Research Organisation & Institute for Global Environmental Strategies. Available from: <http://www.switch-asia.eu/fileadmin/content/PSC/AssessmentSummary.pdf>. [15 August 2012].
Sustainable Consumption and Production in the Asia-Pacific Region. Effective Responses in a Resource Constrained World provides comprehensive guidance to several key aspects of policy implementation. In particular, it provides detailed theoretical and practical knowledge on public education strategies.
IGES 2010, Sustainable Consumption and Production in the Asia-Pacific Region. Effective Responses in a Resource Constrained World, IGES White Paper III 2010, Institute for Global Environmental Strategies. Available from: < http://www.iges.or.jp/en/news/topic/wp3_main.html>. [September 2012].


93page
Part A
1 2 3 4 5 6 7 8 9 10 11 12 13 14
6 Monitoring and Evaluation
6.1 Understanding monitoring and evaluation 6.2 SCP indicators
SCP x
x
ExcellentGoodAveragePoor
SCP?

94page
Monitoring and EvaluationKey Points
• Policy monitoring and evaluation is an ongoing activity. It is essential for determining the need for extending, adjusting or ceasing a policy.
• Effective policy monitoring and evaluation requires well thought out indicators.
• Some important frameworks exist that can be utilised when identifying indicators and when devising indicators systems.
• Commonly used criteria exist for good indicators, in the context of developing and emerging countries.
This section highlights the importance of robust monitoring and evaluation of SCP policies. Monitoring and evaluating should not just be thought of as an after-thought, it is a critical step in the policy cycle that allows for learning and improvement. Guidance is provided, to assist in developing a set of well thought out indicators, for monitoring and evaluating SCP policy.
6.1 Understanding monitoring and evaluation
Monitoring and evaluation
An adaptive approach to SCP policy demands highly developed systems to gain, distribute and use information to describe progress of SCP policies. Policymakers need to make sure that SCP policy interventions are well targeted and yield the desired outcomes. Monitoring and evaluation provides this important information.
Most importantly, monitoring and evaluation needs to be understood as an integral extension of policy implementation – a routine and central function – and not just an afterthought or add-on to the ‘main game’ of policy-making (Dovers, 2005). To allow learning to occur, policymakers need to set up a process and design for monitoring and evaluation that is robust, timely and delivers both to the purpose of standard administrative evaluation and the broader learning’s that need to underpin the policy process. Policymakers need to consider the data requirements for monitoring SCP outcomes.
Monitoring and evaluation are central elements of the SCP policy cycle. They are particularly important in the context of SCP because of the complexity and cross-cutting nature of the SCP policy domain. This creates a much greater likelihood for policy failures and will present the policy community with a need to design an adaptive policy process that will rely on the results of ongoing monitoring and evaluation processes.
Data requirements for environmental and policy monitoring
SCP policy monitoring is unlikely to be a discrete and tightly contained activity. Policy monitoring will hence require a series of steps for monitoring and analysis. The focus of the activity may change as circumstances change and new knowledge becomes available. This reflects the particular complexity and problems of the SCP and sustainability domain, as well as the standard insight of traditional public policy, that policy making is an iterative process. Table 6:1 gives an overview of monitoring implications for two important SCP domains, housing and mobility.
Table 6:1 Monitoring and policy intervention: Introducing SCP in housing and mobility
Substantive issue
Policy problem Policy instrument Key interests and outcomes
Monitoring implications
Building energy use and GHG emissions
Increased appliance and air conditioning use, low insulation standards
Carbon tax increasing the costs of electricity and emissions
Reducing energy and GHG emissions of buildings, incentivising building efficiency gains and efficient appliances
Short term: purchase of energy efficient appliances, investment in building insulationLong term: reduction target in energy use and GHG emissions achieved
6ExcellentGoodAveragePoor

95page
Part A
1 2 3 4 5 6 7 8 9 10 11 12 13 14
GHG emissions from private car use
Increased private car ownership, lack of public transport capacity
Carbon tax, tax off-set for fuel efficient private cars, free public transport on main commuter routes
Reduce private transport emissions, increase public transport use
Short term: up-take of public transport and purchase of energy efficient vehiclesLong-term: substantial reductions in GHG emission form private transport
The example in Table 6:1 shows that there are several target areas for policy monitoring and hence the data that needs to be gathered will vary accordingly. Data would be relevant in three categories:
1. Policy impact, effect or uptake, measuring the extent to which the policy instruments effecting behavioural change in favour are being applied or used.
2. Environmental and/or social conditions, which are sought through the policy intervention. Examples include trends in resource use, emissions, poverty levels and whether they improve through the policies or not.
3. Secondary influences, both policy and environmental, which may be affecting the ability of policy instruments to achieve the desired SCP outcomes. Such factors may include pressure indicators, natural environmental variables and policy variables (such as perverse incentives, or countervailing commutations).
It is important that the policy community states clearly:
1. What objectives are being pursued and how progress can be tracked.2. What measures are being used to achieve such progress and how the success of these measures can
be measured in the interim.3. What other factors might influence achievement of the objectives and how that influence can be identified.
Review, evaluation and policy iteration
During the policy formulation and implementation stages of the SCP policy program a review framework needs to be set in place. Working towards an informed evaluation is an essential discipline that will increase the chances that all aspects of the SCP policy will be evaluated. This will include setting dates for mid-term reviews as well as a major review. In developing countries these review dates will ideally be synchronised with the national planning cycles of the 5 year plans.
Government agency staff will most often undertake the policy evaluations and many large agencies already have dedicated evaluation staff. The evaluation also may be undertaken by commissioned consultants and researchers, or by committees of parliaments, or special commissions of enquiry. For SCP policies, because of the extended policy community and participatory nature of programs, an inclusive approach to evaluation is recommended. This may be achieved through consultation, focused meetings and submissions, or by inclusion of stakeholder representatives as part of the evaluation team. In many cases, the National Development Planning process already has well established evaluation strategies and stakeholder networks to be involved during the evaluation. This puts developing countries in a privileged situation for SCP policy evaluation.
Through evaluation of SCP policies, as is the case with many other policies, governments will ensure accountability and effectiveness in expanding public resources.
Such administrative evaluation may include five strands, underpinned by different rationality, approaches and data needs:
1. Effort evaluation driven by efficiency concerns, examining the quantity of time and finances used for SCP policy programs.
2. Performance evaluation, examining the outputs and outcomes of the SCP policy programs in whatever form these may have manifested (independent of whether the policy goals were being achieved).
3. Adequacy of performance (effectiveness) evaluation, assessing whether the stated policy goals were being achieved.
4. Efficiency evaluation, exploring whether the outcomes of the SCP policy program could have been achieved at a lower cost or effort.
5. Process evaluation, which seeks to draw lessons about process and organisational design.

96page
Whilst administrative evaluation is very important, governments may wish to broaden the scope of the evaluation over time to include multiple interests and organise the evolution process in a participatory manner, to favour long-term policy learning over near-term program efficiency and outcomes. Ultimately, evaluation should inform future policy action regarding whether to:
a. Discontinue the policy because the problem has been satisfactorily resolved.b. Persevere with much the same policy because it appears to be working although the problem
remains and goals have not yet been fully achieved.c. Substantially redesign policy to address failure to achieve the goals.d. Redefine the policy problem in light of experiences gained to date.
Policy learning might take different forms as is outlined in Table 6:2.
Table 6:2 Policy learning: forms and purposes
Form What is learned? Who learns? To what effect?
Instrumental learning How well instruments have allowed the achievement of goals.
Members of the policy network, especially government officials engaged in policy formulation and implementation.
Better design and implementation of policy instruments to achieve predetermined policy goals.
Government learning How well administrative arrangements and processes have allowed policy implementation.
Members of the policy network, especially senior officials responsible for design and maintenance of policy processes.
Better design of administrative structures and processes within the bureaucratic system (and engaging outside that system).
Social learning How useful are the social constructions of policies and goals.
Broader policy community, including actors within and outside government.
Reframed problems and related goals, through changed cause-effect understanding or altered social preferences.
Political learning How to most effectively engage with and influence political and policy processes.
Policy actors wishing to (a) change policy agendas and outcomes or (b) defend current agendas and outcomes.
Change in problem definition, policy goals and/or membership of the policy network.
Source: (Bennett and Howlett 1992)
The interplay between the environment and socio economic activities
To facilitate effective monitoring and evaluation it is necessary to structure thinking about the interplay between the environment and socio-economic activities. A variety of frameworks for this exist, one of which is the DPSIR framework, used by UNEP (for work such as the Global Environmental Outlook) and the European Environment Agency (EEA). It is a slightly extended version of the well-known “PSR” (pressure –state –response) model introduced by the OECD.
DPSIR stands for: Driving forces - Pressures - State - Impact – Responses. This approach can encourage and support decision-making, by pointing to clear steps in the causal chain and allowing for policy intervention to change the causal relations to support environmentally and socially beneficial outcomes. The DPSIR represents a systems analysis view: social and economic developments exert pressure on the environment and, as a consequence, the state of the environment changes. This leads to impacts for example, on human health, ecosystems and materials, which may elicit a societal response that feeds back on the driving forces, on the pressures or on the state or impacts directly, through adaptation or curative action.

97page
Part A
1 2 3 4 5 6 7 8 9 10 11 12 13 14
Figure 6:1 The DPSIR framework
Driver ResponsesImpactStatePressures
Extraction Industry
TradeConsumption
PoliciesTechnology
Cleaner ProductionAwareness
Human HealthClimate ChangeBiodiversity Loss
Economic Damage
Air Water
Soil Quality Biodiversity
PollutingEmissions Resources
ExtendedDriver
PopulationA�uence
Source: (European Environmental Agency n.d.)
6.2 SCP indicatorsWhy do governments need SCP indicators?
Governments in all countries for a number of purposes and in various policy areas use indicators. Indicators convey information about the current situation using a format that is easy to understand. Out of the large pool of statistics and other kinds of data that exist in each country, indicators represent selected pieces of information that are chosen because they highlight areas of key importance for policy making. Indicators can be used both internally by government agencies and for communication with citizens, private enterprises and other actors. In most cases, indicators are quantitative measures derived from national statistics or are based on surveys. SCP indicators will mainly be used for:
• Monitoring progress towards a political SCP objective. In this case the government or the parliament has already decided what changes they would like to see happen and indicators are used to determine if progress is being made towards the objective. When indicators are used in this way there is often a target to be achieved within a certain time frame. An example could be that by 2015 products meeting certain sustainability criteria should make up 20 per cent of the government’s procurement. Such an objective needs to be followed up at regular intervals and if progress is weak stronger efforts may be required.
• Monitoring trends in areas of key relevance to SCP. In such cases where no targets have been set,
the government may find it useful to follow changes in important areas of consumption and production. For areas of high environmental and social significance there can be a need to keep informed about trends through the use of indicators. Since it’s impossible to monitor all aspects of consumption and production patterns and their influence on sustainability, it will be important to be strategic in the selection of indicators.
• Benchmarking with patterns of consumption and production in other countries. Comparisons with other countries can be of value in the policy process to identify countries strengths and weaknesses, and areas that require new or stronger policies. However, when making comparisons with other countries it is important to be aware that statistical definitions may differ. Comparing indicators between countries without checking that definitions are similar can lead to erroneous conclusions.
• Raising awareness of the importance of SCP and to improve accountability. Selected indicators
may be suitable for regular reporting to society at large. They can provide information of whether or not the country is moving towards more sustainable patterns of consumption and production. Reporting regularly to the public also helps in improving the accountability of policy making.
Indicators can be either absolute, such as hectares of land that is farmed organically, or relative, such as percentage

98page
of agricultural output (by weight) produced by organic farming. They can also be composite indices combining different kinds of information into a common metric. An example of such an index is the Human Development Index (HDI), which weighs together data for GDP per capita, literacy and life expectancy. The information provided through an indicator is simplified and gives a quick indication about situations and trends. The underlying reality is always much more complex than shown by indicators, and policy making typically requires more comprehensive data and thorough analysis of cause-effect relationships. For example, unemployment (in most cases measured as a percent of the active workforce lacking employment) is a key indicator that all governments keep track of. Increasing unemployment is a sign that the government might need to intervene. However, the unemployment rate indicator is just a warning sign; it does not in itself say anything about what has changed in the economy and what kind of government action might be effective. For example: is the increasing unemployment caused mainly by a downturn in the export industry or by weak domestic demand, is unemployment increasing mostly among men or among women, or is youth unemployment going up disproportionately. The policy cycle can be structured into four main phases (see Chapter 4.1): problem identification, policy formulation, policy implementation and monitoring and evaluation. At each of these stages there is a need for reliable data reflecting the situation in a country. For problem identification and policy formulation, policymakers typically need rich data sets and advisors with good analytical skills. Consideration of indicators is relevant during policy formulation and during discussions on new policy objectives it is important to think about whether suitable indicators can be ,devised. For policy implementation and monitoring and evaluation, indicators can also play an important role. High-profile indicators can help with increasing awareness on new policies and their objectives, thereby facilitating implementation. Well-designed indicators should provide feedback on whether or not policies are having the intended effect.
Figure 6:2 The role of indicators throughout the policy cycle
ProblemFraming
PolicyFraming
Monitoring &Evaluation
PolicyImplementation
-inform about trends-help agenda setting -allow for an informed public debate
-indicators may underpin policy goals -�gure prominently in a policy statement in the form of targets
-measure progress of SCP -objectives meaure e�ectiveness of SCP policies
-policy instruments will be selected with a view on performance indicators
How to develop indicators: the process For governments, the process of identifying indicators can help with mainstreaming SCP. The process can help government bodies in charge of different policy domains to form a shared vision on the meaning and objectives of SCP. It can thereby contribute to improved policy coherence. In addition, involvement in the process of indicator development builds ownership and responsibility. Since SCP is a very broad policy field that spans across administrative divisions and needs to involve several line ministries or other governmental bodies, the coordinating/mainstreaming value of such processes can be significant. In order for indicators to be fully effective, the involvement of civil society, the business community and academia is desirable. Governments cannot make SCP happen on their own. One consequence of this need for active contributions from other actors is that the selection and design of SCP indicators needs to reflect the interest and priorities of other groups in society. Only if the indicators represent a widely held understanding of SCP and related priority areas can they become fully effective as a coordination mechanism and a guiding tool.

99page
Part A
1 2 3 4 5 6 7 8 9 10 11 12 13 14
Experience shows that the process of jointly developing a set of indicators can have a value that goes beyond that of the indicator set itself. The people involved in the process will increase their knowledge, both about the issues at hand (or the substance) and about the perspectives and thinking of others. This can lay the foundation for improved future collaborative actions towards SCP objectives.
Box 6:1 Developing SCP indicators: Experience from Latin America and the Caribbean
Since 2003, SCP has been a high priority in the agenda of the Ministers of the Environment of the Latin American and Caribbean region, which designated a specific Council of Government Experts to bring forward the discussion and ensure synergies in the regional approach. A recent study by UNEP ROLAC analysed existing SCP policies in the region and associated indicators to identify common approaches and assess sources of information available for the formulation of SCP indicators in LAC countries. Based on this information, a set of common regional indicators to measure progress in the implementation of national SCP policies was proposed.
The analysis of policies shows that energy, water, waste management and public procurement are the SCP aspects prioritised by governments. Data availability appears as one of the key factors determining the SCP indicators that could be implemented. According to the survey completed by 16 countries from the region, the type of information available (in over 70% of the countries surveyed) is related to the total water demand, total energy demand, total fuel demand, the generation of emissions, GDP, energy consumption by economic activity, census population and housing, production by economic activity, percentage of renewable energy and potential for further generation, and the number of industrial and agricultural companies. The type of information available is based on macro-economic and energy data. Information related to SCP of water, waste and procurement is still developing.
As a result of this study the following 19 indicators of SCP for LAC were proposed, covering the fields of water, energy, waste management and public procurement. For effective implementation, they may need to be reduced to a set of core indicators, for example 5 to 7. They must be scientifically based, legitimate and easy to understand to enable successful SCP monitoring.
Indicators1. Annual energy demand in relation to GDP2. Annual energy demand in relation to population3. Annual energy demand per economic activity in relation to total production 4. Energy generation from renewable sources in relation to total energy generation5. Annual water demand in relation to GDP6. Annual water demand in relation to population7. Annual water demand per economic activity in relation to the production completed8. Total amount of solid waste generated in relation to GDP9. Total amount of solid waste generated in relation to number of inhabitants10. Total amount of solid waste generated per economic activity in relation to final production11. Total amount of solid waste recycled and reused in relation to the total amount of solid waste generated12. Total amount of hazardous solid waste in relation to the total amount of solid waste generated13. Total volume of polluted water in relation to the GDP14. Total volume of effluents to be processed per economic activity in relation to the total production 15. Total volume of effluents processed in relation to the volume of effluents that need processing16. Total amount of public procurement of material ‘x’ with sustainability criteria, in relation to total public
procurement of material ‘x’17. Total amount of ‘sustainable/green’ products procured in relation to the total of products available in
the market18. Number of countries with legal instruments in SCP and/or strategies in relation to the total number of
countries in the region19. Number of educational programs that incorporate SCP issues in relation to total number of national
educational programmes Courtesy: Metternicht 2012

100page
How to structure data and identify indicators that reflect critical aspects There is a large pool of environmental and sustainability indicators available today that may be employed for analysing SCP performance.
UNEP SCP indicators approach for developing countries
UNEP has developed an approach for SCP indicators outlined in the publication SCP Indicators for Developing Countries: A Guidance Framework. It aims to provide guidance to government departments for selecting their national SCP indicator sets. The framework is based on the notion of the following five capitals.
1. Natural capital2. Manufactured capital3. Financial capital4. Social capital 5. Human capital
These capitals are related but not fully substitutable. In essence, for SCP to be successful in a country, natural capital should not decrease below a threshold of critical natural capital.
The framework identifies 4 important aspects for developing measurable SCP objectives and related indicators. They include the critical natural capital approach and the efficiency based approach as well as compliance and connectivity. According to the UNEP guidance framework, indicators need to provide information that may guide changing behaviours of producers and consumers. They suggest that in addition to a set of macro-economic indicators relating to the SCP performance in a country, it would be important to also develop indicators that reflect the activities of individual consumers and producers in terms of the four perspectives.
Figure 6:3 The SCP compass
Source : (UNEP 2008)

101page
Part A
1 2 3 4 5 6 7 8 9 10 11 12 13 14
Table 6:3 Mindsets of producers and consumers
For producers, their mind-set could consist of: For consumers, their mind-set could consist of:
Compliance – a minimum contribution, where the firm ensures compliance with the law and merely acts to sustain its right to operate.
Compliance – where consumers purchase on the basis of price and utility without a sense of influencing producer actions through their consumption choices.
Efficiency – where a firm is prepared to look at changes in products and processes, minimising the throughput of resources (material, energy and water) in both production and product life cycle.
Efficiency – where consumers prefer products that have a greater efficiency or reduce resource use and emissions while retaining utility.
Connectivity – where a firm recognises its interdependence on social and human capital and takes steps to build those capitals.
Connectivity – where consumers take steps to influence producers through their consumption decisions and recognise that their success will depend on their access to social networks, income levels and self-esteem.
Critical stock – where a firm recognises the need to maintain a critical stock of natural capital and takes steps to restore natural capital or at least avoids its systematic degradation. To achieve this, firms need to trade-off short term financial gains for longer-term resilience.
Critical stock – where consumer decisions are focused on the need to retain a critical natural capital stock. They are trading off short-term individual gains for longer-term communal values.
The report outlines a set of possible indicators based on the SCP indicators compass Figure 6:3, which in practice relies less on data for assets (or capitals) and is more based on flow indicators for materials, energy, water and land, waste and emissions accompanied by economic and social indicators.
Another well know framework focussing on changes in environmental assets is the UN System of Environmental-Economic Accounting. The System of Environmental - Economic Accounting (SEEA) framework is a multi- purpose, conceptual framework that describes the interactions between the economy and the environment, and the stocks and changes in stocks of environmental assets (EC, FAO, IMF, OECD, UN & WB 2012). The SEEA framework uses a wide range of information and provides a structure to compare and contrast source data and allows the development of aggregates, indicators and trends across a broad spectrum of environmental and economic issues. Particular examples include the assessment of trends in the use and availability of natural resources, the extent of emissions and discharges to the environment resulting from economic activity and the amount of economic activity undertaken for environmental purposes.
Many approaches based on stock accounting, such as the SEEA, are confronted with the problem of feasibility of data collection. Flow accounts for materials, energy, water and emissions avoid this problem because they are usually based on available statistical data that needs to be modified for the purpose of the accounting methods, but allows for datasets and indicators to be constructed at low costs and within reasonable timeframes. There is now large agreement on the methods to be used for national material flows accounts, for energy flow accounts and for water and emission accounting. These accounting frameworks are usually linked to the System of National Accounts (SNA) and are able to provide data with some sectoral disaggregation and very detailed disaggregation of flow categories.
A set of national SCP indicators
National SCP indicator sets will need to build on the experience of SEEA, DPSIR and natural resource flow accounting (material and energy flow accounting). They will need to be highly complementary to the SNA and need to provide information on production and consumption. SCP indicators, if constructed in such a way, will be largely based on available statistical information. However, there will be challenges with regards to sectoral disaggregation, which will be necessary to inform SCP policy information. Another important issue would be to disaggregate consumers and households by income groups, geography (urban or rural) and potentially lifestyle factors. Advanced analytical skills that may need to be used to disaggregate data include input-output analysis and life-cycle assessment. This will allow prioritisation of economic activities for SCP interventions, by identifying

102page
such economic domains where SCP policy interventions would make the largest difference with regard to national SCP outcomes.
Any national (and sectoral) SCP indicator system will need to provide a set of headline indicators along with some more detailed indicators and would profit from indicator dashboards, i.e. sets of indicators that taken together provide information on key aspects of a system. Looking at the indicators together, as a set, should provide an understanding that goes beyond the information conveyed by each individual indicator.
Criteria for quality SCP indicators
• Easy to understand and communicate also to non-experts• Reflect a widely recognised concern• Based on conceptually sound calculation methodologies • Encourage systemic transition/transformation/innovation • Based on available or easily obtainable data • Based on reliable data• Based on data that is updated regularly• Possible to construct time-series to observe trends• Sensitive enough to detect changes over the short or mid-term, should provide a reasonably up-to-
date picture of the situation• Be SMART (Specific, Measureable, Attainable, Relevant and Timebound)
When taken together as a whole, the SCP indicator sets should cover all critical aspects of SCP and provide decision makers with an adequate understanding of whether or not the country is on the right track to achieving SCP. Furthermore, a good set of indicators should consist of a limited number of quality indicators as too many, or weakly structured indicators can easily create confusion. The quality of the SCP indicator development process and the participation and degree of involvement of broader social groups will also affect the effectiveness of an indicator set. An open and consultative process is more likely to generate a set of indicators that are widely understood and supported. There is a trade-off, however, between context and country specific indicators and indicators that are comparable across countries. This may be resolved by a common set of headline indicators but country specific detailed indicators.
© Lewis Akenji

103page
Part A
1 2 3 4 5 6 7 8 9 10 11 12 13 14
Box 6:2 Working with indicators in practice
When working with indicators in practice there are a number of things to keep in mind. The following points provide general advice on how to avoid common mistakes and pitfalls.
• Seek to get the indicator set approved at the highest political level. Endorsement from the political level gives indicators extra weight and makes it easier to engage all governmental agencies.
• Allocate clearly the responsibility for regular follow-up and reporting. For each indicator, or for the whole indicator set, there needs to be an institution with coordinating responsibility. Changes in indicator values need to be clearly documented and communicated to relevant government agencies as well as to other actor groups, sometimes also including the general public. In cases where progress is weak it is necessary to agree which part of the government is in charge of taking remedial action. If an indicator is not based on information generated by the regular statistics system, it may be necessary to develop new routines for data collection and reporting.
• Be flexible and prepared to revise. Working with indicators is and should be a learning process. There is value in observing the same indicators over several years, but there is also a need to review and revise indicator frameworks once in a while to properly reflect emerging issues and new priorities. Hence it is important to strike a balance between continuity and renewal. If the reporting of indicators is done annually it may be a good idea to have a more thorough review every five years.
• Analyse trends and seek to understand why changes are happening. This requires adequate resources in terms of staff and skills. Without proper analysis and understanding there is a risk for ineffective or counterproductive policy response. Indicators only tell part of the truth – that is the reason why they are useful, they simplify a very complex reality into a few metrics that can be understood at a glance. However, this is also one of the dangers of indicators: that they highlight certain aspects but ignore others. This underscores the need for regular reviews to make sure that the indicators used reflect current priorities.
• Communicate achievements widely. Use indicators for education, awareness raising and to improve accountability.
• Learn from other countries’ experiences and share lessons learnt with others. Collaborate in international networks and platforms.

104page
Further reading 6
SCP Indicators for Developing Countries: A Guidance Framework, aims to provide guidance to government departments for selecting their national SCP indicator sets. It proposes a structured framework for understanding SCP and for developing indicators, crucial for monitoring and evaluating progress. This framework is then tested against existing relevant indicators that are being used in twenty developing countries.
United Nations Environment Programme 2008, SCP Indicators for Developing Countries: A Guidance Framework, UNEP Paris.
Moving Towards a Common Approach for Green Growth Indicators is a scoping paper from the Green Growth Knowledge Platform. It proposes a framework that provides a common basis for further developing GG/GE indicators, with a special focus on the economy-environment nexus.
Green Growth Knowledge Platform 2013, Moving Towards a Common Approach for Green Growth Indicators, Green Growth Knowledge Platform.
Towards Green Growth: Monitoring Progress OECD Indicators presents a conceptual framework, a proposal for developing green growth indicators. They are accompanied with a measurement agenda that will help addressing the most pressing data development needs.
OECD 2011, Towards Green Growth: Monitoring Progress OECD Indicators, OECD.
Handbook on Developing, Monitoring and Evaluating for Development Results aims to support UNDP in becoming more results-oriented and to improve its focus on development changes and real improvements in people’s lives. It is a useful publication for not only UNDP, but anyone operating in the development field.
UNDP 2009, Handbook on Developing, Monitoring and Evaluating for Development Results, UNDP, New York.

105page
Part A
1 2 3 4 5 6 7 8 9 10 11 12 13 14
© Lewis Akenji

THEMATIC POLICY OPPORTUNITIES

107page
Part B
1 2 3 4 5 6 7 8 9 10 11 12 13 14
7 Resource Efficiency and Cleaner Production
N
S
EW

108page
Resource Efficiency and Cleaner ProductionKey Points
• Tools and approaches such as RECP, PRE-SME, responsible production and D4S offer most companies practical solutions to improve resource efficiency and embed preventive strategies at the company level.
• Eco-innovation offers opportunities to embed sustainability in a company’s business strategy.
• The appropriate combination of SCP policy instruments can create an enabling environment encouraging industry to transition towards sustainable production.
• Capacity building in SMEs is particularly important as they contribute a significant portion of industrial production and are often vulnerable due to lack of information and poor resource efficiency and environmental performance.
This chapter highlights the importance of preventative approaches, such as Resource Efficiency and Cleaner Production (RECP), in reducing the environmental impact of production, and ultimately consumption. The potential benefits are identified, along with policy opportunities for creating a more enabling environment for RECP.
Why are preventive approaches and decoupling production and consumption patterns important?
As the world has experienced rapid growth and changes in consumption patterns, resource use and environmental degradation resulting from industrial production has increased. Impacts of unsustainable industrial production and utilisation of scarce resources threaten the basis of the economy and negatively affects society. The consequences of industrial production must be dealt with, or preferably prevented in the first place. RECP and eco-innovation are preventative strategies (targeting companies at different levels of sustainability readiness), aimed at decoupling consumption and production patterns from the exploitation of eco-system services. They provide an opportunity for leapfrogging towards sustainable industrial production systems that focus on resource efficient and responsible use of natural resources, creating minimum adverse impacts on the environment (UNEP n.d.).
Historically, actions toward more resource efficient industrial production and the transition towards a Green Economy have been motivated by emerging regulations, driven by increasing risks and accidents. An alternative strategy is to instead inspire and support public and private organisations to act upon the opportunities that resource efficient societies and markets offer. Governments play a pivotal role in enabling and encouraging preventive approaches through supportive policy frameworks. In many developing countries and transition economies, SMEs, who are particularly vulnerable to poor resource efficiency and environmental performance make up a significant proportion of industry, hence policy must be developed for organisations of all sizes, including SMEs.
Resource Efficiency and Cleaner Production (RECP)
RECP builds upon cleaner production to accelerate the application of preventive environmental strategies at company level to processes, products and services. Practices and applications of cleaner production have been around for several decades. The term Cleaner Production (CP) was defined by UNEP in 1990 as: ‘The continuous application of an integrated environmental strategy to processes, products and services to increase efficiency and reduce risks to humans and the environment’. This definition has been used as a working definition for most programmes related to the promotion of cleaner production and is still relevant today. CP addresses problems at the source, using a product lifecycle approach that considers techniques, process and service dimensions.
In recent years, as the economic and environmental crises have intensified, UNEP and UNIDO introduced resource efficiency alongside cleaner production (RECP) to advance production efficiency, environmental management and human development (UNEP n.d.). This strategy integrates the strengthened lifecycle perspective which looks at the point of extraction to the point of disposal, including the critical issue of resource scarcity.
7

109page
Part B
1 2 3 4 5 6 7 8 9 10 11 12 13 14
Involvement in all phases of the product lifecycle allows RECP to investigate ways to improve the efficiency of production and modify or minimise inputs to achieve triple bottom line improvements. Resource efficiency achieves environmental management through the minimisation of waste and pollution. Production efficiency makes business sense as it foregoes the use of unnecessary materials and reduces energy use in producing goods and services. Lastly, humans benefit from the efficient and cleaner processes as it promotes judicious use of resources.
RECP reduces environmental impact and pollution by minimising the use of resources to lessen waste within the production system. These strategies, in effect, attempt to exemplify a preventive stance towards environmental management, choosing pollution prevention rather than end-of-pipe treatments. Measures include adoption of environmentally sound technologies, introduction of process modification and substitution of raw materials.
Box 7:1 RECP for low carbon development
RECP is a fitting approach to low carbon growth as it promotes preventive environmental strategies that increase efficiency and reduce impacts to humans and environment (UNIDO 2010b).
Box 7:2 National Cleaner Production Centres (NCPC)
To support mainstreaming of resource efficiency and cleaner production (RECP), the joint UNIDO UNEP RECP Programme has supported national capacity building through NCPCs and other qualified institutions since the 1990s. The Programme works through its 55 RECP network (RECPnet) members from close to 40 countries - with like minded institutions, the private sector (particularly SMEs), policymakers and other stakeholders at the national level to promote a more resource efficient and Green Economy. Programme activities focus on: network enhancement (expanding and building capacities); company applications of resource efficiency, waste and emission prevention and safe and responsible production; policy mainstreaming and enterprise finance, and on enhancing innovation to support the adaptation and adoption of Environmentally Sound Technologies and sustainable product developments. In 2013 at the 3rd Global RECP Conference, regional action plans were developed. In addition to continuing support for RECP and safer and responsible production, eco-innovation was highlighted as a growth area. RECPnet members are also active UNEP national partners in the areas such as energy efficiency, sustainable tourism, waste management and sustainable public procurement.

110page
Box 7:3 Understanding the prevention strategy discourse
Eco-efficiency, industrial ecology/industrial metabolism, pollution prevention, green productivity and waste minimisation are concepts related to RECP and are often used in the discussion around sustainable industrial production. At times these terms are used synonymously and interchangeably. (UNEP n.d.)
Figure 7:1 RECP innovation across Asia
Safer and Responsible Production
A related approach, Safer and Responsible Production, allows a company to ensure both the safety and health of workers in facilities that manufacture, store, handle or use hazardous substances, and the safety of communities around such facilities, as well as the prevention of releases of these substances into the environment’
Safer and responsible tools, guidelines, and management principles can be implemented at site and local level, and along the value chain, to establish an environmentally sound management system that reduces the risks to humans and pollution to the environment. Safer production is a step towards the prevention of industrial/ technological accidents by identifying risks and providing measures to control or manage them.
At the national level, safer production is promoted through policies supporting the development of chemical accident prevention and preparedness programmes. At the local-level safer production implies preparedness for emergencies in communities where hazardous installations are located. At the site-level, safer production usually includes the implementation of Process Safety Management (PSM). Responsible Production applies safer production principles at the site-level and along the value-chain.

111page
Part B
1 2 3 4 5 6 7 8 9 10 11 12 13 14
The Responsible Production approach includes practical guidance and tools to assist companies in:1. Identifying and understanding the hazards and risks related to the company products and operations.2. Identifying opportunities for reducing risk and costs.3. Identifying and engaging with business partners and communities to improve safety and preparedness
for accidents with chemical products.4. Promoting risk communication and product risk information along the value chain.5. Training workers and business partners in chemical safety.6. Improving procurement systems to include chemical safety management.7. Measuring and communicating performance in a transparent way.
Safer and responsible production is very important as accidents and irresponsible activity can lead to a range of adverse effects for business, the public and the environment. Enhancement requires engagement of multiple stakeholders such as the private sector, government and the community on awareness, prevention, preparedness and management of industrial risks (chemical accidents). National and local governments can play a key role in promoting safer and responsible production through policies and awareness raising and can support initiatives to build industry capacity, particularly within SMEs.
Box 7:4 : UNEP APELL Programme
Associated with safer and responsible production is the UNEP programme, Awareness and Preparedness for Emergencies at Local Level (APELL). The strategy of the APELL approach is to identify and create awareness of risks in an industrialised community to initiate measures for risk reduction and mitigation, and to develop coordinated preparedness between industry, local authorities and the local population. This is specifically of concern for the chemical and mining industries, and the transportation of hazardous substances, and is applicable to safe industrial estate management. APELL can be useful in any situation that requires joint planning by several parties to develop integrated and well understood response plans ready to be implemented should an accident occur, and is relevant to both national and local governments.
Design for sustainability (D4S)
Companies can also apply sustainable product targeted approaches such as Design for Sustainability (D4S), which targets product and service interventions. D4S is a globally recognised method for companies to improve profit margins, product quality, market opportunities, environmental performance and social benefits. By improving design and efficiencies in the products and services they produce and deliver, companies can achieve win-win solutions for shareholders, consumer, and the public. Using a lifecycle approach, D4S moves the boundaries of change beyond the production processes, to encompass solutions that can improve efficiencies, product quality and market opportunities (local and export) and at the same time improve environmental performance and offer additional value to customers (e.g. enhanced functionality).
Increasing regulation, energy and resource costs and enhanced environmental and social awareness are beginning to drive D4S in developing countries and transition economies. Goods which are exported increasingly need to consider environmental and social aspects, to ensure global competiveness. Whilst developing economies face challenges in integrating D4S into business development and product design practices, there is a unique potential to bypass traditional resource intensive and pollution generating development patterns. Such leapfrogging may also help to address other issues such as poverty and urbanisation. A number of projects such as Cleaner Production for Better Products (CP4BP) and Sustainable Product Innovation (SPIN), carried out in Vietnam, Cambodia and Lao PDR are already demonstrating how D4S can enable companies to decouple resource use from economic growth.
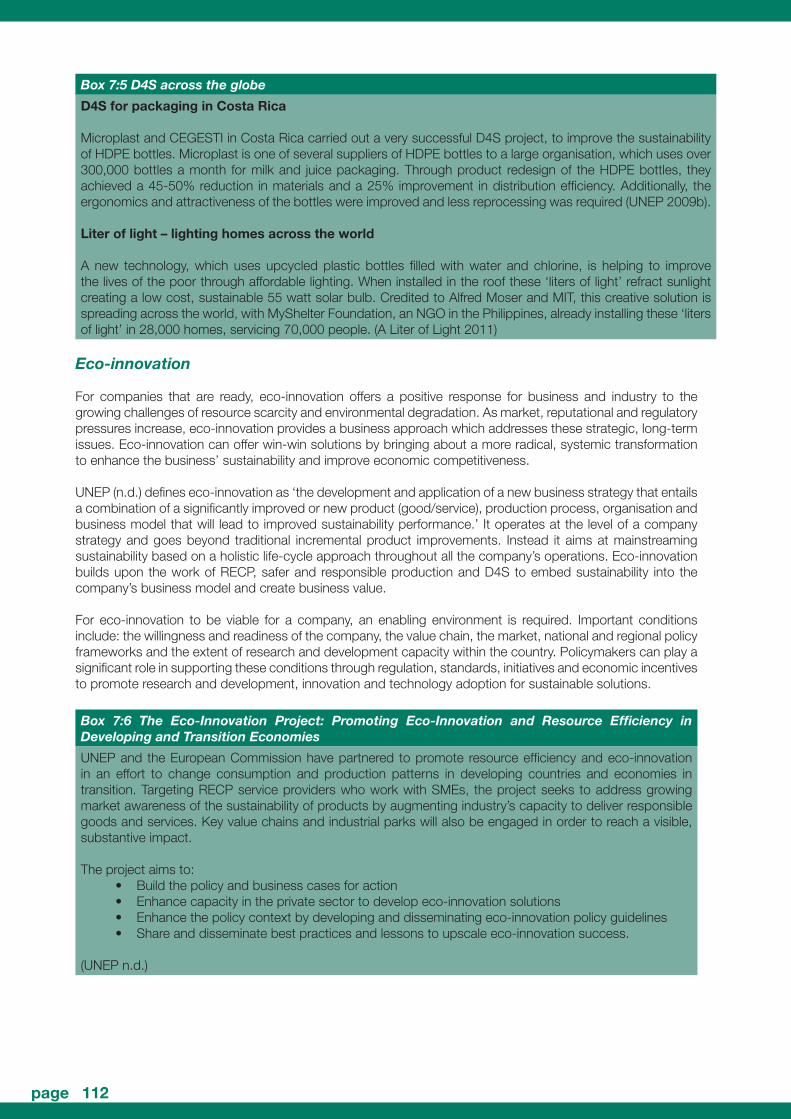
112page
Box 7:5 D4S across the globe
D4S for packaging in Costa Rica
Microplast and CEGESTI in Costa Rica carried out a very successful D4S project, to improve the sustainability of HDPE bottles. Microplast is one of several suppliers of HDPE bottles to a large organisation, which uses over 300,000 bottles a month for milk and juice packaging. Through product redesign of the HDPE bottles, they achieved a 45-50% reduction in materials and a 25% improvement in distribution efficiency. Additionally, the ergonomics and attractiveness of the bottles were improved and less reprocessing was required (UNEP 2009b).
Liter of light – lighting homes across the world
A new technology, which uses upcycled plastic bottles filled with water and chlorine, is helping to improve the lives of the poor through affordable lighting. When installed in the roof these ‘liters of light’ refract sunlight creating a low cost, sustainable 55 watt solar bulb. Credited to Alfred Moser and MIT, this creative solution is spreading across the world, with MyShelter Foundation, an NGO in the Philippines, already installing these ‘liters of light’ in 28,000 homes, servicing 70,000 people. (A Liter of Light 2011)
Eco-innovation
For companies that are ready, eco-innovation offers a positive response for business and industry to the growing challenges of resource scarcity and environmental degradation. As market, reputational and regulatory pressures increase, eco-innovation provides a business approach which addresses these strategic, long-term issues. Eco-innovation can offer win-win solutions by bringing about a more radical, systemic transformation to enhance the business’ sustainability and improve economic competitiveness.
UNEP (n.d.) defines eco-innovation as ‘the development and application of a new business strategy that entails a combination of a significantly improved or new product (good/service), production process, organisation and business model that will lead to improved sustainability performance.’ It operates at the level of a company strategy and goes beyond traditional incremental product improvements. Instead it aims at mainstreaming sustainability based on a holistic life-cycle approach throughout all the company’s operations. Eco-innovation builds upon the work of RECP, safer and responsible production and D4S to embed sustainability into the company’s business model and create business value.
For eco-innovation to be viable for a company, an enabling environment is required. Important conditions include: the willingness and readiness of the company, the value chain, the market, national and regional policy frameworks and the extent of research and development capacity within the country. Policymakers can play a significant role in supporting these conditions through regulation, standards, initiatives and economic incentives to promote research and development, innovation and technology adoption for sustainable solutions.
Box 7:6 The Eco-Innovation Project: Promoting Eco-Innovation and Resource Efficiency in Developing and Transition Economies
UNEP and the European Commission have partnered to promote resource efficiency and eco-innovation in an effort to change consumption and production patterns in developing countries and economies in transition. Targeting RECP service providers who work with SMEs, the project seeks to address growing market awareness of the sustainability of products by augmenting industry’s capacity to deliver responsible goods and services. Key value chains and industrial parks will also be engaged in order to reach a visible, substantive impact.
The project aims to:• Build the policy and business cases for action • Enhance capacity in the private sector to develop eco-innovation solutions • Enhance the policy context by developing and disseminating eco-innovation policy guidelines • Share and disseminate best practices and lessons to upscale eco-innovation success.
(UNEP n.d.)
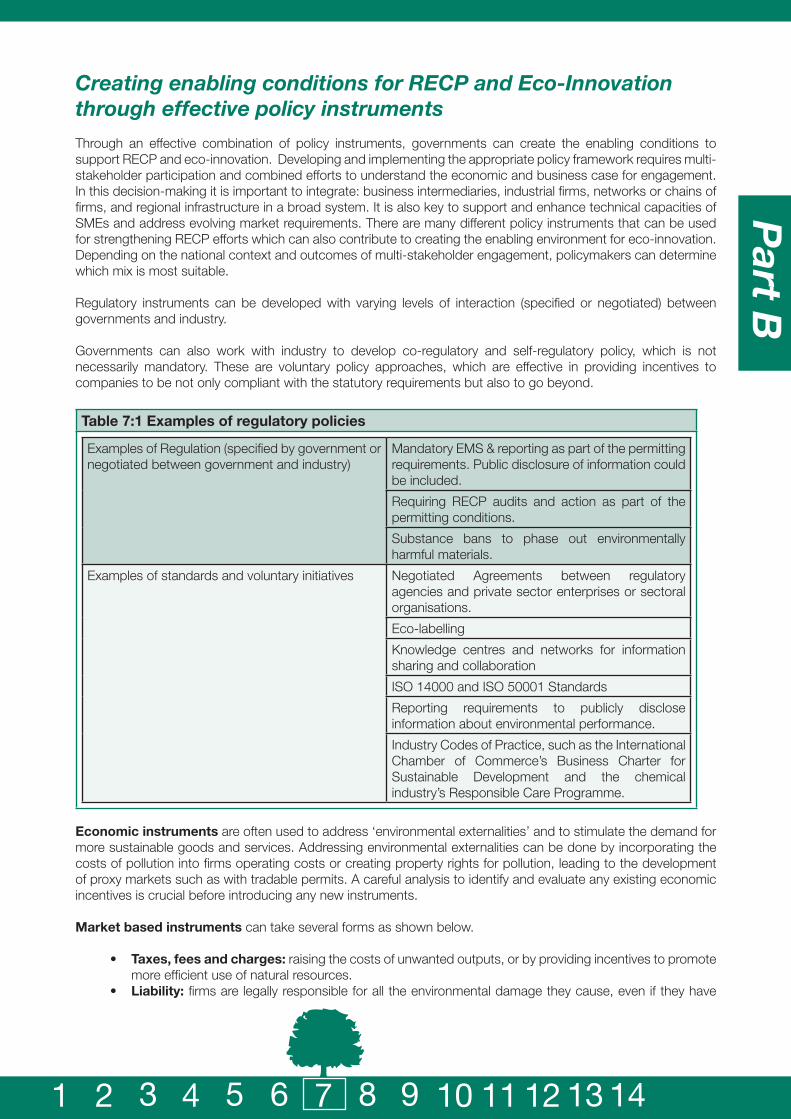
113page
Part B
1 2 3 4 5 6 7 8 9 10 11 12 13 14
Creating enabling conditions for RECP and Eco-Innovation through effective policy instruments
Through an effective combination of policy instruments, governments can create the enabling conditions to support RECP and eco-innovation. Developing and implementing the appropriate policy framework requires multi-stakeholder participation and combined efforts to understand the economic and business case for engagement. In this decision-making it is important to integrate: business intermediaries, industrial firms, networks or chains of firms, and regional infrastructure in a broad system. It is also key to support and enhance technical capacities of SMEs and address evolving market requirements. There are many different policy instruments that can be used for strengthening RECP efforts which can also contribute to creating the enabling environment for eco-innovation. Depending on the national context and outcomes of multi-stakeholder engagement, policymakers can determine which mix is most suitable.
Regulatory instruments can be developed with varying levels of interaction (specified or negotiated) between governments and industry.
Governments can also work with industry to develop co-regulatory and self-regulatory policy, which is not necessarily mandatory. These are voluntary policy approaches, which are effective in providing incentives to companies to be not only compliant with the statutory requirements but also to go beyond.
Table 7:1 Examples of regulatory policies
Examples of Regulation (specified by government or negotiated between government and industry)
Mandatory EMS & reporting as part of the permitting requirements. Public disclosure of information could be included.
Requiring RECP audits and action as part of the permitting conditions.
Substance bans to phase out environmentally harmful materials.
Examples of standards and voluntary initiatives Negotiated Agreements between regulatory agencies and private sector enterprises or sectoral organisations.
Eco-labelling
Knowledge centres and networks for information sharing and collaboration
ISO 14000 and ISO 50001 Standards
Reporting requirements to publicly disclose information about environmental performance.
Industry Codes of Practice, such as the International Chamber of Commerce’s Business Charter for Sustainable Development and the chemical industry’s Responsible Care Programme.
Economic instruments are often used to address ‘environmental externalities’ and to stimulate the demand for more sustainable goods and services. Addressing environmental externalities can be done by incorporating the costs of pollution into firms operating costs or creating property rights for pollution, leading to the development of proxy markets such as with tradable permits. A careful analysis to identify and evaluate any existing economic incentives is crucial before introducing any new instruments.
Market based instruments can take several forms as shown below.
• Taxes, fees and charges: raising the costs of unwanted outputs, or by providing incentives to promote more efficient use of natural resources.
• Liability: firms are legally responsible for all the environmental damage they cause, even if they have

114page
exercised due diligence and met their legal requirements. • Subsidies: such as low interest loans, direct grants or lower tax rates can be used to stimulate
preferential industries and practices and encourage innovation such as funding for green technologies• Schemes: such as Sustainable Public Procurement which can stimulate the market for sustainable
goods and services.
Informational strategies can be used to further promote RECP and eco-innovation. They can provide incentives, build capacity and encourage technology development and adoption. Some key informational strategies can include the development of networks for collaboration and information sharing, national programmes to improve technical capacity and skills requiring public disclosure of firm’s environmental performance, promoting effective training initiatives and showcasing best practice and demonstration projects to exhibit the economic and environmental benefits of RECP projects.
Supporting and building SME capacity is particularly important and should be a key consideration for policymakers. Providing training and support for RECP and eco-innovation can enhance SMEs ability to improve environmental performance and improve competitiveness of exportable products. Providing support for RECP, D4S and safer and responsible production in SMEs is necessary to address information and capacity needs. RECP service providers present a useful link between policymakers and industry, and are an excellent vehicle for building capacity in industry of all size, particularly SMEs.
Box 7:7 The Circular Economy Promotion Law: RECP policies in China
The Circular Economy Promotion Law passed in China in 2008 is an example of RECP policy in action. A Circular Economy (CE) puts emphasis on the most efficient use of resources and promotes reducing, reusing and recycling. It supports resource efficiency by integrating cleaner production and industrial ecology in a broader system including industrial firms, networks or chains of firms, eco-industrial parks and regional infrastructure.
The CE initiative targets resource efficiency at three levels:• At the individual firm level, the manager must seek much higher efficiency through Cleaner
Production (primarily reduce, reuse and recycle).• Reuse and recycle resources in industrial parks and clustered or chained industries, so that
resources will circulate fully in the local production system.• Integrate different production and consumption systems in a region so that resources circulate
among industries and urban systems.
The law was designed such that coordination and regulation is the responsibility of government across all levels and from a number of relevant departments.Source: (UNEP n.d.b)
© shutterstock

115page
Part B
1 2 3 4 5 6 7 8 9 10 11 12 13 14
Further reading 7
Responsible Production Handbook- A Framework for Chemical Hazard Management in Small and Medium Sized Enterprises UNEP’s Responsible Production approach is a systematic, continuous improvement approach to chemical safety along the value-chain. The Handbook provides a set of technical materials and tools to assist companies in understanding hazards, control chemical exposure, reduce accident risks, engage stakeholders and promote chemical stewardship.
United Nations Environment Programme 2010, Responsible Production Handbook- A Framework for Chemical Hazard Management in Small and Medium Sized Enterprises, UNEP, Paris.
Eco-innovation manual The Eco-Innovation Manual provides a stepwise guidance to support technical experts in assisting SMEs to implement eco-innovation in developing and emerging economies. The intended audience of this Manual is technical experts working in companies and organizations that provide professional services to guide and support manufacturing companies to improve their sustainability performance.
UNEP 2014, Eco-Innovation Manual: Working version for Pilot Application, United Nations Environment Programme, Paris
Promoting Resource Efficiency in Small & Medium Sized Enterprises (PRE-SME) Resource Kit is a user-friendly electronic tool accompanied by a hard-copy handbook, that provides SMEs and service providers from developing and transitional economies, with comprehensive learning on Resource Efficiency. It enables SMEs to achieve cleaner and resource efficient production organised by resource category (water, energy, chemicals, wastes and materials) with a clear methodological guidance, based on an in-depth survey and review of existing tools and techniques.
United Nations Environment Programme & United Nations Industrial Development Organization 2010, PRE-SME Resource Kit, UNEP & UNIDO.
Design for Sustainability: A Practical Approach for Developing Economies is a tool which outlines what Design for Sustainability (D4S) is and what might motivate companies to adopt it. The backbone is composed of the three practical, step-by-step approaches to execute a D4S project: needs assessment, redesign and benchmarking. Clear reference information and case studies that can support the project are also provided. (http://www.unep.fr/scp/publications/details.asp?id=DTI/0826/PA)
United Nations Environment Programme 2006, Design for Sustainability: A Practical Approach for Developing Economies, UNEP, Paris.


117page1 2 3 4 5 6 7 8 9 10 11 12 13 14
Part B
8 Sustainable Lifestyles
8.1 Supporting sustainable consumption choices 8.2 Choice editing and restrictions on advertising 8.3 Sustainable products and product information
N
S
EW

118page
Sustainable LifestylesKey Points
• A critical mass of sustainable consumers can influence the products available on the market and also make it easier to implement policies.
• However, although in theory consumers have freedom of choice, macro factors, production culture, as well as social and physical infrastructure have a much higher influence on consumption patterns.
• Sustainable consumption is not just about buying the more sustainable products. Refusing to consume when not necessary and engaging in alternative means of satisfying needs are also important.
• Some approaches to mainstreaming lifestyles include taking unsustainable options out of the market (choice editing) or restricting advertisement practices.
• Sustainable product design, switching from products to services and collaborative consumption are examples of approaches to sustainable lifestyles.
Transitioning towards SCP requires a shift towards more sustainable lifestyles. This requires tackling the complex arena of consumer behaviour. The shift cannot be left to individual actors, it requires government support through a broad package of policy tools. This chapter explores the role of government in supporting the transition towards sustainable lifestyles, considers what is required for encouraging sustainable behaviour and details policy options such as choice editing, advertising, promoting sustainable products and increasing product information.
8.1 Supporting sustainable consumption choicesThe Consumption Issue
There are some seven billion people in the world, all of them involved in various forms of consumption and production activities. While the industrialised countries have plateaued in their population growth, established at high levels of consumption, emerging economies, starting from a low consumption base, are on the rise, both in terms of numbers and in aspiration to join the ranks of consumerism being broadcast across western TV channels. Against a backdrop of social issues, natural resource limits and waste problems, the question of how people live and consume - the lifestyles they pursue - becomes central to sustainability.
Overconsumption as witnessed in North American, Europe and other industrialised countries is on the current trajectory of developing countries. The continuing increase in population in Asia, Africa and Latin America needs to sustain itself; in a fast growing economic environment, the level of material consumption per person also increases. For example, according to the African development Bank (AfDB 2011), there was a growth rate of 3.1% in the middle-class (defined as those consuming between 2 – 20 USD per day) in Africa, rising from 126 million people (27%) in 1980 to 350 million (34%) in 2010. For Asia, among non-industrialised economies, according to the Asian Development Bank (ADB 2010), in 2008 the middle-class had risen to 1.9 billion people, or 56% of the population, up from 21% in 1990. The ADB report showed that consumer spending in these non-industrialised Asian economies reached USD 4.3 trillion in annual expenditure. According to the authors, “Asia’s emerging consumers are likely to assume the traditional role of the US and European middle classes as global consumers.” Looking at growth rates among developing Asian economies over the last 20 years, the report extrapolated that at such rates, by 2030 developing Asian countries will comprise about 43% of worldwide consumption.
Consumption of home appliances and electronics, fashion pieces, housing sizes and unit space per occupant, car ownership are all on the rise. These are typically urban lifestyles, fortified by a high rate of rural-urban migration. The growing concentration in cities demands many things, including more transportation, more convenient foods (processed and packaged) and more energy. Relocating to urban areas for employment also means that some people maintain two houses – one which is the family house in the village and a second, usually a rented apartment in the city, for work – which is materially more demanding.
But these glowing consumption numbers by the consumer class do not speak to the large pockets of people living in poverty both in industrialised and industrialising economies. There is a growing dichotomy of social existence in the world: on the one hand material consumption is high, sometimes at superfluous levels, while
8

119page1 2 3 4 5 6 7 8 9 10 11 12 13 14
Part B
on the other hand, hard-knock poverty blights wide areas of cities with slums, and limits well-being opportunities in villages. In emerging economies, economic growth is lifting many people out of poverty, however a large number of people remain under the minimum sustenance line, and keep slipping behind. In industrialised economies the number of people falling out of poverty or going homeless is increasing, while the few at the top continue to see their wealth grow.
All of this is happening in a planetary context where there are finite resources to serve as natural capital to feed material consumerism. Future projections hold further demands on the environment, with serious potential consequences on human well-being. The International Energy Agency estimates that at the current rates of consumption, global primary energy demand will rise by 40% between 2007 and 2030. Oil demand will grow from 85 million barrels a day in 2008 to about 105 mb/d in 2030; demand for coal, a highly polluting source of energy, will grow to 7000 Mtce between 2007 and 2030; the world will need additional power-generation capacity of about 4800 GW of electricity by 2030. GHG emissions resulting from producing this energy will dwarf the IPCC-recommended cut in global CO2 emissions by 85% over 1990 levels for the world to stay below a 2 degrees Celsius increase in temperature by 2050. CO2 emissions today are almost 40% higher than they were in 1990 – the Kyoto base year – and since 2000 have been growing at over 3% per year. Global extraction of metal ores - iron ore, bauxite, copper and nickel - is now rising faster than world GDP. Similarly, cement production has more than doubled since 1990, outstripping growth of GDP by 70%.
The OECD projects that in cities, where most people will be living by 2030, there will be further deteriorations to urban air quality with severe health effects from exposure to particulate matter and ozone. Exposure of agricultural crops to ozone costs an estimated 2.8 billion Euros in 2008 (ibid); globally over 2 million people die prematurely each year due to indoor and outdoor pollution.
Ecological footprint measures show that the world reached its limits in 1986, and since then resource use continuously outstripped biocapacity. 2006 foot print data show that for every 1.8 hectares available per person globally, we are each using on average 2.6 hectares. We are living beyond our planetary means, operating 40% above budget. Although the contribution of industrialised nations is historically much more than that of emerging economies, the consequences will befall everyone, and unfortunately, affect poorer countries even more. The approach to sustainable lifestyles under the 10YFP involves practical solutions at a local level and macro frameworks to enshrine providing wellbeing in societal dynamics.
Box 8:1 A dichotomy of social existence: poverty and the consumer class in Asia
• Asia is still home to nearly half of the world’s absolute poor with per capita incomes of less than US$1.25 a day.
• By 2030, two-thirds of the global middle class is expected to live in Asia-Pacific.• 578 million or two-thirds of undernourished people in the world are in the Asia-Pacific region.• Obesity is rapidly becoming a problem in Asia. The number of obese people in China more than
doubled over the last 15 years.• Two-thirds of people who have no access to safe drinking water live in Asia.• The ground water reserves in Asia are depleting fast. The water table in many large cities, including
Bangkok, Beijing, Chennai, Manila and Shanghai, has dropped by up to 50 metres in recent decades.• Solid waste generation in Asia is expected to rise from 0.76 million tons per day in 2000 to 1.8 million
in 2025 despite recycling efforts.Source: (SWITCH-Asia 2011)
Activity Areas for Sustainable Lifestyles
Research combining consumption patterns and life-cycle analysis has identified key areas where consumption has the highest impact on the environment - activity domains and sectors that are responsible for high resource use and pollution and sometimes facilitate social issues. A broad category is consumer goods. This refers to the manufacture, use and disposal of lifestyle goods such as electronics and clothing. Key sectors of high impact include food, housing and transport. In these sectors, water, energy and waste can be considered as cross-cutting sectors affecting and affected by almost every lifestyle domain. By changing consumer behaviour in relation to the above, consumers can have a positive influence on the environment; these are the domains that define sustainable lifestyles.

120page
Although a priority order (from the sector with the highest impact to that with lowest) can be established for industrialised countries, developing countries would need further research, data and ecological footprint analysis to determine which sectors have the highest environmental and social impacts. There is however, strong evidence that the above areas are highly relevant in the developing world. Next, the examples of food, housing and transport are discussed.
Food and drinks
What we eat and drink, how we produce it, and how we dispose of it all have impacts on the environment and society. The impacts of food start right back at the production stage, including land distribution and use patterns (as well as social tension from lack of land titles or land grabbing), use of chemical fertilisers that also kill soil microbes and emissions of GHGs that cause climate change. Food manufacturing and distribution requires energy and packaging. Eating foods with high levels of sugar or fats tend to cause health problems, such as obesity and diabetes. At the post consumption phase, packaging becomes waste in need of processing. Throughout the cycle pesticides from agriculture can leach into water bodies and sometimes into drinking water, causing further health problems.
Figure 8:1 Food and the environment
Resource use:
Soil, land, water,energy,
Paper, plastic, glass,metals, energy
Transport fuels
Energy
Emission:
Agricultural productionand industrial processing
Packaging
Distribution
Consumption
Soil loss, pesticides,fertilisers, GHGemissions, manure,effluent, antibiotics
Packaging waste
GHG emissionsOther air emissions
Solid waste
Source: (EEA 2005)
Box 8:2 Water for life
Water is one of the fundamental supporters of life and a basic commodity for mankind. Today around 783 million people do not have access to safe drinking water and the number is projected to increase.
Changing dietary habits by reducing meat and dairy products can significantly reduce the water and energy footprint. Meat production requires a relatively high level of energy, cereal, and water input; and agriculture accounts for 70% of the global water withdrawal. The Water Footprint Network (2013) estimates the global average water footprint at 15,500 litres of water for every kilogramme (kg) of beef, 5,000 litres of water for a kg of cheese, 3,900 litres for a kg of chicken meat, and 1,300 litres of water per kg of barley.
Housing and Building Construction How we live, where we live and what is used to build our living spaces all have social and environmental effects. Building construction requires resources such as sand, wood and metals. Many of the materials require pre processing and some of them are sourced through mining. The mining process alone causes biodiversity loss, deforestation, emissions of GHGs and use of unhealthy chemicals. While living in houses, we use energy and dispose of waste. The way neighbourhoods are built impacts many parts of society, including the rate of crime, the opportunities for neighbours to create strong ties and form vibrant communities and the general well-being of inhabitants. Finally, at the end of a house’s life cycle, the building needs to be demolished, requiring energy and producing waste.
© Tim McKulka

121page1 2 3 4 5 6 7 8 9 10 11 12 13 14
Part B
Figure 8:2 Housing and the environment
Metals, minerals, wood, water, glass energy, etc.
Emission:
Constructing dwellings
Producing and processing goods
Living in the house
Maintenance
Land coverage, air, water
Air (GHG, pollutants, water, waste)
Air (GHG emissions, water, waste)
Air (GHG emissions, water, waste)
Demolition Waste (construction and demolition waste)
Energy
Metals, minerals, wood, water, glass energy, etc
Metals, minerals, wood, water, glass energy, etc
Land, metals, minerals,wood, glass, energy etc.
Resource use:
Source: (EEA 2005)
Transport and Mobility
The means of transportation we use to get from place to place, how often we travel, and the distance travelled all add up to have significant environmental impacts. Over the years, largely due to climate change discussions, there has been increasing understanding of the impact of transport and mobility on society and the environment. The production of motor vehicles is resource intensive; their use requires constant GHG-emitting fuels and the construction of roads; and at the end of life the scrapping of cars takes up space, requires energy and may release harmful substances with potential impacts on human health. Using natural resources and taxes to develop infrastructure for private car use takes funding away from other projects such as the development of social infrastructure, neighbourhood parks and alternatives to fossil fuels.
Figure 8:3 Transportation and the environment
Emission:
Infrastructure development
Vehicle production
Personal transport
Repairing and demolition
Air (GHG), land fragmentation
Air, water, waste
Air (GHG, air, pollutants)Solid waste, end-of-life vehicles
Land, minerals, metals, waste
Resource use:
Energy, minerals, metals, plastic, glass
Energy
Energy, minerals, metals, plastic, glass
Source: (EEA 2005)

122page
Supporting Sustainable Consumer Behaviour:
The Four-E approach
One of the emerging research-based approaches to assist governments in fostering sustainable consumer behaviour is the Four E’s (SDC 2010) This framework was developed by the UK Sustainable Development Research Network, to support the UK Government’s delivery on its SD strategy. The ‘E’s are an easily communicable theoretical framework which can guide the governments approach to “catalyse” change in attitudes and behaviours of people and communities.
To be able to catalyse change, government policy should be designed as a broad package of tools that when deployed, should have enough momentum to break old, unsustainable patterns of consumption and production. Behavioural change takes time, governments must be aware of this, and dedicate sufficient resources and sustained effort while following the four E’s to Enable, Encourage, Engage and Exemplify.
1. Enable access to pro-environmental choiceThis is to help make it easier for people to become sustainable, by providing them with the necessary tools such as education, skill and information. More sustainable alternatives should be available and easily accessible, as well as suitable infrastructure to make it easier to practice sustainable behaviour. Even well-intended people cannot live sustainably if there are no sustainable products and alternatives available.
2. Encourage peopleGovernment should provide signals that show a clear preference for sustainability and encourage behaviour change. These could include peer pressure, putting more taxes on unsustainable options and funding more sustainable practices.
3. Engage people in initiatives to help themselvesGovernment must take deliberate efforts to engage people in the process of change. For example by providing input to policy design, in expressing what is meaningful to them and what they care about in real life and in society, in understanding the advantages and disadvantages of certain behavioural patterns. Research shows that if people feel that solutions are top-down and they are not engaged, they become less active in realising the policy objectives.
4. Exemplify the desired changes within Government’s own policies and practicesGovernment should lead by example, showing what it means to be sustainable. Policies such as sustainable public procurement, prioritising sustainable development projects over unsustainable alternatives, training and capacity building on sustainable consumption for government employees provide examples of government leadership.
Examples of these are given in the section below, Framing sustainable consumption policy.
Figure 8:4 The four E approach to support sustainable consumer behaviour
Source: (SDC 2010)

123page1 2 3 4 5 6 7 8 9 10 11 12 13 14
Part B
Box 8:3 Skills for sustainable lifestyles
Competence for sustainable lifestyles can be supported (e.g. by education) through developing the following attitudes, knowledge and skills:
• Ability to define what one considers to be a good quality of life and to be able to identify the values upon which this is based.
• Realisation of the complexity and often controversial nature of sustainable consumption issues.• Insight into how individual lifestyle choices influence social, economic and environmental development.• Ability to acquire, assess and use information on the consequences of consumption, particularly on
the environment.• Knowledge of consumer rights and central consumer protection laws.• Basic knowledge of the market system and the role of business.• Knowledge of how the production processes are linked to the consumption system.• Basic knowledge of the interaction of pricing mechanisms with the consumer’s attitudes and behaviour.• Insight into the practicalities of both the supply and demand sides of production and consumption and
their outside-of-the- market relationships to community development.• Awareness of a commodity’s intangible and symbolic characteristics.• Ability to recognise, decode and reflect critically upon messages from the media and the market.• Knowledge of social networks responsible for shaping consumption patterns (peer pressure, status,
etc.).• Consciousness of civil society’s power to initiate alternative ways of thinking and acting.• Individual and collective understanding of consumer social responsibility in relation to corporate social
responsibility.• Ability to manage personal finances (budgeting, saving, investing, taxes and fees).• Ability to manage physical resources (effective control, maintenance, reuse and replacement).• Knowledge of conflict resolution in general and in particular in relation to consumer related situations
such as product safety, liability, compensation, redress and restitution.• Ability not only to envision alternative futures but also to create reasonable paths of action leading to
these.Source: (UNEP 2010)
© Lewis Akenji

124page
Table 8:1 Resources from the Marrakech Task force for sustainable lifestyles
Project Description Target group
Smart Start Up: Introducing sustainable lifestyles and sustainable entrepreneurship into African universities and colleges. An education program that combines sustainable lifestyles education with business development skills. Run by universities in Egypt, Kenya, Tanzania, Mozambique, and Mauritius.
EducatorsStudentsYoung entrepreneurs
Communicating Sustainability
Practical guidelines for government on how to produce effective public communications campaigns to facilitate change, based on various examples of national advertising campaigns.
National and local governments NGOSCommunicators
Creative Communities for SL
A collection of inspiring case studies for best-practice grassroots social innovations for sustainable urban living - people are coming together to form “creative communities” in order to solve everyday problems. Examples include responses to challenges in developing countries like India, China, Brazil, and South Africa.
Civil societyDesignersLocal governments
Global Survey on SL
Insights from over 20 countries around the globe from young adults (18-35) in urban areas on their current lifestyles, aspirations for the future and reactions to sustainable lifestyles.
PolicymakersBusinessCommunicatorsResearchers/expertsNGOs
Intercultural Sister Classrooms
Teaching methods combining life-cycle thinking with global citizenship; tested on schools in the USA, Mexico, Costa Rica and Brazil
EducatorsStudents
Literature review on Sustainable Lifestyles
Identified gaps in research which should provide deeper understanding on SL and how it can be achieved. Also made recommendations on further research to realise SL.
ExpertsNGOsPolicymakers
Making the Business Case for SL
A series of seven guidebooks covering business opportunities and new business models that are required for businesses to promote SL.
Business
Toolkit for Advertising and Marketing
Background information, case studies and simulation exercises to prompt students in marketing, advertising and communications to adopt green marketing and responsible communications practices in their future career. Can also be used by companies to train their staff on those issues.
BusinessCommunicatorsStudentsTeachers
YouthXchange Youth engagement projects across 22 countries worldwide. Youthxchange materials have been adapted using local languages, images and examples.
Youth workersLocal governmentNGOsStudentsEducators
Creative Gallery on Sustainability Communications
Hundreds of international advertisements on sustainability issues from public and corporate actors to show multiple ways to promote sustainable lifestyles and to provide inspiration for communicators around the world.
GovernmentsBusinessNGOsCommunicators
Source: (Adopted from Ministry of the Environment Sweden n.d.)

125page1 2 3 4 5 6 7 8 9 10 11 12 13 14
Part B
Beyond individual consumers
The banning of plastic shopping bags, campaigns for energy efficient light bulbs and recycling of household waste are some of the actions that have typified approaches to sustainable consumption in public awareness campaigns. There is however, evidence that such actions hardly achieve the objective of sustainable consumption. Studies of the so-called rebound effect demonstrate that relative sustainability gains in efficiency are often upset by increases in absolute levels of consumption. For example, although washing machines and television sets have become more efficient, savings per unit have meant that people buy even more - therefore absolute amount of consumption has increased, outstripping the efficiency gains. Sustainable consumption does not necessarily mean shopping for more sustainable alternatives; it sometimes means not shopping at all. Finding alternative ways of meeting needs is also a key component of sustainable consumption. Designing and implementing effective policies is likely to have wider and faster implications towards sustainability, than hard efforts to change individual actions. As the following section demonstrates, the consumer is not always king!
Understanding stakeholder salience: The Triple I model
The Triple I framework is used in describing and understanding factors that shape production and consumption and how much influence stakeholders have on the choices they make. It can be used to determine how much opportunity an individual has in choosing to become a sustainable consumer – consumption that has minimum negative environmental social and economic impacts.
Figure 8:5 The Triple I Model
Macro factors
Actor
ImpactsTriple I
InterestInfluence
Instruments
EnvironmentalSocial
Economic
EconomyGeography
DemographyTechnology etc
Source: (Akenji & Bengtsson 2010)
The Triple I’s refer to the interaction of interests, influences, and instruments of stakeholders in the production-consumption chain. To identify intervention points for sustainable consumption, the framework analyses stakeholders, including investors, manufacturers, distributors, retailers, waste managers and government, using the Triple I’s. This provides an understanding of the drivers of production or consumption by each stakeholder group, what influences their decisions in the system, and how power is wielded by them or upon them by other actors. By analysing these elements, it can highlight individual and institutional opportunities and indicate directions to facilitate a general shift towards more sustainable production and consumption.

126page
Box 8:4 The Triple I’s for assessing stakeholder salience in the value chain
I. Interests represent various stakes in production or consumption. • Who are the key actors involved in the design, manufacture, distribution, retail, use and
waste management of products?• What are their needs / expectations (e.g. housing needs for citizens, well-being of society for
governments, profits for producers)?• What are the drivers, patterns and trends of consumption or production?
II. Influence refers to the role of each actor, influence over others and the actor’s position and relative importance in the system. This identifies who the most influential actors are.
• What is the role of each actor in the system?• To what extent can each of these actors influence the design, manufacture, distribution,
retail, use and waste management of products? • How much influence does each actor have in the system?
III. Instruments are mechanisms of operation of each actor - what actors use to wield influence, institutional frameworks under which they operate and opportunities for sustainable change.
• What instruments does each actor use to influence other actors in the system (e.g. consumer boycotts, advertisements by producers, procurement guidelines by government)?
• What other institutional aspects are likely to influence the design, manufacture, distribution, retail, use and waste management of products (e.g. consumer organisations, industry awards, government and consumer agencies)?
By mapping the Triple I’s, a picture emerges of who the most powerful stakeholder is. Given that production and consumption take place within a broader societal context, results of the Triple I analysis are further placed within macro factors that affect consumption and production - such as technology, economy, demography and culture.
Results of such analysis often show that in the larger system, consumers have somewhat less influence than is often thought. For example, investors pre-determine what is produced, advertising has a strong influence on consumer decisions and government policies that subsidise unsustainable production make it more expensive for consumers to afford the more sustainable options.
This is also supported by research looking at everyday practices of households (theories of practice), as well as studies of how infrastructure affects household consumption. Everyday household consumptive activities such as bathing, travelling and eating constitute a set of social practices that cut across society (Shove 2006). Demand for household services like energy, water and waste management is structured by the utility companies, manufacturers and regulators involved in specifying technologies and systems, managing loads and modifying resource flows. The extent to which everyday household consumption behaviour can change is not only dependent on consumer attitude but also on highly interdependent socio-technical networks or systems of provision, the systems through which services or resources are produced, delivered, distributed and used. As such, a more effective framing of sustainable consumption policy is to look beyond just individual actions.
Framing sustainable consumption policy
Policies to encourage sustainable consumer behaviour must therefore look beyond just individual choices. They should address the system within which consumption takes place and seek to address the social and physical infrastructure that enables consumption. An analysis of literature on successful examples has determined three key pre-conditions to achieve sustainable consumption and production. These are: the right attitude by all stakeholders in the production-consumption system; a facilitating system and social infrastructure to translate those attitudes into concrete action; and sustainable infrastructure (Akenji 2012). (These three are sometimes referred to as the mindware, software and hardware of sustainable consumption.)
1. The right attitude by stakeholders
Stakeholders in this case goes beyond just consumers; it refers to all societal actors who have an influence on consumption and production – such as farmers, investors, manufacturers, suppliers, distributors, lawyers, small business owners, government agencies, consumers, waste collectors and recyclers. A target is for each of these stakeholders to have pro-sustainability attitudes and a willingness to engage in potential solutions.
Interdisciplinary research shows that attitudes are shaped by belief systems, personal values, social norms, knowledge, the physical environment as well as the legal environment. Examples of how to instil these positive attitudes is through formal school curriculum as well as public events, awareness-raising campaigns and

127page1 2 3 4 5 6 7 8 9 10 11 12 13 14
Part B
training programs for business leaders, community leaders, judges and politicians etc. By creating an environment where sustainability is a common aspiration, it becomes easier for consumers to engage in everyday sustainable lifestyles. An example of building the right attitude is by creating a positive future-oriented vision which people can identify with, as is the case with the China Dream, and then setting out to provide the tools for people to participate in realising that vision.
Box 8:5 The China Dream: reshaping consumerism in China
The China Dream is an initiative to reimagine prosperity and reshape consumerism in China. To catalyse sustainable habits in China’s emerging consuming class, related values are being embedded in new social norms of a “Harmonious & Happy Dream” (the literal Chinese translation). The initiative has two components: to shape social norms through both aspirational visuals of how Chinese would like to live; and to introduce local policies that guide sustainable consumer behaviour.
JUCCCE, an NGO facilitating the China Dream, has developed the approach which includes several steps. “Framing the Dream” by building coalitions that bring the storytelling power of marketing agencies together with cultural, sustainability, and lifestyle domain experts. A series of multistakeholder co-creation workshops help to visualise a better quality of life for Chinese and their children through “living more, not just having more”. This is complemented with a carefully curated visual lexicon with tweetable captions compellingly capturing the Dream.
Technical sustainability jargon is replaced with the vocabulary of personal prosperity and cultural identity that makes people feel good about themselves and being part of a community. In the China Dream, “sustainability” is replaced with “harmonious happy” and complemented with words such as “food safety” and “access to more public space”. Compelling stories of the China Dream are told and new norms are activated through the power of public champions, social media advocates, and archetypes of “heroes and villains”, soap opera storylines, corporate marketing campaigns, and other regionally-appropriate channels. Crucially, these activities are being entrenched through development of support policies for Dream consumer behaviour in the domains of food, transportation, energy, housing and more.
Source: (JUCCE 2013)
2. Facilitators and social infrastructure
Research shows that there is a gap between people’s attitudes and their actual behaviour. For example, in surveys consumers repeatedly express their preference for healthy, local products but in reality global brands that tend to be less sustainable sell better than their sustainable local alternatives. This could be for several reasons - including price or advertising. This is known as the attitude-behaviour gap. Social infrastructure is a critical determinant of consumer behaviour; Facilitators are the social infrastructure that help in translating positive attitudes to concrete action. They serve as incentives to encourage a particular pattern of behaviour, or place constraints to discourage unwanted outcomes. Following are key facilitators that policymakers may deploy towards sustainable consumption.
• Legal - such as laws and standards – e.g. prohibiting the sale of bottled water in a town where the quality of tap water is demonstrated to be safe for consumption. This would discourage commoditisation of water and use of scarce resources for bottling.
• Administrative – e.g. a difficult process for acquiring building permits for construction around wetlands, or a government agency that ensures that local farmers’ produce has priority points of sale in urbanising areas.
• Cultural – such as promoting traditional architecture that is less energy intensive and uses healthier materials.
• Market – such as preferential billing rates for households that use renewable energy sources.
Facilitators create an environment where sustainability options can develop. Examples include providing subsidies for production of more sustainable products, rejecting advertising that misleads children into consumerism and creating award systems that recognise beacons of sustainable lifestyles. Nudging consumers, as illustrated in the box below, has also proven to be effective.

128page
Box 8:6 Nudging people towards sustainable lifestyles
An example of a subtle facilitator is the use of “green nudges” to guide people towards sustainable behaviour. Recognising that there are usually obstacles to people adopting sustainable lifestyles, the behavioural sciences have developed the concept of nudging as a strategy to lead individuals to make choices in the collective interest, without being prescriptive or guilt-inducing at the behavioural level. Examples include the following, demonstrating different strategies at play:
• Using inertia to offer the most environmentally friendly option as the default choice. E.g. e-bills: in the USA, some banks, energy suppliers and telephone operators now send bills in electronic format by default. If clients want to receive them in hardcopy, they must specifically ask, and they will be charged for this service.
• Similarly, the city of Washington DC introduced a tax of 5 cents per plastic bag on January 1st, 2010. This measure probably contributed toward reducing the number of bags found in Potomac river by 66% between the annual cleaning operation of 2009 and the 2010 operation;
• Using people’s adherence to social norms. E.g. in an experiment on waste recycling in the town of LaVerne in California, every day for four weeks, a note was placed on the door of 120 homes informing the occupants of the number of their neighbours who participate in domestic waste recycling and the quantity of recycled material that that represents. The impact was immediate: the volume of recycled materials increased by 19%.
• A similar strategy is used when placing a note in the bathroom of a hotel indicating the percentage of clients who reused their towels instead of having them changed every day. In one finding, the result was that 44.1% of clients reused their towels, as against 35.1% when the arbitrarily chosen and deliberately high statistic (75%) was not communicated to the client;
• Providing feedback to people. E.g. a display unit connected to a ‘smart’ electricity meter installed in private homes to give consumers a better real-time feedback of their energy consumption and savings has been shown to lead to reductions in energy consumption.
Although, like awareness-raising, “green nudges” are not the most effective approach to sustainable lifestyles they are valuable motivational procedures when used alongside existing instruments.
Source: (Oullier & Sauneron. 2011)
3. Sustainable infrastructure
If a consumer is inclined to lead a sustainable lifestyle but there are no sustainable products, the consumer would have little other option but to consume unsustainably, or at best use the product responsibly - in a more sustainable manner. Infrastructure refers to the hardware for sustainable lifestyles. Such infrastructure should remove lock-ins. Providing a dense network of safe bicycle tracks and bicycle parking space in the city and prioritising bus lanes over private car use would make sustainable mobility the easier option. The appropriate infrastructure could also encourage and prioritise local community bonds over individualisation. For example, granting licences for operating farmers’ markets in city centres and on strategic transit spots that lie on the way between work and residential zones or providing tax incentives to local shops that host exchange or trading of used goods. Housing development for example should be planned as hubs that integrate social facilities, transportation options and communal utilities, thus requiring little resource intensity in their everyday use.
8.2 Choice editing and restrictions on advertisingWhat is Choice Editing?
Choice editing has been defined as “...shifting the field of choice for mainstream consumers: cutting out unnecessarily damaging products and getting real sustainable choices on the shelves” (U.K Sustainable Development Commission 2006).
It is a method of curtailing or even completely banning the availability of a consumer product or service which is considered harmful or undesirable. It is not a new concept; only the terminology is new to some. Choice editing has been practiced by governments for ages: examples include severe curbs and restrictions on availability of drugs and narcotic substances, firearms and the like.
There are different forms of choice editing:• Banning or restricting availability of products or service: a classic case is the “Ban the Bulb” initiative
of the Australian Government which called for replacement of all incandescent bulbs by CFLs and LEDs. Incandescent bulbs were not “harmful” per se, but less energy-efficient and the move should reduce GHG emissions by 4 million tonnes. Other similar measures include the phase-out of leaded

129page1 2 3 4 5 6 7 8 9 10 11 12 13 14
Part B
petrol and the ban on plastic carry bags, common to many countries in the world.• Choice editing on the basis of a component of a product: a typical example is the ban or restriction in
the use of paints which contain lead (commonly found in driers and pigments).• Choice editing on the basis of the manufacturing process: mercury cells in the manufacture of Caustic
Soda/Chlorine were phased out due to the potential hazards of mercury.• Politics and ideology may also dictate restriction or denial of choice • Choice editing can also be imposed on the basis of other factors, such as the supply chain: “blood
diamonds”, for example.
In fact there is really no limit to the number of reasons for editing consumer choice.
Depending on the nature of choice editing and the implementing body (government or private sector), choice editing can be applied in one go or in stages. For example, the government could simply ban a product – both its local manufacture and import. Alternatively, it could ensure reduction in production and/or consumption progressively- an example being the phasing out of ozone-depleting substances.
Role in Policy and Other Options:
When is choice editing used?
Choice editing is not the preferred method of channelling consumer demand with most commentators agreeing that within reason, the consumer must have full freedom of choice. Governments prefer to facilitate the provision of information to the consumer so that he/she can make an informed choice about what to buy. This has spawned a number of initiatives such as Ecolabelling, which provides guidance on the environmental friendliness or otherwise of many consumer products. Ecolabels are discussed further in the following section 8.3, Sustainable Products and Product Information.
Box 8:7 Labels
Private or cooperative initiatives have resulted in such labels as the Forest Stewardship Council or the Marine Stewardship Council labels, which attest to the environmental sustainability of products. Similarly, “social” labels such as Fairtrade attest to the fairness of the supply chain while the Kimberly Process certification relates to “blood diamonds”.
While the provision of information and persuasive measures can succeed to some extent, they often end up with information overload for the consumer, who is faced with a multiplicity of labels such as environmental labels, labels on animal welfare, human rights, workers rights, fair trade and so on, resulting in confusion (Lang 2007).
Deciding to Edit Choice: who decides?
Government: In a sense, choice editing was a feature of the Soviet-style “command” economies where not only the product, but also the quality, manufacturing quantity and distribution were decided by the state. Today, the state continues to play a pivotal role especially in matters concerning the impact of products and services on public health and safety. The state has the mandate to enforce choice editing and the mandate may extend down to municipal levels. The state’s influence on consumer choice is sometimes resented by special interest groups, as witnessed by the outcries in certain countries to legalise marijuana or to resist any forms of controls on firearms. Tools available to the state include a) legislation and b) fiscal measures such as taxation and subsidies. Other policy measures, such as preferential public procurement may serve to bring down prices and stimulate demand for sustainable products, but these cannot be termed ‘editing’.
Manufacturers: The manufacturing sector can also exercise choice editing. Increased awareness of Corporate Social and Environmental Responsibility has led to many manufacturers voluntarily dropping unsustainable or potentially harmful products from their portfolios and the “planned obsolescence”, which was widely practiced in the 1950s is no longer as widespread a practice as it used to be. The greatest change has been in terms of pay and working conditions of workers of sub-contractors, where the embarrassment of “sweatshop” working conditions has often forced the principal to rapidly enforce change.

130page
Retailers: Perhaps more than manufacturers, retailers play a major role in deciding consumer choice, especially in the more developed countries where supermarkets are the source of most consumer goods. Many of the world’s largest retailers such as Walmart have their own rating system which “penalises” unsustainable products, to the point where a product may not be found on retail shelves at all. More subtle measures could include differential discounting or denying premium shelf space to less sustainable products. The situation is vastly different in developing countries where “Mum and Pop” stores are the predominant retail outlets as their motivating drivers are very different (Maniates 2010).
Problem areas with choice editing:
Choice editing is often contentious, sometimes involving issues of morals or ethics. Civil libertarians and special interest groups often query the right of the state to interfere in freedom of choice and this can be carried to extremes. Such resistance could have political repercussions, which is why governments prefer less prescriptive methods, such as labelling programmes.
Choice editing at the retail level is practicable when implemented by giant retail chains such as Walmart and Home Depot, but impractical for a small retailer to implement on his own. Even with the larger retail chains, a degree of consumer suspicion persists: is a low “rating” by a supermarket chain really a way to squeeze extra margins from the vendor?
The consumer in a globalised world, particularly where internet access has permeated, finds it simple to bypass choice editing attempts. He/she can purchase from any number of virtual retailers who publicise their products on the internet – witness the number of “pharmacies” selling banned pharmaceutical substances from anonymous manufacturers across borders. When governments use taxation as a measure of choice editing, smuggling proliferates, such as with cigarettes. This not only defeats the purpose but deprives the state of revenue.
Restrictions in Advertising
The proverb “Build a better mousetrap and the world will beat a path to your door”, attributed to Ralph Waldo Emerson (1803-1882), has long fallen into disuse. It is now accepted that producing a better product is not enough. It has to be advertised and promoted heavily if it is to succeed in the marketplace.
Advertising fulfils several positive functions:
• It informs the consumer of a product – its attributes, benefits, advantages and availability.• It provides justification for the consumer to buy a product in preference to another generic equivalent
or another alternative product which meets the same needs.• It can act as a driver for competition and greater innovation.
But advertising is a two-edged sword and can also carry negative connotations: it may create a need when none exists, it may spur unnecessary and conspicuous consumption, it may create undesirable rifts between the socio-economic “haves” and the “have-nots” and it can assist larger manufacturers in driving out smaller ones who may not be able to afford the same level of media expenditure. It is these negative attributes which could call for some form of restriction in advertising.
Truth in advertising:
There is no requirement in principle for the advertiser to be entirely truthful in the advertising and examples of “stretching” the truth, semantic obfuscation and deliberate misinterpretation abound.
Box 8:8 The truth about orange drink
For exmple: A product, available in powder form, is widely publicised as an “Orange Drink” with the packaging as well as publicity material containing illustrations of the fruit. Inspection of the label reveals not a hint of natural orange; the product is 100% synthetic.
Consumers in developing countries are particularly susceptible to misleading advertisements. In some cases, standards are evolved – usually by an industry body or association – which are far removed from reality, allowing an advertiser to “legitimately” make claims which mislead the consumer. A typical example is the fuel-efficiency figure for automobiles, which are based on unrealistic driving conditions that very few consumers are likely to meet.

131page1 2 3 4 5 6 7 8 9 10 11 12 13 14
Part B
In its crudest form, misleading advertising contains un-truths which are difficult, if not impossible, for an individual consumer to disprove. A slightly more advanced form is making tall claims for products but with the advertiser’s identity concealed – web-based advertising and spam e-mailing are the usual vehicles. In yet more sophisticated cases, the advertiser claims to have received an award or certification to “world” standards, carefully concealing the fact that the awards can be bought for a small fee. This enables manufacturers to claim that their products are “environment-friendly” or “eco-products”.
Box 8:9 The truth about washing machines
For example: Washing machines are often advertised as being “environment friendly” based on just one attribute – energy efficiency in terms of watt-hours. Neither the water consumption nor the consumption of detergents is considered.
Misleading advertising can be found for any product or service but as consumers begin to pay greater heed to the environmental and social impact of their purchases, deception and obfuscation have entered the sustainability arena as well. Many products claim to be “environment-friendly” without any back-up or justification provided. A variation is the claim of being “environment friendly” based on just one attribute.
Restrictions on Advertising:
Most countries place some form of restriction on advertising. Certain goods and services are completely prohibited from being advertised (e.g. drugs and narcotics) while in other cases, advertisements must carry a statutory warning (e.g. cigarettes). Cross-country examination reveals that such prohibitory measures are generally taken on grounds of public health, safety and security. Increasingly, countries are also prohibiting advertisements aimed at children. In the USA, the Federal Trade Commission has played an exemplary role in protecting consumers from gross violations in an environment where advertisers have become masters in semantic obfuscation.
The advertising industry has long resisted the imposition of any external code of conduct and instead prefers self-regulation and a voluntary code. The International Chamber of Commerce has evolved a code and the resultant self-regulatory system has been adopted in 35 countries. In the EU, the European Advertising Standards Alliance fulfils the self-regulatory role. India has the Advertising Standards Council of India to monitor and enforce its own guidelines. The Chinese Responsible Marketing Code was endorsed by the Chinese advertising industry in April 2011.
In summation, if the intention is to channel consumer demand to more sustainable goods and services, neither choice editing nor restrictions on advertising – or even a combination of the two – will be sufficient as a stand-alone action. Accompanying these should be vibrant and well-conceived ecolabelling and consumer information and rating schemes, initiatives to increase public awareness, incentives and disincentives for consumers and manufacturers alike, all integrated into a holistic strategy led by governments but including all relevant stakeholders.
8.3 Sustainable Products and Product InformationAccess to sustainable products and reliable product information is critical in the transition towards sustainable lifestyles. ‘Products are the link between production and consumption, connecting consumers to complex supply chains that are becoming increasingly spread across the globe. The path towards SCP requires measuring and managing impacts from products based on their life cycle’ (UNEP 2013). Such product sustainability information identifies the critical areas for action, can increase producer accountability, encourage producers of lower performing products to improve and helps consumers make more informed decisions, driving the market for more sustainable products.
A ‘sustainable product’ should be economically, socially and environmentally sustainable. Social concerns of production such as labour conditions, minimum wage and child labour have received significant global attention in recent years and are relatively more well known. This section however, will predominantly focus on the environmental pillar of sustainable products and will discuss environmentally sustainable products, sustainable product information and reducing environmental impact through changing patterns of use.
© Peerayot Sidonrusmee

132page
What are sustainable products?
UNEP/ Wuppertal Institute Collaborating Centre on Sustainable Consumption and Production (UNEP 2010) defines a sustainable product as a ‘product that incorporates environmental and social factors and minimises its impact throughout the life cycle, throughout the supply chain and with respect to the socio-economic surroundings’. Another broad definition of a sustainable product identifies it as ‘an item or service that minimises its impact on the environment at each phase of its life cycle’ (NSW Government 2011). These definitions consider the triple bottom line of sustainable development and recognise the need for a lifecycle perspective to minimise environmental impact and improve resource efficiency. Figure 8.6 provides one possible framework for sustainable products, from the Lowell Center for Sustainable Production, highlighting not just the environmental component, but the requirements for overall sustainability.
Figure 8:6 Lowell Center framework for sustainable products
Source: (Edwards 2009)
Product sustainability must consider the complete lifecycle and value chain of a product. In an increasingly global world, products are often produced across numerous continents and pass through many stakeholders across the value chain. In designing and assessing products it is critical that the life cycle approach be taken, ensuing that burden shifting does not take place and that the overall outcome is reduced environmental impact. Chapter 2.2 provides more information on Life Cycle Thinking and Life Cycle Assessment.
Reducing the environmental impact and improving the sustainability of products is a challenging endeavor which cuts across industry, academia, government and the greater community. It will generally engage many of the strategies discussed in Chapter 7, including techniques such as eco-innovation, cleaner production, resource efficiency, design for sustainability, eco-design and life cycle and value chain management. Product sustainability information
Product sustainability information provides an important link between consumption and production and can play a key role in the transition towards SCP. Product sustainability information systems make the sustainability information about the product, service or facility available to different users. This information can take many forms including labels or logos, written claims or declarations or even corporate reporting. It can be mandatory or voluntary, single attribute or life-cycle based, apply to single sector or multiple sectors and have varying degrees of independence. Product sustainability information may provide information only or can be a relative rating or leadership ranking (UNEP 2013). This information can be used by governments in developing, measuring and monitoring sustainability policies. Businesses can use the information to manage supply chains and adopt best practices while final consumers, both public and individual, can base their purchasing choices on such information.
Product sustainability information can take many different forms and continues to emerge from different countries, sectors and organisations. Some forms of sustainability information may include:
• Ecolabels, further elaborated below.• Corporate Social Responsibility (CSR) reporting (e.g. Global Reporting Index)

133page1 2 3 4 5 6 7 8 9 10 11 12 13 14
Part B
• Industry roundtables & initiatives (e.g. Sustainable Apparel Coalition Higg Index 1.0)• Sustainable finance programs (e.g. Equator Principles from the IFC)• Sustainable information platforms (e.g. websites such as Goodguide)
Box 8:10 Ecolabels
One of the more well known product sustainability information systems is ecolabelling. ‘Typically appearing on the product, ecolabels are voluntary, participatory, market-based and transparent economic tools that aim to decrease environmental impacts and improve resource efficiency of products while enabling consumers to make informed decisions based on products’ environmental credentials’ (UNEP 2013). Ecolabel programs can offer the opportunity to tackle social and environmental challenges across the supply chain, while also supporting multiple areas of public policy such as climate change, energy and water efficiency and waste management.
The information communicated by ecolabels should be accurate and verifiable. The Global Ecolabelling Network (2013) states that ‘in contrast to “green” symbols, or claim statements developed by manufacturers and service providers, the most credible labels are based on life cycle considerations; they are awarded by an impartial third-party in relation to certain products or services that are independently determined to meet transparent environmental leadership criteria.’ There are several different types of labels as recognised by ISO described below.
Voluntary Environmental Performance Labelling -- ISO Definitions
Label Definition
TYPE I Environmental LabelsISO 14024
A voluntary, multiple-criteria based, third party program that awards a license that authorises the use of environmental labels on products indicating overall environmental preferability of a product within a particular product category based on life cycle considerations.
TYPE II Self Declared Environmental LabelsISO 14021
Informative environmental self-declaration claims.
TYPE III Environmental DeclarationsISO 14025
Voluntary programs that provide quantified environmental data of a product, under pre-set categories of parameters set by a qualified third party and based on life cycle assessment, and verified by that or another qualified third party. For example Environmental Product Declarations.
Testing against such criteria makes a product certified by an eco-label such as the European Union Ecolabel Flower (Type I), EcoMark of Japan (Type II), Green Seal of the USA (Type I) and the ABNT Ecolabel (Green Label) of Brazil (Type I). In recent years, global ecolabel entities are working hard to develop multilateral accreditation of national ecolabels to reduce duplicating ecolabelling work of individual economies.
Source: (GEN 2013)
Ecolabels aim to provide a market advantage for products and service. They encourage demand for and supply of environmentally preferable products and services. By encouraging consumers to preference these more sustainable products, ecolabels aim to displace less environmentally friendly products from the market, or force them to improve their environmental performance to regain market share. UNEP (2013) notes that the environmental benefits begin to accumulate only when the market forces begin to act, and significant purchasing activity moves toward those environmentally preferable products. Simply establishing an ecolabelling program does not reduce environmental stress, it is necessary for the purchasing practices within the market to also change.
Governments can play a key role in introducing and establishing successful ecolabelling programs. UNEP studies (2013) have found that ecolabels operate best where there is sufficient regulatory and non-regulatory pressure for environmental improvement. Factors which can positively influence the success of such a program include

134page
government policy, consumer awareness, institutional infrastructure, a culture of transparency, adequate quality controls, market trust and business maturity. Governments also have the opportunity to drive and support ecolabelling programs through well thought out sustainable public procurement strategies, which can correspond to a significant percentage of national purchasing (further discussed in Chapter 10). By showing that the government prioritises green products, consumers may be encouraged to adopt the same attitude. Due to the complexity of developing successful ecolabel programs, the process can be lengthy, difficult and costly and often relies on government funding during establishment.
Box 8:11 Ecolabels in developing countries
Successful domestic and regional ecolabelling programs are emerging in many developing countries across the world. Developing countries often face a number of additional challenge such as having a higher percentage of SMEs, lax regulatory frameworks and weak non regulatory pressures. Despite lacking a number of conditions generally considered necessary for successful ecolabel programs, a number of developing countries have started putting robust ecolabel programs in place, as part of greater environmental strategies. Such programs are helping to address national sustainable development strategies and environmental priorities such as climate change, while also increasing the international competitiveness of their countries products. Studies have found that voluntary ecolabel programs in developing countries can improve compliance with statutory requirements, acting as a supporting policy to improve environmental performance.
Whether it be ecolabels or some other form of product sustainability information, three key elements should be considered when developing principles and building a system; quantification, assessment and communication. Successful ecolabel programs require multistakeholder engagement throughout the process. A scientific foundation, such as life cycle based thinking can ensure a credible and comparable assessment process. Lastly a strong focus on capacity building and awareness raising is needed for program success. Ecolabel rollouts needs to be supported with a comprehensive dissemination of information, to both consumers as well as suppliers to drive demand and encourage other companies to join.
Sustainable use of products
Opportunities exist to reduce the environmental impact of existing products by changing the way in which they are used. Two such opportunities which are gaining momentum are through product service system (PSS) and the growing field of collaborative consumption.
In relation to sustainable product design, PSS is an approach that has the potential to lessen consumption or consumerism. With PSS, markets are created for utilities as opposed to products. The premise behind this shift is that consumers seek the service of a product and not the product itself. Selling products tends to consume more material and energy resources through its production, maintenance and the number of units sold; whereas, utilities provide a service where a few own and maintain a product that will be used to serve clients. Essentially, PSS comprises of a system of products and services that serve a particular network, and has the potential of lessening the impact of a product and service throughout its lifecycle.
The increasing shared transportation systems across the globe, such as carshare and bikeshare programs are an excellent example of successful PSS. Car share programs now exist in over 1,100 cities, from 26 countries across the world (Shaheen & Cohen 2012). Bikeshare programs exist in 500 cities, across 49 countries, with an estimated global fleet over over 500,000 bicycles (Earth Policy Institute 2013). These programs have undoubtedly resulted in significant reductions in the number of new bicycles and car purchased by their clients, reducing environmental stress from consumption. While this concept of PSS is not new, more innovations will be needed to expand the impact of PSS in businesses. In PSS, consumers’ choice is driven by both environmental and economic interests, and consumer demands are competitively satisfied in a more environmentally sustainable manner.
A concept related to PSS is collaborative consumption (CC) which can be likened to old market behaviours of bartering, sharing, lending and swapping, but is done through network technologies. ‘Collaborative Consumption is disrupting outdated modes of business and reinventing not just what we consume but how we consume’ (Collaborative Consumption Hub n.d.). The acceptance of this behaviour by consumers is driven by a number of factors and governed by a set of principles, detailed in the figure below. Examples of growing CC trends such as AirBnB (an online platform for sharing accommodation across 34,000 cities around the globe) and Zipcar (a global carsharing program operating in over 50 cities across North America, the UK and Spain) provide significant scope for reduced consumption.

135page1 2 3 4 5 6 7 8 9 10 11 12 13 14
Part B
Figure 8:7 Drivers, principles and systems of collaborative consumption
Source: (Collaborative Consumption Hub n.d.)
In light of lifecycle thinking and triple bottom line conditions at the local level, policy opportunities exist in each phase of the product or service and in creating an enabling environment for the promotion of sustainable products, product sustainability information and improved use of products.

136page
Case Study: The European Union Ecolabel
In 1978 Germany introduced “Blue Angel,” the first national ecolabelling scheme in the world, as a means of informing consumers of the environmental friendly aspects of products. National schemes around the world followed. By 1987 the European Union (EU) introduced the idea of a supranational ecolabel during the first European Year for the Environment. In 1992 the regulation on the EU Ecolabel entered into force.
The EU Ecolabel, also called the EU-Flower for its shape, is a voluntary, market-based tool that encourages businesses to produce - and consumers to purchase - products with lower environmental impacts. While in 1992 the EU Ecolabel was more of a stand-alone instrument in the field of product-related environmental policy and promotion of sustainable consumption patterns, the innovative and multi-dimensional character of ecolabelling as a policy instrument made the EU Ecolabel a catalyst for several important policies on climate change, energy efficiency, health, hazardous substances, use of natural resources, waste, recycling and eco-design. Today the EU-Flower has been awarded to more than 22,000 products in 22 product groups. Small and medium-sized enterprises from developing countries pay reduced application and licence fees.
A survey of over 26,500 randomly selected citizens conducted in April 2009 found that 55 per cent of EU citizens claimed that, when buying or using products, they were generally fully aware or knew about the most significant impacts of these products on the environment. Approximately half of EU citizens said that ecolabelling played an important role in their purchasing decisions (Gallup Organisation, 2009).Source: (UNEP 2012)

137page1 2 3 4 5 6 7 8 9 10 11 12 13 14
Part B
Further Reading 8
Task Force on Sustainable Lifestyles is the final report of the Marrakech Task Force on Sustainable Lifestyles. It presents lessons from projects around the world aimed at promoting sustainable lifestyles. It also highlights resources that stakeholders will find useful in designing and implementing sustainable consumption projects.
Marrakesh Process Secretariat (United Nations Environment Programme and United Nations Department of Economic and Social Affairs) 2010, Paving the Way to Sustainable Consumption and Production – Background paper for the Commission on Sustainable Development, Eighteenth Session, CSD18/2010/BP4.
Youthxchange.net is an online platform designed to help trainers and individuals to understand and communicate on sustainable lifestyles. There are the over 130 examples of organisations, innovative ideas, funny stories and motivated people active in making day to day life more sustainable.
http://www.youthxchange.net/main/home.asp
Consumer Scapegoatism and Limits to Green Consumerism, commissioned as a framing paper for the launch event of the Global Research Forum on Sustainable Consumption and Production, this paper examines some of the easy misconceptions about sustainable consumption. It analyses some of the main challenges of achieving sustainable consumption by focusing only on individual consumer behaviour, and makes recommendations for policymakers to develop more effective ways of mainstreaming sustainable consumption.
Akenji, L 2012, ‘Consumer Scapegoatism and Limits to Green Consumerism’, Proceedings of the Global Research Forum on Sustainable Consumption and Production Workshop. Rio de Janeiro, Available from: < http://grfscp.files.wordpress.com/2012/05/grf-2012-rio-akenji.pdf>. [12 September 2012].
Redefining Ecolabels to improve sustainability and trade in developing countries provides an excellent discussion on product sustainability information and ecolabels, and provides lessons learned and case studies from a UNEP project considering ecolabels as an increased opportunity for trade for developing countries. It provides an interesting discussion on the role of eco labels in global trade and the possible opportunities and barriers that people perceive.
United Nations Environment Programme 2013, Redefining EcoLabels to improve sustainability and trade in developing countries, UNEP, Paris.


139page1 2 3 4 5 6 7 8 9 10 11 12 13 14
Part B
9 Strategic Investments Towards Resource Efficient Cities
N
S
EW

140page
Strategic Investments Towards Resource Efficient Cities
Key Points• The world is becoming increasingly urbanised, with most notable
changes occurring in developing countries. • Urban development needs to address uncertainties and vulnerabilities
such as climate change, to develop resilient cities. • A holistic view, which considers all resource flows within a city, helps
in developing sustainable, resource-efficient cities. • Key opportunities for sustainable urban development relate to
buildings and construction, urban transport, water and waste management.
• Sustainable infrastructure decisions today, can lock cities into a low-carbon, resource-efficient future.
Home to over half of the world’s population, with this percentage set to rise, cities offer an opportunity for significant gains in global sustainability. Rapid urbanisation, particularly in developing countries presents a number of economic, social and environmental challenges. Cities in developing countries face the triple challenge of providing basic services to the urban poor and, contemporarily, reducing resource consumption in weathly areas and planning infrastructure and management systems for the growing population, all within the same urban context. Cities can offer a gateway for a sustainable future. This chapter considers the importance of sustainable urban form, the challenges and opportunities from rapid urbanisation and focuses on the specific opportunities offered by sustainable buildings, transport, water and waste management.
Sustainable cities
Why is urbanisation important?
Urbanisation is a global phenomenon. In 1800, only 8 per cent of humanity lived in cities. Today the number exceeds 50 per cent and UN projections estimate that by 2050 cities will account for as much as 70 per cent of the world’s population. Cities are widely recognised as the aggregate of convenience because they provide economies of scale, serve as engines of economic growth and social progress, and promise employment, social welfare and dignified living. They can guarantee better security and solidarity, support improved lifestyles, and foster education, culture, leisure and pleasure.
Cities are known to be fertile ground for the production of wealth; according to McKinsey Global Institute (2011), today there are 600 urban centres that generate about 60 per cent of the global Gross Domestic Product (GDP). Urbanisation has allowed many countries to achieve sustained economic growth and rapid social development. Densely populated cities provide the economies of scale that can make them more productive and help them create more livelihood opportunities. Well planned cities can provide an ideal platform for the distribution of wealth, especially among the section of society for whom the basic needs and rights remain elusive.
What are the present urbanisation challenges?
Developing countries across the world are experiencing unprecedented rates of rapid urbanisation. In these areas birth rates are often high and there is mass exodus of rural population hoping to escape hunger, poverty and insecurity. Cities in the developing world, at the same time, are becoming concentrations of people, economic growth, development and poverty.
9
© Kibae Park

141page1 2 3 4 5 6 7 8 9 10 11 12 13 14
Part B
Global population continues to grow and is becoming increasingly urban. While the world population quadrupled in the 20th Century, the urban population increased by 16 times during the same period of time. According to the Worldwatch Institute (2012), developing countries are likely to add approximately 2.45 billion people to their cities by 2050, while the industrial world is due to add just 170 million. These forecasts predict the sprouting of a new city of more than a million inhabitants every week over the next few decades!
Figure 9:1 Rural and Urban population by major regions, 1950, 2011 and 2050 (billions)
Source: (UNDESA 2013)
The onslaught of people in these urban centres puts immense pressure on existing infrastructure and systems, such as transport, energy, water, healthcare, and security. Cities occupy 3 per cent of the planet’s land surface, but use 75 per cent of resources, far exceeding the earth’s capacity to regenerate itself and absorb the waste generated (UNESCAP, UN ECLAC & UDL EI CU 2011). Cities account for more than two-thirds of all energy used and greenhouse gas emissions, and are particularly vulnerable to the increasing effects of climate change and natural disasters. Cities must adapt and grow to accommodate the unprecedented increase in urban population which, along with unsustainable consumption patterns, has led to very high growth in resource use and waste generation, and degradation of the planet’s natural environment.
Transforming urban challenges into opportunities
Cities differ in their initial carbon endowments due to climate, population and urban form, transport and built infrastructure, and economic structure. The main role of cities is to provide economic opportunities and better quality of life to its citizens. Cities that opt for low carbon transformation are also likely to experience economic and social gain as they will maximise low-carbon energy sources, enhance efficiency in delivering urban services and thus become more efficient, competitive, liveable and sustainable. There can be a strong alignment between low-carbon growth and sustainable urban development objectives, as outlined in Table 9.1.
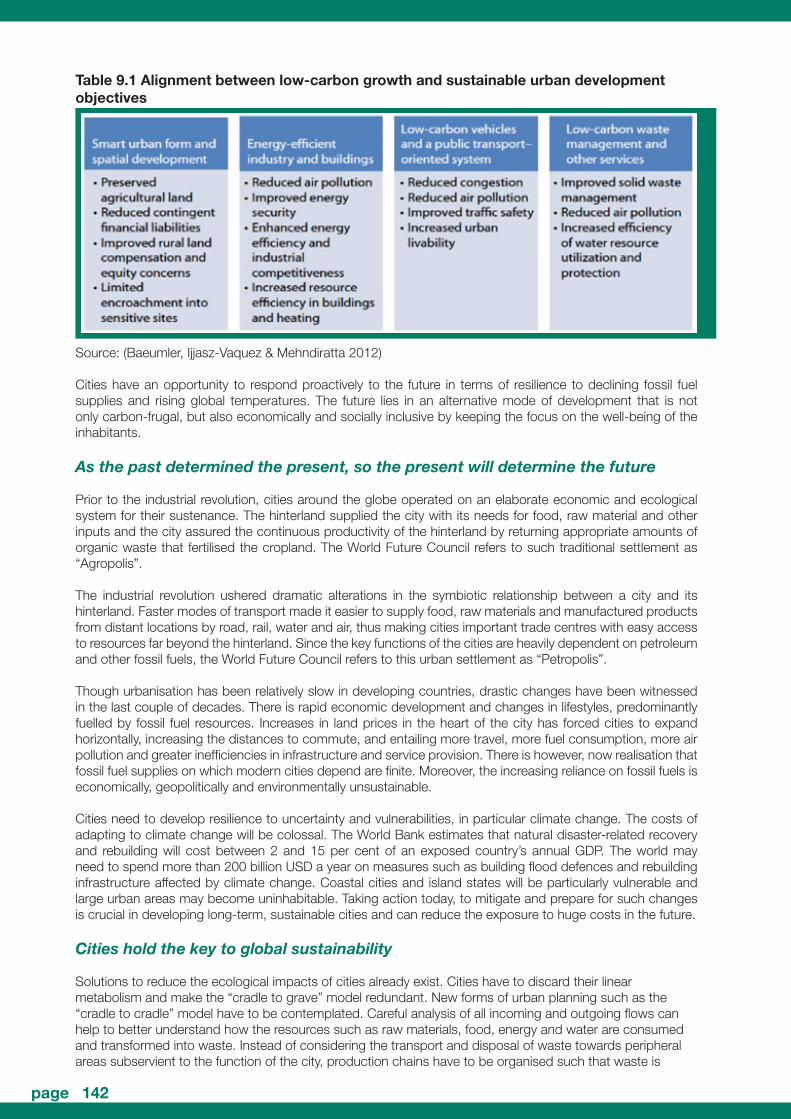
142page
Table 9.1 Alignment between low-carbon growth and sustainable urban development objectives
Source: (Baeumler, Ijjasz-Vaquez & Mehndiratta 2012)
Cities have an opportunity to respond proactively to the future in terms of resilience to declining fossil fuel supplies and rising global temperatures. The future lies in an alternative mode of development that is not only carbon-frugal, but also economically and socially inclusive by keeping the focus on the well-being of the inhabitants.
As the past determined the present, so the present will determine the future
Prior to the industrial revolution, cities around the globe operated on an elaborate economic and ecological system for their sustenance. The hinterland supplied the city with its needs for food, raw material and other inputs and the city assured the continuous productivity of the hinterland by returning appropriate amounts of organic waste that fertilised the cropland. The World Future Council refers to such traditional settlement as “Agropolis”.
The industrial revolution ushered dramatic alterations in the symbiotic relationship between a city and its hinterland. Faster modes of transport made it easier to supply food, raw materials and manufactured products from distant locations by road, rail, water and air, thus making cities important trade centres with easy access to resources far beyond the hinterland. Since the key functions of the cities are heavily dependent on petroleum and other fossil fuels, the World Future Council refers to this urban settlement as “Petropolis”.
Though urbanisation has been relatively slow in developing countries, drastic changes have been witnessed in the last couple of decades. There is rapid economic development and changes in lifestyles, predominantly fuelled by fossil fuel resources. Increases in land prices in the heart of the city has forced cities to expand horizontally, increasing the distances to commute, and entailing more travel, more fuel consumption, more air pollution and greater inefficiencies in infrastructure and service provision. There is however, now realisation that fossil fuel supplies on which modern cities depend are finite. Moreover, the increasing reliance on fossil fuels is economically, geopolitically and environmentally unsustainable.
Cities need to develop resilience to uncertainty and vulnerabilities, in particular climate change. The costs of adapting to climate change will be colossal. The World Bank estimates that natural disaster-related recovery and rebuilding will cost between 2 and 15 per cent of an exposed country’s annual GDP. The world may need to spend more than 200 billion USD a year on measures such as building flood defences and rebuilding infrastructure affected by climate change. Coastal cities and island states will be particularly vulnerable and large urban areas may become uninhabitable. Taking action today, to mitigate and prepare for such changes is crucial in developing long-term, sustainable cities and can reduce the exposure to huge costs in the future.
Cities hold the key to global sustainability
Solutions to reduce the ecological impacts of cities already exist. Cities have to discard their linear metabolism and make the “cradle to grave” model redundant. New forms of urban planning such as the “cradle to cradle” model have to be contemplated. Careful analysis of all incoming and outgoing flows can help to better understand how the resources such as raw materials, food, energy and water are consumed and transformed into waste. Instead of considering the transport and disposal of waste towards peripheral areas subservient to the function of the city, production chains have to be organised such that waste is

143page1 2 3 4 5 6 7 8 9 10 11 12 13 14
Part B
perceived as a resource that can be recycled, upgraded and transformed within an interconnected network into new products.
A key component of the sustainable city will be the ‘circular metabolism’ which discards the “take-make-dispose” thinking and follows the biomimetic approach, reflecting the notion that in nature all of the interdependencies feed into and benefit from one another (Girardet & Mendonca 2009). Nature’s best ideas can be studied, then imitated in designs and processes to solve urban problems. Drastic changes have to be made in the urban metabolism in order to reduce the pressure on natural resources, minimise the impact on the environment and provide better value to the society in the form of higher economic benefits, employment opportunities, delivery of goods and services, and improved quality of life.
Figure 9:2 Cities with linear metabolism versus cities with circular metabolism
Source: (Girardet & Mendonça 2009)
Technlogical innovations for radical resource productivity will undoubtedly be a catalyst for change. In order to avoid potential rebound effects, smart actions towards resource efficiency should be backed up by integrated instruments encompassing fiscal, technology as well as behavioural changes in consumers. Large scale deployment of proven low-carbon technologies will result in several-fold improvement in the resource efficiency of buildings, factories, transporation and electricity generation, transmission and distribution systems. Smart development initiatives will attract more investments in new technologies and create green jobs. Innovations in the fields of information technology and digital networks are contributing to improved urban connectivity and smart city solutions. For example, the difficulties faced by the electric utilities in expanding grid infrastructure and coping with the increasing demand during peak periods is being addressed through the introduction of smart grids, virtual power plants, distributed generation and real-time electricity pricing. Similarly, a connected city is today capable of communicating with citizens, monitoring the urban traffic, managing vehicle fleets, reducing congestion and enhancing carbon-free travel.
Box 9:1 Solutions that can put cities into the path of sustainability
As suggested by William McDounough, examples of solutions for cities to become sustainable include:• Buildings that, like trees, produce more energy than they consume and purify their own waste
water.• Factories that produce effluents that are drinking water.• Products that, when their useful life is over do not become useless waste but can be tossed on
the ground to decompose and become food for plants and animals and nutrients for the soil; or alternatively, that can return to the industrial cycle as high quality raw materials for new products.
• Billions of dollars worth of extra materials for our use each year.• Transportation which improves the quality of life while delivering goods and services.• A world of abundance, not one of limits, pollution and waste.
Source: (Webster & Johnson 2010)

144page
Sector-specific approaches
Infrastructure serves as the backbone of urban development. Lack of infrastructure can have direct and immediate impacts on urban economic growth and prosperity. Multilateral Development Banks are increasingly aware that making the right investments now can lock in more environmentally sound, low-carbon and climate-resilient infrastructure that will be around for many decades to come. They committed over USD 9.5 billion in 2011 for better land-use planning, clean energy supply, energy efficient buildings, public and non-motorised transport, improved water supply, waste management and sanitation, and measures to enhance climate resilience.
The infrastructure challenge is a dual one. It requires new resource efficient hardware solutions, that is the creation of new, or the retrofitting of existing physical assets with an integrated approach, but also better software, that is institutions and citizenship prepared to manage and use infrastructure services more efficiently. The infrastructure opportunities arising from the crucial sectors of sustainable buildings and construction, sustainable urban transportation, sustainable water management and waste management, are further explored below.
Sustainable buildings and construction
Buildings are estimated to account for more than a third of the world’s resources in construction, 40 percent of global energy (including embodied energy), 12 percent of fresh water use, generate 40 percent of greenhouse gas (GHG) emissions and make up 40 percent of waste to landfill. Hence sustainable buildings and energy refurbishments in buildings hold enormous potential for energy saving and reduction of greenhouse gas emissions. Almost two-thirds to four-fifths of energy is used directly during the operation of the building. The remaining accounting for the indirect form of energy such as the energy needed to manufacture building materials, transport raw materials to the construction site, and construction and demolition of the building.
Green buildings have the potential to save money as well as carbon emissions by adopting passive design features and through effective insulation, glazing, water heating, air conditioning, lighting, and other energy-efficiency measures. The Intergovernmental Panel on Climate Change (IPCC 2007) estimated in 2007 that around 30 percent of the baseline CO2 emissions in buildings projected for 2020 could be avoided cost-effectively by the use of various technological options. This would result in a number of co-benefits such as decreased air pollution, better health and reduced mortality, improved social welfare, improved affordability of housing and energy security.
The global greenhouse gas abatement cost curve for the building sector developed by McKinsey (2009) shows that changes in building design and construction could offset up to 6 billion tons of carbon emissions annually through measures with a zero or negative net life-cycle cost.
© Lewis Akenji

145page1 2 3 4 5 6 7 8 9 10 11 12 13 14
Part B
Figure 9:3 Global GHG abatement curve for the building sector (scenario perspective 2030)
Source: (McKinsey 2009)
According to UNEP, greening of buildings can be part of the strategies to improve access to basic services, reduce vulnerability, and contribute to better living conditions of the poor residing in informal settlements or overcrowded housing estates that are associated with the lack of access to electricity, fresh water, health-care and effective waste management.
Box 9:2 Sustainable buidling design strategy
Thanks to the integration of design features that are site-specific and well suited to the local climate, and the adoption of innovative and environment-friendly technologies and durable materials with high recyclable content, buildings have the potential to become more affordable and sustainable by cutting down the energy/water use and cost by over 50 percent as compared to conventional buildings. There are two complementary approaches to consider for green buildings:
• Adoption of nature-driven technology (solar/wind protection, daylight, thermal envelope, renewable resources, reuse and air quality control).
• Adoption of technology-driven strategy (site selection, building materials, heating, cooling, recycling, HVAC control, etc.).
The process of green building is distinguishable from normal conventional practices because it emphasises the need for close collaboration of all concerned. Inputs are obtained from a wide range of parties that include the project team, the owner and users, the community and other stakeholders. They work together to identify sustainable design strategies and options prior to the launch of the schematic design phase. A collaborative multi stakeholder approach should be used, to ensure the development of practical and useful building specifications and designs.
Source: (Mohanty 2012)
The World Business Council for Sustainable Development reports that despite the increasing knowledge and

146page
understanding about green buildings, key decision makers still overestimate the cost. A survey of 1,400 people found that the average guess for the additional cost of building green was 17 percent, when the actual amount is closer to 5 percent. A 2003 report by the U.S. Green Building Council put the increase at as little as 2 percent.
Box 9.3. Eco-village of Adelaide: a new form of urban development
Consisting of 27 dwellings and community facilities (e.g. library, laundry, interpretive centre) and constructed in phases over 7 years, Christie Walk in Central Adelaide was designed to be a catalyst for climate-change resilient and sustainable urban development. This urban eco-village was conceived and developed by a large community of activists, experts, citizens and residents. Christie Walk comprises four 2 and 3 storey straw bale houses, four 3 storey townhouses, a 3 storey building with 6 apartments, and a 5 storey building with 13 apartments and community facilities. The deep-soil roof gardens irrigated with storm water provide a multitude of benefits: improved air quality; alleviation of urban heat island effects; reduced energy use and climate emissions; beautification of the cityscape; and employment creation. Studies of its sustainability outcomes have documented 50-60% reductions of energy use and CO2 emissions against regional averages.
Source: (WWF 2012)
Urban authorities have the opportunity to promote change through developing high energy-efficiency building energy codes and standards and adopting suitable compliance mechanisms. They have the potential to play a key role, at the local level, in creating synergies among all stakeholders in the building sector. Building standards should be appropriate to the local climatic conditions, focus on affordability and take into consideration the type of building and activity. Transformation of the building sector would require not only availability of appropriate building materials, equipment and systems but also a large workforce with the skill necessary to construct sustainable buildings using holistic and integrated design approaches.
Sustainable urban transportation
Transport systems form the lifeline of economic and social development of cities. By connecting urban centres to the bioregion and the rest of the country, they facilitate economic, social and cultural exchanges.
As cities grow, there is increasing demand for travel and transportation of goods. Access to mobility options is unequally distributed across the world. It is more pronounced in developing countries where the urban poor pay heavily in time, money and health for their daily basic transport. Due to the lack of good and adequate public transportation systems, urbanites with growing income are opting for private motorisation, especially in rapidly expanding cities. Beijing’s vehicle ownership per 1,000 people rapidly increased from 9 in 1980 to 171 in 2009.
Transportation poses a number of challenges for cities including infrastructure costs, dependency on fossil fuels, traffic congestion, loss of productivity, air and noise pollution, health and safety and greenhouse gas emissions. Urban roadway congestion is threatening the long-term economic growth of cities due to wasted energy and time. Shanghai is reported to lose 10 percent of its GDP due to traffic congestion. Emissions from transport in urban areas are responsible for 70-90% of air pollution, making it the largest source in most cities. Pollution costs more than 5% of GDP in many developing countries.
© Lewis Akenji
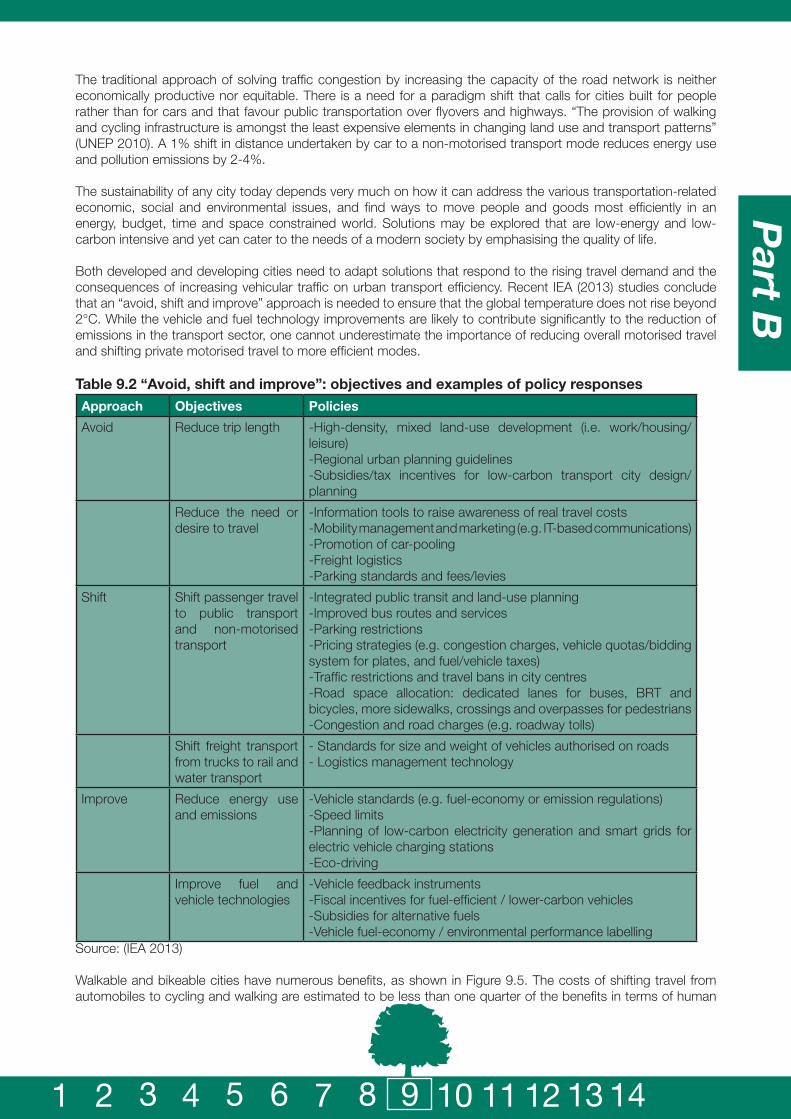
147page1 2 3 4 5 6 7 8 9 10 11 12 13 14
Part B
The traditional approach of solving traffic congestion by increasing the capacity of the road network is neither economically productive nor equitable. There is a need for a paradigm shift that calls for cities built for people rather than for cars and that favour public transportation over flyovers and highways. “The provision of walking and cycling infrastructure is amongst the least expensive elements in changing land use and transport patterns” (UNEP 2010). A 1% shift in distance undertaken by car to a non-motorised transport mode reduces energy use and pollution emissions by 2-4%.
The sustainability of any city today depends very much on how it can address the various transportation-related economic, social and environmental issues, and find ways to move people and goods most efficiently in an energy, budget, time and space constrained world. Solutions may be explored that are low-energy and low-carbon intensive and yet can cater to the needs of a modern society by emphasising the quality of life.
Both developed and developing cities need to adapt solutions that respond to the rising travel demand and the consequences of increasing vehicular traffic on urban transport efficiency. Recent IEA (2013) studies conclude that an “avoid, shift and improve” approach is needed to ensure that the global temperature does not rise beyond 2°C. While the vehicle and fuel technology improvements are likely to contribute significantly to the reduction of emissions in the transport sector, one cannot underestimate the importance of reducing overall motorised travel and shifting private motorised travel to more efficient modes.
Table 9.2 “Avoid, shift and improve”: objectives and examples of policy responsesApproach Objectives Policies
Avoid Reduce trip length -High-density, mixed land-use development (i.e. work/housing/leisure)-Regional urban planning guidelines-Subsidies/tax incentives for low-carbon transport city design/planning
Reduce the need or desire to travel
-Information tools to raise awareness of real travel costs-Mobility management and marketing (e.g. IT-based communications)-Promotion of car-pooling-Freight logistics-Parking standards and fees/levies
Shift Shift passenger travel to public transport and non-motorised transport
-Integrated public transit and land-use planning-Improved bus routes and services-Parking restrictions-Pricing strategies (e.g. congestion charges, vehicle quotas/bidding system for plates, and fuel/vehicle taxes)-Traffic restrictions and travel bans in city centres-Road space allocation: dedicated lanes for buses, BRT and bicycles, more sidewalks, crossings and overpasses for pedestrians-Congestion and road charges (e.g. roadway tolls)
Shift freight transport from trucks to rail and water transport
- Standards for size and weight of vehicles authorised on roads- Logistics management technology
Improve Reduce energy use and emissions
-Vehicle standards (e.g. fuel-economy or emission regulations)-Speed limits-Planning of low-carbon electricity generation and smart grids for electric vehicle charging stations-Eco-driving
Improve fuel and vehicle technologies
-Vehicle feedback instruments-Fiscal incentives for fuel-efficient / lower-carbon vehicles-Subsidies for alternative fuels-Vehicle fuel-economy / environmental performance labelling
Source: (IEA 2013)
Walkable and bikeable cities have numerous benefits, as shown in Figure 9.5. The costs of shifting travel from automobiles to cycling and walking are estimated to be less than one quarter of the benefits in terms of human

148page
health, reduced air pollution, noise from road traffic and reduced parking costs. In cities with a high share of public transport, walking and cycling, the burden of the cost of transport on the community is much lower. For example, the cost of transport represents over 12 percent of the local GDP in Houston or Sydney, but only 6 percent in Tokyo or Hong Kong.
Figure 9:4 Cycle of walkable and bikeable cities
Source: (UNEP 2010)
Box 9:4 Sustainable mobility in Argentina
Buenos Aires ‘Plan for Sustainable Mobility’ is improving transport systems through an integrated, multifaceted approach. This includes developing BRT lines on several key routes, which have led to reductions in commute times from 10-25%, and up to 65% in some cases. To reduce carbon emissions they have introduced a number or hybrid vehicles and articulated buses into the transport system.
Additionally they are aiming to increase the number of people who chose to cycle, by building an additional 100km of bicycle paths and increasing bicycle parking. They plan to open a public bicycle rental scheme soon, and have launched a subsided bicycle loan scheme for the 120,000 municipality employees. They hope that these measures will increase the number of cyclists by six fold. In recent years, many new BRT systems have been built in developing countries including Guangzhou (China), Lima (Peru), Leon and Mexico City (Mexico), Jakarta (Indonesia), Tehran (Iran), Johannesburg (South Africa) - the first in Africa, and Ahmedabad (India) - the first in India.
Source: (IRP/UNEP 2013)
Water
Water is essential for domestic, commercial and industrial uses, as well as the maintenance and enhancement of the urban environment. All major urban settlements have strategically been located to have access to adequate water resources. However, as local water supplies became contaminated due to the lack of pollution control systems and technologies, cities started depending on importing pristine water from remote sources to meet the potable water needs of the population. Earlier both water and energy were abundant and inexpensive, hence infrastructure was designed to achieve economies of scale in the form of a centralised water treatment and distribution system aimed at meeting the demand instead of managing consumption, thus resulting in increased water use.
The situation is very different today. With the rise in population and lifestyle changes, water is becoming increasingly scarce. Effective and efficient management of water resources is essential as network and water management services have become the most onerous infrastructure investment and recurring costs for most municipalities. Due to limited water supplies and expensive energy, the focus has now shifted to minimising

149page1 2 3 4 5 6 7 8 9 10 11 12 13 14
Part B
energy use and managing water demand to ensure sufficient supply.
Water management systems were historically implemented sequentially as specific needs were identified and financial resources were mobilised. With the passage of time, cities faced increasing pressure to manage storm water to prevent flooding and environmental damage, and collect and manage wastewater effectively. As a result, systems for handling drinking water, storm water, and wastewater were often developed and managed separately. There is now increasing understanding that multiple benefits can be accrued by integrating these functions into a single system.
Many state-owned water utilities are unable to recover the capital investment for increasing capacity and the operating expenses from the revenue generated from water sold, due to irrational tariffs and leakage in the water network. Water loss, also referred to as non-revenue water (NRW) refers to the total amount of water lost through leakage in water distribution network. Compared with cities like Berlin (3 percent losses) and Singapore (2.5 percent losses) that have managed to develop and maintain very efficient water distribution systems, the share of NRM in some cities of developing countries can be as high as 50 percent. Though the estimated cost for halving the NRM is estimated to be around USD 20 billion, the amount of water that can be saved could serve an additional 150 million people (GIZ 2010).
An alternative to this vicious urban water cycle would be to adopt an integrated water cycle management approach that encourages water users to adopt simple and cost-effective water saving solutions through a combination of regulatory and market-based instruments. For example, there can be a steeply progressive water tariff for those who consume more water. Such a tariff system however would need to be equitable and include social considerations, such as large family size. Those willing to adopt water saving technologies such as low-water faucets and showerheads, and low-water flushing toilets could be incentivised through innovative financing mechanisms that ensure that the life-cycle cost of water saved is lower than the cost of water purchased from the water utility. Smart water metering can help water utilities in identifying changes in water usage, better detecting leakages, enhancing consumer awareness and reducing operational costs. Building codes could be revised to mandate the adoption of dual-pipe systems in large buildings so that grey water from wash basins and showers could be treated and reused for flushing toilets, gardening and general washing purposes that do not need the use of potable water. Rainwater harvesting and storm water management could be enforced to further reduce the dependence on municipal water supply.
Box 9.5: Closing the water loop in Namibia
The city of Windhoek in the sub Saharan African country of Namibia is closing the water loop to a great extent by adopting integrated water management principles. The city has a current water demand of 25 million Cubic meters per annum, compared to a low scenario projection of 46 million cubes per annum. Windhoek’s efforts started way back in 1993 when a dual piping system was adopted to irrigate all municipal parks, gardens and sports fields with semi-purified sewage effluent, thus reducing 5 to 7 percent of the potable water demand. The city has commissioned more plants to supply up to 35 percent of daily demand from direct potable reclamation. Artificial aquifer recharge systems implemented in phases are adequate for the city to survive for two years without depending on ephemeral rivers.
Source: (Worldbank 2012)
Finally, decentralised/distributed wastewater treatment facilities could be commissioned as wetland treatment systems at the urban district level, to minimise the pumping energy and encourage reuse of treated wastewater for urban greening and agriculture. Such a virtuous urban water cycle can thus be managed cost-effectively with an integrated urban water management system, achieving potable water conservation, wastewater minimisation and storm water management, while ensuring other benefits such as urban greening and improving urban quality of life. Water Sensitive Urban Design (WSUD) is such an approach, seeking to integrate water cycle management into urban planning and design.
Cities are increasingly reducing the dependence on remote water supplies by reclaiming and recycling used water and rainwater harvesting. Thanks to the development of effective treatment technologies, water can be reused, either to meet water-supply needs or to enhance and restore the environment. Further, it is also possible to extract from the waste stream useful products such as organic matter, soil conditioning products and nutrients. The storm water can be managed by taking advantage of natural systems not only to relieve the burden on infrastructure,

150page
but also to enhance natural areas, reduce heat-island effects, and contribute to more pleasing, liveable urban environment.
Sustainable waste management
Waste is a by-product of consumption and production and without intervention will continue to increase. Globally waste generation is on the rise, particularly in developing countries. Across the world, many governments have insufficient human and financial resources to handle waste in an environmentally and economically sound manner, most noticeably in rapidly growing urban centres. Poor waste management practices not only impact human health and environmental quality, but can have negative economic and social impacts. In addition, improper waste management can significantly contribute to greenhouse gas emissions. Developing sustainable waste management strategies is essential, and is a key priority for both stable and growing cities.
Despite these challenges, waste however, presents many opportunities for a transition towards sustainability. Sustainable waste management can contribute to various national and global agenda such as food security, energy sufficiency, improved public health, poverty reduction, climate change mitigation and economic growth. Sustainable waste management can positively contribute to poverty reduction strategies, create livelihood opportunities and improve opportunities for the socially marginalised. When waste is treated as a resource that can be recovered and put to productive and profitable use, significant benefits can be realised.
© Shutterstock

151page1 2 3 4 5 6 7 8 9 10 11 12 13 14
Part B
Box 9:6 Job creation through sustainable waste management
• In 2000 recycling activities in the EU accounted for 229,286 jobs, which by 2008 had increased to 512,337 – an annual growth rate of 10.57%.
Source: (Phitsanulok Municipality 2011)
The central principles of waste management, which should be applied in integrated waste management policies are: the waste management hierarchy, life-cycle thinking and resource efficiency (UNEP 2013). The waste management hierarchy indicates an order of preference for sustainable waste management and demonstrates that first and foremost policy should take action on preventing waste generation. This is followed by reduction, recycling, recovery and lastly disposal. Once the volume of waste for collection, transportation and disposal decreases, the budget required for waste management will also decrease. The waste hierarchy is often used in a simplified form known as the 3Rs (reduce, reuse, recycle) and is sometimes further broken down into the 4Rs, 5Rs, etc. Regardless of the form, the principles remain the same.
Figure 9:5 Waste management hierarchy
Source: (UNEP 2011)
Table 9.3 Considerations, in order of preference for urban and rural sustainable waste management
1 Waste prevention. Change the range, composition and design of products to reduce waste. Requires education within the waste management sector and the community.
2 Source separation. Enable the value of reusable goods and recyclable materials to be recovered and is preferable to downstream, more difficult and expensive sorting. Requires cooperation and engagement of the entire community.
3 Reuse. Recovers value and can be encouraged by changing product design to make reuse easier. Policy intervention is necessary to divert materials towards avenues of reuse.

152page
4 Composting and anaerobic digestion. Diverts waste from landfill and can generate valuable products such as compost and methane for energy.
5 Recycling. Requires collection, sorting and processing. Extended producer responsibility (EPR) is a key policy tool for encouraging recycling.
6 Materials recovery. Recovering useful materials from discarded products. Regulation, awareness raising and capacity building to ensure basic health and safety standards and environmentally sound practices should be given high priority.
7 Disposal. The least preferable method, should be used as a last resort after all other options are exhausted.
Implementation of the waste hierarchy and resource efficiency policy can thus contribute to the long-term ambitious target of zero waste. These policies shift the focus from end-of-pipe solutions (e.g. sanitary landfill, incineration) and disposal practices toward upstream resource management (e.g. eco-design, new product development), waste utilisation (e.g. composting, animal feed, material recycling), and energy recovery (e.g. electricity generation using heat from waste incineration).
Waste management is a cooperative process and requires the involvement of numerous stakeholders including national, regional and local government, the community, private sector, informal sector, NGOs and research institutions. Most waste management activities occur at the local level, emphasising the importance of a bottom-up approach to policy development, and the need for close cooperation between national and local agencies.
Involvement of the private sector in waste management can significantly reduce the burden for local governments. However, government must establish the necessary supportive institutional frameworks such as regulation and awareness raising campaigns to ensure there are sufficient economic incentives, regulations and monitoring in place. Close engagement is also needed with the production and commercial sectors to influence product design. Most importantly cooperation is needed with the general public to encourage sustainable choices and participation in sustainable waste management strategies.
Sustainable waste management can provide a wide array of social, economic and environmental benefits, both for local stakeholders and for the global environment, including improved resource efficiency, public health protection, job creation, poverty reduction, avoided detrimental local and global environmental impacts and enhance economic development. It requires a transition from focusing on service delivery, to managing resources for the future and requires consideration of the sources of waste. “Guidelines for National Waste Management Strategies” launched in 2013 by UNEP/UNIDTR is an excellent publication with detailed guidance on developing, implementing reviewing, revising and updating national waste management strategies.
Sustainable Urban Form
The form of the contemporary city has been perceived as a source of many urban problems. It has led to inefficient land-use practices and policies that have resulted in urban sprawl, increasing the demand for resources and affecting habitat and ecosystems. Growing evidence around the world indicates the need for urgent changes in urban form that can contribute to lower consumption of resources, reduced environmental impacts and resilience to change without compromising socio-economic activities and the well-being of the population.
The debate over desirable urban form is not something new. Many distinctive ideas and design concepts of urban forms exist, as follows:
• Compact city: its distinctive characteristics are high-density development, mixed land-use, and compactness around commercial centres and urban transit nodes.
• Eco-city: it is conceptualised as an eco-system that aims at not consuming more resources that it can produce, not producing more waste than it can assimilate and not polluting the environment; it emphasises urban greening and ecological and cultural diversity.
• Neo-traditional development: best known among the neo-traditional approaches to planning is the new urbanism that advocates design-based strategies based on traditional urban forms that can enhance the neighbourhood concept and bolster a strong sense of community.
• Urban containment: it imposes geographical constraints on urban growth to contain sprawl by preventing the outward expansion of the urban field.

153page1 2 3 4 5 6 7 8 9 10 11 12 13 14
Part B
Another talked-about desired urban form is the concept of the regenerative city that promotes a whole new perspective of restoring environmental systems and positively contributing to eco-system services. It addresses the relationship between cities and their hinterland, and even with the distant territories that supply such cities with goods and services. For example, it may include supporting reforestation in the hinterland to increase its capacity for carbon sequestration or promoting organic agriculture through economic ties.
So what would be the characteristics of the smart cities of the future? The “one size fits all” concept will not work because a city develops by drawing advantages from the specificities of its site as well as by taking into account the site’s constraints. A city can develop successfully by identifying its key strengths, weaknesses and uncertainties in order to propose suitable solutions adapted to the unique characteristics of the site. Identifying uncertainties and vulnerabilities such as the impacts from climate change is particularly crucial for building resilient cities. Development and design today, needs to consider future scenarios to capture disaster risk reduction, preparedness and adaption to change within the urban form. The social and environmental characteristics should form an integral part of urban development. Urban governance has to play a decisive role by associating and privileging all those who will live in the city and ensure its future.
While it is important to build the city to respond to economic demand, it should not be seen just as a place for economic, financial and industrial production. The city’s sustainability will be based on the relationship between environmental constraints and the economic and social demands of the city.
Box 9:7 Strategic urban planning framework
Strategic urban planning is recognised as an important tool that helps local governments conduct themselves more efficiently and effectively in the designing of policy and in its implementation. Urban planners and policymakers need to respond to four essential questions that will assist them in addressing urban challenges and creating an effective and inclusive, long-term development plan: (1) Where are we now?: Answering this question requires identification of stakeholders, data collection and analysis; (2) Where do we want to go?: Answering this question lies in establishing a vision and setting objectives; (3) How do we get there?: This would need identifying actions and strategies, prioritising and implementing actions; and (4) Are we getting there?: This step involves monitoring and evaluation, followed by adjustment and fine-tuning policies.
Source: (UN ECLAC, et al 2011)
The new modes of urban development would not be possible without defining appropriate legal frameworks to suit the scale of territory and without resorting to strategic local and regional sustainable development plans. These can be either holistic or specific (e.g. territorial climate plan or urban mobility plan). The planning process should be unique in terms of its scope, objectives, capacities, leadership and pace of urban growth. The strategic planning framework will have to include flexible tools that can be applied by any city regardless of its size, level of development and nature of challenges faced.
Smart Cities of the Future: Strengthening governance to act locally for achieving global goals
Sustainable urban development calls for a high level of commitment from local authorities, a transparent, participatory and inclusive urban management. Expensive centralised systems are giving way to more network based, decentralised approached. This may include clusters of towns within a city that have high compactness and that have infrastructure services such as power generation, water supply facilities, food production and workplace in their vicinity. Greater efforts are being made to increase urban density, favour mixed land use patterns, enhance energy and water efficiency, provide better infrastructure services and encourage citizens in adopting one-planet lifestyles. Examples of such initiatives include:
• Integrated urban land use and transport planning that favours compact cities and public transport instead of urban sprawl and private car-centred development.
• Shifting from road to rail transport. • Moving away from energy-wasting buildings to low- or zero-energy buildings.

154page
• Converting fossil-fuel dependent and wasteful energy systems into energy-efficient systems that run on renewable energy sources.
• Adopting integrated and decentralised water supply and wastewater disposal systems.• Developing sustainable waste management strategies, which prioritise reducing waste generation
and consider waste as a resource for further use.
Discerning urban decision makers will need to display strong leadership and commitment towards planning, designing and managing sustainable infrastructure. They must aim for infrastructure that does not burden cities with high debts and does not lock cities into high consumption and production patterns throughout its lifespan. In designing new infrastructure and retrofitting existing ones, decision makers must adopt a leap-frogging strategy, and plan for the long term. Such critical decisions may appear challenging in immediate terms but will reap long-term benefits.
The transformation of cities cannot become a reality without increased political leadership, public engagement and entrepreneurship. Local governments need to be empowered, and stakeholders across all levels engaged. Governance that puts sustainability on the top of its agenda will make a decisive difference and make cities more competitive, efficient and attractive while locking in lower resource use and carbon outputs for future generations.

155page1 2 3 4 5 6 7 8 9 10 11 12 13 14
Part B
Further reading 9
Sustainable Resource Efficient Cities – Making it Happen aims to formulate a broader framework of integration which is required for cities to transition to sustainable, resource efficient development and to realise green urban economic growth trajectories that are equitable and sustainable. Within a strategic framework it presents a set of policy positions and recommendations for sustainable resource efficient cities.
United Nations Environment Programme 2012, Sustainable Resource Efficiency Cities – Making it Happen, UNEP, Paris.
Liveable Cities – The Benefits of Urban Environmental Planning presents policy tools and options in addressing sustainability and incorporating environment in urban planning. The case studies presented offer insight on what works, fails and opens up in trying to realise sustainable urban development.
Cities Alliance, ICLEI & UNEP 2007, Liveable Cities – The Benefits of Urban Environmental Planning, Cities Alliance, Washington.
Are we building competitive and liveable cities? - Guidelines for developing eco-efficient and socially inclusive infrastructure provides good reference to eco-efficiency and offers five new ways for city mayors to build competitive and liveable cities.
United Nations, Economic Commission for Latin America and the Caribbean, United Nations Habitat, United Nations, Economic and Social Commission for Asia and the Pacific & Urban Design Lab of The Earth Institute (Columbia University) 2011, Are we building competitive and liveable cities? - Guidelines for developing eco-efficient and socially inclusive infrastructure, United Nations, Bangkok.
Guidelines for National Waste Management Strategies: Moving From Challenges to Opportunities launched in 2013 by UNEP/UNIDTR is an excellent publication with detailed guidance on developing, implementing reviewing, revising and updating national waste management strategies.
United Nations Environment Programme 2013, Guidelines for National Waste Management Strategies: Moving from Challenges to Opportunities, UNEP.

157page1 2 3 4 5 6 7 8 9 10 11 12 13 14
Part B
10 Sustainable Public Procurement (SPP)
N
S
EW

158page
Sustainable Public Procurement (SPP)Key Points
• SPP can play a powerful role in the transition towards SCP. • How has SPP been implemented in different countries; the pre-
requisites, opportunities and challenges.• Successful SPP initiatives can have a positive impact on national
economies.
This chapter highlights the important role that SPP can play in the transition towards SCP. It identifies opportunities and challenges for implementing SPP and provides guidance for governments in developing and implementing successful SPP programs.
What is SPP and why is it important? The Marrakech Task Force on Sustainable Procurement accepted the definition of the UK Sustainable Procurement Task Force (2006) : “a process whereby organisations meet their need for goods, services and utilities in a way that achieves value for money on a whole life basis in terms of generating benefits not only to the organisation, but also to society and the economy, while minimising damage to the environment”.
In the above statement, if the term “organisations” were replaced with “governments” then Sustainable Public Procurement is clearly defined.
Sustainable Public Procurement (SPP) was identified as a major route to sustainable development as far back as the Earth Summit in Rio in 1992 when it featured in Agenda 21. It saw reiteration in the Johannesburg Plan of Implementation in 2002 and more recently, at the 19th Session of the Commission on Sustainable Development in 2011. It forms part of the 10 year Framework of Programmes suggested at the recently concluded Summit in Rio in June 2012.
Procurement of goods and services by the public sector – which includes the central/federal government, state/provincial governments and even towns and municipalities - can constitute as much as 50% of GDP. The figure is somewhat lower in developed countries but is highly significant in the developing world. For countries such as South Africa, India and Brazil, public procurement constitutes 35%, 43% and 47% of GDP respectively while for high-income countries, the figure is 13% - 17% (Perera 2010). UNEP places the worldwide figure at between 15% and 30%.
Figure 10:1 Public procurement as a percentage of GDP
In contrast with purchases by individuals/households, all institutional procurement is highly structured and far less prone to the pressures of advertising, publicity, merchandising, in-store promotions etc. that the individual is subjected to. In contrast with private sector procurement, public procurement is more easily regulated by government; for the private sector, compliance with sustainability norms is usually voluntarily and linked to a company’s policy on Corporate Social (and Environmental) Responsibility. Another important reason in favour of increasing sustainability in public procurement is that – particularly in less affluent countries – individual consumer purchasing is very highly price sensitive. It is unrealistic to expect an individual consumer set aside price considerations in favour of “loftier” principles of social justice and environmental protection when he or she may be struggling to meet basic survival needs.
10

159page1 2 3 4 5 6 7 8 9 10 11 12 13 14
Part B
Thus if the ultimate goal of SCP is to increase resource efficiency, reduce the impact of anthropogenic factors on the earth’s climate, preserve and protect all forms of life and guarantee the future, then it is obvious that the place to start with is consumption by the public sector. Not only can SPP have a quick impact, but a well-conceived and implemented SPP programme can:
• Serve as an incentive to innovation, as vendors compete with each other to achieve higher norms of sustainability.
• Act as a model for institutional purchasing by the private sector.• Improve efficiency, as vendors attempt to reach higher levels of sustainability while adhering to
conventional criteria such as price, quality and delivery.• Encourage economies of scale in production by bulk purchases.• Serve as a demonstration of political will.
SPP and GPP – preferred terminology
The difference between Green procurement and Sustainable procurement is self-evident. The former refers to the environment only whereas the latter refers to the well accepted tripod of sustainability – the environmental, social and economic sustainability of goods and services.
There is a school of thought prevailing which states that for the narrow purpose of sustainable procurement, economic sustainability need not be of too much concern. No loss-making product or service would be offered in the first place and if it were, then it would be for a very definite (social) purpose where sustainability would not be under consideration at all. This is an on-going debate but one which does not materially affect national plans for implementation.
Very often, the two terms are used interchangeably for diverse reasons. For example, the term “green” became associated in Germany with a political party and thus “sustainable” became the preferred adjective (Jensen 2011). In other cases, governments are wary of using the term “sustainable” since this means different things to different countries and there could be international trade ramifications. For example, wooden furniture is eminently sustainable in Canada, Malaysia or Brazil where wood, a renewable resource, is freely available. However the use of wood for making furniture makes little sense in the desert areas of the Middle East.
The social content of sustainable procurement causes a degree of concern to some governments. The reasoning is that a third party should not apply its own standards and norms to what is or what is not socially acceptable in another nation. While the more contentious issues such as defining child labour have already received significant attention and agreement, there are still disagreements such as on minimum pay and working conditions.
Whatever definition a country chooses to adopt, the ultimate goals of its SPP/GPP programme remains constant:• Tangible increases in resource utilisation efficiency.• Perceptibly reduced harmful discharges into the air, soil or water.• Preservation of all forms of life.• Economic development and reduction of poverty.
The terminology and semantics make little difference; what counts is the ultimate objective.
Policy options and challenges in implementing SPP
Implementing an SPP program is a challenging process and it is clear that there must be a high degree of political commitment for SPP practices to be adopted. Some of the challenges and barriers are detailed below.
Scope: Countries need to determine just what is meant by the “public” sector. Does this term cover central/federal bodies, state/provincial bodies, local/city/municipal government? Does it also include government–aided institutions such as universities and research institutions? What about public-private partnerships and commercial companies partly or wholly owned by the government but which are governed by the provisions of laws relating to corporate governance (e.g. a companies act)?

160page
Legislation: Most countries started with no specific laws related to SPP. Legislation has had to be specially drafted and this has often proved contentious since there have been other related laws, some of which may have been contradictory – e.g. policies demanding that the government procures goods and services at the lowest possible price. Paying a higher ‘up-front’ price is still regarded as an anathema.
Capacities within government: Capacity-building has been observed to be a critical component of all successful SPP progrgmmes. The capacity-building needs are not confined to purchase managers of government bodies; users, standard-setting agencies, audit and oversight bodies all require training and sensitisation, appropriate at least to their role in the purchasing process.
Capacity-building of suppliers: No SPP programme can be implemented if vendors do not have the technical, financial or managerial capacity to supply “greener” goods and services. Successful SPP programmes invariably consider suppliers to be equal partners in the initiative who need to be involved at all stages of development and implementation.
Certification/Verification: Some method of certification and/or verification of sustainability characteristics by independent, third-party agencies is essential. National Ecolabels often fulfil this function but they do not include social criteria. This is possibly why many countries simply focus on environmental criteria and implement green, rather than Sustainable, Public Procurement programmes - leaving social considerations to other mechanisms.
Creating unfair markets: Related to the question of capacity-building of suppliers is the concern that if the “green” standards are set too high, the government could end up creating monopolies. It is also entirely possible that some vendors will need financial assistance to adjust their production processes and methods to different standards. This issue is of special concern to countries which are attempting to develop their own industrial base; domestic suppliers are often unable to compete with MNCs. Often, the fear of creating monopolies is used as a way of maintaining the status quo. As will be evident from Figure 10:2 below, training and capacity development – of purchasers and suppliers alike - is a precursor to an implementation programme for SPP. But equally as often, this apprehension is real and a careful balance will need to be struck.
Life Cycle Analysis (LCA): Nowhere is there a greater need for capacity-building than in the area of LCA. Especially amongst developing countries, the capacity to conduct an LCA is scarce, as is the ability to interpret LCA studies and adapt them to local conditions. While LCA is not essential to the implementation of SPP, at least life-cycle thinking needs to be inculcated amongst stakeholders.
Life Cycle Costing: Building in operating and maintenance costs into the procurement decision is routine; what is not so common is the inclusion of “external” costs such as cost of disposal and costs to the environment by the manufacture and use of goods and services. This has complex budgetary implications as well. In government procurement, the capital expenditure may be incurred by one body whereas the cost of operation, maintenance and disposal may have to be borne by another body.
Inter-Ministerial Cooperation: Dialogue is essential for the success of an SPP programme, since ministries and departments guard their turf zealously.
The design of an SPP programme has to respond to at least the above challenges, possibly more. The progress towards implanting an SPP programme is best illustrated in the following figure.

161page1 2 3 4 5 6 7 8 9 10 11 12 13 14
Part B
Figure 10:2 The SPP approach steps
Step 1
Step 2
Step 3
Step 4 Training
Training
Training
Training
Implementation
SPP Policy and Action Plan
Legal Prioritisation Market readiness
Scoping study, project and governance set-up
Source: (UNEP 2012)
Impact of SPP:
Clearly no country would undertake the arduous task of overcoming such obstacles unless there was definite evidence that SPP had a positive impact on the national economy in particular and the world in general. An effective SPP programme demonstrates that a government is serious about resource efficiency and climate change thus invites individuals and the private sector to follow suit – the “demonstration effect”. There are other intangible benefits as well:
• Reduction in CO2 emissions• Cost savings, particularly if “external” costs are internalised• Transfer of skills and technology• Stimulation of innovative solutions to local requirements• Minority empowerment• Job creation• Wealth creation
In a recent UNEP study (2012), eight case studies of sustainable public procurement from around the world were examined. The study demonstrated that socio-economic goals such as the promotion of local industries, the creation of jobs and the support to micro, small and medium-sized businesses are objectives that can be achieved through sustainable public procurement.
Box 10:1 Environmental Benefits of SPP
Within Asia, a study of 3 Chinese cities (Tianjin, Lanzhou, Qinhuangdo) reported by the Centre for Sustainable Consumption and Production, Wuppertal (2011), revealed the following direct reductions in emissions and resource consumption in one year:Electricity saved: 20.36 MWWater Saved: 39,269 KLOil saved: 14,008 KLWaste reduced 24.42 Tonnes CO2 emissions reduced 105.75 TonnesSuch figures more than adequately substantiate the role of SPP.
A study conducted by Price Waterhouse Coopers, Significant and Ecofys in 2009 of GPP amongst the “Green 7” countries in the European Union, revealed that in the 10 product groups considered, green procurement “.... contributed to an average reduction in CO2 emissions in 2006/2007....”. Obviously, this depended on the share of a product in the country’s basket of procurement with services such as transportation contributing heavily, but CO2 emission reduction ranged from 9% (Germany) to 47% (Netherlands), too high to be ignored. Significantly, costs did not go up; rather, they decreased by 1% since Life Cycle Costing was adopted.

162page
Global experience
Countries with legislation on SPP:
Most of the developed world has legislation in place supportive of SPP. In the developing world, there may or may not be specific legislation supporting SPP in a holistic manner; sustainable procurement policies and guidelines are often found for different sectors of the economy. For example, India does not have an over-arching law on SPP; instead, there are guidelines stipulating that certain products can only be purchased by the government if they are produced by registered small-scale industries or handloom weavers or that price preference is to be accorded to purchases from them.
This sector-specificity has led to the evolution of a number of so-called “private” labels standards, sometimes known as “ISEAL labels”, after the ISEAL Alliance (previously the International Social and Environmental Accreditation and Labelling Alliance). Examples of product-specific labels or standards include the Forest Stewardship Council, Marine Stewardship Council, Roundtable on Sustainable Palm Oil and Union for Ethical Biotrade. Other such labels relate more to generic sustainable practices and these include the Rainforest Alliance, Sustainable Agriculture Network and Fairtrade. Whilst these ISEAL labels are often adopted by the private sector, their acceptance amongst public procurement agencies is low. Governments tend to favour their own ecolabelling schemes.
SPP is not merely the purview of central/federal government procurement bodies – it is often practiced by states/provincial governments and even by municipal bodies. ICLEI, Local Governments for Sustainability (2011), lists a number of SPP projects and initiatives undertaken by its 1200-strong membership across the globe.
The following summarises the state of legislation in support of SPP in some major economies across the globe.
European Union: The EU probably has the most highly developed policy and legislative measures in support of Green Public Procurement. The foundations of GPP go back to 2004 when the Council and the European Parliament adopted Directives 2004/17/EC and 2004/18/EC which clarified, simplified and modernised prevailing European legislation on public procurement and contained specific references to the inclusion of environmental considerations in the procurement process. Public purchase accounts for over 2 trillion Euros annually – about 19% of the EU’s GDP and the EU recognises that buying “green” serves the dual purpose of environmental conservation and simultaneously saving money. For example, the EU (2004) estimates that the City of Vienna saved €44 million and 100,000 tonnes of CO2 between 2004 and 2007 through its ‘Ecobuy’ programme, which took into account a life-cycle approach.
By 2011, GPP criteria had been developed for 18 different products and more were being studied for inclusion. In addition there are EU environmental requirements for certain specific sectors such as office I.T. equipment, road transport vehicles and buildings as well as in the rules for disposal of hazardous substances and waste and recycling. Nevertheless, there is some variance in the progress towards achieving the EC’s goal of greening 50% of all purchases, a target which was to have been achieved by 2010, with just 7 Member States having made major progress
China: The legal basis for SPP is found in the Government Procurement Law of 2003. This was greatly facilitated by the fact that the China Environmental Label initiative had been launched as far back as 1997 by the State Environmental Protection Administration, thus encouraging decisions to accord preference to “green” products. In 2006, the Ministries of Finance and Environmental Protection jointly issued the Recommendations on the Implementation of Environmental Labelling Products in government procurement, effectively marking the formal commencement of SPP. The recommendations are applicable at central, provincial and municipal levels. Subsequent policy pronouncements and the 12th 5-Year Plan reinforce the decision to promote SPP. The Global Ecolobelling Network Website (2012) lists 67 product categories of Ecolabels in China and there are said to be some 23,000 ecolabelled products now available.
India: There is no specific legislation supporting SPP at the moment. The long-awaited Public Procurement Policy announced in mid 2012 focused on transparency in the procurement process and makes a passing reference to sustainability, permitting (but not requiring) purchasers to include environmental considerations as one of the “socio-economic” factors which may be included in the criteria for procurement. In the face of fairly rigid pronouncements such as the General Financial Rules (2005) and the Delegation of Financial Powers Rules (1978) which strongly support the lowest price (“L1”) criterion for procurement, it is difficult for a purchaser to decide on grounds of sustainability.

163page1 2 3 4 5 6 7 8 9 10 11 12 13 14
Part B
Some major procurement bodies such as the Indian Railways overcome the obstacles by crafting specifications in a manner which includes environmental criteria and the Central Government’s procurement agency, the Directorate General of Supplies & Disposals, have set examples by unilaterally deciding to purchase environmentally friendly electrical appliances and CFLs (Morton & Gandhi 2011).
Philippines: As far back as 2004, the Philippines Government issued Executive Order No.301 which outlined its Green Procurement Programme. In January 2012, the Philippines Department of Environment & Natural Resources announced that it had signed an MOU on GPP with other Ministries, viz. Department of Budget and Management (DBM), Department of Trade and Industry (DTI), the Department of Energy (DOE), Industrial Technology Development Institute, Department of Science and Technology (DOST), Philippine Center for Environmental Protection and Sustainable Development, Inc. (PCEPSDI), the Philippine Economic Zone Authority (PEZA), the Development Academy of the Philippines (DAP) and Quezon City local government.
These agencies are also Board members in the National Eco-labelling Program of the Philippines-Green Choice Philippines (NELP-GCP) and thus it should be relatively easy to integrate the eco-labelling programme with the green procurement programme. It is, however, premature to comment on the progress of this initiative.
Switzerland: The Federal Constitution of Switzerland specifically includes the promotion of Sustainable Development as a declared “Aim” in Article 2.2. Article 73 of the Constitution specifically states that ‘the Confederation ....shall endeavour to achieve a balanced relationship between nature and its capacity to renew itself and the demands placed on it by the population’. This facilitated the Federal Act and Ordinance on Public Procurement which, while stressing the need for purchases based on the lowest price, also place emphasis on the social and, under Article 21, the environmental soundness of products and services. The Swiss Federal Council has pronounced a Sustainable Development Strategy for 2012-15 which lists as a major challenge ‘increasing economic productivity while decoupling from resource and energy usage, aligning consumption with Sustainable Development’. The Federal Council has also set targets for reductions in pollution per employee from the base of 2006 – to -6% by 2012 to – 10% by 2016. A notable feature of the Swiss legislation is that the successful bidder is responsible for not merely its own compliance to SPP norms, but for its supply chain as well.
USA: The US Environmental protection Agency (EPA) publishes a Green Purchasing Guide and assists the Federal Government (as well as other interested parties in the public and private sector) in preferentially procuring ‘green’ products, the emphasis being very largely on the environment. The President, by Executive Order 13423 of 2007 ‘requires federal agencies to use sustainable environmental practices when acquiring goods and services, including acquisition of bio-based, environmentally preferable, energy-efficient, water-efficient, and recycled-content products’. A subsequent Executive Order - 13514 of 2009 - requires Federal agencies to procure products that are ‘energy-efficient, water-efficient, bio-based, environmentally preferable, non-ozone depleting, contain recycled content, or are non-toxic or less-toxic alternatives’. The EPA’s guidelines are founded on the principles of:
• Including environmental considerations as integral to routine purchasing decision-making.• Pollution prevention also forming an integral component of procurement decisions.• Ensuring that products and services are assessed on the basis of Life Cycle Analysis.• Comparing the environmental impacts of goods and services when selecting them.• Compiling reliable data and information about environmental performance of goods and services
procured.
Environmentally preferable purchasing has percolated down to State and County levels and takes the form of both mandatory and voluntary directives/guidelines with States such as California taking the lead. The Energy Star rating is possibly the most well-known and followed example of a guideline for procuring electrical and electronic appliances. The EPA Guidelines form the basis of such State/County-level initiatives and even such diverse arms of the Federal Government such as NASA and the U.S. Department of Defense have adopted green procurement systems. The latter, for example, has green procurement norms for buildings and construction, paving material, paints motor oil and HVAC in buildings.

164page
Other Countries: Most countries have Sustainable Public Procurement programmes at differing stages of implementation. In Latin America, Argentina, Brazil, Chile and Colombia are known to have legislation and/or policies requiring the inclusion of environmental criteria in the public procurement of select goods and services. Even countries as small as Mauritius have, with the assistance of the UNEP-led Marrakech Task Force on SPP, implemented SPP from 2009, starting with a list of 7 product categories which have a high environmental impact (such as paper and printing, office and classroom furniture, vehicles, I.T. devices and construction). Clearly, all countries have accepted that a successful SPP initiative must form a critical component of their sustainable development programmes.
FURTHER READING 10
Sustainable Public Procurement Implementation Guidelines is recommended for an insight into the challenges and opportunities that are faced during the implementation phase of sustainable public procurement.
United Nations Environment Programme 2012, Sustainable Public Procurement Implementation Guidelines, UNEP DTIE, Paris.
The Impacts of Sustainable Public Procurement is a study into the benefits of SPP in developing, developed and in transition economies. It provides eight excellent case studies from across the globe and reviews the social, environmental and economic benefits that resulted from SPP.
United Nations Environment Programme , The Impacts of Sustainable Public Procurement, UNEP, Paris.
Procuring the Future – Sustainable Procurement National Action Plan – Recommendations from the Sustainable Procurement Task Force provides an overview of how the U.K implemented SPP, offering insight into strategies for successful SPP implementation.
DEFRA 2006, Procuring the Future – Sustainable Procurement National Action Plan – Recommendations from the Sustainable Procurement Task Force, Department for Environment Food and Rural Affairs, London.
Procuring Green in the Public Sector – A Checklist for Getting Started provides a checklist designed for policymakers and people working in public sector procurement, to help get started on green procurement. It also provides a business case for moving towards greener procurement.
Perera, O 2011, Procuring Green in the Public Sector – A Checklist for Getting Started, IISD, Available from: <www.iisd.org/pdf/2011/procuring_green_public_sector.pdf>. [September 2012].

165page1 2 3 4 5 6 7 8 9 10 11 12 13 14
Part B
© shutterstock


167page1 2 3 4 5 6 7 8 9 10 11 12 13 14
Part B
11 Sustainable Tourism
N
S
EW

168page
Sustainable TourismKey Points
• When is tourism sustainable?• Sustainabie tourism policies should address the challenges of
poverty.• There are economic, social and environmental impacts from
sustainable tourism.• Tourism has a complex value chain. Developing sustainable tourism
policies requires the engagement of a large range of stakeholders.• There are a number of international and multilateral organisations,
industry bodies and NGOs who have developed frameworks for sustainable tourism.
This chapter identifies opportunities to facilitate and encourage more sustainable approaches to tourism, with a particular focus on poverty and tourism.
What is sustainable tourism and why is it important?
The magnitude and impacts of the tourism Industry
Tourism is one of the world’s largest industries and one of its fastest growing economic sectors. It has a multitude of impacts, both positive and negative, on people’s lives and on the environment. According to the UN World Tourism Organisation, international tourism receipts exceeded US$1 trillion in 2011.
Figure 11.1 International arrivals 2011
Middle East, 55.45
Africa, 50.17
Europe, 503.96
Asia-Pacific, 217
Americas, 156.6
Figure 11.2 International tourism growth over 2011
0.9
3.9
6.1 6.2
-8-10
-8
-6
-4
-2
0
2
4
6
8
Africa Americas Asia-Pacific Europe Middle East
Source : (UNWTO 2012)
11N
S
EW

169page1 2 3 4 5 6 7 8 9 10 11 12 13 14
Part B
Europe remains the topmost destination in the world, with 12 countries appearing in the list of top 20 destinations. France leads with 79.50 million arrivals and within the continent, Spain, Italy and Turkey follow. The USA hosts 62.30 million arrivals and is the world’s second most popular destination, with China, at 57.60 million arrivals in 2011, coming in third. No destination in Africa or South America features in the top 20 at all.
The above figures pertain to international tourism; domestic tourism is not so easily quantified principally because there are difficulties in its definition. Nevertheless, a report issued in 2008 jointly by the UNWTO and UNEP in collaboration with the World Meteorological Organisation places domestic tourists in 2005 as being over 5 times the number of international tourists, but this varies from country to country. The category of ‘Visiting friends and relatives’ (VFR) accounts for a large percentage of domestic tourism and thus Asian countries, often having larger and more cohesive family structures, have a significantly higher ratio of domestic to international tourists. In China (2005) the ratio of international to domestic tourists was 1:26. In India (2003) it was 1:110 and in Thailand (2005) and Viet Nam (2003) it was 1:7 and 1:5 respectively (UNESCAP 2007).
The Global Sustainable Tourism Council estimates that tourism contributes to 5% of the economic activity of the world and about 7% of employment.
These millions of tourists are already consuming and will continue to demand enormous quantities of energy, water, and natural resources to support their holidays and thus will put additional pressure on ecosystems and natural resources. They will bring income to local communities and will support employment. At the same the increasing demand for basic services and goods from tourists will often cause price hikes that negatively affect local residents whose income does not increase proportionately. As with any productive sector, tourism brings negative impacts and positive effects for the environment, the society and the economy at local, national and global levels.
The overall review and estimation of tourism’s final contribution to the sustainable development of a destination is done on a case by case basis and includes a number of impact areas that should be reviewed.
Box 11:1 The tourism industry and climate change
Tourism is both a cause of and is affected by climate change and environmental degradation. Air travel for example, causes atmospheric pollution by definition and hotels, particularly those in remote locations, place a significant burden on infrastructural facilities such as sewage and waste treatment and water and electricity supply. Simultaneously, tourism is affected by climate change: the choice of destinations is often dependent on the expected climate and many tourist activities such as skiing, trekking or surfing are climate-driven.
Since so much of tourism is climate-dependent, any changes could have a significant impact on the desirability of destinations and thus the flow of tourist traffic. Some predict that with global warming becoming a reality, there will be a shift in preference from the lower latitudes with warmer climates to the higher latitudes and cooler climates.
Definitions, precepts and misconceptions
With one of the most complex supply chains of any industry, a set of numerous positive and negative impacts and with ambiguity regarding the nature of tourism as an industry, a sector or an economy cluster, defining ‘sustainable tourism’ is not an easy task.
The most widely accepted and commonly used definition of sustainable tourism (UNWTO 2004) is the following:‘Sustainable tourism development guidelines and management practices are applicable to all forms of tourism in all types of destinations, including mass tourism and the various niche tourism segments. Sustainability principles refer to the environmental, economic, and socio-cultural aspects of tourism development, and a suitable balance must be established between these three dimensions to guarantee its long-term sustainability’.
UNWTO further stipulates that sustainable tourism should:
• Make optimal use of resources, maintain essential ecological processes and conserve natural heritage and biodiversity.
• Respect the social and cultural heritage and value systems of host communities and contribute to greater understanding and tolerance.
• Ensure economically viable operations and that the socio-economic benefits are distributed equitably amongst all stakeholders.

170page
Box 11:2 Critical challenge for tourism
The critical challenge before the global tourism sector is to develop a coherent policy strategy that decouples the projected massive growth in tourism in the decades ahead from increased energy use and GHG emissions, so as to allow tourism growth to simultaneously contribute to poverty alleviation and play a major role in achieving the United Nations Millennium Development Goals (MDG).(UNEP-WTO-WMO 2008)
A term that is many times used in parallel or as a substitution to sustainable tourism is the term ecotourism. There are hundreds of definitions of ecotourism and in general most of them consider that ideally ecotourism is nature based tourism that embraces the principles of sustainable tourism. According to the Quebec Declaration on Ecotourism (adopted in 2001 during the UN International Year of Ecotourism), ecotourism “embraces the principles of sustainable tourism and the following principles which distinguish it from the wider concept of sustainable tourism are:
• Contributes actively to the conservation of natural and cultural heritage.• Interprets the natural and cultural heritage of the destination to the visitor.• Lends itself better to independent travellers, as well as to organised tours for small size groups”
(2002).
Unfortunately in recent years, the term ecotourism has been literally abused and used to describe activities that have no relation to real ecotourism. Some desert hotels and resorts, where water is scarce, boast of jacuzzis, bathtubs and swimming pools. Ecotourism voyages to Antarctica have posed serious threats to bird and marine life in a fragile ecosystem while the route to Mount Everest is littered with human refuse and even corpses. In Africa, the behaviour of lions in some wildlife parks is said to have changed with frequent exposure to humans. Principles of sustainability could well be applied to such examples of tourism but it is quite unfortunate that many of these activities are described as ecotourism while they are practically nature based tourism.
Sustainability in tourism is not just about the environment; equally important is the effect of tourism on the culture, heritage and economic wellbeing of stakeholders. All tourism needs to be made more sustainable since the existing infrastructure is often unable to cope with the demands of tourists.
Box 11:3 Differences between tourists and locals
In developing countries per capita daily use of water by tourists can be 10-15 times that of the local community (UNEP-WTO 2005). In Phuket, Thailand, tourists generate 2.2 kg of solid waste per person per day versus a Thailand average of 0.65 kg. (World Bank 2003). Tourism is by nature seasonal and this has an impact both on the infrastructure as well as on local employment. Infrastructural investments for assets (e.g. roads or power generating capacity) which are used only for a limited period of the year can be very expensive and it puts a great socio-economic strain on the local community to be employed for only part of the year.
Policy options for sustainable tourism
Policy Tools for Sustainable Tourism
Tourism is almost invariably a private sector activity. Thus the government’s role is dual. On the one hand, it must act as a facilitator by providing the necessary infrastructure for tourists, promoting attractions and encouraging tourist arrivals. On the other hand, government’s role is to enforce laws of the land and these may, in some cases, be in conflict with its role as a promoter of tourism. A delicate balance has to be maintained and this is where voluntary initiatives such as the Global Sustainable Tourism Council (GTSC) certification scheme play a critical role: there is no confrontation since the industry has voluntarily agreed to follow norms which will not only meet but frequently exceed the requirements of the law.
Addressing the main challenge of integrating sustainability in tourism development policies, a set of policy recommendations have been develop by UNEP in partnership with UNWTO to set an agenda for policy making in the area of sustainable tourism. The recommendations are based on a list of 12 principles for sustainable tourism development. These principles were reached after extensive research and consultation in international forums and can be used as a framework to develop policies for sustainable tourism, that recognise the two directions in which tourism policy can exert an influence:
• Minimising the negative impacts of tourism on society and the environment.• Maximising tourism’s positive and creative contribution to local economies, the conservation of
natural and cultural heritage and the quality of life of hosts and visitors.

171page1 2 3 4 5 6 7 8 9 10 11 12 13 14
Part B
The 12 principles are summarised below.
• Economic viability: Ensure the viability and competitiveness of tourism destinations and enterprises, so that they are able to continue to prosper and deliver benefits in the long term.
• Local prosperity: Maximise the contribution of tourism to the prosperity of the host destination including the proportion of visitor spending that is retained locally.
• Employment quality: Strengthen the number and quality of local jobs created and supported by tourism, including the level of pay, conditions of service and availability to all without discrimination by gender, race, disability or in other ways.
• Social equity: Seek a widespread distribution of economic and social benefits from tourism throughout the recipient community, including improving opportunities, income and services available to the poor.
• Visitor fulfilment: Provide a safe, satisfying and fulfilling experience for visitors, available to all without discrimination by gender, race, disability or in other ways.
• Local control: Engage and empower local communities in planning and decision making about the management and future development of tourism in their area, in consultation with other stakeholders.
• Community wellbeing: Maintain and strengthen the quality of life in local communities, including social structures and access to resources, amenities and life support systems, avoiding any form of social degradation or exploitation.
• Cultural richness: Respect and enhance the historic heritage, authentic culture, traditions and distinctiveness of host communities.
• Physical integrity: Maintain and enhance the quality of landscapes, both urban and rural, and avoid the physical and visual degradation of the environment.
• Biological diversity: Support the conservation of natural areas, habitats and wildlife and minimise damage to them.
• Resource efficiency: Minimise the use of scarce and non-renewable resources in the development and operation of tourism facilities and services.
• Environmental purity: Minimise the pollution of air, water and land and the generation of waste by tourism enterprises and visitors.
On the basis of these 12 principles a broad number of specific instruments are available to policymakers. These include:
• Measurement instruments which set indicators and identify the limits. Typically the Sustainable Tourism Criteria established by the Global Sustainable Tourism Council extend to measurable indicators and an appraisal and certification scheme which is rapaidly gaining acceptance by the accommodation sector.
• Command and control instruments, such as legislation/regulation and licensing. Laws pertaining to land use, access, waster disposal, pollution control, minimum wages and the like exist in almost all countries; occasionally, these are relaxed for the tourism indistury in some developing countries in an effort to attract foreign tourists and investments in the industry .
• Economic instruments – taxation/levies and incentives. Fiscal incentives for certified sustainable tourism practices are genuienly needed and require the urgent attention of policymakers.
• Voluntary instruments such as the certification, reporting and auditing. Sustainability reporting by large companies is frequently required by law and many international hotel chains are thus under obligation to report annually on their sustainability performance along with their financial results. However, this many not apply to smaller businesses.
• Supporting instruments such as infrastructure development, capacity building and marketing.
These are discussed in detail in the UNEP-UNWTO publication Making Tourism More Sustainable (2005) which should be referred to by policymakers.
Tourism and Poverty
One of the most important challenges that sustainable tourism policies should address is the challenge of poverty. Looking at the location of poverty in the world and then at tourism flows, two key points emerge. First, tourism

172page
often plays a major part in the economy of poor countries. Tourism is the principal export in a third of all developing countries and, amongst the 49 Least Developed Countries (LDCs), it is the primary source of foreign exchange earnings. Secondly, tourism is growing much faster in developing countries than in developed countries. Therefore tourism, if well and sustainable managed, has great potential to alleviate poverty and contribute to local development.
Tourism is a labour-intensive industry by definition. Universally, tourism has both a direct and indirect impact on employment and the beneficiaries are both international and local labour. There is considerable evidence to suggest that a rise in tourist arrivals leads to a rise in employment in the host destination and vice versa. Tourism can also be highly capital intensive and can lead to a significant inflow of Foreign Direct Investment. The combination makes tourism a highly desired industry by most governments.
Although tourism has significant potentials as a driver of local development and poverty alleviation, there are a number of challenges to be met if this potential is to be realised. These challenges include issues of ownership, economic leakage (from the local economy and through imports), local employment, benefit distribution, social and environmental impacts and dependency. These problems can only be effectively addressed at the destination level with the active participation of the local communities.
UNESCAP (2003) clearly spells out how sustainable tourism can assist in poverty alleviation. It summarises by stating that “The effective development, execution and management of a successful pro-poor tourism strategy reaches far beyond local communities”. It can:
• Enhance a country’s international profile.• Open the door to new investment.• Raise living standards.• Provide additional funds for education and training.• Stimulate economic growth.• Bring about environmental reforms.• Develop a group of innovative entrepreneurs.• Create new business opportunities.
Recent interesting initiatives have been trying to mainstream the use of tourism as a driver for poverty alleviation. Research indicates that these initiatives are promising but there is still a great amount of work to be done. For example, a paper by Manyara & Jones (2007) indicates that community priorities are often inadequately addressed by initiatives of pro-poor tourism. Furthermore a DFID study on the effects of tourism in poverty concluded that the conventional focus on international tourism and foreign exchange has missed the potential to enhance the benefits of tourism for the poor and failed to minimise costs on the poor.
Box 11:4 The impacts of tourism
Tourism can, for example, provide employment for local people but it can also contribute to an increase in their cost of living, e.g. housing, food. It can give visitors a greater understanding and appreciation of people from diverse backgrounds but it may result locally in a disruption of traditional customs and traditions. It can improve roads and infrastructure but it may require communities to raise taxes for additional services. It can provide better recreational and cultural facilities but also create overcrowding, traffic congestion, litter, vandalism and crime (UNESCAP 2003).
Multilateral Agencies and Sustainable Tourism
There are a number of multilateral agencies industry bodies and NGOs working on Sustainable Tourism.
UNWTO: Foremost amongst these is UNWTO. Started as the World Tourism Organisation in 1970 when its statutes were adopted, it became a working entity in 1975 with Headquarters in Madrid and joined the UN system in 2003, becoming known as UNWTO. UNWTO is not intended solely to promote sustainable tourism, it has a broader canvas; it however describes itself as follows: “UNWTO promotes tourism as a driver of economic growth, inclusive development and environmental sustainability, and offers leadership and support to the sector in advancing knowledge and tourism policies worldwide” (2012).
Marrakech Task Force on Sustainable Tourism: UNEP sponsored the creation of 7 Marrakech Task forces following the decision taken at the International Experts Meeting on Sustainable Consumption & Production in Marrakech in 2003, which marked the commencement of the “Marrakech Process”. Following the recommendations of the Johannesburg Plan of Implementation (JPOI) that “developed countries must take the lead” in accelerating the shift towards more sustainable consumption and production, each of the Marrakech Task Forces was chaired by a developed country. The Task Force on Sustainable Tourism was thus chaired by

173page1 2 3 4 5 6 7 8 9 10 11 12 13 14
Part B
France and comprised members from 18 countries representing 17 businesses, international organisations and NGOs. It supported over 40 projects worldwide and conducted a series of meetings of stakeholder groups.
Global Partnership for Sustainable Tourism: The work of the Marrakech Task Force was handed over in 2010-11 to the Global Partnership for Sustainable Tourism. It has 83 members from government, industry and NGOs and has the following objectives:
• Bring together international organisations, governments, civil society and tourism trade groups as members of the Global Sustainable Tourism Partnership and get them involved in its activities.
• Encourage networking among members and facilitate access to information about sustainable tourism.• Strengthen, coordinate and encourage the adoption and implementation of sustainable tourism policies.• Disseminate information about success stories.• Scale-up, adapt and replicate successful projects and initiatives.• Establish and implement innovative, multi-stakeholder projects that support sustainable tourism
development around the world.
Global Sustainable Tourism Council: The UN Foundation, with the support of UNEP, UNWTO and other leading international bodies set up the Global Sustainable Tourism Council (GSTC), now headquartered in Washington DC. The GSTC describes itself as “a global initiative dedicated to promoting sustainable tourism practices around the world”. Its objectives include:
• Promotion of international standards on sustainable tourism.• Promotion of sustainable tourism destinations.• Promotion of market access.• Education and training on tourism sustainability.• Accreditation for standards and certification programmes.
Of these, perhaps the most significant is the development of the Global Sustainable Tourism Criteria, the latest revision of which was published in March 2012. The initiative commenced in 2008 and involved some 50 expert organisations which reviewed over 60 certification schemes and 4500 criteria, inviting comments from 2000 stakeholders. The result of this massive exercise was a set of principles and indicators under 4 objectives:
1. Demonstrate effective sustainable management.2. Maximise social and economic benefits to the local community and minimise negative impact.3. Maximise benefits to cultural and historical heritage and remove negative impacts.4. Maximise benefits to the environment and minimise negative impacts.
Under each objective, several principles were listed and indicators were developed for each principle. Applicable to hotels and tour operators, the GSTC provides the flexibility of adapting to a country’s particular needs and a certification/accreditation procedure has also been developed simultaneously. The GSTC criteria have been adopted by a number of major hotel chains and tour operators around the world.
Private Initiatives: There are several private initiatives promoting sustainable tourism such as Green Globe which also has sustainability criteria – common in many cases to the GSTC criteria – and a certification scheme.
There are, therefore, a large number of organisations and networks providing guidance to the tourism industry on how to transition to more sustainable practices, along with audit and certification schemes aimed at preventing “green-washing”. Simultaneously, there exist initiatives such as the Green Passport for consumer education and Envirotel for educating the small and medium players in the hospitality industry.
Hotels and tour operators are increasingly advertising their green certification status in publicity materials and it is the declared intent of travel and hospitality websites to actively promote such certified businesses. There is evidence that an increasing number of tourists are responding to these efforts.
174page
Box 11:5 Sustainable tourism in the South Pacific Islands
Recognising the importance of sustainable tourism, an initiative is underway in the South Pacific Islands of Fiji, Vanuatu, Samoa and Palau. Working with the South Pacific Tourism Organization (SPTO) these countries are enhancing their ability to manage climate change adaption within the tourism sector. The project focuses on the following three areas:
• Educating existing and new tourism entities on the issue of climate change. • Constructing and implementing a climate change adaptation strategy for community-based-tourism
initiatives. • Incorporating considerations of climate change into national tourism development strategies and
plans. (GTZ & SPREP n.d.)
The role of business
Tourism is an industry where small and large businesses co-exist and often have a symbiotic relationship. In the accommodation sector, hotels may be owned or operated by a global chain but bed-and-breakfast rooms, inns and home-stays also thrive in the very same environment. The transportation sector includes not only airlines and railway networks but also the driver-owned and operated taxi, mini-bus or rickshaw and tuk-tuk.
Basic principles of sustainability apply across the board, irrespective of size. Energy conservation, for instance, applies equally to a small inn as to a large hotel, to a taxi driver as to an airline.
There is no real reason to use construction material (such as flooring) imported into Asia from Europe, or for exotic woods from Africa and South America. Yet such materials are prolifically used in the larger ‘luxury’ hotels. Restaurants will serve food imported in refrigerated condition from thousands of miles away, often in preference to fresh, locally available produce. Again, this is found mainly in the upper-end luxury hotels and dining establishments. In many developing countries which often which boast of some of the world’s greatest cuisines, it is astonishing that that luxury continues to be defined by some by Western standards.
Sustainable tourism can in fact pay back for itself and there is a sound business case for it. In some instances, it may involve higher initial investments – for example in the installation of water or energy-saving devices. Technology may also be difficult to acquire, particularly for small businesses. But the major challenge comes from the fact that mindsets need to be changed.
Fortunately, there is increasing realisation of the errors of the past and many individual hotels and chains have very successfully and profitably implemented corrective measures.
It is a more difficult task to persuade individual tourists. Many are simply over-awed by the ‘exotic’ or ‘foreign’ nature of their surroundings and dietary choices and demand an ambience and cuisine which is akin to ‘home’, however unsustainable that may be in the host country. Others may feel that they are on a well-earned vacation and are thus entitiled to luxury standards of consumption. Measures such as UNEP’s Green Passport initiative may help in small ways but there is no quick-fire solution. The onus must rest on the suppliers of tourism-related services to simply stop offering what is clearly unsustainable and communicate the intentions properly to their clients.
Tourism businesses are sometimes quite reluctant to be pioneers in implementing sustainable practices, since these often require up-front investments which take time to recoup. Providing subsidies or tax breaks for such investments is a potential way of overcoming this reluctance but it should be seen as an approach that is applied only when the private sector is really committed to contribute to sustainable tourism.
Country Comparisons and the need for Impact Assessment
Inter-country comparisons of the impact of sustainable tourism are not always meaningful. Comparisons between developed and developing countries are particularly irrelevant because of the different ways that nations have grown. Issues of varying definitions and data collection methods between countries further complicated inter-country comparisons, so it is probably best that data is used to ascertain trends or to compare a country’s internal performance against its own in the past.
The level of implementation of sustainable practices varies significantly within countries and the relative importance of the different elements varies even more. For instance, waste minimisation is of critical importance to a small island that simply does not have the land area for sanitary landfills. In a water-stressed or desert area, the critical need would be water conservation. Instead, each country (and possibly areas within each country) needs to look at the impact that tourism has had on society, the environment and the economy.

175page1 2 3 4 5 6 7 8 9 10 11 12 13 14
Part B
Box 11:6 Society
• What is the level of employment generated by tourism – direct and indirect?• What is the quality of that employment – are locals being employed for menial tasks or are they also
represented in higher management echelons?• Is training provided to local staff to enhance skills and upward mobility?• Are wages and working conditions in conformity with the law and with the practice of the industry/
the business elsewhere?• Is land, water or any other resource being utilised at the expense of the local community?• To what extent are local materials and foodstuff used in the establishment and operations of the
business?• Do the operations encourage local arts, crafts?• Is the local heritage – particularly buildings, monuments, and archaeological and natural sites un-
harmed?• Is the traditional right-of-way and access being denied?• Are local value systems and traditions accorded due respect? In particular, are women and children
given due respect and consideration?• Has tourism led to the creation of undesirable activities such as prostitution, and is the local
community being exposed to unhealthy or undesirable practices?
Box 11:7 Environment:
• Has tourism caused any damage to the flora and fauna of the region?• Has any building or construction caused an unnatural diversion of rivers, streams and waterways?• Is the land, air or water source (including underground aquifers) being polluted by effluent discharge
and the use of toxic chemicals?• Are exotic and non-indigenous species of flora being planted, endangering local/endemic species?• Does a proper waste management system exist to cope with tourist arrivals?• Do tourist establishments practice water and energy-conservation measures?
Box 11:8 Economy:
• How much revenue has been generated by tourism (international and domestic)?• How much of the revenue is retained within a) the country and b) within the areas?• How has the income been distributed? Does the local community retain a fair share or does it
accrue largely to outside investors?• Is the income likely to be sustained or is it transient?• Is it likely to invite additional investment in legally permitted activities?• Are investments coming in from legitimate sources?

176page
Further reading 11
Advancing Sustainable Tourism – A Regional Sustainable Tourism Situation Analysis is a series of publications promoted by the Global Partnership for Sustainable Tourism. In 2013 new publications were released Asia-Pacific, Southern Africa and the Caribbean, each providing an analysis of the sustainability of tourism within the region.
Global Sustainable Tourism Council 2013, Advancing Sustainable Tourism – A Regional Sustainable Tourism Situation Analysis, GSTC.
UNEP’s Green Passport initiative provides tips to travellers on green tourism with information to read before, during and after you travel. It is a source of information on how to influence tourists and educate them about responsible tourism.
United Nations Environment Programme 2012, Green Passport – Holidays for a living planet. Available from : <www.unep.fr/greenpassport>. [September 15 2012].
Making Tourism More Sustainable – A Guide for Policymakers is essential reading for policymakers, providing practical policy advice for adopting sustainable tourism practices. UNEP-WTO 2005, Making Tourism More Sustainable – A Guide for Policymakers, UNEP & WTO, Paris.
The Global Sustainable Tourism Council for Hotels and Tour Operator’s website provides a list of the Principles of the GSTC criteria, the minimum criteria that any business or tour provider should aspire to reach.
Global Sustainable Tourism Council 2012, Global Sustainable Tourism Criteria for Hotels and Operators. Available from: <http://www.gstcouncil.org/resource-center/sustainable-tourism-gstc-criteria/criteria-for-hotels-and-tour-operators.html>. [September 15 2012].

177page1 2 3 4 5 6 7 8 9 10 11 12 13 14
Part B
© Lewis Akenji


12 Fiscal Reforms
13 Redefining Education for SCP
14 Energy Efficiency

180page
Fiscal ReformsKey Points
• There are a number of economic instruments available for SCP.• These include cap and trade, ‘polluter pays’, ecological budget and
tax reform and removing subsidies. • Ecological budget and tax reform can generate multiple dividends
(environmental, employment, efficiency).
This chapter considers opportunities for fiscal reforms for SCP. It highlights the benefits and challenges of four approaches, namely cap and trade, special taxes, ecological budget and tax reforms and removal of subsidies. It highlights the benefits and challenges for each of the approaches and discusses opportunities for their use in developing and transition economies.
Ecological budget and tax reform for SCP Since the end of the 20th century there has been evidence of a changing economic context in which the price of natural resources has been rising and becoming increasingly volatile. This suggests that resource efficiency should become a priority of national governments’ policy planning and should also play a major role in strategies in the private sector. At the same time, climate change driven by rapidly increasing global CO2 emissions has also become an urgent political topic, indicating that significant efforts are needed to curb global emissions. Comprehensive policies for increasing resource efficiency and reducing emissions are needed to deal with rising natural resource prices and to mitigate CO2 emissions.
Ecological budget and tax reform is a means of steering economies towards greater resource efficiency, lower emissions and sustainable consumption and production. Such economic instruments can shift production costs away from labour towards natural resources and emissions. Economic instruments can be a cost effective and efficient way of changing incentives to guide consumers and producers towards lower resource and emissions intensity in their daily consumption, and in the way production processes in businesses are organised. There is a suite of economic instruments available to achieve this including:
• Cap and trade systems for resources and emissions.• Special charges based on the ‘polluter pays’ principle.• Ecological budget and tax reform.• Removing subsidies for large consumers of, for example, energy and electricity.
If applied correctly and often in combination with command and control approaches, economic instruments can help to:
• Increase prices of environmentally damaging goods and services, while increasing the returns for more sustainable approaches - leading to more sustainable production and consumption patterns.
• Reduce compliance costs by providing flexibility to polluters or users of natural resources to choose the most cost-efficient and environmentally effective measures.
• Minimise the overall cost of achieving a given pollution control target.• Create dynamic incentives for investments to innovate and continually improve environmental
technology, generating both environmental and financial benefits (“win-win”).• Allocate property rights and responsibilities of firms, groups, or individuals so that they have both the
incentive and the power to act in a more environmentally-responsible manner.• Raise revenues that can be used for environmental purposes or for social benefits (e.g. decreasing
income taxes).
Among these economic instruments, ecological budget and tax reform appears to be a far-reaching and advantageous instrument. It can be designed in a cost neutral way, so as not to increase the total tax burden. This would allow the costs of natural resources and emissions to be increased dramatically, by up to 5%–10% of GDP. As overall production costs would remain stable, the likelihood of opposition from businesses should be substantially reduced, and business leaders could focus on process innovation.
A well-designed ecological budget and tax reform can yield a triple dividend of reduced environmental pressures and impacts, increased employment and growth in efficiency. It could potentially also have positive distributional effects.
12

181page1 2 3 4 5 6 7 8 9 10 11 12 13 14
Part B
Policy options for fiscal reform
During most of the 20th century, the price for natural resources (energy, water, metals and food) was low because of abundant endowments and very affordable extraction methods. Many reserves offered easily accessible, high-grade materials. As a result, the cost of natural resources for production was only around 5% of the total input costs and was therefore ignored by most businesses and governments. Most of the effort and investment went into increasing labour productivity, very much in line with standard economic theory, at the cost of a wasteful approach to natural resource use and ever increasing amounts of waste and emissions. There is ample evidence that the time of low prices for natural resources has ended. Over the past ten years the prices of many natural resources have grown substantially and have also become increasingly volatile. This has been driven by the growth dynamic of Asia-Pacific and the large amounts of natural resources that have been required to fuel the industrial transformation in many developing economies, most notably in China. Urbanisation and industrialisation processes have altered resource use patterns and an emerging middle class is engaging in new lifestyles and consumption behaviours. In aggregate, this has underpinned the growth dynamic of natural resource use and emissions across the globe.
Increasing the productivity of natural resources and energy
The large increases in consumption of food, energy, water and metals resulting in environmental and resource consequences over the past decade can be dealt with in two ways. There must either be a drastic reduction of natural resource use through reduced consumption of goods and services, or resource efficiency needs to increase. The potential for resource efficiency gains is indeed very large in many parts of the economy, in particular for housing and construction, mobility and transport, food and agriculture as well as in heavy industries and the manufacturing of consumer goods.
In some areas, resource efficiency gains could be as large as 80%. This would involve large improvements in energy efficiency, switching to low carbon renewable fuels, heat and power recovery, changed feedstock, product innovation and large scale improvements in material efficiency such as through lightweight materials in the building sector, and reuse and recycling systems. Achieving these changes will require moving from labour productivity to resource productivity, encouraged and steered by economic instruments. In the following four sections such instruments are discussed and it is argued that ecological budget and tax reform in competitive markets may have great capacity for steering economies towards sustainable consumption and production.
Cap and trade systems for resources and emissions
Cap and trade systems are most useful when a goal for natural resource use or emissions reduction has been established based on scientific analysis, such as for greenhouse gas emissions. In such a case the amount of tradable permits would establish the desired consumption and emissions levels of a natural resource or an emission, establishing the cap. Permits would be traded on the market. The market mechanism of supply and demand would result in a price which each consumer or emitter would have to pay, in addition to the cost of the raw material procured. More ambitious goals for reducing natural resources or emissions would be achieved by reducing the number of permits further leading to additional price increases. Businesses and consumers would be encouraged to implement resource efficiency measures to offset the price rises. This would lead to innovation in production technologies, investments in green infrastructure and changes in consumption behaviour.

182page
Trade
CAP
Left overAllowancefor sale
CO 2
ExcessCO 2
Allowances
Money
Greenhouse gas emissions price setting by tradable permits, including a cap for total emissions, is one of the most important policy options for mitigating climate change. It is both a cost effective and efficient way of influencing the behaviour of businesses and households and guiding them towards resource efficiency and low carbon strategies. There are, however, a number of institutional issues on how to best design and implement a cap and trade system. Most importantly, policy needs to deal with the fact that there will be winners and losers from the introduction of such an economic instrument and that there will be a need for compensation for high emitters during a transition period, and for low income households which will be facing price rises for electricity and transport.
There are numerous challenges in designing and implementing a cap and trade system.
• First, a compromise on an overall reduction goal for emissions needs to be achieved and there will be groups interested in more or less ambitious reduction goals. In practice, this may mean that influential players who have an interest in less ambitious goals may prevail in the discussion. If this occurs, political negotiations might result in creating a toothless instrument that does not have the required capacity.
• Secondly, the level of compensation is an important design criterion. If for example, the level of compensation for large polluters is set too high or the transition period is too long, this may adversely affect the price of permits and may lead to a very low price with little capacity for steering the macroeconomic changes required. On the other hand, during periods of economic booms the price of permits could rise unpredictably, threatening investment and disproportionately increasing the risk for businesses.
• Thirdly, the concept of tradable permits for emissions relies on readily available, accurate and credible emission accounts of governments and businesses, which can only be expected for some emissions, some natural resources and for some countries that have advanced statistical reporting.
• Finally, since many of today’s economic processes are globalised, a system of tradable permits at some point would need to be implemented internationally. There are likely to be trade-offs between the optimal allocation instruments at national and international levels, which would need to be resolved.
Despite these challenges cap and trade systems have great potential, especially for reducing CO2 emissions.

183page1 2 3 4 5 6 7 8 9 10 11 12 13 14
Part B
Box 12.1: Existing, emerging and potential emissions trading schemes
There are a number of existing, emerging and potential emissions trading schemes around the world. They differ in terms of coverage between regional, national and sub-national programs. The programs are also in varying stages of development with a number already implemented, some with implementation scheduled and others currently under consideration.
Implemented: California, Quebec, European Union, Switzerland, Kazakhstan, Australia, New Zealand, and the Regional Greenhouse Gas Initiative/RGGI (North East and Mid Atlantic USA)
Implementation scheduled: Republic of Korea
Under consideration: Chile, Brazil, Turkey, Ukraine, China, Japan and the Western Climate Initiative (British Colombia, California, Manitoba, Ontario and Quebec).
Source: (World Bank 2013).
Special charges based on the ‘the polluter pays principle’
An important means of creating economic incentives for resource efficiency and lowering emissions is the levying of charges. Charges are even more appropriate when the income raised is earmarked for remedial action in the context of the resource consumption or emission. Charges are effective when the damage is thoroughly manifested, the actor that caused it can be unambiguously identified, and measures for repair and prevention can be based on existing technologies and procedures. In other words, the polluter pays principle is most effective for end-of-pipe technical solutions.
Because of these conditions, the overall economic steering effect of charges may be limited. It could include user charges for waste collection, water or sewage treatment. If the government organises the investment through private businesses that have a record in cleaning up, or an interest in reducing future resource use and avoiding waste and emissions, it could become more effective. This would create a carrot-and-stick approach.
The downside is that charges are often difficult to implement and to police and are practically ineffective in cases where the burden of proof cannot be met and the polluter cannot be identified. Whilst in principle the notion of ‘the polluter pays’ is very useful, the applications and the overall economic effect are limited.
Ecological budget and tax reform
Ecological budget and tax reform (EBTR) is a very different economic policy. The primary objective of the EBTR is to stimulate economic subjects to such behaviour that leads to a reduction in environmental damage and its impacts on public health. In short, EBTR is the process of shifting the tax burden from employment, income and investment, to pollution, resource depletion and waste. Ecological budget and tax reform puts taxes on fossil fuels and nuclear energy, on strategic raw materials such as metals and industrial minerals with a focus on those materials which are likely to end up as toxic pollutants or hazardous waste and on the actual emissions and waste. At the same time, other taxes would be reduced making the budget and tax reform revenue neutral and therefore not increasing the overall fiscal burden for businesses.
Because of the revenue neutrality achieved by shifting taxes from income and labour to natural resources and emissions, one should not think about green taxes but ecological budget and tax reform. The steering effect of an EBTR is such that the cost of natural resources is increased and the cost of labour is reduced, which creates an incentive for investment in resource productivity. In other words, through the EBTR the input factor, ‘natural resources’, become more expensive and the input factor, ‘labour’, less expensive. If the principal of revenue neutrality is observed and the EBTR is introduced slowly over a couple of decades, quite high ecological taxes are possible and they may in fact attain a level of 5% to 10% of GDP (Weizsaecker & Jessinghaus 1992).
The higher costs of natural resources will justify business investment into green technologies and eco-efficiency of production. As prices are passed on through the whole economy, the EBTR will also lead to higher prices for consumers of such goods and services that rely on a large amount of primary inputs. Price increases for electricity and mobility will disproportionally affect low income consumers. In order to avoid such undesired effects the EBTR

184page
must be accompanied by compensation payments to low income households and disadvantaged groups. Compensation could be organised through the tax system or may involve direct payments for such households that don’t pay tax at all. Another way of compensating lower income groups and small businesses, which have less potential to invest in resource efficiency, could be to reduce value added taxes.
The fact that ecological taxes could bring in as much as 5%–10% of GDP without damaging the economy as a whole, but with a large overall steering capacity for sustainable consumption and production, creates a compelling argument for an EBTR. On the other hand, introducing an EBTR would be a fundamental economic reform and would require large support in Parliament, from the business community and from society at large. Credible answers to a number of important questions need to be provided. These questions may include:
• What level of ecological taxation can be justified based on the polluter pays principle?• Can the desired steering effect be achieved by raising the cost of natural resources and emissions?• At which level of taxation can an optimal outcome for resource efficiency be expected?• What would be the optimal timing for such a reform?• Which other taxes should be lowered to achieve revenue neutrality?• How can undesired distribution effects be avoided or compensated?
Answering these and other important questions in relation to the introduction of an EBTR requires national dialogue and political bipartisanship and would need to get all important players on board. It would unleash creativity, create a culture of innovation and reset the economic context to favour resource productivity and an economic system that relies less on natural resource use and emissions than our current economies.
Removing subsidies for large consumers of energy
For many decades, governments have subsidised the consumption of electricity, coal, water, and other natural resources. Aluminium smelters and other energy intensive industries have obtained major price concessions, making primary resources very cheap. This has created a disincentive for innovation in resource productivity and for lowering the emission intensity of production. Another example is agriculture, a sector that has long received large subsidies for energy and fertiliser use in many countries. In addition, many countries have provided generous subsidies or tax breaks to car commuters, creating a perverse incentive towards increased use of private cars and reducing the competitiveness of public transport. Whilst these subsidies may have created a short-term economic advantage, they are also very costly, slowing the pace of technological development and hampering innovation. These unhelpful subsidies should be removed in order to harmonise ecological and economic goals and enable sustainable consumption and production.
How will an EBTR benefit developing countries
Very often, an EBTR is seen as a strategy for wealthy OECD countries, with little or no potential for developing countries. There are a number of arguments for the early introduction of an EBTR in countries that have a large manufacturing base and show the emergence of a wealthy middle class, pursuing resource and emissions intensive lifestyles and consumption patterns. A number of developing and transitions economies have become net importers of many strategic natural resources including crude oil, metal ores and industrial minerals and will be confronted with increasing costs for sourcing these imports. An EBTR in the OECD and in a number of developing countries could reduce global natural resource demand and ease the pressure on resource prices thereby making them more affordable with positive effects on the balance of trade for developing economies.
Secondly, investment in these countries could be directed towards innovation in sustainable consumption and production, especially with regard to urban infrastructure such as public transport and energy and water efficient housing, allowing for much reduced energy demands for heating, cooling and transport. Such investments in a ‘green economy’ would have lasting effects for many years to come. Economic incentives to steer investment away from the old industrial model towards a green economy would assist in achieving human wellbeing at much lower environmental costs, with positive effects on employment and efficiency.
A triple dividend of ecological budget and tax reform
It is generally accepted among economists that when the consumption or production of a good or service results in a negative external effect, i.e. one that is not reflected in the price of the good or service, then social welfare can be improved by imposing a tax on the good or service (Ekins 2000). Similarly, where there is an environmental externality such as greenhouse gas emissions or the consumption of primary natural resources then the imposition of a tax, set at the right level, will lead to an environmental dividend. If there are possibilities for abatement of the externality at a cost lower than the tax levied, some abatement will take place. This will change the output/externality relationship and the output may grow while the environmental dividend, e.g.

185page1 2 3 4 5 6 7 8 9 10 11 12 13 14
Part B
lower emissions and resource extraction, will also occur.
If the revenues of the environmental tax are used to reduce a tax on labour or to subsidise wages in a part of the labour market where wages are inflexible, this may lead to a rise in employment, i.e. an employment dividend which will also enable increased output. Employment dividends also arise through a shift to labour intensive production and consumption, enabled by the reduced price of labour relative to the taxed environmental inputs.
There is a good likelihood that an efficiency dividend will arise from using environmental tax revenues to reduce other distortionary taxes, but there is also the possibility that environmental taxes may exacerbate rather than alleviate existing tax distortions. This would indicate that optimal environmental tax rates would be below levels suggested by the environmental dividend alone.
Box 12:2 Common objections to ecological budget and tax reform
Despite the evident advantages of an Ecological Budget and Tax Reform (EBTR) there are a number of common objections against this policy instrument. The most common criticism is that ecological taxes, if they were effective, would destroy the very basis of their revenue yield. An effective EBTR would reduce natural resource use and emissions and hence reduced use would lead to a lower tax income. Natural resource prices would decline because of lower overall demand and the steering effect would be reduced. Hence green taxes are either unacceptable for the finance or for the environment department. This challenge can be addressed by introducing a yearly increase of the ecological tax while other taxes would be reduced by the same amount to achieve revenue neutrality. Thereby, revenues for the ecological tax would continue to grow and the steering effect would also grow accordingly.
Another common objection from social policy is that the EBTR would increase inequality because indirect taxes would favour high-income groups and disadvantage lower income earners who have to spend a larger share of their household budget on basic consumer items. Lower income groups could be compensated by a reduced value added tax or by direct compensation payments.
The main argument spearheaded by economist Lawrence Goulder (1995), however, has been that there is no double divided of reduced costs and environmental protection through an ecological tax reform. Goulder and colleagues argued that a positive second dividend only exists if the excess burden of the total tax system – including the excess burden of the environmental tax – declines. For instance, Bovenberg and de Mooij (1994) have argued ‘that environmental taxes typically exacerbate, rather than alleviate, pre-existing distortions – even if revenues are employed to cut pre-existing distortionary taxes’. Increasing a narrow-based green tax and reducing a broad-based tax like a tax on labour income will typically increase the overall distortion of the tax system. Hence, they say that the second dividend is negative and the double dividend hypothesis fails.
The argument put forward by Goulder has contributed to stagnation in interest in ecological taxes. It is important to note that the argument of Goulder has been highly theoretical disregarding the contextual factors that would make an EBTR work. Firstly, even if were true that there is no second dividend the positive steering effect of pricing of externalities would still occur and would be highly beneficial in itself. Secondly, there is a need for practical experience with EBTR and similar approaches that would be beneficial for deciding on the additional measures that would come with an EBTR. In the first round of the European (Emission Trading Scheme) ETS the ability of auctioning was very limited with a minimum of 95% grandfathering. This has since changed with a much more flexible system allowing, for auctioning to a much greater extent. It certainly needs those practical experiences to further improve such market based measures such as an EBTR or an ETS.
Box 12.3: Trialing emissions trading in China
Inspired by emissions trading to provide emissions reduction incentives in the most affordable way for businesses in Europe, the Chinese government is trialing a market-based approach to reduce carbon emissions. Seven regions have been chosen to implement pilot projects: Guangdong, Hubei, Beijing, Tianjin, Shanghai, Chongqing and Shenzhen. These regions represent different socio-economic conditions, which will inform the trial. The energy efficiency and carbon emissions intensity targets to be achieved by 2015 are ambitious and lie a little below 15% reductions. The Chinese Government plans a project-based voluntary emissions trading scheme (ETS) starting in 2012, moving to a mandatory ETS in 2013, an inter-provincial ETS in 2014 and a nationwide ETS in 2015 as part of the 13th Five-year development plan. (Belevrat, 2011.

186page
Further reading 12
Environmental tax reform: does it work? A survey of the empirical evidence reviews the practical experience and available modelling studies on environmental tax reform. It concludes that when environmental tax revenues are used to reduce payroll taxes, and if wage-price inflation is prevented, significant reductions in pollution, small gains in employment and marginal gains or losses in production are likely in the short to medium term, while investments fall back and prices increase. Results are less certain in the long term. They might be more positive if models selected welfare instead of production indicators for the second dividend, and if several important variables, such as wage rigidities and the feedback of environmental quality on production, were factored into simulations.
Bosquet B 2000, Environmental tax reform: does it work? A survey of the empirical evidence, Ecological Economics Vol. 34(1): 19–32.
Mapping Carbon Pricing Initiatives maps existing and emerging carbon pricing initiatives around the world. It examines the varied and interesting techniques that many countries, including developing nations, are using to make their carbon initiatives more robust that what has been seen historically.
World Bank & ECOFYS 2013, Mapping Carbon Pricing Initiatives, World Bank, Washington.
The Use of Economic Instruments in Environmental Policy: Opportunities and Challenges aims to provide policymakers, especially in developing countries, with practical guidance on deciding which types of EIs are likely to work in addressing specific environmental problems.
United Nations Environment Programme 2004, The Use of Economic Instruments in Environmental Policy: Opportunities and Challenges, UNEP.
Green Economy report The Green Economy Report is compiled by UNEP’s Green Economy Initiative in collaboration with economists and experts worldwide. It demonstrates that the greening of economies is not generally a drag on growth but rather a new engine of growth; that it is a net generator of decent jobs, and that it is also a vital strategy for the elimination of persistent poverty. The report also seeks to motivate policymakers to create the enabling conditions for increased investments in a transition to a green economy.
UNEP, 2011, Towards a Green Economy: Pathways to Sustainable Development and Poverty Eradication, www.unep.org/greeneconomy

187page1 2 3 4 5 6 7 8 9 10 11 12 13 14
Part B
© Shutterstock

188page
Redefining Education for SCP
Key Points• There are a number of challenges and opportunities for knowledge
development and learning towards SCP.• Evolving and incresing knowledge and learning competencies are
required to fulfil the SCP challenge.• Programmes and processes already exist that are helpful in initiating
required learning processes.• Policy measures provide an opportunity for upscaling and
mainstreaming necessary educational initiatives.
This chapter has been written with the intention not only to highlight the well-understood role of education in facilitating development of SCP systems but, most importantly, to argue for redefining the whole notion of education. We need to go beyond designated processes (e.g. training activities and educational programmes) and places (classroom and out of class areas where learning explicitly takes place) and develop and test new actions for reducing social, environmental and economic vulnerability. Ultimately, it demonstrates that the challenge of learning goes beyond the domain of formal educational systems and programmes, touching all aspects of life, all sectors and every region.
The role of education in the transition to SCP
Challenges of SCP Education
The importance of consumption and production patterns for influencing the state of the environment and livelihood has long been recognised. A number of policy documents and reports dealing with the issue at the national and international levels have emphasised the importance of education for de-coupling material consumption and growth, generating livelihood opportunities and encouraging more sustainable lifestyles. With such universal recognition of the role of education, there are however, some challenges related to putting various learning processes in place. Such challenges, that are not exclusive attributes of the educational domain, relate to the changing role of knowledge in society in general and most importantly, to aspirations to move towards more sustainable economies (Box 13:1). Development of successful educational responses requires transformation of the educational system itself making it more attuned to societal challenges, developing skills for often very different learning strategies and continuously engaging with critical SCP stakeholders.
13
© Peerayot Sidonrusmee

189page1 2 3 4 5 6 7 8 9 10 11 12 13 14
Part B
Box 13:1 Challenges of learning
Understanding the impact of education has long been the major challenge for giving it adequate place among planned interventions. When education is not directly concerned with development of easily defined skills (e.g. creativity, ability to deal with rapid change or engage with others required for SCP systems), manifestations of learning impacts - both in terms of time and space - are difficult to capture. Today, the dominant research on the effect of the educational systems and approaches related to sustainable development clearly favours impact on the individuals (as opposed to organisations and communities) and formal education (as opposed to non-formal and informal learning).
Another challenge comes from the features of today’s reality. In the modern world characterised by accelerated changes, lack of predictability and multiple economic, financial and environmental crises, different forms of knowledge and learning become a necessity. Even sectors that for a long time adhered to traditional ways of doing things, find themselves in need to adapt to the constant demand for (at least partial) transformation. With often dramatic modifications of the market, political, social and production systems, the task of knowing and learning present an ever growing part of every-day life.
The notion of sustainable development (and linked to it understanding of the frameworks for SCP systems) is changing, which leads to the changes in development directions. If consumption-production systems are to support resilient communities, they have to be designed in a manner that allows constant innovation and adaptation while accepting that mistakes will be made along the way.
In developing SCP systems, the major SCP stakeholders, including policymakers, are facing the challenge of reacting to the inflow of seemingly endless new knowledge. As a result, there is a need for constant identification of ongoing knowledge processes, understanding ways of productive engagement with various “knowledge holders”, testing and evaluating impacts of resulting innovations. This presents demands for new competencies and for educational systems that facilitate such competencies.
Development of competencies for SCP calls for practices and, ultimately a system, which overcomes compartmentalisation of responsibilities. Lack of coordination between national policies often results in situations where, for example, green actions are not complemented by skills development response and as a result, do not reach their potential (ILO 2011). On the other hand, lack of enforcement of SCP related policies, such as environmental legislation, precludes demand for green jobs or leaves qualified graduates unemployed (ibid.).
In search of competencies for SCP systems – what learning we seek
Working with the challenges resulting from current consumption and production while leading development of new SCP systems, needs to be guided by competencies related to values, attitudes, knowledge, skills to apply such knowledge and ability to engage in required partnerships.
Critically so, complexity of the SCP area requires broadening learning orientation, first, from understanding of the problem, analysing it, identification of solutions (linking rhetoric and practice), focusing on the proposed solution to understanding the consequences of such an intervention (broadening the scope of the system). While this is absolutely critical for some areas, such as policy making and strategic development, it remains relevant for any field of work.
As a result, critical prerequisites of learning include the abilities to systematically examine real life situations, relating them to strategic actions while engaging transdicsiplinary knowledge and keeping long-term perspective. These required characteristics, that in their most systematic form could be attributed to education for sustainable development (ESD), have important implications. They point out that:
• Learning for SCP takes place in a variety of ways made up of formal education (engaging schools, higher education institutions, educational authorities at the regional and national level, communities) and outside (youth and women groups, civil society and faith organisations, museums, media, business enterprises, agricultural extension authorities, and others).
• Any partner involved at any stage of the life cycle, along the supply chain, in the local communities, among regulators needs to develop competencies that go far beyond technical knowledge of the field.

190page
• Any professional or member of the community who aspires to contribute, through personal or professional actions, into shaping of SCP systems needs to become a non-formal educator themselves, therefore needs to be attentive to the competencies required for such a role.
Box 13:2 DESD and ESD
Following discussions and agreements during the Johannesburg Summit, the United Nations General Assembly, at its 58th Session adopted a resolution to start the Decade of Education for Sustainable Development (DESD) (2005-2014). UNESCO was designated to be the lead agency to promote and facilitate the Decade. The DESD aims at encouraging governments to include ESD into their educational systems, strategies and development plans.
ESD goes beyond a single subject of discipline. It is, “in its broadest sense, education for social transformation with the goal of creating more sustainable societies. ESD touches every aspect of education including planning, policy development, programme implementation, finance, curricula, teaching, learning, assessment, administration. ESD aims to provide a coherent interaction between education, public awareness, and training with a view to creating a more sustainable future” (UNESCO 2012).
Education and learning in the critical areas of production and consumption
Many areas of SCP, often overlapping, indicate challenges from the perspective of knowledge development. The following section is by no means exhaustive, but addresses some of the key challenges in the critical areas of sustainable livelihoods, consumption, production, market change and encouraging sustainable entrepreneurship.
Encouraging livelihood opportunities
Sustainable livelihoods are concerned with the capability to earn income, through formal market and non-market activities, that is sufficient for maintaining (or increasing) quality of life and reducing vulnerabilities. As such, livelihoods cut across issues of consumption and production, private goods and commons and different forms of capital. Education and innovation are necessary for developing an understanding - by individuals and communities - about assets available to them, familiarity with livelihood strategies, risks associated with each strategy and skills necessary for undertaking productive practices. From the perspective of policymakers, ongoing learning would be required for identification of the critical factors that either facilitate (e.g. policy frameworks that encourage livelihood practices that secure ecosystem services and wellbeing of communities) or impede desired livelihood strategies (e.g. corruption, policies disregarding interests of currently disenfranchised).
Aspirations to develop new understandings, skills and attitudes for the transition towards greener, more sustainable markets, will contribute to developing a better quality of life for traditionally low-skill workers. By breaking the cycle of low skill jobs and poor income for workers, the livelihood choices of those who develop these skills would increase.
© Evan Schneider

191page1 2 3 4 5 6 7 8 9 10 11 12 13 14
Part B
Box 13:3 Sustainable livelihoods in Guyana
A study commissioned by The North-South Institute (Griffiths & Anselmo 2010) into viable livelihood alternatives to mining for the Amerindian communities in Guyana found that a diverse number of enterprises working in farming, tourism, craft and community-based natural resource management need to be developed. To develop these livelihood activities, there is a need to secure land rights, address market barriers and develop critical business and technical skills. Facilitation of these skills, however, has to be done with understanding that indigenous communities themselves are uniquely knowledgeable about their traditional practices (farming, handicraft, traditional health, etc). Development of new competencies needs to be facilitated through new models of learning structured around principles of innovation, relevance to a specific situation and social and community engagement. Learning has to happen also on the side of stakeholders of the Ameridian communities, including policymakers, development agencies and commercial entities.
Often, the call for more sustainable production and therefore educational processes to facilitate it, come from the increasing pressure on resources supporting livelihood practices. Resulting emigration or immigration demands total or partial restructuring of occupations and ways of production. For example, loss of soil fertility in some areas could cause an influx of labour from these areas to others, potentially with sensitive ecosystems.
Education for sustainable consumption
Linking knowledge with change practiceFor sustainability-aware consumers (a result of formal and/or informal education) to become a part of the SCP system, information provision alone is not enough. Consumers need to know how to put knowledge into practice. This is particularly challenging as it could demand engagement with partners who may not yet be interested or capable to suggest solutions to the challenges of private or organisational consumption.
In the absence of dominant SCP practices inside or outside markets, consumers and citizens need to learn how to contribute to existing good practices or to co-invent new SCP systems together with other actors. To act responsibly, consumers and other critical stakeholders require competencies that enable them to understand various positions and perspectives, figure critical factors that affect alternative directions of development, be able to evaluate the results and undertake further steps on the basis of such assessment.
Generally, engagement of multiple stakeholders also in search of more sustainable lifestyle options is important, as change practices by individual actors may encounter resistance stemming from traditional or cultural practices in society. Collective learning grounded in local heritage, scientific information and analysis of different options might, as it has been shown by the example of RCE Tongyong (Box 13:4), be successful.
Box 13:4 Working across sectors: Reducing food wastage in The Republic of Korea
Food wastage is a large problem in The Republic of Korea. Regional Centres of Expertise on ESD (RCE) Tongyeong, brought together several partners under the “Clean Plate Movement”. The Movement begun in schools, universities and later included other organisations outside of the educational sector. It brings together knowledge about waste and energy systems, green consumption, food security, farming practices and international food markets along with practices for avoiding food waste.
Deeper engagement - looking for alternatives
Sustainable consumption is a topic relevant for individuals, public and private sector. That is hardly surprising as new, more environmentally and socially benign consumption requires an understanding of available alternatives, their impact along the supply chain and ideas of how the consumption system could evolve and how learning would support such evolution.
Forming conditions for sustainable lifestyles presents a serious challenge, as long-term changes in behaviour may be difficult to achieve by short term interventions. Such interventions, in the form of campaigns (e.g. engaging celebrities or opinion leaders), may contribute to drawing attention to the problems. However, accepting responsibilities and most importantly, linking them to actions requires a set of policies that provide structure and incentives for securing more sustainable lifestyles. It also requires different sets of educational measures rooted

192page
in the local socio-cultural contexts and engaging learners as researchers or co-developers of practices. There is a need to start changing processes based around local resources and capacities, learning throughout the process.
Box 13:5 Consumption - looking for likely alternatives
Sustainable lifestyles in local communities across the globeLaunched in 2005, the Looking for Likely Alternatives (LOLA) project of the Consumer Citizenship Network is a tool for discovering new sustainable solutions for lifestyle choices in local communities. The learners and the teachers who are being assisted with the materials for identifying, describing and presenting cases, give visibility to new models of SCP. They further discuss the identified examples with families, neighbours and friends and by doing so initiate broader social learning.
Realising change in South AfricaPartners of the RCE Makana and Rural Eastern Cape (South Africa), including Rhodes University, participate in development of change practices that contribute to improvement of quality of life while capitalising on locally available resources. The overall premise of the partners is to shift from reliance on awareness and knowledge transfer (‘learning to change’) towards direct engagement of people and organisations into learning practices (‘changing to learn’). Small scale, low cost projects of the community range from support for the local Saturday markets, to development of small cleaning and composting businesses.
Consumption and livelihood
When looking at the notion of sustainable consumption, one ought to look at the meaning that is associated with it. It is critical that in addition to the focus on the environmental dimension, consumers (private and organisational) are able to favour the notion of justice and quality of life for all. It is also important to encourage learning about consumption that is not limited to those who can afford it – many educational processes today, especially those unfolding around green technologies or premium green products, might not be accessible for the less economically privileged. Supporting practices that are accessible for all, while increasing quality of life and livelihood opportunities along the supply chain, would need to become a priority of learning programmes. While some interesting examples of such practices emerge in various corners of the globe there is still a need for more systematic actions engaging economically or socially underprivileged communities as part of the supply chain.
Box 13:6 Consumption and livelihood
In approaches developed to encourage participation of the economically poor in the market activities (Hart 2005) a common principle is to emphasise their role as potential entrepreneurs and consumers. Their inclusion in the supply chain may require the development of new business models that not only deal with the question of what kind of a product or service is a priority for the poor, but also how to satisfy their consumption needs while facilitating their livelihood options. Numerous examples exist where corporations have engaged with vulnerable communities to provide essential products and services, accompanied by learning and training opportunities for both the companies own staff and members of the community.
Increasing the sustainability of cement across Sri Lanka and MexicoHolcim Lanka – the leading provider of cement in Sri Lanka established the Affordable Housing Initiative: House for life, to provide housing for the countries poor. The initiative engaging the manufacturer, Grameen Bank, National Building Research Organization and vulnerable families encourages the use of local sustainable building materials, quality durable construction and livelihood considerations such as including shop fronts in the houses. The initiative required a high degree of informal collaborative learning and training.
Apasco, the Mexican subsidiary of Holcim, not only provides affordable cement prices for the poor (by eliminating middleman in the distribution chains), but also provides learning opportunities for “do-it-yourself” building techniques and improving construction safety. Learning occurs at both the level of the community, as well as within the company, where lessons of Mexican success are explored to be translated across other regions.
Education for sustainable production
Ambitions for more sustainable production practices and aspirations for greener and more sustainable industries calls for development of professional and generic skills. Institutionally, the transition to more sustainable economies often means a decrease (with potential disappearance) of some industries, “evolutionary”

193page1 2 3 4 5 6 7 8 9 10 11 12 13 14
Part B
improvements of production practices and product design in other sectors, emergence of new, greener, industries and productive activities that evolve outside of traditional markets.
Box 13:7 National Cleaner Production Centres (NCPCs)
For a number of decades various initiatives have provided training in the area of more efficient and sustainable production. One of the most significant examples is that of NCPCs supported by UNIDO and UNEP. Among other activities, NCPCs assist companies, large and small, in professional training and coaching of cleaner production auditors. Many experts from NCPCs are also engaged in the educational and research processes of higher education institutions and participate in policy advocacy processes in their respective countries. More information on the NCPCs is given in Chapter 7.
From the educational and learning perspective it means great changes in the ways education and scholarship are conducted, including:
• New skills required by the new market preferences (see next section).• New forms of education for industry employees including more sustainability-oriented technical and
vocational education and training (TVET) as well as ongoing training within companies.• New forms of learning across the supply chain with attention given to the empowerment of suppliers and
customers rather than more traditional compliance inspections.• New forms of cross-sectoral co-engaged learning at the level of local communities – across public-
private or inside public domains.• New forms of scholarship that, while cutting across disciplines, keep in focus practical engagement of
change.
Box 13:8 Technical and vocational education and training (TVET)
TVET plays a very significant role in educating the work force in developing countries. It is responsible for 80% of occupations in China. A transition to more sustainable production consumption systems will call for new professionals. More sustainable TVET, also seen as a strategy to bring more dignity to the technical and vocational jobs, needs to address ethical and sustainability goals associated with each occupational specialisation. The curricula, methods of delivery and required competencies for graduates needs to evolve. Such development itself has to be a collaborative mission of stakeholders from, among others, TVET institutions, government, relevant productive sectors and higher education.
Nation-wide German KOZMET network was formed under the three year BauNachhaltig Project (‘Build Sustainable’). The project, that equates quality with sustainability, focuses on development of pedagogies and learning materials for education of various professions engaged in construction. The project learns from and with small and medium companies in the construction sector that are partners in the process. Key stakeholders of the project include the Faculty of Applied Building Technology of the Hamburg University of Technology, The Federal Institute for Vocational Training and Federal Ministry for Education and Research.
Education for the transition towards more sustainable markets
Greener and more sustainable products and services require availability of new skills for their production and maintenance. For example, demand to develop low-carbon technologies, opens business opportunities where knowledge of cleaner production and innovativeness for developing new business models would be high on the agenda. Presence of new greener technologies and more sustainable services require specialists that might not yet exist or who do not possess all required skills. In addition to the need to educate new specialists, the SCP systems need to address the information, behavioural, regulatory, technical and financial barriers to redirect capital flows from traditional high-carbon to low-carbon investments projects.

194page
Box 13:9 Examples of new skills required by greener markets
• As the largest employer in the world agriculture (UNEP 2008), will face a need for educating farmers and other related occupations in using low-carbon technologies and new ecosystem friendly methods.
• Requirements for low-carbon vehicles will call for skills to develop, produce and service the machines.
• Responsible building practices call for simultaneous application of skills from different fields to design, build and service buildings and infrastructures that are energy-efficient and resilient.
• The energy sector will demand specialists who are able to create, install and support various efficient equipment and electricity systems.
While educational programmes oriented towards SCP systems can be undertaken by a variety of partners, it is critical to understand the requirements for the various skills for the short and long-term development. However, policies that address sustainability-related goals and skills development often are not coordinated. Such integration has begun, for example with the Green New Deal of the Republic of Korea that aligns aspirations for green growth and development of the green technologies with the goals for green skills (with the first step dedicated to the research on the required skills).
Sustainable entrepreneurship
Sustainable entrepreneurship is often celebrated as a potential source of innovation for SCP. Being predominantly a domain of small and medium size enterprises as well as community enterprises it is seen as a source of quick innovations at the technological, organisational and strategic levels. Education of such entrepreneurs should be concerned with competencies for identifying market opportunities to address social and environmental challenges in a manner that satisfies requirements of SCP. A range of measures would be required for not only establishing the educational practices in sustainable entrepreneurship for individuals, organisations and communities but also to establish mechanisms which encourage entrepreneurial activities.
Box 13:10 Education of green entrepreneurs in Kenya, Uganda and Tanzania
The Youth Entrepreneurship Facility (YEF) is an initiative of the Africa Commission (ILO 2012), the Youth Employment Network (YEN) and the International Labour Organization in Kenya, Uganda, and Tanzania. The initiative sees green growth as particularly promising for youth employment and has led to remarkable results.
Some of the features of the program include:• exposure of secondary school youth to green entrepreneurship training;• development and adoption of the training materials;• cooperation with existing business associations to green their business portfolio;• prizes for the green business plans; • green mentorship; • green business development loans;• policies for promotion of green enterprises.
Since its conception in 2010, over 400 university students and 4,680 secondary school students have participated in the programme in Kenya, with thirty one companies developed as a green or greening enterprises. In 2010-2011, under the Chase Bank Enablis ILO Business Launchpad competition more than 5,000 entrepreneurs were trained in greening business strategies. Seven training of trainers sessions resulted in 105 trainers qualifying to train start your business programme.
New governance challenges and a new approach to learning
Individual areas of SCP that call for interventions, with learning and new knowledge playing a critical role, is part of a much larger challenge of SCP governance. To achieve SCP we would have to overcome the situation where, for example, product design remains largely the responsibility of producers with consumers playing a passive role or where the more conventional forms of businesses overshadows opportunities offered by more sustainable production activities that don’t have the scale or access to resources and markets. Traditional models and role distributions need to be challenged, and existing educational practices that reinforce these may need to be redesigned. In the domain of SCP, it is likely that many solutions will need to go beyond individual sectors and “traditional” stakeholders.

195page1 2 3 4 5 6 7 8 9 10 11 12 13 14
Part B
To enhance governance of the SCP system, education of a variety of partners needs to focus on the capabilities to look at a broader slice of the SCP system than traditionally practiced within the professional sectors. For example, effective and sustainable capacity building needs to cut across all segments of education and life-long learning - including educational curricula for formal educational column, vocational education, leadership programmes, data collection and analysis processes, research and innovation programmes, community outreach and grassroots training.
Box 13:11 UNU’s ESD multi-stakeholder initiatives
Education for sustainable developmentRegional Centre of Expertise (RCE) is a network of existing formal and non-formal education organisations mobilised to deliver ESD in the region or locality where it is situated. It creates a platform for dialogue among regional/local ESD stakeholders and for exchanging information, experience and good practices on ESD. There are currently 116 RCEs worldwide. RCEs engage in capacity building through education and training in several SD issues including SCP.
ProSPER.Net in Asia-PacificTwenty eight reputed higher education institutions of ProSPER.Net in Asia-Pacific (Promotion of Sustainability in Postgraduate Education and Research Network) work together to integrate SD into postgraduate courses and curricula as well as in research programs. The network has developed learning modules for various professionals, re-orientation of business schools curricula, e-learning programme for public policy and alternative approaches for university appraisal based on sustainability principles. One of the ProSPER.Net Programmes, coordinated by TERI University, focuses on online education for the policymakers interested in SCP and climate change.
To facilitate the transition towards SCP, education for the policymakers and regulators is a primary task. As governments play a critical role in changing existing consumption and production systems, both through legislative provisions and incentives, it is essential that new competencies are developed on the side of the policy and decision makers. The programmes of capacity development for the governmental officers and policymakers would need to enable them to identify, create or further develop different policy packages/options and assess them from the perspective of environmental, social and economic impacts in a particular context. Part of such assessment would need to relate desired development directions to the required skills and other competencies necessary to achieve it.
Facing the main challenges of the transition towards a more sustainable economy, calls for new leaders who are able to facilitate the required transformation. Internationally, we observe emergence of important programmes that are focused specifically on the policy and decision makers in the national and sub-national governments.
Important examples of educating such leaders are available around the world. For example, the Ministry of the Environment of Japan is facilitating Environmental Leadership Initiatives for Asian Sustainability (ELIAS), focussed on the development of environmentally-conscious citizens and environmental leaders. The initiative, led by universities, is built on facilitating three characteristics of a leader (at the level of ordinary citizens or a high level decision maker) - commitment, expertise and leadership.
Box 13:12 Building the capacity of policymakers across Chile, Indonesia and Tanzania
UNEP, in collaboration with various international partners, facilitated a pilot project focusing on mainstreaming education for sustainable consumption (ESC) and lifestyle into curricula of formal and informal education in Chile, Indonesia and Tanzania. Building on literature reviews and national consultations, the project ‘Institutional Strengthening of Education for Sustainable Consumption’, offered ESC implementation strategies and road maps for the relevant ministries, and partners in various educational settings.
For an effective coordinated response to emerge, a partnership of formal and non-formal education, researchers, policymakers and civil society must emerge at the national and sub-national levels. Models of such practices are gradually emerging. These contribute to the formation of a global learning space for sustainable development, including sustainable consumption and production issues, and the transformation of knowledge and learning towards sustainable development.

196page
Policy options for education and learning for SCP systems
The transition towards more sustainable economies reliant on different production and consumption systems will require massive responses at the level of industries, government, public-private alliances and multi-stakeholder partnerships. It will eventually demand radical transformation of educational and training systems. Key points for policy reform for education for SCP are summarised below.
• Education of policymakers is essential, as they will pave the way for legislation and policies which will drive and support the transition towards SCP. Competencies need to be developed to enable policymakers across the world to identify, create and further develop policy options supportive of environmental, social and economic sustainability.
• Generally, SCP-related policy measures would have to be coordinated and aligned with measures for development of competencies that would secure implementation of these policies.
• Education, awareness raising and information provision with respect to SCP are important for informed choices by citizens and organisations. Still, they do not guarantee a shift in behaviour or emergence of new SCP systems.
• Educational initiatives that promote SCP, with some of them referred to in this section, highlight the necessity for new and different education for all segments of society and sectors of industry. They demonstrate that development of merely technical skills for existing or for newly emerging jobs are not sufficient. There is also a need for developing additional competencies such as understanding of links between personal/professional activities and environment, ability to innovate and engage with other partners as well as for measures that promote and foster application of the required competencies. Educational approaches promoted by ESD could provide valuable and practical insights into ways of structuring educational processes for SCP.
• It is recognised that while the pedagogies for cultivating sustainability competencies are being gradually developed by formal education, it remains a challenge within non-formal, informal and TVET learning. Teaching innovations and teaching competencies for teaching leadership, networking, communication, innovation, complexity of decision making, negotiation and risk management are fundamental for the success of SCP strategies. If education of teachers and trainers (also with the goal of increasing their number) is not addressed, it could become the major impediment for desired development.
• When recognising the need for education in the transition towards SCP, critical attention should be given to policies that enable educational programmes and processes targeted at partners with lesser financial or negotiating power such as local communities, small and medium size companies (SMEs), the vulnerable and the marginalised.
• Finally, while engaging partners for whole education is a professional activity (schools and higher education, TVET system, professional training organisations), it is important to provide incentives to the organisations, programmes and networks that have an existing track record in engaging and learning across different sectors and segments of society nationally or internationally. Such organisations often consider learning as part of the innovation process developing new alternatives for SCP.

197page1 2 3 4 5 6 7 8 9 10 11 12 13 14
Part B
Further reading 13
Skills for Green Jobs: A Global View demonstrates the importance of skills for enabling more sustainable growth of the developed and developing countries. It demonstrates numerous examples of educational practices, policies that facilitate them as well as principles that guide such policies.
International Labour Organization, 2011, Skills for Green Jobs: A Global View, Report of the ILO prepared by Strietska-Ilina O, Hofmann C, Durán Haro M & Jeon S, Geneva.
Here and Now! Education for Sustainable Consumption: Recommendations and Guidelines is primarily intended for the policymakers. It delivers a case for education for sustainable consumption by linking it to other national goals including good citizenship and environmental protection. It shows how education could unlock the potential of sustainable development and provides guidance on integration of educational and sustainable development strategies.
United Nations Environment Programme 2010, Here and Now! Education for Sustainable Consumption: Recommendations and Guidelines, UNEP, Paris.
Towards more sustainable consumption and production systems and sustainable livelihoods: learning contributions of the RCE Network demonstrates how multi stakeholder cross sectoral partnerships could advance SCP practices through co-engaged learning and innovation. Drawing on the practices of the Regional Centres of Expertise for ESD from different world regions, including Asia, it highlights how a combination of cross-efforts from multiple stakeholders, including governments, contributes into to the areas lifestyle choices, green skills development through technical and vocational education and training (TVET), green industries, governance for a greener economy and sustainable livelihoods. It further explores the strategies for up-scaling and mainstreaming such initiatives.
Fadeeva Z, Payyappallimana U &, Petry R 2012, Towards more sustainable consumption and production systems and sustainable livelihoods: learning contributions of the RCE Network. UNU-IAS.
Education for Sustainable Development: Sourcebook, The Toolkit is an easy-to-use manual for beginning the process of combining education and sustainability. The purpose of the publication is to describe ways in which education for sustainable development (ESD) can be integrated into primary and secondary schooling.
UNESCO 2012, Education for Sustainable Development: Sourcebook, United Nations Educational, Scientific and Cultural Organization, Paris
198page
Energy Efficiency
Key Points• Energy efficiency is very important for both developed and developing
countries.• There are economic, social and environmental benefits from energy
efficiency.• What are the drivers, barriers and policy options to achieve energy
efficiency?• Energy efficiency improvements reduce demand and can often
alleviate the need to increase supply.
What is energy efficiency and why is it important?
Energy is widely recognised as the engine for economic growth and modern life. The way we live, construct, produce, eat and commute has a major bearing on energy, most of which is derived from coal, oil and natural gas. Fossil fuels are being consumed at a much faster rate than they can be replenished. If we continue to demand fossil fuels at 2006 rates, the reserves of oil, coal and gas will last a further 40, 200 and 70 years, respectively.
Under the business-as-usual scenario, the world energy demand is expected to increase from around 12 Gigatonnes (Gt) now to over 16 Gt by 2030. Business as usual is therefore no longer an option and we will face dire consequences if we fail to act with clarity of purpose and raise energy productivity radically.
Industrialised nations went through three distinct phases of development—poverty alleviation, industrialisation and mass production and consumption. Many developing countries are experiencing a simultaneous occurrence of all three phenomena. If adequate measures are not taken, it will have devastating consequences on development across the world, in the form of rising energy prices, energy supply volatilities, unaffordable goods and services, stagnant or negative economic growth and degraded life style. There is an urgent need for a paradigm shift in energy consumption, as it will have far-reaching impacts on development, the balances in global resources and the global climate.
Box 14:1 Energy intensity and Energy Efficiency
Energy Intensity is defined as the ratio of energy consumption per unit output or activity (e.g. toe/$ or MWh/Euro). On the other hand, Energy Efficiency improves when a given level of service is provided with reduced amounts of energy inputs or when services are enhanced for a given amount of energy input (e.g. kWh/m2 of air conditioned space per annum or litres of gasoline/100 km travelled). An increase in energy efficiency would mean a decline in energy intensity. In reality, energy intensity includes not just energy efficiency but also some structural and behavioural components. For example, a decrease in energy consumption in a commercial building does not necessarily mean the building has become more energy efficient. Other factors such as changes in activities in the building (occupancy, operating hours), fuel switching, market demand for commercial space, or even the behaviour of the occupants can also affect energy intensity.
While the industrialised world was built with abundant and cheap oil and for a much smaller population, developing countries face high and volatile energy prices as a major obstacle to growth for a burgeoning population, with a sizable number still deprived of access to modern energy services. Energy efficiency offers a great opportunity for innovation and lasting benefits through the reduction of energy use for a given service or level of activity by enhancing energy productivity, and squeezing the maximum out of every unit of primary energy (i.e. doing more with less). The notion of energy efficiency is often associated with adoption of best available technologies and practices (sustainable production, which requires innovation and legislation/obligation). It can also be achieved through better organisation or management and through behavioural changes (sustainable consumption, which requires raising awareness and incentives/ taxes).
According to the International Energy Agency (2009), it is possible to lower energy-related CO2 emissions by 2030 to below the 2009 level, by various technological measures. Interestingly, energy efficiency alone has the potential to contribute a 57 per cent reduction in CO2 emissions, and much of it at a fraction of the marginal cost of energy supply.
14

199page1 2 3 4 5 6 7 8 9 10 11 12 13 14
Part B
Figure 14:1 Possible ways to lower energy related CO2 emissions by 2030
Source: (IEA, 2009)
Box 14:2 Where do we stand in terms of energy productivity?
Here are a couple of examples of abysmal energy productivity in our day-to-day life and possible solutions to dramatically enhance energy productivity:
• Less than 1% of the energy in petrol or diesel moves us in an automobile. The vehicle’s weight alone is responsible for two-thirds of the energy needed to move it. Vehicles can be designed to be more compact and aerodynamic, constructed with ultra-light but ultra-strong materials and equipped with more efficient engine technologies and drive-trains to achieve at least a factor-10 efficiency improvement.
• Less than 3% of the energy in fossil fuel keeps us comfortable in hot or cold climates while the remaining amount is lost in the form of heat losses or gains through poorly designed building shells. Buildings can be designed with the right materials, shape and orientation, minimising or avoiding altogether the need for traditional heating and cooling equipment.
The CO2 abatement curve developed by McKinsey (2009) for India shows that many energy efficiency measures can be attained at negative costs on the basis of life-cycle analysis. Such energy efficiency measures identified for India are also relevant for other developing countries around the world.
© Eskinder Debebe

200page
Figure 14:2 India’s abatement cost curve for 2030 (cost below EUR 100/tonne)
Source: (McKinsey 2009)
Energy efficiency can be considered as the keystone to achieve sustainable consumption and production at country level, or eco-efficiency at corporate level. Investment in energy efficiency is extremely attractive as the incremental capital investment is mostly recovered in a reasonable time frame, energy cost is lowered, and energy productivity improves, thus helping nations and businesses to be better prepared against sharp and unpredictable hikes in fossil fuel prices in future. Moreover, unlike fossil-based energy supply options, energy efficiency does not have adverse impacts on water supplies, coastal wetlands or coral reefs and does not result in spills, accidents, explosions or fires. Hence, there is need for concerted efforts to tap this “low hanging fruit”.
Box 14:3 Negawatt and Factor-4 Efficiency
A negawatt is a unit in Watts of energy saved. For example, when a 20-Watt compact fluorescent lamp replaces a 100-Watt incandescent bulb without sacrificing the quality of lighting service rendered, it can be considered as an 80-negawatt power plant because 80 Watts are saved at the end-use by quadrupling the efficiency of the lighting device (also referred to as factor-4 efficiency). The power utility can use this saved electricity to satisfy another customer without the need for investment and the fuel to generate and transport electricity from the power plant to the customer. In fact, the fossil fuel savings are even greater if one considers that every Watt delivered to a customer requires roughly 4 Watts of fossil fuel due to the energy losses in the thermal power plant and the transmission and distribution network.
Just as the compact fluorescent lamp provides an opportunity to divide the electricity consumption by a factor of four without any compromise in the quality of service, there are similar opportunities for changes in the way we provide thermal comfort in homes and offices, manufacture products in factories, grow food in farms, or transport people and goods. Individual products/devices can improve energy efficiency significantly, but the most impressive savings come from optimising entire systems and processes.
Consider the vast need for energy to sustain the present trend of economic development in developing countries. Meeting the future energy demand will require huge investments and will involve inefficient conversion of depleting fuels into premium forms -- mainly electricity -- in ever larger, more complex, more centralised plants. If on the other hand, we started taking the “soft energy path” and joined the bandwagon of “negawatt revolution” that the eminent American Scientist Amory Lovins referred to as early as 1989, we could gradually squeeze out fossil fuels by a combination of energy efficiency and appropriate renewable energy sources.
The Titanic sank by hitting an iceberg due to the Captain’s misjudgement. Investment decisions are very often made on the basis of the first-cost, which can be like the tip of the iceberg, hiding the operation and maintenance costs that are several-fold greater. For example, the annual cost of lighting an incandescent bulb can be 30 times more than its initial cost, or the cost of a typical boiler can be equivalent to hardly 3-4 months

201page1 2 3 4 5 6 7 8 9 10 11 12 13 14
Part B
of fuel cost to produce steam from it. Energy efficiency solutions may be modestly more expensive but on the basis of life-cycle analysis, the cost of saving energy is lower than the cost of subsidised fossil fuels.
Policy options, barriers and drivers to promote energy efficiency
Developing countries with per capita energy consumption below the world average need undoubtedly more energy to meet the rapidly growing demand for housing, industries, transport, and services and achieve the Millennium Development Goals (MDGs). However, this need not be at the cost of using energy inefficiently. A well-conceived energy efficiency strategy will allow them to achieve their developmental objectives with lower energy consumption and enable them to improve the living standard and quality of life. For countries that face the added challenge of achieving the target of production and services under energy supply constraints, the deficit in energy supply can be effectively met by minimising the “energy waste”.
Box 14:4 Drivers for energy efficiency
• Energy security - Reduce energy demand growth, improve energy supply reliability, and minimise dependence on energy import (maximise energy export in energy-surplus countries).
• Economic competitiveness - Reduce energy intensity, lower production cost to make the products more affordable to users, enhance energy productivity, and improve (domestic and export) competitiveness.
• Health - Reduce local (solid, liquid and gaseous) pollution and improve human health.• Climate change - Abate the adverse impacts of energy use on the regional and global environment
(emissions of greenhouse gases and acid rain).
Huge technological progresses have been made to improve the efficiency of energy consumption and production. In practice however, it can be challenging to tap and capture the most potential energy values from our fossil as well as renewable energy resources, in the overall process of their extraction/capturing, conversion, transportation and use. There are several barriers to making this transition. Governments, businesses and individuals can all play a role, but there is no easy way to coordinate their actions. Barriers to investing in energy efficiency include lack of information and awareness, inadequate knowledge, limited access to technology, market failures, lack of resources and limited capital, poor institutional structure and a lack of incentive mechanisms.
Box 14:5 Typical barriers to energy efficiency
1. Information and awareness - Lack of information on actual energy consumption and energy saving potentials, lack of knowledge of best practices and best available technologies.
2. Behavioural and organisational - Behavioural characteristics of individuals and organisations that hinder the propagation of energy-efficient technologies and practices.
3. Technical - Absence of affordable energy-efficient technologies suitable to the local context; inadequate capacity of energy users to identify, develop, implement energy efficiency projects.
4. Market - Market structures and constraints that prevent energy users from appraising the true value of energy efficiency.
5. Financial - High up-front costs of energy efficiency solutions and the low energy supply tariffs prevailing in many developing countries; lack of awareness of financial institutions of the financial benefits of energy efficiency investments, etc..
6. Structural - Structural characteristics of the political, economic, energy system which make energy efficiency investment difficult.
7. Institutional - Weak institutions to support energy efficiency; institutional bias towards supply-side investments.
8. Regulatory - No regulation to invest in cost-effective energy efficiency; subsidised energy supply.
According to a recent IEA (2009) study covering 38 developing countries, fossil fuel consumption subsidies amounted to 409 billion USD in 2010, with subsidies to oil products representing almost half of the total. While governments argue that lower energy prices are beneficial for economic growth and can make the products and services more affordable, there are several perverse impacts of such short-sighted policies. Subsidies are irrational use of taxpayer money and government investment, more often benefitting the elites and upper classes than the poor in developing countries. Also, a low energy price is a deterrent to the adoption of energy-efficient equipment and processes, eroding the competitiveness of manufactured products and services.
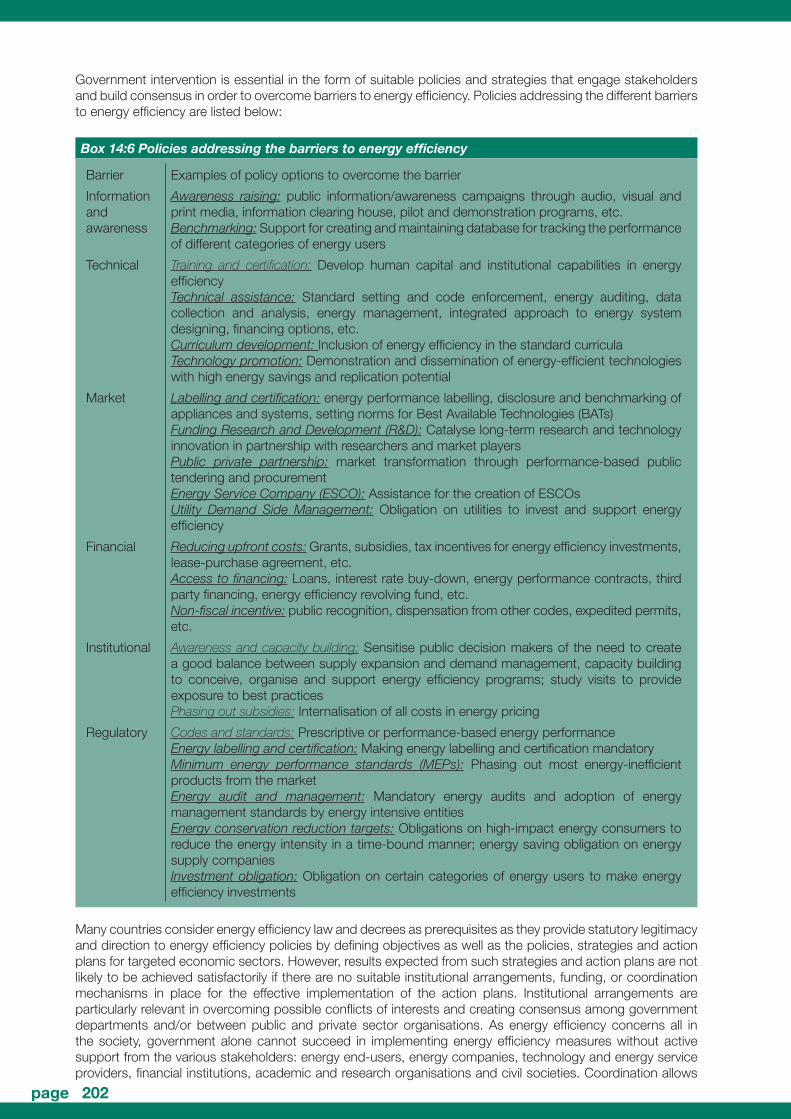
202page
Government intervention is essential in the form of suitable policies and strategies that engage stakeholders and build consensus in order to overcome barriers to energy efficiency. Policies addressing the different barriers to energy efficiency are listed below:
Box 14:6 Policies addressing the barriers to energy efficiency
Barrier Examples of policy options to overcome the barrier
Information and awareness
Awareness raising: public information/awareness campaigns through audio, visual and print media, information clearing house, pilot and demonstration programs, etc.Benchmarking: Support for creating and maintaining database for tracking the performance of different categories of energy users
Technical Training and certification: Develop human capital and institutional capabilities in energy efficiencyTechnical assistance: Standard setting and code enforcement, energy auditing, data collection and analysis, energy management, integrated approach to energy system designing, financing options, etc.Curriculum development: Inclusion of energy efficiency in the standard curriculaTechnology promotion: Demonstration and dissemination of energy-efficient technologies with high energy savings and replication potential
Market Labelling and certification: energy performance labelling, disclosure and benchmarking of appliances and systems, setting norms for Best Available Technologies (BATs)Funding Research and Development (R&D): Catalyse long-term research and technology innovation in partnership with researchers and market playersPublic private partnership: market transformation through performance-based public tendering and procurementEnergy Service Company (ESCO): Assistance for the creation of ESCOsUtility Demand Side Management: Obligation on utilities to invest and support energy efficiency
Financial Reducing upfront costs: Grants, subsidies, tax incentives for energy efficiency investments, lease-purchase agreement, etc.Access to financing: Loans, interest rate buy-down, energy performance contracts, third party financing, energy efficiency revolving fund, etc.Non-fiscal incentive: public recognition, dispensation from other codes, expedited permits, etc.
Institutional Awareness and capacity building: Sensitise public decision makers of the need to create a good balance between supply expansion and demand management, capacity building to conceive, organise and support energy efficiency programs; study visits to provide exposure to best practicesPhasing out subsidies: Internalisation of all costs in energy pricing
Regulatory Codes and standards: Prescriptive or performance-based energy performanceEnergy labelling and certification: Making energy labelling and certification mandatoryMinimum energy performance standards (MEPs): Phasing out most energy-inefficient products from the marketEnergy audit and management: Mandatory energy audits and adoption of energy management standards by energy intensive entitiesEnergy conservation reduction targets: Obligations on high-impact energy consumers to reduce the energy intensity in a time-bound manner; energy saving obligation on energy supply companiesInvestment obligation: Obligation on certain categories of energy users to make energy efficiency investments
Many countries consider energy efficiency law and decrees as prerequisites as they provide statutory legitimacy and direction to energy efficiency policies by defining objectives as well as the policies, strategies and action plans for targeted economic sectors. However, results expected from such strategies and action plans are not likely to be achieved satisfactorily if there are no suitable institutional arrangements, funding, or coordination mechanisms in place for the effective implementation of the action plans. Institutional arrangements are particularly relevant in overcoming possible conflicts of interests and creating consensus among government departments and/or between public and private sector organisations. As energy efficiency concerns all in the society, government alone cannot succeed in implementing energy efficiency measures without active support from the various stakeholders: energy end-users, energy companies, technology and energy service providers, financial institutions, academic and research organisations and civil societies. Coordination allows

203page1 2 3 4 5 6 7 8 9 10 11 12 13 14
Part B
extensive consultation with stakeholders and ensures transparency in the energy efficiency strategy development process. Moreover, all partners clearly understand their responsibilities and provide support for the successful implementation of programmes.
Figure 14:3 Example of stakeholders in the building sector
Source: (WBCSD 2009)
Developing countries generally tend to emphasise regulations more than the free-market approach, as they find it challenging to mobilise adequate funds to translate energy efficiency policies into action. However, a balance between market mechanisms (carrots) and regulations (sticks) is needed to ensure the effectiveness of national energy policy initiatives. A steady and reliable source of funding can finance the implementation of energy efficiency programmes. Governments can allocate budget for such activities by earmarking energy/environment taxes and public benefit charges that are exclusively used to fund energy efficiency programmes.
Energy efficiency experience
The rapid growth of Energy Conservation/Efficiency Frameworks adopted or Acts/Laws promulgated by many countries reflects their recognition of its critical role in sustainable development, by bridging the demand-supply gap, improving international economic competitiveness, lowering import dependency, protecting against fluctuating energy prices, enhancing national security and reducing the threats of global warming and climate change. Such laws are generally comprehensive in the sense that they target the different economic sectors and a range of energy policy measures, some mandatory and others voluntary in nature.
The level of success however varies a lot from one country to another, depending on the priority given to energy efficiency in the national sustainable development framework and the means mobilised to translate the policy into action. Weak institutional capacity appears to be one of the key reasons for the gap between the planning and implementation of national energy efficiency policies. As a result, the institutional and coordination mechanisms are lacking and energy efficiency programmes are not always sustained, especially during periods when oil prices are low. On the other hand, when energy prices shoot up, many governments tend to protect end-users by subsidising energy and absorbing the economic liability. In such cases, there is a need for improving legislation, regulation, and standardisation and other policy and institutional measures. Experience in several developing countries shows that energy performance standards and labelling schemes for appliances and equipment are a cost-effective policy tool for transforming markets and encouraging energy-efficient products. Governments usually follow a process of consensus and negotiation of standards that the industry can meet with reasonable increases in prices. Initially a voluntary target is applied. As the market transformation proceeds, the targets are introduced as standards. However, standards may fail to induce sufficient energy-efficiency improvements if they are largely based on negotiations with industry members without any explicit standard-setting method and if they are not revised periodically.

204page
To conclude, the downward trend of energy intensity in many developing countries is a good sign of the positive impacts of energy efficiency. However, we are still quite far from realising the significant potential that energy efficiency offers, at costs below the rising fossil fuel prices. Countries that still have a long way to go in the development process may consider taking a more aggressive attitude in order to tap energy efficiency to the fullest. This will enable them to achieve their developmental goals with the least adverse impact on the global environment. This is the intention of the program in India, highlighted below. According to Natural Resources Defence Council (NRDC), similar energy saving initiatives have been adopted by China, as part of the Copenhagen Accord process, with formal commitments for a 40–45% reduction in CO2 emissions per unit of GDP by 2020, compared to 2005 levels.
Box 14:7 National action plan for climate change gives a boost to India’s energy efficiency goals
India adopted the National Action Plan for Climate Change (NAPCC) which will allow the country to maintain high growth rates for increasing living standards of the vast majority of people and reduce their vulnerability to the impacts of climate change. To achieve key goals in the context of climate change, the National Mission for Enhanced Energy Efficiency (NMEEE) was retained as one of the 8 National Missions. NMEEE’s objective is to promote innovative policy and regulatory regimes, financing mechanisms, and business models in order to create, sustain and market energy efficiency in a transparent manner with clear deliverables to be achieved in a time bound manner.
In addition to the on-going efforts to carry out action under the national Energy Conservation Act 2001, 4 new initiatives were introduced to enhance energy efficiency:
• Perform Achieve and Trade (PAT) – This is a market-based mechanism to enhance cost effectiveness of improvements in energy efficiency in energy-intensive large industries and facilities, through energy savings certificates which can be traded.
• Market Transformation for Energy Efficiency (MTEE) – This is a market transformation mechanism to accelerate the shift to energy efficient appliances in designated sectors. Innovative measures will make the products more affordable.
• Energy Efficiency Financing Platform (EEFP) – This is an innovative financing mechanism that will help finance demand side management programmes in all sectors, by capturing future energy savings.
• Framework for Energy Efficient Economic Development (FEEED) – This is a fiscal incentive mechanism to promote energy efficient investment.
The PAT is one of the most promising initiatives, implementing Best Available Technologies and Practices in energy-intensive large industries and facilities through economically viable projects. The principle is quite simple and straight-forward: energy-intensive large industries and facilities consuming energy above a certain threshold are notified by the government as designated consumers. This covers 9 sectors, namely thermal power plants, fertilizer, cement, pulp and paper, textiles, chlor-alkali, iron and steel, aluminium and railways. The baseline and energy efficiency improvement target are specific to each designated facility. When a designated consumer achieves and surpasses the target, it can sell its excess savings in the form of Energy Savings Certificates (ESCerts). On the other hand, if a designated consumer fails to achieve its targets, it must purchase the appropriate number of ESCerts to “meet” its energy savings target.
Accredited Energy Auditors will conduct monitoring and verification of energy savings through a transparent system.

205page1 2 3 4 5 6 7 8 9 10 11 12 13 14
Part B
Further reading 14
Energy Efficiency Governance Handbook was written to assist energy efficiency practitioners, government officials and stakeholders to establish effective EE governance structures for their country. The information is intended to help the reader to develop comprehensive and effective energy efficiency governance mechanisms.
International Energy Agency 2010, Energy Efficiency Governance Handbook, IEA, France.
Factor Five: Transforming the Global Economy through 80% Improvements in Resource Productivity, The Natural Edge Project is an important contribution to a growing corpus of work regarding energy and resource efficiency. It provides a coherent framework and synthesis of the crucial issues of resource use efficiency and decoupling of production from material and energy throughput. There are numerous examples of resource productivity improvements from the most relevant sector.
von Weizsacker & E.U et al 2009, Factor Five: Transforming the Global Economy through 80% Improvements in Resource Productivity, The Natural Edge Project, Earthscan Publication, UK.
Energy efficiency policies around the world: review and evaluation identifies recent trends in energy efficiency performance in selected countries and regions at macro and regional levels. Energy efficiency policies are presented and evaluated on the basis of a survey carried out in more than 70 countries and conclusions are drawn on the advantages and drawbacks of different policies.
WEC 2008, Energy efficiency policies around the world: review and evaluation, World Energy Council, London.
Compendium of energy efficiency policies of APEC economies is intended to promote information sharing in the field of energy efficiency and energy conservation across the APEC economies under a common format. It contains energy efficiency policy information for all APEC economies (with the exception of Papua New Guinea) based on responses to a questionnaire.
APERC 2010, Compendium of energy efficiency policies of APEC economies, Asia-
Pacific Energy Research Centre, Japan.

206page
© Peerayot Sidonrusmee
207page
References
Chapter 1.1European Union n.d..Summaries of EU legislation, Available from: <http://europa.eu/legislation_summaries/index_en.htm#>. [23
October 2013].ISSD n.d., Symposium: Sustainable Consumption, 1994. Available from: <www.iisd.ca/consume/oslo004.html#top>. [10
August 2012].Marrakesh Process Secretariat (United Nations Environment Programme and United Nations Department of Economic
and Social Affairs) 2010, Paving the Way to Sustainable Consumption and Production – Background paper for the Commission on Sustainable Development, Eighteenth Session, CSD18/2010/BP4.
United Nations Economic and Social Commission for Asia and the Pacific 2012, Fundamentals about green growth: ecologically sustainable progress to foster low-carbon, socially inclusive development. UNESCAP, Bangkok.
United Nations Environment Programme n.d.a., What is SCP?. Available from: <http://www.unep.org/resourceefficiency/Home/WhatisSCP/tabid/105574/Default.aspx>. [19 October 2013].
……….n.d.b., Green Economy. Available from: <http://www.unep.org/greeneconomy/AboutGEI/WhatisGEI/tabid/29784/Default.aspx>. [13 September 2012].
Chapter 1.2CSIRO & UNEP 2013a, CSIRO and UNEP Asia-Pacific Material Flow and Resource Productivity Database, Available from <www.csiro.
au/AsiaPacificMaterialFlows>. [23 October 2013].CSIRO & UNEP 2013b, CSIRO and UNEP Latin America and the Caribbean Material Flow and Resource Productivity, Available from
<www.csiro.au/LatinAmericaCaribbeanMaterialFlows >. [23 October 2013].Daly, HE 2007, Ecological Economics and Sustainable Development: Selected Essays of Hermann Daly, Edward Elgar,
Cheltenham.Dittrich M., Giljum, S. Lutter, S. & Polzin C.2012, Green economies around the world? Implications of resource use for
development and the environment, SERI, Vienna.European Commission 2013, EUROSTAT, Available from:< www.ec.europa.eu/Eurostat>. [23 October 2013].Gierlinger, S. & Krausmann, F.2012. ‘The physical economy of the United States of America : Extraction, trade and consumption
of materials from 1870 to 2005’. Journal of Industrial Ecology, vol. 16, no.3, pp. 365-377.McKinsey Global Institute 2011, Urban world: mapping the economic power of cities, McKinsey & Company.Schandl H & J West 2010, Resource use and resource efficiency in the Asia-Pacific region, Global Environmental Change, vol
20, no. 4, pp. 636-647.Schandl, H., A Geschke, Y Cai, J West, T Baynes, D Newth, M Lenzen, A Owen, K Hanslow & Hatfield-Dodds, S. (forthcoming).
Decoupling of global environmental pressure and economic growth. Steinberger, J. K. & Roberts J.T. 2010, ‘From constraint to sufficiency: The decoupling of energy and carbon from human
needs, 1975–2005’, Ecological Economics, vol. 70, no. 2, pp. 425-433.United Nations Environment Programme 2010. Priority products and materials: assessing the environmental impacts of
consumption and production. UNEP, Paris........... 2011, Resource Efficiency: Economics and Outlook for Asia and the Pacific, CSIRO Publishing, Canberra........... 2011b. Decoupling natural resource use and environmental impacts from economic growth, A Report of the Working
Group on Decoupling to the International Resource Panel. Fischer-Kowalski, M., Swilling, M., von Weizsäcker, E.U., Ren, Y., Moriguchi, Y., Crane, W., Krausmann, F., Eisenmenger, N., Giljum, S., Hennicke, P., Romero Lankao, P., Siriban Manalang, A.
.......... 2012, Resource Efficiency: Economics and Outlook for Asia and the Pacific – Update, CSIRO Publishing, Canberra.Weizsäcker von, E, Hargroves, K, Smith MH, Desha, C & Stasinopoulos, P 2009, Factor 5. Transforming the Global Economy
through 80% Improvements in Resource Productivity, Earthscan, London.Weisz, H & Schandl, H. 2008, ‘Materials Use across World Regions’, Journal of Industrial Ecology, vol 12, no. 5-6, pp. 629-
636.West, J & Schandl, H 2012, Recent Trends in Material Flows and Resource Productivity in Asia and the Pacific, UNEP, Bangkok.West, J & Schandl, H. 2013, ‘Material use and material efficiency in Latin America and the Caribbean’. Ecological Economics,
vol 94, pp.19-27.Wiedmann, T, Schandl, H. ,Lenzen, M.,Moran, D., Suh, S., West, J., and Kanemoto, K. 2013, The material footprint of nations
Supporting Information, Available from: < doi/10.1073/pnas.1220362110>. [23 October 2013].World Bank 2012, World Bank Development Indicators. Available from: < http://databank.worldbank.org/ddp/home.do>.[24
September 2012].World Bank & Google Public Data 2012, Google Public Data, Available from: <http://www.google.com>. [24 September 2012].Worldwatch Institute 2004, State of the World Report: The Consumer Society, Worldwatch Institute, Washington.
Chapter 1.2IISD 2010, ‘Summary of the Eighteenth Session of the Commission on Sustainable Development: 3 - 14 May 2010’, Earth
Negotiations Bulletin, vol. 5, no. 292. IISD 2011, ‘Summary of the Nineteenth Session of the Commission on Sustainable Development: 2-14 May 2011’, Earth
Negotiations Bulletin, vol. 5, no. 304.Meadows, DH, Meadows, DL, Randers, J & Behrens WW 1972, The Limits to Growth, Universe Books, New York.

208page
United Nations 1992, Agenda 21: Programme of Action for Sustainable Development, United Nations, New York. ……….1992b. Report of the United Nations Conference on Environment and development (Rio de Janeiro, 3-14 June 1992),
Sales No. E93.1.8 and corrigenda.……….2003. Plan of Implementation of the World Summit on Sustainable Development, A/CONF.165/14.……….2012, The Future We Want. United Nations, New York. United Nations Department of Economic and Social Affairs 2003, United Nations Guidelines for Consumer Protection (as
expanded in 1999), United Nations, Available from: <http://www.un.org/esa/sustdev/publications/consumption_en.pdf >. [13 August 2012].
United Nations Environment Programme 2011, Global Outlook on SCP Policies, United Nations Environment Programme, New York.
Chapter 2.1European Commission 2009, Smarter and Cleaner: Consuming and Producing Sustainably, European Commission,
Luxembourg, Available from: <http://ec.europa.eu/environment/eussd/pdf/brochure_scp.pdf >. [28 August 2012].Ferreira, S & Hamilton, K (2006), ‘Comprehensive Wealth, Intangible Capital and Development’, Policy Research Working
Paper 5452. Available from: <http://www-wds.worldbank.org/servlet/WDSContentServer/WDSP/IB/2010/10/20/000158349_20101020103459/Rendered/PDF/WPS5452.pdf>. [30 August 2012].
Lean, G n.d., At a Glance – Poverty. Available from: <http://www.ourplanet.com/imgversn/122/glance.html>. [12 September 2012].
SWITCH Asia Network Facility, Hernndorf, N & Burcu, T 2009a, Satisfying Basic Needs – Respecting the Earth’s Limits – Part 1: The Challenge, UNEP & Wuppertal Institute, Available from: <http://www.scp-centre.org/fileadmin/content/files/6_Resources/1_Publications_pdfs/33_CSCP_WI__2010__-_Satisfying_basic_needs_The_Challenge_en.pdf>. [28 August 2010].
……….2009b, Satisfying Basic Needs – Respecting the Earth’s Limits – Part 2: The Solution, UNEP & Wuppertal Institute, Available from: <http://www.scp-centre.org/fileadmin/content/files/6_Resources/1_Publications_pdfs/33_CSCP_WI__2010__-_Satisfying_basic_needs_The_Challenge_en.pdf>. [28 August 2010].
TEEB 2010, The Economics of Ecosystems and Biodiversity: Mainstreaming the Economics of Nature: A synthesis of the approach, conclusions and recommendations of TEEB. Available from: < http://www.teebweb.org/Portals/25/TEEB%20Synthesis/TEEB_SynthReport_09_2010_online.pdf>. [20 September 2012].
United Nations Environment Programme 2008, Planning for Change - Guidelines for National Programmes on Sustainable Consumption & Production, United Nations Environment Programme, DTI/1028/PA.
……….2011, Decoupling Natural Resource Use and Environmental Impacts from Economic Growth, A Report of the Working Group on Decoupling to the International Resource Panel, DTI/1388/PA.
United Nations Economic and Social Commission for Asia and the Pacific 2003, Poverty Alleviation through Sustainable Tourism Development, United Nations Economic and Social Commission for Asia and the Pacific, Sales No. E.03.II.F.46
Chapter 2.2Bauman, H & Tillman, AM 2004, The Hitch Hiker’s Guide to LCA, Studentlitteratur, Lund.European Commission - Joint Research Centre - Institute for Environment and Sustainability 2010, International Reference
Life Cycle Data System (ILCD) Handbook - General guide for Life Cycle Assessment - Detailed guidance, European Commission, Luxembourg.
European Commission 2010b, Making sustainable consumption and production a reality, European Commission, Luxembourg.Life Cycle Initiative 2013, Sustainability Framework Supported by Life Cycle Thinking and Approaches, Available from: <http://www.
lifecycleinitiative.org>. [23 October 2013].Menikpura, SNM 2011, Development of Sustainability Indicators for Evaluating Municipal Solid Waste Management Systems
- LCA Perspective. Ph.D thesis, King Mongkut’s University of Technology.United Nations Environment Programme, SETAC & Life Cycle Initiative 2005, ‘Life cycle management: A bridge to more
sustainable products’, LCM Slide Show. Available from: http://www.unep.fr/scp/lcinitiative/publications/training/pdf/1.%20LCM%20-%20a%20bridge%20to%20more%20sustainable%20products%5B1%5D..pdf>. [17 September 2012].
Valdivia, S. and Ugaya, M.L.C. 2012, Life cycle inventories of gold artisanal and small-scale mining activities – towards indicators for South America, Journal of Industrial Ecology, Vol. 15, Issue 6, pp. 922–36.
Waste Aware Business: Reduce Reuse Recycle towards Zero Waste Blog, n.d., Available from: <http://wasteawarebusiness.wordpress.com>. [11 September 2012].
Valdivia, S. and Ugaya, M.L.C. ,2012, ‘Life cycle inventories of gold artisanal and small-scale mining activities – towards indicators for South America’, Journal of Industrial Ecology, Vol. 15, Issue 6, pp. 922–36.
WRAP 2011, New Estimates for Household Food and Drink Waste in the UK, WRAP, UK.
Chapter 3.1IISD 2010, ‘Summary of the Eighteenth Session of the Commission on Sustainable Development: 3 - 14 May 2010’, Earth
Negotiations Bulletin, vol. 5, no. 292. Meadows, DH, Meadows, DL, Randers, J & Behrens WW 1972, The Limits to Growth, Universe Books, New York.United Nations 1992, Agenda 21: Programme of Action for Sustainable Development, United Nations, New York. ……….1992b. Report of the United Nations Conference on Environment and development (Rio de Janeiro, 3-14 June 1992),
Sales No. E93.1.8 and corrigenda.……….2003. Plan of Implementation of the World Summit on Sustainable Development, A/CONF.165/14.……….2012, The Future We Want. United Nations, New York. United Nations Department of Economic and Social Affairs 2003, United Nations Guidelines for Consumer Protection (as
expanded in 1999), United Nations, Available from: <http://www.un.org/esa/sustdev/publications/consumption_en.pdf >. [13 August 2012].

209page
United Nations Environment Programme 2011, Paving the Way for Sustainable Consumption and Production: The Marrakech Process Progress Report , United Nations Environment Programme, Paris.
……….2012, Global Outlook on SCP Policies, United Nations Environment Programme, New York. ………..2013, The 10 Year Framework of Programmes on Sustainable Consumption and Production, UNEP, Paris.………..n.d., Website of the Marrakech Process, United Nations, United Nations Environment Programme, Available from: <http://
www.unep.fr/scp/marrakech/taskforces>. [17 September 2013].
Chapter 3.2United Nations Environment Programme 2005, The African 10 Year Framework Programme (10 YFP) on Sustainable Consumption
and Production, UNEP. ………..2012, Global Outlook on SCP Policies, United Nations Environment Programme, New York.
Chapter 4.1 Dovers, S 2005, Environment and Sustainability Policy. Creation, Implementation, Evaluation, The Federation Press, Annandale.
Chapter 4.2 Bengtsson, M, Hotta, Y, Hayashi, S & Akenji, L 2010, Policy Tools for Sustainable Materials Management: Applications in
Asia, IGES Working Paper, Institute for Global Environmental Strategies, Available from: <http://enviroscope.iges.or.jp/modules/envirolib/upload/2885/attach/policy_tools_smm_dp_final.pdf>. [17 September 2010].
GTZ 2006, Policy instruments for resource Efficiency: Towards sustainable Consumption and Production, Deutsche Gesellschaft für Internationale Zusammenarbeit, Available from: <http://www.uns.ethz.ch/edu/teach/bachelor/energmob/GTZ_et_al_2006_policy-instruments_resource_efficiency.pdf>. [17 September 2012].
OECD 2003, Voluntary Approaches for Environmental Policy: Effectiveness, Efficiency and Usage in Policy Mixes. Organization for Economic Co-operation and Development, Paris.
OECD 2007, Instrument Mixes for Environmental Policy, Organization for Economic Co-operation and Development, Available from: <http://paperc.de/12011-instrument-mixes-for-environmental-policy-9789264018419#!/pages/3> . [17 September 2012[.
Stavins, RN 2000, ’Public Policies for Environmental Protection’ in Public Policies for Environmental Protection, eds PR Potney, & RN Stavins, Resources for the Future, Washington (DC).
SWTICH-Asia, SCP Policy Instruments, Available from: < http://www.switch-asia.eu/?id=75>. [22 October 2013].SWITCH-Asia Network Facility, United Nations Environment Programme & Wuppertal Institute 2010, Sustainable Consumption
and Production Policies: a policy toolbox for practical use, Centre on Sustainable Consumption and Production, Available from: <http://www.scp-centre.org/fileadmin/content/files/6_Resources/1_Publications_pdfs/40_CSCP_WI__2010__SCP_Policies_-_Toolbox_en.pdf>. [17 September 2012].
UNEP 2012, The Business Case for The Green Economy: Sustainable Return on Investment, UNEP, Paris.
Chapter 5.1CSIRO & IGES, Capacity Building and Policy Needs Assessment for Sustainable Consumption and Production: Executive
Summary, UNEP, Available from <http://www.switch-asia.eu/fileadmin/content/PSC/AssessmentSummary.pdf>. [15 August 2012].
Tukker, A 2005, ‘Leapfrogging into the future: Developing for sustainability’, International Journal of Innovation and Sustainable Development, vol. 1, no. 1, pp. 65-84. Available from: <http://www.environmental-expert.com/Files%5C6471%5Carticles%5C14638%5Cart4.pdf >. [17 September 2012].
United Nations Environment Programme 2008, Planning for change: Guidelines for national programmes on sustainable consumption and production, DTI/1028/PA.
..........2009, Mainstreaming sustainable consumption and production and resource efficiency into development planning, DTI/1235/PA.
Chapter 5.2CSIRO & IGES, Capacity Building and Policy Needs Assessment for Sustainable Consumption and Production: Executive
Summary, UNEP, Available from <http://www.switch-asia.eu/fileadmin/content/PSC/AssessmentSummary.pdf>. [15 August 2012].
IGES 2010, Sustainable Consumption and Production in the Asia-Pacific Region: Effective Responses in a Resource Constrained World, IGES White Paper III 2010, Institute for Global Environmental Strategies, Available from: <http://www.iges.or.jp/en/news/topic/wp3_main.html>. [17 September 2012].
Leadbeater, C & Wilsdon J, 2007, The Atlas of Ideas: How Asian innovation can benefit us all, Available from <http://www.une.edu.au/chemp/projects/monitor/resources/atlasideas_final1.pdf>. [17 September 2010].
SWITCH-Asia Network Facility, United Nations Environment Programme & Wuppertal Institute 2010, Sustainable Consumption and Production Policies: a policy toolbox for practical use, Centre on Sustainable Consumption and Production, Available from: <http://www.scp-centre.org/fileadmin/content/files/6_Resources/1_Publications_pdfs/40_CSCP_WI__2010__SCP_Policies_-_Toolbox_en.pdf>. [17 September 2012].
SWITCH-Asia Network Facility, United Nations Environment Programme & Wuppertal Institute 2011, Linking to policy-makers - study on scaling-up mechanisms employed in SWITCH-Asia projects, Collaborating Centre On Sustainable Consumption and Production, Available from: <www.switch-asia.eu>. [17 September 2012].
Tukker, A, Emmert, S, Charter, M, Vezzoli, C, Sto, E, Munchandersen, M, Geerken, T, Tischner, U & Lahlou S 2008, ‘Fostering change to sustainable consumption and production: an evidence based view’, Journal of Cleaner Production, vol. 16, no. 11, pp. 1218-1225. Available from: <http://www2.lse.ac.uk/socialPsychology/research_activities/publications/saadi_lahlou/fosteringchange.pdf>. [13 August 2012].

210page
Chapter 6.1Bennett, CJ & Howlett M 1992, ‘The lessons of learning: reconciling theories of policy learning and policy change’, Policy
Sciences, vol. 25, pp. 275-294.Dovers, S 2005, Environment and Sustainability Policy: Creation, Implementation, Evaluation, The Federation Press,
Annandale.
Chapter 6.2 EC, FAO, IMF, OECD, United Nations & WB 2012, System of Environmental-Economic Accounting Central Framework,
White cover publication (pre-edited), Available from: <http://unstats.un.org/unsd/envaccounting/White_cover.pdf>. [17 September 2012].
European Environmental Agency n.d. DPSIR Framework, Available from: <http://www.eea.europa.eu>. [September 2012].United Nations Environment Programme 2008, SCP Indicators for Developing Countries. A Guidance Framework, DTI/1085/
PA.
Chapter 7A Liter of Light, 2011, A Liter of Light, Available from: http://www.aliteroflight.org/ [15th October 2013].United Nations Environment Programme n.d., Resource Efficient and Cleaner Production. Available from: <http://www.unep.
fr/scp/cp>. [01 August 2012].……….n.d.b, .Environment Knowledge Hub, Available from:< http://ekh.unep.org/?q=node/2224> [01 October 2013].……….2009b, Design for Sustainability: A Step by Step Approach, UNEP, Paris. United Nations Industrial Development Organization 2010, Resource Productivity for Climate Action, United Nation Industrial
Development Organization, Available from: <http://www.unido.org/fileadmin/user_media/Services/Environmental_Management/Cleaner_Production/Resource_productivity_Climate_Action.pdf>. [01 September 2012].
Chapter 8.1 ADB 2010, Key Indicators in Asia and the Pacific: The rise of Asia’s middleclass. Asian Development Bank, Available from:
<http://www.adb.org/sites/default/files/pub/2010/Key-Indicators-2010.pdf>. [17 September 2012]. Akenji, L 2012, ‘Consumer Scapegoatism and Limits to Green Consumerism’, Proceedings of Global Research Forum on
Sustainable Consumption and Production Workshop. Available from: <http://grfscp.files.wordpress.com/2012/05/grf-2012-rio-akenji.pdf>. [17 September 2012].
Akenji, L & Bengtsson, M 2010, ‘Is the Customer Really King? Stakeholder Analysis for Sustainable Consumption and Production Using the Example of the Packaging Value Chain’, in Sustainable Consumption and Production in the Asia-Pacific Region: Effective Responses in a Resource Constrained World, Institute for Global Environmental Stategies, pp. 21-46. Available from: <http://enviroscope.iges.or.jp/modules/envirolib/upload/2807/attach/iges_whitepaperiii_e_c02.pdf>. [17 September 2012].
EEA 2005, Household Consumption and the Environment, European Environment Agency Report, no. 11, Available from: <http://www.eea.europa.eu/publications/eea_report_2005_11>. [17 September 2012].
JUCCE 2013, Rethink Energy – Reshape the World, Available from < http://juccce.org/>. [21 October 2013].Oullier, O.& Sauneron. S. 2011, “Green nudges”: new incentives for ecological behaviour. Center for Strategic Analysis, March
16, 2011, Paris.SDC 2010, Making Sustainable Lives Easier – A Priority for Governments, Business and Society, Sustainable Development
Commission, Available from: < http://www.sd-commission.org.uk/publications.php?id=1144>. [17 Spetember 2012].
Shove, E 2006, ‘Efficiency and Consumption: Technology and Practice’ in The Earthscan Reader in Sustainable Consumption, eds T Jackson, Earthscan, London, pp. 293-304.
SME & United Nations Environment Programme n.d, Task Force on Sustainable Lifestyles, Swedish Ministry of Environment & United Nations Environment Programme, Available from: <http://www.unep.fr/scp/marrakech/taskforces/pdf/SLT%20Report.pdf>. [17 September 2012].
SWITCH-Asia Network Facility, UNITED NATIONS ENVIRONMENT PROGRAMME & Wuppertal Institute 2011, Mainstreaming sustainable consumption in Asia - what is holding us back?, Collaborating Centre On Sustainable Consumption and Production, Available from: < http://www.switch-asia.eu/switch-learn/sustainable-consumption-in-asia.html>. [17 September 2012].
United Nations Environment Programme 2010, Here and Now! Education for Sustainable Consumption Recommendations and Guidelines, DTI/1252/PA.
Chapter 8.2Advertising Standards Council of India 2011, CCC Year-wise Decisions on Complaints – Summary. Available from: <http://
www.ascionline.org/index.php/asci-consumers/2-uncategorised/72>. [20 August 2012].Hickman, L 2007, ‘Does the consumer really know best?’, The Guardian, 25 October. Available from: <http://www.
guardian.co.uk/environment/2007/oct/25/ethicalliving.lifeandhealth1>. [19 August 2012].Nevell, AJ, Goldsmith, RE & Banzhaf, EJ 1998, ‘The effect of misleading environmental claims on consumer perceptions of
advertisement’, Journal of Marketing Theory and Practice, vol. 6 no. 2, pp. 48-60.UK Sustainable Development Commission 2006, Looking Back, Looking Forward: Lessons in Choice Editing for
Sustainability, United Kingdom Government, Available from: http://www.sd-commission.org.uk/data/files/publications/Looking_back_SCR.pdf.. [20 August 2012].
Chapter 8.3 Collaborative Consumption Hub n.d., The Movement. Available from: <http://www.collaborativeconsumption.com/the-
movement>. [01 September 2012].Earth Policy Institute 2013, Bike-Sharing Programs Hit the Streets in Over 500 Cities Worldwide, Available from <http://www.

211page
earth-policy.org>. [09 September 2013].Global Ecolabelling Network 2013, What is Ecolabelling?, Available from <http://www.globalecolabelling.net/>. [26 October
2013].The Lowell Center for Sustainable Production 2009, A New Way of Thinking: The Lowell Center Framework for Sustainable
Products, University of Massachusetts Lowell, Available from: <http://www.sustainableproduction.org/downloads/LowellCenterFrameworkforSustainableProducts11-09.09.pdf> . [17 September 2012].
New South Wales Government 2011, What is a Sustainable Product?. Available from: <www.environment.nsw.gov.au/procurement/WhatIs.htm>. [01 August 2012].
Shaheen, S & A. Cohen 2012, ‘Carsharing and Personal Vehicle Services: Worldwide Market Developments and Emerging Trends’, International Journal of Sustainable Transportation, no. 7, pp. 5-34.
United Nations Environment Programme 2010, ABC of SCP-Clarifying Concepts on Sustainable Consumption and Production. United Nations Environment Programme, Available from: <http://www.uneptie.org/scp/marrakech/pdf/ABC%20of%20SCP%20-%20Clarifying%20Concepts%20on%20SCP.pdf>. [17 September 2012].
……….2013, Redefining Ecolabels to Improve Sustainability and Trade in Developing Countries, UNEP, Paris.
Chapter 9 ADB 2010, Every drop counts: Learning from good practices in eight Asian cities, Asian Development Bank and Institute of
Water Policy, Lee Kuan Yew School of Public Policy, Mandaluyong City.Baeumler A., Ijjasz-Vaquez E. & Mehndiratta S. 2012, Sustainable Low-Carbon City Development in China, The World Bank,
Washington D.C.Girardet H. and Mendonça M. 2009, A Renewable World: Energy, Ecology, Equality, A Report for the World Future Council.IRP/UNEP 2013, City Level Decoupling: urban resource flows and governance of infrastructure transitions, UNEP.GIZ 2010, Guidelines for water loss reduction: A focus on pressure management, GIZ. International Energy Agency 2013, A tale of renewed cities: A policy guide on how to transform cities by improving energy
efficiency in urban transport systems, OECD/IEA, Paris, France.IPCC 2007, IPCC Fourth Assessment Report: Climate Change 2007 (AR4) – Chapter 6 Residential and Commercial Buildings,
IPCC. McKinsey Global Institute 2009, Pathways to a Low Carbon Economy, Version 2 of the Global Greenhouse Gas Cost Curve,
McKinsey. McKinsey Global Institute 2011, Urban World: Mapping the Economic Power of Cities, McKinsey.United Nations Department of Economic and Social Affairs 2013, World urbanization prospects – 2011 revision, Available from:
< http://esa.un.org/unup/Analytical-Figures/Fig_2.htm>. [10 October 2013].UNEP 2010, Share the road: Investment in Walking and Cycling Infrastructure, UNEP. ……….2011, Towards a Green Economy: Pathways Towards Sustainable Development and Poverty Eradication, UNEP, Paris. Webster, K. & Johnson,C. 2010, Sense and Sustainability: Educating for a Circular Economy, TerraPreta, USA. Worldbank 2012, In Windhoek, Integrated Urban Water Management is Key to Closing the Water Loop, Available from: <
http://blogs.worldbank.org/water/in-windhoek-iuwm-is-key-to-closing-the-water-loop>. [26 October 2013].WWF 2012, Adelaide Christie Walk, Available from: <http://wwf.panda.org/what_we_do/footprint/cities/urban_solutions/
themes/housing/?204375>. [26 October 2013].WWF 2012c, Singapore: Water Scarcity Prompts Self Sufficiency, Available from <http://wwf.panda.org/what_we_do/footprint/
cities/urban_solutions/themes/water/>. [26 October 2013].
Chapter 10Centre for Sustainable Consumption & Production (2011), Sustainable Public Procurement in Urban China. Available from:<http://www.scp-centre.org/fileadmin/content/files/6_Resources/1_Publications_pdfs/58_CSCP__2011__-_SPP_in_Urban_
China.pdf>. [12 August 2012].European Commission 2004, Buying Green- A Handbook on Environmental Public Procurement. Available from: <www.
ec.europa.eu/environment/gpp/pdf/gpphandbook.pdf >. [12 August 2012].Global Ecolabelling Network, 2012, Global Ecolabelling Network (GEN), Available from: <http://www.globalecolabelling.net/>.
[19 September 2012].Jensen, A 2011, Presentation at the Workshop on Green Public Procurement – Policies and Practices in the EU and India,
New Delhi, Feb 2011.ICLEI, Local Governments for Sustainability 2011, Sustainable Procurement Resource Centre. Available from: <http://www.
sustainable-procurement.org/about-spp/>. [19 September 2012].Kataoka, A 2009, Presentation at the meeting of the Marrakech Task Forces with South Asian stakeholders, New Delhi.Morton, B & Gandhi, R 2011, Green Public Procurement – Policies & Practices in the EU and India, European Union.
Available from: <www.apsfenvironment.in/>. [14 August 2012].Philippines Government, Dept of Environment & Natural Resources 2012. DENR joins other government departments in sustainable public procurement program. Available from: <http://www.gov.ph/2012/01/13/denr-joins-other-government-agencies-in-green-procurement-program/>. [21 September 2012].Price Waterhouse Coopers, Significant & Ecofys 2009, Collection of statistical information on Green Public Procurement
in the EU. Available from: <http://ec.europa.eu/environment/gpp/pdf/statistical_information.pdf >. [18 August 2012].
United Nations Environment Programme 2009. ‘Green Procurement Implementation and Integration in Thailand’. Presentation at the UNEP SPP Training Workshop, Kuala Lumpur.
………. n.d. UNEP DTIE SCP Branch: Sustainable Public Procurement. Available from: <http://www.unep.fr/scp/procurement/ >. [14 August 2012].

212page
Chapter 11 Eijgelaar, W, Peeters, P & Picket, P 2008, Domestic and International Tourism in a Globalized World. Available from: <www.
tourism-master.nl/theses/. [4 August 2012].Forsyth, Timothy 1997, ‘The Case of Sustainable Tourism, The Geographical Journal, Vol 163 No.3, (Nov 1997), pp 270-
280.GTZ n.d., Coping with climate change in the Pacific Island Region, Secretariat of the Pacific Regional Environment
Programme, Available from: <http://www.sprep.org/att/irc/ecopies/pacific_region/673.pdf>. [03 October 2012].International Marrakech Task Force on Sustainable Tourism Development, n.d. <http://www.unep.fr/scp/marrakech/
taskforces/pdf/Brochure_STTF.pdf>. [14 August 2012].The Global Partnership for Sustainable Tourism, n.d, Global Partnership for Sustainable Tourism. Available from: <http://
www.globalsustainabletourism.com>. [29 August 2012].Manyara, G. & Jones, E. 2007, ‘Community-based tourism enterprise development in Kenya: an exploration of their potential
as avenues of poverty reduction’, Journal of Sustainable Tourism, vol. 15, no. 6, pp 628-644.United Nations Economic and Social Commission for Asia and the Pacific 2003, Poverty Alleviation Through Sustainable
Tourism Development, United Nations, Bangkok. ……….2005, The Contribution of Tourism to Poverty Alleviation – ESCAP Tourism Review No.25, Dec 2005. ST/
ESCAP/2380.……….2007, Study on the role of Tourism in Socio-Economic Development, ST/ESCAP/2478.UNESCAP 2011, Statistical Yearbook for Asia and the Pacific, Sales No. E.11.II.F.1. United Nations Environment Programme, United Nations World Tourism Organization & WMO 2008, Climate Change and
Tourism: Responding to Global Challenges, UNEP/Earth Print. United Nations World Tourism Organization 2008 Climate Change and Tourism. UNWTO, Madrid. ……….2011, UNWTO Annual Report 2011. UNWTO, Madrid. ……….n.d , Sustainable Development of Tourism. UNWTO, Madrid.………. n.d, Who We Are. UNWTO, Madrid.World Bank 2003, Waste Generation1 – Thailand Environmental Monitor. Available from: <www.worldbank.org> [31 Aug 2012].
Chapter 12 Belevrat, E 2011, What are the key issues to be addressed by China in its move to establish Emissions Trading Systems?
IDDRI Working Paper No 17/11, IDDRI, Paris.Bovenberg, AL & RA de Mooij 1994, ‘Environmental Levies and Distortionary Taxation’, American Economic Review, vol 84, pp. 1085-1089.Department of Climate Change and Energy Efficiency 2012, Australian Government Department of Climate Change and
Energy Efficiency. Available from: <http://www.climatechange.gov.au>. [20 September 2012].Ekins, P 2000, Economic Growth and Environmental Sustainability. The prospects for Green Growth, Routledge, London
and New York.Goulder, L 1995,’ Environmental taxation and the double dividend: a reader’s guide’. International Tax and Public Finance,
vol. 2, no. 2, pp. 157-183.Von Weizsacker, EU & Jessinghaus J 1992, Ecological Tax Reform. A policy proposal for sustainable development, Zed
Books, London. World Bank 2013, Mapping Carbon Pricing Initiatives: Developments and Prospects 2013, World Bank.
Chapter 13Hart, SL & London, T 2005, Developing native capability: What multinational corporations can learn from the base of the pyramid, Stanford Social Innovation Review, vol. 3, no. 2, pp. 28-33.Griffiths & Anselmo 2010, Indigenous Peoples and Sustainable Livelihoods in Guyana: an overview of experiences and potential
opportunities, Amerindian Peoples Association, Forest Peoples Programme and The North-South Institute. International Labour Organisation Country Office for Tanzania, Kenya, Uganda and Rwanda 2012, Promoting Green Entrepreneurship:
First Lessons from the Green Entrepreneurship Facility in Kenya 2010-2011, ILO. United Nations Educational Scientific and Cultural Organization 2012, Shaping the Education of Tomorrow: 2012 Report on
the UN Decade of Education for Sustainable Development, UNESCO, France. United Nations Environment Programme 2008, Green Jobs: Towards decent work in a sustainable, low carbon world 2008
UNEP on behalf of ILO, IOE, ITUC Green Jobs Initiative.
Chapter 14International Energy Agency 2009, World Energy Outlook, OECD/IEA, Paris.McKinsey & Company 2009, Environmental and energy sustainability, McKinsey & Company, New Delhi.WBCSD 2009. Energy efficiency in buildings: Transforming the market, World Business Council for Sustainable
Development, Geneva.

About the UNEP Division of Technology,Industry and Economics
Set up in 1975, three years after UNEP was created, the Division of Technology, Industry and Economics (DTIE) provides solutions to policymakers and helps change the business environment by offering platforms for dialogue and co-operation, innovative policy options, pilot projects and creative market mechanisms.
DTIE plays a leading role in three of the six UNEP strategic priorities: climate change,
harmful substances and hazardous waste, resource efficiency.
DTIE is also actively contributing to the Green Economy Initiative launched by UNEP in 2008. This aims to shift national and world economies on to a new path, in which jobs and output growth are driven by increased investment in green sectors, and by a switch of consumers’ preferences towards environmentally friendly goods and services.
Moreover, DTIE is responsible for fulfilling UNEP’s mandate as an implementing agency for the Montreal Protocol Multilateral Fund and plays an executing role for a number of UNEP projects financed by the Global Environment Facility.
The Office of the Director, located in Paris, coordinates activities through:
> The International Environmental Technology Centre - IETC (Osaka), promotes the collection and dissemination of knowledge on Environmentally Sound Technologies with a focus on waste management. The broad objective is to enhance the understanding of converting waste into a resource and thus reduce impacts on human health and the environment (land, water and air).
> Sustainable Consumption and Production (Paris), which promotes sustainable consumption and production patterns as a contribution to human development through global markets.
> Chemicals (Geneva), which catalyses global actions to bring about the sound management of chemicals and the improvement of chemical safety worldwide.
> Energy (Paris and Nairobi), which fosters energy and transport policies for sustainable development and encourages investment in renewable energy and energy efficiency.
> OzonAction (Paris), which supports the phase-out of ozone depleting substances in developing countries and countries with economies in transition to ensure implementation of the Montreal Protocol.
> Economics and Trade (Geneva), which helps countries to integrate environmental considerations into economic and trade policies, and works with the finance sector to incorporate sustainable development policies.
DTIE works with many partners (other UN agencies and programmes, international organizations, governments, non-governmental organizations, business, industry, the media
and the public) to raise awareness, improve the transfer of knowledge and information, foster technological cooperation and implement international conventions and agreements.
For more information,www.unep.org/dtie
