sustainable concrete: design and testing · thermal conductivity, numerical concrete design,...
TRANSCRIPT

HERON Vol 60 (2015) No 12 59
Sustainable concrete Design and testing
Jeanette Visser 1 Sandra Couto 2 Anoop Gupta 3 Intildeigo Larraza Alvarez 4 Valle Chozas
Ligero 4 Tiago Sotto Mayor 2 5 Raffaele Vinai 6 Penny Pipilikaki 1 Alessandro Largo 7
Agnese Attanasio 7 Mike Chaolung Huang 8 Marios Soutsos 6
1 TNO the Netherlands
2 CeNTI Portugal
3 BASF Germany
4 Acciona Spain
5 EMPA Switzerland
6 Queenrsquos University of Belfast United Kingdom
7 CETMA Italy
8 TBTC Taiwan
Producing concrete with secondary raw materials is an excellent way to contribute to a more
sustainable world provided that this concrete has at least the same performance during its
service life as concrete made with the primary raw materials it replaces Secondary raw
materials for Light Weight (LW) aggregates (rigid polyurethane foams shredded tire rubber
and mixed plastic scraps) have been combined with secondary raw materials for the binder
(fly ash slag and perlite tailings) making sustainable concretes that were investigated for
their suitability as LW highly insulating concrete for four different types of applications
Compliance to desired engineering properties (workability setting time) was not always
feasible it was mostly the low workability of the mixtures that limited their application
Contrary to well established cements steering the workability by adding water was not an
option for these binders that rely on alkali-activation Eight successful mixtures have been
tested further The results have shown that it is possible to produce a non-structural
sustainable concrete with good mechanical and thermal insulation properties
Design of concrete made with novel materials is currently not feasible without extensive
experimentation as no design rules exist other than empirically derived rules based on
traditional materials As a radical different approach a flexible concrete mix design has been
developed with which the concrete can be modelled in the fresh and hardened state The
numerical concrete mix design method proves a promising tool in designing concrete for
performance demands such as elasticity parameters and thermal conductivity
60
Key words Sustainable binder sustainable aggregate workability mechanical properties
thermal conductivity numerical concrete design performance
1 Introduction
Producing concrete from secondary raw materials is an excellent way to contribute to a
more sustainable world This concrete then is required to have at least the same
performance during its service life as concrete made with the primary raw materials it
replaces Secondary raw material based concrete with similar performance further called
sustainable concrete in this paper saves not only primary raw materials and reduces the
waste pressure on the environment it also reduces Green House Gas emissions (GHG)
and energy (eg Muller [2014] fib [2004])
Secondary raw materials for aggregates require waste streams that are available in large
enough quantities for a substantial replacement in the concrete (production) industry and
pose a socio-economic problem Within Europe these are among others shredded tyre
rubber polyurethanes and plastics These can be used as Light Weight (LW) aggregates in
concrete [Attanasio 2015] Their use as sustainable LW-aggregates in cement-based
concrete is reported for rubber [Bravo 2012 Eldin 1993 Fattuhi 1996 Sukontasukkul
2006] polyurethanes [Mounanga 2008 Perevozchikov 2000 Vaacuteclaviacutek 2012] and plastics
[Choi 2005 Jo 2006 Lakshmi and Nagan 2010 Marzouk 2007 Pezzi 2006 Rebeiz 1996
Sikalidis 2002] and were shown to improve the thermal insulating properties of concrete
Workability and compressive strength proved difficult to maintain [Eldin 1993 Fattuhi
1996 Sukontasukkul 2006] Similar results were found by [Attanasio 2015] for tyre rubber
rigid polyurethane foams and recycled plastic scraps that are also used in this study
Secondary raw materials such as fly ash slag and perlite tailings are in sufficient large
quantities available to serve as cement replacement [Vinai 2015] Sustainable binders such
as alkali activated fly ash slag or combinations of these have been shown to develop a
higher compressive strength than a similarly composed concrete based on a Portland
cement binder and gravel and sand as aggregates [Provis 2014 Bernal 2011] Workability
is more difficult to control as it depends on several parameters (eg activator type and
concentrations) [Collins 1999 Lee 2013 Nath 2014]
61
The current research focuses on designing concrete made with both secondary based
binder and aggregate without negative impact on performance Although the use of any of
these materials in building products is not new [eg Sabnis 2011] the combination of
these sustainable materials to an all-waste type of concrete is The aim of this paper is to
report on the performance of concretes based on the combined use of waste aggregates and
waste binders yielding a low weight high insulating building material with a low
embodied energy while maintaining its performance during its targeted service life of its
building application Results for both the fresh state and the hardened state are included
Durability tests are also part of the research but fall outside the scope of this paper and will
be reported elsewhere The carbon footprint of this sustainable concrete is reported in
Gijlswijk [2015] Full Life Cycle Analysis (LCA) and Life Cycle Costs (LCC) analysis will be
reported at a later stage
Combining sustainable LW-aggregate with a sustainable binder to a concrete that still has
the same performance as a lsquotraditionalrsquo concrete is quite a task Most performance
characteristics of hardened concrete (eg strength thermal resistance) are impossible or not
easy to design in advance and in general trial mixtures have to be made and tested to
determine these properties [Flatt 2012] This is not a preferable way of concrete design
when many different types of materials are available as it may result in extensive
experimental programs to find (the most) suitable aggregatebinder combination and the
optimum aggregate volume fraction Moreover these programs require reruns if the
properties of one of the constituents changes since then also performances may change for
the worst and even the most opportune combinations of aggregatebinder may change as
well The lack of research on concrete design methods other than consisting of large testing
schemes is disconcerting Optimization of sustainable concretes is still often sought by
optimization of the aggregate packing on the presumption that if the cement content can
be lowered the environmental impact will reduced [Mueller 2014] For the sustainable
concrete in this research no primary materials are used in the binder production so this
assumption is not a priori valid Moreover by the use of LW aggregates many
performances such as strength will be reduced with a decrease of binder content
[EuroLigthCon 2008] For this reason a radical different approach from traditional
concrete design has been sought in a modern way of concrete design The second half of
this paper is devoted to the principle of performance based design of sustainable concrete
The aim is to show how it can be used as a design tool
62
2 Fresh concrete research
21 Materials
Binders
Three types of binders have been used in the research
bull cyclones and micro-silica being wastes from a perlite production plant in a 9010
weight proportion and either activated by only NaOH solution (denoted as alkali
activator) or using both NaOH solution and waterglass (denoted as WG
activator)
bull PFA with NaOH waterglass activation
bull PFAGGBS mixture with various PFAGGBS ratios and NaOH waterglass
activation
All binders have been described in detail in Vinai [2015] including the concentration and
type of activators
Aggregates
Also three types of light weight (LW) aggregates have been used
bull Shredded rigid polyurethane foam (PU) (grades 0-4 mm and 4-8 mm)
bull shredded tyre rubber (TR) (grades 0-06 mm 06-2 mm 2-4 mm 3-7 mm)
bull high density Remix (RX HD) (grades 0-3 mm and 3-7 mm) mixed plastic wastes
obtained after sorting plastics from municipal solid wastes combined with a low
density Remix (RX LD) 8-125 mm grade Gypsum was used as foaming agent to
obtain the LD aggregates but the mixed plastic wastes are similar
All aggregates have been described in detail in Attanasio [2015] including their production
process In addition to the LW aggregates sometimes Natural Sand (NS) (grades 0-2 mm
or 0-4 mm) was used as well
22 Target requirements
The targeted mix designs were aimed for four types of application floor screed floor
screed underlay panel for facades and blocks For these applications a pre-described
workability density and compressive strength were taken from the standards The target
requirements for different applications are mentioned in Table 1
63
Table 1 Target requirements for different applications compressive strength and density
requirements at 28 days
Application Workability Compressive
strength (MPa)
Density
(kgm3)
Floor screed ready mix ge 125100 mm slump ge 5 lt1100
(60 min)
Floor screed underlay ready mix ge 125100 mm slump ge 8 lt1100
(60 min)
Panels for facades precast ge 16100 mm slump 5 - 20 lt1500
(30 min)
precast-SCC ge 70650 mm flow
(30 min)
Blocks 0-30 mm slump ge 5 1000-1400
(15 min)
23 Characterization methods
The workability of concrete was evaluated by slump slump flow and spread
measurements The slump and slump flow were evaluated according to the EN 12350-2
standard Spread measurement was performed according to the EN 12350-5 standard The
concrete density was evaluated according to the EN 12350-6 standard The compressive
strength was measured according to the EN 12390-3 standard
Figure 1 Example of workability for cyclone μ-silica with PU aggregates 580 mm slump flow
(after 4 min) and 100 mm slump (after 30 min)
64
24 Fresh concrete mix trials initial design and compatibility casting and curing issues
The initial design of the concrete was based on the (theoretical) density of concrete All
binder aggregate combinations were tested with the optimum binder compositions as
formulated by Vinai [2015] As most of the available aggregates reduced the workability
the biggest challenge in the fresh concrete design was to make the concrete as light as
possible while maintaining a sufficient workability Normally workability can be steered
by adding more water to the mix using superplasticisers or adding some more round
particles that can cause a lubrication effect As the geopolymerization process is quite
sensitive to the amount of water in the mix adding water was not an option In addition
especially for the PU aggregates with a density of only 330 kgm3 adding water may
result in segregation if the viscosity of the mixture is reduced too much Commercially
available superplasticiser proved to be ineffective in these novel types of concretes so that
workability could be steered only by adding more round particles For the PFAGGBS
binders it was possible to add (more round) fly ash particles in the binder blend For the
other binders the only possibility was adding sand but this also increased the density of
the mix The amount of sand that could be added was therefore limited by the targeted
density of the concrete
Compatibility discrepancies between the aggregates and the binders may cause mixing
and casting problems and ultimately poor quality of the concrete Literature results
showed that for both the used aggregates and binders workability could be difficult to
control [Eldin 1993 Fattuhi 1996 Sukontasukkul 2006 Collins 1999 Lee 2013 Nath
2014] A quick assessment of the initially designed fresh concrete mixtures was therefore
made firstly on the basis of workability As two binders (the activated fly ash and cyclone
micro-silica based binders) required heat curing to harden within a reasonable time span also
curing is an important stage for developing a good quality concrete The (geo-)
polymerization underlying the hardening of the activated fly ash and cyclone micro-silica
based binders is a two-stage process in the first dissolution and the formation of the
monomers takes place requiring water The actual hardening takes place during the
second stage (polymerization) During this stage however water should be able to escape
[Vinai 2015] The effect of curing has been tested by compressive strength tests
Different mixing casting and curing approaches were also tried in this study In general
mixing was started with the aggregates adding the coarse particles first followed by the
(pre-blended) binders and then (pre-blended and aged if required) liquids (water and
65
activators) After each step mixing was executed to assure a good dispersion of the various
components Mixing times were adjusted by visual quality control Casting was done
either in plastic moulds or steel moulds depending on preferences of the laboratory
Because of the adhesion issues between the geopolymers and the steel
The major results of the mix trials were as follows
bull Despite different (re-)cleaning techniques the 03 mm RX aggregates were
rejected because this fraction caused heat formation quick drying and swelling
of the concrete This was most likely caused by residual impurities such as
metallic aluminium in the plastic waste stream [Attanasio 2015]
bull TR aggregates mixes gave rise to quick setting that could be overcome by
additional mixing The quick setting was likely flash set presumably due to a
sudden reaction of sulphate compounds from the vulcanization process of tires
with the aluminium present in the binders
bull For the cyclonesmicro-silica based binders an optimized curing in two stages was
developed first curing at 70degC followed by a 55 degC curing to allow for the two-
stage geopolymerization process The durations of curing depended on the
concrete composition and laboratory equipment After carrying out the
compressive strength tests it was found that despite the high mass loss only the
external layers of the samples were hardened and the internal part was still soft
This indicates that curing was not homogeneous and the polymerization in the
interior not complete (see Figure 2) The effect of the thermal insulating LW-
aggregates on the curing of these binders resulted in too long heat curing
Figure 2 Disintegration of the specimen during the compression strength test showing that the
interior of the specimens did not harden
66
regimes even for the (relative) small specimens required for the mechanical
testing Therefore these mixtures were further excluded from the research
bull To increase the geopolymerization rate in the PFA-binders the moulds were
oven-cured at 70 degC It was found that the thermal expansion of the PU
aggregates resulted in expansion of the specimen at young age which resulted in
low strengths (due to microcracking) Therefore the curing regime was changed
in a two stage curing procedure first at 50 degC and then at 70 ordmC The exact curing
times depend on the type of laboratory equipment
25 Resulting fresh concrete mixes
Based on the application requirements according to Table 1 further restrictions of the
possible binder aggregates combinations were as follows
bull for the floor screed and floor screed underlay only the PFAGGBS binder could
be used as heat curing for these applications is not possible
bull workability of PUPFA mixtures decreased rapidly over time Contrary to
cement which is known to have a dormant period during its hydration process
[Neville 2002] geopolymers do not Hence the so-called open time or
workability window ie the timeframe in which a mix can be placed and if
required compacted can be quite brief This was the case for the PU PFA mixes
The workability window required for (the) facade panel was not achieved and
only block production was targeted for these mixes
bull compared to the PFA-binder mixtures lower volume fraction of aggregates had
to be used in the PFABGGBS-binder mixtures All used aggregates reduced the
workability considerably and GGBS does not improve the workability the same
way as PFA does among others due to its more angular shape in comparison to
the well-rounded PFA particles [Vinai 2015] Also for these binder mixtures
replacement of sand in the mix increased the workability drastically At the same
time this increased the density frequently above its target so that sand
replacement was not an option Therefore the PFAGGBS ratio was sometimes
increased
The best mixtures for the PFA-binders are shown in Table 2 those for the PFAGGBS-
mixtures in Table 3 Sometimes the workability could not be measured at the required time
due to practical constraints eg the time elapsed before the slump test could be executed
67
Figure 3 Example of workability for PUPFA showing slump flow after 4 min
As the workability decreases with time a higher workability at later times was generally
considered acceptable for the facade and screed applications For blocks the reverse
applies since these are stamped and need to be demoulded immediately In this case a
lower slump is allowed For TRPFA combinations no mixtures could actually be found
that fulfilled all requirements (Table 2) The best one has been included in the experimental
program
For screed application (only PFAGGBS mixtures) the workability requirements could not
be guaranteed for 60 minutes for any combination (Table 3) Neither could the workability
Table 2 Resulting PFA binder concrete fresh concrete workability and density and strength of the
hardened concrete at 28 days (see Annex A for quantities) aggregates as volume proportion of the
concrete and targets between brackets
Mix
no
Aggregate
(fraction)
Workability
(slump in mm)
time (min) (target)
Density
(kgm3)
(target)
Strength
(MPa)
(target)
Application
2_1 PU + sand
60
25 25
(0-30 15)
1230
(1000-1400)
51
(gt 5)
block
2_2 PU
50
30 20
(0-30 15)
895
(1000-1400)
56
(gt 5)
block
2_3 TR + sand
50
90 15
(0-30 15)
1460
(1000-1400)
46
(gt 5)
block
2_4 RX + sand
45
170 20
(ge 160 30)
1430
(lt1500)
59
(5-20)
panel
for facades
68
Table 3 Resulting PFAGGBS binder concrete fresh concrete workability and density and strength
of the hardened concrete at 28 days (see Annex A for quantities) aggregates as volume proportion of
the concrete
Mix
no
Aggr
(fract)
Binder Target
workab
(slump)
Workab
slump
(mm)
Density
(kgm3)
(target)
Streng
(MPa)
(target)
Appl
3_1 PU 45
PFAGGBS
7525
ready mix
ge 125100
(60 min)
180
(30 min)
1090 84 floor
screed
underlay
(lt1100 )
(gt 8)
ready mix
ge 125100
(60 min)
180
(30 min)
1090 84 floor
screed
(lt1100 )
( gt5)
Precast
ge 160100
(30 min)
180
(30 min)
1090 84 panel for
facades
(lt1100)
(5-20)
3_2 PU 45 PFAGGBS
8515
Precast-
SCC flow
ge 70650
525
(30 min)
1210
(lt1500)
76
(5-20)
panel for
facades
3_3 PU 45 PFAGGBS
1585
0-30 10
(15 min)
1165 151 block
(15 min) (1000-1400) (gt 5)
3_4 RX 40 PFAGGBS
5050
0-30 25
(15 min)
1475 182 block
(15 min) (1000-1400) (gt 5)
of the precast SCC for facades be achieved The PUPFAGGBS mix (mix 3_1) was found
to be the best mix meeting the density and compressive strength requirements and having
good workability (180 mm after 30 min) The PUPFAGGBS (mix 3_1) is also suitable for
facades precast applications For blocks application where low initial workability is
needed binder blends with a low PFAGGBS ratio (5050 and 1585) could be used
A concrete mix with PFAGGBS binder and RX aggregates for the block application has
been added in the experimental program although the density slightly exceeded the target
This mix proved to be the optimum mix Increasing the aggregate fraction to reduce the
density resulted in an inhomogeneous mixture mixes with decreased PFAGGBS ratio set
before 15 minutes while mixes with increased PFAGGBS ratio resulted in workability
higher than 30 mm after 15 minutes
69
3 Hardened concrete research
31 Test program and results
The performance of the eight mixtures in Table 2 and Table 3 were tested further according
to the test program in Table 4 Table 5 summarizes the results
Table 4 Test program for the hardened concrete
Test Dimensions specimens
(mm)
Number of
specimens
Standard
Compressive strength 100 x 100 x 100 3 EN 12390-3
Youngrsquos modulus 50 x 100 2 UNI-EN 6556
Flexural strength 400 x 100 x 100 2 EN 12390-5
Thermal conductivity 150 x 150 x 70 2 EN 12664
Table 5 Summary of the experimental results on the hardened concrete at 28 days full mix
compositions are given in Annex A aggregates as volume proportion of the concrete mix 3_2 has
been cast in two-fold Notation fc = compressive strength fflex = flexural strength E = Youngrsquos
modulus and λ = thermal conductivity
Mix
no
Aggregate Binder Density
(kgm3)
fc
(MPa)
fflex
(MPa)
E
(GPa)
λ
(WmK)
2_1 PU+s 60 PFA 1300 83 plusmn 00 20 plusmn 01 19 plusmn 03 031
2_2) PU 50 PFA 895 56 plusmn 02 12 plusmn 01 11 plusmn 02 016
2_3) TR+s 50 PFA 1490 42 plusmn 01 09 plusmn 01 09 plusmn 03 032
2_4 RX+s 45 PFA 1530 68 plusmn 03 13 plusmn 02 10 plusmn 01 034
3_1 PU 45 PFAGGBS
7525
1145 84 plusmn 01 14 plusmn 01 09 plusmn 01 018
3_2a PU45 PFAGGBS
8515
1115 62 plusmn 00 08plusmn 00 11 plusmn 04 -
3_2b PU45 PFAGGBS
8515
1025 66 plusmn 01 09 plusmn 00 - 017
3_3 PU 45 PFAGGBS
1585
1165 151 plusmn 00 21 plusmn 02 31 plusmn 02 020
3_4 RX 40 PFAGGBS
5050
1475 182 plusmn 00 23 plusmn 03 34 plusmn 02 027
70
The failure mode for mixes with PU aggregates (eg mix no 3_3 in Figure 4) can be
classified as very brittle after reaching the peak stress the stress immediately dropped to
almost zero The concrete with the TR aggregates (mix no 2_3 in Figure 4) showed a
slightly more ductile behavior RX samples had an intermediate behavior The softening
behavior is mostly driven by the aggregates and not by the binder as both PFA and
PFAGGBS matrix failures are typically brittle It was observed that TR grains did not
crush but first deformed and next were pulled out (likely by friction-slip) from the matrix
For the PU aggregates the fracture ran through the aggregates RX aggregates showed an
intermediate behavior sometimes the cracks ran through the aggregates but the plastic
shreds within the aggregates prevented complete failure of these aggregates
Figure 4 Test curves for 3_3 (PFAGGBS and PU 45) and 2_3 (PFA and TR+s 50) samples
dashed and solid lines are indicating tests on different specimen
32 Mechanical behavior as compared to normal LW concrete
Concrete is designed solely on compressive strength as indicator of the mechanical
performance All other mechanical properties (eg tensile strength) are related to this
compressive strength in the building codes or the Fib Model Code 2010 (being destined to
become the next generation building codes) It is generally assumed that if the mechanical
relations in the building codes also hold for the new types of concrete it becomes plausible
71
that also all relating failure mechanisms with respect to the mechanical loads in the Fib
Model Code 2010 are fulfilled as well This assumption is based on the similarity in
inorganic binder composition resulting in the same type of mechanical behavior For a
more extensive reading on this topic see [Visser and Bigaj 2014]
To investigate whether a similar relationship may be applied for the developed sustainable
concrete as for already accepted LW concrete defined in the Fib Model Codes 2010 for
concrete grades le C50 the tensile strength of the developed sustainable concrete should
fulfil the following set of relations
= η==
23
min
max
03 ( ) 07
13
ctm l ck
ctk ctm
ctk ctm
f ff f
f f
(1)
where ctmf is the calculated tensile strength ckf is the characteristic compressive strength
minctkf and maxctkf are the lower and the upper bound values of the characteristic tensile
strength respectively For light weight concrete a reduction factor ηl is included
ρη = +04 062200l (2)
in which ρ is the oven dry density of the aggregate (in kgm3) being on average 330 kgm3
for PU 970 kgm3 for TR and 810 kgm3 for RX
The characteristic compressive strength has been calculated on the basis of a 10 variance
since the standard deviations in the tests were only based on three tests and too low to
make a good assessment of the standard variation for the population possible Also due to
the low strengths a constant standard variation of 8 MPa could not be used in this case As
the tensile strength has been measured by means of a four point bending test the
correction factor to include is
= αctm lf ctmflf f (3)
where
ctmflf is the mean flexural tensile strength
α =+
07
07006
1 006b
lfb
h
h
72
bh is the beam depth (100 mm in these tests)
Figure 5 shows the comparison between the measured flexural tensile strength and that
calculated from the compressive strength according to the above relations As can be seen
with the exception of the mix 2_1 the relationship holds also for the developed sustainable
concrete For mix 2_1 measured flexural tensile strength is much higher than the predicted
one on the basis of the compressive strength There is no indication what has caused this
For all other combinations including other PFAPU mixes the relation between measured
flexural tensile strength and compressive strength as given in the Fib Model Code 2010 is
applicable
The modulus of elasticity for lightweight concrete lciE can be estimated from the following
equation according to the Fib Model Code 2010
= η13
0( )10cm
lci E cf
E E (4)
withρη = 2( )
2200E and ρ is the oven dry density of the lightweight aggregate concrete in
kgm3 (being on average 330 kgm3 for PU 970 kgm3 for TR and 810 kgm3 for RX as
Figure 5 Comparison between measured flexural tensile strength and predicted compressive
strength according the Fib Model Code 2010 coding of the mixtures according to Table 5
73
also used for the tensile bending strength) 0cE = 215103 MPa and cmf is the mean
compressive strength (MPa)
In Figure 6 the measured and predicted Youngacutes moduli are shown Although no upper
and lower boundaries are given in the Model Code 2010 for the Youngrsquos moduli the same
upper and lower boundaries are used as for the tensile bending strength namely the 07
and 13 times the calculated value
Figure 6 shows that all PU-mixtures have a measured Youngrsquos modulus higher than the
predicted one on the basis of eq (4) whereas for the other aggregates the combination
with PFA binder resulted in lower values than predicted Only for the RX with the
PFAGGBS the prediction proved to be good
33 Achieved thermal conductivity
The results obtained regarding thermal conductivity (Table 5) show λ-values from 016
WmK (PUPFA) to 034 WmK (RXPFA) As the LW aggregates have a very low
thermal conductivity themselves (004 WmK for TR and 006 WmK for PU no reliable
data for RX available) the thermal conductivity of the SUS-CON concrete decreases
Figure 6 Comparison between measured and predicted Youngacutes modulus coding of the mixtures
according to Table 5
74
considerably with these LW aggregate fractions The addition of sand having a thermal
conductivity of circa 48 WmK adversely affects the thermal insulation capacity
34 Possible applications for the SUS-CON concrete
In Table 6 a comparison is made between the performance demands and the obtained
results for the newly casted specimens in the hardened concrete research As discussed in
Table 6 Compliance of the hardened concrete with the performance demands for various
applications densities and compressive strength are based on different specimens from the fresh
concrete tests of Section 3
Mix selected Compliance with application
Mix
no
Aggregate Binder Target
density
(kgm3)
Measured
density
(kgm3)
Target
cf
(MPa)
Measured
cf
(MPa)
Application
2_1 PU+s 60 PFA 1000-1400 1300 ge 5 83 plusmn 00 block
2_2 PU 50 PFA 1000-1400 895 ge 5 56 plusmn 02 block
2_3 TR+s 50 PFA 1000-1400 1490 ge 5 42 plusmn 01 block
2_4 RX+s 45 PFA lt1500 1530 5-20 68 plusmn 03 panels
3_1 PU 45 PFA
GGBS
7525
lt1100
lt1500
1145
1145
ge 8
5-20
84 plusmn 01
84 plusmn 01
floor screed
(underlay)
panels
3_2a PU45 PFA
GGBS
8515
lt1500 1115 5-20 62 plusmn 00 panels
3_2b PU45 PFA
GGBS
8515
lt1500 1025 5-20 66 plusmn 01 panels
3_3 PU 45 PFA
GGBS
1585
1000-1400 1165 ge 5 151 plusmn 00 block
3_4 RX 40 PFA
GGBS
5050
1000-1400 1475 ge 5 182 plusmn 00 block
75
section 2 the balance that had to be found in the concrete design was to have a mix as light
as possible (brought about by a high LW aggregate volume) while having strength as high
as possible along with the desired workability (brought about by a high paste volume) An
exception was represented by the blocks where an almost zero workability is required
and thus the lightness and workability were affected in the same way in the mix design
rather than the strength and workability Only in the case of TRPFA the sample did not
reach either target This is in accordance with previous analyses in which those materials
prepared with TR aggregates showed low compressive strengths Low adhesion between
the TR aggregates and the matrix makes it difficult for these aggregates to reach good
strengths especially at high aggregate fractions where non-bonded zones around the
aggregates are likely to connect As a conclusion it can be said that the TR aggregates
cannot be used in the combination of the binders tested for the targeted LW-applications
Thus it can be concluded that only the PU aggregates were suitable for the applications
under consideration Together with the PFA they are applicable for blocks whereas with
PFAGGBS blends they are also applicable for panels
It has been mostly the low workability of the mixtures that has limited their application
Contrary to well established cements steering the workability by adding water was not an
option for the investigated binders Adding sand was an option for the PFA-binders but
not for the PFAGGBS-binders as the density then increases above the target For the
binders in combination with the aggregates no suitable additives could be found that were
commercially available to improve the workability within this project
4 Numerical concrete design for performance prediction
41 Basic principle of the modelling
From the previous sections it has become clear that it requires quite an effort to design
concrete with sustainable aggregatesustainable binder even on only two performance
demands Each additional performance demand and each new material considered will
increase the experimentation scheme considerably Without help of a design tool all
compositional design may therefore be sub-optimal However there is a lack of research
on concrete design methods other than consisting of large testing schemes or optimization
of the aggregate packing [Mueller 2014] To develop an efficient way of designing concrete
mixtures a design tool has been developed The design tool is based on the principle that
the properties of concrete (and other composite materials) are determined by the properties
76
of the constituents their volume fractions in the material and their spatial arrangement
Whereas the properties of the constituents in general can be determined separately and
the volume fractions are known when a concrete mix is designed the spatial arrangement
of the particles is difficult to predict Moreover the dependency on the spatial arrangement
of most properties is different For instance the density of concrete is independent of the
spatial arrangement of coarse aggregates in the mortar (consisting of cement paste and fine
aggregates) In contrast the thermal conductivity depends on the spatial arrangement
In the literature a whole range of different geometrical arrangements can be found to
predict concrete properties that are dependent on the spatial arrangement of its
constituents [Carson 2005] ranging from simple parallel and series ordering of its
constituents without considering the particle structure nor placement (Figure 7) to more
advanced spatial arrangements Although approximate models can be used as a first guess
they generally do not have sufficient predictive capacity for concrete design The
dependence of the concrete properties on the particles arrangement requires more detailed
modelling
Figure 7 Schematized influence of the aggregate volume fraction on the Youngrsquos modulus of
concrete for parallel true and series arrangement of the aggregates
Discrete element method (DEM) is becoming widely accepted as an effective method of
addressing engineering problems in granular materials as proven by Stroeven [1999] and
continued research based on this work (see eg He [2010 2012] Stroeven [2015]) Stroeven
[1999] has shown that all types of concrete compositional defects also can be simulated
with this method such as wall effects around aggregates (giving rise to porous interfaces
77
and thus low strengths) and inefficient packing (giving rise to high porosity and thus also
low strength and durability)
In line with the goals of this research the concrete has been modelled as a two phase
material consisting of mortar and coarse aggregate Hence the mortar has been modelled
as one phase or constituent consisting of the binder(s) small aggregates with a diameter
up to 2 mm water and additives Testing mortars to determine the properties of the
binders for concrete composition design is standard practice standard strengths of cement
for instance are determined on such a mortar From the numerical point of view some
practical issues can be avoided in this way as well Although it is possible to model a large
size range of particles of various shapes discrete element methods are relatively
computationally-intensive with computational times increasing fast with the number of
aggregate size classes included and higher packing densities The validity of this phase
separation also called scale separation has not yet been proven beyond doubt but is
required to restrict computer efforts
Most mortarsconcretes develop their properties over time due to ongoing
hydrationchemical reactions after mixing the binders with water and possibly activator
The properties of the mortar were measured as a function of time which renders possible
predicting time dependent properties of the mortar This method was chosen over
simulation of the time dependent chemical hydration reactions because of the uncertainty
in reaction products in this research (eg Hymostruc [Breugel 1991] CEMHYD3D [Bentz
2005] microic [Bishnoi and Scrivener 2009] XIPKM [Le 2013])
Figure 8 Evolution of particle packing showing segregation phenomena for particles with different
densities ndash lighter (white) particles fall slower than heavier (grey) particles
78
42 Fresh concrete state
Modelling
The open software tool LIGGGHTS [Kloss 2012] used in the present work involves a
random sequential addition (RSA) step in which particles are sequentially placed in
random positions in a container followed by a DEM step to predict the evolution of particle
positions taking into consideration the particle-particle and the particle-fluid interactions
After initial placement of the particles in a container the rearrangement of the particles
needs to be modelled For the current simulation no stirring or shaking has been included
Fluid ndash particle forces included were the buoyancy force and friction (drag force) of fluid
on the particles The buoyancy force depends on the fluid density and the particle size
according to
= ρ π 343
( )buoyancy fluid particleF R g (5)
where ρ fluid is the fluid density particleR is the particle radius and g is the gravity
acceleration The drag force depends on the behaviour of the fresh mortar according to
= πμ6drag dragF C R v (6)
where v is the velocity (of the particle moving through the fluid) R is the particle radius μ
is the fluid viscosity and dragC depends on the constitutive equation of the fluid
The particle-particle interactions were calculated based on the contact geometry [Fennis
2011 He 2010 Kloss and Goniva 2012 Stroeven 1999] and described by Coulombrsquos law of
friction and both normal (contact and damping) and tangential (shear and damping) forces
were considered
The fresh mortar behaves as a Bingham fluid but only in its dormant period After this
period the cement hydrationalkali-activated binder reactions become relevant and the
mortar can no longer be modelled as a Bingham fluid Thus after the dormant period the
drag force is not modelled accurately anymore (Figure 9) For the majority of the mixes
placement of the aggregates will be finished well before the mix stiffens due to hydration
Mixtures which will lsquosolidifyrsquo before settling completely are unlikely to be used in practice
because of their low open time On the other hand if workability is too high it is possible
79
Figure 9 Simulation approaches to study concrete performance
that unwanted phenomena such as segregation or bleeding can occur Such phenomena
can be predicted by DEM and some (virtual) mix modifications can made in order to avoid
these phenomena (eg changing aggregate grading or density changing the viscosity of
the lsquofluidrsquo (the mortar) etc)
Measuring the input material parameters in the model
The fresh mortar is described in the model as a Bingham fluid characterized by the fluid
viscosity μ and yield stress τ0 To validate this choice of the constitutive equation for the
mortar as well as to determine the input parameters for the numerical predictions
viscosity experiments have been performed on the (fluid) mortars An example of the
results is given in Figure 10 Together with the density the fluid phase is fully described
The mechanical interactions between the aggregates are defined by their elasticity
parameters and two interaction coefficients the coefficients of friction and of restitution
taking into account the loss of energy upon collision [Kloss and Goniva 2012 Stroeven
1999] It was concluded from a sensitivity analysis of the modelling that for the materials
under consideration the simulation results were not sensitive to the coefficient of
restitution therefore this coefficient was not measured The coefficient of friction was
measured by a classical Newtonian friction experiment by means of a simple tribometer
while the elasticity parameters were measured by means of Ultrasonic Pulse Velocity both
80
in the P- and S-mode A summary of the required input with respect to the material
properties is given in Table 7
Simulations
The sustainable concrete mix has been simulated as discussed for a two phase-material
consisting of coarse aggregates and a (fluid) mortar The aggregate particles are inert solid
inclusions For the sake of simplicity only spherical particles were considered in the
present study For the LW concrete under consideration optimum packing is not a design
criterium Instead the maximum amount of aggregates that can be accommodated while
still complying the strength demand (Section 3) is of more importance In the simulation
the properties of the concrete are determined for volume fractions of the coarse aggregates
in the range 01 to 038 the latter volume fraction being similar to total aggregate fraction
around 07 when including the sand from the mortar The aggregate particles size
distribution was taken according to Fuller [Neville 2002] with average particle sizes for
the classes 2-4 mm 4-8 mm and 8-16 mm As an example three particle packing
simulations are shown in Figure 11 with coarse aggregate volume fractions of aggregate of
01 03 and 038 Periodic boundaries were used
Figure 10 Results of the viscosity experiments for the reference mortar showing perfect Bingham fit
Table 7 Constituent properties required in the fresh state modelling
Particles properties Fluid properties
Youngrsquos Modulus (GPa) Density (kgm3)
Poissonrsquos ratio (-) Viscosity (Pa s)
Coefficient of friction (-) Yield stress (Pa)
τ
shearstress [Pa]
81
Figure 11 Particle packing with different volume fractions of coarse aggregate (left to right 01 03
and 038 at equilibrium) container of 160 x 160 x 160 mm3 (tenfold the size of the largest particle)
In the example shown in Figure 11 the distribution of the particles at equilibrium can be
seen to have remained well dispersed contrary to the particles shown in Figure 8 which
not only sank to the bottom of the container but also segregated Although the density of
the aggregates in Figure 11 is about 165-fold larger than that of the fluid mortar the
buoyancy force is not sufficient to overcome the critical yield As a consequence the
particles remain well distributed even at these low coarse aggregate volume fractions
where the aggregates settle in the mortar (and not settle at the bottom or drift to the top of
the container)
43 Hardened concrete state
Modelling
The final equilibrium condition of the DEM simulations as shown in the examples in
Figure 11 is assumed to represent the particles in the hardened state because the
placement of the aggregates is finished presumably well before the hardening or
hydration process renders the particles immobile It thus serves as input for the following
simulation phase addressing the performance of the hardened concrete by a 2D FEM
(Finite Element Modelling) approach For this purpose 2D sections of each 3D particle
packing were extracted from the cross section in the middle of the simulation domain The
2D sections resulting from the particle packing of Figure 11 are shown in Figure 12 For
each property boundary conditions were chosen in accordance with their definition in the
constitutive equations This means that the elasticity parameters of the concrete were
calculated by simulating an uniaxial compression test (Figure 13 left) and the Youngrsquos
modulus and Poissonrsquos ratio were calculated according to their definitions by Hookersquos law
[He 2010] In a similar way the thermal conductivity of concrete concretek was calculated
using the Fourier law in unidirectional steady-state heat transfer (Figure 13 right)
82
Figure 12 Particle packings at three different coarse particle volumes of 01 03 and 038 (top row)
and cross-sections of the particle packing at three different locations (rows below)
Measuring the input material parameters
Each concrete parameter to be determined requires its own set of input parameters For the
elasticity parameters of the concrete these are the two elasticity parameters (ie Poissonrsquos
ratio and Youngrsquos modulus) of the two constituents (coarse aggregates and mortar) For
the thermal conductivity of the concrete the thermal conductivity of the constituents is
necessary Thus the elastic properties of the concrete constituents have been measured by
83
Figure 13 Boundary conditions applied for obtaining the Youngrsquos modulus (left) and the thermal
conductivity (right) of concrete
means of UPV for P-waves and S-waves The thermal conductivity of the mortar was
determined according to EN 12664 For the aggregate only an estimate could so far be
obtained by compacting the loose aggregates in the hotplate equipment according to EN
12667 As the mortar is developing its properties over time the elasticity parameters and
the thermal conductivity have been measured at different ages Figure 14 shows the age-
dependency of the Youngrsquos modulus as an example Table 8 shows the required properties
of the constituents of the hardened concrete for the determination of the elasticity and
thermal conductivity
Simulations
A systematic numerical study was conducted in which the Youngrsquos modulus and thermal
conductivity of the aggregate particles and the mortar were varied while the remaining
properties were kept constant As an example results for the Youngrsquos moduli are shown in
Figure 15
Figure 14 Dynamic Youngrsquos modulus for various ages of the reference mortar
84
Table 8 Constituent properties required in the hardened state modelling
Coarse aggregate
properties
Unit Mortar properties
(as function of age)
Unit
Youngrsquos Modulus GPa Youngrsquos Modulus GPa
Poissonrsquos ratio - Poissonrsquos ratio -
Density kgm3 Density in hardened state kgm3
Thermal conductivity WmK Thermal conductivity WmK
Figure 15 Youngrsquos modulus of the concrete Econcrete as a function of the Youngrsquos modulus of the
aggregate Eaggregate for Emortar = 12 GPa (left) and for Emortar = 60 GPa (right) volume fraction of
aggregate = 038
As shown in Figure 15 when the aggregates have no stiffness and can be viewed as
infinitely compressible (ie as lsquoairrsquo) the stiffness of the concrete is reduced as compared to
that of the mortar When the aggregate stiffness is larger than that of the mortar the
stiffness of the concrete is increased If the aggregates become however much stiffer than
the mortar further increase in stiffness has little effect as only the mortar deforms
noticeably At this stage a final stiffness of the concrete is reached (Figure 16)
44 Design demonstration of the sustainable concrete
As a demonstration of its design possibilities the properties of concrete have been
calculated for concrete consisting of a reference mortar with either gravel or polyurethane
foam (PU) as coarse aggregates The results at 25 and 50 coarse aggregate fractions are
shown in Table 9 (the 50 PU is comparable to mix 2_1 although there is much less sand
in mix 2_1)
85
The DEMFEM simulations show that a quick numerical design for the various types of
concrete investigated herein can be realized for elasticity and thermal insulation
properties The design can be extended to other properties that can already be simulated
with related numerical models (eg Le [2014]) Although there is in general a good relation
between viscosity of a mix and the workability (see eg Banfill [2006]) and recently
progress has been made in predicting the workability by a similar DEM-approach
[Mechtcherine 2015] the choice of a good workability reference method and the numerical
validation of these practical test methods are still challenging
Figure 16 Youngrsquos modulus of the concrete (Econcrete) as a function of the Youngrsquos modulus of the
aggregate (Eaggregate) both normalized by the Youngrsquos modulus of the mortar (Emortar) for two
mortars (M1 and M2 characterized by Emortar of 12 GPa and 60 GPa respectively) and for
volume fractions of aggregate (VF) of 01 03 and 038 Mortar curves M1 and M2 are the same
and only depending on the volume fraction of aggregates and mortar
Table 9 Simulated properties of concrete ndash replacing coarse gravel with PU
Density Youngs
Modulus
Poissons ratio Thermal
conductivity
kgm3 GPa - W(mK)
PU 25 1825 181 025 040
PU 50 1326 34 023 012
Gravel 25 2405 444 020 096
Gravel 50 2486 570 015 205
aggregate mortarE E
concrete
mortar
EE
86
5 Conclusions
In this research toward new types of sustainable concrete the fresh concrete mix trial in
which the workability was investigated in relation to the aggregate volume fraction
showed that combing the geopolymeric binders with the new types of aggregates could
lead to compatibility problems such as gas formation extreme heat formation corrosion of
the moulds and flash- and fast set Heat curing in relation with the thermal low
conductive aggregates proved sometimes to be a too large challenge geopolymerisation
occurred too superficially and internally no hardening took place It was concluded that
only the PU aggregates were suitable for the four applications under consideration
(blocks panels floor screed and floor screed underlay) Together with the PFA as binder
the PU aggregates are applicable for blocks whereas with PFAGGBS blends as binder
they are also applicable for panels and floor screed (underlay) applications although in the
latter two cases the workability open time target of 60 minutes could not be guaranteed It
has been mostly the low workability of the mixtures that has limited their application
Contrary to well established cements and aggregates no suitable additives could be found
that were commercially available to improve the workability for the used combination of
waste aggregates and binders
The tested mechanical properties were on average good for all tested mixtures with the
exception of the tyre rubber aggregates Its low compressive strength has been attributed
to the low bonding between the aggregates and the matrix Thermal conductivity was low
as could be expected from the low thermal conductivity values of the aggregates and the
(relative) high volume fractions used
The results show that it is possible to produce a non-structural sustainable concrete with
good mechanical and thermal insulation properties that may contribute to a sustainable
world
The numerical concrete mix design method proves to be a very promising tool in designing
concrete not only for the compressive strength but also for other performance demands
such as elasticity parameters and thermal conductivity Although there is in general a
relation between viscosity of a mix and the workability the sustainable aggregates
combined with the sustainable binders proved to have a low workability which could not
as yet be included in the numerical model
87
Acknowledgement
This research has been executed within the EU-project SUS-CON SUStainable innovative
and energy efficient CONcrete based on the integration of all-waste materials FP72007-
2013 (grant 285463) Their financial support is gratefully acknowledged
Literature
ACI 2111-91 (1991) Standard practice for selecting proportions for normal heavyweight
and mass concrete ACI Manual of concrete Practice Part 1 Materials and general
properties of Concrete 38 pp ACI Detroit Michigan USA
Aliabdo A A Abd Elmoaty A E M Abd Elbaset M M (2015) Utilization of waste
rubber in non-structural applications Construction and Building Materials 91 195ndash207
Al-Sibahy A Edwards R (2012) Thermal behaviour of novel lightweight concrete at
ambient and elevated temperatures Experimental modelling and parametric studies
Construction and Building Materials 31 174ndash187
Attanasio A Largo A Alvarez I L Sonzogni F Balaceanu L (2015) Sustainable
aggregates from secondary materials for innovative lightweight concrete products
HERON Vol 60 (2015) No 12 pp 5ndash26
Banfill P F G (2006) Rheology of fresh cement and concrete Rheology Reviews 2006 pp
61ndash130
Bentz D P (2005) CEMHYD3D a three-dimensional cement hydration and
microstructure development modeling package Version 30 NISTIR 7232 US
Department of Commerce Gaithersburg MD USA
Bernal S A de Gutieacuterrez R M Pedraza A L Provis J L Rodriguez E D Delvasto S
(2011) Effect of binder content on the performance of alkali-activated slag concretes
Cement and Concrete Research 41(1) 1ndash8
Bishnoi S Scrivener K L (2009) microic A new platform for modelling the hydration of
cements Cement and Concrete Research 39(4) 266ndash274
Blackery J Mitsoulis E (1997) Creeping motion of a sphere in tubes filled with a
Bingham plastic material Journal of Non-Newtonian Fluid Mechanics 70 59ndash77
Braacutes A Leal M Faria P (2013) Cement-cork mortars for thermal bridges correction
Comparison with cement-EPS mortars performance Construction and Building Materials
49 315-327
Bravo M de Brito J (2012) Concrete made with used tyre aggregate durability-related
performance Journal of Cleaner Production 25 42ndash50
88
Breugel K van (1991) Simulation of hydration and formation of structure in hardening cement-
based materials PhD thesis Delft University of Technology
Carson J K Lovatt S J Tanner D J Cleland A C (2005) Thermal conductivity bounds
for isotropic porous materials International Journal of Heat and Mass Transfer 48(11)
2150ndash2158
Chabra R Richardson J (2011) Non-Newtonian flow and applied rheology engineering
applications (2nd ed) Butterworth-Heinemann Oxford UK
Choi Y-W Moon D-J Chung J-S Cho S-K (2005) Effects of waste PET bottles
aggregate on the properties of concrete Cement and Concrete Research 35(4) 776ndash781
Collepardi M Collepardi S Troli R (2007) Concrete mix design Grafiche Tintoretto
Castrette di Villorba TV Italy
Collins F G Sanjayan J G (1999) Workability and mechanical properties of alkali
activated slag concrete Cement and Concrete Research 29(3) 455ndash458
Eldin N N and Senouci A B (1993) Rubber-tire particles as concrete aggregate Journal
of Materials in Civil Engineering 5(4) 478ndash496
EuroLigthCon (2007) Grading and Composition of the Aggregate EuroLight report BE96-
3942R7 Sintef Norwegen
Fattuhi N I Clark L A (1996) Cement-based materials containing shredded scrap truck
tyre rubber Construction and Building Materials 10(4) 229ndash236
Fennis S (2011) Design of ecological concrete by particle packing optimization PhD thesis
Delft University of Technology Delft The Netherlands
Fib (2004) Environmental Design Fib bulletin 28 Fib Lausanne Switzerland
Fib (2012) Model Code for Concrete Structures 2010 Fib Lausanne Switzerland
Fib (2015) Benchmarking of deemed-to-satisfy provisions in standards Fib Lausanne
Switzerland
Flatt R J Roussel N Cheeseman C R (2012) Concrete An eco material that needs to be
improved Journal of the European Ceramic Society 32(11) 2787ndash2798
Gijlswijk R N van Pascale S de Vos S E Urbano G (2015) Carbon footprint of
concrete based on secondary materials HERON Vol 60 (2015) No 12 pp 113-142
He H (2010) Computational modelling of particle packing in concrete PhD thesis Delft
University of Technology Delft the Netherlands
He H Stroeven P Stroeven M Sluys L J (2012a) Influence of particle packing on
elastic properties of concrete Magazine of Concrete Research 64 (2) 163-175
89
He H Le NLB Stroeven P (2012b) Particulate structure and microstructure evolution
of concrete investigation by DEM Part 1 Aggregate and binder packing HERON Vol
57 (2012) No 2 pp 112ndash132
Herrero S Mayor P Hernaacutendez-Olivares F (2013) Influence of proportion and particle
size gradation of rubber from end-of-life tires on mechanical thermal and acoustic
properties of plasterndashrubber mortars Materials amp Design 47 633ndash642
Jo B-W Park S-K Kim C-H (2006) Mechanical properties of polyester polymer
concrete using recycled polyethylene terephthalate ACI Structural Journal 103(2) 219-
225
Kloss C Goniva C Hager A Amberger S Pirkers S (2012) Models algorithms and
validation for opensource DEM and CFDndashDEM Progress in Computational Fluid
Dynamics 12 140ndash152
Kosmatka S H Wilson M L (2011) Design and Control of Concrete Mixtures The guide
to applications methods and materials 15th Editions PCA Skokie Illinois USA
Lakshmi R Nagan S (2010) Studies on concrete containing E plastic waste International
Journal of Environmental Sciences 1(3) 270ndash281
Le LBN Stroeven M Sluys LJ Stroeven P (2013) A novel numerical multi-component
model for simulating hydration of cement Comput Mater Sci 7812ndash21
Le LBN Sluys LJ Stroeven M Stroeven P (2014) Implication of pore structure on
micro-mechanical behaviour of virtual cementitious materials Computational Modelling
of Concrete Structures (eds Bicanic et al) Taylor and Francis Group London pp 109-
116
Lee N K Lee H K (2013) Setting and mechanical properties of alkali-activated fly
ashslag concrete manufactured at room temperature Construction and Building
Materials 47 1201ndash1209
Marzouk O Y Dheilly R M Queneudec M (2007) Valorization of post-consumer waste
plastic in cementitious concrete composites Waste Management 27(2) 310ndash318
Mounanga P Gbongbon W Poullain P Turcry P (2008) Proportioning and
characterization of lightweight concrete mixtures made with rigid polyurethane foam
wastes Cement and Concrete Composites 30(9) 806ndash814
Mueller HA Breiner R Moffatt JS Haist M (2014) Design and properties of sustainable
concrete Procedia Engineering 95 290-304
Nath P Sarker P K (2014) Effect of GGBFS on setting workability and early strength
properties of fly ash geopolymer concrete cured in ambient condition Construction and
Building Materials 66 163ndash171
90
Neville AM (2002) Properties of Concrete 4th edition Pearson Prentice Hall Harlow
England
Ordonez-Miranda J Alvarado-Gil J J (2012) Thermal conductivity of nanocomposites
with high volume fractions of particles Composites Science and Technology 72(7) 853ndash
857
Perevozchikov A Yakovlev G Kodolov V (2000) Polyethylene foam waste utilization
for light-weight concrete production International Journal of Polymeric Materials 47(1) 7ndash
17
Petit J Y Wirquin E Vanhove Y Khayat K (2007) Yield stress and viscosity equations
for mortars and self-consolidating concrete Cement and Concrete Research 37(5) 655ndash670
Pezzi L De Luca P A Vuono D Chiappetta F Nastro A (2006) Concrete products
with wastersquos plastic material (bottle glass plate) In Materials Science Forum Vol 514-
516 (no 2) 1753ndash1757
Provis J and van Deventer J (2014) Alkali Activated Materials Springer The Netherlands
Rebeiz K S (1996) Precast use of polymer concrete using unsaturated polyester resin
based on recycled PET waste Construction and Building Materials 10(3) 215ndash220
Sabnis G M (2011) Green Building with Concrete Sustainable Design and Construction CRC
Press Boca Raton USA
Sikalidis C A Zabaniotou A A Famellos S P (2002) Utilisation of municipal solid
wastes for mortar production Resources Conservation and Recycling 36(2) 155ndash167
Stroeven M (1999) Discrete numerical modelling of composite materials-Application to
cementitious materials PhD thesis Delft University of Technology Delft The
Netherlands
Stroeven P Li K Le LBN Stroeven M (2015) Capabilities for property assessment on
different levels of the micro-structure of DEM-simulated cementitious materials
Construction and Building Materials 88 105-117
Sukontasukkul P and Chaikaew C (2006) Properties of concrete pedestrian block mixed
with crumb rubber Construction and Building Materials 20(7) 450ndash457
Vaacuteclaviacutek V Dvorskyacute T Dirner V Daxner J Šťastnyacute M (2012) Polyurethane foam as
aggregate for thermal insulating mortars and lightweight concrete Tehnički vjesnikndash
Technical Gazette 19(3) 665ndash672
Vinai R Panagiotopoulou C Soutsos M Taxiarchou M Zervaki M Valcke S Ligero
V C Couto S Gupta A Pipilikaki P Alvarez I L Coelho D Branquinho J
(2015) Sustainable binders for concrete A structured approach from waste screening to
binder composition development HERON Vol 60 (2015) No 12 pp 27-57
91
Visser JHM Bigaj-van Vliet A J (2014) Designing sustainable concrete on the basis of
equivalence performance assessment criteria for safety Proc 4th Intl FIB congress on
Improving Performance of Concrete Structure Mumbai February 10 ndash 13 2014 India pp
1-11
Wang X Wang K Han J Taylor P (2015) Image analysis applications on assessing
static stability and flowability of self-consolidating concrete Cement and Concrete
Composites 62 156ndash167
Annex Mix compositions
Mix
ID
Binder
(kgm3 concrete)
Activators
(kgm3 concrete)
Aggregate
(kgm3 concrete)
Water
(kgm3 concrete)
2_1 PFA 459 WG 92
NaOH 53
PU foam 4-8 mm 139
normsand 0-2 mm 477
116
2_2 PFA558 WG 112
NaOH 65
PU foam 165 70
2_3 PFA 589 WG 118
NaOH 68 kg
Tyre rubber 0-06 mm 49
tyre rubber 2-4 mm 315
normsand 0-2 mm 331
135
2_4 PFA 648 kg WG 130
NaOH 75
Remix HD 1-4 mm 255
normsand 0-2 mm 358
130
3_1 PFA367
GGBS 122 kg
WG 98
NaOH 38
PU 0-4 mm 52
PU 4-8 mm 97
148
3_2 PFA 481
GGBS 85 g
WG 113
NaOH 66
PU 0-4 mm 74
PU 4-8 mm 74
166
3_3 PFA 76
GGBS 433
WG 112
NaOH 43
PU 0-4 mm 52
PU 4-8 mm 97
149
3_4 PFA 350
GGBS 350
WG 140
NaOH 81
Remix HD 1-4 mm 259
Remix LD 8-125 mm 53
171
) WG waterglass NaOH sodium hydroxide (50)
92

60
Key words Sustainable binder sustainable aggregate workability mechanical properties
thermal conductivity numerical concrete design performance
1 Introduction
Producing concrete from secondary raw materials is an excellent way to contribute to a
more sustainable world This concrete then is required to have at least the same
performance during its service life as concrete made with the primary raw materials it
replaces Secondary raw material based concrete with similar performance further called
sustainable concrete in this paper saves not only primary raw materials and reduces the
waste pressure on the environment it also reduces Green House Gas emissions (GHG)
and energy (eg Muller [2014] fib [2004])
Secondary raw materials for aggregates require waste streams that are available in large
enough quantities for a substantial replacement in the concrete (production) industry and
pose a socio-economic problem Within Europe these are among others shredded tyre
rubber polyurethanes and plastics These can be used as Light Weight (LW) aggregates in
concrete [Attanasio 2015] Their use as sustainable LW-aggregates in cement-based
concrete is reported for rubber [Bravo 2012 Eldin 1993 Fattuhi 1996 Sukontasukkul
2006] polyurethanes [Mounanga 2008 Perevozchikov 2000 Vaacuteclaviacutek 2012] and plastics
[Choi 2005 Jo 2006 Lakshmi and Nagan 2010 Marzouk 2007 Pezzi 2006 Rebeiz 1996
Sikalidis 2002] and were shown to improve the thermal insulating properties of concrete
Workability and compressive strength proved difficult to maintain [Eldin 1993 Fattuhi
1996 Sukontasukkul 2006] Similar results were found by [Attanasio 2015] for tyre rubber
rigid polyurethane foams and recycled plastic scraps that are also used in this study
Secondary raw materials such as fly ash slag and perlite tailings are in sufficient large
quantities available to serve as cement replacement [Vinai 2015] Sustainable binders such
as alkali activated fly ash slag or combinations of these have been shown to develop a
higher compressive strength than a similarly composed concrete based on a Portland
cement binder and gravel and sand as aggregates [Provis 2014 Bernal 2011] Workability
is more difficult to control as it depends on several parameters (eg activator type and
concentrations) [Collins 1999 Lee 2013 Nath 2014]
61
The current research focuses on designing concrete made with both secondary based
binder and aggregate without negative impact on performance Although the use of any of
these materials in building products is not new [eg Sabnis 2011] the combination of
these sustainable materials to an all-waste type of concrete is The aim of this paper is to
report on the performance of concretes based on the combined use of waste aggregates and
waste binders yielding a low weight high insulating building material with a low
embodied energy while maintaining its performance during its targeted service life of its
building application Results for both the fresh state and the hardened state are included
Durability tests are also part of the research but fall outside the scope of this paper and will
be reported elsewhere The carbon footprint of this sustainable concrete is reported in
Gijlswijk [2015] Full Life Cycle Analysis (LCA) and Life Cycle Costs (LCC) analysis will be
reported at a later stage
Combining sustainable LW-aggregate with a sustainable binder to a concrete that still has
the same performance as a lsquotraditionalrsquo concrete is quite a task Most performance
characteristics of hardened concrete (eg strength thermal resistance) are impossible or not
easy to design in advance and in general trial mixtures have to be made and tested to
determine these properties [Flatt 2012] This is not a preferable way of concrete design
when many different types of materials are available as it may result in extensive
experimental programs to find (the most) suitable aggregatebinder combination and the
optimum aggregate volume fraction Moreover these programs require reruns if the
properties of one of the constituents changes since then also performances may change for
the worst and even the most opportune combinations of aggregatebinder may change as
well The lack of research on concrete design methods other than consisting of large testing
schemes is disconcerting Optimization of sustainable concretes is still often sought by
optimization of the aggregate packing on the presumption that if the cement content can
be lowered the environmental impact will reduced [Mueller 2014] For the sustainable
concrete in this research no primary materials are used in the binder production so this
assumption is not a priori valid Moreover by the use of LW aggregates many
performances such as strength will be reduced with a decrease of binder content
[EuroLigthCon 2008] For this reason a radical different approach from traditional
concrete design has been sought in a modern way of concrete design The second half of
this paper is devoted to the principle of performance based design of sustainable concrete
The aim is to show how it can be used as a design tool
62
2 Fresh concrete research
21 Materials
Binders
Three types of binders have been used in the research
bull cyclones and micro-silica being wastes from a perlite production plant in a 9010
weight proportion and either activated by only NaOH solution (denoted as alkali
activator) or using both NaOH solution and waterglass (denoted as WG
activator)
bull PFA with NaOH waterglass activation
bull PFAGGBS mixture with various PFAGGBS ratios and NaOH waterglass
activation
All binders have been described in detail in Vinai [2015] including the concentration and
type of activators
Aggregates
Also three types of light weight (LW) aggregates have been used
bull Shredded rigid polyurethane foam (PU) (grades 0-4 mm and 4-8 mm)
bull shredded tyre rubber (TR) (grades 0-06 mm 06-2 mm 2-4 mm 3-7 mm)
bull high density Remix (RX HD) (grades 0-3 mm and 3-7 mm) mixed plastic wastes
obtained after sorting plastics from municipal solid wastes combined with a low
density Remix (RX LD) 8-125 mm grade Gypsum was used as foaming agent to
obtain the LD aggregates but the mixed plastic wastes are similar
All aggregates have been described in detail in Attanasio [2015] including their production
process In addition to the LW aggregates sometimes Natural Sand (NS) (grades 0-2 mm
or 0-4 mm) was used as well
22 Target requirements
The targeted mix designs were aimed for four types of application floor screed floor
screed underlay panel for facades and blocks For these applications a pre-described
workability density and compressive strength were taken from the standards The target
requirements for different applications are mentioned in Table 1
63
Table 1 Target requirements for different applications compressive strength and density
requirements at 28 days
Application Workability Compressive
strength (MPa)
Density
(kgm3)
Floor screed ready mix ge 125100 mm slump ge 5 lt1100
(60 min)
Floor screed underlay ready mix ge 125100 mm slump ge 8 lt1100
(60 min)
Panels for facades precast ge 16100 mm slump 5 - 20 lt1500
(30 min)
precast-SCC ge 70650 mm flow
(30 min)
Blocks 0-30 mm slump ge 5 1000-1400
(15 min)
23 Characterization methods
The workability of concrete was evaluated by slump slump flow and spread
measurements The slump and slump flow were evaluated according to the EN 12350-2
standard Spread measurement was performed according to the EN 12350-5 standard The
concrete density was evaluated according to the EN 12350-6 standard The compressive
strength was measured according to the EN 12390-3 standard
Figure 1 Example of workability for cyclone μ-silica with PU aggregates 580 mm slump flow
(after 4 min) and 100 mm slump (after 30 min)
64
24 Fresh concrete mix trials initial design and compatibility casting and curing issues
The initial design of the concrete was based on the (theoretical) density of concrete All
binder aggregate combinations were tested with the optimum binder compositions as
formulated by Vinai [2015] As most of the available aggregates reduced the workability
the biggest challenge in the fresh concrete design was to make the concrete as light as
possible while maintaining a sufficient workability Normally workability can be steered
by adding more water to the mix using superplasticisers or adding some more round
particles that can cause a lubrication effect As the geopolymerization process is quite
sensitive to the amount of water in the mix adding water was not an option In addition
especially for the PU aggregates with a density of only 330 kgm3 adding water may
result in segregation if the viscosity of the mixture is reduced too much Commercially
available superplasticiser proved to be ineffective in these novel types of concretes so that
workability could be steered only by adding more round particles For the PFAGGBS
binders it was possible to add (more round) fly ash particles in the binder blend For the
other binders the only possibility was adding sand but this also increased the density of
the mix The amount of sand that could be added was therefore limited by the targeted
density of the concrete
Compatibility discrepancies between the aggregates and the binders may cause mixing
and casting problems and ultimately poor quality of the concrete Literature results
showed that for both the used aggregates and binders workability could be difficult to
control [Eldin 1993 Fattuhi 1996 Sukontasukkul 2006 Collins 1999 Lee 2013 Nath
2014] A quick assessment of the initially designed fresh concrete mixtures was therefore
made firstly on the basis of workability As two binders (the activated fly ash and cyclone
micro-silica based binders) required heat curing to harden within a reasonable time span also
curing is an important stage for developing a good quality concrete The (geo-)
polymerization underlying the hardening of the activated fly ash and cyclone micro-silica
based binders is a two-stage process in the first dissolution and the formation of the
monomers takes place requiring water The actual hardening takes place during the
second stage (polymerization) During this stage however water should be able to escape
[Vinai 2015] The effect of curing has been tested by compressive strength tests
Different mixing casting and curing approaches were also tried in this study In general
mixing was started with the aggregates adding the coarse particles first followed by the
(pre-blended) binders and then (pre-blended and aged if required) liquids (water and
65
activators) After each step mixing was executed to assure a good dispersion of the various
components Mixing times were adjusted by visual quality control Casting was done
either in plastic moulds or steel moulds depending on preferences of the laboratory
Because of the adhesion issues between the geopolymers and the steel
The major results of the mix trials were as follows
bull Despite different (re-)cleaning techniques the 03 mm RX aggregates were
rejected because this fraction caused heat formation quick drying and swelling
of the concrete This was most likely caused by residual impurities such as
metallic aluminium in the plastic waste stream [Attanasio 2015]
bull TR aggregates mixes gave rise to quick setting that could be overcome by
additional mixing The quick setting was likely flash set presumably due to a
sudden reaction of sulphate compounds from the vulcanization process of tires
with the aluminium present in the binders
bull For the cyclonesmicro-silica based binders an optimized curing in two stages was
developed first curing at 70degC followed by a 55 degC curing to allow for the two-
stage geopolymerization process The durations of curing depended on the
concrete composition and laboratory equipment After carrying out the
compressive strength tests it was found that despite the high mass loss only the
external layers of the samples were hardened and the internal part was still soft
This indicates that curing was not homogeneous and the polymerization in the
interior not complete (see Figure 2) The effect of the thermal insulating LW-
aggregates on the curing of these binders resulted in too long heat curing
Figure 2 Disintegration of the specimen during the compression strength test showing that the
interior of the specimens did not harden
66
regimes even for the (relative) small specimens required for the mechanical
testing Therefore these mixtures were further excluded from the research
bull To increase the geopolymerization rate in the PFA-binders the moulds were
oven-cured at 70 degC It was found that the thermal expansion of the PU
aggregates resulted in expansion of the specimen at young age which resulted in
low strengths (due to microcracking) Therefore the curing regime was changed
in a two stage curing procedure first at 50 degC and then at 70 ordmC The exact curing
times depend on the type of laboratory equipment
25 Resulting fresh concrete mixes
Based on the application requirements according to Table 1 further restrictions of the
possible binder aggregates combinations were as follows
bull for the floor screed and floor screed underlay only the PFAGGBS binder could
be used as heat curing for these applications is not possible
bull workability of PUPFA mixtures decreased rapidly over time Contrary to
cement which is known to have a dormant period during its hydration process
[Neville 2002] geopolymers do not Hence the so-called open time or
workability window ie the timeframe in which a mix can be placed and if
required compacted can be quite brief This was the case for the PU PFA mixes
The workability window required for (the) facade panel was not achieved and
only block production was targeted for these mixes
bull compared to the PFA-binder mixtures lower volume fraction of aggregates had
to be used in the PFABGGBS-binder mixtures All used aggregates reduced the
workability considerably and GGBS does not improve the workability the same
way as PFA does among others due to its more angular shape in comparison to
the well-rounded PFA particles [Vinai 2015] Also for these binder mixtures
replacement of sand in the mix increased the workability drastically At the same
time this increased the density frequently above its target so that sand
replacement was not an option Therefore the PFAGGBS ratio was sometimes
increased
The best mixtures for the PFA-binders are shown in Table 2 those for the PFAGGBS-
mixtures in Table 3 Sometimes the workability could not be measured at the required time
due to practical constraints eg the time elapsed before the slump test could be executed
67
Figure 3 Example of workability for PUPFA showing slump flow after 4 min
As the workability decreases with time a higher workability at later times was generally
considered acceptable for the facade and screed applications For blocks the reverse
applies since these are stamped and need to be demoulded immediately In this case a
lower slump is allowed For TRPFA combinations no mixtures could actually be found
that fulfilled all requirements (Table 2) The best one has been included in the experimental
program
For screed application (only PFAGGBS mixtures) the workability requirements could not
be guaranteed for 60 minutes for any combination (Table 3) Neither could the workability
Table 2 Resulting PFA binder concrete fresh concrete workability and density and strength of the
hardened concrete at 28 days (see Annex A for quantities) aggregates as volume proportion of the
concrete and targets between brackets
Mix
no
Aggregate
(fraction)
Workability
(slump in mm)
time (min) (target)
Density
(kgm3)
(target)
Strength
(MPa)
(target)
Application
2_1 PU + sand
60
25 25
(0-30 15)
1230
(1000-1400)
51
(gt 5)
block
2_2 PU
50
30 20
(0-30 15)
895
(1000-1400)
56
(gt 5)
block
2_3 TR + sand
50
90 15
(0-30 15)
1460
(1000-1400)
46
(gt 5)
block
2_4 RX + sand
45
170 20
(ge 160 30)
1430
(lt1500)
59
(5-20)
panel
for facades
68
Table 3 Resulting PFAGGBS binder concrete fresh concrete workability and density and strength
of the hardened concrete at 28 days (see Annex A for quantities) aggregates as volume proportion of
the concrete
Mix
no
Aggr
(fract)
Binder Target
workab
(slump)
Workab
slump
(mm)
Density
(kgm3)
(target)
Streng
(MPa)
(target)
Appl
3_1 PU 45
PFAGGBS
7525
ready mix
ge 125100
(60 min)
180
(30 min)
1090 84 floor
screed
underlay
(lt1100 )
(gt 8)
ready mix
ge 125100
(60 min)
180
(30 min)
1090 84 floor
screed
(lt1100 )
( gt5)
Precast
ge 160100
(30 min)
180
(30 min)
1090 84 panel for
facades
(lt1100)
(5-20)
3_2 PU 45 PFAGGBS
8515
Precast-
SCC flow
ge 70650
525
(30 min)
1210
(lt1500)
76
(5-20)
panel for
facades
3_3 PU 45 PFAGGBS
1585
0-30 10
(15 min)
1165 151 block
(15 min) (1000-1400) (gt 5)
3_4 RX 40 PFAGGBS
5050
0-30 25
(15 min)
1475 182 block
(15 min) (1000-1400) (gt 5)
of the precast SCC for facades be achieved The PUPFAGGBS mix (mix 3_1) was found
to be the best mix meeting the density and compressive strength requirements and having
good workability (180 mm after 30 min) The PUPFAGGBS (mix 3_1) is also suitable for
facades precast applications For blocks application where low initial workability is
needed binder blends with a low PFAGGBS ratio (5050 and 1585) could be used
A concrete mix with PFAGGBS binder and RX aggregates for the block application has
been added in the experimental program although the density slightly exceeded the target
This mix proved to be the optimum mix Increasing the aggregate fraction to reduce the
density resulted in an inhomogeneous mixture mixes with decreased PFAGGBS ratio set
before 15 minutes while mixes with increased PFAGGBS ratio resulted in workability
higher than 30 mm after 15 minutes
69
3 Hardened concrete research
31 Test program and results
The performance of the eight mixtures in Table 2 and Table 3 were tested further according
to the test program in Table 4 Table 5 summarizes the results
Table 4 Test program for the hardened concrete
Test Dimensions specimens
(mm)
Number of
specimens
Standard
Compressive strength 100 x 100 x 100 3 EN 12390-3
Youngrsquos modulus 50 x 100 2 UNI-EN 6556
Flexural strength 400 x 100 x 100 2 EN 12390-5
Thermal conductivity 150 x 150 x 70 2 EN 12664
Table 5 Summary of the experimental results on the hardened concrete at 28 days full mix
compositions are given in Annex A aggregates as volume proportion of the concrete mix 3_2 has
been cast in two-fold Notation fc = compressive strength fflex = flexural strength E = Youngrsquos
modulus and λ = thermal conductivity
Mix
no
Aggregate Binder Density
(kgm3)
fc
(MPa)
fflex
(MPa)
E
(GPa)
λ
(WmK)
2_1 PU+s 60 PFA 1300 83 plusmn 00 20 plusmn 01 19 plusmn 03 031
2_2) PU 50 PFA 895 56 plusmn 02 12 plusmn 01 11 plusmn 02 016
2_3) TR+s 50 PFA 1490 42 plusmn 01 09 plusmn 01 09 plusmn 03 032
2_4 RX+s 45 PFA 1530 68 plusmn 03 13 plusmn 02 10 plusmn 01 034
3_1 PU 45 PFAGGBS
7525
1145 84 plusmn 01 14 plusmn 01 09 plusmn 01 018
3_2a PU45 PFAGGBS
8515
1115 62 plusmn 00 08plusmn 00 11 plusmn 04 -
3_2b PU45 PFAGGBS
8515
1025 66 plusmn 01 09 plusmn 00 - 017
3_3 PU 45 PFAGGBS
1585
1165 151 plusmn 00 21 plusmn 02 31 plusmn 02 020
3_4 RX 40 PFAGGBS
5050
1475 182 plusmn 00 23 plusmn 03 34 plusmn 02 027
70
The failure mode for mixes with PU aggregates (eg mix no 3_3 in Figure 4) can be
classified as very brittle after reaching the peak stress the stress immediately dropped to
almost zero The concrete with the TR aggregates (mix no 2_3 in Figure 4) showed a
slightly more ductile behavior RX samples had an intermediate behavior The softening
behavior is mostly driven by the aggregates and not by the binder as both PFA and
PFAGGBS matrix failures are typically brittle It was observed that TR grains did not
crush but first deformed and next were pulled out (likely by friction-slip) from the matrix
For the PU aggregates the fracture ran through the aggregates RX aggregates showed an
intermediate behavior sometimes the cracks ran through the aggregates but the plastic
shreds within the aggregates prevented complete failure of these aggregates
Figure 4 Test curves for 3_3 (PFAGGBS and PU 45) and 2_3 (PFA and TR+s 50) samples
dashed and solid lines are indicating tests on different specimen
32 Mechanical behavior as compared to normal LW concrete
Concrete is designed solely on compressive strength as indicator of the mechanical
performance All other mechanical properties (eg tensile strength) are related to this
compressive strength in the building codes or the Fib Model Code 2010 (being destined to
become the next generation building codes) It is generally assumed that if the mechanical
relations in the building codes also hold for the new types of concrete it becomes plausible
71
that also all relating failure mechanisms with respect to the mechanical loads in the Fib
Model Code 2010 are fulfilled as well This assumption is based on the similarity in
inorganic binder composition resulting in the same type of mechanical behavior For a
more extensive reading on this topic see [Visser and Bigaj 2014]
To investigate whether a similar relationship may be applied for the developed sustainable
concrete as for already accepted LW concrete defined in the Fib Model Codes 2010 for
concrete grades le C50 the tensile strength of the developed sustainable concrete should
fulfil the following set of relations
= η==
23
min
max
03 ( ) 07
13
ctm l ck
ctk ctm
ctk ctm
f ff f
f f
(1)
where ctmf is the calculated tensile strength ckf is the characteristic compressive strength
minctkf and maxctkf are the lower and the upper bound values of the characteristic tensile
strength respectively For light weight concrete a reduction factor ηl is included
ρη = +04 062200l (2)
in which ρ is the oven dry density of the aggregate (in kgm3) being on average 330 kgm3
for PU 970 kgm3 for TR and 810 kgm3 for RX
The characteristic compressive strength has been calculated on the basis of a 10 variance
since the standard deviations in the tests were only based on three tests and too low to
make a good assessment of the standard variation for the population possible Also due to
the low strengths a constant standard variation of 8 MPa could not be used in this case As
the tensile strength has been measured by means of a four point bending test the
correction factor to include is
= αctm lf ctmflf f (3)
where
ctmflf is the mean flexural tensile strength
α =+
07
07006
1 006b
lfb
h
h
72
bh is the beam depth (100 mm in these tests)
Figure 5 shows the comparison between the measured flexural tensile strength and that
calculated from the compressive strength according to the above relations As can be seen
with the exception of the mix 2_1 the relationship holds also for the developed sustainable
concrete For mix 2_1 measured flexural tensile strength is much higher than the predicted
one on the basis of the compressive strength There is no indication what has caused this
For all other combinations including other PFAPU mixes the relation between measured
flexural tensile strength and compressive strength as given in the Fib Model Code 2010 is
applicable
The modulus of elasticity for lightweight concrete lciE can be estimated from the following
equation according to the Fib Model Code 2010
= η13
0( )10cm
lci E cf
E E (4)
withρη = 2( )
2200E and ρ is the oven dry density of the lightweight aggregate concrete in
kgm3 (being on average 330 kgm3 for PU 970 kgm3 for TR and 810 kgm3 for RX as
Figure 5 Comparison between measured flexural tensile strength and predicted compressive
strength according the Fib Model Code 2010 coding of the mixtures according to Table 5
73
also used for the tensile bending strength) 0cE = 215103 MPa and cmf is the mean
compressive strength (MPa)
In Figure 6 the measured and predicted Youngacutes moduli are shown Although no upper
and lower boundaries are given in the Model Code 2010 for the Youngrsquos moduli the same
upper and lower boundaries are used as for the tensile bending strength namely the 07
and 13 times the calculated value
Figure 6 shows that all PU-mixtures have a measured Youngrsquos modulus higher than the
predicted one on the basis of eq (4) whereas for the other aggregates the combination
with PFA binder resulted in lower values than predicted Only for the RX with the
PFAGGBS the prediction proved to be good
33 Achieved thermal conductivity
The results obtained regarding thermal conductivity (Table 5) show λ-values from 016
WmK (PUPFA) to 034 WmK (RXPFA) As the LW aggregates have a very low
thermal conductivity themselves (004 WmK for TR and 006 WmK for PU no reliable
data for RX available) the thermal conductivity of the SUS-CON concrete decreases
Figure 6 Comparison between measured and predicted Youngacutes modulus coding of the mixtures
according to Table 5
74
considerably with these LW aggregate fractions The addition of sand having a thermal
conductivity of circa 48 WmK adversely affects the thermal insulation capacity
34 Possible applications for the SUS-CON concrete
In Table 6 a comparison is made between the performance demands and the obtained
results for the newly casted specimens in the hardened concrete research As discussed in
Table 6 Compliance of the hardened concrete with the performance demands for various
applications densities and compressive strength are based on different specimens from the fresh
concrete tests of Section 3
Mix selected Compliance with application
Mix
no
Aggregate Binder Target
density
(kgm3)
Measured
density
(kgm3)
Target
cf
(MPa)
Measured
cf
(MPa)
Application
2_1 PU+s 60 PFA 1000-1400 1300 ge 5 83 plusmn 00 block
2_2 PU 50 PFA 1000-1400 895 ge 5 56 plusmn 02 block
2_3 TR+s 50 PFA 1000-1400 1490 ge 5 42 plusmn 01 block
2_4 RX+s 45 PFA lt1500 1530 5-20 68 plusmn 03 panels
3_1 PU 45 PFA
GGBS
7525
lt1100
lt1500
1145
1145
ge 8
5-20
84 plusmn 01
84 plusmn 01
floor screed
(underlay)
panels
3_2a PU45 PFA
GGBS
8515
lt1500 1115 5-20 62 plusmn 00 panels
3_2b PU45 PFA
GGBS
8515
lt1500 1025 5-20 66 plusmn 01 panels
3_3 PU 45 PFA
GGBS
1585
1000-1400 1165 ge 5 151 plusmn 00 block
3_4 RX 40 PFA
GGBS
5050
1000-1400 1475 ge 5 182 plusmn 00 block
75
section 2 the balance that had to be found in the concrete design was to have a mix as light
as possible (brought about by a high LW aggregate volume) while having strength as high
as possible along with the desired workability (brought about by a high paste volume) An
exception was represented by the blocks where an almost zero workability is required
and thus the lightness and workability were affected in the same way in the mix design
rather than the strength and workability Only in the case of TRPFA the sample did not
reach either target This is in accordance with previous analyses in which those materials
prepared with TR aggregates showed low compressive strengths Low adhesion between
the TR aggregates and the matrix makes it difficult for these aggregates to reach good
strengths especially at high aggregate fractions where non-bonded zones around the
aggregates are likely to connect As a conclusion it can be said that the TR aggregates
cannot be used in the combination of the binders tested for the targeted LW-applications
Thus it can be concluded that only the PU aggregates were suitable for the applications
under consideration Together with the PFA they are applicable for blocks whereas with
PFAGGBS blends they are also applicable for panels
It has been mostly the low workability of the mixtures that has limited their application
Contrary to well established cements steering the workability by adding water was not an
option for the investigated binders Adding sand was an option for the PFA-binders but
not for the PFAGGBS-binders as the density then increases above the target For the
binders in combination with the aggregates no suitable additives could be found that were
commercially available to improve the workability within this project
4 Numerical concrete design for performance prediction
41 Basic principle of the modelling
From the previous sections it has become clear that it requires quite an effort to design
concrete with sustainable aggregatesustainable binder even on only two performance
demands Each additional performance demand and each new material considered will
increase the experimentation scheme considerably Without help of a design tool all
compositional design may therefore be sub-optimal However there is a lack of research
on concrete design methods other than consisting of large testing schemes or optimization
of the aggregate packing [Mueller 2014] To develop an efficient way of designing concrete
mixtures a design tool has been developed The design tool is based on the principle that
the properties of concrete (and other composite materials) are determined by the properties
76
of the constituents their volume fractions in the material and their spatial arrangement
Whereas the properties of the constituents in general can be determined separately and
the volume fractions are known when a concrete mix is designed the spatial arrangement
of the particles is difficult to predict Moreover the dependency on the spatial arrangement
of most properties is different For instance the density of concrete is independent of the
spatial arrangement of coarse aggregates in the mortar (consisting of cement paste and fine
aggregates) In contrast the thermal conductivity depends on the spatial arrangement
In the literature a whole range of different geometrical arrangements can be found to
predict concrete properties that are dependent on the spatial arrangement of its
constituents [Carson 2005] ranging from simple parallel and series ordering of its
constituents without considering the particle structure nor placement (Figure 7) to more
advanced spatial arrangements Although approximate models can be used as a first guess
they generally do not have sufficient predictive capacity for concrete design The
dependence of the concrete properties on the particles arrangement requires more detailed
modelling
Figure 7 Schematized influence of the aggregate volume fraction on the Youngrsquos modulus of
concrete for parallel true and series arrangement of the aggregates
Discrete element method (DEM) is becoming widely accepted as an effective method of
addressing engineering problems in granular materials as proven by Stroeven [1999] and
continued research based on this work (see eg He [2010 2012] Stroeven [2015]) Stroeven
[1999] has shown that all types of concrete compositional defects also can be simulated
with this method such as wall effects around aggregates (giving rise to porous interfaces
77
and thus low strengths) and inefficient packing (giving rise to high porosity and thus also
low strength and durability)
In line with the goals of this research the concrete has been modelled as a two phase
material consisting of mortar and coarse aggregate Hence the mortar has been modelled
as one phase or constituent consisting of the binder(s) small aggregates with a diameter
up to 2 mm water and additives Testing mortars to determine the properties of the
binders for concrete composition design is standard practice standard strengths of cement
for instance are determined on such a mortar From the numerical point of view some
practical issues can be avoided in this way as well Although it is possible to model a large
size range of particles of various shapes discrete element methods are relatively
computationally-intensive with computational times increasing fast with the number of
aggregate size classes included and higher packing densities The validity of this phase
separation also called scale separation has not yet been proven beyond doubt but is
required to restrict computer efforts
Most mortarsconcretes develop their properties over time due to ongoing
hydrationchemical reactions after mixing the binders with water and possibly activator
The properties of the mortar were measured as a function of time which renders possible
predicting time dependent properties of the mortar This method was chosen over
simulation of the time dependent chemical hydration reactions because of the uncertainty
in reaction products in this research (eg Hymostruc [Breugel 1991] CEMHYD3D [Bentz
2005] microic [Bishnoi and Scrivener 2009] XIPKM [Le 2013])
Figure 8 Evolution of particle packing showing segregation phenomena for particles with different
densities ndash lighter (white) particles fall slower than heavier (grey) particles
78
42 Fresh concrete state
Modelling
The open software tool LIGGGHTS [Kloss 2012] used in the present work involves a
random sequential addition (RSA) step in which particles are sequentially placed in
random positions in a container followed by a DEM step to predict the evolution of particle
positions taking into consideration the particle-particle and the particle-fluid interactions
After initial placement of the particles in a container the rearrangement of the particles
needs to be modelled For the current simulation no stirring or shaking has been included
Fluid ndash particle forces included were the buoyancy force and friction (drag force) of fluid
on the particles The buoyancy force depends on the fluid density and the particle size
according to
= ρ π 343
( )buoyancy fluid particleF R g (5)
where ρ fluid is the fluid density particleR is the particle radius and g is the gravity
acceleration The drag force depends on the behaviour of the fresh mortar according to
= πμ6drag dragF C R v (6)
where v is the velocity (of the particle moving through the fluid) R is the particle radius μ
is the fluid viscosity and dragC depends on the constitutive equation of the fluid
The particle-particle interactions were calculated based on the contact geometry [Fennis
2011 He 2010 Kloss and Goniva 2012 Stroeven 1999] and described by Coulombrsquos law of
friction and both normal (contact and damping) and tangential (shear and damping) forces
were considered
The fresh mortar behaves as a Bingham fluid but only in its dormant period After this
period the cement hydrationalkali-activated binder reactions become relevant and the
mortar can no longer be modelled as a Bingham fluid Thus after the dormant period the
drag force is not modelled accurately anymore (Figure 9) For the majority of the mixes
placement of the aggregates will be finished well before the mix stiffens due to hydration
Mixtures which will lsquosolidifyrsquo before settling completely are unlikely to be used in practice
because of their low open time On the other hand if workability is too high it is possible
79
Figure 9 Simulation approaches to study concrete performance
that unwanted phenomena such as segregation or bleeding can occur Such phenomena
can be predicted by DEM and some (virtual) mix modifications can made in order to avoid
these phenomena (eg changing aggregate grading or density changing the viscosity of
the lsquofluidrsquo (the mortar) etc)
Measuring the input material parameters in the model
The fresh mortar is described in the model as a Bingham fluid characterized by the fluid
viscosity μ and yield stress τ0 To validate this choice of the constitutive equation for the
mortar as well as to determine the input parameters for the numerical predictions
viscosity experiments have been performed on the (fluid) mortars An example of the
results is given in Figure 10 Together with the density the fluid phase is fully described
The mechanical interactions between the aggregates are defined by their elasticity
parameters and two interaction coefficients the coefficients of friction and of restitution
taking into account the loss of energy upon collision [Kloss and Goniva 2012 Stroeven
1999] It was concluded from a sensitivity analysis of the modelling that for the materials
under consideration the simulation results were not sensitive to the coefficient of
restitution therefore this coefficient was not measured The coefficient of friction was
measured by a classical Newtonian friction experiment by means of a simple tribometer
while the elasticity parameters were measured by means of Ultrasonic Pulse Velocity both
80
in the P- and S-mode A summary of the required input with respect to the material
properties is given in Table 7
Simulations
The sustainable concrete mix has been simulated as discussed for a two phase-material
consisting of coarse aggregates and a (fluid) mortar The aggregate particles are inert solid
inclusions For the sake of simplicity only spherical particles were considered in the
present study For the LW concrete under consideration optimum packing is not a design
criterium Instead the maximum amount of aggregates that can be accommodated while
still complying the strength demand (Section 3) is of more importance In the simulation
the properties of the concrete are determined for volume fractions of the coarse aggregates
in the range 01 to 038 the latter volume fraction being similar to total aggregate fraction
around 07 when including the sand from the mortar The aggregate particles size
distribution was taken according to Fuller [Neville 2002] with average particle sizes for
the classes 2-4 mm 4-8 mm and 8-16 mm As an example three particle packing
simulations are shown in Figure 11 with coarse aggregate volume fractions of aggregate of
01 03 and 038 Periodic boundaries were used
Figure 10 Results of the viscosity experiments for the reference mortar showing perfect Bingham fit
Table 7 Constituent properties required in the fresh state modelling
Particles properties Fluid properties
Youngrsquos Modulus (GPa) Density (kgm3)
Poissonrsquos ratio (-) Viscosity (Pa s)
Coefficient of friction (-) Yield stress (Pa)
τ
shearstress [Pa]
81
Figure 11 Particle packing with different volume fractions of coarse aggregate (left to right 01 03
and 038 at equilibrium) container of 160 x 160 x 160 mm3 (tenfold the size of the largest particle)
In the example shown in Figure 11 the distribution of the particles at equilibrium can be
seen to have remained well dispersed contrary to the particles shown in Figure 8 which
not only sank to the bottom of the container but also segregated Although the density of
the aggregates in Figure 11 is about 165-fold larger than that of the fluid mortar the
buoyancy force is not sufficient to overcome the critical yield As a consequence the
particles remain well distributed even at these low coarse aggregate volume fractions
where the aggregates settle in the mortar (and not settle at the bottom or drift to the top of
the container)
43 Hardened concrete state
Modelling
The final equilibrium condition of the DEM simulations as shown in the examples in
Figure 11 is assumed to represent the particles in the hardened state because the
placement of the aggregates is finished presumably well before the hardening or
hydration process renders the particles immobile It thus serves as input for the following
simulation phase addressing the performance of the hardened concrete by a 2D FEM
(Finite Element Modelling) approach For this purpose 2D sections of each 3D particle
packing were extracted from the cross section in the middle of the simulation domain The
2D sections resulting from the particle packing of Figure 11 are shown in Figure 12 For
each property boundary conditions were chosen in accordance with their definition in the
constitutive equations This means that the elasticity parameters of the concrete were
calculated by simulating an uniaxial compression test (Figure 13 left) and the Youngrsquos
modulus and Poissonrsquos ratio were calculated according to their definitions by Hookersquos law
[He 2010] In a similar way the thermal conductivity of concrete concretek was calculated
using the Fourier law in unidirectional steady-state heat transfer (Figure 13 right)
82
Figure 12 Particle packings at three different coarse particle volumes of 01 03 and 038 (top row)
and cross-sections of the particle packing at three different locations (rows below)
Measuring the input material parameters
Each concrete parameter to be determined requires its own set of input parameters For the
elasticity parameters of the concrete these are the two elasticity parameters (ie Poissonrsquos
ratio and Youngrsquos modulus) of the two constituents (coarse aggregates and mortar) For
the thermal conductivity of the concrete the thermal conductivity of the constituents is
necessary Thus the elastic properties of the concrete constituents have been measured by
83
Figure 13 Boundary conditions applied for obtaining the Youngrsquos modulus (left) and the thermal
conductivity (right) of concrete
means of UPV for P-waves and S-waves The thermal conductivity of the mortar was
determined according to EN 12664 For the aggregate only an estimate could so far be
obtained by compacting the loose aggregates in the hotplate equipment according to EN
12667 As the mortar is developing its properties over time the elasticity parameters and
the thermal conductivity have been measured at different ages Figure 14 shows the age-
dependency of the Youngrsquos modulus as an example Table 8 shows the required properties
of the constituents of the hardened concrete for the determination of the elasticity and
thermal conductivity
Simulations
A systematic numerical study was conducted in which the Youngrsquos modulus and thermal
conductivity of the aggregate particles and the mortar were varied while the remaining
properties were kept constant As an example results for the Youngrsquos moduli are shown in
Figure 15
Figure 14 Dynamic Youngrsquos modulus for various ages of the reference mortar
84
Table 8 Constituent properties required in the hardened state modelling
Coarse aggregate
properties
Unit Mortar properties
(as function of age)
Unit
Youngrsquos Modulus GPa Youngrsquos Modulus GPa
Poissonrsquos ratio - Poissonrsquos ratio -
Density kgm3 Density in hardened state kgm3
Thermal conductivity WmK Thermal conductivity WmK
Figure 15 Youngrsquos modulus of the concrete Econcrete as a function of the Youngrsquos modulus of the
aggregate Eaggregate for Emortar = 12 GPa (left) and for Emortar = 60 GPa (right) volume fraction of
aggregate = 038
As shown in Figure 15 when the aggregates have no stiffness and can be viewed as
infinitely compressible (ie as lsquoairrsquo) the stiffness of the concrete is reduced as compared to
that of the mortar When the aggregate stiffness is larger than that of the mortar the
stiffness of the concrete is increased If the aggregates become however much stiffer than
the mortar further increase in stiffness has little effect as only the mortar deforms
noticeably At this stage a final stiffness of the concrete is reached (Figure 16)
44 Design demonstration of the sustainable concrete
As a demonstration of its design possibilities the properties of concrete have been
calculated for concrete consisting of a reference mortar with either gravel or polyurethane
foam (PU) as coarse aggregates The results at 25 and 50 coarse aggregate fractions are
shown in Table 9 (the 50 PU is comparable to mix 2_1 although there is much less sand
in mix 2_1)
85
The DEMFEM simulations show that a quick numerical design for the various types of
concrete investigated herein can be realized for elasticity and thermal insulation
properties The design can be extended to other properties that can already be simulated
with related numerical models (eg Le [2014]) Although there is in general a good relation
between viscosity of a mix and the workability (see eg Banfill [2006]) and recently
progress has been made in predicting the workability by a similar DEM-approach
[Mechtcherine 2015] the choice of a good workability reference method and the numerical
validation of these practical test methods are still challenging
Figure 16 Youngrsquos modulus of the concrete (Econcrete) as a function of the Youngrsquos modulus of the
aggregate (Eaggregate) both normalized by the Youngrsquos modulus of the mortar (Emortar) for two
mortars (M1 and M2 characterized by Emortar of 12 GPa and 60 GPa respectively) and for
volume fractions of aggregate (VF) of 01 03 and 038 Mortar curves M1 and M2 are the same
and only depending on the volume fraction of aggregates and mortar
Table 9 Simulated properties of concrete ndash replacing coarse gravel with PU
Density Youngs
Modulus
Poissons ratio Thermal
conductivity
kgm3 GPa - W(mK)
PU 25 1825 181 025 040
PU 50 1326 34 023 012
Gravel 25 2405 444 020 096
Gravel 50 2486 570 015 205
aggregate mortarE E
concrete
mortar
EE
86
5 Conclusions
In this research toward new types of sustainable concrete the fresh concrete mix trial in
which the workability was investigated in relation to the aggregate volume fraction
showed that combing the geopolymeric binders with the new types of aggregates could
lead to compatibility problems such as gas formation extreme heat formation corrosion of
the moulds and flash- and fast set Heat curing in relation with the thermal low
conductive aggregates proved sometimes to be a too large challenge geopolymerisation
occurred too superficially and internally no hardening took place It was concluded that
only the PU aggregates were suitable for the four applications under consideration
(blocks panels floor screed and floor screed underlay) Together with the PFA as binder
the PU aggregates are applicable for blocks whereas with PFAGGBS blends as binder
they are also applicable for panels and floor screed (underlay) applications although in the
latter two cases the workability open time target of 60 minutes could not be guaranteed It
has been mostly the low workability of the mixtures that has limited their application
Contrary to well established cements and aggregates no suitable additives could be found
that were commercially available to improve the workability for the used combination of
waste aggregates and binders
The tested mechanical properties were on average good for all tested mixtures with the
exception of the tyre rubber aggregates Its low compressive strength has been attributed
to the low bonding between the aggregates and the matrix Thermal conductivity was low
as could be expected from the low thermal conductivity values of the aggregates and the
(relative) high volume fractions used
The results show that it is possible to produce a non-structural sustainable concrete with
good mechanical and thermal insulation properties that may contribute to a sustainable
world
The numerical concrete mix design method proves to be a very promising tool in designing
concrete not only for the compressive strength but also for other performance demands
such as elasticity parameters and thermal conductivity Although there is in general a
relation between viscosity of a mix and the workability the sustainable aggregates
combined with the sustainable binders proved to have a low workability which could not
as yet be included in the numerical model
87
Acknowledgement
This research has been executed within the EU-project SUS-CON SUStainable innovative
and energy efficient CONcrete based on the integration of all-waste materials FP72007-
2013 (grant 285463) Their financial support is gratefully acknowledged
Literature
ACI 2111-91 (1991) Standard practice for selecting proportions for normal heavyweight
and mass concrete ACI Manual of concrete Practice Part 1 Materials and general
properties of Concrete 38 pp ACI Detroit Michigan USA
Aliabdo A A Abd Elmoaty A E M Abd Elbaset M M (2015) Utilization of waste
rubber in non-structural applications Construction and Building Materials 91 195ndash207
Al-Sibahy A Edwards R (2012) Thermal behaviour of novel lightweight concrete at
ambient and elevated temperatures Experimental modelling and parametric studies
Construction and Building Materials 31 174ndash187
Attanasio A Largo A Alvarez I L Sonzogni F Balaceanu L (2015) Sustainable
aggregates from secondary materials for innovative lightweight concrete products
HERON Vol 60 (2015) No 12 pp 5ndash26
Banfill P F G (2006) Rheology of fresh cement and concrete Rheology Reviews 2006 pp
61ndash130
Bentz D P (2005) CEMHYD3D a three-dimensional cement hydration and
microstructure development modeling package Version 30 NISTIR 7232 US
Department of Commerce Gaithersburg MD USA
Bernal S A de Gutieacuterrez R M Pedraza A L Provis J L Rodriguez E D Delvasto S
(2011) Effect of binder content on the performance of alkali-activated slag concretes
Cement and Concrete Research 41(1) 1ndash8
Bishnoi S Scrivener K L (2009) microic A new platform for modelling the hydration of
cements Cement and Concrete Research 39(4) 266ndash274
Blackery J Mitsoulis E (1997) Creeping motion of a sphere in tubes filled with a
Bingham plastic material Journal of Non-Newtonian Fluid Mechanics 70 59ndash77
Braacutes A Leal M Faria P (2013) Cement-cork mortars for thermal bridges correction
Comparison with cement-EPS mortars performance Construction and Building Materials
49 315-327
Bravo M de Brito J (2012) Concrete made with used tyre aggregate durability-related
performance Journal of Cleaner Production 25 42ndash50
88
Breugel K van (1991) Simulation of hydration and formation of structure in hardening cement-
based materials PhD thesis Delft University of Technology
Carson J K Lovatt S J Tanner D J Cleland A C (2005) Thermal conductivity bounds
for isotropic porous materials International Journal of Heat and Mass Transfer 48(11)
2150ndash2158
Chabra R Richardson J (2011) Non-Newtonian flow and applied rheology engineering
applications (2nd ed) Butterworth-Heinemann Oxford UK
Choi Y-W Moon D-J Chung J-S Cho S-K (2005) Effects of waste PET bottles
aggregate on the properties of concrete Cement and Concrete Research 35(4) 776ndash781
Collepardi M Collepardi S Troli R (2007) Concrete mix design Grafiche Tintoretto
Castrette di Villorba TV Italy
Collins F G Sanjayan J G (1999) Workability and mechanical properties of alkali
activated slag concrete Cement and Concrete Research 29(3) 455ndash458
Eldin N N and Senouci A B (1993) Rubber-tire particles as concrete aggregate Journal
of Materials in Civil Engineering 5(4) 478ndash496
EuroLigthCon (2007) Grading and Composition of the Aggregate EuroLight report BE96-
3942R7 Sintef Norwegen
Fattuhi N I Clark L A (1996) Cement-based materials containing shredded scrap truck
tyre rubber Construction and Building Materials 10(4) 229ndash236
Fennis S (2011) Design of ecological concrete by particle packing optimization PhD thesis
Delft University of Technology Delft The Netherlands
Fib (2004) Environmental Design Fib bulletin 28 Fib Lausanne Switzerland
Fib (2012) Model Code for Concrete Structures 2010 Fib Lausanne Switzerland
Fib (2015) Benchmarking of deemed-to-satisfy provisions in standards Fib Lausanne
Switzerland
Flatt R J Roussel N Cheeseman C R (2012) Concrete An eco material that needs to be
improved Journal of the European Ceramic Society 32(11) 2787ndash2798
Gijlswijk R N van Pascale S de Vos S E Urbano G (2015) Carbon footprint of
concrete based on secondary materials HERON Vol 60 (2015) No 12 pp 113-142
He H (2010) Computational modelling of particle packing in concrete PhD thesis Delft
University of Technology Delft the Netherlands
He H Stroeven P Stroeven M Sluys L J (2012a) Influence of particle packing on
elastic properties of concrete Magazine of Concrete Research 64 (2) 163-175
89
He H Le NLB Stroeven P (2012b) Particulate structure and microstructure evolution
of concrete investigation by DEM Part 1 Aggregate and binder packing HERON Vol
57 (2012) No 2 pp 112ndash132
Herrero S Mayor P Hernaacutendez-Olivares F (2013) Influence of proportion and particle
size gradation of rubber from end-of-life tires on mechanical thermal and acoustic
properties of plasterndashrubber mortars Materials amp Design 47 633ndash642
Jo B-W Park S-K Kim C-H (2006) Mechanical properties of polyester polymer
concrete using recycled polyethylene terephthalate ACI Structural Journal 103(2) 219-
225
Kloss C Goniva C Hager A Amberger S Pirkers S (2012) Models algorithms and
validation for opensource DEM and CFDndashDEM Progress in Computational Fluid
Dynamics 12 140ndash152
Kosmatka S H Wilson M L (2011) Design and Control of Concrete Mixtures The guide
to applications methods and materials 15th Editions PCA Skokie Illinois USA
Lakshmi R Nagan S (2010) Studies on concrete containing E plastic waste International
Journal of Environmental Sciences 1(3) 270ndash281
Le LBN Stroeven M Sluys LJ Stroeven P (2013) A novel numerical multi-component
model for simulating hydration of cement Comput Mater Sci 7812ndash21
Le LBN Sluys LJ Stroeven M Stroeven P (2014) Implication of pore structure on
micro-mechanical behaviour of virtual cementitious materials Computational Modelling
of Concrete Structures (eds Bicanic et al) Taylor and Francis Group London pp 109-
116
Lee N K Lee H K (2013) Setting and mechanical properties of alkali-activated fly
ashslag concrete manufactured at room temperature Construction and Building
Materials 47 1201ndash1209
Marzouk O Y Dheilly R M Queneudec M (2007) Valorization of post-consumer waste
plastic in cementitious concrete composites Waste Management 27(2) 310ndash318
Mounanga P Gbongbon W Poullain P Turcry P (2008) Proportioning and
characterization of lightweight concrete mixtures made with rigid polyurethane foam
wastes Cement and Concrete Composites 30(9) 806ndash814
Mueller HA Breiner R Moffatt JS Haist M (2014) Design and properties of sustainable
concrete Procedia Engineering 95 290-304
Nath P Sarker P K (2014) Effect of GGBFS on setting workability and early strength
properties of fly ash geopolymer concrete cured in ambient condition Construction and
Building Materials 66 163ndash171
90
Neville AM (2002) Properties of Concrete 4th edition Pearson Prentice Hall Harlow
England
Ordonez-Miranda J Alvarado-Gil J J (2012) Thermal conductivity of nanocomposites
with high volume fractions of particles Composites Science and Technology 72(7) 853ndash
857
Perevozchikov A Yakovlev G Kodolov V (2000) Polyethylene foam waste utilization
for light-weight concrete production International Journal of Polymeric Materials 47(1) 7ndash
17
Petit J Y Wirquin E Vanhove Y Khayat K (2007) Yield stress and viscosity equations
for mortars and self-consolidating concrete Cement and Concrete Research 37(5) 655ndash670
Pezzi L De Luca P A Vuono D Chiappetta F Nastro A (2006) Concrete products
with wastersquos plastic material (bottle glass plate) In Materials Science Forum Vol 514-
516 (no 2) 1753ndash1757
Provis J and van Deventer J (2014) Alkali Activated Materials Springer The Netherlands
Rebeiz K S (1996) Precast use of polymer concrete using unsaturated polyester resin
based on recycled PET waste Construction and Building Materials 10(3) 215ndash220
Sabnis G M (2011) Green Building with Concrete Sustainable Design and Construction CRC
Press Boca Raton USA
Sikalidis C A Zabaniotou A A Famellos S P (2002) Utilisation of municipal solid
wastes for mortar production Resources Conservation and Recycling 36(2) 155ndash167
Stroeven M (1999) Discrete numerical modelling of composite materials-Application to
cementitious materials PhD thesis Delft University of Technology Delft The
Netherlands
Stroeven P Li K Le LBN Stroeven M (2015) Capabilities for property assessment on
different levels of the micro-structure of DEM-simulated cementitious materials
Construction and Building Materials 88 105-117
Sukontasukkul P and Chaikaew C (2006) Properties of concrete pedestrian block mixed
with crumb rubber Construction and Building Materials 20(7) 450ndash457
Vaacuteclaviacutek V Dvorskyacute T Dirner V Daxner J Šťastnyacute M (2012) Polyurethane foam as
aggregate for thermal insulating mortars and lightweight concrete Tehnički vjesnikndash
Technical Gazette 19(3) 665ndash672
Vinai R Panagiotopoulou C Soutsos M Taxiarchou M Zervaki M Valcke S Ligero
V C Couto S Gupta A Pipilikaki P Alvarez I L Coelho D Branquinho J
(2015) Sustainable binders for concrete A structured approach from waste screening to
binder composition development HERON Vol 60 (2015) No 12 pp 27-57
91
Visser JHM Bigaj-van Vliet A J (2014) Designing sustainable concrete on the basis of
equivalence performance assessment criteria for safety Proc 4th Intl FIB congress on
Improving Performance of Concrete Structure Mumbai February 10 ndash 13 2014 India pp
1-11
Wang X Wang K Han J Taylor P (2015) Image analysis applications on assessing
static stability and flowability of self-consolidating concrete Cement and Concrete
Composites 62 156ndash167
Annex Mix compositions
Mix
ID
Binder
(kgm3 concrete)
Activators
(kgm3 concrete)
Aggregate
(kgm3 concrete)
Water
(kgm3 concrete)
2_1 PFA 459 WG 92
NaOH 53
PU foam 4-8 mm 139
normsand 0-2 mm 477
116
2_2 PFA558 WG 112
NaOH 65
PU foam 165 70
2_3 PFA 589 WG 118
NaOH 68 kg
Tyre rubber 0-06 mm 49
tyre rubber 2-4 mm 315
normsand 0-2 mm 331
135
2_4 PFA 648 kg WG 130
NaOH 75
Remix HD 1-4 mm 255
normsand 0-2 mm 358
130
3_1 PFA367
GGBS 122 kg
WG 98
NaOH 38
PU 0-4 mm 52
PU 4-8 mm 97
148
3_2 PFA 481
GGBS 85 g
WG 113
NaOH 66
PU 0-4 mm 74
PU 4-8 mm 74
166
3_3 PFA 76
GGBS 433
WG 112
NaOH 43
PU 0-4 mm 52
PU 4-8 mm 97
149
3_4 PFA 350
GGBS 350
WG 140
NaOH 81
Remix HD 1-4 mm 259
Remix LD 8-125 mm 53
171
) WG waterglass NaOH sodium hydroxide (50)
92
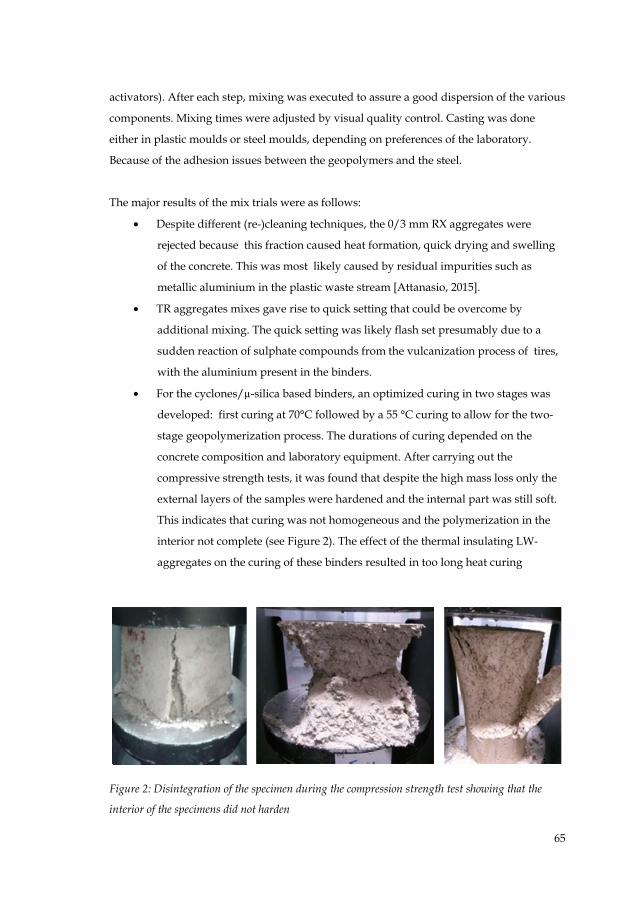
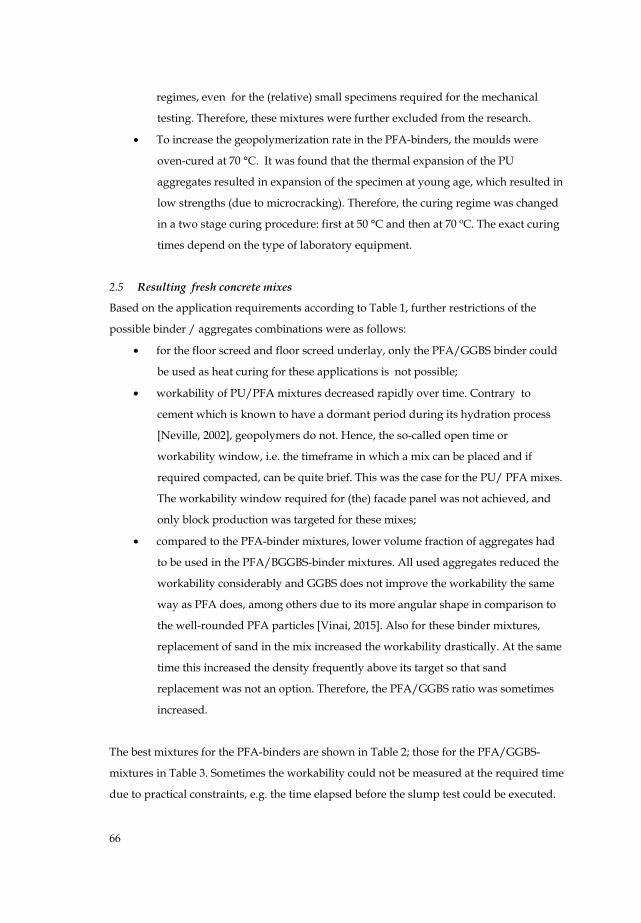
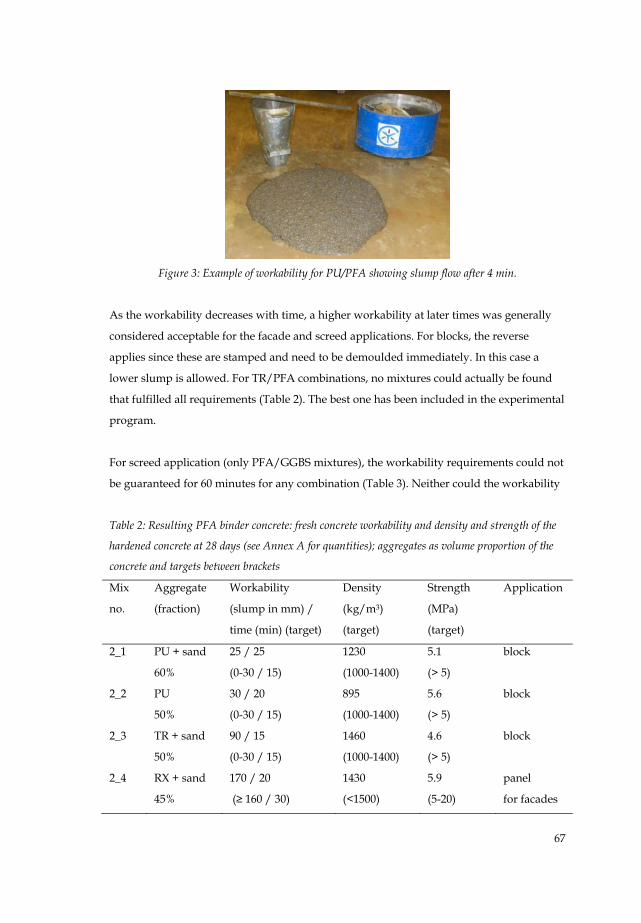
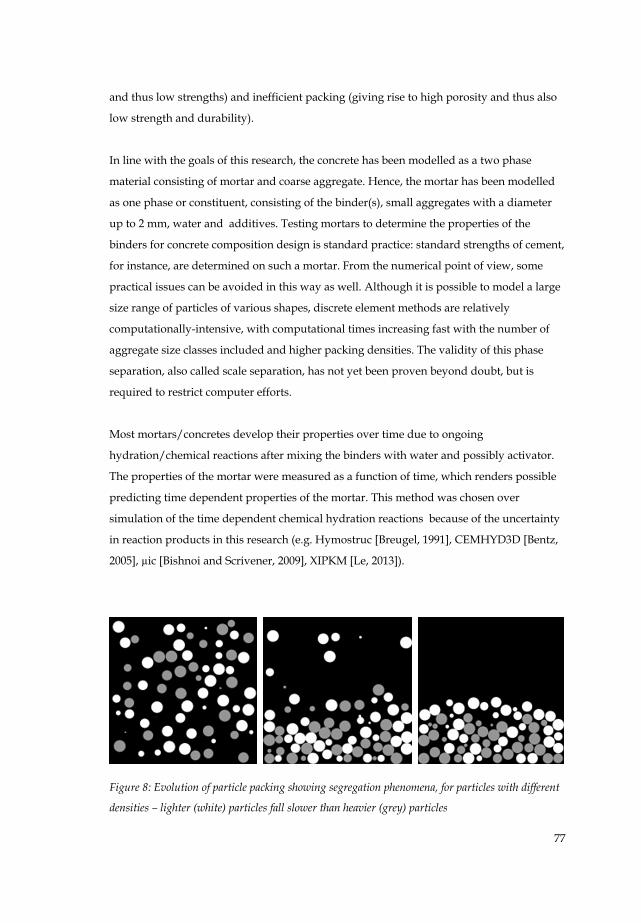
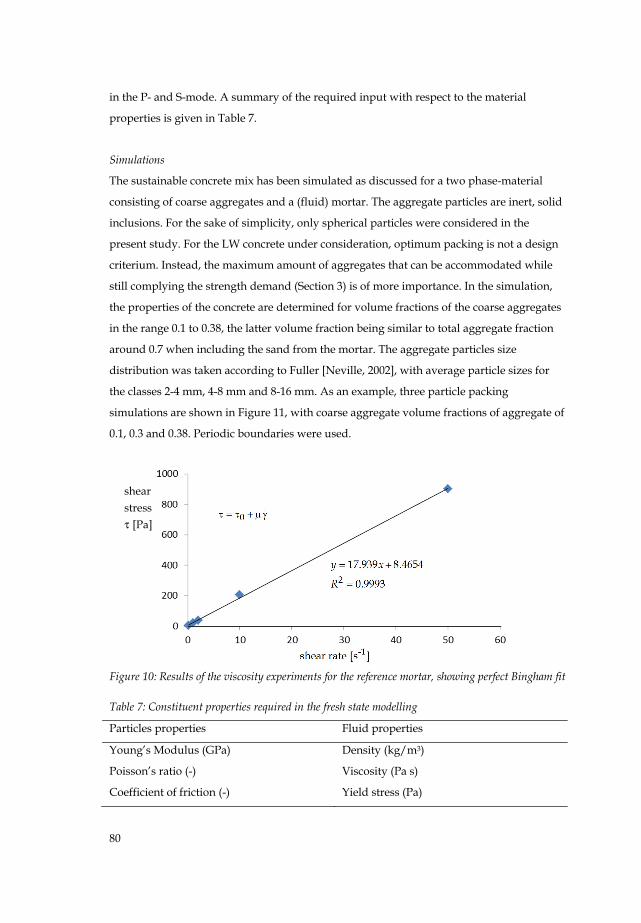
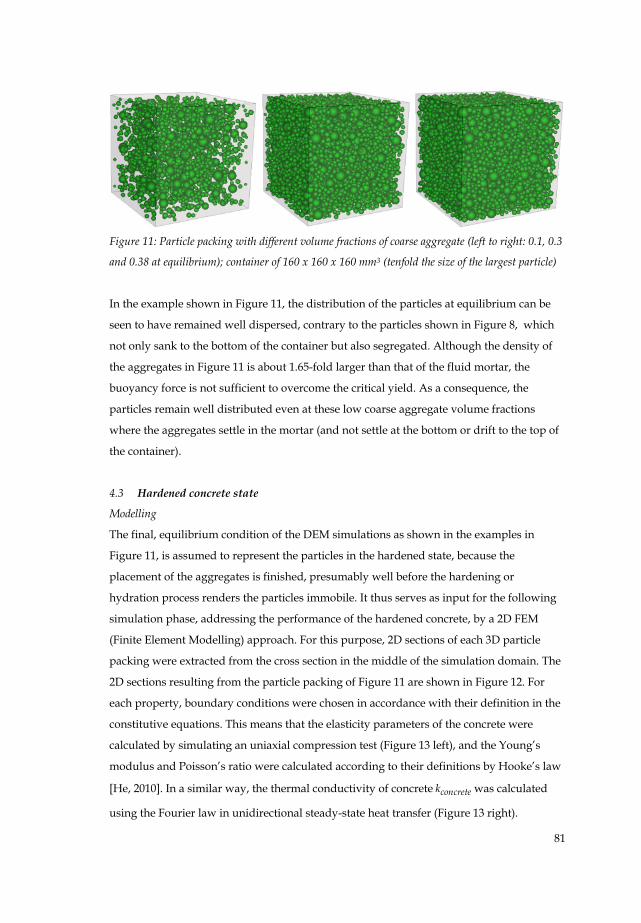
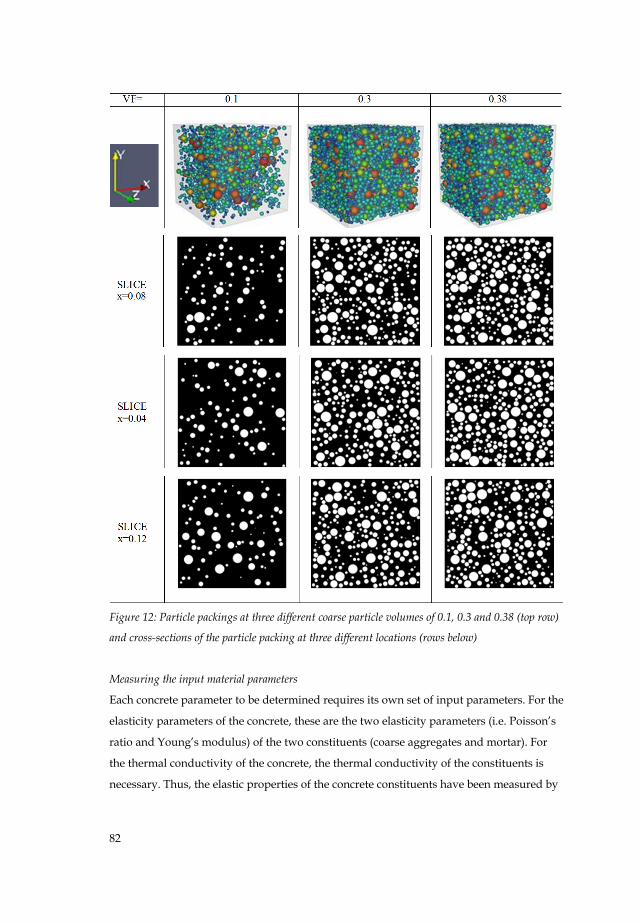
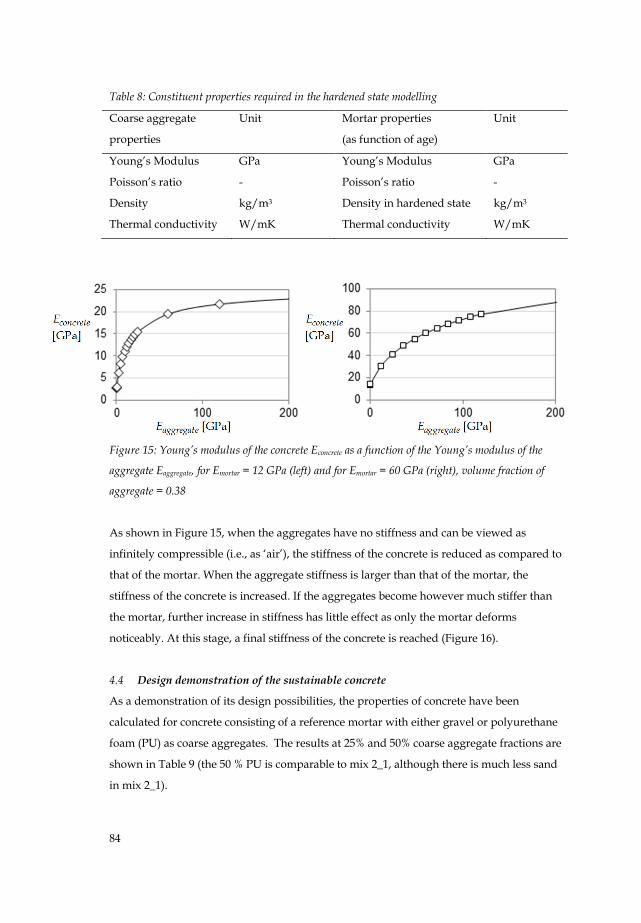

92