sustainable building fundamentals class 2014
TRANSCRIPT

GENUINE | PROGRESSIVE | ADVOCATES
IEQ: INTERIOR ENVIRONMENTAL QUALITY
CET 160; Fall 2014Sustainable Building FundamentalsGuest Speaker: Marcel Harmon, PhD, PE, LEED‐AP O+M
Interior Environmental Quality Impacts• Why IEQ is Important• Personal Environmental Control• Temperature / RH / Thermal Comfort• Indoor Air Quality (IAQ)• Acoustics• Lighting / Views
TOPICS COVERED
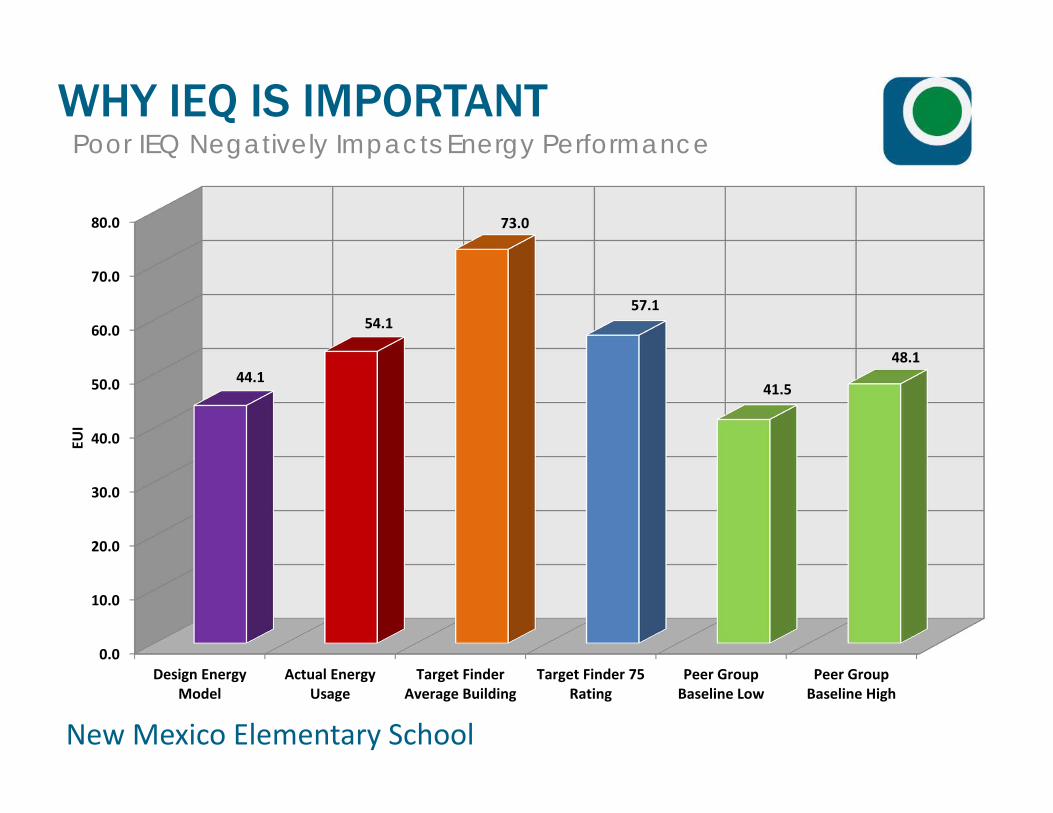
New Mexico Elementary School
WHY IEQ IS IMPORTANTPoor IEQ Negatively Impacts Energy Performance
0.0
10.0
20.0
30.0
40.0
50.0
60.0
70.0
80.0
Design EnergyModel
Actual EnergyUsage
Target FinderAverage Building
Target Finder 75Rating
Peer GroupBaseline Low
Peer GroupBaseline High
44.1
54.1
73.0
57.1
41.5
48.1
EUI

WHY IEQ IS IMPORTANTIEQ Impacts Productivity/Performance and Health
• A study of Chicago and Washington, DC schools found that better school facilities can add 3 to 4 percentage points to a school’s standardized test scores, even after controlling for demographic factors.
Schneider, Mark. “Public School Facilities and Teaching: Washington, DC and Chicago,” November 2002. A Report Prepared for the Neighborhood Capital Budget Group (NCBG). Available at: http://www.ncbg.org/press/press111302.htm.
Kats, G. 2006 Greening America’s Schools: Costs and Benefits. Capital E. www.cap‐e.com.
• Based on actual improvements in design in green schools and based on a very substantial data set on productivity and test performance of healthier, more comfortable study and learning environments, a 3‐5% improvement in learning ability and test scores in green schools appears reasonable and conservative.
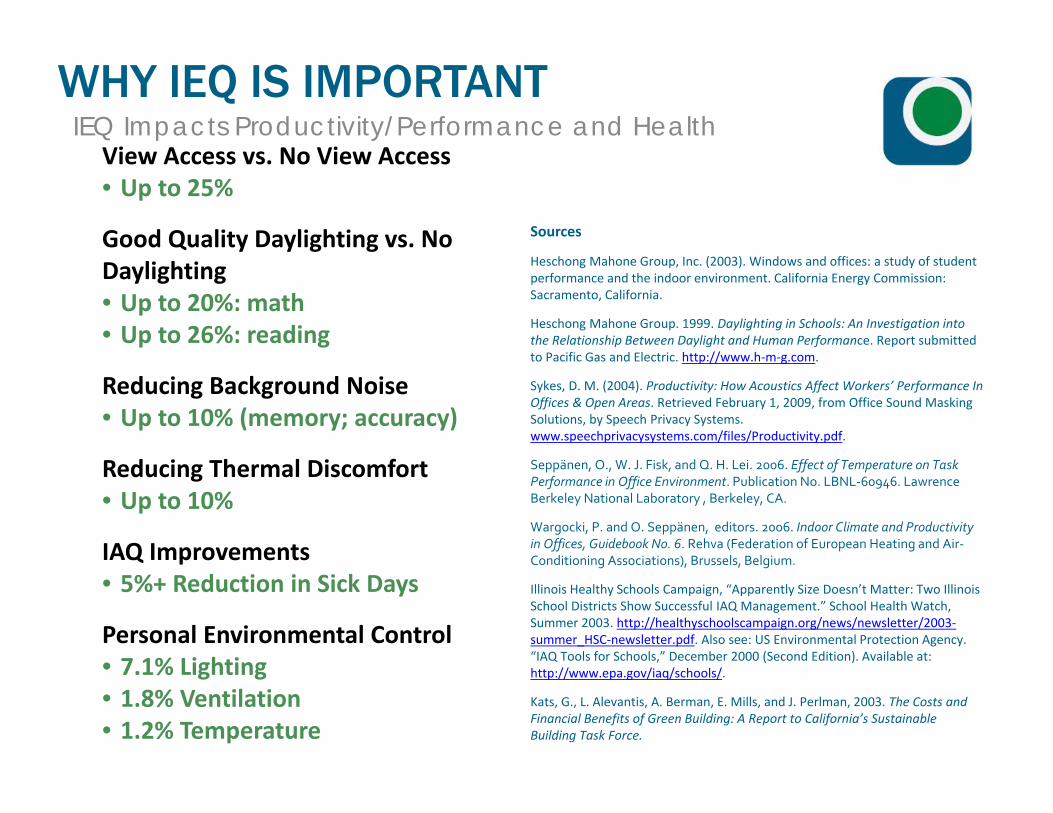
View Access vs. No View Access• Up to 25%
Good Quality Daylighting vs. No Daylighting• Up to 20%: math• Up to 26%: reading
Reducing Background Noise• Up to 10% (memory; accuracy)
Reducing Thermal Discomfort• Up to 10%
IAQ Improvements• 5%+ Reduction in Sick Days
Personal Environmental Control• 7.1% Lighting• 1.8% Ventilation• 1.2% Temperature
WHY IEQ IS IMPORTANT
Sources
Heschong Mahone Group, Inc. (2003). Windows and offices: a study of student performance and the indoor environment. California Energy Commission: Sacramento, California.
Heschong Mahone Group. 1999. Daylighting in Schools: An Investigation into the Relationship Between Daylight and Human Performance. Report submitted to Pacific Gas and Electric. http://www.h‐m‐g.com.
Sykes, D. M. (2004). Productivity: How Acoustics Affect Workers’ Performance In Offices & Open Areas. Retrieved February 1, 2009, from Office Sound Masking Solutions, by Speech Privacy Systems. www.speechprivacysystems.com/files/Productivity.pdf.
Seppänen, O., W. J. Fisk, and Q. H. Lei. 2006. Effect of Temperature on Task Performance in Office Environment. Publication No. LBNL‐60946. Lawrence Berkeley National Laboratory , Berkeley, CA.
Wargocki, P. and O. Seppänen, editors. 2006. Indoor Climate and Productivity in Offices, Guidebook No. 6. Rehva (Federation of European Heating and Air‐Conditioning Associations), Brussels, Belgium.
Illinois Healthy Schools Campaign, “Apparently Size Doesn’t Matter: Two Illinois School Districts Show Successful IAQ Management.” School Health Watch, Summer 2003. http://healthyschoolscampaign.org/news/newsletter/2003‐summer_HSC‐newsletter.pdf. Also see: US Environmental Protection Agency. “IAQ Tools for Schools,” December 2000 (Second Edition). Available at: http://www.epa.gov/iaq/schools/.
Kats, G., L. Alevantis, A. Berman, E. Mills, and J. Perlman, 2003. The Costs and Financial Benefits of Green Building: A Report to California’s Sustainable Building Task Force.
IEQ Impacts Productivity/Performance and Health

Modern Global Village90%+ of our time spent indoors
100 yrs ago: HVAC, Lighting, Materials, etc.
400 generations ago:Agriculture & Urbanism
Hunter/Gatherer Ancestors
Image Source: humanpast.net
WHY IEQ IS IMPORTANT
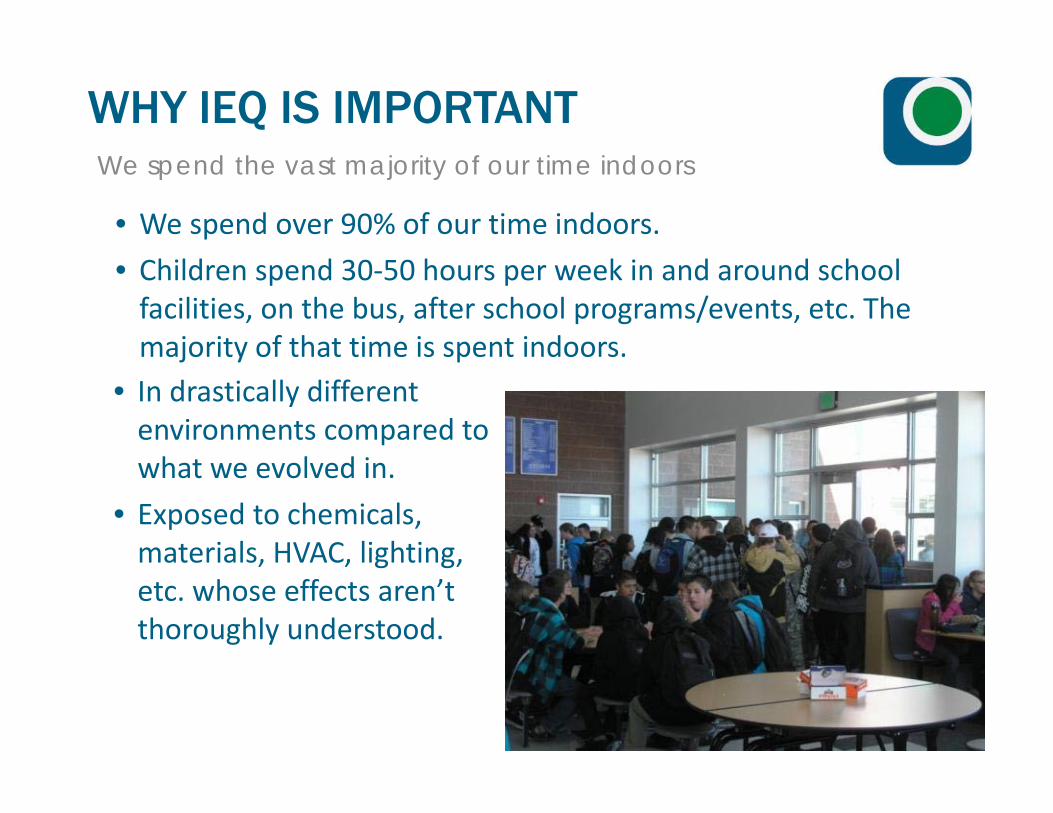
WHY IEQ IS IMPORTANTWe spend the vast majority of our time indoors
• We spend over 90% of our time indoors.
• Children spend 30‐50 hours per week in and around school facilities, on the bus, after school programs/events, etc. The majority of that time is spent indoors.
• In drastically different environments compared to what we evolved in.
• Exposed to chemicals, materials, HVAC, lighting, etc. whose effects aren’t thoroughly understood.
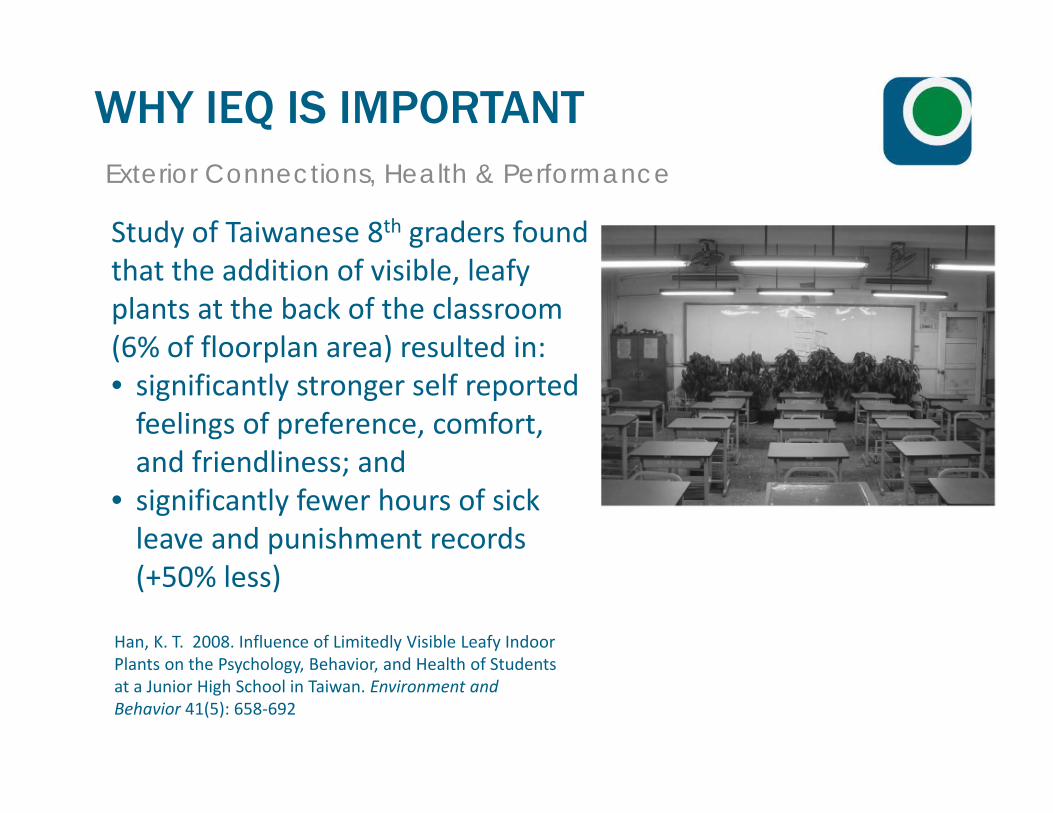
Exterior Connections, Health & Performance
Study of Taiwanese 8th graders found that the addition of visible, leafy plants at the back of the classroom (6% of floorplan area) resulted in:• significantly stronger self reported feelings of preference, comfort, and friendliness; and
• significantly fewer hours of sick leave and punishment records (+50% less)
Han, K. T. 2008. Influence of Limitedly Visible Leafy Indoor Plants on the Psychology, Behavior, and Health of Students at a Junior High School in Taiwan. Environment and Behavior 41(5): 658‐692
WHY IEQ IS IMPORTANT
WHY IEQ IS IMPORTANT
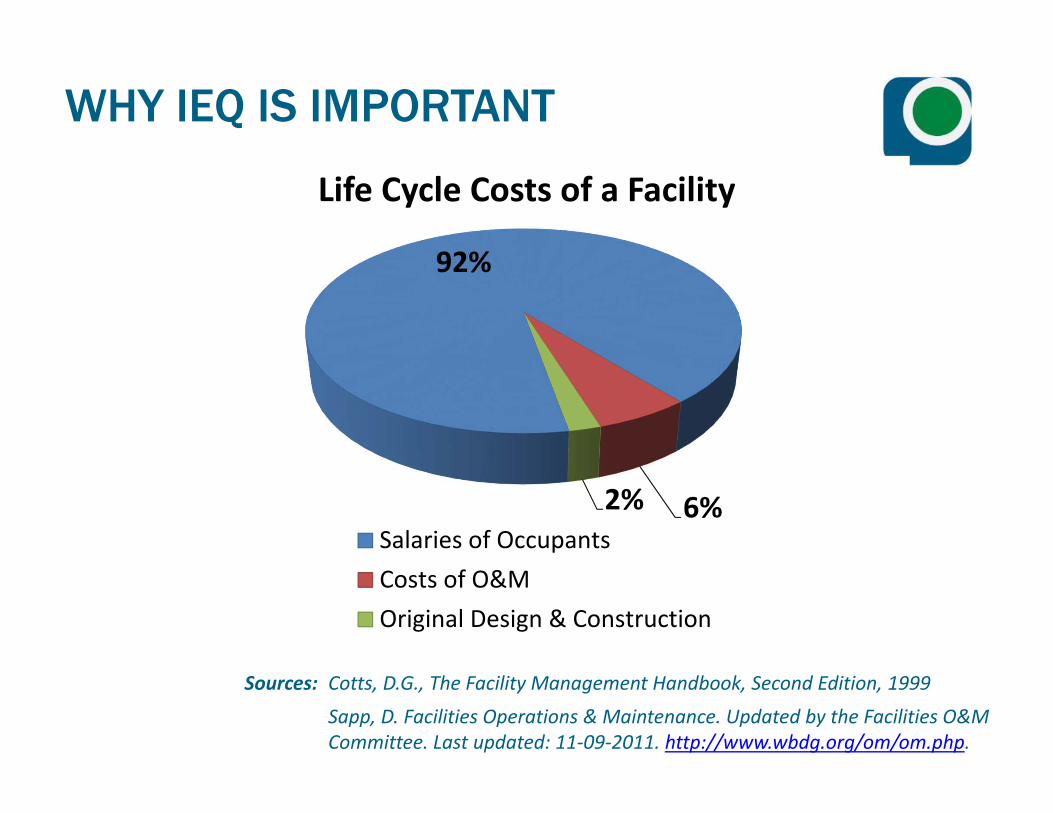
Sources: Cotts, D.G., The Facility Management Handbook, Second Edition, 1999
Sapp, D. Facilities Operations & Maintenance. Updated by the Facilities O&M Committee. Last updated: 11‐09‐2011. http://www.wbdg.org/om/om.php.
92%
6%2%
Life Cycle Costs of a Facility
Salaries of Occupants
Costs of O&M
Original Design & Construction
WHY IEQ IS IMPORTANT
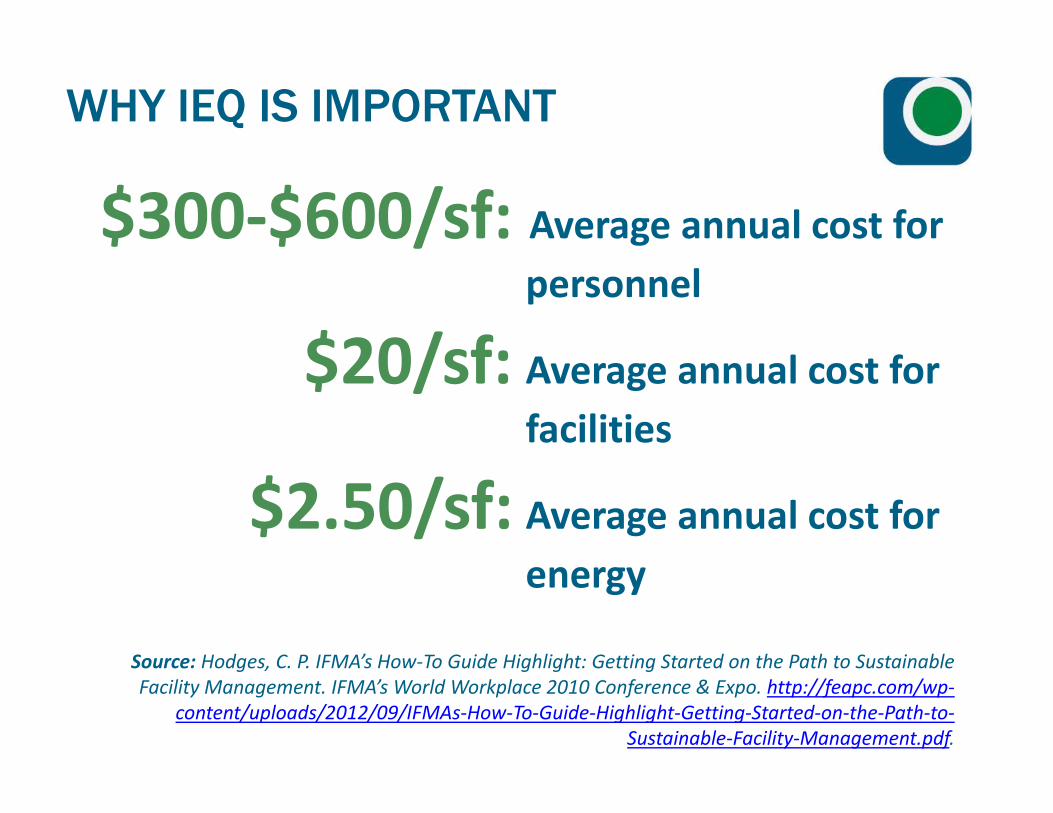
$300‐$600/sf: Average annual cost for personnel
$20/sf: Average annual cost for facilities
$2.50/sf: Average annual cost for energy
Source: Hodges, C. P. IFMA’s How‐To Guide Highlight: Getting Started on the Path to Sustainable Facility Management. IFMA’s World Workplace 2010 Conference & Expo. http://feapc.com/wp‐
content/uploads/2012/09/IFMAs‐How‐To‐Guide‐Highlight‐Getting‐Started‐on‐the‐Path‐to‐Sustainable‐Facility‐Management.pdf.
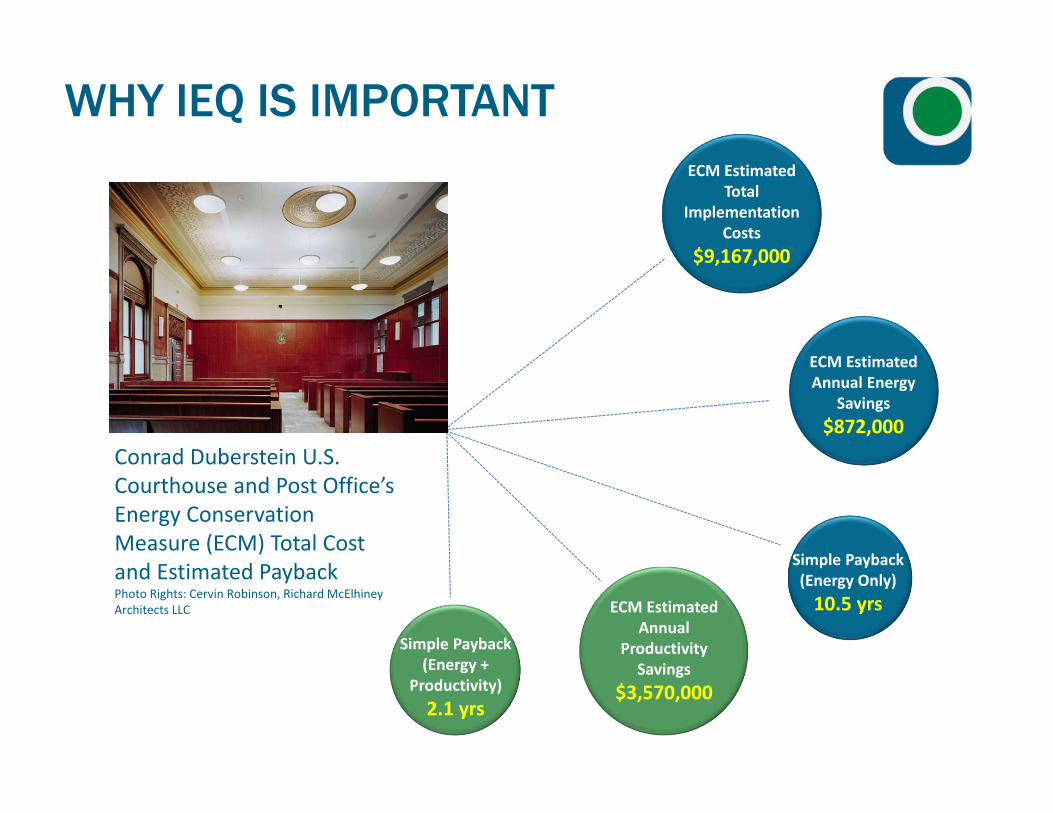
WHY IEQ IS IMPORTANTECM Estimated
Total Implementation
Costs$9,167,000
ECM Estimated Annual Energy
Savings$872,000
ECM Estimated Annual
Productivity Savings
$3,570,000
Simple Payback (Energy Only)10.5 yrs
Simple Payback (Energy +
Productivity)2.1 yrs
Conrad Duberstein U.S. Courthouse and Post Office’s Energy Conservation Measure (ECM) Total Cost and Estimated PaybackPhoto Rights: Cervin Robinson, Richard McElhineyArchitects LLC
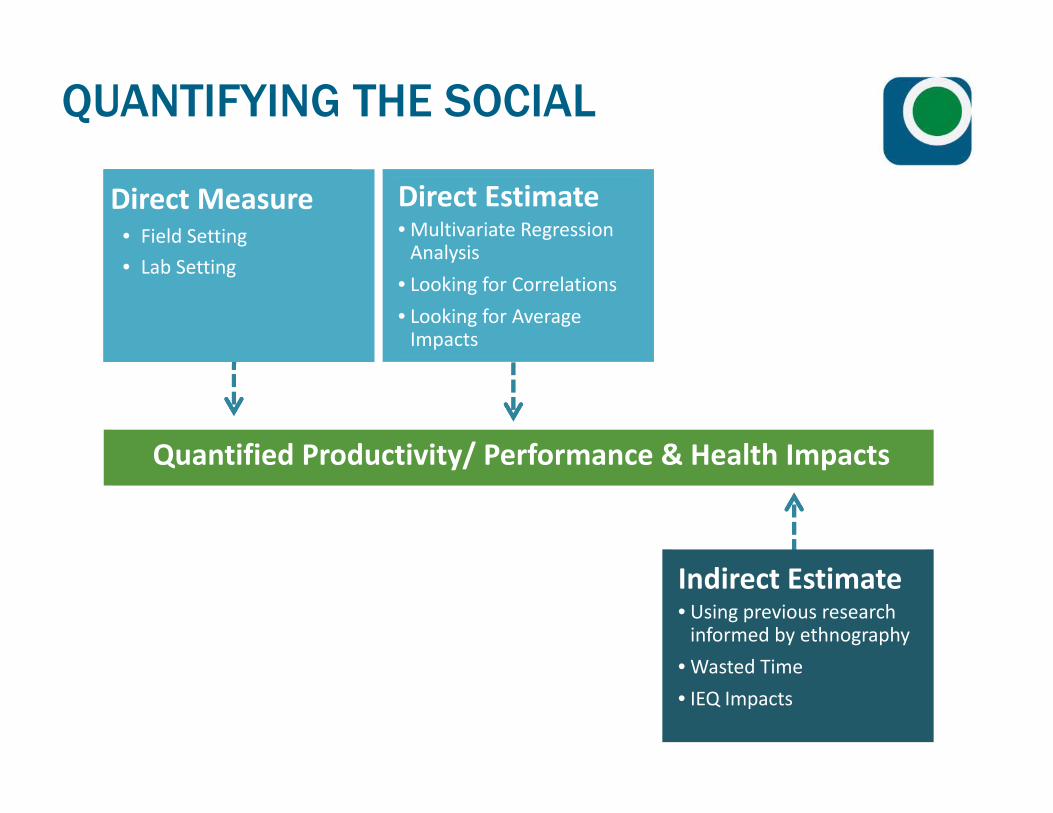
Direct Estimate• Multivariate Regression Analysis
• Looking for Correlations• Looking for Average Impacts
Indirect Estimate• Using previous research informed by ethnography
• Wasted Time
• IEQ Impacts
Direct Measure• Field Setting
• Lab Setting
Quantified Productivity/ Performance & Health Impacts
QUANTIFYING THE SOCIAL

PERSONAL CONTROL
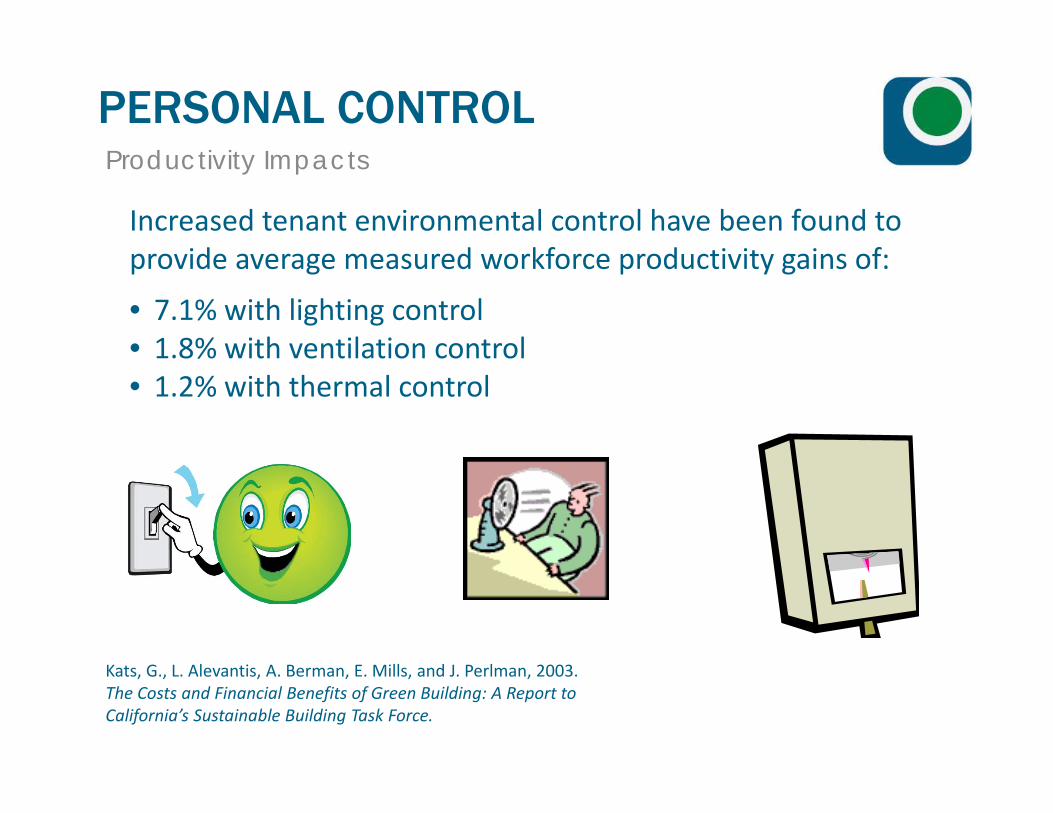
PERSONAL CONTROL
Increased tenant environmental control have been found to provide average measured workforce productivity gains of:
• 7.1% with lighting control • 1.8% with ventilation control• 1.2% with thermal control
Kats, G., L. Alevantis, A. Berman, E. Mills, and J. Perlman, 2003. The Costs and Financial Benefits of Green Building: A Report to California’s Sustainable Building Task Force.
Productivity Impacts
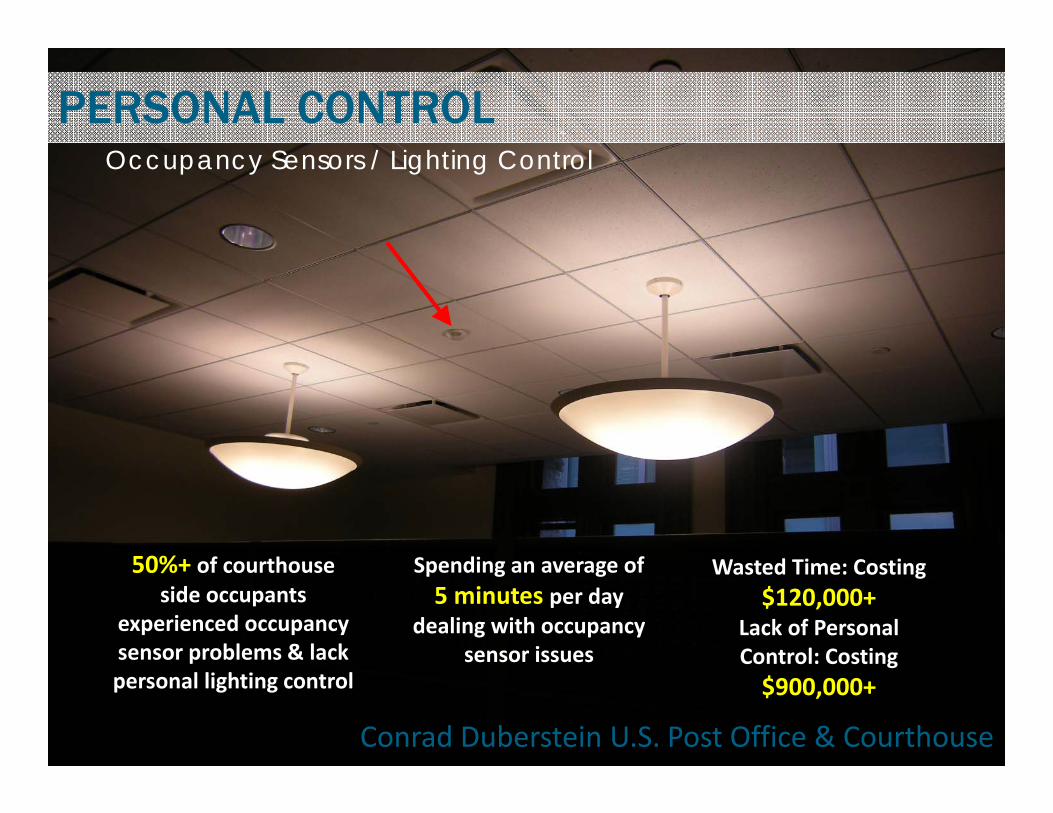
Conrad Duberstein U.S. Post Office & Courthouse
50%+ of courthouse side occupants
experienced occupancy sensor problems & lack personal lighting control
Spending an average of 5 minutes per day
dealing with occupancy sensor issues
Wasted Time: Costing $120,000+
Lack of Personal Control: Costing $900,000+
PERSONAL CONTROLOccupancy Sensors / Lighting Control
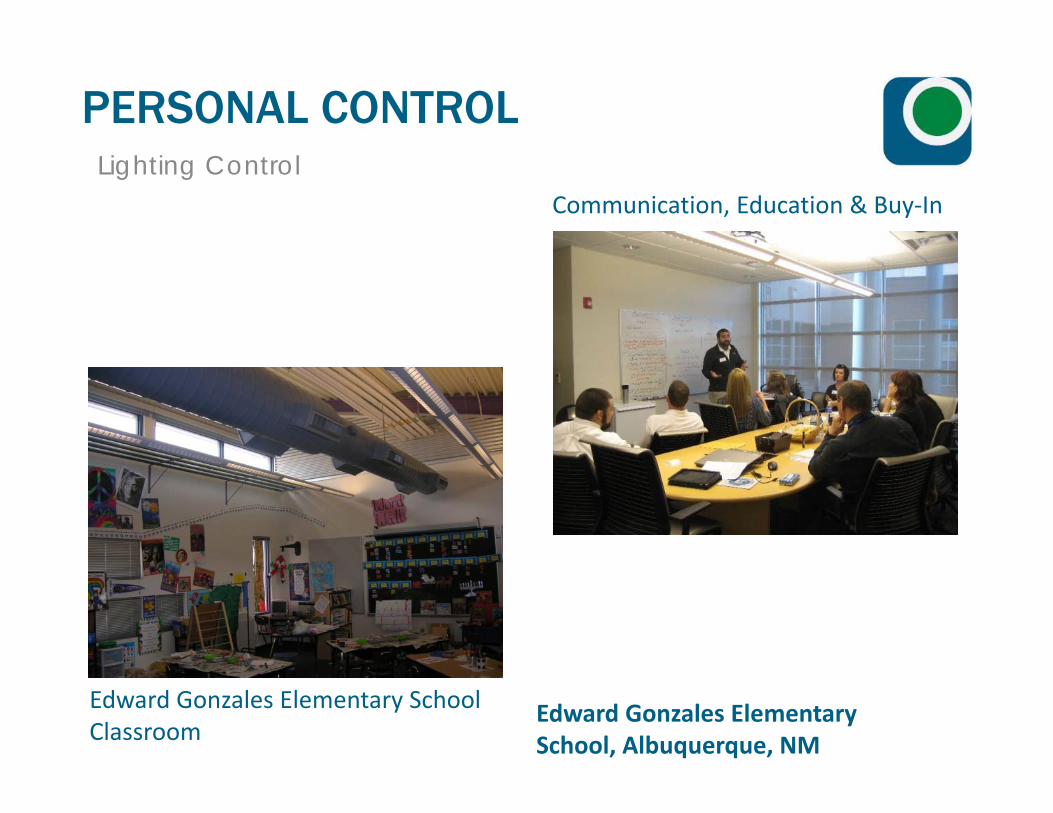
PERSONAL CONTROLLighting Control
Edward Gonzales Elementary School Classroom
Communication, Education & Buy‐In
Edward Gonzales Elementary School, Albuquerque, NM
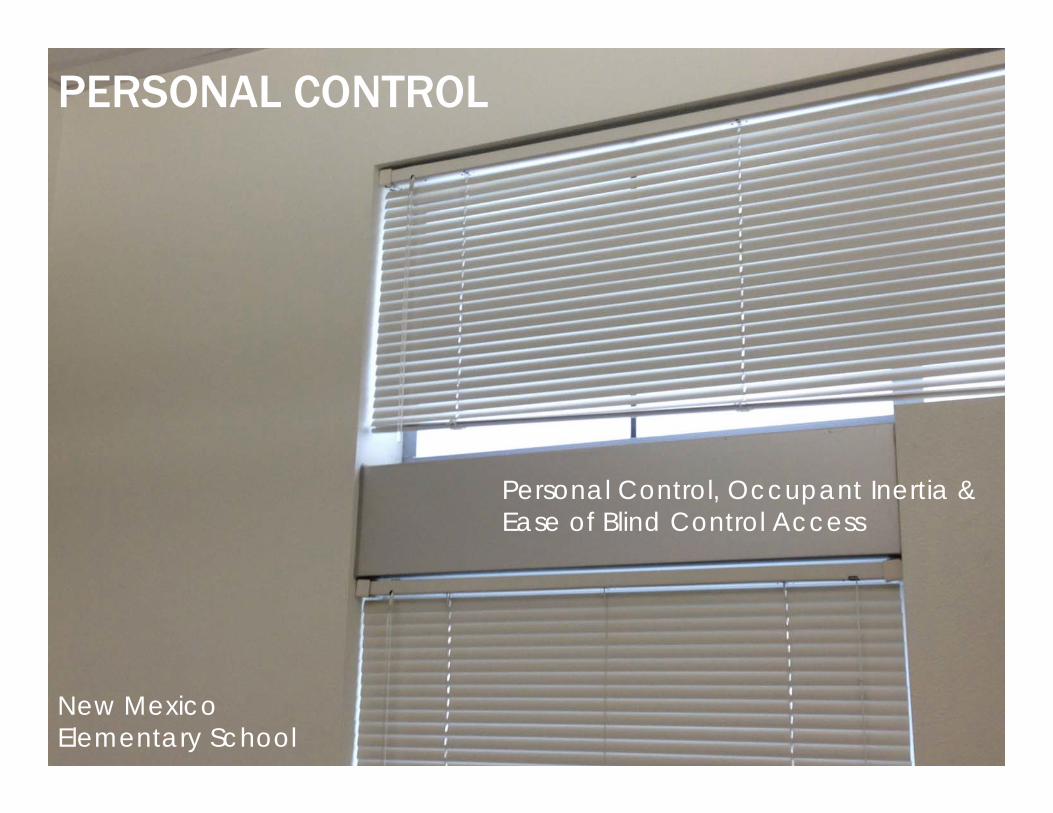
New Mexico Elementary School
Personal Control, Occupant Inertia & Ease of Blind Control Access
PERSONAL CONTROL
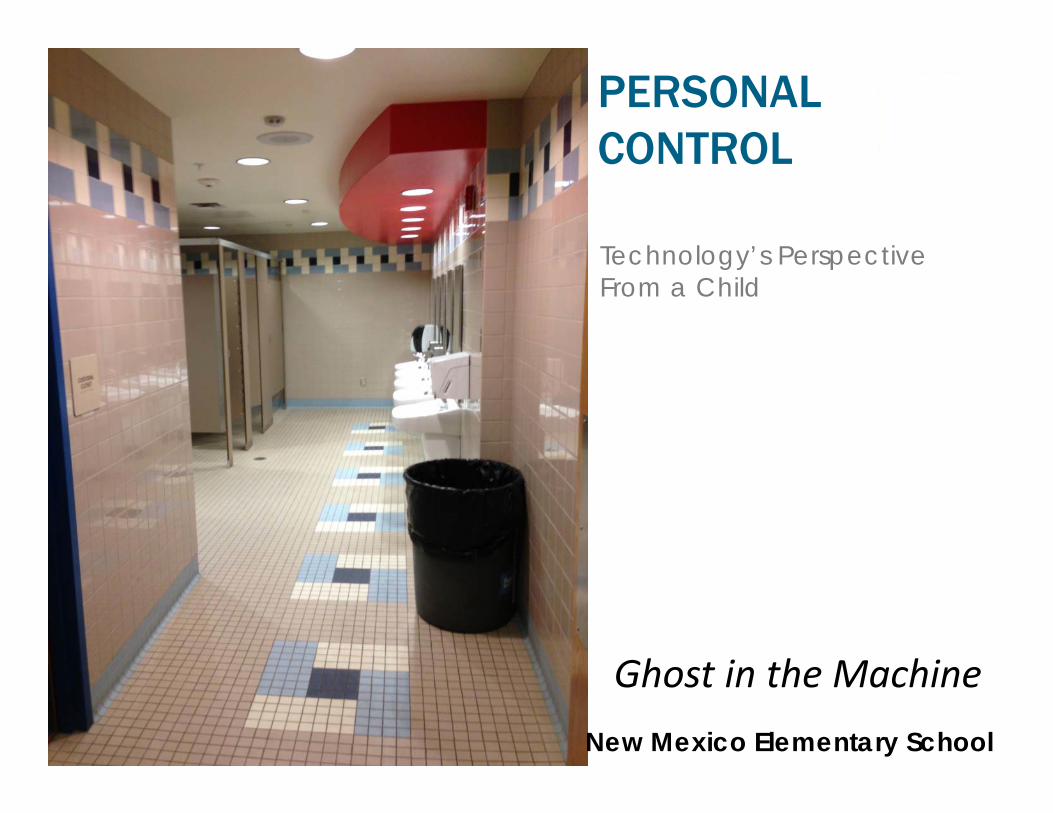
New Mexico Elementary School
Ghost in the Machine
Technology’s Perspective From a Child
PERSONAL CONTROL
PERSONAL CONTROLTemperature Control & Thermal Comfort
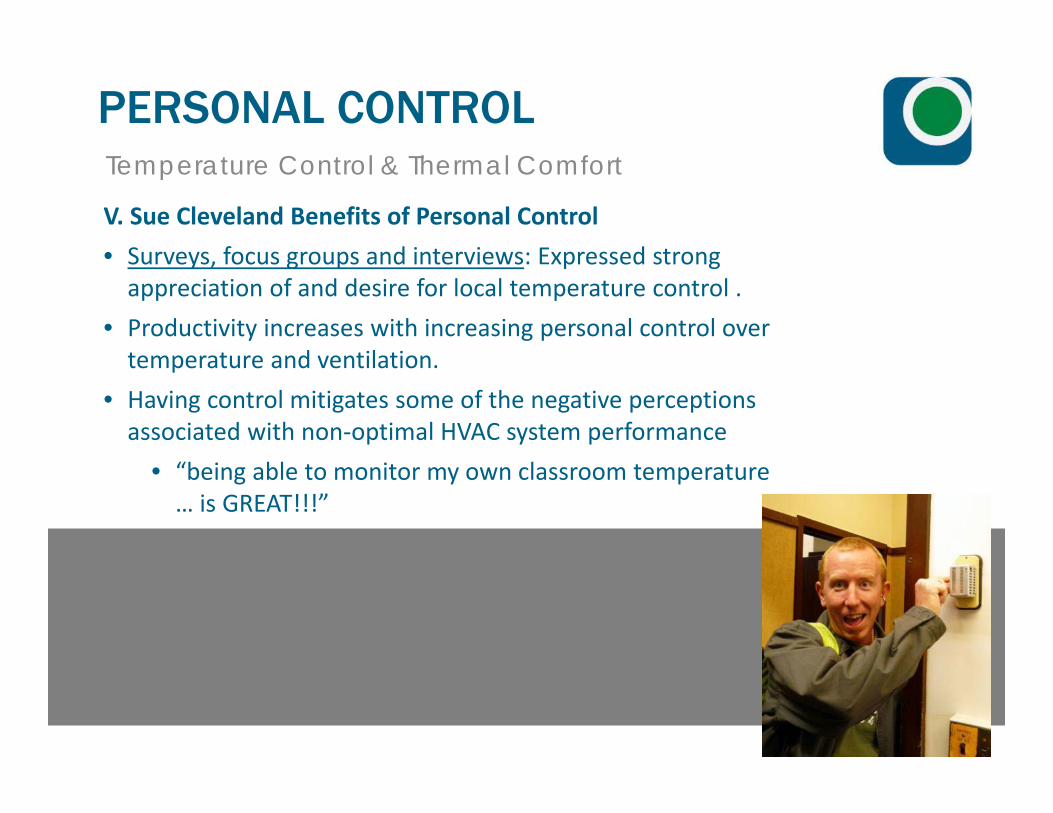
V. Sue Cleveland Benefits of Personal Control
• Surveys, focus groups and interviews: Expressed strong appreciation of and desire for local temperature control .
• Productivity increases with increasing personal control over temperature and ventilation.
• Having control mitigates some of the negative perceptions associated with non‐optimal HVAC system performance
• “being able to monitor my own classroom temperature … is GREAT!!!”
PERSONAL CONTROLTemperature Control & Thermal Comfort
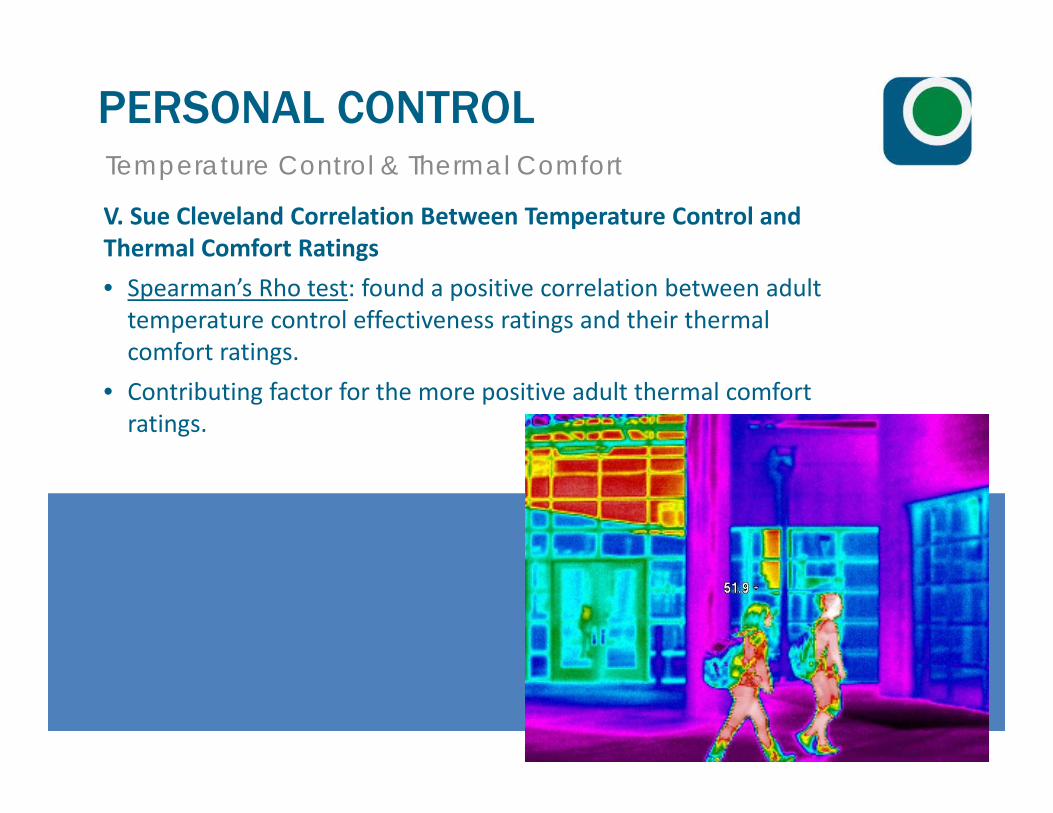
V. Sue Cleveland Correlation Between Temperature Control and Thermal Comfort Ratings
• Spearman’s Rho test: found a positive correlation between adult temperature control effectiveness ratings and their thermal comfort ratings.
• Contributing factor for the more positive adult thermal comfort ratings.

TEMPERATURE/THERMAL COMFORT
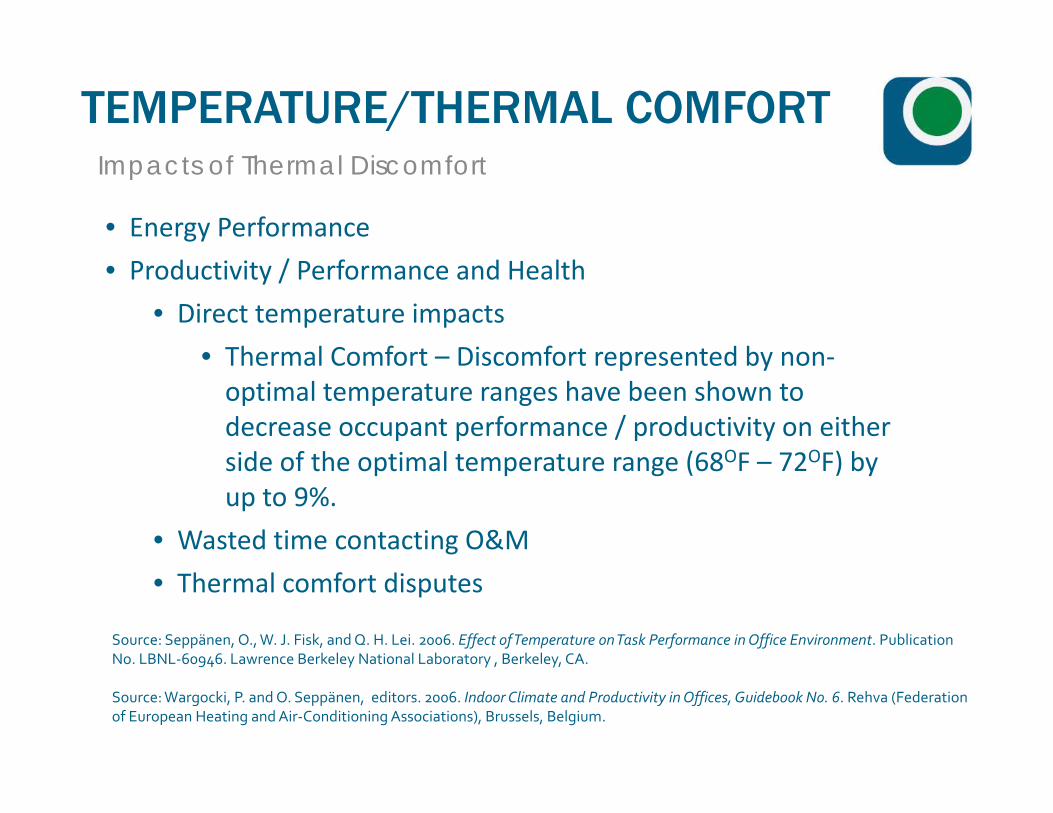
TEMPERATURE/THERMAL COMFORTImpacts of Thermal Discomfort
• Energy Performance
• Productivity / Performance and Health
• Direct temperature impacts
• Thermal Comfort – Discomfort represented by non‐optimal temperature ranges have been shown to decrease occupant performance / productivity on either side of the optimal temperature range (68OF – 72OF) by up to 9%.
• Wasted time contacting O&M
• Thermal comfort disputes
Source: Seppänen, O., W. J. Fisk, and Q. H. Lei. 2006. Effect of Temperature on Task Performance in Office Environment. Publication No. LBNL‐60946. Lawrence Berkeley National Laboratory , Berkeley, CA.
Source: Wargocki, P. and O. Seppänen, editors. 2006. Indoor Climate and Productivity in Offices, Guidebook No. 6. Rehva (Federation of European Heating and Air‐Conditioning Associations), Brussels, Belgium.
0%
10%
20%
30%
40%
50%
60%
70%
80%
90%
100%
Percen
tage
of Re
spon
ses
Building Floor/Area
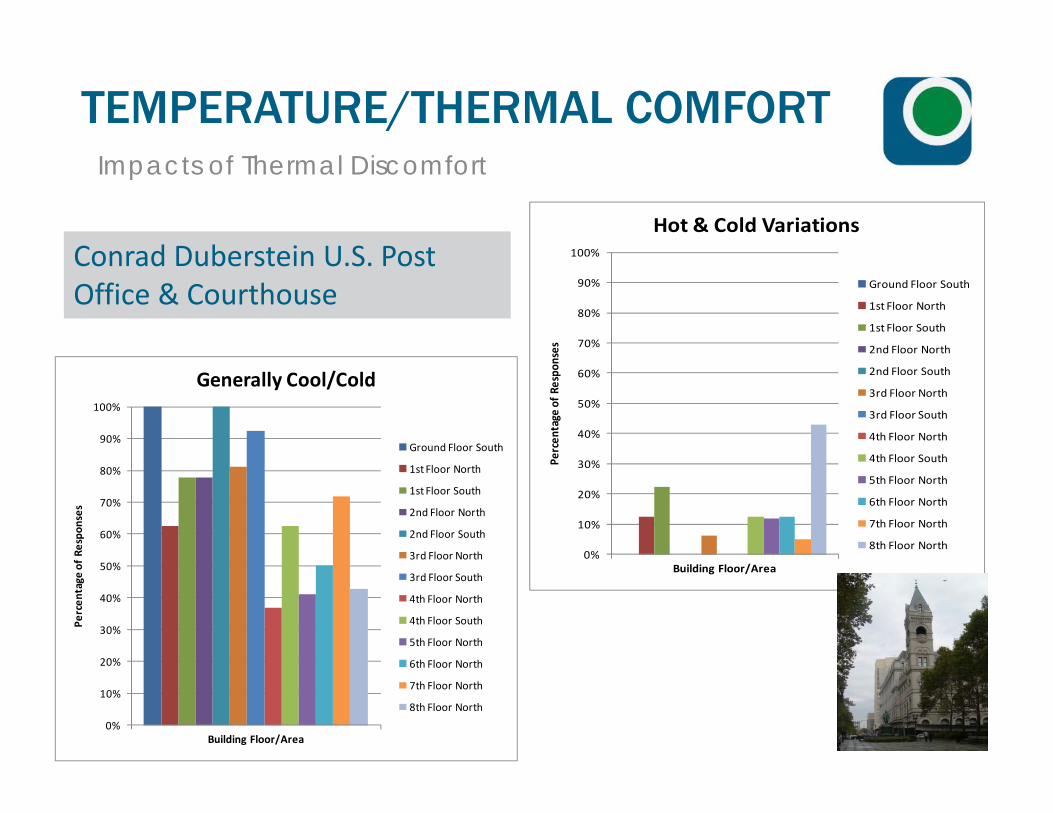
Hot & Cold Variations
Ground Floor South
1st Floor North
1st Floor South
2nd Floor North
2nd Floor South
3rd Floor North
3rd Floor South
4th Floor North
4th Floor South
5th Floor North
6th Floor North
7th Floor North
8th Floor North
0%
10%
20%
30%
40%
50%
60%
70%
80%
90%
100%
Percen
tage
of Re
spon
ses
Building Floor/Area
Generally Cool/Cold
Ground Floor South
1st Floor North
1st Floor South
2nd Floor North
2nd Floor South
3rd Floor North
3rd Floor South
4th Floor North
4th Floor South
5th Floor North
6th Floor North
7th Floor North
8th Floor North
Conrad Duberstein U.S. Post Office & Courthouse
TEMPERATURE/THERMAL COMFORTImpacts of Thermal Discomfort
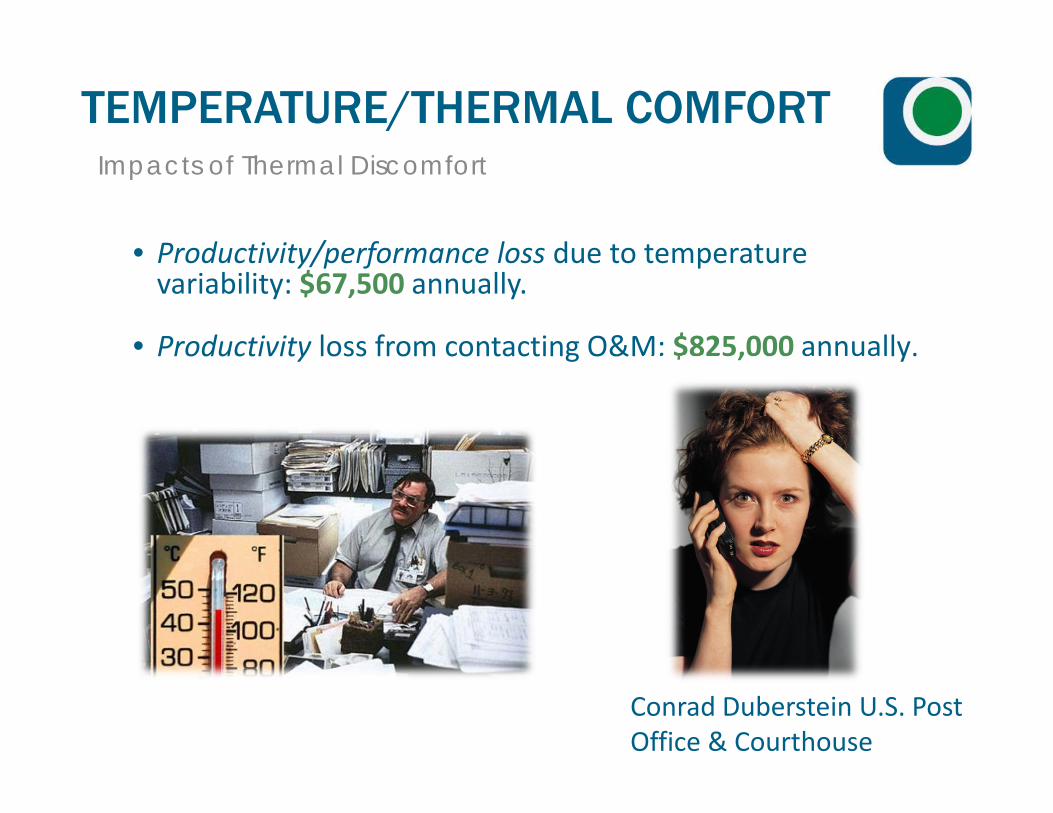
• Productivity/performance loss due to temperature variability: $67,500 annually.
• Productivity loss from contacting O&M: $825,000 annually.
Conrad Duberstein U.S. Post Office & Courthouse
TEMPERATURE/THERMAL COMFORTImpacts of Thermal Discomfort
• Thermal comfort conflicts: Estimated to equate to an annual loss of $69,000 in productivity.
Conrad Duberstein U.S. Post Office & Courthouse
TEMPERATURE/THERMAL COMFORTImpacts of Thermal Discomfort
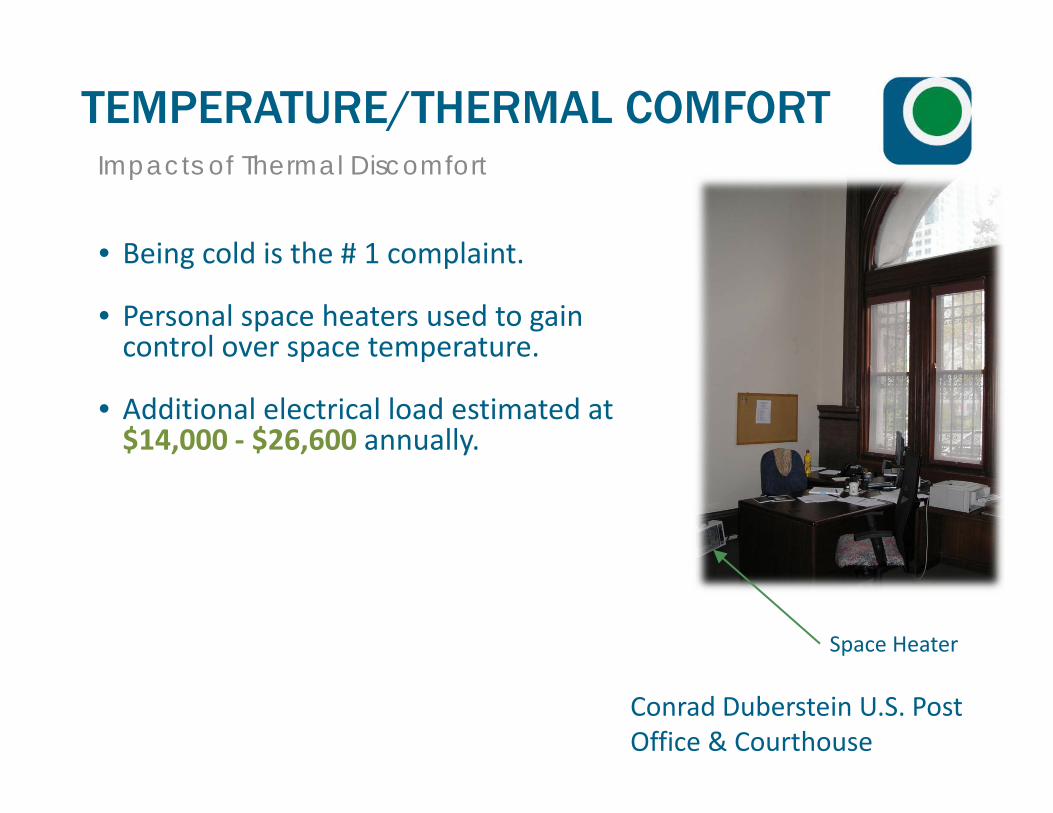
• Being cold is the # 1 complaint.
• Personal space heaters used to gain control over space temperature.
• Additional electrical load estimated at $14,000 ‐ $26,600 annually.
Space Heater
Conrad Duberstein U.S. Post Office & Courthouse
TEMPERATURE/THERMAL COMFORTImpacts of Thermal Discomfort
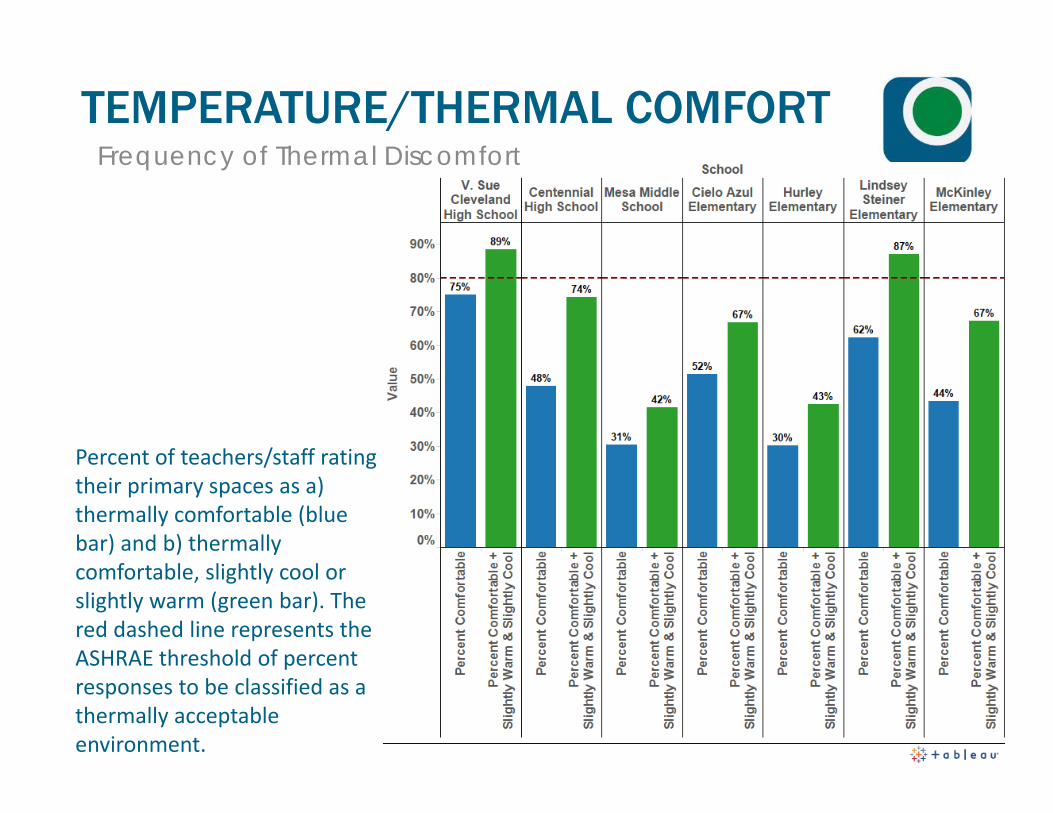
TEMPERATURE/THERMAL COMFORTFrequency of Thermal Discomfort
Percent of teachers/staff rating their primary spaces as a) thermally comfortable (blue bar) and b) thermally comfortable, slightly cool or slightly warm (green bar). The red dashed line represents the ASHRAE threshold of percent responses to be classified as a thermally acceptable environment.
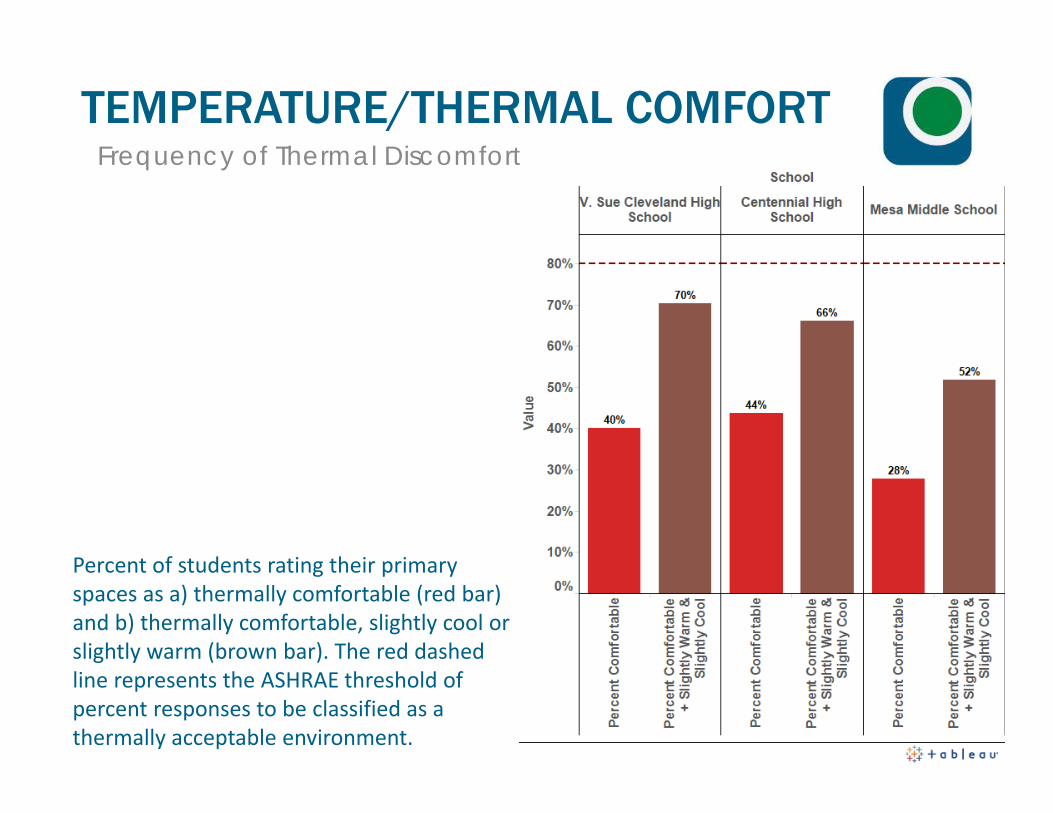
TEMPERATURE/THERMAL COMFORTFrequency of Thermal Discomfort
Percent of students rating their primary spaces as a) thermally comfortable (red bar) and b) thermally comfortable, slightly cool or slightly warm (brown bar). The red dashed line represents the ASHRAE threshold of percent responses to be classified as a thermally acceptable environment.
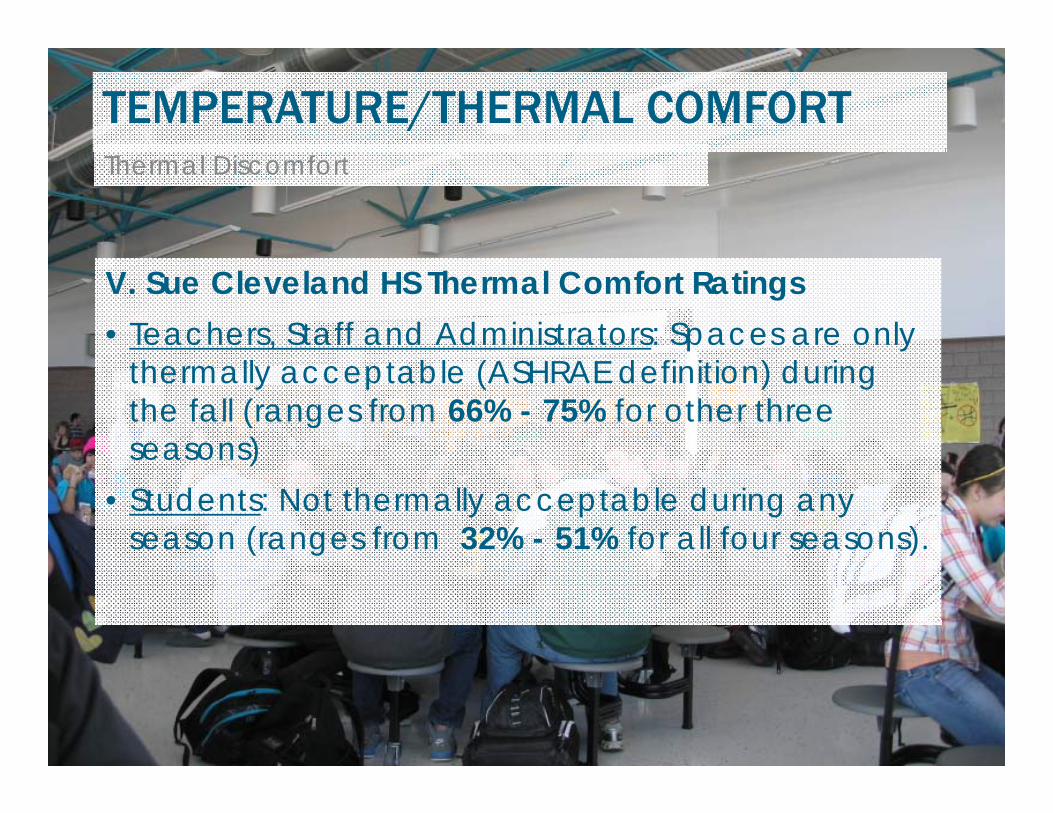
TEMPERATURE/THERMAL COMFORT
V. Sue Cleveland HS Thermal Comfort Ratings• Teachers, Staff and Administrators: Spaces are only
thermally acceptable (ASHRAE definition) during the fall (ranges from 66% - 75% for other three seasons)
• Students: Not thermally acceptable during any season (ranges from 32% - 51% for all four seasons).
Thermal Discomfort
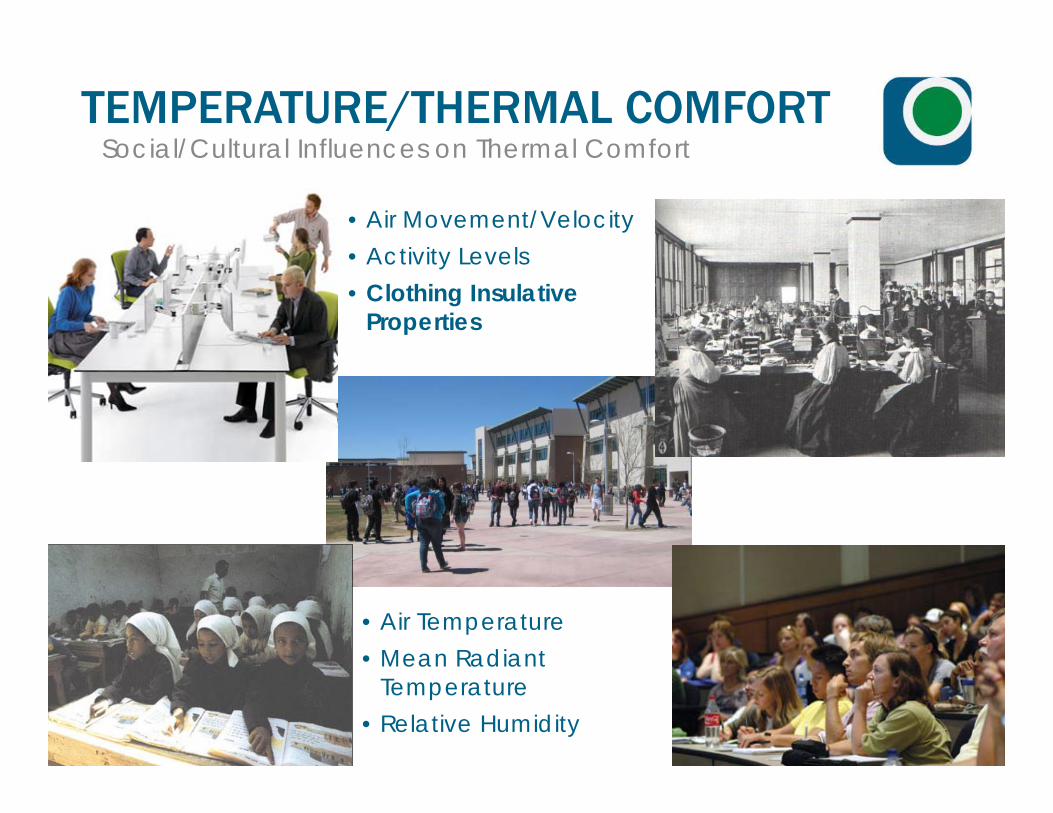
• Air Temperature• Mean Radiant
Temperature• Relative Humidity
• Air Movement/Velocity• Activity Levels• Clothing Insulative
Properties
Social/Cultural Influences on Thermal ComfortTEMPERATURE/THERMAL COMFORT

Clothing Variability
TEMPERATURE/THERMAL COMFORT
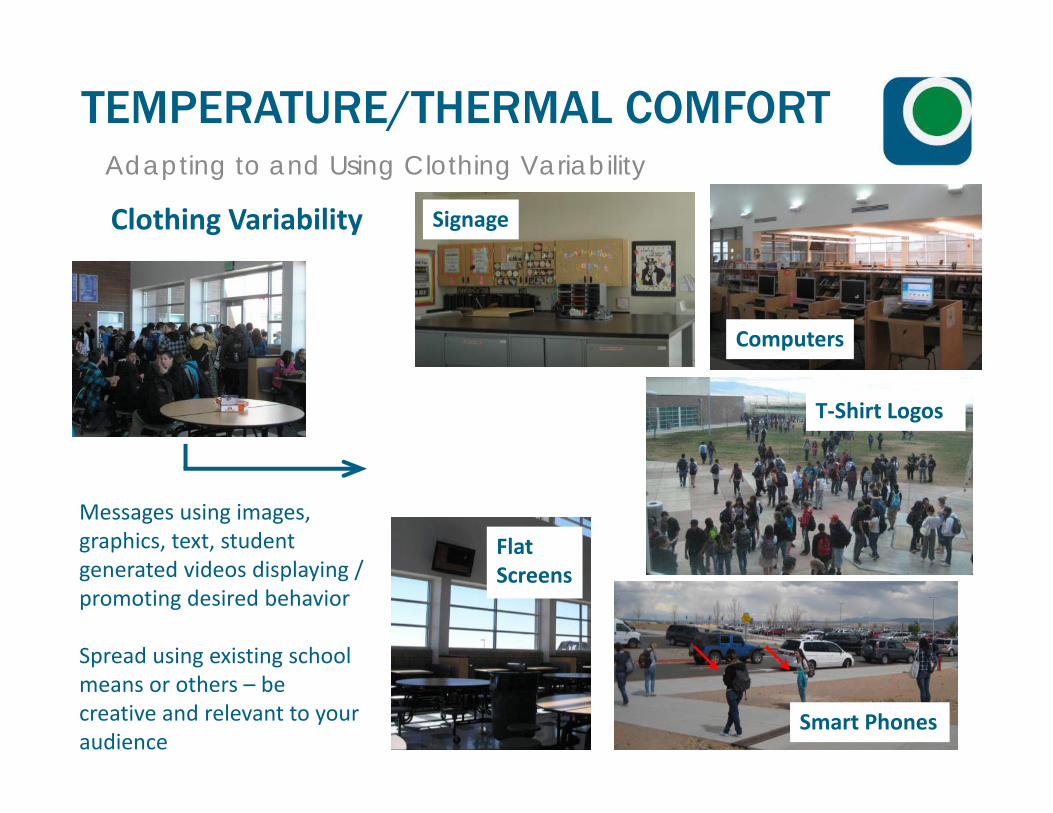
Adapting to and Using Clothing Variability
Clothing Variability Signage
Computers
Flat Screens
Smart Phones
T‐Shirt Logos
Messages using images, graphics, text, student generated videos displaying / promoting desired behavior
Spread using existing school means or others – be creative and relevant to your audience
TEMPERATURE/THERMAL COMFORT
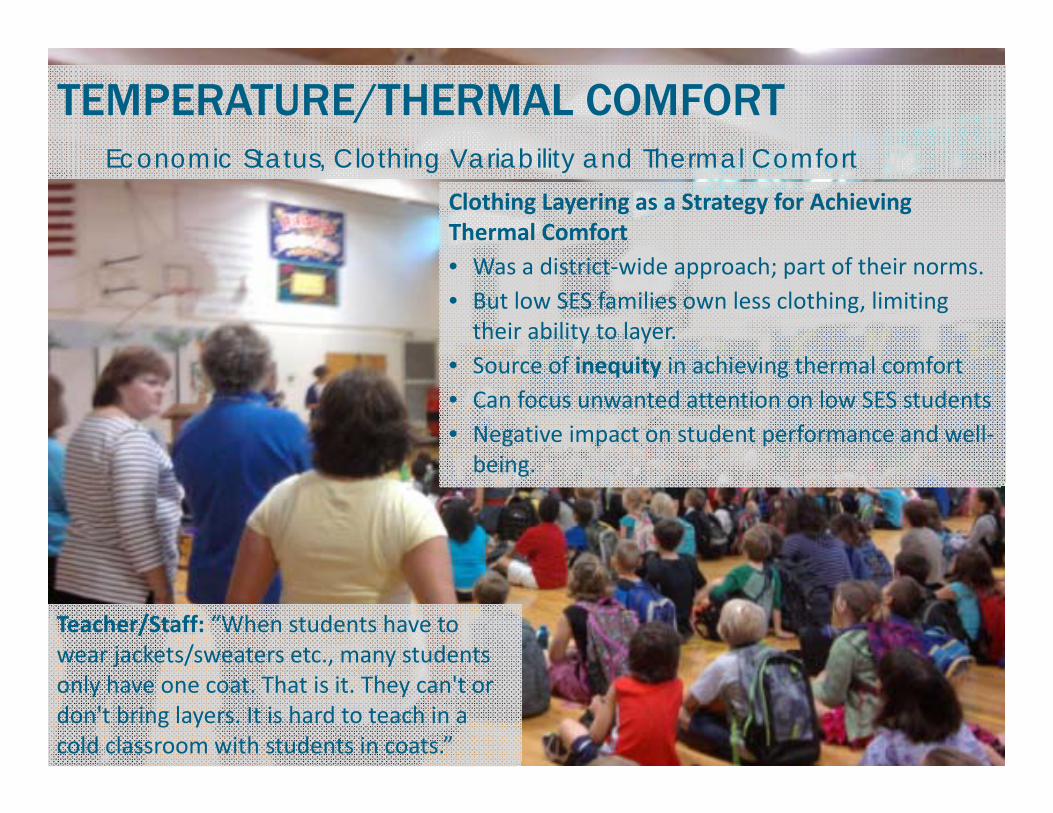
Clothing Layering as a Strategy for Achieving Thermal Comfort• Was a district‐wide approach; part of their norms. • But low SES families own less clothing, limiting their ability to layer.
• Source of inequity in achieving thermal comfort• Can focus unwanted attention on low SES students• Negative impact on student performance and well‐being.
TEMPERATURE/THERMAL COMFORT
Teacher/Staff: “When students have to wear jackets/sweaters etc., many students only have one coat. That is it. They can't or don't bring layers. It is hard to teach in a cold classroom with students in coats.”
Economic Status, Clothing Variability and Thermal Comfort

Heat from copier next to thermostat may be creating “false” call for cooling.
Plug Load Equipment & Thermostats
TEMPERATURE/THERMAL COMFORT

INDOOR AIR QUALITY (IAQ)
U.S. Business IAQ Improvements:• save up to $58 billion in lost sick time • save additional $200 billion in worker
performance.
- Fisk, W. G. 2000, Health and Productivity Gains from Better Indoor Environments and Their Relationship with Building Energy Efficiency. Annual Review of Energy and Environment 25(1):537‐566. Later updated for 2002 dollars.
INDOOR AIR QUALITY (IAQ)Savings to U.S. Businesses

Impacts
• Schools with high IAQ total scores and a high Healthy Greenness School Index (GSI) were more likely to have high student attendance rates (36% and 22% respectively).
• Schools with well maintained air filters were also 42% more likely to have good 4th grade academic performance.
Lin, S., C. Kielb, A. Orsini & N. Muscatiello The Evaluation of Green School Building Attributes and Their Effect on the Health and Performance of Students and Teachers in New York State. Final Project Report ‐ Proposal Number: #147 funded by the US Green Building Council. http://www.usgbc.org/ShowFile.aspx?DocumentID=8627.
Illinois Healthy Schools Campaign, “Apparently Size Doesn’t Matter: Two Illinois School Districts Show Successful IAQ Management.” School Health Watch, Summer 2003. http://healthyschoolscampaign.org/news/newsletter/2003‐summer_HSC‐newsletter.pdf. Also see: US Environmental Protection Agency. “IAQ Tools for Schools,” December 2000 (Second Edition). Available at: http://www.epa.gov/iaq/schools/.
• An analysis of two school districts in Illinois found that student attendance rose by 5% after incorporating cost effective indoor air quality improvements.
INDOOR AIR QUALITY (IAQ)

Landscaping Impacts on IAQ
VE/Defer Landscaping
Increased Cleaning & Poorer IAQ
V. Sue Cleveland High School, Rio Rancho, NM
INDOOR AIR QUALITY (IAQ)
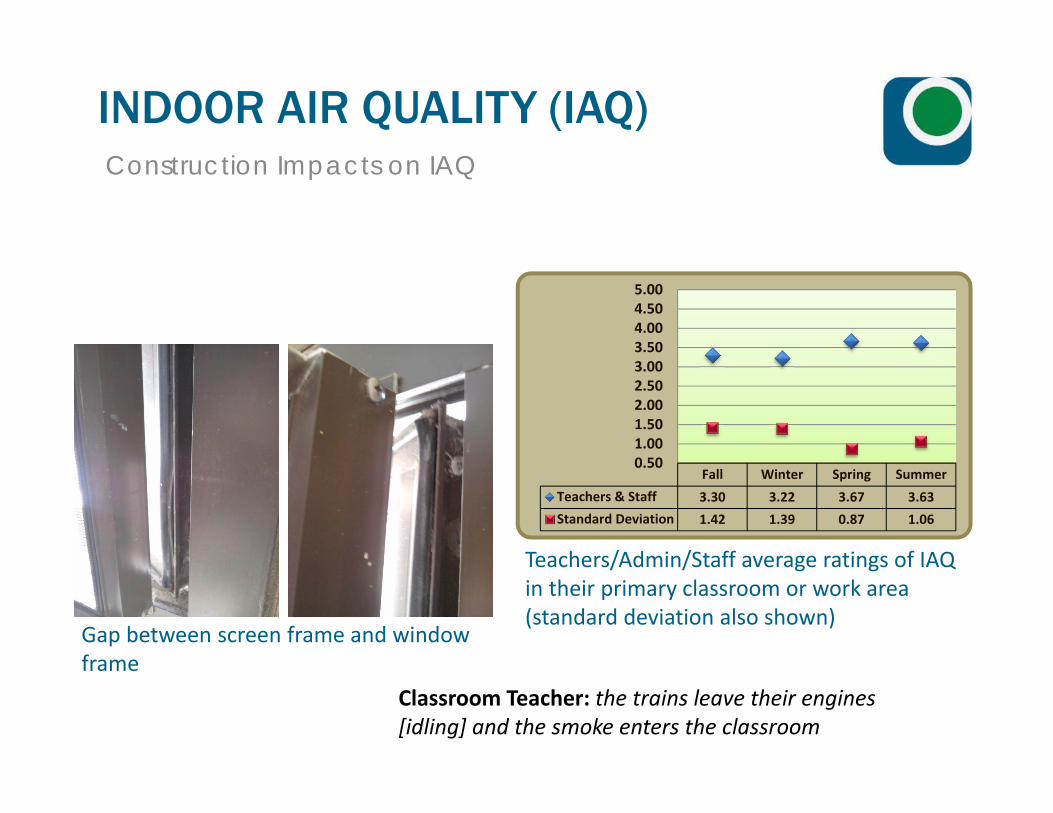
Classroom Teacher: the trains leave their engines [idling] and the smoke enters the classroom
Fall Winter Spring Summer
Teachers & Staff 3.30 3.22 3.67 3.63
Standard Deviation 1.42 1.39 0.87 1.06
0.501.001.502.002.503.003.504.004.505.00
Teachers/Admin/Staff average ratings of IAQ in their primary classroom or work area (standard deviation also shown)
Gap between screen frame and window frame
Construction Impacts on IAQ
INDOOR AIR QUALITY (IAQ)
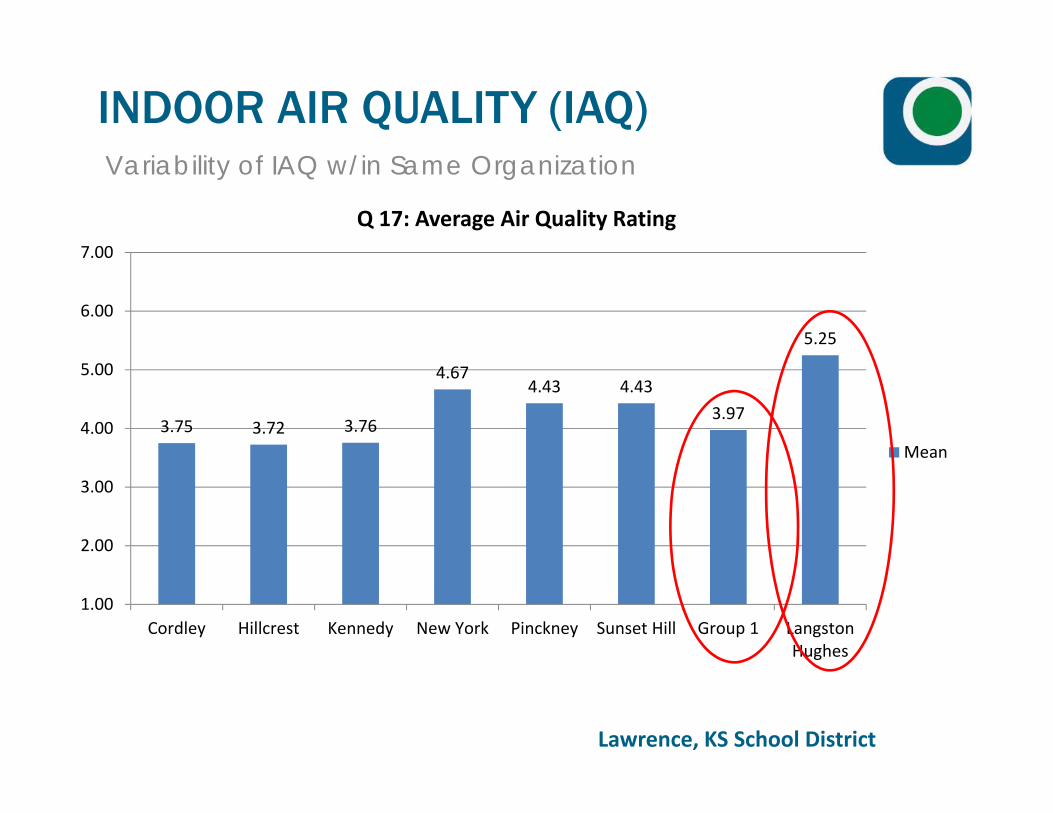
Lawrence, KS School District
3.75 3.72 3.76
4.674.43 4.43
3.97
5.25
1.00
2.00
3.00
4.00
5.00
6.00
7.00
Cordley Hillcrest Kennedy New York Pinckney Sunset Hill Group 1 LangstonHughes
Q 17: Average Air Quality Rating
Mean
Variability of IAQ w/in Same Organization
INDOOR AIR QUALITY (IAQ)
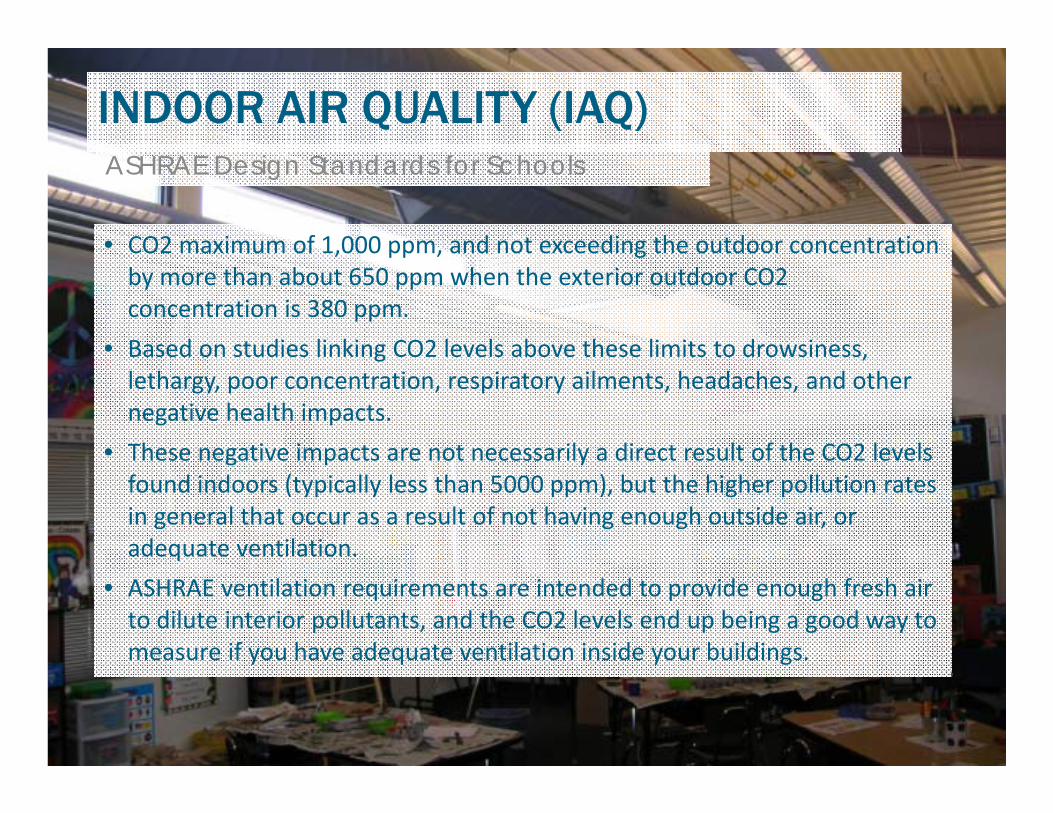
• CO2 maximum of 1,000 ppm, and not exceeding the outdoor concentration by more than about 650 ppm when the exterior outdoor CO2 concentration is 380 ppm.
• Based on studies linking CO2 levels above these limits to drowsiness, lethargy, poor concentration, respiratory ailments, headaches, and other negative health impacts.
• These negative impacts are not necessarily a direct result of the CO2 levels found indoors (typically less than 5000 ppm), but the higher pollution rates in general that occur as a result of not having enough outside air, or adequate ventilation.
• ASHRAE ventilation requirements are intended to provide enough fresh air to dilute interior pollutants, and the CO2 levels end up being a good way to measure if you have adequate ventilation inside your buildings.
INDOOR AIR QUALITY (IAQ)ASHRAE Design Standards for Schools
0
1,000
2,000
3,000
4,000
CO
2 PP
M
0
1,000
2,000
3,000
4,000
CO
2 PP
M
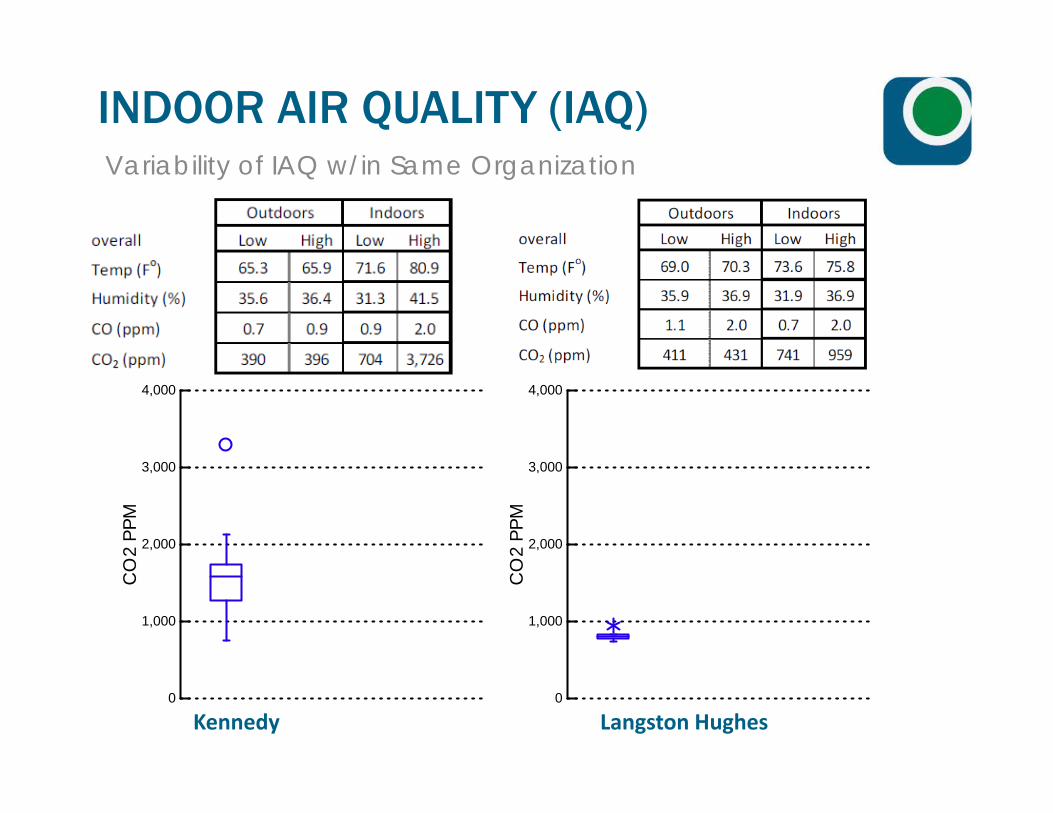
Kennedy Langston Hughes
Variability of IAQ w/in Same Organization
INDOOR AIR QUALITY (IAQ)

ACOUSTICS
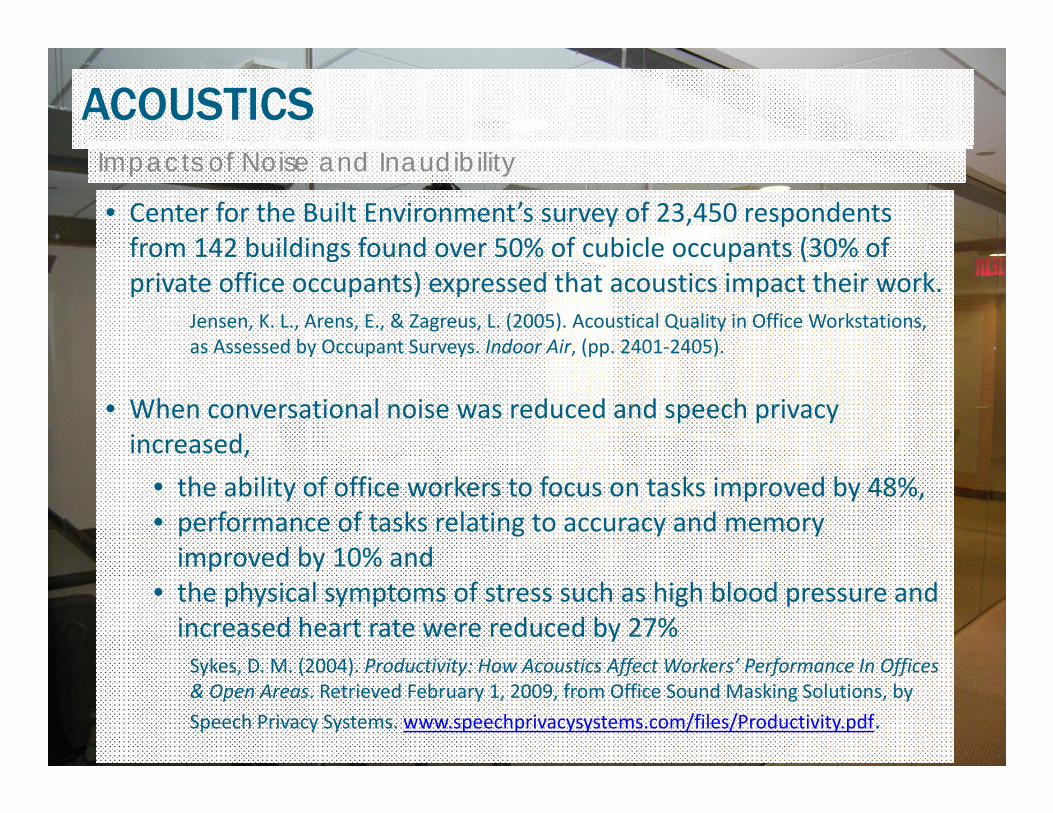
ACOUSTICSImpacts of Noise and Inaudibility
• Center for the Built Environment’s survey of 23,450 respondents from 142 buildings found over 50% of cubicle occupants (30% of private office occupants) expressed that acoustics impact their work.
Jensen, K. L., Arens, E., & Zagreus, L. (2005). Acoustical Quality in Office Workstations, as Assessed by Occupant Surveys. Indoor Air, (pp. 2401‐2405).
• When conversational noise was reduced and speech privacy increased,
• the ability of office workers to focus on tasks improved by 48%, • performance of tasks relating to accuracy and memory improved by 10% and
• the physical symptoms of stress such as high blood pressure and increased heart rate were reduced by 27%Sykes, D. M. (2004). Productivity: How Acoustics Affect Workers’ Performance In Offices & Open Areas. Retrieved February 1, 2009, from Office Sound Masking Solutions, by Speech Privacy Systems. www.speechprivacysystems.com/files/Productivity.pdf.
ACOUSTICSJulian Treasure: Why architects need to use their ears• http://www.ted.com/talks/julian_treasure_why_architects_need_to_use_their_ears.html
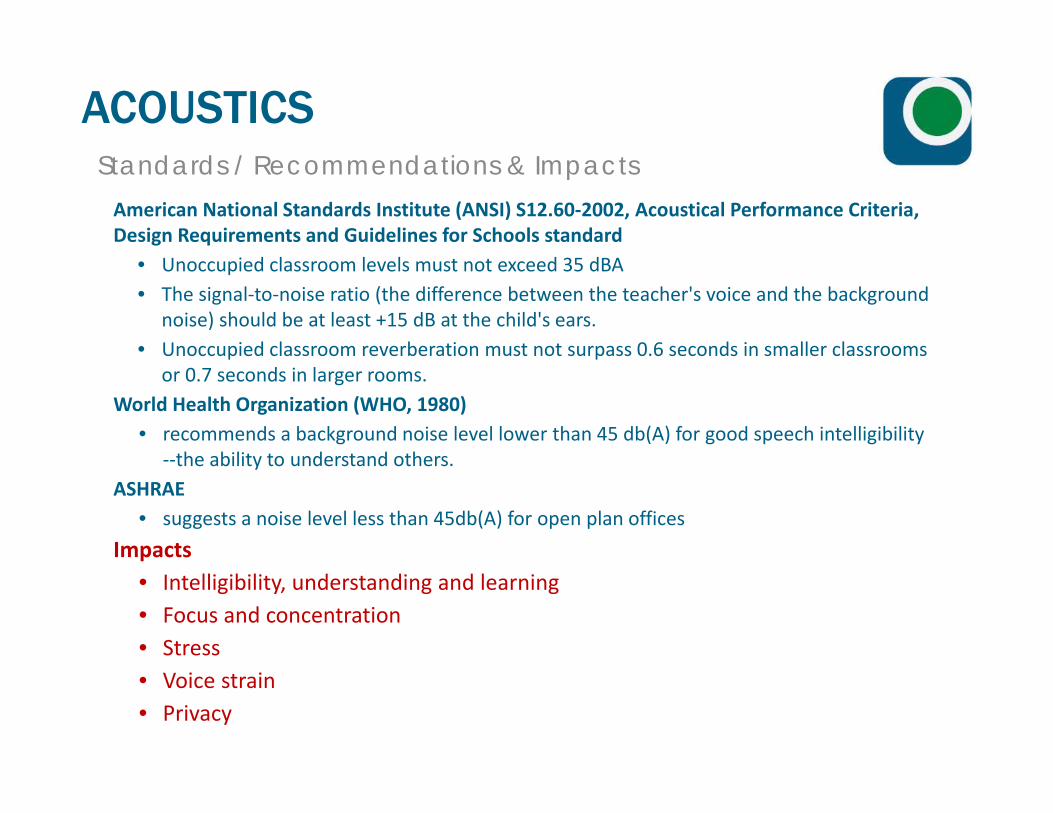
Standards / Recommendations & ImpactsAmerican National Standards Institute (ANSI) S12.60‐2002, Acoustical Performance Criteria, Design Requirements and Guidelines for Schools standard
• Unoccupied classroom levels must not exceed 35 dBA• The signal‐to‐noise ratio (the difference between the teacher's voice and the background
noise) should be at least +15 dB at the child's ears.• Unoccupied classroom reverberation must not surpass 0.6 seconds in smaller classrooms
or 0.7 seconds in larger rooms.World Health Organization (WHO, 1980)
• recommends a background noise level lower than 45 db(A) for good speech intelligibility ‐‐the ability to understand others.
ASHRAE• suggests a noise level less than 45db(A) for open plan offices
Impacts• Intelligibility, understanding and learning• Focus and concentration• Stress • Voice strain• Privacy
ACOUSTICS
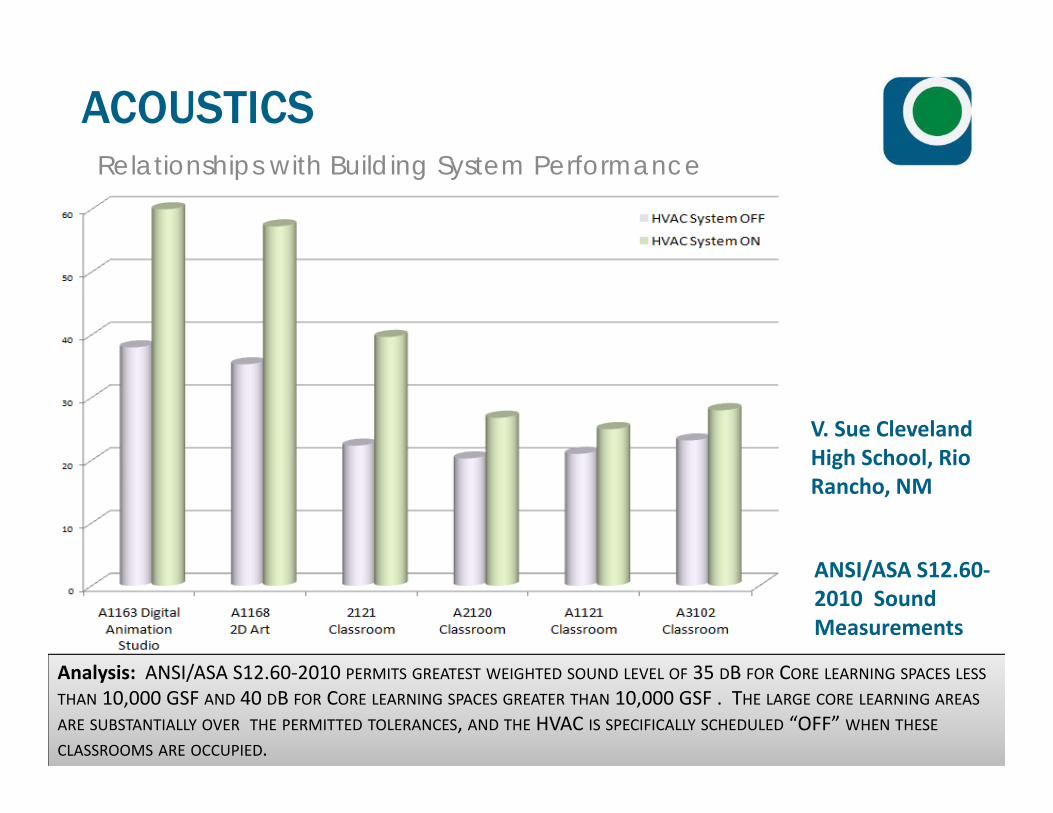
Relationships with Building System Performance
ANSI/ASA S12.60‐2010 Sound Measurements
Analysis: ANSI/ASA S12.60‐2010 PERMITS GREATEST WEIGHTED SOUND LEVEL OF 35 DB FOR CORE LEARNING SPACES LESS
THAN 10,000 GSF AND 40 DB FOR CORE LEARNING SPACES GREATER THAN 10,000 GSF . THE LARGE CORE LEARNING AREAS
ARE SUBSTANTIALLY OVER THE PERMITTED TOLERANCES, AND THE HVAC IS SPECIFICALLY SCHEDULED “OFF” WHEN THESE
CLASSROOMS ARE OCCUPIED.
V. Sue Cleveland High School, Rio Rancho, NM
ACOUSTICS
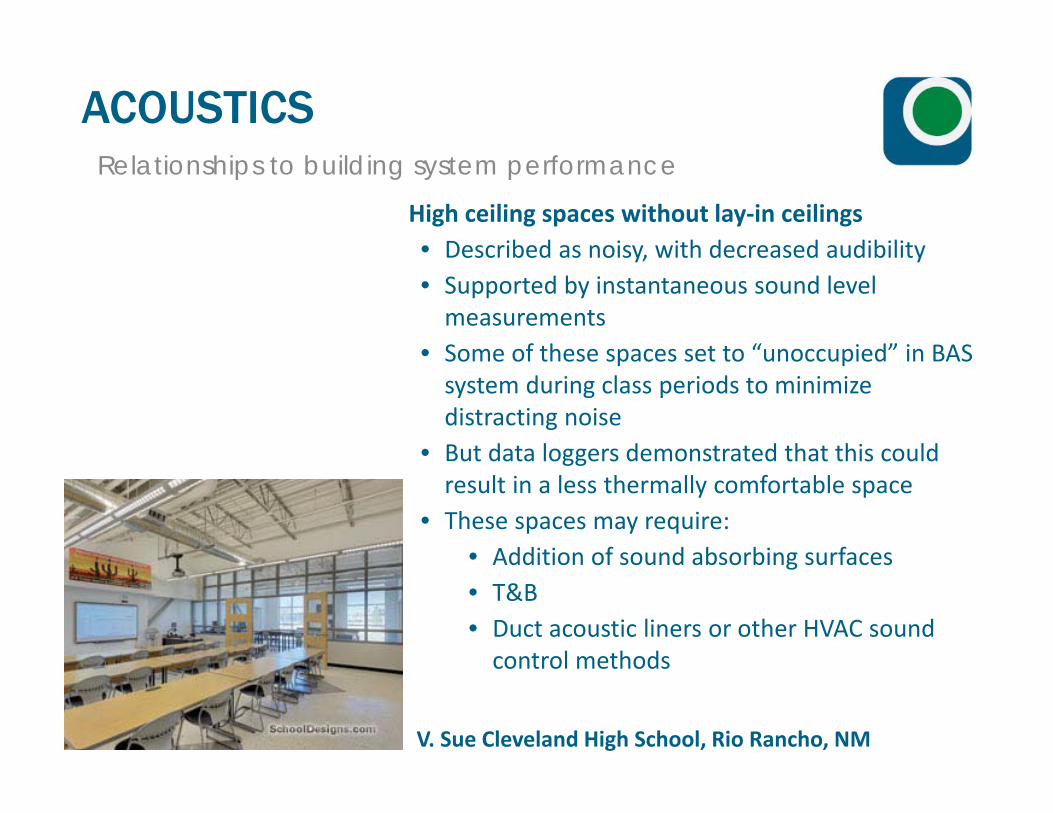
Relationships to building system performance
High ceiling spaces without lay‐in ceilings• Described as noisy, with decreased audibility• Supported by instantaneous sound level measurements
• Some of these spaces set to “unoccupied” in BAS system during class periods to minimize distracting noise
• But data loggers demonstrated that this could result in a less thermally comfortable space
• These spaces may require:• Addition of sound absorbing surfaces• T&B• Duct acoustic liners or other HVAC sound control methods
V. Sue Cleveland High School, Rio Rancho, NM
ACOUSTICS
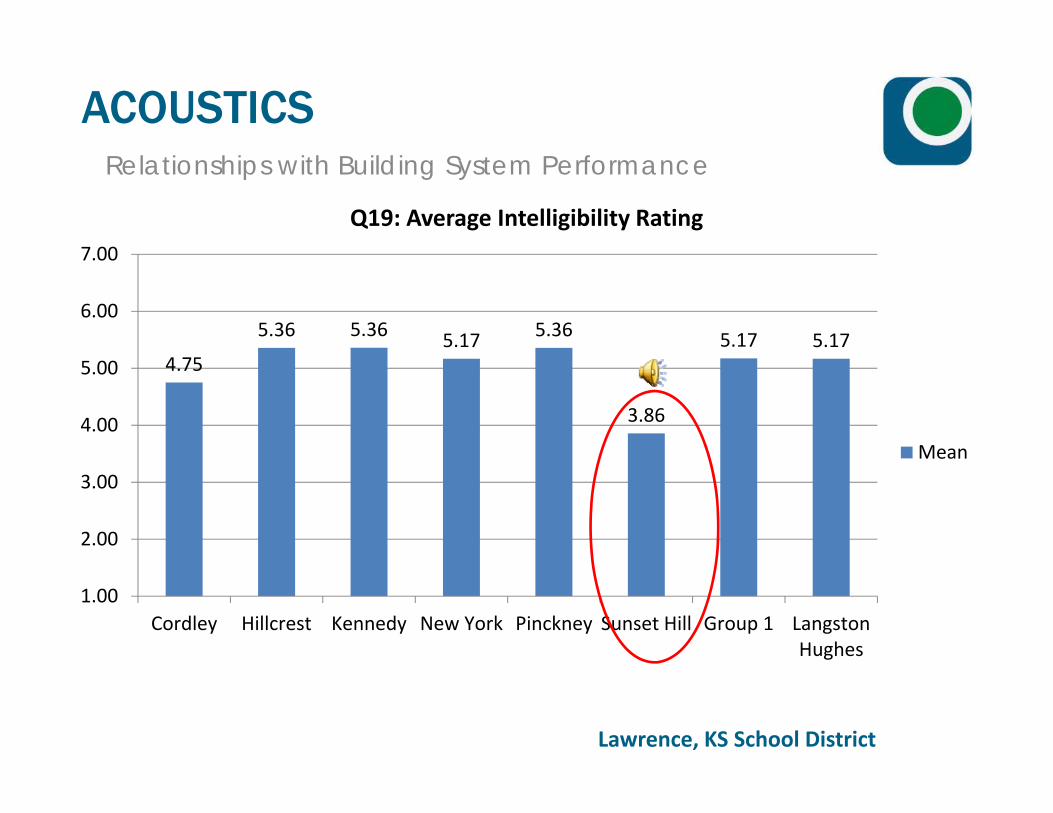
Relationships with Building System Performance
4.75
5.36 5.36 5.17 5.36
3.86
5.17 5.17
1.00
2.00
3.00
4.00
5.00
6.00
7.00
Cordley Hillcrest Kennedy New York Pinckney Sunset Hill Group 1 LangstonHughes
Q19: Average Intelligibility Rating
Mean
Lawrence, KS School District
ACOUSTICS
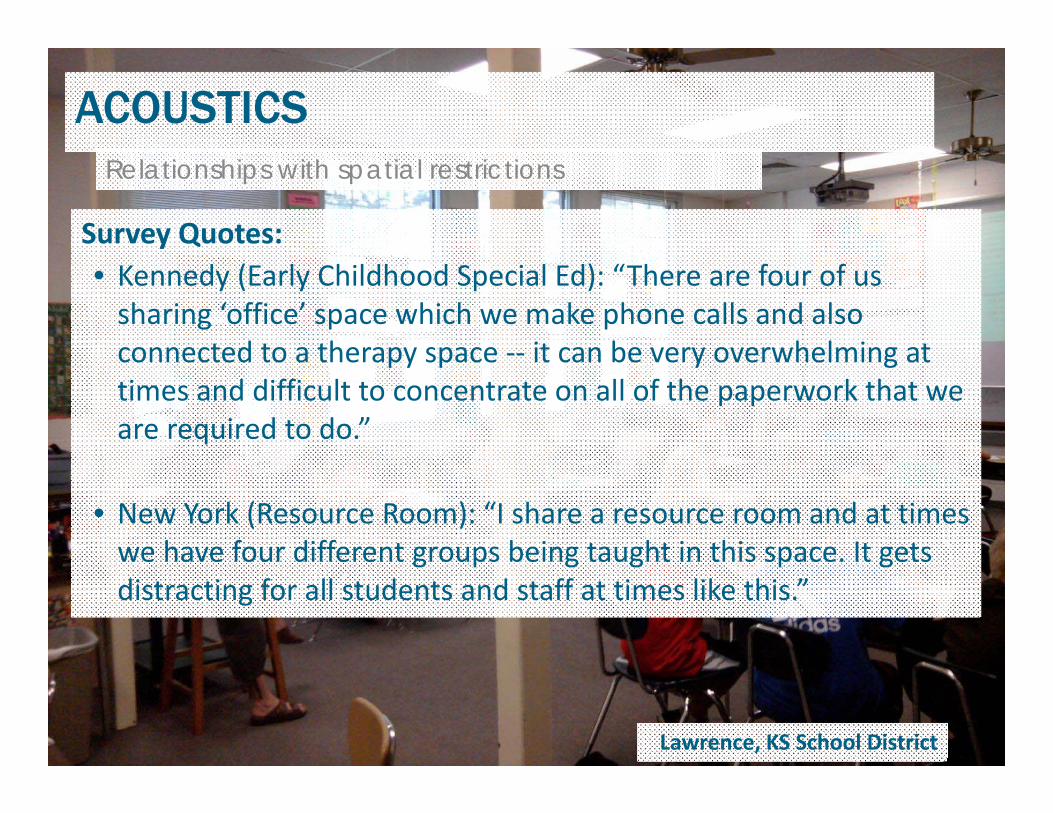
ACOUSTICSRelationships with spatial restrictions
Survey Quotes:• Kennedy (Early Childhood Special Ed): “There are four of us sharing ‘office’ space which we make phone calls and also connected to a therapy space ‐‐ it can be very overwhelming at times and difficult to concentrate on all of the paperwork that we are required to do.”
• New York (Resource Room): “I share a resource room and at times we have four different groups being taught in this space. It gets distracting for all students and staff at times like this.”
Lawrence, KS School District
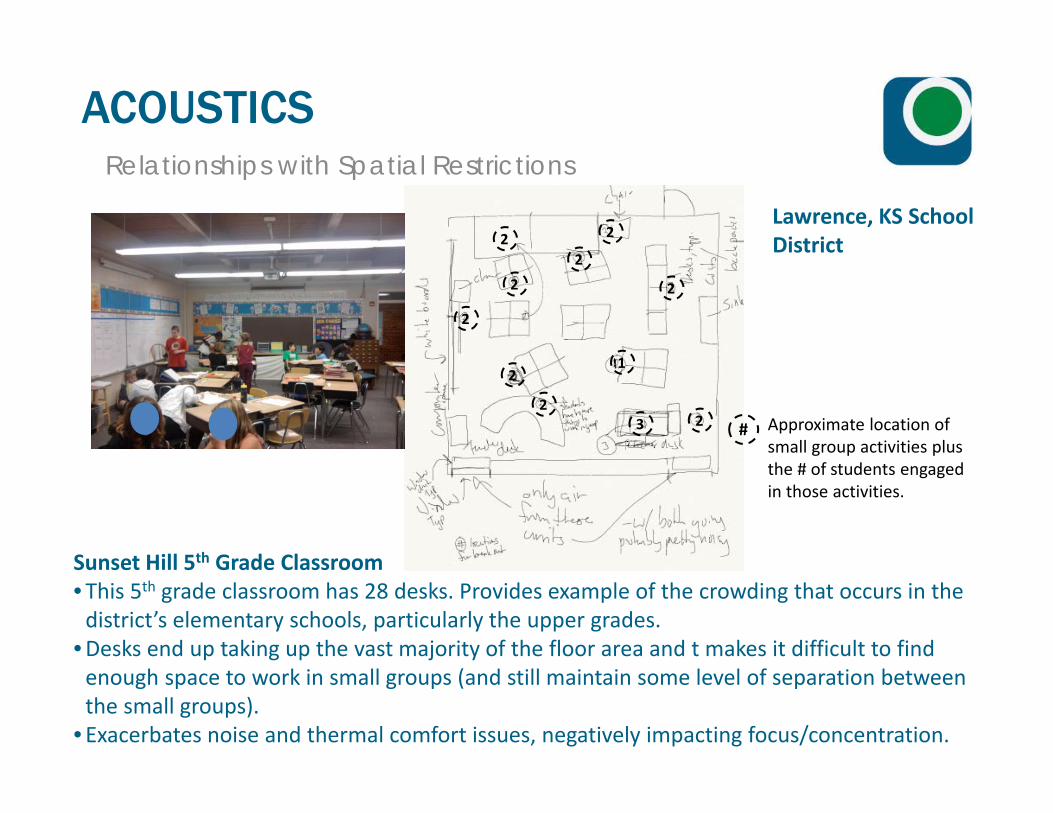
Relationships with Spatial Restrictions
Sunset Hill 5th Grade Classroom• This 5th grade classroom has 28 desks. Provides example of the crowding that occurs in the district’s elementary schools, particularly the upper grades.
•Desks end up taking up the vast majority of the floor area and t makes it difficult to find enough space to work in small groups (and still maintain some level of separation between the small groups).
• Exacerbates noise and thermal comfort issues, negatively impacting focus/concentration.
# Approximate location of small group activities plus the # of students engaged in those activities.
2
1
2
2
2
2
2
2
2
2
3
Lawrence, KS School District
ACOUSTICS

LIGHTING/VIEWS
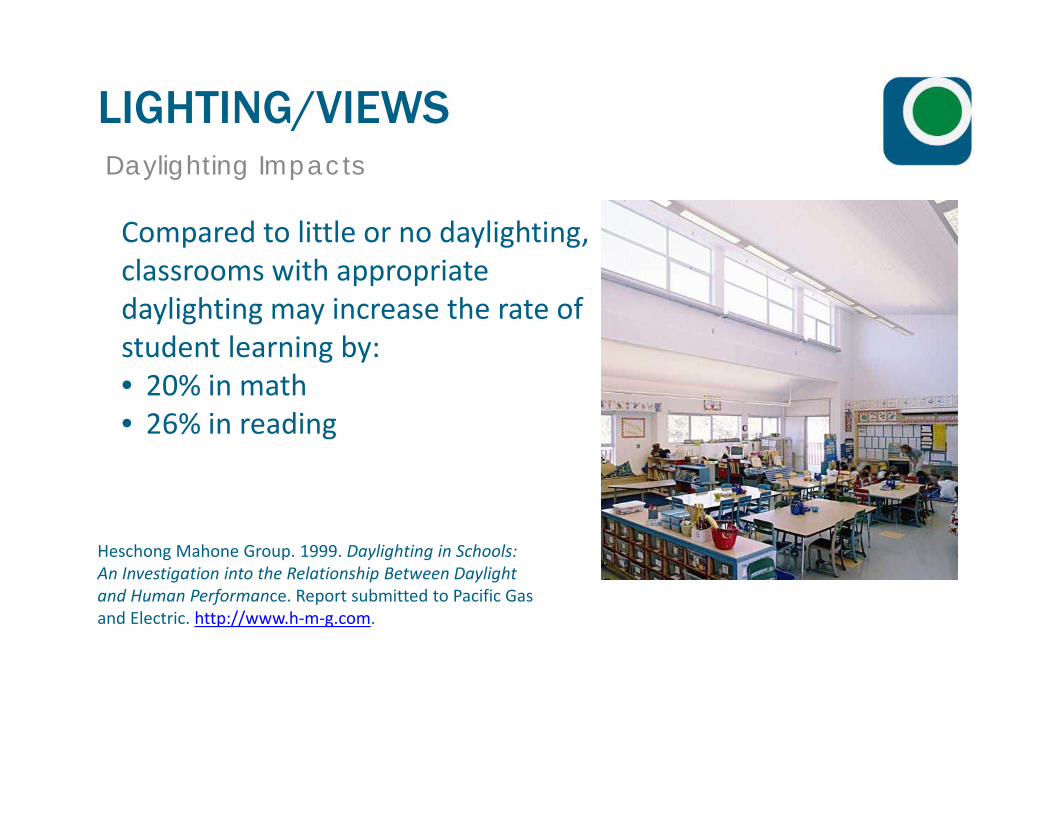
LIGHTING/VIEWSDaylighting Impacts
Compared to little or no daylighting, classrooms with appropriate daylighting may increase the rate of student learning by:• 20% in math• 26% in reading
Heschong Mahone Group. 1999. Daylighting in Schools: An Investigation into the Relationship Between Daylight and Human Performance. Report submitted to Pacific Gas and Electric. http://www.h‐m‐g.com.
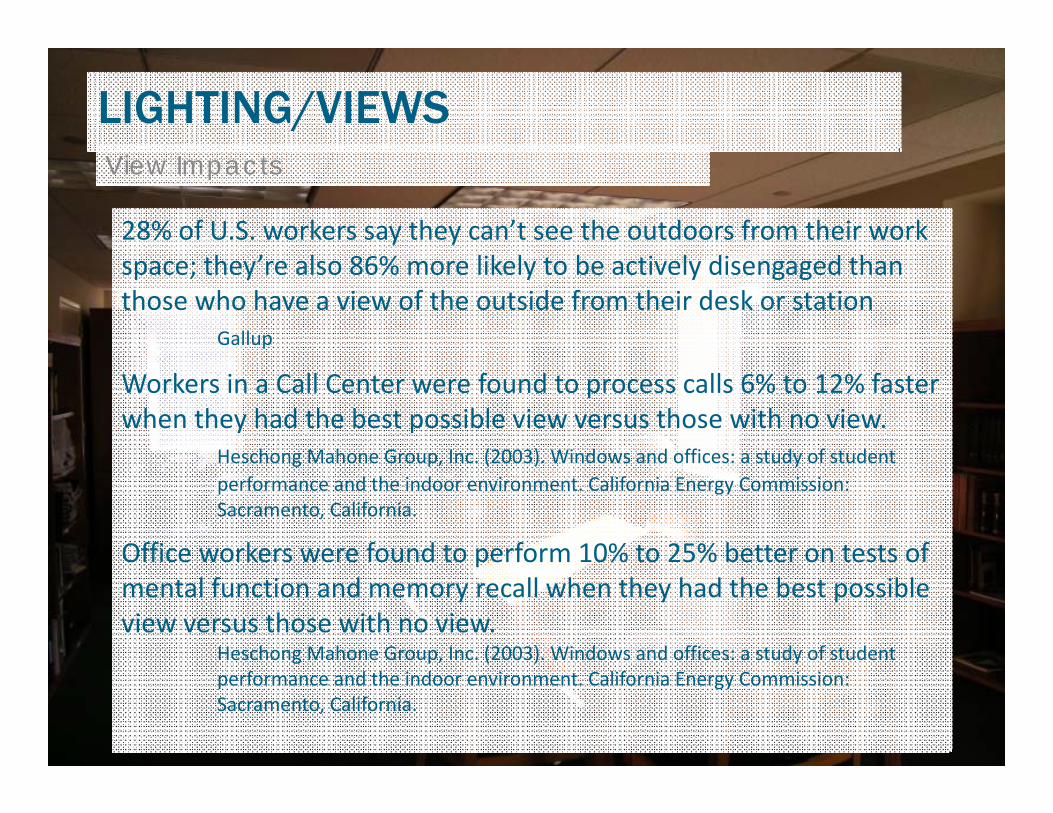
LIGHTING/VIEWSView Impacts
28% of U.S. workers say they can’t see the outdoors from their work space; they’re also 86% more likely to be actively disengaged than those who have a view of the outside from their desk or station
Gallup
Workers in a Call Center were found to process calls 6% to 12% faster when they had the best possible view versus those with no view.
Heschong Mahone Group, Inc. (2003). Windows and offices: a study of student performance and the indoor environment. California Energy Commission: Sacramento, California.
Office workers were found to perform 10% to 25% better on tests of mental function and memory recall when they had the best possible view versus those with no view.
Heschong Mahone Group, Inc. (2003). Windows and offices: a study of student performance and the indoor environment. California Energy Commission: Sacramento, California.
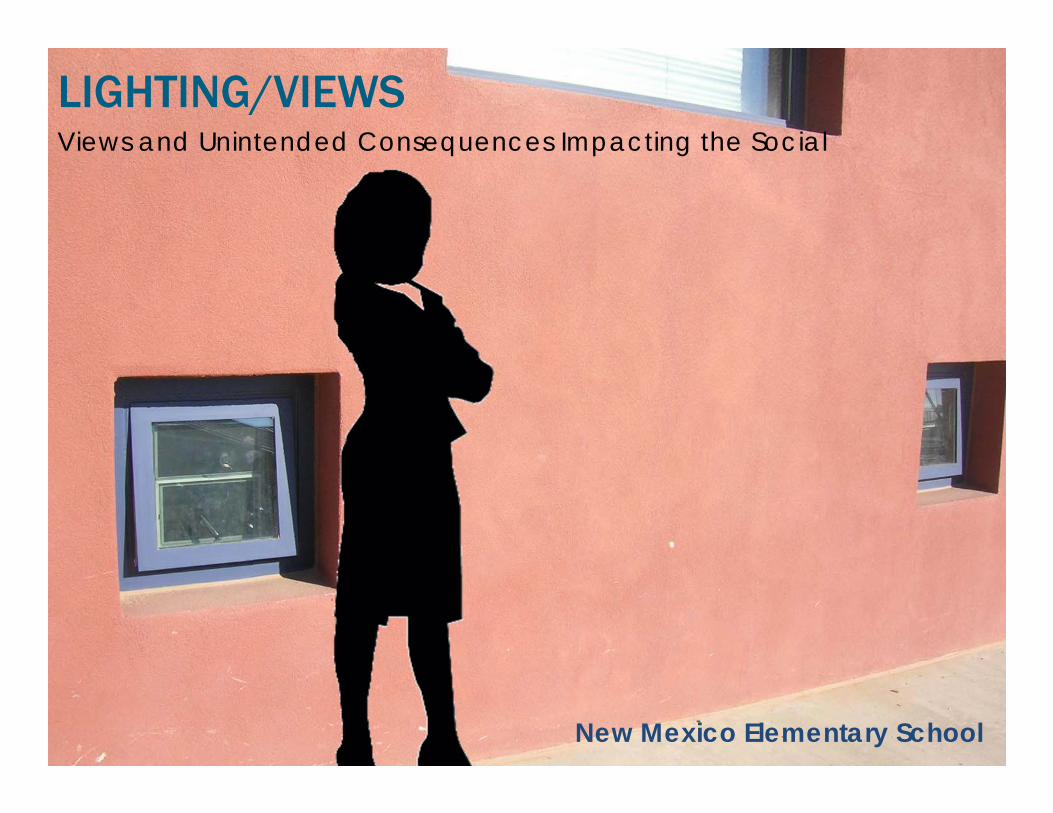
New Mexico Elementary School
Views and Unintended Consequences Impacting the SocialLIGHTING/VIEWS
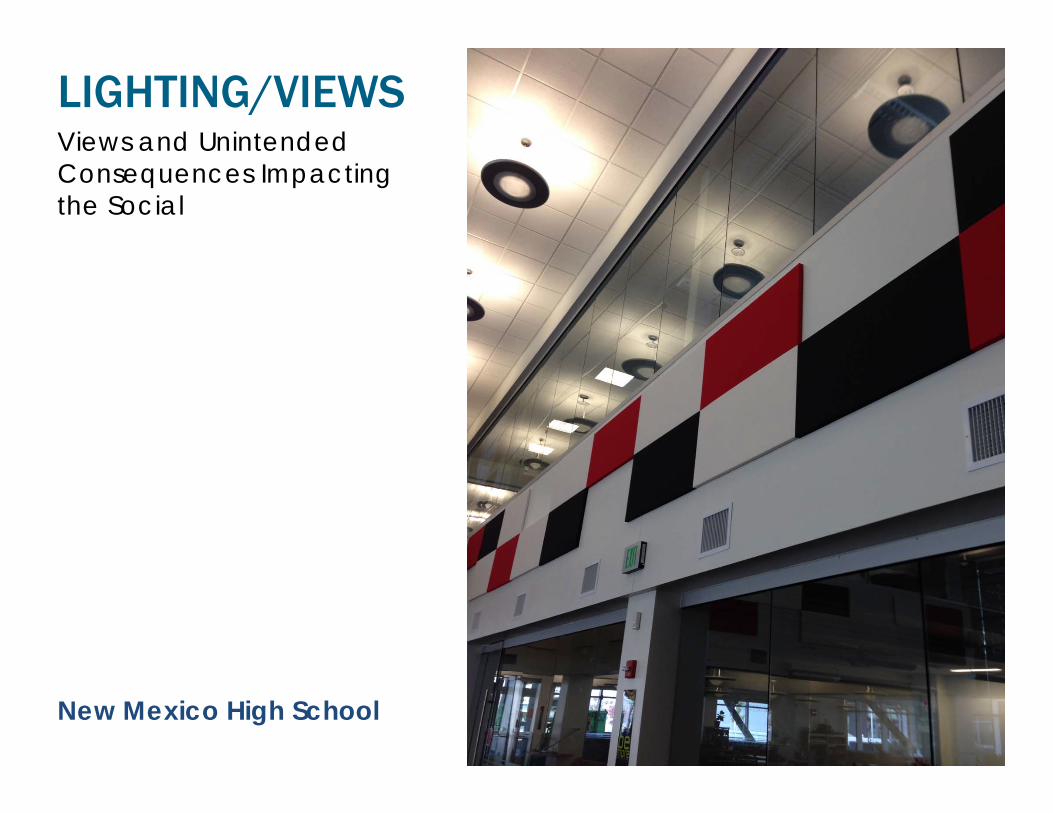
New Mexico High School
Views and Unintended Consequences Impacting the Social
LIGHTING/VIEWS
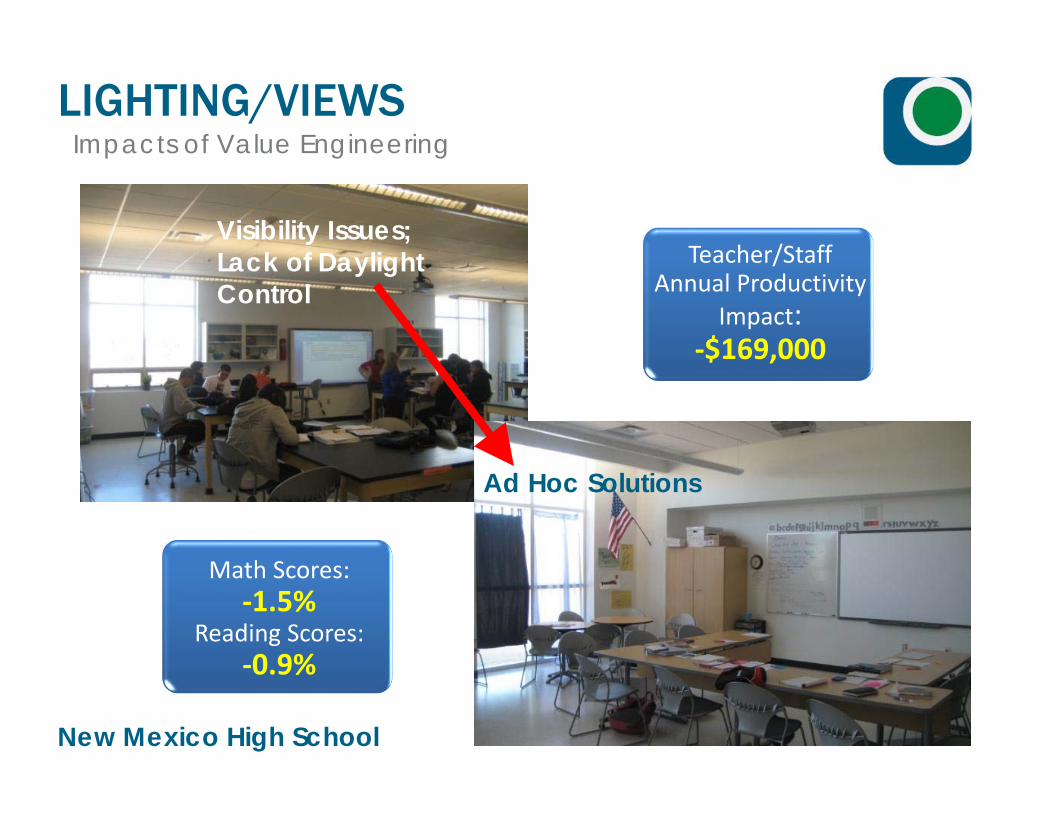
New Mexico High School
Visibility Issues;Lack of Daylight Control
Ad Hoc Solutions
Teacher/Staff Annual Productivity
Impact:‐$169,000
Math Scores:‐1.5%
Reading Scores:‐0.9%
LIGHTING/VIEWSImpacts of Value Engineering
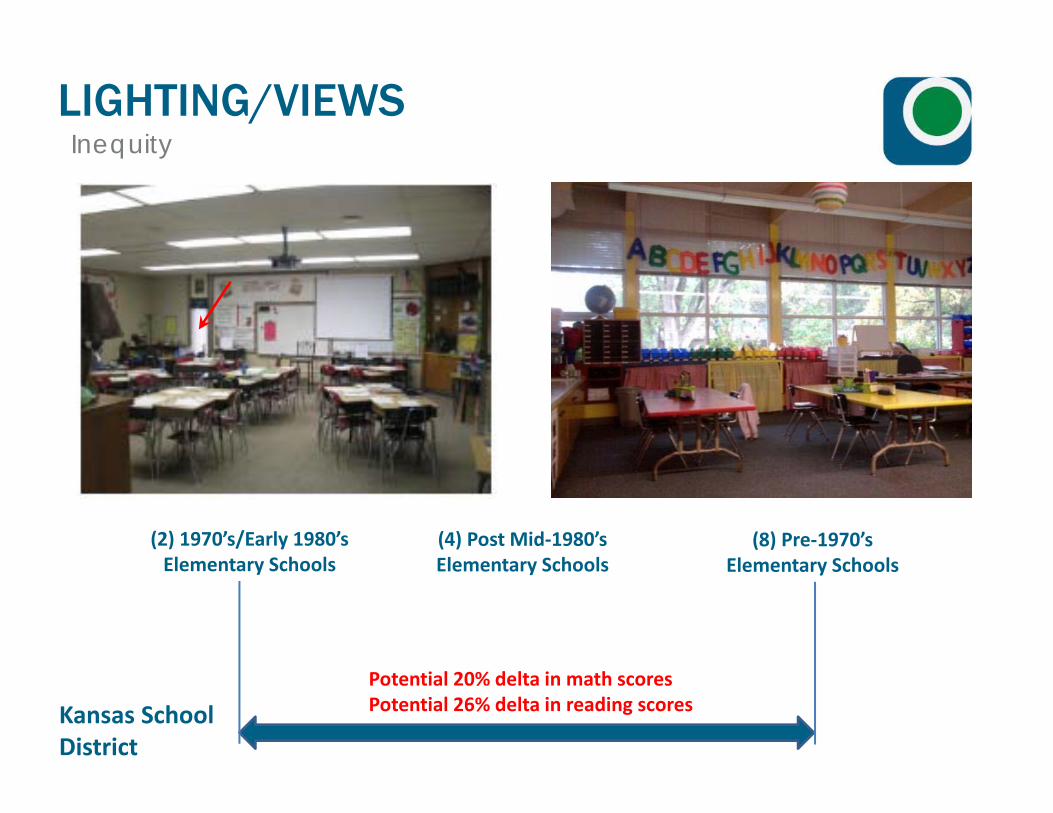
Kansas School District
(2) 1970’s/Early 1980’s Elementary Schools
(8) Pre‐1970’s Elementary Schools
(4) Post Mid‐1980’s Elementary Schools
Potential 20% delta in math scoresPotential 26% delta in reading scores
LIGHTING/VIEWSInequity
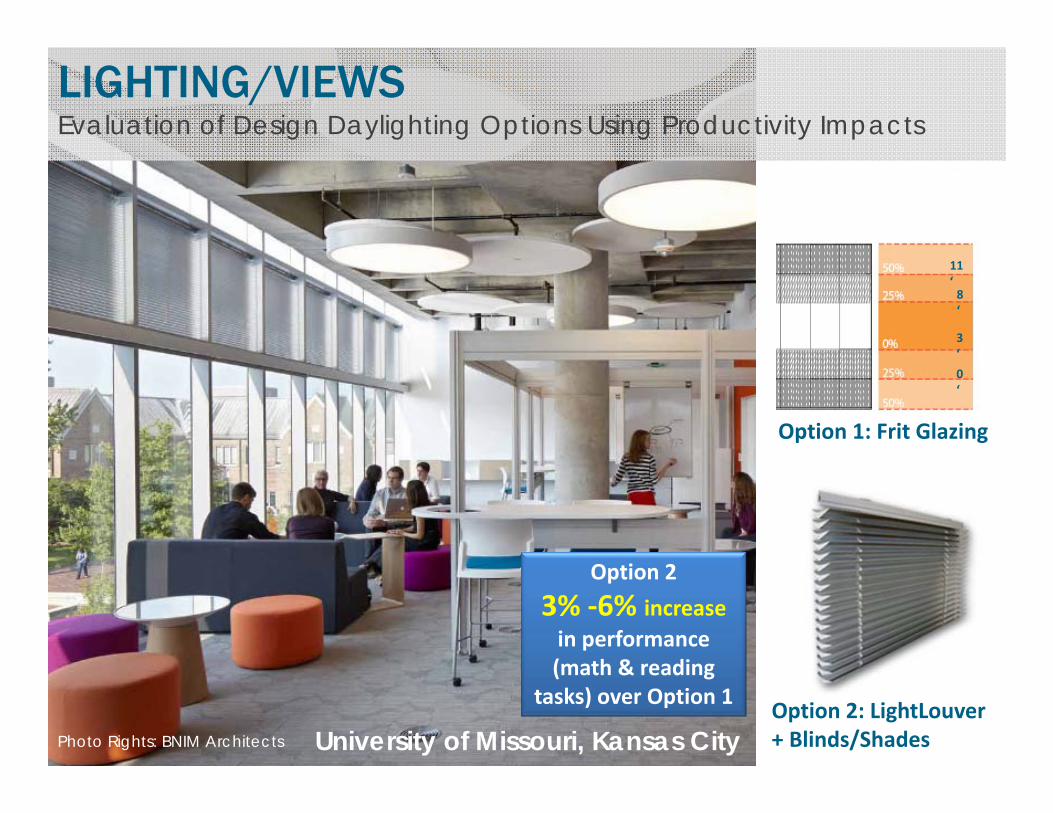
University of Missouri, Kansas City
0 ‘
3 ‘
8 ‘
11 ‘
Option 1: Frit Glazing
Option 2: LightLouver+ Blinds/Shades
LIGHTING/VIEWSEvaluation of Design Daylighting Options Using Productivity Impacts
Option 2
3% ‐6% increase in performance (math & reading
tasks) over Option 1
Photo Rights: BNIM Architects
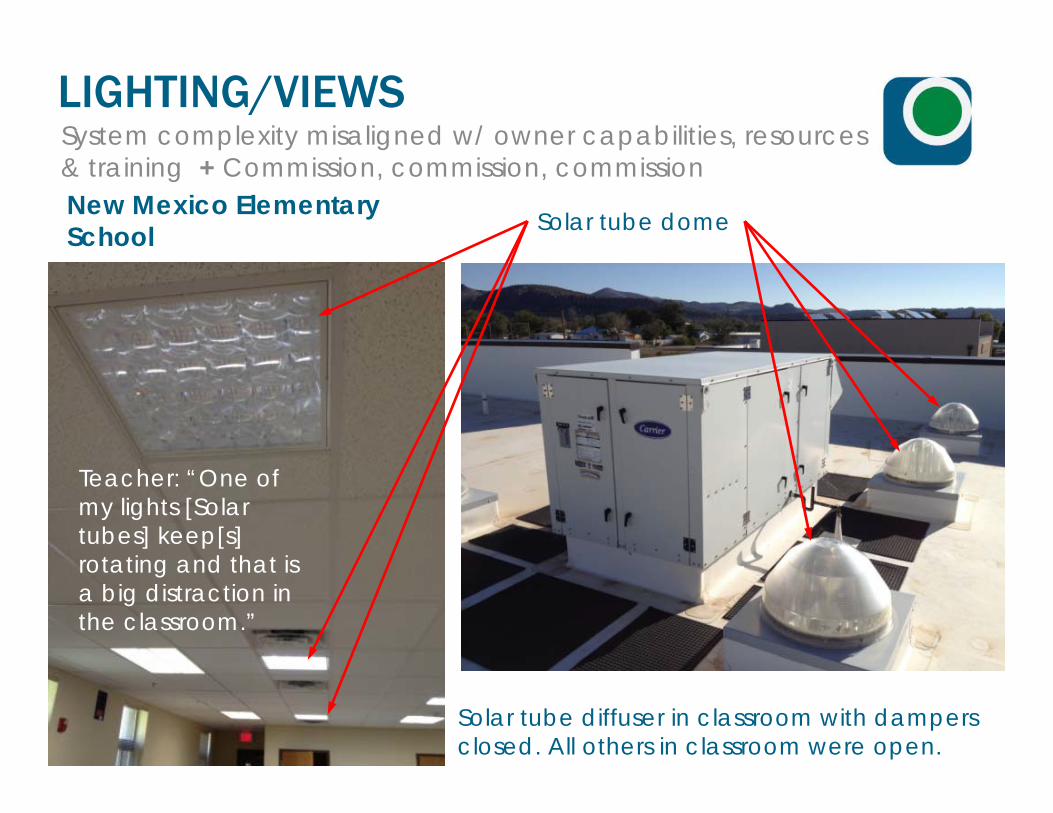
Solar tube dome
Solar tube diffuser in classroom with dampers closed. All others in classroom were open.
New Mexico Elementary School
System complexity misaligned w/ owner capabilities, resources & training + Commission, commission, commission
LIGHTING/VIEWS
Teacher: “One of my lights [Solar tubes] keep[s] rotating and that is a big distraction in the classroom.”
REFERENCESAmerican National Standards Institute (ANSI) S12.60‐2002, Acoustical Performance Criteria,
Design Requirements and Guidelines for Schools standard http://www.asha.org/public/hearing/American‐National‐Standard‐on‐Classroom‐Acoustics/http://acousticalsociety.org/about_acoustics/acoustics_of_classrooms
Committee to Review and Assess the Health and Productivity Benefits of Green Schools (National Research Council, 2006:65‐66).
Heschong Mahone Group. 1999. Daylighting in Schools: An Investigation into the Relationship Between Daylight and Human Performance. Report submitted to Pacific Gas and Electric. http://www.h‐m‐g.com.
Illinois Healthy Schools Campaign, “Apparently Size Doesn’t Matter: Two Illinois School Districts Show Successful IAQ Management.” School Health Watch, Summer 2003. http://healthyschoolscampaign.org/news/newsletter/2003‐summer_HSC‐newsletter.pdf. Also see: US Environmental Protection Agency. “IAQ Tools for Schools,” December 2000 (Second Edition). Available at: http://www.epa.gov/iaq/schools/.
Kanarek, R. (1997) Psychological Effects of Snacks and Altered Meal Frequency. British Journal of Nutrition 77, Suppl. 1:S105‐S120.
Kats, G. 2006 Greening America’s Schools: Costs and Benefits. Capital E. www.cap‐e.com.
Kats, G., L. Alevantis, A. Berman, E. Mills, and J. Perlman, 2003. The Costs and Financial Benefits of Green Building: A Report to California’s Sustainable Building Task Force.
Lin, S., C. Kielb, A. Orsini & N. Muscatiello The Evaluation of Green School Building Attributes and Their Effect on the Health and Performance of Students and Teachers in New York State. Final Project Report ‐ Proposal Number: #147 funded by the US Green Building Council. http://www.usgbc.org/ShowFile.aspx?DocumentID=8627.
Schneider, Mark. “Public School Facilities and Teaching: Washington, DC and Chicago,” November 2002. A Report Prepared for the Neighborhood Capital Budget Group (NCBG). Available at: http://www.ncbg.org/press/press111302.htm.
Smith, A. and A. Maben (1992) Effects of Sleep Deprivation, Lunch, and Personality on Performance, Mood, and Cardiovascular Function. Physiology & Behavior 54:967‐972
Treasure, J. Why architects need to use their ears. TED Talk http://www.ted.com/talks/julian_treasure_why_architects_need_to_use_their_ears.html
USA Today Special Report: The Smokestack Effect ‐ Toxicity and America’s Schools http://content.usatoday.com/news/nation/environment/smokestack/index
Why Environmental Health Matters in Schools ‐ EPA Webinar: 10/17/2012 ‐https://esbuildings.webex.com/mw0307l/mywebex/default.do?siteurl=esbuildings.
Wilson, D. S. (2011) The Neighborhood Project: Using Evolution to Improve My City, One Block at a Time. Hachette Book Group, New York, NY.
Wilson, D. S., D. Tumminelli O'Briena and A. Sesmac (2009) Human Prosociality From an Evolutionary Perspective: Variation and Correlations at a City‐Wide Scale. Evolution and Human Behavior 30:190–200.
REFERENCES