sustainable alternatives to fish meal … alternatives to fish meal and fish oil in fish nutrition:...
TRANSCRIPT
SUSTAINABLE ALTERNATIVES TO FISH MEAL
AND FISH OIL IN FISH NUTRITION:
EFFECTS ON GROWTH, TISSUE FATTY ACID
COMPOSITION AND LIPID METABOLISM
THESIS SUBMITTED TO THE UNIVERSITY OF STIRLING
FOR THE DEGREE OF DOCTOR OF PHILOSOPHY
by
VASILEIOS KARALAZOS
Ptychio, M.Sc.
INSTITUTE OF AQUACULTURE, UNIVERSITY OF STIRLING, STIRLING, SCOTLAND
APRIL 2007

ii
To my family

iii
Declaration
I hereby declare that this thesis has been composed entirely by myself and has
not been submitted for any other degree. Except where specifically acknowledged the
work described in this thesis is the result of my own investigations.
Vasileios Karalazos

iv
Abstract
Traditionally, fish meal (FM) and fish oil (FO) have been used extensively in
aquafeeds, mainly due to their excellent nutritional properties. However, various
reasons dictate the use of sustainable alternatives and the reduction of the dependence
on these commodities in fish feeds. Hence, the aim of the present thesis was to
investigate the effects of the replacement of FM and FO with two vegetable oils (VO)
and an oilseed meal on the growth performance, feed utilization, nutrient and fatty acids
(FA) digestibility and tissue FA composition and metabolism in three commercially
important European fish species. Specifically, in Experiment I crude palm oil (PO) was
used to replace FO in diets for rainbow trout. In Experiments II and III FO was replaced
with rapeseed oil (RO) in diets for Atlantic salmon at various dietary protein/lipid levels
aiming also at further reductions of FM by using low protein (high lipid) diet
formulations. In Experiments II and III the fish were reared at low and high water
temperatures, respectively, in order to elucidate, also, the potential effects of
temperature. Lastly, the effects of the replacement of FM with full fat soya meal (FFS)
in Atlantic cod were investigated in Experiment IV. The results of the present thesis
showed no negative effects on growth performance and feed utilization in rainbow trout
when FO was replaced with PO. The dietary inclusion of RO improved the growth of
Atlantic salmon, possibly, due to changes in the nutrient and FA digestibilities and FA
catabolism while, the growth and feed utilization were unaffected by the dietary
protein/lipid level. However, the growth of Atlantic cod was affected negatively by the
replacement of FM with FFS. The proximate composition of the fish whole body was in
most cases unaffected by dietary treatments. The changes in dietary formulations
affected the dietary FA compositions and resulted in significant changes in the fish
tissue FA compositions. It was clearly shown that the fish tissue total lipid FA
composition reflects the FA composition of the diet, although specific FA were
selectively utilized or retained in the tissues by the fish. These may have serious
implications not only for fish metabolism and growth but also for the quality of the final
product, especially in terms of possible reductions of n-3 HUFA.
v
Acknowledgements
I would like firstly to express my deep gratitude to my supervisor Dr. Gordon
Bell for his continued guidance, advice, encouragement and support throughout this
project. I would like also to thank my secondary supervisor Dr. Kim Jauncey for his
assistance. I am thankful to the great people of the Nutrition Group of the Institute of
Aquaculture, namely Dr. Douglas Tocher, Dr. Jim Henderson, James Dick, Fiona
Strachan, Liz MacKinlay, Irene Younger, Allan Porter and Dr. Mike Bell and my
colleagues Dr. Ioannis Karapanagiotidis, Dr. Jorge Fonseca Madrigal and Sean
Kennedy for their help, advice and support, but above all for making me feel that I have
a second “family” in Scotland.
My studies, towards this PhD, were funded by a PhD Scholarship from the
Greek Scholarship Foundation to whom I am indebted. I am also grateful to BioMar AS
for generously supporting this project and special thanks should be given to Dr. Eldar
Bendiksen, Dr. Patrick Campbell and Dr. Trine Galloway, from BioMar in Norway and
Scotland, for their assistance. Moreover, I am thankful to all the partners of the “FFS in
Cod” project, which was funded by DEFRA, and especially to Dr. Jim Treasurer. I
would like also to thank the Fisheries Association of the British Isles for offering
additional resources for conference attendance. Many thanks to the staff at the
Gildeskål Research Station (GIFAS) and Fjord Research Station AS in Norway and the
Scottish Association for Marine Science (SAMS) in Scotland for their excellent work in
running the feeding trials of the present project and also to the colleagues and staff of
the Institute of Aquaculture for their support during this work.
I must sincerely thank my parents and my brother for their words of
encouragement and fathomless support during my period of studies, with special thanks
to my father for his valuable scientific advice. Last, but not least, I would like to thank
all my friends for their support and encouragement, and of course all the wonderful
people I met in Scotland for making my life here such a unique experience.

vi
Abbreviations and Acronyms
AA Amino Acid(s) ADC Apparent Digestibility Coefficient ANF antinutritional factors ANOVA Analysis of Variance ARA arachidonic acid (20:4n-6) conc. concentrated CSI Cardiosomatic Index DE Digestible Energy DHA docosahexaenoic acid (22:6n-3) DM dry matter DP Digestible Protein EAA Essential Amino Acid(s) EPA eicosapentaenoic acid (20:5n-3) FA fatty acid(s) FAME fatty acid methyl esters FCR Feed Conversion Ratio FFS full fat soy bean meal FM fish meal FO fish oil HSI Hepatosomatic Index HUFA Highly Unsaturated Fatty Acid(s) K Condition Factor NQC Norwegian quality cuts PCB Poly-chlorinated biphenyls PO crude palm oil POP Persistent Organic Pollutants PPV Protein Productive Value prot. protein PUFA Poly-Unsaturated Fatty Acid(s) RO rapeseed oil SBM soy bean meal SGR Specific Growth Rate TGC Thermal Growth Coefficient VO vegetable oil(s) VSI Viscerosomatic Index

vii
Table of Contents
Declaration...................................................................................................................... iii Abstract............................................................................................................................iv
Acknowledgements...........................................................................................................v
Abbreviations and Acronyms ..........................................................................................vi
Table of Contents............................................................................................................vii
List of Tables ..................................................................................................................xii
List of Figures.................................................................................................................xv
Chapter 1. General Introduction...................................................................................1
1.1 Lipids in fish nutrition ...................................................................................2
1.1.1 General..................................................................................................2 1.1.2 Lipids and fatty acids – a brief overview..............................................2 1.1.3 Biosynthesis of fatty acids ....................................................................4 1.1.4 β-oxidation of fatty acids and energy production .................................6
1.2 Overview of aquaculture in Europe and the world ........................................7
1.2.1 General..................................................................................................7 1.2.2 Atlantic salmon .....................................................................................7 1.2.3 Rainbow trout .......................................................................................9 1.2.4 Atlantic cod.........................................................................................11 1.2.5 Current and future status of aquaculture.............................................13
1.3 Fish meal and fish oil in fish feeds ..............................................................14
1.3.1 General................................................................................................14 1.3.2 Raw material sources and production.................................................14 1.3.3 Nutritional properties..........................................................................15 1.3.4 Organic contaminants and human nutrition and health issues............16 1.3.5 Current and future production, consumption and demand .................16 1.3.6 Replacement of fish meal and fish oil ................................................22
1.4 Sustainable alternatives to fish meal and fish oil.........................................22
1.4.1 Substitution with plant alternatives.....................................................22 1.4.2 Challenges and limitations..................................................................23
1.4.2.1 Growth performance...............................................................23 1.4.2.2 Quality of the final product and implications for human
nutrition ..................................................................................24

viii
1.4.2.3 Antinutritional factors.............................................................25
1.4.3 Palm oil in rainbow trout diets............................................................25 1.4.4 Rapeseed oil in Atlantic salmon feeds................................................26 1.4.5 Soybean meal in Atlantic cod diets.....................................................28 1.4.6 Energy dense / High lipid diets...........................................................29
1.5 General objectives........................................................................................31
Chapter 2. General Materials and Methods...............................................................32
2.1 Materials ......................................................................................................33 2.2 Experimental diets .......................................................................................33
2.3 Experimental animals and husbandry ..........................................................34
2.4 Sampling procedures....................................................................................34
2.4.1 Feed sampling .....................................................................................34 2.4.2 Fish sampling......................................................................................34
2.5 Proximate analysis of diets, tissues and faeces............................................36
2.5.1 Moisture ..............................................................................................36 2.5.2 Freeze drying ......................................................................................36 2.5.3 Crude protein ......................................................................................37 2.5.4 Acid hydrolysis ...................................................................................38 2.5.5 Crude fat .............................................................................................38 2.5.6 Ash ......................................................................................................39 2.5.7 Gross energy .......................................................................................39 2.5.8 Yttrium oxide (Y2O3)..........................................................................40
2.6 Lipid extraction and analysis .......................................................................40
2.6.1 Total lipid extraction of diets, tissues and faeces ...............................40 2.6.2 Preparation and purification of fatty acid methyl esters .....................41 2.6.3 Separation and identification of fatty acid methyl esters....................42
2.7 β-oxidation capacity.....................................................................................43 2.8 Calculations..................................................................................................44
2.9 Statistics .......................................................................................................46
Chapter 3. Effects of dietary crude palm oil on rainbow trout (Oncorhynchus
mykiss) .........................................................................................................48
3.1 Introduction..................................................................................................49 3.2 Materials and methods .................................................................................51
3.2.1 Fish and facilities ................................................................................51

ix
3.2.2 Experimental feeds and feeding..........................................................51 3.2.3 Sampling procedure ............................................................................52 3.2.4 Proximate analysis ..............................................................................52 3.2.5 Lipid extraction and fatty acid analyses .............................................53 3.2.6 Calculations and statistical analysis....................................................53
3.3 Results..........................................................................................................53
3.3.1 Diet proximate and fatty acid composition.........................................53 3.3.2 Growth performance ...........................................................................54 3.3.3 Whole body proximate composition...................................................55 3.3.4 Tissue fatty acid compositions............................................................55
3.3.4.1 Muscle fatty acid composition................................................55 3.3.4.2 Liver fatty acid composition...................................................56 3.3.4.3 Gill fatty acid composition .....................................................57 3.3.4.4 Heart fatty acid composition...................................................58 3.3.4.5 Kidney fatty acid composition................................................58
3.4 Discussion ....................................................................................................69
3.4.1 Growth performance ...........................................................................69 3.4.2 Body composition ...............................................................................70 3.4.3 Tissue fatty acid composition .............................................................71
3.5 Conclusions..................................................................................................74
Chapter 4. Dietary protein / lipid ratio and rapeseed oil interactions in
Atlantic salmon – I .....................................................................................75
4.1 Introduction..................................................................................................76 4.2 Materials and methods .................................................................................78
4.2.1 Fish and culture conditions .................................................................78 4.2.2 Experimental diets ..............................................................................78 4.2.3 Sampling procedure ............................................................................79 4.2.4 Proximate analysis ..............................................................................80 4.2.5 Lipid extraction and fatty acid analyses .............................................80 4.2.6 Calculations and statistical analysis....................................................81
4.3 Results..........................................................................................................81
4.3.1 Growth performance and feed efficiency ...........................................81 4.3.2 Proximate composition of whole body ...............................................82 4.3.3 Fatty acid composition of diets and tissues ........................................82
4.4 Discussion ....................................................................................................90
4.4.1 Growth performance ...........................................................................90

x
4.4.2 Whole body proximate composition...................................................91 4.4.3 Tissue fatty acid composition .............................................................93
4.5 Conclusions..................................................................................................95
Chapter 5. Dietary protein / lipid ratio and rapeseed oil interactions in
Atlantic salmon – II ...................................................................................96
5.1 Introduction..................................................................................................97 5.2 Materials and methods .................................................................................99
5.2.1 Fish and culture conditions .................................................................99 5.2.2 Experimental diets and feeding.........................................................100 5.2.3 Sampling procedure ..........................................................................101 5.2.4 Proximate analysis ............................................................................102 5.2.5 Lipid extraction and fatty acid analyses ...........................................102 5.2.6 Peroxisomal β-oxidation capacity.....................................................102 5.2.7 Calculations and statistical analysis..................................................103
5.3 Results........................................................................................................103
5.3.1 Diet proximate and fatty acid composition.......................................103 5.3.2 Growth ..............................................................................................104 5.3.3 Apparent nutrient digestibility ..........................................................105 5.3.4 FA apparent digestibility ..................................................................106 5.3.5 Whole body proximate composition.................................................108 5.3.6 Tissue fatty acid compositions..........................................................109 5.3.7 Peroxisomal β-oxidation capacity.....................................................110
5.4 Discussion ..................................................................................................125
5.4.1 Growth performance .........................................................................125 5.4.2 Nutrient and fatty acid digestibility ..................................................127 5.4.3 Whole body proximate composition.................................................130 5.4.4 Tissue fatty acid composition ...........................................................131 5.4.5 Peroxisomal β-oxidation capacity.....................................................133
5.5 Conclusions................................................................................................135
Chapter 6. Effects of dietary full fat soy bean meal inclusion on Atlantic cod
(Gadus morhua) ........................................................................................136
6.1 Introduction................................................................................................137 6.2 Materials and methods ...............................................................................140
6.2.1 Fish and culture conditions ...............................................................140 6.2.2 Experimental diets and feeding.........................................................140

xi
6.2.3 Sampling procedure ..........................................................................141 6.2.4 Proximate analysis ............................................................................141 6.2.5 Total lipid fatty acid analyses ...........................................................142 6.2.6 Statistical analysis.............................................................................142
6.3 Results........................................................................................................143
6.3.1 Diets ..................................................................................................143 6.3.2 Growth performance .........................................................................144 6.3.3 Whole body proximate composition.................................................144 6.3.4 Tissue fatty acid composition ...........................................................145
6.4 Discussion ..................................................................................................157
6.4.1 Growth performance .........................................................................157 6.4.2 Whole body proximate composition.................................................158 6.4.3 Tissue fatty acid compositions..........................................................159
6.5 Conclusions................................................................................................162
Chapter 7. General Discussion, Conclusions and Future Perspectives .................163
7.1 General.......................................................................................................164 7.2 Growth, feed utilization and nutrient and fatty acid digestibility ..............164
7.3 Whole body proximate composition..........................................................168
7.4 Tissue fatty acid composition ....................................................................169
7.5 General conclusions ...................................................................................171
7.6 Future perspectives ....................................................................................173
References.....................................................................................................................175 Appendix. Publications and presentations from the project .........................................188
xii
List of Tables
Table 3.1. Feed formulations and proximate compositions (% of wet weight) of the experimental diets ....................................................................................60
Table 3.2. Fatty acid composition (% of total fatty acids) of the experimental diets................................................................................................................61
Table 3.3. Growth and performance of rainbow trout fed the experimental diets for 4 and 10 weeks .........................................................................................62
Table 3.4. Whole body proximate composition (g 100g-1, dry weight) of rainbow trout fed experimental palm oil diets for 4 and 10 weeks..............................63
Table 3.5. Total lipid (mg lipid g-1 tissue) and fatty acid compositions (% by weight of total fatty acids) of muscle from rainbow trout fed the experimental diets for 10 weeks ....................................................................64
Table 3.6. Total lipid (mg lipid g-1 tissue) and fatty acid compositions (% by weight of total fatty acids) of liver from rainbow trout fed the experimental diets for 10 weeks ....................................................................65
Table 3.7. Total lipid (mg lipid g-1 tissue) and fatty acid compositions (% by weight of total fatty acids) of gills from rainbow trout fed the experimental diets for 10 weeks ....................................................................66
Table 3.8. Total lipid (mg lipid g-1 tissue) and fatty acid compositions (% by weight of total fatty acids) of heart from rainbow trout fed the experimental diets for 10 weeks ....................................................................67
Table 3.9. Total lipid (mg lipid g-1 tissue) and fatty acid compositions (% by weight of total fatty acids) of kidney from rainbow trout fed the experimental diets for 10 weeks ....................................................................68
Table 4.1. Feed components and proximate compositions (g kg-1) of the six experimental diets ..........................................................................................84
Table 4.2. Fatty acid compositions (% by weight of total fatty acids) of the six experimental diets ..........................................................................................85
Table 4.3. Growth and performance of Atlantic salmon fed the experimental diets for 12 weeks...................................................................................................86
Table 4.4. Proximate composition (g kg-1 of wet weight) of whole body from Atlantic salmon fed the experimental diets for 12 weeks..............................87
Table 4.5. Total lipid (mg lipid g-1 tissue) and fatty acid compositions (% by weight of total fatty acids) of muscle from Atlantic salmon fed the experimental diets for 12 weeks ....................................................................88

xiii
Table 4.6. Total lipid (mg lipid g-1 tissue) and fatty acid compositions (% by weight of total fatty acids) of liver from Atlantic salmon fed the experimental diets for 12 weeks ....................................................................89
Table 5.1. Feed formulations and proximate compositions (g kg-1) of the experimental diets ........................................................................................112
Table 5.2. Fatty acid compositions (% by weight of total fatty acids) of the experimental diets ........................................................................................113
Table 5.3. Growth and performance of Atlantic salmon fed the six experimental diets for 10 weeks ........................................................................................114
Table 5.4. Apparent nutrient and energy digestibility (%) in Atlantic salmon fed the six experimental diets for 10 weeks.......................................................115
Table 5.5. Apparent fatty acid digestibility (%) in Atlantic salmon fed the six experimental diets for ten weeks .................................................................116
Table 5.6. Proximate composition (% of wet weight) of whole body from Atlantic salmon fed the experimental diets for 10 weeks............................119
Table 5.7. Total lipid (mg lipid g-1 tissue) and fatty acid compositions (% by weight of total fatty acids) of muscle from Atlantic salmon fed the experimental diets for 10 weeks ..................................................................120
Table 5.8. Total lipid (mg lipid g-1 tissue) and fatty acid compositions (% by weight of total fatty acids) of liver from Atlantic salmon fed the experimental diets for 10 weeks ..................................................................121
Table 5.9. Differences (Δ)1 between diet and muscle fatty acid concentrations2 for the six experimental treatments..............................................................122
Table 5.10. Differences (Δ)1 between diet and liver fatty acid concentrations2 for the six experimental treatments ...................................................................123
Table 5.11. Peroxisomal β-oxidation capacity (pmol/min/mg protein) of liver, red and white muscle from Atlantic salmon fed the experimental diets for 10 weeks ......................................................................................................124
Table 6.1. Feed ingredients and analysed feed composition (g kg-1) ...........................148
Table 6.2. Fatty acid compositions (% by weight of total fatty acids) of the experimental diets ........................................................................................149
Table 6.3. Growth and performance of cod fed the experimental diets for 12 weeks ...........................................................................................................150
Table 6.4. Proximate composition (% of wet weight) of whole body from Atlantic cod fed the experimental diets for 12 weeks..................................151
Table 6.5. Total lipid (mg lipid g-1 tissue) and fatty acid compositions (% by weight of total fatty acids) of muscle from cod fed the experimental diets for 12 weeks ........................................................................................152

xiv
Table 6.6. Total lipid (mg lipid g-1 tissue) and fatty acid compositions (% by weight of total fatty acids) of liver from cod fed the experimental diets for 12 weeks.................................................................................................153
Table 6.7. Correlation coefficients (r), slopes, Y-axis intercepts, F and P values from plots of dietary fatty acid concentrations vs. muscle fatty acid concentrations for cod fed the four experimental diets, including the difference (Δ)1 between diet and muscle fatty acid values for the FFS0 or the FFS36 groups2 ...................................................................................154
Table 6.8. Correlation coefficients (r), slopes, Y-axis intercepts, F and P values from plots of dietary fatty acid concentrations vs. liver fatty acid concentrations for cod fed the four experimental diets, including the difference (Δ)1 between diet and liver fatty acid values for the FFS0 or the FFS36 groups2........................................................................................154

xv
List of Figures
Figure 1.1. Pathways of desaturation and elongation of C18 FA to HUFA.......................5
Figure 1.2. Total aquaculture production for Atlantic salmon from 1984 to 2004 including the production of the major producing countries...........................8
Figure 1.3. Total aquaculture production for Rainbow trout from 1974 to 2004 including the production of the major producer countries...........................10
Figure 1.4. Total aquaculture production of Atlantic cod from 1984 to 2004 including the production of the major producing countries.........................12
Figure 1.5. Total fisheries capture for the top pelagic fish species destined for FM and FO production from 1984 to 2004 including capture amounts for each species..................................................................................................17
Figure 1.6. Global production of fish meal and fish oil from 1984 to 2004...................19
Figure 1.7. Estimated use of fishmeal and fish oil in animal and aquaculture feeds in 2002 and 2012..........................................................................................20
Figure 1.8. Estimated global use of fishmeal and fish oil in aquafeeds in 2003 by major species................................................................................................21
Figure 5.1. Means of the ADC of DM (a), Energy (b), protein (c) and fat (d), for the six experimental diets, in a two-way ANOVA, showing the effects of the two factors and their interaction...........................................117
Figure 5.2. Means of the ADC of individual fatty acids, 16:0 (a), total saturated (b), 16:1n-7 (c), 18:1n-9 (d) total monoenes (e), and total n-6 PUFA (e), of the six experimental diets, in a two-way ANOVA, showing the effects of the two factors and their interaction...........................................118
Figure 5.3. Means of the peroxisomal β-oxidation capacity (pmol/min/mg protein) of white muscle from Atlantic salmon fed the six experimental diets, in a two-way ANOVA, showing the effects of the two factors and their interaction. ...............................................................124
Figure 6.1. Relationship between dietary fatty acids concentrations and muscle fatty acids concentrations of 18:2n-6 (a), 18:3n-3 (b), 18:1n-9 (c), 22:1 (d), 20:5n-3 (e), 22:6n-3 (f) in total lipids of cod fed diets containing increasing levels of full fat soybean meal (FFS)......................155
Figure 6.2. Relationship between dietary fatty acids concentrations and liver fatty acids concentrations of 18:2n-6 (a), 18:3n-3 (b), 18:1n-9 (c), 22:1 (d), 20:5n-3 (e), 22:6n-3 (f) in total lipids of cod fed diets containing increasing levels of full fat soybean meal (FFS) .......................................156

Chapter 1. General Introduction

CHAPTER 1. GENERAL INTRODUCTION
2
1.1 Lipids in fish nutrition
1.1.1 General
Lipids are, along with proteins, the major organic components of fish and in
most cases of their feeds, also; carbohydrates are, at least quantitatively, less important.
In fish, the lipids and their constituent fatty acids (FA) along with their metabolic
derivatives, such as the eicosanoids, play significant roles in various functions of the
organism, including growth, health, reproduction etc (Sargent, et al., 2002; Tocher,
2003). Dietary lipids provide energy and essential fatty acids (EFA) to the fish and they
also assist the absorption of fat-soluble vitamins (NRC, 1993). Lipids are of great
importance not only to fish nutrition but also to human nutrition. It is well documented
that the n-3 highly unsaturated fatty acids (HUFA) have numerous beneficial effects on
human health and, undoubtedly, fish constitute the best sources of these nutrients in
human diets (De Deckere, et al., 1998; Simopoulos, 1999; ISSFAL, 2000; Simopoulos,
2000; Simopoulos, 2003).
1.1.2 Lipids and fatty acids – a brief overview
Lipids can be classified into several groups or “lipid classes”, with distinctive
properties, functions and roles. The main lipid classes in fish tissues and their feeds are
triacylglycerols (TAG), phosphoglycerides or phospholipids (PL), sphingolipids, sterols
(mainly cholesterol) and wax esters (Sargent, et al., 2002). TAG are a major class of the
neutral lipids and consist of three fatty acids esterified in the sn-1, sn-2 and sn-3
positions of L-glycerol, usually saturated or monounsaturated FA located in the sn-1
and sn-3 and PUFA in sn-2 (Sargent, et al., 2002). TAG is the main form in which

CHAPTER 1. GENERAL INTRODUCTION
3
lipids are stored in fish tissues. Specifically, in most fish species, including salmonids,
the primary storage sites are the mesenteric adipose tissue, the adipose tissue within the
white muscle and to a smaller extent the liver, although the latter can be the major lipid
storage site for many marine fish species (Zhou, et al., 1995, 1996; Nanton, et al.,
2007). The gadoids, which includes Atlantic cod, store large amounts of lipid (up to
70% w/w) in their livers (Henderson and Tocher, 1987; Tocher, 2003). PL are a major
class of polar lipids and consist of two fatty acids esterified to L-glycerol 3-phosphate,
the two FA usually being saturated or monounsaturated in the sn-1 position and PUFA
in the sn-2 position (Sargent, et al., 2002). PL, along with their constituent FA are
essential structural components of cellular membranes and play a significant role in
their functions and properties (Henderson and Tocher, 1987; Sargent, et al., 2002;
Tocher, 2003).
The FA are major constituents of the lipid classes mentioned above (apart from
cholesterol). The FA found in fish lipids contain a single carboxyl group and a straight
carbon chain, ranging from 14 to 24 carbon atoms, predominantly with even carbon
numbers. Depending on the degree of unsaturation, they are classified as saturated and
unsaturated FA, with the latter being further divided into monounsaturated or monoenes
(one double bond), and polyunsaturated FA with two or more double bonds (PUFA). In
fish, the double bonds are largely in the cis configuration and in most cases interrupted
by a methylene group. Lastly, the position of the double bonds, and especially the
position of the first double bond in relation to the methyl terminus, is of great
significance. Hence, two major PUFA families occur, i.e. the n-3 and the n-6, where the
first double bond is in the third and the sixth carbon atom from the methyl end,
respectively. PUFA with carbon chain lengths of more than 20 carbon atoms with three
CHAPTER 1. GENERAL INTRODUCTION
4
or more double bonds are defined as highly unsaturated fatty acids (HUFA) (Sargent, et
al., 2002).
The FA may be found under a variety of names including trivial and systematic
names, names using the Δ nomenclature and shorthand abbreviations or “n” (or “ω”)
nomenclature. The latter has proved popular in biology and nutrition and is used in the
present study. Briefly, it consists of the number of carbon atoms, the number of double
bonds and the position of the first double bond counting from the terminal methyl
group, allowing the entire structure to be defined since the double bonds are interrupted
by methylene groups in cis configuration. For example, stearic acid is designated as
18:0, oleic acid as 18:1n-9, α-linolenic acid as 18:3n-3, linoleic as 18:2n-6,
eicosapentaenoic (EPA) as 20:5n-3, docosahexaenoic (DHA) as 22:6n-3 etc.
1.1.3 Biosynthesis of fatty acids
Fish, like all known organisms, can synthesize de novo the saturated FA 16:0
and 18:0 (Sargent, et al., 2002). The fatty acid synthesis occurs in cytoplasm utilizing
acetyl-CoA and involving the oxidation of NADPH. The pathway is catalyzed by the
fatty acid synthase (FAS). From the endogenously synthesized FA, 16:0 and 18:0, fish
can then produce 16:1n-9 and 18:1n-9, respectively (Figure 1.1). The desaturation is
carried out by the microsomal Δ9 desaturase. The desaturases, including Δ4, Δ5, Δ6 and
Δ9 desaturase, introduce double bonds in the 4th, 5th, 6th, and 9th carbon atom counting
from the carboxylic end, respectively. It should be noted that there is no evidence for
existence of a Δ4 desaturase in fish but the final step in the desaturation pathway is
catalysed by Δ6 as shown in Figure 1.1. This second Δ6 is sometimes called Δ6*.
However, since these enzymes cannot introduce double bonds beyond C9, thus, linoleic
(18:2n-6) and linolenic (18:3n-3) acids cannot be synthesized. Hence, these FA are
CHAPTER 1. GENERAL INTRODUCTION
5
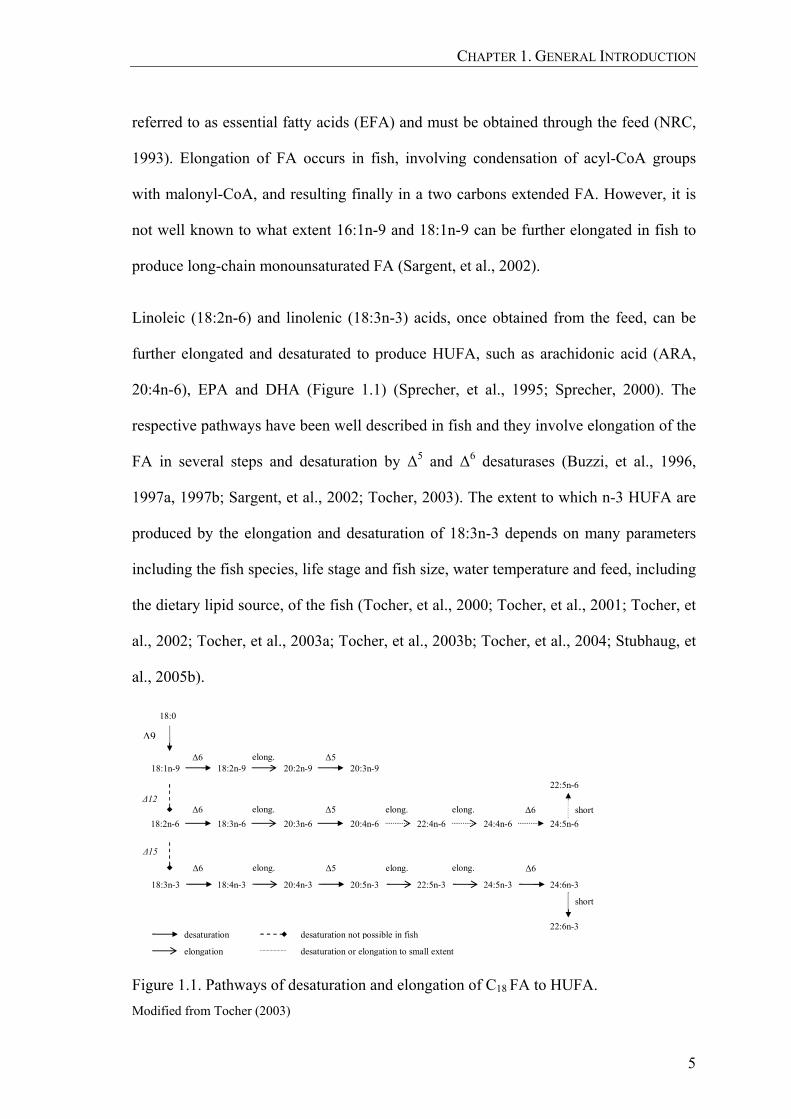
referred to as essential fatty acids (EFA) and must be obtained through the feed (NRC,
1993). Elongation of FA occurs in fish, involving condensation of acyl-CoA groups
with malonyl-CoA, and resulting finally in a two carbons extended FA. However, it is
not well known to what extent 16:1n-9 and 18:1n-9 can be further elongated in fish to
produce long-chain monounsaturated FA (Sargent, et al., 2002).
Linoleic (18:2n-6) and linolenic (18:3n-3) acids, once obtained from the feed, can be
further elongated and desaturated to produce HUFA, such as arachidonic acid (ARA,
20:4n-6), EPA and DHA (Figure 1.1) (Sprecher, et al., 1995; Sprecher, 2000). The
respective pathways have been well described in fish and they involve elongation of the
FA in several steps and desaturation by Δ5 and Δ6 desaturases (Buzzi, et al., 1996,
1997a, 1997b; Sargent, et al., 2002; Tocher, 2003). The extent to which n-3 HUFA are
produced by the elongation and desaturation of 18:3n-3 depends on many parameters
including the fish species, life stage and fish size, water temperature and feed, including
the dietary lipid source, of the fish (Tocher, et al., 2000; Tocher, et al., 2001; Tocher, et
al., 2002; Tocher, et al., 2003a; Tocher, et al., 2003b; Tocher, et al., 2004; Stubhaug, et
al., 2005b).
18:2n-6
18:0
Δ9
18:1n-9
Δ15
18:3n-3
18:2n-9 20:2n-9 20:3n-9Δ6 elong. Δ5
Δ12
18:3n-6 20:3n-6 20:4n-6Δ6 Δ5elong.
22:4n-6 24:4n-6 24:5n-6 elong. elong. Δ6
18:4n-3 20:4n-3 20:5n-3 22:5n-3 24:5n-3 24:6n-3
Δ6 Δ5 elong. Δ6elong. elong.
22:5n-6
22:6n-3
short
short
desaturation
elongation
desaturation not possible in fish
desaturation or elongation to small extent
Figure 1.1. Pathways of desaturation and elongation of C18 FA to HUFA. Modified from Tocher (2003)
CHAPTER 1. GENERAL INTRODUCTION
6
1.1.4 β-oxidation of fatty acids and energy production
As mentioned previously, one of the major roles of lipids and specifically of
their constituent FA in all organisms, including fish, is to provide energy. The
metabolic energy is provided by the catabolism of the FA via β-oxidation occurring
mainly in the inner space of the mitochondria (matrix) or in the peroxisomes. As the
name reveals, the β-oxidation process involves the sequential removal of 2-carbon units
by oxidation at the β-carbon position of the fatty acyl-CoA molecule. Each cycle of β-
oxidation generates one mole of NADH, one mole of FADH2 and one mole of acetyl-
CoA. After further oxidation of the acetyl-CoA to CO2 in the tricarboxylic acid cycle
three moles of NADH, one mole of FADH2 and one mole of ATP are produced.
It is well documented that specific FA are preferentially utilized via β-oxidation
in fish; specifically saturated and monounsaturated FA, such as 16:0 18:1n-9, 20:1n-9
and 22:1n-11 are readily catabolized, whereas EPA is usually oxidized to a lesser extent
and DHA is mainly retained in tissues rather than catabolized (Henderson, 1996;
Sargent, et al., 2002; Tocher, 2003). However, Stubhaug et al. (2005a; 2005b)
demonstrated that EPA and DHA are still significant substrates for β-oxidation,
especially when present to excess as is the case in fish oils (FO). Hence, feeding the fish
with different oils, for example replacing FO with vegetable oils (VO), may affect their
β-oxidation activity, while other factors, such as the size of the fish or the water
temperature, are also of importance (Tocher, et al., 2002; Tocher, et al., 2004;
Torstensen and Stubhaug, 2004; Stubhaug, et al., 2005a; Stubhaug, et al., 2005b).

CHAPTER 1. GENERAL INTRODUCTION
7
1.2 Overview of aquaculture in Europe and the world
1.2.1 General
Numerous fish species are cultured in Europe and throughout the world.
However, the most important species in European aquaculture are Atlantic salmon
(Salmo salar Linnaeus, 1758) and rainbow trout (Oncorhynchus mykiss Walbaum,
1792), accounting for more than 80% of the total European production (Failler, 2006),
although it is noteworthy that they are of great importance for other, non-European,
countries, also. Moreover, the introduction and expansion of new species and cultures is
important for the development and the long term viability of the sector. Culture of
Atlantic cod (Gadus morhua Linnaeus, 1758) is a fairly new but fast growing in
Europe. Under that perspective the present study focused on these three species.
1.2.2 Atlantic salmon
The farming of Atlantic salmon is a relatively new aquaculture activity, starting
in Norway in the 1960’s (FAO, 2004b). In the late 1970’s Atlantic salmon culture
started growing steadily and in the 1990’s this growth was rapid, as it is clearly
demonstrated in Figure 1.2. In 2004 the global production was more than 1.2 million
tonnes and its value was more than 4 billion (4.09 x 10⁹) US$ (FAO, 2007a). The major
producing countries, apart from Norway, include Scotland (UK), Faeroe Islands,
Ireland, Chile, Canada, USA and Australia.

CHAPTER 1. GENERAL INTRODUCTION
8
0
200
400
600
800
1000
1200
1400
1984 1988 1992 1996 2000 2004
Prod
uctio
n (t)
(x 1
000)
AustraliaCanadaUSAChileIrelandFaeroe IslandsUKNorwayWorld (Total)Europe (Total)
Figure 1.2. Total aquaculture production for Atlantic salmon from 1984 to 2004
including the production of the major producing countries (Source: FAO, 2007a)
Atlantic salmon belongs to the family of Salmonidae (Salmonids) and is an
anadromous species, which in the wild is found on both European and North American
sides of the North Atlantic (FAO, 2004b). The spawning and smoltification take place
in freshwater and is followed by an ongrowing period at sea. During the ongrowing
period, which can take up to 4 years, wild Atlantic salmon feed on pelagic species such
as herring, sprat and squid (FAO, 2004b). In culture, Atlantic salmon are reared in
freshwater facilities to the fingerling or smolt stage and then they are transferred to
seawater where fish are ongrown in sea cages (Purser and Forteath, 2003). The
ongrowing phase can be up to two years until the fish reach the desired market size,
which may vary from 2 to 6kg (FAO, 2004b).
Ongrowing Atlantic salmon are fed with pelleted, extruded diets in varying sizes
(diameter of the pellet) depending on the size of the fish (Helland, et al., 1991; NRC,
1993; Lovell, 2002). The diets of Atlantic salmon contain fish meal FM and FO,

CHAPTER 1. GENERAL INTRODUCTION
9
traditionally used as the main sources of protein and lipid, respectively, although other
protein and lipid sources of plant or rarely of animal origin, grain derived products for
binding and micronutrient premixes are also included (Helland, et al., 1991; NRC,
1993; Lovell, 2002; FAO, 2004b). Atlantic salmon feeds contain high amounts of
protein, lipid and energy (Helland, et al., 1991; Lovell, 2002). However, the trend over
the last 20 years has been to increase the dietary lipid level at the expense mainly of
protein but also of carbohydrates (Einen and Roem, 1997; Hillestad, et al., 1998;
Lovell, 2002; FAO, 2004b; Solberg, 2004). Currently, Atlantic salmon diets contain up
to 400 g kg-1 of lipid although these levels may vary significantly between the
producing countries (Solberg, 2004). In general, Atlantic salmon can use dietary protein
and lipids for energy very efficiently but the use of carbohydrates is poor (Lovell,
2002). Regarding the essential fatty acid (EFA) requirements of Atlantic salmon, it is
surprising that they have not been defined yet; however, it has been suggested that they
would be about 1.0% of 18:3n-3 or 0.5 – 1.0% of n-3 HUFA although 18:2n-6 may also
be needed for optimal growth (Sargent, et al., 2002). Lastly, feed additives such as
pigments (carotenoids), either synthetic or natural, are usually included in the diets to
produce the characteristic salmon pink flesh pigmentation (NRC, 1993; Purser and
Forteath, 2003).
1.2.3 Rainbow trout
Rainbow trout also belong to the family of Salmonidae (Salmonids) and is one
of the oldest fish species to be farmed successfully in Europe and North America. It is a
native species to the Pacific drainages of North America, however, since more than 200
years ago, it has been introduced to all continents apart from Antarctica (FAO, 2005a).
The aquaculture production of rainbow trout has grown rapidly from the 1950’s and in

CHAPTER 1. GENERAL INTRODUCTION
10
the last 30 years it has increased 5-fold as shown clearly in Figure 1.3 (FAO, 2007a). In
2004 the global production was 504,876 tonnes with a total value of almost 1.7 billion
(1.69 x 10⁹) US$ (FAO, 2007a). Figure 1.3 shows that the major producing countries
include UK, Norway, France, Italy, Spain, Denmark, Germany, USA, Chile and lately
Iran. It is noteworthy that Europe is the biggest producer of rainbow trout, producing
more than half of the global production in 2004.
0
100
200
300
400
500
600
1974 1980 1986 1992 1998 2004
Prod
uctio
n (t)
(x 1
000)
IranChileUSAUKGermanyDenmarkSpainItalyFranceNorwayWorld (Total)Europe (Total)
Figure 1.3. Total aquaculture production for Rainbow trout from 1974 to 2004
including the production of the major producer countries (Source: FAO, 2007a)
Rainbow trout is a fast growing fish which can tolerate variable environmental
conditions and husbandry techniques and ranges from anadromous to freshwater strains

CHAPTER 1. GENERAL INTRODUCTION
11
(FAO, 2005a). In the wild, the natural feed of rainbow trout may vary widely from
plankton for fry, to insects, crustaceans and even small fish for larger trout (Cho and
Cowey, 1991; FAO, 2005a). In aquaculture, the feeding and nutrition of rainbow trout
is to a great extent similar to that of Atlantic salmon. Specifically, the diets for trout are
usually extruded and varying in size (diameter of the pellet) depending on the size of
the fish, with high protein, lipid and energy content, while the main ingredients include
FM and FO along with other protein and lipid sources (usually of plant origin), grains
and micronutrient premixes (Cho and Cowey, 1991; NRC, 1993; Lovell, 2002; FAO,
2005a). Such diets are utilized by the fish very efficiently, often at feed conversion
ratios (FCR) of 1 (FAO, 2005a). Rainbow trout dietary requirements for EFA are about
0.7-1% of dry diet for 18:3n-3 and 0.4-0.5% for n-3 HUFA (NRC, 1993; Sargent, et al.,
2002).
1.2.4 Atlantic cod
The intensive culture of Atlantic cod is a fairly recent achievement of
aquaculture, beginning in Canada and Norway in the mid 1980’s. However, as shown in
Figure 1.4, in this relatively short time, the culture of Atlantic cod has grown rapidly
increasing from 169 t in 2000 to 3,812 t in 2004 with a total value of global production
in 2004 of 13 million (0.13 x 10⁶) US$ (FAO, 2007a). After 1990, Atlantic cod is
intensively produced only in European countries. Norway is the major producing
country, accounting for 83% of the global production, while Iceland and, to a much
lesser extent, UK are also contributing to the Atlantic cod culture (FAO, 2007a).

CHAPTER 1. GENERAL INTRODUCTION
12
0
500
1000
1500
2000
2500
3000
3500
4000
4500
1984 1988 1992 1996 2000 2004
Prod
uctio
n (t)
IcelandUKNorwayCanadaWorld (Total)
Figure 1.4. Total aquaculture production of Atlantic cod from 1984 to 2004 including
the production of the major producing countries (Source: FAO, 2007a)
Atlantic cod belong to the family of Gadidae. In the wild they are distributed
throughout the northern Atlantic, the Baltic sea, and the Barents sea (FAO, 2001). It is a
voracious and omnivorous species and its feed consists of plankton for larvae and post-
larvae, invertebrates for juveniles, and invertebrates and fish for larger fish, with fish
becoming more important than crustaceans in the diet of larger individuals (FAO,
2001). In aquaculture, Atlantic cod is fed extruded diets with high protein / low oil
content, and has a high dependence on marine FM and FO (Lie, et al., 1988; Morais, et
al., 2001; Lall and Nanton, 2002; Rosenlund, et al., 2004; Karlsen, et al., 2006).
However, compared to other species little is yet known about the nutrition and feeding
of Atlantic cod, including its nutritional requirements. Atlantic cod in larval and
juvenile stages require about 1% (of dry diet) of DHA however, for older fish the
requirements for EFA have yet to be defined quantitatively (Sargent, et al., 2002).
CHAPTER 1. GENERAL INTRODUCTION
13
1.2.5 Current and future status of aquaculture
The growth of world aquaculture has been rapid during the last fifty years
increasing by approximately 10% per annum in the last decade (Brugère and Ridler,
2004). In the early 1950s, the total global production (including aquatic plants) was less
than a million tonnes, whereas in 2004 it was 59.4 million tonnes at a value of 70.3
billion US$ (FAO, 2007a). The aquaculture fin fish production grew from less than half
a million tonnes in 1950 to 28.2 million tonnes in 2004 with a value of almost 38 billion
US$ (FAO, 2007a). Although, much of this growth is due to the very large increase in
China’s aquaculture production, it should be noted that the increase in the world
aquaculture production, if China is excluded, has also been significant and about 6%
per annum from 1970-2000 (Brugère and Ridler, 2004).
It has been estimated that the growth of aquaculture will continue over
forthcoming decades as the demand for and the consumption of aquaculture products
increases (Delgado, et al., 2003; Brugère and Ridler, 2004; Failler, 2006; FAO, 2006b).
Specifically, by 2020 global aquaculture will expand by 1.9%, while the highest output
forecast is to increase by 3.3% (Brugère and Ridler, 2004). The growth for the 15
members of the pre-2004 European Union between 2000 and 2020 is similar to that of
the world’s estimated growth, however Norway’s aquaculture production (based on
salmonids) is estimated to increase at a much higher rate of 6.3% (Brugère and Ridler,
2004). Regarding the production of the species in focus in the present study, both
salmonids and cod output is expected to rise significantly over forthcoming decades,
although no specific data are available for cod production at the present time (Brugère
and Ridler, 2004).
CHAPTER 1. GENERAL INTRODUCTION
14
1.3 Fish meal and fish oil in fish feeds
1.3.1 General
FM is a protein-rich light brown flour or meal derived from processing
(cooking, pressing, drying, grinding) fresh raw fish (usually small pelagic fish not
suitable as food fish or bycatch) and residues and by-products from fish processing
plants (fish offal or fish trimmings) (FIN, 2006c; FAO, 2007b). FM have been used in
animal nutrition for many centuries (Hertrampf and Piedad-Pascual, 2000). Today, FM
is mainly used in feeds for domestic livestock (poultry, pigs, cattle, etc.) and in
aquaculture feeds, largely for carnivorous aquatic species and is also used as a taste
attractant for omnivorous and herbivorous species (FAO, 2007b). There are four
different products sold as FM: “High quality” which is usually used for small-scale
aquaculture units (trout farms) or marine species, “LT (low temperature)” which is
highly digestible and used in salmon and piglet production, “Prime” and “Fair Average
Quality (FAQ)” which is a lower protein content feed ingredient for pigs and poultry
(FIN, 2006c).
The oil obtained from the total fish body or from fish waste by extraction is
called FO (FAO, 2007b). FO are used in the food industry, e.g. for the manufacture of
edible fats, in feeds for terrestrial and aquatic animals, and in industrial products
(Hertrampf and Piedad-Pascual, 2000; FAO, 2007b).
1.3.2 Raw material sources and production
The sources of FM and FO include a variety of fish species and may be fish
caught for the sole purpose of FM production, by-catches from another fishery, or fish

CHAPTER 1. GENERAL INTRODUCTION
15
trimmings/offals from the food fish processing industry (FAO, 1986). The fish species
that are commonly used for the production of FM and FO include anchovies, blue-
whiting, herrings, mackerels, capelin, pilchard, menhaden, sardines, sandeel, Norway
pout, sprat, cod and others (Hertrampf and Piedad-Pascual, 2000; Tacon, 2005; FIN,
2006a). These fish can be divided into three categories in terms of their potential use for
human consumption: fish that are not suitable for human consumption, like sandeel and
Norway pout; fish with potential use for human consumption but mainly used for
fishmeal, like blue whiting, sprat and capelin; and fish that are primarily intended for
human consumption but any surplus within the Total Allowable Catch (TAC) may be
used for fishmeal, e.g. herring and mackerel (FIN, 2006a). The process of FM and FO
production follows the principal of separating the main fractions of the raw material
(fish), that is to separate the solids from water and oil (FAO, 1986; Hertrampf and
Piedad-Pascual, 2000).
1.3.3 Nutritional properties
FM is a highly nutritious feedstuff primarily used as a high quality protein
source but also as a rich source of energy, EFA vitamins and minerals (FAO, 1986;
NRC, 1993). However, the chemical composition of different FM may vary
significantly depending on the source fish used for its production (Hertrampf and
Piedad-Pascual, 2000). For instance, the protein content ranges from less than 60% to
more than 70% in different types of FM while the fat varies from 5% to 10% (NRC,
1993). FO are an almost unique source of EFA and especially n-3 HUFA, which
comprise 10% to 25% of total FA. Moreover, FO are excellent energy sources due to
their high content of 16:0 and monoenes such as 18:1 and, in the case of N. Hemisphere
FO, 20:1 and 22:1 (NRC, 1993). Mainly due to their high nutritional value, FM and FO

CHAPTER 1. GENERAL INTRODUCTION
16
have, traditionally, been the major protein and oil sources in aquafeeds especially for
carnivorous species (Sargent and Tacon, 1999).
1.3.4 Organic contaminants and human nutrition and health issues
In recent years the contamination of FM and FO with Persistent Organic
Pollutants (POP) has been raised in the media with potential implications for fish
nutrition, to the quality of farmed fish as final products and consequently to public
health. The POPs include dioxins and furans, dioxin-like-poly-chlorinated biphenyls
(PCBs), polybrominated diphenylether flame retardants and others. Numerous studies
have reported on the levels of contaminants and their accepted limits, as regulated by
organisations such as the EU and the WHO, in FM and FO, in the farmed and wild fish,
and especially in oily fish like Atlantic salmon, herring and mackerel, as well as their
potential effects on human health (NRC, 1993; SCAN, 2000; SCF, 2001; Hendricks,
2002; Jacobs, et al., 2002a; Jacobs, et al., 2002b; Hites, et al., 2004; Lundebye, et al.,
2004; Bell, et al., 2005; Tacon, 2005; Bethune, et al., 2006; FIN, 2006b; Mozaffarian
and Rimm, 2006).
1.3.5 Current and future production, consumption and demand
As described previously (paragraph 1.3.2), the production of FM and FO mainly
relies on wild stocks and specifically on pelagic species. Since 1950, when the first data
from FAO are available, there has been a seven-fold increase in the global capture of
the pelagic species destined for production of FM and FO, with a total production for
the top pelagic species of 3.7 million tonnes in 1950 to 24.9 million tonnes for 2004
(FAO, 2007a). However, since the middle of the 1990’s, with the exception of 1998
when the El Niño-Southern Oscillation (ENSO) phenomenon occurred, the global

CHAPTER 1. GENERAL INTRODUCTION
17
fisheries capture has been relatively stable, ranging between 20 and 25 million tonnes
(FAO, 2007a). This is clearly demonstrated in Figure 1.5 presenting the fisheries
capture for the top pelagic fish species destined for FM and FO production from 1984
to 2004.
0
5
10
15
20
25
30
1984 1988 1992 1996 2000 2004
Prod
uctio
n (in
mill
ion
tone
s)
Peruvian Anchovy Japanese anchovy Blue Whiting
Sandeels Capelin Atlantic Herring
Chub mackerel Atlantic horse mackerel California pilchard
Chilean jack mackerel European pilchard European sprat
Gulf menhaden Norway pout Total
Figure 1.5. Total fisheries capture for the top pelagic fish species destined for FM and
FO production from 1984 to 2004 including capture amounts for each species (Source: FAO, 2007a)

CHAPTER 1. GENERAL INTRODUCTION
18
Moreover, it has been estimated that the resources of wild feed grade fisheries
will remain static in the next decade (Pike and Barlow, 2003). Tacon (2005, pp. 31),
summarizing the status of exploitation of the major pelagic fish stocks based on data
from FAO’s review of the state of world marine fishery resources (FAO, 2005c),
underlines that 52% of the world stocks are fully exploited and of the remaining,
approximately 17% are over exploited, 7% depleted and 1% recovering and, hence,
there is no room for further expansion. It is also noted that the catches from the fully
exploited wild stocks cannot be further expanded as they are already at, or very close to,
their maximum sustainable production limit (Tacon, 2005).
Lastly, natural phenomena have affected, in previous years, the global fisheries
capture. For instance, the El Niño – Southern Oscillation (ENSO), which occurred in
1997 – 1998, caused a dramatic decline in Southern hemisphere catches and
consequently reduced the global production as demonstrated clearly in Figure 1.5
(FAO, 2007a). The El Niño – Southern Oscillation is a periodical phenomenon and,
hence, the risk of such negative effects on fisheries in the future is apparent.
The relatively stable production of FM and FO in the last 20 years is
demonstrated in Figure 1.6. The global production of FM, that is excluding meals from
crustaceans and aquatic mammals, ranged from 5,810,228 tonnes in 1984 to 6,572,967
tonnes in 2004. The production of FO varied from 1,506,479 tonnes in 1984 to
1,085,674 tonnes in 2004. The negative effect of the El Niño in 1998 mainly on the
production of fish meal is also clearly shown.

CHAPTER 1. GENERAL INTRODUCTION
19
0
1
2
3
4
5
6
7
8
1984 1988 1992 1996 2000 2004
Prod
uctio
n (t)
(x m
illio
ns)
Fish Meal Fish Oil
Figure 1.6. Global production of fish meal and fish oil from 1984 to 2004 (Source: FAO, 2004a)
The aquaculture sector is at present the biggest consumer of FM and FO,
consuming, in 2003, about 2,936,000 tonnes of FM and 802,000 tonnes of FO (Tacon,
2005). Figure 1.7 shows the estimated use of FM and FO in animal and aquafeeds in
2002 and 2012 based on the data from the International Fishmeal and Fish Oil
Organisation (IFFO) (Pike, 2005). In 2002, aquaculture’s share for FM and FO was
estimated at 46% and 81%, respectively, and is expected to increase in the future.
Lastly, the largest proportion of the total FM and FO used in aquafeeds in 2003,
was used by salmonids as is clearly demonstrated in Figure 1.8 (Tacon, 2005).
Specifically, salmon species used 19.5% and 51% and trout species 7.4% and 15.4% of
the total FM and FO in aquafeeds, respectively. The consumption of FM and FO for
marine fish, which include Atlantic cod, is also high.

CHAPTER 1. GENERAL INTRODUCTION
20
Fish Meal Fish Oil 20
02
Poultry22%
Pigs24%
Ruminants1%
Others7%
Aquaculture46%
Aquafeed81%
Industrial5%
Edible14%
2012
Poultry15%
Others10%
Pigs25% Aquaculture
50%
Aquafeed88%
Industrial7%
Edible5%
Figure 1.7. Estimated use of fishmeal and fish oil in animal and aquaculture feeds in
2002 and 2012 (Source: Pike, 2005).

CHAPTER 1. GENERAL INTRODUCTION
21
Fish Meal
Trout 7.4%
Salmon 19.5%
Marine Fish 20.1%
Marine Shrimp 22.8%
Catfish 0.8%
Tilapia 2.7%
Freshwater Crustaceans
4.7%
Eel 5.8%
Milkfish 1.2%
Carp 14.9%
Fish Oil
Trout 15.4%
Salmon 51.2%
Marine Fish 13.8%
Carp 5.5%Milkfish 0.6%Eel 1.4%
Freshwater Crustaceans
1.7%
Tilapia 2.0%
Catfish 1.0%
Marine Shrimp 7.3%
Figure 1.8. Estimated global use of fishmeal and fish oil in aquafeeds in 2003 by major
species (Source: Tacon, 2005)

CHAPTER 1. GENERAL INTRODUCTION
22
1.3.6 Replacement of fish meal and fish oil
Clearly, aquaculture is heavily dependent on FM and FO. Specifically, there is a
strong dependence on FM and FO for the salmon and trout industry, and Atlantic cod
culture also relies to a great extent on these commodities, especially FM. Given the
estimated significant growth of aquaculture in the next decade, while the production
from wild feed grade fisheries will remain static, this could be risky and even harmful
to the viability, growth and profitability of the sector (Sargent and Tacon, 1999; Tidwell
and Allan, 2002; Pike and Barlow, 2003; Tacon, 2004; Pike, 2005). It is noteworthy
that the prices of FM and FO are projected to rise significantly by 2020 under a variety
of possible scenarios (Delgado, et al., 2003). Furthermore, other issues like the
contamination of FM and FO with organic pollutants, make the use of some FM and FO
for aquafeeds problematic. This is emphasized by the increasing international and
national demand for safer and higher quality aquatic products (FAO, 2006b). Hence,
there is a growing, pressing need for sustainable alternatives to FM and FO and for the
reduction of the dependence on FM and FO for fish feeds. In fact, the need for reducing
the FM and FO share in aquafeeds has been underlined in numerous reviews, reports
and scientific papers and it presents a considerable challenge for the future development
of aquaculture (Naylor, et al., 1998; Sargent and Tacon, 1999; Delgado, et al., 2003;
Tacon, 2005; FAO, 2006b; Trushenski, et al., 2006).
1.4 Sustainable alternatives to fish meal and fish oil
1.4.1 Substitution with plant alternatives
There are numerous protein and lipid sources with a potential use in aquafeeds
as substitutes for FM and FO, respectively, including animal by products, plant proteins
CHAPTER 1. GENERAL INTRODUCTION
23
and oils, marine products from lower trophic levels (Olsen, et al., 2004) and transgenic
plants (Robert, 2006). However, the use of ingredients of plant origin as sustainable
alternatives to marine meals and oils in aquafeeds is of great potential. Specifically,
plant ingredients have high global availability at competitive prices, compared to FM
and FO, and they have nutritional properties that can largely satisfy the nutritional
requirements of the fish (NRC, 1993). However, their use does present some problems
and several challenges have to be met before successful replacement of FM and FO,
with plant meals and oils, is achieved. These are further discussed in the following
section (1.4.2). There is a large number of plant ingredients that have been studied or
used as substitutes for FM and FO in aquafeeds; however, the studies presented in this
thesis focused on two VO and an oilseed meal, namely crude palm oil, rapeseed oil and
full fat soy bean meal, respectively.
1.4.2 Challenges and limitations
Any dietary changes using alternative plant-derived materials must ensure that
firstly, the growth of the fish is not compromised. Moreover, as feed accounts for 40-
60% of the total production cost, any negative effects on feed efficiency should also be
avoided. Lastly, the quality of the final product, including its highly beneficial
properties for human health, should not be compromised.
1.4.2.1 Growth performance
As previously described (paragraph 1.3.3), FM is a high quality protein source
providing the essential amino acids (EAA) for optimum fish growth, while both FM and
FO are excellent energy sources for fish. Hence, any reduction in the dietary levels of

CHAPTER 1. GENERAL INTRODUCTION
24
these ingredients should take into account the potential losses in macro- and micro-
nutrients and energy content (NRC, 1993).
When selecting potential VO for substituting FO in fish diets, their FA
composition must be considered. Studies investigating mitochondrial β-oxidation
suggested that saturated and monounsaturated FA are preferred over PUFA for energy
production in fish (Henderson, 1996). Hence, to minimise any reduction in growth rate,
potential substitutes for FO should provide sufficient energy in the form of the preferred
FA. Moreover, the replacement of FO with VO can be also challenging due to the fact
that VO lack the n-3 HUFA which are abundant in FO; these FA and especially EPA
and DHA are essential for optimal growth and development in salmon (Sargent, et al.,
2002). The n-3 HUFA in FO is generally around 20-30% of total lipids, while in VO
contain no HUFA and, in most cases, only moderate levels of the C18 PUFA, 18:3n-3.
On the other hand fish oils contain low levels of n-6 PUFA whereas VO are usually rich
sources of C18 PUFA (NRC, 1993; Hertrampf and Piedad-Pascual, 2000; Hardy, et al.,
2001).
1.4.2.2 Quality of the final product and implications for human nutrition
The FA composition of fish tissues reflects the FA composition of the diets
(Sargent, et al., 2002). Hence, replacement of FO with VO results in reductions of EPA,
DHA and the n-3/n-6 FA ratio, with a direct effect on the nutritional quality of the end
product (Bell, et al., 2001a; Rosenlund, et al., 2001; Bell, et al., 2003a). This is
important for the human consumer as EPA and DHA and a high n-3/n-6 FA ratio have
been associated with numerous beneficial effects for human health and any reduction of
these HUFA in farmed fish would be undesirable (De Deckere, et al., 1998; Horrocks
and Yeo, 1999; Simopoulos, 1999; Hunter and Roberts, 2000; ISSFAL, 2000;
CHAPTER 1. GENERAL INTRODUCTION
25
Simopoulos, 2003). Hence, substitution of FO with VO should be such that the
catabolism of EPA and DHA is minimised and avoids excess deposition of 18:2n-6
(Bell, et al., 2001a; Sargent, et al., 2002). Lastly, reductions in tissue EPA and DHA but
also in 20:1n-9 and 22:1n-11 may affect the retention of oil in tissue adipocytes and
consequently its physicochemical properties during storage and processing, influencing
the quality of the final product (Sargent, et al., 2002).
1.4.2.3 Antinutritional factors
The use of plant materials in aquafeeds may be, to some extent, challenging or
even problematic, due to the presence of antinutrients or antinutritional factors (ANF).
These substances are naturally occurring toxins or antimetabolites, whose main function
in plants is as natural insecticides or generally, as parts of survival mechanisms that
prevent grazing and consumption of plants by insects and herbivores (Hendricks, 2002).
Common antinutritional factors include trypsin inhibitors, hemagglutinatinins (lectins),
phytic acid, gossypol, phytoestrogens, cyclopropenoic FA, glucosinolates, erucic acid,
alkaloids and thiaminase (NRC, 1993; Hendricks, 2002). The presence of such
substances in aquafeeds may affect their nutritional value that may result in a variety of
physiological effects on fish (Francis, et al., 2001).
1.4.3 Palm oil in rainbow trout diets
Palm oil (PO) is derived from the oil palm (Elaeis guineensis family:
Arecaceae). PO is a fruit flesh oil, however, a seed oil (palm kernel oil) is also produced
(Hertrampf and Piedad-Pascual, 2000). PO has a high availability as its production
provides one of the largest VO tonnages in the world, along with soybean oil (FAO,
2005b; U.S. Department for Agriculture, 2007). Interestingly, it is also predicted to

CHAPTER 1. GENERAL INTRODUCTION
26
exceed soybean oil production within the next few years to become the most abundant
VO in the world (Gunstone, 2001).
Crude palm oil has a very high content of 16:0 and 18:1n-9 (43.5% and 36.6%
of total lipid FA, respectively) and relatively low levels of 18:2n-6 (9.1%) (NRC, 1993;
Ng, 2002a, 2002b). This FA composition makes PO a good potential candidate to
replace FO in diets for rainbow trout and that is firstly, for providing energy to the fish
for sufficient growth. Previous studies have shown that in rainbow trout liver, 22:1n-11
and 16:0 were the best substrates for mitochondrial β-oxidation while in red muscle
16:0, 16:1, 18:1n-9 and 18:2n-6 were the preferred substrates (Henderson and Sargent,
1985; Kiessling and Kiessling, 1993). Moreover, the relatively low levels of 18:2n-6
should avoid excess deposition of this FA in the fish tissues, although the lack of n-3
PUFA and HUFA, as is the case for many VO, could restrict its use at high levels as a
respective decrease in fish flesh n-3 HUFA would be undesirable.
The use of PO in the diets of Atlantic salmon and rainbow trout has been
investigated in several studies with regards to the growth and feed utilization efficiency,
and changes in tissue FA composition and FA metabolism, giving promising results
(Torstensen, et al., 2000; Rosenlund, et al., 2001; Bell, et al., 2002; Caballero, et al.,
2002; Ng, et al., 2003; Ng, et al., 2004).
1.4.4 Rapeseed oil in Atlantic salmon feeds
Rapeseed oil (RO) is extracted from rapeseed (Brassica napus – family
Brassicacea), an oil seed which contains 40%-50% oil, and is used both in animal feeds
and also as a food-grade oil, especially in middle and northern Europe (Hertrampf and
Piedad-Pascual, 2000; Beare-Rogers, et al., 2001). It is rich in monounsaturated FA and

CHAPTER 1. GENERAL INTRODUCTION
27
especially in 18:1n-9 (NRC, 1993). It may also have a relatively high content (up to 40
– 50%) of erucic acid (22:1n-9) although, in current varieties, grown for food and feed
use, this has been eliminated through selective breeding (Hertrampf and Piedad-
Pascual, 2000; Beare-Rogers, et al., 2001; Gunstone and Herslöf, 2004). RO has a high
availability, as it is the third largest production of VO in the world, after soy and palm
oil (FAO, 2005b; U.S. Department for Agriculture, 2007).
RO is considered to be a good sustainable substitute for FO in diets for Atlantic
salmon, not only because of its high availability and marketing potential but also for its
nutritional properties, although its FA composition differs significantly to that of marine
oils. Its content of 18:2n-6 and 18:3n-3 is moderate and at a ratio of 2:1 and thus,
should result only in modest deposition of these FA in fish tissues and, perhaps,
enhance the endogenous conversion of 18:3n-3 to 20:5n-3 and 22:6n-3. As discussed in
paragraph 1.4.2.2, accumulation of 18:2n-6 may result in low n-3/n-6 ratios that are
undesirable for the quality of the final product as it may compromise the health benefits
of eating fish and hence, such an effect would be unacceptable to producers and
consumers. Secondly, RO contains high levels of monounsaturated FA, especially
18:1n-9, which are preferred substrates for energy production by Atlantic salmon and
hence, growth rates of the fish should not be compromised (Henderson and Sargent,
1985; Kiessling and Kiessling, 1993; Bell, et al., 2001a; Sargent, et al., 2002).
In fact, RO has been successfully used in a number of previous studies with
Atlantic salmon, replacing up to 100% of FO either as a single replacer or in blends
with other VO including linseed oil, PO, olive oil and others. RO inclusion up to 100%
showed no negative effects on growth or feed conversion and utilization and a
correlation between dietary and tissue FA composition, although the endogenous

CHAPTER 1. GENERAL INTRODUCTION
28
hepatic desaturation and elongation of C18 FA to HUFA is enhanced by RO (Tocher, et
al., 2000; Bell, et al., 2001a; Rosenlund, et al., 2001; Tocher, et al., 2001; Bell, et al.,
2003a; Bell, et al., 2003b; Bendiksen, et al., 2003b; Bendiksen and Jobling, 2003;
Tocher, et al., 2003a; Tocher, et al., 2003b; Torstensen, et al., 2004a; Torstensen, et al.,
2004b; Moya-Falon, et al., 2005; Torstensen, et al., 2005; Stubhaug, et al., 2007).
However, a number of these studies used small fish and focused mainly on the effects
of the replacement of FO only, while moderate dietary lipid levels were used. Lastly, it
has been shown that water temperature may play a significant role in the effects of the
replacement of FO with RO (Bendiksen, et al., 2003b; Bendiksen and Jobling, 2003;
Jobling and Bendiksen, 2003). Hence, there is scope for the investigation of the
interactive effects of dietary RO inclusion at various dietary protein/lipid levels on
growth and FA composition of large on-grown Atlantic salmon cultured at different
temperatures.
1.4.5 Soybean meal in Atlantic cod diets
Soybean meal is produced as a by-product after the removal of the oil from soy
beans (Glycine max); when whole unextracted soy beans are used the product is called
“full fat soybean meal” (FFS) (Hertrampf and Piedad-Pascual, 2000). Soybean meals
have a very high availability; soy beans, soybean meal and soybean oil are the oilcrop,
oilmeal and VO, respectively, with the largest production tonnages in the world (U.S.
Department for Agriculture, 2007). The amino-acid (AA) profile of soybean meal could
meet most of the EAA requirements of fish, and is considered to be one of the best
among all protein-rich plant feedstuffs, although levels of the EAA methionine and
histidine are significantly lower than in FM (NRC, 1993). However, it may contain
several anti-nutritional factors, such as trypsin inhibitors, hemagglutinatinins (lectins)

CHAPTER 1. GENERAL INTRODUCTION
29
and others, that could affect its nutritional value (NRC, 1993; Hertrampf and Piedad-
Pascual, 2000; Francis, et al., 2001).
Although FFS is included in dietary formulations largely as a protein source,
having a crude protein content of ~38%, it also contributes to the dietary fat, containing
about 18% lipid (NRC, 1993). More than 50% of the total FA (FA) of the soya beans is
18:2n-6, more than 25% is 18:1n-9, less than 10% is 16:0 and around 6% is 18:3n-3,
while it does not contain any HUFA such as EPA and DHA (Hertrampf and Piedad-
Pascual, 2000; Beare-Rogers, et al., 2001).
Due to its high availability and nutritional value, FFS, along with other soy
products, is considered a good potential protein substitute for FM in aquafeeds. Such
products have been used to replace FM in diets for various fish species (van den Ingh,
et al., 1991; Oliva-Teles, et al., 1994; Olli and Krogdahl, 1994; Refstie, et al., 1998;
Alexis and Nengas, 2001; Refstie, et al., 2001; Grisdale-Helland, et al., 2002;
Glencross, et al., 2004; Kaushik, et al., 2004; Mundheim, et al., 2004) including
Atlantic cod (Von der Decken and Lied, 1993; Hansen, et al., 2006; Refstie, et al.,
2006). However, the results of these studies are variable, and in some cases
contradictory, probably due to the variable ANF content that soybeans contain (Francis,
et al., 2001). In general, it could be said that relatively little is known about the
replacement of FM with soya products in diets for Atlantic cod.
1.4.6 Energy dense / High lipid diets
The use of high lipid or energy dense diets is mainly designed to increase the
growth of the fish for a given amount of feed intake by maximizing the utilization of
lipids with a consequent protein-sparing effect (Sargent, et al., 2002). The protein

CHAPTER 1. GENERAL INTRODUCTION
30
sparing effect is briefly the utilization by the fish of as much of the available dietary
protein as possible for conversion into muscle protein instead of energy production.
Salmonids can utilize lipids efficiently, therefore the use of high lipid diets in salmon
allows protein sparing and subsequently improved growth (Frøyland, et al., 1998;
Hillestad, et al., 1998; Bendiksen, et al., 2003b).
Traditionally, salmon diets contain high proportions of protein, most of it
provided by FM. However, it is crucial for the aquafeed industry to optimise the use of
feed protein and to improve the protein utilisation in salmon diets. Clearly, high lipid or
energy dense dietary formulations have a potential in commercial aquaculture, as they
would allow less dependence on FM, reduce the cost of the feed and also reduce the
environmental impact through reduced nitrogenous waste output from salmon culture
(Halver and Hardy, 2002). Thus, as mentioned in paragraph 1.2.2, the trend in Atlantic
salmon feeds is currently for high dietary lipid levels.
Several studies have investigated the use of low protein / high lipid diets
showing promising growth results and protein sparing, although an excessive fat
deposition in the fish carcass was coincident with high lipid feeds (Einen and Roem,
1997; Bendiksen, et al., 2003b; Azevedo, et al., 2004a; Solberg, 2004). Although, in
most of the earlier studies relatively high protein/lipid ratios were investigated, high
inclusions of dietary lipid of more than 400 g kg-1 have also been studied in Atlantic
salmon (Hemre and Sandnes, 1999). However, to what extent the dietary protein / lipid
ratio can be reduced and what the optimum levels of dietary protein / lipid are for
Atlantic salmon is largely unknown.
CHAPTER 1. GENERAL INTRODUCTION
31
1.5 General objectives
The overall objective of the present study was to investigate the effects of
substitution of FM and/or FO with sustainable alternatives of plant origin and the use of
low protein/high lipid diets on the growth, fish tissue proximate and FA compositions,
FA metabolism and nutrient and FA digestibility of commercially important European
fish species. Specifically the objectives were:
1) To investigate the effects of dietary PO on growth, feed efficiency, whole
body proximate composition and tissue FA compositions in rainbow trout
2) To elucidate the interactive effects of dietary fat and protein contents and oil
source on growth and feed efficiency, tissue proximate and FA composition in Atlantic
salmon at low water temperatures.
3) To elucidate the interactive effects of dietary fat and protein contents and oil
source on growth and feed efficiency, tissue proximate and FA composition, β-
oxidation capacity, and nutrient and FA digestibility in Atlantic salmon at high water
temperatures.
4) To investigate the effects of the partial replacement of FM and FO with FFS
on growth, feed efficiency and tissue FA composition in Atlantic cod.

Chapter 2. General Materials and Methods

CHAPTER 2. GENERAL MATERIALS AND METHODS
33
2.1 Materials
All reagents, butylated hydroxytoluene (BHT) and 17:0 free fatty acid standard
were obtained from Sigma Chemical Co. (Poole, U.K.). All solvents were HPLC grade
and were obtained from Fisher Scientific UK, Loughborough, England. Thin-layer
chromatography (TLC) plates, precoated with silica gel 60 (without fluorescent
indicator) were obtained from Merck (Darmstadt, Germany). All gases were obtained
from the British Oxygen Company (BOC, Glasgow, UK).
2.2 Experimental diets
The experimental diets for Experiments I, II and III (described in Chapters 3, 4
and 5, respectively) were produced at the BioMar TechCentre (Brande, DK) as
practical-type extruded pellets. The experimental diets for Experiment IV (Chapter 6)
were produced by Fiskeriforskning (Fyllingsdalen, Norway). The diets were formulated
to meet all the known nutritional requirements of the fish species that were studied,
specifically of rainbow trout, Atlantic salmon and Atlantic cod (NRC, 1993). The
formulations, proximate and fatty acid compositions of the experimental diets used in
each individual experiment, along with details regarding the feeding practices, are
described in the methodology of the appropriate chapter for each experiment. Prior to
each feeding trial or during an initial acclimatisation period the fish were fed
commercial extruded feeds.
CHAPTER 2. GENERAL MATERIALS AND METHODS
34
2.3 Experimental animals and husbandry
The experiments were conducted in accordance with either the British Home
Office (experiments I and IV) or the Norwegian Government (experiments II and III)
guidelines regarding research on experimental animals.
The experimental animals used in this study were rainbow trout for experiment
I, Atlantic salmon for experiments II and III and Atlantic cod for experiment IV. The
fish for experiments I and IV were held in enclosed tanks at the aquarium facilities of
the Institute of Aquaculture of the University of Stirling (Stirling, Scotland) and at the
Scottish Association for Marine Science (SAMS) (Ardtoe, Scotland), respectively. The
fish for experiments II and III were held in sea cages at Gildeskål Research Station
(GIFAS) (Inndyr, Norway) and Fjord Research Station AS (Helgeland, Dønna,
Norway), respectively. The specific experimental conditions for each individual dietary
trial are described in the specific methodology section of the appropriate chapter.
2.4 Sampling procedures
2.4.1 Feed sampling
At the beginning of each experiment sufficient amounts of the diets required to
complete the analyses under investigation were collected. The diets were kept at -20oC
until analysed.
2.4.2 Fish sampling
Prior to any experimental procedure (e.g. weighing and measuring) all fish were
anaesthetized using MS222 (Tricaine, Sigma, Poole, UK). After the experimental

CHAPTER 2. GENERAL MATERIALS AND METHODS
35
procedure the fish were placed in clean aerated water and allowed to recover (usually
within 5 min) before being returned to the original housing.
Measurements of fish weight and length were made throughout the experiments.
The fish were weighed to the nearest 0.1g and total (fork) length was measured to the
nearest millimetre.
Where fish required to be sacrificed for tissue sampling they were first
anaesthetized and then killed with a sharp blow to the head such that death was
instantaneous. Tissue samples (i.e livers, gills, hearts, kidneys, pyloric caeca) were
dissected out and immediately frozen in liquid nitrogen or dry ice, as described in the
methodology of the appropriate chapter for each experiment. For flesh samples,
Norwegian quality cuts (NQC) were taken, and skinned and de-boned before being
frozen in liquid nitrogen or dry ice. Muscle and liver samples for β-oxidation capacity
analyses were taken as described above. Briefly, liver samples were dissected out and
immediately frozen in liquid nitrogen and NQC steaks were taken and frozen
immediately, with red and white muscle sections being separated at a later stage, prior
to analyses.
All samples were placed in appropriate containers i.e. plastic tubes, centrifuge
tubes, beakers, plastic bags etc and stored at -20oC until further analyses. Where
samples were required to be transferred from the experimental sites to the Institute of
Aquaculture, University of Stirling labs for analyses they were placed frozen in
polystyrene boxes containing an excessive amount of dry ice to ensure that they were
always kept frozen until delivered.

CHAPTER 2. GENERAL MATERIALS AND METHODS
36
2.5 Proximate analysis of diets, tissues and faeces
The chemical compositions of the experimental diets, fish tissues and faeces
samples were determined by proximate analyses based on methods described in AOAC
(1995).
2.5.1 Moisture
Thermal drying to constant weight in an oven at 110 °C for 24h was applied to
determine moisture content of feeds and fish whole body and tissue samples.
Specifically, the feed samples were ground to a powder using a coffee grinder or mortar
and pestle. Then 1.0 to 5.0g of sample was placed into a pre-weighed dish and dried in
an oven at 110°C. Regarding the whole fish samples, they were either blended in a food
processor or blender or sliced open and then cut into pieces and weighed onto a pre-
weighed dish. Then they were dried in the oven as described above, allowing a longer
drying time and until constant weight was obtained. After removing the samples from
the oven they were placed in a desiccator to cool and then reweighed.
The moisture content of the samples was calculated as:
100(g) weight sample
(g) weight sample dried(g) weight sample% Moisture, ×−
=
2.5.2 Freeze drying
The faeces samples were freeze dried before analysis using a CHRIST Alpha 1-
4 LSC (Osterode am Harz, Germany) freeze dryer. Briefly, the faeces were placed into
a pre-weighed dish and their weight was recorded. Then they were freeze dried at -50oC
under vacuum to constant weight. The vapour pressure above ice was 1.030 mbar

CHAPTER 2. GENERAL MATERIALS AND METHODS
37
giving a freeze drying of -20oC. The dry matter (and consequently the moisture) was
quantified gravimetrically by reweighing the dish or flask and the moisture content of
the faeces was determined per weight of sample freeze-dried.
2.5.3 Crude protein
Crude protein content was determined by Kjeldahl analysis (nitrogen x 6.25)
using a Kjeltec Autoanalyser (Tecator). Briefly, 200mg of sample were weighed into a
Kjeldahl digestion tube and 2 mercury Kjeltabs and 5ml conc. sulphuric acid were
added. The tube was then placed into the digestion block. After 1 hour the tubes were
removed from the block and left to cool inside a fume cupboard for at least 15 minutes.
Then, 20ml de-ionised water and 5ml sodium thiosulphate solution were added to the
digestion tube and mixed thoroughly. The tubes were distilled using the Kjeltec auto
analyser and the titration values were recorded. All samples were analysed in triplicates.
Similarly, for each batch of samples, 3 urea standard tubes and 3 blank tubes were
prepared and analysed.
The protein content of the samples was calculated as:
(mg) weight sample875.1750)eblank titr titresample(% Protein, ×−
=
where 1750.875 is a multiplication factor to convert titre vol. to % protein based on
standardised protein factor.
CHAPTER 2. GENERAL MATERIALS AND METHODS
38
2.5.4 Acid hydrolysis
Diet samples were acid hydrolysed using a Soxtec System 1047 hydrolysing
unit (Tecator Application note 92/87) as follows. Sample of 1.0 –3.0g, celite of the
same weight and 100ml 3M hydrochloric acid solution were added into a hydrolysis
tube. The tube was then inserted into the hydrolysing unit were an appropriate glass
thimble was placed. The sample was boiled gently for 1 hour and then 100ml de-ionised
water were added to the tube. The solution was then filtered through the glass thimbles
and the tube washed with 5 x 50ml hot deionised water using a spray gun. The tubes
and the glass thimble were then removed from the unit. The residue of the sample was
cleaned from the tube with cotton wool and placed in the glass thimble. The thimble
was dried at 100°C for 3 hours (or 60°C overnight) before the sample lipid was
extracted on the Tecator Soxtec Unit.
2.5.5 Crude fat
Crude fat was determined by exhaustive Soxhlet extraction using petroleum
ether on a Soxtec System HT6 (Tecator application note 67/83). Prior to the fat
extraction the diet samples were acid hydrolysed as described in paragraph 2.5.4.
Briefly, 1g of the sample was put into a Soxhlet extraction thimble. A Soxhlet
extraction cup, containing 5 glass balls, was weighed and 40ml of petroleum ether (40-
60°C, BP) were added. The thimble was moved to the Soxtec System and boiled in the
solvent for 20 minutes and then rinsed for 2 hours. After the extraction the solvent was
evaporated off, the extraction cup was removed and placed into an oven at 110°C. After
1 hour the extraction cup was removed from the oven and left to cool inside a
desiccator. Fat was quantified gravimetrically by reweighing the extraction cup and
CHAPTER 2. GENERAL MATERIALS AND METHODS
39
crude fat content was determined per weight of sample extracted. All samples were
analysed in triplicate.
2.5.6 Ash
The ash content of diets, fish tissues and faeces was determined by dry ashing
approximately 1g of sample in a porcelain crucible in a muffle furnace at 600 °C
overnight. After ashing, the samples were removed from the furnace, cooled to room
temperature in a desiccator and then reweighed.
The ash content was calculated as:
100(g) Weight Sample
(g) Ash Weight% Ash, ×=
2.5.7 Gross energy
The gross energy content of diets and faeces was determined using an adiabatic
bomb calorimeter using the Gallenkamp Autobomb system. Briefly, 1g of dried sample
was pressed to make a firm pellet and placed into a crucible. Nickel firing wire was
fixed between the electrodes and then a cotton string was wound from the pellet around
the firing wire and the shorter electrode. The electrode assembly was then put into the
calorimetry bomb. The water jacket of the bomb was filled with tap water and the
calorimeter vessel was filled with water at 21-23°C and weighed to exactly 3kg. The
calorimeter vessel was placed into the water jacket. Before firing the calorimetry bomb
the thermometer reading was recorded as the initial temperature. The bomb was then
fired and when the temperature stabilised it was again recorded (final temperature).

CHAPTER 2. GENERAL MATERIALS AND METHODS
40
The energy content (kJ/g) of the sample was calculated as:
( )[ ](g) Weight Sample
0896.082.10Temp. InitialTemp. FinalEnergy Gross −×−=
where 10.82 is the factor of heat capacity of the system and 0.0896 represents the
combined energy values (expressed in kJ) for the wire and the cotton thread used in the
analysis.
2.5.8 Yttrium oxide (Y2O3)
Yttrium oxide (Y2O3) was determined by a spectrophotometric method after
acid digestion by Dr Andrew Fisher at the University of Plymouth. The diet or faeces
samples were digested in concentrated nitric acid and then analysed by inductively
coupled plasma-optical emission spectrometry (ICP-OES).
2.6 Lipid extraction and analysis
2.6.1 Total lipid extraction of diets, tissues and faeces
Total lipids of diet, tissue and faeces samples were extracted by homogenisation
in chloroform/methanol (C/M) (2:1, v/v) containing butylated hydroxytoluene (0.01%
w/w, BHT) as antioxidant, according to Folch et al. (1957). Specifically, approximately
1g of diet, tissue or faeces sample was added to a boiling tube with 20 ml of C/M)
(2:1,v/v). The sample was then homogenised using an UltraturraxTM , and the stoppered
tube was left on ice for approximately 1 hour. After that, 5 ml of 0.88% (w/v) KCl (0.25
volumes of KCl) were added to the homogenised sample, mixed thoroughly on a vortex
mixer and left to stand on ice. After 15 minutes the tubes were centrifuged at 400 x g

CHAPTER 2. GENERAL MATERIALS AND METHODS
41
for 2-3 minutes. After the layers had separated the top layer was removed by aspiration.
The bottom layer was transferred to pre-weighed tubes through 11 cm filter papers
(Whatman no. 1) pre-washed with C/M 2:1. The solvent was evaporated under a stream
of oxygen-free nitrogen (OFN), on a nitrogen evaporator, to dryness and the samples
were desiccated in vacuo overnight. Lipids were quantified gravimetrically by
reweighing the test tube and total lipid content was determined per weight of material
extracted. Lastly, the total lipids were re-dissolved in C/M (2:1) + 0.01% (w/v) BHT at
a concentration of 10 mg/ml and transfered to 2 ml glass vials. The total lipids were
stored under nitrogen in a freezer at -20oC.
2.6.2 Preparation and purification of fatty acid methyl esters
Fatty acid methyl esters (FAME) were prepared from total lipid by acid-
catalyzed transesterification as described by Christie (1982) and FAME extracted and
purified as described by Tocher & Harvie (1988). Specifically, total lipid (normally 1
mg but up to 50 mg) was added into a small test tube along with 17:0 free fatty acid
standard (prepared to a concentration of 1 mg/ml in C/M (2:1, v/v)) at 10% of the total
lipid mass. The organic solvent was evaporated on the nitrogen evaporator and then 1
ml of toluene and 2 ml of the methylating reagent were added and thoroughly mixed.
The methylation reagent was prepared as a 1% (v/v) solution of conc. sulphuric acid in
methanol. The tube was flushed with nitrogen, stoppered and incubated overnight (16
hr) at 50oC in a hot-block. After incubation the tube was removed from the hot-block.
When cool, 2 ml 2% (w/v) KHCO3 and 5 ml iso-hexane/diethyl ether (1:1, v/v) + 0.01%
(w/v) BHT were added, mixed and centrifuged at 350-400 x gave for 2 minutes. The
upper organic layer was transferred to another test tube and a further 5 ml iso-
hexane/diethyl ether (1:1, v/v) (no BHT) were added to the original tube. The tube was

CHAPTER 2. GENERAL MATERIALS AND METHODS
42
mixed and centrifuged as before and the upper layer was added to the other tube as
before. The combined solvent was evaporated under nitrogen and the FAME were re-
dissolved in 100 µl of iso-hexane.
Methyl esters were purified by TLC on 20 x 20 cm plates. The FAME were
loaded on the plate using a 100 µl glass Hamilton syringe. The plate was
chromatographed in iso-hexane/diethyl ether/acetic acid (90:10:1, v/v/v). Then, it was
removed from the tank and the solvent was allowed to evaporate in the fume cupboard.
The edge of the plate was then sprayed with 1% (w/v) iodine in chloroform to visualise
the FAME. The FAME bands were marked and then scraped from the TLC plate into a
test tube using a straight edged scalpel blade. FAME were eluted from the silica with 10
ml of iso-hexane/diethyl ether (1:1, v:v), then mixed and centrifuged as described
above, to sediment the silica. The solvent was transferred to a clean small test tube and
then evaporated to dryness under nitrogen. The samples were transferred to 2 ml glass
vials in 1 ml of iso-hexane, evaporated to dryness and re-dissolved in iso-hexane to a
concentration of 1 mg/ml. The FAME were stored under nitrogen or argon at -20oC
until GLC analysis.
2.6.3 Separation and identification of fatty acid methyl esters
FAME were separated and quantified by gas-liquid chromatography using a
Carlo Erba Vega 8160 (Milan, Italy) chromatograph equipped with on-column injection
(cold) and using a 30 m x 0.32 mm id, 0.25µm film thickness, capillary column (CP
wax 52CB; Chrompak Ltd., London, U.K.). Hydrogen was used as carrier gas at a flow
rate of 2.0 ml/min (constant flow mode). The temperature programming was from 50oC
to 150oC at 40oC/min and then to 225oC at 2oC/min. The fatty acid peaks were detected
by flame ionisation detection (FID). The volume of the sample injected was 1 µl of 1

CHAPTER 2. GENERAL MATERIALS AND METHODS
43
mg/ml FAME/iso-hexane. Individual methyl esters were identified by comparison to
known standards and by reference to published data (Ackman, 1980). Peak data was
processed using Chromcard for Windows (version 1.19) computer package
(Thermoquest Italia S.p.A., Milan, Italy).
2.7 β-oxidation capacity
Liver and red and white muscle were weighed and homogenized in 20% (w/v)
ice-cold buffered sucrose solution containing 0.25M sucrose, 0.04M potassium
phosphate buffer (pH 7.4), 0.15M KCl, 40mM KF and 1mM N-acetyl cysteine. The
resulting total homogenates were then centrifuged at 1880 g for 10 min at 2°C. The
resulting post-nuclear fractions were collected, and portions were used immediately to
determine β-oxidation capacity. The latter was determined as acid-soluble products
using radiolabelled [1-14C]-palmitoyl-CoA as a substrate as described by Frøyland et al.
(1995).
Briefly, 250 μL of assay medium were added to 2ml eppendorf tubes. Then 10
μL of [1-14C]palmitoyl-CoA substrate (0.1 μCi/100 μM) were added to each tube. The
samples were pre-incubated at incubation (room) temperature for 2 min. The reaction
was started by the addition of homogenate (30-50 μl for liver and red muscle and 300-
500 μl for white muscle, homogenized in 20% (w/v) ice-cold buffered sucrose solution
as described above) and the reaction continued for 10 min. The reaction was stopped by
addition of 150 μL of 1.5 M KOH. Then 25 μL FAF-BSA (100mg/ml) were added, the
tubes were vortexed and 500 μL of ice-cold 4M HClO4 (perchloric acid) were added.
The tubes were centrifuged at 1880 x g for 10 min. Aliquots of 500 μL were placed in
scintillation vials, 2.5 ml of scintillant added and the radioactivity was determined in a
scintillation counter.

CHAPTER 2. GENERAL MATERIALS AND METHODS
44
The protein content of the samples was determined according to the Lowry
method (Lowry, et al., 1951). Specifically, the preparation of standards and samples
was done as follows. For the standards 0, 20, 40, 60, 80 and 100 μl of the BSA standard
were added to 10 ml test tubes in triplicates. Then the volume in each tube was made up
to 100 ml with distilled water and 100 μl of NaOH/SDS solution were added to each
tube. For the samples, 100 μl of cell samples collected were put in an eppendorf tube
and 400 μl of NaOH/SDS were added. The tubes were heated at 60oC for 1h. After
cooling for 10 min, 50 μl portions of the digest were transferred from each sample into
a plastic tube. The standards and samples were then assayed. Specifically, 1 ml of 2%
(w/v) NaK tartrate solution and 1ml of 1% (w/v) CuSO4 solution were added to 100 ml
of 2% (w/v) NaCO3 solution and mixed (volumes were adjusted as appropriate). Then
2.5 ml of this mixture were added to each standard and sample test tube. The tubes were
mixed and left at room temperature for 15 min. Just prior to use, Folin reagent was
diluted 1:1 with distilled water and 250 μl of the diluted reagent were added to each test
tube and mixed. The tubes were then left at room temperature for 30 min before
measuring at 660 nm in a UV/vis spectrophotometer. The calibration curve of protein
(0, 20, 40, 60, 80 and 100 mg) versus absorbance at 660 nm (A660) was prepared and
protein content of samples was determined using the A660 values.
2.8 Calculations
The following formulae were applied to the data:
Feed Conversion Ratio:
(g)gain wet weight
(g) intake feed FCR =

CHAPTER 2. GENERAL MATERIALS AND METHODS
45
Specific Growth Rate:
days ofnumber )Wln()ln(W
100 %/day SGR, o1 −×=
Thermal Growth Coefficient:
C)( Temp.daysWW
1000 TGC o
30
31
×
−×=
Condition Factor:
3LW100 K ×=
Hepatosomatic Index:
WW
100 % HSI, liver×=
Viscerosomatic Index:
WW
100 % VSI, viscera×=
Cardiosomatic Index:
WW
100 % CSI, heart×=

CHAPTER 2. GENERAL MATERIALS AND METHODS
46
Protein productive value, (g protein gain x g protein ingested−1):
intake feed cumulativePWPWP
PPVF
0011
×−
=
In the above formulae W is the weight of the sampled fish in grams; W0 and W1
are the initial and the final fish mean weights in grams; Wliver, Wviscera and Wheart are the
weights in grams of the liver, viscera and heart, respectively, of the sampled fish; L is
the fork length of the sampled fish in cm; P0 and P1 are the initial and final protein
concentrations of the fish; PF is the protein concentration of the feed on a dry matter
basis; cumulative feed intake was determined in grams on a dry matter basis.
The Apparent Digestibility Coefficient (ADC) of nutrients and FA was
calculated as:
FiDi
DF-1 100 % ADC ⎥
⎦
⎤⎢⎣
⎡⎟⎠⎞
⎜⎝⎛ ××=
Where D is the concentration of the nutrient or FA (or kJ/g gross energy) in the
diet, F is the concentration of the nutrient or FA (or kJ/g gross energy) in the faeces, Di
is the concentration of the inert marker in the diet and Fi is the concentration of the inert
marker in the faeces.
2.9 Statistics
All the data are presented as means ± SD (n = 3). The statistical analyses for
experiments I and II and IV were performed using SPSS 13 (SPSS Inc, 2004) while for

CHAPTER 2. GENERAL MATERIALS AND METHODS
47
experiment III SPSS 14 (SPSS Inc, 2005) was used. The graphs were created using
Prism 4 (Graphpad Software Inc., San Diego, USA).
Regarding experiments I and IV, the significant differences between dietary
treatments were determined by one-way ANOVA followed, where appropriate, by
Tukey’s post-hoc test to rank the groups (P=0.05).
The experimental designs for the experiments II and III were factorial with 2
factors (2 x 3). Hence, the effects of the two factors and their interactions were analysed
by two-way ANOVA. When significant interactions of the two factors were observed,
the main effects were not further discussed but instead, multiple comparison testing was
performed to look at the simple main effects, that is the main effect of one factor at a
given level of the other (Zar, 1999, pp. 260-261). The analysis of the simple main
effects was done for both factors. Where appropriate Tukey’s post-hoc test was
conducted to rank the groups (P=0.05).
Data which were identified as non-homogeneous (Levene’s test) were subjected
to square root, log or arcsin transformation before analysis. Differences were regarded
as significant when P < 0.05 (Zar, 1999).
Chapter 3. Effects of dietary crude palm oil on rainbow trout
(Oncorhynchus mykiss)

CHAPTER 3. PALM OIL IN RAINBOW TROUT
49
3.1 Introduction
As previously discussed, FM and FO have been the main sources of protein and
oil for rainbow trout diets over the last 30 years (Lovell, 2002). Such feed formulations
have been shown to be nutritionally beneficial for the fish, providing sufficient essential
amino-acids and FA, along with highly digestible energy, but are also cost effective and
readily available (NRC, 1993). Furthermore, the FA composition of the marine oils and
meals, being rich in n-3 HUFA, reflects on the fish tissues, providing a nutritious and
health beneficial final product for human consumers (De Deckere, et al., 1998; ISSFAL,
2000; Sargent, et al., 2002). However, various reasons, including the stable or limited
supply of these commodities in the near future, along with increased demand from the
aquaculture industry, make their use problematic and a need to find sustainable
alternatives is growing (Pike and Barlow, 2003; Tacon, 2004).
The replacement of FO with VO in aquafeeds has been thoroughly described in
the “General Introduction” section. Briefly, VO can be used successfully as sustainable
oil sources for aquafeeds, while they are readily available around the world and at
competitive prices. However, such a replacement could be challenging as VO lack the
n-3 HUFA that are abundant in FO, with potential negative effects on fish growth as
well as on the quality of the final product (Bell, et al., 2001a; Bell, et al., 2003a).
PO is one of the most abundant VO in the world, and thus its high availability
and competitive price make it a good candidate to replace FO in aquafeeds (U.S.
Department for Agriculture, 2007). Moreover, due to its FA composition, PO has a high
potential for use in feeds for rainbow trout. Specifically, PO content of 16:0 and 18:1n-
9 is high while 18:2n-6 is relatively low (NRC, 1993; Ng, 2002a, 2002b). As previously
described, 16:0 and 18:1n-9 are good substrates for β-oxidation (Kiessling and

CHAPTER 3. PALM OIL IN RAINBOW TROUT
50
Kiessling, 1993), and hence PO should be a good energy source for the fish, while the
low content of 18:2n-6 should only result in moderate accumulation of this FA in the
fish tissues. However, the lack of n-3 HUFA could be challenging in terms of the
changes on the FA composition of the flesh and the consequent effects on the quality of
the final product, especially at high levels of substitution.
Previous studies have investigated the effects of the inclusion of PO in diets for
salmonids. Specifically, graded substitution of FO with PO, up to total replacement of
FO, or blends of dietary oils including PO had no significant effects on growth and feed
utilization both in rainbow trout (Caballero, et al., 2002; Ng, et al., 2003) and Atlantic
salmon (Rosenlund, et al., 2001; Bell, et al., 2002; Ng, et al., 2004). However, the FA
compositions of muscle and liver have been shown to be affected by the altered dietary
FA composition, due to the inclusion of PO, and linear correlation between dietary and
tissue FA have also been suggested, although specific FA are specifically retained or
utilized by the fish (Torstensen, et al., 2000; Rosenlund, et al., 2001; Bell, et al., 2002;
Caballero, et al., 2002; Ng, et al., 2003; Ng, et al., 2004; Tocher, et al., 2004).
Nevertheless, little is known to the effects of the dietary inclusion of PO on other
tissues of rainbow trout, such as the heart, gills and kidneys.
The aim of the present study was to investigate the effects of graded inclusion of
PO at expense of FO in diets for rainbow trout on growth, feed utilization, and FA
composition of various tissues, namely muscle, liver, heart, kidney and gills.

CHAPTER 3. PALM OIL IN RAINBOW TROUT
51
3.2 Materials and methods
3.2.1 Fish and facilities
Rainbow trout (Oncorhynchus mykiss) were randomly distributed into twelve
circular tanks of 100 L capacity (40 fish/tank) at the Institute of Aquaculture
(University of Stirling, Scotland). The fish had a mean initial weight of about 27 g and
were obtained from a local fish hatchery (Almondbank, Perthshire, Scotland). The tanks
were supplied with flow-through freshwater at 1 L min-1. During the experimental
period (10 weeks) the water temperature was constant at 13oC and the fish were
subjected to a photoperiod regime of 12 h light: 12 h dark. Prior to the experiment, the
fish were fed on a commercial trout pellet diet during an initial one-week
acclimatisation period. The experiment was conducted in accordance with British Home
Office guidelines regarding research on experimental animals.
3.2.2 Experimental feeds and feeding
The four experimental diets were formulated to provide approx. 472 g kg-1 crude
protein and 224 g kg-1 crude lipid, containing varying contents of crude PO added at the
expense of marine FO (Table 3.1). The diets were produced at the BioMar Tech Center
(Brande, Denmark) as practical type extruded pellets (3 mm diameter). PO replaced 0%
(P0), 25% (P25), 50% (P50) and 100% (P100) of the added FO and hence, it was
included at 0, 50, 100 and 200 g kg-1 of the diet, respectively. PO was thoroughly mixed
with the FO before the oil mixtures were used to coat the extruded pellets. The FA
compositions of the four diets are shown in Table 3.2. The diets were formulated to
meet all the known nutritional requirements of salmonid fish (NRC, 1993). Each of the

CHAPTER 3. PALM OIL IN RAINBOW TROUT
52
four experimental diets was fed to satiety three times daily, for ten weeks, to randomly
assigned triplicate tanks of fish. Feed consumption was recorded daily.
3.2.3 Sampling procedure
At the beginning of the trial, all fish were individually weighed, fork length was
measured and 3 fish were randomly sampled for whole body proximate composition
determination. After 4 weeks fish were bulk weighed and two fish per tank were
sampled for whole body proximate composition. At the end of the experimental period
(10 weeks), all fish were anaesthetised and weight and length were recorded. Two fish
per tank were sampled for whole body proximate composition and another two for
tissues and blood samples. All fish were killed by a blow to the head and samples were
taken as described in the General Materials and Methods section. Livers, hearts, gills
and kidneys were dissected out and immediately frozen in liquid nitrogen. For flesh
samples, Norwegian quality cuts were taken, and skinned and de-boned before being
frozen in liquid nitrogen. Diet samples were taken at the beginning of the trial and
stored in -20oC until analysed.
3.2.4 Proximate analysis
The nutrient composition, including moisture, crude protein, crude fat and ash
contents, of diets and whole body samples was determined by proximate analysis
according to AOAC (1995), modified as described by Bell et al (2001a) and described
in detail in “General Materials and Methods” section (paragraph 2.5).

CHAPTER 3. PALM OIL IN RAINBOW TROUT
53
3.2.5 Lipid extraction and fatty acid analyses
Total lipids of tissue and diet samples were extracted by homogenization
according to Folch et al. (1957). Fatty acid methyl esters (FAME) were prepared from
total lipid by acid-catalyzed transesterification as described by Christie (1982) and
FAME extracted and purified as described by Tocher & Harvie (1988). FAME were
separated and quantified by gas-liquid chromatography and individual methyl esters
were identified by comparison to known standards and by reference to published data
(Ackman, 1980). The methods followed for the lipid extraction and FA analyses of
diets and tissues are thoroughly described in paragraph 2.6.
3.2.6 Calculations and statistical analysis
Feed Conversion Ratio (FCR), Specific Growth Rate (SGR), Thermal Growth
Coefficient (TGC), Protein Productive Value (PPV), Condition Factor (K) and hepato-
somatic index (HSI) were calculated using the formulae presented in paragraph 2.8.
All the data are presented as means ± SD (n = 3) and were analysed by one-way
ANOVA. Statistical analyses were performed using SPSS 13 (SPSS Inc, 2004) as
described in paragraph 2.9. Differences were regarded as significant when P < 0.05
(Zar, 1999).
3.3 Results
3.3.1 Diet proximate and fatty acid composition
The four experimental diets contained graded amounts of PO, namely 25%, 50%
and 100% of the added oil, at the expense of FO, while one containing only FO (0%

CHAPTER 3. PALM OIL IN RAINBOW TROUT
54
PO) was used as control. The analysed proximate composition of the experimental diets
is shown in Table 3.1. All diets contained approximately 47% protein, 22% lipid, 7%
ash and 7% moisture irrespective of the PO content. The gross energy of all diets was
approximately 23 kJ / g.
The inclusion of PO resulted in significant changes in the FA compositions of
the diets as shown in Table 3.2. The control diet, P0, contained 34.7% monoenes
(mainly 18:1n-9, but also significant amounts of 16:1n-7, 22:1 and 20:1n-9, 29.3%
saturated FA, of which more than half was 16:0, 26.9% n-3 PUFA mainly DHA and
EPA, and 7.2% n-6 PUFA largely in the form of 18:2n-6. Graded inclusion of PO
resulted in increased 16:0, 18:1n-9 and 18:2n-6 (2-fold, 3-fold and 2-fold between P0
and P100, respectively). Total saturated, monoenes and n-6 PUFA also increased. On
the other hand, 14:0, most of the monoenes, 20:2n-6, ARA and all the n-3 PUFA,
including EPA, DHA and total n-3 PUFA, decreased drastically (9-fold and 6-fold
between P0 and P100, for EPA and DHA, respectively).
3.3.2 Growth performance
The growth performance and feed efficiency, including mean weights and
lengths, SGR, TGC and FCR, of rainbow trout fed the experimental diets for 4 and 10
weeks is shown in Table 3.3. In general, the dietary inclusion of PO, up to100% of the
added oil and the total replacement of FO, had no significant effects on the growth
performance of the fish. Specifically, the final weight varied from 70.1 to 81.0g and the
total length between 16.8 and 17.9 cm. SGR was good for all treatments and for both
the growth periods (start to 4 weeks and 4 – 10 weeks). The overall SGR ranged from
1.34 – 1.59. Similarly, TGC varied from 1.22 to 1.47. No significant effects of the PO
inclusion were shown by ANOVA either on SGR or TGC. In the first 4 weeks of the

CHAPTER 3. PALM OIL IN RAINBOW TROUT
55
feeding trial the FCR was approximately 0.72, while the overall FCR was much higher,
varying from 1.44 to 1.79. Nevertheless, no significant differences were shown between
the four dietary treatments.
3.3.3 Whole body proximate composition
The whole body proximate composition at the beginning of the dietary trial and
after 4 and 10 weeks of feeding on the experimental diets is shown in Table 3.4. The
initial composition of the carcass was 75.1% moisture, 66.3% protein, 23.0% lipid and
9.8% ash. After 4 weeks the moisture, protein, lipid and ash content varied between
70.8% - 73.9%, 55.5% - 59.7%, 29.3% - 35.0% and 8.2% - 9.5%, respectively.
ANOVA showed only a significant effect on moisture content, while the protein, lipid
and ash contents were not affected by the PO inclusion. Lastly, at the end of the
experimental period (after 10 weeks) the moisture was approximately 70.6%, protein
55.0%, lipid 35.8% and ash 7.8%. The graded inclusion of PO did not affect
significantly the proximate composition of the whole body at 10 weeks.
3.3.4 Tissue fatty acid compositions
3.3.4.1 Muscle fatty acid composition
The FA compositions of muscle from rainbow trout fed the four experimental
diets for 10 weeks are shown in Table 4.5. The graded inclusion of PO resulted in
significant alterations in the FA composition of the fish muscle, mainly between the fish
fed the P0 and P100 diets, reflecting the dietary FA composition. Regarding the
saturated FA, 14:0 was decreased from 4.2% to 1.4% for P0 and P100, respectively,
while 16:0 was slightly, but significantly, increased (22.4% - 26.5% for P0 and P100,
CHAPTER 3. PALM OIL IN RAINBOW TROUT
56
respectively). However, there were no significant differences in the total saturated FA
being approximately 32%. Reflecting the dietary FA compositions, all monounsaturated
FA were significantly decreased, with the exception of 18:1n-9 which was significantly
increased from 11.6% to 26.9% for P0 and P100, respectively. The increase in 18:1n-9,
being the most abundant monounsaturated FA, resulted in a respective, significant
increase in total monoenes. All n-6 PUFA increased with dietary inclusion of PO.
18:2n-6 increased from 4.5% to 9.0%, 20:2n-6 from 0.4% to 0.7%, 20:3n-6 from 0.2%
to 0.6% and 20:4n-6 from 0.7% to 0.9%, for P0 and P100, respectively, resulting in an
2-fold increase for the total n-6 PUFA (6.1% to 11.9% for P0 and P100, respectively).
There was a significant decrease, especially between P0 and P100 groups, in the n-3
PUFA, including 18:3n-3, EPA, DHA and total n-3 PUFA. It should be noted, though,
that the decrease in DHA was significant only for the P100 group (24.5% vs. 17.5%, for
P0 and P100, respectively). Lastly, the n-3 / n-6 ratio was decreased from 5.8% to
1.8%, for P0 and P100, respectively.
3.3.4.2 Liver fatty acid composition
The liver FA compositions, and the changes arising from the dietary inclusion of
PO, are presented in Table 3.6. The total saturated FA ranged from 29.4% - 32.5%
while 16:0 had the highest proportion (approximately 21.7%) of all saturated FA.
Noticeably, there were no significant differences in any of the individual saturated FA,
or in the total saturated FA. Similarly, the monounsaturated FA were only partially
affected. Specifically, when PO was included in the diets 18:1n-9 was significantly
increased by 2-fold (12.1% vs. 24.6%, for P0 and P100, respectively) and 18:1n-7 and
24:1n-9 were significantly decreased, while there were no significant differences shown
in any of the other monoenes or the total monoenes. The n-6 PUFA, including the total

CHAPTER 3. PALM OIL IN RAINBOW TROUT
57
n-6 PUFA, were significantly increased with graded inclusion of PO. 18:2n-6 was
increased 2-fold, from 2.6% to 5.5% for P0 and P100, respectively. 20:2n-6 increased
almost 3-fold and 20:3n-3 5-fold between P0 and P100, while ARA was unaffected by
the dietary treatments (approx. 1.9%). EPA and the total n-3 PUFA were significantly
decreased when PO replaced FO in the diets of trout. Specifically, EPA was decreased
from 5.0% to 1.0% for P0 and P100, respectively. It is worth mentioning that DHA was
not significantly affected by the dietary changes although it was slightly reduced from
31.2% for P0 to 22.3% for P100. Lastly, the n-3/n-6 ratio was reduced from 6.4 to 1.9
between P0 and P100.
3.3.4.3 Gill fatty acid composition
The FA composition of gills from rainbow trout fed the four experimental diets
is shown in Table 3.7. In gills the graded inclusion of PO resulted in a significant
reduction in 14:0 (4.5% vs. 1.8% for P0 and P100, respectively), in a significant
increase in 16:0 (19.2% vs. 24.7% for P0 and P100, respectively), while 18:0 and total
saturated FA were not significantly affected. Similarly to the other tissues, most
monoenes were significantly reduced when PO replaced FO with only 18:1n-9 (16.3%
vs. 34.8% for P0 and P100, respectively) and total monoenes (39.4% vs. 46.9% for P0
and P100, respectively) were significantly increased. The dietary inclusion of PO
resulted also in significant increases in 18:2n-6 (6.3% - 10.1% for P0 and P100,
respectively), 20:2n-6 (0.4% - 0.6% for P0 and P100, respectively), 20:3n-6 (0.2% -
0.4% for P0 and P100, respectively) and total n-6 PUFA (8.1% - 12.1% for P0 and
P100, respectively), while there was no significant effect on 20:4n-6. All n-3 PUFA
were significantly reduced with the dietary inclusion of PO. Specifically, EPA was

CHAPTER 3. PALM OIL IN RAINBOW TROUT
58
reduced from 4.9% to 1.6% and DHA from 13.6% to 6.7% for P0 and P100,
respectively.
3.3.4.4 Heart fatty acid composition
The heart FA compositions from fish fed the four experimental diets for 10
weeks is presented in Table 3.8. The saturated FA were largely unaffected by the
graded inclusion of PO, with total saturates comprising approximately 32% and 16:0
24.3% of the total lipid. 18:1n-9 and total monoenes were increased (10.5% vs. 27.1%,
for 18:1n-9 and 23.0% vs. 34.2% for total monoenes, for P0 and P100, respectively)
while 16:1n-7, 20:1n-9 and 22:1 were decreased when PO replaced FO. The n-6 PUFA
were significantly increased, including 18:2n-6 (3.7% vs. 8.8% for P0 and P100,
respectively), 20:2n-6 (0.3% - 0.7% for P0 and P100, respectively), 20:3n-6 (0.3% -
0.8% for P0 and P100, respectively) and total n-6 PUFA (6.2% vs. 12.7% for P0 and
P100, respectively). No significant effect was shown on ARA which varied from 1.3%
– 1.5%. With the exception of DHA, which was only slightly but not significantly
reduced (26.8% vs. 18.5% for P0 and P100, respectively), all n-3 PUFA were
significantly decreased. 18:3n-3 was reduced 2-fold (0.8% vs. 0.4% for P0 and P100,
respectively) and EPA was decreased by more than 4-fold (6.3% vs. 1.5% for P0 and
P100, respectively). The n-3/n-6 ratio was decreased from 6.1 (P0) to 1.7 (P100). It
should be noted that most of the aforementioned differences in the FA compositions
were significant only when PO was included at 100% of the added dietary oil.
3.3.4.5 Kidney fatty acid composition
The FA composition of kidney from rainbow trout fed diets containing graded
amounts of PO are shown in Table 3.9. Similar to the FA compositions of other tissues,
most of the differences caused by the inclusion of PO were significant largely between

CHAPTER 3. PALM OIL IN RAINBOW TROUT
59
P0 and P100 groups. Regarding the saturated FA, 14:0 was significantly decreased
(4.1% vs. 1.2%, for P0 and P100, respectively), 16:0 was slightly but significantly
increased (22.6% vs. 27.5%, for P0 and P100, respectively), whereas 18:0 and total
saturated were not affected by the graded inclusion of PO. 18:1n-9 was more than
doubled between P0 and P100 (14.2% vs.31.0%), total monoenes were increased from
31.6% (P0) to 39% (P100); however, all other monoenes were significantly reduced.
Significant increases were shown for the n-6 PUFA with dietary inclusion of PO. 18:2n-
6 increased from 5.1% to 9.3%, 20:2n-6 from 0.4% to 0.7%, 20:3n-6 from 0.2% to
0.6% and 20:4n-6 from 1.3% to 1.9%, for P0 and P100, respectively. All n-3 PUFA
decreased significantly when FO was replaced by PO in the diets of trout. 18:3n3-3 was
reduced from 0.9% to 0.3%, between P0 and P100, EPA from 6.4% to 1.8%, DHA from
17.8% to 11.5% and total n-3 PUFA from 28.5% to 14.2%. The n3/n-6 ratio was
reduced from 3.9 to 1.1, for P0 and P100, respectively.
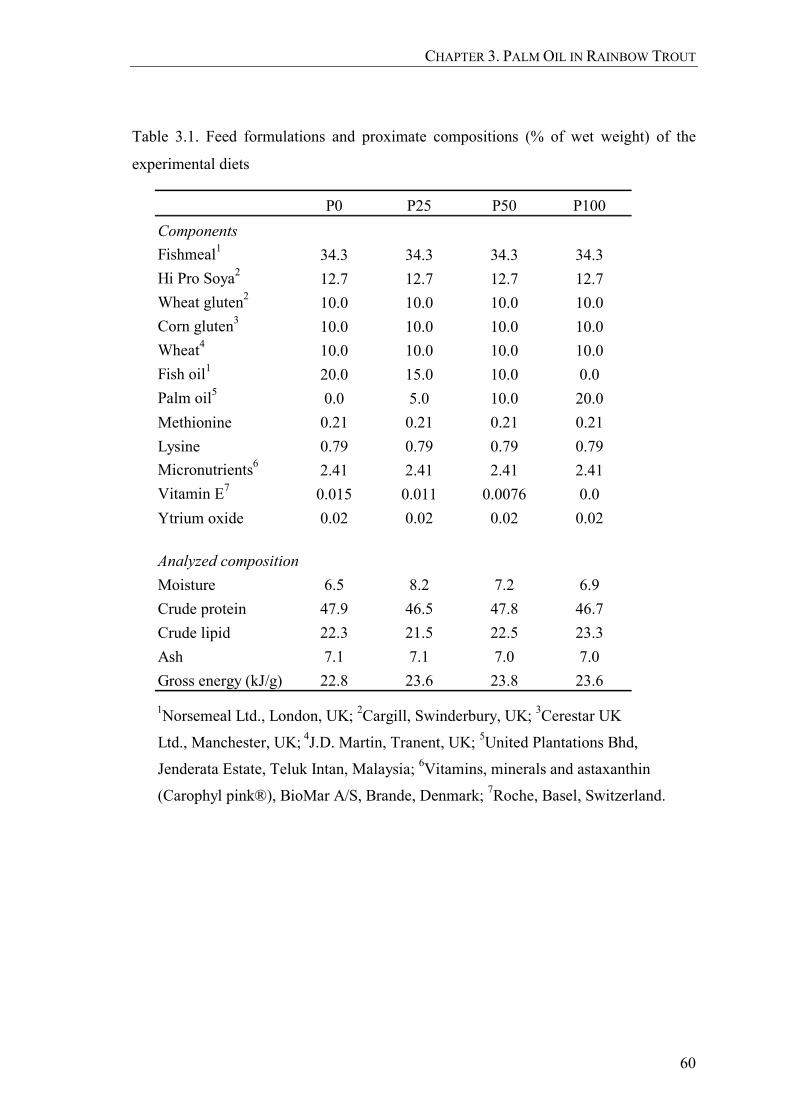
CHAPTER 3. PALM OIL IN RAINBOW TROUT
60
Table 3.1. Feed formulations and proximate compositions (% of wet weight) of the
experimental diets
P0 P25 P50 P100ComponentsFishmeal1 34.3 34.3 34.3 34.3Hi Pro Soya2 12.7 12.7 12.7 12.7Wheat gluten2 10.0 10.0 10.0 10.0Corn gluten3 10.0 10.0 10.0 10.0Wheat4 10.0 10.0 10.0 10.0Fish oil1 20.0 15.0 10.0 0.0Palm oil5 0.0 5.0 10.0 20.0Methionine 0.21 0.21 0.21 0.21Lysine 0.79 0.79 0.79 0.79Micronutrients6 2.41 2.41 2.41 2.41Vitamin E7 0.015 0.011 0.0076 0.0Ytrium oxide 0.02 0.02 0.02 0.02
Analyzed compositionMoisture 6.5 8.2 7.2 6.9Crude protein 47.9 46.5 47.8 46.7Crude lipid 22.3 21.5 22.5 23.3Ash 7.1 7.1 7.0 7.0Gross energy (kJ/g) 22.8 23.6 23.8 23.6
1Norsemeal Ltd., London, UK; 2Cargill, Swinderbury, UK; 3Cerestar UK
Ltd., Manchester, UK; 4J.D. Martin, Tranent, UK; 5United Plantations Bhd,
Jenderata Estate, Teluk Intan, Malaysia; 6Vitamins, minerals and astaxanthin
(Carophyl pink®), BioMar A/S, Brande, Denmark; 7Roche, Basel, Switzerland.

CHAPTER 3. PALM OIL IN RAINBOW TROUT
61
Table 3.2. Fatty acid composition (% of total fatty acids) of the experimental diets
Fatty acid P0 P25 P50 P10014:0 6.4 4.6 3.7 1.616:0 18.6 26.7 30.6 37.918:0 3.4 3.8 4.2 4.2Total saturated1 29.3 35.8 39.1 44.1
16:1n-7 6.7 4.5 3.5 1.018:1n-9 11.1 20.2 24.2 35.918:1n-7 2.5 1.9 1.8 0.620:1n-9 5.4 3.5 2.8 0.422:12 7.6 4.7 2.7 0.424:1n-9 0.7 0.4 0.3 0.1Total monoenes3 34.7 35.6 35.5 38.5
18:2n-6 5.9 8.1 9.1 11.820:2n-6 0.3 0.2 0.1 n.d.*
20:3n-6 0.1 0.1 tr.** n.d.20:4n-6 0.6 0.4 0.3 0.2Total n-6 PUFA4 7.2 9.0 9.9 12.1
18:3n-3 1.3 1.0 0.9 0.618:4n-3 2.9 1.9 1.4 0.220:4n-3 0.7 0.4 0.3 0.120:5n-3 9.2 6.0 4.7 1.222:5n-3 1.2 0.8 0.7 0.322:6n-3 11.3 7.9 6.4 2.7Total n-3 PUFA5 26.9 18.4 14.6 5.1
Total PUFA 36.0 28.5 25.4 17.4(n-3) / (n-6) 3.7 2.0 1.5 0.4
Values are mean ± S.D. (n=3). Values within a row with a different superscript letter aresignificantly different (P<0.05)1Includes 15:0, 20:0 & 22:0; 2Includes 22:1n-11 and 22:1n-9; 3Includes 16:1n-9 & 20:1n-7; 4Includes 18:3n-6, 22:4n-6 & 22:5n-6; 5Includes 20:3n-3 & 22:4n-3. * n.d.: Not detected; ** tr.: Detected as traces

CHAPTER 3. PALM OIL IN RAINBOW TROUT
62
Table 3.3. Growth and performance of rainbow trout fed the experimental diets for 4
and 10 weeks
Weight (g)Start 27.2 ± 0.7 26.6 ± 0.5 27.8 ± 0.4 27.3 ± 1.14 weeks 43.9 ± 5.2 40.9 ± 1.7 44.0 ± 0.7 42.3 ± 1.710 weeks 76.1 ± 4.5 81.0 ± 2.9 76.7 ± 7.1 70.1 ± 8.5
Length (cm)10 weeks 17.5 ± 0.4 17.9 ± 0.5 17.3 ± 0.6 16.8 ± 0.4
SGR0-4 weeks 1.48 ± 0.31 1.35 ± 0.12 1.43 ± 0.04 1.37 ± 0.234-10 weeks 1.46 ± 0.43 1.79 ± 0.18 1.45 ± 0.20 1.32 ± 0.36Overall 1.47 ± 0.11 1.59 ± 0.08 1.45 ± 0.13 1.34 ± 0.15
TGC0-4 weeks 1.24 ± 0.29 1.11 ± 0.11 1.20 ± 0.04 1.14 ± 0.204-10 weeks 1.44 ± 0.41 1.78 ± 0.18 1.45 ± 0.23 1.28 ± 0.37Overall 1.35 ± 0.11 1.47 ± 0.08 1.34 ± 0.14 1.22 ± 0.16
FCR0-4 weeks 0.71 ± 0.17 0.73 ± 0.06 0.72 ± 0.10 0.72 ± 0.11Overall 1.50 ± 0.21 1.44 ± 0.12 1.79 ± 0.62 1.68 ± 0.36
Mortalities 3 0 5 3
Values are mean ± S.D (n=3). Values within a row with a different superscript letter are significantlydifferent (P<0.05)
P0 P25 P50 P100

63
Table 3.4. Whole body proximate composition (g 100g-1, dry weight) of rainbow trout fed experimental palm oil diets for 4 and 10 weeks
Moisture 75.1 ± 1.3 70.8 ± 1.6 a 73.9 ± 0.2 b 71.1 ± 1.3 a 70.8 ± 0.4 a 71.0 ± 0.5 70.5 ± 0.5 70.5 ± 0.5 70.4 ± 0.6Protein 66.3 ± 2.1 55.5 ± 2.2 59.7 ± 0.8 56.1 ± 2.6 55.6 ± 0.4 55.5 ± 1.7 55.1 ± 2.8 54.7 ± 0.3 55.0 ± 0.3Lipid 23.0 ± 3.1 34.3 ± 3.0 29.3 ± 0.7 33.6 ± 4.0 35.0 ± 0.5 35.2 ± 0.7 35.8 ± 2.5 36.2 ± 1.0 35.8 ± 0.6Ash 9.8 ± 0.9 8.3 ± 0.2 9.5 ± 0.9 8.5 ± 1.1 8.2 ± 0.1 8.0 ± 0.4 7.6 ± 0.2 7.6 ± 0.5 7.8 ± 0.3
Values are mean ± S.D (n=3). Values within a row for each period with a different superscript letter are significantly different (P<0.05)
P1004 weeks 10 weeks
P0 P25 P50P100 Start
P0 P25 P50
CH
APTER
3. PA
LM O
IL IN R
AIN
BO
W T
RO
UT

CHAPTER 3. PALM OIL ON TROUT
64
Table 3.5. Total lipid (mg lipid g-1 tissue) and fatty acid compositions (% by weight of
total fatty acids) of muscle from rainbow trout fed the experimental diets for 10 weeks
Fatty AcidTotal lipid 17.5 ± 0.5 14.8 ± 0.2 16.6 ± 3.1 16.6 ± 2.3
14:0 4.2 ± 0.2 a 3.0 ± 0.3 b 2.7 ± 0.2 b 1.4 ± 0.1 c
16:0 22.4 ± 0.3 b 24.5 ± 1.9 a,b 24.2 ± 1.3 a,b 26.5 ± 1.3 a
18:0 4.3 ± 0.1 a 4.1 ± 0.2 a,b 3.8 ± 0.3 b 3.9 ± 0.2 a,b
Total saturated1 31.8 ± 0.5 32.3 ± 2.6 31.2 ± 1.9 32.3 ± 1.7
16:1n-7 5.2 ± 0.1 a 4.2 ± 0.3 b 4.0 ± 0.3 b 2.3 ± 0.3 c
18:1n-9 11.6 ± 0.7 d 16.4 ± 0.9 c 20.2 ± 1.9 b 26.9 ± 1.6 a
18:1n-7 2.4 ± 0.1 a 2.1 ± 0.1 b 2.0 ± 0.0 b 1.5 ± 0.2 c
20:1n-9 3.6 ± 0.4 a 2.8 ± 0.3 b 2.6 ± 0.1 b 2.0 ± 0.1 c
22:12 3.5 ± 0.3 a 2.5 ± 0.2 b 2.3 ± 0.2 b 1.0 ± 0.2 c
24:1n-9 0.7 ± 0.0 a 0.7 ± 0.1 a 0.6 ± 0.0 a 0.5 ± 0.0 b
Total monoenes3 27.2 ± 1.7 c 28.9 ± 1.6 b,c 32.0 ± 2.4 a,b 34.6 ± 1.2 a
18:2n-6 4.5 ± 0.2 d 5.7 ± 0.2 c 6.8 ± 0.4 b 9.0 ± 0.4 a
20:2n-6 0.4 ± 0.0 b 0.4 ± 0.0 b 0.4 ± 0.0 b 0.7 ± 0.1 a
20:3n-6 0.2 ± 0.0 b 0.2 ± 0.0 b 0.3 ± 0.0 b 0.6 ± 0.1 a
20:4n-6 0.7 ± 0.0 b 0.7 ± 0.0 b 0.6 ± 0.0 b 0.9 ± 0.1 a
Total n-6 PUFA4 6.1 ± 0.2 c 7.5 ± 0.3 b 8.5 ± 0.5 b 11.9 ± 0.7 a
18:3n-3 0.8 ± 0.0 a 0.7 ± 0.0 b 0.7 ± 0.0 b 0.4 ± 0.0 c
18:4n-3 1.1 ± 0.0 a 0.8 ± 0.0 b 0.7 ± 0.0 b,c 0.4 ± 0.2 c
20:4n-3 0.9 ± 0.1 a 0.7 ± 0.0 b 0.7 ± 0.0 b 0.3 ± 0.1 c
20:5n-3 5.9 ± 0.2 a 4.7 ± 0.3 a,b 4.2 ± 0.8 b 2.1 ± 0.5 c
22:5n-3 1.5 ± 0.0 a 1.2 ± 0.1 b 1.0 ± 0.0 c 0.5 ± 0.1 d
22:6n-3 24.5 ± 1.5 a 23.3 ± 1.7 a 21.0 ± 2.8 a,b 17.5 ± 2.5 b
Total n-3 PUFA5 34.9 ± 1.3 a 31.3 ± 1.5 a 28.2 ± 3.7 a,b 21.2 ± 3.3 b
Total PUFA 41.0 ± 1.1 a 38.8 ± 1.8 a,b 36.8 ± 3.2 a,b 33.1 ± 2.6 b
(n-3) / (n-6) 5.8 ± 0.5 a 4.2 ± 0.1 b 3.4 ± 0.7 b 1.8 ± 0.4 c
Values are mean ± S.D. (n=3). Values within a row with a different superscript letter aresignificantly different (P<0.05)1Includes 15:0, 20:0 & 22:0; 2Includes 22:1n-11 and 22:1n-9; 3Includes 16:1n-9 & 20:1n-7; 4Includes 18:3n-6, 22:4n-6 & 22:5n-6; 5Includes 20:3n-3 & 22:4n-3.
P50 P100P25P0
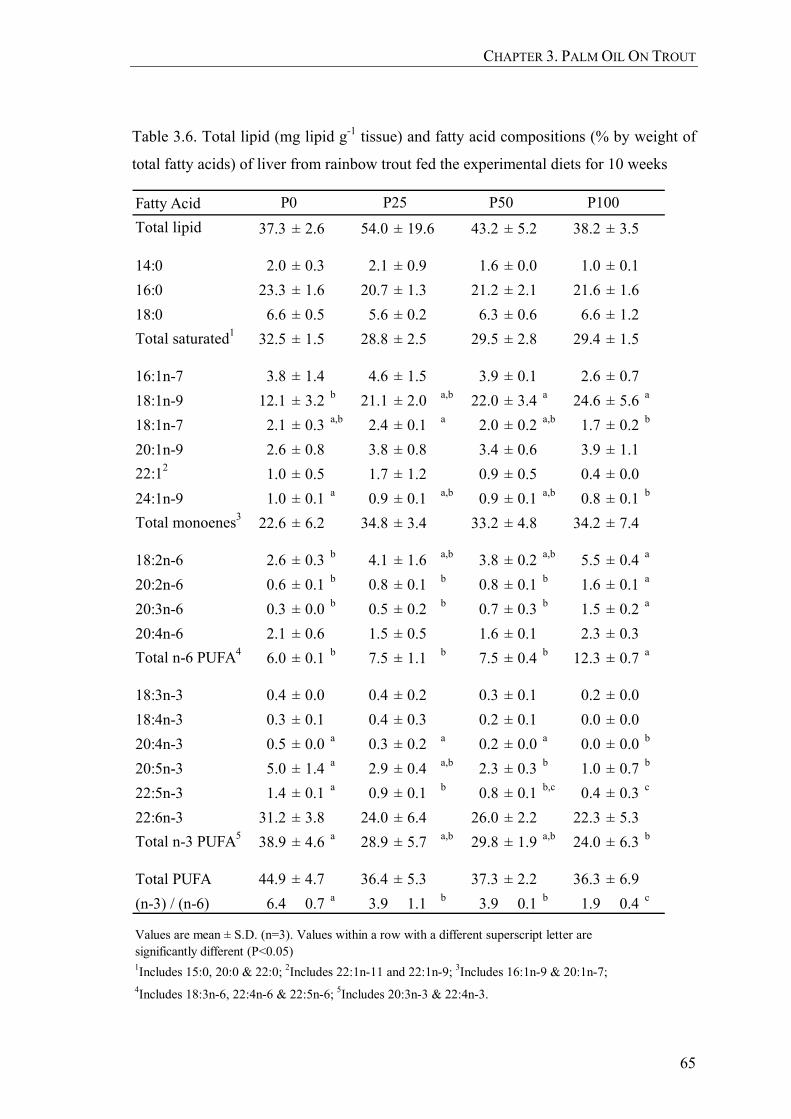
CHAPTER 3. PALM OIL ON TROUT
65
Table 3.6. Total lipid (mg lipid g-1 tissue) and fatty acid compositions (% by weight of
total fatty acids) of liver from rainbow trout fed the experimental diets for 10 weeks
Fatty AcidTotal lipid 37.3 ± 2.6 54.0 ± 19.6 43.2 ± 5.2 38.2 ± 3.5
14:0 2.0 ± 0.3 2.1 ± 0.9 1.6 ± 0.0 1.0 ± 0.116:0 23.3 ± 1.6 20.7 ± 1.3 21.2 ± 2.1 21.6 ± 1.618:0 6.6 ± 0.5 5.6 ± 0.2 6.3 ± 0.6 6.6 ± 1.2Total saturated1 32.5 ± 1.5 28.8 ± 2.5 29.5 ± 2.8 29.4 ± 1.5
16:1n-7 3.8 ± 1.4 4.6 ± 1.5 3.9 ± 0.1 2.6 ± 0.718:1n-9 12.1 ± 3.2 b 21.1 ± 2.0 a,b 22.0 ± 3.4 a 24.6 ± 5.6 a
18:1n-7 2.1 ± 0.3 a,b 2.4 ± 0.1 a 2.0 ± 0.2 a,b 1.7 ± 0.2 b
20:1n-9 2.6 ± 0.8 3.8 ± 0.8 3.4 ± 0.6 3.9 ± 1.122:12 1.0 ± 0.5 1.7 ± 1.2 0.9 ± 0.5 0.4 ± 0.024:1n-9 1.0 ± 0.1 a 0.9 ± 0.1 a,b 0.9 ± 0.1 a,b 0.8 ± 0.1 b
Total monoenes3 22.6 ± 6.2 34.8 ± 3.4 33.2 ± 4.8 34.2 ± 7.4
18:2n-6 2.6 ± 0.3 b 4.1 ± 1.6 a,b 3.8 ± 0.2 a,b 5.5 ± 0.4 a
20:2n-6 0.6 ± 0.1 b 0.8 ± 0.1 b 0.8 ± 0.1 b 1.6 ± 0.1 a
20:3n-6 0.3 ± 0.0 b 0.5 ± 0.2 b 0.7 ± 0.3 b 1.5 ± 0.2 a
20:4n-6 2.1 ± 0.6 1.5 ± 0.5 1.6 ± 0.1 2.3 ± 0.3Total n-6 PUFA4 6.0 ± 0.1 b 7.5 ± 1.1 b 7.5 ± 0.4 b 12.3 ± 0.7 a
18:3n-3 0.4 ± 0.0 0.4 ± 0.2 0.3 ± 0.1 0.2 ± 0.018:4n-3 0.3 ± 0.1 0.4 ± 0.3 0.2 ± 0.1 0.0 ± 0.020:4n-3 0.5 ± 0.0 a 0.3 ± 0.2 a 0.2 ± 0.0 a 0.0 ± 0.0 b
20:5n-3 5.0 ± 1.4 a 2.9 ± 0.4 a,b 2.3 ± 0.3 b 1.0 ± 0.7 b
22:5n-3 1.4 ± 0.1 a 0.9 ± 0.1 b 0.8 ± 0.1 b,c 0.4 ± 0.3 c
22:6n-3 31.2 ± 3.8 24.0 ± 6.4 26.0 ± 2.2 22.3 ± 5.3Total n-3 PUFA5 38.9 ± 4.6 a 28.9 ± 5.7 a,b 29.8 ± 1.9 a,b 24.0 ± 6.3 b
Total PUFA 44.9 ± 4.7 36.4 ± 5.3 37.3 ± 2.2 36.3 ± 6.9(n-3) / (n-6) 6.4 0.7 a 3.9 1.1 b 3.9 0.1 b 1.9 0.4 c
Values are mean ± S.D. (n=3). Values within a row with a different superscript letter aresignificantly different (P<0.05)1Includes 15:0, 20:0 & 22:0; 2Includes 22:1n-11 and 22:1n-9; 3Includes 16:1n-9 & 20:1n-7; 4Includes 18:3n-6, 22:4n-6 & 22:5n-6; 5Includes 20:3n-3 & 22:4n-3.
P0 P25 P50 P100
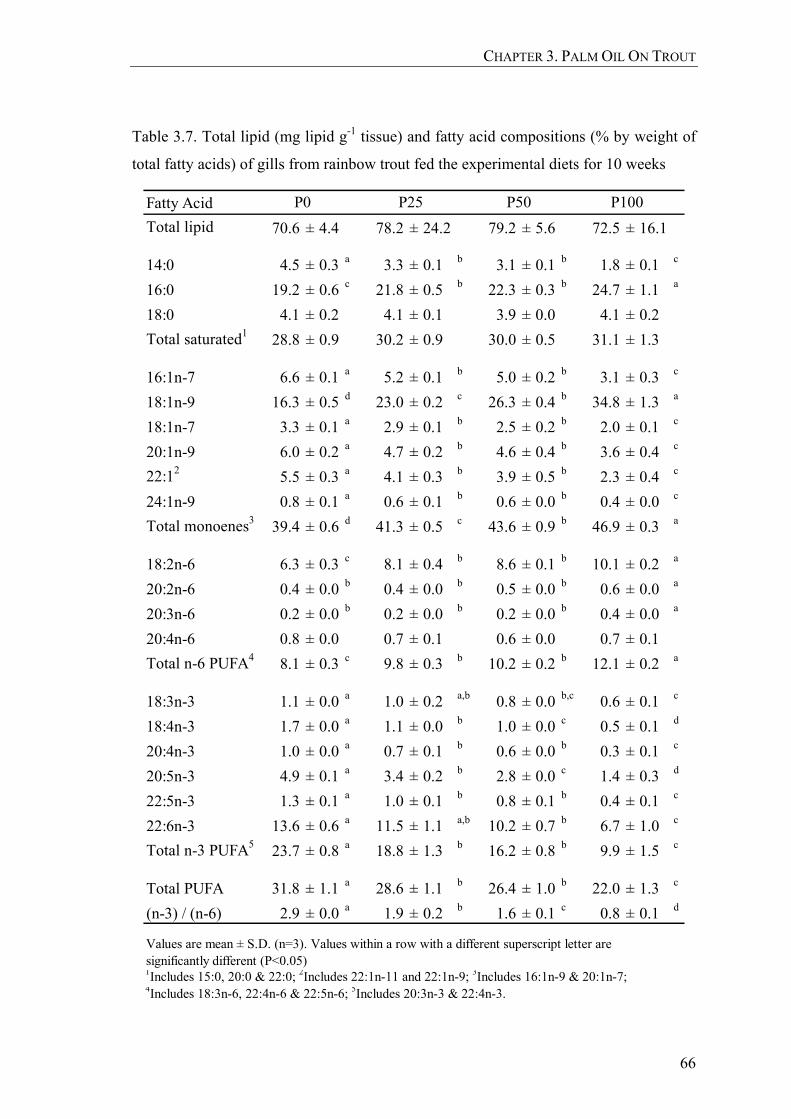
CHAPTER 3. PALM OIL ON TROUT
66
Table 3.7. Total lipid (mg lipid g-1 tissue) and fatty acid compositions (% by weight of
total fatty acids) of gills from rainbow trout fed the experimental diets for 10 weeks
Fatty AcidTotal lipid 70.6 ± 4.4 78.2 ± 24.2 79.2 ± 5.6 72.5 ± 16.1
14:0 4.5 ± 0.3 a 3.3 ± 0.1 b 3.1 ± 0.1 b 1.8 ± 0.1 c
16:0 19.2 ± 0.6 c 21.8 ± 0.5 b 22.3 ± 0.3 b 24.7 ± 1.1 a
18:0 4.1 ± 0.2 4.1 ± 0.1 3.9 ± 0.0 4.1 ± 0.2Total saturated1 28.8 ± 0.9 30.2 ± 0.9 30.0 ± 0.5 31.1 ± 1.3
16:1n-7 6.6 ± 0.1 a 5.2 ± 0.1 b 5.0 ± 0.2 b 3.1 ± 0.3 c
18:1n-9 16.3 ± 0.5 d 23.0 ± 0.2 c 26.3 ± 0.4 b 34.8 ± 1.3 a
18:1n-7 3.3 ± 0.1 a 2.9 ± 0.1 b 2.5 ± 0.2 b 2.0 ± 0.1 c
20:1n-9 6.0 ± 0.2 a 4.7 ± 0.2 b 4.6 ± 0.4 b 3.6 ± 0.4 c
22:12 5.5 ± 0.3 a 4.1 ± 0.3 b 3.9 ± 0.5 b 2.3 ± 0.4 c
24:1n-9 0.8 ± 0.1 a 0.6 ± 0.1 b 0.6 ± 0.0 b 0.4 ± 0.0 c
Total monoenes3 39.4 ± 0.6 d 41.3 ± 0.5 c 43.6 ± 0.9 b 46.9 ± 0.3 a
18:2n-6 6.3 ± 0.3 c 8.1 ± 0.4 b 8.6 ± 0.1 b 10.1 ± 0.2 a
20:2n-6 0.4 ± 0.0 b 0.4 ± 0.0 b 0.5 ± 0.0 b 0.6 ± 0.0 a
20:3n-6 0.2 ± 0.0 b 0.2 ± 0.0 b 0.2 ± 0.0 b 0.4 ± 0.0 a
20:4n-6 0.8 ± 0.0 0.7 ± 0.1 0.6 ± 0.0 0.7 ± 0.1Total n-6 PUFA4 8.1 ± 0.3 c 9.8 ± 0.3 b 10.2 ± 0.2 b 12.1 ± 0.2 a
18:3n-3 1.1 ± 0.0 a 1.0 ± 0.2 a,b 0.8 ± 0.0 b,c 0.6 ± 0.1 c
18:4n-3 1.7 ± 0.0 a 1.1 ± 0.0 b 1.0 ± 0.0 c 0.5 ± 0.1 d
20:4n-3 1.0 ± 0.0 a 0.7 ± 0.1 b 0.6 ± 0.0 b 0.3 ± 0.1 c
20:5n-3 4.9 ± 0.1 a 3.4 ± 0.2 b 2.8 ± 0.0 c 1.4 ± 0.3 d
22:5n-3 1.3 ± 0.1 a 1.0 ± 0.1 b 0.8 ± 0.1 b 0.4 ± 0.1 c
22:6n-3 13.6 ± 0.6 a 11.5 ± 1.1 a,b 10.2 ± 0.7 b 6.7 ± 1.0 c
Total n-3 PUFA5 23.7 ± 0.8 a 18.8 ± 1.3 b 16.2 ± 0.8 b 9.9 ± 1.5 c
Total PUFA 31.8 ± 1.1 a 28.6 ± 1.1 b 26.4 ± 1.0 b 22.0 ± 1.3 c
(n-3) / (n-6) 2.9 ± 0.0 a 1.9 ± 0.2 b 1.6 ± 0.1 c 0.8 ± 0.1 d
Values are mean ± S.D. (n=3). Values within a row with a different superscript letter aresignificantly different (P<0.05)1Includes 15:0, 20:0 & 22:0; 2Includes 22:1n-11 and 22:1n-9; 3Includes 16:1n-9 & 20:1n-7; 4Includes 18:3n-6, 22:4n-6 & 22:5n-6; 5Includes 20:3n-3 & 22:4n-3.
P50 P100P25P0

CHAPTER 3. PALM OIL ON TROUT
67
Table 3.8. Total lipid (mg lipid g-1 tissue) and fatty acid compositions (% by weight of
total fatty acids) of heart from rainbow trout fed the experimental diets for 10 weeks
Fatty AcidTotal lipid 29.3 ± 6.3 29.2 ± 7.7 27.5 ± 2.5 34.8 ± 3.2
14:0 2.0 ± 0.7 a 1.6 ± 0.3 a,b 1.5 ± 0.3 a,b 0.8 ± 0.0 b
16:0 23.8 ± 0.7 24.0 ± 2.2 24.0 ± 2.7 25.4 ± 0.718:0 6.3 ± 0.2 5.7 ± 0.5 5.5 ± 0.5 5.2 ± 0.5Total saturated1 33.8 ± 0.5 31.9 ± 3.2 31.9 ± 3.9 31.9 ± 0.9
16:1n-7 3.5 ± 0.5 a 2.8 ± 0.6 a 2.5 ± 0.4 a,b 1.5 ± 0.1 b
18:1n-9 10.5 ± 1.1 b 16.7 ± 1.6 b 18.0 ± 3.0 b 27.1 ± 5.7 a
18:1n-7 2.4 ± 0.2 2.2 ± 0.1 2.0 ± 0.2 1.8 ± 0.420:1n-9 2.7 ± 0.6 a 2.4 ± 0.1 a,b 2.0 ± 0.3 a,b 1.6 ± 0.3 b
22:12 2.5 ± 0.5 a 2.0 ± 0.2 a,b 1.5 ± 0.3 b 0.6 ± 0.0 c
24:1n-9 1.2 ± 0.2 1.2 ± 0.2 1.1 ± 0.3 0.8 ± 0.2Total monoenes3 23.0 ± 2.9 b 27.9 ± 2.4 a,b 27.5 ± 3.8 a,b 34.2 ± 5.2 a
18:2n-6 3.7 ± 0.7 b 5.3 ± 0.7 b 5.6 ± 1.1 b 8.8 ± 1.4 a
20:2n-6 0.3 ± 0.1 b 0.4 ± 0.0 b 0.4 ± 0.0 b 0.7 ± 0.2 a
20:3n-6 0.3 ± 0.0 b 0.4 ± 0.1 b 0.4 ± 0.0 b 0.8 ± 0.1 a
20:4n-6 1.4 ± 0.1 1.3 ± 0.3 1.4 ± 0.3 1.6 ± 0.6Total n-6 PUFA4 6.2 ± 0.7 c 8.0 ± 0.4 b,c 8.5 ± 0.9 b 12.7 ± 0.8 a
18:3n-3 0.8 ± 0.1 a 0.6 ± 0.1 a,b 0.6 ± 0.1 b 0.4 ± 0.1 c
18:4n-3 0.8 ± 0.2 a 0.5 ± 0.1 a,b 0.4 ± 0.1 b,c 0.1 ± 0.0 c
20:4n-3 0.7 ± 0.1 a 0.6 ± 0.0 a,b 0.5 ± 0.1 b 0.2 ± 0.0 c
20:5n-3 6.3 ± 0.7 a 4.4 ± 0.4 b 4.2 ± 0.9 b 1.5 ± 0.7 c
22:5n-3 1.6 ± 0.0 a 1.2 ± 0.1 b 1.1 ± 0.1 b 0.5 ± 0.2 c
22:6n-3 26.8 ± 3.0 24.8 ± 4.7 25.3 ± 4.6 18.5 ± 5.4Total n-3 PUFA5 36.9 ± 3.2 a 32.2 ± 5.0 a,b 32.1 ± 5.3 a,b 21.2 ± 6.1 b
Total PUFA 43.1 ± 2.5 40.2 ± 4.6 40.6 ± 4.7 33.9 ± 5.4(n-3) / (n-6) 6.1 ± 1.3 a 4.1 ± 0.8 a,b 3.9 ± 1.0 a,b 1.7 ± 0.6 b
Values are mean ± S.D. (n=3). Values within a row with a different superscript letter aresignificantly different (P<0.05)1Includes 15:0, 20:0 & 22:0; 2Includes 22:1n-11 and 22:1n-9; 3Includes 16:1n-9 & 20:1n-7; 4Includes 18:3n-6, 22:4n-6 & 22:5n-6; 5Includes 20:3n-3 & 22:4n-3.
P50 P100P25P0

CHAPTER 3. PALM OIL ON TROUT
68
Table 3.9. Total lipid (mg lipid g-1 tissue) and fatty acid compositions (% by weight of
total fatty acids) of kidney from rainbow trout fed the experimental diets for 10 weeks
Fatty AcidTotal lipid 50.1 ± 11.8 47.8 ± 5.8 40.7 ± 9.7 43.3 ± 1.9
14:0 4.1 ± 0.5 a 2.8 ± 0.1 b 2.3 ± 0.1 c 1.2 ± 0.0 d
16:0 22.6 ± 0.9 b 24.7 ± 1.2 b 24.8 ± 0.8 a,b 27.5 ± 1.2 a
18:0 4.5 ± 0.3 4.3 ± 0.2 4.3 ± 0.1 4.4 ± 0.2Total saturated1 32.4 ± 1.2 32.6 ± 1.8 32.1 ± 1.4 33.7 ± 1.8
16:1n-7 5.5 ± 0.8 a 4.0 ± 0.2 b 3.7 ± 0.2 b 2.0 ± 0.1 c
18:1n-9 14.2 ± 1.0 c 20.6 ± 0.9 b 22.8 ± 1.4 b 31.0 ± 0.8 a
18:1n-7 3.1 ± 0.3 a 2.6 ± 0.1 a,b 2.4 ± 0.2 b,c 2.0 ± 0.1 c
20:1n-9 3.8 ± 0.6 a 3.0 ± 0.2 a,b 2.5 ± 0.4 b,c 1.8 ± 0.2 c
22:12 3.4 ± 0.6 a 2.5 ± 0.1 a,b 1.9 ± 0.3 b 0.7 ± 0.2 c
24:1n-9 0.9 ± 0.1 a 0.8 ± 0.1 a 0.9 ± 0.0 a 0.6 ± 0.1 b
Total monoenes3 31.6 ± 3.1 b 34.2 ± 1.4 a,b 35.0 ± 1.8 a,b 39.0 ± 0.6 a
18:2n-6 5.1 ± 0.6 c 6.7 ± 0.4 b 7.0 ± 0.2 b 9.3 ± 0.1 a
20:2n-6 0.4 ± 0.0 b 0.4 ± 0.0 b 0.5 ± 0.0 b 0.7 ± 0.1 a
20:3n-6 0.2 ± 0.0 c 0.3 ± 0.0 b,c 0.3 ± 0.0 b 0.6 ± 0.1 a
20:4n-6 1.3 ± 0.3 b 1.3 ± 0.2 b 1.4 ± 0.0 a,b 1.9 ± 0.1 a
Total n-6 PUFA4 7.4 ± 0.4 c 9.1 ± 0.2 b 9.6 ± 0.2 b 13.1 ± 0.3 a
18:3n-3 0.9 ± 0.1 a 0.7 ± 0.0 b 0.6 ± 0.0 b 0.3 ± 0.0 c
18:4n-3 1.2 ± 0.2 a 0.7 ± 0.0 b 0.6 ± 0.1 b 0.2 ± 0.0 c
20:4n-3 0.8 ± 0.0 a 0.6 ± 0.1 b 0.5 ± 0.0 b 0.2 ± 0.1 c
20:5n-3 6.4 ± 0.8 a 4.9 ± 0.3 b 4.4 ± 0.5 b 1.8 ± 0.5 c
22:5n-3 1.3 ± 0.1 a 0.9 ± 0.1 b 0.8 ± 0.0 b 0.3 ± 0.1 c
22:6n-3 17.8 ± 2.8 a 16.2 ± 0.5 a 16.4 ± 1.0 a 11.5 ± 1.4 b
Total n-3 PUFA5 28.5 ± 3.2 a 24.1 ± 0.6 a 23.3 ± 1.5 a 14.2 ± 2.0 b
Total PUFA 36.0 ± 3.1 a 33.2 ± 0.5 a 32.9 ± 1.3 a 27.3 ± 1.9 b
(n-3) / (n-6) 3.9 ± 0.5 a 2.7 ± 0.1 b 2.4 ± 0.2 b 1.1 ± 0.2 c
Values are mean ± S.D. (n=3). Values within a row with a different superscript letter aresignificantly different (P<0.05)1Includes 15:0, 20:0 & 22:0; 2Includes 22:1n-11 and 22:1n-9; 3Includes 16:1n-9 & 20:1n-7; 4Includes 18:3n-6, 22:4n-6 & 22:5n-6; 5Includes 20:3n-3 & 22:4n-3.
P50 P100P25P0
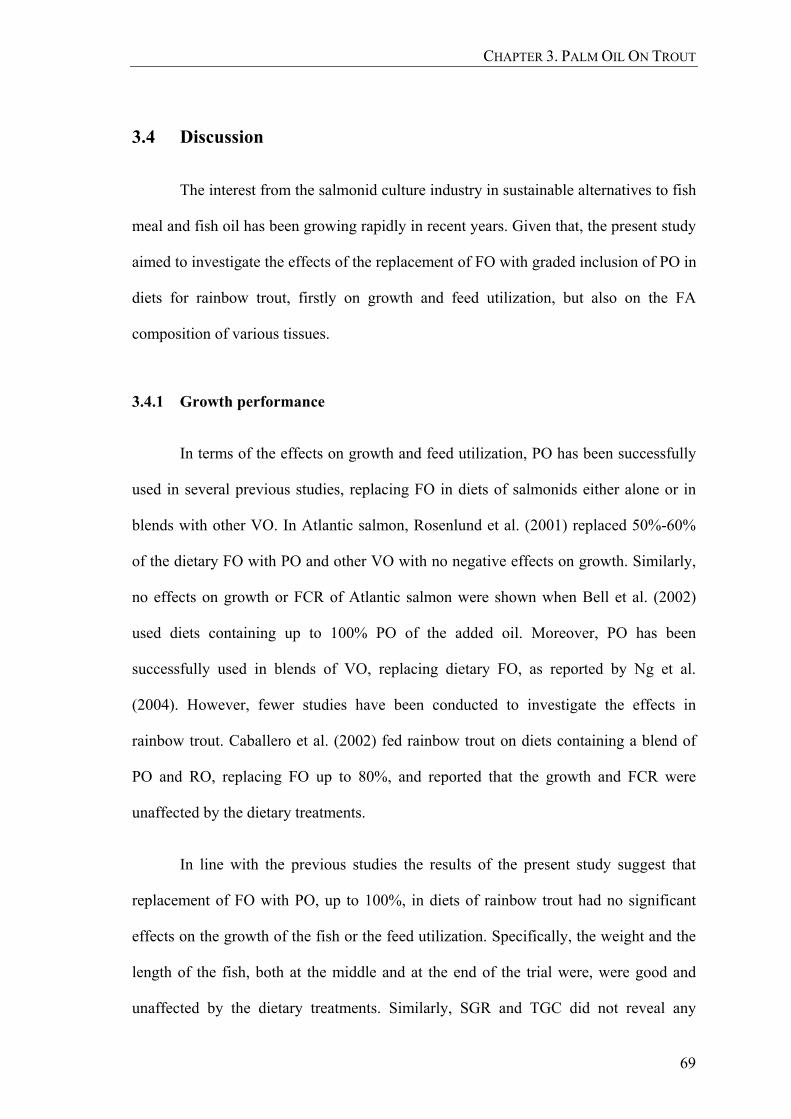
CHAPTER 3. PALM OIL ON TROUT
69
3.4 Discussion
The interest from the salmonid culture industry in sustainable alternatives to fish
meal and fish oil has been growing rapidly in recent years. Given that, the present study
aimed to investigate the effects of the replacement of FO with graded inclusion of PO in
diets for rainbow trout, firstly on growth and feed utilization, but also on the FA
composition of various tissues.
3.4.1 Growth performance
In terms of the effects on growth and feed utilization, PO has been successfully
used in several previous studies, replacing FO in diets of salmonids either alone or in
blends with other VO. In Atlantic salmon, Rosenlund et al. (2001) replaced 50%-60%
of the dietary FO with PO and other VO with no negative effects on growth. Similarly,
no effects on growth or FCR of Atlantic salmon were shown when Bell et al. (2002)
used diets containing up to 100% PO of the added oil. Moreover, PO has been
successfully used in blends of VO, replacing dietary FO, as reported by Ng et al.
(2004). However, fewer studies have been conducted to investigate the effects in
rainbow trout. Caballero et al. (2002) fed rainbow trout on diets containing a blend of
PO and RO, replacing FO up to 80%, and reported that the growth and FCR were
unaffected by the dietary treatments.
In line with the previous studies the results of the present study suggest that
replacement of FO with PO, up to 100%, in diets of rainbow trout had no significant
effects on the growth of the fish or the feed utilization. Specifically, the weight and the
length of the fish, both at the middle and at the end of the trial were, were good and
unaffected by the dietary treatments. Similarly, SGR and TGC did not reveal any

CHAPTER 3. PALM OIL ON TROUT
70
negative impacts of the PO dietary inclusion at any stage of the feeding trial. Lastly,
feed utilization, as indicated by the FCR, was good, especially for the first 4 weeks of
the trial, and unaffected by the dietary inclusion levels of PO. However, the higher FCR
for the whole experimental period could be explained, at least partially, by the lower
lipid and specific FA (especially saturates) digestibility that PO diets have been
reported to have, especially at low culture temperatures, and the fish compensating for
any energy loss by increasing their feed intake (Torstensen, et al., 2000; Caballero, et
al., 2002; Ng, et al., 2003; Ng, et al., 2004). Nevertheless, the rich content of 16:0 and
18:1n-9 in PO seems to play a role in the overall growth of the fish as these FA have
been reported to be preferentially catabolised for energy production (Kiessling and
Kiessling, 1993; Henderson, 1996; Caballero, et al., 2002). The results of the present
study are in agreement with that hypothesis.
3.4.2 Body composition
The body chemical composition of the fish is of importance as it may affect the
quality of the final product or characteristics involved in further processing. However,
the results of previous studies regarding the effects of the replacement of FO with VO
in salmonids are, to some extent, controversial. For example, previous studies in
Atlantic salmon reported that replacement of dietary FO with VO affected the whole
body chemical composition (Bell, et al., 2001a; Torstensen, et al., 2004b; Ruyter, et al.,
2006), while, other studies have shown no significant effects on body composition due
to use of VO (Bendiksen, et al., 2003b). Moreover, different VO, including PO, seem to
have different effects on fish body composition (Rosenlund, et al., 2001; Bell, et al.,
2002). Specifically, Bell et al. (2002) reported that inclusion of PO resulted in lower
body lipid and higher protein contents compared to the fish fed on a FO diet. On the

CHAPTER 3. PALM OIL ON TROUT
71
contrary, Rosenlund et al. (2001) showed that the inclusion of PO had no significant
effect on fillet proximate composition of Atlantic salmon when compared to FO fed
fish, although there were differences with other VO. In agreement with the latter, the
results of the present study suggest that PO had no significant effects on the whole body
proximate composition of rainbow trout, although this was a relatively short period
feeding trial. The reasons for the differences observed between trials could be down to a
number of factors, including the size of fish used, the rate of growth obtained, the
temperature of culture, the duration of and the season when the trial was conducted as
well as genetic variation in the salmon strains. The effects of PO inclusion in rainbow
trout over the whole production cycle should be further investigated.
3.4.3 Tissue fatty acid composition
Several previous studies have shown that the FA compositions of fish tissues
reflect that of the dietary FA and are significantly affected by the changes induced by
the inclusion of VO. In addition, linear correlations have been reported between
individual FA in tissue total lipid and their concentrations in dietary lipid (Bell, et al.,
2001a; Bell, et al., 2003a; Tocher, et al., 2003a).
PO is rich in saturated FA and monoenes, largely 16:0 and 18:1n-9,
respectively, while it lacks n-3 HUFA. Obviously, such an FA composition differs
dramatically from the FA composition of the FO and hence, dietary inclusion of PO at
expense of FO will affect the tissue FA composition of the fish. This has been shown in
previous studies where PO was included as replacement for FO in diets for rainbow
trout (Caballero, et al., 2002; Tocher, et al., 2004) and Atlantic salmon (Torstensen, et
al., 2000; Rosenlund, et al., 2001; Ng, et al., 2004). Moreover, Bell et al. (2002)
reported that linear correlations existed between the diet total lipid specific FA and the

CHAPTER 3. PALM OIL ON TROUT
72
respective FA in the flesh of Atlantic salmon fed on diets where PO replaced FO up to
100%. The results of the present study are clearly in agreement with these, showing
significant differences in the muscle, liver, gills, heart and kidney of the fish due to the
inclusion of PO. In general, in the tissues examined, the graded inclusion of PO in the
diets, resulted in minor changes in the saturated FA, in a 2-fold or more increase in
18:1n-9, in a 2-fold increase in 18:2n-6, and in decreases in 18:3n-3 and EPA, by half
and more than 3-fold, respectively.
However, specific FA were preferably utilized or retained in the tissues, in
agreement with previous studies in salmonids fed on PO diets (Rosenlund, et al., 2001;
Bell, et al., 2002). In the present study, 16:0 was almost doubled in the diets with
increasing PO. However, it was in general unaffected in the fish tissues; slight increases
were shown only in muscle, gills and kidney, but not in liver and heart, while these
differences were significant only between the P0 and P100 groups. This could be due to
the fact that 16:0 is a preferentially utilized for energy, as it is a good substrate for
β-oxidation in rainbow trout (Henderson, 1996), but also because only a small amount
of it was finally available to the fish due its reduced digestibility (Torstensen, et al.,
2000; Caballero, et al., 2002; Ng, et al., 2003; Ng, et al., 2004). The differing
incorporation of 16:0 in the tissues will also be related to the relative levels of lipid
storage in the individual tissues. Thus, the leaner tissues, such as liver and heart, which
contain more polar lipid than TAG, in comparison with gill, muscle and kidney, will
tend to store less 16:0 than tissues where adiposity is greater (Sargent, et al., 2002).
Moreover, 18:1n-9 was found in lower proportions in the tissues compared to the diets,
while 20:1n-9 and 22:1 were found in higher proportions indicating utilization and
retention of these FA, respectively, in line with the findings of Bell et al. (2002). The n-
6 FA 20:2n-6 and 20:3n-6 were generally increased while ARA was either unaffected

CHAPTER 3. PALM OIL ON TROUT
73
or increased slightly, with increasing dietary PO, in the different tissues although these
FA were reduced in the diets. This was probably due to increased desaturation and
elongation of 18:2n-6 in fish fed PO and was more noticeable in this study where there
was no dietary 18:3n-3 increase. Previous studies have shown higher hepatic
desaturation and elongation activities with dietary PO inclusion compared to other
vegetable oils (Bell, et al., 2001a; Bell, et al., 2002). This is probably caused by lack of
competition between 18:2n-6 and 18:3n-3 for the Δ6-desaturase when PO was used
compared to other VO such as rapeseed and linseed oils which both contain appreciable
amounts of 18:3n-3 that would tend to inhibit conversion of 18:2n-6 to ARA (Bell, et
al., 2001a; Tocher, et al., 2003a). EPA was significantly decreased in all tissues,
however not to the same large extent as in the diets. Noticeably, in the muscle it was
reduced only by 3-fold, between P0 and P100, while in other tissues the decrease was 5-
fold and in the diets 9-fold. Moreover, although DHA was dramatically decreased in the
diets contained PO, it was only slightly affected in the tissues, with significant
differences shown when replacement was more than 50% of the FO. Hence, preferential
retention of these n-3 FA occurred, although increased desaturation and elongation of
18:3n-3 may also have contributed in part to the increased retention.
Moreover, there were some differences in the FA compositions between the
different tissues, in terms of the changes shown due to the dietary inclusion of PO and
the extent that these occurred. It is known that different tissues are not affected by
dietary FA composition to the same degree (Tocher and Harvie, 1988; Brodtkorb, et al.,
1997; Rosenlund, et al., 2001). In the present study, 16:0 was increased in muscle, gills
and kidney whereas it was unaffected in liver and heart. Moreover, EPA was decreased
by approximately 5-fold in liver, heart and kidney but only 3- fold in muscle and gills.
Such variability may be induced by the differences in the tissues physiology and role,

CHAPTER 3. PALM OIL ON TROUT
74
their energy requirements and β-oxidation capacity, their ability for desaturation and
elongation of specific FA, their composition in terms of the lipid level and the lipid
classes that their lipid is constituted of (phospholipids or TAG) and the extent to which
lipid deposition occurs in individual tissues.
3.5 Conclusions
The results of the present study, aiming to investigate the effects of graded
inclusion of PO, up to complete replacement of FO, in diets of rainbow trout, showed
no negative results in growth, feed utilization and proximate composition of the fish.
This suggests that PO can be successfully used as a sustainable alternative to FO in
rainbow trout nutrition. However, the dietary PO inclusion resulted in significant
changes in the FA compositions of the fish tissues, especially at replacement levels of
over 50%. These changes, including reductions in n-3 HUFA and the n-3/n-6 ratio, may
have a serious impact on the quality of the final product, in terms of its nutritional value
to the human consumer, although, it should be noted that the reduction in EPA and
especially in DHA were only modest.

Chapter 4. Dietary protein / lipid ratio and rapeseed oil
interactions in Atlantic salmon – I

CHAPTER 4. PROTEIN/LIPID & RO INTERACTIONS IN SALMON – I
76
4.1 Introduction
As discussed thoroughly in the “General Introduction”, marine FM and FO
have, traditionally, been the major protein and oil sources in aquafeeds, especially for
salmonids (Sargent and Tacon, 1999; Tacon, 2005). However, given that the resources
of wild feed grade fisheries will remain static, while the demand for FM and FO by the
aquaculture feed industry will grow significantly in the next decade, the strong
dependence of the salmon industry on these commodities could be risky to the long
term viability of the sector (Sargent and Tacon, 1999; Tidwell and Allan, 2002; Tacon,
2004).
Vegetable oils (VO) represent sustainable alternatives to FO although, the
replacement of FO with VO can be challenging, as VO lack the n-3 highly unsaturated
fatty acids (HUFA) which are abundant in FO (discussed in paragraph 1.4.2). The n-3
HUFA, especially EPA and DHA, are not only essential for the optimal growth and
development of salmon but they are also accumulated in the fish flesh providing a
highly nutritious and health promoting product for the human consumer (De Deckere, et
al., 1998; Horrocks and Yeo, 1999; ISSFAL, 2000; Simopoulos, 2003). Hence, any
reductions of EPA, DHA and the n-3/n-6 FA ratio in fish tissues, resulting from the
replacement of FO with VO, are undesirable (Bell, et al., 2001a; Rosenlund, et al.,
2001; Bell, et al., 2003a). However, as discussed previously in detail (paragraph 1.4.4),
RO is considered to be a good substitute for FO both because of its high availability
(U.S. Department for Agriculture, 2007) but also because of its nutritional properties
for human health (Ackman, 1990) and specifically its FA composition, being rich in
18:1n-9 and moderate in 18:2n-6 (Bell, et al., 2001a).
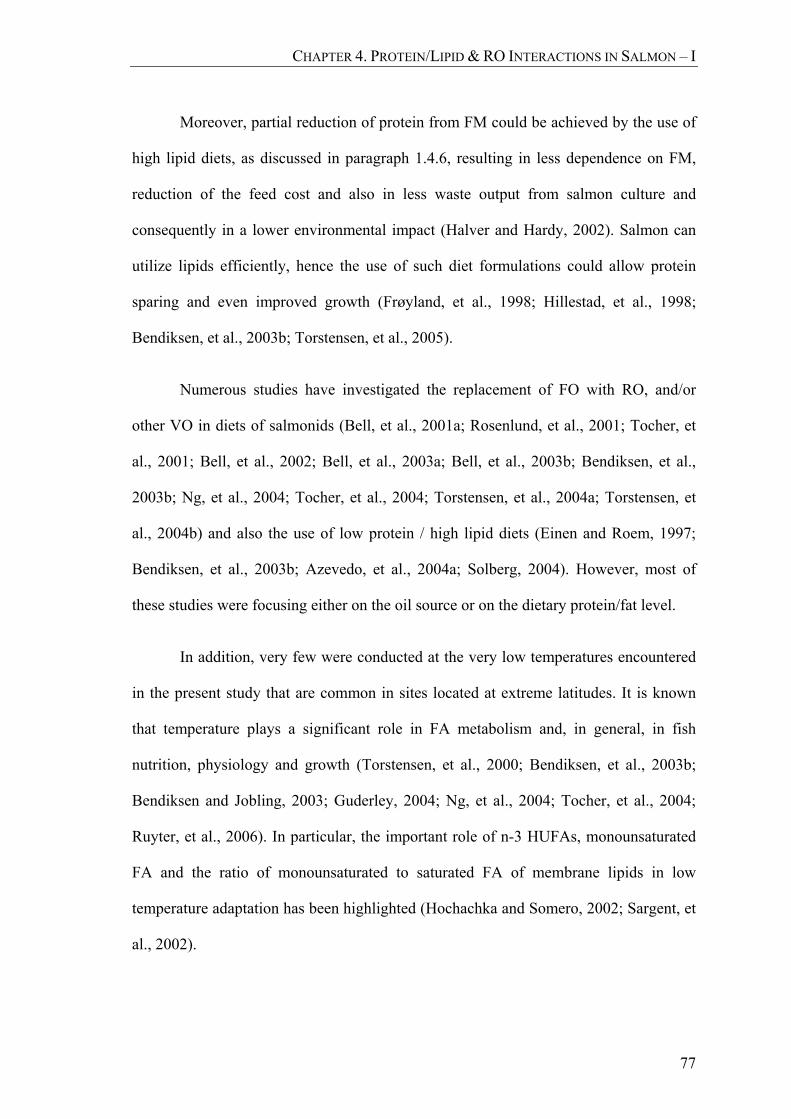
CHAPTER 4. PROTEIN/LIPID & RO INTERACTIONS IN SALMON – I
77
Moreover, partial reduction of protein from FM could be achieved by the use of
high lipid diets, as discussed in paragraph 1.4.6, resulting in less dependence on FM,
reduction of the feed cost and also in less waste output from salmon culture and
consequently in a lower environmental impact (Halver and Hardy, 2002). Salmon can
utilize lipids efficiently, hence the use of such diet formulations could allow protein
sparing and even improved growth (Frøyland, et al., 1998; Hillestad, et al., 1998;
Bendiksen, et al., 2003b; Torstensen, et al., 2005).
Numerous studies have investigated the replacement of FO with RO, and/or
other VO in diets of salmonids (Bell, et al., 2001a; Rosenlund, et al., 2001; Tocher, et
al., 2001; Bell, et al., 2002; Bell, et al., 2003a; Bell, et al., 2003b; Bendiksen, et al.,
2003b; Ng, et al., 2004; Tocher, et al., 2004; Torstensen, et al., 2004a; Torstensen, et
al., 2004b) and also the use of low protein / high lipid diets (Einen and Roem, 1997;
Bendiksen, et al., 2003b; Azevedo, et al., 2004a; Solberg, 2004). However, most of
these studies were focusing either on the oil source or on the dietary protein/fat level.
In addition, very few were conducted at the very low temperatures encountered
in the present study that are common in sites located at extreme latitudes. It is known
that temperature plays a significant role in FA metabolism and, in general, in fish
nutrition, physiology and growth (Torstensen, et al., 2000; Bendiksen, et al., 2003b;
Bendiksen and Jobling, 2003; Guderley, 2004; Ng, et al., 2004; Tocher, et al., 2004;
Ruyter, et al., 2006). In particular, the important role of n-3 HUFAs, monounsaturated
FA and the ratio of monounsaturated to saturated FA of membrane lipids in low
temperature adaptation has been highlighted (Hochachka and Somero, 2002; Sargent, et
al., 2002).

CHAPTER 4. PROTEIN/LIPID & RO INTERACTIONS IN SALMON – I
78
The aim of this trial was to elucidate the interactive effects of dietary fat and
protein contents and oil source on growth, whole body proximate composition and fatty
acid composition of liver and muscle in Atlantic salmon at low water temperatures.
4.2 Materials and methods
4.2.1 Fish and culture conditions
Atlantic salmon (Salmo salar) of the NLA strain (03G) with overall mean
weight of 1168g were randomly distributed into 18 sea cages of 125 m3 (5x5x5m) with
137 fish in each cage. Prior to the trial, the fish were stocked in two trial cages and
acclimatised for six weeks. The fish were subjected to artificial light (LD24:0) from the
middle of December at decreasing ambient temperature (varying between 4-6 °C).
During this holding period the fish were fed commercial pelleted feed (BioOptimal
CPK, 9mm, BioMar AS, Norway) in accordance with the manufacturer's
recommendations. During the experimental period (February – April 2004) the fish
were subjected to artificial light (LD 24:0), provided from sub-merged light (one 400W
bulb shared by four cages). The temperature varied from 2.8 °C to 7.3 °C with an
average temperature of 4.2 ± 0.8 °C. At the beginning of the trial the temperature was
4.5 °C whereas at the last sampling it was 6.7 °C. Salinity was 34.0 ± 0.8 g L-1. Fish
were bulk weighed at the start of the trial, after 6 weeks, and at the end of the trial (12
weeks). Mortalities were recorded and dead fish were removed daily.
4.2.2 Experimental diets
Six isoenergetic, practical-type extruded diets (9 mm) were formulated (BioMar
TechCentre, Brande, Denmark) to provide either 390 g kg-1 protein and 320 g kg-1 fat

CHAPTER 4. PROTEIN/LIPID & RO INTERACTIONS IN SALMON – I
79
(high protein (HP) diets) or 340 g kg-1 protein and 360 g kg-1 fat (low protein (LP)
diets). Within each dietary fat and protein level crude RO comprised 0, 30 or 60% (R0,
R30, R60) of the total added oil, the remainder of which was FO (Table 4.1). The diets
were formulated to meet all the known nutritional requirements of salmonid fish (NRC,
1993). The proximate composition of the experimental diets is shown in Table 4.1 and
the FA compositions are shown in Table 4.2. Each of the six experimental feeds was
fed daily to satiation by hand to triplicate groups (cages) of fish. When sea temperature
was below 5°C the fish were fed to satiation once a day. Above 5°C, two daily meals
were provided with a minimum of 4 hours between the meals. In order to facilitate
accurate calculations of feed intake and FCR, feed wastage was collected using a lift-up
system and calculated on a daily basis.
4.2.3 Sampling procedure
Samples were taken from all diets and stored at -20 °C until analyzed. At the
start of the experiment an initial sample of six fish was taken to determine baseline
values of whole body proximate composition. At the end of the trial (12th week) three
fish per cage were sampled at random from the population in each cage for lipid and FA
composition of liver and muscle. Another sample of three fish per cage was used for
whole body proximate composition.
Fish were killed with a sharp blow to the head and samples of tissues were
dissected and immediately placed in liquid nitrogen as described in the “General
Materials and Methods” section. Viscera, liver and heart weights from four fish per
cage were recorded for measurement of viscero-somatic index (VSI), hepato-somatic
index (HSI) and cardio-somatic index (CSI), respectively. For whole body analysis fish
were minced and homogenate sub-samples of each fish were obtained. Initial whole

CHAPTER 4. PROTEIN/LIPID & RO INTERACTIONS IN SALMON – I
80
body samples were pooled in pairs so three samples were finally obtained (n = 3) while
12 week whole body samples were pooled so there was one sample per cage. A muscle
sample, representative of the edible portion, was obtained by cutting a steak between
the dorsal and ventral fins (NQC). This section was then skinned, de-boned and
homogenized. All samples were then stored at -20 °C until analyzed.
4.2.4 Proximate analysis
Proximate analysis was conducted to determine the nutrient composition of diets
and whole body samples. Moisture, crude protein, crude fat and ash contents were
determined according to AOAC (1995) and modified as described by Bell et al (2001a)
and are described in detail in the “General Materials and Methods” section (paragraph
2.5). The diet samples were acid hydrolysed before fat extraction.
4.2.5 Lipid extraction and fatty acid analyses
The methods followed for the lipid extraction and FA analyses of diets and
tissues are thoroughly described in paragraph 2.6. Briefly, total lipids of flesh, livers
and diet samples were extracted by homogenization according to Folch et al. (1957).
Fatty acid methyl esters (FAME) were prepared from total lipid by acid-catalyzed
transesterification as described by Christie (1982) and FAME extracted and purified as
described by Tocher & Harvie (1988). FAME were separated and quantified by gas-
liquid chromatography and individual methyl esters were identified by comparison to
known standards and by reference to published data (Ackman, 1980).

CHAPTER 4. PROTEIN/LIPID & RO INTERACTIONS IN SALMON – I
81
4.2.6 Calculations and statistical analysis
Feed Conversion Ratio (FCR), Specific Growth Rate (SGR), Thermal Growth
Coefficient (TGC), Protein Productive Value (PPV), Condition Factor (K), viscero-
somatic index (VSI), hepato-somatic index (HSI) and cardio-somatic index (CSI) were
calculated using the formulae presented in paragraph 2.8.
All the data are presented as means ± SD (n = 3) and all statistical analyses were
performed using SPSS 13 (SPSS Inc, 2004) as described in paragraph 2.9. The effects
of dietary RO, the fat/protein ratio and their interactions on growth and tissue fatty acid
compositions were analysed by two-way ANOVA. Differences were regarded as
significant when P < 0.05 (Zar, 1999).
4.3 Results
4.3.1 Growth performance and feed efficiency
There were no significant differences in initial cage mean weights of the fish
(Table 4.3). Following 12 weeks of feeding, the cage mean weight ranged between
1711g and 1784g and the final length of the fish varied from 49.9 to 51.8 cm. No
significant effects or interactions of dietary protein level and oil source were identified
in final weight and length by two-way ANOVA. However, there was a significant effect
of oil source on growth performance (SGR and TGC). Specifically, the inclusion of RO
resulted in higher SGR (0.50 vs. 0.55, R0 vs. R60, respectively) and TGC (4.52 vs.
5.00, R0 vs. R60, respectively).
Feed conversion ratios (FCR) were good for all treatments and ranged from 0.81
to 0.87. No significant overall effects and interactions of dietary protein level and oil

CHAPTER 4. PROTEIN/LIPID & RO INTERACTIONS IN SALMON – I
82
source on FCR were identified, although there was a trend (P<0.10) of lower FCR for
the fish fed the HP diets compared to LP diets. K ranged from 1.30 to 1.34 and no
significant effects and interactions of dietary protein level and oil source were seen. The
organ-to-whole-body indices are shown in Table 4.3. VSI varied from 11.7% to 12.6%,
HSI from 1.4% to 1.5%, and similar CSI were found for all groups (1.3%). Two-way
ANOVA showed no significant effects and interactions of dietary protein level and oil
source.
PPV was high for all groups (0.42 - 0.46) and the there was a significant overall
effect of dietary protein and fat level (P<0.05), with higher overall PPV for the LP
groups compared to the HP groups.
4.3.2 Proximate composition of whole body
The proximate composition of whole body is shown in Table 4.4. Whole body
moisture, protein and ash contents were very similar in all groups (approximately 662,
162 and 15 g kg-1, respectively), whereas final lipid content ranged from 145 to 164 g
kg-1. Two-way ANOVA did not reveal any significant overall effects or interactions.
4.3.3 Fatty acid composition of diets and tissues
The replacement of increasing proportions of FO with RO in the diets resulted
in significant changes in dietary fatty acid compositions (Table 4.2). FO diets had
approximately 30% total saturates of which two thirds was 16:0, and about 35% total
monoenes. Specifically, 18:1n-9 was around 13% and, 20:1 and 22:1, comprised more
than 10% of the diet. The FO diets had 5% n-6PUFA, predominantly 18:2n-6, and
approximately 30% n-3PUFA, with over 20% as the n-3HUFA (mainly EPA and

CHAPTER 4. PROTEIN/LIPID & RO INTERACTIONS IN SALMON – I
83
DHA). Graded inclusion of RO resulted in decreased 16:0, 20:1n-9, 20:4n-6, 20:5n-3
and 22:6n-3 (approximately 10%, 2.5%, 0.2%, 3.5% and 4.5% respectively in diets
containing 60% RO) and increased 18:1n-9, 18:2n-6 and 18:3n-3 (approximately 43%,
14.5% and 6% respectively in diets containing 60% RO) within both dietary protein
levels. The n-3/n-6 ratio decreased from 6.0 in diets containing 100% FO to 1.0 in diets
containing 60% RO.
The total lipid content and the fatty acid compositions of muscle and liver are
shown in Table 4.5 and Table 4.6. Total lipid content ranged from 92.6 to 117.8 mg
lipid g-1 tissue and from 49.4 to 81.0 mg lipid g-1 tissue for muscle and liver,
respectively. RO inclusion increased the total lipid content in liver but not in muscle.
RO inclusion significantly affected tissue FA compositions. However, there were no
significant interactions between dietary protein level and RO inclusion either in muscle
or in liver and in most cases the overall protein level effect was not significant.
Specifically, both in muscle and liver a reduction was seen in 16:0, total saturates,
20:1n-9, 22:1, 20:4n-6, 20:5n-3, 22:6n-3, total n-3 PUFAs and n-3/n-6 ratio as RO
inclusion increased within both dietary fat and protein levels. Conversely, 18:1n-9, total
monoenes, 18:2n-6, total n-6 PUFAs and 18:3n-3 increased in muscle and liver with
graded RO inclusion. However, 20:2n-6 did not reflect the dietary content, as it
increased both in liver and muscle with increased dietary RO inclusion.

CHAPTER 4. PROTEIN/LIPID & RO INTERACTIONS IN SALMON – I
84
Table 4.1. Feed components and proximate compositions (g kg-1) of the six
experimental diets
HP-R0 HP-R30 HP-R60 LP-R0 LP-R30 LP-R60ComponentsFishmeal 390 390 390 310 310 310Oil seed and legume seed meals 225 225 225 235 235 235Fish oil 280 196 112 318 222 126Rapeseed oil a 0 84 168 0 96 192Binder 120 120 120 130 130 130Premixes b 18 18 18 23 23 23
Analysed composition c
Moisture 43 47 44 67 58 56Protein 387 388 391 344 347 342Lipid 327 323 321 353 347 361Ash 79 78 78 70 70 69
Gross Energy, kJ g-1 d 25.2 25.1 25.2 25.3 25.6 25.5
Protein/Energy ratio e 15.3 15.5 15.3 13.6 13.4 13.2
a Double-low quality rapeseed oil b Vitamin and mineral premixes prepared according to BioMar A/S commercial standards. Includes crystaline amino acids and Carophyl pink to provide 40mg/kg astaxanthin. c Wet weightd Estimated from caloric values of 39.5, 23.6 and 17.2 kJ g -1 for fat, protein and carbohydrate, respectivelye Calculated g protein kJ -1

CHAPTER 4. PROTEIN/LIPID & RO INTERACTIONS IN SALMON – I
85
Table 4.2. Fatty acid compositions (% by weight of total fatty acids) of the six
experimental diets
Fatty Acid HP-R0 HP-R30 HP-R60 LP-R0 LP-R30 LP-R6014:0 5.9 3.5 1.8 5.4 3.1 1.916:0 20.3 15.2 10.4 19.6 14.3 10.418:0 3.6 3.0 2.5 3.5 2.9 2.5Total saturateda 31.1 23.1 15.9 29.9 21.6 16.4
16:1n-7 6.6 4.2 2.3 6.1 4.2 2.218:1n-9 13.4 29.0 42.5 13.2 28.0 42.918:1n-7 2.5 2.8 3.0 2.5 3.1 2.620:1n-9 4.4 3.5 2.6 4.6 3.4 2.522:1 6.5 4.8 2.5 6.7 4.3 2.524:1n-9 0.8 0.6 0.4 0.9 0.9 0.5Total monoenesb 34.6 45.1 53.4 34.7 44.5 53.4
18:2n-6 3.7 9.4 14.5 3.5 9.4 14.320:2n-6 0.2 0.2 0.1 0.3 0.2 0.120:4n-6 0.5 0.3 0.2 0.6 0.4 0.222:5n-6 0.3 0.2 0.1 0.3 0.2 0.1Total n-6 PUFAc 5.0 10.4 15.1 5.0 10.4 14.9
18:3n-3 1.3 3.7 5.8 1.4 3.9 5.918:4n-3 2.9 1.8 1.0 3.0 2.0 1.020:4n-3 0.7 0.4 0.2 0.7 0.5 0.320:5n-3 10.4 6.7 3.6 11.0 7.4 3.522:5n-3 2.0 0.7 0.4 1.2 0.8 0.322:6n-3 11.9 8.0 4.6 12.8 8.7 4.3Total n-3 PUFAd 29.3 21.4 15.5 30.3 23.4 15.3
Total PUFA 34.3 31.8 30.7 35.4 33.8 30.2(n-3) / (n-6) 5.9 2.1 1.0 6.0 2.2 1.0
aIncludes 15:0, 20:0 & 22:0. bIncludes 16:1n-9 & 20:1n-7. cIncludes 18:3n-6, 20:3n-6 & 22:4n-6. dIncludes 20:3n-3 & 22:4n-3.

86
Table 4.3. Growth and performance of Atlantic salmon fed the experimental diets for 12 weeks
Parameter protein oil prot x oilInitial Weight (g) 1168.4 ± 32.3 1184.6 ± 16.1 1152.4 ± 21.0 1162.8 ± 24.4 1171.9 ± 14.6 1168.4 ± 24.4Final Weight (g) 1711.3 ± 79.8 1772.0 ± 36.5 1784.3 ± 48.5 1721.7 ± 47.6 1760.3 ± 27.0 1767.7 ± 57.6 0.812 0.149 0.894Final Length (cm) 50.5 ± 0.4 50.9 ± 1.1 50.7 ± 1.0 50.7 ± 0.3 49.9 ± 0.6 51.8 ± 0.6 0.829 0.130 0.077Mortalities1 5 1 2 3 0 5
FCR2 0.86 ± 0.01 0.84 ± 0.02 0.81 ± 0.01 0.86 ± 0.02 0.87 ± 0.04 0.85 ± 0.03 0.077 0.160 0.349SGR3 0.49 ± 0.03 0.52 ± 0.01 0.56 ± 0.01 0.50 ± 0.02 0.52 ± 0.01 0.53 ± 0.03 0.723 0.002 0.128TGC4 4.45 ± 0.27 4.75 ± 0.16 5.13 ± 0.11 4.59 ± 0.20 4.78 ± 0.07 4.87 ± 0.28 0.742 0.005 0.227PPV5 0.42 ± 0.03 0.43 ± 0.01 0.44 ± 0.01 0.46 ± 0.02 0.46 ± 0.02 0.46 ± 0.05 0.045 0.799 0.868
K (%)6 1.31 ± 0.01 1.30 ± 0.02 1.32 ± 0.04 1.31 ± 0.06 1.30 ± 0.01 1.34 ± 0.01 0.609 0.274 0.941VSI (%)7 12.03 ± 1.00 12.01 ± 0.69 12.41 ± 0.98 12.57 ± 0.27 11.67 ± 0.28 11.90 ± 0.49 0.749 0.515 0.395HSI (%)8 1.34 ± 0.12 1.32 ± 0.02 1.45 ± 0.20 1.36 ± 0.10 1.36 ± 0.07 1.31 ± 0.07 0.646 0.822 0.371CSI (%)9 0.15 ± 0.03 0.13 ± 0.01 0.13 ± 0.00 0.13 ± 0.01 0.14 ± 0.03 0.12 ± 0.01 0.358 0.556 0.522
All values are mean ± S.D. (n=3).1 Total number; 2 Feed Conversion Ratio; 3 Specific Growth Rate; 4 Thermal Growth Coefficient; 5 Protein Productive Value; 6 Condition Factor7 Viscero-somatic index; 8 Hepato-somatic index; 9 Cardio-somatic index
TWO WAY ANOVA PLP-R30 LP-R60HP-R0 HP-R30 HP-R60 LP-R0
CH
APTER
4. PR
OTEIN/L
IPID &
RO
INTER
AC
TION
S IN S
ALM
ON
– I
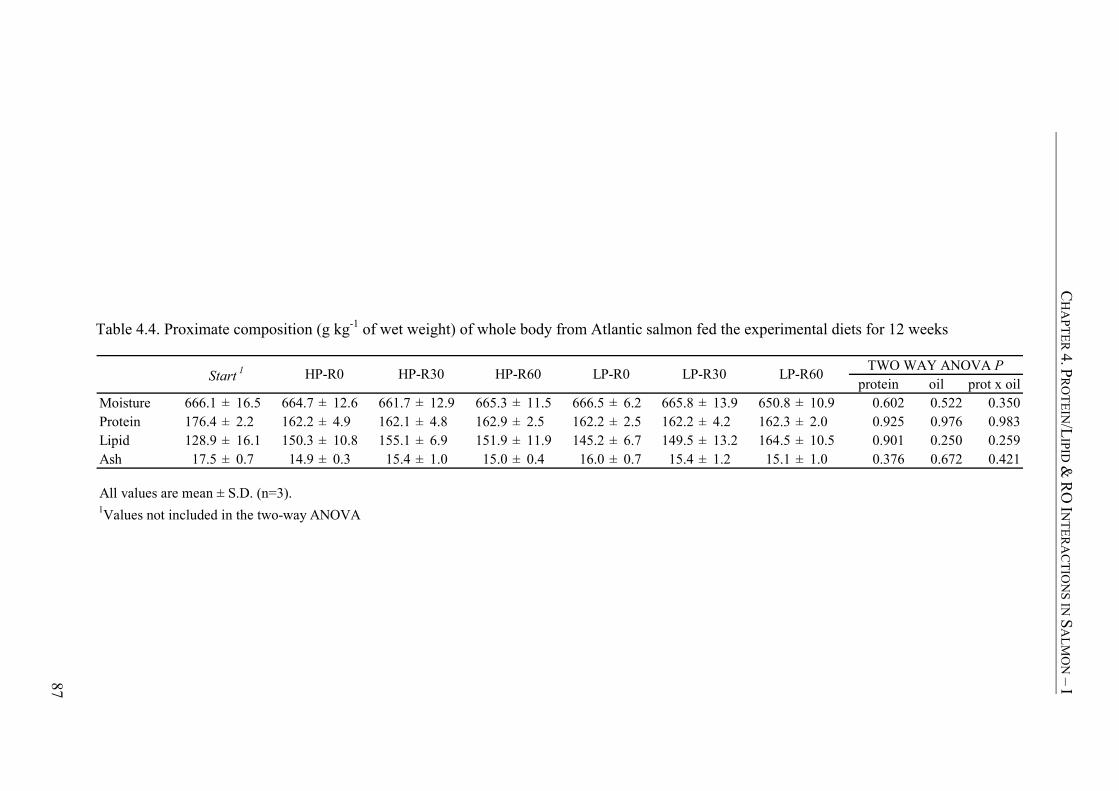
87
Table 4.4. Proximate composition (g kg-1 of wet weight) of whole body from Atlantic salmon fed the experimental diets for 12 weeks
protein oil prot x oilMoisture 666.1 ± 16.5 664.7 ± 12.6 661.7 ± 12.9 665.3 ± 11.5 666.5 ± 6.2 665.8 ± 13.9 650.8 ± 10.9 0.602 0.522 0.350Protein 176.4 ± 2.2 162.2 ± 4.9 162.1 ± 4.8 162.9 ± 2.5 162.2 ± 2.5 162.2 ± 4.2 162.3 ± 2.0 0.925 0.976 0.983Lipid 128.9 ± 16.1 150.3 ± 10.8 155.1 ± 6.9 151.9 ± 11.9 145.2 ± 6.7 149.5 ± 13.2 164.5 ± 10.5 0.901 0.250 0.259Ash 17.5 ± 0.7 14.9 ± 0.3 15.4 ± 1.0 15.0 ± 0.4 16.0 ± 0.7 15.4 ± 1.2 15.1 ± 1.0 0.376 0.672 0.421
All values are mean ± S.D. (n=3).1Values not included in the two-way ANOVA
TWO WAY ANOVA PHP-R60 LP-R0 LP-R30 LP-R60Start 1 HP-R0 HP-R30
CH
APTER
4. PR
OTEIN/L
IPID &
RO
INTER
AC
TION
S IN S
ALM
ON
– I

CHAPTER 4. PROTEIN/LIPID & RO INTERACTIONS IN SALMON – I
88
Table 4.5. Total lipid (mg lipid g-1 tissue) and fatty acid compositions (% by weight of
total fatty acids) of muscle from Atlantic salmon fed the experimental diets for 12
weeks
protein oil prot x oilTotal Lipid 117.8 ± 8.5 101.9 ± 6.4 102.8 ± 4.1 92.6 ± 13.9 101.7 ± 17.1 110.0 ± 9.6 0.259 0.748 0.057
Fatty acid14:0 4.7 ± 0.4 4.1 ± 0.1 3.4 ± 0.3 5.1 ± 0.4 4.3 ± 0.1 3.6 ± 0.4 0.064 0.000 0.73916:0 16.0 ± 0.8 15.2 ± 0.9 13.5 ± 1.3 16.2 ± 1.4 14.6 ± 1.1 13.3 ± 1.1 0.649 0.004 0.85718:0 3.1 ± 0.2 3.1 ± 0.3 3.1 ± 0.4 3.1 ± 0.3 2.9 ± 0.3 2.8 ± 0.3 0.299 0.635 0.825Total saturated1 24.5 ± 1.4 23.2 ± 1.5 21.0 ± 2.5 25.3 ± 2.4 22.7 ± 1.7 20.8 ± 2.1 0.971 0.015 0.874
16:1n-7 6.6 ± 0.1 5.5 ± 0.2 4.4 ± 0.1 6.8 ± 0.0 5.6 ± 0.1 4.6 ± 0.1 0.019 0.000 0.47418:1n-9 15.7 ± 0.5 23.3 ± 1.1 29.7 ± 0.9 15.9 ± 0.3 22.9 ± 0.4 27.9 ± 1.9 0.197 0.000 0.34018:1n-7 3.2 ± 0.1 3.4 ± 0.1 3.1 ± 0.1 3.2 ± 0.2 3.3 ± 0.1 3.1 ± 0.3 0.766 0.070 0.61320:1n-9 7.8 ± 0.5 7.2 ± 0.3 6.7 ± 0.2 8.0 ± 0.2 7.2 ± 0.2 6.8 ± 0.2 0.577 0.000 0.96822:1 8.3 ± 0.4 7.4 ± 0.5 6.0 ± 0.6 8.5 ± 0.1 7.3 ± 0.2 6.4 ± 0.4 0.573 0.000 0.56624:1n-9 0.8 ± 0.0 0.8 ± 0.0 0.7 ± 0.1 0.9 ± 0.1 0.8 ± 0.0 0.7 ± 0.0 0.407 0.002 0.531Total monoenes2 42.9 ± 1.2 48.0 ± 1.4 51.0 ± 0.5 43.8 ± 0.3 47.4 ± 0.2 49.9 ± 1.0 0.426 0.000 0.270
18:2n-6 3.7 ± 0.1 6.3 ± 0.1 8.2 ± 0.9 3.6 ± 0.1 6.3 ± 0.5 8.2 ± 0.6 0.922 0.000 0.94220:2n-6 0.4 ± 0.0 0.5 ± 0.0 0.8 ± 0.2 0.4 ± 0.0 0.5 ± 0.0 0.6 ± 0.1 0.179 0.000 0.07620:3n-6 0.1 ± 0.0 0.1 ± 0.0 0.1 ± 0.0 0.2 ± 0.0 0.1 ± 0.0 0.1 ± 0.0 0.870 0.274 0.48120:4n-6 0.5 ± 0.0 0.3 ± 0.0 0.3 ± 0.0 0.4 ± 0.0 0.3 ± 0.0 0.3 ± 0.0 0.843 0.000 0.756Total n-6 PUFA3 5.1 ± 0.1 7.5 ± 0.2 9.6 ± 0.8 5.0 ± 0.2 7.6 ± 0.6 9.5 ± 0.7 0.817 0.000 0.912
18:3n-3 1.2 ± 0.0 2.2 ± 0.1 3.0 ± 0.4 1.2 ± 0.1 2.2 ± 0.2 3.0 ± 0.3 0.743 0.000 0.96818:4n-3 1.8 ± 0.1 1.3 ± 0.2 1.0 ± 0.1 1.8 ± 0.1 1.4 ± 0.1 1.1 ± 0.0 0.302 0.000 0.41820:4n-3 1.5 ± 0.1 1.1 ± 0.1 0.9 ± 0.1 1.4 ± 0.1 1.2 ± 0.1 1.0 ± 0.0 0.936 0.000 0.16620:5n-3 7.4 ± 0.4 5.4 ± 0.9 4.2 ± 0.4 7.2 ± 0.7 5.7 ± 0.3 4.6 ± 0.2 0.485 0.000 0.67922:5n-3 2.5 ± 0.1 1.9 ± 0.2 1.6 ± 0.2 2.5 ± 0.3 1.9 ± 0.2 1.7 ± 0.0 0.505 0.000 0.73422:6n-3 12.9 ± 0.9 9.3 ± 1.2 7.5 ± 0.7 11.9 ± 1.1 9.7 ± 0.5 8.2 ± 0.1 0.898 0.000 0.252Total n-3 PUFA4 27.5 ± 1.1 21.4 ± 2.6 18.4 ± 1.9 26.0 ± 2.3 22.3 ± 1.3 19.8 ± 0.5 0.668 0.000 0.422
Total PUFA 32.6 ± 1.2 28.8 ± 2.8 28.0 ± 2.7 31.0 ± 2.6 29.8 ± 1.9 29.3 ± 1.2 0.766 0.081 0.535(n-3) / (n-6) 5.4 ± 0.1 2.9 ± 0.3 1.9 ± 0.1 5.2 ± 0.2 2.9 ± 0.1 2.1 ± 0.1 0.557 0.000 0.263
Values are mean ± S.D. (n=3).1Includes 15:0, 20:0 & 22:0; 2Includes 16:1n-9 & 20:1n-7; 3Includes 18:3n-6, 20:3n-6 & 22:4n-6; 4Includes 20:3n-3 & 22:4n-3
LP-R30 LP-R60 TWO WAY ANOVA PHP-R0 HP-R30 HP-R60 LP-R0

CHAPTER 4. PROTEIN/LIPID & RO INTERACTIONS IN SALMON – I
89
Table 4.6. Total lipid (mg lipid g-1 tissue) and fatty acid compositions (% by weight of
total fatty acids) of liver from Atlantic salmon fed the experimental diets for 12 weeks
protein oil prot x oilTotal lipid 62.7 ± 16.6 49.4 ± 6.6 81.0 ± 37.0 52.5 ± 16.7 54.9 ± 7.9 69.3 ± 16.2 0.422 0.037 0.519
Fatty acid14:0 2.4 ± 0.4 1.8 ± 0.0 1.2 ± 0.1 2.7 ± 0.3 1.8 ± 0.3 1.2 ± 0.1 0.543 0.000 0.71416:0 15.2 ± 1.7 12.6 ± 1.1 10.0 ± 0.9 14.2 ± 1.0 13.2 ± 1.1 9.1 ± 1.0 0.418 0.000 0.45018:0 6.1 ± 0.6 5.1 ± 0.3 4.8 ± 0.5 5.5 ± 0.1 4.9 ± 0.5 4.0 ± 0.2 0.022 0.000 0.537Total saturated1 24.4 ± 2.5 20.1 ± 1.4 16.5 ± 1.4 23.2 ± 1.2 20.4 ± 1.2 15.1 ± 1.5 0.359 0.000 0.611
16:1n-7 3.7 ± 0.5 2.6 ± 0.2 1.9 ± 0.2 4.1 ± 0.2 2.6 ± 0.3 1.9 ± 0.2 0.327 0.000 0.26818:1n-9 15.9 ± 4.0 23.0 ± 3.9 35.7 ± 3.9 16.7 ± 2.0 21.3 ± 2.1 37.1 ± 4.8 0.928 0.000 0.72918:1n-7 3.1 ± 0.3 2.9 ± 0.2 3.1 ± 0.1 3.4 ± 0.3 3.0 ± 0.3 3.2 ± 0.5 0.234 0.300 0.94620:1n-9 4.4 ± 0.6 4.2 ± 0.8 5.0 ± 0.2 4.7 ± 0.3 4.0 ± 0.5 5.3 ± 0.7 0.692 0.025 0.61522:1 1.4 ± 0.2 1.1 ± 0.1 0.9 ± 0.0 2.1 ± 0.4 1.4 ± 0.3 1.0 ± 0.0 0.007 0.000 0.23824:1n-9 1.0 ± 0.3 0.9 ± 0.2 0.6 ± 0.2 0.9 ± 0.1 1.1 ± 0.1 0.7 ± 0.1 0.737 0.011 0.299Total monoenes2 29.8 ± 5.2 35.0 ± 5.1 47.3 ± 4.0 32.1 ± 2.8 33.6 ± 3.4 49.3 ± 6.2 0.661 0.000 0.746
18:2n-6 2.1 ± 0.4 4.9 ± 0.5 8.2 ± 0.4 2.5 ± 0.3 4.9 ± 0.5 9.0 ± 0.5 0.124 0.000 0.39620:2n-6 0.6 ± 0.1 1.3 ± 0.2 2.1 ± 0.1 0.6 ± 0.1 1.2 ± 0.1 2.1 ± 0.2 0.695 0.000 0.60020:3n-6 0.1 ± 0.0 0.1 ± 0.0 0.2 ± 0.0 0.2 ± 0.0 0.2 ± 0.0 0.2 ± 0.0 0.853 0.001 0.21520:4n-6 2.2 ± 0.5 1.9 ± 0.4 1.0 ± 0.3 1.9 ± 0.2 2.0 ± 0.3 1.0 ± 0.2 0.524 0.000 0.413Total n-6 PUFA3 5.7 ± 0.1 8.6 ± 0.4 11.9 ± 0.3 5.7 ± 0.3 8.7 ± 0.1 12.5 ± 0.4 0.100 0.000 0.094
18:3n-3 0.7 ± 0.1 1.6 ± 0.2 2.7 ± 0.1 0.9 ± 0.1 1.6 ± 0.2 2.9 ± 0.1 0.047 0.000 0.24218:4n-3 0.3 ± 0.1 0.2 ± 0.0 0.1 ± 0.0 0.4 ± 0.1 0.2 ± 0.0 0.2 ± 0.0 0.032 0.000 0.87920:4n-3 1.4 ± 0.2 1.1 ± 0.1 0.8 ± 0.0 1.7 ± 0.1 1.1 ± 0.1 0.8 ± 0.0 0.208 0.000 0.09620:5n-3 10.4 ± 1.8 8.8 ± 1.3 5.2 ± 0.9 10.3 ± 0.8 9.4 ± 0.8 4.9 ± 1.4 0.921 0.000 0.80822:5n-3 3.3 ± 0.7 2.9 ± 0.3 1.5 ± 0.2 3.7 ± 0.3 2.5 ± 0.2 1.4 ± 0.3 0.671 0.000 0.37022:6n-3 23.7 ± 4.6 21.2 ± 3.4 13.4 ± 3.1 21.9 ± 2.1 22.0 ± 2.0 12.1 ± 3.7 0.621 0.000 0.763Total n-3 PUFA4 40.2 ± 5.9 36.3 ± 4.1 24.3 ± 4.2 39.0 ± 3.1 37.3 ± 2.3 23.0 ± 5.2 0.814 0.000 0.877
Total PUFA 45.9 ± 6.0 45.0 ± 3.7 36.2 ± 4.2 44.7 ± 3.1 46.0 ± 2.1 35.5 ± 4.8 0.899 0.002 0.893(n-3) / (n-6) 7.0 ± 1.0 4.2 ± 0.6 2.1 ± 0.4 6.9 ± 0.7 4.3 ± 0.3 1.8 ± 0.5 0.757 0.000 0.911
Values are mean ± S.D. (n=3).1Includes 15:0, 20:0 & 22:0; 2Includes 16:1n-9 & 20:1n-7; 3Includes 18:3n-6, 20:3n-6 & 22:4n-6; 4Includes 20:3n-3 & 22:4n-3
HP-R0 HP-R30 HP-R60 TWO WAY ANOVA PLP-R0 LP-R30 LP-R60

CHAPTER 4. PROTEIN/LIPID & RO INTERACTIONS IN SALMON – I
90
4.4 Discussion
4.4.1 Growth performance
This study aimed to investigate the effects and interactions of the replacement of
FO with RO at two different protein/lipid ratios at low water temperatures. As
previously discussed, several studies have shown that replacement of FO with RO,
blends of RO and other VO or other VO alone in diets of salmon, has no negative
effects on fish growth (Bell, et al., 2001a; Rosenlund, et al., 2001; Bell, et al., 2002;
Bell, et al., 2003a; Bell, et al., 2003b; Bendiksen, et al., 2003b; Ng, et al., 2004;
Torstensen, et al., 2004a; Torstensen, et al., 2004b; Torstensen, et al., 2005). Moreover,
when low protein feeds were compared to high protein feeds growth was not
significantly affected (Azevedo, et al., 2004a; Solberg, 2004), especially at low
temperatures (Hillestad, et al., 1998; Bendiksen, et al., 2003b). It is likely that the effect
of low temperature masked any potential effects of feed treatment, and that diet-related
growth differences observed at the higher temperature were diminished at the lower
temperature (Bendiksen, et al., 2003b). In line with the previous studies, the current
experiment showed no significant effects due to dietary protein level in final weights,
SGR, TGC and FCRs. Nevertheless, oil source had a significant positive effect on SGR
and TGC. Graded inclusion of RO, at the expense of FO, resulted in increased SGR and
TGC. This is in accordance with other studies and could be a result of improved use of
oil for energy, due to superior fatty acid availability from vegetable oils at low water
temperatures (Bendiksen, et al., 2003b; Torstensen, et al., 2005). Specifically, it has
been shown that the absorption and digestibility of FA in salmonids decreases with
increasing saturation and chain length (Olsen and Ringø, 1998; Torstensen, et al., 2000;
Caballero, et al., 2002; Ng, et al., 2004). Moreover, the AD of the saturated FA

CHAPTER 4. PROTEIN/LIPID & RO INTERACTIONS IN SALMON – I
91
decreases with decreased temperature while the AD of the monoenes and PUFA is
hardly affected (Olsen and Ringø, 1998; Ng, et al., 2004). Hence, the lower levels of
saturated FA in the RO increased the lipid AD and the digestible energy content of the
RO diets, resulting in improved growth performance of the fish. Although no significant
interactions were found, the effect of oil source seemed to differ between LP and HP
series which indicates that the most improved growth was shown when the dietary
protein and amino acids where in excess (HP feeds).
The protein sparing effect could also have been enhanced by higher dietary oil
levels. This is supported by the PPV results, as the overall PPV was significantly
improved when the fish were fed the LP diets. Previous studies have also suggested a
positive effect of increased dietary lipid content on protein retention and, hence, on
protein sparing (Einen and Roem, 1997; Hillestad, et al., 1998; Bendiksen, et al.,
2003b).
In the present trial K, VSI, HSI and CSI were not affected by the different
dietary treatments. This is in agreement with other studies, as changes in dietary protein
/ fat ratio in Atlantic salmon have not been associated with changes in K, VSI and HSI
(Einen and Roem, 1997; Solberg, 2004) or with the replacement of FO with RO and LO
(Rosenlund, et al., 2001; Bendiksen, et al., 2003b). Few reports on diet effects on the
CSI are available although a reduced CSI was observed in one study where salmon
were fed diets where sunflower oil was used as a FO replacement (Bell, et al., 1991).
4.4.2 Whole body proximate composition
In this study, the different dietary treatments had no influence on the chemical
composition of the whole carcass, either due to dietary protein level or due to the oil
CHAPTER 4. PROTEIN/LIPID & RO INTERACTIONS IN SALMON – I
92
source. The moisture, protein and ash content of the carcass were almost constant
between the groups and there were only minor differences in the lipid content. This is in
agreement with the findings of Hillestad et al. (1998) who reported that the fillet and
dressed carcass fat content was not influenced by dietary lipid level, although
significant differences in tissue fat content were shown, due to the dietary energy
content. Other studies have shown that, when the dietary oil increases, tissue lipid, and
usually moisture, increases, while protein decreases (Hillestad and Johnsen, 1994;
Einen and Roem, 1997; Einen and Skrede, 1998; Hemre and Sandnes, 1999; Bendiksen,
et al., 2003b; Azevedo, et al., 2004a; Solberg, 2004). However, in most of these studies
the lipid content of the fillet, carcass or whole body was possibly influenced by the
differences in the dietary energy content, as only Azevedo et al. (2004a) and Solberg
(2004) used isoenergetic diets. In the present study, no significant differences were
observed in the carcass chemical composition due to dietary oil source. This is in
agreement with the results reported by Bendiksen et al. (2003b) when FO was replaced
with a blend of VO at low water temperatures (2 oC). By contrast, other studies have
shown that when RO replaced FO in diets of Atlantic salmon, the chemical composition
of tissues is significantly influenced, to a small extent, although these studies were of
longer duration than the present study (Bell, et al., 2001a; Torstensen, et al., 2004b;
Ruyter, et al., 2006). However, in the present study there was a significant effect due to
the oil source on the total lipid level of the liver; specifically, the inclusion of RO
resulted in increased total lipid in the liver, which is consistent with the previous
mentioned studies. It has been shown that in Atlantic salmon fat deposition increases as
the fish grow larger (Jobling and Johansen, 2003). This was clearly demonstrated in the
present study where an increase in lipid content, along with a decrease in crude protein
and ash, was observed between the initial and final sampling.

CHAPTER 4. PROTEIN/LIPID & RO INTERACTIONS IN SALMON – I
93
4.4.3 Tissue fatty acid composition
The fatty acid compositions of tissue lipids of Atlantic salmon are known to be
highly influenced by dietary fatty acids (Torstensen, et al., 2000; Rosenlund, et al.,
2001) and linear correlations exist between individual fatty acids in tissue total lipid and
their concentrations in dietary lipid (Bell, et al., 2001a; Bell, et al., 2003a; Tocher, et al.,
2003a). In the present study, the differences in the dietary fatty acid compositions
resulting from the graded inclusion of RO, at the expense of FO, were not affected by
dietary protein level. Hence, diets including similar proportions of RO had very similar
fatty acid compositions irrespective of their protein/lipid ratio. As a result the oil source
affected significantly, liver and muscle FA compositions while no significant effects on
the tissue FA compositions were shown due to the dietary protein level. The results are
in line with previous studies showing that dietary fatty acid compositions are reflected
in tissue FA compositions (Torstensen, et al., 2000; Bell, et al., 2001a; Rosenlund, et
al., 2001; Bell, et al., 2003a).
However, previous studies have shown that although dietary fatty acids
correlated to fatty acids deposited in flesh, specific fatty acids were selectively utilized
or retained (Bell, et al., 2001a; 2003a; Torstensen, et al., 2004a). This was also
demonstrated in the present study. Dietary 18:1n-9 increased more than 3-fold and
18:2n-6 and 18:3n-3 more than 4-fold in diets containing 60% RO compared to FO
diets, whereas in muscle and liver these fatty acids increased only around 2-fold. These
data confirm that when certain fatty acids are provided to the fish in high
concentrations, they are readily metabolised, largely catabolism by β-oxidation,
although they may also be subject to limited desaturation and elongation (Bell, et al.,
2003a). On the contrary, n-3 HUFAs were selectively deposited and retained in flesh.

CHAPTER 4. PROTEIN/LIPID & RO INTERACTIONS IN SALMON – I
94
Tissue DHA was reduced only by 30% - 40% and EPA by less than 45% when fish
were fed diets containing 60% RO compared to FO groups, whereas in 60% RO diets
these HUFAs were only 30% of the concentrations in 0% RO diets. Apart from the
selective deposition and retention of these FAs, the moderate reductions in EPA and
DHA could also have been affected, even to small extent, by the hepatic desaturation
and elongation of dietary α-linolenic acid, which can be increased by inclusion of
vegetable oils in the diets (Tocher, et al., 2000; Tocher, et al., 2001; Tocher, et al.,
2003a; Tocher, et al., 2003b).
It is well documented that n-3 HUFAs, particularly EPA and DHA and a high n-
3 / n-6 ratio, in human diets are beneficial for various aspects of human health including
preventive or protective effects in coronary heart disease, rheumatoid arthritis, cancer,
neurodevelopmental and mood disorders etc (De Deckere, et al., 1998; Horrocks and
Yeo, 1999; Simopoulos, 1999; Hunter and Roberts, 2000; ISSFAL, 2000; Simopoulos,
2003). At present, intensive culture of Atlantic salmon uses marine FO resulting in a
highly nutritious and healthy product, as it is rich in n-3 HUFAs and has a high n-3 / n-
6 ratio (Bell, et al., 1998). However, in recent times there has been a desire to
investigate more sustainable alternatives to fish meal and fish oil for use in aquaculture
feeds. Clearly, any changes towards use of vegetable alternatives to marine FO should
not be at the expense of the quality and nutritional value of the final product. In this
regard the present study showing moderate reduction of EPA and DHA in fish fed diets
containing RO, at levels as high as 60%, even at low protein levels, could be
significant, although it should be remembered that this was a relatively short trial
compared to the whole production cycle for Atlantic salmon.

CHAPTER 4. PROTEIN/LIPID & RO INTERACTIONS IN SALMON – I
95
4.5 Conclusions
The results of this study showed no negative effects on growth and feed
conversion, no major detrimental effects on lipid and fatty acid metabolism in Atlantic
salmon and an enhanced protein sparing effect, when fish were fed with lower protein
feeds where RO replaced FO up to 60% of the total oil. In conclusion, the results of this
study suggest that more sustainable, lower protein diets, in which a high proportion of
the dietary protein and lipid is of non-marine origin, with moderate/high RO inclusion,
can be used successfully in Atlantic salmon culture at low water temperatures.

Chapter 5. Dietary protein / lipid ratio and rapeseed oil
interactions in Atlantic salmon – II

CHAPTER 5. PROTEIN/LIPID & RO INTERACTIONS IN SALMON – II
97
5.1 Introduction
The use of VO in fish diets, in order to reduce the use of FO, and consequently
the reliance of the salmon industry on marine oils, leading towards sustainability,
without compromising the cost effectiveness of modern diets or the quality of the final
product, has been discussed previously. It has also been demonstrated that this becomes
even more significant for carnivorous species such as Atlantic salmon. Moreover, the
need for FM reduction in the diets of Atlantic salmon is also of great importance and
thus, high lipid / energy dense diets could play a role towards this goal. However, such
feed formulations will potentially increase the requirements of aquaculture for FO;
hence the need for sustainable oil alternatives is vitally important.
In the previous chapter the interactive effects of two different fat and protein
levels and the inclusion of RO in diets of Atlantic salmon, reared at low water
temperatures, were investigated. The results of that study showed that growth (SGR and
TGC) was enhanced and a protein sparing effect occurred due to the RO inclusion
whereas growth was not negatively affected by low protein levels. These results were in
line with previous studies that used RO in diets for Atlantic salmon and other salmonids
with generally no detrimental effects on growth and FCR (Bell, et al., 2001a; Caballero,
et al., 2002; Bell, et al., 2003a; Ng, et al., 2004; Torstensen, et al., 2004a; Torstensen, et
al., 2004b; Torstensen, et al., 2005) or even, in some cases, enhanced growth
(Bendiksen, et al., 2003b; Torstensen, et al., 2005). They were also in agreement with
studies using low protein / high lipid diets (Einen and Roem, 1997; Hillestad, et al.,
1998; Bendiksen, et al., 2003b; Azevedo, et al., 2004b, 2004a; Solberg, 2004).
However, most of the previous studies used diets with relatively high dietary
protein contents, ranging from greater than 500 g kg-1 to a minimum of approximately

CHAPTER 5. PROTEIN/LIPID & RO INTERACTIONS IN SALMON – II
98
360 g kg-1, and varying lipid levels from as low as 200 g kg-1 up to 470 g kg-1, while in
the study of Chapter 4 levels of CP/CL of 340/360were successfully used. Hence, how
much the dietary protein/lipid level can be further reduced is not clear.
Moreover, as discussed previously, although numerous studies have focused
either on the investigation of sustainable alternatives to FM and FO or in the reduction
of the dietary protein/lipid level very few have investigated the interactive effects such
dietary changes may have on growth and feed utilization (Bendiksen, et al., 2003a;
Bendiksen, et al., 2003b). For example, both factors (dietary protein/lipid level and oil
source) have been shown to affect the chemical composition of fish tissues (Bell, et al.,
2001a; Azevedo, et al., 2004b, 2004a; Solberg, 2004; Torstensen, et al., 2004a; Ruyter,
et al., 2006). Similarly, it has been reported previously that the dietary protein and fat
level affects the digestibility of nutrients in Atlantic salmon (Einen and Roem, 1997;
Azevedo, et al., 2004b). In addition, the dietary FA composition and consequently the
oil source also affect the ADC of nutrients and FA (Caballero, et al., 2002; Bendiksen,
et al., 2003b; Menoyo, et al., 2003; Ng, et al., 2004). Furthermore, the tissue FA
compositions and also the FA metabolism, especially the tissue β-oxidation capacities,
are known to be significantly influenced by the diet and especially the dietary FA
composition (Torstensen, et al., 2000; Bell, et al., 2001a; Rosenlund, et al., 2001; Bell,
et al., 2003a; Tocher, et al., 2003b; Torstensen and Stubhaug, 2004; Stubhaug, et al.,
2005a; Stubhaug, et al., 2007). Nevertheless, although these effects are important for
the understanding of the mechanisms of salmon nutrition and influence the growth and
the quality of the final product, little is known about how these factors interact.
Furthermore, the results of the study reported in the previous chapter showed
that the digestibility of nutrients and especially the ADC of individual FA may play a
CHAPTER 5. PROTEIN/LIPID & RO INTERACTIONS IN SALMON – II
99
key role in the enhanced growth that was shown. However, this hypothesis was not
fully confirmed in the previous study due to technical problems in the measurement of
the ADC and hence the interactive effects on nutrients and FA ADC should be further
elucidated.
Lastly, it is known that temperature plays a significant role in fish nutrition,
nutrient and FA metabolism and digestibility largely by affecting the membrane lipid
composition (Hazel, 1984; Hazel and Williams, 1990; Bendiksen and Jobling, 2003;
Ng, et al., 2004; Ruyter, et al., 2006). The previous trial was carried out at low water
temperatures of approximately 4 °C. However, it became clear that further research was
needed to assess the impact of protein/lipid ratio, and dietary lipid source, in Atlantic
salmon reared at high (summer) water temperatures.
Hence, the aim of this study was to investigate the interactive effects of three
different, decreasing, protein / fat ratios and the replacement of FO with RO on growth,
feed utilization, nutrient and FA digestibility, whole body chemical composition and
tissue FA composition and β-oxidation of large Atlantic salmon grown at high water
temperatures.
5.2 Materials and methods
5.2.1 Fish and culture conditions
For the present trial, triplicate groups of Atlantic salmon (Salmo salar), were
distributed in eighteen sea cages at the Fjord Research Station AS (Helgeland, Dønna,
Norway, 66 °N). Prior to the experiment, the fish were acclimatised to the trial cages for
63 days, where the average temperature was 12oC. During this period the fish were fed

CHAPTER 5. PROTEIN/LIPID & RO INTERACTIONS IN SALMON – II
100
a commercial diet from BioMar AS (9 mm; declared composition 360 g kg-1 protein and
350 g kg-1 fat) according to the producer’s recommendations. The sea cages were of
125 m3 (5x5x5m) with approximately 93 fish, of initial mean weight of 2053g,
randomly distributed in each one. The average water temperature during the 10 week
experimental period (August – October 2005) was 11.6 ± 1.1 °C and the salinity 32.5 ±
0.4 g L-1. During the experimental period the fish were subjected to natural photoperiod.
Mortalities were recorded and dead fish were removed daily.
5.2.2 Experimental diets and feeding
The six experimental diets were produced at the BioMar TechCentre (Brande,
Denmark) as practical-type extruded pellets (9 mm). The diets were formulated at three
different dietary protein/fat levels. Specifically, the diets contained 350 g kg-1 / 350 g
kg-1, 330 g kg-1 / 360 g kg-1, 290 g kg-1 / 380 g kg-1 of protein / lipid for high protein
(HP), medium protein (MP) and low protein (LP) diets, respectively. Within each
dietary protein/fat level the oil source was either FO or RO; in the RO diets crude RO
comprised 60% of the total added oil, the remainder of which was FO. The diets were
isoenergetic with a gross energy content of 25 kJ g-1. The formulations and the
proximate compositions of the experimental diets are shown in Table 5.1 and the fatty
acid compositions are shown in Table 5.2. The diets were formulated to meet all known
nutritional requirements of salmonid fish (NRC, 1993). All diets contained yttrium
trioxide (Y2O3) as an inert marker to determine the apparent digestibility coefficients
(ADC) of nutrients and FA. Each of the six experimental feeds was fed daily to
satiation by hand to triplicate groups (cages) of fish. Two daily meals were provided
with a minimum of 4 hours between the meals. Uneaten feed was collected using a lift-

CHAPTER 5. PROTEIN/LIPID & RO INTERACTIONS IN SALMON – II
101
up system and calculated on a daily basis in order to facilitate accurate calculations of
feed intake and FCR.
5.2.3 Sampling procedure
At the start of the trial the fish were bulk weighed. An initial sample of six fish
was taken to determine baseline values of whole body proximate composition. At the
end of the trial (10th week) the fish were anaesthetized in MS-222 (metacain, 8mg/L)
and individually weighed. Three fish per cage were selected at random from each cage
to determine whole body proximate composition. The fish were killed with a sharp
blow to the head. Fish were minced and homogenate sub-samples of each fish were
obtained. The initial samples were pooled in pairs so three samples were finally
obtained (n = 3) whereas the homogenates of the final sampling were pooled providing
finally one sample per cage.
At the end of the trial faeces samples were obtained by stripping according to
Austreng (1978). The fish were anaesthetized and faeces were collected by gently
squeezing the hindgut of the fish. One sample of faeces per cage was finally obtained
by pooling faeces from an appropriate, varying number of fish from each cage until a
minimum weight of 150 g (wet weight) of faeces was collected. Any water, urine and
fish scales were removed and ethoxyquin (ETQ; 400 mg/L, 1 mL/60g wet faeces) was
added to each sample which were then stored at -20 °C. The faeces samples were then
freeze dried as described in the General Materials and Methods section. The freeze
dried samples were also kept in -20 °C until further analysis. Lastly, samples were taken
from the six experimental diets and stored at -20°C until analyzed.

CHAPTER 5. PROTEIN/LIPID & RO INTERACTIONS IN SALMON – II
102
5.2.4 Proximate analysis
The nutrient compositions (moisture, crude protein, crude fat, ash and gross
energy content) of the six experimental diets and the whole body samples were
determined by proximate analysis based on methods described in AOAC (1995) as
described in the General Materials and Methods section. Prior to the crude fat extraction
the diet samples were acid hydrolysed as previously described. Yttrium trioxide (Y2O3)
was analysed as described in paragraph 2.5.8.
5.2.5 Lipid extraction and fatty acid analyses
The lipid extraction and FA analyses of diets and tissues were carried as
described in paragraph 2.6. Briefly, total lipids of flesh, livers and diet samples were
extracted by homogenization according to Folch et al. (1957). Fatty acid methyl esters
(FAME) were prepared from total lipid by acid-catalyzed transesterification as
described by Christie (1982) and FAME extracted and purified as described by Tocher
& Harvie (1988). FAME were separated and quantified by gas-liquid chromatography
and individual methyl esters were identified by comparison to known standards and by
reference to published data (Ackman, 1980).
5.2.6 Peroxisomal β-oxidation capacity
The peroxisomal β-oxidation capacity of liver, red and white muscle was
measured as described in paragraph 2.7. The samples of tissues were taken as described
above, immediately frozen in liquid nitrogen and stored in -20 °C until analyzed.

CHAPTER 5. PROTEIN/LIPID & RO INTERACTIONS IN SALMON – II
103
5.2.7 Calculations and statistical analysis
Feed Conversion Ratio (FCR), Specific Growth Rate (SGR), Thermal Growth
Coefficient (TGC), Protein productive value (PPV) and the ADC (Apparent
Digestibility Coefficient) of nutrients and FA were calculated as described in paragraph
2.8.
The effects of the protein/fat ratio (protein level), dietary RO inclusion (oil
source) and their interactions on growth, whole body proximate composition and ADC
of nutrients and individual FA were analysed by factorial (two-way) ANOVA. When
significant interactions of the two factors were observed, the main effects were not
discussed further but instead, multiple comparison testing was performed to look at the
simple main effects, that is the main effect of one factor at a given level of the other
(Zar, 1999, pp. 260-261). The analysis of the simple main effects was done for both
factors. Data which were identified as non-homogeneous (Levene’s test) were subjected
to square root, log or arcsin transformation before analysis. Differences were regarded
as significant when P < 0.05 (Zar, 1999). All the data are presented as means ± SD
(n = 3) and all statistical analyses were performed using SPSS 14.0 (SPSS Inc, 2005).
5.3 Results
5.3.1 Diet proximate and fatty acid composition
The analysed proximate composition of the six experimental diets is shown in
Table 5.1. The protein / lipid content of the diets, regardless of the RO inclusion level,
was 349 g kg-1 / 350 g kg-1, 333 g kg-1 / 358 g kg-1, 293 g kg-1 / 384 g kg-1 for HP, MP
and LP, respectively. All diets were isoenergetic with a gross energy value of 25 kJ g-1.

CHAPTER 5. PROTEIN/LIPID & RO INTERACTIONS IN SALMON – II
104
The Digestible Protein / Digestible Energy (DP/DE) ratio was 14.5, 13.5 and 12.3 for
the HP, MP and LP diets, respectively. DP and DE were calculated using the ADC
values for protein and energy found in this trial (Table 5.4).
The oil source of the diets was either 100% FO or a blend of 40% FO and 60%
RO resulting in two different total lipid FA profiles (Table 5.2). The FO diets contained
approximately 36% total saturated FA, largely 16:0 (approx. 20%), except for the HP-
FO diet which had a slightly higher total saturated FA content (40.4%). The total
monoenes were 26%, predominantly 18:1n-9 and 16:1n-7. The total n-6 PUFA were
low (4.5%), half of which was 18:2n-6. Lastly, the total n-3 PUFA were as high as
32%, mainly as EPA and DHA (18.5% and 8%, respectively). The 60% inclusion of RO
resulted in the reduction of 16:0, and consequently of the total saturated FA, by half
compared to the FO diets. The total monoenes almost doubled, largely due to the high
amount of 18:1n-9 (38.5%). The total n-6 PUFA in the RO diets increased 3-fold, up to
14%, mainly as 18:2n-6 (13% of total FA). EPA decreased by 70% and DHA by more
than half (values were 6% and 3% of FA, respectively) and hence the total n-3 PUFA
were reduced by half (17%). The n-3/n-6 PUFA ratio was 7 and 1.2 for the FO and RO
diets, respectively.
5.3.2 Growth
The initial mean weight of the fish was 2053 g. After feeding the fish with the
experimental diets for 10 weeks their weight ranged from 3340.2 g to 3664.2 g, for HP-
RO and MP-RO, respectively (Table 5.3). Two way ANOVA showed a significant
effect due to the oil source (P = 0.032) with the fish fed the RO diets having a higher
final weight compared to the FO diets. The same significant effect due to the oil source
favouring the RO group was also observed in both SGR and TGC (0.87 vs. 0.94 and

CHAPTER 5. PROTEIN/LIPID & RO INTERACTIONS IN SALMON – II
105
3.46 vs. 3.81, respectively). The protein level had no significant effects on any of the
growth parameters although there was a trend (P = 0.085) of lower final weight with
decreasing protein level. In addition, no significant interactions between the two factors
(protein level and oil source) were observed. Lastly, FCR ranged from 0.99 to 1.10 but
was not significantly affected by the dietary treatments.
The PPV ranged from 0.38 to 0.47 (Table 5.3) and the two-way ANOVA
showed that the oil source, but not the protein level, had a significant overall effect on
PPV (P = 0.04); namely, the RO group had a higher PRE compared to the FO group
(0.41 vs. 0.45, for FO and RO, respectively). However, the data were non-homogenous
so the results of the two-way ANOVA could be misleading. Hence, when the outliers
were identified and removed from the data set (PPVb in Table 5.3) the data –set was
fulfilling the assumptions of two-way ANOVA and the results showed a significant
effect both due to the protein level and the oil source. Specifically, the LP diets had
significantly higher PPV than the other two groups (0.41, 0.43 and 0.47, for HP, MP
and LP, respectively). The dietary inclusion of RO resulted in higher PPV compared to
the FO groups (0.42 vs. 0.46, for FO and RO, respectively).
5.3.3 Apparent nutrient digestibility
The nutrients ADC are shown in Table 5.4. The DM ADC was relatively low
varying from 50.5% – 60.1%. Two-way ANOVA showed a significant interaction of
protein level and oil source, therefore the simple main effects were analysed (Figure
5.1a) showing that the LP diets had significantly lower DM ADC compared to HP and
MP diets for both oil sources. Regarding the effect of the oil source, RO diets showed a
significantly higher DM ADC for the HP diets only.

CHAPTER 5. PROTEIN/LIPID & RO INTERACTIONS IN SALMON – II
106
Energy ADC ranged from 73.2% - 79.2%. Again, a significant interaction of
protein level and oil source was observed and, hence, the simple main effects were
tested (Figure 5.1b). For the FO diets MP had significantly higher energy ADC than HP
and LP, whereas for RO the LP treatment showed a significantly lower energy ADC
than HP and MP. Testing the differences between FO and RO at each level of protein
showed a significant difference only in the HP group.
The protein ADC varied from 77.3% to 80.4% and only a significant effect of
the protein level was shown by the two-way ANOVA; specifically, the increase of
protein level resulted in increased protein ADC. As there were no interaction effects,
the means are represented as two parallel lines in Figure 5.1c.
Lastly, there was a significant interaction of protein level and oil source for fat
ADC (Figure 5.1d). For the FO treatments HP had a significantly lower fat ADC
compared to MP and LP, while there were no differences in the RO groups. RO resulted
in significantly higher fat ADC at all protein levels.
5.3.4 FA apparent digestibility
The digestibility of each individual FA for each dietary treatment and the effects
and interactions of the protein level and oil source are shown in Table 5.5. In general,
the ADC of the individual FA decreased with increasing FA chain length. For instance,
the ADC of 14:0 varied from 80.0% to 95.0% while the ADC of 22:0 was as low as
30% (30.3% - 68.3%). On the other hand, increasing the number of double bonds
increased the FA ADC. The FA with 20 carbons are given as an example: 20:0 varied
between 56.2%-78.6%, 20:1n-9 from 92.7% - 97.2%, 20:4n-6 from 97.4% - 98.7% and
20:5n-3 from 97.7% - 99.1%.

CHAPTER 5. PROTEIN/LIPID & RO INTERACTIONS IN SALMON – II
107
For most of the saturated FA, ADC showed significant interactions between the
protein level and oil source, hence, the simple main effects of the two factors were
tested. For instance, for 16:0 (Figure 5.2a) HP had a significantly lower ADC compared
to MP and LP for both oil sources, whereas RO resulted in significantly higher ADC at
all protein levels. The total saturates ADC (Figure 5.2b) was significantly lower for the
HP group compared to MP and LP for the FO treatments, while no significant
differences were shown between the three protein levels for the RO treatments.
Furthermore, RO showed a significantly higher total saturates ADC compared to FO,
only for the HP groups.
Significant interactions were observed for the medium chain monoenes (16 and
18 carbon atoms) and the total monoenes. The simple main effects of the two factors for
16:1n-7, 18:1n-9 and total monoenes are shown in Figure 5.2 (graphs c, d and e,
respectively). In general, the MP diet had a higher ADC for the FO treatments while no
significant effect due to the protein level was shown for the RO treatments. Regarding
the effects of the oil source, RO resulted in higher ADC at all protein levels, apart from
the MP groups for 16:1n-7. The ADC of 20:1n-9, 22:1 and 24:1n-9 was significantly
affected both by the protein level and the oil source. Specifically, RO showed
significantly higher ADC compared to FO, and LP resulted in lower ADC.
Regarding the ADC of the n-6 and n-3 PUFA, the two factors had a significant
effect only on the ADC of 18:2n-6, 18:3n-3 and 18:4n-3. Specifically, the ADC of these
FA was significantly affected by both the protein level and the oil source; the MP
groups had the highest ADC and the LP groups the lowest, and RO diets had higher
ADC than FO, respectively. A significant interaction was shown for the ADC of the
total n-6 PUFA; the simple main effects of total saturates ADC are shown in Figure 5.2f

CHAPTER 5. PROTEIN/LIPID & RO INTERACTIONS IN SALMON – II
108
and are very similar to the effects of total monoenes ADC. Only the protein level had a
significant effect on EPA; the MP groups had the highest ADC and the LP groups the
lowest. DHA was significantly affected only by the oil source resulting in higher ADC
for the FO groups compared to the RO. Lastly, no significant effects were shown for the
total n-3 PUFA ADC.
5.3.5 Whole body proximate composition
The initial proximate composition of the fish whole body was 63.9% DM,
17.2% crude protein, 16.2% crude fat and 1.8% ash (Table 5.6). At the end of the
experimental period moisture varied from 59.3% to 61.3% and was significantly
affected both by the protein level and the oil source. Specifically, the LP group had a
lower moisture content than the other two treatments. Regarding the oil source the fish
fed the FO diets had a higher moisture content compared to the fish fed the RO.
Significant interactions between the two factors were shown for the protein content
which ranged from 15.8 to 16.6%. The analysis of the simple main effects showed that
for the FO groups it was decreased when the dietary protein level decreased while no
differences were shown for the RO groups. For the HP groups FO resulted in higher
protein content, for the MP there were no differences between FO and RO, while for the
LP groups RO had the highest protein content. The fat content was significantly
affected by the oil source with RO groups having a higher fat content than the FO
groups (21.3% vs. 19.4%) but was not influenced by the dietary protein level. No
significant effects were shown on the ash content of the whole body, which varied from
1.6% – 1.8%.

CHAPTER 5. PROTEIN/LIPID & RO INTERACTIONS IN SALMON – II
109
5.3.6 Tissue fatty acid compositions
The total lipid content and the fatty acid composition of muscle and liver from
fish fed the six experimental diets for 10 weeks are shown in Table 5.7 and Table 5.8.
The muscle total lipid varied from 138.0 to 156.5 mg lipid g-1 tissue. The liver lipid
content was much lower, compared to that of muscle, ranging from 50.1 to 64.9 mg
lipid g-1 tissue. Neither the dietary protein level nor the RO inclusion affected the
muscle and liver lipid contents and no significant interactions were shown by two-way
ANOVA.
Regarding the FA composition of muscle and liver, they were significantly
affected by the RO but not by the protein level and no significant interactions between
the two factors were shown. Specifically, the inclusion of RO resulted in a significant
increase of 18:1n-9, total monoenes, 18:2n-6, 20:2n-6, total n-6 PUFA and 18:3n-3. On
the other hand, all saturates, including total saturated FA, 16:1n-7, 22:1, AA, EPA,
DHA, total n-3 FA and the n-3/n-6 ratio were significantly reduced when the fish were
fed the diets containing RO.
Notably, in muscle EPA was reduced by half (10.4 vs. 5.2%, for FO vs. RO,
respectively), while the reduction in DHA was more moderate (7.8 vs. 5.0% for FO vs.
RO, respectively). 18:1n-9 increased from 20.9% to 35.1%, 18:2n-6 from 6.6% to
11.6% and 18:3n-3 from 2.0% to 4.6% for FO and RO groups, respectively. Similarly,
in liver EPA was reduced from 16.0% to 9.9% and DHA from 16.2% to 13.2% for FO
and RO groups, respectively. The increase between FO and RO groups for 18:1n-9,
18:2n-6 and 18:3n-3 was 13.8% vs. 27.9%, 1.9% vs. 7.6% and 0.5% v. 2.9%,
respectively.

CHAPTER 5. PROTEIN/LIPID & RO INTERACTIONS IN SALMON – II
110
The differences (Δ) between diet and muscle fatty acid concentrations for the six
experimental diets are shown in Table 5.9, where negative Δ values indicate lower
values in muscle compared with diet, whereas positive values indicate accumulation in
tissues relative to diet. Thus, the saturated FA, ARA, EPA, and the total n-3 PUFA were
utilized to a higher extent by the fish fed the FO diets compared to the RO groups. DHA
appeared to be slightly utilized in the FO groups but was accumulated in the muscle in
the RO groups. On the contrary, 18:1n-9, 18:2n-6 and 18:3n-3 were found in higher
concentrations in the muscle in the FO groups but were utilised in the RO groups.
Likewise, the differences (Δ) between diet and liver fatty acid concentrations for the six
experimental diets are shown in Table 5.10. In liver the 14:0 and 16:0 were utilized in
all groups, although lower Δ values were found in the FO groups. Similarly to the
muscle, 18:1n-9, 18:2n-6 and 18:3n-3 in liver were much more utilized in the RO
groups compared to the FO ones. Lastly, 18:0, AA and DHA were accumulated in liver
in all groups.
5.3.7 Peroxisomal β-oxidation capacity
The peroxisomal palmitoyl-CoA oxidation capacity in liver, red and white
muscle is shown in Table 5.11. The peroxisomal β-oxidation capacity in liver ranged
from 6.6 to 12.5 pmol/min/mg protein, in red muscle from 26.7 to 36.3 pmol/min/mg
protein and in white muscle from 1.1 to 1.6 pmol/min/mg protein. In liver and red
muscle β-oxidation capacity was significantly affected by the oil source (P = 0.035 and
P = 0.034 for liver and red muscle, respectively). Specifically, RO inclusion resulted in
significantly higher β-oxidation in both liver (7.2 vs. 9.7, for FO and RO, respectively)
and red muscle (28.2 vs. 33.7, for FO and RO, respectively). However, in white muscle
there was a significant interaction of the two factors (protein level and oil source) and

CHAPTER 5. PROTEIN/LIPID & RO INTERACTIONS IN SALMON – II
111
hence, the simple main effects of the two factors were tested, as demonstrated in Figure
5.3. Specifically, the HP group had a significantly higher β-oxidation capacity than MP
and LP when FO was the oil source, whereas in contrast, the β-oxidation capacity in HP
was lower than the other two groups when RO was included in the diet. Regarding the
effects of the oil source on β-oxidation capacity at the three protein levels, the ranking
was FO > RO for HP, RO > FO for MP while FO and RO did not significantly differ at
LP.

CHAPTER 5. PROTEIN/LIPID & RO INTERACTIONS IN SALMON – II
112
Table 5.1. Feed formulations and proximate compositions (g kg-1) of the experimental
diets
HP-FO MP-FO LP-FO HP-RO MP-RO LP-ROComponentsFishmeala 402 340 268 402 340 268Oil seed and legume seed meals 181 190 190 181 190 190Binder 135 130 190 135 130 190Fish oil 304 330 351 122 132 141Rapeseed oilb 0 0 0 182 198 211Premixesc 9 10 11 9 10 11
Analyzed composition d
Moisture 49 69 69 51 73 67Dry Matter 951 931 931 949 927 933Protein 353 338 291 345 328 296Lipid 350 349 386 351 368 382Ash 81 75 63 79 73 63Gross Energye 25.25 25.22 25.32 25.47 25.41 25.36DP/DEf 15.4 14.0 12.3 13.7 13.0 12.3
a South-american, Anchoveta oilb European, non-GM, double-low quality rapeseed oil c Vitamin and mineral premixes prepared according to BioMar A/S commercial standards. Includes crystaline amino acids and Carophyl pink to provide 40mg/kg astaxanthin (DSM Roche, Basel, Switzerland)d Wet weighte kJ g-1
f Digestible Protein/Digestible Energy ratio was calculated using the ADC values for energy and protein found in the present study and presented in the Results section

CHAPTER 5. PROTEIN/LIPID & RO INTERACTIONS IN SALMON – II
113
Table 5.2. Fatty acid compositions (% by weight of total fatty acids) of the experimental
diets
Fatty Acid HP-FO MP-FO LP-FO HP-RO MP-RO LP-R014:0 8.8 8.5 8.3 3.4 3.0 2.816:0 23.2 20.3 20.2 12.1 10.9 10.218:0 5.9 4.9 5.0 3.8 4.3 3.520:0 0.6 0.5 0.5 0.7 0.8 0.722:0 1.3 1.2 1.2 1.9 2.5 1.7Total saturateda 40.4 35.9 35.7 22.0 21.7 19.1
16:1n-7 8.0 8.8 8.7 3.3 3.1 3.018:1n-9 9.5 10.9 11.3 37.7 37.7 40.018:1n-7 3.2 3.3 3.4 3.7 3.0 3.120:1n-9 1.5 1.4 1.3 1.6 1.5 1.522:1 1.7 1.7 1.5 1.3 1.1 0.924:1n-9 0.5 0.5 0.6 0.4 0.4 0.3Total monoenesb 24.7 26.8 27.0 47.9 47.1 49.1
18:2n-6 2.1 2.4 2.7 12.5 13.0 13.820:2n-6 0.1 0.2 0.2 0.1 0.1 0.120:4n-6 1.1 1.1 1.1 0.4 0.5 0.422:5n-6 0.3 0.3 0.3 0.1 0.1 0.1Total n-6 PUFAc 4.1 4.6 4.8 13.2 14.0 14.8
18:3n-3 0.6 0.7 0.8 6.2 6.3 6.718:4n-3 2.1 2.3 2.2 0.8 0.8 0.720:4n-3 0.6 0.7 0.6 0.2 0.2 0.220:5n-3 17.6 19.0 18.8 5.8 6.0 5.822:5n-3 1.9 2.0 2.0 0.7 0.7 0.622:6n-3 8.0 8.0 7.9 3.2 3.2 3.0Total n-3 PUFAd 30.8 32.7 32.5 16.9 17.3 17.1
Total PUFA 34.9 37.3 37.3 30.1 31.3 31.9(n-3) / (n-6) 7.5 7.1 6.8 1.3 1.2 1.2
aIncludes 15:0 bIncludes 16:1n-9 & 20:1n-7. cIncludes 18:3n-6, 20:3n-6 & 22:4n-6. dIncludes 20:3n-3 & 22:4n-3.

114
Table 5.3. Growth and performance of Atlantic salmon fed the six experimental diets for 10 weeks
protein oil prot x oilStart Weight, g 2031.7 ± 8.3 2097.0 ± 9.6 2031.7 ± 32.6 2065.3 ± 28.5 2055.7 ± 47.2 2038.3 ± 18.6End Weight, g 3340.2 ± 136.0 3491.1 ± 134.2 3352.9 ± 156.2 3591.8 ± 158.7 3664.2 ± 148.0 3405.7 ± 92.1 0.085 0.032 0.483
FCR1 1.07 ± 0.06 1.10 ± 0.09 1.06 ± 0.05 0.99 ± 0.05 1.02 ± 0.05 1.09 ± 0.11 0.587 0.262 0.376SGR2 0.86 ± 0.07 0.88 ± 0.07 0.86 ± 0.08 0.95 ± 0.05 0.99 ± 0.03 0.88 ± 0.06 0.262 0.025 0.422TGC3 3.41 ± 0.29 3.54 ± 0.32 3.44 ± 0.34 3.85 ± 0.25 4.04 ± 0.17 3.53 ± 0.26 0.202 0.021 0.414
PPV4a 0.40 ± 0.03 0.38 ± 0.05 0.44 ± 0.02 0.43 ± 0.01 0.44 ± 0.02 0.47 ± 0.06 0.113 0.040 0.865PPV4b 0.40 ± 0.03 0.41 ± 0.01 0.44 ± 0.02 0.43 ± 0.01 0.44 ± 0.02 0.51 ± 0.06 0.003 0.003 0.294
All values are mean ± S.D. (n=3)1 Feed Conversion Ratio; 2 Specific Growth Rate; 3 Thermal Growth Coefficient; 4 Protein Productive Value (4a Including outliers, 4b Excluding Outliers)
MP-RO LP-RO TWO WAY ANOVA PHP-FO MP-FO LP-FO HP-RO
CH
APTER
5. PR
OTEIN/L
IPID &
RO
INTER
AC
TION
S IN S
ALM
ON
–II

115
Table 5.4. Apparent nutrient and energy digestibility (%) in Atlantic salmon fed the six experimental diets for 10 weeks
protein oil prot x oilDry Matter 56.4 ± 0.6 56.9 ± 0.3 53.8 ± 1.2 60.1 ± 0.5 57.7 ± 1.8 50.5 ± 4.2 0.000 0.692 0.028Protein 80.4 ± 0.2 79.7 ± 0.2 78.2 ± 1.1 79.8 ± 0.6 78.9 ± 1.7 77.3 ± 1.8 0.002 0.117 0.946Lipid 82.3 ± 2.0 89.1 ± 0.7 87.0 ± 1.7 92.3 ± 0.7 92.4 ± 0.9 92.0 ± 1.0 0.005 0.000 0.003Gross Energy 73.2 ± 0.3 76.3 ± 0.2 73.2 ± 1.5 79.2 ± 0.2 78.3 ± 1.3 73.2 ± 1.5 0.001 0.001 0.011
All values are mean ± S.D. (n=3).
MP-RO LP-RO TWO WAY ANOVA PHP-FO MP-FO LP-FO HP-RO
CH
APTER
5. PR
OTEIN/L
IPID &
RO
INTER
AC
TION
S IN S
ALM
ON
–II

CHAPTER 5. PROTEIN/LIPID & RO INTERACTIONS IN SALMON – II
116
Table 5.5. Apparent fatty acid digestibility (%) in Atlantic salmon fed the six
experimental diets for ten weeks
protein oil prot x oil14:0 80.0 ± 1.5 88.9 ± 0.4 88.4 ± 0.8 90.6 ± 1.9 95.0 ± 0.3 93.6 ± 0.9 0.000 0.000 0.00316:0 67.1 ± 3.5 82.4 ± 0.8 80.5 ± 1.3 85.5 ± 3.3 91.2 ± 0.1 88.0 ± 1.8 0.000 0.000 0.00218:0 49.0 ± 6.4 62.1 ± 1.8 60.3 ± 4.2 68.6 ± 12.8 55.1 ± 4.3 48.7 ± 8.8 0.520 0.931 0.00620:0 56.2 ± 5.8 59.4 ± 1.7 58.0 ± 4.7 78.6 ± 9.7 63.5 ± 3.3 59.3 ± 8.1 0.080 0.008 0.02422:0 36.2 ± 10.1 32.5 ± 4.8 30.3 ± 8.5 68.3 ± 18.3 44.1 ± 4.6 30.4 ± 15.3 0.019 0.019 0.087Total saturated1 66.2 ± 3.7 79.2 ± 1.0 77.5 ± 1.8 81.8 ± 6.1 78.3 ± 1.4 75.5 ± 4.3 0.070 0.023 0.001
16:1n-7 95.6 ± 0.4 97.7 ± 0.1 95.9 ± 0.8 98.0 ± 0.6 98.0 ± 0.0 97.2 ± 1.2 0.009 0.001 0.04318:1n-9 95.2 ± 0.1 97.3 ± 0.4 95.3 ± 0.9 98.8 ± 0.4 98.6 ± 0.1 97.7 ± 1.1 0.006 0.000 0.02918:1n-7 93.4 ± 0.5 95.7 ± 0.0 93.7 ± 0.8 98.1 ± 0.5 97.4 ± 0.3 96.7 ± 1.1 0.011 0.000 0.00620:1n-9 93.6 ± 0.2 95.2 ± 0.6 92.7 ± 1.1 97.2 ± 0.8 97.1 ± 0.2 95.9 ± 1.7 0.016 0.000 0.31922:1 92.7 ± 0.5 94.4 ± 0.4 91.6 ± 1.0 95.9 ± 1.1 96.2 ± 0.4 93.9 ± 1.6 0.002 0.000 0.45324:1n-9 82.1 ± 1.9 87.1 ± 2.9 85.4 ± 0.9 90.9 ± 1.6 92.7 ± 0.7 88.8 ± 3.5 0.039 0.000 0.135Total monoenes2 94.5 ± 0.3 96.7 ± 0.3 94.6 ± 0.9 98.5 ± 0.4 98.3 ± 0.1 97.4 ± 1.2 0.005 0.000 0.022
18:2n-6 95.2 ± 0.3 96.8 ± 0.7 94.8 ± 1.0 98.8 ± 0.4 98.7 ± 0.1 98.1 ± 0.7 0.012 0.000 0.06220:2n-6 97.0 ± 2.6 99.1 ± 1.6 97.5 ± 2.2 95.9 ± 4.9 98.4 ± 1.4 94.0 ± 4.7 0.273 0.277 0.73620:4n-6 97.8 ± 0.6 98.7 ± 0.4 97.4 ± 0.8 97.9 ± 0.2 98.1 ± 0.3 97.9 ± 0.8 0.082 0.975 0.18022:5n-6 97.7 ± 2.0 99.2 ± 1.4 96.5 ± 1.0 98.3 ± 3.0 99.1 ± 1.5 98.7 ± 2.3 0.384 0.350 0.607Total n-6 PUFA3 95.2 ± 0.5 97.2 ± 0.7 95.7 ± 0.7 98.7 ± 0.3 98.5 ± 0.1 98.0 ± 0.8 0.021 0.000 0.023
18:3n-3 97.1 ± 0.3 98.4 ± 0.4 96.9 ± 0.8 99.3 ± 0.3 99.2 ± 0.0 98.7 ± 0.6 0.015 0.000 0.08118:4n-3 98.2 ± 0.3 99.1 ± 0.1 97.8 ± 0.7 99.1 ± 0.3 99.1 ± 0.1 98.8 ± 0.4 0.013 0.003 0.08220:4n-3 98.6 ± 1.3 98.9 ± 0.2 97.5 ± 0.7 98.8 ± 1.1 99.5 ± 0.9 98.7 ± 1.2 0.166 0.159 0.70220:5n-3 98.3 ± 0.5 99.1 ± 0.2 97.7 ± 0.8 98.9 ± 0.3 98.7 ± 0.2 98.6 ± 0.5 0.045 0.091 0.08722:5n-3 97.7 ± 0.7 98.4 ± 0.3 97.0 ± 0.9 97.9 ± 0.1 97.7 ± 0.1 97.3 ± 0.9 0.058 0.826 0.31022:6n-3 96.0 ± 1.2 97.1 ± 0.6 95.5 ± 1.0 95.7 ± 1.0 94.4 ± 0.7 94.4 ± 1.8 0.391 0.025 0.207Total n-3 PUFA4 97.6 ± 0.7 98.5 ± 0.3 97.1 ± 0.8 98.4 ± 0.4 98.0 ± 0.2 97.9 ± 0.8 0.098 0.230 0.160
Total PUFA 97.3 ± 0.7 98.3 ± 0.3 96.9 ± 0.8 98.5 ± 0.3 98.3 ± 0.1 97.9 ± 0.8 0.064 0.024 0.168
All values are mean ± S.D. (n=3).1Includes 15:0; 2Includes 16:1n-9 & 20:1n-7; 3Includes 18:3n-6, 20:3n-6 & 22:4n-6; 4Includes 20:3n-3 & 22:4n-3
MP-RO LP-RO TWO WAY ANOVA PHP-FO MP-FO LP-FO HP-RO

CHAPTER 5. PROTEIN/LIPID & RO INTERACTIONS IN SALMON – II
117
a. Dry Matter
HP MP LP45
55
65
75
a *
A *
a
A
b
B
FORO
AD%
b. Energy
HP MP LP60
70
80
90 FORO
a *
B *
a
AB
b
AD %
c. Protein
HP MP LP70
80
90
100 FORO
AD%
d. Fat
HP MP LP70
80
90
100
B *
a *
A *
a * a *
A *
FORO
AD%
Figure 5.1. Means of the ADC of DM (a), Energy (b), protein (c) and fat (d), for the six
experimental diets, in a two-way ANOVA, showing the effects of the two factors and
their interaction. For each oil source, values denoted with different letters are significantly different; uppercase or lowercase letters correspond to FO or RO, respectively. Within each protein level the significant differences between FO and RO values are marked with an asterisk.

CHAPTER 5. PROTEIN/LIPID & RO INTERACTIONS IN SALMON – II
118
a. 16:0
HP MP LP60
70
80
90
100
FORO
b *
a *a *
B *
A * A *AD%
b. Total saturated
HP MP LP60
70
80
90
100FORO
*
B *
A A
AD%
c. 16:1n-7
HP MP LP85
90
95
100
FORO
B *
A
B *
**
AD%
d. 18:1n-9
HP MP LP85
90
95
100
FORO
B *
A *B *
* **
AD%
e. Total Monoenes
HP MP LP85
90
95
100
FORO
* **
B *
A *
B *
AD%
f. Total n-6 PUFA
HP MP LP85
90
95
100
FORO
* * *
B *A *
B *
AD%
Figure 5.2. Means of the ADC of individual fatty acids, 16:0 (a), total saturated (b),
16:1n-7 (c), 18:1n-9 (d) total monoenes (e), and total n-6 PUFA (e), of the six
experimental diets, in a two-way ANOVA, showing the effects of the two factors and
their interaction. For each oil source, values denoted with different letters are significantly different; uppercase or lowercase letters correspond to FO or RO, respectively. Within each protein level the significant differences between FO and RO values are marked with an asterisk.

119
Table 5.6. Proximate composition (% of wet weight) of whole body from Atlantic salmon fed the experimental diets for 10 weeks
protein oil prot x oilMoisture 63.9 ± 0.9 61.3 ± 0.5 61.4 ± 0.4 60.8 ± 0.3 60.6 ± 1.0 60.7 ± 0.7 59.3 ± 0.5 0.018 0.004 0.468Protein 17.2 ± 0.3 16.6 ± 0.2 16.1 ± 0.3 15.8 ± 0.2 16.2 ± 0.2 16.1 ± 0.3 16.4 ± 0.1 0.092 0.682 0.004Lipid 16.2 ± 1.1 19.1 ± 1.0 19.7 ± 0.1 19.4 ± 0.1 21.5 ± 0.9 20.9 ± 0.7 21.6 ± 0.7 0.808 0.000 0.274Ash 1.8 ± 0.2 1.7 ± 0.1 1.7 ± 0.1 1.8 ± 0.1 1.8 ± 0.1 1.6 ± 0.1 1.7 ± 0.1 0.093 0.542 0.428
MP-RO LP-RO TWO WAY ANOVA PStart 1 HP-FO MP-FO LP-FO HP-RO
CH
APTER
5. PR
OTEIN/L
IPID &
RO
INTER
AC
TION
S IN S
ALM
ON
– II

CHAPTER 5. PROTEIN/LIPID & RO INTERACTIONS IN SALMON – II
120
Table 5.7. Total lipid (mg lipid g-1 tissue) and fatty acid compositions (% by weight of
total fatty acids) of muscle from Atlantic salmon fed the experimental diets for 10
weeks
protein oil prot x oilTotal Lipid 142.1 ± 14.2 142.2 ± 24.5 138.0 ± 9.7 147.5 ± 13.3 156.5 ± 14.1 143.8 ± 3.8 0.621 0.242 0.843
Fatty acid14:0 5.8 ± 1.3 5.6 ± 0.4 5.7 ± 0.3 3.4 ± 0.1 3.2 ± 0.1 3.4 ± 0.3 0.766 0.000 0.98816:0 17.4 ± 2.9 16.3 ± 1.3 17.0 ± 1.5 12.4 ± 0.4 11.9 ± 0.2 12.3 ± 0.7 0.677 0.000 0.94118:0 4.0 0.7 3.7 ± 0.4 3.8 ± 0.4 3.1 ± 0.1 3.1 ± 0.0 3.1 ± 0.2 0.695 0.001 0.903Total saturated1 28.6 ± 4.8 26.9 ± 2.7 28.3 ± 3.0 20.5 ± 1.6 19.7 ± 1.1 20.5 ± 2.1 0.705 0.000 0.957
16:1n-7 6.9 ± 0.4 7.3 ± 0.2 7.1 ± 0.3 4.3 ± 0.1 4.0 ± 0.1 4.2 ± 0.1 0.977 0.000 0.10618:1n-9 21.3 ± 0.6 21.3 ± 0.9 20.2 ± 1.1 33.7 ± 1.5 36.3 ± 1.4 35.3 ± 0.7 0.131 0.000 0.09018:1n-7 3.6 ± 0.1 3.8 ± 0.3 3.8 ± 0.3 3.4 ± 0.4 3.0 ± 0.2 3.4 ± 0.1 0.427 0.004 0.21420:1n-9 2.7 ± 0.1 2.8 ± 0.0 2.5 ± 0.2 2.9 ± 0.2 3.0 ± 0.1 2.8 ± 0.1 0.033 0.004 0.63222:1 2.5 ± 0.2 2.5 ± 0.2 2.2 ± 0.2 2.1 ± 0.2 2.0 ± 0.2 2.0 ± 0.2 0.147 0.001 0.48924:1n-9 0.5 ± 0.1 0.6 ± 0.1 0.5 ± 0.1 0.4 ± 0.1 0.4 ± 0.0 0.5 ± 0.2 0.571 0.425 0.216Total monoenes2 37.7 ± 0.4 38.6 ± 0.6 36.7 ± 1.7 47.1 ± 1.9 49.0 ± 1.5 48.4 ± 1.0 0.190 0.000 0.336
18:2n-6 6.8 ± 0.6 6.5 ± 0.4 6.6 ± 0.0 11.3 ± 0.1 11.7 ± 0.2 11.8 ± 0.4 0.862 0.000 0.17720:2n-6 0.4 ± 0.1 0.4 ± 0.0 0.4 ± 0.0 0.6 ± 0.0 0.7 ± 0.0 0.6 ± 0.1 0.194 0.000 0.48420:3n-6 0.2 ± 0.0 0.3 ± 0.0 0.2 ± 0.0 0.2 ± 0.0 0.2 ± 0.0 0.2 ± 0.0 0.224 0.000 0.30820:4n-6 0.7 ± 0.1 0.8 ± 0.1 0.7 ± 0.1 0.4 ± 0.0 0.4 ± 0.0 0.4 ± 0.0 0.875 0.000 0.476Total n-6 PUFA3 8.5 ± 0.8 8.4 ± 0.3 8.3 ± 0.1 12.8 ± 0.2 13.2 ± 0.2 13.3 ± 0.5 0.797 0.000 0.379
18:3n-3 2.1 ± 0.3 2.0 ± 0.2 2.0 ± 0.0 4.6 ± 0.1 4.7 ± 0.1 4.6 ± 0.3 0.924 0.000 0.63718:4n-3 1.3 ± 0.1 1.4 ± 0.1 1.4 ± 0.1 0.8 ± 0.0 0.8 ± 0.0 0.8 ± 0.1 0.855 0.000 0.47520:4n-3 1.0 ± 0.1 1.0 ± 0.1 1.0 ± 0.1 0.7 ± 0.0 0.7 ± 0.0 0.7 ± 0.0 0.746 0.000 0.41920:5n-3 9.9 ± 1.6 10.6 ± 1.2 10.7 ± 0.9 5.7 ± 0.3 5.0 ± 0.1 5.0 ± 0.6 0.996 0.000 0.33822:5n-3 3.1 ± 0.5 3.3 ± 0.2 3.5 ± 0.2 2.1 ± 0.2 1.8 ± 0.1 1.8 ± 0.2 0.924 0.000 0.18422:6n-3 7.6 ± 1.5 7.7 ± 1.0 8.0 ± 0.6 5.4 ± 0.5 4.8 ± 0.4 4.7 ± 0.8 0.924 0.000 0.574Total n-3 PUFA4 25.2 ± 3.8 26.1 ± 2.7 26.7 ± 1.9 19.6 ± 1.2 18.1 ± 0.6 17.8 ± 1.9 0.981 0.000 0.451
Total PUFA 33.7 ± 4.4 34.5 ± 2.9 35.0 ± 2.0 32.4 ± 1.4 31.3 ± 0.7 31.1 ± 2.4 0.996 0.039 0.680(n-3) / (n-6) 2.9 ± 0.3 3.1 ± 0.2 3.2 ± 0.2 1.5 ± 0.1 1.4 ± 0.0 1.3 ± 0.1 0.761 0.000 0.049
Values are mean ± S.D. (n=3).1Includes 15:0, 20:0, 22:0; 2Includes 16:1n-9 & 20:1n-7; 3Includes 18:3n-6, 20:3n-6 & 22:4n-6; 4Includes 20:3n-3 & 22:4n-3
MP-RO LP-RO TWO WAY ANOVA PHP-FO MP-FO LP-FO HP-RO
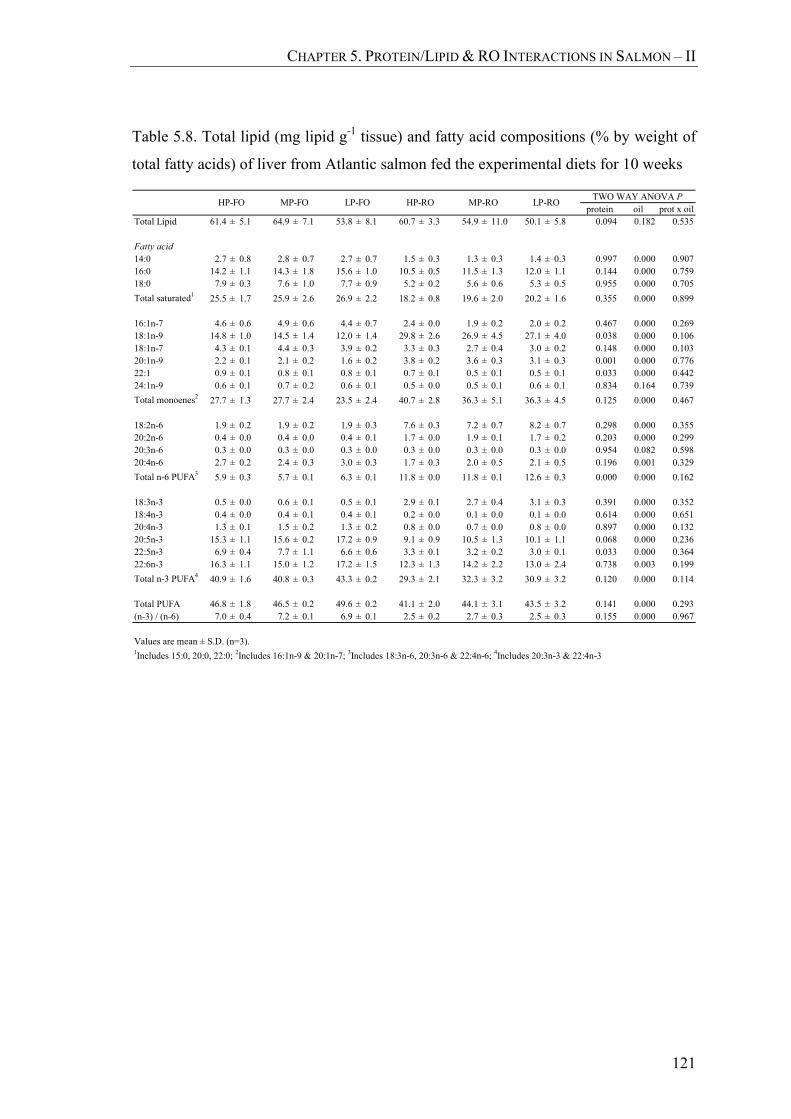
CHAPTER 5. PROTEIN/LIPID & RO INTERACTIONS IN SALMON – II
121
Table 5.8. Total lipid (mg lipid g-1 tissue) and fatty acid compositions (% by weight of
total fatty acids) of liver from Atlantic salmon fed the experimental diets for 10 weeks
protein oil prot x oilTotal Lipid 61.4 ± 5.1 64.9 ± 7.1 53.8 ± 8.1 60.7 ± 3.3 54.9 ± 11.0 50.1 ± 5.8 0.094 0.182 0.535
Fatty acid14:0 2.7 ± 0.8 2.8 ± 0.7 2.7 ± 0.7 1.5 ± 0.3 1.3 ± 0.3 1.4 ± 0.3 0.997 0.000 0.90716:0 14.2 ± 1.1 14.3 ± 1.8 15.6 ± 1.0 10.5 ± 0.5 11.5 ± 1.3 12.0 ± 1.1 0.144 0.000 0.75918:0 7.9 ± 0.3 7.6 ± 1.0 7.7 ± 0.9 5.2 ± 0.2 5.6 ± 0.6 5.3 ± 0.5 0.955 0.000 0.705Total saturated1 25.5 ± 1.7 25.9 ± 2.6 26.9 ± 2.2 18.2 ± 0.8 19.6 ± 2.0 20.2 ± 1.6 0.355 0.000 0.899
16:1n-7 4.6 ± 0.6 4.9 ± 0.6 4.4 ± 0.7 2.4 ± 0.0 1.9 ± 0.2 2.0 ± 0.2 0.467 0.000 0.26918:1n-9 14.8 ± 1.0 14.5 ± 1.4 12.0 ± 1.4 29.8 ± 2.6 26.9 ± 4.5 27.1 ± 4.0 0.038 0.000 0.10618:1n-7 4.3 ± 0.1 4.4 ± 0.3 3.9 ± 0.2 3.3 ± 0.3 2.7 ± 0.4 3.0 ± 0.2 0.148 0.000 0.10320:1n-9 2.2 ± 0.1 2.1 ± 0.2 1.6 ± 0.2 3.8 ± 0.2 3.6 ± 0.3 3.1 ± 0.3 0.001 0.000 0.77622:1 0.9 ± 0.1 0.8 ± 0.1 0.8 ± 0.1 0.7 ± 0.1 0.5 ± 0.1 0.5 ± 0.1 0.033 0.000 0.44224:1n-9 0.6 ± 0.1 0.7 ± 0.2 0.6 ± 0.1 0.5 ± 0.0 0.5 ± 0.1 0.6 ± 0.1 0.834 0.164 0.739Total monoenes2 27.7 ± 1.3 27.7 ± 2.4 23.5 ± 2.4 40.7 ± 2.8 36.3 ± 5.1 36.3 ± 4.5 0.125 0.000 0.467
18:2n-6 1.9 ± 0.2 1.9 ± 0.2 1.9 ± 0.3 7.6 ± 0.3 7.2 ± 0.7 8.2 ± 0.7 0.298 0.000 0.35520:2n-6 0.4 ± 0.0 0.4 ± 0.0 0.4 ± 0.1 1.7 ± 0.0 1.9 ± 0.1 1.7 ± 0.2 0.203 0.000 0.29920:3n-6 0.3 ± 0.0 0.3 ± 0.0 0.3 ± 0.0 0.3 ± 0.0 0.3 ± 0.0 0.3 ± 0.0 0.954 0.082 0.59820:4n-6 2.7 ± 0.2 2.4 ± 0.3 3.0 ± 0.3 1.7 ± 0.3 2.0 ± 0.5 2.1 ± 0.5 0.196 0.001 0.329Total n-6 PUFA3 5.9 ± 0.3 5.7 ± 0.1 6.3 ± 0.1 11.8 ± 0.0 11.8 ± 0.1 12.6 ± 0.3 0.000 0.000 0.162
18:3n-3 0.5 ± 0.0 0.6 ± 0.1 0.5 ± 0.1 2.9 ± 0.1 2.7 ± 0.4 3.1 ± 0.3 0.391 0.000 0.35218:4n-3 0.4 ± 0.0 0.4 ± 0.1 0.4 ± 0.1 0.2 ± 0.0 0.1 ± 0.0 0.1 ± 0.0 0.614 0.000 0.65120:4n-3 1.3 ± 0.1 1.5 ± 0.2 1.3 ± 0.2 0.8 ± 0.0 0.7 ± 0.0 0.8 ± 0.0 0.897 0.000 0.13220:5n-3 15.3 ± 1.1 15.6 ± 0.2 17.2 ± 0.9 9.1 ± 0.9 10.5 ± 1.3 10.1 ± 1.1 0.068 0.000 0.23622:5n-3 6.9 ± 0.4 7.7 ± 1.1 6.6 ± 0.6 3.3 ± 0.1 3.2 ± 0.2 3.0 ± 0.1 0.033 0.000 0.36422:6n-3 16.3 ± 1.1 15.0 ± 1.2 17.2 ± 1.5 12.3 ± 1.3 14.2 ± 2.2 13.0 ± 2.4 0.738 0.003 0.199Total n-3 PUFA4 40.9 ± 1.6 40.8 ± 0.3 43.3 ± 0.2 29.3 ± 2.1 32.3 ± 3.2 30.9 ± 3.2 0.120 0.000 0.114
Total PUFA 46.8 ± 1.8 46.5 ± 0.2 49.6 ± 0.2 41.1 ± 2.0 44.1 ± 3.1 43.5 ± 3.2 0.141 0.000 0.293(n-3) / (n-6) 7.0 ± 0.4 7.2 ± 0.1 6.9 ± 0.1 2.5 ± 0.2 2.7 ± 0.3 2.5 ± 0.3 0.155 0.000 0.967
Values are mean ± S.D. (n=3).1Includes 15:0, 20:0, 22:0; 2Includes 16:1n-9 & 20:1n-7; 3Includes 18:3n-6, 20:3n-6 & 22:4n-6; 4Includes 20:3n-3 & 22:4n-3
MP-RO LP-RO TWO WAY ANOVA PHP-FO MP-FO LP-FO HP-RO

CHAPTER 5. PROTEIN/LIPID & RO INTERACTIONS IN SALMON – II
122
Table 5.9. Differences (Δ)1 between diet and muscle fatty acid concentrations2 for the
six experimental treatments
Fatty Acid HP-FO MP-FO LP-FO HP-RO MP-RO LP-RO14:0 -3.0 -2.9 -2.6 0.0 0.1 0.616:0 -5.8 -3.9 -3.2 0.3 1.0 2.118:0 -1.9 -1.3 -1.2 -0.6 -1.2 -0.4Total saturated3 -11.8 -9.0 -7.4 -1.4 -1.9 1.4
16:1n-7 -1.1 -1.5 -1.6 1.0 0.9 1.218:1n-9 11.7 10.4 8.9 -4.0 -1.4 -4.7Total monoenes4 13.0 11.7 9.7 -0.8 1.9 -0.7
18:2n-6 4.7 4.1 3.9 -1.2 -1.2 -2.020:4n-6 -0.4 -0.4 -0.4 0.0 -0.1 0.0Total n-6 PUFA5 4.4 3.8 3.5 -0.4 -0.8 -1.5
18:3n-3 1.5 1.3 1.2 -1.6 -1.6 -2.120:5n-3 -7.7 -8.4 -8.1 -0.1 -1.0 -0.822:6n-3 -0.4 -0.2 0.1 2.2 1.6 1.8Total n-3 PUFA6 -5.6 -6.6 -5.8 2.7 0.8 0.7
1 Negative Δ values indicate lower values in muscle compared with diet, whereaspositive values indicate accumulation in muscle relative to diet.2 FA concentrations are % by weight of total fatty acids in diet and muscle3Includes 15:0, 20:0, 22:04Includes 16:1n-9, 18:1n-7, 20:1n-9, 20:1n-7,22:1 & 24:1n-95Includes 18:3n-6, 20:2n-6, 20:3n-6, 22:4n-6 & 22:5n-66Includes 18:4n-3, 20:3n-3, 20:4n-3, 22:4n-3 & 22:5n-3

CHAPTER 5. PROTEIN/LIPID & RO INTERACTIONS IN SALMON – II
123
Table 5.10. Differences (Δ)1 between diet and liver fatty acid concentrations2 for the six
experimental treatments
Fatty Acid HP-FO MP-FO LP-FO HP-RO MP-RO LP-RO14:0 -6.2 -5.7 -5.6 -1.9 -1.7 -1.416:0 -9.0 -6.0 -4.6 -1.6 0.6 1.718:0 2.0 2.7 2.8 1.5 1.3 1.7Total saturated3 -14.9 -10.0 -8.8 -3.7 -2.0 1.1
16:1n-7 -4.1 -3.9 -4.3 -1.1 -1.5 -1.318:1n-9 5.3 3.6 0.7 -7.9 -10.8 -13.0Total monoenes4 3.0 0.8 -3.5 -7.2 -10.8 -12.8
18:2n-6 -0.3 -0.5 -0.7 -4.9 -5.8 -5.720:4n-6 1.6 1.3 1.9 1.3 1.6 1.7Total n-6 PUFA5 1.8 1.1 1.5 -1.5 -2.2 -2.2
18:3n-3 -0.1 -0.2 -0.3 -3.3 -3.5 -3.620:5n-3 -2.2 -3.4 -1.7 3.3 4.5 4.322:6n-3 8.3 7.0 9.3 9.1 10.9 10.1Total n-3 PUFA6 10.1 8.1 10.9 12.4 15.0 13.8
1 Negative Δ values indicate lower values in liver compared with diet, whereaspositive values indicate accumulation in liver relative to diet.2 FA concentrations are % by weight of total fatty acids in diet and muscle3Includes 15:0, 20:0, 22:04Includes 16:1n-9, 18:1n-7, 20:1n-9, 20:1n-7,22:1 & 24:1n-95Includes 18:3n-6, 20:2n-6, 20:3n-6, 22:4n-6 & 22:5n-66Includes 18:4n-3, 20:3n-3, 20:4n-3, 22:4n-3 & 22:5n-3
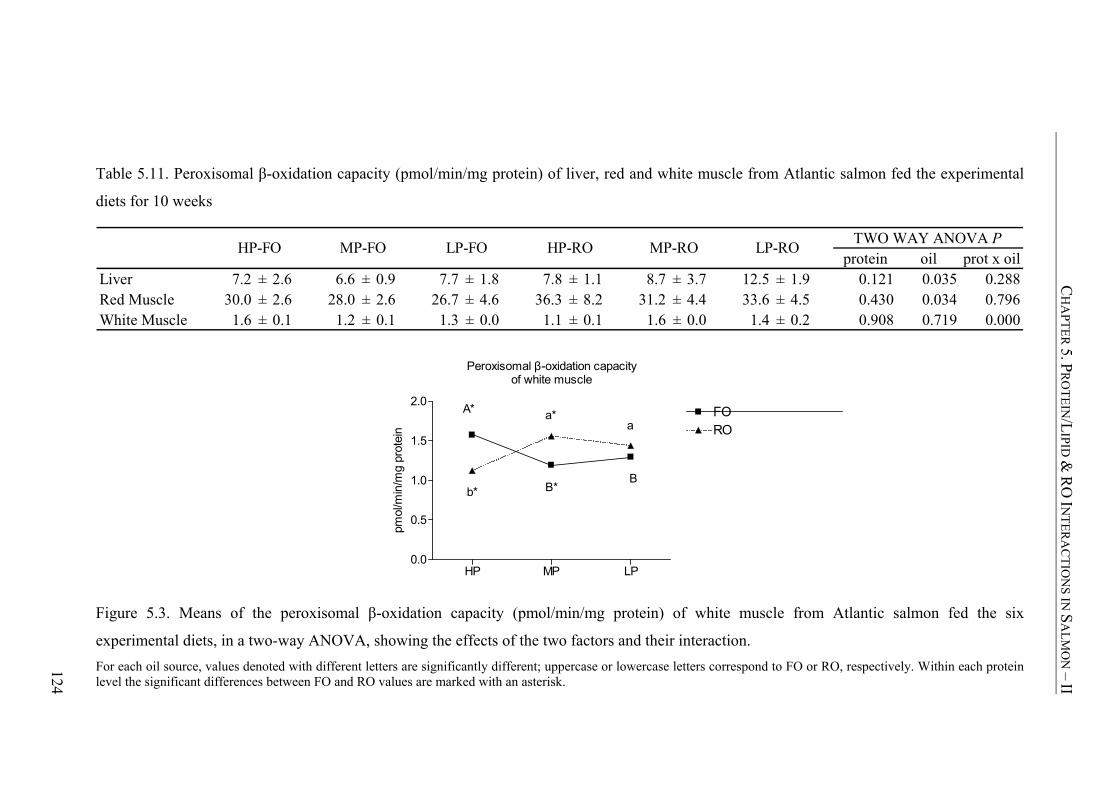
124
Table 5.11. Peroxisomal β-oxidation capacity (pmol/min/mg protein) of liver, red and white muscle from Atlantic salmon fed the experimental
diets for 10 weeks
protein oil prot x oilLiver 7.2 ± 2.6 6.6 ± 0.9 7.7 ± 1.8 7.8 ± 1.1 8.7 ± 3.7 12.5 ± 1.9 0.121 0.035 0.288Red Muscle 30.0 ± 2.6 28.0 ± 2.6 26.7 ± 4.6 36.3 ± 8.2 31.2 ± 4.4 33.6 ± 4.5 0.430 0.034 0.796White Muscle 1.6 ± 0.1 1.2 ± 0.1 1.3 ± 0.0 1.1 ± 0.1 1.6 ± 0.0 1.4 ± 0.2 0.908 0.719 0.000
MP-RO LP-RO TWO WAY ANOVA PHP-FO MP-FO LP-FO HP-RO
Peroxisomal β-oxidation capacityof white muscle
HP MP LP0.0
0.5
1.0
1.5
2.0FORO
A* a*a
b* B*B
pmol
/min
/mg
prot
ein
Figure 5.3. Means of the peroxisomal β-oxidation capacity (pmol/min/mg protein) of white muscle from Atlantic salmon fed the six
experimental diets, in a two-way ANOVA, showing the effects of the two factors and their interaction. For each oil source, values denoted with different letters are significantly different; uppercase or lowercase letters correspond to FO or RO, respectively. Within each protein level the significant differences between FO and RO values are marked with an asterisk.
CH
APTER
5. PR
OTEIN/L
IPID &
RO
INTER
AC
TION
S IN S
ALM
ON
– II
CHAPTER 5. PROTEIN/LIPID & RO INTERACTIONS ON SALMON – II
125
5.4 Discussion
The formulation of aqua feeds with lower protein content, as well as with
sustainable ingredients replacing FM and FO, is rising. Hence, the aim of the present
study was to elucidate the effects and interactions of various dietary protein/lipid levels
and different oil sources (namely FO vs. RO) on the growth, whole body chemical
composition and the digestibility of nutrients, including FA, in tissues of Atlantic
salmon. Moreover, the changes in FA composition of tissues and the retention of
individual FA in specific tissues, as a result of the different dietary treatments were also
investigated. In addition, the hypothesis that protein sparing and altered FA catabolism
via β-oxidation could occur due to the effect of either of the two factors (protein level
and / or oil source) was also tested.
5.4.1 Growth performance
Previous studies have suggested that Atlantic salmon can grow efficiently when
fed diets with high dietary fat and low protein content (Einen and Roem, 1997;
Hillestad, et al., 1998; Bendiksen, et al., 2003b; Azevedo, et al., 2004b, 2004a; Solberg,
2004). The results of the present study are in agreement with these studies, as no
negative effects on growth and FCR occurred when the fish were fed with low protein /
high lipid diets. However, most of the previous studies used diets with higher dietary
protein and lower lipid contents than the present study. For example, Einen and Roem
(1997) used diets containing CP / CL of 425 / 346 g kg-1, which corresponded to a DP /
DE ratio of 16.4, with no negative effects on growth and FCR. In the present study the
dietary CP/ CL ratio was much lower, ranging from 350/350 to 290/380 g kg-1, or in
terms of DP/DE it varied from 15.4 to 12.3. Therefore, it is noteworthy that the protein

CHAPTER 5. PROTEIN/LIPID & RO INTERACTIONS ON SALMON – II
126
level had no significant negative effects on the final weight of the fish, SGR, TGC and
FCR, while performance was very good for all treatments, even at protein levels below
300 g kg-1. This suggests that fish can efficiently utilize high amounts of lipid for
energy and tolerate relatively low dietary protein levels, which could be of great
significance for the Atlantic salmon industry. Such diets could be both more
environmentally friendly and economically advantageous compared to “traditional”
diets, which contain higher protein levels, without compromising the growth of the fish.
In addition, a significant difference between the dietary treatments was shown
on growth due to oil source. Specifically, the replacement of 60% of the dietary FO by
RO resulted in higher final weight, SGR and TGC, but not FCR. Numerous earlier
studies on Atlantic salmon have concluded that the replacement of FO with RO or other
VO has no negative effect on growth and FCR (Bell, et al., 2001a; Rosenlund, et al.,
2001; Caballero, et al., 2002; Bell, et al., 2003a; Bell, et al., 2003b; Torstensen, et al.,
2004a; Torstensen, et al., 2005). Nevertheless, the positive effect of RO on growth of
Atlantic salmon has also been shown previously (Bendiksen, et al., 2003b), including
the results of the previous chapter, and a higher growth for larger Atlantic salmon fed
with diets with a low level of n-3 FA has also been reported (Menoyo, et al., 2003;
Torstensen, et al., 2005). In these previous studies the authors suggested that the
increased growth was due to higher digestibility of the RO, and other VO, FA, resulting
in better utilization of the dietary oil for energy by the fish. The digestibility results of
the present study, discussed below, confirm that theory.
The protein sparing effect could also have been enhanced by both the higher
dietary oil levels and the RO inclusion. This is supported by the PPV results, as the
overall PPV was significantly improved when the fish were fed the LP diets, although

CHAPTER 5. PROTEIN/LIPID & RO INTERACTIONS ON SALMON – II
127
that is not clear due to statistical ambiguity. Previous studies have also suggested a
positive effect of increased dietary lipid content on protein retention and, hence, on
protein sparing (Einen and Roem, 1997; Hillestad, et al., 1998; Bendiksen, et al.,
2003b). Moreover, the results of the present study indicate undoubtedly a positive effect
on PPV due to the dietary inclusion of RO at the expense of FO. The potential effects of
dietary VO in protein sparing in fish are largely unknown, however the results of the
present study are supported by the increased β-oxidation capacity that was shown in
tissues of Atlantic salmon fed with RO diets compared to the FO ones as increased
catabolism of FA for energy production may suggest a protein sparing effect. The β-
oxidation results are discussed further below.
5.4.2 Nutrient and fatty acid digestibility
The protein ADC was significantly affected by the dietary protein/lipid level.
Specifically, the decrease in dietary protein level resulted in lower protein ADC. The
results of previous studies are contradictory; Einen and Roem (1997) and Azevedo et al.
(2004b) reported no significant differences in protein ADC between diets with varying
DP/DE ratios, whereas Bendiksen et al. (2003b) found that protein ADC was decreased
when low protein / high fat diets were used. The latter also reported a positive effect of
the VO on protein ADC, although such an effect was not shown in the present trial.
Nevertheless, lipid ADC was significantly higher for the RO treatments,
compared to the FO, at all dietary protein levels. The lipid digestibility has been
correlated to the dietary FA composition and the positive effect of the VO and
especially RO has been reported previously (Caballero, et al., 2002; Bendiksen, et al.,
2003b; Menoyo, et al., 2003; Ng, et al., 2004). In agreement with previous studies
(Einen and Roem, 1997; Azevedo, et al., 2004b) the dietary protein level did not affect

CHAPTER 5. PROTEIN/LIPID & RO INTERACTIONS ON SALMON – II
128
the lipid ADC, at least for the RO diets. However, in the FO treatments the lipid ADC
of the HP diet was significantly lower compared to the MP and LP. This was probably
due to the higher saturated FA content of this diet, the digestibility of which has been
negatively correlated to their dietary level (Caballero, et al., 2002) and is also confirmed
in the present study.
The energy ADC was affected by both the dietary protein level and the oil
source and significant interactions were shown between the two factors. In line with
previous studies (Azevedo, et al., 2004b), the energy ADC of the LP diets was lower for
both oil sources, probably because of the respective lower protein ADC. Moreover, the
lower lipid ADC of the HP-FO diet apparently reflected on its energy ADC. Lastly, RO
inclusion resulted in higher energy ADC only for the HP diets, which could be due to
the large difference of the two diets lipid ADC and more specifically in the differences
found in the ADC of individual FA, such as 16:0 and 18:1n-9, which are preferentially
utilized for energy production by Atlantic salmon (Henderson and Sargent, 1985). In
contrast to these results, Ng et al. (2004) found no significant differences in the energy
ADC in Atlantic salmon fed diets containing different amounts of palm oil; however,
the diets used in that trial did not significantly differ in their levels of 16:0, 18:1n-9 or,
generally, in total saturates and monoenes.
Previous studies have reported on the individual FA ADC in diets of salmonids
(Torstensen, et al., 2000; Caballero, et al., 2002; Menoyo, et al., 2003; Ng, et al., 2004).
In general, they suggested that the digestibility of FA decreases with increasing chain
length and saturation. This is in agreement with the results of the present study. For
instance, a decrease in ADC of almost 50% was observed for the saturated FA as their
chain length increased, while the order of the ADC of FA in terms of their degree of

CHAPTER 5. PROTEIN/LIPID & RO INTERACTIONS ON SALMON – II
129
saturation, was increasing such that 16:0 < 18:1n-9 < 18:2n-6 < 18:3n-3 < 20:5n-3.
Moreover, the digestibility of saturated FA, and to a lesser extent of unsaturated FA and
especially monoenes, has been negatively correlated largely with their dietary level, but
also with dietary n-3 PUFA levels (Torstensen, et al., 2000; Caballero, et al., 2002;
Menoyo, et al., 2003; Ng, et al., 2004). These authors suggested that at high levels of
saturated FA inclusion, emulsion or micelle formation is impaired, although low levels
are easily digested. In the current study, the ADC of 14:0 and 16:0 was significantly
higher for the RO treatments compared to FO ones, which may be explained by the
level of saturated FA in the RO diets being approximately half that in the FO diets.
However, for the higher chain length saturated FA the difference between the oil
sources was significant only for the HP treatments. Consistent with the previous studies
the digestibility of the monounsaturated FA was also affected by the oil source. In most
cases RO diets had significantly higher total monoenes ADC than the FO ones, at all
protein levels, suggesting a negative correlation between the dietary saturated FA
content and the ADC of the monoenes. The protein level had no significant effect in the
RO treatments but resulted in higher monoenes ADC for the MP group of the FO diets.
Taking into account that saturated FA and monoenes, largely 16:0 and 18:1n-9, are
preferred substrates for β-oxidation the significant increase in their ADC due to RO
inclusion apparently influenced positively the energy utilization and consequently
enhanced the growth of the fish. It should be noted that RO diets had a much higher
(approximately 4-fold) content of 18:1n-9 compared to the FO diets.
The n-6 and n-3 PUFA ADC were affected to a much smaller extent by the
dietary treatments compared to the monoenes and saturated FA. The ADC of 18:2n-6,
18:3n-3 and 18:4n-3 were affected by both the protein and the oil source resulting in
higher digestibility for the RO diets, while it was lower for the LP groups. Although,

CHAPTER 5. PROTEIN/LIPID & RO INTERACTIONS ON SALMON – II
130
the rest of the n-6 PUFA were not affected by any of the factors, significant interactions
were shown for total n-6 PUFA, similar to the monoenes. Again, this is probably
because of the saturated FA levels in the diets influencing the digestibility of PUFA
(Menoyo, et al., 2003). Lastly, ADC for EPA and DHA appeared more stable than most
of the other FA with the former being affected by the protein level (EPA ADC order
was MP ≥ HP ≥ LP), while DHA was significantly higher for the FO diets. It should be
pointed out that DHA was the only FA for which the ADC was positively affected by
the FO content of the diet. These results are in line with previous studies, as EPA and
DHA ADC have been shown to be either higher for the FO diets or not affected by
dietary VO inclusion (Torstensen, et al., 2000; Caballero, et al., 2002; Ng, et al., 2004).
Menoyo et al. (2003) reported that EPA ADC was affected by the dietary saturated FA,
while DHA ADC was affected by both the saturated FA and n-3 PUFA dietary levels.
5.4.3 Whole body proximate composition
Although the chemical composition of the fish body is influenced by the dietary
composition this effect is in many cases only to a small extent. Previous studies, using
either isoenergetic diets (Azevedo, et al., 2004b, 2004a; Solberg, 2004) or diets with a
respective increase in the energy content (Hillestad and Johnsen, 1994; Einen and
Roem, 1997; Einen and Skrede, 1998; Bendiksen, et al., 2003b), have shown that
increasing dietary oil levels results in increased lipid and usually DM content, in the
fish body, while the protein content is decreased or in some cases not affected and the
ash is largely unaffected. However, in the previous trial (Chapter 4) it was shown that
the dietary protein/lipid ratio did not affect the whole body chemical composition. In
the present study, the DM content was significantly affected by the protein level,
resulting in higher DM content for the LP groups, whereas there was no significant
CHAPTER 5. PROTEIN/LIPID & RO INTERACTIONS ON SALMON – II
131
effect on the lipid and ash of the carcass. However, a significant interaction was shown
for the whole body protein, suggesting a decrease with decreasing dietary protein levels.
In agreement with previous studies, the present study demonstrated that the
replacement of FO with RO in the diets of Atlantic salmon affected the whole body
chemical composition (Bell, et al., 2001a; Torstensen, et al., 2004b; Ruyter, et al.,
2006), although no effects on body composition due to use of VO have also been
reported (Bendiksen, et al., 2003b), including the results of the previous trial.
Specifically, in this study, the DM and lipid content of the fish whole body was
increased when the fish were fed with RO, while ash remained unaffected. Regarding
the protein content, where a significant interaction of the factors was shown, the
analysis of the simple main effects showed that it was higher for the FO groups at the
HP level, not affected at the MP level and higher for the RO at the LP level. The latter
suggests that RO could have a positive affect in the use of protein for growth when the
fish are fed with low protein diets.
5.4.4 Tissue fatty acid composition
As previously discussed the tissue total lipid FA composition reflects the FA
composition of the diet, usually following linear correlations between the
concentrations of individual FA in the diet and the tissues (Bell, et al., 2001a;
Rosenlund, et al., 2001; Bell, et al., 2003a; Bell, et al., 2003b; Torstensen, et al., 2004a;
Torstensen, et al., 2005). That was also shown and discussed in the previous trials of
this thesis. The results of the present study are in agreement with the previous studies
showing a reduction in saturated FA, 16:1n-7, 20:4n-6, EPA, DHA and n-3/n-6 ratio,
respective to the reductions in the dietary FA, with inclusion of RO. Similarly, the
increase of 18:1n-9, 18:2n-6 and 18:3n-3 in the diets containing RO, compared to the

CHAPTER 5. PROTEIN/LIPID & RO INTERACTIONS ON SALMON – II
132
FO ones, was reflected in muscle and liver FA. It is clear that, since the FA
compositions of the diets were affected by the oil source only, the changes in the
muscle and liver FA compositions were also due to the dietary RO inclusion and, as
expected, the dietary protein level had no significant effect on the tissue FA
composition.
In agreement with the results of the previous trial, the changes in muscle and
liver FA indicate selective utilization or retention of individual FA. It has been shown
previously that when specific FA are in abundance in the diets they are selectively
utilized for energy production, via β-oxidation, and perhaps to a lesser extent for
desaturation and elongation, or on the contrary, when FA, and especially n-3 HUFA,
are limited in the diet they are retained or deposited in the tissues (Bell, et al., 2001a;
Bell, et al., 2003a; Torstensen, et al., 2004a). For example, in the present study 18:1n-9
was increased almost 4-fold, 18:2n-6 more than 5-fold and 18:3n-3 9-fold in the diets
when FO was replaced with RO, however the respective increases in muscle were less
than or around 2-fold for all of the above FA, while in liver it was approx. 2-fold for
18:1n-9, less than 4-fold for 18:2n-6 and less than 6-fold for 18:3n-3, indicating
selective utilization of these FA in the RO groups. On the other hand, although the
reduction of EPA and DHA was more than 60% in the RO diets the decrease in muscle
was approximately 50% for EPA and 35% for DHA, while in liver the reduction was
approximately 35% for EPA and 20% for DHA indicating a selective retention of these
FA in the tissues when the dietary supply was reduced. These results are also supported
by the Δ values for muscle and liver, that is the differences between diet and tissue fatty
acid concentrations. It was shown that, when provided in high concentrations, 18:1n-9,
18:2n-6 and 18:n-3 were highly utilised in both muscle and liver and EPA and DHA
were accumulated in the tissues when dietary supply was reduced. In other animals, the

CHAPTER 5. PROTEIN/LIPID & RO INTERACTIONS ON SALMON – II
133
selective retention of essential FA in specific tissues is believed to occur by a
mechanism of reacylation of sn-2-monoacylglycerols by hepatic microsomal activity
monoacylglycerol acyltransferase (MGAT), during lipolysis (Xia, et al., 1993).
However, the moderate reductions of EPA and DHA shown in the present study may
also be, partially affected by the enhanced endogenous desaturation and elongation of
dietary 18:3n-3 (Tocher, et al., 2001; Tocher, et al., 2003a; Tocher, et al., 2003b).
Furthermore, it is noteworthy that the results of the present trial suggest that the
inclusion of RO up to 60%, in expense of FO, in diets of Atlantic salmon at various
dietary protein / lipid levels cause only moderate reductions in tissue EPA and DHA.
That was also shown in the previous trial where fish were reared at low water
temperatures. As previously discussed, reductions in n-3 HUFA affect the quality of the
final product, compromise its high nutritional value for the human consumer and should
be avoided. Hence, such results, leading to moderate reductions of EPA and DHA, are
promising for the use of VO in commercial diets, although the present trial, similarly to
the previous one, was conducted over a short time period, which could have masked the
real extent of the FA changes that could occur over the whole production cycle of
salmon.
5.4.5 Peroxisomal β-oxidation capacity
The peroxisomal β-oxidation activity was measured in liver, red and white
muscle. Conducting the assay on-site was not possible and hence the samples of tissues
had to be frozen and transferred to the Institute of Aquaculture in Scotland where
analyzed. Therefore, the measurement of the total β-oxidation was not possible and the
results obtained represent the peroxisomal β-oxidation capacity. Previous studies in
Atlantic salmon have shown that different tissues/organs have very different β-

CHAPTER 5. PROTEIN/LIPID & RO INTERACTIONS ON SALMON – II
134
oxidation capacities as a result of their unique and different energy requirements,
depending on their functions (Henderson and Tocher, 1987; Frøyland, et al., 2000;
Torstensen, et al., 2000; Tocher, et al., 2002; Stubhaug, et al., 2005a; Stubhaug, et al.,
2007). In agreement with that, between the three tissues assessed in the present study
red muscle had the highest β-oxidation activity and white muscle the lowest. However,
it should be noted that the β-oxidation capacities of these tissues, and the consequent
ranking, were expressed on a tissue protein content basis. Considering that white
muscle accounts for more than 60% of the total body mass of Atlantic salmon, it
becomes clear the its role in energy production for the fish is the most significant
(Frøyland, et al., 2000; Stubhaug, et al., 2005a).
It is well documented that tissue β-oxidation capacities are affected by various
factors, including the diet and especially the dietary FA composition (Torstensen, et al.,
2000; Tocher, et al., 2003b; Torstensen and Stubhaug, 2004; Stubhaug, et al., 2005a;
Stubhaug, et al., 2007). Specific FA, such as 16:0, 18:1n-9, 22:1n-11 and 20:1n-9 are
readily catabolized, although 18:3n-3, 18:2n-6 and even EPA and DHA are also good
substrates for β-oxidation, especially when provided at high levels (Henderson and
Tocher, 1987; Stubhaug, et al., 2005a; Stubhaug, et al., 2005b). Hence, dietary changes,
incorporating VO, could affect the β-oxidation capacities of tissues. However, the
results of previous studies are contradictory. Tocher et al. (2003b) showed that β-
oxidation capacity was not affected either by the oil content or the oil type in diets of
Atlantic salmon. On the contrary, Stubhaug et al. (2005a) reported that dietary RO
inclusion had a positive effect on β-oxidation. The results of the present study showed a
significant increase in liver and red muscle β-oxidation capacities due to RO inclusion.
This could explain, at least partially, the better performance that was shown for the RO
groups and the enhanced protein sparing effect. However, in white muscle an

CHAPTER 5. PROTEIN/LIPID & RO INTERACTIONS ON SALMON – II
135
interactive effect of the protein level and the oil source was shown, suggesting a higher
β-oxidation capacity for the FO groups than the RO ones at the HP level, whereas RO
groups had higher values for the other two protein levels, although the difference was
significant only for the MP. The higher β-oxidation capacity of the HP-FO group could
be due to the higher content of saturated FA in that diet, although if the hypothesis is
correct it remains unclear why such an effect was not reflected in the other two tissues.
5.5 Conclusions
In conclusion, the results of this study suggest that firstly, low protein / high
lipid diets can be used with no negative effects on the growth, FCR and chemical
composition of Atlantic salmon reared at high water temperatures. Moreover, the
replacement of FO with RO can enhance the growth of the fish as well as the nutrient
and FA digestibility of the diets, showing an increased protein sparing and β-oxidation.
Lastly, RO inclusion significantly affected the tissue FA compositions, as they reflected
the FA composition of the diets. However, the reduction in EPA and DHA, resulting
from the dietary RO inclusion, was only moderate and hence, the impact on the final
product quality, in terms of the nutritional value for the human consumer, was limited.

Chapter 6. Effects of dietary full fat soy bean meal inclusion
on Atlantic cod (Gadus morhua)

CHAPTER 6. FULL FAT SOY BEAN MEAL IN ATLANTIC COD
137
6.1 Introduction
In recent years there has been a continuous decline in cod commercial fisheries,
resulting in an increasing interest in cod culture. Specifically, global cod culture
production has increased from 169 t in 2000 to 3812 t in 2004 showing a trend for
further future increase (FAO, 2006a). Cod require high protein / low oil diets, with high
dependence on marine fish meal (FM) and fish oil (FO) (Lie, et al., 1988; Morais, et al.,
2001; Lall and Nanton, 2002; Rosenlund, et al., 2004; Karlsen, et al., 2006). Regarding
the estimated stable supplies of FM and FO (Pike and Barlow, 2003) and the increased
demand and price for these commodities for aquafeeds in the next decade (Tidwell and
Allan, 2002; Tacon, 2004) as previously discussed, improvements in feeds that use
alternative sustainable protein and lipid sources are vital for the long term future of the
cod industry.
Full fat soya bean meal (FFS), along with other soy products, is considered a
good potential protein substitute for FM in aquafeeds. These products have been used to
replace FM in diets for various fish species such as Atlantic salmon and rainbow trout
(Oliva-Teles, et al., 1994; Refstie, et al., 2001; Mundheim, et al., 2004), sea bream and
sea bass (Alexis and Nengas, 2001) and Atlantic halibut (Grisdale-Helland, et al.,
2002). However, the results of these studies are contradictory as they vary from positive
to negative effects on growth and other parameters. These variant results could be
explained by the antinutritional factors (ANF) that soybeans contain (Francis, et al.,
2001); hence, the effect of the dietary inclusion of these products on the fish depends on
the treatment and the processing of the soya beans, the amount and type of ANF in the
soya beans, the level of inclusion, the species, the age/size of the fish etc.
CHAPTER 6. FULL FAT SOY BEAN MEAL IN ATLANTIC COD
138
In cod, very little is known about the replacement of FM with soya products. A
study by Von der Decken and Lie (1993) showed that FFS may replace up to 200 g kg-1
of the FM protein with no negative results on growth or feed intake. However, negative
results were shown in the same study at the 300 g kg-1 level of FFS protein. In a more
recent study (Hansen, et al., 2006) plant proteins, including solvent extracted soybean
meal, corn gluten meal, and a mix of soy protein concentrate and wheat gluten meal,
was used to replace FM at levels up to 440 g kg-1 of plant ingredients in the diet.
Hansen et al. (2006) concluded that high growth rates and FCR were shown irrespective
of the dietary treatment and, although the apparent digestibility coefficients (ADC) of
protein and fat were reduced with high inclusions of plant proteins, fish maintained
growth by increasing feed intake. These results are in line with a study by Refstie et al.
(2006), where extracted soybean meal and a bio-processed soybean meal, with reduced
ANF, were used to replace FM in diets for on-grown cod. The authors concluded that
cod showed a high tolerance of these soy products, as there were no negative effects on
growth and the fish compensated for the reduced ADC of amino acids and lipid by
increased feed intake.
Although FFS is included in dietary formulations largely as a protein source,
with a crude protein content of ~38%, it also contributes to the dietary fat, containing
about 18% lipid (NRC, 1993). More than 50% of the total FAof the soya beans is
18:2n-6, more than 25% is 18:1n-9, less than 10% is 16:0 and around 6% is 18:3n-3,
while it does not contain any HUFA such as EPA and DHA (Hertrampf and Piedad-
Pascual, 2000; Beare-Rogers, et al., 2001).
Cod, as with other marine fish, require EFA, i.e. arachidonic acid, EPA and
DHA for normal growth (Lie, et al., 1992; Lall and Nanton, 2002; Sargent, et al., 2002).

CHAPTER 6. FULL FAT SOY BEAN MEAL IN ATLANTIC COD
139
Fish tissue FA compositions largely reflect that of the diet and, as previous studies have
shown, cod is no exception to this general principal, although selective utilization or
retention of specific FA may occur (Lie, et al., 1986; Lie, et al., 1992; dos Santos, et al.,
1993; Kirsch, et al., 1998; Morais, et al., 2001; Morkore, 2006). In cod the main lipid
storage tissue is liver. The fat stored in this tissue could be used for the production of
cod liver oil and, provided that its FA composition satisfies the basic commercial
quality standards, it could be a potentially important by-product of cod culture (Morais,
et al., 2001). Cod muscle is lean with very low lipid content (~1% of wet weight),
where membrane phospholipids are the dominant lipid class. However, the muscle
represents the edible part of the fish and therefore its nutritional value is of importance
for the consumer; in particular, high concentrations of HUFA are desirable for
promoting human health (Hunter and Roberts, 2000; ISSFAL, 2000; Simopoulos,
2002).
Hence, any inclusion of plant ingredients at the expense of FM and FO in cod
diets should ensure that the consequent changes in the dietary FA composition will not
be detrimental either to fish growth and health or to the quality of the final product to
the consumer. The aim of this study was to investigate the effects of the partial
replacement of FM and FO with FFS on growth and tissue FA composition in cod.

CHAPTER 6. FULL FAT SOY BEAN MEAL IN ATLANTIC COD
140
6.2 Materials and methods
6.2.1 Fish and culture conditions
The experiment was conducted at the Scottish Association for Marine Science
(SAMS) (Ardtoe, Scotland) from February to May 2004. Twelve tanks were each
stocked with 30 fish (Atlantic cod, Gadus morhua) of initial average weight 220 g. The
fish were PIT tagged, allowing individual measurements of biological characteristics to
be obtained at each sampling after 6 and 12 weeks. Fish were held in 1600 L volume
circular black polypropylene tanks (4 x 3 x 1.6m2) supplied with UV-treated seawater
filtered to 30 μm in a flow-through system at 15 L min-l. The tanks were housed
indoors, subjected to a photoperiod regime of 24 h light and the water temperature over
the experimental period was 8.3 ± 0.1oC.
6.2.2 Experimental diets and feeding
The fish were fed four extruded diets, produced by Fiskeriforskning, Norway,
for 12 weeks. The control diet did not contain FFS (FFS0) whereas the experimental
diets were formulated to contain 120, 240 or 360g of FFS (FFS12, FFS24 and FFS36,
respectively) per kg of diet at the expense of FM and FO (Table 6.1). All diets were
isoenergetic and isonitrogenous, containing approximately 500 g kg-1 protein and 160 g
kg-1 fat. With regards to amino acids and minerals the diets were balanced for
methionine (4.2 g kg-1 feed protein), lysine (7 g kg-1 feed protein) and digestible
phosphorus (7 g kg-1 feed protein). In all diets mineral and vitamin premixes were
added and the diets were formulated in accordance to all the known nutritional
requirements of cold water fish (NRC, 1993; Lall and Nanton, 2002). The analysed
proximate composition of the experimental diets is shown in Table 6.1, and the FA
CHAPTER 6. FULL FAT SOY BEAN MEAL IN ATLANTIC COD
141
compositions are shown in Table 6.2. The fish were fed to satiation once a day, in the
morning. Mortalities and daily feed intake and feed wastage were recorded.
6.2.3 Sampling procedure
Samples were taken from all diets and stored at -20oC until analyzed. After 6
and 12 weeks the fish were weighed individually and SGR, TGC and FCR were
determined for each individual. Fish with TGC < 1 for the 0-6 weeks experimental
period were not considered representative of the whole population and of the effects of
the dietary treatments and, hence, were excluded from all further calculations. The
number of fish excluded ranged from 1 to a maximum of 7 fish from each cage. At the
end of the trial (12th week) five fish per tank were sampled at random from the
population in each cage for lipid and FA composition of liver and muscle. The samples
from each tank were pooled to give one sample per tank providing three samples per
treatment for each tissue. Sampling was carried out as described in detail in the
“General Materials and Methods” section. Specifically, fish were killed with a sharp
blow to the head and samples of liver were dissected and frozen immediately in dry ice
and then stored in a freezer at -20oC pending analyses. A muscle sample, representative
of the edible portion, was obtained by cutting a steak between the dorsal and ventral
fins. This section was then skinned, de-boned and homogenized and stored at -20oC
until analysed.
6.2.4 Proximate analysis
Moisture, crude protein, crude fat, ash and crude fibre contents of diets and
whole body samples were determined as described in the “General Materials and

CHAPTER 6. FULL FAT SOY BEAN MEAL IN ATLANTIC COD
142
Methods” section. All methods are based on those described in AOAC (1995) and
modified as described by Bell et al (2001a).
6.2.5 Total lipid fatty acid analyses
Total lipids of feed, muscle and liver samples were extracted by the Folch
method (Folch, et al., 1957). FAME were prepared from total lipid by acid-catalyzed
transesterification as described by Christie (1982) and the extraction and purification of
the FAME were carried out as described by Tocher and Harvie (1988). FAME were
separated and quantified by gas-liquid chromatography using hydrogen as carrier gas.
Individual FAME were identified by comparison to known standards and by reference
to published data (Ackman, 1980). All methods have been thoroughly described in the
“General Material and Methods” section.
6.2.6 Statistical analysis
Data are presented as means ± SD (n=3). Significant differences between dietary
treatments were determined by one-way ANOVA followed by Tukey’s post-hoc test to
rank the groups (P=0.05). Percentage data and data which were identified as non-
homogeneous (Lavene’s test) were subjected to square-root, log or arcsine
transformation before analysis. Differences were regarded as significant when P<0.05
(Zar, 1999). ANOVA and regression analyses were performed using SPSS 13 (SPSS
Inc, 2004).

CHAPTER 6. FULL FAT SOY BEAN MEAL IN ATLANTIC COD
143
6.3 Results
6.3.1 Diets
Proximate analysis of the four experimental diets showed that the dietary protein
and fat levels were approximately 500 and 160 g kg-1, respectively, and constant
between the dietary treatments (Table 6.1). However, there was an increase in dietary
fibre with graded inclusion of FFS from 8.4 g kg-1 in the FFS0 diet to 16.4 g kg-1 in the
FFS36 diet.
The increased inclusion of FFS at the expense of FM and FO had a direct effect
on the FA compositions of the diets (Table 6.2). In particular, 14:0 decreased, 16:0
remained stable, whereas 18:0 increased resulting in a slight decrease for the total
saturates (from 22.5% in FFS0 to 20.9% in FFS36). Total monoenes were reduced from
41.4% in the control group to 33.3% in the FFS36, mainly due to the respective
decrease of 16:1n-7, 20:1n-9 and 22:1 (including 22:1n-11 and 22:1n-9) almost by half.
However, there was a large increase in 18:1n-9 from 8.5% to 13.9%, for FFS0 and
FFS36, respectively. The high content of 18:2n-6 in FFS resulted in an increase of that
FA by almost 6-fold and a subsequent increase in total n-6 PUFA, although, the rest of
the n-6 PUFA remained stable, totalling less than 1%. 18:3n-3 was increased by more
than 2-fold between FFS0 and FFS36. Nevertheless, EPA and DHA were decreased by
half. In addition, total n-3 also decreased, from 29.1% to 18.3%, for FFS0 and FFS36,
respectively. The n-3/n-6 ratio decreased from 5.4 in FFS0 to 0.7 in FFS36.

CHAPTER 6. FULL FAT SOY BEAN MEAL IN ATLANTIC COD
144
6.3.2 Growth performance
All groups showed good performance results regarding weight gain, FCR, SGR
and TGC at 6 and 12 weeks (Table 6.3). Fish weights varied from 300 to 350 g and
from 467 to 562 g at 6 and 12 weeks, respectively, with the fish fed the control diet
having the highest weight gain, although the differences between the groups were not
statistically significant. The same trend was shown in SGR (ranging between 0.89 and
1.08) and TGC (varying from 2.49 to 3.09) over the whole experimental period. Fish
fed on FFS0 had significantly higher SGR than fish fed on FFS12 and FFS36, and
significantly higher TGC than all the other treatments. In both cases, there were no
significant differences between the groups fed the FFS. No significant differences were
observed in condition factor (K), which varied between 1.28 and 1.38 over the 12
weeks of the trial. With regards to FCR, the range, over the whole experimental period,
was from 0.68 for the FFS0 group to 0.84 for the FFS12. The fish fed the FFS0 diets
had significantly lower FCR than the fish fed diets containing FFS.
6.3.3 Whole body proximate composition
At the beginning of the feeding trial the proximate composition of the fish
whole body was 75.9% moisture, 16.7% crude protein, 3.5% crude fat and 3.1% ash,
(Table 6.4). After 12 weeks of feeding on the 4 experimental diets the moisture content
ranged from 77.8% to 78.1%, the protein 12.8% to 13.7%, the fat from 5.0% to 6.5%
and the ash 2.1% to 2.3%. ANOVA did not reveal any significant differences between
the four treatments.

CHAPTER 6. FULL FAT SOY BEAN MEAL IN ATLANTIC COD
145
6.3.4 Tissue fatty acid composition
The FA compositions of the cod muscle and liver (Table 6.5 and Table 6.6,
respectively) were highly affected by the dietary treatment. The main effect on both
tissues was the significant increase in the concentration of linoleic acid, with increasing
FFS level. In particular, 18:2n-6 in muscle increased 4-fold, from 3.8% to 15%, for the
FFS0 and FFS36 groups, respectively, while, in liver it increased 5-fold, from 4.6% to
22.8%.
In muscle (Table 6.5), further to the increase in 18:2n-6 with graded inclusion of
FFS, the concentration of total n-6 PUFA also increased (5.4% - 16.7%, for FFS0-
FFS36, respectively). Moreover, 18:3n-3 significantly increased from 0.9 to 1.6%
between the control group and FFS36. However, there were significant reductions in
20:1n-9 and 22:1 (including 22:1n-11 and 22:1n-9) (from 3.5% and 1.7 % in FFS0 to
2.0% and 1.1% in FFS36, respectively) and the total monoenes (21% - 16.7% for the
FFS0 and FFS36, respectively). The EPA concentration was also decreased from 14.7%
in FFS0 to 11.8 in FFS36, although, there were no significant differences between the
three groups fed the FFS. The inclusion of FFS resulted in a significant reduction in the
n-3/n-6 ratio, from 8.0 to 2.4 for the FFS0 and FFS36 groups, respectively. Finally, no
significant differences were shown in the concentrations of 16:0, 18:0, total saturated
FA, 18:1n-9, 20:4n-6, DHA and total n-3 PUFA.
Similarly, in liver (Table 6.6), the dietary inclusion of FFS and the consequent
major increase in the concentration of 18:2n-6 resulted in a significant increase in total
n-6 PUFA (5.5-23.6% for FFS0 and FFS36, respectively). Moreover, 18:1n-9 and
18:3n-3 were also significantly increased from 16.0 and 1.3% to 19.4 and 3.0%,
respectively. In contrast, significant reductions were observed between FFS0 and
CHAPTER 6. FULL FAT SOY BEAN MEAL IN ATLANTIC COD
146
FFS36, in 16:0 (17.6-13.5%), total saturated (26.1-19.9%), 20:1n-9 (10.7-6.9%), 22:1
(including 22:1n-11 and 22:1n-9) (9.6-4.9%), 24:1n-9 (0.6-0.3%), total monoenes
(46.4-39.0), 20:4n-6 (0.3-0.2%), EPA (7.4-5.3%), DHA (9.0-6.4%), total n-3 PUFA
(22.0-17.6%) and the n-3/n-6 ratio (4.0-0.7).
The concentrations of specific FA in muscle were plotted against the respective
dietary FA concentrations. The plots of muscle FA against dietary FA concentrations
are shown in Figure 6.1 and the Correlation coefficients (r), slopes, Y-axis intercepts, F
and P values from these plots, including the difference (Δ) between diet and muscle FA
values for the FFS0 and the FFS36 groups, are shown in Table 6.7. There was a
significant linear correlation between dietary and muscle 18:2n-6 and 20:5n-3 (Figure
6.1a and e, respectively; the correlation coefficients were 0.99 and 0.96, respectively).
Moreover, a similar trend, although not significant, was shown for 18:3n-3 and 22:1
(Figure 6.1b and d, respectively), with r values of 0.95 and 0.94, respectively. However,
the slopes and the intercepts of the linear plots of these FA differed, indicating a
different relationship between the dietary and muscle concentrations for each individual
FA. This is also supported by the Δ values shown in Table 6.7, where negative Δ values
indicate lower values in muscle compared with diet, whereas positive values indicate
accumulation in tissues relative to diet. Hence, EPA and DHA were present in higher
concentrations in muscle compared to diet both in the FFS0 and FFS36 diets, although
at a higher level in the latter. In contrast, the inclusion of FFS in the diet (FFS36)
resulted in lower concentrations of 18:2n-6, 18:3n-3 and 18:1n-9 in muscle lipid
relative to diet lipid. It is noteworthy that the regression analysis of 18:1n-9 and 22:6n-3
(Figure 6.1c and f, respectively) resulted in almost zero r and slope values and not
significant correlations.
CHAPTER 6. FULL FAT SOY BEAN MEAL IN ATLANTIC COD
147
The plots of liver FA concentrations against the dietary FA concentrations are
shown in Figure 6.2 and the correlation coefficients (r), slopes, Y-axis intercepts, F and
P values from these plots, including the difference (Δ) between diet and liver FA values
for the FFS0 and the FFS36 groups, are shown in Table 6.8. The regression analysis and
the plots of the concentrations of 18:2n-6, 18:3n-3, 18:1n-9, 22:1, 20:5n-3 and 22:6n-3
in the diet against their concentration in the liver, showed significant linear correlations
for all of them (correlation coefficients r ranging from 0.98-1.00). Similarly to muscle,
the linear relationships between dietary and liver FA concentration differ between the
individual FA as the slope values ranged from 0.5 to 0.8 and the intercepts from -1.0 to
10.4. This is also shown by the Δ values shown in Table 6.8. The positive Δ values of
18:1n-9 both for FFS0 and FFS 36 indicate a higher concentration of this FA in the liver
compared to the diet. On the contrary, hardly any other FA was at a higher
concentration in the liver than in the diet. It should be mentioned, though, that EPA and
DHA had higher Δ values in FFS36 than in FFS0 showing a lower utilization and/or
increased retention of these FA with the inclusion of FFS.
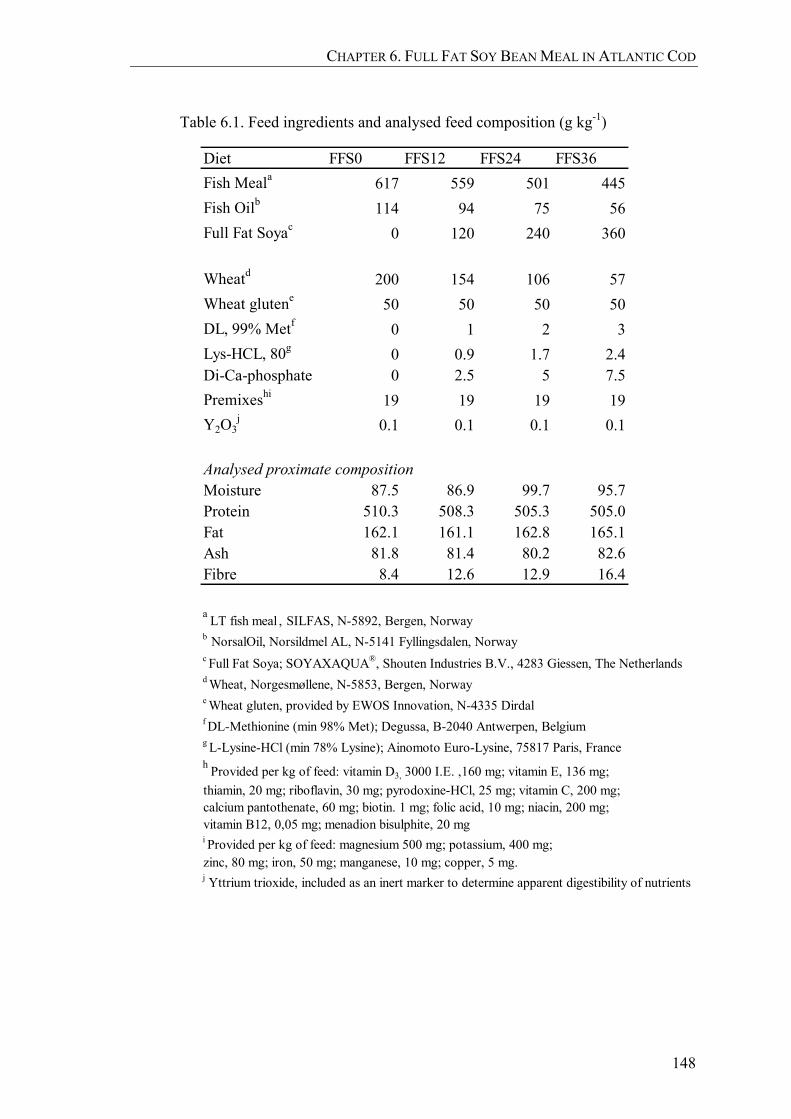
CHAPTER 6. FULL FAT SOY BEAN MEAL IN ATLANTIC COD
148
Table 6.1. Feed ingredients and analysed feed composition (g kg-1)
Diet FFS0 FFS12 FFS24 FFS36Fish Meala 617 559 501 445Fish Oilb 114 94 75 56Full Fat Soyac 0 120 240 360
Wheatd 200 154 106 57Wheat glutene 50 50 50 50DL, 99% Metf 0 1 2 3Lys-HCL, 80g 0 0.9 1.7 2.4Di-Ca-phosphate 0 2.5 5 7.5Premixeshi 19 19 19 19Y2O3
j 0.1 0.1 0.1 0.1
Analysed proximate compositionMoisture 87.5 86.9 99.7 95.7Protein 510.3 508.3 505.3 505.0Fat 162.1 161.1 162.8 165.1Ash 81.8 81.4 80.2 82.6Fibre 8.4 12.6 12.9 16.4
a LT fish meal , SILFAS, N-5892, Bergen, Norwayb
NorsalOil, Norsildmel AL, N-5141 Fyllingsdalen, Norwayc Full Fat Soya; SOYAXAQUA®, Shouten Industries B.V., 4283 Giessen, The Netherlandsd Wheat, Norgesmøllene, N-5853, Bergen, Norwaye Wheat gluten, provided by EWOS Innovation, N-4335 Dirdalf DL-Methionine (min 98% Met); Degussa, B-2040 Antwerpen, Belgium g L-Lysine-HCl (min 78% Lysine); Ainomoto Euro-Lysine, 75817 Paris, Franceh Provided per kg of feed: vitamin D3, 3000 I.E. ,160 mg; vitamin E, 136 mg; thiamin, 20 mg; riboflavin, 30 mg; pyrodoxine-HCl, 25 mg; vitamin C, 200 mg;calcium pantothenate, 60 mg; biotin. 1 mg; folic acid, 10 mg; niacin, 200 mg; vitamin B12, 0,05 mg; menadion bisulphite, 20 mgi Provided per kg of feed: magnesium 500 mg; potassium, 400 mg; zinc, 80 mg; iron, 50 mg; manganese, 10 mg; copper, 5 mg.j Yttrium trioxide, included as an inert marker to determine apparent digestibility of nutrients
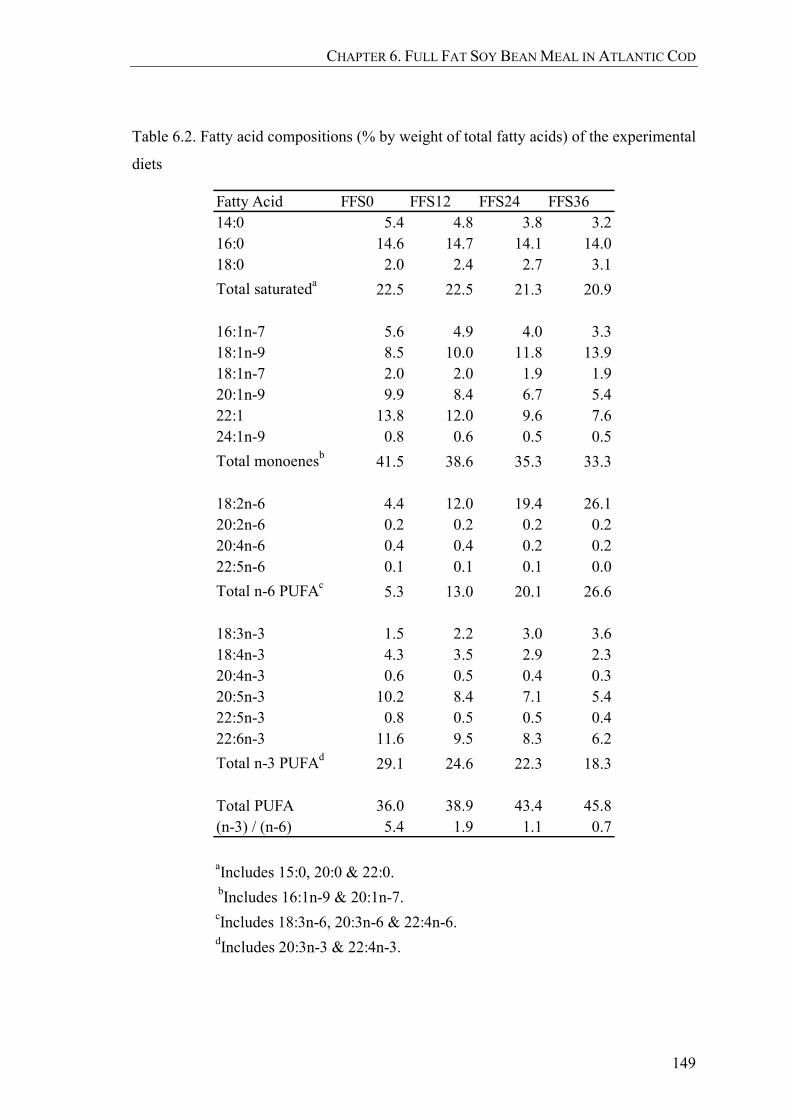
CHAPTER 6. FULL FAT SOY BEAN MEAL IN ATLANTIC COD
149
Table 6.2. Fatty acid compositions (% by weight of total fatty acids) of the experimental
diets
Fatty Acid FFS0 FFS12 FFS24 FFS3614:0 5.4 4.8 3.8 3.216:0 14.6 14.7 14.1 14.018:0 2.0 2.4 2.7 3.1Total saturateda 22.5 22.5 21.3 20.9
16:1n-7 5.6 4.9 4.0 3.318:1n-9 8.5 10.0 11.8 13.918:1n-7 2.0 2.0 1.9 1.920:1n-9 9.9 8.4 6.7 5.422:1 13.8 12.0 9.6 7.624:1n-9 0.8 0.6 0.5 0.5Total monoenesb 41.5 38.6 35.3 33.3
18:2n-6 4.4 12.0 19.4 26.120:2n-6 0.2 0.2 0.2 0.220:4n-6 0.4 0.4 0.2 0.222:5n-6 0.1 0.1 0.1 0.0Total n-6 PUFAc 5.3 13.0 20.1 26.6
18:3n-3 1.5 2.2 3.0 3.618:4n-3 4.3 3.5 2.9 2.320:4n-3 0.6 0.5 0.4 0.320:5n-3 10.2 8.4 7.1 5.422:5n-3 0.8 0.5 0.5 0.422:6n-3 11.6 9.5 8.3 6.2Total n-3 PUFAd 29.1 24.6 22.3 18.3
Total PUFA 36.0 38.9 43.4 45.8(n-3) / (n-6) 5.4 1.9 1.1 0.7
aIncludes 15:0, 20:0 & 22:0. bIncludes 16:1n-9 & 20:1n-7. cIncludes 18:3n-6, 20:3n-6 & 22:4n-6. dIncludes 20:3n-3 & 22:4n-3.

CHAPTER 6. FULL FAT SOY BEAN MEAL IN ATLANTIC COD
150
Table 6.3. Growth and performance of cod fed the experimental diets for 12 weeks
Length (cm)Start 276.1 ± 6.1 273.5 ± 2.6 270.8 ± 11.5 269.8 ± 7.36 weeks 305.6 ± 6.1 298.8 ± 3.4 298.4 ± 11.7 295.4 ± 7.412 weeks 343.0 ± 8.4 330.5 ± 3.7 333.1 ± 12.1 364.7 ± 55.8
Weight (g)Start 226.4 ± 6.9 229.6 ± 9.9 219.1 ± 30.2 212.5 ± 17.06 weeks 349.9 ± 11.6 327.0 ± 16.8 324.3 ± 42.5 300.3 ± 20.112 weeks 562.2 ± 35.9 489.2 ± 23.9 488.5 ± 51.2 466.7 ± 23.6
SGR0-6 weeks 1.03 ± 0.01 a 0.85 ± 0.01 b,c 0.94 ± 0.03 b 0.82 ± 0.05 c
6-12 weeks 1.12 ± 0.08 0.94 ± 0.10 0.97 ± 0.08 1.05 ± 0.07Overall 1.08 ± 0.04 a 0.89 ± 0.05 b 0.95 ± 0.04 a,b 0.94 ± 0.06 b
TGC0-6 weeks 2.98 ± 0.02 a 2.42 ± 0.11 b,c 2.65 ± 0.13 b 2.28 ± 0.09 c
6-12 weeks 3.09 ± 0.26 a 2.49 ± 0.22 b 2.53 ± 0.13 a,b 2.70 ± 0.17 a,b
Overall 3.09 ± 0.14 a 2.49 ± 0.18 b 2.63 ± 0.04 b 2.52 ± 0.13 b
FCR0-6 weeks 0.71 ± 0.03 0.88 ± 0.10 0.77 ± 0.02 0.92 ± 0.136-12 weeks 0.66 ± 0.01 b 0.83 ± 0.03 a 0.77 ± 0.04 a 0.77 ± 0.03 a
Overall 0.68 ± 0.02 b 0.84 ± 0.05 a 0.77 ± 0.01 a,b 0.82 ± 0.01 a
KStart 1.07 ± 0.04 1.12 ± 0.03 1.09 ± 0.02 1.07 ± 0.056 weeks 1.21 ± 0.04 1.22 ± 0.04 1.21 ± 0.03 1.15 ± 0.0312 weeks 1.38 ± 0.02 1.34 ± 0.03 1.33 ± 0.05 1.28 ± 0.03
Mortalities 0 1 0 0
Values are mean ± S.D. Values within a row with a different superscript letter are significantlydifferent (P<0.05)
FFS0 FFS12 FFS24 FFS36
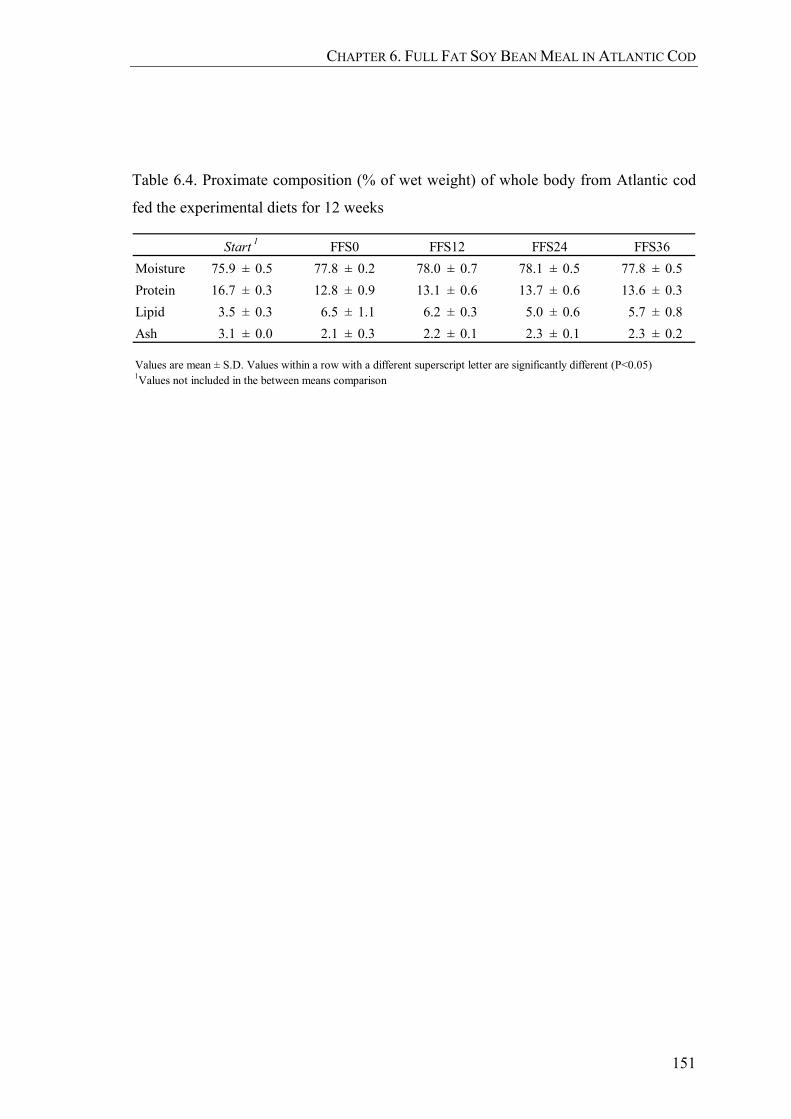
CHAPTER 6. FULL FAT SOY BEAN MEAL IN ATLANTIC COD
151
Table 6.4. Proximate composition (% of wet weight) of whole body from Atlantic cod
fed the experimental diets for 12 weeks
Moisture 75.9 ± 0.5 77.8 ± 0.2 78.0 ± 0.7 78.1 ± 0.5 77.8 ± 0.5Protein 16.7 ± 0.3 12.8 ± 0.9 13.1 ± 0.6 13.7 ± 0.6 13.6 ± 0.3Lipid 3.5 ± 0.3 6.5 ± 1.1 6.2 ± 0.3 5.0 ± 0.6 5.7 ± 0.8Ash 3.1 ± 0.0 2.1 ± 0.3 2.2 ± 0.1 2.3 ± 0.1 2.3 ± 0.2
Values are mean ± S.D. Values within a row with a different superscript letter are significantly different (P<0.05)1Values not included in the between means comparison
FFS24 FFS36Start 1 FFS0 FFS12

CHAPTER 6. FULL FAT SOY BEAN MEAL IN ATLANTIC COD
152
Table 6.5. Total lipid (mg lipid g-1 tissue) and fatty acid compositions (% by weight of
total fatty acids) of muscle from cod fed the experimental diets for 12 weeks
Total Lipid 9.6 ± 1.6 8.7 ± 1.3 9.9 ± 1.8 10.2 ± 0.5
Fatty acid14:0 1.9 ± 0.3 a 1.6 ± 0.1 a 1.2 ± 0.1 b 0.8 ± 0.1 b
16:0 22.4 ± 2.3 23.3 ± 1.8 20.8 ± 1.5 19.7 ± 2.518:0 4.9 ± 1.2 4.4 ± 0.4 4.5 ± 0.8 5.0 ± 0.7
Total saturated1 30.1 ± 4.7 30.4 ± 2.9 27.2 ± 2.6 26.2 ± 4.0
16:1n-7 2.7 ± 0.0 a 2.4 ± 0.3 a,b 2.0 ± 0.2 b,c 1.5 ± 0.1 c
18:1n-9 9.8 ± 0.3 9.8 ± 1.0 10.6 ± 0.4 9.5 ± 0.918:1n-7 2.3 ± 0.1 a 2.2 ± 0.2 a,b 2.3 ± 0.1 a,b 1.9 ± 0.1 b
20:1n-9 3.5 ± 0.4 a 3.2 ± 0.4 a 2.6 ± 0.2 a,b 2.0 ± 0.3 b
22:12 1.7 ± 0.0 a 1.8 ± 0.0 a 1.4 ± 0.1 b 1.1 ± 0.1 c
24:1n-9 0.8 ± 0.2 0.6 ± 0.1 0.7 ± 0.1 0.6 ± 0.2
Total monoenes3 21.0 ± 1.1 a 20.0 ± 2.0 a,b 19.7 ± 1.0 a,b 16.7 ± 1.4 b
18:2n-6 3.8 ± 0.1 c 8.3 ± 0.6 b 13.4 ± 0.2 a 15.0 ± 1.0 a
20:2n-6 0.3 ± 0.0 0.4 ± 0.0 0.5 ± 0.0 0.3 ± 0.320:3n-6 0.1 ± 0.0 0.1 ± 0.0 0.1 ± 0.1 0.1 ± 0.020:4n-6 0.9 ± 0.1 0.9 ± 0.0 0.8 ± 0.0 0.9 ± 0.1
Total n-6 PUFA4 5.4 ± 0.1 d 10.0 ± 0.7 c 15.0 ± 0.2 b 16.7 ± 0.8 a
18:3n-3 0.9 ± 0.0 b 1.2 ± 0.1 b 1.6 ± 0.1 a 1.6 ± 0.2 a
18:4n-3 1.5 ± 0.1 a 1.3 ± 0.1 a,b 1.2 ± 0.1 b 0.9 ± 0.1 c
20:4n-3 0.6 ± 0.0 a 0.5 ± 0.0 b 0.5 ± 0.0 b 0.4 ± 0.0 c
20:5n-3 14.7 ± 0.7 a 12.9 ± 0.5 b 12.5 ± 0.6 b 11.8 ± 0.7 b
22:5n-3 1.2 ± 0.1 1.1 ± 0.1 1.0 ± 0.0 1.1 ± 0.122:6n-3 24.6 ± 2.9 22.5 ± 1.2 21.3 ± 0.7 24.8 ± 2.6
Total n-3 PUFA5 43.5 ± 3.5 39.6 ± 1.8 38.1 ± 1.5 40.5 ± 3.2
Total PUFA 49.0 ± 3.6 b 49.7 ± 1.7 a,b 53.1 ± 1.6 a 57.2 ± 2.9 a
(n-3) / (n-6) 8.0 ± 0.4 a 4.0 ± 0.4 b 2.5 ± 0.1 c 2.4 ± 0.3 c
Values are mean ± S.D. (n=3). Values within a row with a different superscript letter aresignificantly different (P<0.05)1Includes 15:0, 20:0 & 22:0; 2Includes 22:1n-11 and 22:1n-9; 3Includes 16:1n-9 & 20:1n-7; 4Includes 18:3n-6, 20:3n-6 & 22:4n-6; 5Includes 20:3n-3 & 22:4n-3.
FFS0 FFS12 FFS24 FFS36
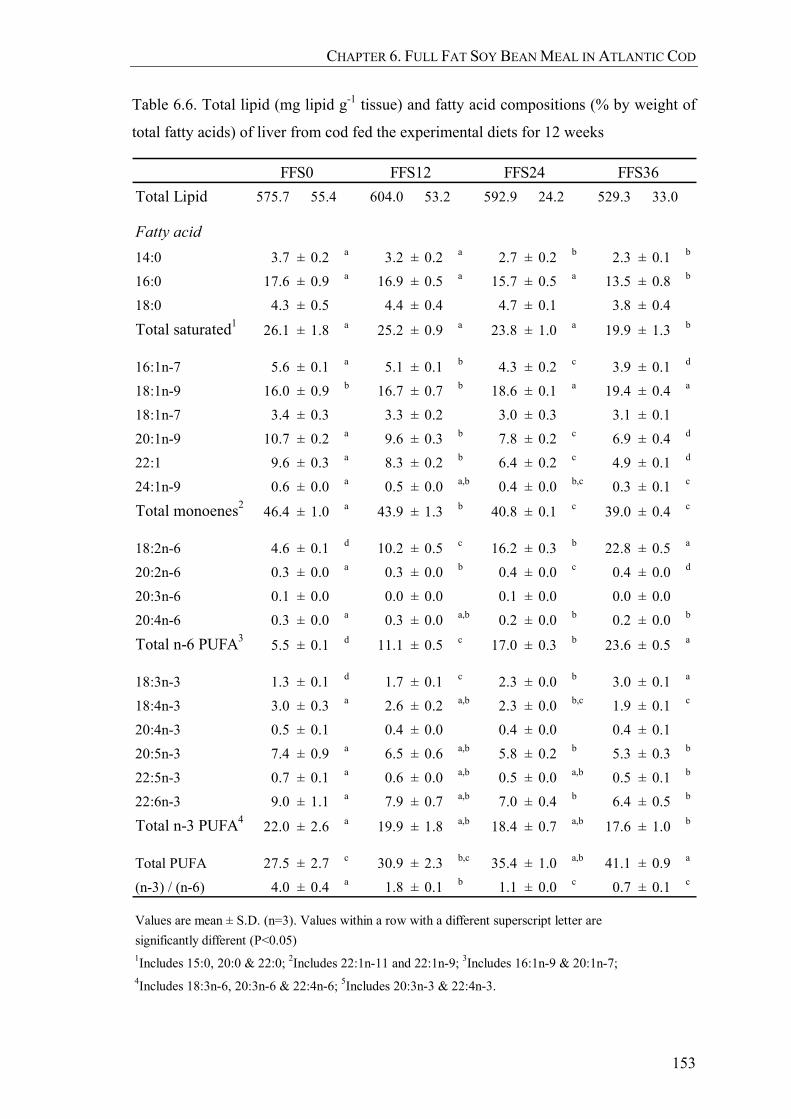
CHAPTER 6. FULL FAT SOY BEAN MEAL IN ATLANTIC COD
153
Table 6.6. Total lipid (mg lipid g-1 tissue) and fatty acid compositions (% by weight of
total fatty acids) of liver from cod fed the experimental diets for 12 weeks
Total Lipid 575.7 55.4 604.0 53.2 592.9 24.2 529.3 33.0
Fatty acid14:0 3.7 ± 0.2 a 3.2 ± 0.2 a 2.7 ± 0.2 b 2.3 ± 0.1 b
16:0 17.6 ± 0.9 a 16.9 ± 0.5 a 15.7 ± 0.5 a 13.5 ± 0.8 b
18:0 4.3 ± 0.5 4.4 ± 0.4 4.7 ± 0.1 3.8 ± 0.4
Total saturated1 26.1 ± 1.8 a 25.2 ± 0.9 a 23.8 ± 1.0 a 19.9 ± 1.3 b
16:1n-7 5.6 ± 0.1 a 5.1 ± 0.1 b 4.3 ± 0.2 c 3.9 ± 0.1 d
18:1n-9 16.0 ± 0.9 b 16.7 ± 0.7 b 18.6 ± 0.1 a 19.4 ± 0.4 a
18:1n-7 3.4 ± 0.3 3.3 ± 0.2 3.0 ± 0.3 3.1 ± 0.120:1n-9 10.7 ± 0.2 a 9.6 ± 0.3 b 7.8 ± 0.2 c 6.9 ± 0.4 d
22:1 9.6 ± 0.3 a 8.3 ± 0.2 b 6.4 ± 0.2 c 4.9 ± 0.1 d
24:1n-9 0.6 ± 0.0 a 0.5 ± 0.0 a,b 0.4 ± 0.0 b,c 0.3 ± 0.1 c
Total monoenes2 46.4 ± 1.0 a 43.9 ± 1.3 b 40.8 ± 0.1 c 39.0 ± 0.4 c
18:2n-6 4.6 ± 0.1 d 10.2 ± 0.5 c 16.2 ± 0.3 b 22.8 ± 0.5 a
20:2n-6 0.3 ± 0.0 a 0.3 ± 0.0 b 0.4 ± 0.0 c 0.4 ± 0.0 d
20:3n-6 0.1 ± 0.0 0.0 ± 0.0 0.1 ± 0.0 0.0 ± 0.020:4n-6 0.3 ± 0.0 a 0.3 ± 0.0 a,b 0.2 ± 0.0 b 0.2 ± 0.0 b
Total n-6 PUFA3 5.5 ± 0.1 d 11.1 ± 0.5 c 17.0 ± 0.3 b 23.6 ± 0.5 a
18:3n-3 1.3 ± 0.1 d 1.7 ± 0.1 c 2.3 ± 0.0 b 3.0 ± 0.1 a
18:4n-3 3.0 ± 0.3 a 2.6 ± 0.2 a,b 2.3 ± 0.0 b,c 1.9 ± 0.1 c
20:4n-3 0.5 ± 0.1 0.4 ± 0.0 0.4 ± 0.0 0.4 ± 0.120:5n-3 7.4 ± 0.9 a 6.5 ± 0.6 a,b 5.8 ± 0.2 b 5.3 ± 0.3 b
22:5n-3 0.7 ± 0.1 a 0.6 ± 0.0 a,b 0.5 ± 0.0 a,b 0.5 ± 0.1 b
22:6n-3 9.0 ± 1.1 a 7.9 ± 0.7 a,b 7.0 ± 0.4 b 6.4 ± 0.5 b
Total n-3 PUFA4 22.0 ± 2.6 a 19.9 ± 1.8 a,b 18.4 ± 0.7 a,b 17.6 ± 1.0 b
Total PUFA 27.5 ± 2.7 c 30.9 ± 2.3 b,c 35.4 ± 1.0 a,b 41.1 ± 0.9 a
(n-3) / (n-6) 4.0 ± 0.4 a 1.8 ± 0.1 b 1.1 ± 0.0 c 0.7 ± 0.1 c
Values are mean ± S.D. (n=3). Values within a row with a different superscript letter aresignificantly different (P<0.05)1Includes 15:0, 20:0 & 22:0; 2Includes 22:1n-11 and 22:1n-9; 3Includes 16:1n-9 & 20:1n-7; 4Includes 18:3n-6, 20:3n-6 & 22:4n-6; 5Includes 20:3n-3 & 22:4n-3.
FFS0 FFS12 FFS24 FFS36

CHAPTER 6. FULL FAT SOY BEAN MEAL IN ATLANTIC COD
154
Table 6.7. Correlation coefficients (r), slopes, Y-axis intercepts, F and P values from
plots of dietary fatty acid concentrations vs. muscle fatty acid concentrations for cod fed
the four experimental diets, including the difference (Δ)1 between diet and muscle fatty
acid values for the FFS0 or the FFS36 groups2
Fatty acid Correlation coefficient ( r ) Slope Y-axis
intercept F P Δ FFS0 Δ FFS36
18:2n-6 0.99 0.534 1.860 70.563 0.014 -0.6 -11.118:3n-3 0.95 0.383 0.332 18.088 0.051 -0.7 -2.018:1n-9 0.03 -0.006 10.011 0.002 0.969 1.3 -4.422:1 3 0.94 0.103 0.405 15.768 0.058 -12.1 -6.620:5n-3 0.96 0.617 8.164 24.605 0.038 4.6 6.322:6n-3 0.04 0.028 23.043 0.003 0.962 13.0 18.6
1 Negative Δ values indicate lower values in muscle compared with diet, whereas positivevalues indicate accumulation in muscle relative to diet.2 FA concentrations are % by weight of total fatty acids in diet and muscle3 Includes 22:1n-11 and 22:1n-9
Table 6.8. Correlation coefficients (r), slopes, Y-axis intercepts, F and P values from
plots of dietary fatty acid concentrations vs. liver fatty acid concentrations for cod fed
the four experimental diets, including the difference (Δ)1 between diet and liver fatty
acid values for the FFS0 or the FFS36 groups2
Fatty acid Correlation coefficient ( r ) Slope Y-axis
intercept F P Δ FFS0 Δ FFS36
18:2n-6 1.00 0.831 0.566 482.934 0.002 0.2 -3.418:3n-3 1.00 0.801 -0.014 270.867 0.004 -0.3 -0.718:1n-9 0.98 0.657 10.407 63.421 0.015 7.5 5.522:1 3 1.00 0.773 -1.021 5662.108 0.000 -4.2 -2.820:5n-3 0.99 0.454 2.706 132.046 0.007 -2.8 -0.222:6n-3 0.99 0.489 3.248 82.646 0.012 -2.6 0.2
1 Negative Δ values indicate lower values in liver compared with diet, whereas positivevalues indicate accumulation in liver relative to diet.2 FA concentrations are % by weight of total fatty acids in diet and liver3 Includes 22:1n-11 and 22:1n-9

CHAPTER 6. FULL FAT SOY BEAN MEAL IN ATLANTIC COD
155
0 10 20 300
5
10
15
20
r = 0.99P = 0.014
a. 18:2n-6
0 1 2 3 4 50.0
0.5
1.0
1.5
2.0
r = 0.95P = 0.051
b. 18:3n-3
0 5 10 15 200
5
10
15
r = 0.03P = 0.969
c. 18:1n-9
0.0 2.5 5.0 7.5 10.0 12.5 15.00.0
0.5
1.0
1.5
2.0
r = 0.94P = 0.058
d. 22:1
Mus
cle,
FA
(% o
f Tot
al F
A)
0.0 2.5 5.0 7.5 10.0 12.5 15.00
5
10
15
20
r = 0.96P = 0.038
e. 20:5n-3
0.0 2.5 5.0 7.5 10.0 12.5 15.00
10
20
30
r = 0.04P = 0.962
f. 22:6n-3
Diet, FA (% of Total FA)
Figure 6.1. Relationship between dietary fatty acids concentrations and muscle fatty
acids concentrations of 18:2n-6 (a), 18:3n-3 (b), 18:1n-9 (c), 22:1 (d), 20:5n-3 (e),
22:6n-3 (f) in total lipids of cod fed diets containing increasing levels of full fat soybean
meal (FFS)

CHAPTER 6. FULL FAT SOY BEAN MEAL IN ATLANTIC COD
156
0 10 20 300
5
10
15
20
25 a. 18:2n-6
r = 1.00P = 0.002
0 1 2 3 4 50
1
2
3
4 b. 18:3n-3
r = 1.00P = 0.004
0 5 10 15 200
5
10
15
20
25
r = 0.98P = 0.015
c. 18:1n-9
0 5 10 15 200
5
10
15
r = 1.00P = 0.000
d. 22:1
Liv
er, F
A (%
of T
otal
FA
)
0.0 2.5 5.0 7.5 10.0 12.5 15.00.0
2.5
5.0
7.5
10.0
r = 0.99P = 0.007
e. 20:5n-3
0.0 2.5 5.0 7.5 10.0 12.5 15.00.0
2.5
5.0
7.5
10.0
r = 0.99P = 0.012
f. 22:6n-3
Diet, FA (% of Total FA)
Figure 6.2. Relationship between dietary fatty acids concentrations and liver fatty acids
concentrations of 18:2n-6 (a), 18:3n-3 (b), 18:1n-9 (c), 22:1 (d), 20:5n-3 (e), 22:6n-3 (f)
in total lipids of cod fed diets containing increasing levels of full fat soybean meal
(FFS)

CHAPTER 6. FULL FAT SOY BEAN MEAL IN ATLANTIC COD
157
6.4 Discussion
6.4.1 Growth performance
All groups showed good performance, for cod of this size, with regards to
weight gain, FCR, SGR and TGC at 6 and 12 weeks. However, in this study a negative
effect of the FFS inclusion was clearly shown. In particular, the fish fed the FFS diets
showed poorer growth (expressed as SGR and TGC) compared to the control group
(FFS0). Both SGR and TGC were significantly lower between the FFS0 and the rest of
the groups in the first period of the trial (0-6 weeks) whereas in the second period (6-12
weeks) no significant differences were shown in SGR and only FFS0 and FFS12 differ
significantly with regards to TGC. Nevertheless, the differences of the first period
probably affected the overall growth of the fish and significant differences between the
fish fed the control diet and the fish fed the FFS diets were observed.
These results are in agreement with previous studies in Atlantic cod fed diets
containing soya bean meal (Von der Decken and Lied, 1993) and could be due to the
presence of anti-nutritional factors in FFS (Francis, et al., 2001). However, Von der
Decken and Lied (1993) concluded that only inclusion of FFS above 300 g kg-1
negatively affected the growth of the fish. In the present study, the negative effects were
shown even with 120 g kg-1 inclusion. It is noteworthy that there were very few
significant differences between the FFS diets and only in the first experimental period.
This indicates that the negative effect was unrelated to the inclusion level and was
probably related to a general effect of the FFS on the physiology and consequently the
growth of the fish. This is likely due, at least in part, to a change in diet that would
probably affect the palatability and therefore the consumption rate by the fish in the
initial few weeks. As growth was not different in the 6-12 week period this suggests an

CHAPTER 6. FULL FAT SOY BEAN MEAL IN ATLANTIC COD
158
acclimation to the diet and had the experiment been conducted for an extended period
an overall growth reduction may not have been seen. Fish, especially cod, are often
very sensitive to a dietary change and this could have occurred here although changes in
digestibility related to ANFs etc may also have been a factor. It has been shown that the
inclusion of plant products, including soya products, in the diets of cod reduces nutrient
digestibility (Hansen, et al., 2006; Refstie, et al., 2006). However, in these studies, the
fish compensated for the reduced digestibility with increased feed consumption and no
negative effects were shown in growth. In the present study, feed consumption was not
affected in the first period of the trial and was only slightly, and not significantly,
increased in the second period. If it is hypothesized that the digestibility in the present
trial was reduced, then the this slight increase in feed intake would not be sufficient for
the fish to make up for the reduced digestibility, during the initial 6 week period, and
could have resulted in the reduced growth over the 12 week study period.
6.4.2 Whole body proximate composition
The results of the present study suggest that the inclusion of FFS, even to
concentrations as high as 36%, did not affect the proximate composition of the cod
carcass. This is in agreement with previous studies where the dietary changes had small
effects on the chemical composition of either the whole fish, or of specific tissues, such
as the muscle or the liver. However, differences between these tissues regarding the
extent of compositional changes, to which they may be affected by dietary changes,
have also been reported (Lie, et al., 1988; dos Santos, et al., 1993; Hemre, et al., 2004).
However, in agreement with the findings of studies in Atlantic salmon (Jobling and
Johansen, 2003), size probably plays a more significant role in influencing the whole
body composition, given the differences between the start and end protein, lipid and ash

CHAPTER 6. FULL FAT SOY BEAN MEAL IN ATLANTIC COD
159
contents, that were shown in the present study. Specifically, the protein and ash were
reduced, while the lipid was increased between the start and end samplings.
6.4.3 Tissue fatty acid compositions
Previous studies in cod have demonstrated that tissue fatty acid compositions
reflect the dietary fatty acid composition (Lie, et al., 1986; Lie, et al., 1992; dos Santos,
et al., 1993; Kirsch, et al., 1998; Morais, et al., 2001; Hemre, et al., 2004; Morkore,
2006). This was clearly shown in the present study, both in muscle and liver.
Specifically, in muscle, linear relationships between dietary and tissue FA
concentrations were shown for 18:2n-6 and 20:5n-3 and a similar tendency for 18:3n-3
and 22:1. In liver, 18:2n-6, 18:3n-3, 18:1n-9, 22:1, 20:5n-3 and 22:6n-3 were linearly
related to dietary FA. Linear relationships between dietary and tissue FA compositions
have been previously demonstrated in salmonids (Bell, et al., 2001a; Bell, et al., 2003b;
Bell, et al., 2004). In agreement with these studies, the linear correlations obtained in
the present trial revealed differences between the relationships of dietary and tissue FA
for each individual FA, as slopes and intercepts and also Δ values differed between FA.
In particular, EPA and DHA were present in higher concentrations in muscle compared
to diet both in the FFS0 and FFS36 diets, although at a higher level in the latter, whilst
in liver the concentrations were higher than in the diet only in the FFS36 group. In line
with previous studies, these results suggest that when these FA were provided to the
fish in low concentrations they were selectively retained in the tissues (Bell, et al.,
2003b; Bell, et al., 2004). The differences in retention and utilisation of specific FA in
muscle and liver are related to the different functions of FA in the two tissues. Liver is
the primary lipid storage organ in cod and thus most of the FA are stored as
triacylglycerols while the lean muscle tissue has most of its FA contained in membrane

CHAPTER 6. FULL FAT SOY BEAN MEAL IN ATLANTIC COD
160
phospholipids. Since HUFA, especially EPA and DHA, are vital for the function of cell
membranes the retention of these HUFA in phospholipids is generally more efficient
than in triacylglycerols (Sargent, et al., 2002).
It is important to point out that no significant difference was shown between
treatments in muscle DHA, while EPA was only moderately decreased. This is
important from the perspective of the nutritional quality of the product for the human
consumer, as long-chain HUFA play an important role with regard to human health
(Hunter and Roberts, 2000; ISSFAL, 2000; Simopoulos, 2002, 2003). However,
although lipid levels in muscle are low the high levels of HUFA present in
phospholipids of lean fish are an important source of FA for the consumer.
Nevertheless, in liver, EPA and DHA were significantly reduced between fish fed the
FFS0 and the FFS36 diets. Noticeably, the reductions were still moderate and are less
important as cod liver is less frequently consumed by humans directly although any cod
liver oil by-product would be lower in EPA and DHA, and higher in 18:2n-6, than in
wild cod products.
In muscle and liver, 18:2n-6 and 18:3n-3 were found in much lower
concentrations than in the diet when the fish were fed the FFS diets, indicating that
when these FA were abundant in the diet they were selectively utilized for metabolism,
probably for energy production (Henderson and Sargent, 1985; Stubhaug, et al., 2006).
However, these FA are the precursors of HUFA, through Δ6 desaturation and
elongation (Sargent, et al., 2002) and numerous studies in salmonids have shown that
the replacement of FO with vegetable oils significantly enhances these pathways
(Tocher, et al., 2002; Tocher, et al., 2003a). Hence, the utilization by the fish of these
FA demonstrated in the present study could also be for the synthesis of HUFA, in
CHAPTER 6. FULL FAT SOY BEAN MEAL IN ATLANTIC COD
161
addition to their oxidation for energy production. However, the desaturation and
elongation activities in Atlantic cod, even when fed high levels of vegetable oils, are
very low (Bell, et al., 2006) and, as was observed in rainbow trout, more than 90% of
dietary 18:3n-3 is used for energy production (Bell, et al., 2001b).
Similarly, 22:1 was also utilized in all treatments; however the inclusion of FFS
resulted in lower dietary concentrations of this FA and a subsequent lower utilization
compared to the FFS0 group (Henderson and Sargent, 1985; Stubhaug, et al., 2006).
Interestingly, the concentration of 18:1n-9 in liver was higher than in the diet,
suggesting a preferential retention, whereas in muscle presented a negative Δ value for
the fish fed the FFS36 diet. The selective retention of 18:1n-9 in Atlantic cod, rather
than mobilization for catabolism, may reflect the structural function of this fatty acid in
membrane phospholipids where it is often found in the sn-1 position of phospholipids
with HUFA being favoured in the sn-2 position (Bell and Dick, 1991). Since no
significant differences were shown by ANOVA in muscle 18:1n-9, it is clear that only
the excess of this FA provided by the FFS diets was used by the fish for metabolism
while a specific amount was constantly retained in muscle. These results suggest that in
cod 22:1, 18:2n-6 and 18:3n-3 are preferred substrates for oxidation, in agreement with
studies in Atlantic salmon (Bell, et al., 2003b).
It is worth mentioning that the effects of the dietary FA composition on tissue
FA composition were more clear in liver than in muscle; for instance in muscle the
regression analysis of 18:1n-9 and 22:6n-3 resulted in non significant correlations. This
is obviously due to the different lipid class composition of these two tissues; in cod, and
gadoid fish in general, muscle is mainly constituted of polar lipids located largely in
cell membranes, whilst the major lipid class of the liver is TAG (Sargent, et al., 2002).
CHAPTER 6. FULL FAT SOY BEAN MEAL IN ATLANTIC COD
162
6.5 Conclusions
The results of this study showed that FFS can be used to partially replace FM
and FO in diets for cod with only moderate reductions on growth, no negative effects on
whole body proximate and no major detrimental effects on tissue fatty acid
compositions, although specific FA of muscle and liver are significantly affected at
high FFS inclusion levels. However, further research on the effects of the inclusion of
FFS in diets for Atlantic cod on the nutrient and FA digestibility is needed.

Chapter 7. General Discussion, Conclusions
and Future Perspectives

CHAPTER 7. GENERAL DISCUSSION, CONCLUSIONS & FUTURE PERSPECTIVES
164
7.1 General
In the present study, the effects of the replacement of FM and FO with two VO
and an oilseed meal on the growth performance, feed utilization, nutrient and FA
digestibility and tissue FA composition and metabolism were investigated in three
commercially important European fish species. Specifically, in Experiment I (Chapter
3) PO was used to replace FO in diets for rainbow trout. In Experiments II and III
(Chapter 4 and 5, respectively) FO was replaced with RO at various dietary
protein/lipid levels aiming at further reductions of FM by using low protein (high lipid)
diet formulations which would enhance a protein sparing effect. In Experiments II and
III the fish were reared at low and high water temperatures, respectively, in order to
elucidate, also, the potential effects of the temperature. Lastly, the effects of the
replacement of FM with FFS in Atlantic cod were investigated in Experiment IV
(Chapter 6).
7.2 Growth, feed utilization and nutrient and fatty acid digestibility
In general, the results of the present thesis showed no negative effects in growth
performance of salmonid fish when FO was replaced with VO, while in the case of RO
growth was improved. In Experiment I, PO was included up to 100% of the added oil
(complete replacement of FO) in diets for rainbow trout, with no negative results in
final weight, SGR, TGC or FCR. The results of this study were in line with previous
studies in salmonids which suggested that PO can be used as replacement for FO
without affecting the growth of the fish or the feed utilization (Rosenlund, et al., 2001;
Bell, et al., 2002; Caballero, et al., 2002; Ng, et al., 2003; Ng, et al., 2004).

CHAPTER 7. GENERAL DISCUSSION, CONCLUSIONS & FUTURE PERSPECTIVES
165
Interestingly, studies on the digestibility of PO diets have suggested that lipid ADC and
FA ADC are reduced with increasing levels of PO inclusion, although this could
potentially have an effect on the performance of the fish, no respective effects on
growth have been shown (Torstensen, et al., 2000; Caballero, et al., 2002; Ng, et al.,
2003; Ng, et al., 2004). A possible explanation for that could be given by the higher
feed consumption by the fish in order to compensate for the energy loss (Caballero, et
al., 2002). Moreover the FA composition of the PO, supplying the fish with FA that are
readily catabolised for energy production, could be another mechanism contributing to
the sufficient growth of the fish (Torstensen, et al., 2000; Caballero, et al., 2002). The
results of Experiment I are in line with these hypotheses, however further investigation
of the exact mechanisms involved may be required as well as investigating the use of
PO in rainbow trout over a longer part of the production cycle.
The important role of the FA compositions of the VO, which are selected as
potential replacements for FO, and the consequent differences in the nutrient and FA
digestibilities play on the growth performance of the fish was emphasized in
Experiments II and III (Chapters 5 and 6, respectively). Specifically, RO was included
in the diets of large Atlantic salmon, at various protein / lipid dietary ratios, at expense
of FO, comprising 0%, 30% and 60% of the added oil, in Experiment II, and 0% or
60% of the added oil in Experiment III. Interestingly, the inclusion of RO resulted in
improved growth (mainly SGR and TGC) in both experiments. Although, several
previous studies have shown that replacement of FO with VO, including RO, does not
have negative effects on growth of salmonids (Bell, et al., 2001a; Rosenlund, et al.,
2001; Caballero, et al., 2002; Bell, et al., 2003a; Bell, et al., 2003b; Torstensen, et al.,
2004a; Torstensen, et al., 2005), very few have shown positive effects on growth due to
such replacements (Bendiksen, et al., 2003b). The nutrient and FA digestibility results

CHAPTER 7. GENERAL DISCUSSION, CONCLUSIONS & FUTURE PERSPECTIVES
166
of Experiment III showed higher ADC of lipid and also of specific FA, such as 14:0,
16:0 and monoenes for the RO groups compared to the FO. Given that these FA
(mainly 16:0 and 18:1n-9) are preferentially utilized by the fish for energy production,
via β-oxidation, and also that the RO diets had a significantly higher content of 18:1n-9
compared to the FO diets, the improved growth could be explained by better utilization
of the dietary lipid (and its constituent FA) by the fish.
The effects of the reduction of the dietary protein level by using high lipid diet
formulations were also investigated in the two aforementioned experiments. The use of
such diets could reduce the use of FM in salmon diets, and thus the reliance on this
commodity, but also the environmental impact of salmon culture activities which are
mainly due to feeding practices. In Experiment II, the experimental diets were
formulated at two protein/lipid ratios, namely 390 g kg-1 protein / 320 g kg-1 fat (high
protein diets) or 340 g kg-1 protein / 360 g kg-1 fat (low protein diets). In Experiment III,
the diets were formulated at three protein / lipid ratios, specifically 350 g kg-1 / 350
g kg-1, 330 g kg-1 / 360 g kg-1, 290 g kg-1 / 380 g kg-1 of protein / lipid for high protein,
medium protein and low protein diets, respectively. It should be noted that the
experimental diets in both trials were isoenergetic. The results of both studies suggest
that the growth performance of the fish, including final weights, SGR and TGC, and the
feed utilization were unaffected by the protein/lipid level in the diets. These findings are
in line with several previous studies investigating the use of high lipid and/or low
protein content in diets for Atlantic salmon (Einen and Roem, 1997; Hillestad, et al.,
1998; Bendiksen, et al., 2003b; Azevedo, et al., 2004b, 2004a; Solberg, 2004).
However, it should be noted that in the experiments presented in this thesis the
protein/lipid levels were much lower than in previous studies, suggesting good growth
even at protein levels as low as 290 g kg-1. However, how much more the protein level

CHAPTER 7. GENERAL DISCUSSION, CONCLUSIONS & FUTURE PERSPECTIVES
167
in the diets of salmon could be reduced and/or what is the upper limit in the dietary
lipid level is largely unknown and hence further research in this area is required.
Furthermore, the potential effect of dietary VO inclusion in protein sparing in
fish is largely unknown. The PPV of Experiment III suggest that the protein sparing
effect could have been enhanced not only by the higher dietary oil levels, in agreement
with the results of Experiment II and also previous studies (Einen and Roem, 1997;
Hillestad, et al., 1998; Bendiksen, et al., 2003b), but also by the RO inclusion. In the
same experiment, the tissues of the fish fed on RO diets had higher β-oxidation capacity
compared to tissues from fish fed FO which indicates increased catabolism of FA for
energy production and may support the hypothesis of an enhanced protein sparing
effect.
Lastly, it is noteworthy that no significant interactions were seen between the
protein/lipid levels and the inclusion of RO on the growth or feed utilization of the fish,
in Experiments II and III. This suggests that low protein / high lipid diets, with
alternative sustainable oil sources, can be successfully used in Atlantic salmon
nutrition. Hence, the reduction in the use of both FM and FO could be achieved with no
negative results in the growth or feed utilization. Nevertheless, significant interactions
were shown in the nutrient and FA ADC in Experiment III, indicating different effects
of RO at different dietary protein/lipid levels and vice versa, which may warrant further
investigation.
In contrast to the promising results of FO replacement with VO in the diets of
salmonids, as demonstrated in Experiments I, II and III, the replacement of FM with
FFS in diets for Atlantic cod had negative results on the growth of the fish. Specifically,
in Experiment IV, FFS was gradually included in the diets (12%, 24% and 36% of diet)

CHAPTER 7. GENERAL DISCUSSION, CONCLUSIONS & FUTURE PERSPECTIVES
168
at the expense of FM and FO, resulting in lower SGR and TGC compared to the control
group (0% FFS). Although, this effect was clear only in the first 6 week period of the
feeding trial, it affected the overall growth of the fish at the end of the trial. Previous
studies in Atlantic cod have also showed poorer growth due to dietary inclusion of soya
bean meal (Von der Decken and Lied, 1993). The presence of anti-nutritional factors in
FFS could explain, at least partially, these results (Francis, et al., 2001). Nevertheless,
as the effect in the growth was not correlated to the inclusion level of FFS other factors,
such changes in the palatability, may also have contributed to these results. Lastly, the
nutrient digestibility is known to be affected by dietary inclusion of plant products,
including soya products, in the diets of cod (Hansen, et al., 2006; Refstie, et al., 2006).
The level up to which FFS can replace FM in cod diets and the exact mechanisms that
are involved in such dietary changes, including the effects of ANF and nutrient
digestibility, require further research.
7.3 Whole body proximate composition
The results of the present thesis, suggest that the proximate composition of the
fish whole body was largely unaffected by the dietary changes employed. This
conclusion arose from the results of Experiments I and II where FO was gradually
replaced by PO in diets of rainbow trout and RO at various dietary protein/lipid levels
in diets of Atlantic salmon, respectively, but also from the Experiment IV, where FM
and FO where replaced by FFS. These findings are in agreement with previous studies
(Lie, et al., 1988; dos Santos, et al., 1993; Bendiksen, et al., 2003b; Hemre, et al.,
2004), and are of importance as the chemical composition of the fish carcass affects the
final quality of the product, and its processing properties. However, significant changes
due to similar dietary changes have also been reported both due to inclusions of VO

CHAPTER 7. GENERAL DISCUSSION, CONCLUSIONS & FUTURE PERSPECTIVES
169
(Bell, et al., 2001a; Torstensen, et al., 2004b; Ruyter, et al., 2006) and also due to
varying dietary protein/lipid levels (Hillestad and Johnsen, 1994; Einen and Roem,
1997; Azevedo, et al., 2004a; Solberg, 2004). In agreement with the results of the latter
studies, the results of Experiment III reported significant differences in the fish body
composition due to the interactive effects of FO replacement with RO and various
dietary protein/lipid levels.
7.4 Tissue fatty acid composition
It is clear that changes in dietary formulations, such as the replacement of FO
and FM with plant sources, affect the dietary FA compositions. This may have serious
implications not only for fish metabolism and growth but also for the quality of the final
product, since the fish tissue total lipid FA composition reflects the FA composition of
the diet, especially in oily fish like salmonids. The relation between the concentrations
of individual FA in the diet and the tissues, which often follows linear correlations, has
been demonstrated in several previous studies both in salmonids (Bell, et al., 2001a;
Rosenlund, et al., 2001; Bell, et al., 2003a; Bell, et al., 2003b; Torstensen, et al., 2004a;
Torstensen, et al., 2005) and in Atlantic cod (Lie, et al., 1986; Lie, et al., 1992; dos
Santos, et al., 1993; Kirsch, et al., 1998; Morais, et al., 2001; Hemre, et al., 2004;
Morkore, 2006) and was also confirmed by the results of the four Experiments of this
thesis. Specifically, in all four Experiments the FA composition of the tissues was
clearly affected by the dietary FA composition, reflecting the changes that were induced
by the inclusion of PO in Experiment I, RO in Experiments II and III and FFS in
Experiment IV. Noticeably, linear correlations between dietary and tissue FA were
shown for several FA in muscle and liver of Atlantic cod in Experiment IV. Lastly, it
should be noted that in Experiments II and III the various dietary protein/lipid ratios, to

CHAPTER 7. GENERAL DISCUSSION, CONCLUSIONS & FUTURE PERSPECTIVES
170
which the experimental diets were formulated, did not affect significantly the tissue FA
composition.
Although, in general, the increases or reductions of FA in the tissues follow the
respective changes in the dietary FA composition, the results of the present thesis
suggest that specific FA were selectively utilized or retained in the tissues by the fish.
This is in line with previous studies reporting specific utilization or accumulation in the
tissues of specific FA and suggesting that when specific FA are in abundance in the
diets they are selectively utilized for energy production, via β-oxidation, or in addition,
but perhaps to a lesser extent they may be desaturated and elongated, whereas on the
contrary, when FA, and especially n-3 HUFA, are limited in the diet they are retained or
deposited in the tissues (Bell, et al., 2001a; Rosenlund, et al., 2001; Bell, et al., 2002;
Bell, et al., 2003a; Torstensen, et al., 2004a).
Hence, 18:1n-9 was selectively utilized, probably for energy production via β-
oxidation, in Experiments I, II and III, where it comprised a large proportion of the FA
compositions of the PO and RO diets. Moreover, 18:2n-6 and 18:3n-3 were also
selectively utilized when in abundance in the diets, as was demonstrated in Experiments
II, III and IV. Interestingly, in Experiment I, where the PO diets lack 18:3n-3, 18:2n-6
was probably utilized by the fish, including elongation and desaturation, as was
indicated by the significantly increased proportions of 20:2n-6, 20:3n-6 and ARA in the
rainbow trout tissues. On the other hand, the n-3 HUFA were decreased in the tissues of
the fish when they were fed on the PO, RO or FFS diets. However, in agreement with
previous studies suggesting selective accumulation of n-3 HUFA when provided in low
dietary concentrations, EPA and especially DHA were, in most cases throughout this
thesis, selectively retained in the fish tissues (Bell, et al., 2001a; Bell, et al., 2003a;

CHAPTER 7. GENERAL DISCUSSION, CONCLUSIONS & FUTURE PERSPECTIVES
171
Torstensen, et al., 2004b). Specifically, although the dietary decreases in these FA were
dramatic, when FO was replaced with plant ingredients, the reductions in the tissues
were in most cases only moderate. However, this may have been due to the relatively
short duration of these studies and longer trials would need to be conducted to ensure
no major deterioration in product quality occurred in the marketed product.
The FA composition of the fish tissues, and especially of the muscle which
represents the edible part of the fish, influences the nutritional and quality
characteristics of the final product. Fish have traditionally been unique sources of n-3
HUFA for human consumers and the beneficial role of the n-3 HUFA on the prevention
of or protection from various human diseases has been well documented (De Deckere,
et al., 1998; Horrocks and Yeo, 1999; Simopoulos, 1999; Hunter and Roberts, 2000;
ISSFAL, 2000; Simopoulos, 2003). Thus, any negative effects on the FA composition
of the fish flesh, resulting from dietary changes such as the replacement of marine oils
and meals with vegetable commodities, would be undesirable. In this regard, the
moderate reductions of EPA and DHA that were shown in the present thesis, although
the feeding trials were of relatively short periods, could be significant for the quality of
the final product and its acceptance by the consumer.
7.5 General conclusions
The results of Experiment I, suggest that the dietary PO inclusion, up to
complete replacement of FO, in diets of rainbow trout has:
• No negative results in growth and feed utilization
• No negative results in proximate composition of the fish

CHAPTER 7. GENERAL DISCUSSION, CONCLUSIONS & FUTURE PERSPECTIVES
172
• Significant changes in the FA compositions of the fish tissues, especially at
replacement levels of over 50% although, the reduction in EPA and especially
in DHA were only modest.
The results of Experiment II investigating the use of the interactive effects of
dietary protein and lipid contents and oil source, namely RO, in Atlantic salmon reared
at low water temperatures, showed:
• No negative effects on growth and feed conversion either by the dietary
protein/lipid level or by the oil source
• No significant changes in the fish whole body proximate composition
• Significant changes in muscle and liver FA compositions due to the oil source.
The tissue FA compositions reflected largely the dietary FA compositions
although specific FA were selectively utilized or retained
• An enhanced protein sparing effect, when fish were fed with lower protein feeds
where RO replaced FO up to 60% of the total oil
The results of Experiment III, aiming to elucidate the interactive effects of the
dietary protein and lipid levels and the replacement of FO with RO in Atlantic salmon
reared at high water temperatures, suggest that:
• Low protein / high lipid diets can be used with no negative effects on the
growth, FCR and chemical composition of Atlantic salmon
• The replacement of FO with RO can enhance the growth of the fish as well as
the nutrient and FA digestibility of the diets, showing an increased protein
sparing and β-oxidation.

CHAPTER 7. GENERAL DISCUSSION, CONCLUSIONS & FUTURE PERSPECTIVES
173
• RO inclusion significantly affected the tissue FA compositions, as they reflected
the FA composition of the diets. However, the reduction in EPA and DHA,
resulting from the dietary RO inclusion, was only moderate and hence, the
impact on the final product quality, in terms of the nutritional value for the
human consumer, was limited.
The results of Experiment IV, investigating the replacement of FM with FFS in
diets of Atlantic cod, showed:
• moderate reductions on growth when FFS replaced FM, which noticeably were
irrespective of the inclusion level FFS
• no negative effects on whole body proximate composition
• no major detrimental effects on tissue fatty acid compositions, although specific
FA of muscle and liver are significantly affected at high FFS inclusion levels
• linear relationships between various tissue and dietary FA, suggesting that
specific FA were selectively utilized or retained in the tissues
7.6 Future perspectives
Some of the areas needing further research are mentioned below:
Dietary trials over a longer part of the production cycle, at varying water
temperatures, may be required to clarify the effects of, and the mechanisms involved in,
the use of PO to replace FO in diets of rainbow trout, on the growth and feed efficiency
of the fish and the quality of the final product in terms of its FA composition.
The extent to which the dietary protein /lipid level can be reduced without
affecting the growth, the health and the welfare of Atlantic salmon is largely unknown

CHAPTER 7. GENERAL DISCUSSION, CONCLUSIONS & FUTURE PERSPECTIVES
174
and should be further investigated. Also the potential positive effects of RO on the
growth of Atlantic salmon should be examined over longer periods of the production
cycle, ensuring though that the quality of the final product is not compromised by
changes in the flesh FA composition. Lastly, future studies may be required to elucidate
the interactive effects between the dietary protein/lipid level and the oil source on
nutrient and FA digestibility and the protein sparing effects at different water
temperatures.
FM could be replaced by FFS in diets for Atlantic cod, however, the maximum
levels of FFS inclusion and the exact mechanisms that are involved in such dietary
changes, including the effects of ANF and nutrient digestibility, are not yet clear and
require further research. Since it was clearly shown by the results of the present study
that such dietary changes affect the tissue FA composition, future studies should
examine these effects, especially at high FM and FO replacement levels, aiming
towards a nutritious final product.

REFERENCES
175
References
Ackman, R.G., 1980. Fish Lipids, part 1. In: Connell, J.J. (Ed.), Advances in Fish Science and Technology. Fishing New Books Ltd., Farnham, U.K., pp. 86-103.
Ackman, R.G., 1990. Canola fatty acids - an ideal mix for human health, nutrition and food use. In: Shahidi, F. (Ed.), Canola and Rapeseed: Production, Chemistry, Nutrition, and Processing Technology. Avi, New York, USA, pp. 355.
Alexis, M.N., Nengas, I., 2001. Current state of knowledge concerning the use of soy products in diets for feeding Sea bass and Sea bream. Needs for future research. American Soybean Association, Brussels, Belgium, 37 pp.
AOAC, 1995. Official methods of analysis of the Association of Official Analytical Chemists International. Association of Official Analytical Chemists, Arlington, VA, USA, 16th ed.
Austreng, E., 1978. Digestibility determination in fish using chromic oxide marking and analysis of contents from different segments of the gastrointestinal tract. Aquaculture 13, 265-272.
Azevedo, P.A., Leeson, S., Cho, C.Y., Bureau, D.P., 2004a. Growth and feed utilization of large size rainbow trout (Oncorhynchus mykiss) and Atlantic salmon (Salmo salar) reared in freshwater: diet and species effects, and responses over time. Aquacult. Nutr. 10, 401-411.
Azevedo, P.A., Leeson, S., Cho, C.Y., Bureau, D.P., 2004b. Growth, nitrogen and energy utilization of juveniles from four salmonid species: diet, species and size effects. Aquaculture 234, 393-414.
Beare-Rogers, J., Dieffenbacher, A., Holm, J.V., 2001. Lexicon of lipid nutrition. Pure and Applied Chemistry 73, 685-744.
Bell, J.G., Henderson, R.J., Tocher, D.R., McGhee, F., Dick, J.R., Porter, A., Smullen, R.P., Sargent, J.R., 2002. Substituting fish oil with crude palm oil in the diet of Atlantic salmon (Salmo salar) affects muscle fatty acid composition and hepatic fatty acid metabolism. J. Nutr. 132, 222-230.
Bell, J.G., Henderson, R.J., Tocher, D.R., Sargent, J.R., 2004. Replacement of dietary fish oil with increasing levels of linseed oil: Modification of flesh fatty acid compositions in Atlantic salmon (Salmo salar) using a fish oil finishing diet. Lipids 39, 223-232.
Bell, J.G., McEvoy, J., Tocher, D.R., McGhee, F., Campbell, P.J., Sargent, J.R., 2001a. Replacement of fish oil with rapeseed oil in diets of Atlantic salmon (Salmo salar) affects tissue lipid compositions and hepatocyte fatty acid metabolism. J. Nutr. 131, 1535-1543.

REFERENCES
176
Bell, J.G., McEvoy, J., Webster, J.L., McGhee, F., Millar, R.M., Sargent, J.R., 1998. Flesh lipid and carotenoid composition of Scottish farmed Atlantic salmon (Salmo salar). J. Agric. Food Chem. 46, 119-127.
Bell, J.G., McGhee, F., Campbell, P.J., Sargent, J.R., 2003a. Rapeseed oil as an alternative to marine fish oil in diets of post-smolt Atlantic salmon (Salmo salar): changes in flesh fatty acid composition and effectiveness of subsequent fish oil "wash out". Aquaculture 218, 515-528.
Bell, J.G., McGhee, F., Dick, J.R., Tocher, D.R., 2005. Dioxin and dioxin-like polychlorinated biphenyls (PCBs) in Scottish farmed salmon (Salmo salar): effects of replacement of dietary marine fish oil with vegetable oils. Aquaculture 243, 305-314.
Bell, J.G., McVicar, A.H., Park, M.T., Sargent, J.R., 1991. High dietary linoleic acid affects the fatty acid compositions of individual phospholipids from tissues of Atlantic salmon (Salmo salar): association with stress susceptibility and cardiac lesion. J. Nutr. 121, 1163-1172.
Bell, J.G., Strachan, F., Good, J.E., Tocher, D.R., 2006. Effect of dietary echium oil on growth, fatty acid composition and metabolism, gill prostaglandin production and macrophage activity in Atlantic cod (Gadus morhua L.). Aquacult. Res. 37, 606-617.
Bell, J.G., Tocher, D.R., Henderson, R.J., Dick, J.R., Crampton, V.O., 2003b. Altered fatty acid compositions in Atlantic salmon (Salmo salar) fed diets containing linseed and rapeseed oils can be partially restored by a subsequent fish oil finishing diet. J. Nutr. 133, 2793-2801.
Bell, M.V., Dick, J.R., 1991. Molecular species composition of the major diacyl glycerophospholipids from muscle, liver, retina and brain of cod (Gadus morhua). Lipids 26, 565-573.
Bell, M.V., Dick, J.R., Porter, A.E., 2001b. Biosynthesis and tissue deposition of docosahexaenoic acid (22:6n-3) in rainbow trout (Oncorhynchus mykiss). Lipids 36, 1153-1159.
Bendiksen, E.Å., Arnesen, A.M., Jobling, M., 2003a. Effects of dietary fatty acid profile and fat content on smolting and seawater performance in Atlantic salmon (Salmo salar L.). Aquaculture 225, 149-163.
Bendiksen, E.Å., Berg, O.K., Jobling, M., Arnesen, A.M., Måsøval, K., 2003b. Digestibility, growth and nutrient utilisation of Atlantic salmon parr (Salmo salar L.) in relation to temperature, feed fat content and oil source. Aquaculture 224, 283-299.
Bendiksen, E.Å., Jobling, M., 2003. Effects of temperature and feed composition on essential fatty acid (n-3 and n-6) retention in Atlantic salmon (Salmo salar L.) parr. Fish Physiol. Biochem. 29, 133-140.
Bethune, C., Seierstad, S.L., Seljeflot, I., Johansen, O., Arnesen, H., Meltzer, H.M., Rosenlund, G., Frøyland, L., Lundebye, A.K., 2006. Dietary intake of
REFERENCES
177
differently fed salmon: a preliminary study on contaminants. Eur. J. Clin. Invest. 36, 193-201.
Brodtkorb, T., Rosenlund, G., Lie, Ø., 1997. Effects of dietary levels of 20:5n-3 and 22:6n-3 on tissue lipid composition in juvenile Atlantic salmon, Salmo salar, with emphasis on brain and eye. Aquacult. Nutr. 3, 175-187.
Brugère, C., Ridler, N., 2004. Global aquaculture outlook in the next decades: An analysis of national aquaculture production forecasts to 2030. FAO Fisheries Circular No. 1001, FAO, Rome, pp. 47. Retrieved from http://www.fao.org/docrep/007/y5648e/y5648e00.HTM.
Buzzi, M., Henderson, R.J., Sargent, J.R., 1996. The desaturation and elongation of linolenic acid and eicosapentaenoic acid by hepatocytes and liver microsomes from rainbow trout (Oncorhynchus mykiss) fed diets containing fish oil or olive oil. Biochimica et Biophysica Acta - Lipids and Lipid Metabolism 1299, 235-244.
Buzzi, M., Henderson, R.J., Sargent, J.R., 1997a. The biosynthesis of docosahexaenoic acid [22:6(n-3)] from linolenic acid in primary hepatocytes isolated from wild northern pike. Journal of Fish Biology 51, 1197-1208.
Buzzi, M., Henderson, R.J., Sargent, J.R., 1997b. Biosynthesis of docosahexaenoic acid in trout hepatocytes proceeds via 24-carbon intermediates. Comparative Biochemistry and Physiology - B Biochemistry and Molecular Biology 116, 263-267.
Caballero, M.J., Obach, A., Rosenlund, G., Montero, D., Gisvold, M., Izquierdo, M.S., 2002. Impact of different dietary lipid sources on growth, lipid digestibility, tissue fatty acid composition and histology of rainbow trout, Oncorhynchus mykiss. Aquaculture 214, 253-271.
Cho, C.Y., Cowey, C.B., 1991. Rainbow trout, Oncorhynchus mykiss. In: Wilson, R. (Ed.), Handbook of nutrient requirements of finfish. CRC Press, Boca Raton, Florida, pp. 131-143.
Christie, W.W., 1982. Lipid Analyses. Pergamon Press, Oxford England, 2nd ed., 52-56 pp.
De Deckere, E.A., Korver, O., Verschuren, P.M., Katan, M.B., 1998. Health aspects of fish and n-3 polyunsaturated fatty acids from plant and marine origin. Eur. J. Clin. Nutr. 52, 749-753.
Delgado, C.L., Wada, N., Rosegrant, M.W., Meijer, S., Ahmed, M., 2003. Fish to 2020: Supply and demand in changing global markets. WorldFish Center Technical Report 62. International Food Policy Research Institute, Washington, D.C. and WorldFish Center, Penang, Malaysia, 236 pp.
dos Santos, J., Burkow, I.C., Jobling, M., 1993. Patterns of growth and lipid deposition in cod (Gadus morhua L.) fed natural prey and fish-based feeds. Aquaculture 110, 173-189.

REFERENCES
178
Einen, O., Roem, A.J., 1997. Dietary protein/energy ratios for Atlantic salmon in relation to fish size: growth, feed utilization and slaughter quality. Aquacult. Nutr. 3, 115-126.
Einen, O., Skrede, G., 1998. Quality characteristics in raw and smoked fillets of Atlantic salmon, Salmo salar, fed high-energy diets. Aquacult. Nutr. 4, 99-108.
Failler, P., 2006. Future prospects for fish and fishery products. Fish consumption in the European Union in 2015 and 2030 - Part 1. European overview & Part 2. Country projections. FAO Fisheries Circular. No. 972/4. FAO, Rome.
FAO, 1986. The production of fish meal and oil. FAO Fisheries Technical Papers - T142. Food and Agriculture Organization of the United Nations, Rome, Italy, 63 pp.
FAO, 2001. A world overview of species of interest to fisheries. Gadus morhua -Species Identification and Data Programme (SIDP). FIGIS Species Fact Sheets FAO, Rome. Retrieved on 25/02/2007 from http://www.fao.org/figis/servlet/FiRefServlet?ds=species&fid=2218.
FAO, 2004a. Collation, analysis and dissemination of global and regional fishery statistics. FI Programme Websites, FAO Fishery Information Data and Statistics Unit (FAO-FIDI). FAO, Rome. Retrieved on 20/02/2007 from http://www.fao.org/figis/servlet/static?dom=org&xml=FIDI_STAT_org.xml.
FAO, 2004b. Cultured aquatic species information programme - Salmo salar. Cultured Aquatic Species Fact Sheets, FAO Inland Water Resources and Aquaculture Service (FIRI), Jones, M., Rome. Retrieved on 22/02/2007 from http://www.fao.org/figis/servlet/static?dom=culturespecies&xml=Salmo_salar.xml
FAO, 2005a. Cultured aquatic species information programme - Oncorhynchus mykiss. Cultured Aquatic Species Fact Sheets, FAO Inland Water Resources and Aquaculture Service (FIRI), Cowx, I.G., Rome. Retrieved on 22/02/2007 from http://www.fao.org/figis/servlet/static?dom=culturespecies&xml=Oncorhynchus_mykiss.xml.
FAO, 2005b. Oilseeds, oils and oilmeals. Food Outlook 2, 22-25.
FAO, 2005c. Review of the state of world marine fishery resources. FAO Fisheries Technical Paper, No 457, Division, F.R., Rome, pp. 235. Retrieved from http://www.fao.org/docrep/009/y5852e/Y5852E00.HTM.
FAO, 2006a. Fishery Statistical Collections. Fishery Information Data and Statistics Unit (FIDI) - FIGIS Data Collection. FAO, Rome. Retrieved on 3 Jul 2006 from http://www.fao.org/figis/servlet/static?dom=root&xml=tseries/index.xml.
FAO, 2006b. State of world aquaculture 2006. FAO Fisheries Technical Paper. No. 500, Rome, pp. 134. Retrieved from http://www.fao.org/docrep/009/a0874e/a0874e00.htm.

REFERENCES
179
FAO, 2007a. Fishery Statistical Collections. Fishery Information Data and Statistics Unit (FIDI) - FIGIS Data Collection. FAO, Rome. Retrieved on 19/02/2007 from http://www.fao.org/figis/servlet/static?dom=root&xml=tseries/index.xml.
FAO, 2007b. Glossary of aquaculture. FIGIS. Retrieved on 14/02/2007 from http://www.fao.org/fi/glossary/aquaculture/.
FIN, 2006a. Annual Review of the feed grade fish stocks used to produce fishmeal and fish oil for the UK market - FIN Dossier 2006. FishMeal Information Network, pp. 54. Retrieved from http://www.gafta.com/fin/sustainability.pdf.
FIN, 2006b. Feed and food safety. A FishMeal Information Network Issue Summary. Retrieved from http://www.gafta.com/fin/findioxin.html.
FIN, 2006c. Fishmeal and fish oil facts and figures. Fishmeal Information Network. Retrieved on 14/02/2007 from http://www.gafta.com/fin/finfacts.html.
Folch, J., Lees, M., Sloane-Stanley, G.H., 1957. A simple method for the isolation and purification of total lipides from animal tissues. J. Biol. Chem. 226, 497-509.
Francis, G., Makkar, H.P.S., Becker, K., 2001. Antinutritional factors present in plant-derived alternate fish feed ingredients and their effects in fish. Aquaculture 199, 197-227.
Frøyland, L., Lie, O., Berge, R.K., 2000. Mitochondrial and peroxisomal beta-oxidation capacities in various tissues from Atlantic salmon Salmo salar. Aquacult. Nutr. 6, 85-89.
Frøyland, L., Madsen, L., Eckhoff, K.M., Lie, O., Berge, R.K., 1998. Carnitine palmitoyltransferase I, carnitine palmitoyltransferase II, and acyl-CoA oxidase activities in Atlantic salmon (Salmo salar). Lipids 33, 923-930.
Glencross, B.D., Carter, C.G., Duijster, N., Evans, D.R., Dods, K., McCafferty, P., Hawkins, W.E., Maas, R., Sipsas, S., 2004. A comparison of the digestibility of a range of lupin and soybean protein products when fed to either Atlantic salmon (Salmo salar) or rainbow trout (Oncorhynchus mykiss). Aquaculture 237, 333-346.
Grisdale-Helland, B., Helland, S.J., Baeverfjord, G., Berge, G.M., 2002. Full-fat soybean meal in diets for Atlantic halibut: growth, metabolism and intestinal histology. Aquacult. Nutr. 8, 265-270.
Guderley, H., 2004. Metabolic responses to low temperature in fish muscle. Biol. Rev. 79, 409-427.
Gunstone, F.D., 2001. Palm oil supplying much of the world demand for fats and oils. Inform 12, 141-146.
Gunstone, F.D., Herslöf, B.G., 2004. Lipid glossary 2. The Oily Press, Bridgwater, UK, 247 pp.

REFERENCES
180
Halver, J.E., Hardy, R.E., 2002. Nutrient flow and retention, Fish Nutrition. Academic Press, Elsevier Science, San Diego, California, USA, 3rd ed., pp. 768-769.
Hansen, A.-C., Rosenlund, G., Karlsen, Ø., Olsvik, P.A., Hemre, G.-I., 2006. The inclusion of plant protein in cod diets, its effects on macronutrient digestibility, gut and liver histology and heat shock protein transcription. Aquacult. Res. 37, 773-784.
Hardy, R.W., Higgs, D.A., Lall, S.P., Tacon, A.G., 2001. Alternative dietary protein and lipid sources for sustainable production of salmonids. Fisken og Havet, No 8, Institute of Marine Research, Bergen, Norway, pp. 53. Retrieved from http://www.imr.no/__data/page/3839/Nr.8-2001._Alternative_dietary_protein_and_lipid_sources_for_sustainable_production_of_salmonids.pdf.
Hazel, J.R., 1984. Effects of temperature on the structure and metabolism of cell membranes in fish. Am. J. Physiol. Regul. Integr. Comp. Physiol. 246, R460-470.
Hazel, J.R., Williams, E.E., 1990. The role of alternations in membrane lipid composition in enabling physiological adaptation of organisms to their physical environment. Prog. Lipid Res. 29, 167-227.
Helland, S., Storebakken, T., Grisdale-Helland, B., 1991. Atlantic salmon, Salmon salar. In: Wilson, R. (Ed.), Handbook of nutrient requirements of finfish. CRC Press, Boca Raton, Florida, pp. 13-22.
Hemre, G.I., Karlsen, O., Eckhoff, K., Tveit, K., Mangor-Jensen, A., Rosenlund, G., 2004. Effect of season, light regime and diet on muscle composition and selected quality parameters in farmed Atlantic cod, Gadus morhua L. Aquacult. Res. 35, 683-697.
Hemre, G.I., Sandnes, K., 1999. Effect of dietary lipid level on muscle composition in Atlantic salmon Salmo salar. Aquacult. Nutr. 5, 9-16.
Henderson, J.R., 1996. Fatty acid metabolism in freshwater fish with particular reference to polyunsaturated fatty acids. Arch Tierernahr (Arch of Animal Nutr) 49, 5-22.
Henderson, J.R., Sargent, J.R., 1985. Chain-length specificities of mitochondrial and peroxisimal β-oxidation of fatty acids in livers of rainbow trout (Salmo gairdneri). Comp. Biochem. Physiol. B 82, 79-85.
Henderson, J.R., Tocher, D.R., 1987. The lipid composition and biochemistry of freshwater fish. Prog. Lipid Res. 26, 281-347.
Hendricks, J.D., 2002. Adventitious Toxins. In: Halver, J.E., Hardy, R.E. (Eds.), Fish Nutrition. Academic Press, Elsevier Science, San Diego, California, USA, 3rd ed., pp. 601-649.
Hertrampf, J.W., Piedad-Pascual, F., 2000. Handbook on ingredients for aquaculture feeds. Kluwer Academic Publishers, Dordrecht, Netherlands, 624 pp.

REFERENCES
181
Hillestad, M., Johnsen, F., 1994. High-energy/low-protein diets for Atlantic salmon: effects on growth, nutrient retention and slaughter quality. Aquaculture 124, 109-116.
Hillestad, M., Johnsen, F., Austreng, E., Åsgård, T., 1998. Long-term effects of dietary fat level and feeding rate on growth, feed utilization and carcass quality of Atlantic salmon. Aquacult. Nutr. 4, 89-97.
Hites, R.A., Foran, J.A., Carpenter, D.O., Hamilton, M.C., Knuth, B.A., Schwager, S.J., 2004. Global Assessment of Organic Contaminants in Farmed Salmon. Science 303, 226-229.
Hochachka, P.W., Somero, G.N., 2002. Biochemical adaptation: mechanism and process in physiological evolution. Oxford University Press US, New York, 480 pp.
Horrocks, L.A., Yeo, Y.K., 1999. Health benefits of docosahexaenoic acid (DHA). Pharmacol. Res. 40, 211-225.
Hunter, B.J., Roberts, D.C.K., 2000. Potential impact of the fat composition of farmed fish on human health. Nutr. Res. 20, 1047-1058.
ISSFAL, 2000. ISSFAL statement on omega-3 Polyunsaturated fatty acids and heart disease. Retrieved on 3/4/2005 from http://www.issfal.org.uk/heart_statement.htm.
Jacobs, M., Ferrario, J., Byrne, C., 2002a. Investigation of polychlorinated dibenzo-p-dioxins, dibenzo-p-furans and selected coplanar biphenyls in Scottish farmed Atlantic salmon (Salmo salar). Chemosphere 47, 183-191.
Jacobs, M.N., Covaci, A., Schepens, P., 2002b. Investigation of selected persistent organic pollutants in farmed Atlantic salmon (Salmo salar), salmon aquaculture feed, and fish oil components of the feed. Environ. Sci. Technol. 36, 2797-2805.
Jobling, M., Bendiksen, E.Å., 2003. Dietary lipids and temperature interact to influence tissue fatty acid compositions of Atlantic salmon, Salmo salar L., parr. Aquacult. Res. 34, 1423-1441.
Jobling, M., Johansen, S.J.S., 2003. Fat distribution in Atlantic salmon Salmo salar L. in relation to body size and feeding regime. Aquacult. Res. 34, 311-316.
Karlsen, O., Hemre, G.I., Tveit, K., Rosenlund, G., 2006. Effect of varying levels of macro-nutrients and continuous light on growth, energy deposits and maturation in farmed Atlantic cod (Gadus morhua L.). Aquaculture 255, 242-254.
Kaushik, S.J., Coves, D., Dutto, G., Blanc, D., 2004. Almost total replacement of fish meal by plant protein sources in the diet of a marine teleost, the European seabass, Dicentrarchus labrax. Aquaculture 230, 391-404.
Kiessling, K.H., Kiessling, A., 1993. Selective utilization of fatty acids in rainbow trout (Oncorhynchus mykiss Walbaum) red muscle mitochondria. Can. J. Zool. 71, 248-251.

REFERENCES
182
Kirsch, P.E., Iverson, S.J., Bowen, W.D., Kerr, S.R., Ackman, R.G., 1998. Dietary effects on the fatty acid signature of whole Atlantic cod (Gadus morhua). Canadian Journal of Fisheries and Aquatic Sciences 55, 1378-1386.
Lall, S.P., Nanton, D., 2002. Nutrition of Atlantic cod, Progress in cod farming: Research to commercialisation. Proceedings of a special session held at Aquaculture Canada 2001. Bull. Aquacult. Assoc. Can., Halifax, Canada, pp. 23-26. Retrieved from.
Lie, Ø., Hemre, G.I., Lambertsen, G., 1992. Influence of dietary fatty acids on the glycerophospholipid composition in organs of cod (Gadus morhua). Lipids 27, 770-775.
Lie, Ø., Lied, E., Lambertsen, G., 1986. Liver retention of fat and of fatty acids in cod (Gadus morhua) fed different oils. Aquaculture 59, 187-196.
Lie, Ø., Lied, E., Lambertsen, G., 1988. Feed optimization in atlantic cod (Gadus morhua): Fat versus protein content in the feed. Aquaculture 69, 333-341.
Lovell, R., 2002. Diet and fish husbandry - Salmonids. In: Halver, J.E., Hardy, R.E. (Eds.), Fish Nutrition. Academic Press, Elsevier Science, San Diego, California, USA, 3rd ed., pp. 720-732.
Lowry, O.H., Rosebrough, N.J., Farr, A.L., Randall, R.J., 1951. Protein measurement with the folin phenol reagent. J. Biol. Chem. 193, 265-275.
Lundebye, A.K., Berntssen, M.H.G., Lie, O., Ritchie, G., Isosaari, P., Kiviranta, H., Vartiainen, T., 2004. Dietary uptake of dioxins (PCDD/PCDFs) and dioxin-like PCBs in Atlantic salmon (Salmo salar). Aquacult. Nutr. 10, 199-207.
Menoyo, D., Lopez-Bote, C.J., Bautista, J.M., Obach, A., 2003. Growth, digestibility and fatty acid utilization in large Atlantic salmon (Salmo salar) fed varying levels of n-3 and saturated fatty acids. Aquaculture 225, 295-307.
Morais, S., Bell, J.G., Robertson, D.A., Roy, W.J., Morris, P.C., 2001. Protein/lipid ratios in extruded diets for Atlantic cod (Gadus morhua L.): effects on growth, feed utilisation, muscle composition and liver histology. Aquaculture 203, 101-119.
Morkore, T., 2006. Relevance of dietary oil source for contraction and quality of pre-rigor filleted Atlantic cod, Gadus morhua. Aquaculture 251, 56-65.
Moya-Falon, C., Thomassen, M.S., Jakobsen, J.V., Ruyter, B., 2005. Effects of dietary supplementation of rapeseed oil on metabolism of [1-C-14]18:1 n-9, [1-C-14] 20:3n-6, and [1-C-14]20:4n-3 in Atlantic salmon hepatocytes. Lipids 40, 709-717.
Mozaffarian, D., Rimm, E.B., 2006. Fish Intake, Contaminants, and Human Health: Evaluating the Risks and the Benefits. Journal of American Medical Association 296, 1885-1899.

REFERENCES
183
Mundheim, H., Aksnes, A., Hope, B., 2004. Growth, feed efficiency and digestibility in salmon (Salmo salar L.) fed different dietary proportions of vegetable protein sources in combination with two fish meal qualities. Aquaculture 237, 315-331.
Nanton, D.A., Vegusdal, A., Rora, A.M.B., Ruyter, B., Baeverfjord, G., Torstensen, B.E., 2007. Muscle lipid storage pattern, composition, and adipocyte distribution in different parts of Atlantic salmon (Salmo salar) fed fish oil and vegetable oil. Aquaculture 265, 230-243.
Naylor, R.L., Goldburg, R.J., Mooney, H., Beveridge, M., Clay, J., Folke, C., Kautsky, N., Lubchenco, J., Primavera, J., Williams, M., 1998. Nature's Subsidies to Shrimp and Salmon Farming. Science 282, 883.
Ng, W.-K., Campbell, J.P., Dick, R.J., Bell, J.G., 2003. Interactive effects of dietary palm oil concentration and water temperature on lipid digestibility in rainbow trout, Oncorhynchus mykiss. Lipids 38, 1031-1038.
Ng, W.-K., Sigholt, T., Bell, J.G., 2004. The influence of environmental temperature on the apparent nutrient and fatty acid digestibility in Atlantic salmon (Salmo salar L.) fed finishing diets containing different blends of fish oil, rapeseed oil and palm oil. Aquacult. Res. 35, 1228-1237.
Ng, W.K., 2002a. Palm oil: Alternative lipid source in aquaculture feeds. Global Aquaculture Advocate 4, 40-41.
Ng, W.K., 2002b. Potential of palm oil utilisation in aquaculture feeds. Asia Pac. J. Clin. Nutr. 11 Suppl 7, 473-476.
NRC, 1993. Nutrient requirements of fish. National Academy Press, Washington D.C.
Oliva-Teles, A., Gouveia, A.J., Gomes, E., Rema, P., 1994. The effect of different processing treatments on soybean meal utilization by rainbow trout, Oncorhynchus mykiss. Aquaculture 124, 343-349.
Olli, J.J., Krogdahl, A., 1994. Nutritive value of 4 soybean products as protein sources in diets for Rainbow trout (Oncorhynchus mykiss, Walbaum) reared in fresh water. Acta Agriculturae Scandinavica Section a-Animal Science 44, 185-192.
Olsen, R.E., Henderson, R.J., Sountama, J., Hemre, G., Ringø, E., Melle, W., Tocher, D.R., 2004. Atlantic salmon, Salmo salar, utilizes wax ester-rich oil from Calanus finmarchicus effectively. Aquaculture 240, 433-449.
Olsen, R.E., Ringø, E., 1998. The influence of temperature on the apparent nutrient and fatty acid digestibility of Arctic charr, Salvelinus alpinus L. Aquacult. Res. 29, 695-701.
Pike, I.H., 2005. Eco-efficiency in aquaculture: global catch of wild fish used in aquaculture. International Aquafeed 8, 38-40.
Pike, I.H., Barlow, S.M., 2003. Impact of fish farming on fish stocks. Int. Aquafeed Dir., 24–29.

REFERENCES
184
Purser, J., Forteath, N., 2003. Salmonids. In: Lucas, J.S., Southgate, P.C. (Eds.), Aquaculture - Farming animals and plants. Fishing News Books - Blackwell Publishing, Oxford, UK, pp. 295-320.
Refstie, S., Forde-Skjaervik, O., Rosenlund, G., Rorvik, K.-A., 2006. Feed intake, growth, and utilisation of macronutrients and amino acids by 1- and 2-year old Atlantic cod (Gadus morhua) fed standard or bioprocessed soybean meal. Aquaculture 255, 279-291.
Refstie, S., Storebakken, T., Baeverfjord, G., Roem, A.J., 2001. Long-term protein and lipid growth of Atlantic salmon (Salmo salar) fed diets with partial replacement of fish meal by soy protein products at medium or high lipid level. Aquaculture 193, 91-106.
Refstie, S., Storebakken, T., Roem, A.J., 1998. Feed consumption and conversion in Atlantic salmon (Salmo salar) fed diets with fish meal, extracted soybean meal or soybean meal with reduced content of oligosaccharides, trypsin inhibitors, lectins and soya antigens. Aquaculture 162, 301-312.
Robert, S.S., 2006. Production of eicosapentaenoic and docosahexaenoic acid-containing oils in transgenic land plants for human and aquaculture nutrition. Marine Biotechnology 8, 103-109.
Rosenlund, G., Karlsen, O., Tveit, K., Mangor-Jensen, A., Hemre, G.I., 2004. Effect of feed composition and feeding frequency on growth, feed utilization and nutrient retention in juvenile Atlantic cod, Gadus morhua L. Aquacult. Nutr. 10, 371-378.
Rosenlund, G., Obach, A., Sandberg, M.G., Standal, H., Tveit, K., 2001. Effect of alternative lipid sources on long-term growth performance and quality of Atlantic salmon (Salmo salar L.). Aquacult. Res. 32 (suppl. 1), 323-328.
Ruyter, B., Moya-Falcon, C., Rosenlund, G., Vegusdal, A., 2006. Fat content and morphology of liver and intestine of Atlantic salmon (Salmo salar): Effects of temperature and dietary soybean oil. Aquaculture 252, 441-452.
Sargent, J.R., Tacon, A.G., 1999. Development of farmed fish: a nutritionally necessary alternative to meat. Proc. Nutr. Soc. 58, 377-383.
Sargent, J.R., Tocher, D.R., Bell, J.G., 2002. The lipids. In: Halver, J.E., Hardy, R.E. (Eds.), Fish Nutrition. Academic Press, Elsevier Science, San Diego, California, USA, 3rd ed., pp. 181-257.
SCAN, 2000. Dioxin contamination of feedingstuffs and their contribution to the contamination of food of animal origin. Opinion of the Scientific Committee on Animal Nutrition, adopted on November 6th 2000. European Commission for Health and Consumer Protection Directorate - General, Brussels, Belgium. Retrieved from http://www.europa.eu.int/comm/food/fs/sc/scan/out55_en.pdf
SCF, 2001. Update of the Risk assessment of dioxins and dioxin-like PCBs in food based on new scientific information available since adoption of the SCF opinion of 22nd November 2000. Opinion of the Scientific Committee on Food, adopted

REFERENCES
185
on May 30th 2001. Brussels, Belgium, European Commission for Health and Consumer Protection Directorate_General. Retrieved from http://www.europa.eu.int/comm/food/fs/sc/scf/out90_en.pdf.
Simopoulos, A.P., 1999. Essential fatty acids in health and chronic disease. Am. J. Clin. Nutr. 70, 560S-569S.
Simopoulos, A.P., 2000. Human requirement for n-3 polyunsaturated fatty acids. Poult. Sci. 79, 961-970.
Simopoulos, A.P., 2002. Omega-3 fatty acids in inflammation and autoimmune diseases. J. Am. Coll. Nutr. 21, 495-505.
Simopoulos, A.P., 2003. Omega-3 fatty acids and cancer. Indoor and Built Environment 12, 405-412.
Solberg, C., 2004. Influence of dietary oil content on the growth and chemical composition of Atlantic salmon (Salmo salar). Aquacult. Nutr. 10, 31-37.
Sprecher, H., 2000. Metabolism of highly unsaturated n-3 and n-6 fatty acids. Biochim. Biophys. Acta 1486, 219-231.
Sprecher, H., Luthria, D.L., Mohammed, B.S., Baykousheva, S.P., 1995. Reevaluation of the pathways for the biosynthesis of polyunsaturated fatty acids. J. Lipid Res. 36, 2471-2477.
Stubhaug, I., Frøyland, L., Torstensen, B.E., 2005a. β-Oxidation capacity of red and white muscle and liver in Atlantic salmon (Salmo salar L.) - effects of increasing dietary rapeseed oil and olive oil to replace capelin oil. Lipids 40, 39-47.
Stubhaug, I., Lie, Ø., Torstensen, B.E., 2006. Fatty acid retention and β-oxidation capacity in tissues of Atlantic salmon (Salmo salar L.) fed dietary fish or vegetable oil- a life cycle study. Aquacult. Nutr. In Press.
Stubhaug, I., Lie, Ø., Torstensen, B.E., 2007. Fatty acid productive value and β-oxidation capacity in Atlantic salmon (Salmo salar L.) fed on different lipid sources along the whole growth period. Aquacult. Nutr. 13, 145-155.
Stubhaug, I., Tocher, D.R., Bell, J.G., Dick, J.R., Torstensen, B.E., 2005b. Fatty acid metabolism in Atlantic salmon (Salmo salar L.) hepatocytes and influence of dietary vegetable oil. Biochim. Biophys. Acta 1734, 277-288.
Tacon, A.G., 2005. State of information on salmon aquaculture feed and the environment. Report prepared for the WWF US Initiated Salmon Aquaculture Dialogue, pp. 80. Retrieved from www.worldwildlife.org/cci/dialogues/salmon.cfm.
Tacon, A.G.J., 2004. Use of fish meal and fish oil in aquaculture: a global perspective. Aquatic Resources, Culture and Development 1, 3-14.

REFERENCES
186
Tidwell, J.H., Allan, G.L., 2002. Fish as food: aquaculture's contribution. Ecological and economic impacts and contributions of fish farming and capture fisheries. World Aquaculture 33, 44-48.
Tocher, D.R., 2003. Metabolism and functions of lipids and fatty acids in teleost fish. Reviews in Fisheries Science 11, 107-184.
Tocher, D.R., Bell, J.G., Dick, J.R., Crampton, V.O., 2003a. Effects of dietary vegetable oil on Atlantic salmon hepatocyte fatty acid desaturation and liver fatty acid compositions. Lipids 38, 723-732.
Tocher, D.R., Bell, J.G., Dick, J.R., Henderson, R.J., McGhee, F., Michell, D., Morris, P.C., 2000. Polyunsaturated fatty acid metabolism in Atlantic salmon (Salmo salar) undergoing parr-smolt transformation and the effects of dietary linseed and rapeseed oils. Fish Physiol. Biochem. 23, 59-73.
Tocher, D.R., Bell, J.G., MacGlaughlin, P., McGhee, F., Dick, J.R., 2001. Hepatocyte fatty acid desaturation and polyunsaturated fatty acid composition of liver in salmonids: effects of dietary vegetable oil. Comp. Biochem. Physiol. B 130, 257-270.
Tocher, D.R., Bell, J.G., McGhee, F., Dick, J.R., Fonseca-Madrigal, J., 2003b. Effects of dietary lipid level and vegetable oil on fatty acid metabolism in Atlantic salmon (Salmo salar - L.) over the whole production cycle. Fish Physiol. Biochem. 29, 193-209.
Tocher, D.R., Fonseca-Madrigal, J., Bell, J.G., Dick, J.R., Sargent, J.R., Henderson, R.J., 2002. Effects of diets containing linseed oil on fatty acid desaturation and oxidation in hepatocytes and intestinal enterocytes in Atlantic salmon (Salmo salar). Fish Physiol. Biochem. 26, 157-170.
Tocher, D.R., Fonseca-Madrigal, J., Dick, J.R., Ng, W.-K., Bell, J.G., Campbell, P.J., 2004. Effects of water temperature and diets containing palm oil on fatty acid desaturation and oxidation in hepatocytes and intestinal enterocytes of rainbow trout (Oncorhynchus mykiss). Comp. Biochem. Physiol. B 137, 49-63.
Tocher, D.R., Harvie, D.G., 1988. Fatty acid compositions of the major phosphoglycerides from fish neural tissues; (n-3) and (n-6) polyunsaturated fatty acids in rainbow trout (Salmo gairdneri) and cod (Gadus morhua) brains and retinas. Fish Physiol. Biochem. 5, 229-239.
Torstensen, B.E., Bell, J.G., Rosenlund, G., Henderson, R.J., Graff, I.E., Tocher, D.R., Lie, Ø., Sargent, J.R., 2005. Tailoring of Atlantic salmon (Salmo salar L.) flesh lipid composition and sensory quality by replacing fish oil with a vegetable oil blend. J. Agric. Food Chem. 53, 10166-10178.
Torstensen, B.E., Frøyland, L., Lie, Ø., 2004a. Replacing dietary fish oil with increasing levels of rapeseed oil and olive oil - effects on Atlantic salmon (Salmo salar L.) tissue and lipoprotein lipid composition and lipogenic enzyme activities. Aquacult. Nutr. 10, 175-192.
REFERENCES
187
Torstensen, B.E., Frøyland, L., Ørnsrud, R., Lie, Ø., 2004b. Tailoring of a cardioprotective muscle fatty acid composition of Atlantic salmon (Salmo salar) fed vegetable oils. Food Chem. 87, 567-580.
Torstensen, B.E., Lie, Ø., Frøyland, L., 2000. Lipid metabolism and tissue composition in Atlantic salmon (Salmo salar L.) - effects of capelin oil, palm oil, and oleic acid-enriched sunflower oil as dietary lipid sources. Lipids 35, 653-664.
Torstensen, B.E., Stubhaug, I., 2004. beta-oxidation of 18:3n-3 in Atlantic salmon (Salmo salar L.) hepatocytes treated with different fatty acids. Lipids 39, 153-160.
Trushenski, J.T., Kasper, C.S., Kohler, C.C., 2006. Challenges and opportunities in finfish nutrition. North American Journal of Aquaculture 68, 122-140.
U.S. Department for Agriculture, 2007. Oilseeds: World market and trade. Circular Series FOP 2 - 07 February 2007, USDA Foreign Agricultural Service. Retrieved on 29/02/2007 from http://www.fas.usda.gov/psdonline/circulars/oilseeds.pdf.
van den Ingh, T.S.G.A.M., Krogdahl, A., Olli, J.J., Hendriks, H.G.C.J.M., Koninkx, J.G.J.F., 1991. Effects of soybean-containing diets on the proximal and distal intestine in Atlantic salmon (Salmo salar): a morphological study. Aquaculture 94, 297-305.
Von der Decken, A., Lied, E., 1993. Metabolic effects on growth and muscle of soya-bean protein feeding in cod (Gadus morhua). Br. J. Nutr. 69, 689-697.
Xia, T., Mostafa, N., Bhat, B.G., Florant, G.L., Coleman, R.A., 1993. Selective retention of essential fatty acids: the role of hepatic monoacylglycerol acyltransferase. Am. J. Physiol. Regul. Integr. Comp. Physiol. 265, R414-419.
Zar, J.H., 1999. Biostatistical analysis. Prentice-Hall International Editions, London, U.K., 4th ed.
Zhou, S.Y., Ackman, R.G., Morrison, C., 1995. Storage of lipids in the myosepta of Atlantic salmon (Salmo salar). Fish Physiol. Biochem. 14, 171-178.
Zhou, S.Y., Ackman, R.G., Morrison, C., 1996. Adipocytes and lipid distribution in the muscle tissue of Atlantic salmon (Salmo salar). Canadian Journal of Fisheries and Aquatic Sciences 53, 326-332.
APPENDIX
188
Appendix. Publications and presentations from the project
Ia. Publications in peer-reviewed journals
• Fonseca-Madrigal, J., Karalazos, V., Campbell, P.J., Bell, J.G., Tocher, D.R.,
2005. Influence of dietary palm oil on growth, tissue fatty acid compositions,
and fatty acid metabolism in liver and intestine in rainbow trout (Oncorhynchus
mykiss). Aquaculture Nutrition 11, 241-250.
• Karalazos, V., Bendiksen, E.Å., Dick, J.R., Bell, J.G., 2007. Effects of dietary
protein and fat level and rapeseed oil on growth and tissue fatty acid
composition and metabolism in Atlantic salmon (Salmo salar L.) reared at low
water temperatures. Aquaculture Nutrition. 13, 256-265.
• Karalazos V., J.G. Bell, J. Treasurer, C.J. Cutts, R. Alderson, T.F. Galloway, S.
Albrektsen, J. Arnason, N. MacDonald, I. Pike, 2007. Effects of fish meal
replacement with full fat soya meal on growth and tissue fatty acid composition
in Atlantic cod (Gadus morhua). Journal of Agricultural and Food Chemistry.
In Press.
Ib. In progress (publications in peer-reviewed journals)
• Karalazos, V., Bendiksen, E.Å., Bell, J.G., 2007. Interactive effects of dietary
protein / lipid level and oil source on growth, feed utilisation and nutrient and
fatty acid digestibility of Atlantic salmon. To be submitted for publication
• Karalazos, V., Bendiksen, E.Å., Bell, J.G., 2007. Dietary protein / lipid level
and oil source interactions on fatty acid metabolism of Atlantic salmon. To be
submitted for publication
• Karalazos V., et al., 2007. Effects of dietary full fat soya meal on Atlantic cod
(Gadus morhua). In progress
• Karalazos, V., et al., 2007. Dietary palm oil inclusion effects on fatty acid
compositions of various tissues in rainbow trout (Oncorhynchus mykiss). In
progress
APPENDIX
189
II. Presentations in peer-reviewed conferences
• Karalazos V., J.G. Bell and E.Å. Bendiksen. 2005. Effects of dietary fat and
protein level and rapeseed oil on growth and fatty acid metabolism in Atlantic
salmon (Salmo salar L.) reared at low water temperatures. World Aquaculture
Society Conference 2005 (WAS 05), 9-13 May 2005, Bali, Indonesia. Oral
presentation.
• Karalazos V., J.G. Bell, J. Treasurer, C.J. Cutts, R. Alderson, T.F. Galloway, S.
Albrektsen, J. Arnason, N. MacDonald, and I. Pike, 2005. Effects of fish meal
replacement with full fat soya meal on growth and tissue fatty acid composition
in Atlantic cod (Gadus morhua). European Aquaculture Society Conference
2005 (EAS 05), 5-9 August 2005, Trondheim, Norway. Poster presentation.
• Karalazos V., E.Å. Bendiksen, and J.G. Bell, 2005. Protein and fat level and
rapeseed oil inclusion in diets for Atlantic salmon (Salmo salar L.): effects on
growth and fatty acid metabolism at low water temperatures. European
Aquaculture Society Conference 2005 (EAS 05), 5-9 August 2005, Trondheim,
Norway. Oral presentation.
• Karalazos V., J.G. Bell and E.Å. Bendiksen,. 2006. Effects of dietary protein
and oil source on nutrient digestibility, growth and fatty acid composition of
Atlantic salmon (Salmo salar L.). XII International Symposium on Fish
Nutrition & Feeding 28 May - 1 June 2006, Biarritz, France. Poster
presentation
• Bell J.G., V. Karalazos, J. Treasurer, C.J. Cutts, R. Alderson, T.F. Galloway, S.
Albrektsen, J. Arnason, N. MacDonald, and I. Pike,, 2006. Growth and tissue
fatty acid composition in Atlantic cod (Gadus morhua) fed full fat soya meal to
replace fish meal. XII International Symposium on Fish Nutrition & Feeding 28
May - 1 June 2006, Biarritz, France. Oral presentation.
• Karalazos V., J.G. Bell and E.Å. Bendiksen. 2007. Apparent digestibility of
nutrients and fatty acids and growth performance in large Atlantic salmon fed
on diets with varying protein/lipid ratios and oil source. European Aquaculture
Society Conference 2007 (EAS 07), 24-27 October 2007, Istanbul, Turkey.
(Oral presentation)

APPENDIX
190
III. Presentations in non peer-reviewed meetings
• Karalazos, V., Bendiksen, E.Å., Dick, J.R., Bell, J.G., 2005. Dietary protein
and fat level and rapeseed oil in Atlantic salmon (Salmo salar L.): effects on
growth and fatty acid metabolism. 37th Scottish Lipids Discussion Group
Meeting (Aberdeen), 21 September 2005
• Karalazos V., J.G. Bell, J. Treasurer, C.J. Cutts, R. Alderson, T.F. Galloway, S.
Albrektsen, J. Arnason, N. MacDonald, and I. Pike. Effects of fish meal
replacement with full fat soya meal on growth and tissue fatty acid composition
in Atlantic cod (Gadus morhua). British Marine Finfish Association Workshop
2005. Oban (Scotland)