sustainability report 2020 building for a better future
TRANSCRIPT
BUILDING FOR A
Better FutureSUSTAINABILITY REPORT 2020
KEY
Performance
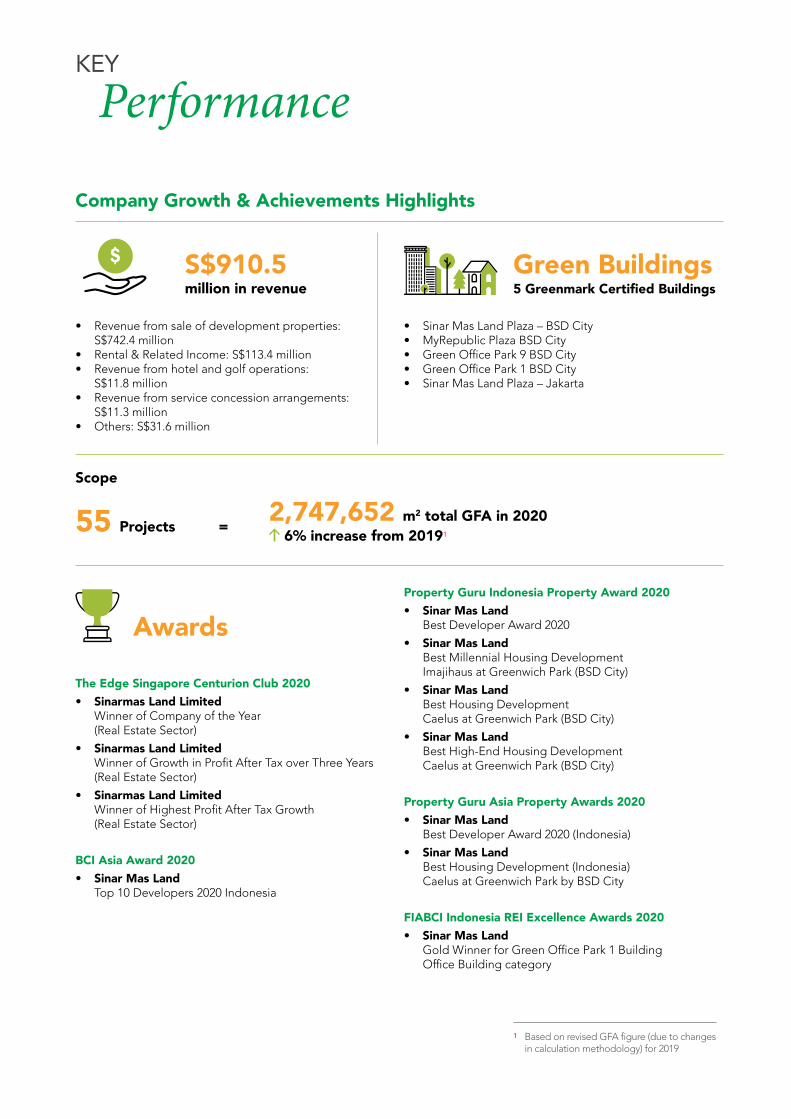
Company Growth & Achievements Highlights
• Revenue from sale of development properties: S$742.4 million
• Rental & Related Income: S$113.4 million• Revenue from hotel and golf operations:
S$11.8 million• Revenue from service concession arrangements:
S$11.3 million• Others: S$31.6 million
The Edge Singapore Centurion Club 2020• Sinarmas Land Limited
Winner of Company of the Year (Real Estate Sector)
• Sinarmas Land Limited Winner of Growth in Profit After Tax over Three Years (Real Estate Sector)
• Sinarmas Land Limited Winner of Highest Profit After Tax Growth (Real Estate Sector)
BCI Asia Award 2020• Sinar Mas Land
Top 10 Developers 2020 Indonesia
• Sinar Mas Land Plaza – BSD City• MyRepublic Plaza BSD City • Green Office Park 9 BSD City• Green Office Park 1 BSD City• Sinar Mas Land Plaza – Jakarta
S$910.5 million in revenue
Scope
Awards
55 Projects =2,747,652 m2 total GFA in 2020
6% increase from 20191
Green Buildings 5 Greenmark Certified Buildings
Property Guru Indonesia Property Award 2020• Sinar Mas Land
Best Developer Award 2020
• Sinar Mas Land Best Millennial Housing Development Imajihaus at Greenwich Park (BSD City)
• Sinar Mas Land Best Housing Development Caelus at Greenwich Park (BSD City)
• Sinar Mas Land Best High-End Housing Development Caelus at Greenwich Park (BSD City)
Property Guru Asia Property Awards 2020• Sinar Mas Land
Best Developer Award 2020 (Indonesia)
• Sinar Mas Land Best Housing Development (Indonesia) Caelus at Greenwich Park by BSD City
FIABCI Indonesia REI Excellence Awards 2020• Sinar Mas Land
Gold Winner for Green Office Park 1 Building Office Building category
1 Based on revised GFA figure (due to changes in calculation methodology) for 2019
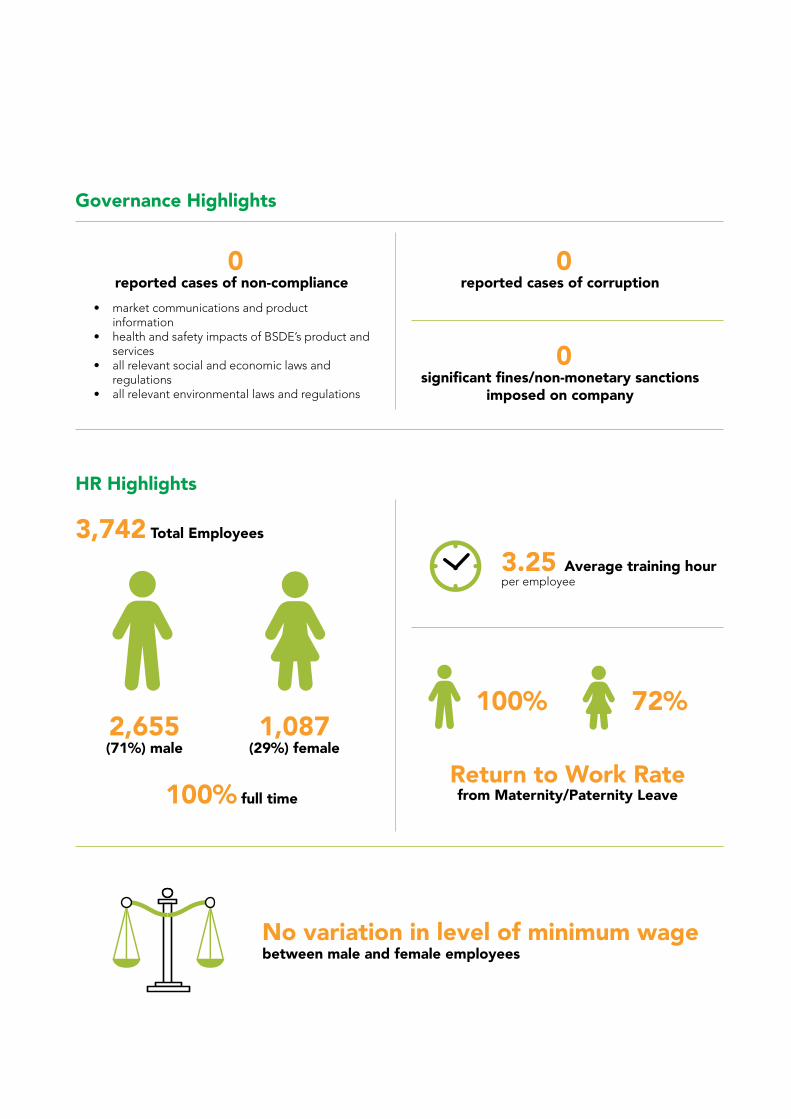
Governance Highlights
HR Highlights
• market communications and product information
• health and safety impacts of BSDE’s product and services
• all relevant social and economic laws and regulations
• all relevant environmental laws and regulations
0 reported cases of non-compliance
3,742 Total Employees
100% full time
2,655 (71%) male
72% 100% 1,087
(29%) female
3.25 Average training hour per employee
No variation in level of minimum wage between male and female employees
Return to Work Rate from Maternity/Paternity Leave
0 reported cases of corruption
0 significant fines/non-monetary sanctions
imposed on company
Building for a Better Future04
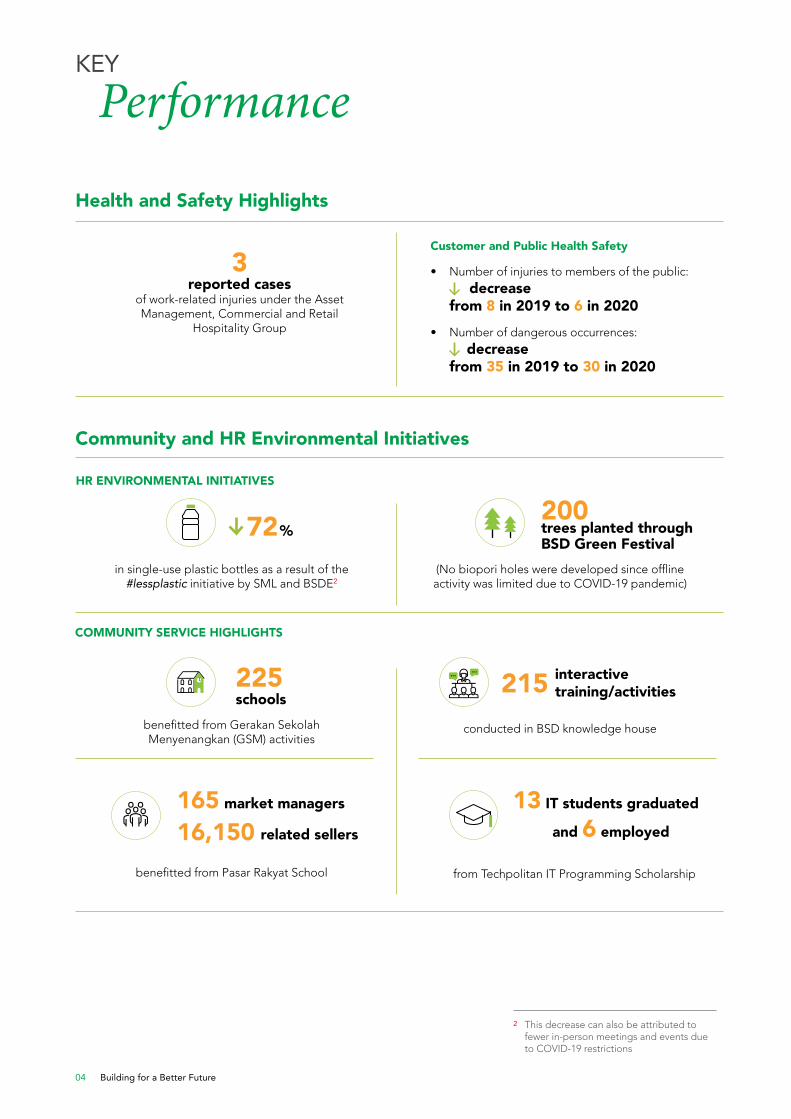
Community and HR Environmental Initiatives
(No biopori holes were developed since offline activity was limited due to COVID-19 pandemic)
conducted in BSD knowledge house
from Techpolitan IT Programming Scholarship
HR ENVIRONMENTAL INITIATIVES
COMMUNITY SERVICE HIGHLIGHTS
in single-use plastic bottles as a result of the #lessplastic initiative by SML and BSDE2
benefitted from Gerakan Sekolah Menyenangkan (GSM) activities
benefitted from Pasar Rakyat School
Health and Safety Highlights
• Number of injuries to members of the public: decrease
from 8 in 2019 to 6 in 2020• Number of dangerous occurrences:
decrease from 35 in 2019 to 30 in 2020
3 reported cases
of work-related injuries under the Asset Management, Commercial and Retail
Hospitality Group
Customer and Public Health Safety
2 This decrease can also be attributed to fewer in-person meetings and events due to COVID-19 restrictions
KEY
Performance
72% 200 trees planted through BSD Green Festival
225 schools
215 interactive training/activities
165 market managers
16,150 related sellers
13 IT students graduated
and 6 employed
Sinarmas Land Limited Sustainability Report 2020 05
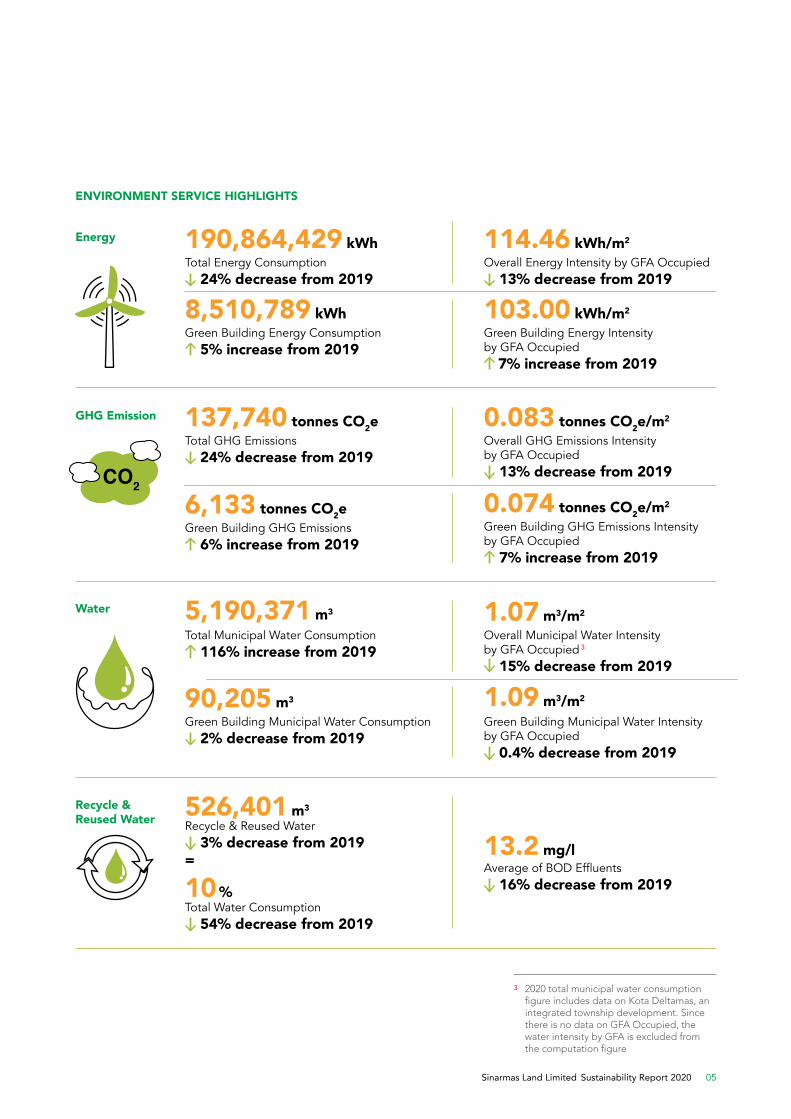
Total GHG Emissions 24% decrease from 2019
137,740 tonnes CO2e
Total Municipal Water Consumption 116% increase from 2019
5,190,371 m3
Overall GHG Emissions Intensity by GFA Occupied
13% decrease from 2019
0.083 tonnes CO2e/m2
Overall Municipal Water Intensity by GFA Occupied 3
15% decrease from 2019
1.07 m3/m2
Green Building Energy Consumption 5% increase from 2019
8,510,789 kWh
Green Building GHG Emissions 6% increase from 2019
6,133 tonnes CO2e
Green Building Municipal Water Consumption 2% decrease from 2019
90,205 m3
Green Building Energy Intensity by GFA Occupied
7% increase from 2019
103.00 kWh/m2
Green Building GHG Emissions Intensity by GFA Occupied
7% increase from 2019
0.074 tonnes CO2e/m2
Green Building Municipal Water Intensity by GFA Occupied
0.4% decrease from 2019
1.09 m3/m2
ENVIRONMENT SERVICE HIGHLIGHTS
Energy
GHG Emission
Water
Average of BOD Effluents 16% decrease from 2019
526,401 m3
Recycle & Reused Water 3% decrease from 2019
=
10%Total Water Consumption
54% decrease from 2019
13.2 mg/l
Recycle & Reused Water
3 2020 total municipal water consumption figure includes data on Kota Deltamas, an integrated township development. Since there is no data on GFA Occupied, the water intensity by GFA is excluded from the computation figure
Total Energy Consumption 24% decrease from 2019
190,864,429 kWhOverall Energy Intensity by GFA Occupied
13% decrease from 2019
114.46 kWh/m2

Building for a Better Future06
Contents
02 KEY PERFORMANCE
08 ABOUT SINARMAS LAND
10 CHAIRMAN AND CEO STATEMENT 12 ABOUT THE REPORT Scope Expansion Board Statement
14 OUR APPROACH Sinarmas Land’s Sustainability Vision Governance & Risk Management Materiality and Stakeholder Engagement Stakeholder Engagement Material Sustainability Topics 2020
21 BEST IN CLASS REAL ESTATE Providing Excellent Facilities and Services Attention to Customers and Occupational Health and Safety Setting Programs to Achieve Sustainable Development Compliance to All Related Regulatory Requirements
31 CLIMATE CHANGE & THE ENVIRONMENT Optimising Building Operation to Achieve Clean Environment Providing and Facilitating Various Type of Public Transportation Providing and Maintaining Green Open Space Responsible Waste Management Program
41 SUSTAINABLE COMMUNITY Engagement Program for All Stakeholders Improving Community Welfare in Surrounding Development Area
45 EDUCATIONAL PATRONAGE Initiating Programs to Support Knowledge Enhancement Improving Educational Method and Facility
48 APPENDIX A: NOTES FOR SUSTAINABILITY PERFORMANCE DATA
54 APPENDIX B: GRI CONTENT INDEX
Sinarmas Land Limited Sustainability Report 2020 07
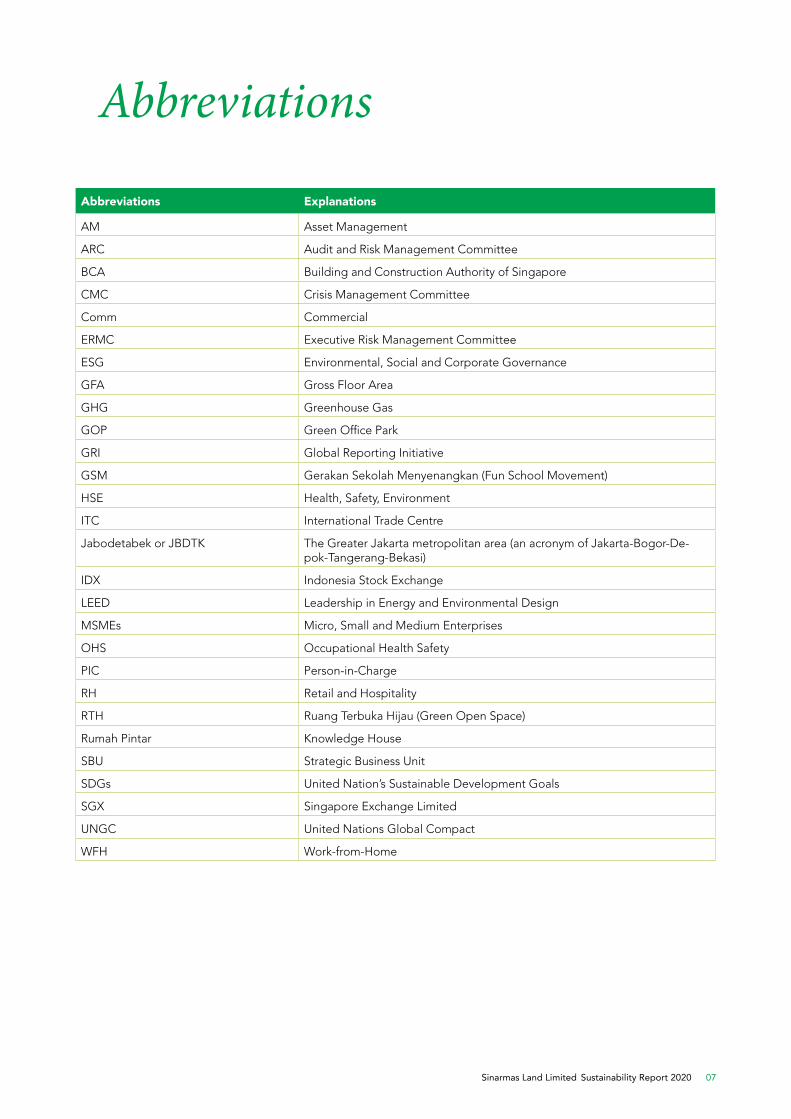
Abbreviations
Abbreviations Explanations
AM Asset Management
ARC Audit and Risk Management Committee
BCA Building and Construction Authority of Singapore
CMC Crisis Management Committee
Comm Commercial
ERMC Executive Risk Management Committee
ESG Environmental, Social and Corporate Governance
GFA Gross Floor Area
GHG Greenhouse Gas
GOP Green Office Park
GRI Global Reporting Initiative
GSM Gerakan Sekolah Menyenangkan (Fun School Movement)
HSE Health, Safety, Environment
ITC International Trade Centre
Jabodetabek or JBDTK The Greater Jakarta metropolitan area (an acronym of Jakarta-Bogor-De-pok-Tangerang-Bekasi)
IDX Indonesia Stock Exchange
LEED Leadership in Energy and Environmental Design
MSMEs Micro, Small and Medium Enterprises
OHS Occupational Health Safety
PIC Person-in-Charge
RH Retail and Hospitality
RTH Ruang Terbuka Hijau (Green Open Space)
Rumah Pintar Knowledge House
SBU Strategic Business Unit
SDGs United Nation’s Sustainable Development Goals
SGX Singapore Exchange Limited
UNGC United Nations Global Compact
WFH Work-from-Home
Building for a Better Future08
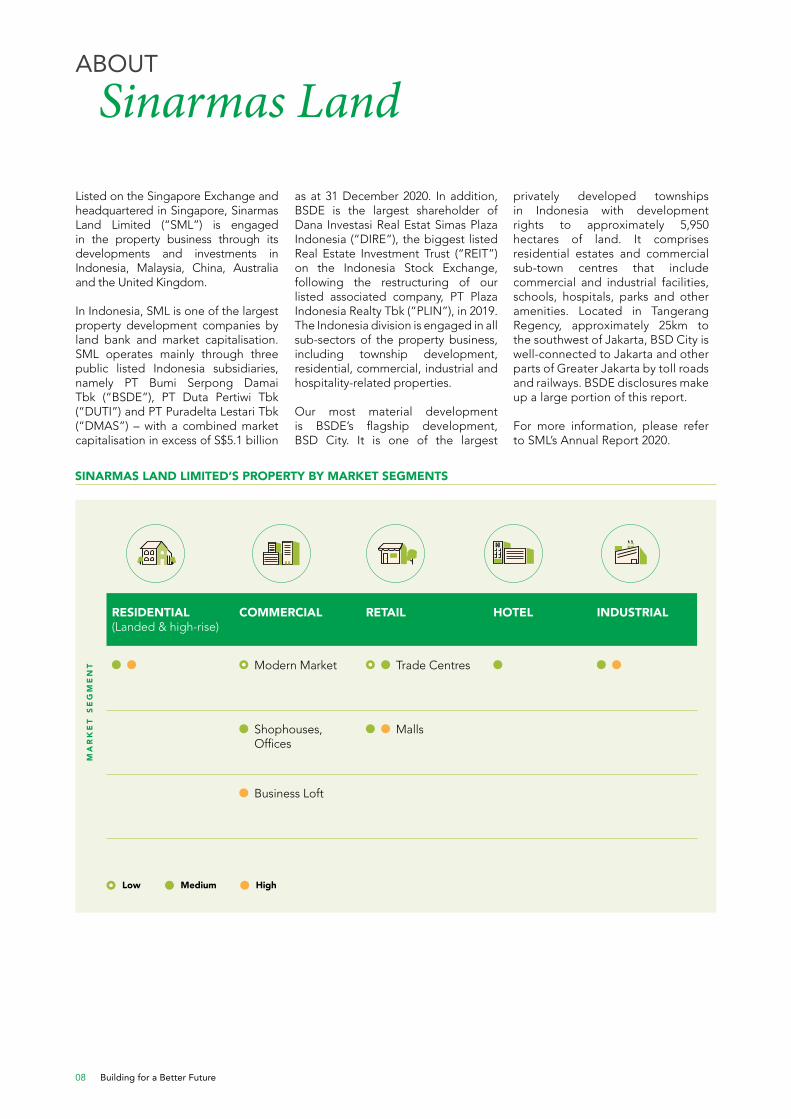
ABOUT
Sinarmas Land
Listed on the Singapore Exchange and headquartered in Singapore, Sinarmas Land Limited (“SML”) is engaged in the property business through its developments and investments in Indonesia, Malaysia, China, Australia and the United Kingdom.
In Indonesia, SML is one of the largest property development companies by land bank and market capitalisation. SML operates mainly through three public listed Indonesia subsidiaries, namely PT Bumi Serpong Damai Tbk (“BSDE”), PT Duta Pertiwi Tbk (“DUTI”) and PT Puradelta Lestari Tbk (“DMAS”) – with a combined market capitalisation in excess of S$5.1 billion
as at 31 December 2020. In addition, BSDE is the largest shareholder of Dana Investasi Real Estat Simas Plaza Indonesia (“DIRE”), the biggest listed Real Estate Investment Trust (“REIT”) on the Indonesia Stock Exchange, following the restructuring of our listed associated company, PT Plaza Indonesia Realty Tbk (“PLIN”), in 2019. The Indonesia division is engaged in all sub-sectors of the property business, including township development, residential, commercial, industrial and hospitality-related properties.
Our most material development is BSDE’s flagship development, BSD City. It is one of the largest
RESIDENTIAL (Landed & high-rise)
COMMERCIAL RETAIL HOTEL INDUSTRIAL
Modern Market Trade Centres
Shophouses, Offices
Malls
Business Loft
SINARMAS LAND LIMITED’S PROPERTY BY MARKET SEGMENTS
privately developed townships in Indonesia with development rights to approximately 5,950 hectares of land. It comprises residential estates and commercial sub-town centres that include commercial and industrial facilities, schools, hospitals, parks and other amenities. Located in Tangerang Regency, approximately 25km to the southwest of Jakarta, BSD City is well-connected to Jakarta and other parts of Greater Jakarta by toll roads and railways. BSDE disclosures make up a large portion of this report.
For more information, please refer to SML’s Annual Report 2020.
MA
RK
ET
SE
GM
EN
T
Medium HighLow
Sinarmas Land Limited Sustainability Report 2020 09
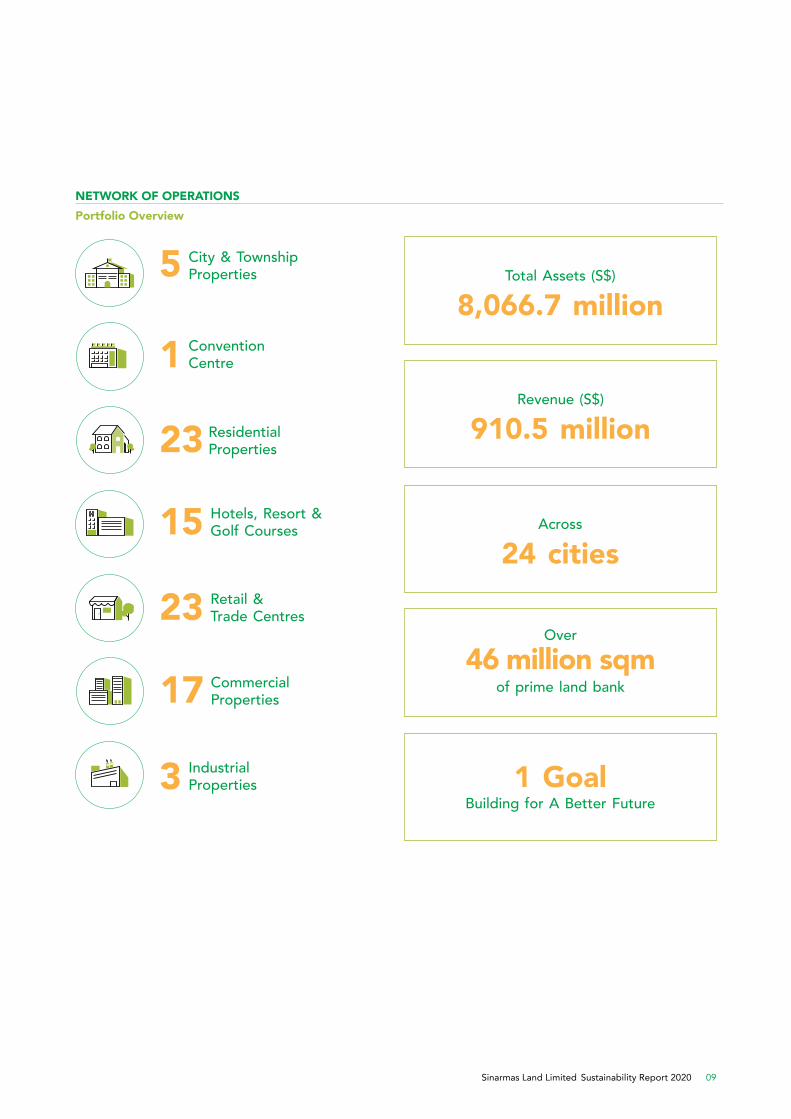
City & TownshipProperties5
NETWORK OF OPERATIONSPortfolio Overview
Hotels, Resort &Golf Courses15
ConventionCentre1
Retail &Trade Centres23
ResidentialProperties23
CommercialProperties17
IndustrialProperties3
Total Assets (S$)
8,066.7 million
Across
24 cities
1 GoalBuilding for A Better Future
Revenue (S$)
910.5 million
Over
46 million sqmof prime land bank

Building for a Better Future10
CHAIRMAN AND
CEO Statement
In 2020, the business world was caught off-guard by the level of upheaval and disruption the COVID-19 health crisis brought. As repercussions from the pandemic continue to unfold, they serve as a reminder to always expect the unexpected. Sinarmas Land Limited (“SML” or “the Company”) and its subsidiaries (collectively “the Group”), along with the rest of the business communities, found ourselves needing to reassess our plans and priorities as the impacts of COVID-19 were unveiled.
Like many other industries, the real estate industry was negatively impacted in multiple different ways. Substantial changes were made to previously busy workplaces and crowded retail locations to make them safe and regulatory compliant, resulting in an extended period of low human traffic and decreasing recurring income. On the flip side, people realised that residential dwellings had become more than just a place
Dear Valued Stakeholders,
to live. As governments worldwide announced different form of lock-down and social restriction measures, the normalising of working from home arrangement had led many to expand and transform their residential spaces.
COMBATING THE PANDEMIC TOGETHER
As one of the largest real estate developers in Indonesia, we adopt a nimble and reactive business model that allows us to respond rapidly and efficiently to any unexpected circumstances or changes. Upon receiving news that the COVID-19 virus had reached Indonesia, our Crisis Management Committee (“CMC”) immediately galvanised the COVID-19 response task force and began integrating action plans with inputs from all business units. The safety of our key stakeholders such as employees, tenant, customers, governments and communities took priority in these plans.
Since then, the Group has initiated and undertaken many preventive and precautionary measures to curb the spread of the virus. Other than issuing health kits that consist of surgical masks, face shields and gloves to every employee, our employees were also instructed to adopt a flexible work-from-home arrangement, replace physical meetings with web-based conferencing platforms and practice social distancing. The physical office area and workstations were thoroughly sanitised regularly. In addition, we conducted routine COVID-19 screening tests for our employees working in the front line and for those that commute via public transport. Property managers were tasked with ensuring our premises remained accessible and open to tenants and customers, with minimal disruption, through safety measures such as mandatory temperature scanning via thermal scanner, adhering to safe
FRANKY OESMAN WIDJAJAExecutive Chairman
MUKTAR WIDJAJAExecutive Director and Chief Executive Officer
Sinarmas Land Limited Sustainability Report 2020 11
social distancing, provision of hand sanitisers, tracking procedures and distribution of information. To render assistance to the local government and surrounding communities, the Group donated COVID-19 rapid test kits, personal protective equipment, surgical masks, face shields, thermometer guns and portable handwash facilities. Also, the Group handed out food and supplement to people that suffered from economic hardship due to the pandemic, as well as gift hampers to COVID-19 patients and healthcare professionals who worked tirelessly during this challenging period.
REASSURANCE OF OUR SUSTAINABILITY COMMITMENT
The happenings of 2020 have further reaffirmed our commitment to continue investing towards our sustainability vision. Developed in 2017, SML’s Sustainability Vision is based on four foundation pillars, being “Best in Class Real Estate”, “Climate Change & The Environment”, “Sustainable Community”, and “Educational Patronage”. These pillars are mapped to the relevant United Nation’s Sustainable Development Goals (“SDGs”) with details spelt out later in this report.
This is SML’s fourth sustainability report and serves as an important tool to measure, manage and communicate our sustainability performance to every stakeholder. As sustainability disclosure continues to increase in prominence globally, we aim for consistent improvement, transparent disclosure and expansion of scope by aligning with international and national guidelines such as the Global Reporting Initiative (“GRI”) Standards and the 2016 SGX Sustainability Reporting Guide.
This year, we have expanded the scope by including landed houses to the existing disclosed buildings and projects within BSD City and the Jabodetabek area. Following the expansion, our gross floor area (“GFA”)
and GFA Occupied covered in this report have changed by 6% and -12% to 2.75 million m2 and 1.67 million m2 respectively. The increase in GFA is in line with SML’s disclosure roadmap that outlines our sustainability reporting scope expansion progress and future scope expansion targets. Through this roadmap, we target to cover the entire Indonesia operations and properties by 2021 and internationally by 2022.
Other than expanding our scope, we conducted a materiality review in 2020 to reassess if our existing focus areas and topics were still relevant to us. This review was completed even though we did not conduct a large-scale materiality assessment similar to that of 2019 where we engaged our stakeholders through various focus group discussions and surveys. The result from 2020 materiality review highlighted that due to the ongoing COVID-19 pandemic, most of our stakeholders’ concerns were focused towards health and safety, hereby validating that our four foundation pillars continue to remain relevant.
Upon understanding the needs of our stakeholders, we placed more emphasis on their safety and well-being. Hence, we are glad to report that there were no severe health and safety incidents involving our staff, customers and tenants. Also, the well-being and progress of the local communities within and surrounding our developments are key to SML’s sustained prosperity and success. Because of that, we continue to
make strategic investments into local infrastructure and participate in community engagements and development initiatives across our operating areas. As a founding corporate member at Green Building Council Indonesia, SML is committed to embed sustainable development into our core business strategy, specifically through incorporating “Green” building design and technological innovation in our products while continuing to be profitable. These initiatives and efforts have been recognised in Indonesia and internationally.
APPRECIATION
As COVID-19 ravages the lives of millions around the world, many healthcare workers and other frontline essential workers risk their lives to ensure that we are well-taken care of during this difficult period. We would like to salute all frontline medical and essential workers for their dedication and services while extending our sympathies to those that have lost their lives or livelihoods. In addition, we are thankful to all stakeholders for their unwavering trust and support.
Moving forward, 2021 will present numerous opportunities to re-evaluate our operations and initiatives in response to the COVID-19 situation and our stakeholders’ needs. We are excited to continue finding ways to work with you to create greater economic, environmental and social value for Indonesia and beyond.
FRANKY OESMAN WIDJAJAExecutive Chairman
MUKTAR WIDJAJAExecutive Director and Chief Executive Officer
Building for a Better Future12
ABOUT
the Report
This report covers the period from 1 January 2020 to 31 December 2020 (“FY2020”) and shall review all aspects of our sustainability work and performance for FY2020, starting with materiality and stakeholder engagement, followed by discussion of our performance, practices and initiatives within each of Sinarmas Land’s four foundation pillars. We continue to report in line with the GRI standards and the SGX listing requirements. We are of the opinion that GRI remains the most relevant and internationally recognised framework, allowing us to contribute
additional comparative information to the sustainability community. In addition, GRI standards help us to ensure the accuracy, reliability, clarity, and comparability of the information presented in this report.
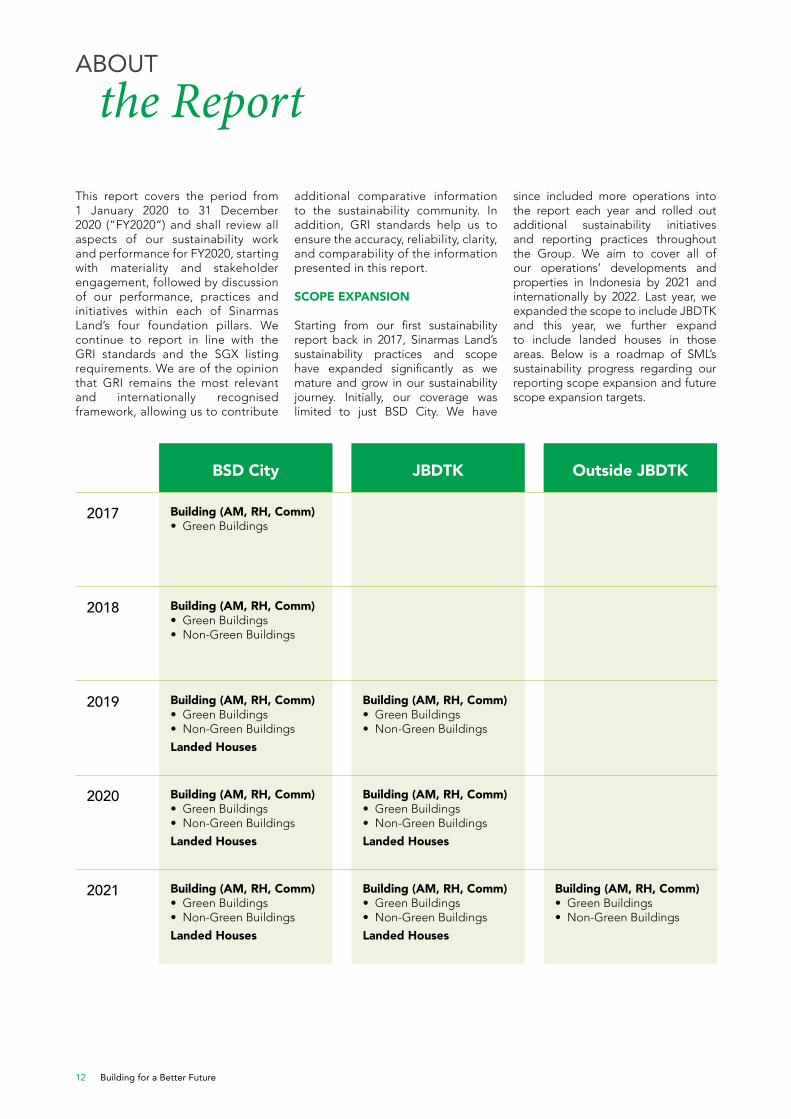
SCOPE EXPANSION
Starting from our first sustainability report back in 2017, Sinarmas Land’s sustainability practices and scope have expanded significantly as we mature and grow in our sustainability journey. Initially, our coverage was limited to just BSD City. We have
since included more operations into the report each year and rolled out additional sustainability initiatives and reporting practices throughout the Group. We aim to cover all of our operations’ developments and properties in Indonesia by 2021 and internationally by 2022. Last year, we expanded the scope to include JBDTK and this year, we further expand to include landed houses in those areas. Below is a roadmap of SML’s sustainability progress regarding our reporting scope expansion and future scope expansion targets.
BSD City JBDTK Outside JBDTK
2017 Building (AM, RH, Comm)• Green Buildings
2018 Building (AM, RH, Comm)• Green Buildings• Non-Green Buildings
2019 Building (AM, RH, Comm)• Green Buildings• Non-Green Buildings
Landed Houses
Building (AM, RH, Comm)• Green Buildings• Non-Green Buildings
2020 Building (AM, RH, Comm)• Green Buildings• Non-Green Buildings
Landed Houses
Building (AM, RH, Comm)• Green Buildings• Non-Green Buildings
Landed Houses
2021 Building (AM, RH, Comm)• Green Buildings• Non-Green Buildings
Landed Houses
Building (AM, RH, Comm)• Green Buildings• Non-Green Buildings
Landed Houses
Building (AM, RH, Comm)• Green Buildings• Non-Green Buildings
Sinarmas Land Limited Sustainability Report 2020 13
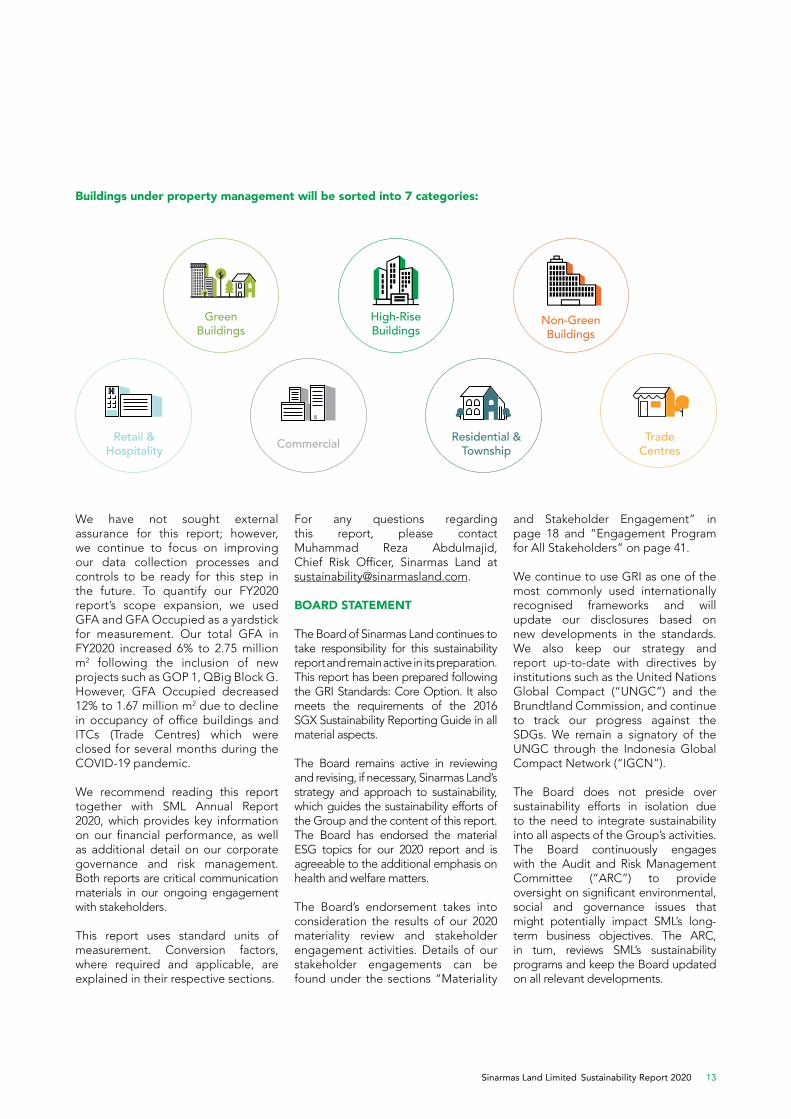
Retail & Hospitality
Trade Centres
Residential & TownshipCommercial
High-Rise Buildings
Non-Green Buildings
Green Buildings
Buildings under property management will be sorted into 7 categories:
We have not sought external assurance for this report; however, we continue to focus on improving our data collection processes and controls to be ready for this step in the future. To quantify our FY2020 report’s scope expansion, we used GFA and GFA Occupied as a yardstick for measurement. Our total GFA in FY2020 increased 6% to 2.75 million m2 following the inclusion of new projects such as GOP 1, QBig Block G. However, GFA Occupied decreased 12% to 1.67 million m2 due to decline in occupancy of office buildings and ITCs (Trade Centres) which were closed for several months during the COVID-19 pandemic.
We recommend reading this report together with SML Annual Report 2020, which provides key information on our financial performance, as well as additional detail on our corporate governance and risk management. Both reports are critical communication materials in our ongoing engagement with stakeholders.
This report uses standard units of measurement. Conversion factors, where required and applicable, are explained in their respective sections.
For any questions regarding this report, please contact Muhammad Reza Abdulmajid, Chief Risk Officer, Sinarmas Land at [email protected].
BOARD STATEMENT
The Board of Sinarmas Land continues to take responsibility for this sustainability report and remain active in its preparation. This report has been prepared following the GRI Standards: Core Option. It also meets the requirements of the 2016 SGX Sustainability Reporting Guide in all material aspects.
The Board remains active in reviewing and revising, if necessary, Sinarmas Land’s strategy and approach to sustainability, which guides the sustainability efforts of the Group and the content of this report. The Board has endorsed the material ESG topics for our 2020 report and is agreeable to the additional emphasis on health and welfare matters.
The Board’s endorsement takes into consideration the results of our 2020 materiality review and stakeholder engagement activities. Details of our stakeholder engagements can be found under the sections “Materiality
and Stakeholder Engagement” in page 18 and “Engagement Program for All Stakeholders” on page 41.
We continue to use GRI as one of the most commonly used internationally recognised frameworks and will update our disclosures based on new developments in the standards. We also keep our strategy and report up-to-date with directives by institutions such as the United Nations Global Compact (“UNGC”) and the Brundtland Commission, and continue to track our progress against the SDGs. We remain a signatory of the UNGC through the Indonesia Global Compact Network (“IGCN”).
The Board does not preside over sustainability efforts in isolation due to the need to integrate sustainability into all aspects of the Group’s activities. The Board continuously engages with the Audit and Risk Management Committee (“ARC”) to provide oversight on significant environmental, social and governance issues that might potentially impact SML’s long-term business objectives. The ARC, in turn, reviews SML’s sustainability programs and keep the Board updated on all relevant developments.
Building for a Better Future14
OUR
Approach
IN THIS SECTION
Sinarmas Land has invested significant amount of time and effort towards our sustainability practices in the belief that it is our responsibility to do the right thing for our stakeholders and the environment. This section details Sinarmas Land’s sustainability vision and approach and how that aligns with our core values. We also describe our sustainability governance structure and how we conducted our materiality review and stakeholder engagement in 2020.
BEST IN CLASS REAL ESTATE
Our Best in Class Real Estate pillar is the top priority for Sinarmas Land. We believe that by providing state-of-the-art facilities and services of the highest quality, we are able to create value for our business, stakeholders and communities. Our developments and properties provide safe, accessible and convenient spaces that allow people who use them to live, work and play in comfort, thereby contributing to the positive socio-economic environment in areas that we operate. In particular,
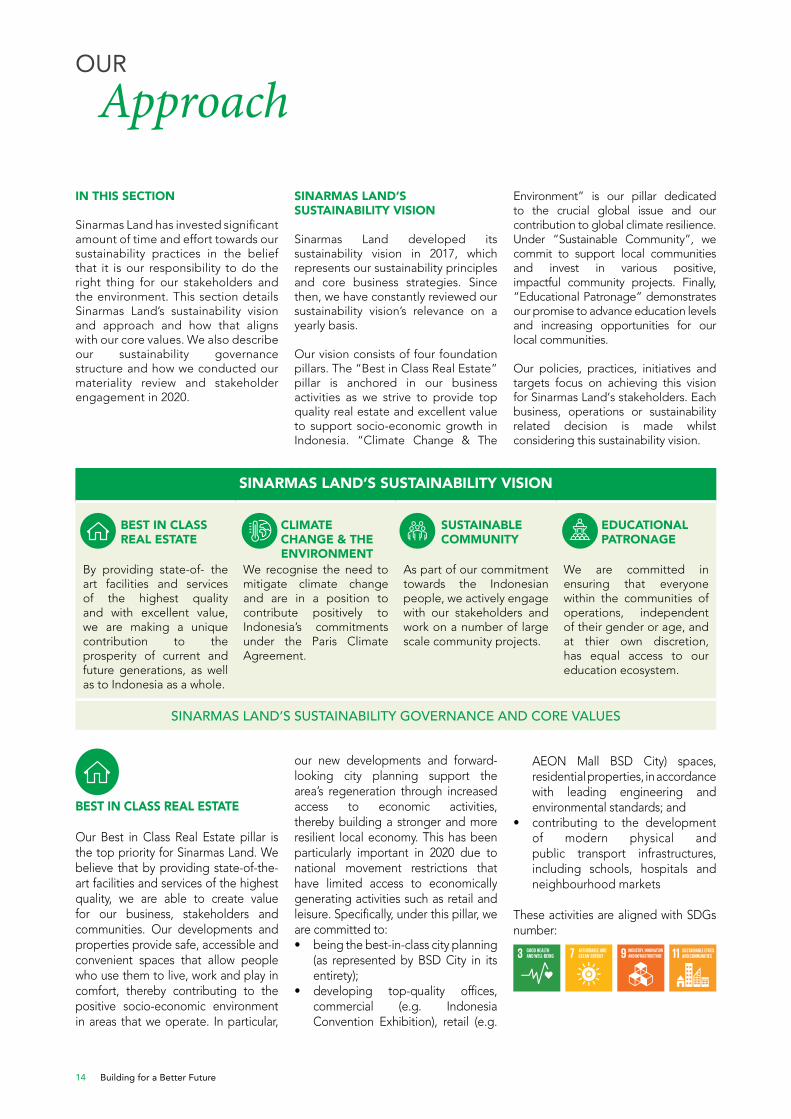
SINARMAS LAND’S SUSTAINABILITY VISION
Sinarmas Land developed its sustainability vision in 2017, which represents our sustainability principles and core business strategies. Since then, we have constantly reviewed our sustainability vision’s relevance on a yearly basis.
Our vision consists of four foundation pillars. The “Best in Class Real Estate” pillar is anchored in our business activities as we strive to provide top quality real estate and excellent value to support socio-economic growth in Indonesia. “Climate Change & The
our new developments and forward-looking city planning support the area’s regeneration through increased access to economic activities, thereby building a stronger and more resilient local economy. This has been particularly important in 2020 due to national movement restrictions that have limited access to economically generating activities such as retail and leisure. Specifically, under this pillar, we are committed to:• being the best-in-class city planning
(as represented by BSD City in its entirety);
• developing top-quality offices, commercial (e.g. Indonesia Convention Exhibition), retail (e.g.
Environment” is our pillar dedicated to the crucial global issue and our contribution to global climate resilience. Under “Sustainable Community”, we commit to support local communities and invest in various positive, impactful community projects. Finally, “Educational Patronage” demonstrates our promise to advance education levels and increasing opportunities for our local communities.
Our policies, practices, initiatives and targets focus on achieving this vision for Sinarmas Land‘s stakeholders. Each business, operations or sustainability related decision is made whilst considering this sustainability vision.
AEON Mall BSD City) spaces, residential properties, in accordance with leading engineering and environmental standards; and
• contributing to the development of modern physical and public transport infrastructures, including schools, hospitals and neighbourhood markets
These activities are aligned with SDGs number:
SINARMAS LAND’S SUSTAINABILITY VISION
BEST IN CLASS REAL ESTATE
CLIMATE CHANGE & THE ENVIRONMENT
SUSTAINABLE COMMUNITY
EDUCATIONAL PATRONAGE
By providing state-of- the art facilities and services of the highest quality and with excellent value, we are making a unique contribution to the prosperity of current and future generations, as well as to Indonesia as a whole.
We recognise the need to mitigate climate change and are in a position to contribute positively to Indonesia’s commitments under the Paris Climate Agreement.
As part of our commitment towards the Indonesian people, we actively engage with our stakeholders and work on a number of large scale community projects.
We are committed in ensuring that everyone within the communities of operations, independent of their gender or age, and at thier own discretion, has equal access to our education ecosystem.
SINARMAS LAND’S SUSTAINABILITY GOVERNANCE AND CORE VALUES
Sinarmas Land Limited Sustainability Report 2020 15
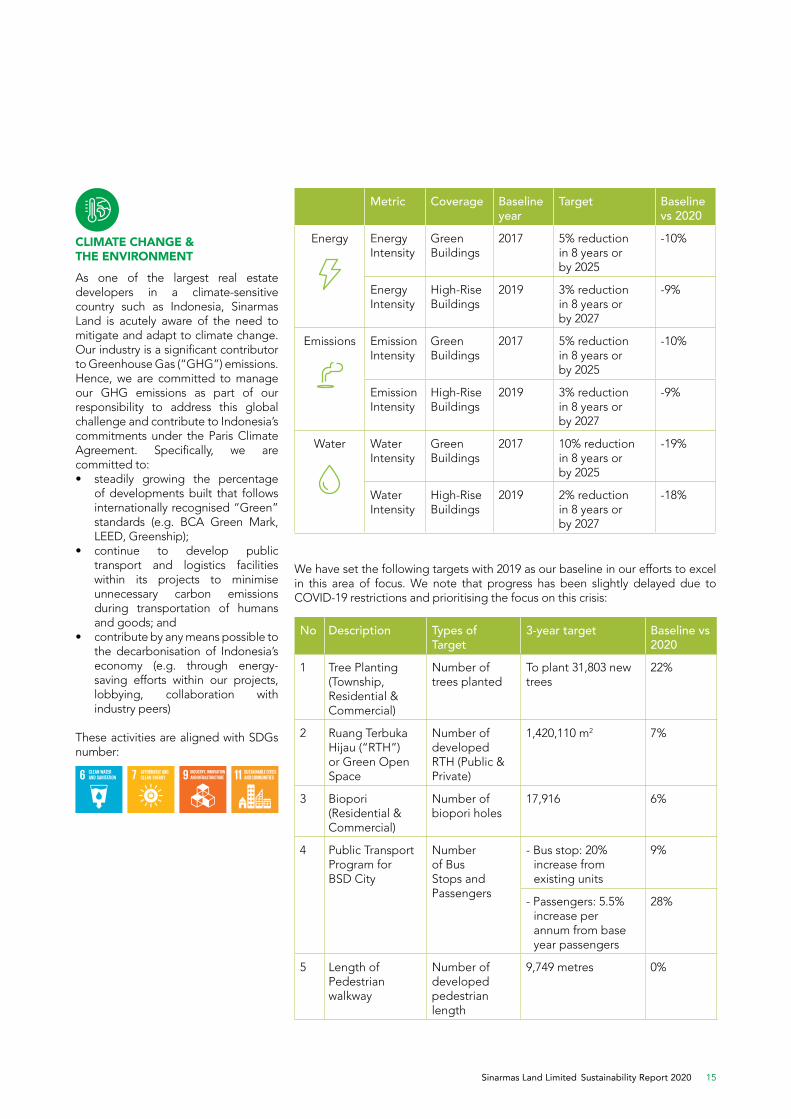
As one of the largest real estate developers in a climate-sensitive country such as Indonesia, Sinarmas Land is acutely aware of the need to mitigate and adapt to climate change. Our industry is a significant contributor to Greenhouse Gas (“GHG”) emissions. Hence, we are committed to manage our GHG emissions as part of our responsibility to address this global challenge and contribute to Indonesia’s commitments under the Paris Climate Agreement. Specifically, we are committed to:• steadily growing the percentage
of developments built that follows internationally recognised “Green” standards (e.g. BCA Green Mark, LEED, Greenship);
• continue to develop public transport and logistics facilities within its projects to minimise unnecessary carbon emissions during transportation of humans and goods; and
• contribute by any means possible to the decarbonisation of Indonesia’s economy (e.g. through energy-saving efforts within our projects, lobbying, collaboration with industry peers)
These activities are aligned with SDGs number:
CLIMATE CHANGE & THE ENVIRONMENT
Metric Coverage Baseline year
Target Baseline vs 2020
Energy
Energy Intensity
Green Buildings
2017 5% reduction in 8 years or by 2025
-10%
Energy Intensity
High-Rise Buildings
2019 3% reduction in 8 years or by 2027
-9%
Emissions
Emission Intensity
Green Buildings
2017 5% reduction in 8 years or by 2025
-10%
Emission Intensity
High-Rise Buildings
2019 3% reduction in 8 years or by 2027
-9%
Water
Water Intensity
Green Buildings
2017 10% reduction in 8 years or by 2025
-19%
Water Intensity
High-Rise Buildings
2019 2% reduction in 8 years or by 2027
-18%
No Description Types of Target
3-year target Baseline vs 2020
1 Tree Planting (Township, Residential & Commercial)
Number of trees planted
To plant 31,803 new trees
22%
2 Ruang Terbuka Hijau (“RTH”) or Green Open Space
Number of developed RTH (Public & Private)
1,420,110 m2 7%
3 Biopori (Residential & Commercial)
Number of biopori holes
17,916 6%
4 Public Transport Program for BSD City
Number of Bus Stops and Passengers
- Bus stop: 20% increase from existing units
9%
- Passengers: 5.5% increase per annum from base year passengers
28%
5 Length of Pedestrian walkway
Number of developed pedestrian length
9,749 metres 0%
We have set the following targets with 2019 as our baseline in our efforts to excel in this area of focus. We note that progress has been slightly delayed due to COVID-19 restrictions and prioritising the focus on this crisis:
Building for a Better Future16
OUR
Approach
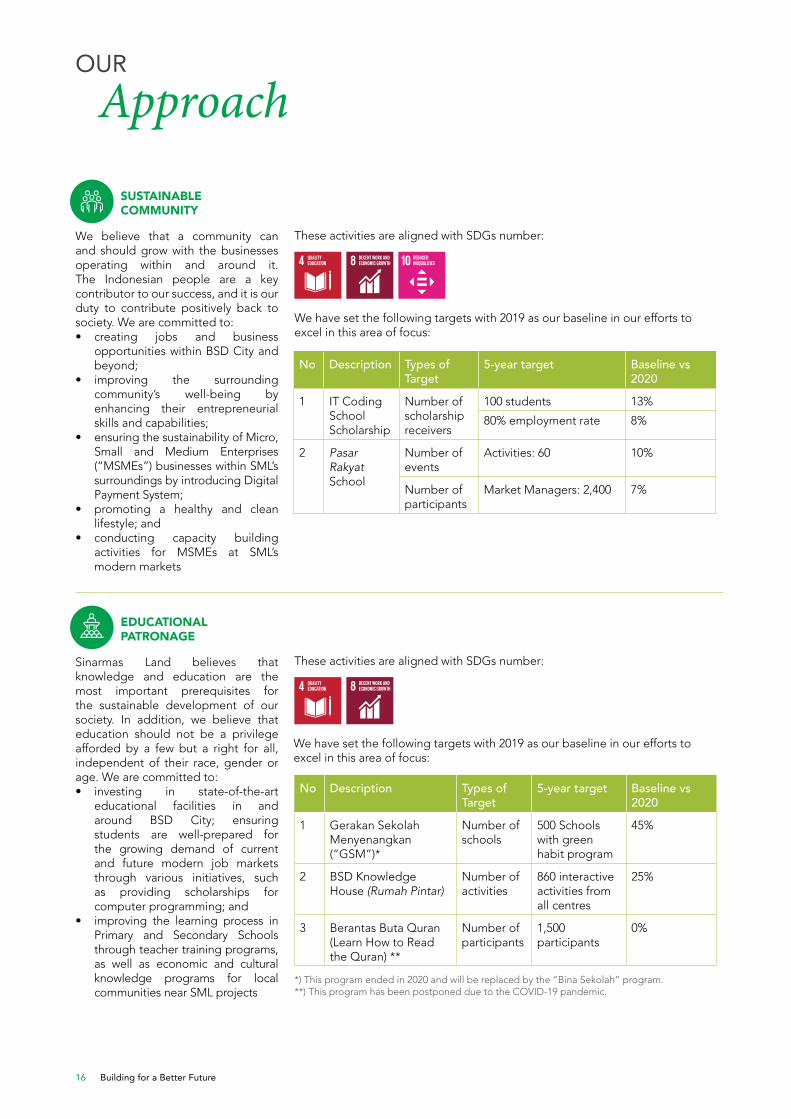
SUSTAINABLE COMMUNITY
We believe that a community can and should grow with the businesses operating within and around it. The Indonesian people are a key contributor to our success, and it is our duty to contribute positively back to society. We are committed to:• creating jobs and business
opportunities within BSD City and beyond;
• improving the surrounding community’s well-being by enhancing their entrepreneurial skills and capabilities;
• ensuring the sustainability of Micro, Small and Medium Enterprises (“MSMEs”) businesses within SML’s surroundings by introducing Digital Payment System;
• promoting a healthy and clean lifestyle; and
• conducting capacity building activities for MSMEs at SML’s modern markets
EDUCATIONAL PATRONAGE
Sinarmas Land believes that knowledge and education are the most important prerequisites for the sustainable development of our society. In addition, we believe that education should not be a privilege afforded by a few but a right for all, independent of their race, gender or age. We are committed to:• investing in state-of-the-art
educational facilities in and around BSD City; ensuring students are well-prepared for the growing demand of current and future modern job markets through various initiatives, such as providing scholarships for computer programming; and
• improving the learning process in Primary and Secondary Schools through teacher training programs, as well as economic and cultural knowledge programs for local communities near SML projects
These activities are aligned with SDGs number:
No Description Types of Target
5-year target Baseline vs 2020
1 IT Coding School Scholarship
Number of scholarship receivers
100 students 13%
80% employment rate 8%
2 Pasar Rakyat School
Number of events
Activities: 60 10%
Number of participants
Market Managers: 2,400 7%
No Description Types of Target
5-year target Baseline vs 2020
1 Gerakan Sekolah Menyenangkan (“GSM”)*
Number of schools
500 Schools with green habit program
45%
2 BSD Knowledge House (Rumah Pintar)
Number of activities
860 interactive activities from all centres
25%
3 Berantas Buta Quran (Learn How to Read the Quran) **
Number of participants
1,500 participants
0%
*) This program ended in 2020 and will be replaced by the “Bina Sekolah” program.**) This program has been postponed due to the COVID-19 pandemic.
These activities are aligned with SDGs number:
We have set the following targets with 2019 as our baseline in our efforts to excel in this area of focus:
We have set the following targets with 2019 as our baseline in our efforts to excel in this area of focus:
Sinarmas Land Limited Sustainability Report 2020 17
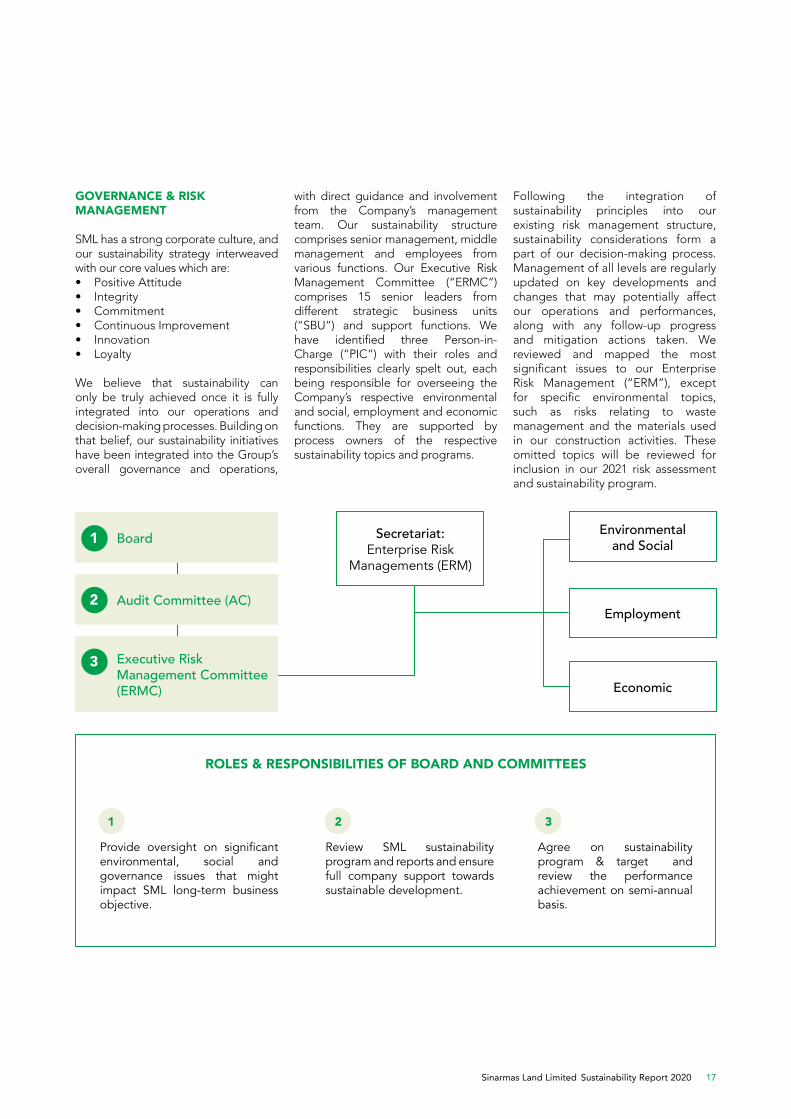
GOVERNANCE & RISK MANAGEMENT
SML has a strong corporate culture, and our sustainability strategy interweaved with our core values which are:• Positive Attitude• Integrity• Commitment• Continuous Improvement• Innovation• Loyalty
We believe that sustainability can only be truly achieved once it is fully integrated into our operations and decision-making processes. Building on that belief, our sustainability initiatives have been integrated into the Group’s overall governance and operations,
with direct guidance and involvement from the Company’s management team. Our sustainability structure comprises senior management, middle management and employees from various functions. Our Executive Risk Management Committee (“ERMC”) comprises 15 senior leaders from different strategic business units (“SBU”) and support functions. We have identified three Person-in-Charge (“PIC”) with their roles and responsibilities clearly spelt out, each being responsible for overseeing the Company’s respective environmental and social, employment and economic functions. They are supported by process owners of the respective sustainability topics and programs.
Following the integration of sustainability principles into our existing risk management structure, sustainability considerations form a part of our decision-making process. Management of all levels are regularly updated on key developments and changes that may potentially affect our operations and performances, along with any follow-up progress and mitigation actions taken. We reviewed and mapped the most significant issues to our Enterprise Risk Management (“ERM”), except for specific environmental topics, such as risks relating to waste management and the materials used in our construction activities. These omitted topics will be reviewed for inclusion in our 2021 risk assessment and sustainability program.
Board
Audit Committee (AC)
Executive Risk Management Committee (ERMC)
1
1 2 3
2
3
Secretariat: Enterprise Risk
Managements (ERM)
Environmental and Social
Employment
Economic
ROLES & RESPONSIBILITIES OF BOARD AND COMMITTEES
Provide oversight on significant environmental, social and governance issues that might impact SML long-term business objective.
Review SML sustainability program and reports and ensure full company support towards sustainable development.
Agree on sustainability program & target and review the performance achievement on semi-annual basis.
Building for a Better Future18
OUR
Approach
MATERIALITY AND STAKEHOLDER ENGAGEMENT
In 2019, we undertook an extensive review of our material sustainability issues through a comprehensive stakeholder engagement which included focus groups and surveys, resulting in the revision of our materiality matrix.
In 2020, we revisited our material sustainability topics as part of our practice of keeping these topics relevant. This year, we conducted desktop research and analysis to review our sustainability work in the context of global, regional and industry developments and supplemented this research with various stakeholder engagement surveys (Note that our usual customer and tenant survey was not conducted in 2020 due to COVID-19 restrictions. Please refer to our 2019 report for the most recent customer and tenant engagement). Thereafter, we discussed our findings with the Company’s management team to validate and approve the selection of material sustainability topics for 2020.
Our materiality review aligns with GRI’s Principles for Defining Report Content. Specifically, the Principles of Stakeholder Inclusiveness was addressed through our stakeholder engagement surveys. The Principle of Sustainability Context was the aim of our desktop context review, and the Principles of Materiality and Completeness were addressed in the management level discussion of the results of our context review and stakeholder outreach.
STAKEHOLDER ENGAGEMENT
1. Context review and stakeholder engagement 2020
The 2020 context review and stakeholder engagement aim to determine the relevancies of our four pillars and material ESG topics identified to the current sustainability landscape and emerging trends. This involved three steps:1. Desktop context review2. Internal stakeholder engagement
survey3. Management validation session
The desktop context review involved a landscape analysis of recent developments and sustainability trends, both globally and regionally. This analysis included developments in sustainability reporting best practice, such as the World Economic Forum’s report entitled “Toward Common Metrics and Consistent Reporting of Sustainable Value Creation”, the creation of the Value Reporting Foundation by the Sustainability Accounting Standards Board (“SASB”) and the International Integrated Reporting Council (“IIRC”) and recent consultations on changes to the materiality definitions in the GRI Standards. The analysis also acknowledged the increasing regulations in both Singapore, driven by MAS and SGX, and Indonesia, driven by IDX. In addition, the analysis considered changes in the real estate sustainability landscape such as increasing demand for eco-efficient buildings, contribution to the development of circular economy via the usage of recycled materials, and the growing prominence issuance of green bonds or loans. Responses to COVID-19 and COVID-19 restrictions featured heavily in the analysis, with research demonstrating changes in
behaviours such as increased working from home and placing a higher priority on safe and healthy living and working environments.
These findings were translated into an internal stakeholder engagement survey, requesting stakeholders to rank sustainability topics on a scale of least to most important. There were 145 respondents to the survey, representing a balanced mix of employment across the Group. According to the survey results, topics of most importance to the stakeholders that responded includes: waste management, GHG emissions, workplace health and safety, customer health and safety, anti-corruption and indirect economic impacts.
The context review and stakeholder engagement exercise indicate that our 2019 sustainability topics remain relevant. To supplement our disclosure, we will share, in greater detail, initiatives implemented by the Group to safeguard our stakeholders against the COVID-19 pandemic later in the report.
2. Employee Engagement Survey
Every year, the Group will conduct an employee engagement survey for all permanent and retired contract employees of staff level and above. Each question is based on a 4-scale measurement, and employees were encouraged to fill the questionnaires through an online application. SML Human Capital team prepared the questionnaire based on employee engagement survey best practices with the intention of capturing material issues. In 2020, the participation rate was 87.2%, an increase of 9.86 percentage points from 2019. The results have been compiled and presented to the Company’s management team before being incorporated into SML’s materiality assessment and material topics in this year’s report.
Sinarmas Land Limited Sustainability Report 2020 19
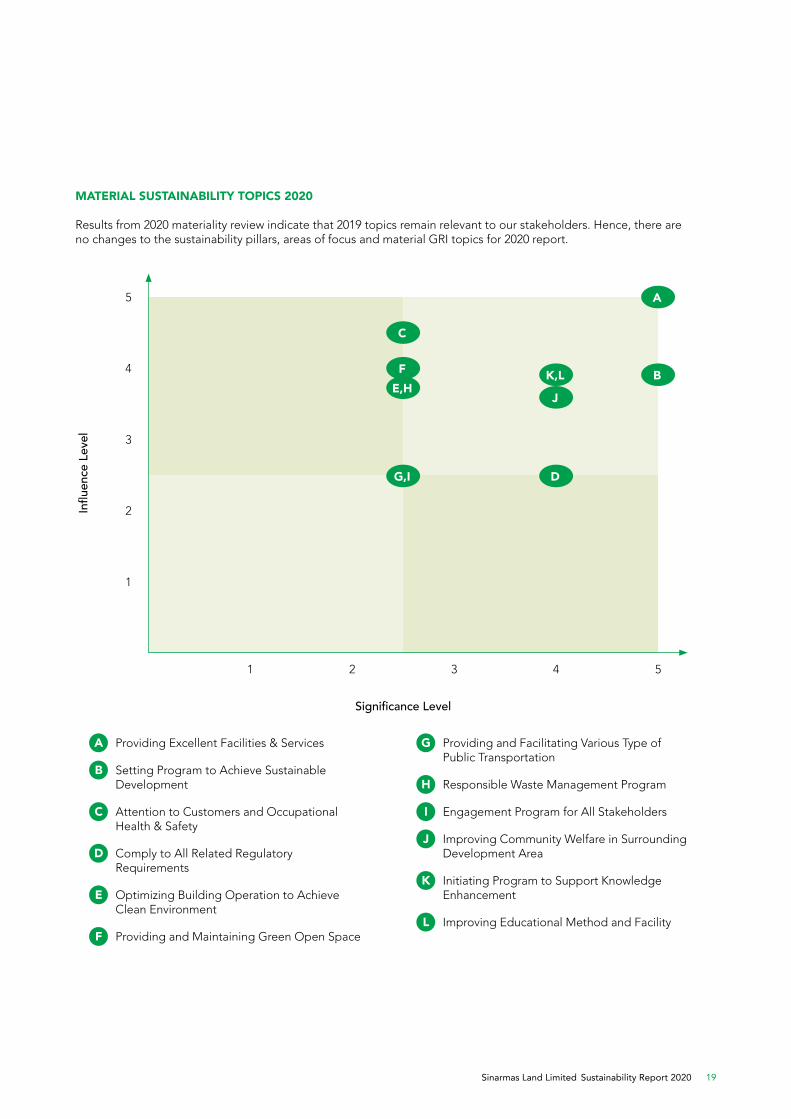
MATERIAL SUSTAINABILITY TOPICS 2020
Results from 2020 materiality review indicate that 2019 topics remain relevant to our stakeholders. Hence, there are no changes to the sustainability pillars, areas of focus and material GRI topics for 2020 report.
1
1 2 3 4 5
2
3
4
5 A
B
C
E,H
G,I D
J
K,L
Significance Level
Influ
ence
Lev
el
A Providing Excellent Facilities & Services
B Setting Program to Achieve Sustainable Development
C Attention to Customers and Occupational Health & Safety
D Comply to All Related Regulatory Requirements
E Optimizing Building Operation to Achieve Clean Environment
F Providing and Maintaining Green Open Space
G Providing and Facilitating Various Type of Public Transportation
H Responsible Waste Management Program
I Engagement Program for All Stakeholders
J Improving Community Welfare in Surrounding Development Area
K Initiating Program to Support Knowledge Enhancement
L Improving Educational Method and Facility
F
Building for a Better Future20
OUR
Approach
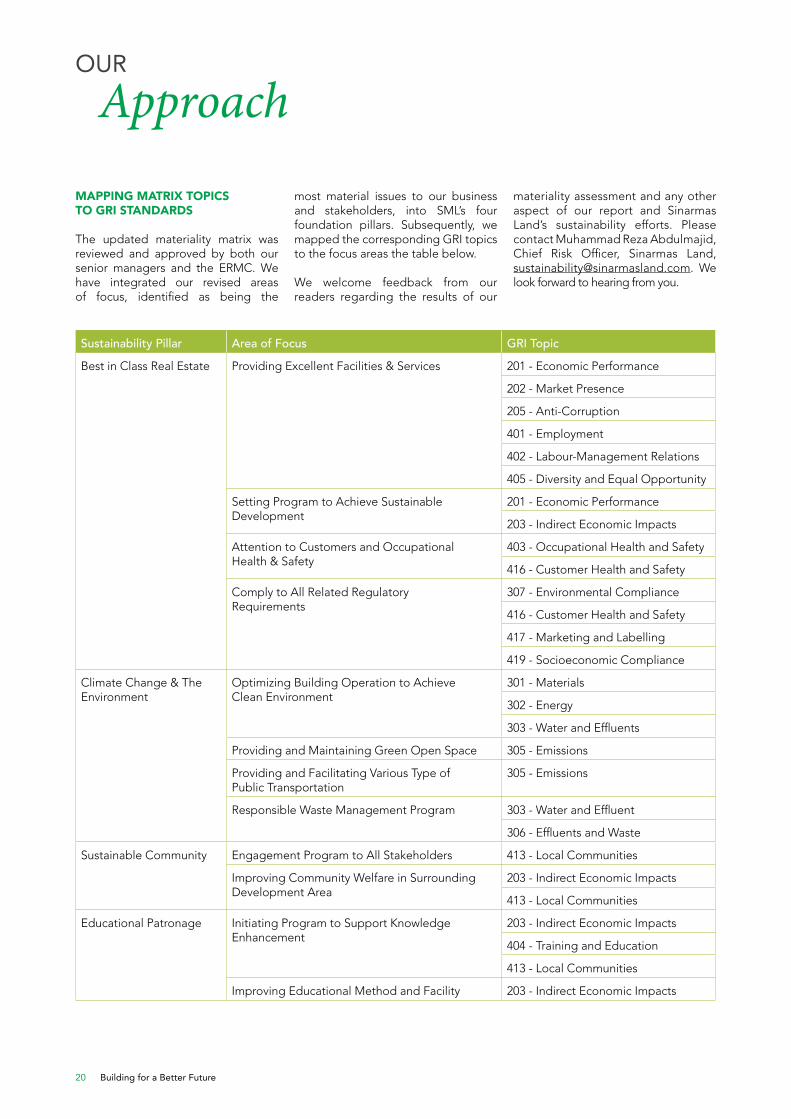
MAPPING MATRIX TOPICS TO GRI STANDARDS
The updated materiality matrix was reviewed and approved by both our senior managers and the ERMC. We have integrated our revised areas of focus, identified as being the
Sustainability Pillar Area of Focus GRI Topic
Best in Class Real Estate Providing Excellent Facilities & Services 201 - Economic Performance
202 - Market Presence
205 - Anti-Corruption
401 - Employment
402 - Labour-Management Relations
405 - Diversity and Equal Opportunity
Setting Program to Achieve Sustainable Development
201 - Economic Performance
203 - Indirect Economic Impacts
Attention to Customers and Occupational Health & Safety
403 - Occupational Health and Safety
416 - Customer Health and Safety
Comply to All Related Regulatory Requirements
307 - Environmental Compliance
416 - Customer Health and Safety
417 - Marketing and Labelling
419 - Socioeconomic Compliance
Climate Change & The Environment
Optimizing Building Operation to Achieve Clean Environment
301 - Materials
302 - Energy
303 - Water and Effluents
Providing and Maintaining Green Open Space 305 - Emissions
Providing and Facilitating Various Type of Public Transportation
305 - Emissions
Responsible Waste Management Program 303 - Water and Effluent
306 - Effluents and Waste
Sustainable Community Engagement Program to All Stakeholders 413 - Local Communities
Improving Community Welfare in Surrounding Development Area
203 - Indirect Economic Impacts
413 - Local Communities
Educational Patronage Initiating Program to Support Knowledge Enhancement
203 - Indirect Economic Impacts
404 - Training and Education
413 - Local Communities
Improving Educational Method and Facility 203 - Indirect Economic Impacts
most material issues to our business and stakeholders, into SML’s four foundation pillars. Subsequently, we mapped the corresponding GRI topics to the focus areas the table below.
We welcome feedback from our readers regarding the results of our
materiality assessment and any other aspect of our report and Sinarmas Land’s sustainability efforts. Please contact Muhammad Reza Abdulmajid, Chief Risk Officer, Sinarmas Land, [email protected]. We look forward to hearing from you.
Sinarmas Land Limited Sustainability Report 2020 21
BEST IN
Class Real Estate
IN THIS SECTION
The following section describes an overview of Sinarmas Land’s efforts to provide best in class real estate and products to our customers. We have identified four areas of focus that are vital to our success:1. Providing excellent facilities and
services2. Attention to customers and
occupational health and safety3. Setting programs to achieve
sustainable development4. Compliance to all related
regulatory requirements
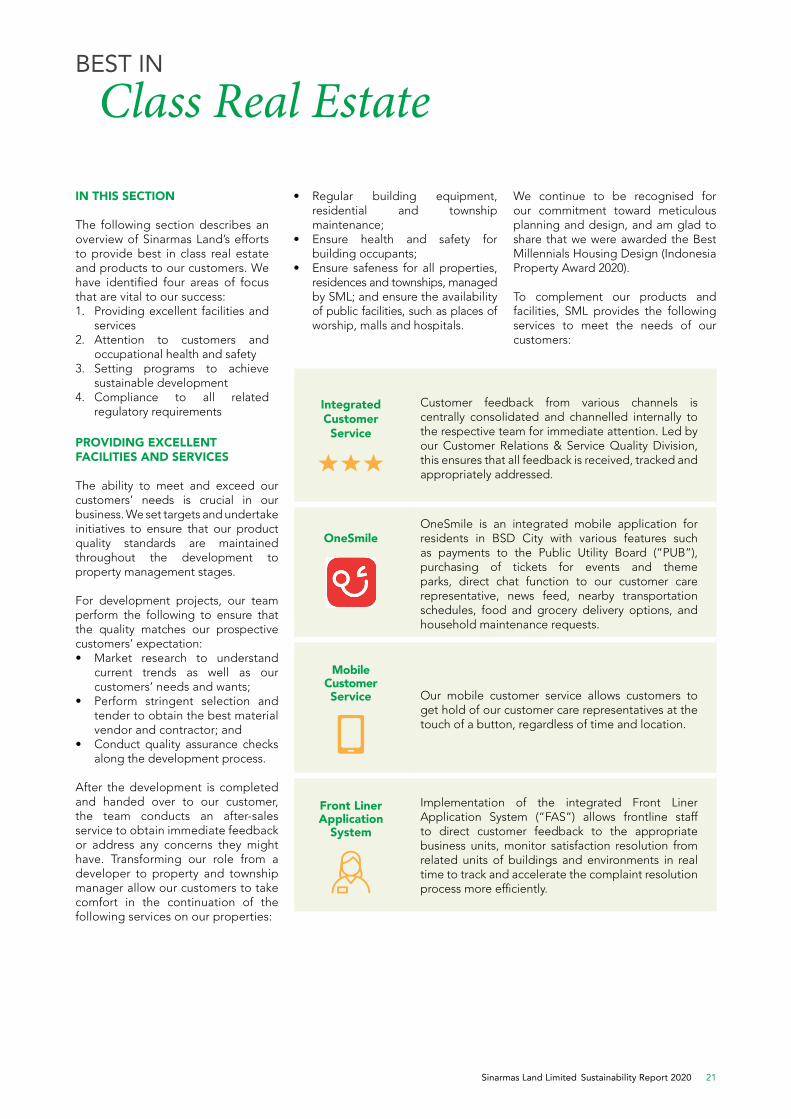
PROVIDING EXCELLENT FACILITIES AND SERVICES
The ability to meet and exceed our customers’ needs is crucial in our business. We set targets and undertake initiatives to ensure that our product quality standards are maintained throughout the development to property management stages.
For development projects, our team perform the following to ensure that the quality matches our prospective customers’ expectation: • Market research to understand
current trends as well as our customers’ needs and wants;
• Perform stringent selection and tender to obtain the best material vendor and contractor; and
• Conduct quality assurance checks along the development process.
After the development is completed and handed over to our customer, the team conducts an after-sales service to obtain immediate feedback or address any concerns they might have. Transforming our role from a developer to property and township manager allow our customers to take comfort in the continuation of the following services on our properties:
Integrated Customer Service
Customer feedback from various channels is centrally consolidated and channelled internally to the respective team for immediate attention. Led by our Customer Relations & Service Quality Division, this ensures that all feedback is received, tracked and appropriately addressed.
OneSmileOneSmile is an integrated mobile application for residents in BSD City with various features such as payments to the Public Utility Board (“PUB”), purchasing of tickets for events and theme parks, direct chat function to our customer care representative, news feed, nearby transportation schedules, food and grocery delivery options, and household maintenance requests.
Mobile Customer Service Our mobile customer service allows customers to
get hold of our customer care representatives at the touch of a button, regardless of time and location.
Front Liner Application
System
Implementation of the integrated Front Liner Application System (“FAS”) allows frontline staff to direct customer feedback to the appropriate business units, monitor satisfaction resolution from related units of buildings and environments in real time to track and accelerate the complaint resolution process more efficiently.
• Regular building equipment, residential and township maintenance;
• Ensure health and safety for building occupants;
• Ensure safeness for all properties, residences and townships, managed by SML; and ensure the availability of public facilities, such as places of worship, malls and hospitals.
We continue to be recognised for our commitment toward meticulous planning and design, and am glad to share that we were awarded the Best Millennials Housing Design (Indonesia Property Award 2020).
To complement our products and facilities, SML provides the following services to meet the needs of our customers:
Building for a Better Future22
Our Employees
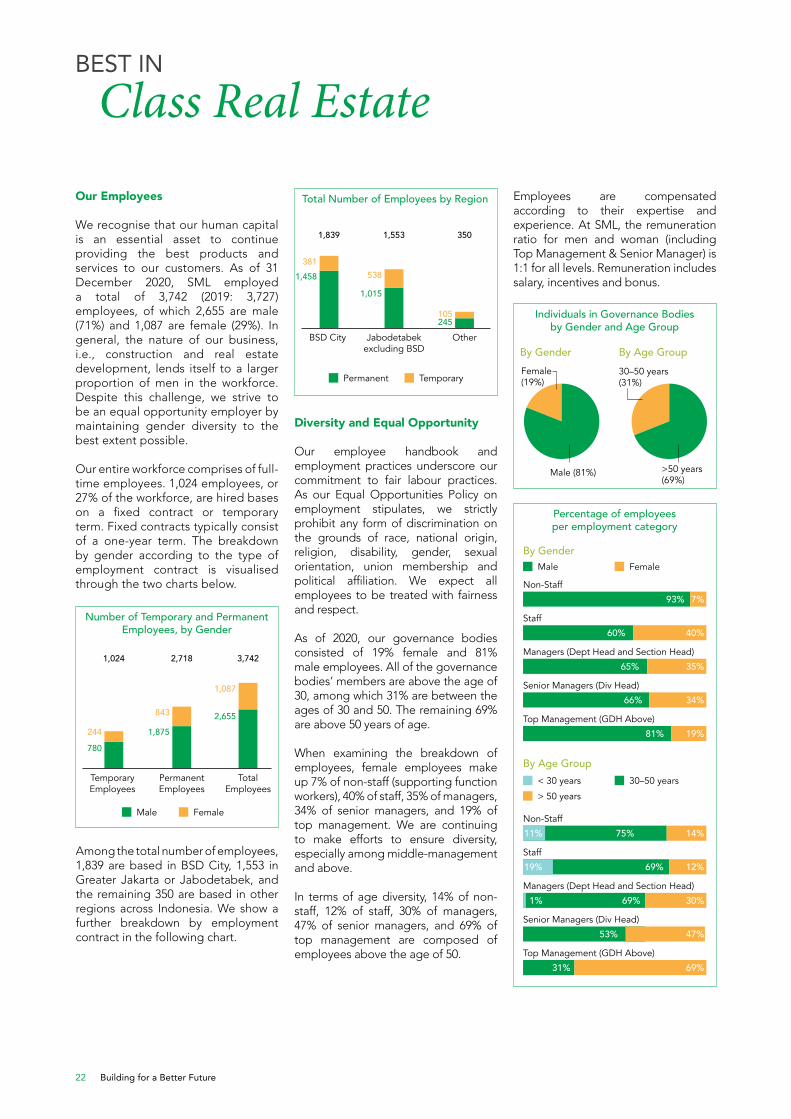
We recognise that our human capital is an essential asset to continue providing the best products and services to our customers. As of 31 December 2020, SML employed a total of 3,742 (2019: 3,727) employees, of which 2,655 are male (71%) and 1,087 are female (29%). In general, the nature of our business, i.e., construction and real estate development, lends itself to a larger proportion of men in the workforce. Despite this challenge, we strive to be an equal opportunity employer by maintaining gender diversity to the best extent possible.
Our entire workforce comprises of full-time employees. 1,024 employees, or 27% of the workforce, are hired bases on a fixed contract or temporary term. Fixed contracts typically consist of a one-year term. The breakdown by gender according to the type of employment contract is visualised through the two charts below.
Diversity and Equal Opportunity
Our employee handbook and employment practices underscore our commitment to fair labour practices. As our Equal Opportunities Policy on employment stipulates, we strictly prohibit any form of discrimination on the grounds of race, national origin, religion, disability, gender, sexual orientation, union membership and political affiliation. We expect all employees to be treated with fairness and respect.
As of 2020, our governance bodies consisted of 19% female and 81% male employees. All of the governance bodies’ members are above the age of 30, among which 31% are between the ages of 30 and 50. The remaining 69% are above 50 years of age.
When examining the breakdown of employees, female employees make up 7% of non-staff (supporting function workers), 40% of staff, 35% of managers, 34% of senior managers, and 19% of top management. We are continuing to make efforts to ensure diversity, especially among middle-management and above.
In terms of age diversity, 14% of non-staff, 12% of staff, 30% of managers, 47% of senior managers, and 69% of top management are composed of employees above the age of 50.
Number of Temporary and Permanent Employees, by Gender
Total Number of Employees by Region
Temporary Employees
BSD City
Male
Permanent
Female
Temporary
1,458
1,015
245
381
1,024
1,839
2,718
1,553
3,742
350
538
105
Permanent Employees
Jabodetabek excluding BSD
Total Employees
Other
Among the total number of employees, 1,839 are based in BSD City, 1,553 in Greater Jakarta or Jabodetabek, and the remaining 350 are based in other regions across Indonesia. We show a further breakdown by employment contract in the following chart.
780
1,875
2,655
244
843
1,087
By Gender
By Gender
By Age Group
By Age Group
Male
< 30 years
> 50 years
>50 years (69%)
Non-Staff
Non-Staff
Managers (Dept Head and Section Head)
Managers (Dept Head and Section Head)
Staff
Staff
Senior Managers (Div Head)
Senior Managers (Div Head)
Top Management (GDH Above)
Top Management (GDH Above)
Female (19%)
Female
30–50 years
30–50 years (31%)
93%
75%
60%
69%
65%
69%
66%
53%
81%
31%
19%
69%
34%
47%
35%
30%
40%
12%
7%
14%11%
19%
1%
Male (81%)
Individuals in Governance Bodiesby Gender and Age Group
Percentage of employees per employment category
BEST IN
Class Real Estate
Employees are compensated according to their expertise and experience. At SML, the remuneration ratio for men and woman (including Top Management & Senior Manager) is 1:1 for all levels. Remuneration includes salary, incentives and bonus.
Sinarmas Land Limited Sustainability Report 2020 23
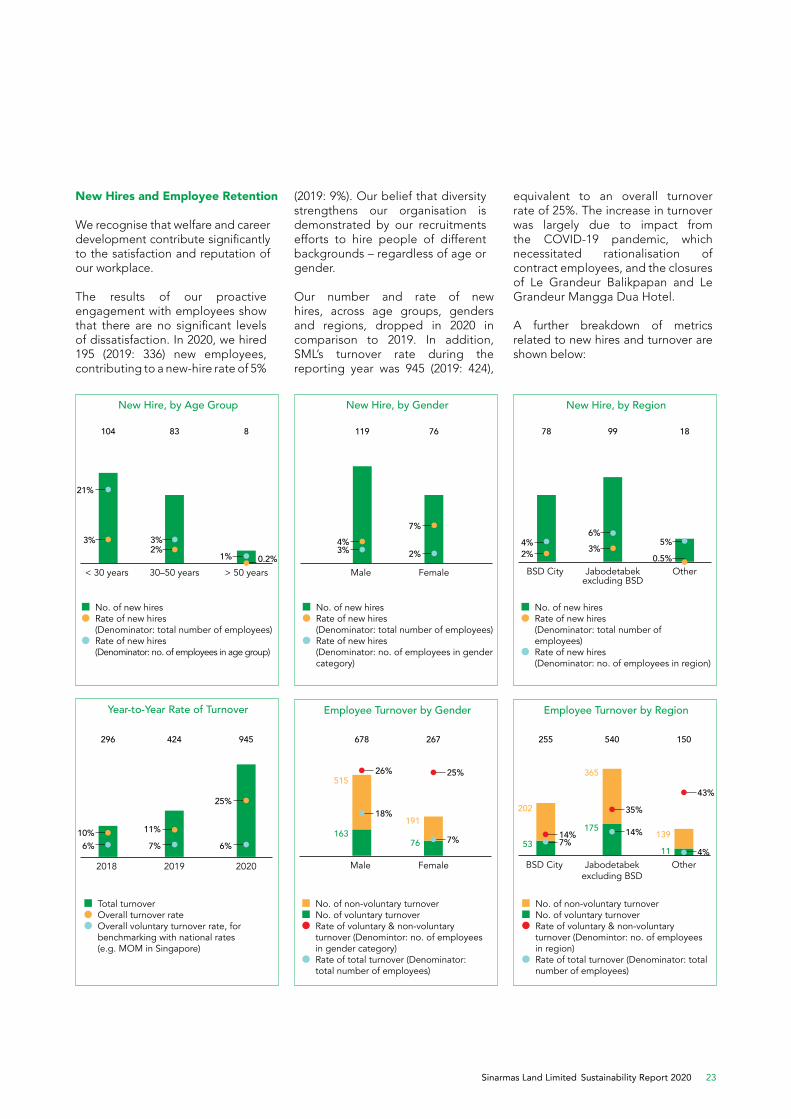
New Hires and Employee Retention
We recognise that welfare and career development contribute significantly to the satisfaction and reputation of our workplace.
The results of our proactive engagement with employees show that there are no significant levels of dissatisfaction. In 2020, we hired 195 (2019: 336) new employees, contributing to a new-hire rate of 5%
(2019: 9%). Our belief that diversity strengthens our organisation is demonstrated by our recruitments efforts to hire people of different backgrounds – regardless of age or gender.
Our number and rate of new hires, across age groups, genders and regions, dropped in 2020 in comparison to 2019. In addition, SML’s turnover rate during the reporting year was 945 (2019: 424),
BSD CityMale
No. of non-voluntary turnover No. of voluntary turnover Rate of voluntary & non-voluntary
turnover (Denomintor: no. of employees in region)
Rate of total turnover (Denominator: total number of employees)
No. of non-voluntary turnover No. of voluntary turnover Rate of voluntary & non-voluntary
turnover (Denomintor: no. of employees in gender category)
Rate of total turnover (Denominator: total number of employees)
26% 25%
14%
35%
14%
4%
43%
7%7%
18%
53
202
163
515
17576
365
191139
11
255678 540267 150
Jabodetabek excluding BSD
Female Other
Employee Turnover by Gender Employee Turnover by Region
2018
Total turnover Overall turnover rate Overall voluntary turnover rate, for
benchmarking with national rates (e.g. MOM in Singapore)
6%10%
7%
11%
25%
6%
296 424 945
2019 2020
Year-to-Year Rate of Turnover
BSD CityMale
No. of new hires Rate of new hires
(Denominator: total number of employees)
Rate of new hires (Denominator: no. of employees in region)
No. of new hires Rate of new hires
(Denominator: total number of employees) Rate of new hires
(Denominator: no. of employees in gender category)
2%4%
3%4%
3%2%
6%7%
5%
0.5%
78119 9976 18
Jabodetabek excluding BSD
Female Other
New Hire, by Gender New Hire, by Region
< 30 years
No. of new hires Rate of new hires
(Denominator: total number of employees) Rate of new hires
(Denominator: no. of employees in age group)
3%
21%
2%3%
1% 0.2%
104 83 8
30–50 years > 50 years
New Hire, by Age Group
equivalent to an overall turnover rate of 25%. The increase in turnover was largely due to impact from the COVID-19 pandemic, which necessitated rationalisation of contract employees, and the closures of Le Grandeur Balikpapan and Le Grandeur Mangga Dua Hotel.
A further breakdown of metrics related to new hires and turnover are shown below:
Building for a Better Future24
Respecting Freedom of Association and Collective Bargaining Rights
SML respects employees’ fundamental rights to freedom of association and unions. We follow regulation set out by the Indonesian government (as ratified by the ILO) which allows trade unions to represent our employees for collective bargaining, providing our employees with a way to seek remediation for disputes. A total number of 12 employees (0.4% of our total workforce) are covered by collective bargaining agreements. This is a change from 240 employees last year, as the properties (Le Grandeur Balikpapan and Le Grandeur Mangga Dua Hotel) corresponding to the most of those employees are no longer in operation.
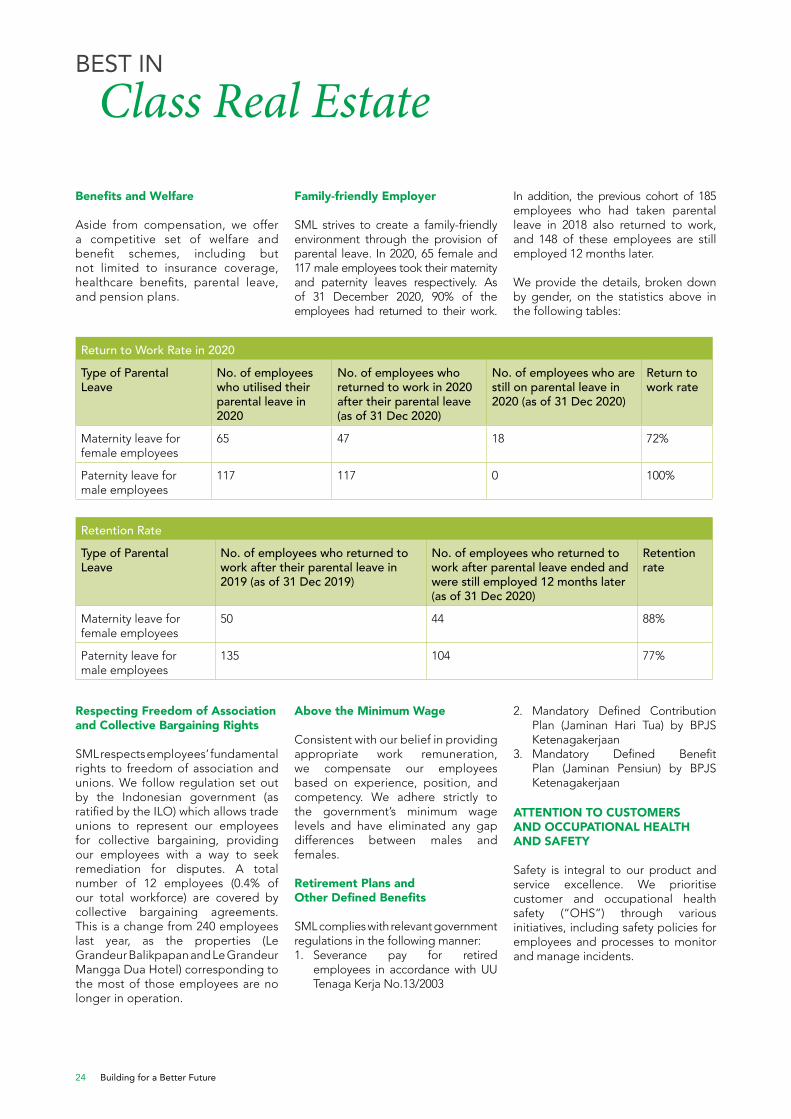
Return to Work Rate in 2020
Type of Parental Leave
No. of employees who utilised their parental leave in 2020
No. of employees who returned to work in 2020 after their parental leave (as of 31 Dec 2020)
No. of employees who are still on parental leave in 2020 (as of 31 Dec 2020)
Return to work rate
Maternity leave for female employees
65 47 18 72%
Paternity leave for male employees
117 117 0 100%
Retention Rate
Type of Parental Leave
No. of employees who returned to work after their parental leave in 2019 (as of 31 Dec 2019)
No. of employees who returned to work after parental leave ended and were still employed 12 months later (as of 31 Dec 2020)
Retention rate
Maternity leave for female employees
50 44 88%
Paternity leave for male employees
135 104 77%
Family-friendly Employer
SML strives to create a family-friendly environment through the provision of parental leave. In 2020, 65 female and 117 male employees took their maternity and paternity leaves respectively. As of 31 December 2020, 90% of the employees had returned to their work.
Above the Minimum Wage
Consistent with our belief in providing appropriate work remuneration, we compensate our employees based on experience, position, and competency. We adhere strictly to the government’s minimum wage levels and have eliminated any gap differences between males and females.
Retirement Plans and Other Defined Benefits
SML complies with relevant government regulations in the following manner:1. Severance pay for retired
employees in accordance with UU Tenaga Kerja No.13/2003
ATTENTION TO CUSTOMERS AND OCCUPATIONAL HEALTH AND SAFETY
Safety is integral to our product and service excellence. We prioritise customer and occupational health safety (“OHS”) through various initiatives, including safety policies for employees and processes to monitor and manage incidents.
BEST IN
Class Real Estate
Benefits and Welfare
Aside from compensation, we offer a competitive set of welfare and benefit schemes, including but not limited to insurance coverage, healthcare benefits, parental leave, and pension plans.
In addition, the previous cohort of 185 employees who had taken parental leave in 2018 also returned to work, and 148 of these employees are still employed 12 months later.
We provide the details, broken down by gender, on the statistics above in the following tables:
2. Mandatory Defined Contribution Plan (Jaminan Hari Tua) by BPJS Ketenagakerjaan
3. Mandatory Defined Benefit Plan (Jaminan Pensiun) by BPJS Ketenagakerjaan
Sinarmas Land Limited Sustainability Report 2020 25
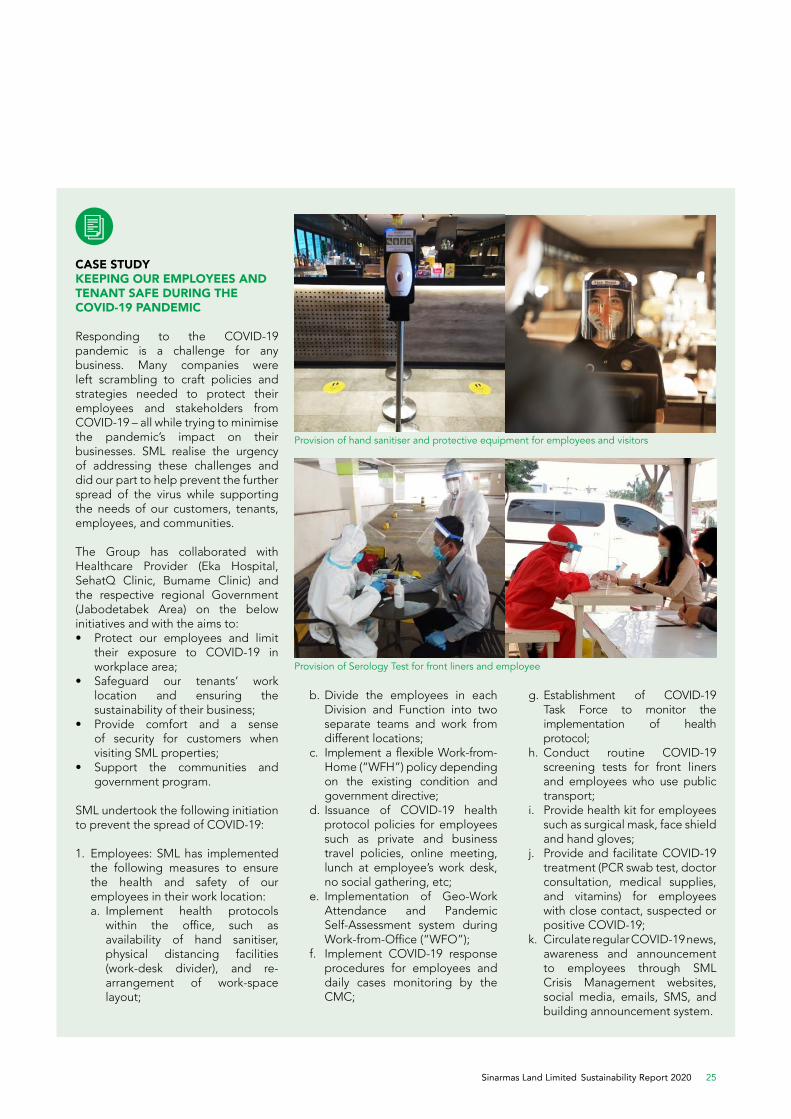
CASE STUDY KEEPING OUR EMPLOYEES AND TENANT SAFE DURING THE COVID-19 PANDEMIC
Responding to the COVID-19 pandemic is a challenge for any business. Many companies were left scrambling to craft policies and strategies needed to protect their employees and stakeholders from COVID-19 – all while trying to minimise the pandemic’s impact on their businesses. SML realise the urgency of addressing these challenges and did our part to help prevent the further spread of the virus while supporting the needs of our customers, tenants, employees, and communities.
The Group has collaborated with Healthcare Provider (Eka Hospital, SehatQ Clinic, Bumame Clinic) and the respective regional Government (Jabodetabek Area) on the below initiatives and with the aims to:• Protect our employees and limit
their exposure to COVID-19 in workplace area;
• Safeguard our tenants’ work location and ensuring the sustainability of their business;
• Provide comfort and a sense of security for customers when visiting SML properties;
• Support the communities and government program.
SML undertook the following initiation to prevent the spread of COVID-19:
1. Employees: SML has implemented the following measures to ensure the health and safety of our employees in their work location:
a. Implement health protocols within the office, such as availability of hand sanitiser, physical distancing facilities (work-desk divider), and re-arrangement of work-space layout;
b. Divide the employees in each Division and Function into two separate teams and work from different locations;
c. Implement a flexible Work-from-Home (“WFH”) policy depending on the existing condition and government directive;
d. Issuance of COVID-19 health protocol policies for employees such as private and business travel policies, online meeting, lunch at employee’s work desk, no social gathering, etc;
e. Implementation of Geo-Work Attendance and Pandemic Self-Assessment system during Work-from-Office (“WFO”);
f. Implement COVID-19 response procedures for employees and daily cases monitoring by the CMC;
g. Establishment of COVID-19 Task Force to monitor the implementation of health protocol;
h. Conduct routine COVID-19 screening tests for front liners and employees who use public transport;
i. Provide health kit for employees such as surgical mask, face shield and hand gloves;
j. Provide and facilitate COVID-19 treatment (PCR swab test, doctor consultation, medical supplies, and vitamins) for employees with close contact, suspected or positive COVID-19;
k. Circulate regular COVID-19 news, awareness and announcement to employees through SML Crisis Management websites, social media, emails, SMS, and building announcement system.
Provision of hand sanitiser and protective equipment for employees and visitors
Provision of Serology Test for front liners and employee
Building for a Better Future26
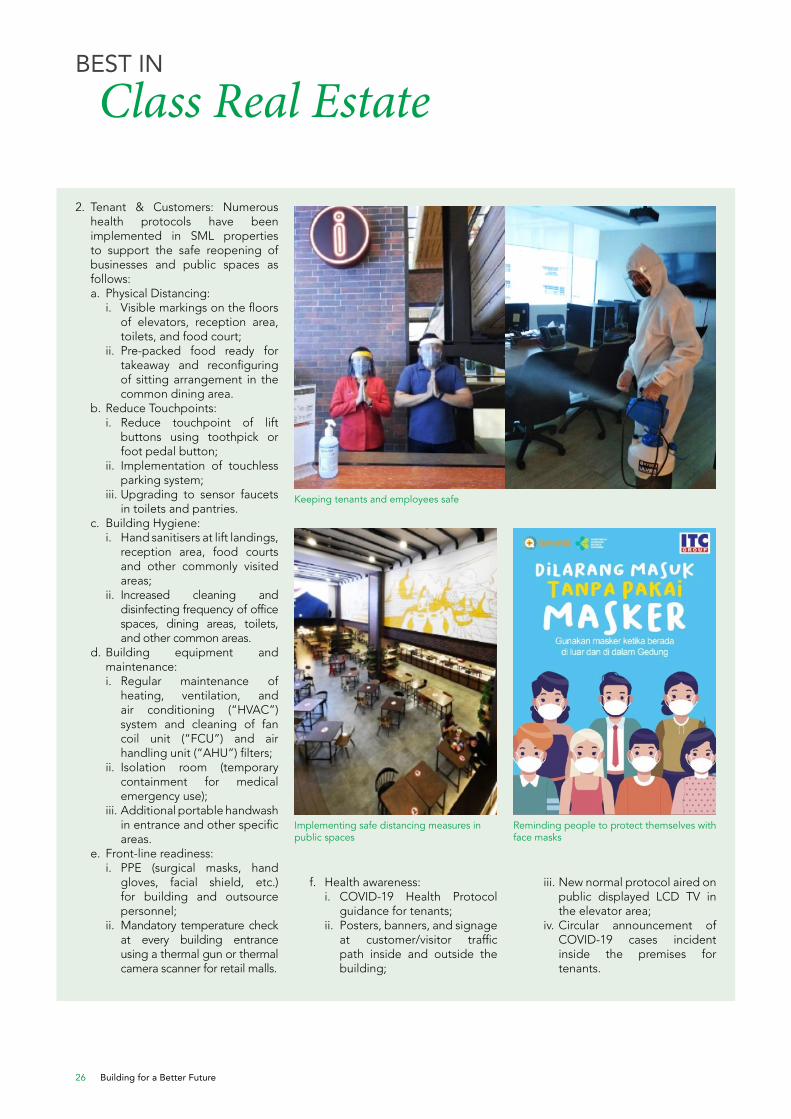
2. Tenant & Customers: Numerous health protocols have been implemented in SML properties to support the safe reopening of businesses and public spaces as follows:
a. Physical Distancing: i. Visible markings on the floors
of elevators, reception area, toilets, and food court;
ii. Pre-packed food ready for takeaway and reconfiguring of sitting arrangement in the common dining area.
b. Reduce Touchpoints: i. Reduce touchpoint of lift
buttons using toothpick or foot pedal button;
ii. Implementation of touchless parking system;
iii. Upgrading to sensor faucets in toilets and pantries.
c. Building Hygiene: i. Hand sanitisers at lift landings,
reception area, food courts and other commonly visited areas;
ii. Increased cleaning and disinfecting frequency of office spaces, dining areas, toilets, and other common areas.
d. Building equipment and maintenance:
i. Regular maintenance of heating, ventilation, and air conditioning (“HVAC”) system and cleaning of fan coil unit (“FCU”) and air handling unit (“AHU”) filters;
ii. Isolation room (temporary containment for medical emergency use);
iii. Additional portable handwash in entrance and other specific areas.
e. Front-line readiness: i. PPE (surgical masks, hand
gloves, facial shield, etc.) for building and outsource personnel;
ii. Mandatory temperature check at every building entrance using a thermal gun or thermal camera scanner for retail malls.
f. Health awareness: i. COVID-19 Health Protocol
guidance for tenants; ii. Posters, banners, and signage
at customer/visitor traffic path inside and outside the building;
Reminding people to protect themselves with face masks
Implementing safe distancing measures in public spaces
Keeping tenants and employees safe
iii. New normal protocol aired on public displayed LCD TV in the elevator area;
iv. Circular announcement of COVID-19 cases incident inside the premises for tenants.
BEST IN
Class Real Estate
Sinarmas Land Limited Sustainability Report 2020 27
3. Government & Communities: SML extended the following support to local government and communities:
a. Health kits (rapid test kits, surgical masks, hand sanitisers, disinfectants, personal protective equipment, face shields, thermo guns, portable handwash facilities, health protection tools, etc);
b. Food and supplement (rice, instant noodles, cooking oils, basic necessities and vitamins);
c. Corporate Partnership - Collaboration with Pengusaha Peduli NKRI
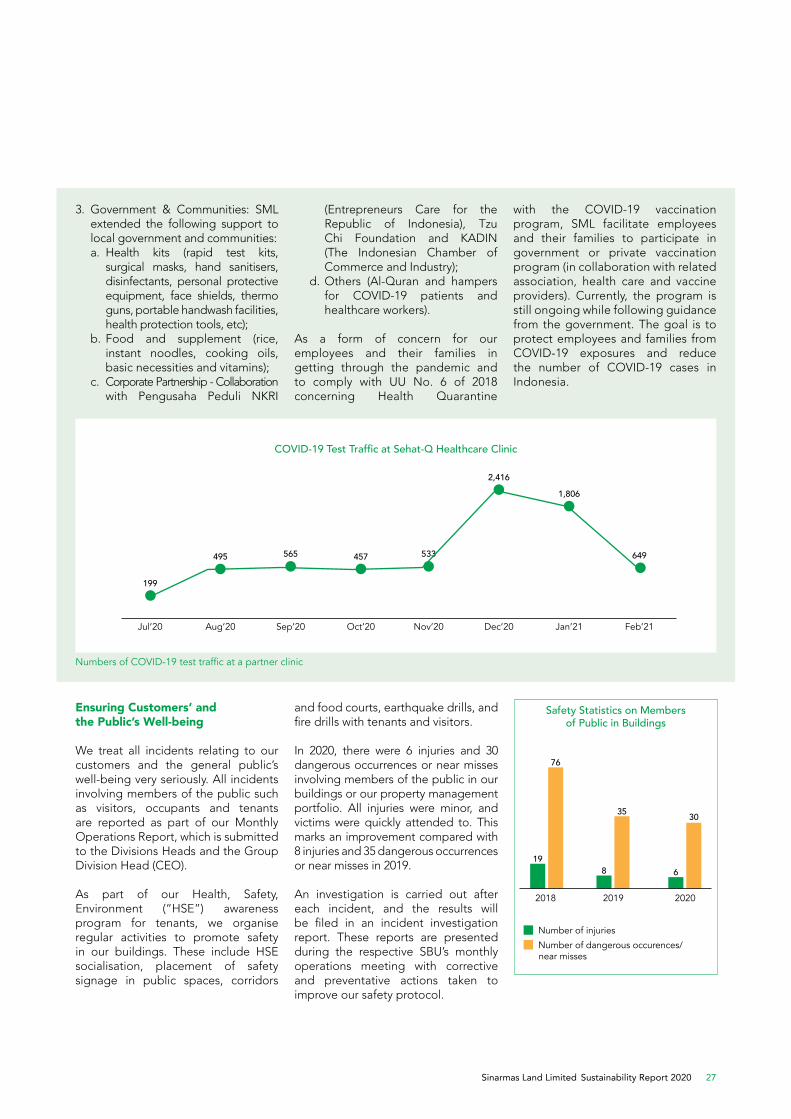
with the COVID-19 vaccination program, SML facilitate employees and their families to participate in government or private vaccination program (in collaboration with related association, health care and vaccine providers). Currently, the program is still ongoing while following guidance from the government. The goal is to protect employees and families from COVID-19 exposures and reduce the number of COVID-19 cases in Indonesia.
Numbers of COVID-19 test traffic at a partner clinic
(Entrepreneurs Care for the Republic of Indonesia), Tzu Chi Foundation and KADIN (The Indonesian Chamber of Commerce and Industry);
d. Others (Al-Quran and hampers for COVID-19 patients and healthcare workers).
As a form of concern for our employees and their families in getting through the pandemic and to comply with UU No. 6 of 2018 concerning Health Quarantine
COVID-19 Test Traffic at Sehat-Q Healthcare Clinic
Jul’20
199
Aug’20
495
Sep’20
565
Oct’20
457
Nov’20
533
Dec’20
2,416
Jan’21
1,806
Feb’21
649
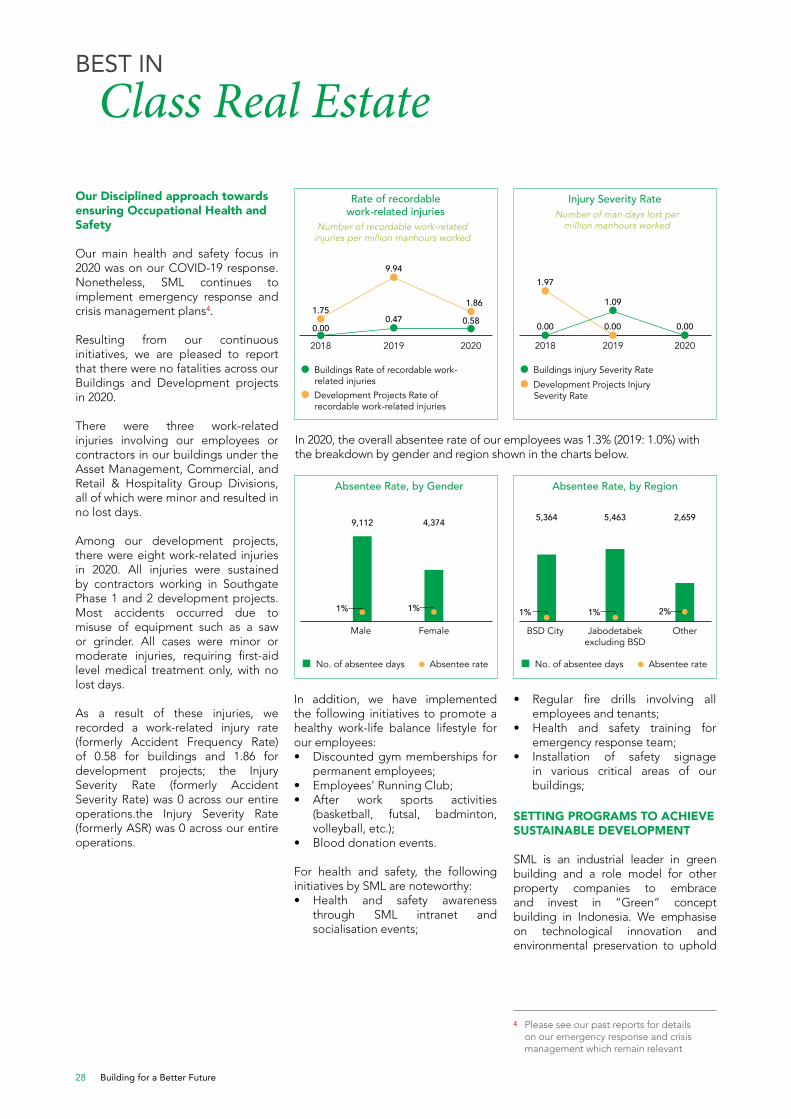
Ensuring Customers’ and the Public’s Well-being
We treat all incidents relating to our customers and the general public’s well-being very seriously. All incidents involving members of the public such as visitors, occupants and tenants are reported as part of our Monthly Operations Report, which is submitted to the Divisions Heads and the Group Division Head (CEO).
As part of our Health, Safety, Environment (“HSE”) awareness program for tenants, we organise regular activities to promote safety in our buildings. These include HSE socialisation, placement of safety signage in public spaces, corridors
2018
Number of injuries
Number of dangerous occurences/near misses
198 6
76
35 30
2019 2020
Safety Statistics on Members of Public in Buildings
and food courts, earthquake drills, and fire drills with tenants and visitors.
In 2020, there were 6 injuries and 30 dangerous occurrences or near misses involving members of the public in our buildings or our property management portfolio. All injuries were minor, and victims were quickly attended to. This marks an improvement compared with 8 injuries and 35 dangerous occurrences or near misses in 2019.
An investigation is carried out after each incident, and the results will be filed in an incident investigation report. These reports are presented during the respective SBU’s monthly operations meeting with corrective and preventative actions taken to improve our safety protocol.
Building for a Better Future28
4 Please see our past reports for details on our emergency response and crisis management which remain relevant
Our Disciplined approach towards ensuring Occupational Health and Safety
Our main health and safety focus in 2020 was on our COVID-19 response. Nonetheless, SML continues to implement emergency response and crisis management plans4.
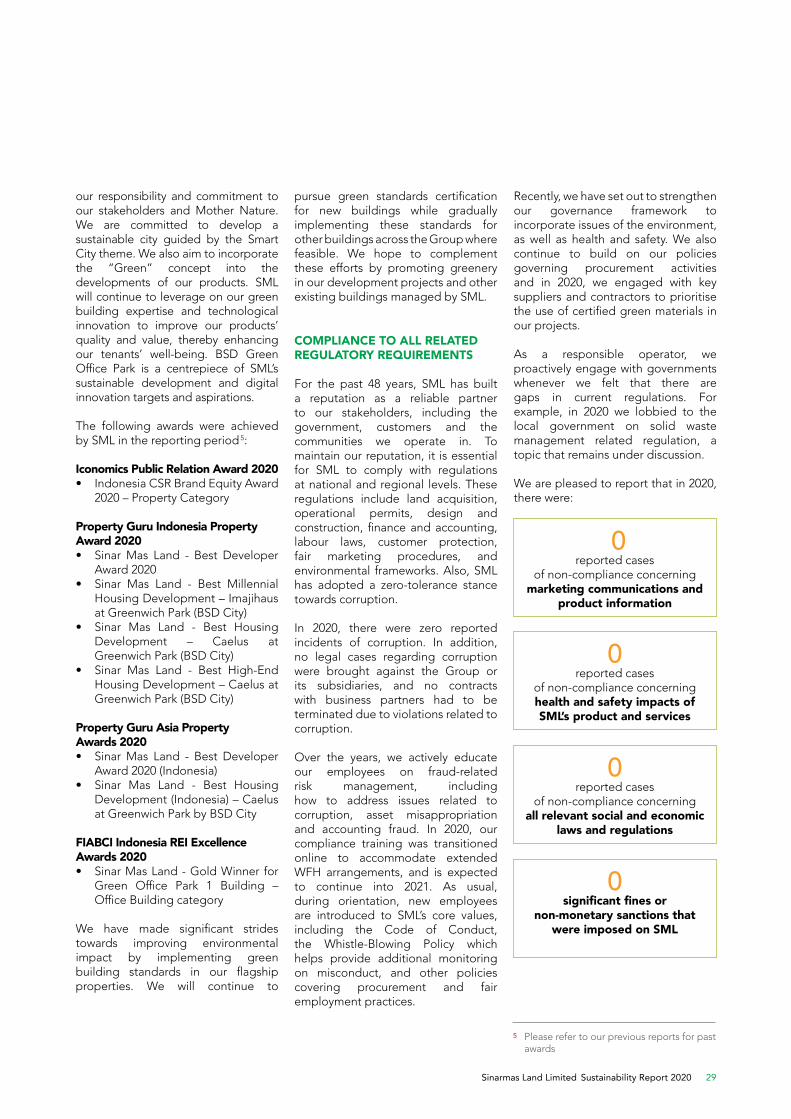
Resulting from our continuous initiatives, we are pleased to report that there were no fatalities across our Buildings and Development projects in 2020.
There were three work-related injuries involving our employees or contractors in our buildings under the Asset Management, Commercial, and Retail & Hospitality Group Divisions, all of which were minor and resulted in no lost days.
Among our development projects, there were eight work-related injuries in 2020. All injuries were sustained by contractors working in Southgate Phase 1 and 2 development projects. Most accidents occurred due to misuse of equipment such as a saw or grinder. All cases were minor or moderate injuries, requiring first-aid level medical treatment only, with no lost days.
As a result of these injuries, we recorded a work-related injury rate (formerly Accident Frequency Rate) of 0.58 for buildings and 1.86 for development projects; the Injury Severity Rate (formerly Accident Severity Rate) was 0 across our entire operations.the Injury Severity Rate (formerly ASR) was 0 across our entire operations.
2018 2018
Buildings Rate of recordable work-related injuries
Buildings injury Severity Rate
Development Projects Rate of recordable work-related injuries
Development Projects Injury Severity Rate
Number of recordable work-related injuries per million manhours worked
Number of man days lost per million manhours worked
0.00
1.750.47
9.94
0.00 0.00
1.97
0.00
1.09
0.58
1.86
2019 20192020 2020
Rate of recordable work-related injuries
Injury Severity Rate
In 2020, the overall absentee rate of our employees was 1.3% (2019: 1.0%) with the breakdown by gender and region shown in the charts below.
Male
No. of absentee days No. of absentee days
1% 1% 1% 1%
9,112 4,374
Female
Absentee rate Absentee rate
BSD City
2%
5,364 5,463 2,659
Jabodetabek excluding BSD
Other
Absentee Rate, by Gender Absentee Rate, by Region
In addition, we have implemented the following initiatives to promote a healthy work-life balance lifestyle for our employees: • Discounted gym memberships for
permanent employees;• Employees’ Running Club;• After work sports activities
(basketball, futsal, badminton, volleyball, etc.);
• Blood donation events.
For health and safety, the following initiatives by SML are noteworthy:• Health and safety awareness
through SML intranet and socialisation events;
SETTING PROGRAMS TO ACHIEVE SUSTAINABLE DEVELOPMENT
SML is an industrial leader in green building and a role model for other property companies to embrace and invest in “Green” concept building in Indonesia. We emphasise on technological innovation and environmental preservation to uphold
BEST IN
Class Real Estate
• Regular fire drills involving all employees and tenants;
• Health and safety training for emergency response team;
• Installation of safety signage in various critical areas of our buildings;
Sinarmas Land Limited Sustainability Report 2020 29
5 Please refer to our previous reports for past awards
our responsibility and commitment to our stakeholders and Mother Nature. We are committed to develop a sustainable city guided by the Smart City theme. We also aim to incorporate the “Green” concept into the developments of our products. SML will continue to leverage on our green building expertise and technological innovation to improve our products’ quality and value, thereby enhancing our tenants’ well-being. BSD Green Office Park is a centrepiece of SML’s sustainable development and digital innovation targets and aspirations.
The following awards were achieved by SML in the reporting period 5:
Iconomics Public Relation Award 2020• Indonesia CSR Brand Equity Award
2020 – Property Category
Property Guru Indonesia Property Award 2020• Sinar Mas Land - Best Developer
Award 2020• Sinar Mas Land - Best Millennial
Housing Development – Imajihaus at Greenwich Park (BSD City)
• Sinar Mas Land - Best Housing Development – Caelus at Greenwich Park (BSD City)
• Sinar Mas Land - Best High-End Housing Development – Caelus at Greenwich Park (BSD City)
Property Guru Asia Property Awards 2020• Sinar Mas Land - Best Developer
Award 2020 (Indonesia)• Sinar Mas Land - Best Housing
Development (Indonesia) – Caelus at Greenwich Park by BSD City
FIABCI Indonesia REI Excellence Awards 2020• Sinar Mas Land - Gold Winner for
Green Office Park 1 Building – Office Building category
We have made significant strides towards improving environmental impact by implementing green building standards in our flagship properties. We will continue to
pursue green standards certification for new buildings while gradually implementing these standards for other buildings across the Group where feasible. We hope to complement these efforts by promoting greenery in our development projects and other existing buildings managed by SML.
COMPLIANCE TO ALL RELATED REGULATORY REQUIREMENTS
For the past 48 years, SML has built a reputation as a reliable partner to our stakeholders, including the government, customers and the communities we operate in. To maintain our reputation, it is essential for SML to comply with regulations at national and regional levels. These regulations include land acquisition, operational permits, design and construction, finance and accounting, labour laws, customer protection, fair marketing procedures, and environmental frameworks. Also, SML has adopted a zero-tolerance stance towards corruption.
In 2020, there were zero reported incidents of corruption. In addition, no legal cases regarding corruption were brought against the Group or its subsidiaries, and no contracts with business partners had to be terminated due to violations related to corruption.
Over the years, we actively educate our employees on fraud-related risk management, including how to address issues related to corruption, asset misappropriation and accounting fraud. In 2020, our compliance training was transitioned online to accommodate extended WFH arrangements, and is expected to continue into 2021. As usual, during orientation, new employees are introduced to SML’s core values, including the Code of Conduct, the Whistle-Blowing Policy which helps provide additional monitoring on misconduct, and other policies covering procurement and fair employment practices.
Recently, we have set out to strengthen our governance framework to incorporate issues of the environment, as well as health and safety. We also continue to build on our policies governing procurement activities and in 2020, we engaged with key suppliers and contractors to prioritise the use of certified green materials in our projects.
As a responsible operator, we proactively engage with governments whenever we felt that there are gaps in current regulations. For example, in 2020 we lobbied to the local government on solid waste management related regulation, a topic that remains under discussion.
We are pleased to report that in 2020, there were:
0 reported cases
of non-compliance concerning marketing communications and
product information
0reported cases
of non-compliance concerning health and safety impacts of SML’s product and services
0reported cases
of non-compliance concerning all relevant social and economic
laws and regulations
0significant fines or
non-monetary sanctions that were imposed on SML
Building for a Better Future30
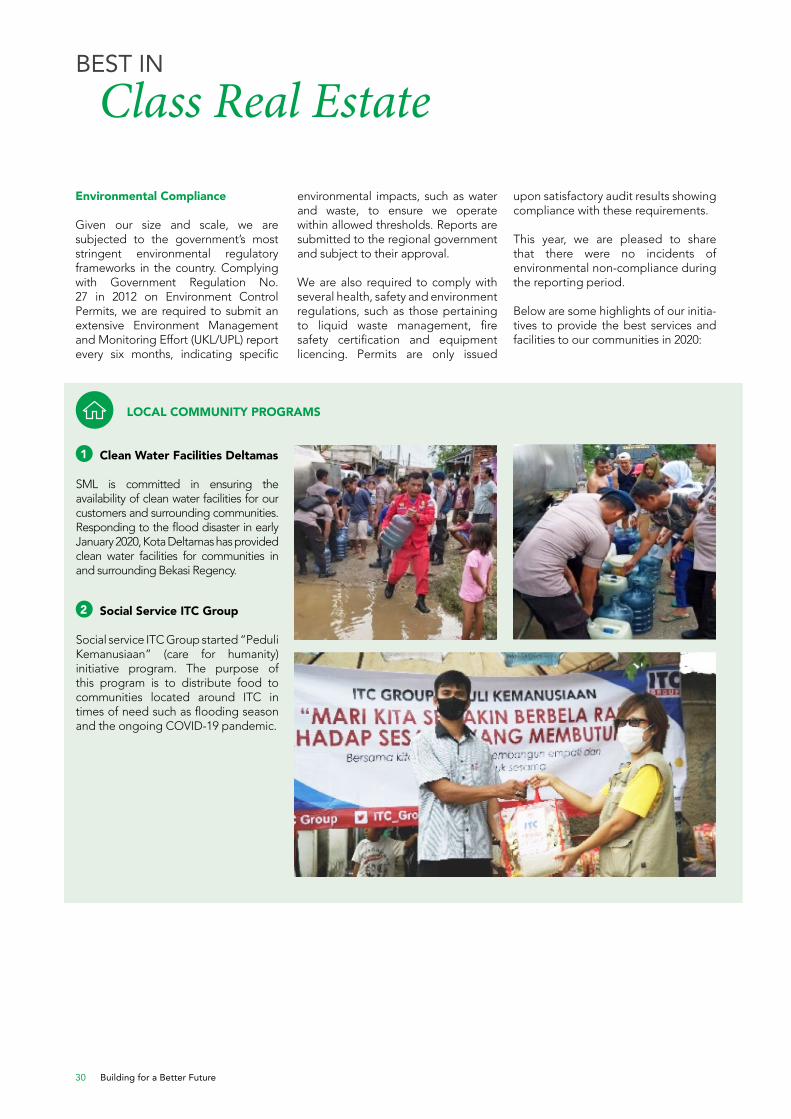
1 Clean Water Facilities Deltamas
SML is committed in ensuring the availability of clean water facilities for our customers and surrounding communities. Responding to the flood disaster in early January 2020, Kota Deltamas has provided clean water facilities for communities in and surrounding Bekasi Regency.
2 Social Service ITC Group
Social service ITC Group started “Peduli Kemanusiaan” (care for humanity) initiative program. The purpose of this program is to distribute food to communities located around ITC in times of need such as flooding season and the ongoing COVID-19 pandemic.
LOCAL COMMUNITY PROGRAMS
BEST IN
Class Real Estate
Environmental Compliance
Given our size and scale, we are subjected to the government’s most stringent environmental regulatory frameworks in the country. Complying with Government Regulation No. 27 in 2012 on Environment Control Permits, we are required to submit an extensive Environment Management and Monitoring Effort (UKL/UPL) report every six months, indicating specific
environmental impacts, such as water and waste, to ensure we operate within allowed thresholds. Reports are submitted to the regional government and subject to their approval.
We are also required to comply with several health, safety and environment regulations, such as those pertaining to liquid waste management, fire safety certification and equipment licencing. Permits are only issued
upon satisfactory audit results showing compliance with these requirements.
This year, we are pleased to share that there were no incidents of environmental non-compliance during the reporting period.
Below are some highlights of our initia-tives to provide the best services and facilities to our communities in 2020:
Sinarmas Land Limited Sustainability Report 2020 31
CLIMATE CHANGE
& the Environment
At Sinarmas Land, we understand the potential impacts climate change can have on Indonesia as a whole and our business. We strive to protect the environment through policies and programs, minimising our impacts while mitigating risks to our operations.
IN THIS SECTION
This section of the report presents our approach to mitigate environmental risks and minimising our contributions to climate change. In doing so, we have identified four key areas of focus:• Optimising Building Operations to
Achieve Clean Environment • Providing and Maintaining Green
Open Space• Providing and Facilitating Various
Type of Public Transportation• Responsible Waste Management
Program
Environmental data for our property management portfolio is categorised into the following groups:• Green Buildings• High-Rise Buildings• Non-Green Buildings• Retail and Hospitality• Commercial• Residential and Township• Trade Centres (including all ITCs)
OPTIMISING BUILDING OPERATIONS TO ACHIEVE CLEAN ENVIRONMENT
SML strives to optimise building performance from the design and development stage, through to property management, in order to minimise the usage of natural resources.
We continuously seek to develop new ideas and innovate to realise green building potential. In 2019, we embarked on a sustainability program integrated across the organisation to better understand and manage our waste and recycling, energy, water and emissions performance. This year, we improved our data calculation and collection processes from projects, including amount of solid waste, use of building materials and water consumption. These initiatives are expected to provide a more accurate baseline for further efficiency targets.
2018
Granite Sand Concrete Steel Marble tile
2,758,901274,359 5,155,522
72737430,428107156,092 50,275
37,45767,426
148,566
2,537,501
5,034
46,01659,156
5,047,283
2,340
2019 2020
Material Used in Development Projects (tonnes)
Materials
As one of Indonesia’s leading real estate developers, we recognised that all our developments, including buildings, supporting amenities and infrastructures have a significant impact on the environment. In 2020, 5.16 million tonnes of materials were used, including 5.05 million tonnes of steel, compared with 2.76 million tonnes of materials used in 2019 6. In particular, we saw significant growth in the usage of steel, largely attributed to the construction of Ruko The Icon 5. Concrete and sand markedly decreased as the construction of most development projects commenced in Q3 2020, while Southgate Apartment and Foresta Business Loft 6 reaches the tail end of their development. We continue to use concrete with recycled content and aim to gradually build our internal monitoring capacity to include other consumable materials and their respective consumed quantities in our internal watchlist, and have them reported in subsequent reports. Also, we continue to abide by relevant environmental regulations to promote transparency and accountability in our supply chain.
6 Data for 2019 has been revised due to changes in calculation methodology.
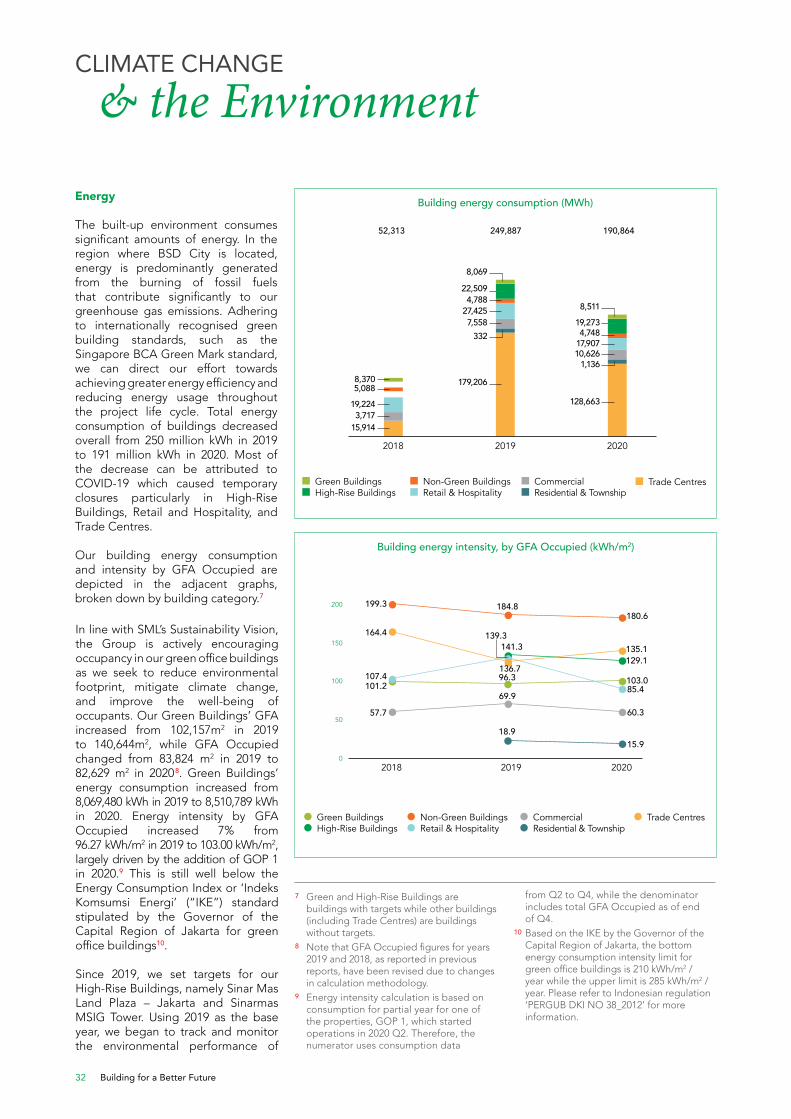
Building for a Better Future32
Energy
The built-up environment consumes significant amounts of energy. In the region where BSD City is located, energy is predominantly generated from the burning of fossil fuels that contribute significantly to our greenhouse gas emissions. Adhering to internationally recognised green building standards, such as the Singapore BCA Green Mark standard, we can direct our effort towards achieving greater energy efficiency and reducing energy usage throughout the project life cycle. Total energy consumption of buildings decreased overall from 250 million kWh in 2019 to 191 million kWh in 2020. Most of the decrease can be attributed to COVID-19 which caused temporary closures particularly in High-Rise Buildings, Retail and Hospitality, and Trade Centres.
Our building energy consumption and intensity by GFA Occupied are depicted in the adjacent graphs, broken down by building category.7
2018
Green Buildings High-Rise Buildings
249,88752,313 190,864
2019 2020
Non-Green Buildings Retail & Hospitality
Building energy consumption (MWh)
128,663
179,206
1,136
332
15,9143,717
19,224
5,0888,370
10,626
7,558
17,907
27,425
4,748
4,788
19,273
22,509
8,511
8,069
Commercial Residential & Township
Trade Centres
Green Buildings High-Rise Buildings
Building energy intensity, by GFA Occupied (kWh/m2)
Non-Green Buildings Retail & Hospitality
2018 2019
139.3
129.1
85.4103.0
60.3
69.9
18.915.9
96.3
57.7
101.2107.4
135.1141.3
184.8199.3
164.4
180.6
20200
50
150
100
200
Commercial Residential & Township
Trade Centres
In line with SML’s Sustainability Vision, the Group is actively encouraging occupancy in our green office buildings as we seek to reduce environmental footprint, mitigate climate change, and improve the well-being of occupants. Our Green Buildings’ GFA increased from 102,157m2 in 2019 to 140,644m2, while GFA Occupied changed from 83,824 m2 in 2019 to 82,629 m2 in 20208. Green Buildings’ energy consumption increased from 8,069,480 kWh in 2019 to 8,510,789 kWh in 2020. Energy intensity by GFA Occupied increased 7% from 96.27 kWh/m2 in 2019 to 103.00 kWh/m2, largely driven by the addition of GOP 1 in 2020.9 This is still well below the Energy Consumption Index or ‘Indeks Komsumsi Energi’ (“IKE”) standard stipulated by the Governor of the Capital Region of Jakarta for green office buildings10.
Since 2019, we set targets for our High-Rise Buildings, namely Sinar Mas Land Plaza – Jakarta and Sinarmas MSIG Tower. Using 2019 as the base year, we began to track and monitor the environmental performance of
7 Green and High-Rise Buildings are buildings with targets while other buildings (including Trade Centres) are buildings without targets.
8 Note that GFA Occupied figures for years 2019 and 2018, as reported in previous reports, have been revised due to changes in calculation methodology.
9 Energy intensity calculation is based on consumption for partial year for one of the properties, GOP 1, which started operations in 2020 Q2. Therefore, the numerator uses consumption data
from Q2 to Q4, while the denominator includes total GFA Occupied as of end of Q4.
10 Based on the IKE by the Governor of the Capital Region of Jakarta, the bottom energy consumption intensity limit for green office buildings is 210 kWh/m2 /year while the upper limit is 285 kWh/m2 /year. Please refer to Indonesian regulation ‘PERGUB DKI NO 38_2012’ for more information.
CLIMATE CHANGE
& the Environment
136.7
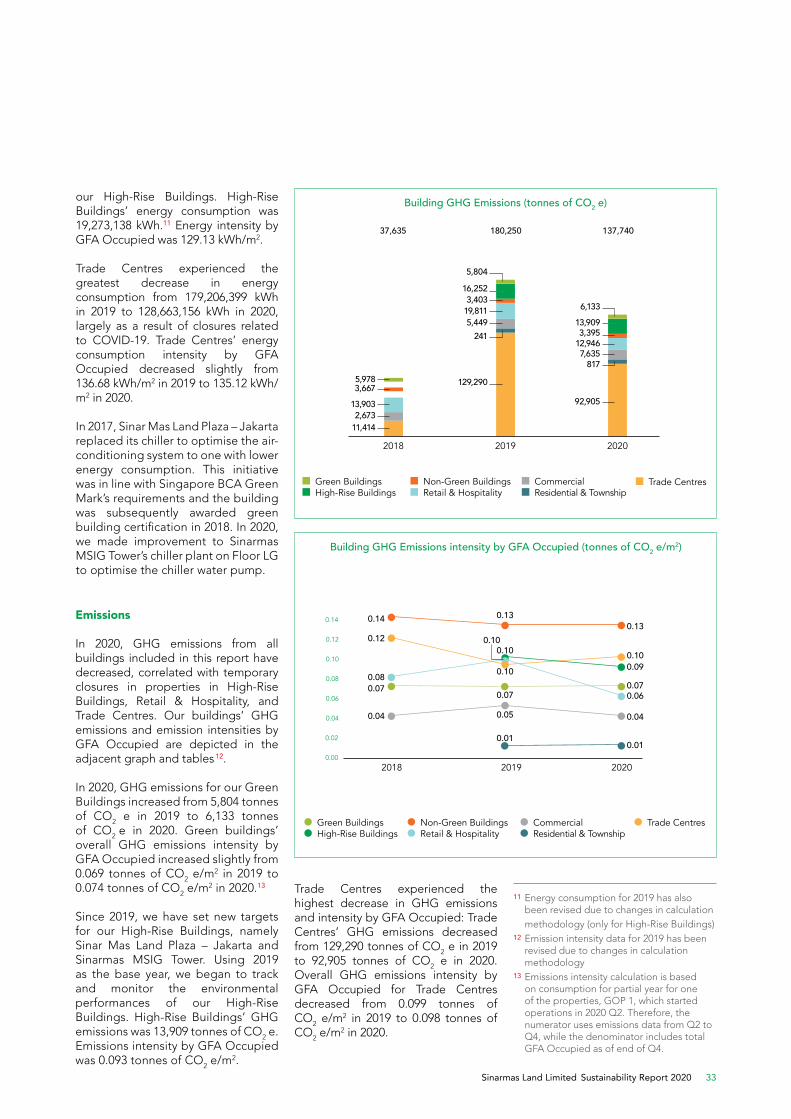
Sinarmas Land Limited Sustainability Report 2020 33
2018
Green Buildings High-Rise Buildings
180,25037,635 137,740
2019 2020
Non-Green Buildings Retail & Hospitality
Building GHG Emissions (tonnes of CO2 e)
92,905
129,290
817
241
11,4142,673
13,903
3,6675,978
7,635
5,449
12,946
19,811
3,395
3,403
13,909
16,252
6,133
5,804
Commercial Residential & Township
Trade Centres
Green Buildings High-Rise Buildings
Building GHG Emissions intensity by GFA Occupied (tonnes of CO2 e/m2)
Non-Green Buildings Retail & Hospitality
2018 2019 2020
Commercial Residential & Township
Trade Centres
our High-Rise Buildings. High-Rise Buildings’ energy consumption was 19,273,138 kWh.11 Energy intensity by GFA Occupied was 129.13 kWh/m2.
Trade Centres experienced the greatest decrease in energy consumption from 179,206,399 kWh in 2019 to 128,663,156 kWh in 2020, largely as a result of closures related to COVID-19. Trade Centres’ energy consumption intensity by GFA Occupied decreased slightly from 136.68 kWh/m2 in 2019 to 135.12 kWh/m2 in 2020.
In 2017, Sinar Mas Land Plaza – Jakarta replaced its chiller to optimise the air-conditioning system to one with lower energy consumption. This initiative was in line with Singapore BCA Green Mark’s requirements and the building was subsequently awarded green building certification in 2018. In 2020, we made improvement to Sinarmas MSIG Tower’s chiller plant on Floor LG to optimise the chiller water pump.
Emissions
In 2020, GHG emissions from all buildings included in this report have decreased, correlated with temporary closures in properties in High-Rise Buildings, Retail & Hospitality, and Trade Centres. Our buildings’ GHG emissions and emission intensities by GFA Occupied are depicted in the adjacent graph and tables 12.
In 2020, GHG emissions for our Green Buildings increased from 5,804 tonnes of CO2 e in 2019 to 6,133 tonnes of CO2 e in 2020. Green buildings’ overall GHG emissions intensity by GFA Occupied increased slightly from 0.069 tonnes of CO2 e/m2 in 2019 to 0.074 tonnes of CO2 e/m2 in 2020.13
Since 2019, we have set new targets for our High-Rise Buildings, namely Sinar Mas Land Plaza – Jakarta and Sinarmas MSIG Tower. Using 2019 as the base year, we began to track and monitor the environmental performances of our High-Rise Buildings. High-Rise Buildings’ GHG emissions was 13,909 tonnes of CO2 e. Emissions intensity by GFA Occupied was 0.093 tonnes of CO2 e/m2.
0.10
0.10
0.09
0.060.07
0.040.05
0.010.01
0.07
0.04
0.070.08
0.100.10
0.130.14
0.120.13
0.00
0.02
0.04
0.06
0.08
0.10
0.12
0.14
11 Energy consumption for 2019 has also been revised due to changes in calculation methodology (only for High-Rise Buildings)
12 Emission intensity data for 2019 has been revised due to changes in calculation methodology
13 Emissions intensity calculation is based on consumption for partial year for one of the properties, GOP 1, which started operations in 2020 Q2. Therefore, the numerator uses emissions data from Q2 to Q4, while the denominator includes total GFA Occupied as of end of Q4.
Trade Centres experienced the highest decrease in GHG emissions and intensity by GFA Occupied: Trade Centres’ GHG emissions decreased from 129,290 tonnes of CO2 e in 2019 to 92,905 tonnes of CO2 e in 2020. Overall GHG emissions intensity by GFA Occupied for Trade Centres decreased from 0.099 tonnes of CO2 e/m2 in 2019 to 0.098 tonnes of CO2 e/m2 in 2020.
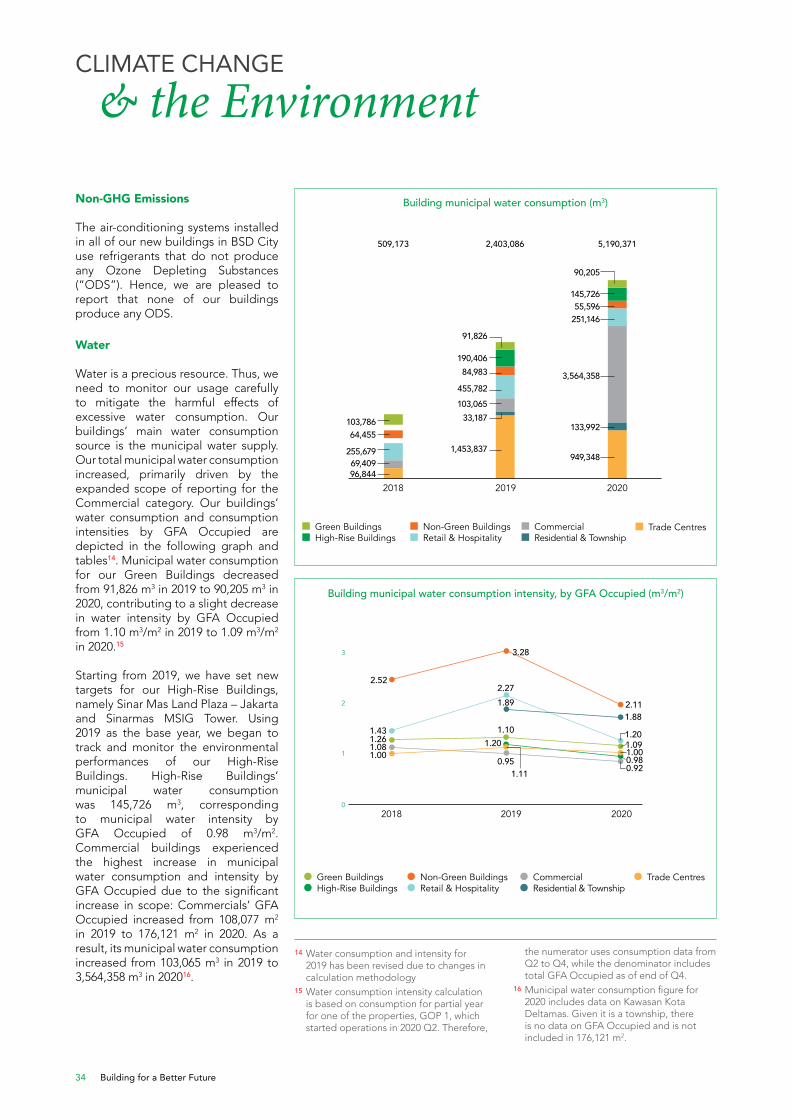
Building for a Better Future34
Water
Water is a precious resource. Thus, we need to monitor our usage carefully to mitigate the harmful effects of excessive water consumption. Our buildings’ main water consumption source is the municipal water supply. Our total municipal water consumption increased, primarily driven by the expanded scope of reporting for the Commercial category. Our buildings’ water consumption and consumption intensities by GFA Occupied are depicted in the following graph and tables14. Municipal water consumption for our Green Buildings decreased from 91,826 m3 in 2019 to 90,205 m3 in 2020, contributing to a slight decrease in water intensity by GFA Occupied from 1.10 m3/m2 in 2019 to 1.09 m3/m2 in 2020.15
Starting from 2019, we have set new targets for our High-Rise Buildings, namely Sinar Mas Land Plaza – Jakarta and Sinarmas MSIG Tower. Using 2019 as the base year, we began to track and monitor the environmental performances of our High-Rise Buildings. High-Rise Buildings’ municipal water consumption was 145,726 m3, corresponding to municipal water intensity by GFA Occupied of 0.98 m3/m2. Commercial buildings experienced the highest increase in municipal water consumption and intensity by GFA Occupied due to the significant increase in scope: Commercials’ GFA Occupied increased from 108,077 m2 in 2019 to 176,121 m2 in 2020. As a result, its municipal water consumption increased from 103,065 m3 in 2019 to 3,564,358 m3 in 202016.
CLIMATE CHANGE
& the Environment
14 Water consumption and intensity for 2019 has been revised due to changes in calculation methodology
15 Water consumption intensity calculation is based on consumption for partial year for one of the properties, GOP 1, which started operations in 2020 Q2. Therefore,
the numerator uses consumption data from Q2 to Q4, while the denominator includes total GFA Occupied as of end of Q4.
16 Municipal water consumption figure for 2020 includes data on Kawasan Kota Deltamas. Given it is a township, there is no data on GFA Occupied and is not included in 176,121 m2.
3,564,358
251,14655,596
145,726
90,205
133,992
949,348
455,782
84,983190,406
91,826
103,06533,187
1,453,83764,455
255,679
103,786
69,40996,844
1.20
1.001.09
0.920.98
1.882.11
2.52
3.28
1.431.261.081.00
2.271.89
1.101.20
1.110.95
1
2
3
Non-GHG Emissions
The air-conditioning systems installed in all of our new buildings in BSD City use refrigerants that do not produce any Ozone Depleting Substances (“ODS”). Hence, we are pleased to report that none of our buildings produce any ODS.
2018
Green Buildings High-Rise Buildings
2,403,086509,173 5,190,371
2019 2020
Non-Green Buildings Retail & Hospitality
Building municipal water consumption (m3)
Commercial Residential & Township
Trade Centres
Green Buildings High-Rise Buildings
Building municipal water consumption intensity, by GFA Occupied (m3/m2)
Non-Green Buildings Retail & Hospitality
2018 2019 20200
Commercial Residential & Township
Trade Centres

Sinarmas Land Limited Sustainability Report 2020 35
17 Rainwater reported here is not recorded by actual volume captured. These figures are instead based on the GREENSHIP Rating issued by Green Building Council (GBC) Indonesia. The calculation uses average rainfall multiplied by wet days in one year (derived from data provided by the meteorological agency), divided by the total catchment area across all three buildings.
18 Includes municipal water, rain water, and ground water.
Two of our Green Buildings , MyRepublic Plaza and GOP 1, use collected rainwater17. Total consumption of rain water across buildings was 1,660 m3 in 2020 (2019: 1,746 m3). Two other Green Buildings, GOP 9 and Sinar Mas Land Plaza – BSD City, are still implementing this system. The collected rainwater is used for gardening activities and flushing of toilets. Through the usage of collected rainwater, we aim to reduce our municipal water footprint, which is critical in water-stressed Jakarta.
We also have systems in place to reuse and recycle used water which is collected from sinks, ablution
2019 2020
Water recycled and reused in buildings
543,081
526,401
% of water recycled and reused (compared against the total water consumption from all sources)
22% 10%
Key Water Initiatives in 2020
Building water consumption from all sources18 (m3) 2018 2019 2020
Green Buildings 108,747 93,572 91,865
High-Rise Buildings N/A 190,406 145,726
Non-Green Buildings 64,455 84,983 55,596
Retail & Hospitality 255,679 445,782 251,146
Commercial 69,409 138,726 3,620,878
Residential & Township N/A 33,187 133,992
Trade Centres 96,844 1,508,747 981,910
Water Initiatives Savings
Use of recycled water from sinks, ablution taps, showers, and air-conditioning systems
526,401 m3 equivalent to IDR 6.6 billion (or approximately S$614,305)
Use of collected rainwater 1,660 m3 equivalent to IDR 20.9 million (or approximately S$1,937)
taps, showers, and air-conditioning systems. Consumption of recycled and reused water decreased modestly from 543,081 m3 in 2019 to 526,401 m3 in 2020. The percentage of recycled and used water from total water usage also decreased from 22% in 2019 to 10% in 2020.
Meanwhile, our consumption of surface water is subjected to strict environmental impact assessments, and it has been found there are no adverse effects on our stakeholders or on local and downstream biodiversity arising from our water use.
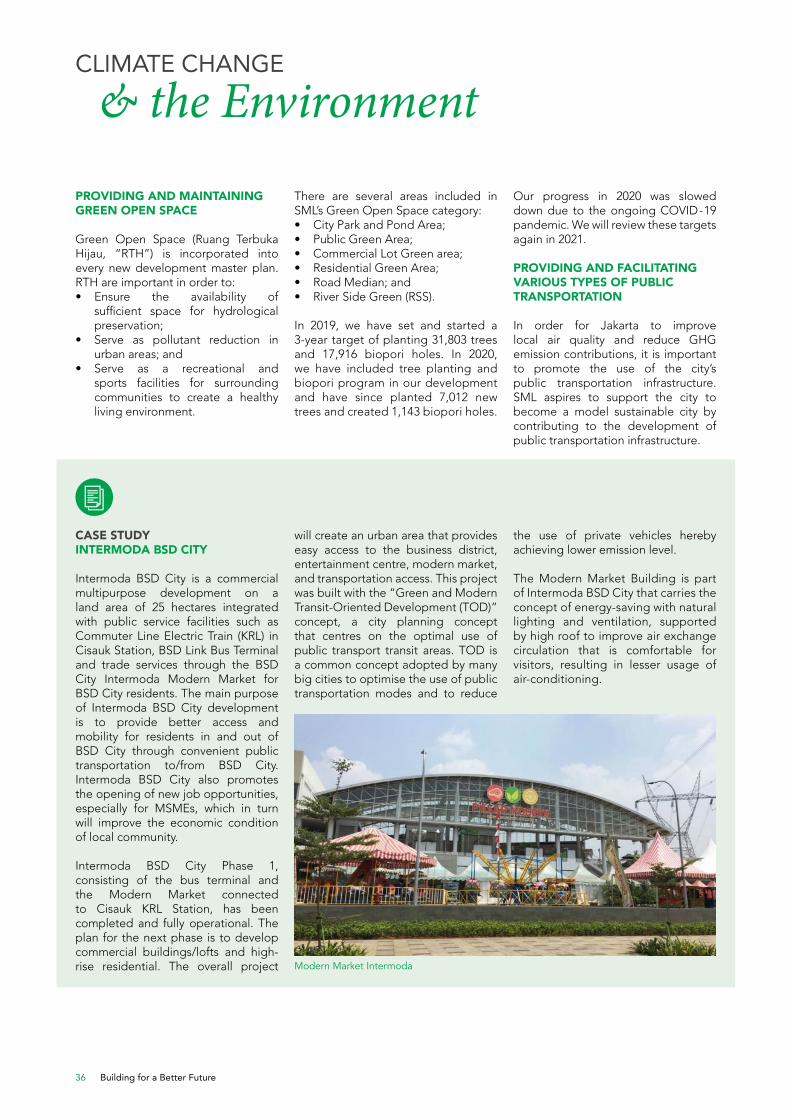
Building for a Better Future36
CLIMATE CHANGE
& the Environment
PROVIDING AND MAINTAINING GREEN OPEN SPACE
Green Open Space (Ruang Terbuka Hijau, “RTH”) is incorporated into every new development master plan. RTH are important in order to:• Ensure the availability of
sufficient space for hydrological preservation;
• Serve as pollutant reduction in urban areas; and
• Serve as a recreational and sports facilities for surrounding communities to create a healthy living environment.
There are several areas included in SML’s Green Open Space category:• City Park and Pond Area;• Public Green Area;• Commercial Lot Green area;• Residential Green Area;• Road Median; and• River Side Green (RSS).
In 2019, we have set and started a 3-year target of planting 31,803 trees and 17,916 biopori holes. In 2020, we have included tree planting and biopori program in our development and have since planted 7,012 new trees and created 1,143 biopori holes.
Our progress in 2020 was slowed down due to the ongoing COVID-19 pandemic. We will review these targets again in 2021.
PROVIDING AND FACILITATING VARIOUS TYPES OF PUBLIC TRANSPORTATION
In order for Jakarta to improve local air quality and reduce GHG emission contributions, it is important to promote the use of the city’s public transportation infrastructure. SML aspires to support the city to become a model sustainable city by contributing to the development of public transportation infrastructure.
CASE STUDYINTERMODA BSD CITY
Intermoda BSD City is a commercial multipurpose development on a land area of 25 hectares integrated with public service facilities such as Commuter Line Electric Train (KRL) in Cisauk Station, BSD Link Bus Terminal and trade services through the BSD City Intermoda Modern Market for BSD City residents. The main purpose of Intermoda BSD City development is to provide better access and mobility for residents in and out of BSD City through convenient public transportation to/from BSD City. Intermoda BSD City also promotes the opening of new job opportunities, especially for MSMEs, which in turn will improve the economic condition of local community.
Intermoda BSD City Phase 1, consisting of the bus terminal and the Modern Market connected to Cisauk KRL Station, has been completed and fully operational. The plan for the next phase is to develop commercial buildings/lofts and high-rise residential. The overall project
will create an urban area that provides easy access to the business district, entertainment centre, modern market, and transportation access. This project was built with the “Green and Modern Transit-Oriented Development (TOD)” concept, a city planning concept that centres on the optimal use of public transport transit areas. TOD is a common concept adopted by many big cities to optimise the use of public transportation modes and to reduce
the use of private vehicles hereby achieving lower emission level.
The Modern Market Building is part of Intermoda BSD City that carries the concept of energy-saving with natural lighting and ventilation, supported by high roof to improve air exchange circulation that is comfortable for visitors, resulting in lesser usage of air-conditioning.
Modern Market Intermoda

Sinarmas Land Limited Sustainability Report 2020 37
Sky Bridge Intermoda
Intermoda bus terminal Modern Market Intermoda
To Cisauk Train Station To Intermoda Terminal
Monthly Intermoda Terminal Skybridge Traffic StatisticJan ‘20 - 31 Dec ‘20
Total
Feb’20
47,292
Jan’20
45,308
52,646 53,972
Mar’20
44,550
40,557
May’20
5,4896,115
Jun’20
8,808
9,554
Jul’20
12,489
13,742
Aug’20
12,152
12,366
Sep’20
10,013
11,721
Oct’20
12,282
13,005
Nov’20
14,721
15,879
Dec’20
14,364
15,424
Apr’20
6,1255,403
97,954101,264
85,107
11,528 11,60418,362
26,231 24,51821,734
25,28730,600 29,788
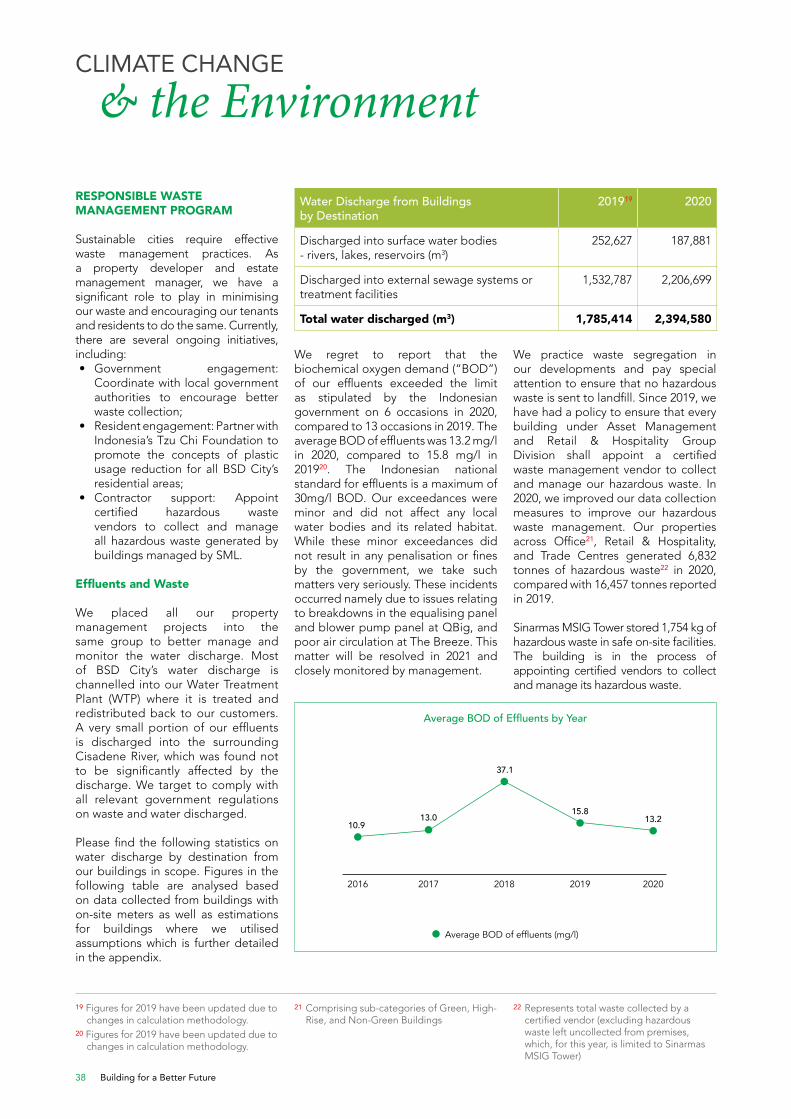
Building for a Better Future38
RESPONSIBLE WASTE MANAGEMENT PROGRAM
Sustainable cities require effective waste management practices. As a property developer and estate management manager, we have a significant role to play in minimising our waste and encouraging our tenants and residents to do the same. Currently, there are several ongoing initiatives, including:• Government engagement:
Coordinate with local government authorities to encourage better waste collection;
• Resident engagement: Partner with Indonesia’s Tzu Chi Foundation to promote the concepts of plastic usage reduction for all BSD City’s residential areas;
• Contractor support: Appoint certified hazardous waste vendors to collect and manage all hazardous waste generated by buildings managed by SML.
Effluents and Waste
We placed all our property management projects into the same group to better manage and monitor the water discharge. Most of BSD City’s water discharge is channelled into our Water Treatment Plant (WTP) where it is treated and redistributed back to our customers. A very small portion of our effluents is discharged into the surrounding Cisadene River, which was found not to be significantly affected by the discharge. We target to comply with all relevant government regulations on waste and water discharged.
Please find the following statistics on water discharge by destination from our buildings in scope. Figures in the following table are analysed based on data collected from buildings with on-site meters as well as estimations for buildings where we utilised assumptions which is further detailed in the appendix.
Water Discharge from Buildings by Destination
201919 2020
Discharged into surface water bodies - rivers, lakes, reservoirs (m3)
252,627 187,881
Discharged into external sewage systems or treatment facilities
1,532,787 2,206,699
Total water discharged (m3) 1,785,414 2,394,580
We regret to report that the biochemical oxygen demand (“BOD”) of our effluents exceeded the limit as stipulated by the Indonesian government on 6 occasions in 2020, compared to 13 occasions in 2019. The average BOD of effluents was 13.2 mg/l in 2020, compared to 15.8 mg/l in 201920. The Indonesian national standard for effluents is a maximum of 30mg/l BOD. Our exceedances were minor and did not affect any local water bodies and its related habitat. While these minor exceedances did not result in any penalisation or fines by the government, we take such matters very seriously. These incidents occurred namely due to issues relating to breakdowns in the equalising panel and blower pump panel at QBig, and poor air circulation at The Breeze. This matter will be resolved in 2021 and closely monitored by management.
19 Figures for 2019 have been updated due to changes in calculation methodology.
20 Figures for 2019 have been updated due to changes in calculation methodology.
21 Comprising sub-categories of Green, High-Rise, and Non-Green Buildings
22 Represents total waste collected by a certified vendor (excluding hazardous waste left uncollected from premises, which, for this year, is limited to Sinarmas MSIG Tower)
We practice waste segregation in our developments and pay special attention to ensure that no hazardous waste is sent to landfill. Since 2019, we have had a policy to ensure that every building under Asset Management and Retail & Hospitality Group Division shall appoint a certified waste management vendor to collect and manage our hazardous waste. In 2020, we improved our data collection measures to improve our hazardous waste management. Our properties across Office21, Retail & Hospitality, and Trade Centres generated 6,832 tonnes of hazardous waste22 in 2020, compared with 16,457 tonnes reported in 2019.
Sinarmas MSIG Tower stored 1,754 kg of hazardous waste in safe on-site facilities. The building is in the process of appointing certified vendors to collect and manage its hazardous waste.
Average BOD of Effluents by Year
Average BOD of effluents (mg/l)
2016
10.913.0
37.1
15.813.2
2017 2018 2019 2020
CLIMATE CHANGE
& the Environment
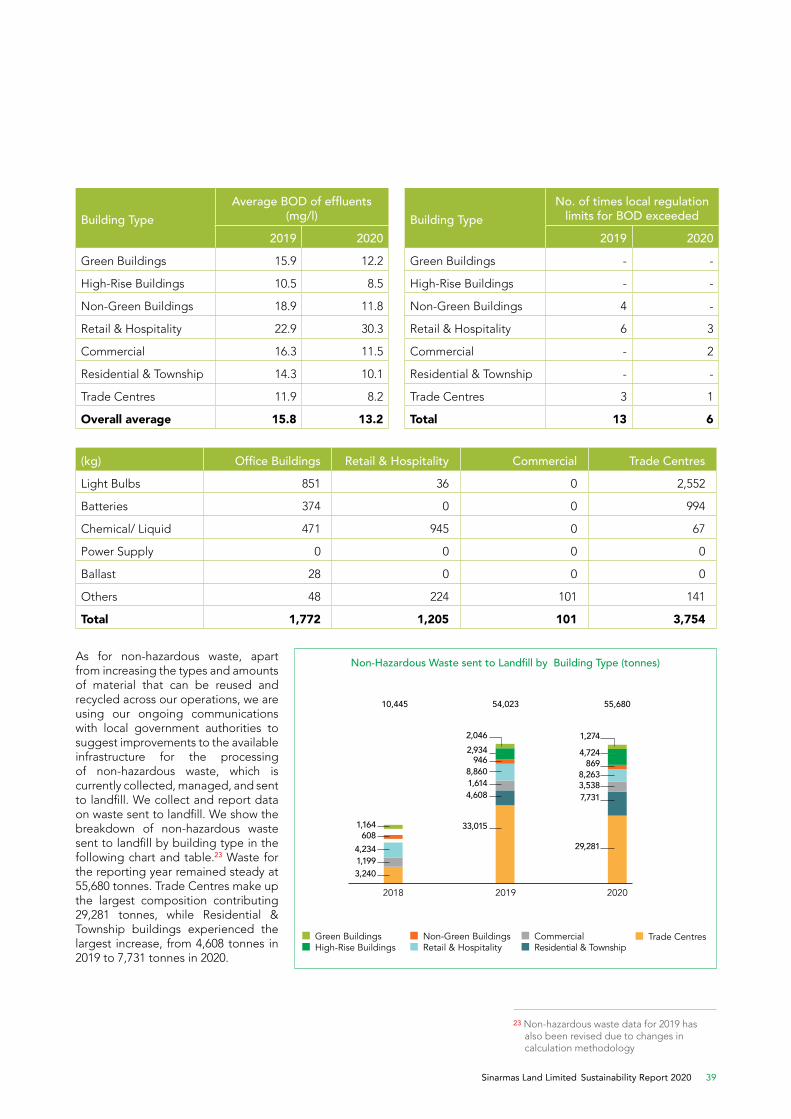
Sinarmas Land Limited Sustainability Report 2020 39
Building TypeAverage BOD of effluents
(mg/l)
2019 2020
Green Buildings 15.9 12.2
High-Rise Buildings 10.5 8.5
Non-Green Buildings 18.9 11.8
Retail & Hospitality 22.9 30.3
Commercial 16.3 11.5
Residential & Township 14.3 10.1
Trade Centres 11.9 8.2
Overall average 15.8 13.2
Building TypeNo. of times local regulation
limits for BOD exceeded
2019 2020
Green Buildings - -
High-Rise Buildings - -
Non-Green Buildings 4 -
Retail & Hospitality 6 3
Commercial - 2
Residential & Township - -
Trade Centres 3 1
Total 13 6
(kg) Office Buildings Retail & Hospitality Commercial Trade Centres
Light Bulbs 851 36 0 2,552
Batteries 374 0 0 994
Chemical/ Liquid 471 945 0 67
Power Supply 0 0 0 0
Ballast 28 0 0 0
Others 48 224 101 141
Total 1,772 1,205 101 3,754
As for non-hazardous waste, apart from increasing the types and amounts of material that can be reused and recycled across our operations, we are using our ongoing communications with local government authorities to suggest improvements to the available infrastructure for the processing of non-hazardous waste, which is currently collected, managed, and sent to landfill. We collect and report data on waste sent to landfill. We show the breakdown of non-hazardous waste sent to landfill by building type in the following chart and table.23 Waste for the reporting year remained steady at 55,680 tonnes. Trade Centres make up the largest composition contributing 29,281 tonnes, while Residential & Township buildings experienced the largest increase, from 4,608 tonnes in 2019 to 7,731 tonnes in 2020.
23 Non-hazardous waste data for 2019 has also been revised due to changes in calculation methodology
29,281
33,015
7,7314,608
3,2401,1994,234
6081,164
3,5381,6148,2638,860
8699464,7242,9341,2742,046
2018
Green Buildings High-Rise Buildings
54,02310,445 55,680
2019 2020
Non-Green Buildings Retail & Hospitality
Non-Hazardous Waste sent to Landfill by Building Type (tonnes)
Commercial Residential & Township
Trade Centres
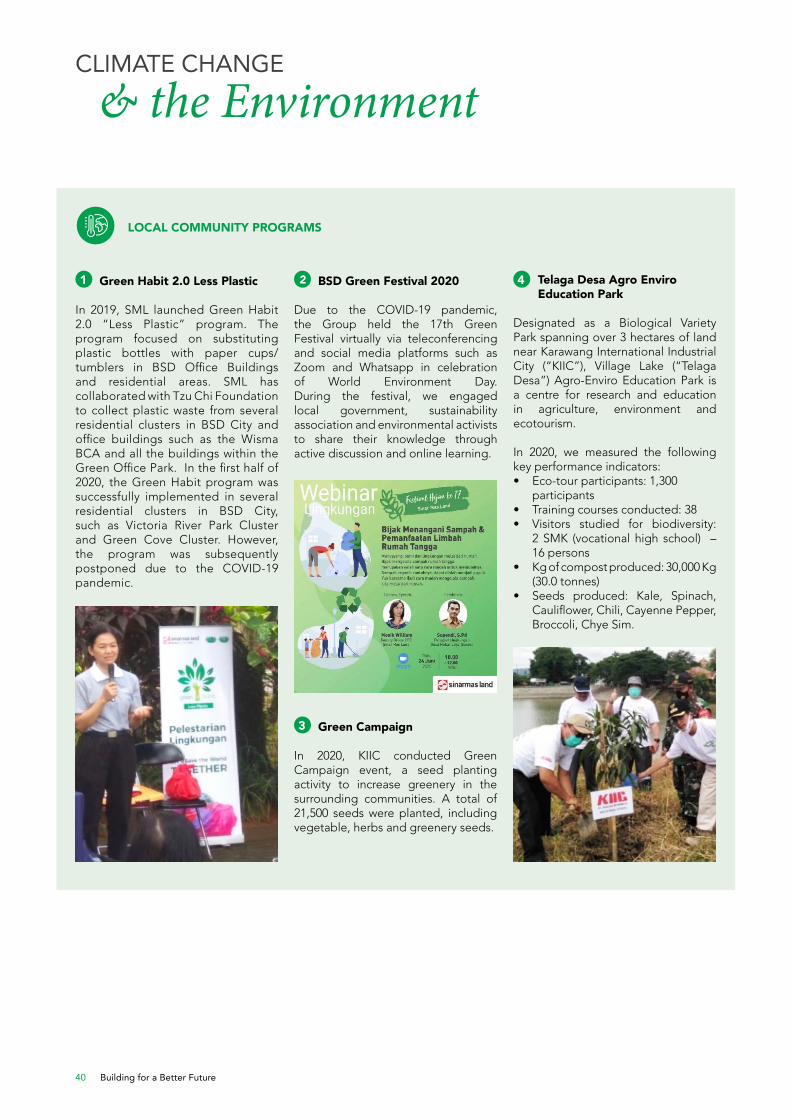
Building for a Better Future40
CLIMATE CHANGE
& the Environment
LOCAL COMMUNITY PROGRAMS
1 Green Habit 2.0 Less Plastic
In 2019, SML launched Green Habit 2.0 “Less Plastic” program. The program focused on substituting plastic bottles with paper cups/tumblers in BSD Office Buildings and residential areas. SML has collaborated with Tzu Chi Foundation to collect plastic waste from several residential clusters in BSD City and office buildings such as the Wisma BCA and all the buildings within the Green Office Park. In the first half of 2020, the Green Habit program was successfully implemented in several residential clusters in BSD City, such as Victoria River Park Cluster and Green Cove Cluster. However, the program was subsequently postponed due to the COVID-19 pandemic.
4 Telaga Desa Agro Enviro Education Park
Designated as a Biological Variety Park spanning over 3 hectares of land near Karawang International Industrial City (“KIIC”), Village Lake (“Telaga Desa”) Agro-Enviro Education Park is a centre for research and education in agriculture, environment and ecotourism.
In 2020, we measured the following key performance indicators:• Eco-tour participants: 1,300
participants • Training courses conducted: 38• Visitors studied for biodiversity:
2 SMK (vocational high school) – 16 persons
• Kg of compost produced: 30,000 Kg (30.0 tonnes)
• Seeds produced: Kale, Spinach, Cauliflower, Chili, Cayenne Pepper, Broccoli, Chye Sim.
2 BSD Green Festival 2020
Due to the COVID-19 pandemic, the Group held the 17th Green Festival virtually via teleconferencing and social media platforms such as Zoom and Whatsapp in celebration of World Environment Day. During the festival, we engaged local government, sustainability association and environmental activists to share their knowledge through active discussion and online learning.
3 Green Campaign
In 2020, KIIC conducted Green Campaign event, a seed planting activity to increase greenery in the surrounding communities. A total of 21,500 seeds were planted, including vegetable, herbs and greenery seeds.
Sinarmas Land Limited Sustainability Report 2020 41
SUSTAINABLE
Community
IN THIS SECTION
Our buildings, developments and projects all form their own communities. We feel that our role is not just to provide physical infrastructure for living and working, but to contribute to the well-being of the people in these communities. Other than being green and innovative, our buildings should also contribute towards a healthy, happy and above all, sustainable community. The following pages provide an insight into our various initiatives contribute to a sustainable community.
Our developments contribute to the well-being of communities through the provision of modern work facilities, safe residential units, valuable commercial buildings and retail centres, local marketplaces for local businesses, accessible public transport and essential services like healthcare and utilities. These facilities support a stable socio-economic environment in these communities. We also acknowledge that construction can be disruptive. Sinarmas Land respects our communities and strive to mitigate any potential negative impacts caused by our activities.
In order to get feedback from our community on how we can continue to serve their well-being as well as mitigate disruptions, we have community engagement initiatives that supplement our customer, tenant and employee surveys, which was mentioned earlier in this report.
We also conduct needs-based community programs such as donation drives, sponsoring local events, contributing to natural disasters relief programs supporting social and environmental campaigns and the development of local worship facilities to contribute to a sustainable and happy community.
In this section of the report, we discuss two areas of work we have embarked on in 2020 to help our communities to prosper and thrive:• Engagement Program for All
Stakeholders• Improving Community Welfare in
Surrounding Development Areas
ENGAGEMENT PROGRAM FOR ALL STAKEHOLDERS
Sinarmas Land continuously engages our communities on various fronts to better understand their needs and opinions on new developments or initiatives. We gather feedback to develop products and deliver services of the highest quality to benefit our communities as well as to understand how we can better manage our potentially negative impacts. We also engage with the media for wider engagement with society and other public entities.
Managing Our Impact on Communities
While our continuous development activities contribute to the vibrancy of the local area, certain activities might unfortunately pose some inconvenience to the surrounding communities. As a baseline, we ensure that both our contractors and employees adhere to the legal requirements stipulated by the Indonesian government with regards to traffic, noise and pollution management. As most construction activities are handled by external contractors, we mandate that every contractor appointed or engaged must be rated by the regional regulator and possess a Construction Service Permit Letter issued by the government. In addition, we have included the following initiatives to avoid negative impacts during construction activities:• Regular communication with the
communities surrounding the development project about our construction plans;
• Mitigate the potentially negative impacts for example reduce noise pollution, reasonable construction hours, keeping the environment clean during construction and many more.
Sinarmas Land comply with Government Regulation No. 27 (2012) on Environment Control Permits that requires every developer to perform an environmental impact assessment (AMDAL) and provide plans to avoid/mitigate the possibility of negative impacts before the commencement of any property development project in Indonesia. This assessment covers the following areas: • Physical, chemical (land, soil,
space, etc.) and biological aspects (habitats and biodiversity);
• Social factors (economics, safety, culture, etc.);
• Community health.
As a result of precautions taken, based on reports from government regulators and issuance of permits, we are pleased to note that during the reporting period, none of our operations were found to have any significant or potentially negative impacts on local communities.
Engagement with Media
The media is a key platform for SML to communicate with the society and other public entities. Our Corporate Communication Division actively engage with the media to provide the latest information on SML products, services and businesses. These engagements are carried out through exclusive interviews, press releases, press conferences (online and in-person where possible), press tours and media gatherings. During the COVID-19 pandemic, Corporate Communication switched to virtual meetings and interviews as much as possible.

Building for a Better Future42
IMPROVING COMMUNITY WELFARE IN SURROUNDING DEVELOPMENT AREA
To support our local community’s welfare, we make targeted and strategic investments into local
infrastructure and community development. Due to restrictions caused by the COVID-19 pandemic, the school renovation program was dropped. As a replacement, SML will launch a new program called “Bedah Rumah” (House Renovation).
CASE STUDYPASAR RAKYAT SCHOOL
Invitation from Ministry of Trade
Modern Market BSD semi-virtual event
Modern Market Intermoda onsite event
Nonetheless, our earlier investments and initiatives continued to provide work opportunities, enhance skills and knowledge for potential talent in communities. Some case studies highlighting this work are:
SUSTAINABLE
Community
Pasar Rakyat School is a comprehensive training program for the public market community to improve the sustainability of MSMEs businesses. Targeting market managers and sellers, the program focuses its training towards digital platform and financial management, as well as maintaining a clean and healthy marketplace.
Pasar Rakyat School was initiated in 2017 and conducted at Modern Market BSD City. Over time, this successful program has improved the livelihoods of its participants and is now an acknowledged program by the Indonesia Ministry of Trade. Today, Modern Market BSD City has become a role model for modern market in Indonesia, and the program is rolled
Pasar Rakyat School Number of events and participants
Number of events Number of participants (market managers)
2017
1,300
600
15
165
2018 2019 2020
450
2916 6
out to many public markets across Indonesia.
There are two types of events in Pasar Rakyat School program:1. Internal events: Conducted and
organised by SML, our team share best practices to enhance knowledge of sellers and market managers.
2. External events: Accepting invitation from local government and agencies to speak and share good governance practice for modern market in other cities or regions.
The program is conducted and delivered through the following methods: i. Training; ii. Seminar;iii. Workshop;
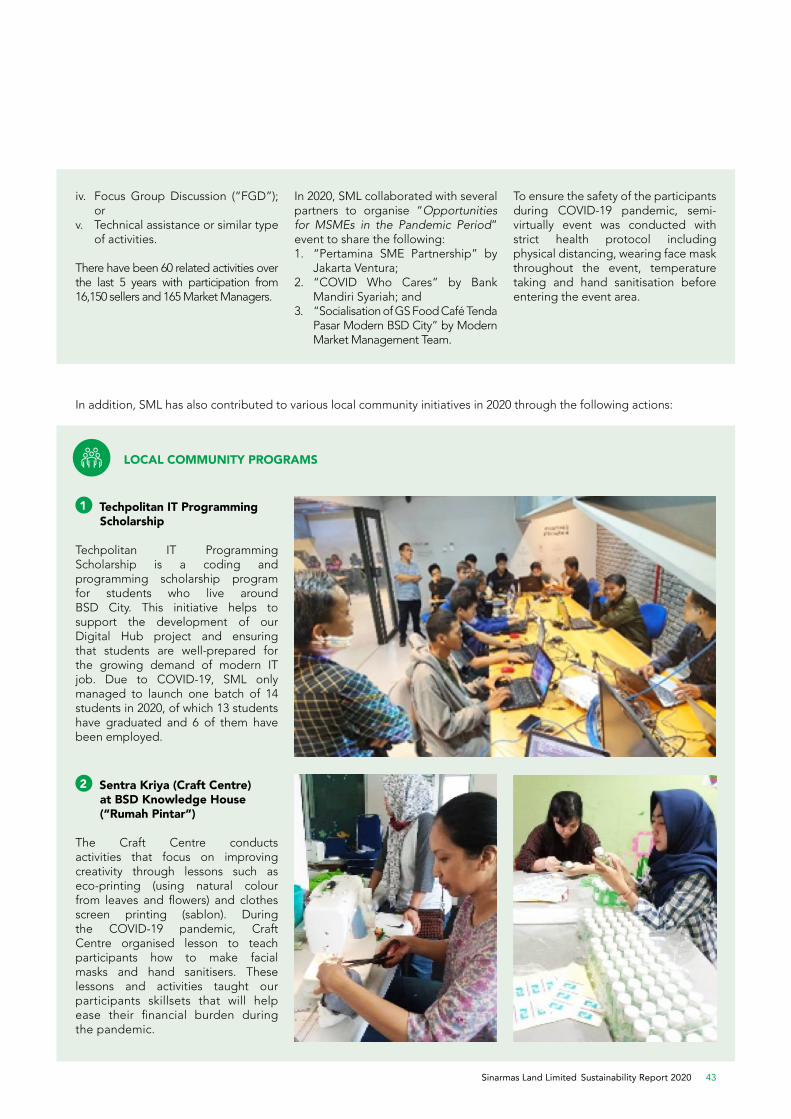
Sinarmas Land Limited Sustainability Report 2020 43
iv. Focus Group Discussion (“FGD”); or
v. Technical assistance or similar type of activities.
There have been 60 related activities over the last 5 years with participation from 16,150 sellers and 165 Market Managers.
In addition, SML has also contributed to various local community initiatives in 2020 through the following actions:
LOCAL COMMUNITY PROGRAMS
1 Techpolitan IT Programming Scholarship
Techpolitan IT Programming Scholarship is a coding and programming scholarship program for students who live around BSD City. This initiative helps to support the development of our Digital Hub project and ensuring that students are well-prepared for the growing demand of modern IT job. Due to COVID-19, SML only managed to launch one batch of 14 students in 2020, of which 13 students have graduated and 6 of them have been employed.
2 Sentra Kriya (Craft Centre) at BSD Knowledge House (“Rumah Pintar”)
The Craft Centre conducts activities that focus on improving creativity through lessons such as eco-printing (using natural colour from leaves and flowers) and clothes screen printing (sablon). During the COVID-19 pandemic, Craft Centre organised lesson to teach participants how to make facial masks and hand sanitisers. These lessons and activities taught our participants skillsets that will help ease their financial burden during the pandemic.
In 2020, SML collaborated with several partners to organise “Opportunities for MSMEs in the Pandemic Period” event to share the following:1. “Pertamina SME Partnership” by
Jakarta Ventura;2. “COVID Who Cares” by Bank
Mandiri Syariah; and3. “Socialisation of GS Food Café Tenda
Pasar Modern BSD City” by Modern Market Management Team.
To ensure the safety of the participants during COVID-19 pandemic, semi-virtually event was conducted with strict health protocol including physical distancing, wearing face mask throughout the event, temperature taking and hand sanitisation before entering the event area.
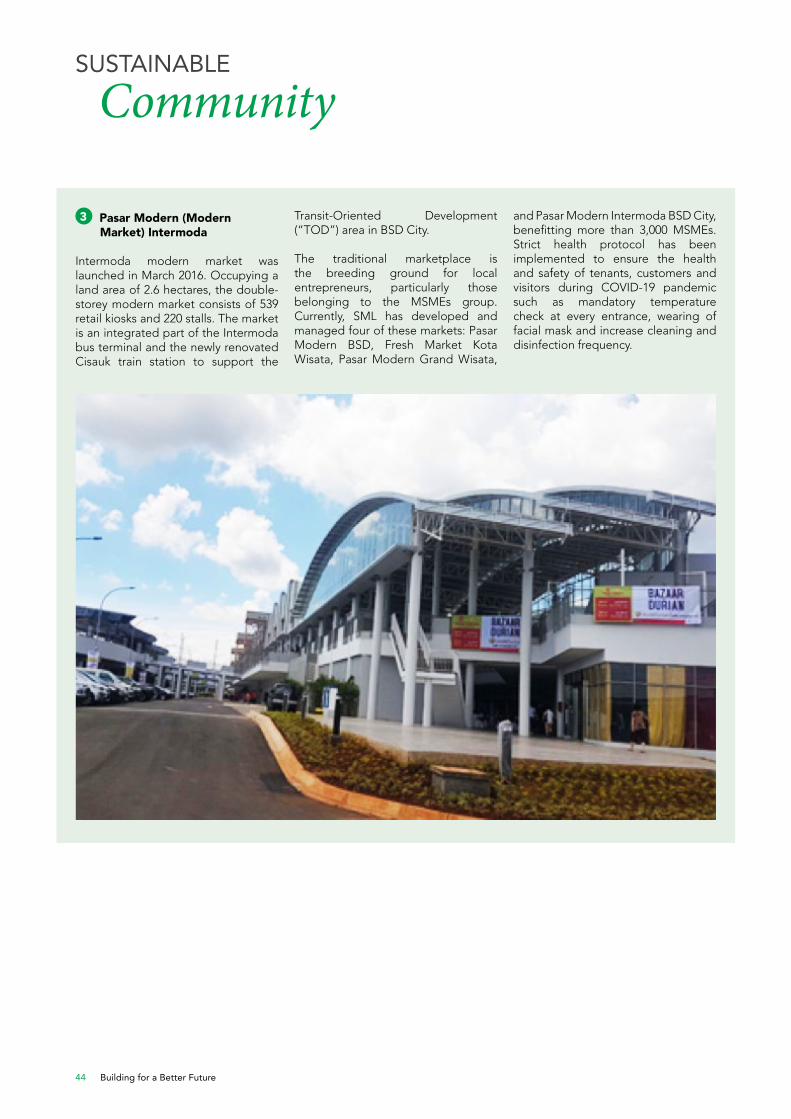
Building for a Better Future44
3 Pasar Modern (Modern Market) Intermoda
Intermoda modern market was launched in March 2016. Occupying a land area of 2.6 hectares, the double-storey modern market consists of 539 retail kiosks and 220 stalls. The market is an integrated part of the Intermoda bus terminal and the newly renovated Cisauk train station to support the
Transit-Oriented Development (“TOD”) area in BSD City.
The traditional marketplace is the breeding ground for local entrepreneurs, particularly those belonging to the MSMEs group. Currently, SML has developed and managed four of these markets: Pasar Modern BSD, Fresh Market Kota Wisata, Pasar Modern Grand Wisata,
and Pasar Modern Intermoda BSD City, benefitting more than 3,000 MSMEs. Strict health protocol has been implemented to ensure the health and safety of tenants, customers and visitors during COVID-19 pandemic such as mandatory temperature check at every entrance, wearing of facial mask and increase cleaning and disinfection frequency.
SUSTAINABLE
Community

Sinarmas Land Limited Sustainability Report 2020 45
EDUCATIONAL
Patronage
IN THIS SECTION
Educational Patronage is an area in which we place strong emphasis and take a long-term approach. We invest heavily in education for our employees and our surrounding communities. This section of the report provides an overview of the investments SML made to enhance and drive educational development.
An educated and self-sufficient population can drive success both for our nation and for our business. Elevating the level of national education will alleviate poverty and improve livelihoods for the nation as a whole. In addition, a strong education system will provide a stable pipeline of diverse talent for the long-term success of our business. Hence, we are determined to support the education system within our organisation and the surrounding communities.
Internally, we provide various learning opportunities to improve our employees’ knowledge and skillsets. We have a set of policies and targets to maintain the quality of our human resources and talents.
Externally, we support learning and knowledge development for our communities in a number of ways. The key objective of these programs is to provide equal opportunity to members of local communities, particularly those who have limited access to develop knowledge and skills to support themselves.
SML provides both educational and financial support, as well as providing infrastructure and learning spaces such as schools and community learning centres.
In 2020, we continued our focus on the following initiatives:• Initiating Program to Support
Knowledge Enhancement• Improving Educational Method and
Facility
INITIATING PROGRAMS TO SUPPORT KNOWLEDGE ENHANCEMENT
Training and Development
At Sinarmas Land, we operate an annual employee training and professional certification program. This program is fully funded by our annual training budget and consists of specific programs that address our employees’ training needs. By equipping our team with the knowledge and skills they need, it will contribute to the growth of their career and our Group. We want to nurture our employees and local talent by providing them with the knowledge and abilities to excel, hereby helping to create a more resilient national workforce. In addition, we provide on-the-job training opportunities and support sufficiently qualified staff by paying for their relevant professional bodies’ membership fees, such as chartered engineers.
All SML employees are required to undergo mandatory training specific to their job function as part of their skills enhancement every year. As of 31 December 2020, a total of 12,157
Total number training hours and average number of training hours per year per employee, by gender
Male
Total number of training hours
2.74
4.507,267
4,890
Female
Average no. of training hours ( Denominator: no. of employees in gender category
Male Female
Average hours of training per year per employee, by employee category
23.02
20.59
5.35
3.083.48
0.120.34
6.09
34.58
30.60
Top Management
Senior Managers
Managers (Dept)
Staff
Non-Staff
hours of training were conducted for all employees throughout the year. This is an equivalent to an average of 2.74 training hours for our male employees and 4.50 training hours for female employees.
Employee Performance
To keep track of employee training needs, we conduct semi-annual performance and career development reviews. This KPI-based formal review is an important milestone in our employees’ career as their performances, strengths and areas of improvement are evaluated transparently and objectively, which will then form the basis for additional training or promotion. Group Division Heads identify and introduce suitable training and development programs to tailor to their division employees’ needs based on employees’ previous year performances, results and career plans. In 2020, all employees of all genders and employee categories (senior management, executives, and non-executives) received regular performance and career development review.
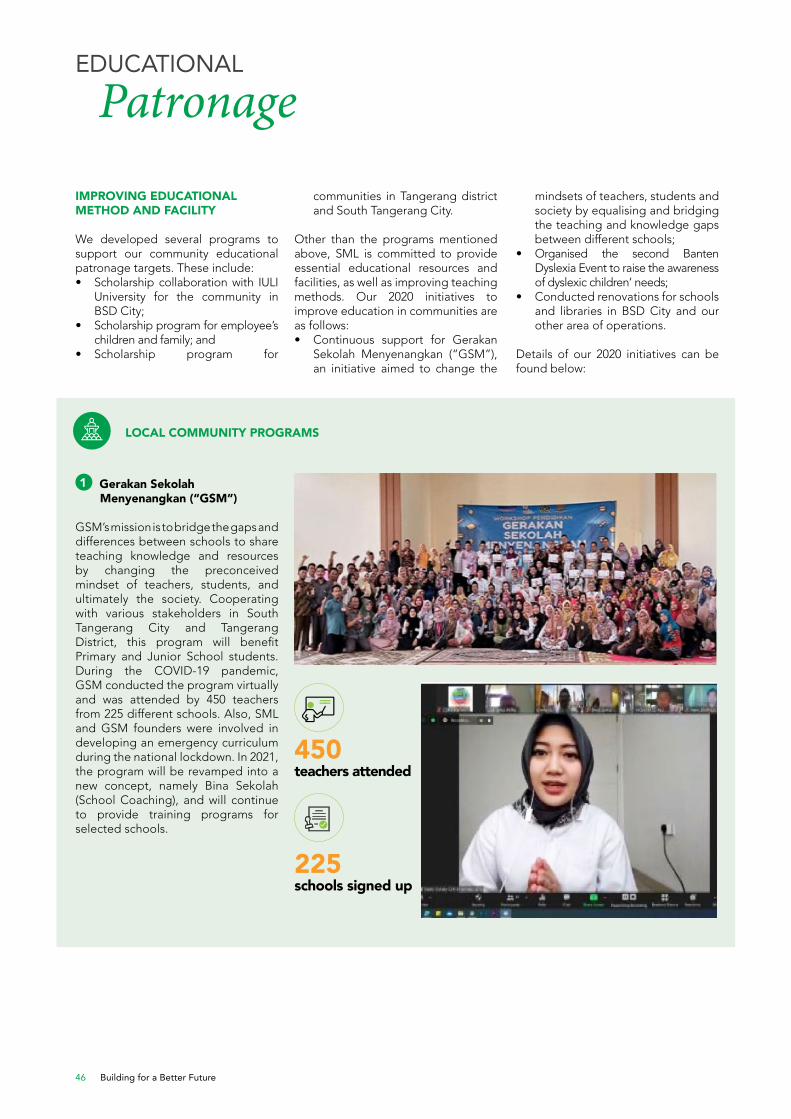
Building for a Better Future46
IMPROVING EDUCATIONAL METHOD AND FACILITY
We developed several programs to support our community educational patronage targets. These include:• Scholarship collaboration with IULI
University for the community in BSD City;
• Scholarship program for employee’s children and family; and
• Scholarship program for
LOCAL COMMUNITY PROGRAMS
communities in Tangerang district and South Tangerang City.
Other than the programs mentioned above, SML is committed to provide essential educational resources and facilities, as well as improving teaching methods. Our 2020 initiatives to improve education in communities are as follows: • Continuous support for Gerakan
Sekolah Menyenangkan (“GSM”), an initiative aimed to change the
EDUCATIONAL
Patronage
1 Gerakan Sekolah Menyenangkan (“GSM”)
GSM’s mission is to bridge the gaps and differences between schools to share teaching knowledge and resources by changing the preconceived mindset of teachers, students, and ultimately the society. Cooperating with various stakeholders in South Tangerang City and Tangerang District, this program will benefit Primary and Junior School students. During the COVID-19 pandemic, GSM conducted the program virtually and was attended by 450 teachers from 225 different schools. Also, SML and GSM founders were involved in developing an emergency curriculum during the national lockdown. In 2021, the program will be revamped into a new concept, namely Bina Sekolah (School Coaching), and will continue to provide training programs for selected schools.
450 teachers attended
225 schools signed up
mindsets of teachers, students and society by equalising and bridging the teaching and knowledge gaps between different schools;
• Organised the second Banten Dyslexia Event to raise the awareness of dyslexic children’ needs;
• Conducted renovations for schools and libraries in BSD City and our other area of operations.
Details of our 2020 initiatives can be found below:
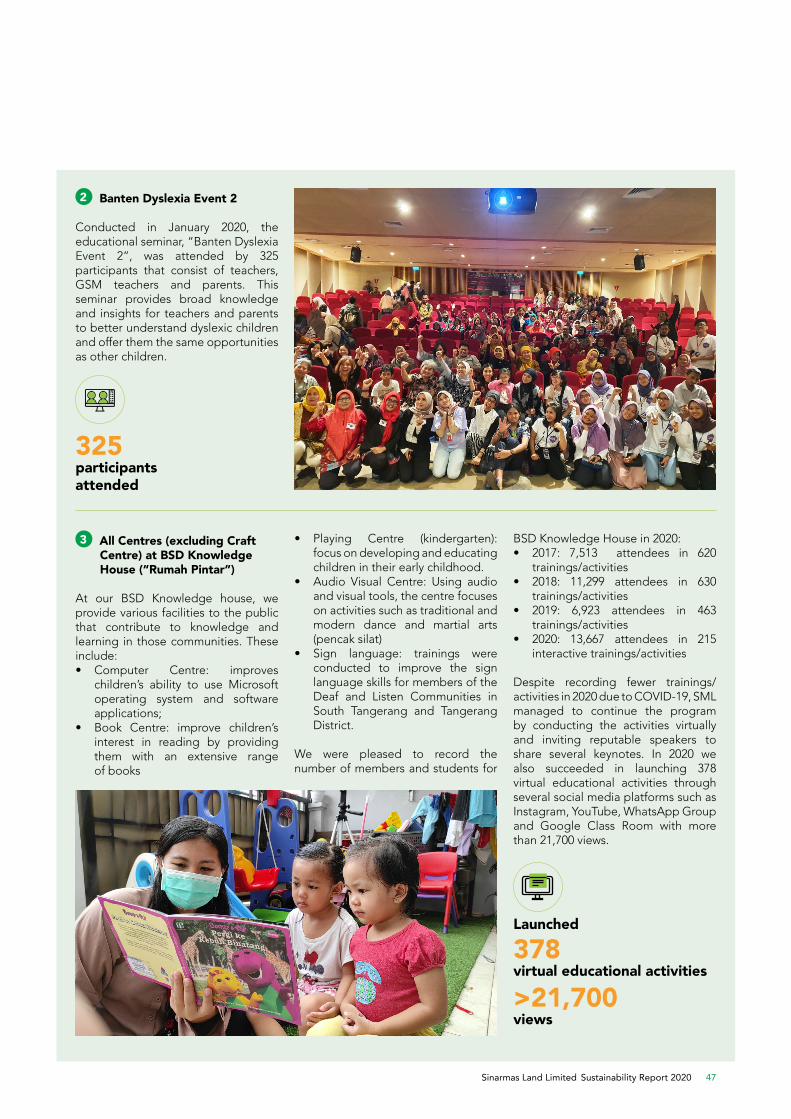
Sinarmas Land Limited Sustainability Report 2020 47
2 Banten Dyslexia Event 2
Conducted in January 2020, the educational seminar, “Banten Dyslexia Event 2”, was attended by 325 participants that consist of teachers, GSM teachers and parents. This seminar provides broad knowledge and insights for teachers and parents to better understand dyslexic children and offer them the same opportunities as other children.
3 All Centres (excluding Craft Centre) at BSD Knowledge House (“Rumah Pintar”)
At our BSD Knowledge house, we provide various facilities to the public that contribute to knowledge and learning in those communities. These include:• Computer Centre: improves
children’s ability to use Microsoft operating system and software applications;
• Book Centre: improve children’s interest in reading by providing them with an extensive range of books
• Playing Centre (kindergarten): focus on developing and educating children in their early childhood.
• Audio Visual Centre: Using audio and visual tools, the centre focuses on activities such as traditional and modern dance and martial arts (pencak silat)
• Sign language: trainings were conducted to improve the sign language skills for members of the Deaf and Listen Communities in South Tangerang and Tangerang District.
We were pleased to record the number of members and students for
BSD Knowledge House in 2020:• 2017: 7,513 attendees in 620
trainings/activities• 2018: 11,299 attendees in 630
trainings/activities• 2019: 6,923 attendees in 463
trainings/activities• 2020: 13,667 attendees in 215
interactive trainings/activities
Despite recording fewer trainings/activities in 2020 due to COVID-19, SML managed to continue the program by conducting the activities virtually and inviting reputable speakers to share several keynotes. In 2020 we also succeeded in launching 378 virtual educational activities through several social media platforms such as Instagram, YouTube, WhatsApp Group and Google Class Room with more than 21,700 views.
325 participants attended
Launched
378 virtual educational activities
>21,700 views

Building for a Better Future48
APPENDIX A: NOTES FOR
Sustainability Performance DataENVIRONMENT
1. Buildings’ energy consumption, GHG emissions, and respective intensities data include our use of electricity from the grid and diesel fuel for emergency purposes in our back-up generators. Our processes do not use any heating, cooling, or steam consumption.
2. We do not sell any electricity, heating, cooling, or steam energy to other organisations.
3. Gross Floor Area (“GFA”) for intensity figures: GFA is identified based on the Built Drawing Data and Tenant Relation Data (based on Tenant Agreement).
4. All covered floor areas of a building (except otherwise exempted), indoor and basement parking areas, and uncovered areas for commercial uses, are deemed to be the gross floor area of the building.
5. We also report our intensity figures on a GFA Occupied basis. GFA Occupied is calculated by multiplying occupancy rate (simple average of monthly occupancy rates) with the GFA.
6. Building and development site details including property type, approximate net leasable area, project site area, and expected completion date are available in SML’s Annual Report 2020 (Property Portfolio).
7. Green Buildings’ intensity figures for energy consumption, water consumption and greenhouse gas emissions in 2018 and 2019 were revised due to a correction in GFA and/or GFA Occupied for Sinar Mas Land Plaza - BSD City, MyRepublic Plaza, and GOP 9.
8. High-Rise Buildings’ energy consumption figure in 2019 was revised due to a correction in consumption data for common area.
9. Non-Green Buildings’ intensity figures for energy consumption, water consumption, and greenhouse gas emissions in 2019, were revised due to corrections in GFA and GFA Occupied for BSD Permit and Township Office.
10. Retail & Hospitality’s intensity figures for energy consumption, water consumption, and greenhouse gas emissions in
2018 and 2019 were revised due to corrections in GFA and GFA Occupied for QBig BSD City.
11. Residential & Township’s intensity figures for energy consumption, water consumption, and greenhouse gas emissions in 2019 were revised due to corrections in GFA and GFA Occupied for BSD Modern Market.
12. Commercial’s intensity figures for energy consumption, water consumption, and greenhouse gas emissions in 2018 and 2019 were revised due to corrections in GFA and GFA Occupied for The Elements Jakarta and changes in calculation methodology for aggregate across Trade Centres.
13. Water consumption and discharge data for Green Buildings in 2018 and 2019, and Commercial in 2019 were revised due to changes in calculation methodology for GOP 9 and Akasa Apartment.
14. BOD of effluent data for Green Buildings in 2018, High-Rise Buildings in 2019, and Trade Centres for 2019 were revised due to changes in calculation methodology for Sinar Mas Land Plaza - BSD City, Cashbac, and aggregate across Trade Centres.
15. Non-hazardous waste data for Green Buildings in 2019 was revised due to changes in calculation methodology for MyRepublic Plaza.
16. Standards and methodologies used for unit conversion of diesel fuel are based on the Carbon Disclosure Project.
17. Greenhouse gas conversion is based on the Greenhouse Gas Protocol.
18. Emission factors for electricity consumption are sourced from the Standard Pedoman Teknis Perhitungan Baseline Gas Rumah Kaca Sektor Berbasis Energi Republik Indonesia, Area Jamali (Jawa-Madura Bali): 0.725 kg/CO2/kWh.
19. Greenhouse Gas Protocol Emission Factors from Cross Sector Tools, March 2017 were used for diesel conversions. The gases included in the conversion of diesel are CO2, CH4 and N2O.
20. Our water consumption data is based on the standards and methodologies defined by the
Indonesian National Standard and Indonesian regulation for water supply. Calculation of water discharge was performed in the following manner. While 2020’s scope expanded, we are aware that not all building has installed on-site meter to measure water discharge due to their designs. The following buildings have on-site meters as of 2020 to measure water discharge:
• Green Buildings: MyRepublic Plaza, GOP 1
• High-Rise Buildings: Sinar Mas Land Plaza - Jakarta Tower II & III
• Non-Green Buildings: Wisma BCA BSD City
• Retail & Hospitality: QBig BSD City
• Commercial: Hotel Le Premier Kota Deltamas, Kawasan Kota Deltamas
• Trade Centres: ITC BSD, BSD Junction, Mall Mangga Dua, ITC Cempaka Mas, ITC Depok, ITC Fatmawati, Graha Cempaka Mas, ITC Roxy Mas, ITC Permata Hijau, ITC Mangga Dua
For buildings without on-site meters, we made estimations on the volume of water discharged. Among the buildings in scope, for Sinar Mas Land Plaza - Jakarta Tower I and Cashbac, we set the volume of water discharged equal to the amount of water consumption.
For the rest of buildings in scope, the volume of water discharged is based on the assumption that volume of water discharge from a building is approximately 80% of water consumption for each building. This methodology is aligned with international standards and the Indonesian government’s Ministry of Public Work and Housing. We have applied this methodology to determine the water discharge volume for the following buildings in scope:
• Green Buildings: Sinar Mas Land Plaza - BSD City, GOP 9
• High-Rise Buildings: Sinarmas MSIG Tower
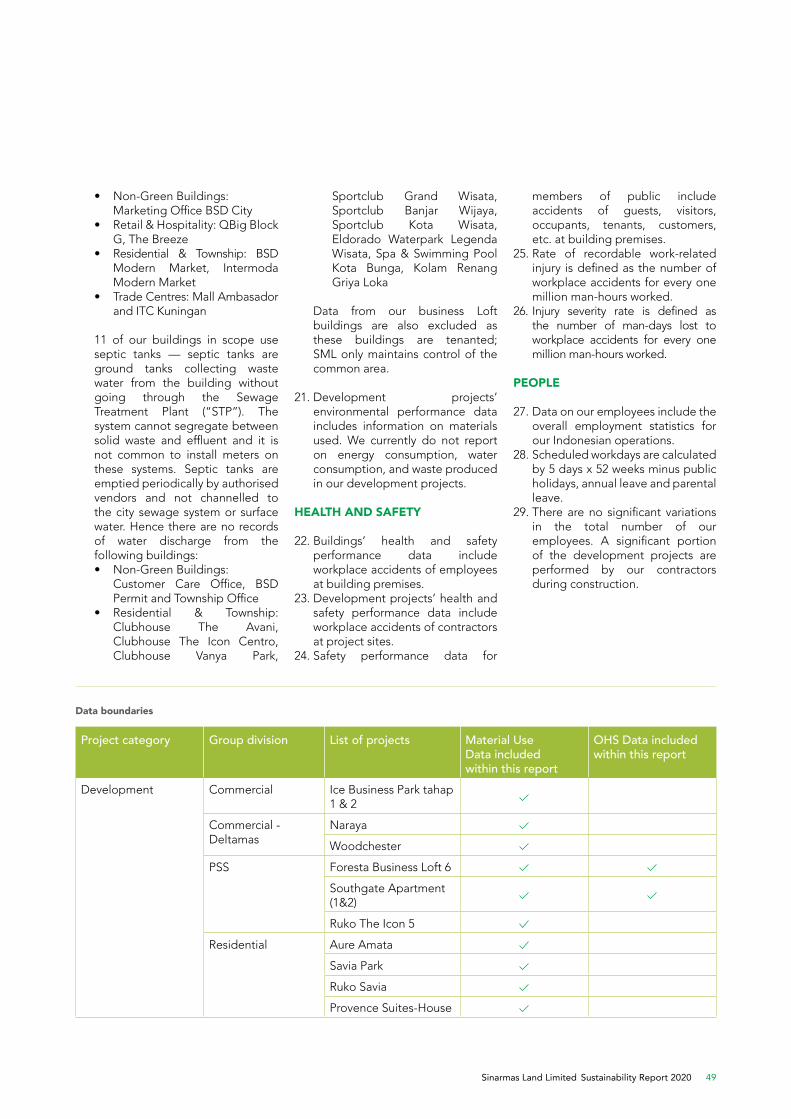
Sinarmas Land Limited Sustainability Report 2020 49
• Non-Green Buildings: Marketing Office BSD City
• Retail & Hospitality: QBig Block G, The Breeze
• Residential & Township: BSD Modern Market, Intermoda Modern Market
• Trade Centres: Mall Ambasador and ITC Kuningan
11 of our buildings in scope use
septic tanks — septic tanks are ground tanks collecting waste water from the building without going through the Sewage Treatment Plant (“STP”). The system cannot segregate between solid waste and effluent and it is not common to install meters on these systems. Septic tanks are emptied periodically by authorised vendors and not channelled to the city sewage system or surface water. Hence there are no records of water discharge from the following buildings:
• Non-Green Buildings: Customer Care Office, BSD
Permit and Township Office • Residential & Township:
Clubhouse The Avani, Clubhouse The Icon Centro, Clubhouse Vanya Park,
Sportclub Grand Wisata, Sportclub Banjar Wijaya, Sportclub Kota Wisata, Eldorado Waterpark Legenda Wisata, Spa & Swimming Pool Kota Bunga, Kolam Renang Griya Loka
Data from our business Loft buildings are also excluded as these buildings are tenanted; SML only maintains control of the common area.
21. Development projects’ environmental performance data includes information on materials used. We currently do not report on energy consumption, water consumption, and waste produced in our development projects.
HEALTH AND SAFETY
22. Buildings’ health and safety performance data include workplace accidents of employees at building premises.
23. Development projects’ health and safety performance data include workplace accidents of contractors at project sites.
24. Safety performance data for
Project category Group division List of projects Material UseData included within this report
OHS Data included within this report
Development Commercial Ice Business Park tahap 1 & 2
Commercial - Deltamas
Naraya
Woodchester
PSS Foresta Business Loft 6
Southgate Apartment (1&2)
Ruko The Icon 5
Residential Aure Amata
Savia Park
Ruko Savia
Provence Suites-House
Data boundaries
members of public include accidents of guests, visitors, occupants, tenants, customers, etc. at building premises.
25. Rate of recordable work-related injury is defined as the number of workplace accidents for every one million man-hours worked.
26. Injury severity rate is defined as the number of man-days lost to workplace accidents for every one million man-hours worked.
PEOPLE
27. Data on our employees include the overall employment statistics for our Indonesian operations.
28. Scheduled workdays are calculated by 5 days x 52 weeks minus public holidays, annual leave and parental leave.
29. There are no significant variations in the total number of our employees. A significant portion of the development projects are performed by our contractors during construction.
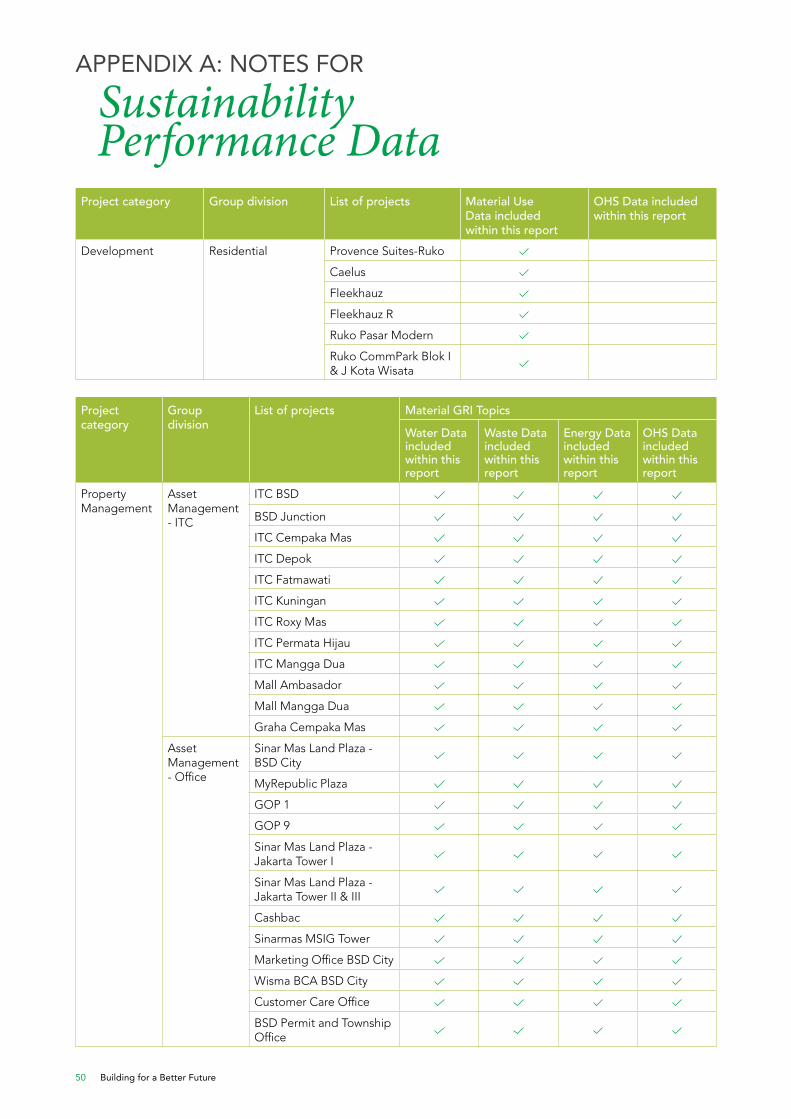
Building for a Better Future50
Project category Group division List of projects Material UseData included within this report
OHS Data included within this report
Development Residential Provence Suites-Ruko
Caelus
Fleekhauz
Fleekhauz R
Ruko Pasar Modern
Ruko CommPark Blok I & J Kota Wisata
Project category
Group division
List of projects Material GRI Topics
Water Data included within this report
Waste Data included within this report
Energy Data included within this report
OHS Data included within this report
Property Management
Asset Management - ITC
ITC BSD
BSD Junction
ITC Cempaka Mas
ITC Depok
ITC Fatmawati
ITC Kuningan
ITC Roxy Mas
ITC Permata Hijau
ITC Mangga Dua
Mall Ambasador
Mall Mangga Dua
Graha Cempaka Mas
Asset Management - Office
Sinar Mas Land Plaza - BSD City
MyRepublic Plaza
GOP 1
GOP 9
Sinar Mas Land Plaza - Jakarta Tower I
Sinar Mas Land Plaza - Jakarta Tower II & III
Cashbac
Sinarmas MSIG Tower
Marketing Office BSD City
Wisma BCA BSD City
Customer Care Office
BSD Permit and Township Office
APPENDIX A: NOTES FOR
Sustainability Performance Data
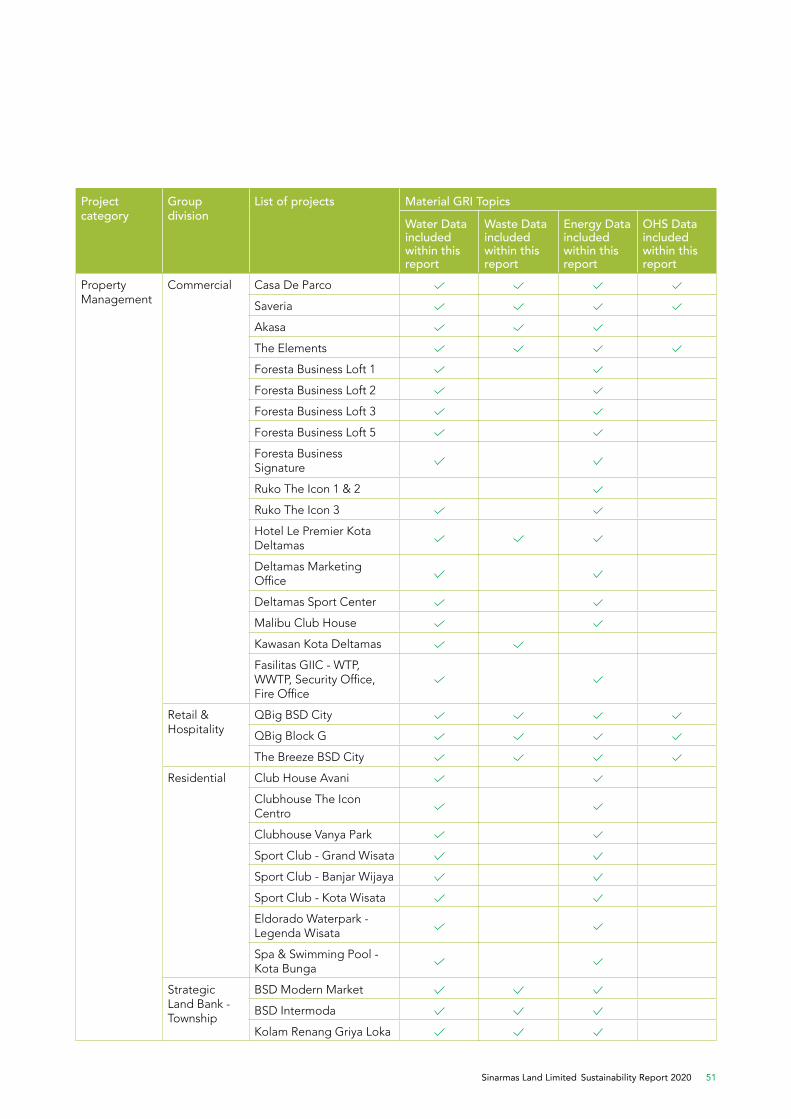
Sinarmas Land Limited Sustainability Report 2020 51
Project category
Group division
List of projects Material GRI Topics
Water Data included within this report
Waste Data included within this report
Energy Data included within this report
OHS Data included within this report
Property Management
Commercial Casa De Parco
Saveria
Akasa
The Elements
Foresta Business Loft 1
Foresta Business Loft 2
Foresta Business Loft 3
Foresta Business Loft 5
Foresta Business Signature
Ruko The Icon 1 & 2
Ruko The Icon 3
Hotel Le Premier Kota Deltamas
Deltamas Marketing Office
Deltamas Sport Center
Malibu Club House
Kawasan Kota Deltamas
Fasilitas GIIC - WTP, WWTP, Security Office, Fire Office
Retail & Hospitality
QBig BSD City
QBig Block G
The Breeze BSD City
Residential Club House Avani
Clubhouse The Icon Centro
Clubhouse Vanya Park
Sport Club - Grand Wisata
Sport Club - Banjar Wijaya
Sport Club - Kota Wisata
Eldorado Waterpark - Legenda Wisata
Spa & Swimming Pool - Kota Bunga
Strategic Land Bank - Township
BSD Modern Market
BSD Intermoda
Kolam Renang Griya Loka
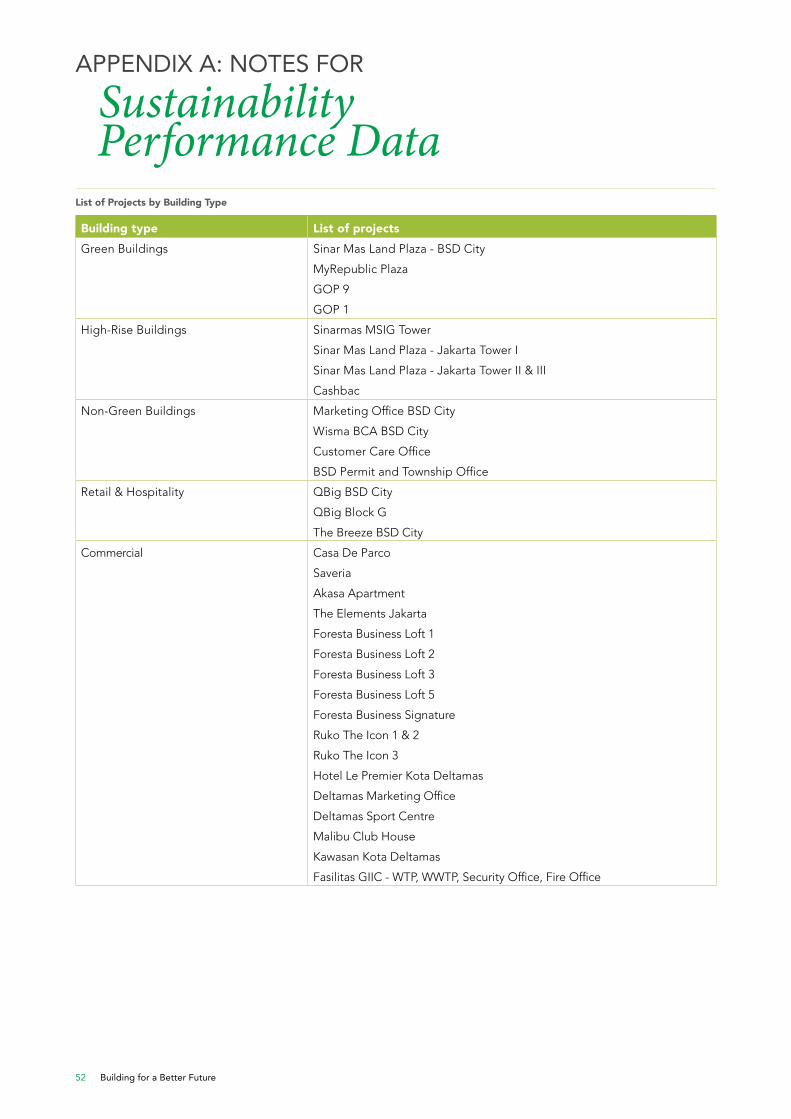
Building for a Better Future52
Building type List of projectsGreen Buildings Sinar Mas Land Plaza - BSD City
MyRepublic Plaza
GOP 9
GOP 1
High-Rise Buildings Sinarmas MSIG Tower
Sinar Mas Land Plaza - Jakarta Tower I
Sinar Mas Land Plaza - Jakarta Tower II & III
Cashbac
Non-Green Buildings Marketing Office BSD City
Wisma BCA BSD City
Customer Care Office
BSD Permit and Township Office
Retail & Hospitality QBig BSD City
QBig Block G
The Breeze BSD City
Commercial Casa De Parco
Saveria
Akasa Apartment
The Elements Jakarta
Foresta Business Loft 1
Foresta Business Loft 2
Foresta Business Loft 3
Foresta Business Loft 5
Foresta Business Signature
Ruko The Icon 1 & 2
Ruko The Icon 3
Hotel Le Premier Kota Deltamas
Deltamas Marketing Office
Deltamas Sport Centre
Malibu Club House
Kawasan Kota Deltamas
Fasilitas GIIC - WTP, WWTP, Security Office, Fire Office
APPENDIX A: NOTES FOR
Sustainability Performance DataList of Projects by Building Type
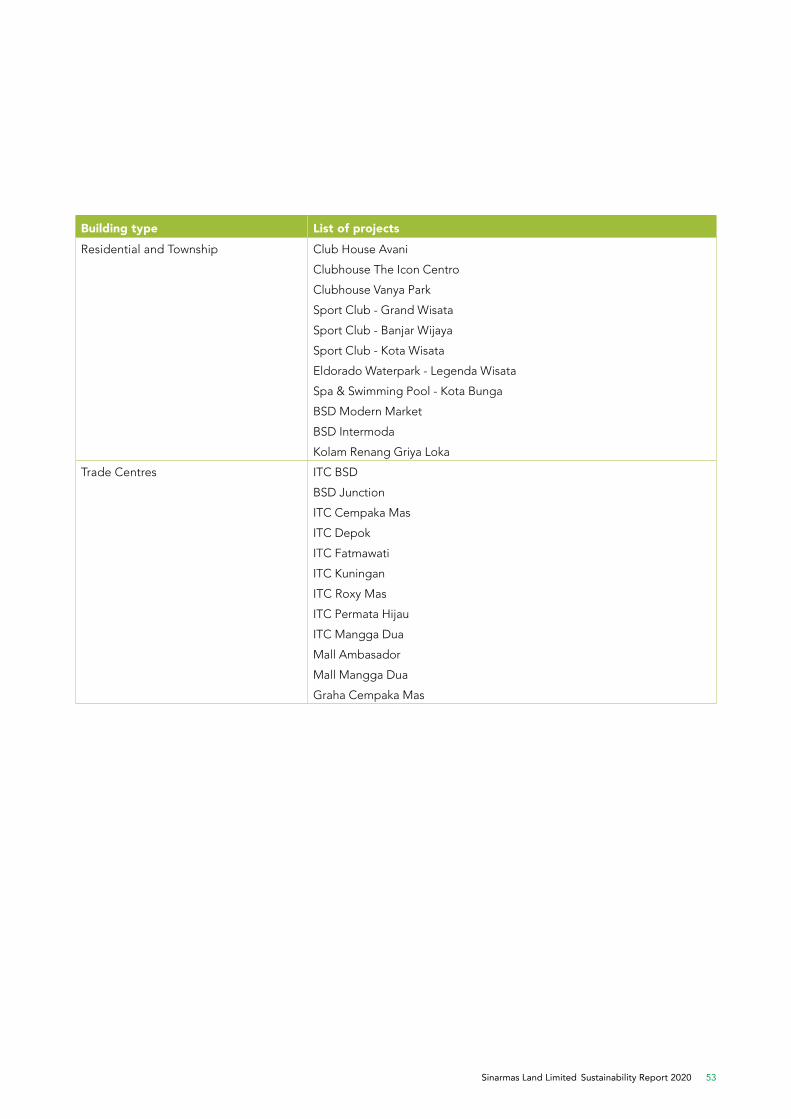
Sinarmas Land Limited Sustainability Report 2020 53
Building type List of projectsResidential and Township Club House Avani
Clubhouse The Icon Centro
Clubhouse Vanya Park
Sport Club - Grand Wisata
Sport Club - Banjar Wijaya
Sport Club - Kota Wisata
Eldorado Waterpark - Legenda Wisata
Spa & Swimming Pool - Kota Bunga
BSD Modern Market
BSD Intermoda
Kolam Renang Griya Loka
Trade Centres ITC BSD
BSD Junction
ITC Cempaka Mas
ITC Depok
ITC Fatmawati
ITC Kuningan
ITC Roxy Mas
ITC Permata Hijau
ITC Mangga Dua
Mall Ambasador
Mall Mangga Dua
Graha Cempaka Mas

Building for a Better Future54
APPENDIX B:
GRI Content Index
GRI Standard Disclosure number and title Page number and reasons for omission, if applicable
ORGANIZATIONAL PROFILE
102-1 Name of the organization Back cover
102-2 Activities, brands, products and services About Sinarmas Land, page 8
102-3 Location of headquarters Back cover
102-4 Location of operations About Sinarmas Land, page 8
102-5 Ownership and legal form About Sinarmas Land, page 8
102-6 Markets served About Sinarmas Land, page 8
102-7 Scale of the organization About Sinarmas Land, page 8
102-8 Information on employees and other workers Best In Class Real Estate > Providing Excellent Facilities and Services > Our Employees, page 22
102-9 Supply Chain About Sinarmas Land, page 8
102-10 Significant changes to the organization (size, structure, ownership) and its supply chain
About Sinarmas Land, page 8
102-11 Precautionary Principle or Approach Our Approach > Governance and Risk Management, page 17
102-12 External initiatives Our Approach > Sinarmas Land’s Sustainability Vision, page 14
102-13 Membership of assocations About Sinarmas Land, page 8
STRATEGY 102-14 Statement from senior decision-maker Chairman and CEO Statement, page 10
ETHICS AND INTEGRITY
102-16 Values, principles, standards and norms of behaviour
Our Approach > Governance and Risk Management, page 17
GOVERNANCE 102-18 Governance structure Our Approach > Governance and Risk Management, page 17
STAKEHOLDER ENGAGEMENT
102-40 List of stakeholder groups Our Approach > Materiality and Stakeholder Engagement, page 18
102-41 Collective bargaining agreements Best In Class Real Estate > Providing Excellent Facilities and Services > Our Employee > Respecting Freedom of Association and Collective Bargaining Rights, page 24
102-42 Identifying and selecting stakeholders Our Approach > Materiality and Stakeholder Engagement, page 18
102-43 Approach to stakeholder engagement Our Approach > Materiality and Stakeholder Engagement, page 18
102-44 Key topics and concerns raised Our Approach > Materiality and Stakeholder Engagement, page 18 Sustainable Community > Engagement Program for All Stakeholders, page 41
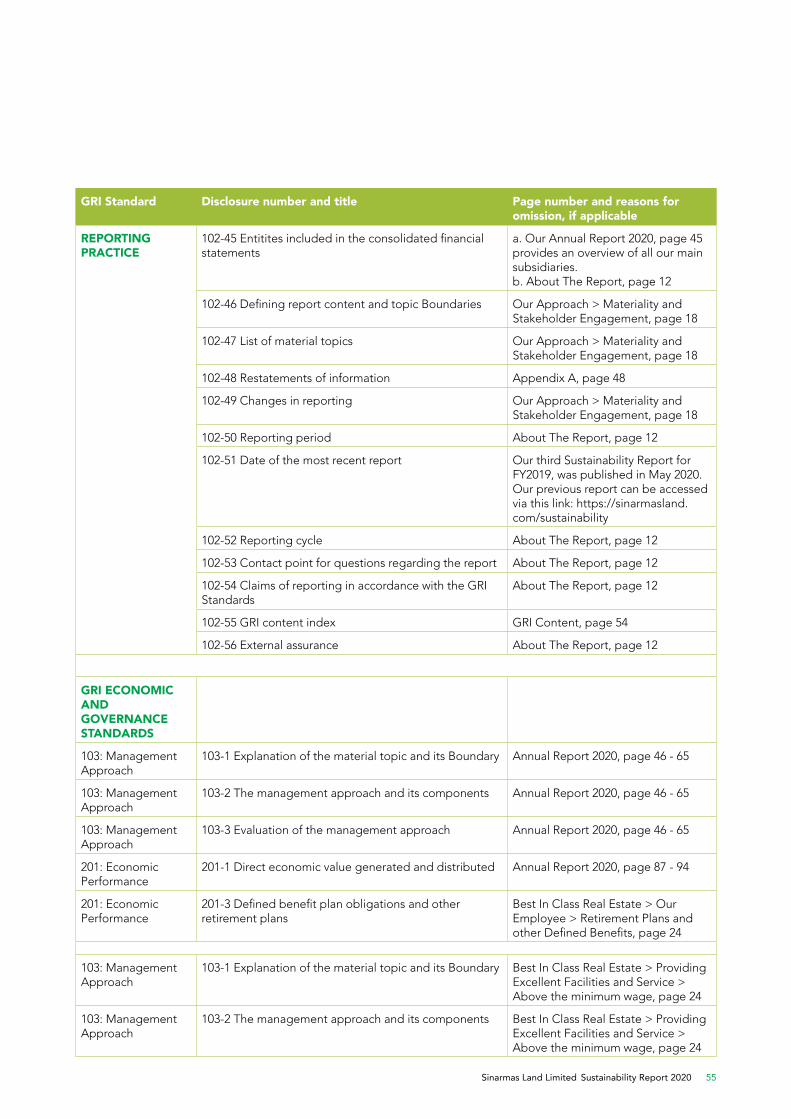
Sinarmas Land Limited Sustainability Report 2020 55
GRI Standard Disclosure number and title Page number and reasons for omission, if applicable
REPORTING PRACTICE
102-45 Entitites included in the consolidated financial statements
a. Our Annual Report 2020, page 45 provides an overview of all our main subsidiaries. b. About The Report, page 12
102-46 Defining report content and topic Boundaries Our Approach > Materiality and Stakeholder Engagement, page 18
102-47 List of material topics Our Approach > Materiality and Stakeholder Engagement, page 18
102-48 Restatements of information Appendix A, page 48
102-49 Changes in reporting Our Approach > Materiality and Stakeholder Engagement, page 18
102-50 Reporting period About The Report, page 12
102-51 Date of the most recent report Our third Sustainability Report for FY2019, was published in May 2020. Our previous report can be accessed via this link: https://sinarmasland.com/sustainability
102-52 Reporting cycle About The Report, page 12
102-53 Contact point for questions regarding the report About The Report, page 12
102-54 Claims of reporting in accordance with the GRI Standards
About The Report, page 12
102-55 GRI content index GRI Content, page 54
102-56 External assurance About The Report, page 12
GRI ECONOMIC AND GOVERNANCE STANDARDS
103: Management Approach
103-1 Explanation of the material topic and its Boundary Annual Report 2020, page 46 - 65
103: Management Approach
103-2 The management approach and its components Annual Report 2020, page 46 - 65
103: Management Approach
103-3 Evaluation of the management approach Annual Report 2020, page 46 - 65
201: Economic Performance
201-1 Direct economic value generated and distributed Annual Report 2020, page 87 - 94
201: Economic Performance
201-3 Defined benefit plan obligations and other retirement plans
Best In Class Real Estate > Our Employee > Retirement Plans and other Defined Benefits, page 24
103: Management Approach
103-1 Explanation of the material topic and its Boundary Best In Class Real Estate > Providing Excellent Facilities and Service > Above the minimum wage, page 24
103: Management Approach
103-2 The management approach and its components Best In Class Real Estate > Providing Excellent Facilities and Service > Above the minimum wage, page 24
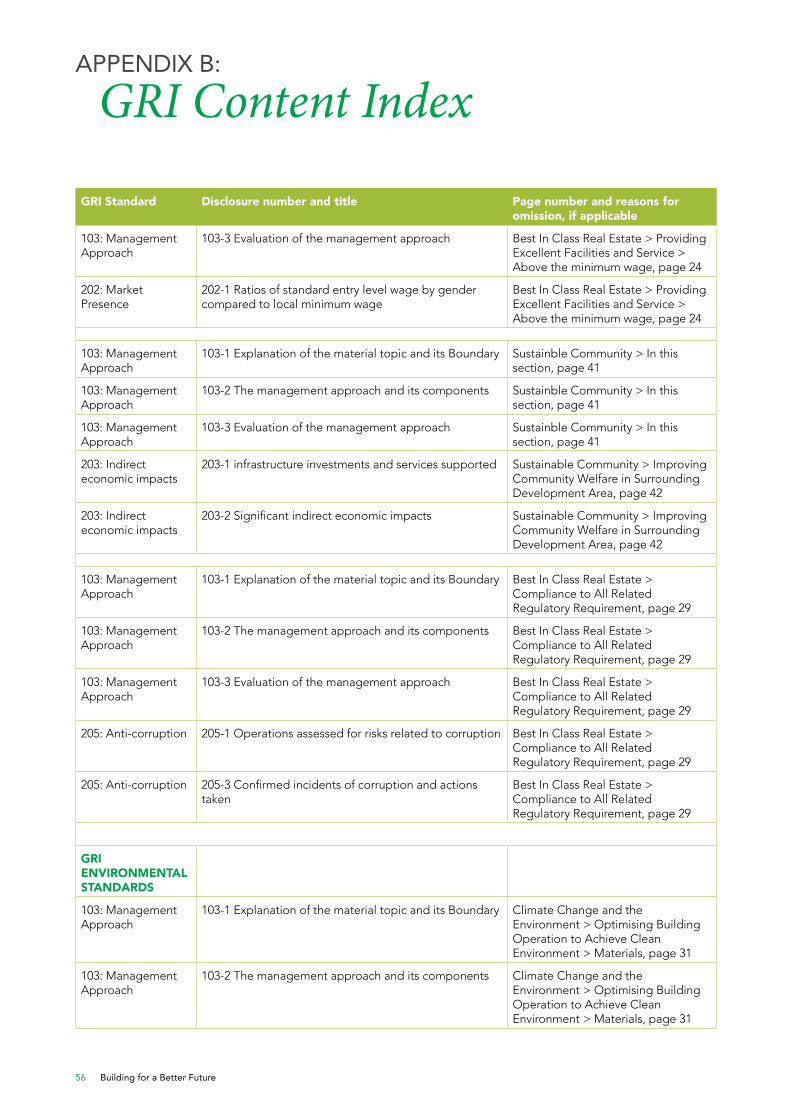
Building for a Better Future56
GRI Standard Disclosure number and title Page number and reasons for omission, if applicable
103: Management Approach
103-3 Evaluation of the management approach Best In Class Real Estate > Providing Excellent Facilities and Service > Above the minimum wage, page 24
202: Market Presence
202-1 Ratios of standard entry level wage by gender compared to local minimum wage
Best In Class Real Estate > Providing Excellent Facilities and Service > Above the minimum wage, page 24
103: Management Approach
103-1 Explanation of the material topic and its Boundary Sustainble Community > In this section, page 41
103: Management Approach
103-2 The management approach and its components Sustainble Community > In this section, page 41
103: Management Approach
103-3 Evaluation of the management approach Sustainble Community > In this section, page 41
203: Indirect economic impacts
203-1 infrastructure investments and services supported Sustainable Community > Improving Community Welfare in Surrounding Development Area, page 42
203: Indirect economic impacts
203-2 Significant indirect economic impacts Sustainable Community > Improving Community Welfare in Surrounding Development Area, page 42
103: Management Approach
103-1 Explanation of the material topic and its Boundary Best In Class Real Estate > Compliance to All Related Regulatory Requirement, page 29
103: Management Approach
103-2 The management approach and its components Best In Class Real Estate > Compliance to All Related Regulatory Requirement, page 29
103: Management Approach
103-3 Evaluation of the management approach Best In Class Real Estate > Compliance to All Related Regulatory Requirement, page 29
205: Anti-corruption 205-1 Operations assessed for risks related to corruption Best In Class Real Estate > Compliance to All Related Regulatory Requirement, page 29
205: Anti-corruption 205-3 Confirmed incidents of corruption and actions taken
Best In Class Real Estate > Compliance to All Related Regulatory Requirement, page 29
GRI ENVIRONMENTAL STANDARDS
103: Management Approach
103-1 Explanation of the material topic and its Boundary Climate Change and the Environment > Optimising Building Operation to Achieve Clean Environment > Materials, page 31
103: Management Approach
103-2 The management approach and its components Climate Change and the Environment > Optimising Building Operation to Achieve Clean Environment > Materials, page 31
APPENDIX B:
GRI Content Index
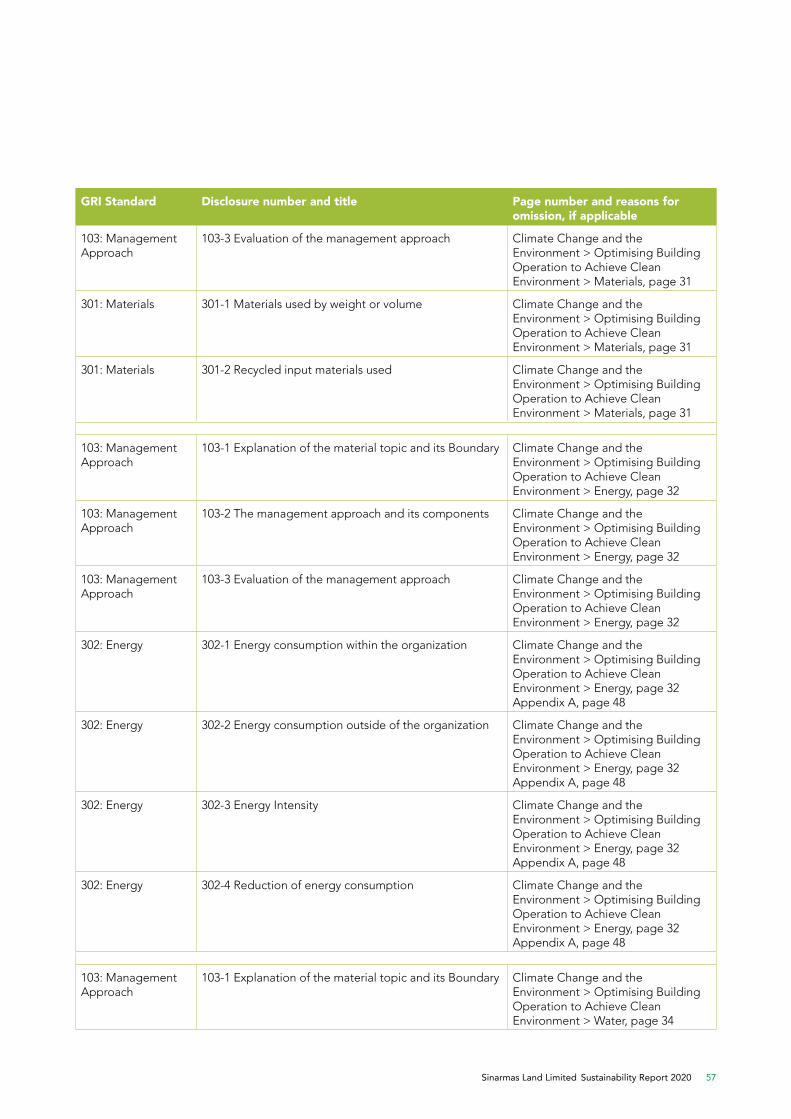
Sinarmas Land Limited Sustainability Report 2020 57
GRI Standard Disclosure number and title Page number and reasons for omission, if applicable
103: Management Approach
103-3 Evaluation of the management approach Climate Change and the Environment > Optimising Building Operation to Achieve Clean Environment > Materials, page 31
301: Materials 301-1 Materials used by weight or volume Climate Change and the Environment > Optimising Building Operation to Achieve Clean Environment > Materials, page 31
301: Materials 301-2 Recycled input materials used Climate Change and the Environment > Optimising Building Operation to Achieve Clean Environment > Materials, page 31
103: Management Approach
103-1 Explanation of the material topic and its Boundary Climate Change and the Environment > Optimising Building Operation to Achieve Clean Environment > Energy, page 32
103: Management Approach
103-2 The management approach and its components Climate Change and the Environment > Optimising Building Operation to Achieve Clean Environment > Energy, page 32
103: Management Approach
103-3 Evaluation of the management approach Climate Change and the Environment > Optimising Building Operation to Achieve Clean Environment > Energy, page 32
302: Energy 302-1 Energy consumption within the organization Climate Change and the Environment > Optimising Building Operation to Achieve Clean Environment > Energy, page 32 Appendix A, page 48
302: Energy 302-2 Energy consumption outside of the organization Climate Change and the Environment > Optimising Building Operation to Achieve Clean Environment > Energy, page 32 Appendix A, page 48
302: Energy 302-3 Energy Intensity Climate Change and the Environment > Optimising Building Operation to Achieve Clean Environment > Energy, page 32 Appendix A, page 48
302: Energy 302-4 Reduction of energy consumption Climate Change and the Environment > Optimising Building Operation to Achieve Clean Environment > Energy, page 32 Appendix A, page 48
103: Management Approach
103-1 Explanation of the material topic and its Boundary Climate Change and the Environment > Optimising Building Operation to Achieve Clean Environment > Water, page 34
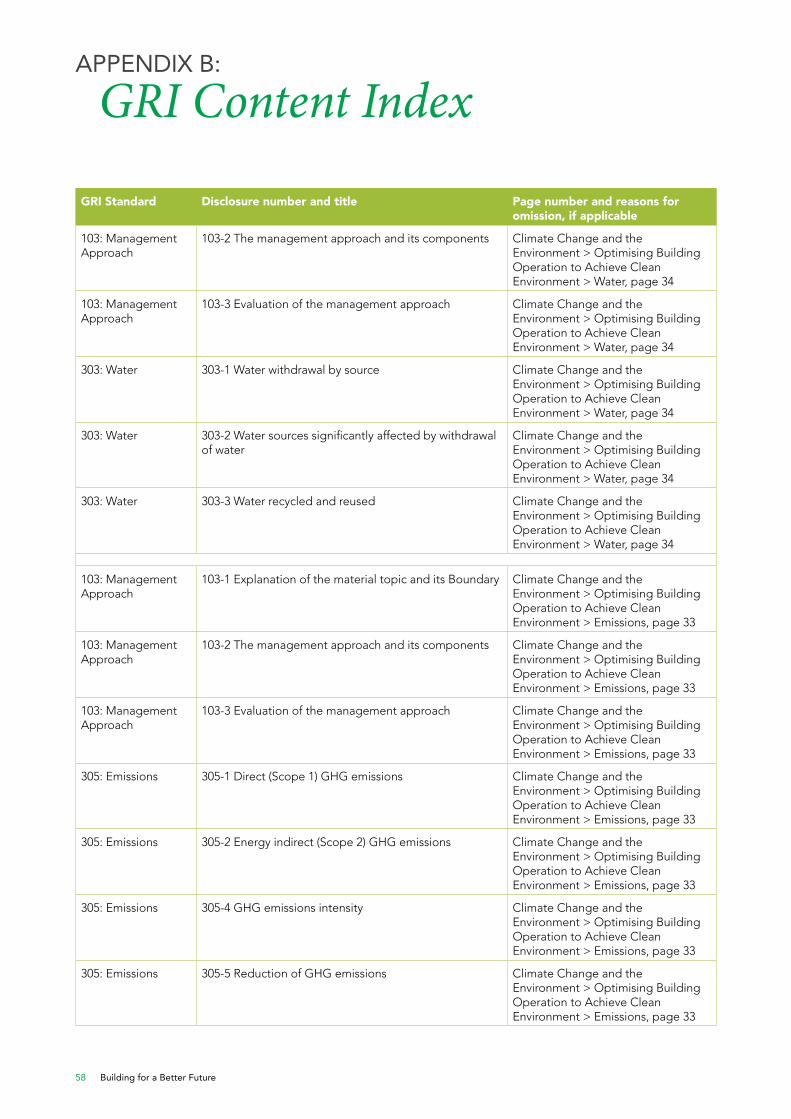
Building for a Better Future58
GRI Standard Disclosure number and title Page number and reasons for omission, if applicable
103: Management Approach
103-2 The management approach and its components Climate Change and the Environment > Optimising Building Operation to Achieve Clean Environment > Water, page 34
103: Management Approach
103-3 Evaluation of the management approach Climate Change and the Environment > Optimising Building Operation to Achieve Clean Environment > Water, page 34
303: Water 303-1 Water withdrawal by source Climate Change and the Environment > Optimising Building Operation to Achieve Clean Environment > Water, page 34
303: Water 303-2 Water sources significantly affected by withdrawal of water
Climate Change and the Environment > Optimising Building Operation to Achieve Clean Environment > Water, page 34
303: Water 303-3 Water recycled and reused Climate Change and the Environment > Optimising Building Operation to Achieve Clean Environment > Water, page 34
103: Management Approach
103-1 Explanation of the material topic and its Boundary Climate Change and the Environment > Optimising Building Operation to Achieve Clean Environment > Emissions, page 33
103: Management Approach
103-2 The management approach and its components Climate Change and the Environment > Optimising Building Operation to Achieve Clean Environment > Emissions, page 33
103: Management Approach
103-3 Evaluation of the management approach Climate Change and the Environment > Optimising Building Operation to Achieve Clean Environment > Emissions, page 33
305: Emissions 305-1 Direct (Scope 1) GHG emissions Climate Change and the Environment > Optimising Building Operation to Achieve Clean Environment > Emissions, page 33
305: Emissions 305-2 Energy indirect (Scope 2) GHG emissions Climate Change and the Environment > Optimising Building Operation to Achieve Clean Environment > Emissions, page 33
305: Emissions 305-4 GHG emissions intensity Climate Change and the Environment > Optimising Building Operation to Achieve Clean Environment > Emissions, page 33
305: Emissions 305-5 Reduction of GHG emissions Climate Change and the Environment > Optimising Building Operation to Achieve Clean Environment > Emissions, page 33
APPENDIX B:
GRI Content Index
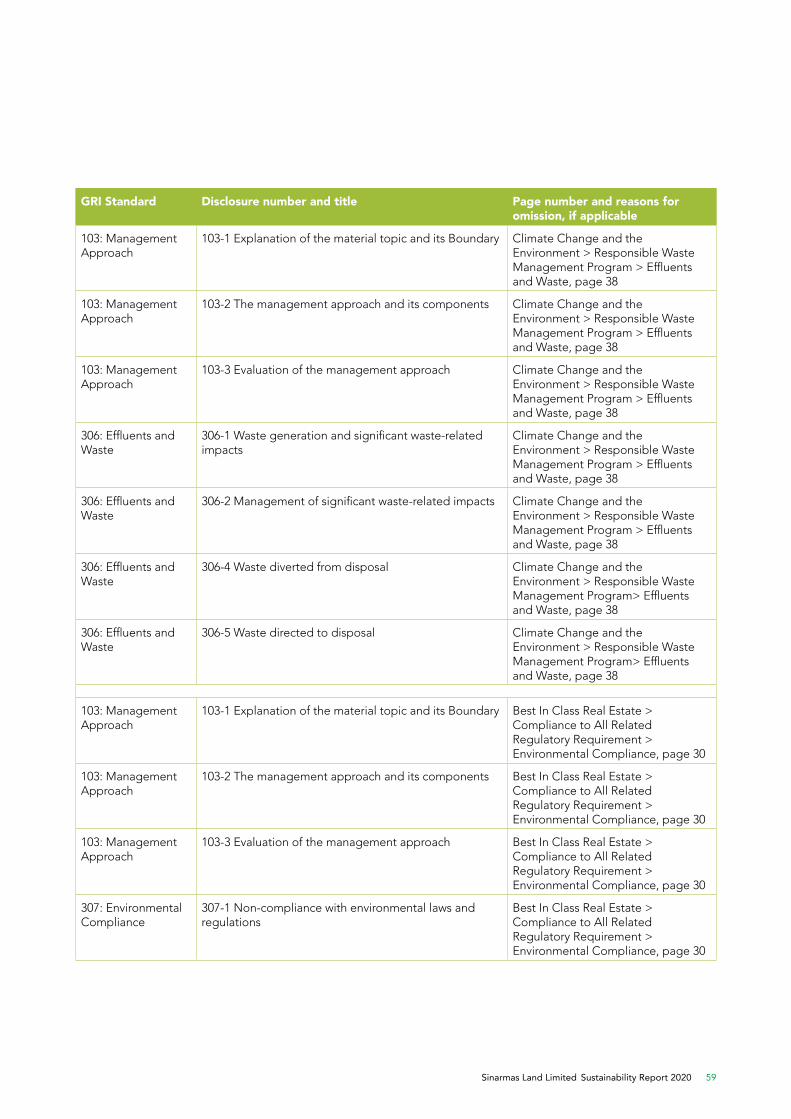
Sinarmas Land Limited Sustainability Report 2020 59
GRI Standard Disclosure number and title Page number and reasons for omission, if applicable
103: Management Approach
103-1 Explanation of the material topic and its Boundary Climate Change and the Environment > Responsible Waste Management Program > Effluents and Waste, page 38
103: Management Approach
103-2 The management approach and its components Climate Change and the Environment > Responsible Waste Management Program > Effluents and Waste, page 38
103: Management Approach
103-3 Evaluation of the management approach Climate Change and the Environment > Responsible Waste Management Program > Effluents and Waste, page 38
306: Effluents and Waste
306-1 Waste generation and significant waste-related impacts
Climate Change and the Environment > Responsible Waste Management Program > Effluents and Waste, page 38
306: Effluents and Waste
306-2 Management of significant waste-related impacts Climate Change and the Environment > Responsible Waste Management Program > Effluents and Waste, page 38
306: Effluents and Waste
306-4 Waste diverted from disposal Climate Change and the Environment > Responsible Waste Management Program> Effluents and Waste, page 38
306: Effluents and Waste
306-5 Waste directed to disposal Climate Change and the Environment > Responsible Waste Management Program> Effluents and Waste, page 38
103: Management Approach
103-1 Explanation of the material topic and its Boundary Best In Class Real Estate > Compliance to All Related Regulatory Requirement > Environmental Compliance, page 30
103: Management Approach
103-2 The management approach and its components Best In Class Real Estate > Compliance to All Related Regulatory Requirement > Environmental Compliance, page 30
103: Management Approach
103-3 Evaluation of the management approach Best In Class Real Estate > Compliance to All Related Regulatory Requirement > Environmental Compliance, page 30
307: Environmental Compliance
307-1 Non-compliance with environmental laws and regulations
Best In Class Real Estate > Compliance to All Related Regulatory Requirement > Environmental Compliance, page 30
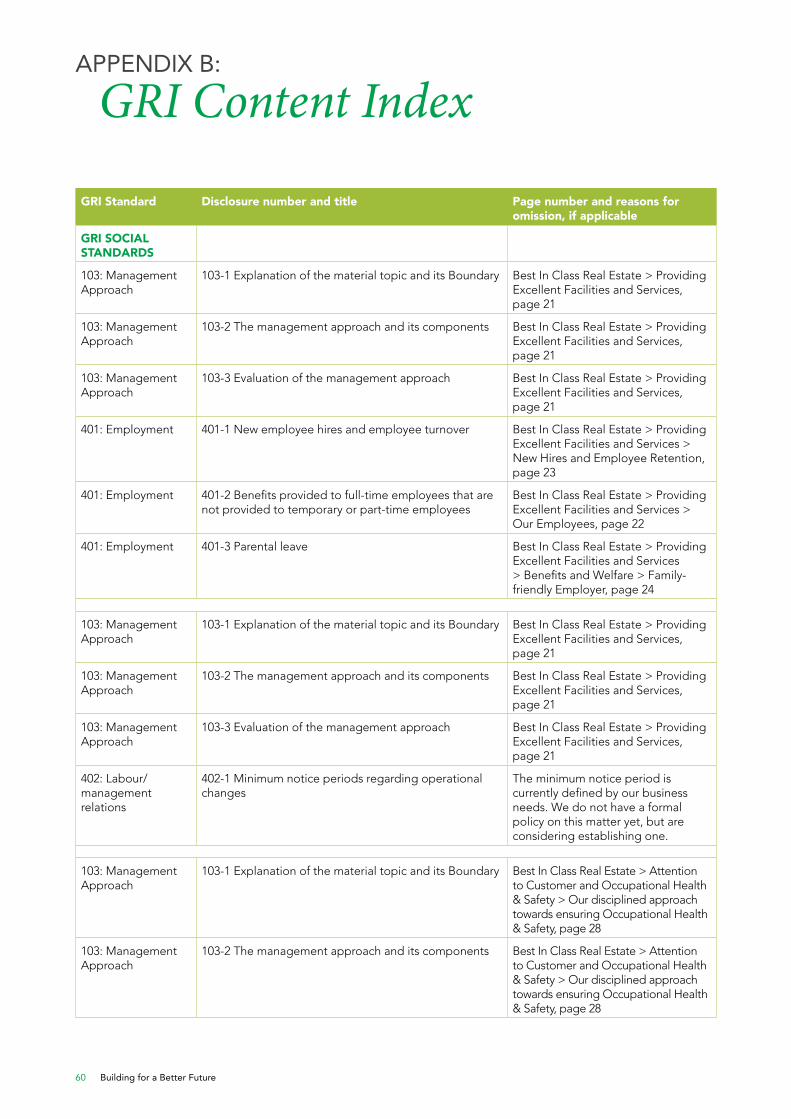
Building for a Better Future60
GRI Standard Disclosure number and title Page number and reasons for omission, if applicable
GRI SOCIAL STANDARDS
103: Management Approach
103-1 Explanation of the material topic and its Boundary Best In Class Real Estate > Providing Excellent Facilities and Services, page 21
103: Management Approach
103-2 The management approach and its components Best In Class Real Estate > Providing Excellent Facilities and Services, page 21
103: Management Approach
103-3 Evaluation of the management approach Best In Class Real Estate > Providing Excellent Facilities and Services, page 21
401: Employment 401-1 New employee hires and employee turnover Best In Class Real Estate > Providing Excellent Facilities and Services > New Hires and Employee Retention, page 23
401: Employment 401-2 Benefits provided to full-time employees that are not provided to temporary or part-time employees
Best In Class Real Estate > Providing Excellent Facilities and Services > Our Employees, page 22
401: Employment 401-3 Parental leave Best In Class Real Estate > Providing Excellent Facilities and Services > Benefits and Welfare > Family-friendly Employer, page 24
103: Management Approach
103-1 Explanation of the material topic and its Boundary Best In Class Real Estate > Providing Excellent Facilities and Services, page 21
103: Management Approach
103-2 The management approach and its components Best In Class Real Estate > Providing Excellent Facilities and Services, page 21
103: Management Approach
103-3 Evaluation of the management approach Best In Class Real Estate > Providing Excellent Facilities and Services, page 21
402: Labour/management relations
402-1 Minimum notice periods regarding operational changes
The minimum notice period is currently defined by our business needs. We do not have a formal policy on this matter yet, but are considering establishing one.
103: Management Approach
103-1 Explanation of the material topic and its Boundary Best In Class Real Estate > Attention to Customer and Occupational Health & Safety > Our disciplined approach towards ensuring Occupational Health & Safety, page 28
103: Management Approach
103-2 The management approach and its components Best In Class Real Estate > Attention to Customer and Occupational Health & Safety > Our disciplined approach towards ensuring Occupational Health & Safety, page 28
APPENDIX B:
GRI Content Index
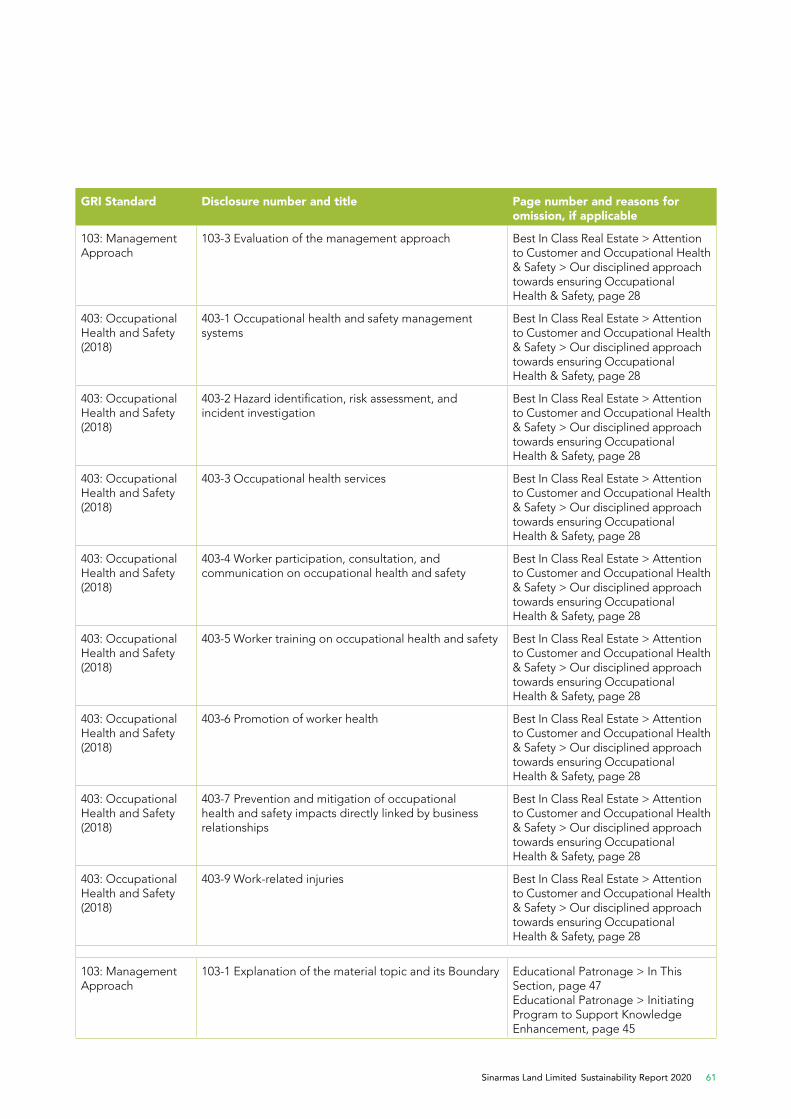
Sinarmas Land Limited Sustainability Report 2020 61
GRI Standard Disclosure number and title Page number and reasons for omission, if applicable
103: Management Approach
103-3 Evaluation of the management approach Best In Class Real Estate > Attention to Customer and Occupational Health & Safety > Our disciplined approach towards ensuring Occupational Health & Safety, page 28
403: Occupational Health and Safety (2018)
403-1 Occupational health and safety management systems
Best In Class Real Estate > Attention to Customer and Occupational Health & Safety > Our disciplined approach towards ensuring Occupational Health & Safety, page 28
403: Occupational Health and Safety (2018)
403-2 Hazard identification, risk assessment, and incident investigation
Best In Class Real Estate > Attention to Customer and Occupational Health & Safety > Our disciplined approach towards ensuring Occupational Health & Safety, page 28
403: Occupational Health and Safety (2018)
403-3 Occupational health services Best In Class Real Estate > Attention to Customer and Occupational Health & Safety > Our disciplined approach towards ensuring Occupational Health & Safety, page 28
403: Occupational Health and Safety (2018)
403-4 Worker participation, consultation, and communication on occupational health and safety
Best In Class Real Estate > Attention to Customer and Occupational Health & Safety > Our disciplined approach towards ensuring Occupational Health & Safety, page 28
403: Occupational Health and Safety (2018)
403-5 Worker training on occupational health and safety Best In Class Real Estate > Attention to Customer and Occupational Health & Safety > Our disciplined approach towards ensuring Occupational Health & Safety, page 28
403: Occupational Health and Safety (2018)
403-6 Promotion of worker health Best In Class Real Estate > Attention to Customer and Occupational Health & Safety > Our disciplined approach towards ensuring Occupational Health & Safety, page 28
403: Occupational Health and Safety (2018)
403-7 Prevention and mitigation of occupational health and safety impacts directly linked by business relationships
Best In Class Real Estate > Attention to Customer and Occupational Health & Safety > Our disciplined approach towards ensuring Occupational Health & Safety, page 28
403: Occupational Health and Safety (2018)
403-9 Work-related injuries Best In Class Real Estate > Attention to Customer and Occupational Health & Safety > Our disciplined approach towards ensuring Occupational Health & Safety, page 28
103: Management Approach
103-1 Explanation of the material topic and its Boundary Educational Patronage > In This Section, page 47 Educational Patronage > Initiating Program to Support Knowledge Enhancement, page 45
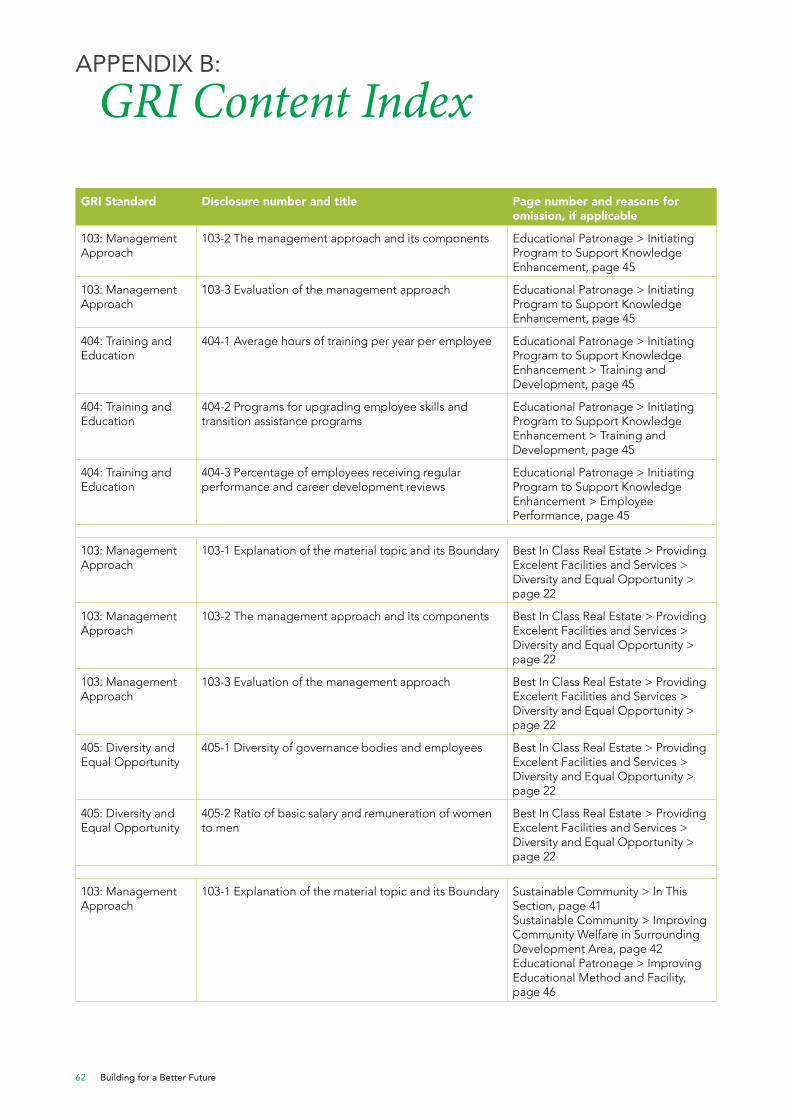
Building for a Better Future62
GRI Standard Disclosure number and title Page number and reasons for omission, if applicable
103: Management Approach
103-2 The management approach and its components Educational Patronage > Initiating Program to Support Knowledge Enhancement, page 45
103: Management Approach
103-3 Evaluation of the management approach Educational Patronage > Initiating Program to Support Knowledge Enhancement, page 45
404: Training and Education
404-1 Average hours of training per year per employee Educational Patronage > Initiating Program to Support Knowledge Enhancement > Training and Development, page 45
404: Training and Education
404-2 Programs for upgrading employee skills and transition assistance programs
Educational Patronage > Initiating Program to Support Knowledge Enhancement > Training and Development, page 45
404: Training and Education
404-3 Percentage of employees receiving regular performance and career development reviews
Educational Patronage > Initiating Program to Support Knowledge Enhancement > Employee Performance, page 45
103: Management Approach
103-1 Explanation of the material topic and its Boundary Best In Class Real Estate > Providing Excelent Facilities and Services > Diversity and Equal Opportunity > page 22
103: Management Approach
103-2 The management approach and its components Best In Class Real Estate > Providing Excelent Facilities and Services > Diversity and Equal Opportunity > page 22
103: Management Approach
103-3 Evaluation of the management approach Best In Class Real Estate > Providing Excelent Facilities and Services > Diversity and Equal Opportunity > page 22
405: Diversity and Equal Opportunity
405-1 Diversity of governance bodies and employees Best In Class Real Estate > Providing Excelent Facilities and Services > Diversity and Equal Opportunity > page 22
405: Diversity and Equal Opportunity
405-2 Ratio of basic salary and remuneration of women to men
Best In Class Real Estate > Providing Excelent Facilities and Services > Diversity and Equal Opportunity > page 22
103: Management Approach
103-1 Explanation of the material topic and its Boundary Sustainable Community > In This Section, page 41 Sustainable Community > Improving Community Welfare in Surrounding Development Area, page 42 Educational Patronage > Improving Educational Method and Facility, page 46
APPENDIX B:
GRI Content Index
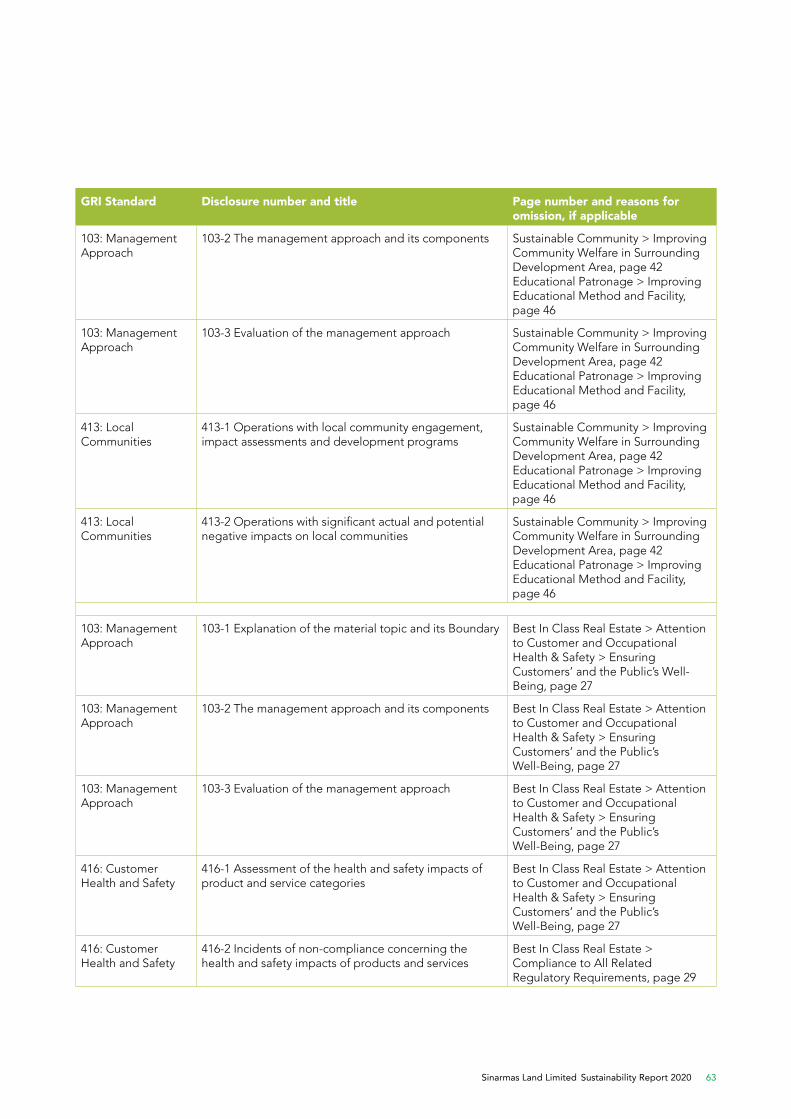
Sinarmas Land Limited Sustainability Report 2020 63
GRI Standard Disclosure number and title Page number and reasons for omission, if applicable
103: Management Approach
103-2 The management approach and its components Sustainable Community > Improving Community Welfare in Surrounding Development Area, page 42 Educational Patronage > Improving Educational Method and Facility, page 46
103: Management Approach
103-3 Evaluation of the management approach Sustainable Community > Improving Community Welfare in Surrounding Development Area, page 42 Educational Patronage > Improving Educational Method and Facility, page 46
413: Local Communities
413-1 Operations with local community engagement, impact assessments and development programs
Sustainable Community > Improving Community Welfare in Surrounding Development Area, page 42 Educational Patronage > Improving Educational Method and Facility, page 46
413: Local Communities
413-2 Operations with significant actual and potential negative impacts on local communities
Sustainable Community > Improving Community Welfare in Surrounding Development Area, page 42 Educational Patronage > Improving Educational Method and Facility, page 46
103: Management Approach
103-1 Explanation of the material topic and its Boundary Best In Class Real Estate > Attention to Customer and Occupational Health & Safety > Ensuring Customers’ and the Public’s Well-Being, page 27
103: Management Approach
103-2 The management approach and its components Best In Class Real Estate > Attention to Customer and Occupational Health & Safety > Ensuring Customers’ and the Public’s Well-Being, page 27
103: Management Approach
103-3 Evaluation of the management approach Best In Class Real Estate > Attention to Customer and Occupational Health & Safety > Ensuring Customers’ and the Public’s Well-Being, page 27
416: Customer Health and Safety
416-1 Assessment of the health and safety impacts of product and service categories
Best In Class Real Estate > Attention to Customer and Occupational Health & Safety > Ensuring Customers’ and the Public’s Well-Being, page 27
416: Customer Health and Safety
416-2 Incidents of non-compliance concerning the health and safety impacts of products and services
Best In Class Real Estate > Compliance to All Related Regulatory Requirements, page 29
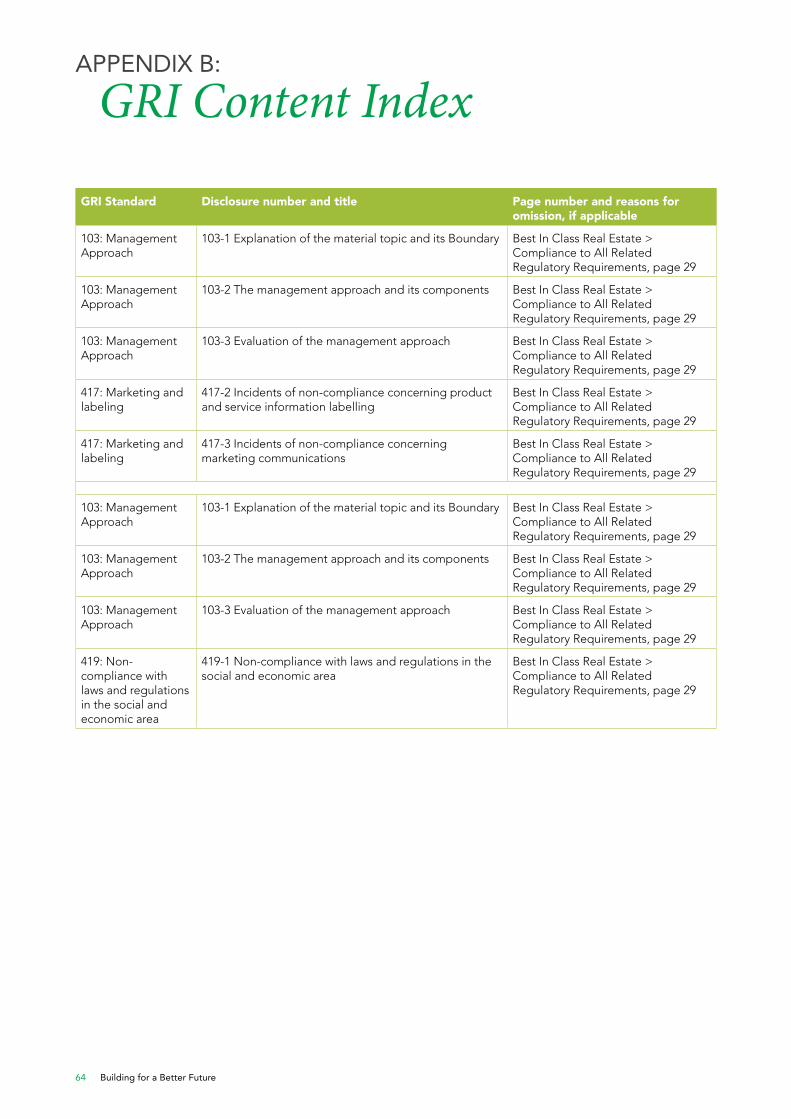
Building for a Better Future64
GRI Standard Disclosure number and title Page number and reasons for omission, if applicable
103: Management Approach
103-1 Explanation of the material topic and its Boundary Best In Class Real Estate > Compliance to All Related Regulatory Requirements, page 29
103: Management Approach
103-2 The management approach and its components Best In Class Real Estate > Compliance to All Related Regulatory Requirements, page 29
103: Management Approach
103-3 Evaluation of the management approach Best In Class Real Estate > Compliance to All Related Regulatory Requirements, page 29
417: Marketing and labeling
417-2 Incidents of non-compliance concerning product and service information labelling
Best In Class Real Estate > Compliance to All Related Regulatory Requirements, page 29
417: Marketing and labeling
417-3 Incidents of non-compliance concerning marketing communications
Best In Class Real Estate > Compliance to All Related Regulatory Requirements, page 29
103: Management Approach
103-1 Explanation of the material topic and its Boundary Best In Class Real Estate > Compliance to All Related Regulatory Requirements, page 29
103: Management Approach
103-2 The management approach and its components Best In Class Real Estate > Compliance to All Related Regulatory Requirements, page 29
103: Management Approach
103-3 Evaluation of the management approach Best In Class Real Estate > Compliance to All Related Regulatory Requirements, page 29
419: Non-compliance with laws and regulations in the social and economic area
419-1 Non-compliance with laws and regulations in the social and economic area
Best In Class Real Estate > Compliance to All Related Regulatory Requirements, page 29
APPENDIX B:
GRI Content Index
SINARMAS LAND LIMITEDCompany Registration No. 199400619R
108 Pasir Panjang Road,#06-00 Golden Agri Plaza, Singapore 118535Tel : (65) 6220 7720 Fax : (65) 6590 0887
www.sinarmasland.com
Sinar Mas Land @sinarmas_land