sustainability investing with the dow jones sustainability ... · global warming population growth...
TRANSCRIPT

1A cooperation of Dow Jones Indexes, STOXX Ltd. and SAM Group
Sustainability Investing with theDow Jones Sustainability Indexes

2
I. Sustainability Investing
II. Dow Jones Sustainability Indexes
Content

3
• Boycotts and ethicalmotivation
• Exclusion of industrygroups
• Focus on a narrowselection of social andenvironmental criteria
EthicalInvestments
SustainabilityInvestments
• Adding shareholdervalue
• Future-driven• Best of class and
industry-specific
• Integrating economic,environmental andsocial criteria
Market Developments (I)From Ethical to Sustainability Investments
4
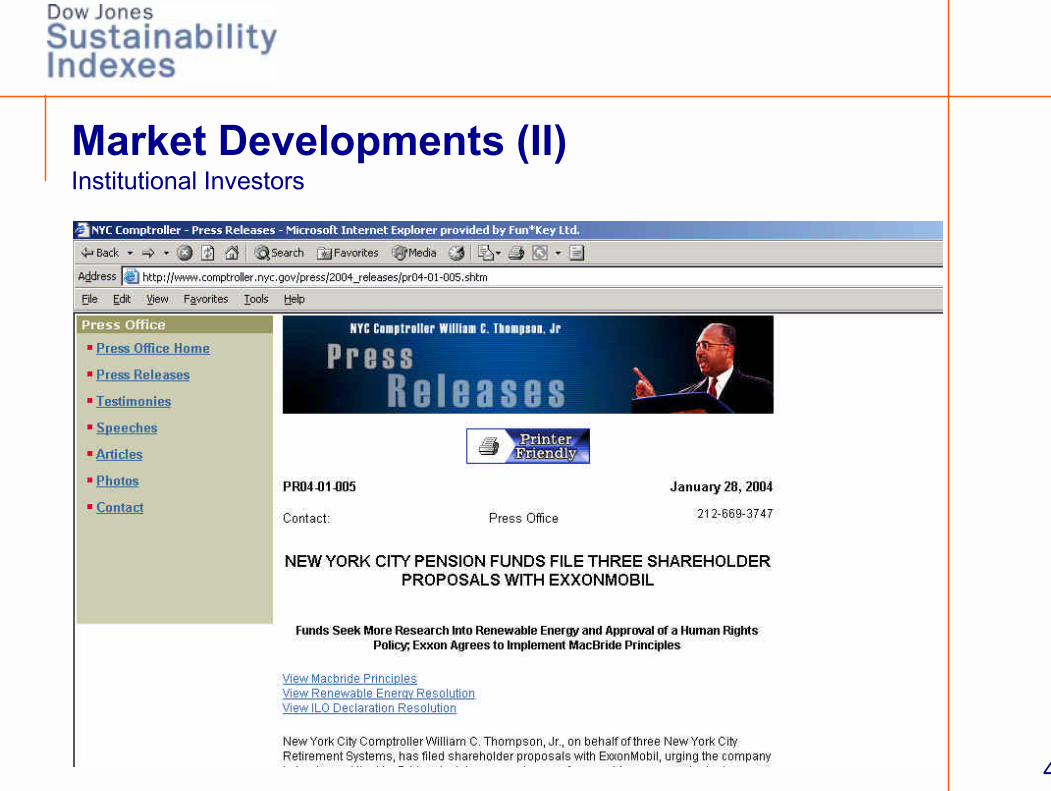
Market Developments (II)Institutional Investors

5Source: Investments & Pensions Europe
Market Developments (III)Institutional Investors
6
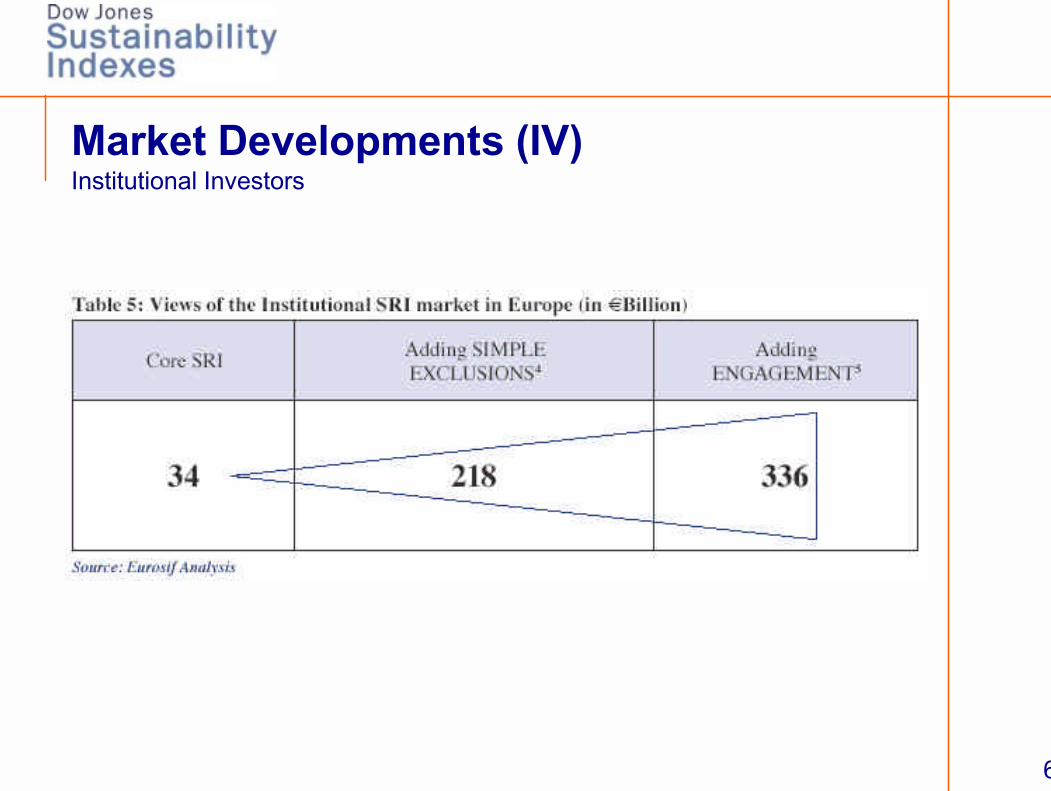
Market Developments (IV)Institutional Investors
7
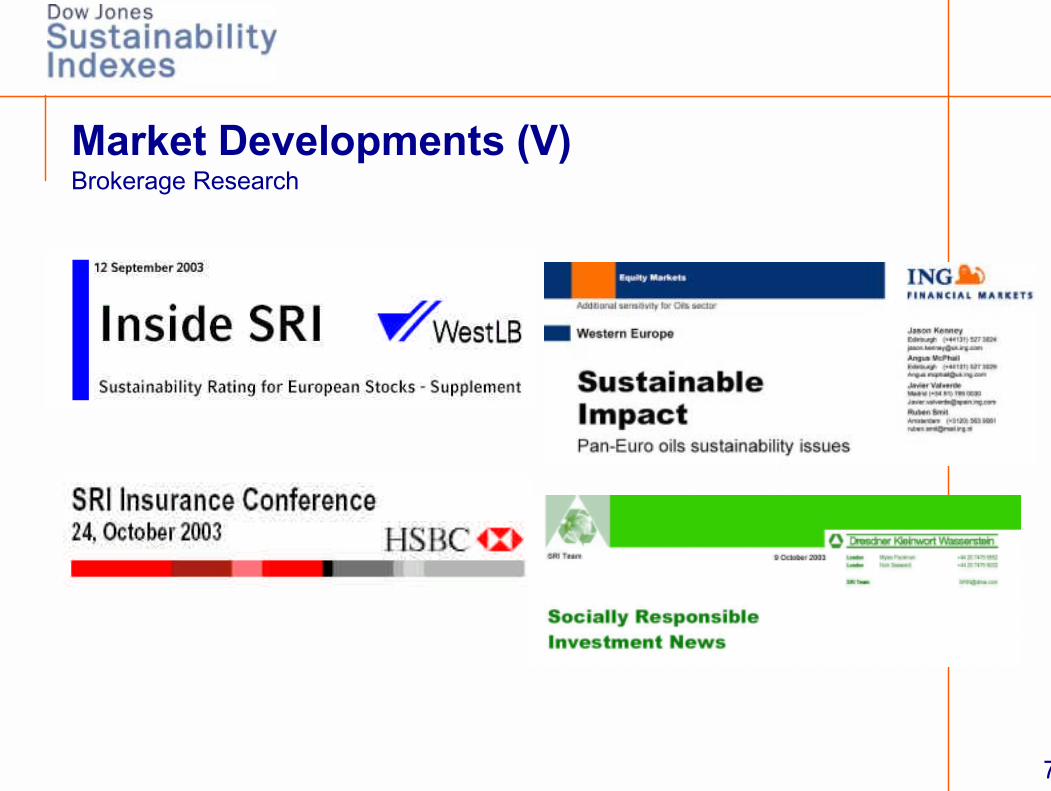
Market Developments (V)Brokerage Research

8
Market Developments (VI)Media
„It pains me to say this, but I am becoming less cynical aboutcorporate social responsibility.“
Jane Fuller, Financial Editor, FTFT Fund Management, 21 July 2003

9
I. Market Developments
II. Dow Jones Sustainability Indexes
Content

10
DJSI – Partners
Creates and licenses indexes for use in investment products, calculates 3,000+ indexes in real time
Provides and services the Dow JonesSTOXXSM indexes, Europe's leading regional equity indexes.
Focuses exclusively on sustainability investments, offers indexes, research, asset management and private equity services

11
• Integrated assessment of economic, social andenvironmental criteria with a strong focus on long-term shareholder value
• Consistent rule-based methodology, primaryresearch (direct contact to companies)
• Coverage of 60 industries world-wide using industry-specific assessment criteria
• Yearly review to reflect best-practices andcontinuous monitoring of companies
• Verification by PricewaterhouseCoopers
DJSI – Overview

12
DJSI – Assets and LicensesSeptember 1999 – May 2004
0
5
10
15
20
25
30
35
40
45
50
55
09/99 01/00 05/00 09/00 01/01 05/01 09/01 01/02 05/02 09/02 01/03 05/03 09/03 01/04 05/04
0
200
400
600
800
1000
1200
1400
1600
1800
2000
2200
2400
2600
2800
3000
Assets based on D
JSI (in m
io EU
R)
Number of sold DJSI Licenses Assets based on DJSI (in mio EUR)
Num
ber
of s
old
DJS
I Li
cens
es

13
Aegon (NL)Baloise Insurance (CH)BNL Gestioni (IT)CIC Asset Management (FR)Credit Suisse Asset Management (CH)Credit Union Central Alberta (CA)Credit Union Central of Ontario (CA)Danske Invest / BG Invest (DK)Dexia Asset Management (BE)Deutsche Postbank (DE)DWS (DE)DZ Bank (DE)Folksam Sak (SE)Fortis Investment Management (BE)Gerling Investment (DE)Gestnord (IT)HypoVereinsbank (DE)Invesco (DE)MEAG MUNICH ERGO (DE)Kepler Fonds KAG (AT)
Merrill Lynch (UK)Mandatum Asset Management (FI)Nikko Asset Management (JP)Oppenheim (DE)OP Fund Management Company (FI)Private Client Bank (CH)Raiffeisen (AT)Rabo Bank (UK)Rothschild & Cie Gestion (FR)Sagitta Wealth Management Limited (AU)SAM Sustainable Asset Management (CH)Sparinvest (DK)SPP (SE)State Street Global Advisors (US)Sustainable Performance Group (CH)Swiss Life Asset Management (CH)Synchrony Asset Management (CH)Theodoor Gilissen Bankiers (NL)UBS Global Asset Management (Japan) LtdUnion Investment (DE)WestLB (DE)VZ VermögensZentrum (CH)Zenit (IT)
DJSI – Licenseesas of May 31, 2004

14
Transparency
Healthy living
Better livingstandards
Rich / poor gap
Equal rights
Fair trade
Social - Cultural Trends
Ecological risk awareness
Pollution and waste
Global Warming
Population growth
Scarcity of NaturalResources
Loss of bio-diversity
Environmental Trends
Technological Change & Innovation
Shorter Product life-cycles
Speed & Flexibility
Life-long learning
Intellectual capital
Virtual living and working
Economic Trends
DJSI – Sustainability Trends (I)

15Source: SAM & World Resources Institute
DJSI – Sustainability Trends (II)Projected EBIT impact of climate change policies on the ten biggestautomotive companies until 2015
-15%
-10%
-5%
0%
5%
10%
15%
Toyota Renault Nissan Honda DC VW PSA BMW GM Ford

16
%
Total IndustryCriteria
GeneralCriteria
SocialDimension
EnvironmentalDimension
EconomicDimension
40%33%
20%
100%
60%
33%
33%
DJSI – Criteria (I)Weightings

17
...
DJSI – Criteria (II)Examples of general criteria

18
DJSI – Criteria (III)Examples of general criteria

19
DJSI – Criteria (IV)Examples of industry-specific criteria

20Q ll SAM R h
0
10
20
30
40
50
60
70
80
Automobile s Bas icResources
Banks CyclicalGoods &S e rvice s
Chemica ls Construct. Energy Food &Be ve rage
Financ ia lS e rvices
He a lthcare
Marke t S e c to r
To
tal
Sco
re
2000 2001 2002 2003
Maximum score: 100
DJSI – Scores (I)Average of best five scores in the DJSI World

21Q ll SAM R h
0
10
20
30
40
50
60
70
80
Ind . Goods& S e rvic e s
In s u ra n c e Me d ia Non-cyclic a lGoods &S e rvice s
R e ta il Technology Te le c o m . Utilitie s Total
Marke t S e c to r
To
tal
Sco
re
2000 2001 2002 2003
Maximum score: 100
DJSI – Scores (II)Average of best five scores in the DJSI World
22
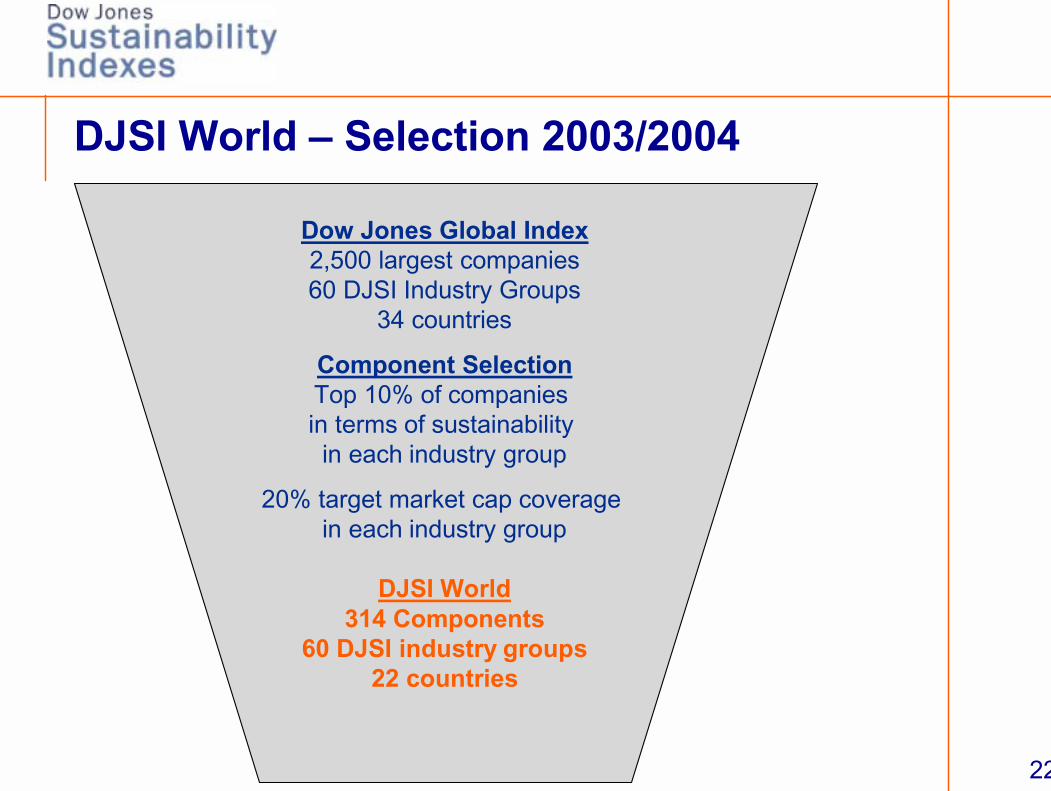
Dow Jones Global Index2,500 largest companies60 DJSI Industry Groups
34 countries
Component SelectionTop 10% of companiesin terms of sustainability in each industry group
20% target market cap coveragein each industry group
DJSI World314 Components
60 DJSI industry groups22 countries
DJSI World – Selection 2003/2004

23
DJSI World – Standard Range
! DJSI World(314 Components)
! DJSI World ex Alcohol(308 Components)
! DJSI World ex Tobacco(312 Components)
! DJSI World ex Gambling(303 Components)
! DJSI World ex Armaments & Firearms(305 Components)
! DJSI World ex Alcohol, Tobacco, Gambling,Armaments & Firearms(286 Components)
24
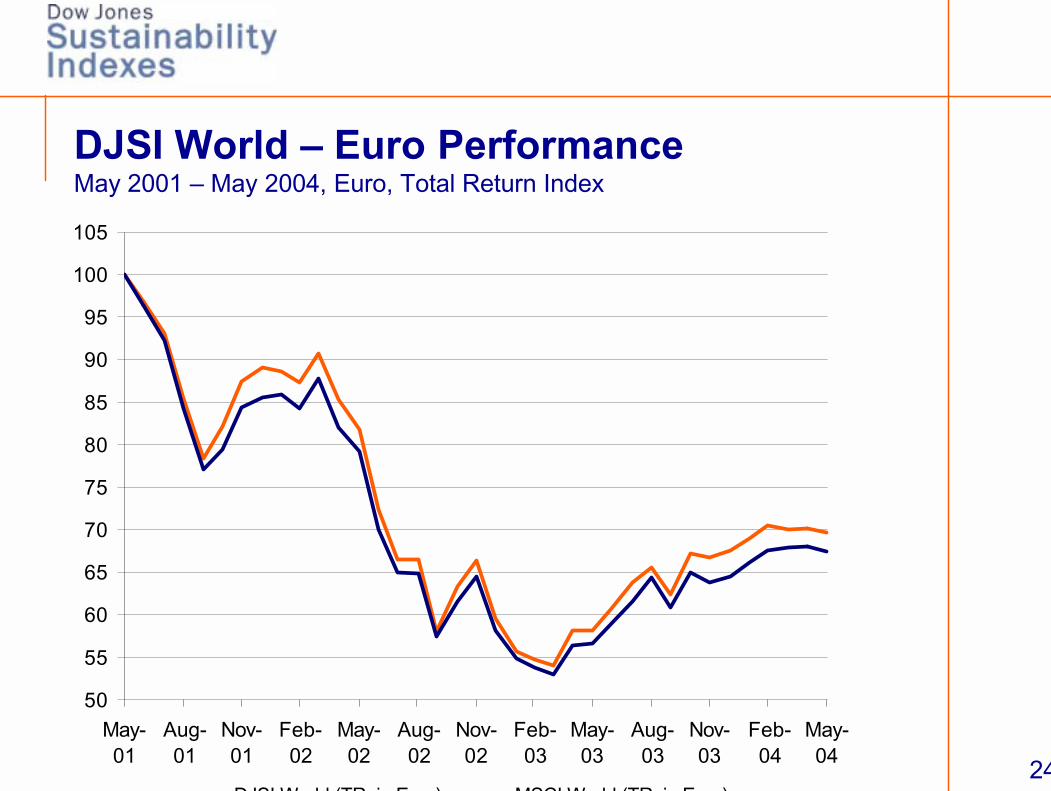
DJSI World – Euro PerformanceMay 2001 – May 2004, Euro, Total Return Index
50
55
60
65
70
75
80
85
90
95
100
105
May-01
Aug-01
Nov-01
Feb-02
May-02
Aug-02
Nov-02
Feb-03
May-03
Aug-03
Nov-03
Feb-04
May-04
DJSI World (TR in E ro) MSCI World (TR in E ro)

25
Dow Jones STOXXSM 600600 Companies
50 DJSI industry clusters17 countries
Component SelectionTop 20% leading
sustainability companies in eachindustry cluster
45% target market cap coveragein each market sector
DJSI STOXX 2003/2004175 Components
50 DJSI industry clusters13 countries
DJSI STOXX – Selection

26
DJSI STOXX – Subsets
! DJSI STOXX (175 Components)
! DJSI STOXX ex Alcohol, Tobacco, Gambling,Armaments & Firearms(158 Components)
! DJSI EURO STOXX(73 Components)
! DJSI EURO STOXX ex Alcohol, Tobacco, Gambling,Armaments & Firearms(69 Components)

27
DJSI STOXX – PerformanceDJSI STOXX / DJ STOXX 600 / DJ STOXX 50 (TR, in EUR, since inception)
50.00
60.00
70.00
80.00
90.00
100.00
110.00
120.00
10/01 01/02 04/02 07/02 10/02 01/03 04/03 07/03 10/03 01/04 04/04
DJSI STOXXDJ STOXX 600DJ STOXX 50

28
Result of Regression Multi-Factor Model(OLS-Valuations, t-Values in Brackets, Alpha denotes Monthly Outperformance)
Previous Results Total Time Period (incl.
backtracking)
Since Launch of Index
Since peak of investment
bubble
(01/99 - 10/02) (01/99 - 08/03) (10/01 - 08/03) (03/00 - 08/03)
Alpha 0.1706* 0.2572*** 0.2521** 0.3156***(1.736) (2.989) (2.507) (2.817)
Market-Beta 1.0248 1.0361 1.0464 1.0404(68.925) (80.781) (85.275) (72.615)
Size-Beta -0.2436 -0.2299 -0.1543 -0.2423(-8.707) (-9.023) (-3.862) (-7.833)
Value/Growth-Beta 0.1020 0.0968 -0.0178 0.0661(5.594) (5.488) (-0.509) (2.050)
*=10%-Level, **=5%-Level, ***=1%-Level Source: WestLB Equity Markets
DJSI STOXX – PerformanceDJSI STOXX / DJ STOXX 600

29
SAM IndexesPhone +41 1 395 2829alex@sustainability-indexes.comwww.sustainability-indexes.com