sustainability growth - financials
TRANSCRIPT

SUSTAINABILITY&GROWTH
IN TOUGH TIMES
Oil & Gas Development Company Limited Annual Report 2016

Oil & Gas Development Company Limited (OGDCL) is the largest exploration and
production Company of Pakistan, which was established in 1961 as a Public Sector
Corporation and later converted to a Public Limited Company in October 1997. Through
an Initial Public Offering in October 2003, the Company was listed on all three stock
exchanges of the Country, subsequently merged into Pakistan Stock Exchange. Its Global
Depository Shares started trading on the London Stock Exchange (LSE) in December
2006, thereby making OGDCL the first E&P Company in Pakistan to be listed on LSE.
The Government of Pakistan is the majority shareholder and owns 74.97% shares of
the Company as at 30 June 2016.
OGDCL’s core business activities encompass exploration, development and production
of hydrocarbon products to boost nation’s energy supply and contribute in the Country’s
economic growth. Proven capability and track record of delivering successful onshore
developments led the Company to earn the coveted status of market leader in terms
of exploration acreage, seismic data acquisition, oil and gas reserves and production
volumes in the Country. As at 30 June 2016, its exploration portfolio comprises sixty
(60) owned and operated joint venture exploration licenses covering an area of
112,453 sq. km. Its 2D and 3D seismic data acquisition during the year were 68%
and 53% respectively of the total seismic data acquired in the Country. Its
hydrocarbon reserves were 59% of oil and 36% of total natural gas reserves
in the Country as at 30 June 2015. Moreover, the production contributions
during July 2015 - June 2016 were 48% and 28% of the Country’s total
oil and natural gas production respectively (source: Pakistan Petroleum
Information Services).
Committed to ensuring sustainability and growth in tough times, fast track
exploration, development and production activities continued to preserve
the business leading position and emerge more stronger and competitive
E&P Company in the future. Exhibition of such endeavors during the
year resulted in many operational achievements in the shape of enhanced
3D seismic survey, six new oil and gas discoveries, completion of phase-II
of Sinjhoro development project and registering highest contribution in the
Country’s total oil and natural gas production. On the financial front, prudent
investment selection and capital allocation preserved to ensure that the business
successfully withstand the low oil price era and remain profitable during the
year. Moving on, the Company on the back of intensified exploration activities
and financial strength to support ongoing development projects is on track to
sustain business long term growth and efficiently meet the future business
challenges in a way that contributes to the maximization of the shareholders
wealth and safety of the workforce and wellbeing of the communities around
the business operational areas.

Contents2 Geographical Presence
3 Product Portfolio
4 Pursuing Sustainability and Growth
5 Calendar of Major Events
6 Highlights of the Year
8 Notice of Annual General Meeting
10 Vision and Mission
11 Core Values and Goals
12 Code of Conduct
14 Corporate Information
16 Board of Directors
20 Committees of the Board
22 Attendance of the Board and Committee Meetings
24 Organizational Chart
25 Management Objectives and Strategies
26 Core Management Team
28 Exploration Licenses
30 Development and Production/Mining Leases
32 Six Years Performance
35 Vertical and Horizontal Analysis
36 Statement of Value Addition
37 DuPont Analysis and Analysis of Variation in Results Reported in Interim Reports
38 Managing Director’s Review
40 Directors’ Report
64 Risk and Opportunity Report
65 Review Report to the Members on the Statement of Compliance with the Code of Corporate Governance and Public Sector Companies (Corporate Governance) Rules, 2013
66 Statement of Compliance with the Code of Corporate Governance and Public Sector Companies (Corporate Governance) Rules, 2013
72 Auditors’ Report to the Members
74 Balance Sheet
76 Profit and Loss Account
77 Statement of Comprehensive Income
78 Cash Flow Statement
79 Statement of Changes in Equity
80 Notes to and Forming Part of the Financial Statements
135 Pattern of Shareholding
137 Categories of Shareholders
150 Abbreviations
Form of Proxy/E-Voting
Request Form
Entry Card
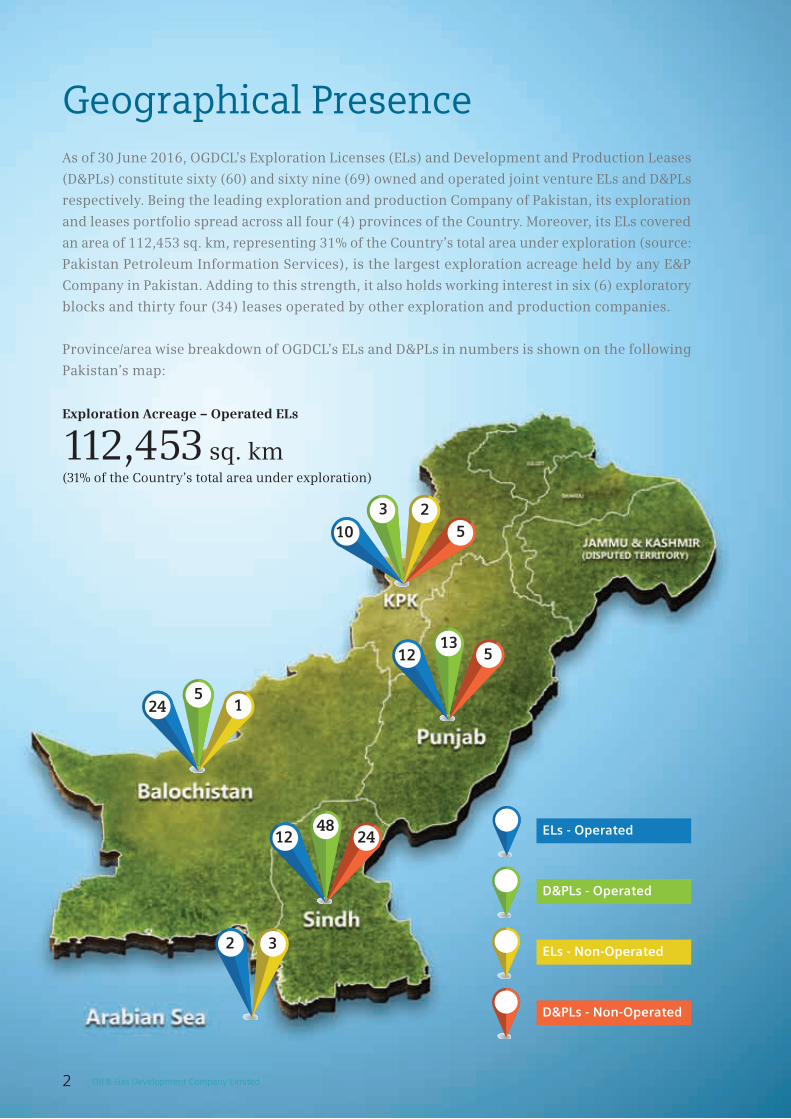
Geographical PresenceAs of 30 June 2016, OGDCL’s Exploration Licenses (ELs) and Development and Production Leases
(D&PLs) constitute sixty (60) and sixty nine (69) owned and operated joint venture ELs and D&PLs
respectively. Being the leading exploration and production Company of Pakistan, its exploration
and leases portfolio spread across all four (4) provinces of the Country. Moreover, its ELs covered
an area of 112,453 sq. km, representing 31% of the Country’s total area under exploration (source:
Pakistan Petroleum Information Services), is the largest exploration acreage held by any E&P
Company in Pakistan. Adding to this strength, it also holds working interest in six (6) exploratory
blocks and thirty four (34) leases operated by other exploration and production companies.
Province/area wise breakdown of OGDCL’s ELs and D&PLs in numbers is shown on the following
Pakistan’s map:
24 15
1248
24
1213
5
Exploration Acreage – Operated ELs
112,453 sq. km(31% of the Country’s total area under exploration)
210
35
2 3
ELs - Operated
D&PLs - Operated
ELs - Non-Operated
D&PLs - Non-Operated
2 Oil & Gas Development Company Limited

Crude Oil36.28%
Others3.48%
Gas60.24%
OGDCL in an endeavor to meet growing energy demands and contribute in the economic growth
of the Country is making all out efforts to maintain and augment the current production levels
of crude oil, gas, LPG and sulphur. Pursuit to this ambition during the reporting period led the
Company to make largest contribution of around 48% and 28% in the Country’s total oil and
natural gas production respectively, which in addition to generating operational cash flows also
continues to render significant foreign exchange savings as import substitution. During the
period under review, Company’s major fields contributing in the aforesaid production of crude
oil include Nashpa, Kunnar/KPD, Pasakhi, Sinjhoro and Rajian and for gas include Qadirpur,
Uch, KPD, Nashpa and Dakhni.
Product Portfolio
Net Sales Rs 162.867 billion
40,609Barrels per day
1,056MMcf per day
39Tons per day
Crude Oil Gas
LPG Sulphur
Product wise contribution in Net Sales
342Tons per day
Annual Report 2016 3

Pursuing Sustainability and Growth
Development of New Partnerships Benefit from the expertise of experienced E&P
companies (indigenous/international) through
continuing formulation of value driven joint ventures
to ensure that projects and operations remain cost
effective and technical and commercial risks are
diversified.
Enhance Recovery of Reserves Utilize advance reservoir management practices
and state of the art oil recovery methods to optimize
oil and gas reserves and maximize hydrocarbon
recovery from mature fields. Moreover, locate and
exploit alternate sources of energy such as shale gas,
coal bed methane, etc., to enhance energy security
of the Country.
New Discoveries Carry on intensified exploratory efforts to yield new
oil and gas discoveries alongside focus on seamless
development of new discoveries in the shortest
possible time to overcome the impact of natural
decline from mature fields and boost the existing
reserves and production levels.
E&P Activities Continuing fast track seismic data acquisition,
expeditious processing/reprocessing of the acquired
seismic data and active drilling campaigns in the
business operated blocks to pave the way to discover
potential hydrocarbon bearing zones and counter the
impact of low oil prices leading to improved business
profitability and shareholder value.
Moreover, undertaking effective production
operations and ramping up completion activities
of ongoing development projects will enable
the business to reap the futuristic rewards in the
form of enhanced oil, gas and LPG output and carry
on the track record of delivering industry leading
performance in the coming years.
Operational Improvement Adapt and use latest production techniques and
innovative technologies to drive functional excellence
across E&P operations. Moreover in compliance
to the risk management framework, identify,
manage and curtail controllable business risks in
parallel displaying zero tolerance to the health and
safety matters and contributing to the wellbeing
of marginalized communities residing around the
business operational areas.
Internationalization In line with the business vision to expand E&P
operations, make efforts to establish footprints abroad
by undertaking farm-in/farm-out opportunities as
well as acquisition of concessions in an international
market subject to their economic and financial
viability.
OGDCL in pursuit to sustain and grow E&P operations in a tough environment, existent due to plunge in
international oil prices, is focused on the following:
in tough times
4 Oil & Gas Development Company Limited

1st Quarter
Oil discovery was made at Chak Naurang South-1 located in district Chakwal, Punjab province.
OGDCL’s Annual Report 2014 secured Best Corporate Report Award and ranked second in fuel and energy sector by the Joint Committee of Institute of Chartered Accountants of Pakistan and Institute of Cost and Management Accountants of Pakistan.
Gas discovery was made at Aradin-1 located in district Khairpur, Sindh province.
Pakistan’s 69th Independence Day was celebrated at Head Office, field locations and other offices with great zeal and fervor.
OGDCL signed MOU with Russian firm JSC Rosgeologia on 9 September 2015 for exploration and production on broader terms within their exploration blocks to seek mutual benefits.
Hosted 463rd Scout Check Meeting on 21 September 2015 at OGDCL House, Islamabad, which was attended by representatives of twelve E&P companies to discuss details of exploration activities.
20
15
20
16
2nd Quarter
OGDCL’s 18th Annual General Meeting was held on 15 October 2015 at Marriott Hotel, Islamabad.
Co-hosted 22nd Annual Technical Conference on “E&P Challenges: Prospects, Professionals and Policies”, which was inaugurated by Mr. Shahid Khaqan Abbasi, Minister for Petroleum & Natural Resources on 24 November 2015.
An EPCC contract for LPG plant at Nashpa field was signed between OGDCL and Hong Kong Huihua Global Technology Limited.
Mr. Shahid Khaqan Abbasi, Minister for Petroleum & Natural Resources took the oath from the newly elected office bearers of Officers’ Association in a ceremony held on 29 December 2015.
Three days workshop on “HSE Hazards Identification and Risk Assessment for managing Risk Register” was held on 29-31 December 2015.
3rd Quarter
Gas discovery was made at Thal East-1 located in district Sukkur, Sindh province.
Oil discovery was made at Nashpa X-5 located in district Karak, Khyber Pakhtunkhwa province.
In recognition of activities relating to social responsibilities, OGDCL won the 5th Corporate Social Responsibility Award 2016 in a ceremony organized by National Forum for Environment and Health on 14 January 2016.
OGDCL was assigned medium to long term entity rating ‘AAA’ (triple A) and short term entity rating ‘A-1 +’ (A One Plus) by the Pakistan Credit Rating Agency for the fiscal year 2014-15.
4th Quarter
Gas discovery was made at Thal West-1 located in district Sukkur, Sindh province.
Gas condensate discovery was made at Bitrism West-1A located in district Sanghar, Sindh province.
On account of compliance to HSE standards, Chanda and Dakhni fields attained ISO 14001 and OHSAS 18001 certifications.
7th Annual HSE Awareness Event 2016 was celebrated at Bobi Oil Complex on 24 April 2016.
On the basis of contributions and implementations in the field of fire and safety, OGDCL won the 6th Fire and Safety Award 2016 in a conference organized by Fire Protection Association of Pakistan in collaboration with National Forum for Environment and Health on 28 April 2016.
Calendar of Major EventsDuring the Fiscal Year 2015-16
Annual Report 2016 5
Highlights of the Year
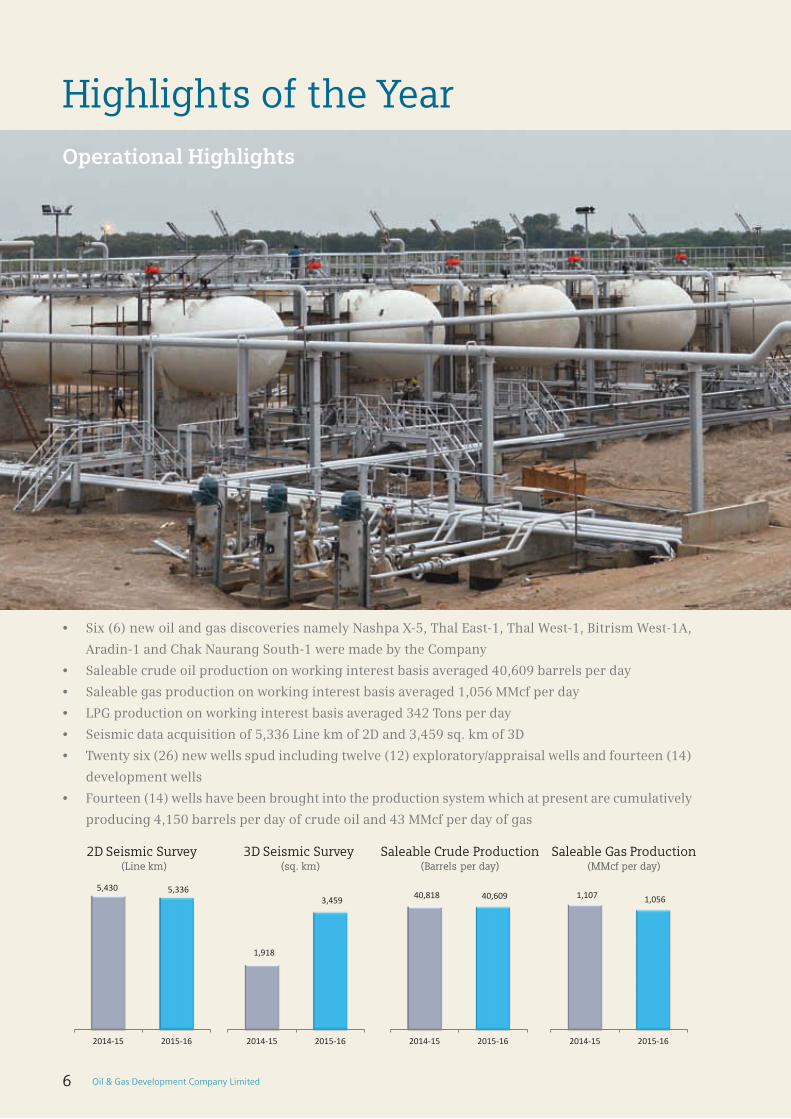
5,430 5,336
2014-15 2015-16
1,918
3,459
2014-15 2015-16
40,818 40,609
2014-15 2015-16Exploratory/Appraisal Development
210.6
162.9
2014-15 2015-16
87.2
60.0
2014-15 2015-16
2.28 V
2D Seismic Survey(sq. km)
3D Seismic Survey(Line km) (Barrels per day)
Saleable Crude Production(MMcf per day)
Saleable Gas Production(Numbers)
Wells Spud(Rs in billion)
Sales Revenue(Rs in billion)
Profit for the Year
2014-15 2015-16
14
1211
141,107 1,056
2014-15 2015-16
Operational Highlights
• Six(6)newoilandgasdiscoveriesnamelyNashpaX-5,ThalEast-1,ThalWest-1,BitrismWest-1A,
Aradin-1 and Chak Naurang South-1 were made by the Company
• Saleablecrudeoilproductiononworkinginterestbasisaveraged40,609barrelsperday
• Saleablegasproductiononworkinginterestbasisaveraged1,056MMcfperday
• LPGproductiononworkinginterestbasisaveraged342Tonsperday
• Seismicdataacquisitionof5,336Linekmof2Dand3,459sq.kmof3D
• Twentysix(26)newwellsspudincludingtwelve(12)exploratory/appraisalwellsandfourteen(14)
development wells
• Fourteen(14)wellshavebeenbroughtintotheproductionsystemwhichatpresentarecumulatively
producing 4,150 barrels per day of crude oil and 43 MMcf per day of gas
6 Oil & Gas Development Company Limited

5,430 5,336
2014-15 2015-16
1,918
3,459
2014-15 2015-16
40,818 40,609
2014-15 2015-16Exploratory/Appraisal Development
210.6
162.9
2014-15 2015-16
87.2
60.0
2014-15 2015-16
2.28 V
2D Seismic Survey(sq. km)
3D Seismic Survey(Line km) (Barrels per day)
Saleable Crude Production(MMcf per day)
Saleable Gas Production(Numbers)
Wells Spud(Rs in billion)
Sales Revenue(Rs in billion)
Profit for the Year
2014-15 2015-16
14
1211
141,107 1,056
2014-15 2015-16
Financial HighlightsSeismic Data Acquisition (2D)
5,336Line km
Seismic Data Acquisition (3D)
3,459sq. km
Wells Spud
26Numbers
Discoveries
6Numbers
• TotalassetsincreasedtoRs589.6billionfromRs553.8billion
• NetrealizedpricesofcrudeoilandgasaveragedUS$39.07/
barrelandRs253.77/Mcfrespectively(2014-15:US$63.29/
barrel and Rs 272.61/Mcf)
• SalesrevenuefortheyearRs162.9billion(2014-15:Rs210.6
billion)
• ProfitfortheyearRs60.0billion(2014-15:Rs87.2billion)
• EarningspersharefortheyearRs13.94(2014-15:Rs20.29)
• Total cumulative dividend declared Rs 5.20 per share
(2014-15: Rs 7.75 per share)
• ContributiontonationalexchequerRs81.6billion(2014-15:
Rs 123.7 billion)
Annual Report 2016 7

Notice of Annual General MeetingNotice is hereby given that the 19th Annual General Meeting of Oil and Gas Development Company Limited will be held at Marriott Hotel, Islamabad on 26 October 2016 at 10:00 a.m. to transact the following business:
ORDINARY BUSINESS
1) To confirm the minutes of the 18th Annual General Meeting held on 15 October 2015.
2) To confirm the minutes of 10th Extraordinary General Meeting held on 23 August 2016.
3) To receive, consider and adopt the audited accounts of the Company for the year ended 30 June 2016 together with the Directors’ and Auditors’ Reports thereon.
4) To approve the final cash dividend @ 20% i.e. Rs 2.00 per share for the year ended 30 June 2016 as recommended by the Board of Directors. This is in addition to three interim cash dividends totaling to 32% i.e. Rs 3.20 per share already paid during the year.
5) To appoint Auditors for the year 2016-17 and fix their remuneration. The present auditors M/s KPMG Taseer Hadi & Co., Chartered Accountants and M/s A.F. Ferguson & Co., Chartered Accountants will stand retired on the conclusion of this meeting.
6) To transact any other business with the permission of the Chair.
By order of the Board
20 September 2016 (Ahmed Hayat Lak)Islamabad Company Secretary
NOTES:
1- Participation in the Annual General Meeting A member entitled to attend and vote at this meeting is entitled to appoint another person as his/her
proxy to attend and vote. Proxies in order to be effective must be received at the Registered Office of the Company duly stamped and signed not less than 48 hours before the meeting.
2- CDC Account holders will further have to follow the under mentioned guidelines as laid down in Circular 1 dated 26 January 2000 issued by the Securities and Exchange Commission of Pakistan:
a. For attending the meeting In case of individuals, the account holder or sub-account holder and/or the person whose securities
are in group account and their registration details are uploaded as per regulations, shall authenticate his/her identity by showing his/her original Computerized National Identity Card (CNIC) or original passport at the time of attending the meeting.
In the case of corporate entities, the Board of Directors’ resolution/power of attorney with specimen signature of the nominee shall be produced (unless it has been provided earlier) at the time of the meeting.
b. For appointing proxiesi) In case of individuals, the account holder or sub-account holder and/or the person whose
securities are in group account and their registration details are uploaded as per regulations, shall submit the proxy form as per the above requirement.
8 Oil & Gas Development Company Limited

ii) The proxy form shall be witnessed by two (2) persons whose names, addresses and CNIC number shall be mentioned on the form.
iii) Attested copies of CNIC or the passport of the beneficial owners and of the proxy shall be furnished with the proxy form.
iv) The proxy shall produce his/her original CNIC or original passport at the time of the meeting.
v) In the case of a corporate entity, the Board of Directors’ resolution/power of attorney with specimen signature of the person nominated to represent and vote on behalf of the corporate entity shall be submitted (unless it has been provided earlier) along with proxy form to the Company.
c. E-Voting Pursuant to SECP Companies (E-voting) Regulations, 2016, members can also exercise their
right to vote through e-voting by giving their consent in writing at least 10 days before the date of the meeting to the Company on the appointment of Execution Officer by the intermediary as Proxy.
3- Video Conference Facility Pursuant to provisions of SECP Circular No. 10 of 2014 dated 21 May 2014, if the Company receives
consent from members holding aggregate 10% or more shareholding residing in geographical location to participate in the meeting through video conference at least 10 days prior to the date of meeting, the Company will arrange video conference facility in that city subject to availability of such facility in that city. In order to vote through e-voting and avail video conference facility, please fill the requisite forms and submit to the Company within the time frame as mentioned in forms. The forms are being sent to each individual shareholder through post and are also available on the Company website.
4- Closure of Share Transfer Books The share transfer books of the Company will remain closed and no transfer of shares will be accepted
for registration from 19 October 2016 to 26 October 2016 (both days inclusive). Transfers received in order at the Share Registrar’s office Share Registrar Department, Central Depository Company of Pakistan Limited, CDC House, 99-B, Block ‘B’, S.M.C.H.S., Main Shahrah-e-Faisal, Karachi-74400 by the close of business on 18 October 2016 will be treated in time for the purpose of payment of final cash dividend, if approved by the shareholders.
5- Change in Address Members are requested to promptly notify any change in their address.
6- Notice to Shareholders who have not provided their CNICs In accordance with the notification of the Securities and Exchange Commission of Pakistan (SECP), SRO
831(I) 2012 dated 5 July 2012, dividend warrants should bear CNIC number of the registered member or the authorized person. Accordingly members who have not yet submitted copy of their valid CNIC/ NTN (in case of corporate entities) are requested to submit the same to the Company with members Folio No. mentioned thereon. It may kindly be noted that in case of non-receipt of the copy of valid CNIC, the Company in the light of SECP Notification No. S.R.O 275 (I)/2016 dated 31 March 2016 would be constrained to consider withholding dividend. List of shareholders who have not provided copies of their CNIC/NTN has been uploaded on the Company’s website for shareholders’ information.
7- Dissemination of Annual Audited Accounts to Shareholders In the light of SRO No. 470(I)/2016 dated 31 May 2016 as notified by Securities and Exchange Commission
of Pakistan, shareholders of the Company in the 10th Extraordinary General meeting held on 23 August 2016 approved dissemination of information regarding annual audited accounts in soft form i.e. CD/DVD/USB. Shareholder who opt to receive annual audited accounts at their registered addresses or through email, are requested to fill the standard Request Form uploaded on the Company’s website and send the same duly signed by the shareholder to our Share Registrar, Central Depository Company of Pakistan Limited.
Annual Report 2016 9

Mission
Vision
To be a leading multinational
Exploration and Production Company.
To become the leading provider
of oil and gas to the Country
by increasing exploration and
production both domestically and
internationally, utilizing all options
including strategic alliances;
To continuously realign ourselves
to meet the expectations of
our stakeholders through best
management practices, the use of
latest technology and innovation
for sustainable growth while being
socially responsible.
10 Oil & Gas Development Company Limited

Core Values
Financial• Buildstrategicreservesforfuturegrowth/
expansion
• Growthandsuperiorreturnstoallstakeholders
• DoublethevalueoftheCompanyinthenextfive(5) years
• Makeinvestmentdecisionsbyrankingprojectson the basis of best economic indicators
• Maximizeprofitsbyinvestingsurplusfundsinprofitable avenues
• Reducecostandtimeoverrunstoimproveperformance results
Learning and Growth• Motivateourworkforceandenhancetheirtechnical,
managerial and business skills through modern HR practices
• Acquire,learnandapplystate-of-the-arttechnology
• Emphasizeorganizationallearningandresearchthrough effective use of knowledge management systems
• Fillthecompetencygapwithintheorganizationby attracting and retaining best professionals
• Attainfullautonomyinfinancialanddecisionmaking matters
Customers• Continuouslyimprovequalityofserviceand
responsiveness to maintain a satisfied customer base
• Improvereliabilityandefficiencyofsupplytothe customer
• Bearesponsiblecorporatecitizen
Internal Process• Evolveconsensusthroughconsultativeprocess
interlinking activities of all departments
• Excelinexploration,developmentandcommercialization
• Betransparentinallbusinesstransactions
• Synergizethrougheffectivebusinesspracticesand teamwork
• Havewell-definedSOPswithspecificownershipsand accountabilities
• Improveinternalcontrols
• Improveinternalbusinessdecisionmakingand strategic planning through state of the art Management Information System
• Periodicbusinessprocessreengineering
Ded
icat
ion
Teamwork Merit In
no
vation
Integrity Safety
Goals
Annual Report 2016 11

1. OBJECTIVE To ensure that Oil & Gas Development Company Limited (“the Company”) conducts and is seen to conduct its
operations in accordance with highest business ethical consideration complying with all statutory regulations and universally accepted standards of a good corporate citizen. The Company’s core values are Merit, Teamwork, Dedication, Integrity, Safety and Innovation. It is towards this end of fostering the core values in the corporate culture of the Company that the Company has adopted this Code of Conduct (“the Code”).
2. APPLICATION In compliance with the requirements of Clause No. v (a) of the Code of Corporate Governance, this Code
applies to all directors and employees of the Company.
3. IMPLEMENTATION The Code implies as follows:
Use of Company’s assets/record keeping3.1 The directors and employees of the Company seek to protect the Company’s assets and to ensure that
the Company’s assets and services are used solely for legitimate business purposes of the Company. The use of Company’s funds for political contributions to any organization or to any candidate for public office is prohibited.
3.2 The Company must make and keep books and records that accurately and fairly reflect the Company’s transactions and the disposition of its assets in accordance with Generally Accepted Accounting Principles (GAAP) and applicable laws and regulations.
3.3 Any accounting adjustments that materially depart from GAAP must be reported to the Audit Committee of the Board, Board of Directors and the Company’s statutory auditors. In addition, any off-balance sheet transactions, arrangements and obligations, contingent or otherwise, and other relationships of the Company with unconsolidated entities or other persons that may have material current or future effects on the financial condition, changes in financial condition, results of operations, liquidity, capital expenditures, capital resources or significant components or revenues or expenses must also be disclosed to the Audit Committee of the Board, Board of Directors and the Company’s statutory auditors.
Legal Compliance and Conflict of Interest3.4 The directors and employees adhere in letter and spirit to all laws and conform to the accepted
standards of good corporate governance and avoid conflict of interest. The conflict of interest, if any, real or perceived including potential conflicts must be notified to the Company in writing immediately. (A conflict of interest may arise when a director or an employee is in a position to influence a decision or situation that may result in personal gain for such employee or the employee’s family or friends at the expense of the Company or its customers).
3.5 The directors and employees shall not place themselves in a position where their loyalty to the Company becomes divided for any reason including their direct or indirect financial interest in a competitor, supplier, consultant or customer.
3.6 The Company respects the interests of all the stakeholders and enters into transparent and fairly negotiated contracts. It will do business with customers and suppliers of sound business character and reputation only. All business dealings by the Company with third parties shall be on an arm’s length and commercial basis.
Corruption3.7 The directors and employees reject corruption in all forms – direct, indirect, public or private and do
not directly or indirectly engage in bribery, kick-backs, payoffs or any other corrupt business practices.
Code of Conduct
12 Oil & Gas Development Company Limited

No employee of the Company shall accept any funds, loans, favours or other assets (including those provided as preferential treatment) to obtain business from the Company or that might tend to influence an employee’s business decisions. Acceptance of any gift will be subject to the Company’s policy.
3.8 In the course of their normal business duties, employees may be offered entertainment such as lunch, dinner, theatre, a sporting event and the like. Accepting these offers is appropriate if those are reasonable and occur in the course of a meeting or on an occasion the purpose of which is to hold bona fide business discussions or to foster better business relations. Employees should not accept tickets or invitations to entertainment when the prospective host will not be present at the event with the employee.
3.9 Employees may offer tips or hospitality of a customary amount or value for routine services or exchange of customary reciprocal courtesies to promote general business goodwill provided it does not influence business decisions or dealings of the Company.
Confidentiality3.10 The Company respects the privacy of data relating to individual persons (whether employees or third
parties) which it may hold or handle as part of its information processing activities or otherwise. Employees maintain confidentiality of the Company’s and its customers’ confidential information which is disclosed to them.
3.11 The directors and employees may not take advantage of the Company’s information or property, or their position with the Company, to develop inappropriate personal gains or opportunities.
General3.12 The Company is an equal opportunity employer and does not discriminate on the basis of sex, colour,
religion or creed.
3.13 Employees may offer tips, gratuity or hospitality of a customary amount or value for routine services or courtesies received as per the Company policy.
3.14 If an employee becomes aware that another employee has violated this Code, he or she is obligated to report that violation to the Company.
4. RESPONSIBILITY FOR ENFORCEMENT/INTERPRETATION4.1 All directors and employees of the Company and its subsidiary/subsidiaries are responsible for the
continuing enforcement and compliance of this Code. If any employee has any question about any part of this Code, he or she should direct such question to his or her immediate supervisor or to the Executive Director (Human Resources) or to the Company Secretary. Non-compliance with this Code will result in disciplinary action as per rules of the Company.
4.2 Good faith reports of the violations will be promptly and thoroughly investigated. All employees must cooperate in the investigation of reported violations.
4.3 The Investigating Officer will not, to the extent practical and appropriate under the circumstances, disclose the identity of anyone who reports a suspected violation or who participates in the investigation.
4.4 The Company does not permit retaliation against an employee who in good faith seeks advice or reports misconduct. Retaliation in any form against an individual, who in good faith reports a violation of this Code or the law, even if the report is mistaken, or who assists in the investigation of a reported violation, is itself a serious violation of this Code. Anyone who engages in retaliation will be subject to disciplinary action, including termination from the service of the Company.
Annual Report 2016 13

Board of DirectorsMr. Zahid Muzaffar Chairman
Mr. Arshad Mirza Director
Mr. Saif Ullah Chattha Director
Mr. Iskander Mohammed Khan Director
Mr. Hamid Farooq Director
Mr. Muhammad Ali Tabba Director
Mr. Zafar Masud Director
Prince Ahmed Omar Ahmedzai Director
Sayed Shafqat Ali Shah Director
Mr. Rahmat Salam Khattak Director
Mr. Muhammad Yawar Irfan Khan Director
Mr. Zahid Mir MD & CEO
Corporate InformationChief Financial OfficerMr. Irteza Ali Qureshi
Company SecretaryMr. Ahmed Hayat Lak
AuditorsM/s KPMG Taseer Hadi & Co., Chartered Accountants
M/s A.F. Ferguson & Co., Chartered Accountants
Legal AdvisorM/s Khokhar Law Chambers
Tax AdvisorM/s A.F. Ferguson & Co., Chartered Accountants
14 Oil & Gas Development Company Limited

BankersAllied Bank Limited Askari Bank Limited Bank Alfalah Limited Bank Al Habib Limited Barclays Bank PLC Citibank Deutsche Bank Faysal Bank Limited Habib Bank Limited Habib Metropolitan Bank Limited HSBC Bank of Middle East MCB Bank Limited Meezan Bank Limited National Bank of Pakistan NIB Bank Limited Soneri Bank Limited Standard Chartered Bank United Bank Limited
Registered OfficeOGDCL House, Plot No. 3, F-6/G-6, Blue Area, Jinnah Avenue, Islamabad. Phone:(PABX)+92519209811-8Fax:+92519209804-6,9209708Website:www.ogdcl.comEmail: [email protected]
Registrar OfficeCentral Depository Company of Pakistan Limited, CDC House, 99-B, Block-B, S.M.C.H.S, Main Shahrah-e-Faisal, Karachi-74400. Phone:+9221111111500Fax:+922134326053Website:www.cdcpakistan.comEmail: [email protected]
Annual Report 2016 15

Board of Directors
Mr. Zahid Muzaffar has over 36 years of diversified experience in energy sector, in both upstream and downstream oil and gas operations, including transportation of gas via terrestrial piplines as well as liquefied natural gas (“LNG”). Mr. Muzaffar has developed successful working relationships with investors, business professionals, financiers and government officials internationally, particularly those resident in the Far East, South Asia, the Middle East and North Africa. He has been involved in securing valuable deal flows and business opportunities for leading international companies. Mr. Muzaffar has served on the board of directors of London and Scottish Marine Oil plc in Pakistan and many other international E&P and refining companies. He headed the acquisition of the largest oil refining company in the Mediterranean, (RA’s LANUF Refinery Libya). Mr. Muzaffar was appointed as a board member of the new entity LIBYAN EMIRATES oil Refinery Company (LERCO) as well as various initiatives on behalf of Middle Eastern groups in connection with the privatization of assets in different countries in the energy sector. He was also responsible for setting up a joint venture consortium for Spanish and Turkish oil and gas companies for a cross-country gas pipeline and LNG terminal in Turkey.
Mr. Muzaffar holds a Bachelor of Economics from the University of the Punjab, Pakistan and has attended various management courses at the College of Petroleum Studies and St. Catherine’s College, Oxford, UK, and the Edwin H. Cox School of Business at Southern Methodist University, Dallas Texas, USA, WENTWORTH Consultants, HUDDERSFIELD UK. He has also attended high performance Board program at IMD Switzerland.
Mr. Saif Ullah Chattha is a career civil servant. He is at present the Chief Secretary of Balochistan. Mr. Chattha holds a Bachelor of Arts degree from Government College, Lahore and Bachelor of Law degree from Punjab University, Law College, Lahore. Mr. Chattha has significant experience of Public Administration. He has served as Assistant Commissioner, Sui (Dera Bugti), Sibi and Usta Mohammad; as Deputy Secretary to the Chief Minister of Balochistan; as Deputy Commissioner of Jafarabad and Loralai; as Deputy Secretary to the Chief Minister of Punjab; as Additional Secretary of Agriculture of Punjab; as Deputy Commissioner of Bhakkhar, Multan and Jhelum; and as Secretary of the Mines and Minerals Department of Punjab. He has also served in the Federal Government as Principal Staff Officer to the Prime Minister of Pakistan; as Counsel General of Pakistan in Montreal, Canada; as Chief Secretary of Gilgit Baltistan; as Additional Secretary at the Ministry of Communications; and as Secretary of Water and Power.
Mr. Saif Ullah ChatthaDirector
Mr. Arshad Mirza, Secretary, Federal Ministry of Petroleum and Natural Resources is a career civil servant. After doing his M.Sc. (Public Administration) from Quaid-e-Azam University, Islamabad in 1981, he joined civil service of Pakistan (District Management Group) in the year 1983. He has held various positions in the Federal as well as Provincial Governments and District Administration.
He has served as Secretary, Works and Services, Secretary Health Department, Additional Secretary, Finance Department and Additional Secretary Planning and Development Department in the Government of Khyber Pukhtunkhwa.
In the Federal Government he was posted as Joint Secretary, Ministry of Finance and Revenue (PMSP Wing), Islamabad in May 2005. Served in Prime Minister’s Secretariat, ERRA and Environment Division. Elevated to the post of Additional Secretary and worked in Finance Division and Water & Power Division.
He joined National Defence University for higher training and obtained M.Sc. degree in Defence and Strategic Studies in 2009. He visited different countries i.e. Philippines, USA, Sri Lanka, Egypt, UK, Kazakhstan and Korea to attend workshops, trainings, seminars and conferences. He attended advance professional courses in institutions like University of Manchester UK, University of Connecticut USA and Harvard University USA.
He joined Ministry of Petroleum and Natural Resources on 22 July 2013 as Additional Secretary. He assumed the charge of the Federal Secretary on 23 January 2015. He also served as Managing Director, Pakistan Petroleum Limited (PPL), Government Holding Pvt Ltd (GHPL) and Hydrocarbon Development Institute of Pakistan (HDIP). He is ex-officio Member on the Board of PPL and PARCO.
Mr. Arshad MirzaDirector
Mr. Zahid MuzaffarChairman
16 Oil & Gas Development Company Limited

Mr. Iskander Mohammed Khan is a director of the Premier Group of Companies, including Premier Sugar Mills & Distillery Company Limited, Frontier Sugar Mills & Distillery Limited, Chashma Sugar Mills Limited, Arpak International Investments Limited and other non-listed subsidiaries of the Premier Group. He served as Chairman of the All Pakistan Sugar Mills Association between 2000 and 2004, Chairman of the Pakistan Polypropylene Woven Sack Manufacturers Association, Chairman of the All Pakistan Sugar Mills Association (KPK) from 2005 to 2006, Director of the ISE in 2005 and was a member of the Managing Committee of the Federation of Pakistan Chambers of Commerce and Industry from 2005 to 2006. Mr. Khan holds a degree in Law (LLB) and Chartered Accountancy.
Mr. Iskander Mohammed KhanDirector
Mr. Hamid Farooq is Chief Business Development Officer at the Pakistan Telecommunication Company Limited. He has 28 years of senior general management experience including 15 years of financial management in leading complex commercial and technical environments. Mr. Hamid Farooq is also Chairman of the Board of Directors at Microfinance Bank Ltd. He has served as Managing Director, MENA Region at Catalyst Managerial Services, CEO of Warid Telecom, Executive Vice President, CFO and Company Secretary of Mobilink, Chief Accountant and Administrator at Canadian Occidental Petroleum, Head of Accounts and Operations at Petro Canada, and Country Finance Manager at DHL/TCS. Mr. Farooq is a certified financial consultant and holds a Diploma in Financial Consulting and an MBA. He trained as an accountant with PricewaterhouseCoopers in Pakistan and obtained a Bachelor of Commerce degree. He is also a Certified Director (training and programme), certified through the Securities and Exchange Commission of Pakistan.
Mr. Hamid FarooqDirector
Mr. Muhammad Ali Tabba is Chief Executive of Lucky Cement Ltd, a member of the Yunus Brothers Group, which holds diversified interests in textiles, energy, chemicals, cement and other construction related sectors. Muhammad Ali Tabba also heads Yunus Textile Mills, a home textiles unit with subsidiaries in the USA, Europe, Canada and France. He also serves as Vice Chairman on the Board of Directors of ICI Pakistan. Mr. Tabba also sits on the Board of Governors at several universities, institutions and foundations. He also runs the Aziz Tabba Foundation which works extensively in education, health and housing. The foundation also operates a kidney centre and a state-of-the art cardiac hospital. The World Economic Forum has bestowed the title of Young Global Leader on Mr. Tabba, recognizing his outstanding services and commitment to the social development sector in Pakistan.
Mr. Muhammad Ali TabbaDirector
Annual Report 2016 17
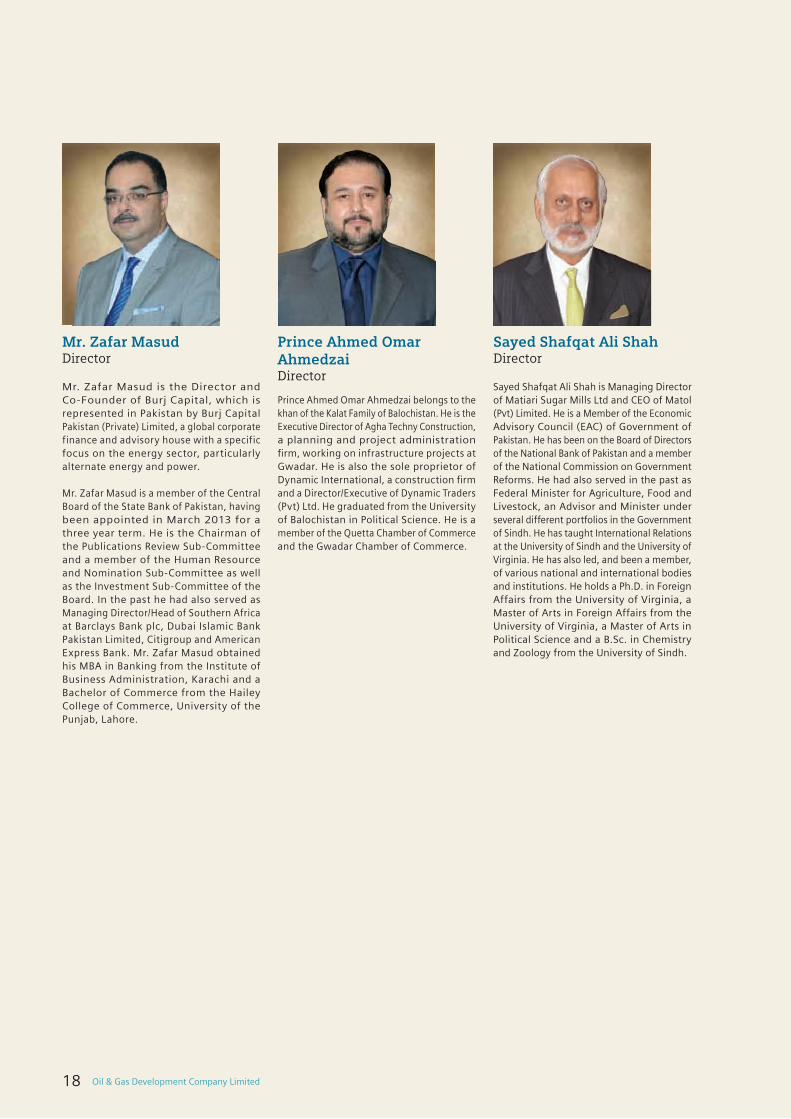
Sayed Shafqat Ali Shah is Managing Director of Matiari Sugar Mills Ltd and CEO of Matol (Pvt) Limited. He is a Member of the Economic Advisory Council (EAC) of Government of Pakistan. He has been on the Board of Directors of the National Bank of Pakistan and a member of the National Commission on Government Reforms. He had also served in the past as Federal Minister for Agriculture, Food and Livestock, an Advisor and Minister under several different portfolios in the Government of Sindh. He has taught International Relations at the University of Sindh and the University of Virginia. He has also led, and been a member, of various national and international bodies and institutions. He holds a Ph.D. in Foreign Affairs from the University of Virginia, a Master of Arts in Foreign Affairs from the University of Virginia, a Master of Arts in Political Science and a B.Sc. in Chemistry and Zoology from the University of Sindh.
Sayed Shafqat Ali ShahDirector
Mr. Zafar Masud is the Director and Co-Founder of Burj Capital, which is represented in Pakistan by Burj Capital Pakistan (Private) Limited, a global corporate finance and advisory house with a specific focus on the energy sector, particularly alternate energy and power.
Mr. Zafar Masud is a member of the Central Board of the State Bank of Pakistan, having been appointed in March 2013 for a three year term. He is the Chairman of the Publications Review Sub-Committee and a member of the Human Resource and Nomination Sub-Committee as well as the Investment Sub-Committee of the Board. In the past he had also served as Managing Director/Head of Southern Africa at Barclays Bank plc, Dubai Islamic Bank Pakistan Limited, Citigroup and American Express Bank. Mr. Zafar Masud obtained his MBA in Banking from the Institute of Business Administration, Karachi and a Bachelor of Commerce from the Hailey College of Commerce, University of the Punjab, Lahore.
Mr. Zafar MasudDirector
Prince Ahmed Omar Ahmedzai belongs to the khan of the Kalat Family of Balochistan. He is the Executive Director of Agha Techny Construction, a planning and project administration firm, working on infrastructure projects at Gwadar. He is also the sole proprietor of Dynamic International, a construction firm and a Director/Executive of Dynamic Traders (Pvt) Ltd. He graduated from the University of Balochistan in Political Science. He is a member of the Quetta Chamber of Commerce and the Gwadar Chamber of Commerce.
Prince Ahmed Omar AhmedzaiDirector
18 Oil & Gas Development Company Limited

Mr. Rahmat Salam Khattak holds a Bachelor of Arts degree from the University of Peshawar. Mr. Khattak was elected District Nazim of Karak and performed functions as executive head of the district management and the council. He is well abreast with the problems being faced by E&P sector in Pakistan. As District Nazim he successfully managed & resolved long outstanding local issues of E&P companies operating in District Karak. He has also been associated with education and founder of first modern management sciences institute in Peshawar, the first of its kind in the province designed to equip young business managers with modern management skills. He served as Chief Executive of the Institute of Management and Computer Sciences Peshawar; Hayatabad Science College Peshawar and Chief Executive of the Shenghar Children Academy Karak. Besides education sector, Mr. Khattak established a construction company and managed its operations. He also served in Saudi Arabia and Habib Bank Limited in various capacities.
Mr. Rahmat Salam KhattakDirector
Mr. Zahid Mir is a Petroleum Engineer with over 27 years experience in the oil and gas industry with assignments relating to onshore and offshore operations having been involved at a senior level in all stages of upstream operations. He has strong HSE background, extensive experience as an oil and gas commercial negotiator and business developer, strategy, joint ventures and license management, new ventures, economic evaluations, mergers and acquisitions.
Mr. Zahid Mir had significant exposure to field operations including production, project development, development planning, conceptual engineering and operational support. During the performance of his functions, he closely interacted with oil and gas producers both in Pakistan and United Kingdom like Shell Exploration Pakistan B.V., Premier Exploration Pakistan Limited, Premier-Kufpec Pakistan B.V., Premier Oil Pakistan and Premier Oil UK.
He has done his B.Sc. in Petroleum Engineering in 1986 from University of Engineering and Technology Lahore and Masters in Business Administration from Preston University, Islamabad.
Mr. Zahid Mir MD & CEO
Mr. Muhammad Yawar Irfan Khan holds a Masters in Business Administration and is the Chairman of the Irfan Group of Companies which includes Famous Brands Pvt Ltd and Irfan Foods Pvt Ltd. He serves as Chairman of the Asifa Irfan Foundation Trust, a family-run charity organisation. He is a board member of both the Pakistan School of Fashion Design, Lahore and the Government Chuna Mandi College for Women, Lahore, and is a Life Member of the South Asian Association for Regional Cooperation (‘‘SAARC’’) on behalf of the Chamber of Commerce and Industry. Previously, he served as a Director of the Lahore Transport Company, as Chairman of the Chief Minister of Punjab’s Task Force for Industrial Development, and as Managing Director of the Punjab Small Industries Corporation.
Mr. Muhammad Yawar Irfan KhanDirector
Annual Report 2016 19

Committees of the BoardHuman Resource and Nomination CommitteeMr. Saif Ullah Chattha Chairman
Mr. Zahid Muzaffar Member
Mr. Arshad Mirza Member
Mr. Hamid Farooq Member
Mr. Zafar Masud Member
Mr. Rahmat Salam Khattak MemberCompany Secretary Secretary
Terms of Reference• Todealwithallemployeerelatedmattersincluding
recruitment, training, remuneration, performance evaluation, succession planning and measures for effective utilization of the employees of the Public Sector Company;
• RecommendingtotheBoardtheselection,evaluation,compensation (including retirement benefits) and succession planning of the CEO;
• ConsiderationandapprovalonrecommendationsofCEO on such matters for key management positions who report directly to CEO;
• Approvalofappointments/promotionstoEG-VIandEG-VII;
• Recommendationsforappointment/promotionsbeyondEG-VII;
• Guidance/recommendationsforCBAagreements;• Restructuringoftheorganization;• Reviewofcompensationpackage;• ReviewofHRpoliciesincludingthepoliciesrequired
under the Code of Corporate Governance; and• Consideranyotherissueormatterasmaybeassigned
by the Board of Directors.
Risk Management CommitteeMr. Zafar Masud ChairmanMr. Iskander Mohammad Khan MemberMr. Hamid Farooq MemberSayed Shafqat Ali Shah MemberMr. Muhammad Yawar Irfan Khan MemberCompany Secretary Secretary Terms of Reference• Reviewtheriskidentificationandmanagementprocess
developed by management to confirm it is consistent with the Company’s strategy and business plan;
• Reviewmanagement’sassessmentofriskperiodicallyand provide an update to the Board in this regard;
• Inquireofmanagementandtheindependentauditorsabout significant business, political, financial and control risks or exposure to such risks;
• Overseeandmonitormanagement’sdocumentationof the material risks that the Company is exposed to and update as events change and risks shift;
• Assessthestepsmanagementhasimplementedtomanage and mitigate identifiable risk, including the
use of hedging, insurance and other measures taken by the management;
• Overseeandmonitormanagement’sreview,periodicallyof the Company’s policies for risk assessment and risk management (the identification, monitoring, and mitigation of risks); and
• Reviewthefollowingwithmanagement,withtheobjective of obtaining reasonable assurance that all risks are being effectively managed and controlled: - management’s tolerance for financial risks;- management’s assessment of significant risks the
Company is exposed to;- the Company’s policies, procedures, plans, processes
and any proposed changes to those policies for controlling significant financial/non-financial risks; and
- the Company’s counsel legal matters which could have a material impact on the Company’s public disclosure, including financial statements.
Audit CommitteeMr. Iskander Mohammad Khan ChairmanMr. Saif Ullah Chattha MemberMr. Hamid Farooq MemberMr. Muhammad Ali Tabba MemberPrince Ahmed Omar Ahmedzai MemberCompany Secretary Secretary
Terms of Reference• Recommendappointmentofexternalauditorsto
the Board of Directors and consider any questions of resignation or removal of external auditors, audit fees, etc.;
• Recommendappointmentoffinancialconsultantforany service to the Company in addition to audit of its financial statements;
• Recommendappointmentofsuitablecandidate(s)forthe position of Head of Internal Audit;
• Determinationofappropriatemeasurestosafeguardthe Company’s assets;
• Reviewpreliminaryannouncementsoffinancialresultsprior to publication;
• Reviewofquarterly,half-yearlyandannualfinancialstatements of the Company, prior to their approval by the Board of Directors, focusing on: - major judgment areas; - significant adjustments resulting from the audit;- the going-concern assumption; - any changes in accounting policies and practices; - compliance with applicable accounting standards;
and - compliance with listing regulations and other
statutory and regulatory requirements.• Facilitatingtheexternalauditanddiscussionwith
external auditors of major observations arising from interim and final audits and any matter that the auditors may wish to highlight (in the absence of management, where necessary);
20 Oil & Gas Development Company Limited

• Reviewofmanagementletterissuedbyexternalauditorsand management’s response thereto;
• Ensuringcoordinationbetweentheinternalandexternal auditors of the Company;
• Reviewthescopeandextentofinternalauditandensuring that the internal audit function has adequate resources and is appropriately placed within the Company;
• Considerationofmajorfindingsofinternalinvestigationsand management’s response thereto;
• Ascertainingthattheinternalcontrolsystemincludingfinancial and operational controls, accounting system and reporting structure are adequate and effective;
• ReviewoftheCompany’sstatementoninternalcontrolsystems prior to endorsement by the Board of Directors;
• Institutingspecialprojects,valueformoneystudiesor other investigations on any matter specified by the Board of Directors, in consultation with the Chief Executive Officer and to consider remittance of any matter to the external auditors or to any other external body;
• Determinationofcompliancewithrelevantstatutoryrequirements;
• Monitoringcompliancewiththebestpracticesofcorporate governance and identification of significant violations thereof; and
• Considerationofanyotherissueormatterasmaybeassigned by the Board of Directors.
Procurement, Operations and Finance CommitteeMr. Rahmat Salam Khattak ChairmanMr. Zahid Muzaffar MemberMr. Arshad Mirza MemberMr. Hamid Farooq MemberSayed Shafqat Ali Shah MemberCompany Secretary Secretary
Terms of Reference• Toensuretransparencyinprocurementtransactionsand
in dealing with the suppliers and financial institutions; • Procurementofplantmachineryandstoreitemsetc.,
exceeding the powers delegated to Managing Director; • Approval/recommendationforawardofcontractsfor
civil works, development of fields etc., exceeding the powers delegated to Managing Director;
• ReviewandrecommendBusinessandStrategicPlansof the Company for approval by the Board of Directors;
• FormulationofTechnicalandFinancialPoliciesandControls including the policies required under the Code of Corporate Governance;
• Reviewandrecommendpoliciesforinvestmentofsurplus funds of the Company and opening/closing of bank accounts;
• ReviewandrecommendfinancingplansforCompany’sprojects/operations including borrowing limits, loans from banks/financial institutions and other credit lines for approval by the Board of Directors;
• Reviewandrecommendwrite-offcasesinvolvingtheCompany assets;
• ApprovalofExplorationLicensesandrelatedworkprogrammes within budgetary provision;
• RecommendationsforFarm-inandFarm-outinconcessions;
• Recommendationsforparticipationinoffshoreandoverseas opportunities;
• Recommend/reviewthephysicaltargets;• FormulationofTechnicalPoliciesrequiredunder
the Code of Corporate Governance and Public Sector Companies (Corporate Governance) Rules, 2013;
• BusinessDevelopment;• Fieldoperations;• Drillingoperations;• BusinessPlan;• Formationofsubsidiaries,acquisitionetc.;and• Consideranyotherissueormatterasmaybeassigned
by the Board of Directors.
Corporate Social Responsibility CommitteePrince Ahmed Omar Ahmedzai ChairmanMr. Hamid Farooq MemberMr. Zafar Masud MemberSayed Shafqat Ali Shah MemberMr. Rahmat Salam Khattak MemberCompany Secretary Secretary
Terms of Reference• Tomeetallobligatoryrequirementsasprescribed
under the Petroleum Concession Agreement (PCA);• Tomeetnon-obligatoryprojectsunderOGDCL’s
Corporate Social Responsibility (CSR) Policy viz., education, health, water supply and sanitation, supply of gas, infrastructure, sports etc., as prescribed under the Company’s CSR policy;
• TheCommitteewillrecommendtheannualbudgetof CSR (along with a detailed list of all CSR related initiatives), at the beginning of each financial year, to the Board of Directors. Any deviation from this budget can only be made after approval from the Board of Directors;
• Intheeventofanemergency/naturalcalamity,suchas earthquakes, floods etc., the CSR Council may recommend to the MD & CEO to approve a donation up to Rs 1,000,000/- (Rupees one million). However, this must be in line with the approved CSR policy of the Company. The Board of Directors shall be informed of this by circular, to be ratified at its next meeting;
• TheCommitteewillreviewandmonitortheprogressof ongoing CSR projects on a quarterly basis. A detailed report will be provided by Manager CSR to the Committee and the Board of Directors;
• AllactivitiescarriedoutundertheheadCSRwillbeaudited by an external auditor (each financial year) and the audit report will be circulated to the Board of Directors; and
• Consideranyotherissueormatterasmaybeassignedby the Board of Directors.
Annual Report 2016 21

Att
enda
nce
of
the
Boar
d an
d Co
mm
itte
e M
eeti
ngs
Na
me
of
Dir
ecto
rB
oa
rdH
um
an
Res
ou
rce
an
d N
om
ina
tio
nC
om
mit
tee
Ris
k M
an
ag
emen
t C
om
mit
tee
Mem
ber
Mee
tin
gs
1A
tten
da
nce
Mem
ber
Mee
tin
gs
1A
tten
da
nce
Mem
ber
Mee
tin
gs
1A
tten
da
nce
Mr.
Zah
id M
uza
ffar
*8
8*
44
SI1
1
Mr.
Ars
had
Mir
za*
85
*2
1 -
- -
Mr.
Sai
f U
llah
Ch
atth
a*
85
*4
3 -
11
Mr.
Isk
and
er M
oh
amm
ed K
han
*8
8SI
11
*2
2
Mr.
Ham
id F
aro
oq
*8
7*
33
*2
2
Mr.
Mu
ham
mad
Ali
Tab
ba
*8
- -
31
- -
-
Mr.
Zaf
ar M
asu
d*
87
*4
4*
22
Pri
nce
Ah
med
Om
ar A
hm
edza
i*
88
-4
4 -
22
Saye
d S
haf
qat
Ali
Sh
ah*
82
- -
-*
11
Mr.
Rah
mat
Sal
am K
hat
tak
*8
7*
44
-1
1
Mr.
Mu
ham
mad
Yaw
ar I
rfan
Kh
an*
84
- -
-*
2-
Mr.
Zah
id M
ir*
87
SI2
2 -
- -
22 Oil & Gas Development Company Limited

Na
me
of
Dir
ecto
rA
ud
it C
om
mit
tee
Pro
cure
men
t, O
per
ati
on
s &
Fin
an
ce
Co
mm
itte
eC
orp
ora
te S
oci
al
Res
po
nsi
bil
ity
Co
mm
itte
e
Mem
ber
Mee
tin
gs
1A
tten
da
nce
Mem
ber
Mee
tin
gs
1A
tten
da
nce
Mem
ber
Mee
tin
gs
1A
tten
da
nce
Mr.
Zah
id M
uza
ffar
- -
-*
44
-1
1
Mr.
Ars
had
Mir
za -
- -
* -
- -
- -
Mr.
Sai
f U
llah
Ch
atth
a*
21
- -
- -
- -
Mr.
Isk
and
er M
oh
amm
ed K
han
*4
4 -
- -
- -
-
Mr.
Ham
id F
aro
oq
*4
3*
43
*1
1
Mr.
Mu
ham
mad
Ali
Tab
ba
*2
- -
- -
- -
-
Mr.
Zaf
ar M
asu
dSI
11
-4
4*
11
Pri
nce
Ah
med
Om
ar A
hm
edza
i*
44
SI4
4*
11
Saye
d S
haf
qat
Ali
Sh
ah -
- -
*4
1 *
- -
Mr.
Rah
mat
Sal
am K
hat
tak
-2
2*
44
*1
1
Mr.
Mu
ham
mad
Yaw
ar I
rfan
Kh
an -
- -
- -
- -
- -
Mr.
Zah
id M
ir -
- -
SI2
2SI
11
No
tes:
1
Hel
d d
uri
ng
th
e p
erio
d c
on
cern
ed D
irec
tors
wer
e o
n t
he
Bo
ard
* M
emb
er o
f th
e B
oar
d/r
esp
ecti
ve C
om
mit
tee
SI
Spec
ial
Invi
tati
on
Annual Report 2016 23

ED
(Pro
du
ctio
n)
GM
(P
&P
)
GM
(P
E&
FD)
GM
(P
roje
cts)
GM
(C
om
mer
cial
)
GM
(P
rod
uct
ion
)
ED
(Exp
lora
tio
n)
GM
(P
rosp
ect
Gen
erat
ion
)
GM
(G
eop
hys
ical
Se
rvic
es)
ED
(Pet
rose
rv)
GM
(D
O)
GM
(D
S)
GM
(C
&E
SS)
ED
(B
D/J
V)
GM
(J
V)
GM
(B
D)
ED
(F
inan
ce)
GM
(F
inan
ce)
GM
(A
cco
un
ts)
GM
(R
M)
ED
(S
ervi
ces)
GM
(H
SEQ
)
GM
(S
ecu
rity
)
GM
(C
SR)
GM
(I
nfo
rmat
ion
Sy
stem
)
GM
(C
orp
ora
te
Aff
airs
)
Man
agin
g D
irec
tor/
Ch
ief
Exe
cuti
ve O
ffice
r
Bo
ard
of
Dir
ecto
rs
Co
mp
any
Secr
etar
y/G
ener
al M
anag
er (
Leg
al S
ervi
ces)
Gen
eral
Man
ager
(In
tern
al A
ud
it)/
Ch
ief
Inte
rnal
Au
dit
or
Au
dit
Co
mm
itte
e o
f th
e B
oar
d
Ch
ief
Op
erat
ing
Offi
cer
(CO
O)
Ch
ief
Fin
anci
al O
ffice
r (C
FO)
ED
(H
R/A
dm
in)
GM
(H
R)
GM
(A
dm
in)
GM
(H
ealt
h
Serv
ices
)
GM
(O
GT
I)
GM
(R
MD
)
GM
(G
eolo
gic
al
Serv
ices
)
GM
(S
CM
)
GM
(M
ater
ial)
GM
(T
reas
ury
)
Organizational Chart
BD
B
usi
nes
s D
evel
op
men
tC
&E
SS
Civ
il a
nd
En
gin
eeri
ng
Su
pp
ort
Ser
vice
sC
SR
Co
rpo
rate
So
cial
Res
po
nsi
bil
ity
DO
D
rill
ing
Op
erat
ion
sD
S D
rill
ing
Ser
vice
sE
D
Exe
cuti
ve D
irec
tor
GM
G
ener
al M
anag
erH
R
Hu
man
Res
ou
rce
HSE
Q
Hea
lth
, Saf
ety,
En
viro
nm
ent
& Q
ual
ity
JV
Join
t V
entu
reO
GT
I O
il &
Gas
Tra
inin
g I
nst
itu
teP
E&
FD
Petr
ole
um
En
gin
eeri
ng
an
d F
acil
itie
s D
epar
tmen
tP
&P
P
roce
ss &
Pla
nts
RM
D
Res
ervo
ir M
anag
emen
t D
epar
tmen
tR
M
Ris
k M
anag
emen
tSC
M
Sup
ply
Ch
ain
Man
agem
ent
24 Oil & Gas Development Company Limited

Management Objectives and StrategiesManagement objectives and strategies are tasked at improving the corporate performance and creating material value for shareholders in the future. These objectives and strategies are in line with OGDCL’s strategic plan and may change/alter depending upon change(s) in the internal and external environment.
Management objectives and strategies are summarized as follows:
• Pursueinvestmentchoicesthatplaytothebusiness strengths and deemed financially viable for the purpose of reserve building, production enhancement and growth in distributions to shareholders in the coming years;
• FormulatevaluedrivenjointventureswithleadingE&P companies both locally and internationally to introduce new partners with complementary skills and to carry out exploration, development and production operations cost effectively;
• Ensuretheexistenceofamixedexplorationportfolio constituting exploration concessions in the established, promising and unexplored areas alongside keeping a balance between enhancing exploratory endeavors and mitigating risk with acceptable drilling success leading to reserves accretion and sustainable long term business growth;
• Maintainandacceleratetheexploratoryendeavorsincluding fast track seismic data acquisition, data processing/interpretation and active drilling campaigns to tap additional reserves and optimize hydrocarbon production to address energy challenges in the Country;
• Seekproductiongrowthfromownedandoperatedjoint venture fields through expediting efforts for completion of ongoing development projects, fast track development of newly discovered fields and utilizing latest production techniques and innovative technologies to maximize hydrocarbon recovery;
• IncarryingoutintensifiedE&Pactivitiestomaintainmarket leadership status, ensure adherence to high safety standards coupled with respecting the environment and local communities that may be affected by the business operations. Being a socially responsible entity, carry on CSR activities through investment in areas; education, health, water supply, infrastructure development and providing generous donations in the case of natural calamities;
• Basedonsuppressedinternationaloilpricesimpacting the business financials, a trend witness across the entire E&P industry, maintain a rigorous approach to capital allocation and concentrate on efficiency and competitiveness in carrying out business activities;
• Improveefficiencyandoutputoftheemployeesby continuing to provide training in the form of workshops, seminars and conferences alongside building and maintaining strong relationships with the stakeholders to ensure business growth and success;
• Inlinewiththebusinessvision,focusonestablishingfoot prints abroad by undertaking suitable farm-in/farm-out opportunities as well as acquisition of concessions in domestic and international market. In this respect, grab and exploit such overseas opportunities which can be monetized quickly and deliver immediate production boost; and
• Toexploitunconventionalsourcesofenergylikeshale gas and coal bed methane, carry on the study initiated in the business operated blocks to evaluate shale and tight gas potential and define development strategy for operated reservoirs.
Annual Report 2016 25

Core Management Team
Mr. Zahid Mir Managing Director & CEO
Mr. Irteza Ali QureshiChief Financial Officer
Mr. Masood NabiExecutive Director (Business Develoment and Joint Venture)
Dr. Mohammad Saeed Khan JadoonActing Executive Director (Exploration)
Mr. Muhammad Aslam Khan NiaziActing Executive Director (Services)
Mr. Khan AlamActing Executive Director (Petroserv)
Mr. Malik Muhammad Arshad Acting Executive Director (HR/Administration)
Dr. Naseem AhmadActing Executive Director (Production)
Mr. Ahmed Hayat Lak Company Secretary/General Manager (Legal Services)
26 Oil & Gas Development Company Limited

Sitting from left to right:Mr. Muhammad Aslam Khan Niazi, Mr. Irteza Ali Qureshi, Mr. Zahid Mir, Dr. Mohammad Saeed Khan Jadoon, Mr. Masood Nabi
Standing from left to right:Dr. Naseem Ahmad, Mr. Khan Alam, Mr. Ahmed Hayat Lak, Mr. Malik Muhammad Arshad
Annual Report 2016 27

Exploration LicensesHeld by OGDCL as on 30 June 2016
Sr. No.
Exploration License DistrictsArea
(sq. km)Date of Grant
Working Interest (%)
OGDCL’s 100% Owned Exploration Licenses1 Fateh Jang Islamabad, Rawalpindi & Attock 1,080.43 05.11.2002 OGDCL 100%2 Jandaran Barkhan, Kohlu & Loralai 408.00 20.09.1989 OGDCL 100%3 Saruna Khuzdar & Lasbella 2,431.62 17.02.2004 OGDCL 100%4 Shahana Kharan & Panjgur 2,445.06 29.12.2004 OGDCL 100%5 Samandar Awaran & Uthal 2,495.33 06.07.2005 OGDCL 100%6 Latamber Bannu & Tribal area adjacent to Bannu 331.47 24.10.2005 OGDCL 100%7 Tegani Shikarpur, Sukkur, Kandhkot & Kashmore 270.60 13.02.2006 OGDCL 100%8 Thano Beg Lasbela, Jamshoro & Karachi 2,404.73 13.02.2006 OGDCL 100%9 Thal Khairpur, Sukkur & Ghotki 1,622.67 13.02.2006 OGDCL 100%
10 Wali SouthWaziristanAgency,Bannu,LakkiMarwat&Tribalareaadjacent to Tank
2,179.26 31.05.2006 OGDCL 100%
11 Mianwali Mianwali, Chakwal, Khushab & Lakki Marwat 2,280.91 31.05.2006 OGDCL 100%12 Soghri Kohat & Attock 410.36 31.05.2006 OGDCL 100%13 Shaan Zhob, Qila Saifullah & Musakhel Bazar 2,489.80 13.07.2007 OGDCL 100%14 Mari East Ghotki, Rahim Yar Khan & Rajanpur 1,399.44 21.01.2010 OGDCL 100%15 Lakhi Rud Loralai, Musakhel, Barkhan & Kohlu 2,488.78 21.01.2010 OGDCL 100%16 JandranWest Kohlu & Barkhan 759.46 16.02.2010 OGDCL 100%17 Eastern Offshore Indus-A Offshore Area 2,500.00 05.07.2007 OGDCL 100%18 Offshore Indus-R Offshore Area 1,492.23 19.04.2007 OGDCL 100%19 Ladhana Muzaffargarh, Layyah & Multan 2,409.05 10.02.2014 OGDCL 100%20 Fatehpur Layyah, Muzaffargarh, Khanewal & Multan 2,430.84 10.02.2014 OGDCL 100%21 Rasmalan Gwadar, Awaran & Lasbela 1,463.74 10.02.2014 OGDCL 100%22 Alipur Multan, Bahawalpur, Rahim Yar Khan & Muzaffargarh 2,425.55 21.02.2014 OGDCL 100%23 Parkani Block-B Awaran & Gwadar 1,908.31 10.02.2014 OGDCL 100%24 Parkini Block-A Awaran & Kech 1,892.10 21.03.2014 OGDCL 100%25 RasmalanWest Awaran & Pasni 1,639.69 21.03.2014 OGDCL 100%26 Bostan Ziarat, Pishin, Killah Abdullah & Quetta 2,337.50 21.03.2014 OGDCL 100%27 Kharan-3 Kharan & Noshki 2,487.46 21.03.2014 OGDCL 100%28 Bela North Khuzdar, Awaran & Lasbela 2,045.73 21.03.2014 OGDCL 100%29 Khiu Bhakkar & Khushab 2,395.64 21.03.2014 OGDCL 100%30 Layyah Layyah, D.G. Khan & Muzaffargarh 2,459.20 21.03.2014 OGDCL 100%
Sub Total 55,384.96
OGDCL Operated JV Exploration Licenses (with GHPL, KPOGCL & SEHCL) 1. Ranipur Khairpur, Larkana & Naushahro Feroz 2,379.52 10.02.2014 OGDCL 95.00%, SEHCL 2.50%, GHPL 2.50%2. Armala Tharparkar 2,488.98 10.02.2014 OGDCL 97.50%, SEHCL 2.50%3. Zorgarh Ghotki, Jaffarabad, Kashmore, Dera Bugti & Rajanpur 2,402.48 28.02.2014 OGDCL 95.80%, SEHCL 1.70%, GHPL 2.50%4. Baratai Kohat 38.92 10.02.2014 OGDCL 97.50%, KPOGCL 2.50%5. Orakzai Kurram, Orakzai Agency & Hangu 1,708.04 28.02.2014 OGDCL 97.16%, KPOGCL 0.34%, GHPL 2.50%6. Tirah Khyber, Kurram & Orakzai Agencies. 1,945.64 21.03.2014 OGDCL 97.50%, GHPL 2.50%7. Pezu D.G. Khan, Lakki Marwat, Tank, D.I. Khan & Tribal area of D.I. Khan 2,430.73 21.02.2014 OGDCL 95.88%, KPOGCL 1.62%, GHPL 2.50%8. Hetu Bhakkar, Mianwali & D.I. Khan 2,432.37 28.02.2014 OGDCL 97.14%, KPOGCL 0.36%, GHPL 2.50%9. Zhob Zhob, Musa Khail Bazar & Tribal area of D.I. Khan 2,473.45 21.03.2014 OGDCL 97.50%, GHPL 2.50%
10. PasniWest Gwadar & Kech 2,293.40 21.02.2014 OGDCL 97.50%, GHPL 2.50%11. Khanpur Rahim Yar Khan 2,494.92 21.02.2014 OGDCL 97.50%, GHPL 2.50%12. Plantak Washuk&Panjgur 2,457.01 21.03.2014 OGDCL 97.50%, GHPL 2.50%13. Gawadar Gwadar & Kech 2,407.01 21.03.2014 OGDCL 97.50%, GHPL 2.50%14. Rakhshan Washuk 2,459.17 21.03.2014 OGDCL 97.50%, GHPL 2.50%15. South Kharan Kharan 2,187.48 21.03.2014 OGDCL 97.50%, GHPL 2.50%16. Khuzdar North Khuzdar 2,451.44 21.03.2014 OGDCL 97.50%, GHPL 2.50%17. Warnali Chakwal, Jhelum & Rawalpindi 718.57 21.03.2014 OGDCL 97.50%, GHPL 2.50%18. Kulachi D.I. Khan, D.G. Khan & Bhakkar 2,494.89 07.01.2015 OGDCL 95.45%, KPOGCL 2.05%, GHPL 2.50%
Sub Total 38,264.02
OGDCL Operated JV Exploration Licenses (with GHPL)1 Bitrisim Nawabshah, Khairpur & Sanghar 1,445.11 27.09.1997 OGDCL 95%, GHPL 5%2 Khewari Khairpur & Nawabshah 1,276.40 29.12.1999 OGDCL 95%, GHPL 5%3 Nim Hyderabad & Tando Muhammad Khan 229.58 29.12.1999 OGDCL 95%, GHPL 5%4 Tando Allah Yar Hyderabad & Matiari 403.34 27.09.1997 OGDCL 95%, GHPL 5%5 Zin Dera Bugti, Nasirabad, Kohlu & Bolan 5,559.74 15.08.1996 OGDCL 95%, GHPL 5%
Sub Total 8,914.17
OGDCL Operated JV Exploration Licenses (with other E&P companies)1 Gurgalot Kohat & Attock 346.92 28.06.2000 OGDCL 75%, POL 20%, GHPL 5%2 Nashpa Kohat, Karak, Mianwali & Tribal area adjacent to Bannu 531.16 16.04.2002 OGDCL 65%, PPL 30%, GHPL 5%3 Kohat Kohat, Naushera, Orakzai Agency, Hangu, Peshawar, Tribal area
adjacent to Kohat & Tribal area adjacent to Peshawar 1,107.21 03.02.2009 OGDCL 30%, Tullow 40%, MPCL 20%, Saif
Energy 10%4 Sinjhoro Sanghar & Khairpur 1,283.43 29.12.1999 OGDCL 76%, OPL 19%, GHPL 5%5 Kalchas Kohlu, Dera Bugti & Rajanpur 2,068.32 29.12.2004 OGDCL 50%, MPCL 20%, Tullow 30%6 Kohlu Kohlu, Dera Bugti & Barkhan 2,459.11 29.12.2004 OGDCL 40%, MPCL 30%, Tullow 30%7 Guddu Rajanpur, Rahim Yar Khan, Ghotki & Kashmore 2,093.40 04.12.2006 OGDCL 70%, IPRTOC 11.50%, SEPL 13.50%,
GHPL 5% Sub Total 9,889.55 Total Operated 112,452.70
OGDCLs Non-Operated JV Exploration Licenses1 Block-28 Sibbi, Kohlu & Loralai 5,856.71 14.01.1991 Tullow 95%, OGDCL 5%2 BunnuWest Bannu&NorthWaziristanAgency 1,229.57 27.04.2005 Tullow 40%, OGDCL 40%, MPCL 10%, SEL 10%3 Tal Block Kohat, Karak, Bannu & Tribal area adjacent to Bannu 3,224.58 11.02.1999 MOL 10%, OGDCL 30%, PPL 30%, POL 25%,
GHPL 5%4 Offshore Indus-U Offshore Area 6,294.28 21.07.2006 UEPL 72.50%, OGDCL 27.50%5 Offshore Indus-S Offshore Area 2,129.91 22.03.2007 UEPL 50%, OGDCL 50%6 Offshore Indus-G Offshore Area 5,972.82 12.12.2012 ENI 33.34%, OGDCL 33.33%, PPL 33.33%
Total Non-Operated 24,707.87
28 Oil & Gas Development Company Limited

PUNJAB
IRAN
KPK
ISLAMABAD
LAHORE
AFGHANISTAN
BALOCHISTAN
INDIA
QUETTA
SKARDU
GILGIT
MUZAFFER ABAD
PESHAWAR
CHINA
SRINAGAR
KARACHI
SINDH
GAWADAR
FRO
NTIER
UN
DEFIN
ED
JAMMU & KASHMIR(DISPUTED TERRITORY)
TANDO ALAM
BUZDARTHORA & THORA EASTOGDCL OGDCL
OGDCLDARU
OGDCL
MISANOGDCL
PASAKHI & PASAKHI NORTH
KUNAROGDCL
TANDO ALLAH YAROGDCL
DARS WESTDARS
OGDCLNUR
OGDCLBAGLA
OGDCL
OGDCL
SONOOGDCL
OGDCL
TANDO ALLAH YAROGDCL
LASHARI CENTREL & SOUTH
2468-12KOTRI
PPL
Nandpur
Palli
Reti
MaruMaru South
Sadkal
Pirkoh (Add)Pirkoh
Chak Naurang
Fimkassar
PanjpirBahu
DakhniBhal Syedan
Qadirpur
(JAKHRO)
Missakeswal
Sari Singh
Dhodak
UchLoti
Sara West
MARITIME BOUNDARY UNDEFINE
CHAK-5 DIM SOUTH
CHAK-66
(SINJHORO)OGDCL
CHAK-7ALALA JAMALI
2568-5CHAK63-SE
CHAK-2
HAKEEM DAHO
CHAK-63
RESHAM
Hundi
Toot
Jhal Magsi South
Bobi & Dhamarki
KalRajian
3200
2700
2800
1100
1600
2600
2700
2700
3700
3700
3700
3600
2000
2000 2000
2700
2700
37003200
3200
1800
2000
1700
2700
1800
3200
3200
3100
3600
2700
100
1700
50
1003300
1700
3100
3100
50
1600
1100 100600
26002100
2100
NORAI JAGIR
Chanda
MelaNashpa
Tando Alam
Buzdar/Buzdar NorthThora & Thora East
Daru
MisanPasakhi & Pasakhi NorthKunnar
Kunnar SouthKunnar West
Kunnar Deep
Tando Allah Yar
Dars WestDars
Norai Jagir
Sono Lashari Centre & South
Jakhro
Chak-66Chak-63 SE
Chak-7A
Lala Jamali
Chak-2
Hakeem Daho
Resham
Chak-5 Dim & Dim South
Chak-63
Sinjhoro, T.Alam Complex, Nim & Tando Allahyar Fields
Nur
Bagla
Nim West
NIM WEST
GopangPakhro
Nim
T.Y. North
Unnar
Pasakhi DeepShah
ChandioPasakhi East
Concession Portfolio (Exploration Licenses)As on 30 June 2016
Summary of Exploration Licenses
Province/Area Operated Non-Operated
Punjab 12 -
Sindh 12 -
Balochistan 24 1
KPK 10 2
Offshore 2 3
Total 60 6
Annual Report 2016 29

Development & Production/Mining LeasesHeld by OGDCL as on 30 June 2016
Sr. No.
Lease Name Districts/ProvinceArea
(sq. km)Date of Grant
Working Interest (%)
OGDCL’s 100% Owned Leases1 Bagla Thatta & Badin, Sindh 29.70 27.02.1995 OGDCL 100%2 Bahu Jhang, Punjab 11.22 19.05.2008 OGDCL 100%3 Bhal Syedan Attock, Punjab 16.41 11.04.1994 OGDCL 100%4 Bobi/Dhamrakhi (ML) Sanghar, Sindh 128.93 23.01.1990 OGDCL 100%5 Buzdar Hyderabad, Sindh 6.58 13.12.1999 OGDCL 100%6 Chak 5 Dim South Sanghar, Sindh 15.92 18.03.1996 OGDCL 100%7 Dakhni (ML) Attock, Punjab & Kohat, KPK 267.83 23.04.1984 OGDCL 100%8 Daru Thatta, Sindh 10.26 07.04.1990 OGDCL 100%9 Dhodak Dera Ghazi Khan,Punjab 41.92 01.02.1995 OGDCL 100%
10 Fimkassar Chakwal, Punjab 27.98 19.12.1992 OGDCL 100%11 Hundi Dadu, Sindh 15.04 21.09.2002 OGDCL 100%12 Kal Chakwal, Punjab 41.96 13.08.1996 OGDCL 100%13 Kunnar Deep (ML) Hyderabad, Sindh 16.07 17.05.2008 OGDCL 100%14 Kunnar (ML) Hyderabad, Sindh 34.21 23.01.1990 OGDCL 100%15 KunnarWest(ML) Hyderabad, Sindh 3.13 17.05.2008 OGDCL 100%16 Lashari Centre & South Hyderabad, Sindh 23.15 25.06.1989 OGDCL 100%17 Loti (ML) Dera Bugti Agency, Balochistan 204.11 14.11.1986 OGDCL 100%18 Misan Hyderabad, Sindh 2.50 12.07.1999 OGDCL 100%19 Missa Keswal Rawalpindi, Punjab 23.43 11.04.1994 OGDCL 100%20 Nandpur Multan & Jhang, Punjab 45.05 12.03.1996 OGDCL 100%21 Nur Thatta & Badin, Sindh 30.64 27.02.1995 OGDCL 100%22 Pali Hyderabad, Sindh 16.43 17.11.2001 OGDCL 100%23 Panjpir Multan & Jhang, Punjab 45.18 12.03.1996 OGDCL 100%24 Pasakhi & Pasakhi North Hyderabad, Sindh 27.95 27.01.1990 OGDCL 100%25 Pasakhi Deep Hyderabad, Sindh 18.08 17.05.2008 OGDCL 100%26 Pirkoh Sibi (Bugti Tribal Territory), Balochistan 141.69 14.07.1988 OGDCL 100%27 Pirkoh (Additional) Dera Bugti Agency, Balochistan 13.57 08.08.1977 OGDCL 100%28 Rajian Chakwal & Jehlum, Punjab 39.09 28.02.1996 OGDCL 100%29 Sadkal Attock, Punjab 26.77 24.01.1994 OGDCL 100%30 SaraWest Ghotki, Sindh 168.41 08.06.2001 OGDCL 100%31 Sari Sing Dadu, Sindh 25.89 30.07.2008 OGDCL 100%32 Sono Hyderabad, Sindh 25.08 23.07.1989 OGDCL 100%33 Tando Alam (ML) Hyderabad, Sindh 38.62 30.07.1985 OGDCL 100%34 Thora/Thora East & Thora Add. (ML) Hyderabad, Sindh 15.20 23.01.1990 OGDCL 100%35 Toot (ML) Attock, Punjab 67.97 02.11.1968 OGDCL 100%36 Uch Dera Bugti, Balochistan 121.00 01.07.1996 OGDCL 100%
OGDCL’s Operated JV Leases1 Baloch Sanghar, Sindh 9.78 16.09.2013 OGDCL 62.5%, OPL 15%, GHPL 22.5%2 Chak Naurang (ML) (28.07Sq.Miles) Chakwal, Punjab 72.70 14.11.1988 OGDCL 85%, POL 15%3 Chak-63 Sanghar, Sindh 50.95 06.05.2013 OGDCL 62.5%, OPL 15%, GHPL 22.5%4 Chak-63 South East Sanghar, Sindh 9.60 23.05.2013 OGDCL 62.5%, OPL 15%, GHPL 22.5%5 Chak-66 Sanghar/Khairpur, Sindh 11.13 16.09.2013 OGDCL 62.5%, OPL 15%, GHPL 22.5%6 Chak-7A Sanghar, Sindh 6.12 05.12.2012 OGDCL 62.5%, OPL 15%, GHPL 22.5%7 Chanda Kohat, KPK 32.32 01.06.2002 OGDCL 72%, GHPL 17.5%, ZPCL 10.5%8 Chandio Hyderabad, Sindh 8.11 07.02.2014 OGDCL 77.5%, GHPL 22.5%9 Chak-2 Sanghar, Sindh 43.57 13.09.2013 OGDCL 62.5%, OPL 15%, GHPL 22.5%
10 Dars Hyderabad, Sindh 6.02 24.01.2005 OGDCL 77.5%, GHPL 22.5%11 Dars Deep Hyderabad, Sindh 20.27 16.05.2014 OGDCL 77.5%, GHPL 22.5%12 DarsWest Hyderabad, Sindh 5.20 24.01.2005 OGDCL 77.5%, GHPL 22.5%13 Gopang Hyderabad, Sindh 2.88 27.01.2014 OGDCL 77.5%, GHPL 22.5%14 Hakeem Dahu Sanghar/Khairpur, Sindh 23.46 13.09.2013 OGDCL 62.5%, OPL 15%, GHPL 22.5%15 Jakhro Sanghar, Sindh 35.05 13.02.2002 OGDCL 77.5%, GHPL 22.5%16 Jhal Magsi South & additional area Jhal Magsi, Balochistan 17.71 24.07.2009 OGDCL 56%, POL 24%, GHPL 20%17 Kunnar South Hyderabad, Sindh 6.90 16.07.2013 OGDCL 77.5%, GHPL 22.5%18 Lala Jamali Sanghar, Sindh 13.57 23.05.2013 OGDCL 62.5%, OPL 15%, GHPL 22.5%19 Maru Ghotki, Sindh 15.41 28.06.2013 OGDCL 57.76%, SPEL 10.66%, IPRTOC 9.08 %, GHPL 22.5%20 Maru South Ghotki, Sindh 6.64 18.06.2013 OGDCL 57.76%, SPEL 10.66%, IPRTOC 9.08 %, GHPL 22.5%21 Mela Kohat, KPK 77.57 02.04.2013 OGDCL 56.45%, PPL 28.55%, GHPL 15%22 Nashpa Karak, KPK 170.21 19.06.2013 OGDCL 56.45%, PPL 28.55%, GHPL 15%23 Nim Hyderabad, Sindh 2.14 01.01.2013 OGDCL 77.5%, GHPL 22.5%24 NimWest Hyderabad, Sindh 3.25 21.05.2012 OGDCL 77.5%, GHPL 22.5%25 Norai Jagir Hyderabad, Sindh 2.43 16.08.2008 OGDCL 77.5%, GHPL 22.5%26 Pasahki East Hyderabad, Sindh 4.16 12.12.2013 OGDCL 77.5%, GHPL 22.5%27 Qadirpur Ghotki & Kashmore, Sindh 389.16 18.08.1992 OGDCL 75%, PPL 7%, KUFPEC 8.5%, PKPEL-I 4.75%,
PKPEL-II 4.75%28 Resham Sanghar, Sindh 9.37 23.05.2013 OGDCL 62.5%, OPL 15%, GHPL 22.5%29 Reti Ghotki,Sindh 8.60 25.06.2013 OGDCL 57.76%, SPEL 10.66%, IPRTOC 9.08 %, GHPL 22.5%30 Shah Hyderabad, Sindh 2.37 16.09.2013 OGDCL 77.5%, GHPL 22.5%31 Tando Allah Yar Hyderabad, Sindh 3.35 24.01.2005 OGDCL 77.5%, GHPL 22.5%32 Tando Allah Yar North Hyderabad, Sindh 1.43 07.05.2014 OGDCL 77.5%, GHPL 22.5%33 Unnar Hyderabad, Sindh 1.88 01.10.2014 OGDCL 77.5%, GHPL 22.5%Sr. No.
Lease Name Districts/ProvinceArea
(sq. km)Operator
Working Interest (%)
OGDCL’s Non-Operated JV Leases1 Jabo Golarchi & Badin, Sindh 16.13 UEPL 51% OGDCL 49%2 Kato Tando Muhammed Alam & Badin, Sindh 20.40 UEPL 51% OGDCL 49%3 Paniro Matli & Badin, Sindh 10.00 UEPL 51% OGDCL 49%4 Pir Golarchi & Badin, Sindh 43.84 UEPL 51% OGDCL 49%5 Rind Tando Muhammed Alam & Badin, Sindh 17.00 UEPL 51% OGDCL 49%6 Jalal Hyderabad, Sindh 34.25 UEPL 51% OGDCL 49%7 Zaur Badin, Sindh 15.71 UEPL 51% OGDCL 49%8 Meyun Ismail Hyderabad, Sindh 3.59 UEPL 51% OGDCL 49%9 Buzdar South Badin, Sindh 25.13 UEPL 51% OGDCL 49%
10 Jagir Badin, Sindh 1.36 UEPL 76% OGDCL 24%11 Raj Hyderabad, Sindh 21.70 UEPL 76% OGDCL 24%12 Muban Hyderabad, Sindh 1.91 UEPL 76% OGDCL 24%13 Sakhi Deep Tando Muhammad Khan, Sindh 4.71 UEPL 76% OGDCL 24%14 Jhaberi South Badin, Sindh 4.13 UEPL 60% OGDCL 15%, GHPL 25%15 Ali Zaur Badin, Sindh 6.23 UEPL 60% OGDCL 15%, GHPL 25%16 Shah Dino Badin, Sindh 1.46 UEPL 60% OGDCL 15%, GHPL 25%17 Fateh Shah North Thatta, Sindh 23.81 UEPL 60% OGDCL 15%, GHPL 25%
30 Oil & Gas Development Company Limited
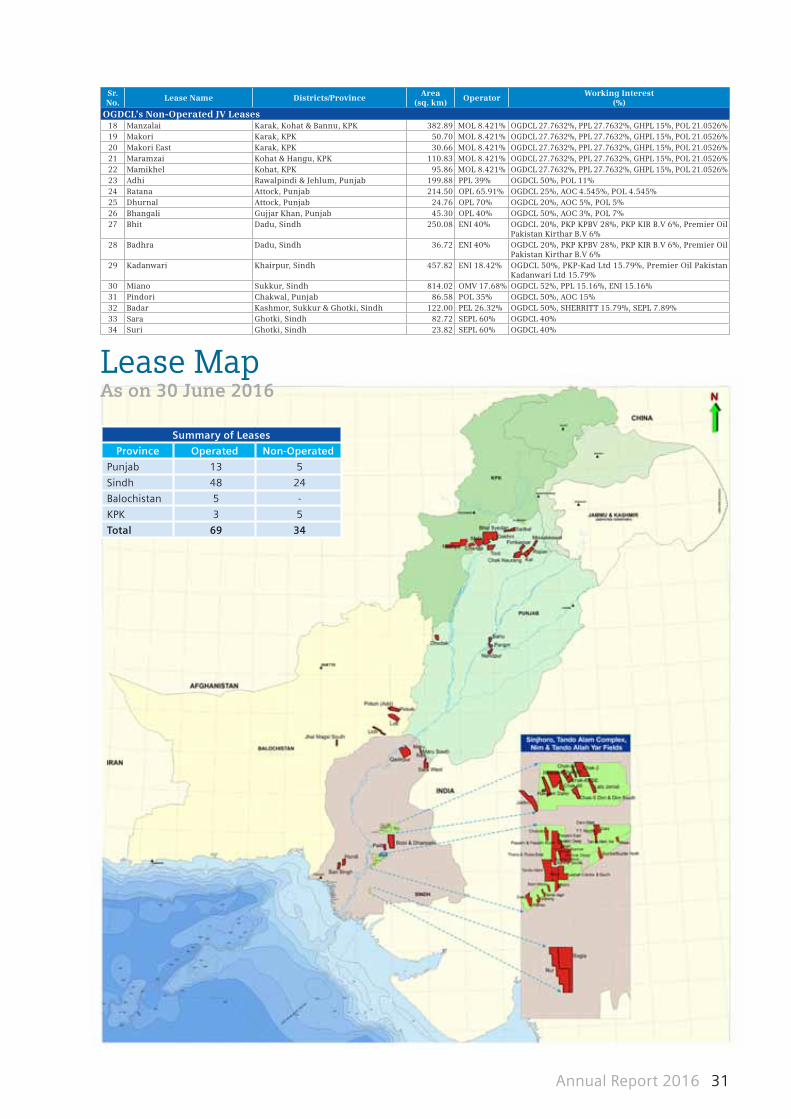
Summary of Leases
Province Operated Non-Operated
Punjab 13 5
Sindh 48 24
Balochistan 5 -
KPK 3 5
Total 69 34
Sr. No.
Lease Name Districts/ProvinceArea
(sq. km)Operator
Working Interest (%)
OGDCL’s Non-Operated JV Leases18 Manzalai Karak, Kohat & Bannu, KPK 382.89 MOL 8.421% OGDCL 27.7632%, PPL 27.7632%, GHPL 15%, POL 21.0526%19 Makori Karak, KPK 50.70 MOL 8.421% OGDCL 27.7632%, PPL 27.7632%, GHPL 15%, POL 21.0526%20 Makori East Karak, KPK 30.66 MOL 8.421% OGDCL 27.7632%, PPL 27.7632%, GHPL 15%, POL 21.0526%21 Maramzai Kohat & Hangu, KPK 110.83 MOL 8.421% OGDCL 27.7632%, PPL 27.7632%, GHPL 15%, POL 21.0526%22 Mamikhel Kohat, KPK 95.86 MOL 8.421% OGDCL 27.7632%, PPL 27.7632%, GHPL 15%, POL 21.0526%23 Adhi Rawalpindi & Jehlum, Punjab 199.88 PPL 39% OGDCL 50%, POL 11%24 Ratana Attock, Punjab 214.50 OPL 65.91% OGDCL 25%, AOC 4.545%, POL 4.545%25 Dhurnal Attock, Punjab 24.76 OPL 70% OGDCL 20%, AOC 5%, POL 5%26 Bhangali Gujjar Khan, Punjab 45.30 OPL 40% OGDCL 50%, AOC 3%, POL 7%27 Bhit Dadu, Sindh 250.08 ENI 40% OGDCL 20%, PKP KPBV 28%, PKP KIR B.V 6%, Premier Oil
Pakistan Kirthar B.V 6%28 Badhra Dadu, Sindh 36.72 ENI 40% OGDCL 20%, PKP KPBV 28%, PKP KIR B.V 6%, Premier Oil
Pakistan Kirthar B.V 6%29 Kadanwari Khairpur, Sindh 457.82 ENI 18.42% OGDCL 50%, PKP-Kad Ltd 15.79%, Premier Oil Pakistan
Kadanwari Ltd 15.79%30 Miano Sukkur, Sindh 814.02 OMV 17.68% OGDCL 52%, PPL 15.16%, ENI 15.16%31 Pindori Chakwal, Punjab 86.58 POL 35% OGDCL 50%, AOC 15%32 Badar Kashmor, Sukkur & Ghotki, Sindh 122.00 PEL 26.32% OGDCL 50%, SHERRITT 15.79%, SEPL 7.89%33 Sara Ghotki, Sindh 82.72 SEPL 60% OGDCL 40%34 Suri Ghotki, Sindh 23.82 SEPL 60% OGDCL 40%
Lease MapAs on 30 June 2016
Annual Report 2016 31

Six Years Performance2010-11 2011-12 2012-13 2013-14 2014-15 2015-16
Operational PerformanceSeismic Survey - 2D Line km 1,500 2,589 1,584 1,807 5,430 5,336 - 3D sq. km 660 654 1,121 867 1,918 3,459 Wells Drilled Numbers 21 17 24 17 25 26 Oil & Gas Discoveries Numbers 2 2 3 2 4 6
Quantity SoldCrude Oil Thousand barrels 13,224 13,713 14,183 14,734 14,591 14,461 Gas MMcf 362,924 381,863 392,513 416,238 404,128 386,637 LPG Tons 71,061 75,005 41,003 64,088 95,629 125,241 Sulphur Tons 34,400 21,400 14,493 27,707 23,600 15,800 White Petroleum Products Thousand barrels 30 19 - - - -
Financial ResultsNet Sales Rs in billion 155.63 197.84 223.37 257.01 210.62 162.87 Other Revenues 3.38 9.75 15.80 19.24 20.23 16.89
Profit before Taxation 90.98 133.08 146.81 172.35 127.03 80.51
Profit for the Year 63.53 96.91 91.27 123.91 87.25 59.97
Balance SheetShare Capital Rs in billion 43.01 43.01 43.01 43.01 43.01 43.01 Reserves and Unappropriated Profit 158.56 220.37 269.26 352.66 399.51 435.62
Non-Current Liabilities 38.44 42.69 43.29 52.52 49.37 51.96
Current Liabilities 21.78 32.21 58.38 48.05 61.90 58.97
Total Equity and Liabilities 261.78 338.29 413.93 496.23 553.79 589.57
Fixed Assets 106.03 116.04 134.53 155.77 196.38 215.37
Long Term Investments, Loans, Receivables & Prepayments 6.14 7.40 145.15 146.30 137.63 119.40
Current Assets 149.60 214.85 134.25 194.16 219.78 254.80
Total Assets 261.78 338.29 413.93 496.23 553.79 589.57
Cash Flow SummaryNet Cash from Operating Activities Rs in billion 67.88 48.58 185.68 50.39 74.01 55.85 Net Cash used in Investing Activities (15.92) (14.66) (164.80) (25.47) (53.65) (35.59)Net Cash used in Financing Activities (18.66) (30.61) (33.92) (27.22) (37.95) (23.76)Increase/(Decrease) in Cash and Cash Equivalents 33.30 3.31 (13.04) (2.30) (17.59) (3.49)
Cash and Cash Equivalents at beginning of the Year 18.84 52.14 55.45 42.41 40.11 22.53
Cash and Cash Equivalents at end of the Year 52.14 55.45 42.41 40.11 22.53 19.03
Key IndicatorsProfitability RatiosGross Profit Margin % 66 70 71 69 63 54Net Profit Margin % 41 49 41 48 41 37EBITDA Margin to Sales % 71 74 69 73 67 58Return on Average Capital Employed % 35 42 32 35 21 13Liquidity RatiosCurrent Ratio Times 6.87 6.67 2.30 4.04 3.55 4.32 Acid Test/Quick Ratio Times 6.22 6.26 2.01 3.65 3.27 4.01 Cash to Current Liabilities Times 2.40 1.73 0.73 0.84 0.37 0.33 Cash Flow from Operations to Sales % 87 59 125 63 79 74Activity/Turnover RatiosDebtor Turnover in Days (1) Numbers 189 200 158 111 192 261 Total Assets Turnover Ratio % 63 66 59 56 40 28Investment/Market RatiosEarnings per Share Rupees 14.77 22.53 21.22 28.81 20.29 13.94 Price Earning Ratio Times 10.36 7.12 10.78 9.07 8.84 9.90 Dividend Yield Ratio % 4 5 4 4 4 4Dividend Payout Ratio % 37 32 39 32 38 37Dividend Coverage Ratio Times 2.69 3.11 2.57 3.11 2.62 2.68 Cash Dividend per Share Rupees 5.50 7.25 8.25 9.25 7.75 5.20 Market Price per Share (2) - As on June 30 Rupees 153.00 160.44 228.75 261.28 179.24 138.07 - High during the Year 180.66 170.70 254.81 287.84 277.52 183.50
- Low during the Year 129.13 120.29 167.41 229.47 172.44 95.58 Break-up Value per Share Rupees 46.87 61.24 72.60 92.00 102.89 111.29
Contribution to National Exchequer Rs in billion 76.84 100.55 129.62 132.26 123.70 81.64
Notes:Previous year figures have been rearranged and/or reclassified, wherever, necessary for the purpose of comparison1. 366 days have been used for the year 2011-12 and 2015-162. Source: Pakistan Stock Exchange
32 Oil & Gas Development Company Limited

Graphical PresentationSix Years Operational and Financial Performance
Quantity Sold - Crude Oil/Condensate (Thousand Barrels)
Assets and Liabilities(Rs in billion)
Quantity Sold - Gas (MMcf)
Earnings and Dividend per Share(Rupees)(Rs in billion)
Net Sales Vs Profit for the Year
Return on Average Capital Employed
3.07 x 4.6296
3.07 x 4.427
2010-11 2011-12 2012-13 2013-14 2014-15 2015-160%
5%
10%
15%
20%
25%
30%
35%
40%
45%
2010-11 2011-12 2012-13 2013-14 2014-15 2015-160.00
5.00
10.00
15.00
20.00
25.00
30.00
35.00
Earnings per Share Dividend
2010-11 2011-12 2012-13 2013-14 2014-15 2015-160.00
50.00
100.00
150.00
200.00
250.00
300.00
Net Sales Revenue Profit for the Year
2010-11 2011-12 2012-13 2013-14 2014-15 2015-160
50000
100000
150000
200000
250000
300000
350000
400000
450000
Own Fields Operated JVs Non-Operated JVs
2010-11 2011-12 2012-13 2013-14 2014-15 2015-160
2000
4000
6000
8000
10000
12000
14000
16000
Own Fields Operated JVs Non-Operated JVs
2010-11 2011-12 2012-13 2013-14 2014-15 2015-16 -
50.00
100.00
150.00
200.00
250.00
Non-Current Assets
Net Current Assets
Long Term Investments, Loans, Receivables & Prepayments
Long Term Liabilities
Annual Report 2016 33

Comments on Six Years Performance
OGDCL in an effort to seek sustainability and growth of its business operations is determined to carry on vigorous exploratory activities and deliver stable operational performance leading to production enhancement and improved operational cash flows in the future. This is testified by the Company’s operational results recorded in the past many years while on the financial front slump in international oil prices impacted the business profitability during the fiscal years 2014-15 and 2015-16.
OGDCL’s operational and financial snapshot during the fiscal years 2010-11 to 2015-16 is as follows:
• 2Dand3Dseismicsurveyacquiredin2015-16is 5,336 Line km and 3,459 sq. km respectively against 1,500 Line km and 660 sq. km in 2010-11 portraying fast track seismic data acquisition carried out with the aim to tap additional oil and gas reserves and further enrich the reserves portfolio;
• Twentysix(26)exploratory/appraisalanddevelopment wells are drilled during 2015-16 against twenty one (21) wells during 2010-11 representing active drilling campaigns carried out to locate new hydrocarbon reserves;
• Intensifiedexploratoryactivities,particularlyin the last two fiscal years, led the business to witness a total of nineteen (19) new oil and gas discoveries during the last six (6) fiscal years, which effectively contributed in maintaining and enhancing oil and gas production;
• Quantitysoldwithrespecttocrudeoil,gasandLPG in 2015-16 were higher in comparison to 2010-11, mainly owing to extensive exploration, development and production activities coupled with increase in production from non-operated fields;
• NetSalesin2015-16wereRs162.87billionagainst Rs 155.63 billion in 2010-11 showing an increase of Rs 7.24 billion mainly on account of higher realized prices of gas, enhancement in oil and gas production and favorable exchange rate. However, dramatic fall in international oil prices impacted the business net sales in the last two fiscal years;
• Profitaftertaxfor2015-16stoodatRs59.97billion compared to Rs 63.53 billion for 2010-11 primarily due to low oil price environment and increased operating, exploration and prospecting expenditures partially offset by higher other income;
• TotalAssetsason30June2016areRs589.57billion against Rs 261.78 billion as on 30 June 2011 showing a healthy surge of Rs 327.79 billion which is attributable to increase in fixed assets including property, plant and equipment and development and production assets coupled with higher long term investment, mainly due to investment in Privately Placed Term Finance Certificates and Pakistan Investment Bonds. Moreover, rise in current assets largely due to trade debts outstanding against oil refineries and gas distribution companies contributed to increased total assets;
• Cashandcashequivalentsattheendof2015-16were Rs 19.03 billion in comparison to Rs 52.14 billion at the end of 2010-11 primarily owing to rise in trade debts and higher dividends and taxes payments coupled with increase in expenditures; operating, capital, exploration and prospecting; and
• BeingthelargestexplorationandproductionCompany of Pakistan, OGDCL made a significant contribution of Rs 644.61 billion in national exchequer during 2010-11 to 2015-16 on account of corporate tax, dividend, royalty, general sales tax, gas infrastructure development cess, excise duty and development surcharge.
Targets for the Fiscal Year 2016-17
During the fiscal year 2016-17, OGDCL seeks to carry out 6,253 Line km and 1,130 sq. km of 2D and 3D seismic survey respectively. Twenty six (26) new wells including sixteen (16) exploratory/appraisal wells and ten (10) development wells are planned to be drilled. Net capital expenditure is estimated at Rs 65.8 billion; Rs 29.2 billion on exploratory, appraisal and development wells (net of estimated dry hole cost of Rs 10.6 billion) and Rs 36.6 billion on development projects and property, plant & equipment.
34 Oil & Gas Development Company Limited

Vertical and Horizontal Analysis
2010-11 2011-12 2012-13 2013-14 2014-15 2015-16
Vertical Analysis
Profit and Loss AccountNet Sales 100.0 100.0 100.0 100.0 100.0 100.0
Royalty (11.4) (11.7) (11.6) (11.6) (11.3) (11.1)Operating Expenses (21.2) (17.4) (16.5) (19.0) (25.1) (33.8)Transportation Charges (1.4) (1.0) (1.0) (0.9) (0.9) (1.2)Gross Profit 66.0 69.9 70.9 68.5 62.7 54.0
Other Income 2.1 4.9 7.0 7.4 9.1 9.0 Exploration and Prospecting Expenditure (4.3) (2.0) (6.7) (3.4) (5.5) (8.9)General and Administration Expenses (1.4) (1.1) (1.1) (1.2) (2.0) (2.3)Finance Cost (1.0) (0.9) (1.0) (0.9) (1.2) (1.1)Workers' Profit Participation Fund (3.1) (3.5) (3.5) (3.5) (3.2) (2.6)Share of Profit in Associate 0.1 0.0 0.0 0.0 0.5 1.3 Profit before Taxation 58.5 67.3 65.7 67.1 60.3 49.4 Taxation (17.6) (18.3) (24.9) (18.8) (18.9) (12.6)Profit for the Year 40.8 49.0 40.9 48.2 41.4 36.8
Balance SheetShare Capital and Reserves 77.0 77.9 75.4 79.7 79.9 81.2 Non-Current Liabilities 14.7 12.6 10.5 10.6 8.9 8.8 Current Liabilities 8.3 9.5 14.1 9.7 11.2 10.0 Total Equity and Liabilities 100.0 100.0 100.0 100.0 100.0 100.0
Non-Current Assets 42.9 36.5 67.6 60.9 60.3 56.8 Current Assets 57.1 63.5 32.4 39.1 39.7 43.2 Total Assets 100.0 100.0 100.0 100.0 100.0 100.0
Horizontal Analysis
Profit and Loss AccountNet Sales 100.0 127.1 143.5 165.1 135.3 104.6
Royalty 100.0 130.6 146.3 167.9 134.1 102.1 Operating Expenses 100.0 104.2 111.5 148.0 160.4 166.6 Transportation Charges 100.0 92.2 102.2 108.5 90.2 86.9 Gross Profit 100.0 134.6 154.2 171.4 128.5 85.6
Other Income 100.0 292.4 475.0 578.9 580.7 445.0 Exploration and Prospecting Expenditure 100.0 61.1 226.2 131.7 175.6 219.7 General and Administration Expenses 100.0 98.5 107.5 132.7 192.9 168.8 Finance Cost 100.0 115.8 155.9 148.5 171.7 115.7 Workers' Profit Participation Fund 100.0 146.3 161.4 189.4 139.6 88.5 Share of Profit in Associate 100.0 111.2 133.7 145.2 1,330.7 2,790.6 Profit before Taxation 100.0 146.3 161.4 189.4 139.6 88.5 Taxation 100.0 131.8 202.3 176.4 144.9 74.8 Profit for the Year 100.0 152.5 143.7 195.1 137.3 94.4
Balance SheetShare Capital and Reserves 100.0 130.7 154.9 196.3 219.5 237.5 Non-Current Liabilities 100.0 111.1 112.6 136.6 128.4 135.2 Current Liabilities 100.0 147.9 268.1 220.6 284.3 270.8 Total Equity and Liabilities 100.0 129.2 158.1 189.6 211.6 225.2
Non-Current Assets 100.0 110.0 249.3 269.3 297.8 298.4 Current Assets 100.0 143.6 89.7 129.8 146.9 170.3 Total Assets 100.0 129.2 158.1 189.6 211.6 225.2
Annual Report 2016 35

Employees13.59%
Government48.98%
Shareholders2.89%
Society1.20%
Retained in Business33.34%
Employees8.44%
Government56.72%
Shareholders4.33%
Society0.56%
Retained in Business29.95%
Statement of Value Addition(Rs in Million)
2015-16 2014-15
Gross Revenue 190,736 240,987 Less:Operating, General & Administration, Transportation and Exploration Expenses 30,565 28,787
160,171 212,200 Add:Income from Financial Assets 12,909 18,000 Income from Non-Financial Assets 1,794 1,187 Other 2,189 1,044 Less: Other Expenses 1,718 2,550 Total Value Added 175,345 229,880
Distribution to:
Employees asRemuneration 20,180 18,775 Contribution to Employees' Benefits (Pension & Medical) 3,643 616
23,823 19,391
Government asCorporate Tax 20,537 39,776 Dividends 15,155 29,827 Levies - Sales Tax 19,133 21,311 Excise Duty 3,157 3,316 Gas Infrastructure Development Cess (GIDC)/Development Surcharge 5,579 5,735 Royalty 18,079 23,737 Workers'ProfitParticipationFund 4,237 6,686
85,877 130,387
Shareholders other than the Government asDividends 5,059 9,957
Society 2,107 1,290
Business asReserves 3,075 850 Depreciation 7,099 5,724 Amortization 15,267 16,281 Unappropriated Profit 33,038 46,000
58,479 68,855
Total Value Added 175,345 229,880
2015-16 2014-15
Distribution of Value Added
36 Oil & Gas Development Company Limited

Statement of Value AdditionDuPont Analysis shows that OGDCL’s Return on Equity during the fiscal year 2015-16 is impacted in comparison to the preceding year. This is due to fall in average basketpriceofcrudeoiltoUS$42.50/barrelfromUS$74.45/barrel in the preceding year leading the business to witness lower realized prices for crude oil and gas
coupled with increase in operating, exploration and prospecting expenditures and reduced other income which influenced the Company’s Total Assets Turnover and Net Profit Margin. Equity Multiplier is slightly lower on account of greater increase in equity in comparison to increase in total assets.
Item wise Quarterly Analysis Quarter wise variations and commentary on the financial results of OGDCL during the fiscal year 2015-16 are as follows:
--------------------------------------Rupees in billion -------------------------------------- Rupees
Quarter Net Sales Gross Profit Profit before Tax Profit after Tax Earnings per Share
First Quarter 44.513 26.397 26.228 18.260 4.25
Second Quarter 41.673 22.659 21.848 15.946 3.71
Third Quarter 36.525 18.615 13.848 9.294 2.16 Fourth Quarter 40.155 20.220 18.583 16.471 3.83
Total 2015-16 162.867 87.890 80.507 59.971 13.94
Equity Multiplier
Total Assets Turnover
Net Profit Margin
Return on Equity
DuPont Analysis
Analysis of Variation in Results Reported in Interim Reports
Net sales for the first quarter in comparison to the remaining quarters is greater mainly due to higher realized prices of crude oil and gas. Significant fall in international oil prices impacted sales revenue in the remaining quarters, while oil prices recovered partially in the fourth quarter resulting in increased net sales in comparison to the third quarter. Lowest net sales are observed in the third quarter which apart from the suppressed oil price is due to reduced gas intake from Uch field by Uch-II Power (Private) Limited and Qadirpur field by Engro Powergen Qadirpur Limited and Liberty Power Limited coupled with SSGCL’s increased pipeline pressure which also affected gas production at KPD field.
Gross profit reported for the first quarter in comparison to the remaining quarters is higher primarily owing to increased net sales. In the following quarters, lower net sales coupled with increased operating expenses influenced gross profit.
Profit before tax (PBT) recorded for the first quarter in comparison to the remaining quarters is more largerly attributable to higher net sales and lower exploration and prospecting expenditures. In the subsequent quarters, lower gross profit accompanied with increased exploration and prospecting expenditures on account of enhanced geophysical survey (3D) partially offset by surge in share of profit in associate in the fourth quarter affected PBT.
Profit after tax (PAT) posted for the first quarter in comparison with the remaining quarters is greater due to increased profit before tax. In the other quarters, decline in the PBT led to reduced profitability, while slight recovery of PAT in the fourth quarter is attributable to partial price rebound in conjunction with surge in share of profit in associate and lower taxation on account of advance tax adjustment .
Earnings per share variations in the four (4) quarters follow the same trend as evident in the results of PAT and owing to the same reasons as well.
x x =
1.2328% 37% 13%FY 2015-16
Annual Report 2016 37

Managing Director’s Review
Against the backdrop of steep decline in international oil prices having impacted the earnings of global oil and gas industry, Oil & Gas Development Company Limited (OGDCL) remained committed to serve the national cause of meeting oil and gas demands and in this connection delivered yet another steady operational performance during the fiscal year 2015-16. Moreover, the Company leveraging on robust exploration portfolio, business strategy, financial strength and dedicated employees continued to maintain its position as an industry leader in terms of highest share in exploration acreage, seismic data acquisition, oil and gas reserves and production contribution in E&P sector of Pakistan.
OGDCL’s solid operational performance rendered during the
period July 2015 to June 2016 is primarily attributable to
exploration, which has been once again a driver of value
creation for the business. This is witnessed by the fact that
the Company’s intensified exploratory efforts continued
during the year resulting in 3D and 2D seismic data acquisition
of 3,459 sq. km and 5,336 Line km in comparison to 1,918
sq. km and 5,430 Line km respectively in the last year.
Moreover, the Company drilled a total of twenty six (26) new
wells including twelve (12) exploratory/appraisal wells and
fourteen (14) development wells against twenty five (25) wells
drilled in the previous year.
In addition to the above, OGDCL during the period under
review carried on its track record of exploration success
striking six (6) new oil and gas discoveries having cumulative
daily production potential of 50 MMcf of gas and 1,500 barrels
of oil. These discoveries comprise Nashpa X-5 in district
Karak, Khyber Pakhtunkhwa province, Thal East-1 & Thal
West-1 in district Sukkur, Bitrism West-1A in district Sanghar,
Aradin-1 in district Khairpur, Sindh province and Chak
Naurang South-1 in district Chakwal, Punjab province.
Reserves addition through new discoveries is 171.27 billion
cubic feet of gas and 9.20 million barrels of oil combined 35.13
million barrels of oil equivalent, which will contribute to
further bolster reserves base of the Company.
38 Oil & Gas Development Company Limited

Being the national flagship of the Country’s E&P sector,
OGDCL is striving to augment oil and gas production from
owned and operated joint venture fields. In this regard, the
Company during the year under review added 4,150 barrels
per day of crude oil and 43 MMcf per day of gas through
addition of new wells in the existing gathering system, which
contributed towards narrowing down the impact of natural
decline and operational problems encountered at certain
fields. Moreover, the Company during the year contributed
around 48% and 28% of the Country’s total oil and natural gas
production respectively (source: Pakistan Petroleum
Information Services). Apart from this, a sum of Rs 81.640
billion is contributed to the national exchequer on account of
corporate tax, dividend, royalty, general sales tax, gas
infrastructure development cess and excise duty.
Despite the natural decline observed in the mature
hydrocarbon producing fields, OGDCL’s daily net saleable
crude oil and gas production remained steady during the
reporting period averaging 40,609 barrels and 1,056 MMcf
respectively. Moving forward, the Company envisages
production growth from its owned and operated joint venture
fields based on aggressive exploratory endeavors, expediting
pace of bringing new discoveries on production and
completion of ongoing development projects including
Kunnar Pasakhi Deep-Tando Allah Yar (KPD-TAY), Sinjhoro,
Uch-II, Nashpa and Mela. In this regard, phase-II of the
Sinjhoro development project upon completion of
commissioning activities has been brought into production
during the month of July 2015. At present, cumulative daily
production from phases I and II is around 2,600 barrels of
crude oil, 30 MMcf of gas and 140 Tons of LPG. Likewise,
concerted efforts are underway at phase-II of the KPD-TAY
development project which is expected to be completed
during September 2016 leading to an average daily
incremental production of 4,000 barrels of oil, 105 MMcf of
gas and 400 tons of LPG. Development work at Nashpa-Mela
fields is also in full swing as the EPCC contract is awarded,
pipeline to be laid from Mela to Nashpa field is procured and
the contractor is mobilized at site with activities including
construction of temporary site facilities and leveling and
grading process of plant area and LPG bullet area under
progress. This development project will be brought on stream
by June 2017 to deliver an incremental daily production of
1,200 barrels of crude oil, 10 MMcf of gas and 380 Tons of LPG.
On the financial front, slump in oil prices owing to crude
supply glut in the international market continues to impact
OGDCL’s financial performance. This is reflected in the
standings of average basket price which during the year
under review plummeted to US$ 42.50/barrel against US$
74.45/barrel in the comparative period. Resultantly, the
Company recorded lower realized prices for crude oil and gas
averaging US$ 39.07/barrel and Rs 253.77/Mcf compared with
US$ 63.29/barrel and Rs 272.61/Mcf respectively in the
preceding year. This decrease in oil prices has influenced the
business financial results leading the Company to register
Sales Revenue and Profit after Tax of Rs 162.867 billion and
Rs 59.971 billion respectively translating into Earnings per
Share of Rs 13.94 for the year ended 30 June 2016. In order to
successfully navigate through this era of low oil prices and
volatility, the Company has maintained vigilance on its
operational and capital spending while adapting to the
changing conditions and position for an eventual recovery.
Moving on, OGDCL with the aim to carry out exploration,
development and production operations efficiently and cost
effectively will continue formulation of value driven joint
ventures with leading E&P companies, both locally and
internationally. While acting as a low cost operator, the
Company also seeks to acquire concessions in domestic and
international market and evaluate suitable farm-in/farm-out
opportunities to enhance reserves and production base
resulting in improved operational cash flows. In addition, the
Company is focused on locating alternate sources of energy
by carrying out a comprehensive study through an
international consultant to evaluate shale gas/oil and tight
gas/oil potential in its operated blocks.
As we enter the fiscal year 2016-17, OGDCL is confident that
its fast track exploration, development and production
activities coupled with concentration on rigorous financial
spending and capital discipline will pave the way to discover
new oil and gas reserves and optimize production on
competitive basis. While doing so, the Company stands firm
in utilizing latest production techniques and innovative
technologies to drive functional excellence across E&P
operations and maximize hydrocarbon recovery from mature
fields. In pursuit to meet the stated commitments, the
Company will continue to bank on the support and patronage
of all its stakeholders particularly Government of Pakistan,
Ministry of Petroleum & Natural Resources, Directorate
General of Petroleum Concessions, joint venture partners,
Board of Directors, shareholders and employees as we look
ahead to embrace new business challenges and accept
courageous tasks to carry on our track record of delivering
industry leading performance, safely and responsibly.
24 August 2016 (Zahid Mir)
Islamabad Managing Director & CEO
Annual Report 2016 39

Directors’ Report
Dear Shareholders,
On behalf of the Board of Directors of the Company, I am pleased to present OGDCL’s operational and financial performance together with the audited financial statements and Auditors’ Report for the year ended 30 June 2016.
Fiscal year 2015-16 is marked as a year of both challenges and achievements in the Company’s history. Despite the tough market conditions, existent due to low oil price environment influencing the oil and gas sector across the globe, OGDCL being the national flagship of Pakistan’s E&P sector remained steadfast in its resolve to carry on vigorous exploratory endeavors and continue playing a pivotal role in enhancing the Country’s energy security. Pursuit to this ambition led the Company to report yet another industry leading performance in the Country while preserving its coveted status as a market leader in E&P sector in terms of exploration acreage, seismic data acquisition, oil and gas reserves and production volumes.
40 Oil & Gas Development Company Limited

Exploration and Development ActivitiesOGDCL’s exploration strategy is to maintain a balanced
portfolio of exploratory assets in the established,
promising and unexplored areas and focus on
accelerating exploration activities leading to
hydrocarbon reserves accretion. As of 30 June 2016, the
Company’s exploratory assets covered an area of
112,453 sq. km which is the largest exploration acreage
held by any E&P Company in Pakistan. These exploratory
licenses are spread across all four (4) provinces of the
Country and the portfolio constitutes sixty (60) owned
and operated joint venture exploration licenses along
with holding working interest in six (6) blocks operated
by other exploration and production companies.
In line with its exploration-led growth strategy to
enhance oil and gas reserves and embark upon new
growth opportunities, OGDCL’s fast track seismic data
acquisition continued during the year under review.
These exploratory efforts culminated in 3D and 2D
seismic data acquisition of 3,459 sq. km (2014-15: 1,918
sq. km) and 5,336 Line km (2014-15: 5,430 Line km)
respectively in various exploratory blocks including
Armala, Dakhni, Fatehpur, Khanpur, Khiu, Ladhana,
Layyah, Mari East, Pezu, Kulachi, Ranipur, Thal, Tegani,
Zorgarh, Baratai, Rakshan, Plantak, Shahana, Kohat,
Khewari and Warnali. The Company also carried out
geological field work of 182 Line km in Bostan exploration
license. Moreover to identify prospective areas offering
the potential for commercial oil and gas reserves, 8,054
Line km of 2D seismic data and 2,061 sq. km of 3D
seismic data of various blocks were processed using
in-house resources.
In a suppressed oil price market where some of the E&P
companies have resorted to scale back their capital
expenditures, OGDCL carried on its active drilling
campaigns to replenish and augment the hydrocarbon
reserves and ensure business sustainability. In this
pursuit, the Company spud twenty six (26) wells
(2014-15: 25 wells) including twelve (12) exploratory/
appraisal wells viz., Bachani-1, Bitrism West-1A, Thal
West-1, Pirkoh Deep-1, Barkatwala-1, Daru Deep-1,
Mithri-1, Dhodak Rubbly X-1, Khamiso-1, Chhutto-1, Thal
East-2 and Jand-2 and fourteen (14) development wells
viz., Buzdar North-2, Pirkoh-54, Pasakhi Deep-6, Palli-2,
Rajian-9, Dhachrapur-3, Kunnar Deep-11, Kunnar-10 &
11, Qadirpur-54 & 55 and Qadirpur HRL-9, 10 & 11 during
the reporting period. In addition, drilling and testing of
nine (9) wells spud in the previous fiscal year were
completed.
In order to exploit unconventional oil and gas resources
like shale gas and coal bed methane, first phase of the
study carried out by an international consultant to
evaluate shale gas/oil and tight gas/oil potential in
OGDCL’s operated blocks is completed while second and
third phases of the study are underway. Moreover to
measure and evaluate shale gas potential at the well-site
during the drilling phase, services including Well-site
Geosciences and Canister Gas Analysis are being utilized
at Kunnar Deep-10 and Suleman-2. Moving forward with
this study, shale/tight gas evaluation program
comprising additional drilling, stress testing, analyzing
cores and special logs is incorporated in wells under
drilling and to be drilled in the future. Furthermore,
efforts are in progress to formulate joint exploration
strategy in collaboration with Pakistan Petroleum
Limited for shale/tight gas evaluation.
Apart from the above, OGDCL being a low cost operator
is focused on establishing foot prints abroad by
undertaking farm-in/farm-out opportunities as wells as
acquisition of concessions in domestic and international
market. In this respect, the Company is making all out
efforts to seek suitable opportunities that play to the
business strengths and deemed financially viable.
Moving forward, OGDCL is determined to carry on its
extensive exploration program including fast track
seismic data acquisition, data processing/interpretation
and active drilling campaigns to replenish and augment
hydrocarbon reserves, ramp up oil and gas production
and contribute in the economic development of the
Country.
Annual Report 2016 41

DiscoveriesOGDCL’s aggressive exploratory efforts to locate new
hydrocarbon reserves bear fruit during the period
under review resulting in six (6) new oil and gas
discoveries having cumulative daily production
potential of 50 MMcf of gas and 1,500 barrels of oil.
These discoveries were witnessed at Nashpa X-5 in
district Karak, Khyber Pakhtunkhwa province, Thal
East-1 & Thal West-1 in district Sukkur, Bitrism West-1A
in district Sanghar, Aradin-1 in district Khairpur, Sindh
province and Chak Naurang South-1 in district Chakwal,
Punjab province. Reserves addition attributable to the
aforesaid discoveries is 171.27 billion cubic feet of gas
and 9.20 million barrels of oil combined 35.13 million
barrels of oil equivalent.
Oil and Gas ReservesOGDCL’s total gross remaining recoverable 3P reserves
as of 30 June 2016 stood at 498.50 million barrels of oil
and 11,689.20 billion cubic feet of gas. These reported
reserves are in accordance with the Reserves Evaluation
Study-2014 carried out by an independent consultant
namely Bayphase Limited, UK for all OGDCL fields.
Original reserves by Bayphase Limited, UK have been
revised/updated during the reporting period based
on the production performance, workovers and
development wells result of individual fields.
ProductionOGDCL’s production strategy is to maintain and enhance
hydrocarbon production profile by expediting
connectivity of newly discovered exploratory, appraisal
and development wells in the system, employing latest
production techniques and innovative technologies to
curtail natural decline and undertaking/completing
ongoing development projects on seamless track to
meet the growing demands of oil and gas in Pakistan.
In this pursuit, the Company during the period under
review injected new wells; Chak 63-3, Chak 2-3, Mela-4,
Loti Deep-1, Kunnar-10, Pirkoh-54, Palli-2, Nashpa X-5,
Loti-19 & 20, Qadirpur-54 & 55 and Qadirpur HRL-9 & 10
in the existing gathering system which at present are
cumulatively producing 4,150 barrels per day of crude
oil and 43 MMcf per day of gas. This addition of oil and
gas to the production base contributed towards
narrowing down the impact of natural decline and
operational problems encountered at certain fields.
Moreover, the Company contributed around 48% and
28% of the Country’s total oil and natural gas production
respectively during July 2015 to June 2016 (source:
Pakistan Petroleum Information Services).
In order to revive and enhance production from the
mature wells, OGDCL during the reporting period
carried out workover jobs with rig at Kal-3,
Missakeswal-3, Sono-7, Pasakhi North-1, Nim West-1,
Thora Deep-1, Chak 2-2, Kunnar-6 & 8, Rajian 1 & 2 and
Thora-1, 3 & 4. Likewise, rig-less workover jobs were
carried out at various wells to boost oil and gas
production. Moreover to induce improvement in current
well flow parameters, pressure build-up survey jobs
42 Oil & Gas Development Company Limited

were completed at various wells of Qadirpur, Sinjhoro,
Kunnar, Kunnar Pasakhi Deep, Maru Reti, Uch, Bobi,
Chanda, Mela and Nashpa fields.
During the period under review, OGDCL as part of
preventive maintenance plan carried out Annual Turn
Around of plants at Bobi, Qadirpur, Kunnar, Kunnar
Pasakhi Deep, Dakhni, Chanda, Uch and Sinjhoro fields.
In addition, production testing has been completed at
wells; Suleman-2, Thal East-1, Thal West-1, Bitrism
West-1A, Kunnar-11, Pasakhi Deep-6 and Kunnar Deep-10
& 11. The commissioning of cathodic protection system
at twenty four (24) wells of Kunnar Pasakhi Deep and
fifteen (15) wells of Uch-II project has also been
completed.
Against the backdrop of natural decline in some of the
mature hydrocarbon producing fields, OGDCL during
the fiscal year 2015-16 recorded stable crude oil
production while gas production is impacted in
comparison to the corresponding year. The Company’s
gas production is influenced by less gas intake from
Uch-I & II fields by Uch-II Power (Private) Limited during
the months of January, February and March 2016 due to
its Annual Turn Around and tripping of turbines and
Qadirpur field by Engro Powergen Qadirpur Limited and
Liberty Power Limited owing to their shut-in from
22 January 2016 to 30 April 2016 and 17 February 2016 to
14 March 2016 respectively. Moreover on account of
SSGCL’s increased pipeline pressure, gas production is
affected at Qadirpur and KPD fields. Regarding LPG
production, the Company witnessed surge mainly
owing to startup of production from Sinjhoro and
Jakhro fields.
The average daily net saleable production of crude oil,
gas and LPG during the period under review, including
share in both operated and non-operated joint venture
fields is as under:
ProductsUnit of
MeasurementFY
2015-16FY
2014-15
Crude oil Barrels per day 40,609 40,818
Gas MMcf per day 1,056 1,107
LPG Tons per day 342 260
Going forward, OGDCL is confident that its vigorous
exploratory endeavors accompanied with the expedited
efforts for completion of ongoing development projects
will lay a solid foundation to reap the reward of
augmented oil and gas output in the future. In doing so,
utilizing advanced technology, pursuing latest
production techniques and enhancing engineering
design and simulation capabilities will remain part and
parcel of the Company’s production strategy leading to
growth in production and distribution to the
shareholders in the coming years.
Annual Report 2016 43

Market Share Information from an Independent SourceBeing an industry leader in E&P sector, OGDCL boasts
the highest share in exploration acreage, seismic data
acquisition, oil and gas reserves and production
volumes in comparison to other E&P companies
operating in Pakistan. The Company’s exploration
portfolio comprises sixty (60) owned and operated joint
venture exploration licenses covering an area of
112,453 sq. km, which represents 31% of the Country’s
total exploration acreage awarded as of 30 June 2016. Its
2D and 3D seismic data acquisition were 68% and 53%
respectively of the total seismic data acquired in the
Country during the year. Moreover, hydrocarbon
reserves of the business were 59% of oil and 36% of total
natural gas reserves in the Country as at 30 June 2015.
Furthermore, the Company contributed around 48%
and 28% of the Country’s total oil and natural gas
production respectively during the period July 2015-
June 2016.
(Source: Pakistan Petroleum Information Services)
Development ProjectsOGDCL in line with its business strategy to augment
hydrocarbon production and improve operational cash
flows continued to make all out efforts for completion
of its ongoing development projects including Kunnar
Pasakhi Deep-Tando Allah Yar (KPD-TAY), Sinjhoro,
Uch-II and Nashpa-Mela. These development projects
are of significant importance as sizeable increase in
crude oil, gas and LPG production is expected upon their
completion in the near future.
OGDCL’s progressive efforts for completion of its
ongoing development projects during the fiscal year
2015-16 are as follows:
KPD-TAY Development ProjectKPD-TAY integrated development project is located
adjacent to existing Kunnar LPG plant in district
Hyderabad, Sindh province. OGDCL through use of
in-house resources is engaged in completion of this
project in two (2) phases. In this regard, phase-I of the
project has already been completed, currently supplying
around 1,000 barrels per day of condensate and 120
MMcf per day of dehydrated gas.
Under phase-II of the project, OGDCL has carried out
installation of well head facilities, gas gathering system,
CO2 removal unit, LPG extraction feed/sales gas
compressors, power generation and allied utilities.
Moreover, work on 21 kilometer trunk line and EPCC
installation coupled with mechanical and piping
activities relating to sales gas compressors is completed
and pre-commissioning activities have started. Phase-II
of the project is expected to be completed during
September 2016 upon which production from combined
phases I and II will be around 5,000 barrels per day of
oil/condensate/NGL, 225 MMcf per day of gas and 400
Tons per day of LPG.
Other E&P companiesOGDCL
52%48%
72%
28%
32%
68%
47%53%
Production
Crude Oil
Gas
Sesimic Data Acquisition
2D
3D
44 Oil & Gas Development Company Limited

Sinjhoro Development ProjectSinjhoro development project is located near district
Sanghar, Sindh province. This project is a joint venture
among OGDCL, OPL and GHPL having 62.5%, 15% and
22.5% working interest respectively with OGDCL acting
as the operator. By using in-house resources, the
Company has carried out development of this field in
two (2) phases. Phase-I of the project has already been
completed and is currently supplying around 1,000
barrels per day of oil and 16 MMcf per day of gas.
During the month of July 2015, OGDCL upon completion
of commissioning activities has brought phase-II of the
project into production. At present, total production
from combined phases I and II is around 2,600 barrels
per day of crude oil, 30 MMcf per day of gas and 140 Tons
per day of LPG.
Uch-II Development ProjectUch gas field is located about 67 kilometers South East
of Dera Bugti in Balochistan province. OGDCL is working
to complete this project by employing in-house
resources. The contractor has already been mobilized
at site and development activities are in the final stages
of completion. At present, 130 MMcf per day of gas under
interim arrangement is being supplied to Uch-II Power
(Private) Limited from one amine unit as per demand.
Expected completion of the project during the month of
September 2016 will enable the Company to exhibit
operational excellence in supply of 160 MMcf per day of
gas to Uch-II Power (Private) Limited.
Nashpa-Mela Development ProjectNashpa-Mela fields are located in Karak and Kohat
districts of Khyber Pakhtunkhwa province. OGDCL is the
operator of these fields with 56.45% share while joint
venture partners include PPL and GHPL with 28.55% and
15% working interest respectively. The scope of this
project involves the installation of well head
compressors, crude stabilization unit and laying of 22
kilometers gas transport pipeline from Mela to Nashpa
field. The tendering relating to EPCC for gas processing,
LPG recovery plant and allied facilities at Nashpa field
and respective evaluation has been completed and the
contract is awarded to Hong Kong Huihua Global
Technology Limited.
At present, the contractor has been mobilized at site and
activities including construction of temporary site
facilities and leveling and grading process of plant area
and LPG bullet area are under progress. Moreover,
pipeline to be laid from Mela to Nashpa field has been
procured and tender to hire the services of contractor
for laying, construction and commissioning of pipeline
is under preparation. Currently, Nashpa-Mela fields are
cumulatively contributing around 22,400 barrels per
day of oil and 90 MMcf per day of gas. This development
project is expected to be completed by June 2017 leading
to an incremental production of 1,200 barrels per day of
crude oil, 10 MMcf per day of gas and 380 Tons per day
of LPG.
Annual Report 2016 45

Non Operated Joint VenturesOGDCL holds working interest in various blocks
operated by other exploration and production
companies. The detail of the activities carried out in the
Company’s non-operated joint ventures during the
fiscal year 2015-16 is as follows:
TAL Concession TAL block is located in Khyber Pakhtunkhwa province
and spreads over Karak, Kohat, Hangu, Bannu, North
Waziristan and Orakzai agency areas. The concession is
operated by MOL Pakistan with OGDCL, PPL and GHPL
as joint venture partners. OGDCL has 27.76% working
interest in TAL concession. To date, discoveries
accredited to TAL concession include Manzalai, Makori,
Mamikhel, Maramzai, Makori East, Tolanj and Mardan
Khel. During the period under review, drilling at Tolanj
West-1 and production testing at Makori Deep-1
continued while drilling at Makori East-5 has been
completed. Moreover, civil work activities at Mardan
Khel-2 & 3 and Maramzai-4 along with tie-in of Mardan
Khel-1 with the production facilities remained under
progress. At present, average daily production is
20,207 barrels of crude oil/condensate, 263 MMcf of gas
and 432 Tons of LPG.
Adhi FieldAdhi oil field is located in district Rawalpindi, Punjab
province and is operated by PPL with OGDCL and POL
as joint venture partners. OGDCL holds 50% working
interest in Adhi oil field. During the reporting period,
drilling at Adhi-23, 24 & 25 has been completed while
drilling at Adhi-27 remained under way. Moreover, Adhi
reservoir simulation study along with 3D seismic data
and petro-physical interpretation continued during the
year. The erection of Adhi plant-III is also completed and
is in operation since November 2015. Currently, average
daily production is 4,650 barrels of crude oil, 50 MMcf
of gas, 1,950 barrels of NGL and 160 Tons of LPG.
Pindori FieldPindori field is located in district Chakwal, Punjab
province and is operated by POL while OGDCL holds 50%
working interest. The main productive reservoirs are
fractured carbonates of the Eocene Sakesar formation
and the Paleocene Lockhart formation. To date, eleven
(11) wells are drilled including two (2) water injectors
wells. Presently, two (2) wells are on production and
contributing average daily production of 242 barrels of
crude oil and 0.13 MMcf of gas.
Kadanwari, Bhit and Badhra FieldsKadanwari gas field is located in district Khairpur, Sindh
province while Bhit and Badhra fields are located in
district Dadu, Sindh province. ENI Pakistan is the
operator of these fields and OGDCL possess a working
interest of 50% in Kadanwari field and 20% each in Bhit
and Badhra fields. In order to enhance the production
from Bhit and Badhra fields, phase-II of compression
project has been completed under which ten (10) booster
compressors have been commissioned resulting in
cumulative gain of 38 MMcf per day of gas. Moreover,
drilling of a development well with potential of 25 MMcf
per day of gas at Badhra field has been completed.
During the year, average daily gas production for
Kadanwari and Badhra fields is 45 MMcf and 112 MMcf
respectively while Bhit field is contributing around 151
MMcf per day of gas and 262 barrels per day of
condensate.
Badar FieldBadar gas field is located in Kashmore, Sukkur and
Ghotki, Sindh province and is operated by PEL with
OGDCL holding 50% working interest. During the year
under review, Badar-2 has been put on regular
production and currently the field is producing on
average 16 MMcf per day of gas.
Miano FieldMiano gas field is located in district Sukkur, Sindh
province and is operated by OMV Pakistan with OGDCL,
ENI and PPL as joint venture partners. OGDCL holds 52%
working interest in Miano field. During the period
under review, drilling at Miano-19 has been completed
and well is under production testing. Moreover, Miano
TG-16 horizontal well has also been completed and
feasibility study for tie-in possibility of the well is under
progress. At present, there are eight (8) producing wells
with average daily production of 83 MMcf of gas and
37 barrels of condensate.
Dhurnal, Bhangali and Ratana FieldsDhurnal, Bhangali and Ratana fields are located in
district Attock and Rawalpindi in Punjab province. These
fields are operated by OPL with OGDCL holding 20%,
50% and 25% working interest in these fields
respectively. During the year, reprocessing of 119 sq. km
of 3D seismic data and installation of jet pump at
Dhurnal-2 remained under progress. The current
average daily production of Dhurnal field is 200 barrels
of oil and 1 MMcf of gas and Ratana field is producing
250 barrels of condensate, 6 MMcf of gas and 8 Tons of
LPG.
Badin-II, Badin-IIR and Badin-III FieldsBadin fields are located in district Badin, Sindh province
and are operated by UEPL. OGDCL’s working interest in
Badin-II, Badin-IIR and Badin-III fields is 49%, 24% and
15% respectively. During the year, drilling of two (2)
wells has been completed and average daily gross
production from the Badin fields is around 1,063 barrels
of oil/condensate and 8 MMcf of gas.
46 Oil & Gas Development Company Limited

Sara and Suri Gas FieldsSara and Suri gas fields are located in district Ghotki,
Sindh province and are operated by SEPL with OGDCL
holding 40% working interest in each field. In order to
commence production from shut-in wells, activities to
tie-in Sara-4 with gas transmission facilities are in
progress while arrangements are being made to procure
and install compression facilities at Suri-1 & 2. Moreover,
contract for reinterpretation of Sara-Suri 3D seismic
data has also been awarded.
Indus-Offshore Blocks - S and UOGDCL holds 50% and 27.5% working interest in blocks
S and U respectively. As of 30 June 2016, operator UEPL’s
request for an extension in the grant period of these
exploration licenses remained pending with DGPC.
Offshore Block GBlock-G is located in the Deep Offshore Indus Basin
about 250 km from the coast of Karachi with water
depths between 1,800 and 2,800 meters. The block is
operated by ENI while joint venture partners include
OGDCL and PPL. OGDCL holds a working interest of
33.33% in this block.
Within the Block-G, Kekra structure has been evaluated
as “high risk-high reward”, a promising carbonate
buildup with more than 425 sq. km area. Currently,
activities to spud-in exploratory well Kekra-1 have been
deferred due to current slump in oil prices.
Financial Performance ReviewPersistent slump in international oil prices owing to
crude supply glut in the market, albeit a mild price
recovery observed in last quarter of the year, continues
to influence OGDCL’s financial performance. The same
is evident in the shape of average basket price of crude
oil which during the fiscal year 2015-16 plunged to US$
42.50/barrel from US$ 74.45/barrel in the corresponding
year. This suppressed oil price environment led the
Company to report lower realized prices for crude oil
and gas averaging US$ 39.07/barrel and Rs 253.77/Mcf
compared with US$ 63.29/barrel and Rs 272.61/Mcf
respectively in the preceding year. In addition, the
Company’s Sales which have been affected by decrease
in saleable oil and gas production were partially offset
by increase in exchange rate to Rs 104.56 per US$ from
Rs 102.14 per US$ during the comparative period leading
the business to register Sales Revenue of Rs 162.867
billion (2014-15: Rs 210.625 billion).
During July 2015 - June 2016, reduced other income
mainly due to interest income on investment and bank
deposits coupled with increased exploration and
prospecting expenditure on account of enhanced
geophysical survey impacted OGDCL’s profitability.
Additionally, higher operating expenses reflecting an
increase in depreciation of property, plant & equipment
and training and welfare cost contributed to lower
financial results thus making the Company to register
Profit after Tax of Rs 59.971 billion translating into
Earnings per Share of Rs 13.94.
Against the backdrop of the challenging times faced by
the E&P companies due to collapse in international oil
prices leading the companies to witness squeeze in their
profit margins, OGDCL has reset its business strategy
whereby concentration on prudent investment selection
and capital allocation remained the cornerstone in
competitively carrying out the exploration, development
and production operations and efficiently meet the
business challenges ahead. Going on, the Company on
the account of exhibiting stable operational performance
coupled with the financial strength to support ongoing
development projects and activities will continue to
exploit profitable opportunities to sustain business long
term growth and create material value for the
shareholders in the years to come.
Liquidity and Cash flow AnalysisDuring the fiscal year 2015-16, OGDCL’s cash flow from
operations after working capital changes and payment
of income tax of Rs 35.076 billion and royalty of Rs 19.339
billion was Rs 55.852 billion. After adjusting investment
and financing activities of Rs 35.586 billion and Rs 23.759
billion respectively (cash outflows), the Company’s cash
and cash equivalents at the end of the year were
Rs 19.035 billion.
The prevailing inter-corporate circular debt issue in the
energy sector is hampering the business performance
as OGDCL’s overdue receivables stood at Rs 78.704
billion as on 30 June 2016, outstanding against oil
refineries and gas distribution companies. Out of
outstanding receivables, Rs 59.395 billion and Rs 16.525
billion are overdue from related parties namely SSGCL
and SNGPL respectively. In this respect, Company’s
Management with the aim to expedite the payment of
outstanding receivable amount is carrying out vigorous
follow-ups through personal visits, telephonic calls and
written letters directed towards oil refineries and gas
distribution companies alongside keeping Ministry of
Finance and Ministry of Petroleum & Natural Resources
apprised of all such steps coupled with reporting
position of receivables to the aforesaid institutes on
daily basis. The Government of Pakistan is also pursuing
for satisfactory settlement of inter-corporate circular
debt issue on account of which the Company considers
the receivable amount to be fully recoverable.
As on 30 June 2016, OGDCL’s current and acid test/quick
ratio were 4.32 and 4.01 respectively reflecting the
Annual Report 2016 47

Financial results for the year ended 30 June 2016 are summarized below:
(Rs in billion)
Profit before taxation 80.507
Taxation (20.536)
Profit for the year 59.971
Unappropriated profit brought forward 392.056
Other comprehensive loss (3.643)
Profit available for appropriations 448.384
Appropriations
Transfer to reserves (3.076)
Distribution through Dividends
Final Dividend 2014-15 @ Rs 1.50 per share (15.00%) (6.451)
First Interim Dividend 2015-16 @ Rs 1.50 per share (15.00%) (6.451)
Second Interim Dividend 2015-16 @ Rs 1.20 per share (12.00%) (5.161)
Third Interim Dividend 2015-16 @ Rs 0.50 per share (5.00%) (2.151)
(20.214)
Unappropriated profit carried forward 425.094
Company’s sound financial position and adequate
liquidity to meet day to day business requirements.
Going on, the Company in validation of its going
concern aspect is confident that its core activities will
continue to generate sufficient cash flows to fund the
exploration, development and production operations.
Crude Oil32.87%
Sulphur0.14%
Gas54.58%
Gas Processing0.03%
Other Income8.18%
Share of Profit in Associate
1.22%LPG
2.98%Operating Expenses30.59%
Finance Cost0.96%
Retained Profit20.41%
Dividend 11.25%
G & A Expenses2.10%
WPPF2.36%
Reserves1.71%
Transportation Charges1.06%
Exploration Expenses
8.09%
Corporate Tax11.42%
Royalty10.06%
Total Rs 179.76 billion Total Rs 179.76 billion
Source of Net Income 2015-16 Utilization of Net Income 2015-16
Final DividendThe Board of Directors has recommended the final cash
dividend of Rs 2.00 per share in addition to three (3)
cumulative interim cash dividends of Rs 3.20 per share
already declared and paid during the year. This makes
a total dividend of Rs 5.20 per share (52%) for the year
ended 30 June 2016.
Contribution to National ExchequerOGDCL being the leading E&P Company of Pakistan
made a significant contribution of Rs 81.640 billion to
the national exchequer on account of corporate tax,
dividend, royalty, general sales tax, gas infrastructure
development cess and excise duty during the fiscal year
2015-16. In addition, the Company’s oil and gas
production continues to render significant foreign
exchange savings as import substitution.
48 Oil & Gas Development Company Limited

Performance Measures and IndicatorsOGDCL has a wide range of key performance indicators
which are used to measure business operational and
financial performance. These indicators are in the form
of Six Years Performance given at page 32 of the Annual
Report 2016.
Awards Conferred
Corporate Excellence AwardOGDCL won the 31st Corporate Excellence Award (CEA)
and was ranked first by the Management Association of
Pakistan (MAP) in oil and gas sector for the third
consecutive year. This award is given in recognition of
the Company’s outstanding performance and
demonstrating progress and enlightened management
practices during the fiscal year 2014-15. Chief Minister,
Sindh then Senior Minister of Finance, P&D, Energy and
Irrigation, Government of Sindh, Mr. Murad Ali Shah
presided over the MAP’s 31st CEA ceremony and
presented the award to Mr. Masood Nabi, Executive
Director (Business Development and Joint Venture),
OGDCL.
Best Corporate Report AwardOGDCL won the Best Corporate Report Award (BCR) for
its Annual Report 2014 was ranked second in fuel and
energy sector by the Joint Committee of the Institute of
Chartered Accountants of Pakistan and Institute of Cost
and Management Accountants of Pakistan. The aim of
BCR awards is to encourage and give recognition to
excellence in annual corporate reporting. BCR Award
2014 was received by Mr. Irteza Ali Qureshi, CFO on
behalf of OGDCL.
Other AwardsOGDCL in recognition of its activities relating to
social responsibilities won the 5th Corporate Social
Responsibility Award 2016. Apart from this, the Company
on the basis of its contributions and implementations
in the field of fire and safety won the 6th Fire and Safety
Award 2016.
Board of DirectorsOGDCL Board of Directors comprises twelve (12)
directors including Chairman and Managing Director &
CEO. Mr. Zahid Muzaffar serves as Chairman Board of
Directors since 20 May 2014 while Mr. Zahid Mir is
fulfilling responsibilities as Managing Director & CEO
since 15 April 2015.
The present Board of Directors comprises the following:
Mr. Zahid Muzaffar Chairman
Mr. Arshad Mirza Director
Mr. Saif Ullah Chattha Director
Mr. Iskander Mohammed Khan Director
Mr. Hamid Farooq Director
Mr. Muhammad Ali Tabba Director
Mr. Zafar Masud Director
Prince Ahmed Omar Ahmedzai Director
Sayed Shafqat Ali Shah Director
Mr. Rahmat Salam Khattak Director
Mr. Muhammad Yawar Irfan Khan Director
Mr. Zahid Mir Managing Director
& CEO
Board Structure and Committees OGDCL’s Board structure is in accordance with the Code
of Corporate Governance and Public Sector Companies
(Corporate Governance) Rules, 2013 issued by the
Securities and Exchange Commission of Pakistan.
Presently, the Company’s Board comprises twelve
Directors; nine (9) Independent Directors, two (2)
Non-Executive Directors and an Executive Director. The
profile of the Board of Directors is given on page 16 of
the Annual Report 2016.
In order to ensure effective implementation of sound
internal control system and compliance with the Code
of Corporate Governance, the Board has constituted
various committees including Human Resource &
Nomination, Risk Management, Audit and Procurement,
Operations & Finance. The composition of the Board
committees and their Terms of Reference are given on
page 20 of the Annual Report 2016.
Annual Report 2016 49

Role of Chairman and Managing Director & CEOPositions of Chairman and Managing Director & CEO in
OGDCL are headed by two separate individuals.
Chairman is primarily responsible for running the
Board and all matters relevant to governance of the
Company where superintendence of the Board is
necessary. Moreover, Chairman in consultation with the
Board members formulate business policies and
strategies and heads Board meetings including fixing
the agenda of the meetings and overseeing Board
evaluation.
Managing Director & CEO is involved in the management
of day to day operations and procedures relating to
operational, financial and other matters of the Company.
Managing Director & CEO is also responsible for
implementation of strategies and policies approved by
the Board and making appropriate arrangements to
ensure that the business resources are properly
safeguarded and used economically, efficiently and
effectively in accordance with the statutory obligations.
Performance Evaluation: Board, Managing Director & CEO and Senior ManagementOGDCL’s Board in accordance with the requirements laid
down in the Code of Corporate Governance and Public
Sector Companies (Corporate Governance) Rules, 2013
carried out self-evaluation of the performance,
capabilities and competencies. This evaluation exercise
is undertaken on annual basis with the aim to enhance
the efficiency and effectiveness of the Board. Moreover,
performance evaluation of Managing Director & CEO
and senior management is done by the Board against
their targets and responsibilities.
Formal Orientation and Continuous Professional Development Programs Orientation and briefing sessions remained a regular
feature at OGDCL during the fiscal year 2015-16.
Moreover, the Company continued its focus on
imparting external training through professional
institutions both local and foreign. During the reporting
period, directors; Mr. Iskander Mohammed Khan and
Mr. Rahmat Salam Khattak attended Directors’ training
program viz., Corporate Governance Leadership Skills
organized by Pakistan Institute of Corporate Governance
(PICG). Additionally, Mr. Zahid Muzaffar and Mr. Hamid
Farooq are certified directors from SECP approved
institutions. Furthermore, a workshop on Board
Effectiveness organized by PICG is attended by the
Company directors; Mr. Zahid Muzaffar, Mr. Iskander
Mohammed Khan, Mr. Hamid Farooq, Mr. Zafar Masud,
Prince Ahmed Omar Ahmedzai and Mr. Muhammad
Yawar Irfan Khan.
Corporate GovernanceOGDCL being a listed Company adheres to the Code of
Corporate Governance and all listing regulations to
ensure business integrity and upholding confidence of
all the stakeholders. Moreover, the Company is a public
sector enterprise and operates under the framework
enshrined in the Public Sector Companies (Corporate
Governance) Rules, 2013. Overall superintendence of the
Company vests with the Board of Directors which are
accountable to the shareholders for good corporate
governance while the management is responsible for
day to day operations, implementation of policies and
disclosure requirements as envisaged in the Companies
Ordinance, Rules, Regulations and the Code.
Specific statements to comply with the requirements of
the Code of Corporate Governance are as follows:
• The financial statements prepared by the
management present fairly its state of affairs, the
result of its operations, cash flows and changes in
equity.
• ProperbooksofaccountsoftheCompanyhavebeen
maintained.
• Appropriate accounting policies have been
consistently applied in preparation of the financial
statements and accounting estimates are based on
reasonable and prudent judgment.
• International Financial Reporting Standards, as
applicable in Pakistan, have been followed in the
preparation of financial statements and any
departure there from has been adequately disclosed.
• TheBoardhascompliedwiththerelevantprinciples
of corporate governance and has identified the rules
that have not been complied with, the period in
which such non-compliance continued and reasons
for such non-compliance.
• Thesoundsystemofinternalcontrolisestablished
and maintained which is regularly reviewed and
monitored with ongoing efforts to improve it further.
• TherearenodoubtsupontheCompany’sabilityto
continue as a going concern.
• The appointment of the Chairman and other
members of the Board and terms of their appointment
along with the remuneration policy adopted are in
the best interests of the Company as well as in line
with the best practices.
• Disclosure on remuneration of Chief Executives,
Directors and Executives is given on page 129 of the
Annual Report 2016.
• Therehasbeennomaterialdeparturefromthebest
practices of corporate governance, as detailed in the
listing regulations.
• Informationaboutoutstandingtaxesandleviesis
given in the notes to the financial statements.
50 Oil & Gas Development Company Limited

• Valueof investments, includingbankdeposits,of
various funds based on the latest audited accounts
as of 30 June 2015 are as follows:
- Pension Fund Rs 58,605 million
- General Provident Fund Rs 3,613 million
Auditors The present auditors KPMG Taseer Hadi & Co., Chartered
Accountants and A.F. Ferguson & Co., Chartered
Accountants have completed their assignment for the
year ended 30 June 2016 and shall retire on the
conclusion of 19th Annual General Meeting scheduled
to be held on 26 October 2016. In accordance with the
Code of Corporate Governance, Audit Committee
considered and recommended the reappointment of
KPMG Taseer Hadi & Co., Chartered Accountants and
A.F. Ferguson & Co., Chartered Accountants, as joint
statutory auditors for the fiscal year 2016-17. The
recommendations of the Audit Committee are endorsed
by the Board of Directors.
Internal Control and AuditInternal audit function serves as an effective appraisal
of internal controls which ensure that methods and
measures are in place to safeguard the business assets,
monitoring compliance with the best practices of
Corporate Governance, check the accuracy and
reliability of accounting data and encourage adherence
to prescribed rules and policies. In line with this
function, OGDCL has an independent Internal Audit
Department. The scope and role of the Internal Audit
Department has been duly approved by the Company’s
Board. The role corresponds to the responsibilities
envisaged for the internal audit function under the
Public Sector Companies (Corporate Governance) Rules,
2013. Head of the Internal Audit Department functionally
reports directly to the Audit Committee of the Board.
Investor Relations (IR)OGDCL is aware of the fact that both its existing and
potential stakeholders are interested in having access
to strategic and operational information which could
help them charter how the Company might perform
going forward. In this regard, the Company’s IR program
serves to keep the investors and market participants
informed of all the material information which could
have an influence on the Company’s share price. This
information is simultaneously broadcasted to Pakistan
Stock Exchange and London Stock Exchange, accurately
and timely. Moreover, all such material information is
regularly posted and updated on OGDCL’s website
(www.ogdcl.com) including share price related data
with graphical representations, financial reports,
conference call presentations with transcript, financial
calendar and other important notices to keep
shareholders abreast of all material developments of
the Company.
In line with the international best practices, OGDCL
maintains a regular dialogue with local and foreign
institutional investors/fund managers and research
analysts through meetings, presentations and
conference calls on full and half year financial results.
Personal communication is done through Annual
General Meeting (AGM) and on dates of the presentation
of annual results and half year results, whereby
shareholders and research analysts interface with the
executive management through conference calls. In
addition, notice of AGM is circulated at least twenty one
(21) days prior to the meeting along with dispatch of the
Annual Report to all the shareholders within the
stipulated timeframe.
Handling Investor GrievancesIn pursuance to OGDCL’s mission of meeting
expectations of the stakeholders through best
management practices, enquiries from shareholders
and analysts relating to OGDCL’s operational and
financial activities are welcomed and in response IR
function strives to provide a prompt reply to those
queries. Moreover, investor grievances are aptly
handled and all out efforts are made to swiftly address
their concerns, if any.
Relationship and Engagement with StakeholdersOGDCL in adherence to highest standards of corporate
governance and ethical consideration maintains strong
and healthy relations with its stakeholders including
shareholders, Ministries, Divisions and Departments/
Directorates of Federal and Provincial Governments, JV
partners, customers, suppliers, employees and local
communities. The Company endeavors to build durable
bonds with these stakeholders to stay connected,
informed and engaged as a group.
OGDCL regulators include MP&NR, DGPC and other
divisions and departments of Federal and Provincial
Governments. The Company fully complies with their
directives/guidelines relating to gas pricing, crude oil
and gas allocation to refineries and gas distribution
companies, concession management, etc. Regarding
shareholders, the Company fully respects their
confidence and trust reposed in the business and carries
out regular dialogue with them through active Investor
Relations, maintaining and updating material
information on the organization’s website and timely
dissemination of the information to the stock exchanges.
OGDCL’s workforce through its contributions and
relentless efforts has played a pivotal role in making the
organization a leading E&P Company of Pakistan. In this
regard, the business is focused on safety and satisfaction
of its employees in addition to ensuring that their hard
work is recognized and valued. Moreover, the Company
Annual Report 2016 51

enjoys amicable relations with its joint venture partners
and works alongside a number of E&P companies
through production sharing contracts to explore,
develop and produce oil and gas cost effectively in the
Country. Likewise, the Company maintains positive
relationships with its customers including crude oil
refineries and gas distribution companies, suppliers
and local communities with the aim to create long term
sustainable value for mutual benefits of all the
stakeholders.
Share Price Sensitivity AnalysisBy the very nature of E&P business, OGDCL is exposed
to various risks inherent in its core business of finding
and developing oil and gas resources. Such risk factors
may potentially impact the business share price and
results of operations. In this regard, the key factors are
as follows:
Commodity Prices (Crude oil and HSFO)Changes in the international crude oil/HSFO price
impact business revenue thus influencing the share
price. The same is witnessed by the slump in
international oil price which has impacted the business
sales revenue and profitability.
Operational ActivitiesShare price responds positively to success achieved on
operational fronts especially as a result of new oil and
gas discoveries, enhancement of hydrocarbon
production from owned and operated joint venture
fields and completion of development projects. Failures
such as dry and abandoned wells and operational
catastrophes may create a contrary effect on the share
price.
Macroeconomic, Political and Security EnvironmentChanges in macroeconomic factors such as growth in
economy, low inflation and stable interest/exchange
rates have a positive bearing on the business share price
and vice versa. Moreover, political stability reduces the
Country’s risk premium and favorably affects the share
price. Likewise, improvement in security situation
enhances the E&P activities and reduces security related
expenditures thus increasing the share price.
Regulatory and Licensing RegimesImprovement and stability in the regulatory regime and
better pricing policies positively influence future
earnings leading to a favorable effect on the share price.
Infrastructure and TechnologyImprovement in existing infrastructure and introduction
of latest E&P technologies make it possible to reduce
exploration and production costs and provide access to
untapped hydrocarbon reservoirs. This creates future
growth opportunities and positively impacts the share
price.
Pattern of Shareholding The pattern of shareholding as on 30 June 2016 is given
on page 135 of the Annual Report 2016.
Human Resource (HR)OGDCL’s coveted status as a “market leader in E&P sector
of Pakistan” is attributable to its employees dedicated
and consistent endeavors, extending over a span of many
years. On this account, the Company highly values the
importance of its human capital and regards it as a key
business resource. During the year under review, the
Company’s prime focus remained on building
productivity and capacity enhancement of its workers to
seek operational excellence and accomplish
organizational objectives in line with the business vision
and mission statement. In addition, the Company’s HR
strategy continues to play a proactive role in embedding
high performing culture in the organization hinging on
business core values namely merit, teamwork,
dedication, integrity, safety and innovation.
In order to carry on delivering performance with higher
productivity, OGDCL focuses on maintaining
transparency and meritocracy pertaining to its HR
activities including employee induction, development,
compensation, evaluation and promotion. Moreover to
instill a sense of achievement and enhance motivation
of the workers, the Company has brought effective
changes and innovation in the system of performance
management. Performance based awards are granted
to inculcate competition and motivate the employees to
take on further challenges in the years to come.
Apart from the above, OGDCL continues to promote
diversity and equal employment opportunity coupled
with providing a safe workplace free from discrimination,
hostility and harassment, where rights to freedom of
association and collective bargaining are respected. Any
discrimination against or harassment of an employee
based on age, gender, race, religion, creed, marital
status, ethnic group, etc., is regarded as violation of the
business regulations and will result in disciplinary
action as per the Company’s rules.
As of 30 June 2016, OGDCL’s manpower strength
comprised a total of 9,376 employees working at Head
Office, regional offices, field locations and other
operational areas of the business. This strength is also
inclusive of minorities, women and disabled employees
working in the organization. Going forward, the
Company is confident that its employees have the
requisite skills to meet the challenges of the current
52 Oil & Gas Development Company Limited

business environment and continue rendering
improved operational performance to register new
milestones and boost nation’s energy supply.
Succession Planning OGDCL is focused on career growth and development of
employees by ensuring that effective succession
planning exists in the organization. This culture is
preserved on account of making persistent efforts for
development of a professional team and succession
plans both short and long term for all critical positions
coupled with imparting training to the successors. Skill
enhancement workshops and appropriate management
courses are regularly designed to train the successors
to share the higher responsibilities.
Industrial RelationsManagement relations with the Collective Bargaining
Agent continued to be friendly and industrial peace
prevailed at all locations during the reporting period.
Measures such as settlement of disputes and differences
through bilateral negotiations, ensuring security of
employment, provision of safe working environment
and job satisfaction and maintaining continuous
sympathy and understanding along with prompt
dealing of cases relating to individual grievances
preserved to ensure that relations between the workers
and management remain cordial and conducive poised
towards meeting business goals and objectives.
Code of Conduct: Business Ethics & Anti-Corruption Measures and Conflict of InterestOGDCL’s Code of Conduct aims to ensure that the
business operations are conducted in accordance with
highest business ethical consideration complying with
all statutory regulations and standards of good
corporate governance. The code provides guidelines on
fair employment practices, equitable treatment of the
employees and procedures to report any failure to
comply with the business regulations, financial
malpractices, damage to business assets and actions
which are likely to harm the reputation of the Company.
The Code of Conduct promotes a culture of openness in
which employees report legitimate concerns without
the fear of any retaliation or punishment. The directors
and employees adhere in letter and spirit to all laws and
avoid conflict of interest, which if any (real or perceived)
are to be notified to the Company immediately.
Training and DevelopmentOGDCL is cognizant of the role played by its skilled
manpower in rendering industry leading performance
in E&P sector of Pakistan. In this regard, the Company
strives to provide regular training and professional
development courses to its workforce with an aim to
enhance their skills and knowledge and to keep them
abreast of technological changes in oil and gas industry.
Moreover, the Company’s Oil & Gas Training Institute
(OGTI) established in 1979 is equipped with well
established laboratories and other complimentary
facilities thus effectively contributing in carrying out
the training programs in a planned and organized
manner.
OGTI provides basic training to the petroleum industry
graduates and technicians enabling them to start their
career in addition to arranging refresher courses and
advanced training programs for experienced
professionals in all streams of the petroleum industry in
general and upstream in particular. Training programs
are being offered ranging from technician to
management level in the fields of Exploration, Reservoir
Management, Drilling, Production and Processing
activities. In addition, the institute imparts education
and training with respect to Health, Safety and
Environment, Information Technology and Management.
These training programs are developed and delivered by
renowned trainers both from within OGDCL and other
companies - indigenous and foreign.
During the fiscal year 2015-16, a batch comprising
Geophysicists, Geologists, Data Acquisition Engineers,
Wire Line Logging Engineers and Mud Logging
Engineers has successfully completed one (1) year
training program at OGTI. This program was a delicate
mix of classroom and on-job training which included
course work and on-job attachments to provide practical
exposure to the trainees. Additionally, OGTI successfully
conducted 68 refresher training programs in the form
of technical courses and workshops. Most of these
training programs were arranged at the institute and
some at field locations to facilitate the participants.
About 1,200 professionals from OGDCL and other E&P
companies participated in these programs. Furthermore,
OGTI processed cases of 128 professionals relating to
foreign training and visit and provided summer
internships to more than 600 students from various
universities. Besides this, attachments were offered to
fresh graduates, who recently completed their
education.
Annual Report 2016 53

Corporate Social Responsibility (CSR)In line with its mission to be a socially responsible
corporate citizen, OGDCL not only deems community
development as an ethical, moral and social
responsibility but the same is also reflected in the
conduct of business operations. The Company’s
extensive social welfare program tasks at supporting
and sustaining the communities residing in the business
operational areas by way of making investment in the
domains of education, health care, water supply,
infrastructure development and generous donations.
While undertaking such poverty alleviation efforts
among the marginalized communities, the Company
continues to discharge its social welfare obligations
under respective Petroleum Concession Agreement.
A brief of CSR activities carried out during the fiscal year
2015-16 is as follows:
EducationOGDCL during the year carried on with its role to uplift
the educational level among the most deprived
communities. In this regard, the Company’s CSR
activities include:
• In collaboration with the Institute of Business
Administration (IBA) Karachi and Sukkur launched
its first National Talent Hunt Program for the
students hailing from the backward areas. This
program offered free scholarships to the students
selected on merit and in this respect the Company
plans to contribute Rs 111.23 million to IBA Karachi
and Rs 77.72 million to IBA Sukkur in a period of five
(5) years and four (4) years respectively;
• Introduced National Internship Program under
which 300 graduates for one (1) year internship were
selected from all four provinces of the Country;
• ProvidedfinancialsupporttotheFamilyEducation
Services Foundation amounting to Rs 3 million for
grant of scholarships to the special students of Deaf
Reach School Sukkur, Sindh province;
• ProvidedscholarshipworthRs7.5milliontolocal
students for completion of three (3) years diploma
program at Technical Training College Daharki,
district Ghotki, Sindh province;
• Constructionoftwo(2)classroomsatGovernment
Primary School Alwargi Banda Nashpa, district
Karak, Khyber Pakhtunkhwa province costing Rs 1.13
million and construction of one (1) class room
coupled with providing computers at Higher
Secondary School Chanda Khuram, district Karak,
Khyber Pakhtunkhwa province;
• Provided financial assistance for construction of
class room and school furniture totaling Rs 1.4
million to Jarwar Bridge School Uch, district Dera
Bugti, Balochistan province; and
• Provideduniformandnecessaryschoolitemstothe
poor students of Government Primary School Maru/
Reti, district Ghotki, Sindh province and furniture,
computers and other school items for Boys and Girls
School Dhudial, district Chakwal, Punjab province.
HealthOGDCL’s CSR activities in relation to health and medical
facilities during the reporting period are as follows:
• Provided fully equipped ambulances amounting
Rs 8 million to Tehsil Head Quarter Hospital Jand,
district Attock, Punjab and Civil Hospital
Shakardara, district Kohat, Khyber Pakhtunkhwa
province;
• Organized free medical camps relating to skin
diseases for the local communities residing in
Kunnar, Bobi, Sinjhoro, Qadirpur and Tando Alam
Oil Complex fields;
• Establishedmobilemedicalsetuptoprovidehealth
care facilities to the patients of remote villages at
Qadirpur field, district Ghotki, Sindh province;
• Donated X-ray machine to Basic Health Unit
Halepota, district Hyderabad, Sindh province;
• Provided donation to Al-Shifa Eye Trust Hospital
Rawalpindi, Punjab province for its outreach
54 Oil & Gas Development Company Limited

program in the areas of Khyber Pakhtunkhwa and
Southern Punjab; and
• Providedfinancialsupportforcounteringdengue
to the locals of Kohat district, Khyber Pakhtunkhwa
province and non food item kits to Pakistan Red
Crescent Society at district Nasirabad, Balochistan
province.
Supply of Clean Drinking WaterOGDCL continued to supply clean drinking water
through water tankers and bouzers to the locals of Loti,
Pirkoh, Tando Alam, Daru, Sari/Hundi, Rajian, Chak
Naurang, Dhodak, Chanda and Nashpa fields.
Installation of water hand pumps has also been carried
out at different villages near Kunnar, Pasakhi and
Nashpa fields during the year. Moreover, the Company
by incurring a cost of Rs 2 million completed water
supply scheme at Killi Kalli, district Dera Bugti,
Balochistan province. In order to check availability of
water in the areas of Loti and Pirkoh, water resistivity
survey has also been carried out.
Donations and Financial AssistanceBeing the national oil and gas Company, OGDCL has
always played a proactive role to provide relief activities
to the victims of national calamities in addition to
making significant contributions for the national cause
purpose. In this connection, steps taken by the Company
during the year under review include:
Flood ReliefOGDCL timely moved to provide relief to the flood
affected people in the areas of Ghotki and Khairpur
districts of Sindh province. The Company donated an
amount of Rs 2 million and distributed medicines and
food hampers/dry rations to the needy people. Moreover,
flood relief activities were carried out in the areas of Kot
Addu, Muzaffargarh and Garh Maharaja, Punjab
province by providing medicines, food hampers and
drinking water to the flood affectees at a total cost of
Rs 1.65 million.
Empowering WomenAs a goodwill gesture towards empowering the
community particularly women, OGDCL distributed
sewing machines among the poor and needy women in
the areas of Toba Tek Singh, Tona Nokhani, Zin, Dera
Bugti and Maru Reti. The Company believes that this
donation will contribute to self-employment of women
enabling them to earn their livelihood.
Donations to promote Sport ActivitiesOGDCL contributions towards promoting sport activities
include:
• ProvidedfinancialsupportforCentreforAdvanced
Studies School Karachi for participation in Rowing
International Championship, Singapore;
• Donated Rs 5 million and Rs 2.45 million to the
Frontier Corp, Quetta and Frontier Constabulary for
organizing T20 Ramzan-ul-Mubarak cricket
tournament and Golf Championship respectively;
• Sponsored 1st Flood Light Hockey tournament
organized by Pakistan Hockey Federation, football
tournament at Jand, district Attock, Punjab province,
3rd Prime Minister Blind T20 cricket tournament
and 3rd football tournament at district Kohat,
Khyber Pakhtunkhwa province with an amount of
Rs 10 million, Rs 2.50 million, Rs 1.60 million and
Rs 0.88 million respectively; and
• Also sponsored, National Motorsports Desert
Challenge Rally at Jhal Magsi, Balochistan province
and spring and cultural sports festivals at Sibi and
Qadirpur.
Annual Report 2016 55

Health, Safety, Environment and Quality (HSEQ)
Occupational Health, Safety and Environment InitiativesOn account of being a safe operator and responsible
corporate citizen, OGDCL attaches great importance to
HSE Management System with a view to foster a culture
of compliance towards safety and wellbeing of the
manpower, community and environment. The Company
resolutely believes that responsibility for health, safety,
and environment cannot be delegated but is in fact a
shared responsibility ultimately leading to business
growth. While carrying out E&P activities, the Company
ensures that welfare of the local communities, protection
of ecosystems and safety of workforce remains a
business priority.
In pursuance to sustainable mechanisms for safeguard
of environment, OGDCL complies with Pakistan
Environment Protection Act 1997 and strictly adheres to
the rules and regulations promulgated for protection of
the environment. Initial Environment Examination and
Environmental Impact Assessment are part and parcel
of the business operations and no project is initiated
without acquiring No Objection Certificates (NOCs)
from the respective Environmental Protection Agency
(EPA).
During the year under review, OGDCL participated in
2nd International Summit on Environment, Health,
Safety and Security and in recognition for its remarkable
efforts in HSE activities has been awarded with a
souvenir. Moreover, the Company in recognition of the
arrangements for fire prevention and safety received
Fire and Safety Award 2016 by National Forum for
Environment and Health.
Consumer Protection MeasuresOGDCL continues to ensure that its business products
supplied to the markets, consumers and other
stakeholders are properly processed and bear minimum
(allowable) potential for pollution. In order to mitigate
unwanted and hazardous impact of gases, absorbents,
scrubbers and desiccants/molecular sieves are utilized
to guarantee continuous quality conscious operations
at the fields and plants. In addition, it is ascertained that
the remaining traces of gases are burnt in accordance
with the international practice in the controlled-flare.
HSE - key activitiesOGDCL key HSE activities during the reporting year are
as follows:
I. Promulgated Risk Management Policy and
Framework and launched a comprehensive
program to train and aware employees of the key
business risks. Moreover, risk management
exercise has been conducted at all fields and major
risks have been identified at grass root level. Top
ten (10) corporate risks have been presented to the
Board of Directors which are being controlled/
managed as per directions of the Risk Management
Committee;
II. To ensure top level commitment with respect to
health, safety and environment, a meeting to devise
a framework for implementation of HSE SOPs
guidelines and bring cultural change is held
between Managing Director & CEO and all the HSE
engineers at OGDCL House;
III. In addition to ISO certifications for its Dhodak and
Qadirpur fields, the Company has achieved ISO
14001 and OHSAS 18001 certifications for Dakhni
and Chanda fields;
IV. Became the first Company in Pakistan to introduce
a newly emerged technology namely Floating
Treatment Island/Wetland (FTW) which is used to
treat waste water in an environment friendly, cost
effective and efficient manner. This is done through
soil-less plantation by integrating agronomy and
ecological engineering, whereby regionally
suitable vegetation is trapped in self-buoyant mats
to construct artificial floating wetlands;
V. Acquired more than 40 NOCs from all the four
provincial EPAs after fulfilling the requirements
and submission of comprehensive environmental
reports;
VI. Distribution of safety bulletin amongst the
employees and stakeholders to keep them well
versed with HSE activities and new techniques.
Incidents along with their detailed reports were
also shared through safety bulletin to avoid the
recurrence of same nature of incidents in the
future;
56 Oil & Gas Development Company Limited

VII. Safety Audit of OGDCL House has been carried out
in accordance with the Capital Development
Authority bye laws for high rise buildings and all
international applicable laws pertaining to fire and
safety, electricity, etc. Safety Audits of different
fields were also conducted using in-house
competency of HSE professionals;
VIII. To create awareness through involvement of
employees and local community, HSE awareness
events were organized at field locations. In view of
the fact that health, safety and environment
protection is a shared responsibility, all the workers
participated in these events; and
IX. Officials from various operational departments of
the Company received training in the following
areas:
a. Hazard Identification, Risk Assessment and
Risk Control
b. HSE Auditing – based on ISO 14001 and OHSAS
18001 standards
c. Accident prevention and Investigation through
Root Cause and Failure Analysis
d. Firefighting and Rescue Techniques
Major Energy Conservation/Emissions Control Project With an aim to monitor the impact of OGDCL operations
on the environment, Ambient Air Monitoring of the
major fields has been carried out during the year. While
emissions at most of the locations were within the
range, required modifications were made where the
results were beyond National Environment Quality
Standard limits. Carrying out Ambient Air Monitoring
has now become a permanent feature at the Company’s
fields/locations, which is done on quarterly basis.
Moreover, optimization of process parameters has been
achieved at Qadirpur field through monitoring of fuel
and chemical usage and preemptively addressing and
troubleshooting heating/cooling systems, whereby
energy conservation and saving opportunities are
directly or indirectly linked with the results of the heat
volume balance. Extensive pragmatic plants have also
been developed to ensure prudent utilization of energy
resources at key installations like Dakhni, Nashpa,
Sinjhoro, KPD-TAY and Uch fields. Furthermore, in view
of the increasing oil and gas requirements in the
Country, the Company is working to install solar systems
to meet the energy deficiency and conserve oil reserves
of the business.
Energy Saving MeasuresEnergy saving measures carried out at fields and offices
through application of 4Rs philosophies; Reduce, Reuse,
Recycle and Repair are as follows:
I. Replacement of conventional lighting with LED
lights;
II. Installation of solar systems;
III. Timely maintenance of engines and turbines to
avoid incomplete combustion and wastage of fuel;
IV. Predictive maintenance of machines based on
condition monitoring to avoid efficiency drop;
V. Proper insulation of pipelines and air ducts and use
of heat tracing cables;
VI. Decanting and secondary containment systems for
condensate/crude oil, diesel and chemicals;
VII. Replacing lights with low energy lamps or solar
lights where feasible and using intelligent lighting
controls;
VIII. Reuse of oil based mud during drilling operations;
IX. Bioremediation of oil spills, oil based drill cuttings
and oily sludge to rehabilitate soil; and
X. Use of FTW technology to treat waste water in an
environment friendly and cost effective manner.
Annual Report 2016 57

Information TechnologyOGDCL as part of its technology modernization plan
continued to undertake system development activities
to carry out the business processes efficiently and
effectively. Steps taken during the fiscal year 2015-16
include:
Deployment of Wi-Fi solutionExisting cable networking has been replaced by an
enterprise grade secure Wi-Fi solution at Head Office
offering high network connectivity for business
applications. This system has true mobility and is
protected through an inbuilt robust firewall.
Information Security Management System AuditAn internal security assessment of the Company’s data
center has been carried out by Solutions Tech Pakistan
to ensure that the data center is established and
implemented in accordance with international best
practices and standards. A comprehensive report in this
regard is submitted by the consultant highlighting
critical, medium and low level vulnerabilities.
Responding to the high level vulnerabilities, remedial
actions have been performed by the Company.
Revamping of Data CenterAs a result of Information Security Management System
audit, revamping of data center has been carried out by
installing Internet Protocol based cameras, smoke
detectors, Access Control System and centralized system
for monitoring humidity and fire. Similarly, expansion
for storage related to Microsoft Exchange and Microsoft
SharePoint Infrastructure is added in the data center by
increasing its capacity from 12 to 24 terabyte.
Deployment of Infrastructure for ApplicationsInfrastructure for applications including Maximo
(Maintenance Management System), Medical
Management System and Fund Management System has
been successfully configured coupled with providing
data center facilities for running these applications. In
addition, blade servers have been re-configured as per
requirement.
Integration of Tape Library with Microsoft Exchange Infrastructure and Revision of Backup PolicyIntegration of existing TS3200 Tape Library has been
made with Microsoft Exchange Infrastructure along
with revising the backup policy. Moreover, off-site
backups on IBM LTO Ultrium cartridges are being
maintained for email databases and archive databases.
Computerized Maintenance Management SystemComputerized Maintenance Management System has
been implemented at the Company’s two (2) major fields
namely Qadirpur and Dakhni. It is an IBM Maximo Asset
Management solution that manages physical assets on
common platform allowing organizations to share and
enforce best practices. Moreover, it is helpful for
reducing corrective maintenance. Moving on, the
Company plans to implement this system at Sinjhoro,
KPD and Uch fields.
Medical Management SystemMedical Management System integrated with ERP
system has been successfully implemented in the
Company. Its main features include maintenance of
employee/pensioner medical history and monitoring of
medical expenses.
Document Management SystemThe Company has developed its own Document
Management System using the SharePoint Portal. This
system has the capability for archiving of important
digital data including policies, procedures, SOPs
contracts, etc. Moreover, training session has been
arranged to equip the employees with basic knowledge
of the system and enable them to carry out the routine
functions; upload, retrieve and access the documents.
58 Oil & Gas Development Company Limited

Production Database Management SystemThe Company is carrying out up gradation of the
existing Production Data Management System for
efficient management of the production data and sales
record of oil, gas, LPG, NGL and sulphur. This system is
planned to be integrated with different reservoir
management software in addition to fulfilling the
function of information dissemination to the concerned
personnel, departments, joint venture partners and
government bodies including Ministry of Petroleum
and Natural Resources and Directorate General of
Petroleum Concessions.
Up-gradation of Oracle ERPThe Company implemented ERP system in 2003, which
at present requires up-gradation in order to meet the
future business requirements. In this regard, review
and revamp exercise of the current ERP business
processes is planned by carrying out an extensive review
of installed processes, identification of gaps and detailed
requirement analysis.
Business Risks and Mitigation MeasuresOGDCL’s core business activities task at locating,
acquiring, developing and commercially producing oil
and gas reserves. However, such activities are speculative
in nature and are characterized by inherent
uncertainties, geological surprises and complexities
which may have a potential impact on the business
financial conditions and results of exploration,
production and development operations.
In order to cope up with business risks, OGDCL has in
hand effective risk management strategies and proactive
risk mitigation techniques which play an imperative role
to accomplish the strategic objectives and protect the
business assets, personnel and reputation. Moreover,
the Company’s Risk Management Committee functions
to identify and mitigate the potential impact of the risks
and ensure quality decision making by timely assessing,
treating and monitoring the broad spectrum of the risks
which may occur while carrying out E&P activities.
OGDCL’s business risks are likely to change subject to
modification in the business strategy and changes in the
external environment. At present, risks and
uncertainties which are believed to be material in nature
coupled with their mitigation techniques are as follows:
Strategic RiskOGDCL’s strategy aims at optimization of business
portfolio and sustaining production growth in a cost
effective manner leading to improved profit margins.
Going forward, the Company in an effort to find and
develop oil and gas prospects cannot guarantee
maintenance of high drilling success and effective
execution of low cost strategy. Responding to the risk of
strategic failure, the Company focuses on utilizing latest
production techniques, advance reservoir management
practices and modern technology to exploit new
reserves and boost production while ensuring its low
cost operator status. Additionally, the Company renews
and repositions its exploration portfolio to embark upon
future growth opportunities and increase shareholders
value.
Commercial RiskOn account of operating in an energy deficient Country,
OGDCL’s hydrocarbon production is readily absorbed in
the indigenous market thus bearing no risk relating to
sale of products. However, following factors may
unfavorably influence the Company’s financial stature:
Commodity Price RiskCrude prices in Pakistan are linked to a basket of Middle
East crude oil prices which are calculated by taking into
account average prices of Oman, Dubai and Das Blend.
Any volatility in the prices of the crude oil has a
significant influence on OGDCL’s financial performance.
In this respect, financial results witnessed across the
sector during the year under review were sobering
reminders of the challenges low commodity prices pose
to sales revenue and profit margins.
However, OGDCL’s gas sale is less prone to price risk as
the gas prices of major fields are capped at fixed crude
oil/HSFO prices and sales revenue is only affected
provided international crude oil prices fall below the
capped price. Against the backdrop of decline in the
international oil prices, the Company will continue
managing its costs and preserving capital flexibility
while stepping up the exploratory efforts to discover
new hydrocarbon reserves and augment oil and gas
Annual Report 2016 59
production leading to increased operational cash flows
in the coming years.
Foreign Currency RiskAs OGDCL’s functional and reporting currency is Pak
rupees, the business is exposed to foreign currency risk
with respect to crude oil and gas prices which are
determined in US dollars and translated into Pak rupees
using exchange rate established by the regulatory
authority. Therefore, any decline in the value of Pak
rupee against US dollar has a positive impact on the
Company’s earnings and vice versa. While currency risk
arising due to foreign currency payments made for
purchase of material, equipment and hiring of third
party services is neutralized by natural hedging
provided by the Company’s pricing mechanism.
Credit RiskAgainst supply of crude oil and natural gas products,
significant trade debts are payable to OGDCL by crude
oil refineries and natural gas distribution companies
respectively. Settlement of such debts has been slow
which resulted in the creation of Inter Corporate
Circular Debt issue in the energy industry. Against this
risk, OGDCL’s management during the year under
review continued to undertake all possible measures
including vigorous follow-ups and constant liaison with
Government of Pakistan to recover outstanding
receivables and avert liquidity problems. Moreover,
Government of Pakistan is also pursuing for satisfactory
settlement of Inter Corporate Circular Debt issue and on
this account the Company considers this amount to be
fully recoverable.
Financial RiskOGDCL’s debt free balance sheet is reflection of the fact
that currently the business is not exposed to any
financial risk. However, delay in settlement of trade
debts can put the business cash position and financial
standing in jeopardy. Prolonged nonpayment of trade
debts by crude oil refineries and gas distribution
companies may trigger the need for borrowing in order
to carry out planned exploration, production and
development activities/projects alongside ensuring
timely discharge of statutory obligations including
royalty, taxes/duties, dividend, etc.
Reserves RiskCrude oil and gas reserves data are only estimates and
the actual quantity of recoverable reserves may differ
from the estimated proven and probable reserves. In
order to cope up with this risk, OGDCL internally
evaluates and update reserves on quarterly basis based
on the production performance, workover jobs and
development wells results of individual fields. Also for
verification/up-dation of the reserves status, the
Company arranges reserves evaluation study in all its
fields which is carried out by an independent
international expert after every three (3) years.
Operational RiskOGDCL operational activities may be exposed to the
following risks:
Exploration, Drilling and Production RiskThe risks and hazards inherent in OGDCL’s operational
activities include well blowouts, explosions,
uncontrollable leaks, down hole fires, oil spills,
mechanical failures, adverse weather conditions, etc.
Such risks may result in substantial losses in the form
of injury to workers, loss of life, severe damage to
property, plant and equipment, production loss,
pollution and suspension of operations thus adversely
affecting the business earnings and growth. In order to
mitigate these risks, OGDCL focuses on routine check
ups and repair and maintenance of plant and machinery
in addition to maintaining an insurance coverage in line
with the customary industry practices against some of
the potential operational risks.
In addition to the above, drilling of exploratory wells
involve the risk that no commercially productive oil or
gas reservoirs will be encountered. Moreover,
exploration and production activities are often
conducted in extremely challenging environments
which heighten the risks of technical integrity failure
and natural disasters. Furthermore, exploring and
developing oil and gas fields is a capital intensive
activity requiring sufficient cash flows to finance the
operations. The Company counters such risks by
maintaining a strong financial discipline and
formulation of strategic alliances with other E&P
companies having technical expertise and
complementary skills to carry out the operations cost
effectively and skillfully.
Environmental RiskEnvironmental risks relate to natural disasters in shape
of earthquakes, cyclones, floods and other such events
which cause the business operations to disrupt or be
curtailed. OGDCL in this regard covers all insurable
risks through insurance besides maintaining a
contingency fund to cover uninsured damages.
Security RiskSecurity risk is in shape of insurgency and political
instability which adversely influence the business
operations causing threat to lives of the workers in
60 Oil & Gas Development Company Limited

affected operational areas, suspension of business
activities, production limitations, etc. OGDCL is exposed
to such risks particularly in the provinces of KPK and
Balochistan. In this respect, the Company relies on a well
thought-out plan for curbing or neutralizing potential
security threats and collaborates with law enforcement
agencies to deploy security personnel in the sensitive
areas for protection of the workers and operational
facilities.
Competitive RiskWhile award of the exploration licenses is done on a
competitive basis in the Country, OGDCL being a public
sector entity does not enjoy any preferential treatment
or relaxation of any sort in bidding for new exploration
areas. Moving on, the Company may face increased
competition in gaining access to new exploration
licenses and utilization of advance equipment and
technology by the competitors to more efficiently
explore and develop oil and gas fields. To cope up with
this risk, the Company based on its quality asset base,
capable workforce and commitment to utilize innovative
technology and latest production techniques will
continue to compete on merit for acquiring new
concessions and successfully discharge agreed work
commitments as per respective petroleum concession
agreement.
Risk Management Policy and Business Continuity PlanOGDCL’s risk management policy and steps taken to
ensure business continuity are given below:
Risk Management PolicyOGDCL recognizes that an effective system of risk
management and internal control is critical for its
business success. The Company is committed to
managing risks in a manner consistent with the
business practices in order to:
• Protectitspeople,communities,environment,assets
and reputation;
• Ensuregoodgovernanceandlegalcompliance;and
• Enable it to realize opportunities and create long
term shareholder value.
OGDCL’s Board of Directors oversee the risk management
and control framework of the Company to ensure an
appropriate control environment is established and
maintained, spanning business operations, financial
reporting and compliance activities. The Audit and Risk
Management Committees assist the Board in fulfilling
its responsibilities by reviewing and monitoring
financial and reporting matters and the Company’s risk
management and internal control processes.
Management will be responsible for implementation of
this policy through the following:
• FormulationofRiskManagementSOPs;
• Identificationofrisksandrecordingoftheseriskson
risk register;
• Useofappropriateandrelevantriskmanagement
techniques and methodologies to analyze and
quantify risks;
• Determination of mitigation/or action plan for
identified risks;
• Regular assessment of risks by Risk Management
Committee of the Board; and
• Allocationofnecessaryandappropriateresourcesin
support of risk management.
Identification and communication of vulnerabilities and
changes to OGDCL’s risk profile are an integral part of
day-to-day management. In addition, all personnel are
encouraged to identify and manage risks on a continual
basis so as to develop a “risk aware” culture and an
environment of continuous improvement.
Business Continuity Plan OGDCL’s risk management policy ensures business
continuity and sustainability thus endorsing the
business going concern. The objective of risk
management policy is to identify hazards, assess the
risks and implement effective control measures to
prevent or reduce the likelihood of their occurrence to
as low as reasonably practicable. In line with this policy,
the Company has a well-defined and extensive
Emergency Response Procedures in place at all field
locations and operational areas to avoid business
disruptions in worst case scenarios. The Company has
also established a Disaster Recovery Site for ERP
applications at National Telecommunication datacenter,
Islamabad to retrieve the data in the case of catastrophic
consequences. Moreover, strengthening of business
contingency plans through arranging training sessions,
mock exercises and HSEQ awareness events are a regular
feature at the Company.
Annual Report 2016 61

Future OutlookIn the wake of dramatic fall in the oil prices which has
made a massive impact on profitability of the oil and gas
sector resulting in many upstream companies scaling
back their capital expenditures, OGDCL being the
largest E&P Company in Pakistan believes that
maintaining a conservative financial framework and
exercising cost control will be cornerstone of the
business long term strategy to optimize oil and gas
reserves and remain competitive in the market. In
adherence to this, the Company will continue to exploit
its low cost operator status and take advantage of
reduced cost of suppliers and oilfield service companies
to step up its intensified exploratory activities leading
to production enhancement and increase in business
value in the coming years. Going on with its ambitious
exploration plan, the business during the fiscal year
2016-17 will spare no efforts to scale new heights in 2D
and 3D seismic data acquisition coupled with gearing
up processing and reprocessing of the acquired data to
locate new oil and gas reserves and exploit economically
feasible growth opportunities. Moreover, active drilling
campaigns will also remain part of the core business
strategy to replenish and boost the hydrocarbon
reserves base.
On the production front, OGDCL is focused on ramping
up its production operations with the aim to maintain
and enhance oil and gas production from operated
fields and address energy challenges in the Country. To
achieve production growth, the Company will continue
to focus on seamless development of new discoveries in
shortest possible time in tandem with utilizing advance
reservoir management practices and state of the art oil
recovery methods to maximize hydrocarbon recovery
from mature fields. Additionally, workover jobs at wells
and Annual Turn Around of plants will remain part and
parcel of the business strategy to keep production
operations effective. Also, vigorous endeavors will be
made to expedite the activities pertaining to ongoing
development projects, which upon completion in near
future are expected to yield enhancement in crude oil,
gas and LPG production. It is worth mentioning that
exhibition of such efforts during the year under review
led the Company to report; injection of various new
wells in the existing gathering system which are
currently producing 4,150 barrels per day of crude oil
and 43 MMcf per day of gas leading to narrowing down
the impact of natural decline and operational problems
faced at certain fields, completion of phase-II of Sinjhoro
development project and record the largest contribution
of 48% and 28% in the Country’s total oil and natural gas
production respectively.
In order to cope with the suppressed oil price
environment, the Company will continue formulation
of joint ventures with leading E&P companies both
within the Country and abroad to introduce new
partners with complementary skills and ensure ventures
and projects remain value driven. Moving on, the
Company deeming this low oil price trend to continue
for some time will carry on efficient deployment of
capital in all its operational areas and maintain prudent
cost control strategy which will not only contribute in
carrying out exploration, development and production
operations viably and competitively but would also
enable the Company to encounter future business
challenges in a well-organized and proficient manner.
In pursuance to these strategies, OGDCL despite the
uncertain oil price outlook is optimistic that its fast track
exploration activities, solid financial structure and
robust pipeline of ongoing development projects would
lay a strong foundation to reap the long term benefits
of continued business sustainability and return
maximum value to shareholders by embedding highest
safety standards and social responsibility in the core
business operations.
AcknowledgementThe fiscal year 2015-16 posed a great challenge to oil and
gas industry on account of plunge in the international
oil prices. Although, oil prices recovered slightly at end
of the year but were not enough to mark a significant
contribution in the financial results of oil and gas
companies. The takeaway message amid the prevailing
volatility in oil prices is that only those E&P companies
will successfully sustain their business operations
which are able to operate efficiently and smartly.
Resultantly, the Company while exercising vigilance on
costs and driving efficiencies in business operations has
stood up and taken this situation as a challenge to
continue delivering industry leading performance
alongside maximizing shareholders wealth and
bridging the gap between hydrocarbon demand and
supply in the Country. Remaining undeterred in our
62 Oil & Gas Development Company Limited

resolve, we will continue to seek support of all our
stakeholders in service of maintaining the Company’s
balance sheet strength and building a more competitive
OGDCL that can outperform through all industry cycles.
With respect to the steady operational performance
rendered during the year, I am thankful for the trust and
confidence reposed by the shareholders in OGDCL along
with expressing my gratitude to Ministry of Petroleum
and Natural Resources, Ministry of Finance, Directorate
General of Petroleum Concessions and other divisions/
departments of federal and provincial governments for
their firm support and guidance. The Company’s
operational performance also reflects a strong focus on
execution from our employees for which I deeply
acknowledge their remarkable contributions displayed
at all levels. Nevertheless, I am thankful to Board of
Directors for their prudent role and valuable counsel in
steering the business to the path of new glories and
achievements. As we approach the fiscal year 2016-17, I
assure you that we will collectively strive to stay ahead
by continuing to push boundaries in the industry’s new
realities and drive forward our business performance
in a commercially, environmentally and socially
responsible manner.
On behalf of the Board
24 August 2016 (Zahid Muzaffar)
Islamabad Chairman
Annual Report 2016 63

Risks
OGDCL’s core business activities including finding, developing and extracting of oil and gas resources are highly speculative in nature and characterized by inherent uncertainties, geological surprises and complexities which may produce a material impact on the business operational and financial results. A brief of the risks faced by the Company in carrying out exploration, development and production activities are as follows:
• Crudeoilandgasreservesdataareestimatesandactual quantity of recoverable reserves may differ from the estimated proven and probable reserves. This may impact the business reserves estimation, production levels and operational cash flows;
• Strategytomaintainarobustbusinessportfolioanddrive production growth may not be sustainable on a long term basis as the business moving on cannot guarantee maintenance of high drilling success;
• CrudepricesarelinkedtoabasketofMiddleEastcrude oil prices which are calculated taking into account average of Oman, Dubai and Das Blend prices. Fluctuation in these prices can significantly influence the business sales revenue and profit margins;
• CrudeoilandgaspricesaredeterminedinUSdollarsand translated into Pak rupees using exchange rate established by the regulatory authority. Appreciation in the value of Pak rupee against US dollar has a negative bearing on the business earnings and vice versa;
• Operationalactivitiescanexposebusinesstowellblowouts, unplanned plant shutdowns, uncontrollable leaks, oil spills, mechanical failures and adverse weather conditions which may interrupt smooth carrying out of E&P operations;
• Changesinapplicablelawsandregulationspertaining to oil and gas sector may impact the business operational and financial performance; and
• Securityconditioncanadverselyinfluencethebusiness activities causing threat to lives of the workers in affected operational areas, damage to business assets and suspension of exploration, development and production activities.
Opportunities
OGDCL being the market leader in terms of exploration acreage, seismic data acquisition, hydrocarbons reserves and oil and gas production in the Country is committed to carry on and maintain the growth momentum by capturing and exploiting such opportunities which arise in the course of running the business and are deemed financially and commercially feasible. The Company with the aim to ensure sustainability of E&P assets portfolio is focused on the following opportunities:
• Continuefasttrackseismicdataacquisition,swiftprocessing/reprocessing of the seismic data and active drilling campaigns in the business robust exploration portfolio to replenish and increase reserves in the coming years;
• BasedonprevailingenergycrisisintheCountry,carry on fast track exploration, development and production activities and expedite efforts for completion of ongoing development projects to deliver enhanced oil, gas and LPG production while continuing to play a pivotal role in meeting energy demands of the nation;
• Exploitreducedcostofsuppliersandoilfieldservicecompanies, existent due to low oil price era, to embark upon new growth opportunities. This would be potentially beneficial for the business in the longer run especially when the newly discovered reserves are monetized under a high oil price environment;
• Carryonformulationofvaluedrivenjointventureswith leading E&P companies, both within the Country and abroad to introduce new partners with complementary skills and ensure that core business activities are undertaken cost effectively;
• Favorablepricingregimesenablethebusinesstofetch improved prices for sale of the hydrocarbon products which in return positively influence the business financial results;
• Inpursuittothebusinessvision;tobealeadingmultinational exploration and production Company, seek favorable farm-in/farm-out opportunities and acquisition of concessions in domestic and international markets; and
• Locateunconventionalsourcesofenergylikeshalegas and coal bed methane to boost reserves and production base and sustain business long term growth.
Risk and Opportunity Report
64 Oil & Gas Development Company Limited

Review Report to the Members on the Statement of Compliance with the Code of Corporate Governance and Public Sector Companies (Corporate Governance) Rules, 2013
We have reviewed the enclosed Statement of Compliance with the best practices contained in the Code of Corporate Governance and Public Sector Companies (Corporate Governance) Rules, 2013 (both herein referred to as ‘Codes’) prepared by the Board of Directors of Oil and Gas Development Company Limited for the year ended 30 June 2016 to comply with the requirements of Clause No. 5.19.23 of the Pakistan Stock Exchange Limited Regulations where the Company is listed and provisions of Public Sector Companies (Corporate Governance) Rules, 2013.
The responsibility for compliance with the Codes is that of the Board of Directors of the Company. Our responsibility is to review, to the extent where such compliance can be objectively verified, whether the Statement of Compliance reflects the status of the Company’s compliance with the provisions of the Codes and report if it does not and to highlight any non-compliance with the requirements of the Codes. A review is limited primarily to inquiries of the Company’s personnel and review of various documents prepared by the Company to comply with the Codes.
As a part of our audit of the financial statements we are required to obtain an understanding of the accounting and internal control systems sufficient to plan the audit and develop an effective audit approach. We are not required to consider whether the Board of Directors’ statement on internal control covers all risks and controls or to form an opinion on the effectiveness of such internal controls, the Company’s corporate governance procedures and risks.
The Codes require the Company to place before the Audit Committee, and upon recommendation of the Audit Committee, place before the Board of Directors for their review and approval its related party transactions distinguishing between transactions carried out on terms equivalent to those that prevail in arm’s length transactions and transactions which are not executed at arm’s length price and recording proper justification for using such alternate pricing mechanism. We are only required and have ensured compliance of this requirement to the extent of the approval of the related party transactions by the Board of Directors upon recommendation of the Audit Committee. We have not carried out any procedures to determine whether the related party transactions were undertaken at arm’s length price or not.
Based on our review, nothing has come to our attention, which causes us to believe that the ‘Statement of Compliance’ does not appropriately reflect the Company’s compliance, in all material aspects, with the best practices contained in the Codes as applicable to the Company for the year ended 30 June 2016.
A. F. Ferguson & Co. KPMG Taseer Hadi & Co.Chartered Accountants Chartered AccountantsIslamabad Islamabad
24 August 2016 24 August 2016Engagement Partner: Asim Masood Iqbal Engagement Partner: Syed Bakhtiyar Kazmi
Annual Report 2016 65

SCHEDULE I[See paragraph 2(1)]
I. This statement is being presented to comply with Code of Corporate Governance (“CCG”) contained in the Clause No. 5.19.23 of Pakistan Stock Exchange Limited Regulations and Public Sector Companies (Corporate Governance) Rules, 2013 (hereinafter called “the Codes”) issued for the purpose of establishing a framework of good governance, whereby a public sector company is managed in compliance with the best practices of public sector governance. In case where there is inconsistency with the CCG, the provisions of Public Sector Companies (Corporate Governance) Rules, 2013 (“Rules”) shall prevail.
II. The Company has complied with the provisions of the Codes in the following manner:
Sr. No.
Provision of the RulesRule No.
Y N Remarks
Tick the relevant box
1. The independent directors meet the criteria of independence as defined under the Rules.
2(d) ü
2. The Board has the requisite percentage of independent directors.
At 30 June 2016 the Board includes:
Category NamesDate of
appointment
Independent Directors
üMr. Zahid MuzaffarüMr. Iskander Mohammed KhanüMr. Muhammad Ali Tabbaü Sayed Shafqat Ali ShahüMr. Rahmat Salam KhattaküMr. Hamid FarooqüMr. Zafar Masudü Prince Ahmed Omar AhmedzaiüMr. Muhammad Yawar Irfan Khan
24.10.1424.10.1424.10.1424.10.1424.10.1424.10.1424.10.1424.10.1424.10.14
Executive Director
üMr. Zahid Mir 15.04.15
Non-Executive Directors
üMr. Saif Ullah ChatthaüMr. Arshad Mirza(All Independent Directors are also Non-Executive Directors)
24.10.1413.04.15
3 (2) ü
3. All casual vacancies occurring on the Board were filled up by the Directors within 90 days.
3(4) Not applicable. No casual vacancies occurred
during the year.
4. The Directors have confirmed that none of them is serving as a Director on more than five public sector companies and listed companies simultaneously, except their subsidiaries.
3(5) ü
5. The appointing authorities have applied the fit and proper criteria given in the Annexure to the Rules in making nominations of the persons for election as board members under the provisions of the Ordinance. All the nominations on the Board of Directors have been made by the Government of Pakistan (GoP).
3(7) All the nominations on the Board of Directors are made by
the GoP.
6. The Chairman of the Board is working separately from the Chief Executive of the Company.
4(1) ü
7. The Chairman has been elected from amongst the Independent Directors. 4(4) ü
Statement of Compliancewith the Code of Corporate Governance and Public Sector Companies (Corporate Governance) Rules, 2013
66 Oil & Gas Development Company Limited

Sr. No.
Provision of the RulesRule No.
Y N Remarks
Tick the relevant box
8. The Board has evaluated the candidates for the position of the Chief Executive on the basis of the fit and proper criteria as well as the guidelines specified by the Commission.
5(2) ü During the year ended
30 June 2015, acting
charge of CEO
was given to Chief
Operating Officer.
However, the process to evaluate
the candidates
for the position of the Chief Executive
on the basis of the fit
and proper criteria as well as the guidelines specified
by the Commission
is in process.
9. (a) The Company has prepared a “Code of Conduct” and has ensured that appropriate steps have been taken to disseminate it throughout the Company along with its supporting policies and procedures, including posting the same on the Company’s website (www.ogdcl.com).
(b) The Board has set in place adequate systems and controls for the identification and redressal of grievances arising from unethical practices.
5(4) ü
ü
10. The Board has established a system of sound internal control to ensure compliance with the fundamental principles of probity and propriety; objectivity, integrity and honesty; and relationship with the stakeholders, in the manner prescribed in the Rules.
5(5) ü
11. The Board has developed and enforced an appropriate conflict of interest policy to lay down circumstances or considerations when a person may be deemed to have actual or potential conflict of interests and the procedure for disclosing such interests.
5(5)(b)(ii)
ü
12. The Board has developed and implemented a policy on anti-corruption to minimize actual or perceived corruption in the Company.
5(5)(b)(vi)
ü
13. (a) The Board has ensured equality of opportunity by establishing open and fair procedures for making appointments and for determining terms and conditions of service.
(b) A Committee has been formed to investigate deviations from the Company’s Code of Conduct.
5(5)(c)(iii)
5(4)&5(5)(c) (ii)
ü
The Company
has its own service
regulation and cases of misconduct or discipline are governed
Annual Report 2016 67

Sr. No.
Provision of the RulesRule No.
Y N Remarks
Tick the relevant box
as per the procedure
given in the regulations.
These regulations
have statutory
protection. Committees are formed depending
on the nature and subject
matter of the issue involved.
14. The Board has ensured compliance with the law as well as the Company’s internal rules and procedures relating to public procurement, tender regulations and purchasing and technical standards, when dealing with suppliers of goods and services.
5(5)(c)(iii)
ü
15. The Board has developed a vision or mission statement, corporate strategy and significant policies of the Company. A complete record of particulars of significant policies along with the dates on which they were approved or amended has been maintained.
5(6) ü
16. The Board has quantified the outlay of any action in respect of any service delivered or goods sold by the Company as a public service obligation and has submitted its request for appropriate compensation to the Government for consideration.
5(8) None
17. (a) The Board has met at least four times during the year.
(b) Written notices of the Board meetings, along with agenda and working papers, were circulated at least seven days before the meetings.
(c) The minutes of the meetings were appropriately recorded and circulated.
6(1)
6(2)
6(3)
ü
ü
ü
18. The Board has carried out performance evaluation of its members, including the Chairman and the Chief Executive, on the basis of a process, based on specified criteria, developed by it. The Board has also monitored and assessed the performance of senior management on annual basis.
8 ü The Board has developed
a self evaluation
mechanism. Annual
review of the Board, its
Committees, members, Chairman
and Managing
Director was conducted.
Performance evaluation
was discussed
and concluded in the meeting held on 24
August 2016.
19. The Board has reviewed and approved the related party transactions placed before it after recommendations of the Audit Committee. A party wise record of transactions entered into with the related parties during the year has been maintained
9 ü
68 Oil & Gas Development Company Limited

Sr. No.
Provision of the RulesRule No.
Y N Remarks
Tick the relevant box
20. The Board has approved the profit and loss account for, and balance sheet as at the end of, the first, second and third quarter of the year as well as the financial year end, and has placed the annual financial statements on the Company’s website. Monthly accounts were also prepared and circulated amongst the Board members.
10 ü
21. All the Board members underwent an orientation course arranged by the Company to appraise them of material developments and information as specified in the Rules.
11 ü As required under the Rule 11, during
the year Company
arranged an orientation course for
all of its Directors
which was attended
by six Directors.
During the year ended
30 June 2015, all Directors
underwent an
orientation course.
22. (a) The Board has formed the requisite committees, as specified in the Rules.
(b) The Committees were provided with written term of reference defining their duties, authority and composition.
(c) The minutes of the meetings of the Committees were circulated to all the Board members.
(d) The Committees were chaired by the following Non-Executive Directors:
Committee No. of Members
Name of Chair
Audit Committee 5 Mr. Iskander Mohammed Khan
Risk Management Committee
5 Mr. Zafar Masud
Human Resource & Nomination Committee
6 Mr. Saif Ullah Chattha
Procurement, Operations & Finance Committee
5 Mr. Rehmat Salam Khattak
Corporate Social Responsibilities (CSR) Committee
5 Prince Ahmed Omar Ahmedzai
12 ü
ü
ü
ü
23. The Board has approved appointment of Chief Financial Officer, Company Secretary and Chief Internal Auditor, with their remuneration and terms and conditions of employment, and as per their prescribed qualifications.
13/14 ü
24. The Company has adopted International Financial Reporting Standards notified by the Commission under clause (i) of sub-section (3) of section 234 of the Ordinance.
16 ü
Annual Report 2016 69

Sr. No.
Provision of the RulesRule No.
Y N Remarks
Tick the relevant box
25. The Directors’ Report for this year has been prepared in compliance with the requirements of the Ordinance and the Rules and fully describes the salient matters required to be disclosed.
17 ü
26. The Directors, CEO and Executives do not hold any interest in the shares of the Company other than that disclosed in the pattern of shareholding.
18 ü
27. A formal and transparent procedure for fixing the remuneration packages of individual directors, who only includes one Executive Director, has been set in place. The criteria and details of remuneration of such director is adequately disclosed in Annual Report.
19 ü
28. The financial statements of the Company were duly endorsed by the Chief Executive and Chief Financial Officer before approval of the Board.
20 ü
29. The Board has formed an Audit Committee, with defined and written terms of reference, and having the following members as at 30 June 2016:
Name of Member Category Professional background
Mr. Iskander Mohammed Khan
Independent Director
Chartered Accountant
Mr. Saif Ullah Chattha
Non-Executive Director
Government Service
Mr. Mohammed Ali Tabba
Independent Director
Business Executive
Mr. Hamid Farooq Independent Director
Business Executive
Prince Ahmed Omar Ahmedzai
Independent Director
Business Executive
The Chief Executive and Chairman of the Board are not members of the Audit Committee.
21 ü
30. The Board has set up an effective internal audit function, which has an audit charter, duly approved by the Audit Committee and which worked in accordance with the applicable standards.
22 ü
31. The Company has appointed its external auditors in line with the requirements envisaged under the Rules.
23 ü
32. The external joint auditors of the Company have confirmed that the firm and all its partners are in compliance with International Federation of Accountants (IFAC) guidelines on Code of Ethics as applicable in Pakistan.
23(4) ü
33. The external joint auditors have not been appointed to provide non-audit services except that one of the joint auditors provides Taxation Services to the Company and the joint auditors have confirmed that they have observed applicable guidelines issued by IFAC in this regard.
23(5) ü
34. The Company has complied with all the corporate and financial reporting requirements of the Rules.
ü
70 Oil & Gas Development Company Limited

Certain additional disclosures as required under Code of Corporate Governance (CCG) 2012
• All the resident Directors of the Company are registered as tax payers and none of them has defaulted in payment of any loan to a banking company, a DFI or an NBFI or, being a member of a stock exchange, has been declared as a defaulter by that stock exchange.
• All the powers of the Board have been duly exercised and decisions on material transactions including appointment and determination of remuneration and terms and conditions of employment of the CEO, other Executive and Non-Executive Directors have been taken by the Board/shareholders.
• Two Directors of the Company have obtained certification as required under Code of Corporate Governance (CCG) during the year.
• The meetings of the Audit Committee were held at least once every quarter prior to approval of interim and final results of the Company and as required by the CCG. The terms of reference of the Committee have been formed and advised to the Committee for compliance.
• The ‘closed period’, prior to the announcement of interim/final results, and business decisions, which may materially affect the market price of the Company’s securities was determined and intimated to Directors, employees and stock exchange(s).
• Material/price sensitive information has been disseminated among all market participants at once through stock exchange(s).
(Zahid Mir) (Zahid Muzaffar)Chief Executive Officer Chairman
24 August 2016Islamabad
Annual Report 2016 71

Auditors’ Report to the MembersWe have audited the annexed Balance Sheet of Oil and Gas Development Company Limited (“the Company”) as at 30 June 2016 and the related Profit and Loss Account, Statement of Comprehensive Income, Cash Flow Statement and Statement of Changes in Equity together with the Notes forming part thereof, for the year then ended and we state that we have obtained all the information and explanations which, to the best of our knowledge and belief, were necessary for the purposes of our audit. It is the responsibility of the Company’s Management to establish and maintain a system of internal control, and prepare and present the above said statements in conformity with the approved accounting standards and the requirements of the Companies Ordinance, 1984. Our responsibility is to express an opinion on these statements based on our audit. We conducted our audit in accordance with the auditing standards as applicable in Pakistan. These standards require that we plan and perform the audit to obtain reasonable assurance about whether the above said statements are free of any material misstatement. An audit includes examining on a test basis, evidence supporting the amounts and disclosures in the above said statements. An audit also includes assessing the accounting policies and significant estimates made by management, as well as, evaluating the overall presentation of the above said statements. We believe that our audit provides a reasonable basis for our opinion and, after due verification, we report that: (a) in our opinion, proper books of account have been kept by the Company as required by the Companies
Ordinance, 1984; (b) in our opinion -
(i) the Balance Sheet and Profit and Loss Account together with the Notes thereon have been drawn up in conformity with the Companies Ordinance, 1984, and are in agreement with the books of account and are further in accordance with accounting policies consistently applied, except for the changes as stated in Note 3 to the financial statements with which we concur;
(ii) the expenditure incurred during the year was for the purpose of the Company’s business; and (iii) the business conducted, investments made and the expenditure incurred during the year were
in accordance with the objects of the Company. (c) in our opinion and to the best of our information and according to the explanations given to us, the
Balance Sheet, Profit and Loss Account, Statement of Comprehensive Income, Cash Flow Statement and Statement of Changes in Equity together with the Notes forming part thereof conform with the approved accounting standards as applicable in Pakistan, and give the information required by the Companies Ordinance, 1984, in the manner so required and respectively give a true and fair view of the state of the Company’s affairs as at 30 June 2016 and of the profit, total comprehensive income, its cash flows and changes in equity for the year then ended; and
(d) in our opinion, zakat deductible at source under the Zakat and Ushr Ordinance, 1980 (XVIII of
1980) was deducted by the Company and deposited in the Central Zakat Fund established under section 7 of that Ordinance.
A. F. Ferguson & Co. KPMG Taseer Hadi & Co.Chartered Accountants Chartered AccountantsIslamabad Islamabad
24 August 2016 24 August 2016Engagement Partner: Asim Masood Iqbal Engagement Partner: Syed Bakhtiyar Kazmi
72 Oil & Gas Development Company Limited

Financial Statements

2016 2015 2016 2015
Note --------------(Rupees ‘000)------------- Note -------------(Rupees ‘000)-----------
SHARE CAPITAL AND RESERVES NON CURRENT ASSETS
Fixed assets
Share capital 4 43,009,284 43,009,284 Property, plant and equipment 11 120,542,404 109,983,739
Development and production assets - intangible 12 87,990,960 78,260,687
Reserves 5 10,529,373 7,456,000 Exploration and evaluation assets 13 6,834,078 8,139,436
215,367,442 196,383,862
Unappropriated profit 425,093,910 392,055,684 Long term investments 14 112,517,292 131,193,328
478,632,567 442,520,968 Long term loans and receivable 15 5,997,669 5,932,606
Long term prepayments 882,466 502,972
334,764,869 334,012,768
NON CURRENT LIABILITIES CURRENT ASSETS
Deferred taxation 6 15,579,499 16,606,840 Stores, spare parts and loose tools 16 18,251,184 16,847,032
Deferred employee benefits 7 14,971,638 12,457,915 Stock in trade 291,904 317,476
Provision for decommissioning cost 8 21,412,687 20,303,619 Trade debts 17 111,204,186 121,411,485
51,963,824 49,368,374 Loans and advances 18 10,459,609 8,043,768
Deposits and short term prepayments 19 1,646,777 1,414,433
Interest accrued 21,085,027 14,433,563
Other receivables 20 182,211 183,825
Income tax - advance 21 41,599,042 24,059,740
Current maturity of term finance certificates 14.2 30,750,000 10,250,000
CURRENT LIABILITIES Other financial assets 22 11,426,964 9,814,481
Trade and other payables 9 58,969,148 61,901,977 Cash and bank balances 23 7,903,766 13,002,748
254,800,670 219,778,551
589,565,539 553,791,319 589,565,539 553,791,319
CONTINGENCIES AND COMMITMENTS 10
The annexed notes 1 to 45 form an integral part of these financial statements.
Chief Executive
Balance SheetAs at 30 June 2016
74 Oil & Gas Development Company Limited

2016 2015 2016 2015
Note --------------(Rupees ‘000)------------- Note -------------(Rupees ‘000)-----------
SHARE CAPITAL AND RESERVES NON CURRENT ASSETS
Fixed assets
Share capital 4 43,009,284 43,009,284 Property, plant and equipment 11 120,542,404 109,983,739
Development and production assets - intangible 12 87,990,960 78,260,687
Reserves 5 10,529,373 7,456,000 Exploration and evaluation assets 13 6,834,078 8,139,436
215,367,442 196,383,862
Unappropriated profit 425,093,910 392,055,684 Long term investments 14 112,517,292 131,193,328
478,632,567 442,520,968 Long term loans and receivable 15 5,997,669 5,932,606
Long term prepayments 882,466 502,972
334,764,869 334,012,768
NON CURRENT LIABILITIES CURRENT ASSETS
Deferred taxation 6 15,579,499 16,606,840 Stores, spare parts and loose tools 16 18,251,184 16,847,032
Deferred employee benefits 7 14,971,638 12,457,915 Stock in trade 291,904 317,476
Provision for decommissioning cost 8 21,412,687 20,303,619 Trade debts 17 111,204,186 121,411,485
51,963,824 49,368,374 Loans and advances 18 10,459,609 8,043,768
Deposits and short term prepayments 19 1,646,777 1,414,433
Interest accrued 21,085,027 14,433,563
Other receivables 20 182,211 183,825
Income tax - advance 21 41,599,042 24,059,740
Current maturity of term finance certificates 14.2 30,750,000 10,250,000
CURRENT LIABILITIES Other financial assets 22 11,426,964 9,814,481
Trade and other payables 9 58,969,148 61,901,977 Cash and bank balances 23 7,903,766 13,002,748
254,800,670 219,778,551
589,565,539 553,791,319 589,565,539 553,791,319
CONTINGENCIES AND COMMITMENTS 10
The annexed notes 1 to 45 form an integral part of these financial statements.
Director
Annual Report 2016 75

2016 2015
Note -------------(Rupees ‘000)-------------
Sales - net 24 162,866,578 210,624,908
Royalty (18,078,772) (23,736,702)
Operating expenses 25 (54,986,250) (52,935,481)
Transportation charges (1,912,017) (1,985,814)
(74,977,039) (78,657,997)
Gross profit 87,889,539 131,966,911
Other income 26 14,702,971 19,186,191
Exploration and prospecting expenditure 27 (14,548,295) (11,627,518)
General and administration expenses 28 (3,770,607) (4,308,255)
Finance cost 29 (1,717,889) (2,550,067)
Workers' profit participation fund (4,237,231) (6,685,550)
Share of profit in associate - net of taxation 14.1 2,188,899 1,043,741
Profit before taxation 80,507,387 127,025,453
Taxation 30 (20,536,585) (39,776,421)
Profit for the year 59,970,802 87,249,032
Earnings per share - basic and diluted (Rupees) 31 13.94 20.29
The annexed notes 1 to 45 form an integral part of these financial statements.
DirectorChief Executive
Profit and Loss AccountFor the year ended 30 June 2016
76 Oil & Gas Development Company Limited

2016 2015
--------------(Rupees ‘000)--------------
Profit for the year 59,970,802 87,249,032
Other comprehensive income/(loss) for the year
Items that will not be reclassified to profit or loss:
Remeasurement loss on employee retirement benefit plans (7,652,528) (1,239,809)
Current tax credit related to remeasurement loss on employee
retirement benefit plans 4,026,760 624,129
Share of other comprehensive loss of the associate - net of taxation (17,125) -
(3,642,893) (615,680)
Total comprehensive income for the year 56,327,909 86,633,352
The annexed notes 1 to 45 form an integral part of these financial statements.
DirectorChief Executive
Statement of Comprehensive Income For the year ended 30 June 2016
Annual Report 2016 77

2016 2015 Note --------------(Rupees ‘000)--------------
Cash flows from operating activitiesProfit before taxation 80,507,387 127,025,453 Adjustments for:
Depreciation 7,098,893 5,723,600 Amortization of development and production assets 15,266,568 16,281,337 Impairment on assets 1,886,551 2,611,044 Royalty 18,078,772 23,736,702 Workers' profit participation fund 4,237,231 6,685,550 Provision for employee benefits 2,932,900 5,083,172 Un-winding of discount on provision for decommissioning cost 1,700,742 2,536,838 Interest income (12,920,657) (16,923,990)Un-realized gain on investments at fair value through profit or loss (6,356) (13,893)Dividend income (19,296) (18,615)Gain on disposal of property, plant and equipment (60,458) (18,320)Provision for slow moving, obsolete and in transit stores 163,178 237,427 Share of profit in associate (2,188,899) (1,043,741)Stores inventory written off 3,814 9,031
116,680,370 171,911,595 Changes in:
Stores, spare parts and loose tools (1,571,144) 1,409,432 Stock in trade 25,572 103,150 Trade debts 10,207,299 (20,900,490)Deposits and prepayments (611,838) 155,825 Advances and other receivables (2,479,290) (765,878)Trade and other payables (1,905,586) 15,284,139
Cash generated from operations 120,345,383 167,197,773
Royalty paid (19,338,668) (25,007,688)Employee benefits paid (3,390,389) (13,967,782)Payment from self insurance reserve (1,946) - (Payments to)/receipt from workers' profit participation fund (6,685,550) 346,775 Income taxes paid (35,076,467) (54,556,568)
(64,493,020) (93,185,263)Net cash from operating activities 55,852,363 74,012,510
Cash flows from investing activitiesCapital expenditure (42,313,524) (66,317,675)Interest received 6,960,084 13,093,552 Dividends received 199,058 36,990 Purchase of investments (522,843) (517,129)Proceeds from disposal of property, plant and equipment 91,112 56,442
Net cash used in investing activities (35,586,113) (53,647,820)
Cash flows from financing activitiesDividends paid (23,759,105) (37,950,811)
Net cash used in financing activities (23,759,105) (37,950,811)
Net decrease in cash and cash equivalents (3,492,855) (17,586,121)Cash and cash equivalents at beginning of the year 22,527,785 40,113,906 Cash and cash equivalents at end of the year 34 19,034,930 22,527,785
The annexed notes 1 to 45 form an integral part of these financial statements.
DirectorChief Executive
Cash Flow StatementFor the year ended 30 June 2016
78 Oil & Gas Development Company Limited
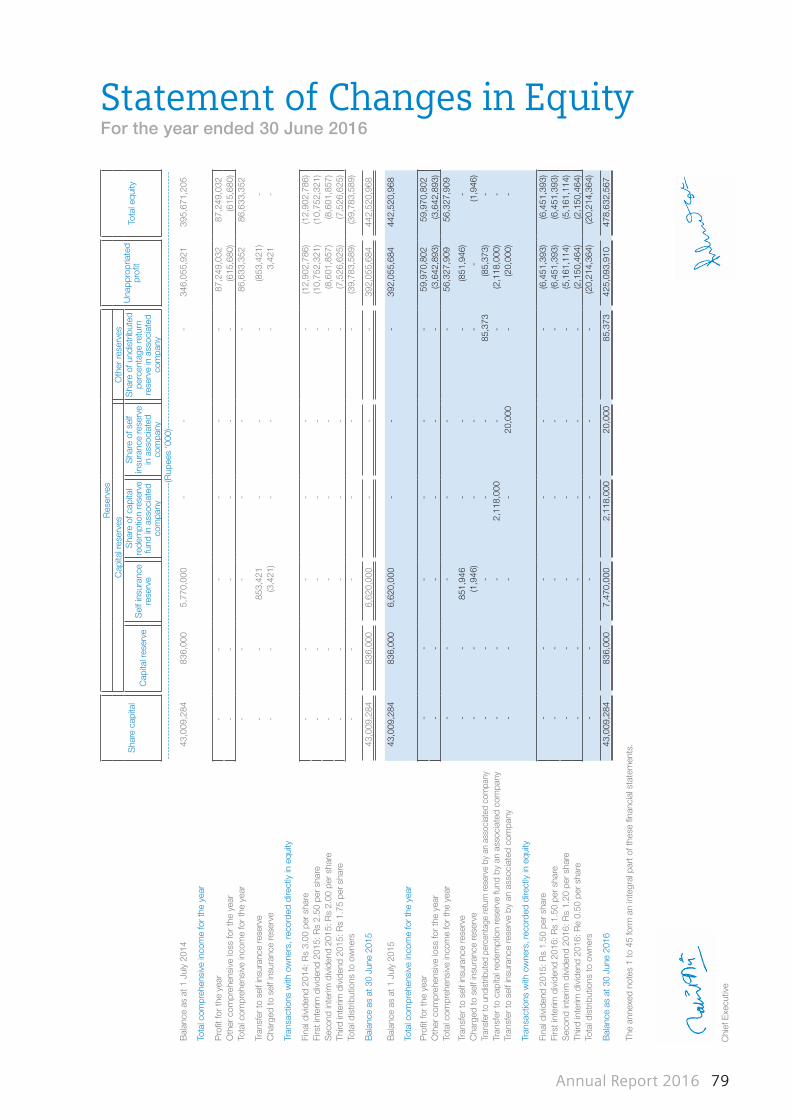
Dire
ctor
Chi
ef E
xecu
tive
Sha
re c
apita
l
Res
erve
s
Una
ppro
pria
ted
profi
tTo
tal e
quity
Cap
ital r
eser
ves
Oth
er re
serv
es
Cap
ital r
eser
veS
elf i
nsur
ance
re
serv
e
Sha
re o
f cap
ital
rede
mpt
ion
rese
rve
fund
in a
ssoc
iate
d co
mpa
ny
Sha
re o
f sel
f in
sura
nce
rese
rve
in a
ssoc
iate
d co
mpa
ny
Sha
re o
f und
istr
ibut
ed
perc
enta
ge re
turn
re
serv
e in
ass
ocia
ted
com
pany
----
----
----
----
----
----
----
----
----
----
----
----
----
----
----
----
----
----
----
----
----
(Rup
ees
‘000
)---
----
----
----
----
----
----
----
----
----
----
----
----
----
----
----
----
----
----
---
Bal
ance
as
at 1
Jul
y 20
14 4
3,00
9,28
4 8
36,0
00
5,7
70,0
00
-
-
-
346
,055
,921
3
95,6
71,2
05
Tota
l com
preh
ensi
ve in
com
e fo
r th
e ye
ar
Pro
fit fo
r th
e ye
ar -
-
-
-
-
-
8
7,24
9,03
2 8
7,24
9,03
2 O
ther
com
preh
ensi
ve lo
ss fo
r th
e ye
ar -
-
-
-
-
-
(6
15,6
80)
(615
,680
)To
tal c
ompr
ehen
sive
inco
me
for
the
year
-
-
-
-
-
-
86,
633,
352
86,
633,
352
Tran
sfer
to s
elf i
nsur
ance
rese
rve
-
-
853
,421
-
-
-
(8
53,4
21)
-
Cha
rged
to s
elf i
nsur
ance
rese
rve
-
-
(3,4
21)
-
-
-
3,4
21
-
Tran
sact
ions
with
ow
ners
, rec
orde
d di
rect
ly in
equ
ity
Fina
l div
iden
d 20
14: R
s 3.
00 p
er s
hare
-
-
-
-
-
-
(12,
902,
786)
(12,
902,
786)
Firs
t int
erim
div
iden
d 20
15: R
s 2.
50 p
er s
hare
-
-
-
-
-
-
(10,
752,
321)
(10,
752,
321)
Sec
ond
inte
rim d
ivid
end
2015
: Rs
2.00
per
sha
re -
-
-
-
-
-
(8
,601
,857
) (8
,601
,857
)Th
ird in
terim
div
iden
d 20
15: R
s 1.
75 p
er s
hare
-
-
-
-
-
-
(7,5
26,6
25)
(7,5
26,6
25)
Tota
l dis
trib
utio
ns to
ow
ners
-
-
-
-
-
-
(39,
783,
589)
(39,
783,
589)
Bal
ance
as
at 3
0 Ju
ne 2
015
43,
009,
284
836
,000
6
,620
,000
-
-
-
3
92,0
55,6
84
442
,520
,968
Bal
ance
as
at 1
Jul
y 20
15 4
3,00
9,28
4 8
36,0
00
6,6
20,0
00
-
-
-
392
,055
,684
4
42,5
20,9
68
Tota
l com
preh
ensi
ve in
com
e fo
r th
e ye
ar
Pro
fit fo
r th
e ye
ar -
-
-
-
-
-
5
9,97
0,80
2 5
9,97
0,80
2 O
ther
com
preh
ensi
ve lo
ss fo
r th
e ye
ar -
-
-
-
-
-
(3
,642
,893
) (3
,642
,893
)To
tal c
ompr
ehen
sive
inco
me
for
the
year
-
-
-
-
-
-
56,
327,
909
56,
327,
909
Tran
sfer
to s
elf i
nsur
ance
rese
rve
-
-
851
,946
-
-
-
(8
51,9
46)
-
Cha
rged
to s
elf i
nsur
ance
rese
rve
-
-
(1,9
46)
-
-
-
-
(1,9
46)
Tran
sfer
to u
ndis
tribu
ted
perc
enta
ge re
turn
rese
rve
by a
n as
soci
ated
com
pany
-
-
-
-
-
85,
373
(85,
373)
-
Tran
sfer
to c
apita
l red
empt
ion
rese
rve
fund
by
an a
ssoc
iate
d co
mpa
ny -
-
-
2
,118
,000
-
-
(2
,118
,000
) -
Tr
ansf
er to
sel
f ins
uran
ce re
serv
e by
an
asso
ciat
ed c
ompa
ny -
-
-
-
2
0,00
0 -
(2
0,00
0) -
Tran
sact
ions
with
ow
ners
, rec
orde
d di
rect
ly in
equ
ity
Fina
l div
iden
d 20
15: R
s 1.
50 p
er s
hare
-
-
-
-
-
-
(6,4
51,3
93)
(6,4
51,3
93)
Firs
t int
erim
div
iden
d 20
16: R
s 1.
50 p
er s
hare
-
-
-
-
-
-
(6,4
51,3
93)
(6,4
51,3
93)
Sec
ond
inte
rim d
ivid
end
2016
: Rs
1.20
per
sha
re -
-
-
-
-
-
(5
,161
,114
) (5
,161
,114
)Th
ird in
terim
div
iden
d 20
16: R
e 0.
50 p
er s
hare
-
-
-
-
-
-
(2,1
50,4
64)
(2,1
50,4
64)
Tota
l dis
trib
utio
ns to
ow
ners
-
-
-
-
-
-
(20,
214,
364)
(20,
214,
364)
Bal
ance
as
at 3
0 Ju
ne 2
016
43,
009,
284
836
,000
7
,470
,000
2
,118
,000
2
0,00
0 8
5,37
3 4
25,0
93,9
10
478
,632
,567
The
anne
xed
note
s 1
to 4
5 fo
rm a
n in
tegr
al p
art o
f the
se fi
nanc
ial s
tate
men
ts.
Statement of Changes in EquityFor the year ended 30 June 2016
Annual Report 2016 79

Notes to and Forming Part of the Financial StatementsFor the year ended 30 June 2016
1 LEGAL STATUS AND OPERATIONS
Oil and Gas Development Company Limited (OGDCL), ‘the Company’, was incorporated on 23 October 1997 under the Companies Ordinance, 1984. The Company was established to undertake exploration and development of oil and gas resources, including production and sale of oil and gas and related activities formerly carried on by Oil and Gas Development Corporation, which was established in 1961. The registered office of the Company is located at OGDCL House, Plot No. 3, F-6/G-6, Blue Area, Islamabad, Pakistan. Previously, the shares of the Company were quoted on Karachi, Lahore and Islamabad stock exchanges of Pakistan. However, due to integration of these stock exchanges into Pakistan Stock Exchange effective 11 January 2016, the shares of the Company are now quoted on Pakistan Stock Exchange Limited. The Global Depository Shares (1GDS = 10 ordinary shares of the Company) of the Company are listed on the London Stock Exchange.
2 BASIS OF PREPARATION
2.1 STATEMENT OF COMPLIANCE
These financial statements have been prepared in accordance with the approved accounting standards as applicable in Pakistan. Approved accounting standards comprise of such International Financial Reporting Standards (IFRS) issued by the International Accounting Standards Board as are notified under the Companies Ordinance, 1984, provisions of and directives issued under the Companies Ordinance, 1984. In case requirements differ, the provisions or directives of the Companies Ordinance, 1984, shall prevail.
2.2 BASIS OF MEASUREMENT
These financial statements have been prepared on the historical cost basis except for the following material items in the balance sheet;
- obligation under certain employee benefits and provision for decommissioning cost have been measured at present value; and
- investments at fair value through profit or loss have been measured at fair value.
The methods used to measure fair values are described further in their respective policy notes.
2.3 FUNCTIONAL AND PRESENTATION CURRENCY
These financial statements are presented in Pakistan Rupee (PKR) which is the Company’s functional currency.
2.4 SIGNIFICANT ACCOUNTING ESTIMATES
The preparation of these financial statements in conformity with the approved accounting standards requires management to make judgments, estimates and assumptions that affect the application of policies and reported amounts of assets and liabilities, income and expenses. The estimates and associated assumptions are based on historical experience and various other factors that are believed to be reasonable under the circumstances, the results of which form the basis of making judgment about carrying value of assets and liabilities that are not readily apparent from other sources. Actual results may differ from these estimates.
The estimates and underlying assumptions are reviewed on an ongoing basis. Revisions to accounting estimates are recognized in the period in which estimates are revised if the revision affects only that year, or in the year of the revision and any future year affected.
In the process of applying the Company’s accounting policies, the management has made the following estimates, assumptions and judgments which are significant to these financial statements:
2.4.1 Property, plant and equipment
The Company reviews the useful lives and residual values of property, plant and equipment on the reporting date. Any change in the estimates in future years might affect the carrying amounts of the respective items of property, plant and equipment with a corresponding effect on the depreciation charge and impairment.
80 Oil & Gas Development Company Limited

Notes to and Forming Part of the Financial StatementsFor the year ended 30 June 2016
2.4.2 Exploration and evaluation expenditure
The Company’s accounting policy for exploration and evaluation expenditure results in certain items of expenditure being capitalized for an area of interest where it is considered likely to be recoverable by future exploration or sale or where the activities have not reached a stage which permits a reasonable assessment of the existence of reserves. This policy requires management to make certain estimates and assumptions as to future events and circumstances, in particular whether an economically viable extraction operation can be established. Any such estimates and assumptions may change as new information becomes available. If, after having capitalized the expenditure under the policy, a judgment is made that recovery of the expenditure is unlikely, the relevant capitalized amount is written off to the profit and loss account.
2.4.3 Development and production expenditure
Development and production activities commence after project sanctioning by the appropriate level of management. Judgment is applied by the management in determining when a project is economically viable. In exercising this judgment, management is required to make certain estimates and assumptions similar to those described above for capitalized exploration and evaluation expenditure. Any such estimates and assumptions may change as new information becomes available. If, after having commenced development activity, a judgment is made that a development and production asset is impaired, the appropriate amount is written off to the profit and loss account.
2.4.4 Estimation of oil and natural gas reserves
Oil and gas reserves are an important element in impairment testing for development and production assets of the Company. Estimates of oil and natural gas reserves are inherently imprecise, require the application of judgment and are subject to future revision. Proved reserves are estimated with reference to available reservoir and well information, including production and pressure trends for producing reservoirs and, in some cases, subject to definitional limits, to similar data from other producing reservoirs. All proved reserve estimates are subject to revision, either upward or downward, based on new information, such as from development drilling and production activities or from changes in economic factors, including product prices, contract terms or development plans.
Changes to the estimates of proved developed reserves, affect the amount of amortization recorded and impairment, if any, in the financial statements for fixed assets related to hydrocarbon production activities.
2.4.5 Provision for decommissioning cost
Provision is recognized for the future decommissioning and restoration cost of oil and gas wells, production facilities and pipelines at the end of their economic lives. The timing of recognition requires the application of judgment to existing facts and circumstances, which can be subject to change. Estimates of the amount of provision recognized are based on current legal and constructive requirements, technology and price levels. Provision is based on the best estimates, however, the actual outflows can differ from estimated cash outflows due to changes in laws, regulations, public expectations, technology, prices and conditions, and can take place many years in the future. The carrying amount of provision is reviewed annually and adjusted to take account of such changes.
During the year, the Company revised its estimates of well cost, discount and inflation rates. This has been treated as change in accounting estimates, applied prospectively, in accordance with IFRIC Interpretation 1, ‘Changes in Existing Decommissioning, Restoration and Similar Liabilities’.
Following line items would have been effected had there been no change in estimates:
Rupees in million Provision for decommissioning cost would have been higher by 1,693 Property, plant and equipment would have been lower by 206 Development and production assets would have been higher by 1,899 Amortization charge would have been higher by 1,394 Total comprehensive income would have been lower by 931
Annual Report 2016 81

Notes to and Forming Part of the Financial StatementsFor the year ended 30 June 2016
2.4.6 Employee benefits
Defined benefit plans are provided for permanent employees of the Company. The employees pension plan is structured as separate legal entity managed by trustees. The Company recognizes deferred liability for post retirement medical benefits, accumulating compensated absences and gratuity fund. These calculations require assumptions to be made of future outcomes, the principal ones being in respect of increases in remuneration and pension benefit levels, medical benefit rate and the discount rate used to convert future cash flows to current values. The assumptions used vary for the different plans as they are determined by independent actuaries annually.
Pension or service cost primarily represents the increase in actuarial present value of the obligation for benefits earned on employees service during the year and the interest on the net liability/(asset) in respect of employee’s service in previous years. Calculations are sensitive to changes in the underlying assumptions.
2.4.7 Taxation
The Company takes into account the current income tax laws and decisions taken by appellate authorities. Instances where the Company’s view differs from the view taken by the income tax department at the assessment stage and the Company considers that its view on items of material nature is in accordance with law, the amounts are shown as contingent liabilities.
2.4.8 Stores and spares
The Company reviews the stores and spares for possible impairment on an annual basis. Any change in the estimates in future years might affect the carrying amounts of the respective items of stores and spares with a corresponding affect on the provision.
2.4.9 Provision against trade debts, advances and other receivables
The Company reviews the recoverability of its trade debts, advances and other receivables to assess amount of bad debts and provision required there against on annual basis.
2.5 NEW ACCOUNTING STANDARDS AND IFRIC INTERPRETATIONS THAT ARE NOT YET EFFECTIVE
The following standards, interpretations and the amendments are effective for accounting periods beginning from the dates specified below and are either not relevant to the Company’s operations or are not expected to have significant impact on the Company’s financial statements other than certain additional disclosures:
- Amendments to IAS 1, ‘Presentation of financial statements’ (effective for annual periods beginning on or after 1 January 2016) provides clarification on a number of issues including:
Materiality- an entity should not aggregate or disaggregate information in a manner that obscures useful information. Where items are material, sufficient information must be provided to explain the impact on the financial position or performance.
Disaggregation and subtotals - line items specified in IAS 1 may need to be disaggregated where this is relevant to an understanding of the entity’s financial position or performance. There is also new guidance on the use of subtotals.
Notes - confirmation that the notes do not need to be presented in a particular order.
Other Comprehensive Income (OCI) arising from investments accounted for under the equity method - the share of OCI arising from equity - accounted investments is grouped based on whether the items will or will not subsequently be reclassified to profit or loss. Each group should then be presented as a single line item in the statement of other comprehensive income.
- Amendments to IFRS 10, ‘Consolidated Financial Statements’ and IAS 28, ‘Investments in Associates and Joint Ventures’ (effective for annual periods beginning on or after 1 January 2016) clarifies (a) which subsidiaries of an investment entity are consolidated; (b) exemption to present consolidated financial statements is available to a parent entity that is a subsidiary of an investment entity; and (c) how an entity that is not an investment entity should apply the equity method of accounting for its investment in an associate or joint venture that is an investment entity. The amendments are not likely to have an impact on Company’s financial statements.
82 Oil & Gas Development Company Limited

Notes to and Forming Part of the Financial StatementsFor the year ended 30 June 2016
- Amendments to IAS 38, ‘Intangible Assets’ and IAS 16 ‘Property, Plant and Equipment’ (effective for annual periods beginning on or after 1 January 2016) introduce severe restrictions on the use of revenue-based amortization for intangible assets and explicitly state that revenue-based methods of depreciation cannot be used for property, plant and equipment. The rebuttable presumption that the use of revenue-based amortization methods for intangible assets is inappropriate and can be overcome only when revenue and the consumption of the economic benefits of the intangible asset are ‘highly correlated’, or when the intangible asset is expressed as a measure of revenue.
- Agriculture: Bearer Plants [Amendment to IAS 16 and IAS 41] (effective for annual periods beginning on or after 1 January 2016). Bearer plants are now in the scope of IAS 16 ‘Property, Plant and Equipment’ for measurement and disclosure purposes. Therefore, a company can elect to measure bearer plants at cost. However, the produce growing on bearer plants will continue to be measured at fair value less costs to sell under IAS 41, ‘Agriculture’. A bearer plant is a plant that: is used in the supply of agricultural produce; is expected to bear produce for more than one period; and has a remote likelihood of being sold as agricultural produce. Before maturity, bearer plants are accounted for in the same way as self-constructed items of property, plant and equipment during construction.
- Amendments to IAS 27, ‘Separate Financial Statements’ (effective for annual periods beginning on or after 1 January 2016). The amendments to IAS 27 will allow entities to use the equity method to account for investments in subsidiaries, joint ventures and associates in their separate financial statements.
- Accounting for Acquisitions of Interests in Joint Operations – Amendments to IFRS 11, ‘Joint Arrangements’ (effective for annual periods beginning on or after 1 January 2016) clarify the accounting for the acquisition of an interest in a joint operation where the activities of the operation constitute a business. They require an investor to apply the principles of business combination accounting when it acquires an interest in a joint operation that constitutes a business.
- Amendments to IAS 12, ‘Income Taxes’ are effective for annual periods beginning on or after 1 January 2017. The amendments clarify that the existence of a deductible temporary difference depends solely on a comparison of the carrying amount of an asset and its tax base at the end of the reporting period, and is not affected by possible future changes in the carrying amount or expected manner of recovery of the asset.
- Amendments to IAS 7, ‘Statement of Cash Flows’ are part of IASB’s broader disclosure initiative and are effective for annual periods beginning on or after 1 January 2017. The amendments require disclosures that enable users of financial statements to evaluate changes in liabilities arising from financing activities, including both changes arising from cash flow and non-cash changes.
- Amendments to IFRS 2, ‘Share-based Payment’ clarify the accounting for certain types of arrangements and are effective for annual periods beginning on or after 1 January 2018. The amendments cover three accounting areas (a) measurement of cash-settled share-based payments; (b) classification of share-based payments settled net of tax withholdings; and (c) accounting for a modification of a share-based payment from cash-settled to equity-settled. The new requirements could affect the classification and/or measurement of these arrangements and potentially the timing and amount of expense recognized for new and outstanding awards.
- Annual Improvements 2012-2014 cycle (the amendments apply prospectively for annual period beginning on or after 1 January 2016). The new cycle of improvements contain amendments to the following standards:
IAS 19, ‘Employee Benefits’. IAS 19 is amended to clarify that high quality corporate bonds or government bonds used in determining the discount rate should be issued in the same currency in which the benefits are to be paid.
IAS 34, ‘Interim Financial Reporting’. IAS 34 is amended to clarify that certain disclosures, if they are not included in the notes to interim financial statements and disclosed elsewhere should be cross referred.
IFRS 5, ‘Non-current Assets Held for Sale and Discontinued Operations’. IFRS 5 is amended to clarify that if an entity changes the method of disposal of an asset (or disposal group) i.e. reclassifies an asset from held for distribution to owners to held for sale or vice versa without any time lag, then such change in classification is considered as continuation of the original plan of disposal and if an entity determines that an asset (or disposal group) no longer meets the criteria to be classified as held for distribution, then it ceases held for distribution accounting in the same way as it would cease held for sale accounting.
Annual Report 2016 83
Notes to and Forming Part of the Financial StatementsFor the year ended 30 June 2016
IFRS 7, ‘Financial Instruments-Disclosures’. IFRS 7 is amended to clarify when servicing arrangements are in the scope of its disclosure requirements on continuing involvement in transferred financial assets in cases when they are derecognized in their entirety. IFRS 7 is also amended to clarify that additional disclosures required by ‘Disclosures: Offsetting Financial Assets and Financial Liabilities (Amendments to IFRS 7)’ are not specifically required for inclusion in condensed interim financial statements for all interim periods.
- IFRS 14, ‘Regulatory Deferral Accounts’ (effective for annual periods beginning on or after 1 January 2016) specifies the financial reporting requirements for ‘regulatory deferral account balances’ that arise when an entity provides goods or services to customers at a price or rate that is subject to rate regulation. IFRS 14 is permitted, but not required, to be applied where an entity conducts rate-regulated activities and has recognized amounts in its previous financial statements that meet the definition of ‘regulatory deferral account balances’ also referred as the ‘regulatory assets’ and ‘regulatory liabilities’.
- IFRS 15, ‘Revenue from Contracts with Customers’ (effective for annual periods beginning on or after 1 January 2018) specifies how and when an IFRS compliant entity will recognize revenue as well as requiring such entities to provide users of financial statements with more informative and relevant disclosures. The standard provides a single principle-based five-step model to be applied to all contracts with customers. The objective of IFRS 15 is to establish the principles that an entity shall apply to report useful information to users of financial statements about the nature, amount, timing, and uncertainty of revenue and cash flows arising from a contract with a customer.
- IFRS 16, ‘Leases’ (effective for annual periods beginning on or after 1 January 2019) supersedes IAS 17, ‘Leases’ and related interpretations. IFRS 16 will affect primarily the accounting by lessees and will result in the recognition of almost all leases on balance sheet. The standard removes the current distinction between operating and financing leases and requires recognition of an asset (the right to use the leased item) and a financial liability to pay rentals for virtually all lease contracts. An optional exemption exists for short-term and low-value leases. The accounting by lessors will not significantly change. Some differences may arise as a result of the new guidance on the definition of a lease. Under IFRS 16 a contract is, or contains, a lease if the contract conveys the right to control the use of an identified asset for a period of time in exchange for consideration.
Other than the aforesaid standards, interpretations and amendments, the International Accounting Standards Board (IASB) has also issued the following standards which have not been notified locally by the Securities and Exchange Commission of Pakistan (SECP) as at 30 June 2016:
- IFRS 1 – First Time Adoption of International Financial Reporting Standards
- IFRS 9 – Financial Instruments
The following interpretations issued by the IASB have been waived off by SECP effective 16 January 2012:
- IFRIC 4 – Determining Whether an Arrangement Contains a Lease. Also refer note 41 to the financial statements.
- IFRIC 12 – Service Concession Arrangements
3 SUMMARY OF SIGNIFICANT ACCOUNTING POLICIES
The accounting policies set out below have been applied consistently to all periods presented in these financial statements, and have been applied consistently by the Company except for the following new standards adopted by the Company during the year ended 30 June 2016:
a. IFRS 10 Consolidated Financial Statementsb. IFRS 11 Joint Arrangementsc. IFRS 12 Disclosure of Interest in Other Entitiesd. IFRS 13 Fair Value Measuremente. IAS 27 Separate Financial Statementsf. IAS 28 Investment in Associates and Joint Ventures
84 Oil & Gas Development Company Limited

Notes to and Forming Part of the Financial StatementsFor the year ended 30 June 2016
a. IFRS 10, ‘Consolidated Financial Statements’ became effective from financial periods beginning on or after 1 January 2015. As a result of IFRS 10, the Company has changed its accounting policy for determining whether it has control over and consequently whether it consolidates its investees. IFRS 10 introduces a new control model that focuses on whether the Company has power over an investee, exposure or rights to variable returns from its involvement with the investee and ability to use its power to affect those returns. The Company reassessed the control conclusion for its investees at 1 July 2015, however, there has been no change in the control conclusion.
b. IFRS 11, ‘Joint Arrangements’ is a replacement of IAS 31 ‘Interest in Joint Ventures’ and modifies the accounting for joint arrangements:
Under IFRS 11, the Company classifies its interests in joint arrangements as either joint operations or joint ventures depending on the Company’s rights to the assets and obligations for the liabilities of the arrangements. When making this assessment, the Company considers the structure of the arrangements, the legal form of any separate vehicles, the contractual terms of the arrangements and other facts and circumstances. The Company has assessed the nature of its joint arrangements and determined them to be joint operations.
c. IFRS 12, ‘Disclosure of Interest in Other Entities’ became effective from financial periods beginning on or after 1 January 2015. The standard includes the disclosure requirements for all forms of interest in other entities, including joint arrangements, associates, structured entities and other off-balance sheet vehicles. The adoption of standard does not have any impact on the Company’s financial statements except for certain additional disclosures.
d. IFRS 13 ‘Fair Value Measurement’ became effective from financial periods beginning on or after 1 January 2015. IFRS 13 establishes a single framework for measuring fair value and making disclosures about fair value measurements when such measurements are required or permitted by other IFRSs. It unifies the definition of fair value as a price that would be received to sell an asset or paid to transfer a liability in an orderly transaction between market participants at the measurement date. It replaces and expands the disclosure requirements about fair value measurements in other IFRSs, including IFRS 7. The application of IFRS 13 does not have any impact on the financial statements of the Company except for certain additional disclosures.
e. IAS 27, ‘Separate Financial Statements’ (revised 2011) deals only with accounting for subsidiaries, associates and joint ventures in separate financial statements of the parent company. Adoption of this standard does not have any impact on the Company’s financial statements.
f. IAS 28, ‘Investments in associates and joint ventures’ (revised 2011) sets out the requirements of application of equity method of accounting when accounting for investment in associates and joint ventures. Adoption of this standard does not have any impact on the Company’s financial statements.
3.1 EMPLOYEE BENEFITS
Salaries, wages and benefits are accrued in the period in which the associated services are rendered by employees of the Company. The accounting policy for pension, gratuity, post retirement medical benefits and accumulating compensated absences is described below:
3.1.1 Pension, gratuity, post retirement medical benefits and accumulating compensated absences
The Company operates an approved funded pension scheme under an independent trust for its permanent employees regularized before 1 January 2016, as a defined benefit plan. During the year, the Company changed its policy for pension scheme and consequently, the employees regularized from 1 January 2016 and onwards will be entitled to gratuity, a defined benefit plan and provident fund, a defined contributory plan instead of pension benefit. In contributory provident fund, the Company shall match the contribution by employees upto one basic salary annually. The contractual officers of the Company are also entitled to gratuity.
The Company also provides post retirement medical benefits to its permanent employees and their families as a defined benefit plan.
The Company also has a policy whereby its regular/contractual officers and regular staff are eligible to encash accumulated leave balance at the time of retirement in case of officers and at the time of retirement or during the service in case of regular staff.
Annual Report 2016 85

Notes to and Forming Part of the Financial StatementsFor the year ended 30 June 2016
The Company makes contributions or record liability in respect of defined benefit plans on the basis of actuarial valuations, carried out annually by independent actuaries. The latest actuarial valuations were carried out as of 30 June 2016. The calculations of actuaries are based on the Projected Unit Credit Method, net of the assets guaranteeing the plan, if any, with the obligation increasing from year to year, in a manner that it is proportional to the length of service of the employees.
The Company’s net obligation in respect of defined benefit plans is calculated separately for each plan by estimating the present value of the future benefit that employees have earned in return for their service in the current and prior periods; that benefit is discounted to determine its present value.
The interest element of the defined benefit cost represents the change in present value of scheme obligations resulting from the passage of time, and is determined by applying the discount rate to the net defined benefit liability/(asset).
Actuarial gains and losses arising from experience adjustments and changes in actuarial assumptions are charged or credited in other comprehensive income in the year in which they arise.
Past service costs are recognized immediately in profit and loss account.
3.2 TAXATION
Taxation for the year comprises current and deferred tax. Taxation is recognized in the profit and loss account except to the extent that it relates to items recognized outside profit and loss account (whether in other comprehensive income or directly in equity), if any, in which case the tax amounts are recognized outside profit and loss account.
3.2.1 Current tax
Provision for current taxation is based on taxable income at the current rate of tax after taking into account applicable tax credits, rebates and exemptions available, if any, adjusted for payments to GoP for payments on account of royalty and any adjustment to tax payable in respect of previous years.
3.2.2 Deferred tax
Deferred tax is accounted for using the balance sheet liability method in respect of all taxable temporary differences arising from differences between the carrying amount of assets and liabilities in the financial statements and the corresponding tax bases used in the computation of taxable profit. Deferred tax liabilities are recognized for all taxable temporary differences and deferred tax assets are recognized for all deductible temporary differences to the extent that it is probable that taxable profits will be available against which the deductible temporary differences, unused tax losses and tax credits can be utilized. Deferred tax assets are reviewed at each reporting date and are reduced to the extent that it is no longer probable that the related tax benefit will be realized.
Deferred tax is not recognized for the temporary differences arising from the initial recognition of assets or liabilities in a transaction that is not a business combination and that affects neither accounting nor taxable profit or loss, and differences relating to investments in associates and interest in joint arrangements to the extent that it is probable that they will not reverse in a foreseeable future and the investor/joint operator is able to control the timing of the reversal of the temporary difference. In addition, deferred tax is not recognized for taxable temporary differences arising on the initial recognition of goodwill.
Deferred tax is calculated at the rates that are expected to apply to the period when the differences reverse, based on tax rates that have been enacted or substantively enacted by the reporting date, adjusted for payments to GoP on account of royalty.
Deferred tax assets and liabilities are offset if there is a legally enforceable right to offset current tax liabilities and assets, and they relate to income taxes levied by the same tax authority on the same taxable entity, or on different tax entities, but they intend to settle current tax liabilities and assets on a net basis or their tax assets and liabilities will be realized simultaneously.
Deferred tax has been calculated at the tax rate of 28.17% (2015: 31.35%) after taking into account depletion allowance and set offs, where available, in respect of royalty payment to the Government of Pakistan. The tax rate is reviewed annually.
86 Oil & Gas Development Company Limited

Notes to and Forming Part of the Financial StatementsFor the year ended 30 June 2016
3.3 PROPERTY, PLANT AND EQUIPMENT
Property, plant and equipment is stated at cost less accumulated depreciation and accumulated impairment losses, if any except for freehold land and capital work in progress, which are stated at cost less impairment loss, if any. Cost in relation to property, plant and equipment comprises acquisition and other directly attributable costs and decommissioning cost as referred in the note 3.4.4 to the financial statements. The cost of self constructed assets includes the cost of materials, direct labour and any other costs directly attributable to bringing the assets to working condition for their intended use. Software that is integral to the functionality of the related equipment is capitalized as part of that equipment.
Depreciation is provided on straight line method at rates specified in note 11 to the financial statements so as to write off the cost of property, plant and equipment over their estimated useful life. Depreciation on additions to property, plant and equipment is charged from the month in which property, plant and equipment is acquired or capitalized while no depreciation is charged for the month in which property, plant and equipment is disposed off.
The cost of replacing part of an item of property, plant and equipment is recognized in the carrying amount of the item if it is probable that the future economic benefits embodied within the part will flow to the Company and its cost can be measured reliably. The carrying amount of the replaced part is derecognized. The costs of the day-to-day servicing of property, plant and equipment are recognized in profit and loss account as incurred.
Gains and losses on disposal of an item of property, plant and equipment are determined by comparing the proceeds from disposal with the carrying amount of property, plant and equipment, and are recognized net within “other income” in profit or loss account.
Capital work in progress is stated at cost less accumulated impairment losses, if any, and is transferred to the respective item of property, plant and equipment when available for intended use.
Impairment tests for property, plant and equipment are performed when there is an indication of impairment. At each year end, an assessment is made to determine whether there are any indications of impairment. The Company conducts annually an internal review of asset values which is used as a source of information to assess for any indications of impairment. External factors such as changes in expected future prices, costs and other market factors are also monitored to assess for indications of impairment. If any such indication exists, an estimate of the asset’s recoverable amount is calculated being the higher of the fair value of the asset less cost to sell and the asset’s value in use.
If the carrying amount of the asset exceeds its recoverable amount, the property, plant and equipment is impaired and an impairment loss is charged to the profit and loss account so as to reduce the carrying amount of the property, plant and equipment to its recoverable amount.
Fair value is the price that would be received to sell an asset or paid to transfer a liability in an orderly transaction between market participants at the measurement date.
Value in use is determined as the present value of the estimated future cash flows expected to arise from the continued use of the property, plant and equipment in its present form and its eventual disposal. Value in use is determined by applying assumptions specific to the Company’s continued use and does not take into account future development.
In testing for indications of impairment and performing impairment calculations, assets are considered as collective groups, referred to as cash generating units. Cash generating units are the smallest identifiable group of assets that generate cash inflows that are largely independent of the cash inflows from other assets or groups of assets.
An impairment loss is reversed if there has been a change in the estimates used to determine the recoverable amount. An impairment loss is reversed only to the extent that the asset’s carrying amount does not exceed the carrying amount that would have been determined, net of depreciation or amortization, if no impairment loss had been recognized.
Annual Report 2016 87

Notes to and Forming Part of the Financial StatementsFor the year ended 30 June 2016
3.4 OIL AND GAS ASSETS
The Company applies the “Successful efforts” method of accounting for Exploration and Evaluation (E&E) costs.
3.4.1 Pre license costs
Costs incurred prior to having obtained the legal rights to explore an area are charged directly to the profit and loss account as they are incurred.
3.4.2 Exploration and evaluation assets
Under the Successful efforts method of accounting, all property acquisitions, exploratory/evaluation drilling costs are initially capitalized as intangible E&E assets in well, field or specific exploration cost centres as appropriate, pending determination.
Costs directly associated with an exploratory well are capitalized as an intangible asset until the drilling of the well is completed and results have been evaluated. Major costs include employee benefits, material, chemical, fuel, well services and rig operational costs. All other exploration costs including cost of technical studies, seismic acquisition and data processing, geological and geophysical activities are charged against income as exploration and prospecting expenditure.
Tangible assets used in E&E activities, include the Company’s vehicles, drilling rigs, seismic equipment and other property, plant and equipment used by the Company’s exploration function and are classified as property, plant and equipment. However, to the extent that such a tangible asset is consumed in developing an intangible E&E asset, the amount reflecting that consumption is recorded as part of the cost of the intangible asset. Such intangible costs include directly attributable overheads, including the depreciation of property, plant and equipment utilized in E&E activities, together with the cost of other materials consumed during the exploration and evaluation phases.
Intangible E&E assets relating to each exploration license/field are carried forward, until the existence or otherwise of commercial reserves have been determined subject to certain limitations including review for indications of impairment. If commercial reserves have been discovered, the carrying value after any impairment loss of the relevant E&E assets is then reclassified as development and production assets and if commercial reserves are not found, the capitalized costs are written off as dry and abandoned wells and charged to profit and loss account.
E&E assets are not amortized prior to the conclusion of appraisal activities.
3.4.3 Development and production assets - intangible
Development and production assets are accumulated on a field by field basis and represent the cost of developing the discovered commercial reserves and bringing them into production, together with the capitalized E&E expenditures incurred in finding commercial reserves transferred from intangible E&E assets as outlined in accounting policy 3.4.2 above. The cost of development and production assets also includes the cost of acquisition of such assets, directly attributable overheads, and the cost of recognizing provisions for future site restoration and decommissioning.
Expenditure carried within each field is amortized from the commencement of production on a unit of production basis, which is the ratio of oil and gas production in the year to the estimated quantities of proved developed reserves at the end of the year plus the production during the year, on a field by field basis. Changes in the estimates of commercial reserves or future field development costs are dealt with prospectively. Amortization is charged to profit and loss account.
3.4.4 Decommissioning cost
The activities of the Company normally give rise to obligations for site restoration. Restoration activities may include facility decommissioning and dismantling, removal or treatment of waste materials, land rehabilitation, and site restoration.
88 Oil & Gas Development Company Limited
Notes to and Forming Part of the Financial StatementsFor the year ended 30 June 2016
Liabilities for decommissioning cost are recognized when the Company has an obligation to dismantle and remove a facility or an item of plant and to restore the site on which it is located, and when a reliable estimate of that liability can be made. The Company makes provision in full for the decommissioning cost on the declaration of commercial discovery of the reserves, to fulfill the obligation of site restoration and rehabilitation. Where an obligation exists for a new facility, such as oil and natural gas production or transportation facilities, this will be on construction or installation. An obligation for decommissioning may also crystallize during the period of operation of a facility through a change in legislation or through a decision to terminate operations. The amount recognized is the estimated cost of decommissioning, discounted to its net present value and the expected outflow of economic resources to settle this obligation is up to next twenty five years. Decommissioning cost, as appropriate, relating to producing/shut-in fields and production facilities is capitalized to the cost of development and production assets and property, plant and equipment as the case may be. The recognized amount of decommissioning cost is subsequently amortized/depreciated as part of the capital cost of the development and production assets and property, plant and equipment.
While the provision is based on the best estimate of future costs and the economic life of the facilities and property, plant and equipment there is uncertainty regarding both the amount and timing of incurring these costs. Any change in the present value of the estimated expenditure is dealt with prospectively and reflected as an adjustment to the provision and a corresponding adjustment to property, plant and equipment and development and production assets. The unwinding of the discount on the decommissioning provision is recognized as finance cost in the profit and loss account.
3.4.5 Impairment of oil and gas assets
E&E assets are assessed for impairment when facts and circumstances indicate that carrying amount may exceed the recoverable amount of E&E assets. Such indicators include, the point at which a determination is made that as to whether or not commercial reserves exist, the period for which the Company has right to explore has expired or will expire in the near future and is not expected to be renewed, substantive expenditure on further exploration and evaluation activities is not planned or budgeted and any other event that may give rise to indication that E&E assets are impaired.
Impairment test of development and production assets is also performed whenever events and circumstances arising during the development and production phase indicate that carrying amount of the development and production assets may exceed its recoverable amount. Such circumstances depend on the interaction of a number of variables, such as the recoverable quantities of hydrocarbons, the production profile of the hydrocarbons, the cost of the development of the infrastructure necessary to recover the hydrocarbons, the production costs, the contractual duration of the production field and the net selling price of the hydrocarbons produced.
The carrying value is compared against expected recoverable amount of the oil and gas assets, generally by reference to the future net cash flows expected to be derived from such assets. The cash generating unit applied for impairment test purpose is generally field by field basis, except that a number of fields may be grouped as a single cash generating unit where the cash flows of each field are inter dependent.
Where conditions giving rise to impairment subsequently reverse, the effect of the impairment charge is also reversed as a credit to the profit and loss account, net of any depreciation that would have been charged since the impairment.
3.5 INVESTMENTS
All purchases and sale of investments are recognized using settlement date accounting. Settlement date is the date on which investments are delivered to or by the Company. All investments are derecognized when the right to receive economic benefits from the investments has expired or has been transferred and the Company has transferred substantially all the risks and rewards of ownership.
3.5.1 Investments in associate
An associate is an entity over which the Company has significant influence and that is neither a subsidiary nor an interest in a joint venture. Significant influence is the power to participate in the financial and operating policy decisions of the investee but is not control or joint control over those policies.
Annual Report 2016 89

Notes to and Forming Part of the Financial StatementsFor the year ended 30 June 2016
The results and assets and liabilities of the associate have been incorporated in these financial statements using the equity method of accounting. Under the equity method, investments in associates are carried in the balance sheet at cost as adjusted for post acquisition changes in the Company’s share of net assets of the associate, less any impairment in the value of investment. Losses of an associate in excess of the Company’s interest in that associate (which includes any long term interest that, in substance, form part of the Company’s net investment in the associate) are recognized only to the extent that the Company has incurred legal or constructive obligation or made payment on behalf of the associate.
3.5.2 Investments held to maturity
Investments with fixed or determinable payments and fixed maturity and where the Company has positive intent and ability to hold investments to maturity are classified as investments held to maturity. These are initially recognized at cost inclusive of transaction costs and are subsequently carried at amortized cost using the effective interest rate method, less any impairment losses.
3.5.3 Loans and receivables
These are initially measured at fair value plus any directly attributable transaction costs. Subsequent to initial recognition, they are measured at amortized cost using the effective interest method.
3.5.4 Investments at fair value through profit or loss
An investment is classified at fair value through profit or loss if it is held for trading or is designated as such upon initial recognition. Financial instruments are designated at fair value through profit or loss if the Company manages such investments and makes purchase and sale decisions based on their fair value in accordance with the Company’s investment strategy. All investments classified as investments at fair value through profit or loss are initially measured at cost being fair value of consideration given. At subsequent dates these investments are measured at fair value, determined on the basis of prevailing market prices, with any resulting gain or loss recognized directly in the profit and loss account.
3.6 STORES, SPARE PARTS AND LOOSE TOOLS
Stores, spare parts and loose tools are valued at the lower of cost and net realizable value less allowance for slow moving, obsolete and in transit items. Cost is determined on the moving average basis and comprises cost of purchases and other costs incurred in bringing the inventories to their present location and condition. Net realizable value signifies the estimated selling price in the ordinary course of business less costs necessarily to be incurred in order to make a sale.
Materials in transit are stated at cost comprising invoice value and other charges paid thereon.
3.7 STOCK IN TRADE
Stock in trade is valued at the lower of production cost and net realizable value. Net realizable value signifies the estimated selling price in the ordinary course of business less net estimated cost of production and selling expenses.
3.8 INTANGIBLES
An intangible asset is recognized if it is probable that future economic benefits that are attributable to the asset will flow to the Company and that the cost of such asset can also be measured reliably. Intangible assets having definite useful life are stated at cost less accumulated amortization and are amortized based on the pattern in which the assets’ economic benefits are consumed. Intangible assets which have indefinite useful life are not amortized and tested for impairment annually, if any.
3.9 REVENUE RECOGNITION
Revenue from sale of goods is recognized when significant risks and rewards of ownership are transferred to the buyer, recovery of the consideration is probable, the associated costs and possible return of goods can be estimated reliably, there is no continuing management involvement with the goods, and the amount of revenue can be measured reliably.
90 Oil & Gas Development Company Limited

Notes to and Forming Part of the Financial StatementsFor the year ended 30 June 2016
Revenue from the sale of goods is measured at the fair value of the consideration received or receivable, net of government levies. Effect of adjustments, if any, arising from revision in sale prices is reflected as and when the prices are finalized with the customers and/or approved by the GoP.
Revenue from services is recognized on rendering of services to customers and is measured at the fair value of the consideration received or receivable.
3.10 FINANCE INCOME AND EXPENSE
Finance income comprises interest income on funds invested, delayed payments from customers, dividend income, exchange gain and changes in the fair value of financial assets at fair value through profit or loss. Income on bank deposits is accrued on a time proportion basis by reference to the principal outstanding and the applicable rate of return. Income on investments is recognized on time proportion basis taking into account the effective yield of such securities. The Company recognizes interest, if any, on delayed payments from customers on receipt basis. Dividend income on equity investments is recognized when the right to receive the payment is established. Foreign currency gains and losses are reported on a net basis.
Finance cost comprises interest expense on borrowings (if any), unwinding of the discount on provisions and bank charges. Mark up, interest and other charges on borrowings are charged to income in the period in which they are incurred.
3.11 JOINT OPERATIONS
The Company has applied IFRS 11 to all joint arrangements as of 1 July 2015. Under IFRS 11, investment in joint arrangements are classified as either joint operations or joint ventures depending on contractual rights and obligations of the parties to the arrangement. The Company has assessed the nature of its arrangements and determined them to be joint operations.
The Company has recognized its share of assets, liabilities, revenues and expenses jointly held or incurred under the joint operations on the basis of latest available audited financial statements of the joint operations and where applicable, the cost statements received from the operator of the joint venture, for the intervening period up to the balance sheet date. The difference, if any, between the cost statements and audited financial statements is accounted for in the next accounting year.
3.12 FOREIGN CURRENCIES
Transactions in foreign currencies are recorded at the rates of exchange ruling on the date of the transaction. All monetary assets and liabilities denominated in foreign currencies are translated into PKR at the rate of exchange ruling on the balance sheet date and exchange differences, if any, are charged to income for the year.
3.13 FINANCIAL INSTRUMENTS
Financial assets and liabilities are recognized when the Company becomes a party to the contractual provisions of the instrument. These are derecognized when the Company ceases to be a party to the contractual provisions of the instrument.
Financial assets mainly comprise investments, loans, advances, deposits, trade debts, other receivables and cash and bank balances. Financial liabilities are classified according to the substance of the contractual arrangements entered into. Significant financial liabilities are trade and other payables.
All financial assets and liabilities are initially measured at fair value. These financial assets and liabilities are subsequently measured at fair value, amortized cost or cost, as the case may be.
3.14 OFFSETTING
Financial assets and liabilities and tax assets and liabilities are set off in the balance sheet, only when the Company has a legally enforceable right to set off the recognized amounts and intends either to settle on a net basis or to realize the assets and settle the liabilities simultaneously.
Annual Report 2016 91

Notes to and Forming Part of the Financial StatementsFor the year ended 30 June 2016
3.15 TRADE DEBTS AND OTHER RECEIVABLES
Trade debts and other receivables are stated at original invoice amount as reduced by appropriate provision for impairment. Bad debts are written off when identified while debts considered doubtful of recovery are fully provided for. Provision for doubtful debts is charged to profit and loss account currently.
3.16 TRADE AND OTHER PAYABLES
Liabilities for trade and other payables are carried at cost which is the fair value of the consideration to be paid in the future for goods and services received.
3.17 CASH AND CASH EQUIVALENTS
Cash and cash equivalents for the purpose of cash flow statement comprise cash in hand and at bank and includes short term highly liquid investments that are readily convertible to known amounts of cash and which are subject to an insignificant risk of change in value.
3.18 DIVIDEND
Dividend is recognized as a liability in the period in which it is declared.
3.19 SELF INSURANCE SCHEME
The Company is following a policy to set aside reserve for self insurance of rigs, wells, plants, pipelines, vehicles, workmen compensation, losses of petroleum products in transit and is keeping such reserve invested in specified investments.
3.20 IMPAIRMENT
3.20.1 Non-financial assets
The Company assesses at each balance sheet date whether there is any indication that assets except deferred tax assets may be impaired. If such indication exists, the carrying amounts of such assets are reviewed to assess whether they are recorded in excess of their recoverable amount. Where carrying values exceed the respective recoverable amount, assets are written down to their recoverable amounts and the resulting impairment loss is recognized in profit and loss account. The recoverable amount is the higher of an asset’s fair value less costs to sell and value in use.
Where an impairment loss subsequently reverses, the carrying amount of the asset is increased to the revised estimate of its recoverable amount, but so that the increased carrying amount does not exceed the carrying amount that would have been determined had no impairment loss been recognized for the asset in prior years. A reversal of an impairment loss is recognized immediately in profit and loss account.
3.20.2 Financial assets
A financial asset is assessed at each reporting date to determine whether there is any objective evidence that it is impaired. A financial asset is considered to be impaired if objective evidence indicates that one or more events have had a negative effect on the estimated future cash flows of that asset. Individually significant financial assets are tested for impairment on an individual basis. The remaining financial assets are assessed collectively in groups that share similar credit risk characteristics.
3.21 OPERATING SEGMENTS
Operating segments are reported in a manner consistent with the internal reporting provided to the chief operating decision-maker. The chief operating decision-maker, who is responsible for allocating resources and assessing performance of the operating segments, has been identified as the Board of Directors that makes strategic decisions. The management has determined that the Company has a single reportable segment as the Board of Directors views the Company’s operations as one reportable segment.
92 Oil & Gas Development Company Limited

Notes to and Forming Part of the Financial StatementsFor the year ended 30 June 2016
4 SHARE CAPITAL
Authorized share capital
2016 2015 2016 2015 ----------(Number of shares)------------ -------------(Rupees ‘000)-------------
5,000,000,000 5,000,000,000 Ordinary shares of Rs 10 each 50,000,000 50,000,000
Issued, subscribed and paid up capital
1,075,232,100 1,075,232,100 Ordinary shares of Rs 10 each issued for consideration other than cash (note 4.1)
10,752,321 10,752,321
3,225,696,300 3,225,696,300 Ordinary shares of Rs 10 each issued as fully paid bonus shares
32,256,963 32,256,963
4,300,928,400 4,300,928,400 43,009,284 43,009,284
4.1 In consideration for all the properties, rights, assets, obligations and liabilities of Oil and Gas Development Corporation (OGDC) vested in the Company, 1,075,232,100 ordinary fully paid shares of Rs 10 each were issued to Government of Pakistan (GoP) on 23 October 1997. Currently, GoP holds 74.97% (2015: 74.97%) paid up capital of the Company.
2016 2015Note -------------(Rupees ‘000)-----------
5 RESERVES
Capital reserve:
Capital reserve 5.1 836,000 836,000 Self insurance reserve 5.2 7,470,000 6,620,000 Capital redemption reserve fund - associated company 5.3 2,118,000 - Self insurance reserve - associated company 5.4 20,000 -
Other reserves:
Undistributed percentage return reserve - associated company 5.5 85,373 - 10,529,373 7,456,000
5.1 This represents bonus shares issued by former wholly owned subsidiary - Pirkoh Gas Company (Private) Limited (PGCL) prior to merger.
5.2 The Company has set aside a specific capital reserve for self insurance of rigs, wells, plants, pipelines, workmen compensation, vehicle repair and losses for petroleum products in transit. Refer note 14.2.1 for investments against this reserve. Accordingly, the reserve is not available for distribution to shareholders.
5.3 This represents Company’s share of profit set aside by an associated company to redeem redeemable preference shares in the form of cash to the preference shareholders.
5.4 This represents Company’s share of profit set aside by an associated company for self insurance of general assets, vehicles and personal accident for security personnel.
5.5 This represents Company’s share of profit set aside by an associated company from distributable profits for the year related to undistributed percentage return reserve.
Annual Report 2016 93

Notes to and Forming Part of the Financial StatementsFor the year ended 30 June 2016
2016 2015Note -------------(Rupees ‘000)-----------
6 DEFERRED TAXATION
The balance of deferred tax is in respect of following temporary differences:
Accelerated depreciation on property, plant and equipment 7,419,066 7,548,441 Expenditure of exploration and evaluation, development and production assets 10,487,778 12,887,530 Provision for decommissioning cost (1,870,834) (3,042,951)Long term investment in associate 414,961 132,767 Provision for doubtful debts, claims and advances (87,175) (97,265)Provision for slow moving and obsolete stores (784,297) (821,682)
15,579,499 16,606,840
7 DEFERRED EMPLOYEE BENEFITS
Post retirement medical benefits 7.1 10,975,188 8,083,396 Accumulating compensated absences 7.2 3,996,450 4,374,519
14,971,638 12,457,915
7.1 Post retirement medical benefits
Movement in the present value of defined benefit obligation is as follows:Present value of defined benefit obligation at beginning of the year 8,083,396 6,770,977 Current service cost 175,262 179,026 Interest cost 783,067 889,503 Benefits paid (505,446) (364,126)Remeasurement loss recognized in Other Comprehensive Income 2,438,909 608,016 Present value of defined benefit obligation at end of the year 10,975,188 8,083,396
Movement in liability recognized in the balance sheet is as follows:Opening liability 8,083,396 6,770,977 Expense for the year 958,329 1,068,529 Benefits paid (505,446) (364,126)Remeasurement loss recognized in Other Comprehensive Income 2,438,909 608,016 Closing liability 10,975,188 8,083,396
Expense recognized is as follows:Current service cost 175,262 179,026 Interest cost 783,067 889,503
958,329 1,068,529
The expense is recognized in the following:Operating expenses - profit and loss account 504,610 550,979 General and administration expenses - profit and loss account 129,161 141,641 Technical services 324,558 375,909
958,329 1,068,529
94 Oil & Gas Development Company Limited

Notes to and Forming Part of the Financial StatementsFor the year ended 30 June 2016
2016 2015Significant actuarial assumptions used were as follows:
Discount rate per annum 9% 10%Medical inflation rate per annum - retired 9% 10%Medical inflation rate per annum - in service 7% 8.50%Mortality rate SLIC 2001-2005 SLIC 2001-2005Withdrawal rate Low LowWeighted average duration of the obligation 10 years 10 years
The calculation of the defined benefit obligation is sensitive to assumptions set out above. The following table summarizes how the impact on the defined benefit obligation at the end of the reporting period would have increased/(decreased) as a result of a change in respective assumptions.
Impact on defined benefit obligation Change in
assumptionIncrease in assumption
Decrease in assumption
-------------(Rupees ‘000)-------------- Discount 1% (1,640,117) 2,101,304 Medical indexation 1% 2,126,565 (1,683,947)Withdrawal 10% 6,684 (6,713)
1 year setback
1 year setforward
-------------(Rupees ‘000)-------------- Mortality 98,777 (97,896)
The impact of changes in assumptions has been determined by revaluation of the obligation on different rates.
The expected medical expense for the next financial year is Rs 1,362.247 million.
2016 2015--------------(Rupees ‘000)---------------
7.2 Accumulating compensated absences
Present value of defined benefit obligation at beginning of the year 4,374,519 3,056,584 Charge for the year - net 1,018,489 2,153,682 Payments made during the year (1,396,558) (835,747)Present value of defined benefit obligation at end of the year 3,996,450 4,374,519
The rates of discount at 9% per annum (2015: 10%) and long term salary increase rate of 9% per annum (2015: 9.50%) and short term salary increase rate (next one year) of 12% per annum (2015: 9.50%) were assumed.
2016 2015--------------(Rupees ‘000)---------------
The expense is recognized in the following:
Operating expenses - profit and loss account 540,555 1,124,194 General and administration expenses - profit and loss account 122,184 257,461 Technical services 355,750 772,027
1,018,489 2,153,682
Annual Report 2016 95

Notes to and Forming Part of the Financial StatementsFor the year ended 30 June 2016
2016 2015Note -------------(Rupees ‘000)--------------
8 PROVISION FOR DECOMMISSIONING COST
Balance at beginning of the year 20,303,619 20,417,830 Provision during the year 1,101,437 781,004
21,405,056 21,198,834 Revision due to change in estimates (1,693,111) (3,432,053)Unwinding of discount on provision for decommissioning cost 29 1,700,742 2,536,838 Balance at end of the year 21,412,687 20,303,619
The above provision for decommissioning cost is analyzed as follows:Development and production wells 4,450,781 5,518,058Production facilities 1,815,374 1,339,771 Unwinding of discount on provision for decommissioning cost
Development and production wells 13,458,767 11,989,714 Production facilities 1,687,765 1,456,076
15,146,532 13,445,790 21,412,687 20,303,619
2016 2015Significant assumptions used were as follows:Discount rate per annum 7.99% 9.14%Inflation rate per annum 5.98% 6.99%
2016 2015Note -------------(Rupees ‘000)--------------
9 TRADE AND OTHER PAYABLES
Creditors 115,148 1,159,807 Payable to Government of Pakistan - on account of Kunnar discount - 2,085,112 Accrued liabilities 14,359,034 7,792,656 Payable to partners of joint operations 4,573,507 5,747,349 Retention money payable 6,124,024 6,208,634 Royalty payable 2,499,371 3,759,267 Excise duty payable 235,912 243,798 General sales tax payable 526,179 1,636,792 Gas Infrastructure Development Cess (GIDC) Payable 17.2 2,137,525 6,143,565 Withholding tax payable 735,910 80,791 Trade deposits 119,298 102,210 Workers' profit participation fund - net 9.1 4,237,231 6,685,550 Employees' pension trust 9.2 9,272,728 3,116,025 Gratuity fund 9.3 69,009 - Un-paid dividend 9.4 12,439,784 16,000,346 Un-claimed dividend 200,776 184,955 Advances from customers 1,133,572 861,045 Other payables 190,140 94,075
58,969,148 61,901,977
9.1 Workers’ profit participation fund - net
Payable/(receivable) at beginning of the year 6,685,550 (346,775)(Paid to)/received from the fund during the year - net (6,685,550) 346,775 Charge for the year 4,237,231 6,685,550 Payable at end of the year 4,237,231 6,685,550
96 Oil & Gas Development Company Limited

Notes to and Forming Part of the Financial StatementsFor the year ended 30 June 2016
2016 2015-------------(Rupees ‘000)--------------
9.2 Employees’ pension trust
The amount recognized in the balance sheet is as follows:Present value of defined benefit obligation 72,609,026 61,669,438 Fair value of plan assets (63,336,298) (58,553,413)Net liability at end of the year 9,272,728 3,116,025
The movement in the present value of defined benefit obligation is as follows:Present value of defined benefit obligation at beginning of the year 61,669,438 54,402,957 Current service cost 2,236,272 1,869,247 Interest cost 5,950,393 7,344,399 Benefits paid (4,331,014) (2,978,860)Remeasurement loss recognized in Other Comprehensive Income 7,083,937 1,031,695 Present value of defined benefit obligation at end of the year 72,609,026 61,669,438
The movement in the fair value of plan assets is as follows:Fair value of plan assets at beginning of the year 58,553,413 42,611,861 Expected return on plan assets 5,713,104 5,752,601 Contributions 1,486,261 12,767,909 Benefits paid (4,331,014) (2,978,860)Remeasurement gain recognized in Other Comprehensive Income 1,914,534 399,902 Fair value of plan assets at end of the year 63,336,298 58,553,413
The movement in liability recognized in the balance sheet is as follows:Opening liability 3,116,025 11,791,096 Expense for the year 2,473,561 3,461,045 Remeasurement loss recognized in Other Comprehensive Income during the year 5,169,403 631,793 Payments to the fund during the year (1,486,261) (12,767,909)Closing liability 9,272,728 3,116,025
Expense recognized is as follows:Current service cost 2,236,272 1,869,247 Net interest cost 237,289 1,591,798
2,473,561 3,461,045
Remeasurement loss recognized in Other Comprehensive Income:Remeasurement loss on defined benefit obligation 7,083,937 1,031,695 Remeasurement gain on plan assets (1,914,534) (399,902)
5,169,403 631,793
Annual Report 2016 97
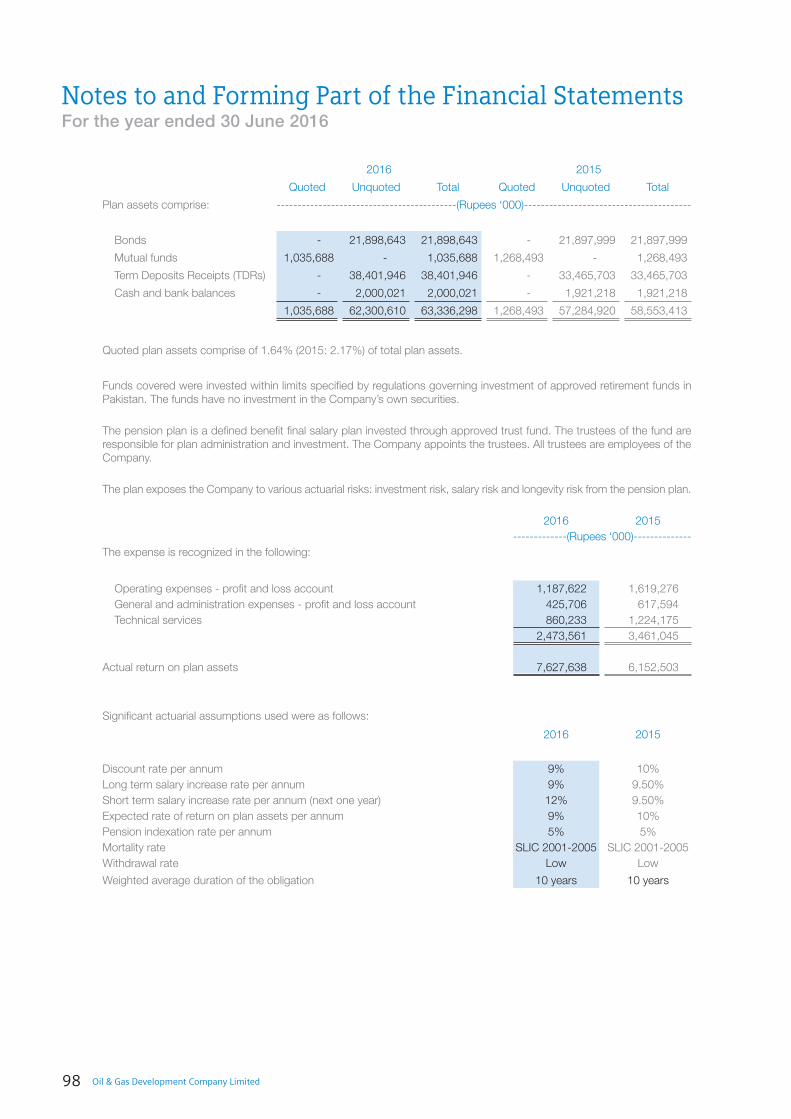
Notes to and Forming Part of the Financial StatementsFor the year ended 30 June 2016
2016 2015
Quoted Unquoted Total Quoted Unquoted Total
Plan assets comprise: -------------------------------------------(Rupees ‘000)----------------------------------------
Bonds - 21,898,643 21,898,643 - 21,897,999 21,897,999
Mutual funds 1,035,688 - 1,035,688 1,268,493 - 1,268,493
Term Deposits Receipts (TDRs) - 38,401,946 38,401,946 - 33,465,703 33,465,703
Cash and bank balances - 2,000,021 2,000,021 - 1,921,218 1,921,218
1,035,688 62,300,610 63,336,298 1,268,493 57,284,920 58,553,413
Quoted plan assets comprise of 1.64% (2015: 2.17%) of total plan assets.
Funds covered were invested within limits specified by regulations governing investment of approved retirement funds in Pakistan. The funds have no investment in the Company’s own securities.
The pension plan is a defined benefit final salary plan invested through approved trust fund. The trustees of the fund are responsible for plan administration and investment. The Company appoints the trustees. All trustees are employees of the Company.
The plan exposes the Company to various actuarial risks: investment risk, salary risk and longevity risk from the pension plan.
2016 2015-------------(Rupees ‘000)--------------
The expense is recognized in the following:
Operating expenses - profit and loss account 1,187,622 1,619,276 General and administration expenses - profit and loss account 425,706 617,594 Technical services 860,233 1,224,175
2,473,561 3,461,045
Actual return on plan assets 7,627,638 6,152,503
Significant actuarial assumptions used were as follows:
2016 2015
Discount rate per annum 9% 10%Long term salary increase rate per annum 9% 9.50%Short term salary increase rate per annum (next one year) 12% 9.50%Expected rate of return on plan assets per annum 9% 10%Pension indexation rate per annum 5% 5%Mortality rate SLIC 2001-2005 SLIC 2001-2005Withdrawal rate Low Low
Weighted average duration of the obligation 10 years 10 years
98 Oil & Gas Development Company Limited

Notes to and Forming Part of the Financial StatementsFor the year ended 30 June 2016
The calculation of the defined benefit obligation is sensitive to assumptions set out above. The following table summarizes how the impact on the defined benefit obligation at the end of the reporting period would have increased/(decreased) as a result of a change in respective assumptions:
Impact on defined benefit obligation
Change in assumption
Increase in assumption
Decrease in assumption
-------------(Rupees ‘000)--------------
Discount 1% (6,892,800) 8,286,792 Salary increase 1% 770,009 (990,971)Pension indexation 1% 4,906,249 (4,109,945)Withdrawal 10% 29,044 (21,783)
1 year setback
1 year set forward
-------------(Rupees ‘000)-------------- Mortality 682,525 (653,481)
The impact of changes in assumptions has been determined by revaluation of the obligation on different rates.
The Company expects to make a contribution of Rs 12,583 million (2015: Rs 5,664 million) to the employees’ pension trust during the next financial year.
2016 2015-------------(Rupees ‘000)--------------
9.3 Gratuity fund
Opening liability - -
Expense for the year 26,917 - Other comprehensive income 44,216 - Benefits paid during the year (2,124) -
Closing liability 69,009 -
The expense is recognized in the following:
Operating expenses - profit and loss account 5,620 - General and administration expenses - profit and loss account 17,442 - Technical services 3,855 -
26,917 -
9.4 This includes an amount of Rs 10,500 million (2015: Rs 9,225 million) payable to OGDCL Employees’ Empowerment Trust. The payment of dividend has been withheld since GoP is considering to revamp Benazir Employees’ Stock Option Scheme (BESOS) as communicated to the Company by Privatization Commission of Pakistan (PCP). Further, the PCP vide Letter No. 13(4)12/BESOS/PC/OGDCL dated 21 July 2016 has informed the Company that all activities regarding BESOS have been withheld till decision is made by the Government of Pakistan.
Annual Report 2016 99

Notes to and Forming Part of the Financial StatementsFor the year ended 30 June 2016
10 CONTINGENCIES AND COMMITMENTS
10.1 CONTINGENCIES
10.1.1 Claims against the Company not acknowledged as debts amounted to Rs 1,556.580 million at year end (2015: Rs 1,483.728 million).
10.1.2 Certain banks have issued guarantees on behalf of the Company in ordinary course of business aggregating Rs 1.707 million (2015: Rs 1.707 million), refer note 23.1 to the financial statements.
10.1.3 The Company’s share of associate contingencies at year end are as follows:
Indemnity bonds given to Collector of Customs against duty concessions on import of equipment and materials amounted to Rs 1.045 million (2015: Rs 1.045 million).
10.1.4 For contingencies related to tax matters, refer note 21.1 to 21.4 and note 30.2.
10.1.5 For contingencies related to sales tax and federal excise duty, refer note 18.1 and 18.2.
10.2 COMMITMENTS
10.2.1 Commitments outstanding at year end amounted to Rs 48,618.352 million (2015: Rs 61,786.278 million). These include amounts aggregating to Rs 24,779.797 million (2015: Rs 27,052.325 million) representing the Company’s share in the minimum work commitments under Petroleum Concession Agreements.
10.2.2 Letters of credit issued by various banks on behalf of the Company in ordinary course of the business, outstanding at year end amounted to Rs 22,235.046 million (2015: Rs 12,711.536 million).
10.2.3 The Company’s share of associate commitments at year end is as follows:
2016 2015-------------(Rupees ‘000)--------------
Capital expenditure:
Share in joint operations 1,218,299 1,501,493 Others 42,454 119,226
1,260,753 1,620,719
100 Oil & Gas Development Company Limited

Notes to and Forming Part of the Financial StatementsFor the year ended 30 June 2016
11
PR
OP
ER
TY,
PLA
NT
AN
D E
QU
IPM
EN
T
(Rup
ees
‘000
)
Des
crip
tion
Free
hold
la
ndLe
aseh
old
la
nd
Build
ings
, of
fices
and
ro
ads
on
freeh
old
land
Build
ings
, of
fices
and
ro
ads
on
leas
ehol
d
land
Plan
t and
m
achi
nery
Rigs
Pipe
lines
Offi
ce a
nd
dom
estic
eq
uipm
ent
Offi
ce a
nd
tech
nica
l da
ta
com
pute
rs
Furn
iture
an
d
fixtu
res
Vehi
cles
Dec
om-
miss
ioni
ng
cost
Cap
ital
wor
k in
pr
ogre
ss
(Not
e 11
.3)
Stor
es h
eld
for c
apita
l ex
pend
iture
Tota
l
Cos
t
Bala
nce
as a
t 1 J
uly
2014
248
,974
5
4,03
9 4
,274
,867
5
,242
,730
7
6,07
2,64
9 5
,047
,366
1
1,99
9,81
6 7
84,5
62
1,6
81,1
81
122
,234
5
,260
,728
1
,645
,073
2
0,63
6,85
7 2
,113
,359
1
35,1
84,4
35
Addi
tions
dur
ing
the
year
5,6
06
-
63,
070
141
,870
1
6,02
7,13
0 1
5,87
2 3
,322
,040
1
52,7
27
121
,123
1
3,57
0 2
74,4
26
88,
603
35,
811,
246
2,8
58,0
62
58,
895,
345
Revis
ion
due
to c
hang
e in
est
imat
e -
-
-
-
-
-
-
-
-
-
-
(3
93,9
05)
-
-
(393
,905
)
Disp
osal
s/tra
nsfe
rs d
urin
g th
e ye
ar -
-
-
-
(4
5,76
2) (1
8,17
5) (2
,385
) (3
,110
) (2
0,37
3) (8
8) (1
42,1
86)
-
(12,
406,
934)
(1,0
54,9
93)
(13,
694,
006)
Adju
stm
ents
-
-
(9
55)
-
321
,851
(4
09,4
71)
-
84,
756
3,8
74
-
(55)
-
-
-
-
Bala
nce
as a
t 30
June
201
5 2
54,5
80
54,
039
4,3
36,9
82
5,3
84,6
00
92,
375,
868
4,6
35,5
92
15,
319,
471
1,0
18,9
35
1,7
85,8
05
135
,716
5
,392
,913
1
,339
,771
4
4,04
1,16
9 3
,916
,428
1
79,9
91,8
69
Bala
nce
as a
t 1 J
uly
2015
254
,580
5
4,03
9 4
,336
,982
5
,384
,600
9
2,37
5,86
8 4
,635
,592
1
5,31
9,47
1 1
,018
,935
1
,785
,805
1
35,7
16
5,3
92,9
13
1,3
39,7
71
44,
041,
169
3,9
16,4
28
179
,991
,869
Addi
tions
dur
ing
the
year
1,6
78
-
103
,141
2
61,8
48
11,
636,
241
401
,193
9
33,2
61
158
,427
1
44,6
46
16,
263
306
,467
2
69,9
47
15,
164,
178
1,9
28,0
20
31,
325,
310
Revis
ion
due
to c
hang
e in
est
imat
e -
-
-
-
-
-
-
-
-
-
-
2
05,6
56
-
-
205
,656
Disp
osal
s/tra
nsfe
rs d
urin
g th
e ye
ar -
-
-
-
(1
77,9
60)
(13,
342)
-
(3,3
16)
(23,
582)
-
(191
,910
) -
(9
,542
,219
) (3
,177
,210
) (1
3,12
9,53
9)
Adju
stm
ents
-
-
-
-
(6
7,09
4) -
-
-
6
7,09
4 -
-
-
-
-
-
Bala
nce
as a
t 30
June
201
6 2
56,2
58
54,
039
4,4
40,1
23
5,6
46,4
48
103
,767
,055
5
,023
,443
1
6,25
2,73
2 1
,174
,046
1
,973
,963
1
51,9
79
5,5
07,4
70
1,8
15,3
74
49,
663,
128
2,6
67,2
38
198
,393
,296
Dep
reci
atio
n
Bala
nce
as a
t 1 J
uly
2014
-
48,
694
1,6
69,0
85
1,3
57,4
79
41,
730,
757
1,4
08,2
69
9,1
47,7
48
632
,644
1
,346
,977
8
8,67
7 4
,416
,098
1
,226
,261
-
1
72,0
84
63,
244,
773
Cha
rge/
(reve
rsal
) for
the
year
-
2,1
45
266
,312
2
39,9
04
4,9
29,1
90
323
,394
6
08,4
68
78,
107
217
,699
8
,937
3
19,5
94
(302
,381
) -
(6
9,10
1) 6
,622
,268
On
disp
osal
s -
-
-
-
(4
5,72
6) (1
8,15
6) (2
,384
) (2
,991
) (1
9,53
4) (8
1) (1
05,0
85)
-
-
-
(193
,957
)
Adju
stm
ents
-
-
(45)
-
-
-
-
52
45
-
(52)
-
-
- -
Bala
nce
as a
t 30
June
201
5 -
5
0,83
9 1
,935
,352
1
,597
,383
4
6,61
4,22
1 1
,713
,507
9
,753
,832
7
07,8
12
1,5
45,1
87
97,
533
4,6
30,5
55
923
,880
-
1
02,9
83
69,
673,
084
Bala
nce
as a
t 1 J
uly
2015
-
50,
839
1,9
35,3
52
1,5
97,3
83
46,
614,
221
1,7
13,5
07
9,7
53,8
32
707
,812
1
,545
,187
9
7,53
3 4
,630
,555
9
23,8
80
-
102
,983
6
9,67
3,08
4
Char
ge fo
r the
yea
r -
2
,145
2
64,8
00
246
,675
5
,655
,286
4
54,7
60
892
,170
8
2,47
6 2
17,7
07
6,9
78
315
,205
9
4,90
8 -
(1
0,89
2) 8
,222
,218
On
disp
osal
s -
-
-
-
(1
77,7
61)
(13,
323)
-
(3,1
88)
(23,
077)
-
(162
,107
) -
-
-
(3
79,4
56)
Adju
stm
ents
-
-
-
-
(5
,909
) 7
18
-
-
5,1
91
-
-
-
-
-
-
Bala
nce
as a
t 30
June
201
6 -
5
2,98
4 2
,200
,152
1
,844
,058
5
2,08
5,83
7 2
,155
,662
1
0,64
6,00
2 7
87,1
00
1,7
45,0
08
104
,511
4
,783
,653
1
,018
,788
-
9
2,09
1 7
7,51
5,84
6
Impa
irmen
t
Bala
nce
as a
t 1 J
uly
2014
-
-
-
-
135
,008
-
3
33
-
-
-
-
327
-
-
1
35,6
68
Cha
rge
for t
he y
ear
-
-
61,
204
128
,386
8
,709
-
-
-
-
-
1
,079
-
-
-
1
99,3
78
Bala
nce
as a
t 30
June
201
5 -
-
6
1,20
4 1
28,3
86
143
,717
-
3
33
-
-
-
1,0
79
327
-
-
3
35,0
46
Bala
nce
as a
t 1 J
uly
2015
-
-
61,
204
128
,386
1
43,7
17
-
333
-
-
-
1
,079
3
27
-
-
335
,046
Cha
rge
for t
he y
ear
-
-
-
-
-
-
-
-
-
-
-
-
-
-
-
Bala
nce
as a
t 30
June
201
6 -
-
6
1,20
4 1
28,3
86
143
,717
-
3
33
-
-
-
1,0
79
327
-
-
3
35,0
46
Car
ryin
g am
ount
- 30
Jun
e 20
15 2
54,5
80
3,2
00
2,3
40,4
26
3,6
58,8
31
45,
617,
930
2,9
22,0
85
5,5
65,3
06
311
,123
2
40,6
18
38,
183
761
,279
4
15,5
64
44,
041,
169
3,8
13,4
45
109
,983
,739
Car
ryin
g am
ount
- 30
Jun
e 20
16 2
56,2
58
1,0
55
2,1
78,7
67
3,6
74,0
04
51,
537,
501
2,8
67,7
81
5,6
06,3
97
386
,946
2
28,9
55
47,
468
722
,738
7
96,2
59
49,
663,
128
2,5
75,1
47
120
,542
,404
Rate
s of
dep
reci
atio
n (%
) -
3
.3~4
2
.5~8
2
.5~8
4
~20
10
10
15
33.
33
10
20
2.5
~10
-
-
Annual Report 2016 101

Notes to and Forming Part of the Financial StatementsFor the year ended 30 June 2016
11.1 Cost and accumulated depreciation as at 30 June 2016 include Rs 48,173 million (2015: Rs 40,425 million) and Rs 26,284 million (2015: Rs 23,019 million) respectively being the Company’s share in property, plant and equipment relating to joint operations operated by other working interest owners.
2016 2015Note --------------(Rupees ‘000)---------------
11.2 The depreciation charge has been allocated to:
Operating expenses 25 6,893,094 5,525,660 General and administration expenses 28 205,799 197,940 Technical services 1,123,325 898,668
8,222,218 6,622,268
11.3 Capital work in progress
Production facilities and other civil works in progress:Wholly owned 47,809,254 36,790,973 Joint operations 1,843,702 7,231,739
49,652,956 44,022,712 Construction cost of field offices and various bases/offices owned by the Company 10,172 18,457
49,663,128 44,041,169
102 Oil & Gas Development Company Limited

Notes to and Forming Part of the Financial StatementsFor the year ended 30 June 2016
11.4 Details of property, plant and equipment sold: Cost Book Salevalue proceeds
---------------------------(Rupees ‘000)---------------------------Vehicles sold to following in-service/retiring employees as per Company’s policy:
Mr. Mirza Khalid Baig 1,772 1,614 1,614 Syed Mazhar Ali 1,772 1,604 1,604 Syed Rashid Hassan 1,772 1,650 1,650 Mr. Siraj Ali 1,772 1,622 1,622 Mr. Maqbool Ahmed Somro 1,727 1,070 1,070 Mr. Saleem Ahmed Khan 1,707 937 937 Mr. Rashid Javaid 1,702 1,080 1,080 Mr. Murad Niaz Khan 1,692 565 565 Mr. Mushtaq Ahmad 1,692 484 484 Mr. Asad Ahmed Asad 1,692 523 523 Capt® Muhammad Siddique Awan 1,691 774 774 Mr. Raja Arshad Sultan 1,691 614 614 Mr. Muneer Ahmad Khan 1,571 189 189 Mr. Agha Mujeeb Ur Rehman 1,569 344 344 Mr. Rooh Ullah 1,569 296 296 Mr. Tahir Shaukat 1,569 236 236 Mr. Muhammad Amjad Ehsan 1,569 259 259 Mr. Aijaz Kaleem Ashraf 1,546 1 155 Mr. Basharat Ali Mirza 1,539 346 346 Ms. Mehurnisa Jehangir 1,539 180 180 Mr. Bashir Ahmad 1,477 59 149 Mr. Jehangaz Khan 1,441 1 144 Mr. Tariq Mehmood 1,441 1 144 Mr. Khwaja Masood Ahmed 1,429 1 143 Mr. Daud Ahmad Butt 1,429 1 143 Mr. Asif Nasim 1,429 1 143 Mr. Muhammad Sabir Khan 1,399 1 140 Mr. Muhammad Ismail Laghari 1,210 1 140 Mr. Abdul Jamil Khan 1,203 961 961 Mr. Noor Muhammad 1,073 770 770 Mrs. Lubna Hassan 1,073 817 817 Mr. Shahnawaz Rajpoot 1,024 468 468 Mr. Muhammad Irfan Khan 1,024 516 516 Mr. Ikram Ullah Khan 1,024 551 551 Mr. Qamar Raza 1,024 606 606 Mr. Sultan Mehmood 1,024 534 534 Syed Rashid Hassan 1,023 473 473 Mr. Shrafat Ali 1,003 373 373 Mr. Muhammad Arif Bhutto 1,003 422 422 Mr. Abdul Ghani Memon 1,003 464 464 Mr. Abdullah Bajir 1,003 469 469 Mr. Iftikhar Abbasi 1,003 460 460
Annual Report 2016 103

Notes to and Forming Part of the Financial StatementsFor the year ended 30 June 2016
Cost Book Salevalue proceeds
---------------------------(Rupees ‘000)---------------------------Vehicles sold to following in-service/retiring employees as per Company’s policy - continued
Mrs. Nusrat Parveen 1,003 453 453 Mr. Javed Iqbal 1,003 456 456 Mr. Muhammad Saghir 1,003 468 468 Mr. Muhammad Iqbal Khan 1,003 473 473 Mr. Manzoor Ahsan 1,003 476 476 Mr. Nazar Abbas Zaidi 1,003 473 473 Mr. Muhammad Tariq Iqbal 1,003 530 530 Mr. Mazhar Ali 1,003 416 416 Mr. Arshad Mehmood 1,003 431 431 Mr. Shahid Waqar Malik 1,003 416 416 Mr. Muhammad Nawaz 968 259 259 Mr. Abdur Raziq Khattak 965 350 350 Mr. Etezaz Ud Din Ahmed 965 369 369 Mr. Jamal Nasir 965 348 348 Dr. Mubashar Ayaz Wyn 925 253 253 Mr. Muhammad Ajaz Sarwar 925 262 262 Dr. Ruhee Fahim 925 308 308 Mr. Muhammad Munir Memon 925 327 327 Mr. Muhammad Iqbal Khosa 925 269 269 Ms. Farida Habib 843 19 84 Mr. Mirza Abdul Waheed 818 1 82 Mr. Khalid Javed 818 1 82 Mr. Shoaib Shabih 818 1 82 Mr. Sher Ullah Khan 818 1 82 Mr. Muhammad Akram Qureshi 818 1 82 Mr. Munawar Ali Khan 818 1 82 Mr. Shoaib Khan 818 1 82 Mr. Muhammad Asghar 817 1 82 Syed Hassan Abbas 817 1 82 Mr. Zafar Ullah 817 1 82
86,453 29,704 31,813
Computers/mobiles sold to employees as per Company’s policy 11,643 348 1,378
Aggregate of other items of property, plant and equipment with individual book value not exceeding Rs 50,000, sold through public auction 202,095 550 57,922
Items written off during the year 109,919 52 - 30 June 2016 410,110 30,654 91,113
30 June 2015 232,079 38,122 56,442
104 Oil & Gas Development Company Limited

Notes to and Forming Part of the Financial StatementsFor the year ended 30 June 2016
12 DEVELOPMENT AND PRODUCTION ASSETS - intangible(Rupees ‘000)
DescriptionProducing fields Shut-in fields Wells in
progress (Note 12.1)
Sub totalDecom-
missioning cost
TotalWholly owned
Joint operations
Wholly owned
Joint operations
Cost
Balance as at 1 July 2014 56,662,299 77,159,798 5,628,217 15,560,634 4,894,681 159,905,629 7,863,805 167,769,434
Adjustment 138,082 2,826,198 (138,082) (2,826,198) - - - -
Additions during the year - - - - 15,497,846 15,497,846 692,401 16,190,247
Revision due to change in estimate - - - - - - (3,038,148) (3,038,148)
Transfer from exploration and evaluation assets during the year 3,142,089 905,247 2,486,770 2,938,012 - 9,472,118 - 9,472,118
Transfers in/(out) during the year 2,804,640 9,548,048 - 2,972,975 (15,325,663) - - -
Balance as at 30 June 2015 62,747,110 90,439,291 7,976,905 18,645,423 5,066,864 184,875,593 5,518,058 190,393,651
Balance as at 1 July 2015 62,747,110 90,439,291 7,976,905 18,645,423 5,066,864 184,875,593 5,518,058 190,393,651
Adjustment (191,393) (596,044) 191,393 596,044 - - - -
Additions during the year - - - - 17,728,636 17,728,636 831,490 18,560,126
Revision due to change in estimate - - - - - - (1,898,767) (1,898,767)
Transfer from exploration and evaluation assets during the year 1,531,998 1,887,665 2,150,270 4,652,100 - 10,222,033 - 10,222,033
Transfers in/(out) during the year 6,400,016 7,447,147 122,356 1,509,998 (15,479,517) - - -
Balance as at 30 June 2016 70,487,731 99,178,059 10,440,924 25,403,565 7,315,983 212,826,262 4,450,781 217,277,043
Amortization
Balance as at 1 July 2014 37,586,738 48,162,315 322,631 462,003 - 86,533,687 5,949,325 92,483,012
Adjustment (91,493) 29,329 91,493 (29,329) - - - -
Charge/(reversal of charge) for the year 4,642,207 12,856,284 - - - 17,498,491 (1,217,154) 16,281,337
Balance as at 30 June 2015 42,137,452 61,047,928 414,124 432,674 - 104,032,178 4,732,171 108,764,349
Balance as at 1 July 2015 42,137,452 61,047,928 414,124 432,674 - 104,032,178 4,732,171 108,764,349
Adjustment (320,545) (413,375) 169,009 413,376 - (151,535) (440,826) (592,361)
Charge/(reversal of charge) for the year 5,047,860 11,407,703 24,771 32,271 - 16,512,605 (1,246,037) 15,266,568
Balance as at 30 June 2016 46,864,767 72,042,256 607,904 878,321 - 120,393,248 3,045,308 123,438,556
Impairment
Balance as at 1 July 2014 545,089 - 332,013 - - 877,102 79,847 956,949
Adjustment - - (154,847) 154,847 - - - -
Charge for the year - 1,004,360 - 1,391,639 - 2,395,999 15,667 2,411,666
Balance as at 30 June 2015 545,089 1,004,360 177,166 1,546,486 - 3,273,101 95,514 3,368,615
Balance as at 1 July 2015 545,089 1,004,360 177,166 1,546,486 - 3,273,101 95,514 3,368,615
Adjustment 437,291 - - - - 437,291 155,070 592,361
Charge for the year 709,154 - 788,869 373,810 - 1,871,833 14,718 1,886,551
Balance as at 30 June 2016 1,691,534 1,004,360 966,035 1,920,296 - 5,582,225 265,302 5,847,527
Carrying amounts - 30 June 2015 20,064,569 28,387,003 7,385,615 16,666,263 5,066,864 77,570,314 690,373 78,260,687
Carrying amounts - 30 June 2016 21,931,430 26,131,443 8,866,985 22,604,948 7,315,983 86,850,789 1,140,171 87,990,960
2016 2015
--------(Rupees ‘000)-------
12.1 Wells in progress at year end represent:
Wholly owned 3,277,101 2,137,978
Joint operations 4,038,882 2,928,886
7,315,983 5,066,864
Annual Report 2016 105

Notes to and Forming Part of the Financial StatementsFor the year ended 30 June 2016
2016 2015 Note --------------(Rupees ‘000)--------------
13 EXPLORATION AND EVALUATION ASSETS
Balance at beginning of the year 6,103,544 7,913,076 Additions during the year 14,182,070 12,512,724
20,285,614 20,425,800 Cost of dry and abandoned wells during the year 27 (4,909,724) (4,850,138)Cost of wells transferred to development and production assetsduring the year (10,222,033) (9,472,118)
(15,131,757) (14,322,256) 5,153,857 6,103,544
Stores held for exploration and evaluation activities 13.1 1,680,221 2,035,892 Balance at end of the year 6,834,078 8,139,436
13.1 Stores held for exploration and evaluation activities
Balance at beginning of the year 2,035,892 1,724,712 Additions 1,155,565 1,123,234 Issuances (1,511,236) (812,054)Balance at end of the year 1,680,221 2,035,892
13.2 Liabilities, other assets and expenditure incurred on exploration and evaluation activities are:
Liabilities related to exploration and evaluation 2,303,095 883,804
Exploration and prospecting expenditure 27 14,548,295 11,627,518
14 LONG TERM INVESTMENTS
Investment in related party 14.1 3,393,185 1,401,173 Investments held to maturity 14.2 109,124,107 129,792,155
112,517,292 131,193,328
14.1 Investment in related party - associate, quoted
Mari Petroleum Company Limited (MPCL)Cost of investment (22,050,000 (2015: 22,050,000) fully paid ordinary shares of Rs 10 each including 14,700,000 (2015: 14,700,000) bonus shares) 73,500 73,500
Post acquisition profits brought forward 1,327,673 302,307 1,401,173 375,807
Share of profit for the year - net of taxation 14.1.2 2,188,899 1,043,741
Share of other comprehensive loss of the associate - net of taxation (17,125) - Dividend received (179,762) (18,375)
1,992,012 1,025,366 3,393,185 1,401,173
106 Oil & Gas Development Company Limited

Notes to and Forming Part of the Financial StatementsFor the year ended 30 June 2016
14.1.1 MPCL is incorporated in Pakistan and is principally engaged in exploration, production and sale of hydrocarbons. The Company has 20% (2015: 20%) holding in the associate. The market value of the investment in associate as of the year end is Rs 20,026 million (2015: Rs 10,333 million).
14.1.2 Share of profit for the year ended 30 June 2016 includes Rs 978.608 million related to prior years.
14.1.3 The tables below provide summarized financial information for the associate that is material to the Company. The information disclosed reflects the amounts presented in the annual audited financial statements of the associate for the year ended 30 June 2016 and not the Company’s share of those amounts.
2016 2015---------------(Rupees ‘000)---------------
Summarized balance sheet
Current assets 32,727,282 41,868,075 Non-current assets 26,832,365 23,785,743 Current liabilities (35,017,149) (39,398,626)Non-current liabilities (7,576,575) (14,758,974)Net assets 16,965,923 11,496,218
Reconciliation to carrying amounts:
Opening net assets 11,496,218 16,822,231 Total comprehensive income for the year 5,965,830 5,674,228 Opening net assets transferred to redeemable preference shares - liability - (10,590,001)Dividends paid (496,125) (410,240)Closing net assets 16,965,923 11,496,218
Company's percentage shareholding in the associate 20% 20%
Company's share in carrying value of net assets 3,393,185 2,299,244
Others - (898,071)
Carrying amount of investment 3,393,185 1,401,173
Summarized statement of comprehensive income
Revenue for the year 94,997,719 88,239,537
Profit for the year 6,051,455 5,650,313 Other comprehensive (loss)/income for the year (85,625) 23,915 Total comprehensive income for the year 5,965,830 5,674,228
14.1.4 Effective 1 July 2014, the cost plus wellhead gas pricing formula is replaced with a crude oil price linked formula which provides a discounted wellhead gas price to be gradually achieved in five (5) years from 1 July 2014. The revised formula provides dividend distribution to be continued for next ten (10) years in line with the previous cost plus formula and any residual profit are to be reinvested for exploration and development activities in Mari as well as outside Mari field. Under the revised formula, the Government of Pakistan will no more provide exploration funds to MPCL. MPCL has issued non voting, non-cumulative redeemable preference shares during the year ended 30 June 2015, against undistributable balance of profit and loss account at 30 June 2014 and investment of Government of Pakistan in Mari Seismic Unit amounting to Rs 10,590 million. During the year ended 30 June 2016, MPCL approved redemption of all preference shares in cash after obtaining requisite approvals of Board of Directors, members and Government of Pakistan (GoP). The Economic Coordination Committee (ECC) of the Cabinet approved the above arrangement and the revised Mari Wellhead Gas Price Agreement was signed by MPCL and the President of Islamic Republic of Pakistan on 29 July 2015.
Annual Report 2016 107

Notes to and Forming Part of the Financial StatementsFor the year ended 30 June 2016
2016 2015Note ---------------(Rupees ‘000)---------------
14.2 Investments held to maturity
Term Deposit Receipts (TDRs) 14.2.1 6,384,972 5,862,129 Investment in Pakistan Investment Bonds (PIBs) 14.2.2 51,489,135 52,180,026 Investment in Term Finance Certificates 14.2.3 82,000,000 82,000,000
139,874,107 140,042,155 Less: Current maturity of Term Finance Certificates (30,750,000) (10,250,000)
109,124,107 129,792,155
14.2.1 These represent investments in local currency TDRs. Face value of these investments is Rs 6,385 million (2015: Rs 5,862 million) and carry effective interest rate of 7.35% (2015: 9.91%) per annum. These investments are due to mature within next 12 months, however, these have not been classified as current assets based on the management’s intention to reinvest them in the like investments for a longer term. These investments are earmarked against self insurance reserve as explained in note 5.2 to the financial statements.
14.2.2 In 2013, Ministry of Finance, Government of Pakistan, approved the plan for partial settlement of circular debt issue prevailing in the energy sector. These PIBs were subscribed by the Company in order to settle its overdue receivables from oil refineries and gas companies. The face value of these PIBs is Rs 50.773 billion carrying interest rate of 11.50% per annum. These PIBs were issued on 19 July 2012 for a period of five years maturing on 19 July 2017. Premium on investment is amortized over the remaining term of the investment using effective interest method.
14.2.3 This represents investment in Privately Placed Term Finance Certificates (TFCs) amounting to Rs 82 billion. In 2013, the Government of Pakistan, for partial resolution of circular debt issue prevailing in the energy sector, approved issuance of TFCs amounting to Rs 82 billion by Power Holding (Private) Limited (PHPL). These TFCs were subscribed by the Company in order to settle its overdue receivables from oil refineries and gas companies.
TFCs are for a period of seven (7) years including grace period of three (3) years carrying interest rate of KIBOR + 1%, payable semi-annually. The principal portion of these TFCs shall be repaid in eight (8) equal installments starting from 42nd month of date of transaction. National Bank of Pakistan executed the transaction on 10 September 2012 as Trustee. These TFCs are secured by Sovereign Guarantee, covering the principal, markup, and/or any other amount becoming due for payment in respect of investment in TFCs. Principal repayment amounting to Rs 10,250 million (2015: Rs Nil) is past due as at 30 June 2016. Further, interest due as of 30 June 2016 was Rs 18,139 million (2015: Rs 11,502 million) of which Rs 16,270 million (2015: Rs 9,151 million) was past due as of the balance sheet date. The Company considers the principal and interest to be fully recoverable as these are backed by Sovereign Guarantee of Government of Pakistan.
2016 2015Note --------------(Rupees ‘000)----------------
15 LONG TERM LOANS AND RECEIVABLE
Long term loans:Secured 15.1 5,757,931 5,692,868 Un-secured 15.2 239,738 239,738
5,997,669 5,932,606
15.1 Long term loans - secured
Considered good:Executives 4,618,807 3,801,069 Other employees 2,095,113 2,848,183
6,713,920 6,649,252 Current portion shown under loans and advances 18 (955,989) (956,384)
5,757,931 5,692,868
108 Oil & Gas Development Company Limited

Notes to and Forming Part of the Financial StatementsFor the year ended 30 June 2016
15.1.1 Movement of carrying amount of loans to executives and other employees:
Balance Disbursements Adjustments Repayments Balanceas at during the during the during the as at
1 July 2015 year year year 30 June 2016
--------------------------------------------------(Rupees ‘000)--------------------------------------------------Due from:
Executives 3,801,069 331,764 1,157,913 (671,939) 4,618,807 Other employees 2,848,183 649,836 (1,157,913) (244,993) 2,095,113
30 June 2016 6,649,252 981,600 - (916,932) 6,713,920
30 June 2015 5,722,379 1,760,951 - (834,078) 6,649,252
15.1.2 The loans are granted to the employees of the Company in accordance with the Company’s service rules. House building and conveyance loans are for maximum period of 15 and 5 years respectively. These loans are secured against the underlying assets. Included in these are loans of Rs 5,635.351 million (2015: Rs 5,506.893 million) which carry no interest. The balance amount carries an effective interest rate of 10.53% (2015: 11.79%) per annum. Interest free loans to employees have not been discounted as required by IAS 39, ‘Financial Instruments: Recognition and Measurement’ as the amount involved is deemed immaterial.
The maximum amount due from executives at the end of any month during the year was Rs 4,618.807 million (2015: Rs 3,801.069 million).
15.2 The Company and other working interest owners in Chanda, Nashpa and Tal joint operations have entered into an agreement dated 20 October 2010 with National Highway Authority (NHA) for provision of interest free loan to NHA amounting to Rs 700 million for construction of new Bridge on River Indus, district Kohat. The bridge will facilitate operations of these joint operations including transportation of crude oil & condensate, materials & equipment and staff etc. According to the agreement, share of Tal, Nashpa and Chanda joint operations in the loan will be 68.63%, 23.09% and 8.28% respectively and will be paid to NHA by the Company in stages based on percentage completion of work. Proportionate share in stage-wise payments of the loan will be recovered by the Company from other working interest owners.
As per terms and conditions of the agreement, NHA will design, construct, operate and maintain the new bridge and shall commission the bridge within 27 months from the date of agreement. NHA shall not charge the Company and other operator the toll tax for the use of new bridge till the entire loan stands repaid. The loan is repayable by NHA in seven years in 84 equal monthly installments, with grace period of one year, starting from one year after the commissioning of the bridge. The bridge has been inaugurated on 28 July 2014 and is currently operational. The amount of Rs 239.738 million as on 30 June 2016 (2015: Rs 239.738 million) represents the Company’s net share, based on effective working interest ownership of 38.05% (2015: 38.05%) which have not been discounted as required by IAS 39, ‘Financial Instruments: Recognition and Measurement’ as the amount involved is deemed immaterial.
2016 2015Note ---------------(Rupees ‘000)--------------
16 STORES, SPARE PARTS AND LOOSE TOOLS
Stores, spare parts and loose tools 20,069,409 19,251,264 Stores and spare parts in transit 965,949 216,764
21,035,358 19,468,028 Provision for slow moving, obsolete and in transit stores 16.1 (2,784,174) (2,620,996)
18,251,184 16,847,032
16.1 Movement of provision for slow moving, obsolete and in transit stores
Balance as at 1 July 2,620,996 2,383,569 Provision for the year 163,178 237,427 Balance as at 30 June 2,784,174 2,620,996
Annual Report 2016 109

Notes to and Forming Part of the Financial StatementsFor the year ended 30 June 2016
2016 2015---------------(Rupees ‘000)--------------
17 TRADE DEBTS
Un-secured, considered good 111,204,979 121,411,485 Un-secured, considered doubtful 111,989 112,782
111,316,968 121,524,267 Provision for doubtful debts (111,989) (112,782)Trade debts written off (793) -
111,204,186 121,411,485
17.1 Trade debts include overdue amount of Rs 78,704 million (2015: Rs 76,990 million) on account of Inter-Corporate Circular debt, receivable from oil refineries and gas companies out of which Rs 59,395 million (2015: Rs 60,702 million) and Rs 16,525 million (2015: Rs 10,380 million) is overdue from related parties, Sui Southern Gas Company Limited and Sui Northern Gas Pipeline Limited respectively. The Government of Pakistan (GoP) is pursuing for satisfactory settlement of Inter-Corporate Circular debt issue and the Company considers this amount to be fully recoverable.
17.2 Included in trade debts is an amount of Rs 3,171 million (2015: Rs 8,043 million) receivable from three Independent Power Producers and a fertilizer Company on account of Gas Infrastructural Development Cess (GIDC) and related sales tax paid/payable thereon. Retrospective imposition of GIDC has finally been confirmed by the Government of Pakistan through promulgation of GIDC Act 2015. Accordingly, where applicable, the Company has charged GIDC to its customers and has recognized its liability in these financial statements.
2016 2015Note ---------------(Rupees ‘000)--------------
18 LOANS AND ADVANCES
Advances considered good: Suppliers and contractors 2,046,796 1,070,013 Partners in joint operations 2,065,882 2,463,683 Sales tax 18.1 & 18.2 4,816,374 3,511,537 Others 574,568 42,151
9,503,620 7,087,384 Current portion of long term loans - secured 15.1 955,989 956,384
10,459,609 8,043,768 Advances considered doubtful 187,033 187,033
10,646,642 8,230,801 Provision for doubtful advances (187,033) (187,033)
10,459,609 8,043,768
18.1 This includes an amount of Rs 3,180 million (2015: Rs 3,180 million) paid under protest to Federal Board of Revenue (FBR) on account of sales tax demand raised in respect of capacity invoices from Uch Gas Field for the period July 2004 to March 2011. Based on Sales Tax General Order (STGO) 1 of 2000 dated 24 January 2000, the matter was argued before various appellate forums, however, the Supreme Court of Pakistan finally decided the issue against the Company on 15 April 2013. The FBR granted time relaxation to the Company for issuance of debit note for an amount of Rs 750 million for the period April 2011 to May 2012, accounted for as trade debt. Uch Power Limited (UPL) challenged the grant of time relaxation to the Company by FBR before Islamabad High Court. On 27 December 2013, the Honorable Court decided the matter in favor of the Company. In light of the Islamabad High Court decision, the Company has applied to FBR for obtaining condonation of time limit for issuing debit notes to UPL for the remaining amount of Rs 3,180 million for the period July 2004 to March 2011 and currently the matter is pending with FBR.
UPL has filed an Intra Court appeal against the decision of the Islamabad High Court and the Islamabad High Court has granted stay against recovery of Rs 750 million to UPL. Management and its legal advisor are confident that the stay will be vacated and the Intra Court appeal by UPL will also be decided in favor of the Company.
110 Oil & Gas Development Company Limited

Notes to and Forming Part of the Financial StatementsFor the year ended 30 June 2016
18.2 This also includes recoveries of Rs 317 million (2015: Rs Nil) made by the tax department against sales tax and Federal Excise Duty (FED) demand of Rs 6,699 million, issued by the Deputy Commissioner Inland Revenue (DCIR). In addition, DCIR has also issued a show cause notice of Rs 5,271 million against sales tax and FED, response against which is yet to be submitted by the management. These demands and show cause notice have been raised by tax authorities due to difference between computation of sales/production reported by the Company in its sales tax return and sales/production based on other sources of data. The Company has filed an appeal before the Appellate Tribunal Inland Revenue (ATIR), Islamabad and the hearing is yet to be fixed. The Company has obtained stay from ATIR against further recovery of the outstanding demand notice. The Company believes that these demands have been raised without legal validity.
2016 2015Note --------------(Rupees ‘000)----------------
19 DEPOSITS AND SHORT TERM PREPAYMENTS
Security deposits 22,112 21,025 Short term prepayments 1,624,665 1,393,408
1,646,777 1,414,433
20 OTHER RECEIVABLES
Development surcharge 80,391 80,391 Claims receivable 78,134 31,504 Others 23,686 71,930
182,211 183,825 Claims considered doubtful 10,439 10,439
192,650 194,264 Provision for doubtful claims (10,439) (10,439)
182,211 183,825
21 INCOME TAX - ADVANCE
Income tax - advance at beginning of the year 24,059,740 14,319,141 Income tax paid during the year 35,025,909 50,613,873 Income tax recovered by tax authorities during the year 50,558 3,942,695 Provision for current taxation for the year - Profit and loss account 30 (21,853,820) (37,279,117)Tax credit related to remeasurement loss on employee retirement benefit plans for the year - Other Comprehensive Income 4,026,760 624,129 Provision for taxation - prior years 30 289,894 (8,160,981)Income tax - advance at end of the year 21.1 to 21.4 41,599,042 24,059,740
21.1 This includes amount of Rs 13,846 million (2015: Rs 13,225 million) paid to tax authorities on account of disallowance of actuarial loss amounting to Rs 27,556 million which the Company claimed in its return for the tax years 2014 and 2015. This actuarial loss was recognized in the books as a result of retrospective application of IAS 19 (as revised in June 2011) ‘Employee Benefits’ from the year ended 30 June 2014 and onwards. The Commissioner Inland Revenue Appeals (CIRA) through its order dated 3 November 2015 related to tax year 2014, accepted the Company’s viewpoint, however, ordered to claim the expenditure over a period of seven years. The Company has filed an appeal against the order of CIRA in Appellate Tribunal Inland Revenue which is currently pending. The management, based on opinion of its tax consultant dated 29 January 2015, believes that there is reasonable probability that the matter will be decided in favor of the Company by appellate forums available under the law.
Annual Report 2016 111

Notes to and Forming Part of the Financial StatementsFor the year ended 30 June 2016
21.2 During the year ended 30 June 2014, tax authorities raised demands of Rs 13,370 million by disallowing effect of price discount on sale of crude from Kunnar field and have recovered Rs 5,368 million (2015: Rs 5,317 million) from the Company upto 30 June 2016. During the year ended 30 June 2015, appeal before Appellate Tribunal Inland Revenue (ATIR) against the said demands were decided against the Company. The Company filed a reference application before Islamabad High Court (IHC) against the decision of ATIR. The Islamabad High Court remanded the case back to ATIR with the instructions to pass a speaking order which is currently pending with ATIR. Further, ATIR has granted stay for recovery of fifty days with effect from 2 August 2016 or till the decision of appeals, whichever is earlier. Management and its legal advisor are of the view that the price discount is not income of the Company and hence not liable to tax. Accordingly, management is confident that the matter will be resolved in favor of the Company as the discounted price for Kunnar field was finally determined by the Ministry of Petroleum and Natural Resources (MP&NR) and the total amount of price discount amount has been paid to the Government of Pakistan (GoP) upon directions from the Ministry of Finance, to this effect.
21.3 Income tax advance includes Rs 2,746 million (2015: Rs Nil) paid to tax authorities during the year on account of super tax relating to tax year 2015. The Company is currently contesting applicability of super tax at the rate of 3 percent of taxable profits from oil and gas operations under Petroleum Concession Agreements (PCAs) and has filed an appeal before CIRA in this respect. Management based on opinion of its tax consultant is confident that the Company has probable chances to defend its case before appellate authorities due to clauses relating to charge of tax under PCAs. Accordingly, no provision has been made in this respect in the financial statements for the years ended 30 June 2015 and 30 June 2016.
21.4 Income tax advance includes Rs 5,805 million (2015: Rs Nil) paid to tax authorities during the year mainly on account of disallowances made by the Additional Commissioner Inland Revenue (ACIR) against workers’ profit participation fund expense, decommissioning cost and employee benefits claimed by the Company in its return of income for the year ended 30 June 2015. The Company has field an appeal with CIRA against the disallowances made by ACIR. Management believes that disallowances are against income tax laws and regulations and accordingly no provision has been made in this respect in the financial statements.
2016 2015Note ---------------(Rupees ‘000)--------------
22 OTHER FINANCIAL ASSETS
Investment in Term Deposits 22.1 11,131,164 9,525,037 Investment at fair value through profit or loss - NIT units 295,800 289,444
11,426,964 9,814,481
22.1 This include foreign currency TDRs amounting to USD 106.305 million (2015: USD 94.448 million), carrying interest rate ranging from 1.60% to 2.65% (2015: 1.75% to 2.35%) per annum, having maturities between one month to three months.
2016 2015 Note --------------(Rupees ‘000)---------------
23 CASH AND BANK BALANCES
Cash at bank:Deposit accounts 23.1 7,692,851 12,849,120 Current accounts 146,976 110,855
7,839,827 12,959,975 Cash in hand 63,939 42,773
7,903,766 13,002,748
23.1 These deposit accounts carry interest rate of 0.20% to 5.75% (2015: 0.20% to 7.00%) per annum and include foreign currency deposits amounting to USD 4.995 million (2015: USD 52.413 million). Deposits amounting to Rs 1.707 million (2015: Rs 1.707 million) with banks were under lien to secure bank guarantees issued on behalf of the Company.
112 Oil & Gas Development Company Limited

Notes to and Forming Part of the Financial StatementsFor the year ended 30 June 2016
2016 2015---------------(Rupees ‘000)---------------
24 SALES - net
Gross sales
Crude oil 59,080,776 94,317,109 Gas 125,009,124 139,478,446 Liquefied petroleum gas 6,285,313 6,751,228 Sulphur 299,907 377,987 Gas processing 60,698 61,771
190,735,818 240,986,541
Government levies
General sales tax (19,132,696) (21,310,910)Gas Infrastructure Development Cess (GIDC) (5,579,173) (5,734,982)Excise duty (3,157,371) (3,315,692)Development surcharge - (49)
(27,869,240) (30,361,633)
162,866,578 210,624,908
24.1 Gas sales include sales from Uch II, Dhachrapur and Nur-Bagla fields invoiced on provisional prices. There may be adjustment in revenue upon issuance of final wellhead prices notification by Ministry of Petroleum and Natural Resources (MP&NR), impact of which cannot be determined at this stage.
24.2 On 20 February 2012, OGDCL entered into an agreement with M/s Jamshoro Joint Venture Limited (JJVL) to process gas from Kunnar Pasahki Deep (KPD) to produce Natural Gas Liquids (NGL), Liquefied Petroleum Gas (LPG ) and Condensate in consideration of gas processing charges. However, Sui Southern Gas Company Limited (SSGCL) claimed that as per applicable petroleum policy the delivery point should be KPD field gate instead of JJVL plant. The matter was discussed between the parties and SSGCL viewpoint was accepted and a term sheet was signed between OGDCL and SSGCL in 2013. Resultantly, the delivery point was changed to KPD field gate and OGDCL renounced its right on LPG, etc., production. Consequently the Company issued a provisional credit note of Rs 2,285 million in prior years related to revenue from sale of LPG, NGL and Condensate from the JJVL plant net of processing and other ancillary charges. OGDCL also recorded a provisional debit note amounting to Rs 164.445 million relating to additional gas sales revenue to SSGCL on account of the change in delivery point from JJVL plant to KPD field gate. These credit and debit notes recorded in the books of accounts in prior years are provisional and the final prices will be agreed between SSGCL and OGDCL upon execution of Gas Sales Agreement (GSA) and adjustments, if any, will be incorporated in the books on finalization of GSA.
24.3 The Company has signed the supplemental Agreements with GoP for conversion of Petroleum Concession Agreements (PCA) to the Petroleum Exploration and Production Policy, 2012 in respect of various blocks. Price regimes prevailing in Petroleum Policy 2007, Petroleum Policy 2009 and Petroleum Policy 2012 shall be applicable correlated with the spud date of wells in the respective policies starting from 27 November 2007 and for future exploratory efforts under respective blocks.
In terms of supplemental agreements, draft statements in respect of Sheikhan, Gopang and Pakhro, TAL block - Mamikhel, Maramzai & Makori East discoveries - have been submitted to the GoP. GoP shall facilitate for issuance of necessary gas price notifications for payments to be made to the parties. Effect of adjustment arising from revision in sale price will be recognized upon issuance of gas price notifications by OGRA.
Annual Report 2016 113

Notes to and Forming Part of the Financial StatementsFor the year ended 30 June 2016
2016 2015 Note ---------------(Rupees ‘000)---------------
25 OPERATING EXPENSES
Salaries, wages and benefits 25.1 15,214,752 14,065,027 Stores and supplies consumed 1,439,904 1,913,121 Contract services 1,854,126 1,709,615 Joint operations expenses 2,250,488 2,089,230 Workover charges 1,398,851 1,091,708 Traveling and transportation 800,648 651,539 Repairs and maintenance 935,596 1,239,635 Rent, fee and taxes 810,339 685,642 Insurance 215,869 309,134 Communication 42,544 42,757 Utilities 336,264 245,186 Land and crops compensation 736,160 553,803 Desalting, decanting and naphtha storage charges 58,104 68,780 Training, welfare and Corporate Social Responsibility (CSR) 2,107,025 959,743 Provision for slow moving, obsolete and in transit stores 163,178 237,427 Stores inventory written off 3,814 9,031 Depreciation 11.2 6,893,094 5,525,660 Amortization of development and production assets 12 15,266,568 16,281,337 Impairment on development and production assets 12 1,886,551 2,411,666 Impairment on property, plant and equipment 11 - 199,378 Transfer from general and administration expenses 28 2,538,202 2,533,226 Miscellaneous 8,601 9,686
54,960,678 52,832,331 Stock of crude oil and other products:
Balance at beginning of the year 317,476 420,626 Balance at end of the year (291,904) (317,476)
54,986,250 52,935,481
25.1 These include charge against employee retirement benefits of Rs 1,698 million (2015: Rs 2,170 million).
2016 2015 ---------------(Rupees ‘000)---------------
26 OTHER INCOME
Income from financial assetsInterest income on:
Investments and bank deposits 12,908,363 16,921,497 Delayed payments from joint operations partners 10,241 - Delayed payments from customers 2,053 2,493
12,920,657 16,923,990
Dividend income from NIT units 19,296 18,615 Un-realized gain on investments at fair value through profit or loss 6,356 13,893 Exchange (loss)/gain - net (37,543) 1,043,079
12,908,766 17,999,577 Income from non-financial assetsGain on disposal of property, plant and equipment 60,458 18,320 Gain on disposal of stores, spare parts and loose tools 40,421 40,396 Others 1,693,326 1,127,898
1,794,205 1,186,614 14,702,971 19,186,191
114 Oil & Gas Development Company Limited

Notes to and Forming Part of the Financial StatementsFor the year ended 30 June 2016
2016 2015 Note ---------------(Rupees ‘000)---------------
27 EXPLORATION AND PROSPECTING EXPENDITURE
Cost of dry and abandoned wells 13 4,909,724 4,850,138 Prospecting expenditure 9,638,571 6,777,380
14,548,295 11,627,518
28 GENERAL AND ADMINISTRATION EXPENSES
Salaries, wages and benefits 28.1 4,965,364 4,710,471 Joint operations expenses 1,097,036 1,013,500 Unallocated expenses of technical services 896,277 1,323,643 Traveling and transportation 312,882 327,882 Repairs and maintenance 104,421 140,200 Stores and supplies consumed 124,642 123,062 Rent, fee and taxes 154,471 157,969 Communication 52,361 47,794 Utilities 57,149 64,177 Training and scholarships 30,971 30,359 Legal and professional services 50,377 44,354 Contract services 172,865 146,307 Auditors' remuneration 28.2 20,310 18,016 Advertising 83,293 128,898 Insurance 3,895 3,759 Donations - 330,000 Depreciation 11.2 205,799 197,940 Miscellaneous 40,151 48,818
8,372,264 8,857,149 Allocation of expenses to:
Operations 25 (2,538,202) (2,533,226)Technical services (2,063,455) (2,015,668)
(4,601,657) (4,548,894) 3,770,607 4,308,255
28.1 These include charge against employee retirement benefits of Rs 572 million (2015: Rs 759 million).
2016 2015---------------(Rupees ‘000)---------------
28.2 Auditors’ remuneration
M/s KPMG Taseer Hadi & Co., Chartered AccountantsAnnual audit fee 2,000 2,000 Half yearly review 800 800 Out of pocket expenses 280 280 Concession audit fee 4,391 4,150 Audit fee for claims lodged by employees under BESOS 262 270 Verification of Central Depository Company record 110 110 Certification of fee payable to OGRA 110 110 Dividend certification 300 400
8,253 8,120
Annual Report 2016 115

Notes to and Forming Part of the Financial StatementsFor the year ended 30 June 2016
2016 2015 Note ---------------(Rupees ‘000)----------------
Auditors’ remuneration - continued
M/s A. F. Ferguson & Co., Chartered AccountantsAnnual audit fee 2,000 2,000 Half yearly review 800 800 Out of pocket expenses 280 280 Concession audit fee 4,608 4,395 Verification of Central Depository Company record 110 110 Dividend certification 100 - Tax services 4,159 2,286 Audit of Employees Benevolent Fund - 25
12,057 9,896 20,310 18,016
29 FINANCE COST
Unwinding of discount on provision for decommissioning cost 8 1,700,742 2,536,838 Others 17,147 13,229
1,717,889 2,550,067
30 TAXATION
Current - charge/(credit)- for the year 21,853,820 37,279,117 - for prior year (289,894) 8,160,981
21,563,926 45,440,098 Deferred - (credit)/charge
- for the year (617,397) 706,322 - for prior year (409,944) (6,369,999)
(1,027,341) (5,663,677)
20,536,585 39,776,421
30.1 Reconciliation of tax charge for the year:
Accounting profit 80,507,387 127,025,453
Tax rate 52.62% 50.34%
Tax on accounting profit at applicable rate 42,362,987 63,944,613 Tax effect of royalty allowed for tax purposes (7,032,918) (9,320,933)Tax effect of depletion allowance (9,988,702) (12,546,508)Tax effect of amount not admissible for tax purposes (782,751) (977,230)Tax effect of exempt income (10,154) (9,371)Tax effect of income chargeable to tax at reduced corporate rate (3,663,025) (3,466,975)Tax effect of prior years (699,838) 1,790,982 Effect of super tax 410,559 526,977 Others (59,573) (165,134)
20,536,585 39,776,421
116 Oil & Gas Development Company Limited

Notes to and Forming Part of the Financial StatementsFor the year ended 30 June 2016
30.2 Various appeals in respect of assessment years 1992-93 to 2002-03, tax years 2003 to 2015 are pending at different appellate forums in the light of the order of the Commissioner of Inland Revenue (Appeals) and decision of the Adjudicator, appointed by both the Company as well as the Federal Board of Revenue (FBR) mainly on the issues of decommissioning cost, depletion allowance, prospecting, exploration and development expenditure and tax rate. Total amount of tax demand against the major issues, raised in respect of assessment years 1992-93 to 2002-03 and tax years 2003-2015 amounts to Rs 66,643 million out of which an amount of Rs 63,302 million has been paid to tax authorities. Also refer to note 21.1 to 21.4 of the financial statements.
2016 201531 EARNINGS PER SHARE - BASIC AND DILUTED
Profit for the year (Rupees '000) 59,970,802 87,249,032
Average number of shares outstanding during the year ('000) 4,300,928 4,300,928
Earnings per share - basic (Rupees) 13.94 20.29
There is no dilutive effect on the earnings per share of the Company.
32 OPERATING SEGMENTS
The financial statements have been prepared on the basis of a single reportable segment. Revenue from external customers for products of the Company is disclosed in note 24.
Revenue from five major customers of the Company constitutes 77% (2015: 75%) of the total revenue during the year ended 30 June 2016.
33 FINANCIAL INSTRUMENTS
The Company has exposure to the following risks from its use of financial instruments:
- Credit risk- Liquidity risk- Market risk
This note presents information about the Company’s exposure to each of the above risks, the Company’s objectives, policies and processes for measuring and managing risk, and the Company’s management of capital. Further quantitative disclosures are included throughout these financial statements.
The Board of Directors has overall responsibility for the establishment and oversight of the Company’s risk management framework. The Board is responsible for developing and monitoring the Company’s risk management policies.
The Company’s risk management policies are established to identify and analyze the risks faced by the Company, to set appropriate risk limits and controls, and to monitor risks and adherence to limits. Risk management policies and systems are reviewed regularly to reflect changes in market conditions and the Company’s activities. The Company, through its training and management standards and procedures, aims to develop a disciplined and constructive control environment in which all employees understand their roles and obligations.
The Board’s Risk Management Committee assists the Board in the identification and monitoring of the principal risks and opportunities of the Company ensuring that appropriate systems and internal control framework are in place to manage these risks and opportunities, including, safeguarding the public reputation of the Company. The Committee is required to over-see, report and make recommendations to the Board in respect of financial and non-financial risks faced by the Company.
Annual Report 2016 117

Notes to and Forming Part of the Financial StatementsFor the year ended 30 June 2016
33.1 CREDIT RISK
Credit risk is the risk of financial loss to the Company if a customer or counterparty to a financial instrument fails to meet its contractual obligations. As part of these processes the financial viability of all counterparties is regularly monitored and assessed.
The Company is exposed to credit risk from its operating and certain investing activities and the Company’s credit risk exposures are categorized under the following headings:
33.1.1 Counterparties
The Company conducts transactions with the following major types of counterparties:
Trade debts
Trade debts are essentially due from oil refining companies, oil and gas marketing companies and power generation companies and the Company does not expect these companies to fail to meet their obligations. Majority of sales to the Company’s customers are made on the basis of agreements approved by GoP.
Sale of crude oil and natural gas is at prices determined in accordance with the agreed pricing formula as approved by GoP under respective agreements. Prices of liquefied petroleum gas are determined by the Company subject to maximum of preceding months’ average prices of Saudi Aramco. Sale of refined petroleum products is made at prices notified by OGRA.
The Company establishes an allowance for impairment that represents its estimate of incurred losses in respect of trade debts. This allowance is based on the management’s assessment of a specific loss component that relates to individually significant exposures.
Bank balances and investments
The Company limits its exposure to credit risk by investing in liquid securities and maintaining bank accounts only with counterparties that have a credit rating of at least A1 and A. Given these high credit ratings, management does not expect any counterparty to fail to meet its obligations. In addition to the exposure with Banks, the Company also holds investments in Pakistan Investment Bonds and Term Finance Certificates issued by the State Bank of Pakistan and Power Holding (Private) Limited held by GoP respectively. These investments are considered highly secured. Investment in TFCs and PIBs are secured by GoP guarantee. The credit rating of the counterparties is as follows:
2016 2015Short term Long term Short term Long term Credit Rating Agency
National Bank of Pakistan A-1+ AAA A-1+ AAA JCR-VISAllied Bank of Pakistan A1+ AA+ A1+ AA+ PACRAAskari Bank Limited A1+ AA+ A1+ AA PACRABank Al-Falah Limited A1+ AA A1+ AA PACRABank Al-Habib Limited A1+ AA+ A1+ AA+ PACRAFaysal Bank A1+ AA A1+ AA PACRA Habib Bank Limited A-1+ AAA A-1+ AAA JCR-VISHabib Metropolitan Bank A1+ AA+ A1+ AA+ PACRAMCB Bank A1+ AAA A1+ AAA PACRANIB Bank A1+ AA- A1+ AA- PACRASoneri Bank Limited A1+ AA- A1+ AA- PACRAUnited Bank limited A-1+ AAA A-1+ AA+ JCR-VISCitibank N.A. P-1 A1 P-1 A2 Moody'sMeezan Bank Limited A1+ AA- - - JCR-VIS
118 Oil & Gas Development Company Limited

Notes to and Forming Part of the Financial StatementsFor the year ended 30 June 2016
33.1.2 Exposure to credit risk
The carrying amount of financial assets represents the maximum credit exposure. The maximum exposure to credit risk at the reporting date was:
2016 2015---------------(Rupees ‘000)---------------
Long term investments 109,124,107 129,792,155 Long term loans and receivable 5,997,669 5,932,606 Trade debts - net of provision 111,204,186 121,411,485 Loans and advances 3,596,439 3,462,218 Deposits 22,112 21,025 Other receivables 101,820 103,434 Interest accrued 21,085,027 14,433,563 Current maturity of Term Finance Certificates 30,750,000 10,250,000
Other financial assets 11,131,164 9,525,037 Bank balances 7,839,827 12,959,975
300,852,351 307,891,498
The maximum exposure to credit risk for financial assets at the reporting date by type of customer was:
2016 2015---------------(Rupees ‘000)---------------
Oil refining companies 12,270,830 18,057,449 Oil and gas marketing companies 90,096,501 88,783,767 Power generation companies 7,669,316 11,702,291 Banks and financial institutions 79,791,366 94,960,730 Power Holding (Private) Limited 100,138,759 93,501,837 Others 10,885,579 885,424
300,852,351 307,891,498
The credit quality of financial assets that are neither past due nor impaired can be assessed by reference to external credit ratings or to historical information about counterparty default rates:
2016 2015Note ---------------(Rupees ‘000)---------------
InvestmentsAAA 14.2.1 6,384,972 5,862,129 Unrated 14.2.2 & 14.2.3 133,489,135 134,180,026
139,874,107 140,042,155 Trade debtsCustomers with no defaults in the past one year - -
Customers with some defaults in past one year which have been fully recovered 3,322,833 2,496,615
Customers with defaults in past one year which have not yet been recovered 25,792,369 37,331,589
29,115,202 39,828,204
Annual Report 2016 119

Notes to and Forming Part of the Financial StatementsFor the year ended 30 June 2016
2016 2015Note ---------------(Rupees ‘000)---------------
Other financial assetsAA+ 22.1 11,131,164 9,525,037
Bank balancesAAA 2,036,297 7,725,585 AA+ 1,855,424 3,985,819 AA 3,943,739 1,248,489 AA- 4,357 72 A1 10 10
23 7,839,827 12,959,975
The Company’s most significant customers, an oil refining company and a gas marketing company (related party), accounts for Rs 69,420 million of the trade debts carrying amount at 30 June 2016 (2015: Rs 78,105 million).
The maximum exposure to credit risk for trade debts at the reporting date by type of product was:
2016 2015---------------(Rupees ‘000)---------------
Crude oil 12,270,727 18,057,346 Gas 98,845,594 103,229,734 Kerosene oil 1,984 1,984 High speed diesel oil 86 86 Naphtha 103 103 Liquefied petroleum gas 52,010 91,527 Other operating revenue 33,682 30,705
111,204,186 121,411,485
33.1.3 Impairment losses
The aging of trade debts at the reporting date was:30 June 2016 30 June 2015
Gross debts Impaired Gross debts ImpairedNote --------------------------------------(Rupees ‘000)----------------------------------------
Not past due 29,115,202 - 39,828,204 - Past due 0-30 days 3,968,071 - 8,194,459 - Past due 31-60 days 2,641,376 - 6,522,394 - Past due 61-90 days 2,755,428 - 5,066,143 - Over 90 days 72,836,098 (111,989) 61,913,067 (112,782)
17 111,316,175 (111,989) 121,524,267 (112,782)
120 Oil & Gas Development Company Limited

Notes to and Forming Part of the Financial StatementsFor the year ended 30 June 2016
The aging of trade debts from related parties at the reporting date was:
Total Not past due
Past due 0-30 days
Past due 31-90 days
Over 90 days Impaired balance
---------------------------------------(Rupees ‘000)---------------------------------------
30 June 2016
Enar Petrotech Services Limited 988,108 1,186,570 - - (198,462) - Pak Arab Refinery Company Limited 2,136,263 2,136,263 - - - - Sui Northern Gas Pipelines Limited 25,864,252 8,517,438 2,178,193 3,138,027 12,030,594 - Sui Southern Gas Company Limited 64,230,178 4,834,990 1,163,159 1,778,031 56,453,998 - WAPDA 21,282 - - - 21,282 (21,282)Pakistan State Oil 1,867 - - - 1,867 -
93,241,950 16,675,261 3,341,352 4,916,058 68,309,279 (21,282)
30 June 2015
Enar Petrotech Services Limited 1,080,082 1,293,328 - - (213,246) - Pak Arab Refinery Company Limited 1,203,287 1,203,287 - - - - Sui Northern Gas Pipelines Limited 19,575,029 8,458,397 2,618,485 5,245,633 3,252,514 - Sui Southern Gas Company Limited 69,206,667 8,504,813 2,588,324 5,086,509 53,027,021 - WAPDA 21,282 - - - 21,282 (21,282)Pakistan State Oil 1,867 - - - 1,867 -
91,088,214 19,459,825 5,206,809 10,332,142 56,089,438 (21,282)
The movement in the allowance for impairment in respect of trade debts during the year was as follows:
2016 2015--------------(Rupees ‘000)---------------
Balance at beginning of the year 112,782 112,782 Written off during the year (793) - Balance at end of the year 111,989 112,782
As explained in note 17 to the financial statements, the Company believes that no impairment allowance is necessary in respect of trade debts past due other than the amount provided. Trade debts are essentially due from oil refining companies, natural gas and liquefied petroleum gas transmission and distribution companies and power generation companies, the Company is actively pursuing for recovery of debts and the Company does not expect these companies to fail to meet their obligations.
The movement in the allowance for impairment in respect of loans, advances and other receivables during the year was as follows:
2016 2015--------------(Rupees ‘000)---------------
Balance at beginning of the year 197,472 197,472 Provision made during the year - - Balance at end of the year 197,472 197,472
The allowance accounts in respect of trade receivables, loans and advances are used to record impairment losses unless the Company is satisfied that no recovery of the amount owing is possible, at that point the amount considered irrecoverable is written off against the financial asset directly.
Annual Report 2016 121

Notes to and Forming Part of the Financial StatementsFor the year ended 30 June 2016
The aging of principal amount of TFCs at the reporting date was:2016 2015
--------------(Rupees ‘000)---------------
Not past due 71,750,000 82,000,000 Over 90 days 10,250,000 -
82,000,000 82,000,000
The aging of interest accrued on TFCs at the reporting date was:
Not past due 1,868,432 2,350,772 Past due 16,270,327 9,151,065
18,138,759 11,501,837
33.2 LIQUIDITY RISK
Liquidity risk is the risk that the Company will not be able to meet its financial obligations as they fall due. Prudent liquidity risk management implies maintaining sufficient cash and marketable securities to close out market positions due to dynamic nature of the business. The Company’s approach to managing liquidity is to ensure, as far as possible, that it will always have sufficient liquidity to meet its liabilities when due, under both normal and stressed conditions, without incurring unacceptable losses or risking damage to the Company’s reputation.
The maturity profile of the Company’s financial liabilities based on the contractual amounts is as follows:
30 June 2016 30 June 2015
Trade and other payables Carrying amount
Contractual cash flows
Carrying amount
Contractual cash flows
---------------------------------------(Rupees ‘000)--------------------------------------
All the trade and other payables havematurity upto one year 38,121,711 38,121,711 39,455,935 39,455,935
33.3 MARKET RISK
Market risk is the risk that changes in market prices, such as foreign exchange rates, interest rates, equity price and crude oil price will affect the Company’s income or the value of its holdings of financial instruments. The objective of market risk management is to manage and control market risk exposures within acceptable parameters, while optimizing the return on risk.
33.3.1 Foreign currency risk management
PKR is the functional currency of the Company and as a result currency exposure arise from transactions and balances in currencies other than PKR. The Company’s potential currency exposure comprise;
- Transactional exposure in respect of non-functional currency monetary items.- Transactional exposure in respect of non-functional currency expenditure and revenues.
The potential currency exposures are discussed below;
Transactional exposure in respect of non-functional currency monetary items
Monetary items, including financial assets and liabilities, denominated in currencies other than the functional currency of the Company are periodically restated to PKR equivalent, and the associated gain or loss is taken to the profit and loss account. The foreign currency risk related to monetary items is managed as part of the risk management strategy.
122 Oil & Gas Development Company Limited

Notes to and Forming Part of the Financial StatementsFor the year ended 30 June 2016
Transactional exposure in respect of non-functional currency expenditure and revenues
Certain operating and capital expenditure is incurred by the Company in currencies other than the functional currency. Certain sales revenue is earned in currencies other than the functional currency of the Company. These currency risks are managed as a part of overall risk management strategy. The Company does not enter into forward exchange contracts.
Exposure to foreign currency risk
The Company’s exposure to foreign currency risk was as follows based on carrying values:
2016 2015USD ($) ------------------- (‘000) -------------------
Trade debts 67,059 100,696 Investment in Term Deposits 106,305 94,448 Cash and bank balances 4,995 52,413 Trade and other payables (148,608) (102,733)
29,751 144,824 Euro (€)
Trade and other payables 3,437 6,457
Foreign currency commitments outstanding at year end are as follows: 2016 2015
--------------(Rupees ‘000)---------------
Euro (€) 6,173,974 9,555,780 USD ($) 35,594,447 31,255,354 GBP (£) 14,540 21,080
41,782,961 40,832,214
The following significant exchange rates were applied during the year:
Average rate Reporting date mid spot rate2016 2015 2016 2015
--------------------------------------(Rupees)--------------------------------------
USD ($) 1 104.56 102.14 104.91 101.05
Foreign currency sensitivity analysis
A 10 percent strengthening of the PKR against the USD at 30 June 2016 would have decreased equity and profit or loss by the amounts shown below. This analysis assumes that all other variables, in particular interest rates, remain constant. The analysis is performed on the same basis for 30 June 2015.
2016 2015--------------(Rupees ‘000)--------------
Profit and loss account 312,118 1,463,447
A 10 percent weakening of the PKR against the USD at 30 June 2016 would have had the equal but opposite effect on USD to the amounts shown above, on the basis that all other variables remain constant.
Annual Report 2016 123

Notes to and Forming Part of the Financial StatementsFor the year ended 30 June 2016
33.3.2 Interest rate risk management
The interest rate risk is the risk that the value of the financial instrument will fluctuate due to changes in the market interest rates. Sensitivity to interest rate risk arises from mismatches of financial assets and liabilities that mature in a given period. The Company adopts a policy to ensure that interest rate risk is minimized by investing in fixed rate investments like DSCs and TDRs while the Company has no borrowings.
Profile
At the reporting date the interest rate profile of the Company’s interest-bearing financial instruments was:
2016 2015 2016 2015--------------------- % ---------------------- --------------(Rupees ‘000)--------------
Fixed rate instrumentsFinancial assets
Long term investments 7.35 to 11.50 9.91 to 11.50 57,874,107 58,042,155 Long term loans 10.53 11.79 1,078,569 1,142,360 Other financial assets 1.60 to 2.65 1.75 to 2.35 11,131,164 9,525,037 Cash and bank balances 0.20 to 5.75 0.20 to 7.00 7,692,851 12,849,120
77,776,691 81,558,672 Financial liabilities - -
77,776,691 81,558,672
Fair value sensitivity analysis for fixed rate instruments
The Company does not account for any fixed rate financial assets and liabilities at fair value through profit or loss, and the Company does not have derivatives as hedging instruments recognized under fair value hedge accounting model. Therefore, a change in interest rates at the reporting date would not affect profit or loss.
33.3.3 Other market price risk
The Company is following a policy to set aside reserve for self insurance of rigs, wells, plants, pipelines, vehicles, workmen compensation, losses of petroleum products in transit and is keeping such reserve invested in specified investments. The primary goal of the Company’s investment strategy is to maximize investment returns on surplus funds. The Company’s price risk arises from investments in NIT units which are designated at fair value through profit or loss, however, in accordance with the investment strategy the performance of NIT units is actively monitored and they are managed on a fair value basis.
Sensitivity analysis of price risk
A change of Rs 5 in the value of investments at fair value through profit and loss would have increased or decreased profit and loss by Rs 22.701 million (2015: Rs 22.701 million).
Sensitivity analysis of crude oil price risk
A change of USD 5 in average price of crude oil would increase or decrease profit by Rs 7,585 million (2015: Rs 7,372 million) on the basis that all other variables remain constant.
124 Oil & Gas Development Company Limited

Notes to and Forming Part of the Financial StatementsFor the year ended 30 June 2016
33.4 FAIR VALUES AND RISK MANAGEMENT
The following table shows the carrying amounts and fair values of financial assets and liabilities. The fair value of financial asset measured at fair value is shown below. It does not include fair value information for financial asset and financial liabilities not measured at fair value as the carrying amount is a reasonable approximation of fair value.
Carrying Amount
Loans and receivables
Investments at
fair value through
profit or loss
Held to maturity
Other financial liabilities
Total
30 June 2016 Note --------------------------------------(Rupees ‘000)--------------------------------------
Financial assets measured at fair value
Other financial assets - NIT units 22 - 295,800 - - 295,800
Financial assets not measured at fair value
Long term investments 14.1 & 14.2 3,393,185 - 109,124,107 - 112,517,292
Long term loans and receivable 15 5,997,669 - - - 5,997,669
Trade debts - net of provision 17 111,204,186 - - - 111,204,186
Loans and advances 18 3,596,439 - - - 3,596,439
Deposits 19 22,112 - - - 22,112
Interest accrued 21,085,027 - - - 21,085,027
Other receivables 20 101,820 - - - 101,820
Current maturity of Term Finance Certificates 14.2 - - 30,750,000 - 30,750,000
Other financial assets 22 11,131,164 - - - 11,131,164
Cash and bank balances 23 7,903,766 - - - 7,903,766
164,435,368 295,800 139,874,107 - 304,605,275
Financial liabilities not measured at fair value
Trade and other payables 9 - - - 38,121,711 38,121,711
- - - 38,121,711 38,121,711
Carrying Amount
Loans and receivables
Investments at
fair value through
profit or loss
Held to maturity
Other financial liabilities
Total
30 June 2015 Note --------------------------------------(Rupees ‘000)--------------------------------------
Financial assets measured at fair value
Other financial assets - NIT units 22 - 289,444 - - 289,444
Financial assets not measured at fair value
Long term investments 14.1 & 14.2 1,401,173 - 129,792,155 - 131,193,328
Long term loans and receivable 15 5,932,606 - - - 5,932,606
Trade debts - net of provision 17 121,411,485 - - - 121,411,485
Loans and advances 18 3,462,218 - - - 3,462,218
Deposits 19 21,025 - - - 21,025
Interest accrued 14,433,563 - - - 14,433,563
Other receivables 20 103,434 - - - 103,434
Current maturity of Term Finance Certificates 14.2 - - 10,250,000 - 10,250,000
Other financial assets 22 9,525,037 - - - 9,525,037
Cash and bank balances 23 13,002,748 - - - 13,002,748
169,293,289 289,444 140,042,155 - 309,624,888
Financial liabilities not measured at fair value
Trade and other payables 9 - - - 39,455,935 39,455,935
- - - 39,455,935 39,455,935
Annual Report 2016 125

Notes to and Forming Part of the Financial StatementsFor the year ended 30 June 2016
Interest rates used for determining fair value
The interest rates used to discount estimated cash flows, when applicable, are based on the government yield curve at the reporting date plus an adequate credit spread. Since the majority of the financial assets are fixed rate instruments, there is no significant difference in market rate and the rate of instrument, fair value significantly approximates to carrying value.
Fair value hierarchy
The table below analyses financial instruments carried at fair value, by valuation method. The different levels have been defined as follows:
Level 1: quoted prices (unadjusted) in active markets for identical assets or liabilities.
Level 2: inputs other than quoted market prices included within Level 1 that are observable for the asset or liability, either directly (i.e. as prices) or indirectly (i.e. derived from prices).
Level 3: inputs for the asset or liability that are not based on observable market data (unobservable inputs).
Level 1 Level 2 Level 3--------------------------(Rupees ‘000)--------------------------
30 June 2016
Financial assets measured at fair valueOther financial assets - NIT units 295,800 - -
30 June 2015
Financial assets measured at fair valueOther financial assets - NIT units 289,444 - -
Determination of fair values
A number of the Company’s accounting policies and disclosures require the determination of fair value, for both financial and non-financial assets and liabilities. Fair values have been determined for measurement and/or disclosure purposes based on the following methods.
Investment at fair value through profit and loss account - held for trading
The fair value of held for trading investment is determined by reference to their quoted closing repurchase price at the reporting date.
Investment in associate
The fair value of investment in associate is determined by reference to their quoted closing bid price at the reporting date. The fair value is determined for disclosure purposes.
Non-derivative financial assets
The fair value of non-derivative financial assets is estimated as the present value of future cash flows, discounted at the market rate of interest at the reporting date. This fair value is determined for disclosure purposes.
Non-derivative financial liabilities
Fair value, which is determined for disclosure purposes, is calculated based on the present value of future principal and interest cash flows, discounted at the market rate of interest at the reporting date.
126 Oil & Gas Development Company Limited

Notes to and Forming Part of the Financial StatementsFor the year ended 30 June 2016
33.5 CAPITAL MANAGEMENT
The Company’s objective when managing capital is to safeguard the Company’s ability to continue as a going concern so that it can continue to provide returns for shareholders and benefits for other stakeholders, and to maintain a strong capital base to support the sustained development of its businesses.
The Company manages its capital structure which comprises capital and reserves by monitoring return on net assets and makes adjustments to it in the light of changes in economic conditions. In order to maintain or adjust the capital structure, the Company may adjust the amount of dividend paid to shareholders and/or issue new shares. There were no changes to Company’s approach to capital management during the year and the Company is not subject to externally imposed capital requirement.
2016 2015Note ---------------(Rupees ‘000)---------------
34 CASH AND CASH EQUIVALENTS
Cash and bank balances 23 7,903,766 13,002,748 Short term highly liquid investments 22 11,131,164 9,525,037
19,034,930 22,527,785
2016 201535 NUMBER OF EMPLOYEES
Total number of employees at the end of the year were as follows:Regular 9,077 9,475 Contractual 299 27
9,376 9,502
Average number of employees during the year were as follows:Regular 9,276 9,690 Contractual 163 25
9,439 9,715
36 RELATED PARTIES TRANSACTIONS
Government of Pakistan owns 74.97% (2015: 74.97%) shares of the Company. Therefore, all entities owned and controlled by the Government of Pakistan are related parties of the Company. Other related parties comprise associated company, major shareholders, directors, companies with common directorship, key management personnel, OGDCL employees empowerment trust and employees pension trust. The Company in normal course of business pays for electricity, gas and telephone to entities controlled by Government of Pakistan which are not material, hence not disclosed in these financial statements. Transactions of the Company with related parties and balances outstanding at year end are as follows:
2016 2015---------------(Rupees ‘000)---------------
Associated companyShare of profit in associate - net of taxation 2,188,899 1,043,741
Major shareholders
Government of PakistanDividend paid 17,267,376 29,988,201 Payable on account of Kunnar discount at 30 June - 2,085,112 Payment on account of Kunnar discount during the year ended 30 June 2,085,112 - Dividend payable at 30 June 1,451,040 5,078,640
Annual Report 2016 127

Notes to and Forming Part of the Financial StatementsFor the year ended 30 June 2016
2016 2015---------------(Rupees ‘000)---------------
RELATED PARTIES TRANSACTIONS - continued
OGDCL Employees' Empowerment Trust (OEET)Dividend paid 756,331 - Dividend payable 10,500,000 9,225,000
Related parties by virtue of common directorship and GoP holdings
Government Holdings (Private) Limited (GHPL)GHPL share (various fields) - net receivable 740,625 1,166,592
Power Holding (Private) Limited (PHPL)Markup earned 6,636,923 8,673,803 Balance of investment in TFCs receivable not yet due as at 30 June 71,750,000 82,000,000 Balance of past due principal repayment on TFCs as at 30 June 10,250,000 - Balance of markup receivable on TFCs not yet due as at 30 June 1,868,432 2,350,772 Balance of past due markup receivable on TFCs as at 30 June 16,270,327 9,151,065
State Bank of PakistanInterest earned on Pakistan Investment Bonds (PIBs) 5,867,299 5,838,861 Balance of investment in PIBs and markup receivable as at 30 June 54,149,061 53,380,191
Pak Arab Refinery Company LimitedSale of crude oil 7,951,721 9,530,107 Trade debts as at 30 June 2,136,263 1,203,287
Sui Northern Gas Pipelines LimitedSale of natural gas 53,793,498 52,919,073 Purchase of high BTU value gas - 2,991,030 Trade debts as at 30 June 25,864,252 19,575,029 Payable as at 30 June 73,880 473,503
Sui Southern Gas Company LimitedSale of natural gas 38,070,256 53,413,428 Pipeline rental charges 36,660 36,660 Trade debts as at 30 June 64,230,178 69,206,667
Pakistan State Oil Company LimitedPurchase of petroleum, oil and lubricants 4,262,212 3,763,690 Trade debts as at 30 June 1,867 1,867 Payable as at 30 June 2,700 97,026
National Insurance Company LimitedInsurance premium paid 624,631 523,358 Payable as at 30 June - 9,565
National Logistic CellCrude transportation charges paid 1,822,565 1,588,145 Payable as at 30 June 365,400 382,591
128 Oil & Gas Development Company Limited

Notes to and Forming Part of the Financial StatementsFor the year ended 30 June 2016
2016 2015Note ---------------(Rupees ‘000)---------------
RELATED PARTIES TRANSACTIONS - continued
Enar Petrotech Services LimitedConsultancy services 106,926 33,816 Sale of crude oil 7,798,062 9,261,452 Trade debts as at 30 June 988,108 1,080,082 Payable as at 30 June - 4,748
Other related partiesContribution to staff benefit funds 1,486,261 12,767,909 Remuneration including benefits and perquisites of key management personnel 36.1 489,455 533,774
36.1 Key management personnel
Key management personnel comprises chief executive, executive directors and general managers of the Company.
2016 2015--------------(Rupees ‘000)--------------
Managerial remuneration 174,233 173,208 Housing and utilities 123,680 123,536 Other allowances and benefits 150,694 176,619 Medical benefits 3,117 4,511 Leave encashment 10,222 8,708 Contribution to pension fund 27,509 47,192
489,455 533,774
Number of persons 31 40
36.2 The amounts of the trade debts outstanding are unsecured and will be settled in cash. No expense has been recognized in the current or prior years for bad or doubtful debts in respect of the amounts owed by related parties.
37 REMUNERATION OF CHIEF EXECUTIVES, DIRECTORS AND EXECUTIVES
The aggregate amount charged in these financial statements for the remuneration of the chief executives and executives was as follows:
2016 2015 Chief Executives Chief Executives
Executive Executive ----------------------------------------(Rupees ‘000)----------------------------------------
Managerial remuneration 14,912 3,529,780 8,725 3,184,496 Housing and utilities 8,090 2,757,985 5,914 2,372,960 Other allowances and benefits 13,501 3,859,869 9,727 3,547,221 Medical benefits 5 226,439 16 200,738 Leave encashment 556 48,737 1,961 51,737 Contribution to pension fund 2,325 557,946 2,377 867,654
39,389 10,980,756 28,720 10,224,806
Number of persons including those who worked part of the year 1 2,153 2 2,110
Annual Report 2016 129

Notes to and Forming Part of the Financial StatementsFor the year ended 30 June 2016
- Executive means any employee whose basic salary exceeds Rs 500,000 (2015: Rs 500,000) per year.
- The remuneration of chief executives includes an amount of Rs 7.154 million (2015: Rs 20.845 million) related to final settlement of chief executives retired in prior years.
- The aggregate amount charged in these financial statements in respect of fee to 11 directors (2015: 13) was Rs 11.390 million (2015: Rs 27.755 million).
38 INFORMATION RELATING TO PROVIDENT FUND
Oil and Gas Development Company Limited (OGDCL) Employees’ Provident Fund is a contribution plan for benefit of permanent employees of the Company. The Company does not contribute to the fund and the contributions are made by the employees only. The details based on unaudited financial statements of the Fund are as follows:
2016 2015----------(Rupees ‘000)---------------
Net assets 4,724,312 4,359,446 Cost of investments made 4,653,623 4,214,749 Percentage of investments made 99% 97%Fair value of investments 4,852,507 4,471,061
Break-up of investments at cost:NIT units 545,229 545,229 Term Deposit Receipts 2,800,000 2,600,000 Regular Income Certificates 850,000 850,000 Bank Balances 458,394 219,520
4,653,623 4,214,749
All investments out of Provident Fund have been made in accordance with the provisions of section 227 of the Companies Ordinance, 1984 and the rules formulated for this purpose.
During the year, the Company changed its policy for entitlement of pension fund whereby employees regularized after 1 January 2016 will contribute one basic salary towards provident fund annually and the Company shall match the contribution. No employee has been regularized after 1 January 2016.
39 DISCLOSURE REQUIREMENTS FOR ALL SHARES ISLAMIC INDEX
Following information has been disclosed with reference to Circular No. 14 of 2015 dated 21 April 2016, issued by the Securities and Exchange Commission of Pakistan relating to ‘All Shares Islamic Index’.
Description Explanation
i) Long term investments - asset Interest bearingii) Long term loans and receivables - asset Interest bearing/Non-interest bearing (Refer note 15)iii) Other financial assets Interest bearingiv) Loans and Advances - asset Non-interest bearingv) Deposits - asset Non-interest bearingvi) Segment Revenue Disclosed in note 32vii) Relationship with banks having Islamic windows Mezan Bank Limited
130 Oil & Gas Development Company Limited

Notes to and Forming Part of the Financial StatementsFor the year ended 30 June 2016
viii) Bank Balances as at 30 June 2016 (Rupees ‘000)Placed under interest arrangement 7,688,568 Placed under Shariah permissible arrangement 4,283
7,692,851
ix) Interest income on bank deposits for the year ended 30 June 2016
Placed under interest arrangement 216,518 Placed under Shariah permissible arrangement 51
216,569
x) Interest income on investments for the year ended 30 June 2016
Placed under interest arrangement 6,135,765 Placed under Shariah permissible arrangement -
6,135,765 xi) All sources of other income Disclosed in note 26
xii) Exchange gain Earned from actual currency fluctuations
Disclosures other than above are not applicable to the Company.
40 INTEREST IN JOINT OPERATIONS
This disclosure is given to comply with the requirements of IFRS 11, ‘Joint Arrangements’ and on the basis of management’s interpretation, the Company has working interest in the following operated and non-operated exploration licenses/leases in Pakistan:
Working interest2016 2015
Exploration Licenses/Leases ----------------- % -----------------
Operated by OGDCL
Nim Petroleum Concession - Exploratory 95.00 95.00 - Development 77.50 77.50
Tando Allah Yar Petroleum Concession - Exploratory 95.00 77.50 - Development 77.50 77.50
Nashpa Petroleum Concession - Exploratory 65.00 65.00 - Development 56.45 56.45
Sinjhoro Petroleum Concession - Exploratory 76.00 76.00 - Development 62.50 62.50
Guddu Petroleum Concession - Exploratory 70.00 70.00 - Development 57.76 57.76
Jakhro Development and Production Lease 77.50 77.50Chak Naurang Mining Lease 85.00 85.00Qadirpur Development and Production Lease 75.00 75.00Jhal Magsi South Development and Production Lease 56.00 56.00Chanda Mining Lease 72.00 72.00Gurgalot Petroleum Concession 75.00 75.00Khewari Petroleum Concession 95.00 95.00Zin Petroleum Concession 95.00 95.00Bitrism Petroleum Concession 95.00 95.00Kohlu Petroleum Concession 40.00 40.00Kalchas Petroleum Concession 50.00 40.00Kohat Petroleum Concession 30.00 30.00Armala Petroleum Concession 97.50 97.50
Annual Report 2016 131

Notes to and Forming Part of the Financial StatementsFor the year ended 30 June 2016
Working interest2016 2015
Exploration Licenses/Leases - continued ----------------- % -----------------
Hetu Petroleum Concession* 97.14 97.14Pezu Petroleum Concession* 95.88 95.88Ranipur Petroleum Concession* 95.00 95.00Zorgarh Petroleum Concession* 95.80 95.80Baratai Petroleum Concession* 97.50 97.50Orakzai Petroleum Concession* 97.16 97.16Tirah Petroleum Concession* 97.50 97.50Zhob Petroleum Concession* 97.50 97.50Pasni West Petroleum Concession* 97.50 97.50Khanpur Petroleum Concession* 97.50 97.50Plantak Petroleum Concession* 97.50 97.50Gawadar Petroleum Concession* 97.50 97.50Rakhshan Petroleum Concession* 97.50 97.50South Kharan Petroleum Concession* 97.50 97.50Khuzdar North Petroleum Concession* 97.50 97.50Warnali Petroleum Concession* 97.50 97.50Kulachi Petroleum Concession* 95.45 95.45
*Deeds of assignment of these Concessions have not yet been finalized.
Non-Operated Operator
Badin II Petroleum Concession United Energy Petroleum Limited 49.00 49.00Badin II (Revised) Petroleum Concession United Energy Petroleum Limited 24.00 24.00Badin III Petroleum Concession United Energy Petroleum Limited 15.00 15.00TAL Petroleum Concession
- Exploratory MOL Pakistan Oil and gas 30.00 30.00 - Development MOL Pakistan Oil and gas 27.76 27.76
North Potwar Petroleum Concession Ocean Pakistan Limited 20.00 20.00Soan Petroleum Concession Ocean Pakistan Limited 50.00 50.00Ratana Petroleum Concession Ocean Pakistan Limited 25.00 25.00Pindori Petroleum Concession Pakistan Oilfields Limited 50.00 50.00East Potwar Petroleum Concession Pakistan Petroleum Limited 50.00 50.00Tajjal Petroleum Concession ENI Pakistan 50.00 50.00Kirthar Petroleum Concession ENI Pakistan 20.00 20.00East Badin Petroleum Concession Spud Energy (Pty) Limited 40.00 40.00Block 20 Petroleum Concession OMV (Pakistan) Exploration GmbH 52.00 52.00Ghouspur Petroleum Concession Pakistan Exploration Limited 50.00 50.00Block 28 Petroleum Concession Tullow Oil Plc 5.00 5.00Bannu West Petroleum Concession Tullow Oil Plc 40.00 40.00Offshore Block G Petroleum Concession ENI Pakistan 33.33 33.33Offshore Block U Petroleum Concession United Energy Petroleum Limited 27.50 27.50Offshore Block S Petroleum Concession United Energy Petroleum Limited 50.00 50.00
132 Oil & Gas Development Company Limited

Notes to and Forming Part of the Financial StatementsFor the year ended 30 June 2016
41 APPLICABILITY OF IFRIC 4, ‘DETERMINING WHETHER AN ARRANGEMENT CONTAINS A LEASE’
International Accounting Standards Board (IASB) has issued IFRIC 4, ‘Determining whether an Arrangement contains a Lease’, which is effective for financial periods beginning on or after 1 January 2006. According to the said interpretation an arrangement conveys the right to use the asset, if the arrangement conveys to the purchaser (lessee) the right to control the use of the underlying asset. The right to control the use of the underlying asset is conveyed when the purchaser has the ability or right to operate the asset or direct others to operate the asset in a manner it determines while obtaining or controlling more than an insignificant amount of the output or other utility of the asset. Such arrangements are to be accounted for as a finance lease in accordance with the requirements of IAS 17, ‘Leases’.
The Company signed gas sale agreements with Uch Power Limited and UCH II Power (Private) Limited, Independent Power Producers (IPPs), for supply of total output by production facilities at Uch and Uch II fields respectively. Both arrangement appears to fall in the definition of lease under the criteria specified in IFRIC 4. However, Securities and Exchange Commission of Pakistan (SECP) vide its S.R.O No. 24(I)/2012 has decided to defer the implementation of IFRIC 4 to all companies which have executed implementation agreements with the Government/Authority or entity, this relaxation would be available till the conclusion of their agreements, entered on or before 30 June 2010. However, impact of IFRIC 4 is mandatory to be disclosed in the financial statements as per requirements of IAS 8.
Had this interpretation been applied, following adjustments to profit and loss account and balance sheet would have been made:
2016 2015---------------(Rupees ‘000)---------------
Profit for the year 59,970,802 87,249,032 Depreciation reversed 293,940 184,376 Amortization reversed 472,550 454,719 Finance income recognized 8,775,929 6,622,345 Addition to property, plant and equipment reversed (287,348) (59,222)Sales revenue reversed (8,435,679) (6,280,954)Tax impact at estimated effective rate (231,150) (290,843)
Adjusted profit for the year 60,559,044 87,879,453
Carried forward balance of unappropriated profit at the end of year would have been as follows:
Adjusted unappropriated profit brought forward 408,398,297 361,768,113 Adjusted profit for the year 60,559,044 87,879,453
468,957,341 449,647,566 Transfer to capital and other reserves (3,075,319) (850,000) Other Comprehensive Income (3,642,893) (615,680) Dividend paid (20,214,364) (39,783,589)Adjusted unappropriated profit at end of the year 442,024,765 408,398,297
Unadjusted unappropriated profit at end of the year 425,093,910 392,055,684
42 APPLICATION OF IFRS 2, ‘SHARE BASED PAYMENT’
On 14 August 2009, the Government of Pakistan (GoP) launched Benazir Employees’ Stock Option Scheme (the “Scheme”) for employees of certain State Owned Enterprises (SOEs) and non-State Owned Enterprises where GoP holds significant investments (non-SOEs). The Scheme is applicable to permanent and contractual employees who were in employment of these entities on the date of launch of the Scheme, subject to completion of five years vesting period by all contractual employees and by permanent employees in certain instances.
The Scheme provides a cash payment to employees on retirement or termination based on the price of shares of respective entities. To administer this Scheme, GoP shall transfer 12% of its investment in such SOEs and non-SOEs to a Trust Fund to be created for the purpose by each of such entities. The eligible employees would be allotted units by each Trust Fund in proportion to their respective length of service and on retirement or termination such employees would be entitled to receive such amounts from Trust Funds in exchange for the surrendered units as would be determined based on market price of listed entities or breakup value for non-listed entities. The shares relating to the surrendered units would be transferred back to GoP.
Annual Report 2016 133
Notes to and Forming Part of the Financial StatementsFor the year ended 30 June 2016
The Scheme also provides that 50% of dividend related to shares transferred to the respective Trust Fund would be distributed amongst the unit-holder employees. The balance 50% dividend would be transferred by the respective Trust Fund to the Central Revolving Fund managed by the Privatization Commission of Pakistan for the payment to employees against surrendered units. The deficit, if any, in Trust Funds to meet the re-purchase commitment would be met by GoP.
The Scheme, developed in compliance with the stated GoP policy of empowerment of employees of the State Owned Enterprises need to be accounted for by the covered entities, including the Company, under the provisions of the amended International Financial Reporting Standard to share based payment (IFRS 2). However, keeping in view the difficulties that may be faced by the entities covered under the Scheme, the Securities and Exchange Commission of Pakistan on receiving representation from some of the entities covered under the scheme and after having consulted the Institute of Chartered Accountants of Pakistan vide their Letter No. CAIDTS/PS & TAC/2011-2036 dated 2 February 2011 has granted exemption to such entities from the application of IFRS 2 to the Scheme vide SRO 587 (I)/2011 dated 7 June 2011.
Had the exemption not been granted the staff costs of the Company for the year would have been higher by Rs Nil (2015: Rs 753 million), profit after taxation and unappropriated profit would have been lower by Rs Nil (2015: Rs 753 million), earnings per share would have been lower by Rs Nil (2015: Rs 0.18) per share and reserves would have been higher by Rs 30,137 million (2015: Rs 30,137 million).
The Privatization Commission has not paid any claims to unit holders since June 2011. The management believes that GoP is considering changes to the Scheme, and impact of any such changes cannot be determined as of 30 June 2016. Also refer note 9.4.
43 NON ADJUSTING EVENT AFTER BALANCE SHEET DATE
The Board of Directors recommended final cash dividend at the rate of Rs 2.00 per share amounting to Rs 8,602 million in its meeting held on 24 August 2016 for approval of shareholders.
44 DATE OF AUTHORIZATION FOR ISSUE
These financial statements were authorized for issue on 24 August 2016 by the Board of Directors of the Company.
45 GENERAL
Figures have been rounded off to the nearest thousand of rupees, unless otherwise stated.
DirectorChief Executive
134 Oil & Gas Development Company Limited

Number of
Shareholders
Shareholding Slab Total Shares
Heldfrom to
1715 1 100 104,110 9263 101 500 4,244,565 6267 501 1000 6,050,671 4492 1001 5000 10,253,222 676 5001 10000 5,161,636 230 10001 15000 2,936,682 138 15001 20000 2,512,876 88 20001 25000 2,048,619 79 25001 30000 2,222,517 36 30001 35000 1,174,157 36 35001 40000 1,383,699 30 40001 45000 1,272,571 31 45001 50000 1,492,885 19 50001 55000 1,009,084 10 55001 60000 592,200 10 60001 65000 631,149 10 65001 70000 675,000 13 70001 75000 953,863 11 75001 80000 859,687 9 80001 85000 751,238 4 85001 90000 354,534 5 90001 95000 464,836
12 95001 100000 1,189,755 12 100001 105000 1,237,465 6 105001 110000 654,800 5 110001 115000 567,000 2 115001 120000 236,413 3 120001 125000 369,000 2 125001 130000 258,000 3 130001 135000 396,460 2 135001 140000 277,000 2 140001 145000 287,000 6 145001 150000 896,437 3 150001 155000 456,629 2 155001 160000 319,500 1 160001 165000 162,000 2 165001 170000 334,306 1 170001 175000 172,000 2 175001 180000 354,449 3 180001 185000 543,000 1 185001 190000 185,804 2 190001 195000 386,144 7 195001 200000 1,393,800 2 200001 205000 405,300 2 205001 210000 413,300 5 210001 215000 1,062,438 2 215001 220000 436,080 1 220001 225000 225,000 2 240001 245000 485,996 3 245001 250000 739,603 1 250001 255000 254,096 1 255001 260000 255,900 1 260001 265000 260,400 1 265001 270000 265,800 1 270001 275000 272,500
Number of
Shareholders
Shareholding Slab Total Shares
Heldfrom to
2 275001 280000 557,200 2 280001 285000 561,047 1 290001 295000 293,000 2 295001 300000 600,000 1 300001 305000 302,300 1 330001 335000 331,360 2 340001 345000 681,800 1 345001 350000 350,000 1 350001 355000 352,200 3 355001 360000 1,069,795 2 360001 365000 726,000 1 365001 370000 367,988 1 370001 375000 372,300 1 375001 380000 379,870 1 380001 385000 385,000 2 385001 390000 776,700 1 390001 395000 392,500 2 395001 400000 796,600 1 405001 410000 405,200 1 410001 415000 414,700 1 420001 425000 425,000 2 430001 435000 864,046 1 440001 445000 443,000 1 445001 450000 450,000 1 455001 460000 455,500 1 465001 470000 470,000 1 470001 475000 471,900 2 480001 485000 964,000 3 485001 490000 1,462,100 3 495001 500000 1,499,300 1 505001 510000 506,524 1 510001 515000 513,500 1 515001 520000 516,216 1 520001 525000 525,000 1 525001 530000 526,200 1 530001 535000 534,000 2 535001 540000 1,075,450 1 545001 550000 549,200 1 560001 565000 564,800 2 570001 575000 1,147,043 1 580001 585000 582,440 1 595001 600000 595,400 2 605001 610000 1,216,500 1 610001 615000 613,000 1 615001 620000 616,262 1 620001 625000 623,952 1 640001 645000 642,600 2 645001 650000 1,300,000 1 650001 655000 653,476 1 660001 665000 664,900 1 675001 680000 677,555 1 715001 720000 719,700 1 725001 730000 728,800 2 745001 750000 1,500,000 1 760001 765000 760,563
Pattern of ShareholdingAs of 30 June 2016
Annual Report 2016 135
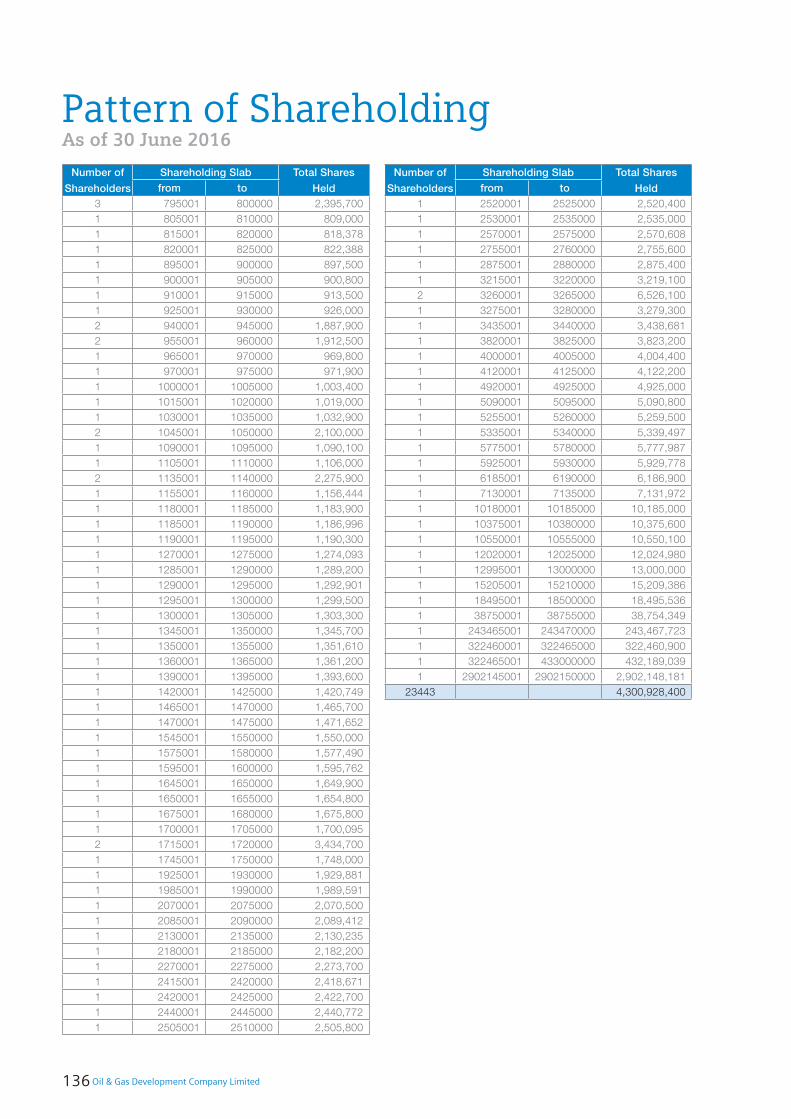
Number of
Shareholders
Shareholding Slab Total Shares
Heldfrom to
3 795001 800000 2,395,700 1 805001 810000 809,000 1 815001 820000 818,378 1 820001 825000 822,388 1 895001 900000 897,500 1 900001 905000 900,800 1 910001 915000 913,500 1 925001 930000 926,000 2 940001 945000 1,887,900 2 955001 960000 1,912,500 1 965001 970000 969,800 1 970001 975000 971,900 1 1000001 1005000 1,003,400 1 1015001 1020000 1,019,000 1 1030001 1035000 1,032,900 2 1045001 1050000 2,100,000 1 1090001 1095000 1,090,100 1 1105001 1110000 1,106,000 2 1135001 1140000 2,275,900 1 1155001 1160000 1,156,444 1 1180001 1185000 1,183,900 1 1185001 1190000 1,186,996 1 1190001 1195000 1,190,300 1 1270001 1275000 1,274,093 1 1285001 1290000 1,289,200 1 1290001 1295000 1,292,901 1 1295001 1300000 1,299,500 1 1300001 1305000 1,303,300 1 1345001 1350000 1,345,700 1 1350001 1355000 1,351,610 1 1360001 1365000 1,361,200 1 1390001 1395000 1,393,600 1 1420001 1425000 1,420,749 1 1465001 1470000 1,465,700 1 1470001 1475000 1,471,652 1 1545001 1550000 1,550,000 1 1575001 1580000 1,577,490 1 1595001 1600000 1,595,762 1 1645001 1650000 1,649,900 1 1650001 1655000 1,654,800 1 1675001 1680000 1,675,800 1 1700001 1705000 1,700,095 2 1715001 1720000 3,434,700 1 1745001 1750000 1,748,000 1 1925001 1930000 1,929,881 1 1985001 1990000 1,989,591 1 2070001 2075000 2,070,500 1 2085001 2090000 2,089,412 1 2130001 2135000 2,130,235 1 2180001 2185000 2,182,200 1 2270001 2275000 2,273,700 1 2415001 2420000 2,418,671 1 2420001 2425000 2,422,700 1 2440001 2445000 2,440,772 1 2505001 2510000 2,505,800
Number of
Shareholders
Shareholding Slab Total Shares
Heldfrom to
1 2520001 2525000 2,520,400 1 2530001 2535000 2,535,000 1 2570001 2575000 2,570,608 1 2755001 2760000 2,755,600 1 2875001 2880000 2,875,400 1 3215001 3220000 3,219,100 2 3260001 3265000 6,526,100 1 3275001 3280000 3,279,300 1 3435001 3440000 3,438,681 1 3820001 3825000 3,823,200 1 4000001 4005000 4,004,400 1 4120001 4125000 4,122,200 1 4920001 4925000 4,925,000 1 5090001 5095000 5,090,800 1 5255001 5260000 5,259,500 1 5335001 5340000 5,339,497 1 5775001 5780000 5,777,987 1 5925001 5930000 5,929,778 1 6185001 6190000 6,186,900 1 7130001 7135000 7,131,972 1 10180001 10185000 10,185,000 1 10375001 10380000 10,375,600 1 10550001 10555000 10,550,100 1 12020001 12025000 12,024,980 1 12995001 13000000 13,000,000 1 15205001 15210000 15,209,386 1 18495001 18500000 18,495,536 1 38750001 38755000 38,754,349 1 243465001 243470000 243,467,723 1 322460001 322465000 322,460,900 1 322465001 433000000 432,189,039 1 2902145001 2902150000 2,902,148,181
23443 4,300,928,400
Pattern of ShareholdingAs of 30 June 2016
136 Oil & Gas Development Company Limited

Categories of Shareholders Shareholders Shares Held Percentage
Government
Government of Pakistan 1 2,902,148,181 67.48
OGDCL - Employees Empowerment Trust 1 432,189,039 10.05
Privatisation Commission of Pakistan, Minsitry of Privatisation and Investment 1 322,460,900 7.50
Associated Companies, Undertakings and Related Parties - - -
Mutual Funds 86 44,944,633 1.04
Directors and their spouse(s) and Minor Children
Hamid Farooq 1 2,353 0.00
Executives - - -
Public Sector Companies and Corporations 10 21,275,944 0.49
Banks, Development Finance Institutions, Non-Banking Finance Companies, Insurance Companies, Takaful Companies and Modarabas 34 25,268,684 0.59
General Public
A. Local 22773 50,999,231 1.19
B. Foreign 128 463,313,350 10.77
Others 408 38,326,085 0.89
Total 23443 4,300,928,400 100.00
Shareholders holding 5% or more Shares Held Percentage
Government of Pakistan 2,902,148,181 67.48
OGDCL - Employees Empowerment Trust 432,189,039 10.05
Privatisation Commission of Pakistan, Minsitry of Privatisation & Investment 322,460,900 7.50
Franklin Templeton Investment Funds [1610-5] 243,467,723 5.66
Categories of ShareholdersAs of 30 June 2016
Annual Report 2016 137

S. No. Folio No. Name of ShareholderNumber of Shares
Held Percentage
Government Holding
1 - GOVERNMENT OF PAKISTAN 2,902,148,181 67.48
2 - OGDCL - EMPLOYEES EMPOWERMENT TRUST 432,189,039 10.05
3 04705-35398 PRIVATISATION COMMISSION OF PAKISTAN, MINSITRY OF PRIVATISATION
AND INVESTMENT 322,460,900 7.50
3 3,656,798,120 85.02
Associated Companies, Undertakings and Related Parties
NIL
Mutual Funds
1 05371-28 CDC - TRUSTEE MCB PAKISTAN STOCK MARKET FUND 4,004,400 0.09
2 05488-25 CDC - TRUSTEE PAKISTAN CAPITAL MARKET FUND 168,600 0.00
3 05520-28 GOLDEN ARROW SELECTED STOCKS FUND LIMITED 750,000 0.02
4 05645-24 CDC - TRUSTEE PICIC INVESTMENT FUND 795,700 0.02
5 05777-29 CDC - TRUSTEE PICIC GROWTH FUND 1,465,700 0.03
6 05819-23 CDC - TRUSTEE MCB PAKISTAN ISLAMIC STOCK FUND 613,000 0.01
7 05959-27 CDC - TRUSTEE ATLAS STOCK MARKET FUND 1,550,000 0.04
8 05991-23 CDC - TRUSTEE MEEZAN BALANCED FUND 450,000 0.01
9 06197-29 CDC - TRUSTEE ALFALAH GHP VALUE FUND 362,900 0.01
10 06213-25 CDC - TRUSTEE UNIT TRUST OF PAKISTAN 471,900 0.01
11 06411-21 CDC - TRUSTEE AKD INDEX TRACKER FUND 146,437 0.00
12 06437-29 CDC - TRUSTEE PICIC ENERGY FUND 487,100 0.01
13 06619-26 CDC - TRUSTEE AKD OPPORTUNITY FUND 650,000 0.02
14 06726-23 CDC - TRUSTEE PAK. INT. ELEMENT ISLAMIC ASSET ALLOCATION FUND 213,900 0.00
15 07062-23 CDC - TRUSTEE AL MEEZAN MUTUAL FUND 650,000 0.02
16 07070-22 CDC - TRUSTEE MEEZAN ISLAMIC FUND 3,823,200 0.09
17 07377-26 CDC - TRUSTEE UBL STOCK ADVANTAGE FUND 913,500 0.02
18 09449-25 CDC - TRUSTEE ATLAS ISLAMIC STOCK FUND 470,000 0.01
19 09456-24 CDC - TRUSTEE AL-AMEEN SHARIAH STOCK FUND 300,000 0.01
20 09480-21 CDC - TRUSTEE NAFA STOCK FUND 1,929,881 0.04
21 09506-26 CDC - TRUSTEE NAFA MULTI ASSET FUND 254,096 0.01
22 09746-28 CDC - TRUSTEE MCB DCF INCOME FUND 13,000 0.00
23 10108-22 CDC - TRUSTEE ASKARI ASSET ALLOCATION FUND 85,000 0.00
24 10397-29 CDC - TRUSTEE MEEZAN TAHAFFUZ PENSION FUND - EQUITY SUB FUND 900,800 0.02
25 10603-21 CDC - TRUSTEE APF - EQUITY SUB FUND 125,000 0.00
26 10660-25 CDC - TRUSTEE JS PENSION SAVINGS FUND - EQUITY ACCOUNT 48,100 0.00
27 10710-28 CDC - TRUSTEE ALFALAH GHP ISLAMIC STOCK FUND 1,106,000 0.03
28 10728-27 CDC - TRUSTEE HBL - STOCK FUND 1,654,800 0.04
29 10801-27 CDC - TRUSTEE NAFA ISLAMIC ASSET ALLOCATION FUND 489,000 0.01
30 10900-25 CDC - TRUSTEE APIF - EQUITY SUB FUND 90,000 0.00
31 10918-24 MC FSL TRUSTEE JS - INCOME FUND 121,500 0.00
32 11056-28 CDC - TRUSTEE HBL MULTI - ASSET FUND 213,000 0.00
33 11262-23 CDC - TRUSTEE MCB PAKISTAN ASSET ALLOCATION FUND 480,500 0.01
34 11486-27 CDC - TRUSTEE JS ISLAMIC PENSION SAVINGS FUND-EQUITY ACCOUNT 44,000 0.00
35 11809-26 CDC - TRUSTEE ALFALAH GHP STOCK FUND 719,700 0.02
36 11924-22 CDC - TRUSTEE ALFALAH GHP ALPHA FUND 483,500 0.01
37 12021-20 CDC - TRUSTEE NIT STATE ENTERPRISE FUND 7,131,972 0.17
38 12120-28 CDC - TRUSTEE NIT-EQUITY MARKET OPPORTUNITY FUND 1,292,901 0.03
39 12195-21 CDC - TRUSTEE ABL STOCK FUND 897,500 0.02
40 12310-25 CDC - TRUSTEE FIRST HABIB STOCK FUND 66,500 0.00
41 12336-23 CDC - TRUSTEE LAKSON EQUITY FUND 1,135,900 0.03
42 12625-27 CDC - TRUSTEE NAFA ASSET ALLOCATION FUND 211,000 0.00
43 12880-27 CDC - TRUSTEE NAFA SAVINGS PLUS FUND - MT 55,200 0.00
44 13052-26 CDC - TRUSTEE AKD AGGRESSIVE INCOME FUND - MT 19,500 0.00
45 13367-29 CDC - TRUSTEE PICIC INCOME FUND - MT 32,100 0.00
46 13607-28 CDC - TRUSTEE PICIC STOCK FUND 14,400 0.00
47 13714-25 CDC - TRUSTEE HBL PF EQUITY SUB FUND 44,000 0.00
48 13813-23 CDC - TRUSTEE ASKARI EQUITY FUND 90,000 0.00
49 13862-28 CDC - TRUSTEE ALFALAH GHP INCOME FUND - MT 10,200 0.00
50 13953-27 MCBFSL - TRUSTEE PAK OMAN ADVANTAGE ASSET ALLOCATION FUND 44,000 0.00
51 13961-26 MCBFSL - TRUSTEE PAK OMAN ISLAMIC ASSET ALLOCATION FUND 41,000 0.00
Categories of ShareholdersName Wise Detail as of 30 June 2016
138 Oil & Gas Development Company Limited

S. No. Folio No. Name of ShareholderNumber of Shares
Held Percentage
52 14092-21 CDC - TRUSTEE LAKSON INCOME FUND - MT 5,700 0.00
53 14134-25 CDC - TRUSTEE ATLAS INCOME FUND - MT 201,500 0.00
54 14373-27 MCBFSL - TRUSTEE ABL ISLAMIC STOCK FUND 944,800 0.02
55 14480-24 CDC - TRUSTEE PIML STRATEGIC MULTI ASSET FUND 110,000 0.00
56 14514-28 CDC - TRUSTEE FIRST CAPITAL MUTUAL FUND 62,800 0.00
57 14605-27 CDC - TRUSTEE AL-AMEEN ISLAMIC ASSET ALLOCATION FUND 110,000 0.00
58 14688-29 CDC - TRUSTEE NIT INCOME FUND - MT 102,300 0.00
59 14761-29 CDC - TRUSTEE PIML ISLAMIC EQUITY FUND 105,000 0.00
60 14803-23 CDC - TRUSTEE FAYSAL SAVINGS GROWTH FUND - MT 42,800 0.00
61 14845-29 CDC - TRUSTEE AL-AMEEN ISLAMIC RET. SAV. FUND - EQUITY SUB FUND 75,000 0.00
62 14860-27 CDC - TRUSTEE UBL RETIREMENT SAVINGS FUND - EQUITY SUB FUND 357,900 0.01
63 14902-21 CDC - TRUSTEE NATIONAL INVESTMENT (UNIT) TRUST 572,043 0.01
64 14969-25 CDC - TRUSTEE PICIC ISLAMIC STOCK FUND 30,100 0.00
65 15115-26 CDC - TRUSTEE ASKARI HIGH YIELD SCHEME - MT 13,900 0.00
66 15362-27 CDC - TRUSTEE ABL ISLAMIC PENSION FUND - EQUITY SUB FUND 23,000 0.00
67 15388-25 CDC - TRUSTEE ABL PENSION FUND - EQUITY SUB FUND 23,300 0.00
68 15974-23 CDC - TRUSTEE NAFA ISLAMIC STOCK FUND 293,000 0.01
69 16014-27 CDC - TRUSTEE PAKISTAN SARMAYA MEHFOOZ FUND 142,000 0.00
70 16022-26 CDC - TRUSTEE NAFA INCOME OPPORTUNITY FUND - MT 181,300 0.00
71 16030-25 CDC - TRUSTEE PIML VALUE EQUITY FUND 137,000 0.00
72 16105-26 CDC - TRUSTEE HBL MUSTAHEKUM SARMAYA FUND 1 63,700 0.00
73 16139-23 CDC - TRUSTEE NIT ISLAMIC EQUITY FUND 956,000 0.02
74 16162-20 CDC - TRUSTEE NITIPF EQUITY SUB-FUND 15,000 0.00
75 16188-28 CDC - TRUSTEE NITPF EQUITY SUB-FUND 5,000 0.00
76 16246-20 MCBFSL - TRUSTEE NAFA INCOME FUND - MT 104,200 0.00
77 16303-22 CDC - TRUSTEE ALFALAH GHP INCOME MULTIPLIER FUND - MT 26,600 0.00
78 16386-24 CDC - TRUSTEE AL AMEEN ISLAMIC DEDICATED EQUITY FUND 809,000 0.02
79 16402-20 CDC - TRUSTEE NAFA ISLAMIC ACTIVE ALLOCATION EQUITY FUND 153,700 0.00
80 16485-22 CDC - TRUSTEE FAYSAL MTS FUND - MT 1,400 0.00
81 16501-27 CDC - TRUSTEE MEEZAN ASSET ALLOCATION FUND 60,000 0.00
82 16519-26 CDC - TRUSTEE NAFA ISLAMIC ENERGY FUND 499,300 0.01
83 16535-24 CDC - TRUSTEE LAKSON TACTICAL FUND 132,103 0.00
84 14415-21 CDC - TRUSTEE NAFA PENSION FUND EQUITY SUB-FUND ACCOUNT 106,800 0.00
85 15719-23 CDC - TRUSTEE PAKISTAN ISLAMIC PENSION FUND - EQUITY SUB FUND 128,000 0.00
86 15727-22 CDC - TRUSTEE PAKISTAN PENSION FUND - EQUITY SUB FUND 220,000 0.01
86 44,944,633 1.04
Directors and their Spouse(s) and Minor Children
1 01826-3202 HAMID FAROOQ 2,353 0.00
1 2,353 0.00
Executives
NIL
Public Sector Companies and Corporations
1 01867-22 PAKISTAN KUWAIT INVESTMENT CO. (PVT) LTD. 1,003,400 0.02
2 02659-34 PAK LIBYA HOLDING COMPANY (PVT.) LIMITED 150,000 0.00
3 03889-28 NATIONAL BANK OF PAKISTAN 477 0.00
4 03889-44 NATIONAL BANK OF PAKISTAN 3,438,681 0.08
5 04812-24 PAK - OMAN INVESTMENT COMPANY LTD. 150,000 0.00
6 06247-63 SAUDI PAK INDUSTRIAL & AGRICULTURAL INVESTMENT CO. LTD.- PMD 500,000 0.01
7 10819-26 PAK BRUNEI INVESTMENT COMPANY LIMITED 385,000 0.01
8 11304-27 PAIR INVESTMENT COMPANY LIMITED 340,300 0.01
9 16527-25 PAK - OMAN INVESTMENT COMPANY LTD. - MT 98,700 0.00
10 02683-23 STATE LIFE INSURANCE CORP. OF PAKISTAN 15,209,386 0.35
10 21,275,944 0.49
Banks, Development Financial Institutions, Non Banking Financial Institutions, Insurance Companies, Takaful and Modarabas
1 00307-40281 INNOVATIVE INVESTMENT BANK LIMITED 34,000 0.00
2 02246-42 HABIB BANK LIMITED - TREASURY DIVISION 606,500 0.01
3 02295-39 FAYSAL BANK LIMITED 1,361,200 0.03
4 02394-29 NIB BANK LIMITED 486,000 0.01
5 02618-20 HABIB METROPOLITAN BANK LIMITED 414,700 0.01
6 02832-32 MEEZAN BANK LIMITED 537,000 0.01
Categories of ShareholdersName Wise Detail as of 30 June 2016
Annual Report 2016 139

S. No. Folio No. Name of ShareholderNumber of Shares
Held Percentage
7 03079-42 SONERI BANK LIMITED - ORDINARY SHARES 1,050,000 0.02
8 03111-46 UNITED BANK LIMITED - TRADING PORTFOLIO 2,520,400 0.06
9 03335-57 BANK ALFALAH LIMITED 1,190,300 0.03
10 03798-52 THE BANK OF KHYBER 150,000 0.00
11 04127-28 MCB BANK LIMITED - TREASURY 2,130,235 0.05
12 04598-22 FIRST WOMEN BANK LIMITED 110,000 0.00
13 04606-29 SILKBANK LIMITED 80,000 0.00
14 06502-6117 FIRST CREDIT & INVESTMENT BANK LTD. 44,000 0.00
15 07393-24 SUMMIT BANK LIMITED 363,100 0.01
16 11940-4410 ESCORTS INVESTMENT BANK LIMITED 1,107 0.00
17 14506-11 NIB BANK LIMITED - MT 352,200 0.01
18 00364-164630 ASIA INSURANCE COMPANY LIMITED. 43,000 0.00
19 02139-29 PREMIER INSURANCE LIMITED 260,400 0.01
20 02451-21 JUBILEE GENERAL INSURANCE COMPANY LIMITED 1,183,900 0.03
21 03277-2184 EFU GENERAL INSURANCE LIMITED 225,000 0.01
22 03277-2538 EFU LIFE ASSURANCE LTD 4,122,200 0.10
23 03277-6454 ALPHA INSURANCE CO. LTD. 6,300 0.00
24 03277-7330 RELIANCE INSURANCE COMPANY LTD. 25,076 0.00
25 03277-9371 JUBILEE LIFE INSURANCE COMPANY LIMITED 5,777,987 0.13
26 03277-9404 ALLIANZ EFU HEALTH INSURANCE LIMITED 35,000 0.00
27 03277-12023 EAST WEST INSURANCE CO.LTD 205,300 0.00
28 03277-15009 CENTURY INSURANCE COMPANY LTD. 68,879 0.00
29 03277-57588 ATLAS INSURANCE LIMITED 180,500 0.00
30 03459-996 ASKARI GENERAL INSURANCE CO. LTD. 12,500 0.00
31 13748-501 ADAMJEE LIFE ASSURANCE CO.LTD-IMF 1,050,000 0.02
32 13755-21 ADAMJEE INSURANCE COMPANY LIMITED 610,000 0.01
33 02113-21 FIRST EQUITY MODARABA 26,900 0.00
34 03277-1651 FIRST UDL MODARABA 5,000 0.00
34 25,268,684 0.59
General Public - Local
22773 50,999,231 1.19
General Public - Foreign
1 93263 M/S STATE STREET BANK & TRUST CO 1 0.00
2 00364-15220 RAFIQUE SULEMAN 128 0.00
3 00364-137065 DR. OMAR ABDUL MONEM YOUSUF AL ZAWAWI 20,000 0.00
4 00513-19305 ZAIN UL ABIDIN 100 0.00
5 00521-700 DEUTSCHE BANK AG LONDON BRANCH 2,570,608 0.06
6 00521-2532 CANADA POST CORPORATION REGISTERED PENSION PLAN 1,345,700 0.03
7 00521-2680 ROBECO CAPITAL GROWTH FUNDS 1,595,762 0.04
8 00521-2920 EATON VANCE COLLECTIVE INV TRT FOR EMP BENEFIT PLANS 1,090,100 0.03
9 00521-2938 LAZARD/WILMINGTON COLLECTIVE TRUST (SUDAN FREE) 5,339,497 0.12
10 00521-2979 LAZARD RETIREMENT EMERGING MKT EQT PRTFL 3,279,300 0.08
11 00521-2987 LAZARD/WILMINGTON COLLECTIVE TRUST 818,378 0.02
12 00521-2995 LAZARD EMERGING MARKETS EQUITY PORTFOLIO 38,754,349 0.90
13 00521-3068 SANOFI - AVENTIS US PENSION TRUST 389,100 0.01
14 00521-3266 CALIFORNIA STATE TEACHERS RTM SYT-LAZARD ASSET MNG LLC 4,925,000 0.11
15 00521-3399 CALIFORNIA PUBLIC EMPLOYEES RETIREMENT SYSTEM 5,929,778 0.14
16 00521-3415 CALIFORNIA PUBLIC EMPLOYEES RETIREMENT SYSTEM 506,524 0.01
17 00521-3431 CALIFORNIA PUBLIC EMPLOYEES RETIREMENT SYSTEM 653,476 0.02
18 00521-3449 CALIFORNIA PUBLIC EMPLOYEES RETIREMENT SYSTEM 5,259,500 0.12
19 00521-3456 MORGAN STANLEY INST FD INC FRONTIER EMERGING MKT PORTFOLIO 10,375,600 0.24
20 00521-3498 GENERAL CONFERENCE CORPORATION OF SEVENTH DAY ADVENTISTS 101,700 0.00
21 00521-3530 STATE OF NEW JERSEY COMMON PENSION FUND D 1,420,749 0.03
22 00521-3639 UPS GROUP TRUST 2,418,671 0.06
23 00521-3662 PARAMETRIC EMERGING MARKETS FUND 1,989,591 0.05
24 00521-3688 PARAMETRIC TAX-MANAGED EMERGING MARKETS FUND 1,649,900 0.04
25 00521-3845 LAZARD EMERGING MARKETS FUND 2,182,200 0.05
26 00521-3944 PUBLIC EMPLOYEES RETIREMENT SYSTEM OF MISSISSIPPI 2,535,000 0.06
27 00521-3951 GOLDMAN SACHS FUNDS-GOLDMAN SACHS N-11(R) EQUITY PORTFOLIO 2,273,700 0.05
28 00521-4082 THE JAMES IRVINE FOUNDATION 199,600 0.00
Categories of ShareholdersName Wise Detail as of 30 June 2016
140 Oil & Gas Development Company Limited

S. No. Folio No. Name of ShareholderNumber of Shares
Held Percentage
29 00521-4793 TEACHER RETIREMENT SYSTEM OF TEXAS 526,200 0.01
30 00521-4801 TEACHER RETIREMENT SYSTEM OF TEXAS 5,090,800 0.12
31 00521-4934 EMERGING MARKETS EQUITY GROUP TRUST 3,261,100 0.08
32 00521-4942 EARNEST INSTITUTIONAL LLC 36,646 0.00
33 00521-5162 ADVANCE SERIES TRUST - AST PARAMETRIC EMERGING MKTS EQT PRTF 203,800 0.00
34 00521-5246 EATON VANCE TRT CO CM TRT FD-PARMTC STR EME MKT EQT CM TRT F 32,000 0.00
35 00521-5329 ONTARIO PENSION BOARD 1,471,652 0.03
36 00521-5535 THE EMERGING FRONTIERS MASTER FUND LTD 99,055 0.00
37 00521-5659 EURIZON EASYFUND 822,388 0.02
38 00521-5774 BLACKROCK FRONTIER MKTS EX-GULF COOP COUNCIL COUNTRIES FUN B 1,186,996 0.03
39 00521-5790 BLACKROCK FRONTIER MARKETS FUND 1,675,800 0.04
40 00521-5808 BLACKROCK FRONTIER MARKETS FUND B 1,274,093 0.03
41 00521-5980 ISHARES MSCI FRONTIER 100 ETF 3,219,100 0.07
42 00521-6269 MSAM SA ACTING ON BEHALF OF MORGAN STANLEY GALAXY FUND 10,185,000 0.24
43 00521-6368 STICHTING F&C MULTI MANAGER EMERGING EQUITY ACTIVE 623,952 0.01
44 00521-6483 MONETARY AUTHORITY OF SINGAPORE 1,289,200 0.03
45 00521-6590 CITY OF NEW YORK GROUP TRUST 242,400 0.01
46 00521-7002 RUSSELL INVESTMENT COMPANY II PUBLIC LIMITED COMPANY 1,019,000 0.02
47 00521-7184 CALIFORNIA PUBLIC EMPLOYEES RETIREMENT SYSTEM 74,100 0.00
48 00521-7218 RUSSELL INST FUNDS,LLC-RUSSELL EMER MARKETS EQUITY PLUS FUND 281,000 0.01
49 00521-7382 TEACHER RETIREMENT SYSTEM OF TEXAS 405,200 0.01
50 00521-7416 PUBLIC SCHOOL TEACHERS PENSION AND RETIREMENT FD OF CHICAGO 51,600 0.00
51 00521-7606 GOLDMAN SACHS FUNDS II - GOLDMAN SACHS GMS EME EQU PORTFOLIO 396,600 0.01
52 00521-7648 GUGGENHEIM FRONTIER MARKETS ETF 243,596 0.01
53 00521-7663 VPB - FINANCE S.A. 199,100 0.00
54 00521-7812 JNL/LAZARD EMERGING MARKETS FUND 2,440,772 0.06
55 00521-7903 PUBLIC EMPLOYEES RETIREMENT ASSOCIATION OF NEW MEXICO 113,700 0.00
56 00521-8026 CALIFORNIA PUBLIC EMPLOYEES RETIREMENT SYSTEM 1,299,500 0.03
57 00521-8042 VANGUARD FTSE ASIA EX JAPAN HIGH DIVIDEND YIELD INDEX ETF 9,800 0.00
58 00521-8083 ST STR TR HK LT AS TRS F VN ETF SER - VAN FTSE A EX JA IN ET 3,000 0.00
59 00521-8257 VANGUARD INTERNATIONAL HIGH DIVIDEND YIELD INDEX FUND 10,000 0.00
60 00521-8307 LAZARD INVESTMENT FUNDS-LAZARD EMERGING MARKETS FUND 1,700,095 0.04
61 00521-8349 GOLDMAN SACHS TRUST II GOLDMAN SACHS MULTI-MANGER GL EQ FUND 20,400 0.00
62 00521-8414 PARAMETRIC EMERGING MARKETS CORE FUND 5,900 0.00
63 00547-2068 MERRILL LYNCH INTERNATIONAL 516,216 0.01
64 00547-2142 LEGAL AND GENERAL ASSURANCE SOCIETY LTD. 83,800 0.00
65 00547-2407 LEGAL & GENERAL ASSURANCE (PENSIONS MANAGEMENT) LTD 2,089,412 0.05
66 00547-2761 J.P. MORGAN SECURITIES PLC 23,000 0.00
67 00547-6622 BNP PARIBAS ARBITRAGE 1,101 0.00
68 00547-6945 HSBC TRSTE (CAYMAN)LTD AS TRSTE OF FULLERTON FND C1-F.VPIC F 280,047 0.01
69 00547-7133 LEGAL & GENERAL GLOBAL EMERGING MARKETS INDEX FUND 185,804 0.00
70 00547-7406 HARDING LOEVNER FUNDS,INC FRONTIER EMERGING MARKET PORTFOLIO 1,393,600 0.03
71 00547-8073 CITIGROUP GLOBAL MARKETS MAURITIUS PRIVATE LIMITED 213,158 0.00
72 00547-8115 EATON VANCE INTL IRLEND F.P-EATN V.INTL IRLND PRAMTRIC E.M.F 379,870 0.01
73 00547-8222 TUNDRA PAKISTAN FUND 3,265,000 0.08
74 00547-8487 NTGI - QM COMMON DIVERSIFIED FRONTIER MARKETS INDEX FUND 1,156,444 0.03
75 00547-8545 TUNDRA FRONTIER OPPORTUNITIES FUND 700 0.00
76 00547-8834 ASHMORE SICAV EMERGING MARKET FRONTIER EQUITY FUND 664,900 0.02
77 00547-8859 THE HARDING LOEVNER FRONTIER MARKETS EQUITY FUND 53,000 0.00
78 00547-9089 UNILEVER OVERSEAS HOLDINGS LIMITED 100 0.00
79 00547-9659 ASHMORE EMERGING MARKETS FRONTIER EQUITY FUND 728,800 0.02
80 00547-10012 STCTNG BEDRIJFSTAKPENSIOENFONDS VOR HET BEROEPSVERVOER O.D.W 969,800 0.02
81 00547-10046 OP - EMERGING FRONTIER FUND 525,000 0.01
82 00547-10467 ONESHARE PUBLIC LIMITED COMPANY 549,200 0.01
83 00547-10657 NOMURA MULTI MANAGERS FUND III-ASIAN EQUITY 26,000 0.00
84 00547-10962 ARROWSTREET (CANADA) GLOBAL WORLD ALPHA EXTENSION FUND I 302,300 0.01
85 00695-3242 THE BANK OF NEW YORK [414-2] 12,024,980 0.28
86 00695-3978 JPMORGAN CHASE BANK [540-4] 65,670 0.00
87 00695-4562 UNIEM FERNOST (586-5) 800,000 0.02
88 00695-5049 SCHRODER INTERNATIONAL SELECTION FUND [634-5] 2,505,800 0.06
Categories of ShareholdersName Wise Detail as of 30 June 2016
Annual Report 2016 141

S. No. Folio No. Name of ShareholderNumber of Shares
Held Percentage
89 00695-6468 ABU DHABI INVESTMENT AUTHORITY (767-0) 971,900 0.02
90 00695-8381 BARCLAYS CAPITAL SECURITIES LIMITED (967-4) 143 0.00
91 00695-8464 MORGAN STANLEY INVESTMENT FUNDS (975-6) 1,718,500 0.04
92 00695-9892 MORGAN STANLEY MAURITIUS COMPANY LIMITED(1130-1) 5,011 0.00
93 00695-10353 STICHTING DEPOSITARY APG EMERGING MARKETS EQUITY POOL 18,495,536 0.43
94 00695-10817 GOLDMAN SACHS INVESTMENTS (MAURITIUS) I LIMITED [1400-5] 1,351,610 0.03
95 00695-10874 CONSULTING GROUP CAPITAL MARKETS FUNDS [1363-5] 616,262 0.01
96 00695-11302 GOLDMAN SACHS TRUST -GOLDMAN SACHS N-11 EQUITY FUND [1443-1] 595,400 0.01
97 00695-11450 FRANKLIN TEMPLETON INVESTMENTS CORP. [1453-4] 2,755,600 0.06
98 00695-11591 TEMPLETON EMERGING MARKETS FUND [1471-2 ] 387,600 0.01
99 00695-11708 GLOBAL X FUNDS - GLOBAL X MSCI PAKISTAN ETF 582,440 0.01
100 00695-11716 PFA KAPITALFORENING [1484-3] 2,875,400 0.07
101 00695-12193 VANGUARD FUNDS PLC - VG FTSE ALL-WORLD UCITS ETF [1533-0] 2,700 0.00
102 00695-12201 VANGUARD FUNDS PLC - VANGUARD FTSE EM UCITS ETF [1534-4] 104,900 0.00
103 00695-12284 THE NOMURA TRUST AND BANKING CO. LTD (1542-6) 14,000 0.00
104 00695-12342 KAPITALFORENINGEN LAERERNES PENSION INVEST [1547-5] 1,303,300 0.03
105 00695-12391 SCHRODER FRONTIER MARKETS EQUITY PORTFOLIO L.P.[1554-3] 159,500 0.00
106 00695-12417 BMA FUNDS LIMITED [PK1555-0 ] 145,000 0.00
107 00695-12581 VANGUARD FUNDS PUBLIC LIMITED COMPANY [1573-5] 18,000 0.00
108 00695-12953 FRANKLIN TEMPLETON INVESTMENT FUNDS [1610-5] 243,467,723 5.66
109 00695-12987 GLOBAL X FUNDS - GLOBAL X NEXT EMERGING & FRONTIER ETF 11,400 0.00
110 00695-13308 T. ROWE PRICE FUNDS SICAV - FRONTIER MKTS EQ F[000912600018] 102,500 0.00
111 00695-13373 T. ROWE PRICE INSTITITIONAL FRONTIER MAKTS EQTY FD[911900257] 372,300 0.01
112 00695-13548 JPMORGAN DIVERSIFIED RETURN EMERGING MARKETS EQUITY ETF 5,800 0.00
113 00695-13589 VANGUARD TOTAL INTERNATIONAL STOCK INDEX FUND 6,186,900 0.14
114 00695-13621 VANGUARD EMERGING MARKETS STOCK INDEX FUND 10,550,100 0.25
115 00695-13639 VANGUARD TOTAL WORLD STOCK INDEX FUND 122,500 0.00
116 00695-13654 SEI INSTITUTIONAL INVESTMENTS TRUST-EMERGING MARKETS EQT FUN 2,070,500 0.05
117 00695-13712 KRANESHARES FTSE EMERGING MARKETS PLUS ETF 10,465 0.00
118 02832-2764 H.E. SH. EBRAHIM KHALIFA ALI AL KHALIFA 112,000 0.00
119 03533-698 HABIB BANK AG ZURICH, ZURICH,SWITZERLAND 367,988 0.01
120 03533-722 HABIB BANK AG ZURICH, DEIRA DUBAI 760,563 0.02
121 03533-2272 MAHMOOD AHMAD CHAUDHRY 47,000 0.00
122 03590-2631 FAZAL REHMAN 12,900 0.00
123 06452-27426 MOHAMMED ANWAR PERVEZ 443,000 0.01
124 06502-755 HABIBSONS BANK LTD - CLIENT ACCOUNT 538,450 0.01
125 06502-5283 TARIIC HOLDING COMPANY BSC (CLOSED) 75,000 0.00
126 07450-21022 FARZANA BADAR 400 0.00
127 12666-924 TARIIC HOLDING COMPANY BSC CLOSED 7,800 0.00
128 14282-17808 AHMAD KHAN 4,000 0.00
128 463,313,350 10.77
Others
1 00364-19255 PRUDENTIAL STOCKS FUND LTD (03360) 6,500 0.00
2 00547-8651 UNILEVER PAKISTAN LIMITED NON-MANAGEMENT STAFF GRATUITY FUND 2,900 0.00
3 00547-8669 THE UNION PAKISTAN PROVIDENT FUND 66,500 0.00
4 00547-8685 UNILEVER PAKISTAN DC PENSION FUND (SUB FUND B) 39,000 0.00
5 00547-10186 WYETH PAKISTAN DC PENSION FUND 7,500 0.00
6 00547-10194 PFIZER PAKISTAN DC PENSION FUND 39,700 0.00
7 00547-10251 PFIZER PAKISTAN PROVIDENT FUND 51,100 0.00
8 01826-87767 ABRIS (PRIVATE) LIMITED 27,500 0.00
9 03277-41265 MANAGEMENT & ENTERPRISES (PVT) LIMITED 1,602 0.00
10 03277-89136 ABRIS (PVT) LTD 38,500 0.00
11 05884-4606 ORION INVESTMENTS (PVT) LTD. 001158 500 0.00
12 13904-22 CYAN LIMITED 750,000 0.02
13 15818-518 NOMAN ABID & COMPANY LIMITED 40,000 0.00
14 07419-8676 PAK QATAR INDIVIDUAL FAMILY PARTICIPANT INVEST FUND 50,000 0.00
15 07419-13130 PAK QATAR INVESTMENT ACCOUNT 30,000 0.00
16 10298-6432 SAFEWAY FUND LIMITED 350,000 0.01
17 483 ALBARAKA BANK (PAKISTAN) LIMITED - STAFF PROVIDENT FUND 2,053 0.00
18 8369 M/S TRUSTEES NRL WORKMEN PROVIDENT FUND 30,925 0.00
Categories of ShareholdersName Wise Detail as of 30 June 2016
142 Oil & Gas Development Company Limited

S. No. Folio No. Name of ShareholderNumber of Shares
Held Percentage
19 8455 M/S ZEENAT HUSSAIN FOUNDATION 5,511 0.00
20 9214 M/S RELIANCE COMMODITIES (PVT) LTD 12,880 0.00
21 9893 M/S TRI - PACK FILMS LTD EMPLOYEES GRATUITY FUND 5,361 0.00
22 9894 M/S TRI - PACK FILMS LTD. EMPLOYEES PROVIDEND FUND 5,361 0.00
23 13522 M/S SEC MANAGEMENT PENSION FUND 15,888 0.00
24 13898 M/S SHAIKH SALIM ALI ALLY ARMS CO. 1,000 0.00
25 16323 M/S EMPLOYEES PENSION FUND-PAKISATAN SECURITY PRINTING 677,555 0.02
26 19205 M/S RELIANCE INSURANCE COMPANY LTD. EMP. PROVIDENT FUND 3,105 0.00
27 23395 M/S TRUSTERS NRL NON, MANAGEMENT STAFF GRATUITY FUND 30,925 0.00
28 24126 M/S SSG NON - EXEC. STAFF GRATUITY FUND 45,963 0.00
29 24127 M/S SSG EXEC. STAFF PROVIDENT FUND 211,380 0.00
30 24128 M/S SSG NON-EXEC. STAFF PROVIDENT FUND 151,229 0.00
31 24129 M/S SSG EXEC. STAFF GRATUITY FUND 45,963 0.00
32 24567 M/S DESCON STAFF PROVIDENT FUND TRUST 10,173 0.00
33 32163 M/S HIGHNOON LABORATORIES LTD STAFF PROVIDENT FUND 4,609 0.00
34 36417 M/S SIEMENS PAK SPECIAL ASSIST 14,985 0.00
35 37971 M/S ANOUD GAS LIMITED 2,353 0.00
36 38959 M/S FATIMA FOUNDATION 2,353 0.00
37 44076 M/S LOWE & PAUF STAFF PROVIDENT FUND 8,369 0.00
38 44281 M/S ROCHE PAKISTAN LIMITED NON MANAGEMENT STAFF GR. FUND 1,301 0.00
39 44438 M/S AIDY VEE & COMPANY (PVT) LTD. STAFF PROVIDEND FUND 1,602 0.00
40 44999 M/S INTERNATIONAL AERADIO PAKISTAN LTD. STAFF PRV. FUND 1,301 0.00
41 46298 M/S DIVERSIFIED LOGISTICS PVT. 1,000 0.00
42 46350 M/S KARACHI AMERICAN SOCIETY SCHOOL EMPL. PROVIDENT FUND 5,361 0.00
43 46538 M/S TRANSCONTINENTAL SERVICES STAFF P.F. 1,301 0.00
44 46545 M/S TAQ ENTERPRISES STAFF PROV. 2,353 0.00
45 46554 M/S TAQ INTERNATIONAL STAFF 2,654 0.00
46 47230 M/S THE EASTERN TRADE DISTRIBUTION COMP (PVT) LTD. 1,000 0.00
47 47234 M/S SURGE LABORATORIES (PVT) LTD. EMPLOYEES PROVIDENT FUND 1,301 0.00
48 47239 M/S NABIQASIM INDUSTES (PVT) LTD. EMPLOYEES PROVIDENT FUND 2,504 0.00
49 51285 M/S RURAL DEVELOPMENT FOUNDATION 1,752 0.00
50 66664 M/S SHAIKH SALIM ALI TRUST 1,000 0.00
51 82298 M/S H.M NASIR & CO 500 0.00
52 85417 M/S FATIMA FOUNDATION WELFARE TRUST 835 0.00
53 88189 M/S REDCO TEXTILE LTD. 500 0.00
54 88569 M/S DYNAMIC COMPUTER SYSTEM 500 0.00
55 89143 M/S KARACHI AMERICAN SOCIETY SCHOOL EMPLOYEES PROVIDENT FUND 3,681 0.00
56 89144 M/S KARACHI AMERICAN SOCIETY SCHOOL EMPLOYEES GRATUITY FUND 3,681 0.00
57 90072 M/S CAPITAL FLOUR MILLS LIMITED 500 0.00
58 90073 M/S S. SALIM ALI (PVT.) LIMITED 500 0.00
59 90074 M/S ALLY BROS & CO. 500 0.00
60 93300 M/S AHMED GARIB FOUNDATION 4,000 0.00
61 94473 PHILLIPA DARGO JANJUA 1,000 0.00
62 00364-65 KASB SECURITIES LIMITED 10,000 0.00
63 00364-6773 TRUSTEE NESTLE PAKISTAN LTD. MANAGERIAL STAFF PENSION FUND 162,000 0.00
64 00364-6781 TRUSTEE NESTLE PAKISTAN LTD.EMPLOYEES PROVIDENT FUND (02333) 118,000 0.00
65 00364-13688 TRUSTEES KUEHNE & NAGEL PAKISTAN SPF 500 0.00
66 00364-16558 TRUSTEES HIMONT PHARAMA EMPLOYEE P.F. 8,369 0.00
67 00364-16624 TRUSTEE NESTLE PAKISTAN LTD. EMPLOYEES GRATUITY FUND (03866) 102,500 0.00
68 00364-141034 CENTRAL DEPOSITORY COMPANY OF PAKISTAN LIMITED. 109 0.00
69 00364-185312 SIDDIQ LEATHER WORKS (PVT) LTD 9,300 0.00
70 00513-32 RAHAT SECURITIES LIMITED 500 0.00
71 00521-3878 TRUSTEE - SANOFI AVENTIS PAKISTAN - EMPLOYEES PROVIDENT FUND 28,000 0.00
72 00521-3886 TRUSTEE - SANOFI AVENTIS PAKISTAN SENIOR - EXECUTIVE PENSION FD 28,100 0.00
73 00521-3894 TRUSTEE - SANOFI AVENTIS PAKISTAN - EMPLOYEES GRATUITY FUND 20,000 0.00
74 00521-5170 TRUSTEE - BSN MEDICAL (PVT) LIMITED - EMPLOYEES PROVIDENT FUND 10,000 0.00
75 00521-5188 TRUSTEE - BSN MEDICAL (PVT) LIMITED - EMPLOYEES GRATUITY FUND 7,000 0.00
76 00521-5311 PAKISTAN CENTRE FOR PHILANTHROPY 27,000 0.00
77 00521-5865 DESCON CHEMICALS LIMITED GRATUITY FUND 1,600 0.00
78 00521-6061 TRUSTEE ENGRO CORPORATION LTD GRATUITY FUND 17,500 0.00
Categories of ShareholdersName Wise Detail as of 30 June 2016
Annual Report 2016 143

S. No. Folio No. Name of ShareholderNumber of Shares
Held Percentage
79 00521-6079 TRUSTEE ENGRO CORP LTD MPT EMP DEFINED CONT GRATUITY FUND 108,000 0.00
80 00521-6087 TRUSTEE ENGRO CORP LTD MPT EMP DEFINED CONTRIBUTION PEN FUND 53,500 0.00
81 00521-6293 TRUSTEE-PAKISTAN HERALD PUBLICATION PVT LTD STAFF PENSION FD 7,000 0.00
82 00521-7473 FC COLLEGE EMPLOYEE PROVIDENT FUND 16,000 0.00
83 00521-8000 TRUSTEE-KOHINOOR ENERGY LIMITED EMPLOYEE GRATUITY FUND 9,900 0.00
84 00547-6424 TRUSTEE - IBM ITALIA S.P.A. PAKISTAN EMPLOYEES PENSION FUND 900 0.00
85 00547-6432 TRUSTEE - IBM ITALIA S.P.A. PAKISTAN EMPLOYEES GRATUITY FUND 1,400 0.00
86 00547-6457 TRUSTEE - IBM SEMEA EMPLOYEES PROVIDENT FUND 30,100 0.00
87 00547-8701 TRUSTEE-RAFHAN BEST FOODS EMPLOYEES PROVIDENT FUND 11,000 0.00
88 00596-34 CAPITAL ONE EQUITIES LIMITED 500 0.00
89 00620-21 TAURUS SECURITIES LIMITED 8 0.00
90 00695-10684 TRUSTEE PAK TOBACCO CO. LTD MANAGEMENT PROV FUND (1386-2) 68,500 0.00
91 00695-10692 TRUSTEE PAK TOBACCO CO. LTD EMPLOYEES PROVIDENT FUND (1385-5) 71,700 0.00
92 00695-10700 TRUSTEE PAK TOBACCO CO LTD EMPLOYEES GRATUITY FUND (1383-4) 113,000 0.00
93 00695-10718 TRUSTEE PAK TOBACCO CO LTD STAFF DEF CONTRI PEN FD (1384-1) 20,700 0.00
94 00695-10759 TRUSTEE PAK TOBACCO CO LTD STAFF PENSION FUND [1390-2] 455,500 0.01
95 00695-14066 TRUSTEE - SHELL PAKISTAN MANAGEMENT STAFF PROVIDENT FUND 35,000 0.00
96 00695-14074 TRUSTEE - SHELL PAKISTAN MANAGEMENT STAFF GRATUITY FUND 1,600 0.00
97 00695-14082 TRUSTEE - SHELL PAKISTAN LABOUR & CLERICAL STAFF GRATUITY FUND 7,200 0.00
98 00695-14090 TRUSTEE - SHELL PAKISTAN LABOUR PROVIDENT FUND 6,500 0.00
99 00695-14108 TRUSTEE - SHELL PAKISTAN DC PENSION FUND 49,000 0.00
100 00695-14116 TRUSTEE - SHELL PAKISTAN STAFF PENSION FUND 1,000 0.00
101 00695-14132 TRUSTEE - SHELL PAKISTAN MANAGEMENT STAFF PENSION FUND 88,000 0.00
102 00935-38040 TRUSTEE CITY SCHOOLS PROVIDENT FUND TRUST 30,000 0.00
103 00992-1091 TRADING ENTERPRISES (PVT) LTD. 21,000 0.00
104 00992-3345 F & B BULK STORAGE (PTIVATE) LIMITED 5,000 0.00
105 01651-13749 TARIK RASHID (PRIVATE) LIMITED 600 0.00
106 01651-19506 TRUSTEE PAK HERALD PUBLICATIONS (PVT) LTD STAFF GRATUITYFUND 12,000 0.00
107 01651-24811 TRUSTEE PAK HERALD PUBLICATIONS (PVT) LTD STAFF PENSION FUND 19,000 0.00
108 01651-24852 TRUSTEE OF CITY SCHOOLS PROVIDENT FUND TRUST 10,000 0.00
109 01669-26 SHAFFI SECURITIES (PVT) LIMITED 400 0.00
110 01826-44891 TRUSTEE - ENGRO FOODS LTD EMPLOYEES GRATUITY FUND 15,000 0.00
111 01826-60780 INTERNATIONAL KNITWEAR LIMITED 2,000 0.00
112 01826-65920 TRUSTEE - THE PAKISTAN MEMON EDUCATIONAL & WELAFRE SOCIETY 10,500 0.00
113 01826-66951 TRUSTEE - SULAIMANIYAH TRUST 40,000 0.00
114 01826-73817 TRUSTEE - MERCK (PVT) LIMITED MANAGEMENT STAFF PROVIDENT FUND 10,000 0.00
115 01826-73825 TRUSTEE - MERCK (PVT) LIMITED MANAGEMENT STAFF PENSION FUND 3,000 0.00
116 01826-76562 UNITED TRADING & MANUFACTURING (PVT) LTD 3,000 0.00
117 01826-77610 MERCK (PRIVATE) LIMITED MANAGEMENT STAFF GRATUITY FUND 6,000 0.00
118 01826-79632 TRUSTEE - BMA ASSET MANAGEMENT CO LTD. STAFF PROVIDENT FUND 500 0.00
119 01826-80234 TRUSTEE - AZAN WELFARE TRUST 3,000 0.00
120 01826-87163 M. N. TEXTILES (PRIVATE) LIMITED 30,000 0.00
121 01826-87775 PETROMARK (PRIVATE) LIMITED 500 0.00
122 01826-89086 TRUSTEE - ALCATEL - LUCENT PAKISTAN LIMITED GRATUITY FUND TRUST 8,000 0.00
123 01826-89326 INTERNATIONAL KNITWEAR LIMITED 500 0.00
124 01826-91256 TRUSTEE - BANK ALFALAH LTD EMPLOYEES PROVIDENT FUND TRUST 40,000 0.00
125 01917-33 PRUDENTIAL SECURITIES LIMITED 1,861 0.00
126 02543-623 W. H. ASSOCIATES (PVT) LTD. 3,000 0.00
127 02832-2798 IMPERIAL DEVELOPERS AND BUILDER (PRIVATE) LIMITED 265,800 0.01
128 03186-2532 TECHNOLOGY LINKS (PVT) LTD. 10,000 0.00
129 03277-385 NATIONWIDE (PVT) LTD 2,000 0.00
130 03277-1339 PREMIER FASHIONS (PVT) LTD 100,000 0.00
131 03277-2083 TRUSTEES OF ABBOTT LAB PAK STAFF P.F 247,303 0.01
132 03277-2102 THE AGA KHAN UNIVERSITY FOUNDATION 198,600 0.00
133 03277-2132 TARIK RASHID (PVT) LIMITED 300 0.00
134 03277-2404 MOHAMAD AMIN BROS (PVT) LIMITED 6,500 0.00
135 03277-2509 TRUSTEES GATRON IND LTD WORKERS PRV FUND 5 0.00
136 03277-3397 PAKISTAN MEMON EDUCATIONAL & WELFARE SOC 5,000 0.00
137 03277-3785 TRUSTEE CHERAT CEMENT CO.LTD.EMP.PRO.FND 20,369 0.00
138 03277-4230 CRESCENT STEEL AND ALLIED PRODUCTS LTD. 55,000 0.00
Categories of ShareholdersName Wise Detail as of 30 June 2016
144 Oil & Gas Development Company Limited

S. No. Folio No. Name of ShareholderNumber of Shares
Held Percentage
139 03277-4231 TRUSTEES MOOSA LAWAI FOUNDATION 6,000 0.00
140 03277-4275 TRUSTEES NRL OFFICERS PROVIDENT FUND 11,353 0.00
141 03277-4841 BULK MANAGEMENT PAKISTAN (PVT.) LTD. 70,187 0.00
142 03277-4865 SHAKOO (PVT) LTD. 65,051 0.00
143 03277-4931 SOFIAN BUSINESS CORPORATION (PRIVATE) LIMITED 208,000 0.00
144 03277-5061 FREEDOM ENTERPRISES (PVT) LTD 6,000 0.00
145 03277-5360 TRUSTEES ROCHE PAK LTD.MANG.STAFF PEN.FD 5,511 0.00
146 03277-5361 TRUSTEES ROCHE PAK LTD.EMP.PROV FUND 5,511 0.00
147 03277-5362 TRUSTEES ROCHE PAK LTD.MAN.STAFF GR.FND 3,105 0.00
148 03277-6084 THE HUSEIN EBRAHIM FOUNDATION 10,557 0.00
149 03277-6150 THE OKHAI MEMON ANJUMAN 42,000 0.00
150 03277-7146 THE OKHA MANDAL CO-OP HOUSING SOC. LTD 3 0.00
151 03277-7421 TRUSTEES SAEEDA AMIN WAKF 300,000 0.01
152 03277-7633 TRUSTEES MOHAMAD AMIN WAKF ESTATE 500,000 0.01
153 03277-7652 ISMAILIA YOUTH SERVICES 30,000 0.00
154 03277-7927 TRUSTEES BARRETT HODGSON PAK PVT.LTD.G.F 4,308 0.00
155 03277-7928 TRUSTEES BARRETT HODGSON PAK PVT.LTD.P.F 4,158 0.00
156 03277-8265 TRUSTEES ALAUDDIN FEERASTA TRUST 5,000 0.00
157 03277-8809 TRUSTEES PAKISTAN PETROLEUM JUNIOR P.F 26,181 0.00
158 03277-8810 TRUSTEES PAKISTAN PETROLEUM SENIOR P.F 38,585 0.00
159 03277-8811 TRUSTEES PAK.PETROLEUM EXEC.STAFF PN.F 102,465 0.00
160 03277-8812 TRUSTEES PAK.PETROLEUM NON-EXEC.STF PN.F 21,695 0.00
161 03277-8813 TRUSTEES PAK.PETROLEUM EXEC.STAFF GR.F 16,351 0.00
162 03277-8814 TRUSTEES PAK.PETROLEUM NON-EXEC.STF GR.F 19,950 0.00
163 03277-9199 LOADS LIMITED 63 0.00
164 03277-9292 TRUSTEE QASIM INT CONT TER. PAK EMP P.F. 162 0.00
165 03277-9352 TRUSTEES CRESCENT STEEL&ALLIED PROD PN.F 10,000 0.00
166 03277-9981 TRUSTEES OF FAROUKH&ROSHEN KARANI TRUST 5,000 0.00
167 03277-11151 BANDENAWAZ (PVT) LTD 5,000 0.00
168 03277-11276 TURSTEES CLOVER PAK LTD EMP.CONT.P.F 1,500 0.00
169 03277-11277 TRUSTEES COLGATE PALMOLIVE PAK E.C.P.F 24,910 0.00
170 03277-11278 TRUSTEES COLGATE PALMOLIVE PAK LTD E.G.F 12,880 0.00
171 03277-11284 TRUSTEES OF PHILIP MORRIS (PAKISTAN) LIMITED EMPL G.F TRUST 19,300 0.00
172 03277-11285 TRUSTEES OF PHILIP MORRIS (PAKISTAN) LIMITED E.C.P.F TRUST 26,500 0.00
173 03277-11413 TRUSTEES OF FFC MGNT STAFF PENSION FUND 1,748,000 0.04
174 03277-11924 AMIR FINE EXPORTS (PVT) LTD. 2,422,700 0.06
175 03277-12637 TRUSTEES LOTTE CHEMICAL PAKISTAN MNGT STAFF GRATUITY FUND 12,500 0.00
176 03277-12796 TRUSTEES OF ZEL EMPLOYEES P.FUND 2,353 0.00
177 03277-13122 MANG. COM. KARACHI ZARTHOSTI BANU MANDAL 3,857 0.00
178 03277-13154 TRUSTEES HOMMIE&JAMSHED NUSSERWANJEE C.T 50,000 0.00
179 03277-13417 MNG. COMMITTEE OKHAI MEMON MADRESSAH ASSO 75,609 0.00
180 03277-14004 TRUSTEES LOTTE CHEMICAL PAKISTAN NON MGN STAFF G.FUND 320 0.00
181 03277-14005 TRUSTEES LOTTE CHEMICAL PAKISTAN MNG STAFF PROVIDENT FUND 23,000 0.00
182 03277-14818 TRUSTEES ADAMJEE ENTERPRISES STAFF P.F 4,500 0.00
183 03277-15506 TRUSTEES PERAC MNG&SUPERVISORY S.PEN FND 1,472 0.00
184 03277-16893 TRUSTEES AUTOMOTIVE BATTERY CO.EMP.P.F 2,353 0.00
185 03277-16894 TRUSTEES AUTOMOTIVE BATTERY CO.EMP.GR.F 2,353 0.00
186 03277-18010 TRUSTEES - ICI M.S.D.C SUPERANNUATION FUND 517 0.00
187 03277-18575 TRUSTEES MOHAMMAD USMAN HAJRABI TRUST 2,605 0.00
188 03277-18963 TRUSTEES OF HAJI MOHAMMED WELFARE TRUST 140,000 0.00
189 03277-19048 TRUSTEES LOTTE CHEMICAL PAKISTAN MGT.STAFF DEF. CONT. S.FUND 16,000 0.00
190 03277-19140 TRUSTEES OF ICI PAKISTAN MNG STAFF GF 516 0.00
191 03277-21988 TRUSTEES EXIDE PAKISTAN LTD EMP.GR.FUND 2,654 0.00
192 03277-22406 MEHRAN SUGAR MILLS LTD 575,000 0.01
193 03277-23841 TRUSTEES MCB EMPLOYEES FOUNDATION 8,369 0.00
194 03277-26842 TRUSTEES AL - BADER WELFARE TRUST 37,800 0.00
195 03277-26972 WESTBURY (PRIVATE) LTD 341,500 0.01
196 03277-34600 TRUSTEES LINDE PAKISTAN LTD MANAGEMENT STAFF PENSION FUND 8,369 0.00
197 03277-34620 TRUSTEES LINDE PAKISTAN LIMITED PAKISTAN EMP GRATUITY FUND 5,361 0.00
Categories of ShareholdersName Wise Detail as of 30 June 2016
Annual Report 2016 145

S. No. Folio No. Name of ShareholderNumber of Shares
Held Percentage
198 03277-35867 TRUSTEE GUL AHMED TEXTILE MILLS LTD EMP P.F 2,000 0.00
199 03277-36622 TRUSTEES CRESCENT COTTON PRODUCTS STAFF PROVIDENT FUND 4,000 0.00
200 03277-38435 PREMIER MERCANTILE SERVICES (PRIVATE) LIMITED 5,000 0.00
201 03277-44509 MANAGING COMMITTEE OF MEMON EDUCATIONAL BOARD 2,500 0.00
202 03277-45542 NAVEENA EXPORTS (PVT) LTD 564,800 0.01
203 03277-45638 TRUSTEES GLAXO SMITHKLINE PAK LTD. EMPLOYEES GRATUITY FUND 99,000 0.00
204 03277-45641 TRUSTEES GLAXO LABORATORIES PAKISTAN LTD. PROVIDENT FUND 12,400 0.00
205 03277-45642 TRUSTEES GLAXO LABORATORIES PAK LTD. LOCAL STAFF P.F 28,000 0.00
206 03277-45643 TRUSTEES SMITH KLINE & FRENCH OF PAK LTD. PROVIDENT FUND 51,000 0.00
207 03277-47074 GULISTAN FIBRES LIMITED 16 0.00
208 03277-48639 TRUSTEES OF RECKITT BENCKISER PAK LTD. STAFF PROVIDENT FUND 5,000 0.00
209 03277-48792 TRUSTEES OF GREAVES PAKISTAN (PVT) LTD. EMP PROVIDENT FUND 5,000 0.00
210 03277-50199 VALIKA TRADING HOUSE (PRIVATE) LIMITED 500 0.00
211 03277-50590 TECHNOLOGY LINKS (PVT.) LIMITED 29,000 0.00
212 03277-51945 TRUSTEES E.F.U. GENERAL INS. LTD. EFU OFFICER'S PENSION FUND 21,000 0.00
213 03277-51947 TRUSTEES E.F.U. GENERAL INSURANCE LIMITED EMP. GRATUITY FUND 65,000 0.00
214 03277-52198 TRUSTEE'S CHERAT PAPERSACK LIMITED EMPLYEE PROVIDENT FUND 4,609 0.00
215 03277-55836 LINES (PRIVATE) LIMITED 500 0.00
216 03277-57693 MAGNUS INVESTMENT ADVISORS LIMITED 100 0.00
217 03277-61129 TRUSTEE NATIONAL REFINERY LTD. MANAGEMENT STAFF PENSION FUND 46,828 0.00
218 03277-61170 HABIB SAFE DEPOSIT VAULT (PVT) LTD 5,000 0.00
219 03277-62672 TRUSTEES UBL FUND MANAGERS LTD. EMPLOYEES GRATUITY FUND 3,500 0.00
220 03277-62673 TRUSTEES UBL FUND MANAGERS LTD. EMPLOYEE PROVIDENT FUND 500 0.00
221 03277-63669 TRUSTEE OF HAJI MOHAMMED BENEVOLENT TRUST 46,000 0.00
222 03277-64627 DOSSA COTTON & GENERAL TRADING (PVT) LIMITED 100,000 0.00
223 03277-72577 HAMEED SHAFI HOLDINGS (PVT) LTD. 8,000 0.00
224 03277-74182 THE TRUSTEES OF EXIDE PAKISTAN LTD. SENIOR STAFF PROV. FUND 3,857 0.00
225 03277-74416 THE TRUSTEES OF EXIDE PAKISTAN LIMITED PROVIDENT FUND 2,955 0.00
226 03277-74557 TRUSTEES OF ADAMJEE INSURANCE COMPANY LTD. EMP. PROV. FUND 8,369 0.00
227 03277-74694 TRUSTEES OF MAGNUS INVESTMENT ADVISORS LTD. EMPL. PROV. FUND 700 0.00
228 03277-77227 TRUSTEES INDUS MOTOR COMPANY LTD. EMPLOYEES PROVIDENT FUND 46,600 0.00
229 03277-77228 TRUSTEES INDUS MOTOR COMPANY LTD. EMPLOYEES PENSION FUND 25,500 0.00
230 03277-78335 TRUSTEE NATIONAL BANK OF PAKISTAN EMPLOYEES PENSION FUND 77,700 0.00
231 03277-78367 TRUSTEE PNSC EMPLOYEES CONTRIBUTORY PROVIDENT FUND 21,000 0.00
232 03277-78974 CS CAPITAL (PVT) LTD 61,000 0.00
233 03277-79595 TRUSTEES OF ZENSOFT (PVT) LTD EMPL. PROVIDENT FUND 1,500 0.00
234 03277-81682 TRUSTEES OF CRESENT STEEL & ALLIED PRODUCTS LTD-PENSION FUND 3,692 0.00
235 03277-82127 TRUSTEE NATIONAL BANK OF PAKISTAN EMP BENEVOLENT FUND TRUST 2,726 0.00
236 03277-82362 TRUSTEES OF KHATIDA ADAMJEE FOUNDATION 2,500 0.00
237 03277-83462 NADEEM INTERNATIONAL (PVT.) LTD. 500 0.00
238 03277-85327 MOGUL TOBACCO COMPANY PVT LTD 425,000 0.01
239 03277-86315 SKYLINE ENTERPRISES (PVT) LTD 331,360 0.01
240 03277-86759 SOORTY ENTERPRISES (PVT) LTD. 1,577,490 0.04
241 03277-89461 MOOSANI SECURITIES (PVT) LTD 26,000 0.00
242 03277-89566 LIBERTY MILLS LIMITED 926,000 0.02
243 03277-89567 LIBERTY POWER TECH LIMITED 956,500 0.02
244 03277-91890 TRUSTEES H. J. BEHRANA PARSI FIRE TEMPLE T 25,000 0.00
245 03277-92044 TRUSTEES OF BRISTOL MYERS SQUIBB PAKISTAN (PVT)LTD.STAFF G.F 10,000 0.00
246 03277-93071 EFULAL - MANAGED GROWTH FUND 400,000 0.01
247 03350-22 ZAHID LATIF KHAN SECURITIES (PVT) LTD. 402 0.00
248 03525-1974 NAGINA COTTON MILLS LIMITED 25,000 0.00
249 03525-1990 ELLCOT SPINNING MILLS LIMITED 25,000 0.00
250 03525-2002 PROSPERITY WEAVING MILLS LTD. 25,000 0.00
251 03525-6645 TRUSTEES PACKAGES LTD.MGT.STAFF PEN.FUND 4,158 0.00
252 03525-15026 PAK PING CARPETS (PVT)LTD 2,602 0.00
253 03525-48327 SURAJ COTTON MILLS LTD. 200,000 0.00
254 03525-48329 CRESCENT POWERTEC LIMITED 40,000 0.00
255 03525-61184 PITCO (PVT) LTD 9,398 0.00
256 03525-63817 NH SECURITIES (PVT) LIMITED. 6 0.00
257 03525-64045 NH CAPITAL FUND LTD 1,000 0.00
Categories of ShareholdersName Wise Detail as of 30 June 2016
146 Oil & Gas Development Company Limited

S. No. Folio No. Name of ShareholderNumber of Shares
Held Percentage
258 03525-66811 TRUSTEES NESTLE PAKISTAN LTD MANAGERIAL STAFF PENSION FUND 46,700 0.00
259 03525-66812 TRUSTEES NESTLE PAKISTAN LTD EMPLOYEES PROVIDENT FUND 70,100 0.00
260 03525-66813 TRUSTEES NESTLE PAKISTAN LTD EMPLOYEES GRATUITY FUND 30,000 0.00
261 03525-86739 COMBINED FABRICS LIMITED 15,000 0.00
262 03525-87235 MAPLE LEAF CAPITAL LIMITED 1 0.00
263 03525-89276 SIDDIQ LEATHER WORKS (PVT.) LIMITED 16,500 0.00
264 03525-89724 SUNRAYS TEXTILE MILLS LIMITED 9,100 0.00
265 03525-91079 TRUSTEES LEINER PAK GELATINE LTD EMPLOYEES PROVIDENT FUND 2,500 0.00
266 03574-25 PROGRESSIVE INVESTMENT MANAGEMENT (PVT) LTD. 3,100 0.00
267 04002-22 MEMON SECURITIES (PVT.) LIMITED 6,800 0.00
268 04010-21 FAWAD YUSUF SECURITIES (PVT.) LIMITED 101,500 0.00
269 04143-1297 AL MASOOM (PVT) LTD 7,000 0.00
270 04184-22 AZEE SECURITIES (PRIVATE) LIMITED 100 0.00
271 04218-27 LAKHANI SECURITIES (PVT) LTD. 50,000 0.00
272 04333-8109 MYCON PVT LIMITED 28 0.00
273 04341-22 ORIENTAL SECURITIES (PVT) LTD. 2,000 0.00
274 04366-20 MULTILINE SECURITIES (PVT) LIMITED 5,000 0.00
275 04424-2648 TRUSTEES AAL - BAWANY FOUNDATION (200) 2,000 0.00
276 04440-20 ZAFAR MOTI CAPITAL SECURITIES (PVT) LTD. 18,300 0.00
277 04481-26 DOSSLANI'S SECURITIES (PVT) LIMITED 4,350 0.00
278 04705-5470 BOARD OF TRUSTEES, FEB & GIF, IBD 355,095 0.01
279 04705-10542 TRUSTEES OF FFC EMPLOYEES PROVIDENT FUND 278,700 0.01
280 04705-48962 SHAKIL EXPRESS (PVT) LTD 16,388 0.00
281 04705-51363 KASHMIR WALA SON'S (PVT) LIMITED 500 0.00
282 04705-65373 ASSOCIATED CONSULTANCY CENTRE (PVT) LIMITED 2,000 0.00
283 04705-66337 TRUSTEES FAUJI FERTILIZER BIN QASIM LTD. PROVIDENT FUND 150,000 0.00
284 04705-69173 TRUSTEES OF ARL MANAGEMENT STAFF PENSION FUND 5,000 0.00
285 04705-78456 TRUSTEES OF PAKISTAN MOBILE COMMUNICATION LTD-PROVIDENT FUND 100,000 0.00
286 04705-89143 NATIONAL UNIVERSITY OF SCIENCES AND TECHNOLOGY 23,300 0.00
287 04804-20205 FORTRESS TEXTILE PRIVATE LIMITED 5,000 0.00
288 04820-23 STOCK VISION (PVT.) LTD. 6,457 0.00
289 04879-28 AKHAI SECURITIES (PRIVATE) LIMITED 507 0.00
290 04895-26 DJM SECURITIES (PRIVATE) LIMITED 77,000 0.00
291 04903-9032 TRUSTEE - HAFIZ FOUNDATION 800 0.00
292 04952-28 SHERMAN SECURITIES (PRIVATE) LIMITED 356,800 0.01
293 04952-14649 TRUSTEES PAK BRUNEI INVESTMENT COMPANY LTD. EMPLOYEES PF 6,900 0.00
294 05074-966 FRONTIER EDUCATION FOUNDATION 46,985 0.00
295 05074-1162 TRUSTEES BASIC EDUCATION & SKILL DEVELOP 47,768 0.00
296 05116-28 TIME SECURITIES (PVT.) LTD. 1,000 0.00
297 05264-21 JS GLOBAL CAPITAL LIMITED 513,500 0.01
298 05264-1276 JAHANGIR SIDDIQUI & CO. LTD. 430,500 0.01
299 05264-3751 TRUSTEE - THE BHAIMIA FOUNDATION 70,776 0.00
300 05264-7307 TRUSTEE - JS GLOBAL CAPITAL LIMITED STAFF PROVIDENT FUND 13,500 0.00
301 05264-21035 NATIONAL RURAL SUPPORT PROGRAMM 94,636 0.00
302 05264-55173 TRUSTEE - NISHAT POWER LIMITED-EMPLOYEES PROVIDENT FUND 200 0.00
303 05264-76344 SUNRAYS TEXTILE MILLS LIMITED 100 0.00
304 05306-25 FAIR EDGE SECURITIES (PRIVATE) LIMITED 7,000 0.00
305 05314-24 INVESTFORUM (SMC-PVT) LIMITED 1,601 0.00
306 05348-21 HH MISBAH SECURITIES (PRIVATE) LIMITED 6,000 0.00
307 05355-541 TRUSTEE : NIB BANK LIMITED EMPLOYEES PROVIDENT FUND 12,000 0.00
308 05470-26 B & B SECURITIES (PRIVATE) LIMITED 12,500 0.00
309 05512-73554 MUHAMMAD SHAFI TANNERIES (PVT,) LIMITED 40,000 0.00
310 05512-73604 TRUSTEE - CITY SCHOOLS PROVIDENT FUND TRUST 20,000 0.00
311 05587-48 FIRST NATIONAL EQUITIES LIMITED 1 0.00
312 05660-12829 COMBINED FABARICS LIMITED 20,000 0.00
313 05736-15 NCC - PRE SETTLEMENT DELIVERY ACCOUNT 255,900 0.01
314 05884-12310 MIAN NAZIR SONS INDUSTRIES (PVT) LIMITED 10,000 0.00
315 05892-25 MONEYLINE SECURITIES (PRIVATE) LIMITED 750 0.00
316 06122-24612 FIVE RIVERS TECHNOLOGIES (PVT.) LTD 2,500 0.00
317 06122-89524 ARKAD CONSULTANTS PVT LIMITED 2,115 0.00
Categories of ShareholdersName Wise Detail as of 30 June 2016
Annual Report 2016 147

S. No. Folio No. Name of ShareholderNumber of Shares
Held Percentage
318 06270-29 GROWTH SECURITIES (PVT) LTD. 47,500 0.00
319 06353-29 SHIRAZI INVESTMENTS (PVT) LIMITED 50,000 0.00
320 06445-28 DARSON SECURITIES (PVT) LIMITED 100 0.00
321 06452-3112 SIDDIQSONS DENIM MILLS LTD.STAFF PROVIDENT FUND 50 0.00
322 06452-10604 TRUSTEE CHERAT CEMENT CO. LTD EMPLOYEES PROVIDENT FUND 10,000 0.00
323 06452-13335 TRUSTEE CHERAT CEMENT COMPANY LTD STAFF GRATUITY FUND 10,000 0.00
324 06452-15645 TRUSTEE GREAVES PAKISTAN (PVT) LTD EMPLOYEES PROVIDENT FUND 5,000 0.00
325 06452-22971 TRUSTEE GREAVES PAKISTAN (PVT) LTD STAFF GRATUITY FUND 5,000 0.00
326 06452-36443 TRUSTEE HI-TECH LUBRICANTS LTD EMP PROVIDENT FUND TRUST 10,000 0.00
327 06452-37920 RELIANCE SACKS LIMITED 2,000 0.00
328 06452-38381 TRUSTEE GILLETTE PAKISTAN LTD EMPLOYEES PROVIDENT FUND 5,662 0.00
329 06502-4740 PERIDOT PRODUCTS (PVT) LIMITED 23,000 0.00
330 06601-11354 HIGHLINK CAPITAL (PVT)LIMITED 1,000 0.00
331 06650-22 SAAO CAPITAL (PVT) LIMITED 5,000 0.00
332 06676-2323 TRUSTEES THAL LTD. - EMPLOYEES PROVIDENT FUND 88 0.00
333 06676-3412 BANDENAWAZ (PVT) LTD. 3,500 0.00
334 06676-6076 TRUSTEE - IFFAT INAMUR RAHIM WELFARE TRUST 2,000 0.00
335 06676-6712 TRUSTEES AGRIAUTO IND.LTD. EMPL.PROV.FUND 3,105 0.00
336 06676-10490 ISPI CORPORATION (PVT) LIMITED 22,700 0.00
337 06684-29 MOHAMMAD MUNIR MOHAMMAD AHMED KHANANI SECURITIES (PVT.) LTD. 34,000 0.00
338 06700-21104 GARIBSONS (PVT) LTD 10,000 0.00
339 06734-22 GAZIPURA SECURITIES & SERVICES (PRIVATE) LIMITED 196,500 0.00
340 06874-3731 RYK MILLS LIMITED 100 0.00
341 06890-24 MAYARI SECURITIES (PVT) LIMITED 5,000 0.00
342 06957-26 BABA EQUITIES (PVT) LTD. 5,000 0.00
343 06981-23 FAIR DEAL SECURITIES (PVT) LTD. 321 0.00
344 07054-24 BHAYANI SECURITIES (PVT) LTD. 5,000 0.00
345 07229-23 ALTAF ADAM SECURITIES (PVT) LTD. 78,000 0.00
346 07260-29 M.R. SECURITIES (SMC-PVT) LTD. 197 0.00
347 07278-28 WASI SECURITIES (SMC-PVT) LTD. 4 0.00
348 07286-27 DR. ARSLAN RAZAQUE SECURITIES (SMC-PVT) LTD. 72 0.00
349 07328-21 TS SECURITIES (PVT) LTD. 2,000 0.00
350 07351-697 COLONY MILLS LIMITED(22003) 89 0.00
351 07385-25 ISMAIL ABDUL SHAKOOR SECURITIES (PRIVATE) LIMITED 19 0.00
352 07419-11316 FALCON-I (PRIVATE) LIMITED 2,000 0.00
353 08847-1447 CRESCENT STANDARD BUSINESS MANAGEMENT (PVT) LIMITED 1 0.00
354 09787-24 SNM SECURITIES (PVT) LTD. 1,000 0.00
355 10231-27 MSMANIAR FINANCIALS (PVT) LTD. 851 0.00
356 10298-1755 TRUSTEES BILQUIS LATIF JAMAL TRUST 51 0.00
357 10298-3439 JUBILEE SPINNING & WEAVING MILLS LTD 3,800 0.00
358 10298-5327 TRUSTEE THE HUSEIN EBRAHIM FOUNDATION 500 0.00
359 10470-29 GPH SECURITIES (PVT.) LTD. 20,000 0.00
360 10611-20 AKD SECURITIES LIMITED - AKD TRADE 5 0.00
361 10629-1118 TRUSTEE KARACHI PARSI ANJUMAN TRUST FUND 5,000 0.00
362 10629-49752 DMS RESEARCH (PVT) LTD 26,079 0.00
363 11072-26 SEVEN STAR SECURITIES (PVT.) LTD. 38,200 0.00
364 11478-28 CMA SECURITIES (PVT) LIMITED 4,000 0.00
365 11544-5159 PRUDENTIAL DISCOUNT & GUARANTEE HOUSE LIMITED 2,000 0.00
366 11544-5332 TRUSTEE - GREAVES PAKISTAN (PVT) LTD. - STAFF GRATUITY FUND 2,000 0.00
367 11544-5340 TRUSTEE - GREAVES PAKISTAN (PVT) LTD. EMP. PROVIDENT FUND 7,000 0.00
368 11544-6959 UNITED TOWEL EXPORTERS (PVT) LIMITED 1,500 0.00
369 11692-21 ABA ALI HABIB SECURITIES (PVT) LIMITED 45,013 0.00
370 12203-12148 MERIN (PRIVATE) LIMITED 6,500 0.00
371 12286-20 JSK SECURITIES LIMITED 1,500 0.00
372 12369-20 INA SECURITIES (PVT) LTD 2,500 0.00
373 12401-701 TRUSTEE - AL-MUSTAFA TRUST 2,000 0.00
374 12666-536 TRUSTEES OF SULAIMANIYAH TRUST 21,700 0.00
375 12666-601 TRUSTEES OF KARACHI SHERATON HOTEL EMPLOYEES PROVIDENT FUND 795 0.00
376 12666-676 TRUSTEE OF TELENOR EMPLOYEES GRATUITY FUND 65,000 0.00
377 12666-700 ISPI CORPORATION (PRIVATE) LIMITED 26,300 0.00
Categories of ShareholdersName Wise Detail as of 30 June 2016
148 Oil & Gas Development Company Limited

S. No. Folio No. Name of ShareholderNumber of Shares
Held Percentage
378 12666-817 TRUSTEES OF GREENSTAR SOCIAL MKT. PAK.(G) LTD. EMP.GRA. FUND 3,000 0.00
379 12666-833 USMAN MEMORIAL FOUNDATION 4,000 0.00
380 12666-858 TRUSTEES ENGRO CORPORATION LIMITED PROVIDENT FUND 193,000 0.00
381 12666-908 TRUSTEES OF GETZ PHARMA PAKISTAN (PVT) LIMITED-EPF 16,800 0.00
382 12666-1120 TRUSTEES OF PAKISTAN HUMAN DEVELOPMENT FUND 67,000 0.00
383 12666-1153 TRUSTEES OF THAL LIMITED EMPLOYEES PROVIDENT FUND 11,300 0.00
384 12666-1187 TRUSTEES OF INSPECTEST (PVT) LTD EMP. PROV. FUND TRUST 4,400 0.00
385 12666-1195 TRUSTEES OF DESCON OXYCHEM LTD EMP. PROV. FUND TRUST 3,100 0.00
386 12666-1203 TRUSTEE DESCON POWER SOLUTIONS (PVT) LTD EMP PROV FUND TRUST 12,700 0.00
387 12690-509 TRUSTEE INTERNATIONAL INDUST. LTD EMPLOYEES PROVIDENT FUND 25,000 0.00
388 12690-517 TRUSTEE INTERNATIONAL INDUST. LTD EMPLOYEES GRATUITY FUND 35,200 0.00
389 12690-533 TRUSTEES INTERNATIONAL STEELS LTD EMPLOYEES GRATUITY FUND 5,100 0.00
390 12690-541 TRUSTEES INTERNATIONAL STEELS LTD EMPLOYEES PROVIDENT FUND 7,200 0.00
391 12690-566 TRUSTEE THALL LIMITED- EMPLOYEES RETIREMENT BENEFIT FUND 5,100 0.00
392 12690-574 TRUSTEE THALL LIMITED- EMPLOYEES PROVIDENT FUND 42,300 0.00
393 12690-608 TRUSTEES MAPLE LEAF CEMENT FACTORY LTD EMPLOYEES PROV FUND 18,400 0.00
394 12724-751 SINDH GENERAL PROVIDENT INVESTMENT FUND 1,140,000 0.03
395 13011-20 GLOBAL SECURITIES PAKISTAN LIMITED - MF 2,500 0.00
396 13128-27 PEARL SECURITIES LIMITED - MF 400 0.00
397 13649-24 JS GLOBAL CAPITAL LIMITED - MF 61,600 0.00
398 13748-592 TRUSTEE-MILLAT TRACTORS LTD. EMPLOYEES PENSION FUND 67,400 0.00
399 13748-659 TRUSTEE-THE KOT ADDU POWER CO. LTD. EMPLOYEES PROVIDENT FUND 14,600 0.00
400 13748-667 TRUSTEE-THE KOT ADDU POWER CO. LTD. EMPLOYEES PENSION FUND 47,000 0.00
401 14084-22 FORTRESS FINANCIAL SERVICES (PVT.) LIMITED 10,000 0.00
402 14241-22 FIKREE'S (SMC-PVT) LTD. 5,000 0.00
403 14613-26 GOVERNMENT OF SINDH - PROVINCIAL PENSION FUND 13,000,000 0.30
404 15024-27 INTERACTIVE SECURITIES (PVT) LIMITED 15,000 0.00
405 15073-22 AKY SECURITIES (PVT) LTD. 9,369 0.00
406 15818-21 RELIANCE SECURITIES LIMITED 40,500 0.00
407 15867-26 MARGALLA FINANCIAL (PRIVATE) LIMITED 1,400 0.00
408 16212-23 KASB SECURITIES LIMITED - MF 51,700 0.00
408 38,326,085 0.89
Total 23443 4,300,928,400 100.00
Categories of ShareholdersName Wise Detail as of 30 June 2016
Annual Report 2016 149

AbbreviationsAGM Annual General Meeting
AOC Attock Oil Company
BD Business Development
BESOS Benazir Employees Stock Option Scheme
BTU British Thermal Unit
CBA Collective Bargaining Agent
CDC Central Depository Company
CEO Chief Executive Officer
CFO Chief Financial Officer
CNIC Computerized National Identity Card
D&PL Development and Production Lease
DFI Development Finance Institution
DGPC Directorate General of Petroleum Concessions
DSC Defence Saving Certificate
E&E Exploration and Evaluation
E&P Exploration and Production
EBITDAEarnings before Interest, Tax, Depreciation and
Amortization
EG Executive Grade
ENI Eni Pakistan Limited
EPCCEngineering, Procurement, Construction and
Commissioning
ERP Enterprise Resource Planning
FBR Federal Board of Revenue
FTW Floating Treatment Wetland
GHPL Government Holdings (Private) Limited
GoP Government of Pakistan
HSE Health, Safety and Environment
HSFO High Sulphur Fuel Oil
IAS International Accounting Standards
IASB International Accounting Standards Board
ICI Imperial Chemical Industries
IFRICInternational Financial Reporting Interpretations
Committee
IFRS International Financial Reporting Standards
IPRTOC IPR Transoil Corporation
ISE Islamabad Stock Exchange
ISO International Organization for Standardization
JV Joint Venture
km Kilometer
KPD Kunnar Pasakhi Deep
KPK Khyber Pakhtunkhwa
KPOGCL Khyber Pakhtunkhwa Oil and Gas Company Limited
KUFPEC Kuwait Foreign Petroleum Exploration Company
LED Light Emitting Diode
LPG Liquefied Petroleum Gas
MBA Master of Business Administration
Mcf Thousand cubic feet
MENA Middle East and North Africa
ML Mining Lease
MMcf Million cubic feet
MOL MOL Pakistan Oil & Gas Co. B.V.
MOU Memorandum of Understanding
MP&NR Ministry of Petroleum & Natural Resources
MPCL Mari Petroleum Company Limited
NBFI Non-Bank Financial Institution
NGL Natural Gas Liquids
NHA National Highway Authority
NIT National Investment Trust
OEET OGDCL Employees Empowerment Trust
OGRA Oil & Gas Regulatory Authority
OHSAS Occupational Health and Safety Assessment Series
OMV OMV (Pakistan) Exploration Gmbh
OPL Ocean Pakistan Limited
PEL Petroleum Exploration (Pvt) Limited
PIB Pakistan Investment Bond
PKPEL Pakistan Petroleum Exploration Limited
PKR Pak Rupee
POL Pakistan Oilfields Limited
PPIS Pakistan Petroleum Information Services
PPL Pakistan Petroleum Limited
SECP Securities and Exchange Commission of Pakistan
SEHCL Sindh Energy Holding Company (Pvt) Limited
SEL Saif Energy Limited
SEPL Spud Energy Pty Limited
SHERRITT Sherritt International Oil and Gas
SLIC State Life Insurance Corporation of Pakistan
SNGPL Sui Northern Gas Pipelines Limited
SOP Standard Operating Procedure
sq. km Square Kilometer
SSGCL Sui Southern Gas Company Limited
TDR Term Deposit Receipt
TFC Term Finance Certificate
UEPL United Energy Pakistan Limited
ZPCL Zaver Petroleum Corporation Limited
150 Oil & Gas Development Company Limited

I/We, ___________________________________________ of _____________________________________ being a
member of Oil and Gas Development Company Limited, holder of _________Ordinary Share(s) as per Register Folio
No_______________ hereby appoint Mr.___________________________________________ Folio No. (if member)
__________________________ of __________________________or failing him Mr. ________________________________
Folio No. (if member) ___________of ______________________ as my/our proxy in my/our absence to attend and vote for
me/us, and on my/our behalf at the Annual General Meeting/Extra Ordinary General Meeting of the Company to be held
on ___________ and at any adjournment thereof. Signed under my/our hand this __________day of ____________ 2016.
Signature of Shareholder _____________________________(Signature should agree with the specimen signature registered with the Company)
Form of Proxy/E-Voting19th Annual General Meeting
Option 1: Appointing other person as Proxy
Signed in the presence of:
Signature of Witness: ________________________________
Name: _____________________________________________
Address: ___________________________________________
CNIC No:
Note:
1. This instrument appointing a proxy under option 1 shall be in writing under the hand of the appointer or his attorney duly authorized in writing, or if the appointer is a corporation either under the common seal or under the hand of an official or attorney so authorized.
2. The instrument appointing a proxy option 1 and the power of attorney or other authority (if any), under which it is signed or a notarially certified copy of that power of authority, shall be deposited at the office of the Company not less than 48 (forty eight) hours before the time for holding the meeting at which the person named in the instrument proposes to vote, and in default the instrument of a proxy shall not be treated as valid.
3. The instrument of e-voting under option 2 shall be deposited in advance in writing at least ten days before holding of Annual General Meeting, at the registered office of the Company at OGDCL House, Plot No. 3, F-6/G-6, Blue Area, Jinnah Avenue, Islamabad or through email [email protected].
I/We,_________________ of __________________ being a member of Oil and Gas Development Company Limited, holder
of ________________ Ordinary share(s) as per Register Folio No.__________ hereby opt for e-voting through Intermediary
and hereby consent the appointment of execution officer_________________ as proxy and will exercise Proxy Electronic
Voting as per The Companies (Proxy e-Voting) Regulations, 2016 and hereby demand for poll for resolutions.
My secured email address is ________________________, please send login details, password and electronic signature
through email.
Option 2: E-Voting as per The Companies (E-voting) Regulations, 2016
I/We,____________________________ of _______________________, being member(s) of Oil and Gas Development
Company Limited holder of Ordinary Share(s) as per Register Folio No.______________ hereby opt for Video Conference
facility at __________________________.
_____________________
Signature of Member
Form for Video Conference Facility
Signature of Witness: ________________________________
Name: _____________________________________________
Address: ___________________________________________
CNIC No:


Date:____________________
Share Registrar Department,Central Depository Company of Pakistan LimitedCDC House, 99-B, Block ‘B’,S.M.C.H.S, Main Shaha-e-Faisal,Karachi -74400.
I/We, ______________________________________________________ being a member of Oil & Gas Development Company
Limited, holder of ________________ Ordinary Share(s) as per Register Folio No./CDS A/C No._______________________
hereby opt to receive Annual Report through email __________________________________________ or hard copy on my
registered address as given below:
Signature: _________________________________________
Postal address: _________________________________________
_________________________________________
_________________________________________
Contact No: _________________________________________
CNIC No:
Note:
Please specify one option i.e. email/hard copy and send this form duly filled and signed along with a copy of valid CNIC (in case of individual) to Share Registrar of the Company.
Request FormConsent for Transmission of Audited Financial Statements through Email or Hard Copy


Register Folio No:________________________________ Number of Shares held:____________________________________
Name of Shareholder:_____________________________________________________________________________________
CNIC No:
For beneficial owners as per CDC List
CDC participant I.D. No:_____________________ Sub-Account No: _________________________________
CNIC No:
Signature of Shareholder___________________________
Note:
1. The signature of the shareholder must tally with specimen signature already on the record of the Company.
2. The shareholders are requested to hand over the duly completed entry card at the counter before entering meeting premises.
3. This Entry Card is not transferable.
Entry Card19th Annual General Meeting


Oil & Gas Development Company LimitedOGDCL House, Plot No. 3, F-6/G-6, Blue Area,Jinnah Avenue, Islamabad - Pakistan.www.ogdcl.com
Designed & Printed by:The Times Press (Pvt) Ltd.