sustainability assessment methods and tools to support decision-making ...€¦ · the...
TRANSCRIPT

This project is funded by the European Union This work was supported by the Swiss State Secretariat for Education, Research and Innovation (SERI) under contract number 15.006
SAMT SUSTAINABILITY ASSESSMENT METHODS AND TOOLS TO SUPPORT
DECISION-MAKING IN THE PROCESS INDUSTRIES
COORDINATION & SUPPORT ACTION
GRANT AGREEMENT NO. 636727
WWW.SPIRE2030.EU/SAMT
Deliverable 1.1 Overview of existing sustainability assessment methods and tools, and of relevant standards
Responsible authors & organisations:
Mathieu Saurat, Michael Ritthoff Wuppertal Institute for climate, environment and energy
Luz Smith AENOR
Deliverable due date: 31 March 2015
Actual submission date: 01 June 2015
Project start date: 1 January 2015
Project duration: 24 months
Work package: WP1
Work package leader: WI
Organisation name of lead contractor for this deliverable: WI
Dissemination level: PUBLIC

SAMT D1.1
1
Executive summary:
The aim of the SAMT project (2015-2016) is to review and make recommendations about the most potential methods for evaluating sustainability and therein the energy and resource efficiency in the process industry. SAMT will collect, evaluate and communicate the experiences of leading industrial actors from cement, oil, metal, water, waste and chemical industry and review the latest scientific developments within the field of sustainability assessment. SAMT is a coordination and support action that will promote the cross-sectorial uptake of the most promising tools by conducting case studies, organizing workshops and producing recommendations for further implementation of the best practices in sustainability assessment.
PART A – REVIEW OF SUSTAINABILITY ASSESSMENT METHODS AND TOOLS
The aim of this report is to conduct a review of existing sustainability assessment methods and tools. In this report, a method is a set of instructions describing how to calculate a set of indicators (it includes official standards), while a tool is an artefact that assists with the implementation of a method (it usually is software but could also be a paper-based check-list). This report includes in particular (but is not restricted to) methods and tools covering the whole life cycle of products and relevant for evaluating resource and energy efficiency. The focus is on methods and tools that are or could be used in the industry, especially the process industries. This includes readily available methods and tools, as well as those under development.
This report is the first outcome in the SAMT project. It is not expected to deliver a definitive and exhaustive evaluation of all possible sustainable assessment methods and tools. The list of methods and tools will most probably be extended in the next project step, which consists in interviewing industrial practitioners to collect their experience with sustainability assessment methods and tools. Results from this report will in any case serve as input into the subsequent work packages of the project, where identified methods and tools will be systematically evaluated.
However, we hope that this report provides a useful overview of what is available so that company representatives or researchers do not have to go through the hassle themselves to search and sort out that many methods and tools. This report also allows us to identify both the main patterns and interesting outliers in this method and tool pool. The latter are at the forefront of method and tool development, in particular when it comes to integrating all aspects of sustainability.
For this report we searched scientific literature and the Web to establish a list of methods and tools for sustainability assessment. The search yielded over 100 potential methods and tools, of which we retained 51 methods and 38 tools. The informed reader may at first miss specific methods such as, for example, Material Flow Analysis (MFA), the RobecoSAM Corporate Sustainability Assessment, or specific LCA characterisation methods. Such methods were not further considered because, respectively, MFA is a macro-level method mostly relevant for policy making (even though it may help broaden life cycle methods), RobecoSAM is a result aggregator that builds indices on top of the methods and tools selected for this report, and characterization methods are mentioned in general under LCA methods and tools. We also only selected publicly available tools (whether for free or against license fees).
We organised the long list of methods and tools in clusters. We established, together with the project’s industry partners, a set of classification criteria that allows comparable detailed reviews. Against this background, we conducted two types of reviews.
First, we built three web-based visualisations (available at www.spire2030.eu/samt). In the first two, all methods and tools are displayed at once. The first one shows how we organised the methods and tools in

SAMT D1.1
2
clusters. The second one shows which tools implement which methods and which methods build on one another. One can look at these visualisations at a high level of aggregation to recognise overall patterns. An interested reader can also dive deeper into the online visualisations and explore the data at the level of single methods and tools. The third visualisation shows, at the level of tool clusters, how these score for a some of the classification criteria (selected as the most relevant for industry partners). Mousing over the visualisation online gives further details for each data point.
These visualisations clearly show that a large number of tools implement a small number of methods. The LCA method is, by far, the most widely implemented method. Some classification criteria are difficult to assess without deeper testing. For example, many tools claim to allow “scenarios” to be modelled. But, to our knowledge, none of these tools actually give the possibility to input time series of a number of parameters to model complex scenarios. What is meant with “scenarios” is the possibility to parameterise a product model (for example) and run “what if” type of simulations by varying some parameters. Another difficult criterion concerns decision-making. Most tools are designed so that the user can make immediate decisions for her own task. However, if decision-making refers to strategic planning at the upper-management level, it becomes more difficult to assess the actual potential of the tools.
The second type of review acknowledges the general patterns seen on the web-based visualisations and the necessity to go into more details to assess properly each criteria. To rationalise the detailed review and keep this report at an acceptable length, we selected the following method and tool clusters with the highest potential for cross-sectorial applications: life cycle methods, hybrid methods, integrated methods, full LCA tools, simplified LCA tools, and integrated tools. All of the detailed reviews follow the same format, based on the set of classification criteria established with our industry partners.
The detailed reviews confirm that the life cycle perspective is pervasive both among methods and tools. It also clearly showed that LCA tools occupy a large spectrum. Simplified LCA tools use pre-calculated data blocks for common materials and products and often focus on the most demanded environmental impacts (e.g. marketed as carbon footprint calculators). They are easy to use, at the expense of replicability and transparency, however. Full LCA tools require some level of expertise from the user. They have become, however, much more than just tools for environmental LCA. Several full LCA tools can now be used for horizontally integrated (i.e. environmental + economic + social) life cycle sustainability assessments. Advanced expert users can input cost flows into their models and include social parameters (in part from the recently available Social Hotspot Database, which lowers the barrier to entry to social LCA). Horizontally integrated methods especially aim to inform high-level decision-making in firms (e.g. SEEBALANCE developed and used at BASF, with their own in-house tools).
These methods require to weigh and normalise environmental, economic and social data outcomes before integrating them. To date there is no standard to frame this step. A number of participatory approaches exist to deal with this aspect. However, it introduces additional uncertainties and subjectivity to the process, which would in turn require even more transparency to ensure replicability.
While horizontally integrated methods seem to be more and more available in tools, vertically integrated methods (from the product at the micro-level to the entire economic system where these products diffuse) are not. Complex hybrid methods are well adopted in academic life cycle studies. There are many variants, including LCA combined with input-output analysis, economic models, or optimisation models. Such methods aim at a more complete coverage of interlinkages between all sectors of the economic system, to model the consequences (environmental and else) of product diffusion, and to optimise life cycle models over one or more (conflicting) objectives under given constraints, respectively. Publicly available tools usually do not, however, implement such methods. There are a couple of exceptions but even those are rather used by the academic community.
Finally, the review further highlights already known research needs for the area of sustainability assessment in general. First, standardised weightings and aggregation methods and their implementation in practical tools are missing. These are central in integrated methods supporting decision making where

SAMT D1.1
3
trade-offs between environmental, economic, and social objectives have to be dealt with. Second, most potent methods (integrated and hybrid) for supporting decision making still lack tool implementations that would make these complex methods manageable for small and medium-sized enterprises. Third, dealing with data uncertainties goes hand in hand with the capacity to evaluate the meaningfulness of sustainability assessment results.
The next tasks and work packages planed in the SAMT project will build on the results presented in this report. First, of all the methods and tools that we reviewed probably only a small number is actually frequently used in the process industries and others may be missing. Interviews with industrial practitioners will address this issue in the second report of this project. Second, this report presents methods and tools in a structured way but without judging their intrinsic value. Considering the expectations of the industry and prioritising some key criteria, identified methods and tools need to be systematically ranked to select the most potent ones. This is the objective of the second work package in SAMT. Third, a plan is needed to realise the potential identified in the best-ranked methods and tools. The goal beyond the SAMT project is to eventually develop a consistent set of sustainability assessment methods and tools to be used in the process industries. Preparing such a plan is the objective of the third and last work package in SAMT.
KEY WORDS: review, methods, tools, sustainability assessment, life cycle assessment, visualisations
PART B – REVIEW OF STANDARDS RELATED TO SUSTAINABILITY, SUSTAINABILITY ASSESSMENT, AND RESOURCE AND ENERGY EFFICIENCY
This document has been prepared as part of Deliverable D.1.1, Overview of existing sustainability assessment tools and tools that are known to be under development, of Task T.1.1 of Work Package WP 1 under SAMT Project, Sustainability assessment methods and tools to support decision-making in the process industries.
This document is the first version for D.1.1.
The aim of this document is to provide information on the current status of standardization, both at International and European level, for the SAMT Project Scope. As a consequence, the information contained in the deliverable could be used in WP 1 and, in addition, the rest of WPs, for the SAMT partners to identify and use the applicable standard requirements, methodologies, processes, terminology, etc. which can contribute to the project, avoiding duplication of efforts, ensuring adaptation to market conditions and maximizing compatibility with existing ones.
KEY WORDS: standard, project, reference, document
This project is funded by the
European Union.
This work was supported by the Swiss State Secretariat for Education, Research and
Innovation (SERI) under contract number 15.006. The opinions expressed and arguments employed herein
do not necessarily reflect the official views of the Swiss Government.

Contents
PART A – REVIEW OF SUSTAINABILITY ASSESSMENT METHODS AND TOOLS .................................................. 5
1 Introduction ............................................................................................................................................... 5
1.1 Background ........................................................................................................................................ 5
1.2 Some definitions ................................................................................................................................ 6
1.3 Aim of the report ............................................................................................................................... 7
1.4 Method .............................................................................................................................................. 8
1.5 Classification criteria ....................................................................................................................... 10
2 Overall review .......................................................................................................................................... 13
3 Review by clusters ................................................................................................................................... 22
3.1 Life cycle methods ........................................................................................................................... 23
3.2 Hybrid methods ............................................................................................................................... 28
3.3 Integrated methods ......................................................................................................................... 33
3.4 Full LCA tools ................................................................................................................................... 38
3.5 Simplified LCA tools ......................................................................................................................... 43
3.6 Integrated tools ............................................................................................................................... 47
4 Conclusions and recommendations ........................................................................................................ 51
4.1 Main conclusions ............................................................................................................................. 51
4.2 Future research needs ..................................................................................................................... 53
5 References ............................................................................................................................................... 55
6 Appendices .............................................................................................................................................. 59
6.1 List of methods for sustainability assessment ................................................................................. 59
6.2 List of tools for sustainability assessment ....................................................................................... 62
6.3 Alphabetical list of methods and tools for sustainability assessment ............................................ 65
PART B – REVIEW OF STANDARDS RELATED TO SUSTAINABILITY, SUSTAINABILITY ASSESSMENT, AND
RESOURCE AND ENERGY EFFICIENCY .............................................................................................................. 69
1 Introduction ............................................................................................................................................. 69
2 Short introduction about standardization ............................................................................................... 69
3 Methodology used for the report ........................................................................................................... 71
4 Abbreviations and acronyms ................................................................................................................... 73
5 List of standards and projects.................................................................................................................. 73
6 Conclusions .............................................................................................................................................. 77

SAMT D1.1
5
PART A – REVIEW OF SUSTAINABILITY ASSESSMENT METHODS AND TOOLS
1 Introduction
1.1 Background
Sustainability assessment methods are needed for various industrial sectors to support sustainable
technology development, decision-making and to evaluate the impacts of existing solutions, products and
technologies. Ideally, sustainability assessment methods should address the environmental, economic and
social aspects of technologies and cover the whole life cycle of the solutions. The assessment methods
should provide robust knowledge to support decision-making, and allow comparability of the results.
However, addressing all those aspects within one tool or assessment method is challenging, or even
impossible. While there are aspects and indicators that are common to all process industries, sector specific
methods, tools, or indicators are often required to address the specific features of each industrial sector in
a fair and transparent way.
The SPIRE Public –Private Partnership brings together several sectors of process industry: cement, ceramics,
chemicals, engineering, minerals and ores, non-ferrous metals, and water. All SPIRE sectors can be
considered as resource and energy intensive and thus improving resource and energy efficiency are urgent
issues for improving the sustainability and competitiveness of the sectors. Within the Horizon 2020 work
programme, the specific and common goals listed for the SPIRE sectors are:
A reduction in fossil energy intensity of up to 30% from current levels by 2030.
A reduction of up to 20% in non-renewable, primary raw material intensity compared to current
levels by 2030.
A reduction of greenhouse gas emissions by 20% below 1999 levels by 2020, with further
reductions up to 40% by 2030.
For the SPIRE sectors, sustainability assessment methods are crucial for evaluating the current state and
the achievement of the goals related to resource and energy efficiency. For evaluating the overall resource
and energy efficiency of the SPRIRE sectors as a whole, tools and indicators that are applicable for cross-
sectorial assessment are required.
At the moment, several tools, assessment methods and indicators exist, but they differ in their goal and
scope and are intended for different kind of use within companies, by consumers or by authorities to
support policy planning and evaluation. Additionally, different tools are focused for different levels of
assessment: product, company, industry or society. Thus the problem is not so much the existence of
proper methods and tools but rather the lack of understanding and knowledge on how they should be
applied and in which context. Thorough understanding of the underlying mechanisms and calculation
principles incorporated in the tool in question is often required to make a trustworthy assessment.
Furthermore, it should be recognized which of the existing methods and tools are suitable for analysing
resource and energy efficiency within the process industries and across the different sectors of the
industry.
The SAMT project will respond to the need for cross-sectorial sustainability assessment methods by
bringing together representatives of several process industry sectors, namely cement, metal, oil, water,

SAMT D1.1
6
waste and chemical industry, and collecting and evaluating the current best practices from each industrial
sector, together with the latest research know-how related to sustainability assessment methods and
recent activities in standardization within the field.
SAMT is funded by the Horizon 2020 work program SPIRE.2014-4: Methodologies, tools and indicators for
cross-sectorial sustainability assessment of energy and resource efficient solutions in the process industry.
1.2 Some definitions
In this report we use at length the terms ‘method’, ‘tool’, and ‘indicator’. The definitions we use for our
particular case are as follows:
Method: set of instructions describing how to calculate a set of indicators. Methods include official
standards.
Tool: artefact that assists with the implementation of a method. A tool is usually software but it
could also be, for example, a paper-based check-list.
Indicator: a quantitative or qualitative proxy that informs on performance, result, impact, etc.
without actually directly measuring it. For example, a low carbon footprint indicates a low
environmental impact for the category climate change, but it does not measure the impact, it
refers to greenhouse gas emissions, i.e. the environmental pressure.
Those definitions are by no means “official” but the ones we use in this project to avoid confusion. These
terms are indeed used differently by many stakeholders in the scientific community, in policy, in the
industry etc.
To take but three arbitrary examples: ‘E-Factor’, ‘Green Option Matrix’ (GOM), and BASF’s ‘Eco-Efficiency
Analysis’ (EEA) are referred to as both methods and tools in the literature. Consistently with the definitions
above, we decided that these were not tools because they are not directly implemented in software (or at
least we could not find publicly available commercial or free software claiming to carry out E-Factor, GOM
or EEA1 assessments out of the box). We, therefore, consider both as sets of instructions to calculate
indicators, i.e. “methods”. One may go further and classify them as either “sub-methods” of broader
methods or as “combinations” of more narrow methods. For instance, the E-Factor stems from the broader
principles of ‘Green Chemistry’. EEA on the other hand brings together Life Cycle Assessment (LCA) and
Total Cost of Ownership (TCO). We did not, however, systematically pursue this kind of more granular
classification.
The term “toolkit” also appears in the literature, notably with the OECD Sustainable Manufacturing Toolkit
and the US EPA’s Lean Manufacturing Environmental Toolkits. These are in fact guidebooks and, by our
definition, collections of methods and not tools.
Note that we do not use the term ‘methodology’. It is often used in the literature as a synonym for method
or a group of methods. We, however, consider methodology to refer to the theoretical analysis of the body
of methods in a given field. This is out of the scope of this report.
1 BASF uses, however, an in-house Web-based LCA software based on openLCA providing Eco-Efficiency and
SEEBALANCE calculations. Full LCA tools that also allow Life Cycle Costing are also advertised as EEA calculators.
SAMT D1.1
7
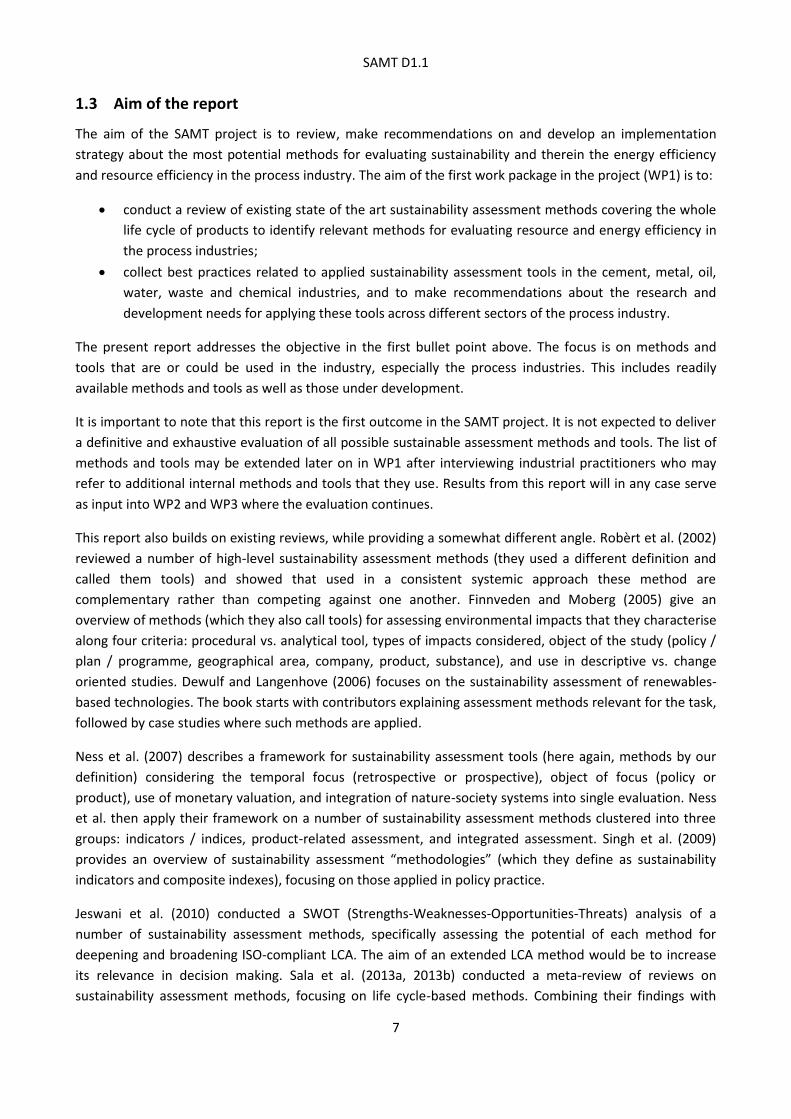
1.3 Aim of the report
The aim of the SAMT project is to review, make recommendations on and develop an implementation
strategy about the most potential methods for evaluating sustainability and therein the energy efficiency
and resource efficiency in the process industry. The aim of the first work package in the project (WP1) is to:
conduct a review of existing state of the art sustainability assessment methods covering the whole
life cycle of products to identify relevant methods for evaluating resource and energy efficiency in
the process industries;
collect best practices related to applied sustainability assessment tools in the cement, metal, oil,
water, waste and chemical industries, and to make recommendations about the research and
development needs for applying these tools across different sectors of the process industry.
The present report addresses the objective in the first bullet point above. The focus is on methods and
tools that are or could be used in the industry, especially the process industries. This includes readily
available methods and tools as well as those under development.
It is important to note that this report is the first outcome in the SAMT project. It is not expected to deliver
a definitive and exhaustive evaluation of all possible sustainable assessment methods and tools. The list of
methods and tools may be extended later on in WP1 after interviewing industrial practitioners who may
refer to additional internal methods and tools that they use. Results from this report will in any case serve
as input into WP2 and WP3 where the evaluation continues.
This report also builds on existing reviews, while providing a somewhat different angle. Robèrt et al. (2002)
reviewed a number of high-level sustainability assessment methods (they used a different definition and
called them tools) and showed that used in a consistent systemic approach these method are
complementary rather than competing against one another. Finnveden and Moberg (2005) give an
overview of methods (which they also call tools) for assessing environmental impacts that they characterise
along four criteria: procedural vs. analytical tool, types of impacts considered, object of the study (policy /
plan / programme, geographical area, company, product, substance), and use in descriptive vs. change
oriented studies. Dewulf and Langenhove (2006) focuses on the sustainability assessment of renewables-
based technologies. The book starts with contributors explaining assessment methods relevant for the task,
followed by case studies where such methods are applied.
Ness et al. (2007) describes a framework for sustainability assessment tools (here again, methods by our
definition) considering the temporal focus (retrospective or prospective), object of focus (policy or
product), use of monetary valuation, and integration of nature-society systems into single evaluation. Ness
et al. then apply their framework on a number of sustainability assessment methods clustered into three
groups: indicators / indices, product-related assessment, and integrated assessment. Singh et al. (2009)
provides an overview of sustainability assessment “methodologies” (which they define as sustainability
indicators and composite indexes), focusing on those applied in policy practice.
Jeswani et al. (2010) conducted a SWOT (Strengths-Weaknesses-Opportunities-Threats) analysis of a
number of sustainability assessment methods, specifically assessing the potential of each method for
deepening and broadening ISO-compliant LCA. The aim of an extended LCA method would be to increase
its relevance in decision making. Sala et al. (2013a, 2013b) conducted a meta-review of reviews on
sustainability assessment methods, focusing on life cycle-based methods. Combining their findings with

SAMT D1.1
8
ontological, epistemological and methodological aspects of the broader field of sustainability science, their
aim is here also to enhance classical comparative life cycle approaches towards proactive life cycle methods
suited for decision making.
The last paragraphs are not an exhaustive list of existing reviews but give a good overview. Some of the
reviews above give a large place to sustainability assessment methods of policies, which is not within the
industry-oriented scope of our project. All the reviews cited above focus on methods. We also reviewed
tools, since those are crucial for the actual use of sustainability assessment methods “in the real world”,
including the industry. The overall objective of the SAMT project is related to that in Jeswani et al. (2010)
and Sala et al. (2013a, 2013b) where they are looking for ways to enhance current life cycle assessment
methods. Our approach additionally has a pragmatic component in that the applicability of potential
enhancements will be discussed directly with industrial actors from the process industries.
Readers interested in sustainability assessment may find methods or tools presented in this report that
they did not know existed. One particular added value of this review is to present methods and tools side
by side and show links between the two. One can see the profusion of tools available for a small number of
methods. This review can then serve as a first step in selecting a tool. On the other hand a number of
methods (standalone or combination of other methods) are not implemented in publicly available tools.
This may indicate a higher barrier to entry for stakeholders interested in implementing such a method,
since they would have to develop their own tools. The clustered review also gives some insights into the
characteristics of methods and tools. Some of the criteria are common with existing review but others are
more practice-oriented (such as free access, license fees etc.).
After collecting a rather long list of methods and tools for sustainability assessment, we organised it in
clusters. We also used a set of classification criteria—approved by SAMT’s industry partners—to structure
and harmonise the review. Results are presented either in visualisations displaying all single methods and
tools or at the level of clusters, somewhat more aggregated.
It is a challenge to visualise review results for such a long list of methods and tools. The pitfalls are: either
highly aggregated figures where the link to single methods and tools is lost, or detailed reviews for each
single method or tool where the big picture is lost. We tried to generate visualisations that show patterns
at a high level of aggregation while still retaining low level information. Depending on the background and
interest of the reader it is possible to dive more or less deeply into the review results.
1.4 Method
We have searched databases of the following scientific journals for relevant methodological peer-reviewed
articles: International Journal of Life Cycle Assessment, Journal of Cleaner Production, Journal of Industrial
Ecology. We used different keyword combinations based in the following set: sustainab*, assessment,
method, tool, life cycle, footprint, industry, decision making, environment*, social, energy efficien*,
resource efficien*.
We have looked for methods and tools in the guidelines of the following disclosure mechanisms: Global
Reporting Initiative2 , Dow Jones Sustainability Indices3 , United Nations Global Compact 4 , German
2 https://www.globalreporting.org/Pages/default.aspx
3 http://www.sustainability-indices.com/

SAMT D1.1
9
Sustainability Codex5, CDP (formerly Carbon Disclosure Project)6, IPIECA7, CEO Water Mandate8 (a part of
the UN Global Compact), Product Environmental Footprint9, Organisation Environmental Footprint10.
We have also conducted regular web searches, looking for examples of sustainability assessment tools and
methods used in the industry or developed at universities but not necessarily published in the scientific
journals we have surveyed.
Finally, we cross-referenced our findings with the lists of methods and tools used by our SPIRE-funded
sister projects STYLE11 and MEASURE12 in their survey.
In the end, 51 methods and 38 tools made it to our list. We clustered the methods and tools we found in
seven method-categories and six tool-categories, respectively. The clusters are presented in Table 1. Other
classifications are of course possible. The complete list of methods can be found in Appendix 6.1. The
complete list of tools follows in Appendix 6.2.
Table 1: Overview of the clusters defined to organise the methods and tools found during the literature review
Method clusters
Life cycle-related methods
Hybrid methods
Integrated methods
Methods focusing on costs
Methods specific to the chemical industry
Methods specific to the agricultural, forestry and food sectors
Other methods
Tool clusters
Full LCA tools
Simplified LCA tools
Tools specific to the chemical industry
Tools focusing on energy
Tools focusing on waste
Other tools
4 https://www.unglobalcompact.org/
5 http://www.deutscher-nachhaltigkeitskodex.de/
6 https://www.cdp.net/en-US/Pages/HomePage.aspx
7 http://www.ipieca.org/
8 http://ceowatermandate.org/
9 http://ec.europa.eu/environment/eussd/smgp/product_footprint.htm
10 http://ec.europa.eu/environment/eussd/smgp/organisation_footprint.htm
11 www.spire2030.eu/style
12 www.spire2030.eu/measure

SAMT D1.1
10
1.5 Classification criteria
We have developed a set of criteria to help us structure the review of existing sustainability assessment
methods and tools. All SAMT partners, in particular industry partners, were given a chance to comment on
and check this list for completeness, usefulness for industrial actors, level of detail, clarity etc. The table
below presents a short definition of each criteria, after consideration of the partners’ comments. Some
criteria are multiple choice (the possible “states” of such criteria are given as state 1 | state 2 | state 3 etc.),
while other are more open and descriptive.

SAMT D1.1
11
Table 2: Classification criteria for reviewing sustainability assessment methods and tools
Criteria Description
ESSENCE
Nature tool | method
Core idea Describe specificities, use, potential
Status established | available | under development
Outcome quantitative | qualitative
Complexity low | medium | high
Access & costs proprietary | open source | license fee | free license
Updating on-going updating | development halted since…
Replicability possible if X and Y | unlikely because of subjective inputs X and Y
Dynamics Is the tool dynamic? Does it support future scenarios (ex-ante assessment)?
SCOPE
Sustainability aspects environmental | social | economic
Economic scope product | production site | company | branch
Geographical scope sub-national | national | international
Application field along the supply chain
technical process optimization | management process optimization | supply chain optimization|
life cycle wide optimization |
ex-ante technology impact assessment | other [specify]
Life cycle stages cradle to gate | cradle to grave | …
Sectors If already used in several sectors: which ones? in process industries too?
RELEVANCE
Relevance for decision making
support management and investment decisions | support long-term process development inside a company | monitoring and reporting of sustainability performance | etc.
Relevance for business sectors inside a company
controlling | top-management | R&D | marketing | supply chain management | certification | Product specification standards | communications | etc.

SAMT D1.1
12
Disclosure Recommended or required by GRI, CDP, DJSI, etc.
REQUIREMENTS
Information systems software or tool, reporting system, required standard, license fees etc.
Company internal data, supply chain data
[list them, if any]
Commercial or public databases, maps
[list them, if any]
Competences needed personnel with their expected level of qualification and experience
Organisation needed structures inside the company, minimum size of the company
OUTCOME
Examples of possible outcomes
Environmental indicators [list them, if any]
Social indicators [list them, if any]
Economic indicators [list them, if any]
Output formats e.g.: flow charts, Sankey diagrams, risk score cards, spider diagrams etc.
Labelling and certification Can the outcome be used to receive a label or standardization, or certification etc.
FURTHER INFORMATION
Literature
Web

SAMT D1.1
13
2 Overall review
First off, all figures in this chapter are web-based visualisations that render better in a web browser, where
they are also animated and interactive allowing the user to actually explore the data. The reader is
therefore encouraged to follow the web-links provided in this report. The project web-page presents a list
of visualisations used in this chapter: https://www.spire2030.eu/samt (select: OUTCOMES -- Other results
from the navigation menu on the left of the website).
The keyword-based search—whose approach is described in section 1.4—yielded 51 methods and 38 tools.
It is a challenge to make sense of such a long list of—sometimes disparate—methods and tools. In this
chapter we propose some analysis of the linkages between and characteristics of these methods and tools.
The results of the analysis are presented below and online in visualisations inviting the reader to further dig
into the data. All methods and tools were reviewed for this analysis, although not at the level of detail
shown in the full list of classification criteria (section 1.5).
For readability reasons, methods and tools are referred to by their ‘short names’ in the figures below.
Appendix 6.3 provides an alphabetical list of the methods’ and tools’ short names, matching these with the
corresponding full names. Appendices 6.1 and 6.2 additionally provide web-links or literature sources for
each method and tool, and the provider of each tool.
Figure 1 presents all methods and tools classified in clusters. Single methods and tools are aligned on the
edge of the circle. These are grouped at increasing levels of aggregation when moving towards the centre
of the diagram. This classification was useful in organising the review. It does not pretend, however, to be a
definitive framework.
Clusters vary widely in size, from two tools (cluster “Tools focusing on energy”) to 11 methods (cluster
”Other methods”). Some items may actually belong to more than one cluster, so we had to make choices.
For example, ‘Eco-Efficiency Analysis’ would fit in both clusters ‘Life cycle methods’ and ’Integrated
methods’. We assigned EEA to the latter, considering that the method is designed to be integrative by
combining life cycle approaches. Another example is the ‘Waste Reduction Algorithm’ (WAR) that would fit
in both clusters ‘Tools specific to the chemical industry’ and ‘Tools focusing on waste’. We assigned WAR to
the former since it seems to be primarily used in the chemical industry.
The visualisation in Figure 1 can be accessed online on the project website for a better view (possibility to
zoom etc.).
A Cartesian view, where the methods and tools are listed vertically in a clear but space-consuming view, is
also available at the project website.

SAMT D1.1
14
Figure 1: Overview of methods and tools considered in the review, organised in clusters. The figure is accessible online, as well as a non-radial view (see main text for the links).
In the course of our review we have also tried to answer the question: which tools implement (or at least
claim to implement) which methods? As a result, we have matched methods and tools in an interactive
visualisation that can be accessed at:
https://www.spire2030.eu/sites/default/files/project/samt/spire_visus/figure-1-
3/implementation_fig.html
In the diagram, methods are linked to the tools (or also other methods) that claim to implement them and
inversely tools are linked to the methods they claim to implement. Note again that our search does not
SAMT D1.1
15
claim to be exhaustive and there are probably more methods and tools that we are not aware of as of this
writing. Also, some links to and from the methods and tools not included in the clusters reviewed in details
in section 3 may be missing. A detailed review of each and every method tool would be necessary to ensure
all linkages are shown.
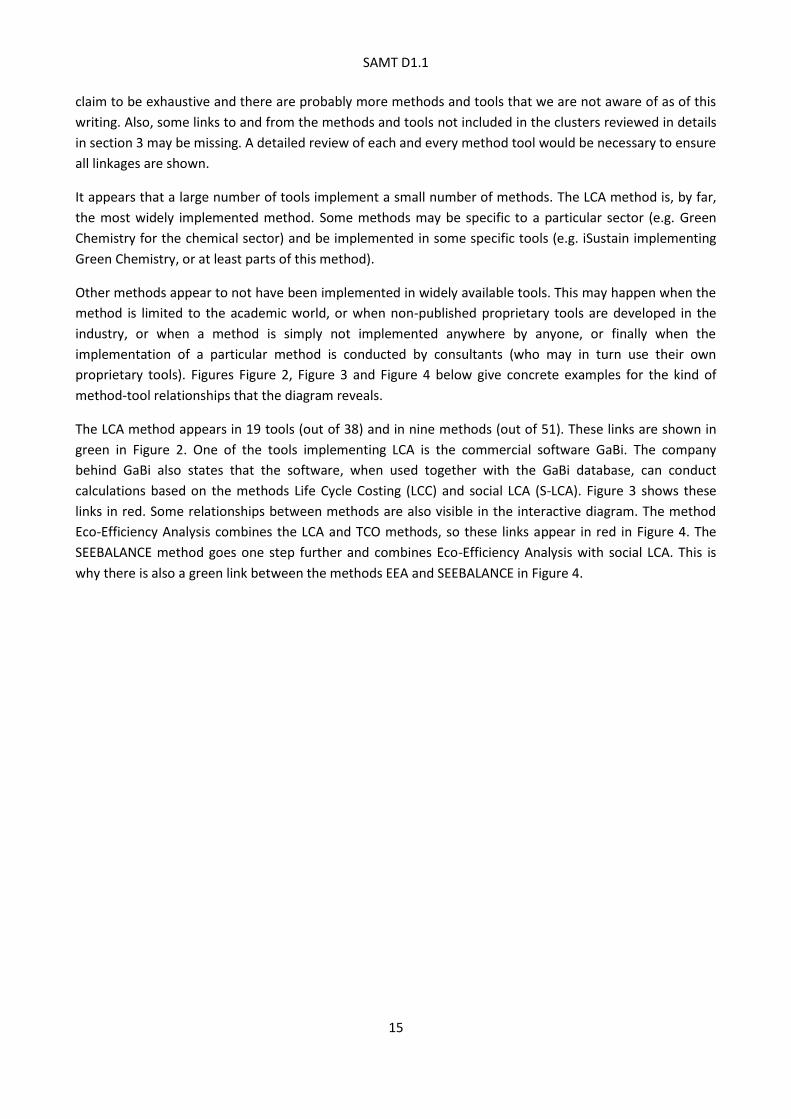
It appears that a large number of tools implement a small number of methods. The LCA method is, by far,
the most widely implemented method. Some methods may be specific to a particular sector (e.g. Green
Chemistry for the chemical sector) and be implemented in some specific tools (e.g. iSustain implementing
Green Chemistry, or at least parts of this method).
Other methods appear to not have been implemented in widely available tools. This may happen when the
method is limited to the academic world, or when non-published proprietary tools are developed in the
industry, or when a method is simply not implemented anywhere by anyone, or finally when the
implementation of a particular method is conducted by consultants (who may in turn use their own
proprietary tools). Figures Figure 2, Figure 3 and Figure 4 below give concrete examples for the kind of
method-tool relationships that the diagram reveals.
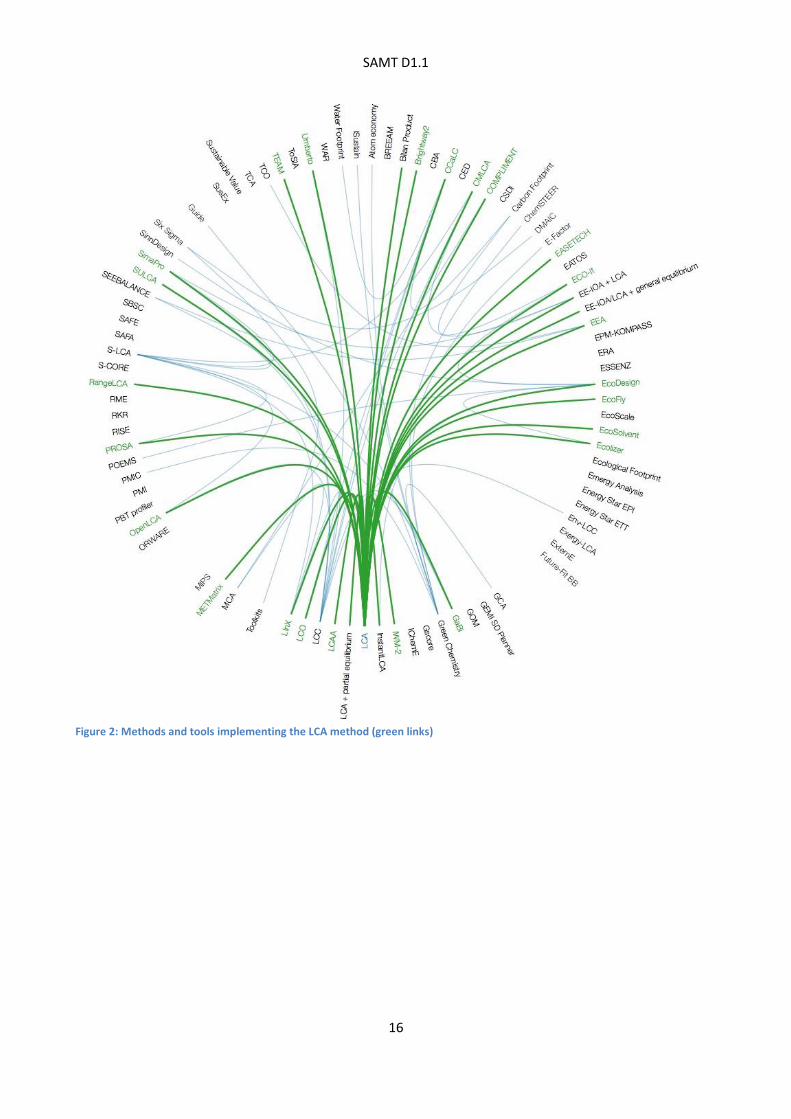
The LCA method appears in 19 tools (out of 38) and in nine methods (out of 51). These links are shown in
green in Figure 2. One of the tools implementing LCA is the commercial software GaBi. The company
behind GaBi also states that the software, when used together with the GaBi database, can conduct
calculations based on the methods Life Cycle Costing (LCC) and social LCA (S-LCA). Figure 3 shows these
links in red. Some relationships between methods are also visible in the interactive diagram. The method
Eco-Efficiency Analysis combines the LCA and TCO methods, so these links appear in red in Figure 4. The
SEEBALANCE method goes one step further and combines Eco-Efficiency Analysis with social LCA. This is
why there is also a green link between the methods EEA and SEEBALANCE in Figure 4.
SAMT D1.1
16
Figure 2: Methods and tools implementing the LCA method (green links)

SAMT D1.1
17
Figure 3: Methods that the tool GaBi implements (red links)

SAMT D1.1
18
Figure 4: Methods that the other method Eco-Efficiency Analysis implement (red links) and method that implements EEA (green link)

SAMT D1.1
19
From the commenting round on the review criteria by the SAMT industry partners, it appeared that some
criteria were more directly relevant: complexity, cost, use in the industry, dynamics, relevance to decision
making. To these categories, we added relevance for labelling/certification, and the type of indicators
(environmental, social, economic) produced. The result is a hierarchical bundle chart whose interactive
visualisation can be accessed at:
https://www.spire2030.eu/sites/default/files/project/samt/spire_visus/figure-1-4/analysis_fig.html
Although it is difficult to review tools without proper testing, we tried to assess each tool against the
criteria listed above. We had to rely on the tools’ documentation and the claims made by the tools’
providers. We then aggregated the results at the level of tool clusters. This is what the online visualisation
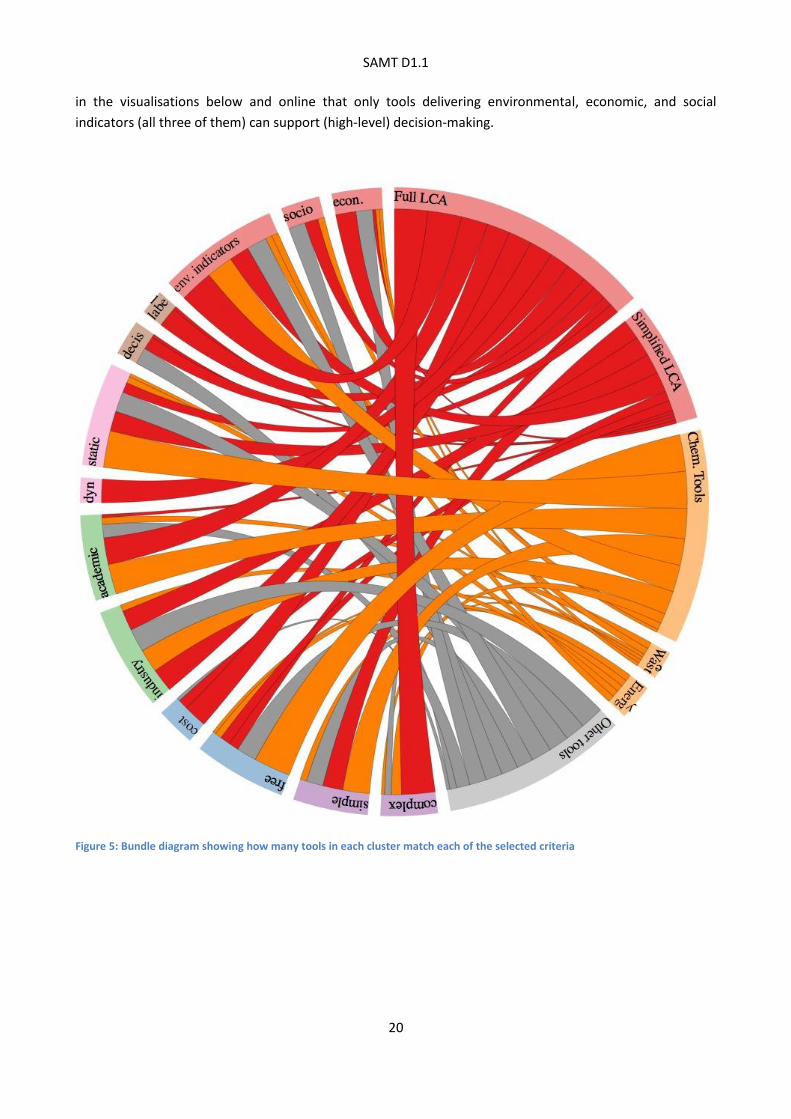
and Figure 5 show.
The tool clusters and selected criteria are on the edge of the circular diagram. Tool clusters are on the right,
criteria are on the left. The abbreviations are listed below Figure 6 with their meaning. One can select a tool
cluster or criteria at the edge of the circle to focus on it. The links to/from the selected group are then
highlighted (Figure 6). The online version shows the total number of tools in the cluster (and their names)
or the total number of tools matching the criteria selected. The thickness of links between tool clusters and
criteria encode the absolute number of tools from a given cluster that match a given criteria.
For example, 10 out of 10 tools in the cluster “Full LCA tools” are considered “complex”. This is of course
our own assessment based on the literature review and own judgement. In this case, it is justified because
such tools require qualified personnel to be operated.
The relative size of the base of the criteria at the edge of the diagram (i.e. where the name of the criteria
are written) also shows which criteria match a large or small number of tools across the different clusters.
For example, it is clear that close to all tools in all clusters deliver environmental indicators. On the other
hand only three clusters (Full LCA tool, Chemical industry tools, Other tools) seem to provide social
indicators, and not all tools in those clusters do so (4 out of 10, 2 out of 11, and 5 out of 7, respectively).
There are slightly more tools providing economic indicators (14 against 11), but they are spread across
more clusters than in the previous case: six from the cluster Full LCA tools, one each from the clusters
Simplified LCA tools, Chemical industry tools, and Waste tools, and five from the cluster Other tools. These
quantitative data are visible on the online diagram when you move mouse over the links between criteria
and tool clusters (see for example the yellow information bubble in Figure 6).
Other criteria are more difficult to assess. Many tools claim to allow “scenarios” to be modelled. But, to our
knowledge, none of these tools actually gives the possibility to input time series of a number of parameters
to model complex scenarios. We therefore watered down the requirements for a truly “dynamic” tool and
considered a given tool dynamic if it allowed for parameterisation of the model.
Another difficult criterion concerns decision-making. Most tools are designed so that the user can make
immediate decisions (e.g. for a product design, the choice of solvent for a chemical reaction etc.). Therefore
if a tool supporting decision-making means that the tool allows the user to compare two or more options
and make a choice, then many of the tools reviewed support decision-making. One could consider,
however, that a tool supports decision-making only if it provides results that could be directly used by, say,
upper management to make strategic decisions. The number of tools falling in that category would be
considerably lower. To get closer to this second definition of “supporting decision-making” we considered
SAMT D1.1
20
in the visualisations below and online that only tools delivering environmental, economic, and social
indicators (all three of them) can support (high-level) decision-making.
Figure 5: Bundle diagram showing how many tools in each cluster match each of the selected criteria

SAMT D1.1
21
Figure 6: Bundle diagram showing how the cluster ’Full LCA tools’ relates to the classification criteria
TOOL CLUSTERS (on the right of the diagram)
Full LCA = Full LCA tools; Simplified LCA = Simplified LCA tools; Chem. Tools = Tools of the chemical industry; Waste = Tools
focusing on waste; Energy = Tools focusing on energy; Other tools = Other tools.
CRITERIA (on the left of the diagram)
complex = complex tools; simple = simple tools; free = free tools; cost = tools the user has to pay for; industry = tool used in the
industry; academic = tool used in academia; dyn = dynamic tool; static = static tool; decis = tool supporting decision-making; label =
tool used for labelling / certification; env. indicators = tool producing environmental indicators; socio = tool producing social
indicators; econ = tool producing economic indicators.

SAMT D1.1
22
3 Review by clusters
Considering the long list of methods and tools we have assembled, we decided to rationalise the review in
order to keep this report at an acceptable length. The following sections present detailed reviews (using the
criteria presented in section 1.5) of selected method and tool clusters. We selected the clusters for their
relevance to the project and the process industries. That is why, for example, we left out the cluster
“Methods specific to the agricultural, forestry and food sectors”. We focused on clusters with potential for
cross-sectorial applications. That is why, for example, we did not review in more details the method and
tool clusters specific to the chemical industry.
We decided against selecting and reviewing single methods and tools separately. It would be arbitrary at
this stage to label some methods or tools as "most important" and review only those. We do not yet have a
metric to compare them with one another. Further evaluation is planned in WP2 and WP3 where a second
layer of analysis, using rankings, will actually provide such a metric to single out most promising methods
and tools.
Each review attempts to give a first structured evaluation of the methods and tools in those clusters.
Where relevant, we tried to point out noteworthy particularities of single methods or tools in the reviewed
clusters. We otherwise assessed the clusters’ methods and tools “in bulk”.
All tools and methods are listed with their short and full names in Appendices 6.1 and 6.2 with web-links
and literature references for further information.
The reviews in the following sections all follow the same format. First, a profile page provides the name of
the cluster, a summary of the main findings from the review, and links to navigate to the different parts of
the review. The review itself unfolds in the subsequent pages in tabular form using the criteria described in
section 1.5. Table 3 gives an overview of the reviewed clusters.
Table 3: Method and tool clusters considered in the detailed review
Method and tool clusters Comments
Life cycle methods LCA, subsets or derivatives of LCA, and life cycle methods beyond environmental assessment
Hybrid methods Fusion of existing methods (the limit between methods becomes blurred) in order to increase the scope of each individual method.
Integrated methods Juxtaposition of well-delimited methods (“Russian dolls” construct) to support decision making. Usually includes a weighting scheme to aggregate sub-indicators into one or a small number of indicators.
Full LCA tools Implementation of ISO-conform LCA and possibly other life cycle methods
Simplified LCA tools Implementation of streamlined LCA and possibly other life cycle methods
Integrated tools Interestingly, available integrated tools do not implement the integrated methods described above but provide their own combinations of methods

SAMT D1.1
23
3.1 Life cycle methods
LCA (Life Cycle Assessment), MIPS (Material
Input Per Service), CF (Carbon Footprint), WF
(Water Footprint), EF (Ecological footprint), S-
LCA (Social LCA), E-LCC (Environmental Life Cycle
Costing), CED (Cumulative Energy Demand), E-
LCA (Exergetic LCA), EA (Emergy analysis)
Back to Table of Content Wordcloud made from DIN EN ISO 14044:2006
SUMMARY
It is commonly recognised that sustainability assessment should rely on three pillars:
environmental, economic, social (or societal). Regarding life cycle methods, environmental ones are
plural and well established. LCA is standardised. LCC predates environmental LCA but environmental
LCC (where the system boundaries are consistent with those of an LCA) is still under development.
S-LCA is also being developed to be consistent with LCA standards. Overview of the methods in this
cluster:
Environmental: LCA (incl. subsets CED, CF, WF), MIPS (or Material Footprint, also a subset of
LCA), EF
Economic: E-LCC
Social: S-LCA
In this cluster, methods are not combined with one another or with other modelling techniques or
with management processes. These aspects are addressed in the clusters reviewed in sections 3.2
and 3.3. The economic and social extensions of LCA promise an integrated assessment but they still
lack standards, adequate databases. They have uncertainty issued and add to the complexity of LCA,
already perceived as complex. The main advantage of E-LCC and S-LCA is, however, that the process
itself forces the analyst to learn more and understand better what is modelled.
TO THE STRUCTURED REVIEW (you can use the links in the column on the left)
ESSENCE Nature | Core idea | Status | Outcome | Complexity | Access | Updating | Replicability | Dynamics
SCOPE Sustainability | Economic | Geographical | Application fields | Life cycle | Sectors
RELEVANCE Decision making | Business sectors | Disclosure
REQUIREMENTS IT systems | Data (1) | Data (2) | Competences | Organisation
OUTCOME Examples | Environmental indicators | Social indicators | Economic indicators | Format | Labelling
and certification
INFORMATION Literature | Web

SAMT D1.1
24
ESSENCE back to top
Nature Life cycle methods. CED, CF, WF, even MIPS (= Material Footprint) can be considered sub-methods of the broader (in terms of indicators) LCA.
Core idea All these methods follow the same life cycle perspective, i.e. ideally modelling a product or service’s life from “cradle to grave”. Their specificities lie in the indicators that they produce.
Status LCA (CED, CF, WF), MIPS, EF are established methods. EA, E-LCA are available but rarely used. S-LCA, E-LCC are available / under development and attracting growing interest.
Outcome All methods deliver quantitative indicators. S-LCA can also deliver qualitative and semi-qualitative results.
Complexity Medium to High. Trained personnel is usually required to implement these methods. Data collection is usually challenging. Some tools try to lower the barrier to entry. (see sections 3.4 and 3.5)
Access & costs Descriptions of the methods are usually publicly available. Most available tools are proprietary with license fees but free software is gaining importance. Most widely used databases also have license fees. (see sections 3.4 and 3.5)
Updating LCA, MIPS started in parallel in the 1990s and were not compatible. LCA tools and databases are continuously updated and expanded. MIPS (= Material Footprint) is also being updated so that it is now compatible with popular LCA tools and databases.
Replicability Theoretically possible. It requires in practice all assumptions, data collected, database entries used etc. to be reported transparently and in details, which only few studies do. Methods such as S-LCA without yet standardised impact assessment methods and with high uncertainty in the inventory data should be used and reported all the more transparently.
Dynamics These methods are originally conceived for status-quo or ex-post assessments. Some level of parameterisation is possible for “what-if” types of scenarios. Real ex-ante assessments (with both foreground and background systems dynamically modelled) are in theory possible but very costly.
SCOPE back to top
Sustainability aspects LCA, CED, CF, WF, MIPS, EF, EA, E-LCA are environmentally-oriented life cycle methods. S-LCA, E-LCC are life cycle methods focusing on social and economic aspects, respectively.
Economic scope These methods operate at the micro-level, i.e. product, process, or service. Key is the definition of the “functional unit” studied. It can be defined to analyse the life cycle effects of a production site.
Geographical scope There are in general no predefined geographical boundaries in a life cycle

SAMT D1.1
25
model.
Application field along the supply chain
Life cycle studies can be used for technical process optimization, management process optimization, supply chain optimization, life cycle wide optimization. Ex-ante impact assessment is less readily doable but gains traction, esp. in academic literature.
Life cycle stages “Cradle to grave” is the ISO-compliant approach but parts of the life cycle can be also analysed separately.
Sectors There are examples of LCA (and its subsets) and MIPS applications in most sectors, including process industries.
RELEVANCE back to top
Relevance for decision making
Applied separately these methods can be used for monitoring and reporting. For decision making, at least the environmental and economic aspects need to be integrated, ideally social aspects as well (see sections 3.2 and 3.3).
Relevance for business sectors inside a company
Applied separately (especially environmental life cycle methods) are used internally in R&D, supply chain management, certification, and towards the outside of the company in marketing, communications etc. Non integrated methods are less relevant for controlling and top-management.
Disclosure GRI cites LCA as potential source of information for the indicator “Extent of impact mitigation of environmental impacts of products and services”.
REQUIREMENTS back to top
Information systems Standards: ISO 14040 series for LCA; VDI Guideline on Cumulative Resource Use in development in Germany; E-LCC and S-LCA are not standardised. Tools/software: see sections 3.4 and 3.5.
Company internal data, supply chain data
Needed data from inside the company and suppliers (for each step in the process chain): technology used, direct material, energy and water inputs, direct emissions and waste generation, costs (for E-LCC), various social factors (for S-LCA). For cradle to grave approach: on users’ behaviour, on end-of-life of the modelled product.
Commercial or public databases, maps
Main commercial environmental life cycle databases: ecoinvent, GaBi. Free sector-specific databases (agriculture, construction) exist, some are built on top of ecoinvent. The free ELCD database provides Life Cycle Inventories. Main commercial social life cycle database: Social Hotspots Database (SHDB).
Competences Life cycle approaches require trained personnel to compile data; external consultants are routinely brought in for assistance. For environmental life cycle studies an engineer’s understanding of the production processes modelled is required; economic life cycle studies require competences in the fields of controlling, accounting; social life cycle studies require competences in the field of controlling, human resource management.

SAMT D1.1
26
Organisation Whether in-house or through consultants, the critical phase of any life cycle study is data collection: collaboration from inside the company and suppliers is critical. Site-specific visits and audits may be required. For social LCA, interviews with external stakeholders may also be required. ISO-compliant LCAs also require review by a third-party.
OUTCOME back to top
Examples of possible outcomes
In comparative life cycle studies, the outcome is a (environmental) performance comparison of the considered products. Further assessment such a hot spot analysis in the supply chain or whole life cycle are also possible.
Environmental indicators LCA provides environmental indicators at different levels: elementary flows (direct flows from/to the environment) in the LCI (e.g. CO2 emissions, cadmium emission), mid-point (e.g. climate change, human toxicity) and end-point (e.g. human health) indicators. Aggregation between each steps involves characterisation methods (e.g. CML 2001, ReCiPe etc.). EF translates environmental pressures in unit of surface. MIPS (or Material Footprint) aggregates the total material (abiotic and biotic separately) and water requirements of a product or service; it includes economically unused resource extraction, not accounted for in standard LCA.
Social indicators UNEP/SETAC produced guidelines for producing life cycle social inventories but there are not yet widely agreed upon characterisation methods to produce mid-point or end-point social indicators.
Economic indicators Economic life cycle inventory data are expressed in a currency unit. There is no subsequent characterization or weighting for impact assessment. Final indicator is the aggregated cost data that provide a direct measure of financial impact.
Output formats Depends on the tools used.
Labelling and certification The data collected and analyses generated in those methods can provide the basis for certification and labelling processes (for example Environmental Product Declarations according to ISO 14025, or the upcoming Product Environmental Footprint and Organisation Environmental Footprint in development at the European Commission), although they are not directly associated with a particular label.
FURTHER INFORMATION back to top
Literature Literature references for life cycle methods can be found in Table 4 in Appendix 6.1.
Web Main commercial life cycle databases:
Ecoinvent (license fees): www.ecoinvent.org GaBi (license fees): http://www.gabi-software.com/international/databases/gabi-
databases/
Social Hotspots Database (license fees): http://socialhotspot.org/
SAMT D1.1
27
Additional life cycle databases (note that you may have to pay license fees to your LCA software provider to get a compatible version for some of the “free” databases listed below):
ELCD (free): http://eplca.jrc.ec.europa.eu/ELCD3/ LC-Inventories (free): http://www.lc-inventories.ch/
U.S. Life Cycle Inventory Database: https://www.lcacommons.gov/nrel/search NEEDS (free): http://www.needs-project.org/needswebdb/ ProBas (free): http://www.probas.umweltbundesamt.de Ökobaudat (free): http://oekobaudat.de/datenbank/browser-oekobaudat.html
BioEnergieDat (free): http://www.bioenergiedat.de/datenbereich Agribalyse (free): http://www.ademe.fr/agribalyse
USDA (free): https://www.lcacommons.gov/discovery/

SAMT D1.1
28
3.2 Hybrid methods
EE-IOA/LCA (Hybrid environmentally
extended input-output analysis and LCA),
LCA/PEM (Hybrid LCA + partial equilibrium
model), EE-IOA/LCA/GEM (Hybrid EE-
IOA/LCA + General Equilibrium Model), LCO
(Life Cycle Optimisation), LCAA (Life Cycle
Activity Analysis)
Back to Table of Content Wordcloud made from Suh & Huppes (2005), Azapagic & Clift (1998), Earles & Halog (2011)
SUMMARY
We refer to these methods as “hybrid” because the sub-methods that constitute them have
compatible mathematical formalisations. The sub-methods can be computed together in one
consistent model (“hybridised”). This is different from integrated methods (see section 3.3) that run
sub-methods in parallel or one after the other and require weighting + aggregating of the separate
results.
LCO and LCAA often remain at the same micro-level as the constituting LCA. Linear programming is
used to optimise the life cycle model over one or more (conflicting) objectives under given
constraints.
EE-IOA/LCA expands the scope of LCA towards sectorial and macro level, while usually keeping the
possibility to calculate usual LCA indicators (as well as socio-economic ones). EE-IOA explicitly
implements cross-sectorial relationships, albeit at an aggregated level. IOA sectors can be
disaggregated into technologies and processes. This uses LCA models and is time and data intensive.
LCA/PEM, EE-IOA/LCA/GEM implement the impact of a product’s life cycle and its diffusion on /
through other sectors of the economy, which is referred to as consequential LCA (CLCA).
All these methods can be considered as complex. There is also no readily available “hybrid” tool
(apart from CMLCA, see section 3.4), therefore building a product model requires some
programming or teaming up with an institution with the necessary know-how.
TO THE STRUCTURED REVIEW (you can use the links in the column on the left)
ESSENCE Nature | Core idea | Status | Outcome | Complexity | Access | Updating | Replicability | Dynamics
SCOPE Sustainability | Economic | Geographical | Application fields | Life cycle | Sectors
RELEVANCE Decision making | Business sectors | Disclosure
REQUIREMENTS IT systems | Data (1) | Data (2) | Competences | Organisation
OUTCOME Examples | Environmental indicators | Social indicators | Economic indicators | Format | Labelling
and certification
INFORMATION Literature | Web

SAMT D1.1
29
ESSENCE back to top
Nature Standalone methods that all have in common that they incorporate traditional LCA. They aim to increase LCA’s relevance for decision making.
Core idea Hybrid methods have different aims: improve completeness of process-based traditional LCA by linking it to a complete sectorial representation of the economy (EE-IOA/LCA), bring economic modelling to LCA to realise consequential LCA (LCA/PEM, EE-IOA/LCA/GEM), identify the best compromise solution in a system with conflicting objectives (LCO, LCAA). The latter are optimisation methods that use Linear Programming. Note: consequential LCA (CLCA) models environmental impacts of a product system beyond physical relationships accounted for in traditional attributional LCA (ALCA).
Status First method descriptions are over two decades old. Multiple publications have refined the methods since and proposed case studies. The availability of large computing power (compared to two decades ago) to any researcher explain that the interest for these methods keeps growing.
Outcome All these methods rely on quantitative modelling delivering quantitative results.
Complexity High (in particular in the absence of dedicated tools, using these methods require programming skills and sufficient computing power, the latter being less and less of an issue)
Access & costs Method descriptions (including algorithms) are published but there are no publicly available tools that implement them.
Updating Input-output tables with environmental extensions are increasingly available (EE-IOA/LCA), e.g. the successive EU projects EXIOPOL, CREEA, DESIRE producing multi-regional input-output tables for a number of (past) years. Economic models of various kinds are of course constantly developed but there is no standardised, concerted development effort for hybrid LCA / economic models. LCO and LCAA are relatively less known methods, at least outside academic circles.
Replicability Replicability is possible only with full transparency, which includes description and access to all data and models used (e.g. economic models).
Dynamics Economic models are often used for ex-ante assessments and so are CLCA combining LCA and economic models. The underlying physical LCA or EE-IOA/LCA models often remain static, however.
SCOPE back to top
Sustainability aspects Environmental aspects are addressed through LCA and EE-IOA (usual LCA impact categories can be calculated). Input-output tables can also be extended with socio-economic accounts (e.g. number of workers and

SAMT D1.1
30
educational attainment, capital stocks, gross output and value added etc.). Hybridisation with PEM and GEM also provides access to socio-economic indicators (which ones depends on the model used).
Economic scope These methods expand the product / production site scope of LCA by explicitly linking it to the rest of the economy. Multi-regional trade-linked input-output tables, multi-market multi-regional PEM, and GEM provide (at least theoretically) links to other sectors. An issue (for which there is no standardised solution) is the different aggregation levels between such economic modelling methods (broad sectors) and LCA (detailed product or process level).
Geographical scope Life cycle methods intrinsically have no geographical boundaries (but they do not cover all ramifications of the supply chain into other sectors due to necessary cut-offs). Economic models or input-output tables may have a given geographical scope of their own (but they link all economic sectors together).
Application field along the supply chain
EE-IOA/LCA has the same application field as LCA (technical process optimization, management process optimization, supply chain optimization, life cycle wide optimization). In that case, how to optimise the system relies partly on trial-and-error and subjective assessment. With LCO and LCAA the optimisation process is formalised through linear programming and the optimal system is an objective result of the modelling. CLCA using hybridisation with economic models is a form of ex-ante (technology) impact assessment.
Life cycle stages “Cradle to grave” is usually aimed at but parts of the life cycle can also be analysed separately.
Sectors A number of case studies exist for each of the methods. They usually are academic works. They usually look at specific manufactured products or processes such as electricity generation or recycling.
RELEVANCE back to top
Relevance for decision making
Optimisation methods aim at giving objective results on the optimal trade-offs when making decision with conflicting objectives (e.g. economic and environmental). The level of decision support depends on the parameters that can be modelled (e.g. social parameters are rarely included beyond employment level parameters). LCA / economic model hybrids can help support management and investment decisions, they were however so far rather used to inform policy making.
Relevance for business sectors inside a company
Although not widespread in the industry EE-IOA/LCA can inform the same business sectors as LCA: internally in R&D, supply chain management, certification, and towards the outside of the company in marketing, communications etc. Optimisation methods and LCA / economic model hybrids can be used for management, depending on what parameters are included.
Disclosure Hybrid methods are still mostly academic, not standardised, and it seems that

SAMT D1.1
31
they are not mentioned in the main disclosure mechanisms’ guidelines.
REQUIREMENTS back to top
Information systems See section 3.1 for info systems in life cycle methods. Since the scope of hybrid methods is broader than a company and its suppliers, access to additional micro, sectorial, and macro data and knowledge is needed. There is to date no standard organising this.
Company internal data, supply chain data
See section 3.1 for data in life cycle methods. CLCA approaches require to collect “marginal data”, i.e. data on technologies, products etc. outside the physical supply chain of the LCA model but that are (would be) affected by the diffusion of the studied product as a result of market forces (e.g. product substitution). Identifying and collecting such data is very challenging.
Commercial or public databases, maps
See section 3.1 for data in life cycle methods. Ready to use environmentally extended input-output databases include EXIOBASE, E3IOT (both for purchase), WIOD (World Input Output Database, free). Sectors in WIOD are more aggregated than in the other two but WIOD has socio-economic accounts while the others focus on environmental extensions.
Competences Besides competences required for life cycle methods, an understanding of input-output methods is required for EE-IOA/LCA. Economic modelling knowledge is needed for hybrid LCA / economic models, and linear programming is needed for LCO, LCAA. Since tools are not readily available, using these methods require to build your own tools (i.e. programming) or associate with an entity that has built such tools. For optimisation, popular languages with linear programming solvers are GAMS (General Algebraic Modeling System) and GNU Mathprog.
Organisation To this day, EE-IOA/LCA, LP / LCA optimisation methods, and hybridisation with economic models are not wide spread in the industry or in consultancies, therefore using such methods requires to organise projects with institutes or universities with the necessary know-how.
OUTCOME back to top
Examples of possible outcomes
EE-IOA/LCA provides outcome comparable to standard LCA. When using multi-objective linear programming, optimisation methods can deliver results as a so-called Pareto surface which displays optimal solutions to a multi-objective problem (e.g. minimise environmental impact and maximise economic output). Those optima define trade-offs between objectives: i.e. none of the objectives can be improved without worsening another objective but they are not at the minimum or maximum they would reach if optimised separately. CLCA aims at calculating the life cycle impacts of a product (like a regular LCA) as well as the indirect impacts resulting from economic relationships triggered by the product.
Environmental indicators Same as in LCA.
Social indicators To date usually absent or limited to parameters related to employment.

SAMT D1.1
32
Economic indicators Economic life cycle inventory data are expressed in a currency unit. Economic models or economic accounts of input-output tables provides their own variety of economic indicators (also in currency units).
Output formats There is no standardised output format. Each model will have its own preferred output format, depending on who programmed it.
Labelling and certification Although the data collected and analyses generated in those methods can be used in certification and labelling processes, they usually go way beyond what is required.
FURTHER INFORMATION back to top
Literature Literature references for life cycle methods can be found in Table 4 in Appendix 6.1.
Web Input-output tables with environmental extensions (and socio-economic accounts for WIOD and Eora):
World Input-Output Database (free): http://www.wiod.org EXIOBASE (license fees): http://www.exiobase.eu/ E3IOT (license fees): http://www.cml.leiden.edu/software/data-e3iot.html Eora MRIO Database (free): http://worldmrio.com/
SAMT D1.1
33
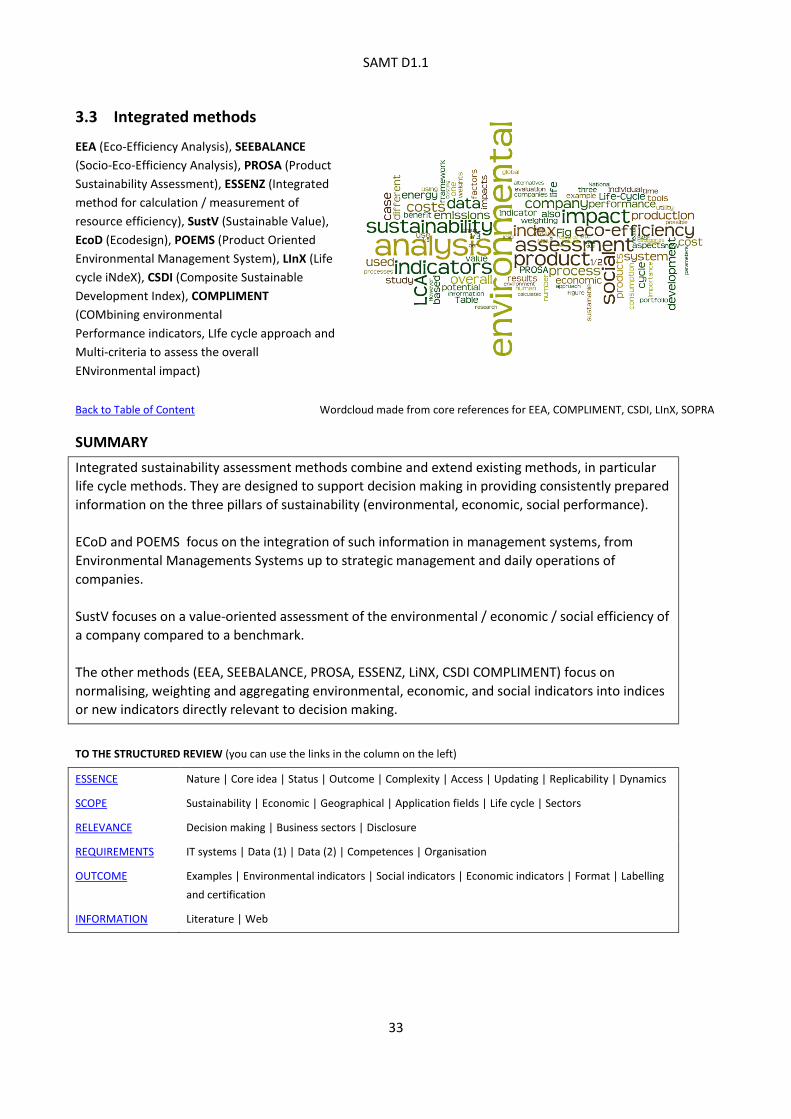
3.3 Integrated methods
EEA (Eco-Efficiency Analysis), SEEBALANCE
(Socio-Eco-Efficiency Analysis), PROSA (Product
Sustainability Assessment), ESSENZ (Integrated
method for calculation / measurement of
resource efficiency), SustV (Sustainable Value),
EcoD (Ecodesign), POEMS (Product Oriented
Environmental Management System), LInX (Life
cycle iNdeX), CSDI (Composite Sustainable
Development Index), COMPLIMENT
(COMbining environmental
Performance indicators, LIfe cycle approach and
Multi-criteria to assess the overall
ENvironmental impact)
Back to Table of Content Wordcloud made from core references for EEA, COMPLIMENT, CSDI, LInX, SOPRA
SUMMARY
Integrated sustainability assessment methods combine and extend existing methods, in particular
life cycle methods. They are designed to support decision making in providing consistently prepared
information on the three pillars of sustainability (environmental, economic, social performance).
ECoD and POEMS focus on the integration of such information in management systems, from
Environmental Managements Systems up to strategic management and daily operations of
companies.
SustV focuses on a value-oriented assessment of the environmental / economic / social efficiency of
a company compared to a benchmark.
The other methods (EEA, SEEBALANCE, PROSA, ESSENZ, LiNX, CSDI COMPLIMENT) focus on
normalising, weighting and aggregating environmental, economic, and social indicators into indices
or new indicators directly relevant to decision making.
TO THE STRUCTURED REVIEW (you can use the links in the column on the left)
ESSENCE Nature | Core idea | Status | Outcome | Complexity | Access | Updating | Replicability | Dynamics
SCOPE Sustainability | Economic | Geographical | Application fields | Life cycle | Sectors
RELEVANCE Decision making | Business sectors | Disclosure
REQUIREMENTS IT systems | Data (1) | Data (2) | Competences | Organisation
OUTCOME Examples | Environmental indicators | Social indicators | Economic indicators | Format | Labelling
and certification
INFORMATION Literature | Web
SAMT D1.1
34
ESSENCE back to top
Nature Standalone methods (SustV, ESSENZ), combinations of existing methods (EEA, SEEBALANCE, SOPRA, COMPLIMENT), combinations of existing methods with management processes (EcoD, POEMS), or schemes to build indices from existing indicators (LiNX, CSDI).
Core idea Designed to support pro-active and strategic decision making. EcoD and POEMS address this by advising to integrate life cycle methods (environmental, economic, social) into standardised Environmental Management Systems, in turn integrated in the strategic management of the company. SustV proposes a value-oriented approach of environmental efficiency (return per unit of resource use, emissions etc.) to compare a given company to a benchmark. The other methods (EEA, SEEBALANCE, PROSA, ESSENZ, LiNX, CSDI COMPLIMENT) aim at providing key indicators that cover at least two (environmental and economic) and better the three sustainability pillars (+ social). The methods differ by the sub-methods that they integrate. They each have their own approach to compute weights for sub-indicators or sub-indices, often applying some form of Multi-Criteria Analysis, which introduces subjective parameters. EEA mixes objective relevance factors for environmental and economic categories with subjective societal weighting factors. ESSENZ hopes to use objective using distance-to-target method. However, when objective targets do not exist, subjective expert judgement needs to be relied upon.
Status EEA and SEEBALANCE are established methods. SOPRA is very similar to SEEBALANCE. Ecodesign and POEMS are also established methods. COMPLIMENT, LiNX, CSDI are available, do not seem to have spread in the industry. ESSENZ is currently under development in a German project.
Outcome Quantitative for indicators based on environmental and economic parameters (e.g. eco-efficiency). Qualitative or semi-quantitative when social parameters come to play.
Complexity Medium to High in the implementation. Most methods try to generate results in simple aggregated indicators.
Access & costs Descriptions of the methods are publicly available. However, no tool publicly available covering whole integrated methods (some company-internal tools may exist). Some LCA tools may cover part of the required methods. See sections 3.4 and 3.5 for review of access and costs for such tools.
Updating The underlying methods (e.g. LCA, S-LCA etc.) are being further developed, as well as tools for them (see corresponding reviews). New ways to compute weights for integrated assessment are published regularly but there is no one agreed upon method for this that is being updated.
Replicability LCA and similar methods are replicable (under conditions of full transparency). Integrated methods use weighting schemes to generate aggregated indicators. Depending on the method (e.g. MCA) to obtain them,

SAMT D1.1
35
the weights are mostly subjective and another team may obtain different weights.
Dynamics Even though these methods are used for strategic assessment, they do not seem to allow for more dynamics than the limited parameterisation available from the underlying methods (such as LCA, see section 3.1). COMPLIMENT uses Environmental Performance Indicators (direct on-site environmental indicators) that are usually reported yearly to introduce a time dimension in the assessment.
SCOPE back to top
Sustainability aspects EEA integrates life cycle environmental aspects and total costs. SEEBALANCE and PROSA add social aspects to the picture. SustV is also applicable to the three pillars. ESSENZ also aims at a revisited eco-efficiency that also includes social aspects. COMPLIMENT focuses on environmental aspects, while the other index methods (LInX, CSID) consider the three aspects. Management methods (EcoD, POEMS) start with environmental aspects but aim at including all three.
Economic scope Company: SustV, CSDI; Production site / company: COMPLIMENT; Product: EEA, SEEBALANCE, PROSA, EcoD, POEMS, ESSENZ, LInX
Geographical scope When life cycle methods are used in the integrated methods, geographical boundaries should be as broad as necessary (i.e. international). The weighting system, on the other hand, may reflect geography-related subjective preferences.
Application field along the supply chain
Mainly optimization of management processes and of customer processes and products
Life cycle stages SustV is not a life cycle approach, the other methods aim at considering the entire life cycle.
Sectors There are several industrial applications of EEA, SEEBALANCE, SustV, in particular in the chemical industry.
RELEVANCE back to top
Relevance for decision making
SustV is limited to management and investment decisions. All the others address that and process development in the company as well as reporting of sustainability performance in the company.
Relevance for business sectors inside a company
These methods bare the same relevance as the sub-methods (esp. life cycle methods) that they combine: R&D, supply chain management, marketing, communication. They are additionally relevant for controlling and top-management.
Disclosure The RobecoSAM Corporate Sustainability Assessment (research arm of the DJSI) assesses the top 2500 companies with surveys that include such criteria as Environmental Management System / Reporting / Footprint, Operational
SAMT D1.1
36
Eco-Efficiency, Social Reporting etc. A company implementing an integrated assessment method logically would also match those criteria.
REQUIREMENTS back to top
Information systems See section 3.1 for info systems in life cycle methods. In addition capacity to conduct surveys or gather expert opinions for generating societal weighting factors.
Company internal data, supply chain data
See section 3.1 for data in life cycle methods. COMPLIMENT requires also Environmental Performance Indicators.
Commercial or public databases, maps
See section 3.1 for data in life cycle methods. In addition sectorial or macro-level data may be needed for normalising indicators prior to weighting and aggregating them.
Competences Trained personnel for conducting the assessment. But the integrated methods usually aim at generating an outcome that can be understood even without particular knowledge.
Organisation Besides the cornerstones motivated and competent staff, projects involving the right persons, sufficient technical capabilities, managerial decision-makers are crucial players to organise access to environmental and economic information and coordinate the use of adequate tools.
OUTCOME back to top
Examples of possible outcomes
Method-specific indicators (e.g. eco-efficiency portfolio in EEA, “value contribution” in SustV), index from existing indicators.
Environmental indicators Usual indicators are weighted and normalised. Can subsequently be aggregated.
Social indicators Usual indicators are weighted and normalised. Can subsequently be aggregated.
Economic indicators SustV delivers so-called “value contribution” indicators.
Output formats BASF’s EEA provides “Environmental fingerprints” (spider-diagrams showing the normalised and weighted pros and cons of the considered alternatives for different environmental categories) and “Eco-efficiency portfolio” (normalised environmental impacts plotted vs. normalised total costs shown). Other methods aim at outputting just one or a handful of indices (LInX, CSDI).
Labelling and certification The data collected and analyses generated in those methods can provide the basis for certification and labelling processes, although they are not directly associated with a particular label.
FURTHER INFORMATION back to top
Literature Literature references for life cycle methods can be found in Table 4 in

SAMT D1.1
37
Appendix 6.1.
Web

SAMT D1.1
38
3.4 Full LCA tools
GaBi, OpenLCA, SimaPro, TEAM, Umberto, SULCA,
CMLCA, RangeLCA, EASETECH, Brightway2
Back to Table of Content Wordcloud made from the above tools’ web pages
SUMMARY
The core functionality of existing full LCA tools remains to calculate environmental LCI and LCIA of
product models. These are then routinely used for resource and energy efficiency analysis,
benchmark studies, hot spot analysis in the supply chain or life cycle, in certification and labelling
processes etc. LCA tool providers often also are LCA consultants.
Several LCA tools (e.g. openLCA, SimaPro, GaBi, CMLCA) also support social parameters in product
models and are compatible with the Social Hotspots Database.
These tools also support user defined flows in product models, such as “cost flows”. They can
therefore be used for Life Cycle Costing.
With some work required from the user to define and enter weighting and normalising factors for
environmental, economic and social data outcomes similar to BASF’s Eco-Efficiency Analysis and
SEEBALANCE can be generated. Hence, these LCA tools are evolving towards tools implementing
integrated methods.
More complex hybrid methods are less readily implemented. CMLCA and to some extent SimaPro
let the user build hybrid EE-IOA/LCA models, where all ramifications in the economic system are
accounted for, whereas pure process models impose cut-offs. This is for advanced users, however,
usually researchers.
Hybrid LCA/economic models are not available, except for the openLCA plugin ProSuite Decision
System Support (ProSuite DSS) that enables an integrated assessment of life cycle environmental,
economic and social impacts of processes with regional and sectorial differentiation. The plugin (for
advanced users) includes micro and macro-economic models that assess the socio-economic impact
of the diffusion of a product at the macro-level.
TO THE STRUCTURED REVIEW (you can use the links in the column on the left)
ESSENCE Nature | Core idea | Status | Outcome | Complexity | Access | Updating | Replicability | Dynamics
SCOPE Sustainability | Economic | Geographical | Application fields | Life cycle | Sectors
RELEVANCE Decision making | Business sectors | Disclosure
REQUIREMENTS IT systems | Data (1) | Data (2) | Competences | Organisation
OUTCOME Examples | Environmental indicators | Social indicators | Economic indicators | Format | Labelling
and certification
INFORMATION Literature | Web

SAMT D1.1
39
ESSENCE back to top
Nature Tools (software). They all have a desktop version. Brightway2 additionally has a web interface. GaBi, SimaPro also exist in a server version.
Core idea Provide software-tools to implement ISO-conform LCA for use in R&D, product development, design, sustainability reporting, marketing, communication, operations / process / supply chain management and optimisation.
CMLCA also supports environmentally extended input-output analysis (EE-IOA) and hybrid EE-IOA/LCA (see section 3.2).
Status All tools are available and arguably established, even though they evidently have largely different market shares (for which we do not have numbers).
Outcome Quantitative results, including life cycle inventory (LCI) and life cycle impact assessment (LCIA).
Complexity Usually low to medium complexity according to the software providers. In fact, using these tools requires some prior training. Note: GaBi, SimaPro and Umberto have “light” versions marketed to non LCA experts; those are covered in section 3.5 “Simplified LCA tools”. Some tools offer the possibility for advanced users to tackle integrated and hybrid methods.
Access & costs Note that license fees for life cycle databases may come in addition. In some cases a database (e.g. ecoinvent) is included in the license fees. We do not consider here possible free education licenses of otherwise for purchase software. GaBi, SimaPro, Umberto actually come in different versions (with more or less complex features, with single or multi user licenses, with or without service contract) which makes for a large price range.
Free software: openLCA, CMLCA, Brightway2
License fees: GaBi (need to request a quote), SimaPro (4-30 kEUR/year), TEAM (need to request a quote), Umberto (need to request a quote), SULCA (need to request a quote)
Others: EASETECH (5 kEUR fees for mandatory training course, then software free to use), RangeLCA seems to be an in-house LCA software used by RDC Environment for consulting.
Updating All tools described here are under continuous development.
Replicability Complete and transparent documentation of life cycle models is necessary, even when using LCA software. Product models can usually be exported (different formats exist such as EcoSpold, ILCD, ELCD). In some cases there may still be compatibility issues between software thus hampering replicability. Free software does not have this problem (but one may still need to buy a database license).
Dynamics Essentially static tools. However, most tools allow for some level of parameterisation so that the user can build “what-if” scenarios by changing some assumptions in a model.

SAMT D1.1
40
SCOPE back to top
Sustainability aspects Primarily environmental aspects.
Social aspects are coming up in some tools: the Social Hotspots Database (works at a higher level of aggregation—product categories—than environmentally-focused product-level databases) can be loaded into openLCA, SimaPro; the GaBi database includes Life Cycle Working Environment Data measuring some social aspects of a product’s life cycle (e.g. qualified working time etc.). CMLCA also supports S-LCA calculations.
Because of the similarities between LCA and LCC (cost flows instead of physical flows), Life Cycle Costs can be performed in tools where the user can assign cost flows to processes and define a new impact category adding up the costs.
Economic scope These tools operate at the micro-level, i.e. product, process, or service. Key is the definition of the “functional unit” studied. It can be defined to analyse the life cycle effects of a production site. CMLCA supports hybrid EE-IOA/LCA, thus allowing for cross-sectorial connections.
Geographical scope Life cycle models a priori operate by definition with international boundaries (i.e. actually no geographical boundaries).
Application field along the supply chain
These tools can be used for technical process optimization, management process optimization, supply chain optimization, life cycle wide optimization.
Life cycle stages “Cradle to grave” is the ISO-compliant approach but parts of the life cycle can be also analysed separately.
Sectors The tool providers’ websites showcase a number of case studies coming from various sectors, including process industries.
RELEVANCE back to top
Relevance for decision making
LCA tools have been used to support process development inside a company, monitoring and reporting of sustainability performance. Their relevance in management and investment decisions improves with the on-going integration of LCC and S-LCA into the tools (approaching methods described in section “3.3 Integrated methods”). LCA tools can inform to some extent long-term, ex-ante development and management decisions but they lack built-in dynamics for long-term ex-ante assessment.
Relevance for business sectors inside a company
Relevant internally for R&D, supply chain management, certification, and towards the outside of the company in marketing, communications etc. Relevant for controlling and top-management when the tools are tweaked or extended to implement (part of) integrated or hybrid methods (sections 3.3 and 3.2).
Disclosure Specific tools are not required but LCAs are potential sources of information for reporting, or are requirements such as in the upcoming Product
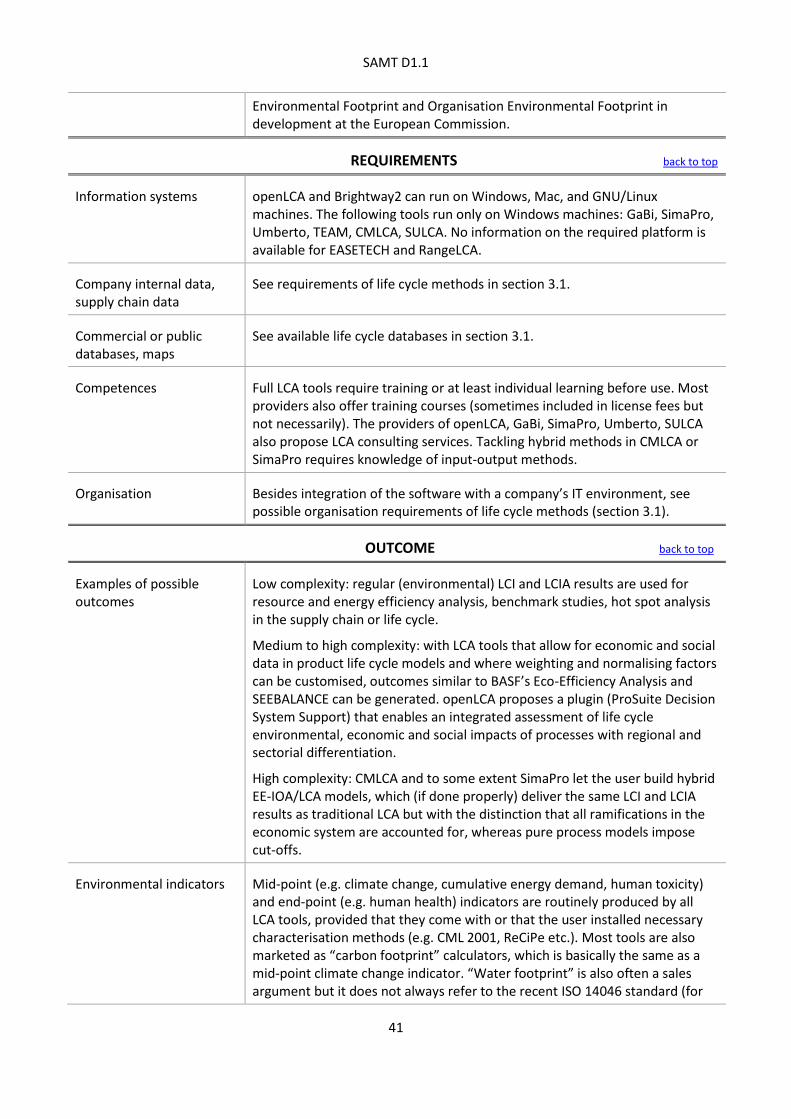
SAMT D1.1
41
Environmental Footprint and Organisation Environmental Footprint in development at the European Commission.
REQUIREMENTS back to top
Information systems openLCA and Brightway2 can run on Windows, Mac, and GNU/Linux machines. The following tools run only on Windows machines: GaBi, SimaPro, Umberto, TEAM, CMLCA, SULCA. No information on the required platform is available for EASETECH and RangeLCA.
Company internal data, supply chain data
See requirements of life cycle methods in section 3.1.
Commercial or public databases, maps
See available life cycle databases in section 3.1.
Competences Full LCA tools require training or at least individual learning before use. Most providers also offer training courses (sometimes included in license fees but not necessarily). The providers of openLCA, GaBi, SimaPro, Umberto, SULCA also propose LCA consulting services. Tackling hybrid methods in CMLCA or SimaPro requires knowledge of input-output methods.
Organisation Besides integration of the software with a company’s IT environment, see possible organisation requirements of life cycle methods (section 3.1).
OUTCOME back to top
Examples of possible outcomes
Low complexity: regular (environmental) LCI and LCIA results are used for resource and energy efficiency analysis, benchmark studies, hot spot analysis in the supply chain or life cycle.
Medium to high complexity: with LCA tools that allow for economic and social data in product life cycle models and where weighting and normalising factors can be customised, outcomes similar to BASF’s Eco-Efficiency Analysis and SEEBALANCE can be generated. openLCA proposes a plugin (ProSuite Decision System Support) that enables an integrated assessment of life cycle environmental, economic and social impacts of processes with regional and sectorial differentiation.
High complexity: CMLCA and to some extent SimaPro let the user build hybrid EE-IOA/LCA models, which (if done properly) deliver the same LCI and LCIA results as traditional LCA but with the distinction that all ramifications in the economic system are accounted for, whereas pure process models impose cut-offs.
Environmental indicators Mid-point (e.g. climate change, cumulative energy demand, human toxicity) and end-point (e.g. human health) indicators are routinely produced by all LCA tools, provided that they come with or that the user installed necessary characterisation methods (e.g. CML 2001, ReCiPe etc.). Most tools are also marketed as “carbon footprint” calculators, which is basically the same as a mid-point climate change indicator. “Water footprint” is also often a sales argument but it does not always refer to the recent ISO 14046 standard (for

SAMT D1.1
42
which regional specification of water use and emissions to water have to be considered).
Material Input Per Service (= Material Footprint) can also be calculated with any LCA tool that allows the user to import new impact methods. The Wuppertal Institute developed such an impact method for calculating MIPS with the ecoinvent database.
Social indicators Tools that support the Social Hotspots Database can help identify processes with significant worker-hours which are also at elevated risk relative to specific indicators relating to human rights, labour rights, health and safety, community impacts, and governance.
The GaBi database Life Cycle Working Environment (LCWE) data that can be used in the GaBi LCA tool for tracking of indicators such as qualified working time on the basis of seconds of labour per value added.
Economic indicators Several tools support Life cycle Costing where an economic life cycle inventory is generated in a currency unit.
Output formats Product models can usually be exported in different formats, such as EcoSpold, ILCD, ELCD.
Besides delivering LCI and LCIA result tables, all tools can provide outputs in graphical form, from “not 'fancy' just straight bar charts” in CMLCA to rich visualisations using the d3.js library in Brightway2.
Several tools feature customisable reports that are automatically updated when the life cycle model is changed.
Labelling and certification Used consistently together with rating tools’ and certificates’ guidelines and benchmarks, LCA tools can provide the basis for certification and labelling processes (for example Environmental Product Declarations according to ISO 14025, or the upcoming Product Environmental Footprint and Organisation Environmental Footprint in development at the European Commission).
FURTHER INFORMATION back to top
Literature
Web Links to full LCA tools can be found in Table 5 in Appendix 6.2.
Most common life cycle database formats:
EcoSpold: http://www.ecoinvent.org/data-providers/how-to-submit-data/ecospold2/
ILCD: http://eplca.jrc.ec.europa.eu/?page_id=140 ELCD: http://eplca.jrc.ec.europa.eu/ELCD3/

SAMT D1.1
43
3.5 Simplified LCA tools
CCaLC, ECO-it, Ecolizer, InstantLCA, EcoFly, Bilan
Product, GaBi Envision, SimaPro Compact, Umberto
NXT CO2
Back to Table of Content Wordcloud made from web pages for GaBi Envision, Umberto NXT CO2, CCaLC, and EcoFly
SUMMARY
We call the tools presented here “Simplified LCA tools” in contrast to “Full LCA tools” presented in
the previous section. These simplified tools aim at non-expert users (not LCA practitioners, not
environmental experts) who do not necessarily have the necessary technical knowledge required to
model in detail the process chain of a product. These tools are also aimed at situations where quick
insights into life cycle environmental impacts are preferred (for example in the product
development phase when designers have to make choices on materials to use, sourcing of
materials, manufacturing places, transport routes etc.).
Collecting primary data for a full LCA is notoriously time and labour intensive. These simplified tools
come with pre-calculated LCIA indicators for common materials, transport modes, processes etc.
The building blocks can be used in place of primary to test different design options for their
environmental impacts on the life cycle. This approach hampers transparency and replicability
somewhat, however.
The simplified LCA tools clearly focus on environmental aspects of the life cycle. Some are even
marketed primarily as carbon footprint calculators, even though they can often also calculate other
environmental impacts. Only CCaLC includes some economic parameters and also provides an
optimisation engine identifying optimum low-carbon options at minimum costs.
Note: worth mentioning but not reviewed here because it is not yet publicly available, WATERLILY is
a specialised ISO 14046 conform water footprint calculator developed by SUEZ environnement.
TO THE STRUCTURED REVIEW (you can use the links in the column on the left)
ESSENCE Nature | Core idea | Status | Outcome | Complexity | Access | Updating | Replicability | Dynamics
SCOPE Sustainability | Economic | Geographical | Application fields | Life cycle | Sectors
RELEVANCE Decision making | Business sectors | Disclosure
REQUIREMENTS IT systems | Data (1) | Data (2) | Competences | Organisation
OUTCOME Examples | Environmental indicators | Social indicators | Economic indicators | Format | Labelling
and certification
INFORMATION Literature | Web

SAMT D1.1
44
ESSENCE back to top
Nature Tools. Mostly desktop software. Ecolizer is an online tool. InstantLCA exists as a web portal for textile and footwear (online simplified LCA tool).
Core idea Provide turn-key software-tools with integrated pre-calculated LCIA for diverse commonly used materials, products and processes (e.g. transport) that can be easily assembled and swapped like building blocks to quickly generate life cycle indicators without the user having to collect all primary data.
Status All tools are available and arguably established, even though they evidently have largely different market shares (for which we do not have numbers).
Outcome The tools tend to focus on a limited number of LCIA indicators, in particular climate impact (carbon footprint) but other indicators are also available in some cases.
Complexity These tools are clearly marketed as “quick and easy” to use, targeted at non LCA experts.
Access & costs Note that license fees for life cycle databases may come in addition. In some cases a database (e.g. ecoinvent) is included in the license fees.
Free software: CCaLC, Ecolizer, Bilan Product
License fees: GaBi Envision (need to request a quote), SimaPro (6 kEUR/year), TEAM (need to request a quote), Umberto NXT CO2 (need to request a quote), ECO-it (no longer for sale), InstantLCA textile (5 kEUR/year), EcoFly (2-11 kEUR/year)
Updating All tools described here are under continuous development.
Replicability Using pre-calculated LCIA “building blocks” makes things easier but hampers transparency and thus replicability.
Dynamics Essentially static tools. However, they are also marketed as tools for “what-if scenarios” where e.g. different “building blocks” are successively tested in product development.
SCOPE back to top
Sustainability aspects Environmental aspects. None of the tools mentioned that they also support social or economic parameters (even though full fledged versions of GaBi, SimaPro, Umberto do support such parameters), except CCaLC that can account for “value added”.
Economic scope These tools operate at the micro-level, i.e. product, process, or service. Key is the definition of the “functional unit” studied. These tools are targeted at designers and other people (e.g. engineers) working with product development. It is unlikely that they would be used for modelling production sites. This would require full LCA tools.

SAMT D1.1
45
Geographical scope Life cycle models a priori operate by definition with international boundaries (i.e. actually no geographical boundaries).
Application field along the supply chain
These tools can be used in early-stage product development for testing the impact of different parameters (material selection, transport routes, processing options etc.) on the life cycle performance of a product, using pre-calculated data blocks for those components.
Life cycle stages Looking at the tools’ descriptions, it seems that they are mainly targeted at cradle-to-gate studies.
Sectors The tool providers’ websites showcase a number of case studies coming from various sectors. These simplified LCA tools, however, seem to be more directed at the manufacturing sector.
RELEVANCE back to top
Relevance for decision making
These tools can provide support for decisions in early-stage product development based on the environmental impact of different parameters (material selection, transport routes, processing options etc.) on the life cycle. CCaLC includes an optimisation model that enables identification of optimum low-carbon options at minimum costs.
Relevance for business sectors inside a company
Mainly R&D. Maybe marketing too.
Disclosure Generally, LCAs are potential sources of information for reporting.
REQUIREMENTS back to top
Information systems The following tools run only on Windows machines: CCaLC, GaBi Envision, SimaPro Compact, Umberto NXT CO2. EcoFly works on PC and Mac. Other tools (Ecolizer, Bilan Product) are web-based.
Company internal data, supply chain data
See requirements of life cycle methods in section 3.1. The purpose of simplified LCA tools is also, however, to reduce the need for data collection by relying on pre-calculated building blocks.
Commercial or public databases, maps
See existing life cycle databases in section 3.1. However, most of the tools will support only ecoinvent or have their own datasets of pre-calculated building blocks.
Competences Tool providers market their simplified LCA product to non environmental experts who, however, want to introduce life cycle thinking in their work flow (e.g. product design).
Organisation Besides integration of the software with a company’s IT environment, see possible organisation requirements of life cycle methods (section 3.1.).
OUTCOME back to top

SAMT D1.1
46
Examples of possible outcomes
Remarkably, LCI is not advertised as an output for these simplified LCA tools. LCIA results are usually used for testing the environmental impacts of different design options in product development (what-if scenarios). The field of application seems therefore more specific than in the case of full LCA tools.
CCaLC can also calculate optimum low-carbon product design options at minimum costs.
Environmental indicators All tools prominently calculate carbon footprint. Most can also generate usual LCIA indicators (e.g. through ReCiPe characterisation methods).
Social indicators Seem not to be available.
Economic indicators Not available (except value added in CCaLC).
Output formats Similarly to full LCA tools, these simplified tools usually offer visualisation of life cycle environmental impacts and customisable reports.
Labelling and certification LCA tools can provide the basis for certification and labelling processes, however, a full LCA is probably more appropriate (depends on the certificate’s guidelines).
FURTHER INFORMATION back to top
Literature
Web Links to simplified LCA tools can be found in Table 5 in Appendix 6.2.
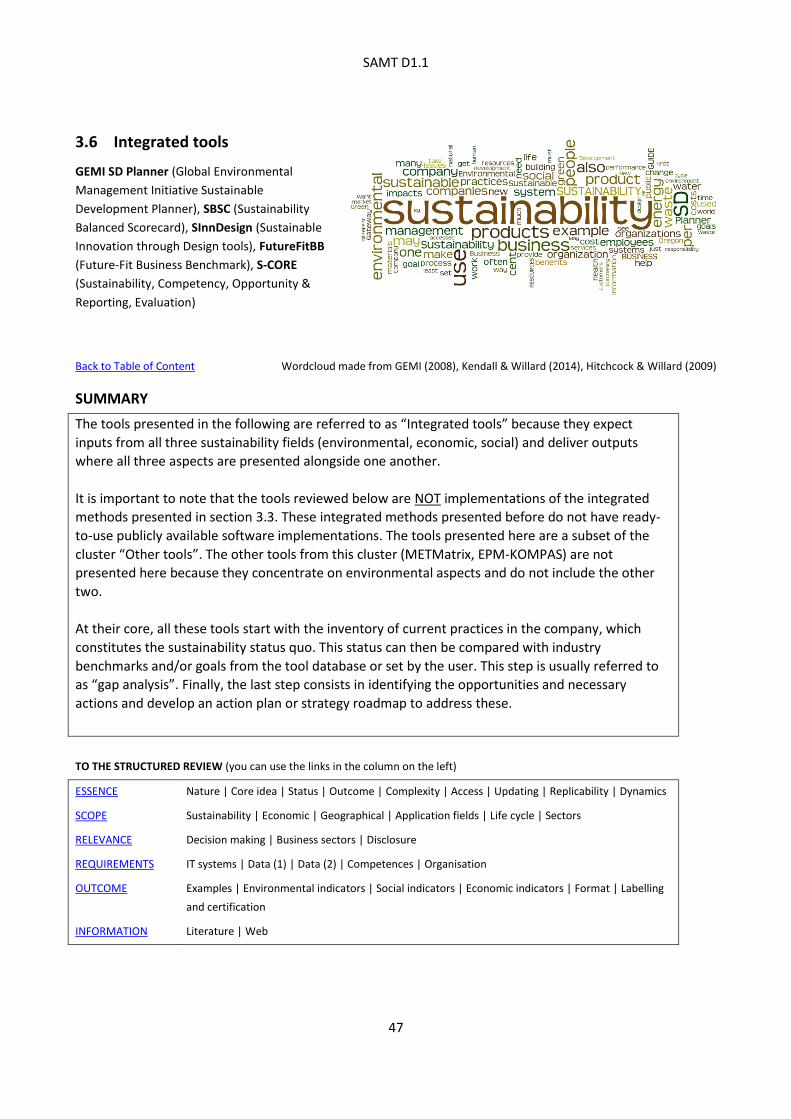
SAMT D1.1
47
3.6 Integrated tools
GEMI SD Planner (Global Environmental
Management Initiative Sustainable
Development Planner), SBSC (Sustainability
Balanced Scorecard), SInnDesign (Sustainable
Innovation through Design tools), FutureFitBB
(Future-Fit Business Benchmark), S-CORE
(Sustainability, Competency, Opportunity &
Reporting, Evaluation)
Back to Table of Content Wordcloud made from GEMI (2008), Kendall & Willard (2014), Hitchcock & Willard (2009)
SUMMARY
The tools presented in the following are referred to as “Integrated tools” because they expect
inputs from all three sustainability fields (environmental, economic, social) and deliver outputs
where all three aspects are presented alongside one another.
It is important to note that the tools reviewed below are NOT implementations of the integrated
methods presented in section 3.3. These integrated methods presented before do not have ready-
to-use publicly available software implementations. The tools presented here are a subset of the
cluster “Other tools”. The other tools from this cluster (METMatrix, EPM-KOMPAS) are not
presented here because they concentrate on environmental aspects and do not include the other
two.
At their core, all these tools start with the inventory of current practices in the company, which
constitutes the sustainability status quo. This status can then be compared with industry
benchmarks and/or goals from the tool database or set by the user. This step is usually referred to
as “gap analysis”. Finally, the last step consists in identifying the opportunities and necessary
actions and develop an action plan or strategy roadmap to address these.
TO THE STRUCTURED REVIEW (you can use the links in the column on the left)
ESSENCE Nature | Core idea | Status | Outcome | Complexity | Access | Updating | Replicability | Dynamics
SCOPE Sustainability | Economic | Geographical | Application fields | Life cycle | Sectors
RELEVANCE Decision making | Business sectors | Disclosure
REQUIREMENTS IT systems | Data (1) | Data (2) | Competences | Organisation
OUTCOME Examples | Environmental indicators | Social indicators | Economic indicators | Format | Labelling
and certification
INFORMATION Literature | Web

SAMT D1.1
48
ESSENCE back to top
Nature Tools of different kinds: web-based planning and benchmark software (GEMI SD Planner, S-CORE), table-based guidance to sustainability management (SBSC), text-based benchmarks (FutureFitBB). SInnDesign promises a set of tools but it is not yet clear what form they will take.
Core idea Core ideas common to all these tools (but implemented in widely different ways) are the ability to compare a company’s sustainability performance to benchmarks, set sustainability goals for the company, and plan to get there.
Status Available, except SInnDesign tools that are still in the testing phase and not yet publicly available.
Outcome All these tools generate qualitative results. None of these tools perform quantitative calculations by themselves but they may use results from other methods/tools.
Complexity Low to medium. The tools are not “plug-and-play”. Using them requires to—at least—get acquainted with their documentation.
Access & costs GEMI SD Planner, SBSC, FutureFitBB are available free of charge. SInnDesign will apparently follow this model too.
Using S-CORE requires the user to work with an “assessor” (S-CORE administrators who went through the training process and have been licensed to use S-CORE).
Updating All tools seem to be supported, although it is not always clear how often future updates are to be expected.
Replicability All the tools involve qualitative descriptions and guided subjective assessments throughout, which makes replicability an issue if all steps and decisions are not thoroughly documented.
Dynamics These tools are planning / management tools, therefore also looking into the future. Dynamics, however, are implemented at a qualitative level.
SCOPE back to top
Sustainability aspects These tools address all three sustainability aspects (environmental, economic, social)
Economic scope These tools are mainly used at the company level (except SInnDesign, apparently more at the product level).
Geographical scope Different parts of the assessments conducted with the tools have different geographical scopes but in all cases, there is at some point an international perspective (e.g. through an organisation’s operations in foreign countries, through life cycle considerations in product development etc.)

SAMT D1.1
49
Application field along the supply chain
Company-wide sustainability planning and management.
Life cycle stages FutureFitBB insists on a cradle-to-grave approach, also mentions cradle-to-cradle as a possible goal. Other tools do not have as strong a life cycle approach.
Sectors GEMI has members from the chemical and oil sectors, logistics, manufacturing, agriculture etc. S-CORE has clients among municipalities, transport and power utility companies, and service sector companies (e.g. insurances). SBSC is the result of an academic research project and it is not clear where it has been applied. FutureFitBB is just starting out, SInnDesign is still in test phase, there is no further information on concrete applications.
RELEVANCE back to top
Relevance for decision making
The tools help to establish sustainability goals and action plans for a company, hence they support management and long-term development decisions (but the tools do not output the “best” decisions to be made, e.g. through some optimisation model, the user has to weigh the trade-offs and decide based on the qualitative indications given by the tools).
Relevance for business sectors inside a company
Controlling and management, mainly. SInnDesign and FutureFitBB may also be relevant for R&D, supply chain management.
Disclosure Categories asked for by the tools for sustainability status assessment, benchmark etc. are similar to some of the categories in disclosure schemes.
REQUIREMENTS back to top
Information systems No particular information system required.
Company internal data, supply chain data
Qualitative data is required, which implies a good understanding of a company’s product portfolio, operations, management systems etc.
Commercial or public databases, maps
Not directly relevant.
Competences No particular competence required except a broad knowledge of the company.
Organisation No particular structure required, but implementing those tools does require commitment from (top-)management to work.
OUTCOME back to top
Examples of possible outcomes
Structured self-evaluation of sustainability performance, including gap analysis against benchmarks. Development of a sustainability strategy, including goal setting, roadmap for actions etc.
Environmental indicators No quantitative indicator. S-CORE, however, calculates rankings (or scores) for

SAMT D1.1
50
different performance areas (e.g. resource conservation, toxics, climate).
Environmental elements in GEMI SD Planner (further detailed in sub-elements): impact minimisation, natural resource protection.
Social indicators No quantitative indicator. S-CORE, however, calculates rankings (or scores) for different performance areas (e.g. public health, community, governance).
Social elements in GEMI SD Planner (further detailed in sub-elements): employee well-being, quality of life, business ethics.
Economic indicators No quantitative indicator. S-CORE, however, calculates rankings (or scores) for different performance areas (e.g. financial return, purchase power, job creation).
Economic elements in GEMI SD Planner (further detailed in sub-elements): shareholder value creation, economic development.
Output formats GEMI SD Planner and S-CORE offer online dashboards where the user can see his sustainability status (inventory of current practices) and compare it graphically (gap analysis) to set goals and benchmarks. Output from other tools (SBSC, FutureFitBB) depend on how the user concretely implements the text- and table-based guidelines and benchmarks.
Labelling and certification Describing which processes or products are certified can be an input to the tools; or aiming at a label or certification can be an outcome of the tools (as a sustainability goal).
FURTHER INFORMATION back to top
Literature Documentation for the tools:
GEMI SD Planner: GEMI (2008)
SBSC: Hahn & Wagner (2001)
FutureFitBB: Kendall & Willard (2014)
S-CORE: Hitchcock & Willard (2009)
Web Links to integrated tools can be found in the last part of Table 5 (in the cluster “Other tools”) in Appendix 6.2.

SAMT D1.1
51
4 Conclusions and recommendations
4.1 Main conclusions
Although our review is not exhaustive, it yielded a long list of methods (51) and tools (38) for sustainability
assessment. A number of others were also considered but did not make it to the final list. Some, such as
Material Flow Analysis or Substance Flow Analysis, were not further considered because they are macro-
level methods that are mostly relevant for evidence-based policy making, even though they may one day
help broaden life cycle methods (Jeswani et al. 2010)13. Others such as the RobecoSAM Corporate
Sustainability Assessment (research arm of the Dow Jones Sustainability Indices) build up surveys and
indices that compile insights that companies (the top 2500 companies in that particular case) have gained
through their environmental management system, footprint and/or eco-efficiency calculations, social
reporting etc. In some way, it is a result aggregator that comes on top of the methods and tools presented
in this report.
The aim of this review is not to provide a pseudo statistical/quantitative analysis of the different types and
characteristics of the methods and tools that we selected. Instead, it wants to provide two things. First, we
hope that this review provides a useful overview of what is available so that company representatives do
not have to go through the hassle themselves to search and sort out that many methods and tools. Second,
this review allows us to identify both the main patterns and interesting outliers in this method and tool
population. The latter are at the forefront of method and tool development, in particular when it comes to
integrating all aspects of sustainability.
It is clear from the review that the life cycle perspective is pervasive both among methods and tools.
Another obvious pattern is that the chemical sector has a number of methods and corresponding tools of
its own. Since these are very specific, we do not address them further here. Many tools claim to implement
the LCA method. Complex tools require the user to understand the different steps of a life cycle
assessment, from defining the system boundaries, functional unit, to generating the inventory and impact
assessment. Simplified tools appeal to non-expert and propose pre-calculated building blocks for standard
products and materials that can be hooked up together to quickly estimate life cycle indicators for a
product. Most simplified LCA tools used the commercial database ecoinvent14 to pre-calculate data blocks.
Ecoinvent is also a popular choice for analysts using full LCA tools.
Despite the fact that the ecoinvent database underlies many of them, life cycle analyses (full or simplified)
done with different tools or even the same tool but by different people are not directly compatible or
comparable. A prerequisite for comparability would be full transparency of the models and assumptions.
Even then some further (possibly complex) harmonisation would almost certainly be needed before
comparison. Full transparency is basically impossible with simplified LCA tools because the user do not
know by design the assumptions (e.g. background energy mix used etc.) made when calculating the
building blocks she is using. Such building blocks are typically available for common materials (such as
metals, plastics, paper, board, glass), transport modes, energy sources etc.
13
EASETECH is a full LCA tool with a strong material flow modelling component, i.e. flows between processes are modelled and represented as “as a mix of material fractions with different properties and flows in terms of mass and composition”. 14
http://www.ecoinvent.ch/

SAMT D1.1
52
Some of the simplified LCA tools may explicitly implement life cycle methods limited to a single indicator
(such as carbon footprint, water footprint15 etc.). This contrasts with the (very) long list of impact categories
available from characterisation methods such as ReCiPe16 that are generally used in full LCA tools.
Over the past decade or so, hybrid methods became state-of-the-art in academic life cycle studies (Suh &
Huppes 2005). Such methods aim at a more complete coverage of environmental effects along the life cycle
by combining detailed process-based classical LCA with environmentally-extended input-output analysis
that covers the interlinkages between all sectors of the economic system. Input-output analysis can also
give insights into socio-economic spill-overs between sectors. These methods are quite complex and a
number of variants exist. To our knowledge most hybrid studies to date are conducted with ad-hoc
programmes that the researchers themselves develop. Hybrid methods are still far from being easily
accessible in publicly available tools. CMLCA implements hybrid EE-IOA/LCA, but it is targeted at scientists
rather than consultants or companies. SimaPro comes with some input-output databases (but no Multi-
Regional-IO unlike CMLCA) and allows advanced users to conduct hybrid EE-IOA/LCA.
There is a relatively high number of methods generating (life cycle) cost indicators. There are, however,
comparatively fewer tools that implement these methods. Life Cycle Costing (LCC) is an exception since it is
implemented in most full LCA tools (e.g. openLCA, SimaPro, GaBi, Umberto, CMLCA). It usually requires the
user to define her own “cost flows”. It also considerably increases the amount of data needed. Note that
simplified LCA tools usually do not go beyond environmental effects, except CCaLC that can also explicitly
track economic parameters (value added).
Methods generating (life cycle) social indicators are rather rare. Social LCA (S-LCA) is, however, gaining
traction in full LCA tools. One main obstacle so far seemed to be that, contrary to environmental indicators,
there was no database of the size and popularity of ecoinvent that would provide a basis for calculating
economic and social life cycle indicators with popular tools. This may be changing with databases such as
the Social Hotspot Database that is proposed (against a license fee) in an increasing number of full LCA
tools (e.g. openLCA, SimaPro, GaBi, CMLCA).
A number of composite and integrated methods try to concatenate or even merge methods generating (life
cycle) environmental, economic, and social indicators. Such methods require a qualified personnel with a
good understanding of the different approaches. Companies (such as BASF with Eco-Efficiency Analysis and
SEEBALANCE) using such methods have their own software solutions for it. To our knowledge, there is no
turn-key program available to the general public. It is possible, however, for advanced users of e.g.
openLCA, SimaPro, CMLCA to conduct EEA and possibly SEEBALANCE calculations. These LCA tools are thus
evolving towards tools implementing integrated methods.
Integrated methods were developed explicitly to support decision-making. These methods generally deliver
weighted indicators or indices as output. This requires the user to define and enter weighting and
normalising factors for environmental, economic and social data outcomes. There is to date no standard to
15
One has to be cautious that not all tools advertised as water footprint calculators can actually deliver according to ISO 14046, which requires more than, say, the ReCiPe midpoint impact category Water Depletion Potential. Not reviewed in this report because it is not yet publicly available, WATERLILY is a specialised ISO 14046 conform water footprint calculator developed by SUEZ environnement that has been recently released for internal use at the company. 16
http://www.lcia-recipe.net/

SAMT D1.1
53
frame this step. A number of participatory approaches exist to deal with this aspect. However, it introduces
additional uncertainties and subjectivity to the process, which would in turn require even more
transparency to ensure replicability.17
Finally, close to all methods and tools reviewed are decidedly micro-level. Life cycle approaches use per
definition global system boundaries but usually applied to a micro-level functional unit. A vertical
integration from the company’s product level to the entire economic system is usually not possible. It is
also very complex. In a nutshell, such an approach is often referred to as consequential LCA (C-LCA). This
requires plugging an LCA and an economic model together. A number of academic models do that but they
are not accessible to the general public. There exists, however, the ProSuite DSS (Decision Support System)
plugin for openLCA (includes ProSuite Midpoint and Endpoint impact assessment method, including
normalization factors). It integrates environmental, economic, and social aspects with regional and sectorial
differentiation. It includes micro and macro-economic models (to date with some limitations in sectorial
scope) that assess the socio-economic impact of the diffusion of a product at the macro-level. This, of
course, requires market research and assumptions on the expected diffusion of the studied product. This
means, of course, more data, more uncertainties, and a more complex model. But it is as close as it gets to
a horizontally (environmental, economic, social aspects) and vertically (product micro-level, inter-sectorial
meso-level, and entire economy macro-level) integrated publicly available tool.
The next steps of the project will have to decide which of the options above, combinations thereof, or
additional in-house methods and tools that come up in the interviews could meet the needs of the process
industries for sustainability assessment. There is certainly no “one size fits all” solution for all economic
sectors. Whether such a solution exists for the process industries is an open question.
4.2 Future research needs
Our review further highlights already known research needs for the area of sustainability assessment in
general. Firstly, there are not yet standardised weighting and aggregation methods and their
implementation in practical tools. They play a central role in integrated methods supporting decision
making where trade-offs between environmental, economic, and social objectives have to be dealt with.
Secondly, most potent methods (integrated or hybrid) for supporting decision making still lack tool
implementations that would make these complex methods manageable for small and medium-sized
enterprises. Thirdly, dealing with data uncertainties (reference areas, reference years, assumptions on the
future etc.) goes in hand in hand with the capacity to evaluate the meaningfulness of sustainability
assessment results. This particular aspect needs to be seamlessly integrated and streamlined between
databases, methods, and tools.
The next tasks and work packages planned in the SAMT project cover the immediate further research
needs. Those are of at least three types.
17
Generally, besides the availability of tools (software) the question of available databases (e.g. regionally specific social and environmental data; weighting and normalisation factors for integrated assessments) is very relevant for companies that cannot rely only on primary environmental and social data and generate their own weighting and normalisation factors through participatory processes. Where applicable, we have pointed out in the reviews which databases are available.

SAMT D1.1
54
First, of all the methods and tools that we reviewed probably a small number is actually frequently used in
the process industries. In turn, additional in-house tools that did not make it into our selection may be used
in practice. This review hopefully provides our industry partners with new information on methods and
tools. The next step (Task 1.2 of the project) will be to gather information from the industrial actors on their
actual practice with and their expectation from sustainability assessment methods and tools.
Second, this report presents methods and tools in a structured way but without judging their intrinsic
value. Considering the expectations of the industry and prioritising some key criteria (e.g. ability to support
decision-making; cross-sectorial implementation), known methods and tools need to be systematically
ranked. In that way the most adequate methods and tools would emerge, or at least those with the highest
potential. This work is planned in WP2.
Third, a plan is needed to realise the potential identified in the best ranked methods and tools. The goal
beyond the SAMT project is to eventually develop a consistent set of sustainability assessment methods
and tools to be used in the process industries. WP3 is going to build on the previous steps to work out an
implementation strategy on the way to reach that goal.

SAMT D1.1
55
5 References
Anastas, P.T. & Warner, J.C., 2000. Green Chemistry: Theory and Practice Revised., Oxford England; New
York: Oxford University Press, U.S.A.
Azapagic, A. & Clift, R., 1999. Life cycle assessment and multiobjective optimisation. Journal of Cleaner
Production, 7(2), pp.135–143.
Azapagic, A. & Clift, R., 1998. Linear programming as a tool in life cycle assessment. The International
Journal of Life Cycle Assessment, 3(6), pp.305–316.
Beaver, E. 2000. LCA and Total Cost Asessment. Environmental Progress, 19. 130-139.
Constable, D. J. C., Curzons, A. D., Cunningham, V. L. 2002. Metrics to 'green' chemistry - which are best? Green Chemistry, 4. 521-527.
Cornelissen, R. 1997. Thermodynamics and sustainable development - The use of exergy analysis and the reduction of irreversibility. Ph. D. Dissertation, University of Twente.
Curkovic, S. and Sroufe, R. 2007. Total Quality Environmental Management and Total Cost Assessment: An exploratory study. Int. Journal of Production Economics, 105. 560-579.
De Bakker, F.G.A., Fisscher, O.A.M. & Brack, A.J.P., 2002. Organizing product-oriented environmental
management from a firm’s perspective. Journal of Cleaner Production, 10(5), pp.455–464.
Van Berkel, R., van Kampen, M. & Kortman, J., 1999. Opportunities and constraints for Product-oriented
Environmental Management Systems (P-EMS). Journal of Cleaner Production, 7(6), pp.447–455.
De Bruijn, H., van Duin, R. & Huijbregts, M.A.J., 2002. Handbook on Life Cycle Assessment J. B. Guinee et al.,
eds., Dordrecht: Springer Netherlands. Available at: http://link.springer.com/10.1007/0-306-48055-7
[Accessed April 11, 2015].
De Meester, B., Dewulf, J., Van Langenhove H. 2006. eXoinvent: the exergy of ecoinvent reference flows (version 1.0). Ghent, Belgium: Ghent University.
Dangelico, R.M. & Pontrandolfo, P., 2010. From green product definitions and classifications to the Green
Option Matrix. Journal of Cleaner Production, 18(16–17), pp.1608–1628.
DBU, SEG. 2006. Sustainable Excellence: Exzellent führen – nachhaltig handeln. Konzeption, Umsetzung und Praxis-Erfahrungen für die Führung. Deutsche Budesstiftung Umwelt, Sustainable Excellence Group.
Dewulf, J. & Langenhove, H.V., 2006. Renewables-Based Technology: Sustainability Assessment, John Wiley
& Sons.
Donnelly, K. et al., 2006. Eco-design implemented through a product-based environmental management
system. Journal of Cleaner Production, 14(15–16), pp.1357–1367.
Earles, J.M. & Halog, A., 2011. Consequential life cycle assessment: a review. The International Journal of
Life Cycle Assessment, 16(5), pp.445–453.
EC. 1995. ExternE. Externalities of Energy. Vol. 2: Methodology. European Comission, Directorate-General
XII: Science, Research and Development. Brussels-Luxembourg.

SAMT D1.1
56
Ellram, L. M. 2002. Total Cost of ownership. In: Handbuch Industrielles Beschaffungsmanagement. 659-671. Gabler Verlag, Wiesbaden.
Figge, F. & Hahn, T., 2004. Sustainable Value Added—measuring corporate contributions to sustainability
beyond eco-efficiency. Ecological Economics, 48(2), pp.173–187.
Figge, F. & Hahn, T., 2005. The Cost of Sustainability Capital and the Creation of Sustainable Value by
Companies. Journal of Industrial Ecology, 9(4), pp.47–58.
Fijał, T., 2007. An environmental assessment method for cleaner production technologies. Journal of
Cleaner Production, 15(10), pp.914–919.
Finnveden, G. & Moberg, Å., 2005. Environmental systems analysis tools – an overview. Journal of Cleaner
Production, 13(12), pp.1165–1173.
Freire, F. et al., 2002. Life Cycle Activity Analysis and the Case Study of Plastic Panels. In S. A. Thore, ed.
Technology Commercialization: DEA and Related Analytical Methods for Evaluating the Use and
Implementation of Technical Innovation. Springer Science & Business Media, pp. 323–352.
Friedrich R. 2011. The “ExternE” methodology for assessing the eco-efficency of technologies. Journal of industrial Ecology 15 (5), 668-671.
GEMI, 2008. GEMI SD PlannerTM & SD Gateway User Manual, Washington, DC.
Grießhammer, R. et al., 2007. PROSA – Product Sustainability Assessment, Freiburg, Germany: Öko-Institut
e.V.
Hahn, T. & Wagner, M., 2001. Sustainability Balanced Scorecard - Von der Theorie zur Umsetzung,
University of Lueneburg: Center for Sustainability Management.
Hermann, B.G., Kroeze, C. & Jawjit, W., 2007. Assessing environmental performance by combining life cycle
assessment, multi-criteria analysis and environmental performance indicators. Journal of Cleaner
Production, 15(18), pp.1787–1796.
Hitchcock, D. & Willard, M., 2009. The Business Guide to Sustainability: Practical Strategies and Tools for
Organizations Revised., London ; Sterling, VA: Earthscan.
Hunkeler, D., Lichtenvort, K. & Rebitzer, G., 2008. Environmental Life Cycle Costing, CRC Press.
IChemE. 2002. Sustainable Development Progress Metrics. Institution of Chemical Engineers.
ISO 14040:2006, Environmental management - Life cycle assessment - Principles and framework, Geneva,
Switzerland: International Organization for Standardization.
ISO 14044:2006, Environmental management - Life cycle assessment - Requirements and guidelines,
Geneva, Switzerland: International Organization for Standardization.
ISO 14046:2014, Environmental management - Water footprint - Principles, requirements and guidelines,
Geneva, Switzerland: International Organization for Standardization.
ISO/TS 14067:2013, Greenhouse gases - Carbon footprint of products - Requirements and guidelines for
quantification and communication, Geneva, Switzerland: International Organization for Standardization.

SAMT D1.1
57
Jeswani, H.K. et al., 2010. Options for broadening and deepening the LCA approaches. Journal of Cleaner
Production, 18(2), pp.120–127.
Jung, E.J., Kim, J.S. & Rhee, S.K., 2001. The measurement of corporate environmental performance and its
application to the analysis of efficiency in oil industry. Journal of Cleaner Production, 9(6), pp.551–563.
Karlsson, R. & Luttropp, C., 2006. EcoDesign: what’s happening? An overview of the subject area of
EcoDesign and of the papers in this special issue. Journal of Cleaner Production, 14(15–16), pp.1291–1298.
Kendall, G. & Willard, B., 2014. Future - Fit Business Benchmark: Equipping business leaders and investors
with the means to quantify how their actions are contributing to a flourishing future, 3D Investment
Foundation and The Natural Step Canada.
Khan, F.I., Sadiq, R. & Veitch, B., 2004. Life cycle iNdeX (LInX): a new indexing procedure for process and
product design and decision-making. Journal of Cleaner Production, 12(1), pp.59–76.
Kolsch, D. et al., 2008. How to measure social impacts? A socio-eco-efficiency analysis by the SEEBALANCE®
method. International Journal of Sustainable Development, 11(1), p.1.
De Koning, H., De Mast, J., 2006. A rational reconstruction of Six Sigma’s Breakthrough Cookbook. International Journal of Quality and Reliability Management 23 (7), 766–787.
Krajnc, D. & Glavič, P., 2005. A model for integrated assessment of sustainable development. Resources,
Conservation and Recycling, 43(2), pp.189–208.
Krotscheck, C. & Narodoslawsky, M., 1996. The Sustainable Process Index a new dimension in ecological
evaluation. Ecological Engineering, 6(4), pp.241–258.
Linder, M., Suominen, T., Palosuo, T., Garcia-Gonzalo, J., Verweij, P., Zudin, S., Päivinen, R. 2010. ToSIA- A tool for sustainability impact assessment of forest-wood-chains. Ecological Modelling, 221. 2197-2205.
Linderman, K., Schroeder, R. G., Zaheer, S., Choo, A. S. 2003. Six Sigma: a goal-theoretic perspective. Journal of Operation, 21. 193-203.
Mendoza, G.A., Prabhu, R., 2003. Qualitative multi-criteria approaches to assessing indicators of sustainable
forest resource management. Forest Ecol. Manage. 174, 329–343.
Munda, G., Nijkamp, P., Rietveld, P., 1994. Qualitative multicriteria evaluation for environment management. Ecol. Econ. 10, 97– 112.
Ness, B. et al., 2007. Categorising tools for sustainability assessment. Ecological Economics, 60(3), pp.498–
508.
Odum, H. T. 1996. Environmental accounting: Emergy and environmental decision making. New York: John Wiley and Sons, Inc.
Onischka, M., Ritthoff, M., Liedtke C., 2008. Instrumentenwegweiser zur Steigerung der Ressourceneffizienz. Wuppertal Institut für Klima, Umwelt und Energie.
Pande, P.S., Neuman, R.P., Cavangh, R.R., 2000. The Six Sigma Way: How GE, Motorola, and Other Top Companies Are Honing Their Performance, McGraw Hill, NY.
RISE (Response-Inducing Sustainability Evaluation), version 2.0. 2012. What is RISE? Bern University of Applied Sciences
SAMT D1.1
58
Ritthoff, M., Rohn, H. & Liedtke, C., 2002. Calculating MIPS : resource productivity of products and services,
Wuppertal: Wuppertal Inst. for Climate, Environment and Energy. Available at:
http://epub.wupperinst.org/frontdoor/index/index/docId/1577 [Accessed February 5, 2015].
Robèrt, K.-H. et al., 2002. Strategic sustainable development — selection, design and synergies of applied
tools. Journal of Cleaner Production, 10(3), pp.197–214.
Sala, S., Farioli, F. & Zamagni, A., 2013a. Life cycle sustainability assessment in the context of sustainability
science progress (part 2). The International Journal of Life Cycle Assessment, 18(9), pp.1686–1697.
Sala, S., Farioli, F. & Zamagni, A., 2013b. Progress in sustainability science: lessons learnt from current
methodologies for sustainability assessment: Part 1. The International Journal of Life Cycle Assessment,
18(9), pp.1653–1672.
Saling, P. et al., 2002. Eco-efficiency analysis by basf: the method. The International Journal of Life Cycle
Assessment, 7(4), pp.203–218.
Saurat, M. & Ritthoff, M., 2013. Calculating MIPS 2.0. Resources, 2(4), pp.581–607.
Schneider, L. et al., 2013. The economic resource scarcity potential (ESP) for evaluating resource use based
on life cycle assessment. The International Journal of Life Cycle Assessment, 19(3), pp.601–610.
Sheldon, R.A., 2007. The E Factor: fifteen years on. Green Chemistry, 9(12), pp.1273–1283.
Singh, R.K. et al., 2009. An overview of sustainability assessment methodologies. Ecological Indicators, 9(2),
pp.189–212.
Suh, S. & Huppes, G., 2005. Methods for Life Cycle Inventory of a product. Journal of Cleaner Production,
13(7), pp.687–697.
Swarr, T.E. et al., 2011. Environmental Life Cycle Costing: A Code of Practice, Society of Environmental
Toxicology and Chemistry.
Trost, B. M. 1995. Angew. Chem. Int. Ed., 34. 259-281.
Turner, R. K., Pearce, D., Bateman, I. 1994. Environmental economics, an elementary introduction. Harvester Wheatsheaf.
UNEP, 2009. Guidelines for Social Life Cycle Assessment of Products - Social and socio-economic LCA
guidelines complementing environmental LCA and Life Cycle Costing, contributing to the full assessment of
goods and services within the context of sustainable development, UNEP/SETAC Life Cycle Initiative.
UNEP, 2013. The Methodological Sheets for Subcategories in Social Life Cycle Assessment (S-LCA),
UNEP/SETAC Life Cycle Initiative.
White, A. L., Savage D., Shapiro, K. 1996. Life-cycle costing: concepts and applications. In: Curran, M. A., editor. Environmental life cycle assessment. New York: McGraw-Hill.

SAMT D1.1
59
6 Appendices
6.1 List of methods for sustainability assessment
The table below presents the full list of methods that we considered in our review. Method clusters are separated by horizontal double lines. The clusters
are, from top to bottom: Life cycle-related methods; Hybrid methods; Integrated methods; Methods focusing on costs; Methods specific to the chemical
industry; Methods specific to the agricultural, forestry and food sectors; Other methods. The last column proposes some literature references for each
method. We tried to select the most important and/or seminal references for each method (to avoid a table bloated with too many references) but without
a proper bibliometric study, it is not always clear which those are.
Table 4: Methods for sustainability assessment (short names, full names, literature sources)
SHORT NAME FULL NAME LITERATURE
LCA Life Cycle Assessment ISO 14040:2006, ISO 14044:2006, de Bruijn et al. (2002)
MIPS Material Input Per Service Saurat & Ritthoff (2013), Ritthoff et al. (2002)
S-LCA Social Life Cycle Assessment UNEP (2009), UNEP (2013)
E-LCC Environmental Life Cycle Costing Hunkeler et al. (2008), Swarr et al. (2011)
CED Cumulative Energy Demand VDI 4600: 2012
E-LCA Exergetic Life Cycle Assessment, Exergy analysis De Meester et al. (2006), Cornelissen (1997)
EA Emergy analysis Odum (1996)
CF Carbon Footprint ISO/TS 14067:2013
WF Water Footprint ISO 14046:2014
EF Ecological footprint Krotscheck & Narodoslawsky (1996)
EE-IOA/LCA Hybrid environmentally extended input-output analysis and LCA Suh & Huppes (2005)
LCA/PEM Hybrid LCA + partial equilibrium model Earles & Halog (2011)
EE-IOA/LCA/GEM Hybrid EE-IOA/LCA + General Equilibrium Model Earles & Halog (2011)
LCO Life Cycle Optimisation Azapagic & Clift (1999), Azapagic & Clift (1998)
LCAA Life Cycle Activity Analysis Freire et al. (2002)
EEA Eco-Efficiency Analysis Saling et al. (2002), https://www.basf.com/en/company/sustainability/management-and-instruments/quantifying-sustainability/eco-efficiency-analysis.html
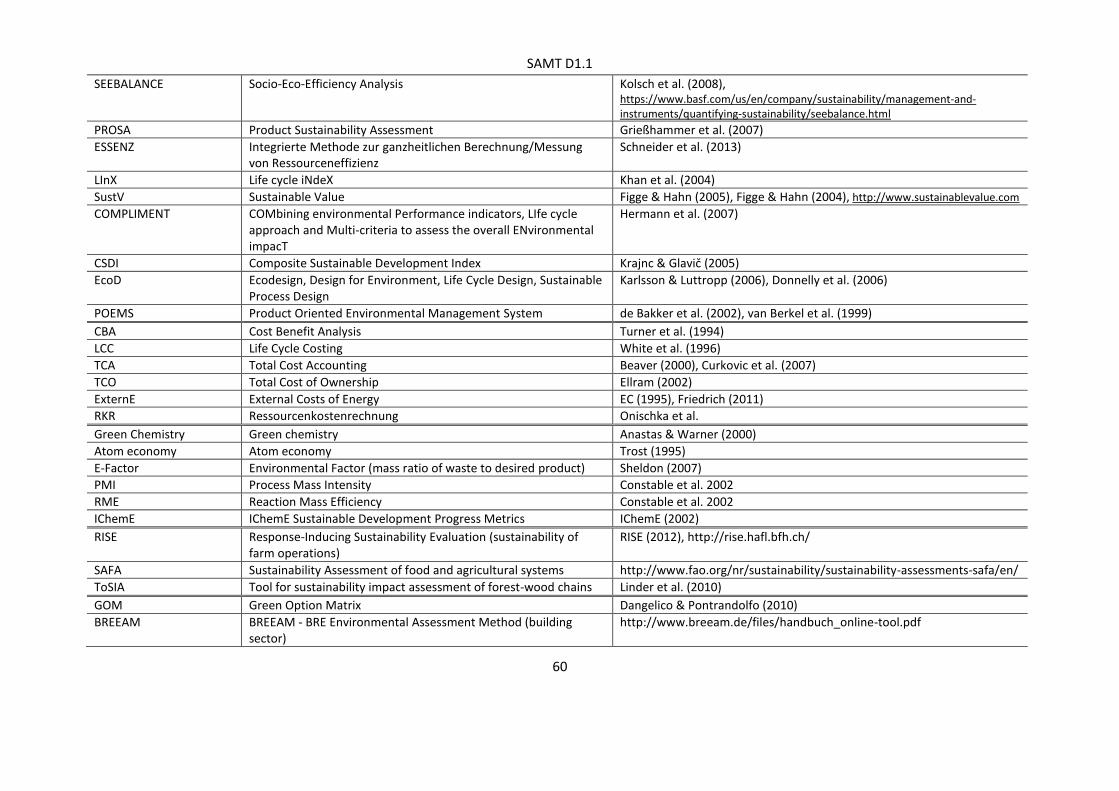
SAMT D1.1
60
SEEBALANCE Socio-Eco-Efficiency Analysis Kolsch et al. (2008), https://www.basf.com/us/en/company/sustainability/management-and-instruments/quantifying-sustainability/seebalance.html
PROSA Product Sustainability Assessment Grießhammer et al. (2007)
ESSENZ Integrierte Methode zur ganzheitlichen Berechnung/Messung von Ressourceneffizienz
Schneider et al. (2013)
LInX Life cycle iNdeX Khan et al. (2004)
SustV Sustainable Value Figge & Hahn (2005), Figge & Hahn (2004), http://www.sustainablevalue.com COMPLIMENT COMbining environmental Performance indicators, LIfe cycle
approach and Multi-criteria to assess the overall ENvironmental impacT
Hermann et al. (2007)
CSDI Composite Sustainable Development Index Krajnc & Glavič (2005)
EcoD Ecodesign, Design for Environment, Life Cycle Design, Sustainable Process Design
Karlsson & Luttropp (2006), Donnelly et al. (2006)
POEMS Product Oriented Environmental Management System de Bakker et al. (2002), van Berkel et al. (1999)
CBA Cost Benefit Analysis Turner et al. (1994)
LCC Life Cycle Costing White et al. (1996)
TCA Total Cost Accounting Beaver (2000), Curkovic et al. (2007)
TCO Total Cost of Ownership Ellram (2002)
ExternE External Costs of Energy EC (1995), Friedrich (2011) RKR Ressourcenkostenrechnung Onischka et al.
Green Chemistry Green chemistry Anastas & Warner (2000)
Atom economy Atom economy Trost (1995)
E-Factor Environmental Factor (mass ratio of waste to desired product) Sheldon (2007)
PMI Process Mass Intensity Constable et al. 2002
RME Reaction Mass Efficiency Constable et al. 2002
IChemE IChemE Sustainable Development Progress Metrics IChemE (2002)
RISE Response-Inducing Sustainability Evaluation (sustainability of farm operations)
RISE (2012), http://rise.hafl.bfh.ch/
SAFA Sustainability Assessment of food and agricultural systems http://www.fao.org/nr/sustainability/sustainability-assessments-safa/en/
ToSIA Tool for sustainability impact assessment of forest-wood chains Linder et al. (2010)
GOM Green Option Matrix Dangelico & Pontrandolfo (2010)
BREEAM BREEAM - BRE Environmental Assessment Method (building sector)
http://www.breeam.de/files/handbuch_online-tool.pdf
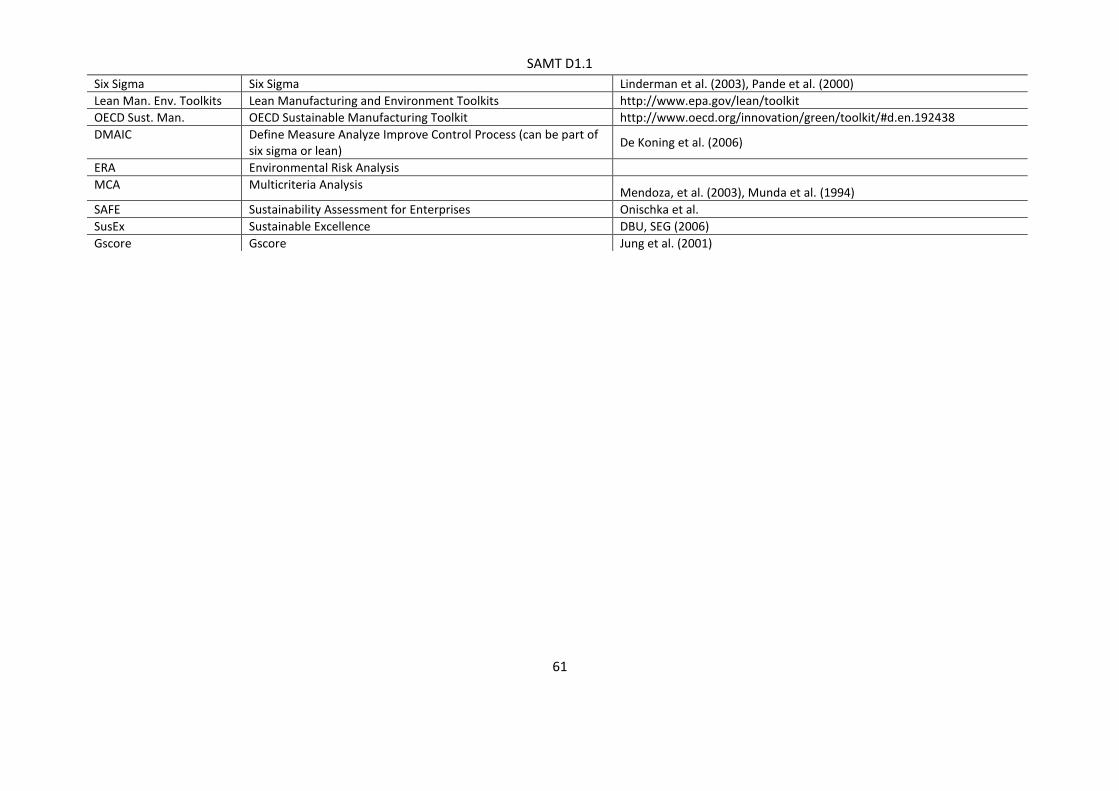
SAMT D1.1
61
Six Sigma Six Sigma Linderman et al. (2003), Pande et al. (2000)
Lean Man. Env. Toolkits Lean Manufacturing and Environment Toolkits http://www.epa.gov/lean/toolkit
OECD Sust. Man. OECD Sustainable Manufacturing Toolkit http://www.oecd.org/innovation/green/toolkit/#d.en.192438
DMAIC Define Measure Analyze Improve Control Process (can be part of six sigma or lean)
De Koning et al. (2006)
ERA Environmental Risk Analysis
MCA Multicriteria Analysis Mendoza, et al. (2003), Munda et al. (1994)
SAFE Sustainability Assessment for Enterprises Onischka et al.
SusEx Sustainable Excellence DBU, SEG (2006)
Gscore Gscore Jung et al. (2001)

SAMT D1.1
62
6.2 List of tools for sustainability assessment
The table below presents the full list of tools that we considered in our review. Tool clusters are separated by horizontal double lines. The clusters are, from
top to bottom: Full LCA tools; Simplified LCA tools; Tools specific to the chemical industry; Tools focusing on waste; Tools focusing on energy; Other tools.
The last column proposes a link to a web-page proposing the corresponding tool.
Table 5: Tools for sustainability assessment (short names, full names, providers, URLs)
SHORT NAME FULL NAME PROVIDER URL
GaBi GaBi thinkstep (previously PE International)
http://www.gabi-software.com/international/index/
OpenLCA OpenLCA GreenDelta http://www.openlca.org/ SimaPro SimaPro PRé http://www.pre-sustainability.com/simapro TEAM TEAM Ecobilan, PWC http://ecobilan.pwc.fr/en/boite-a-outils/team.jhtml Umberto Umberto IFU Hamburg http://www.umberto.de/en/ SULCA SULCA (formerly KCL-ECO) VTT https://www.simulationstore.com/sulca
CMLCA CMLCA CML Leiden University http://www.cmlca.eu/ RangeLCA Range Life Cycle Assessment RDC Environment http://www.rdcenvironment.be/index.php?option=com_content&view=article&id=32&Itemid
=24&lang=en
EASETECH (formerly EASEWASTE)
Environmental Assessment System for Environmental TECHnologies
Technical University of Denmark
http://www.easetech.dk/
Brightway2 Brightway2 (Python open source project)
ETH Zürich http://brightwaylca.org/
CCaLC Carbon Calculations over the Life Cycle of Industrial Activities
School of Chemical Engineering and Analytical Science (CEAS), The University of Manchester
http://www.ccalc.org.uk/
ECO-it ECO-it (screening tool for designers)
PRé http://www.pre-sustainability.com/eco-it
Ecolizer Ecolizer (ecodesign tool for designers - OVAM)
OVAM Ecodesign.link http://www.ecolizer.be

SAMT D1.1
63
InstantLCA Instant Life Cycle Assessment RDC Environment http://www.rdcenvironment.be/index.php?option=com_content&view=article&id=32&Itemid=24&lang=en http://www.instantlca-textile.com/index_en.html
EcoFly EcoFly (ecodesign tool) PlesTech Ltd. http://www.ecoflyonline.com/ Bilan Product Bilan Product ADEME http://www.base-impacts.ademe.fr/index/index/hash/2222197b8e6362f0a2ffd8fe34e05249
EATOS Environmental Assessment Tool for Organic Syntheses
Institute for Chemistry, University of Oldenburg
http://www.metzger.chemie.uni-oldenburg.de/eatos/english.htm
EcoScale EcoScale (semi-quantitative tool to select organic preparations)
Ecosynth http://www.ecosynth.be/facilities/database-access/2-ecoscale
EcoSolvent EcoSolvent Tool (life cycle assessment tool for waste-solvent treatment)
Safety and Environmental Technology Group, ETH Zürich
http://www.sust-chem.ethz.ch/tools/ecosolvent
iSustain iSustain Green Chemistry Index (generate a sustainability-based score for chemical products and processes)
Cytec Industries Inc., Sopheon, Beyond Benign
https://www.isustain.com/
PBT profiler Persistent Bioaccumulative and Toxic profiler
US EPA http://www.pbtprofiler.net/
WAR Waste Reduction Algorithm US EPA http://www.epa.gov/nrmrl/std/war/sim_war.htm ChemSTEER Chemical Screening Tool For
Exposures & Environmental Releases
US EPA http://www.epa.gov/oppt/exposure/pubs/chemsteer.htm
GC Alt. Purch. Wiz.
Green Chemical Alternatives Purchasing Wizard
MIT's Environment, Health, and Safety Office
http://ehs.mit.edu/site/content/green-chemical-alternatives-purchasing-wizard
Solvent Selec. Guides
Solvent Selection Guides American Chemical Society (but different institutions published different guides)
http://www.acs.org/content/acs/en/greenchemistry/research-innovation/tools-for-green-chemistry.html
PMIC Process Mass Intensity Calculator
American Chemical Society www.acs.org/content/dam/acsorg/greenchemistry/industriainnovation/roundtable/process-mass-intensity-calculation-tool.xls
GCA Green Chemistry Assistant St. Olaf College http://fusion.stolaf.edu/gca/
IWM-2 Integrated Waste Management-2 (life cycle inventory model)
Procter & Gamble http://www.scienceinthebox.com.de/en_UK/sustainability/solid_waste_management_en.html#five
ORWARE ORganic WAste Research KTH http://www.ima.kth.se/im/orware/English/index.htm

SAMT D1.1
64
Energy Star ETT
Energy Star Energy Tracking tool
US EPA http://www.energystar.gov/buildings/tools-and-resources/energy-tracking-tool
Energy Star EPI Energy Star Energy Performance Indicator tool
US EPA http://www.energystar.gov/buildings/facility-owners-and-managers/industrial-plants/measure-track-and-benchmark/energy-star-energy
METMatrix Materials, Energy, Toxicity Matrix
FP 7 project futureSME (Note: other providers exist)
www.futuresme.eu/docs/lca-tools/met-matrix.xlsm
GEMI SD Planner
Global Environmental Management Initiative Sustainable Development Planner
Global Environmental Management Initiative
http://www.gemi.org/sd/
SBSC Sustainability Balanced Scorecard
BMBF https://www.nachhaltigkeit.info/artikel/sustainability_balanced_scorecard_1562.htm
EPM-KOMPASS Environmental Performance
Measurement - Konzeption, Operationalisierung und Multiplikation für eine Publicy Available Specification
Technical University Dresden http://tu-dresden.de/die_tu_dresden/fakultaeten/fakultaet_wirtschaftswissenschaften/copy_of_bwl/bu/forschung/projekte/epm_kompas_software
SinnDesign Sustainable Innovation through Design tools
EU project SInnDesign http://sinndesignproject.eu/sinndesign-tools/
FutureFitBB Future-Fit Business Benchmark 3D Investment Foundation and The Natural Step Canada
http://futurefitbusiness.org/
S-CORE Sustainability, Competency, Opportunity & Reporting, Evaluation
International Sustainable Development Foundation
http://www.sustainability-core.com/

SAMT D1.1
65
6.3 Alphabetical list of methods and tools for sustainability assessment
The table below presents the full list of methods and tools that we considered in our review. The “short names” are arranged alphabetically. The table also
provides the full names and clusters to which the methods and tools belong. This table should be helpful when looking at the web-visualisations where we
had to use only the short names in order to fit all methods and tools.
Table 6: Methods and tools for sustainability assessment arranged alphabetically (short names, full names, clusters)
SHORT NAME FULL NAME METHOD OR TOOL CLUSTER
Atom economy Atom economy Methods specific to the chemical industry
Bilan Product Bilan Product Simplified LCA tools
BREEAM BREEAM - BRE Environmental Assessment Method (building sector)
Other methods
Brightway2 Brightway2 (Python open source project) Full LCA tools
CBA Cost Benefit Analysis Methods focusing on costs
CCaLC Carbon Calculations over the Life Cycle of Industrial Activities Simplified LCA tools
CED Cumulative Energy Demand Life cycle methods
CF Carbon Footprint Life cycle methods
ChemSTEER Chemical Screening Tool For Exposures & Environmental Releases Tools specific to the chemical industry
CMLCA CMLCA Full LCA tools
COMPLIMENT COMbining environmental Performance indicators, LIfe cycle approach and Multi-criteria to assess the overall ENvironmental impacT
Integrated methods
CSDI Composite Sustainable Development Index Integrated methods
DMAIC Define Measure Analyze Improve Control Process (can be part of six sigma or lean)
Other methods
E-Factor Environmental Factor (mass ratio of waste to desired product) Methods specific to the chemical industry
E-LCA Exergetic Life Cycle Assessment, Exergy analysis Life cycle methods
E-LCC Environmental Life Cycle Costing Life cycle methods
EA Emergy analysis Life cycle methods
EASETECH Environmental Assessment System for Environmental TECHnologies
Full LCA tools
EATOS Environmental Assessment Tool for Organic Syntheses Tools specific to the chemical industry

SAMT D1.1
66
ECO-it ECO-it (screening tool for designers) Simplified LCA tools
EcoD Ecodesign, Design for Environment, Life Cycle Design, Sustainable Process Design
Integrated methods
EcoFly EcoFly (ecodesign tool) Simplified LCA tools
Ecolizer Ecolizer (ecodesign tool for designers - OVAM) Simplified LCA tools
EcoScale EcoScale (semi-quantitative tool to select organic preparations) Tools specific to the chemical industry
EcoSolvent EcoSolvent Tool (life cycle assessment tool for waste-solvent treatment)
Tools specific to the chemical industry
EE-IOA/LCA Hybrid environmentally extended input-output analysis and LCA Hybrid methods
EE-IOA/LCA/GEM Hybrid EE-IOA/LCA + General Equilibrium Model Hybrid methods
EEA Eco-Efficiency Analysis Integrated methods
EF Ecological footprint Life cycle methods
EPM-KOMPASS Environmental Performance Measurement - Konzeption, Operationalisierung und Multiplikation für eine Publicy Available Specification
Other tools
ERA Environmental Risk Analysis Other methods
ES-EPI Energy Star Energy Performance Indicator tool Tools focusing on energy
ES-ETT Energy Star Energy Tracking tool Tools focusing on energy
ESSENZ Integrierte Methode zur ganzheitlichen Berechnung/Messung von Ressourceneffizienz
Integrated methods
ExternE External Costs of Energy Methods focusing on costs
FFBB Future-Fit Business Benchmark Other tools
GaBi GaBi Full LCA tools
GC Alt. Purch. Wiz. Green Chemical Alternatives Purchasing Wizard Tools specific to the chemical industry
GCA Green Chemistry Assistant Tools specific to the chemical industry
GEMI SD Planner Global Environmental Management Initiative Sustainable Development Planner
Other tools
GOM Green Option Matrix Other methods
Green Chemistry Green chemistry Methods specific to the chemical industry
Gscore Gscore Other methods
IChemE IChemE Sustainable Development Progress Metrics Methods specific to the chemical industry
InstantLCA Instant Life Cycle Assessment Simplified LCA tools
iSustain iSustain Green Chemistry Index (generate a sustainability-based score for chemical products and processes)
Tools specific to the chemical industry

SAMT D1.1
67
IWM-2 Integrated Waste Management-2 (life cycle inventory model) Tools focusing on waste
LCA Life Cycle Assessment Life cycle methods
LCA/PEM Hybrid LCA + partial equilibrium model Hybrid methods
LCAA Life Cycle Activity Analysis Hybrid methods
LCC Life Cycle Costing Methods focusing on costs
LCO Life Cycle Optimisation Hybrid methods
Lean Man. Env. Toolkits Lean Manufacturing and Environment Toolkits Other methods
LInX Life cycle iNdeX Integrated methods
MCA Multicriteria Analysis Other methods
METMatrix Materials, Energy, Toxicity Matrix Other tools
MIPS Material Input Per Service Life cycle methods
OECD Sust. Man. OECD Sustainable Manufacturing Toolkit Other methods
OpenLCA OpenLCA Full LCA tools
ORWARE ORganic WAste Research Tools focusing on waste
PBT profiler Persistent Bioaccumulative and Toxic profiler Tools specific to the chemical industry
PMI Process Mass Intensity Methods specific to the chemical industry
PMIC Process Mass Intensity Calculator Tools specific to the chemical industry
POEMS Product Oriented Environmental Management System Integrated methods
PROSA Product Sustainability Assessment Integrated methods
RangeLCA Range Life Cycle Assessment Full LCA tools
RISE Response-Inducing Sustainability Evaluation (sustainability of farm operations)
Methods specific to the agricultural, forestry and food sectors
RKR Ressourcenkostenrechnung Methods focusing on costs
RME Reaction Mass Efficiency Methods specific to the chemical industry
S-CORE Sustainability, Competency, Opportunity & Reporting, Evaluation Other tools
S-LCA Social Life Cycle Assessment Life cycle methods
SAFA Sustainability Assessment of food and agricultural systems Methods specific to the agricultural, forestry and food sectors
SAFE Sustainability Assessment for Enterprises Other methods
SBSC Sustainability Balanced Scorecard Other tools
SEEBALANCE Socio-Eco-Efficiency Analysis Integrated methods
SimaPro SimaPro Full LCA tools
SinnDesign Sustainable Innovation through Design tools Other tools
Six Sigma Six Sigma Other methods
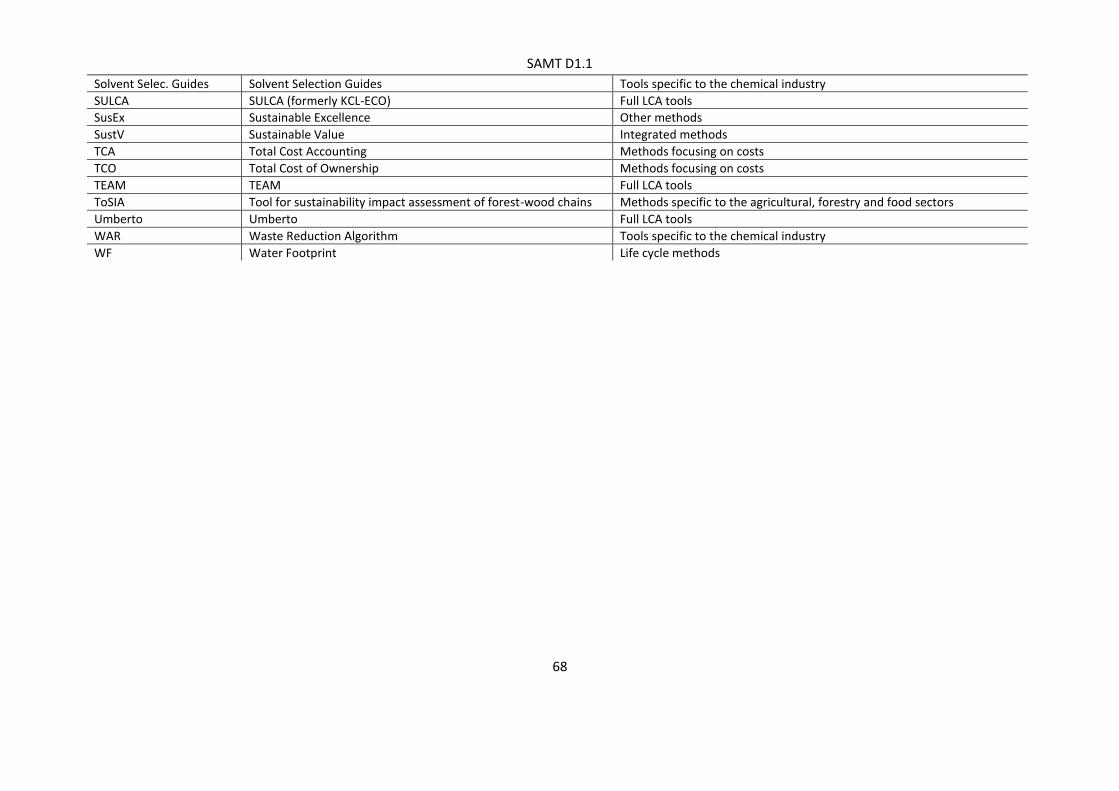
SAMT D1.1
68
Solvent Selec. Guides Solvent Selection Guides Tools specific to the chemical industry
SULCA SULCA (formerly KCL-ECO) Full LCA tools
SusEx Sustainable Excellence Other methods
SustV Sustainable Value Integrated methods
TCA Total Cost Accounting Methods focusing on costs
TCO Total Cost of Ownership Methods focusing on costs
TEAM TEAM Full LCA tools
ToSIA Tool for sustainability impact assessment of forest-wood chains Methods specific to the agricultural, forestry and food sectors
Umberto Umberto Full LCA tools
WAR Waste Reduction Algorithm Tools specific to the chemical industry
WF Water Footprint Life cycle methods
SAMT D1.1
69
PART B – REVIEW OF STANDARDS RELATED TO SUSTAINABILITY,
SUSTAINABILITY ASSESSMENT, AND RESOURCE AND ENERGY EFFICIENCY
1 Introduction
This document presents the standardization activity (published standards and projects under development)
that have been found relevant for the SAMT project.
The standardization study included in this report covers European standardization developed by the
European Committees for Standardization (CEN and CENELEC) and International standardization developed
by the International Organizations for Standardization (ISO and IEC).
This report represents the state of the art of the standardization works in the moment of publication of the
document. However, it should be clear that the standardization landscape may vary during the project
lifetime.
2 Short introduction about standardization
Standards are voluntary technical documents that set out requirements for a specific item, material,
component, system or service, or describes in detail a particular method, procedure or best practice.
Standards are developed and defined through a process of sharing knowledge and building consensus
among technical experts nominated by interested parties and other stakeholders - including businesses,
consumers and environmental groups, among others. These experts are organized in Technical Committees
(TCs), which are subdivided in Subcommittees (SCs) and/or Working Groups (WGs). These TCs are included
in the structure of the Standardization Organizations (National, European and International, with the
respective mirror committees) and work following their internal regulations.
The standardization bodies operate at National (AENOR, AFNOR, BSI, DIN, etc.), Regional (CEN, CENELEC,
ETSI) or International (ISO, IEC, ITU) level. Sometimes there are different standardization bodies at the
same level, but covering different fields. This is the case of ISO (general), IEC (electrical) and ITU
(telecommunications) at International level, or CEN, CENELEC and ETSI at European level in the same way.
There are also different kinds of standardization documents. The most widespread is the standard, which
has a different code depending on the organization under it was developed. e.g. EN for European
Standards, ISO for International standards. Other types of documents are Technical Specifications (TS),
Technical Reports (TR) and Workshop Agreements (CWA). Further Amendments to the standards are
identified by adding A1, A2, etc. at the end of the standard code.
At European level, all the members of CEN shall adopt EN standards as national standards and have to
withdraw any existing national standard which could conflict with them. A summary of the characteristics
of the different standardization documents can be found in Table 1.

SAMT D1.1
70
Table 1 – Characteristics of different standardization documents
Type International
code
European
code
National code Main characteristics
Standard ISO
IEC
EN UNE, NF, BS,
DIN, etc.
When adopting:
UNE-EN, NF-EN,
UNE-ISO, NF-
ISO, etc.
• Elaboration: 3 years
• 2 steps of member approval
• European: compulsory national
adoption
• Revision: every 5 years
Technical
Specification
ISO/TS
IEC/TS
CEN/TS
CLC/TS
When adopting:
UNE-CEN/TS,
NF-CEN/TS,
UNE-ISO/TS, NF-
ISO/TS, etc
• Elaboration: 21 months
• 1 step of member approval or
internal approval in TC
• European: optional national
adoption
• Revision: at 3 years (upgrading to
EN or deletion)
Technical
Report
ISO/TR
IEC/TR
CEN/TR
CLC/TR
When adopting:
UNE-CEN/TR,
NF-CEN/TR,
UNE-ISO/TR, NF-
ISO/TR, etc
• Elaboration: free timeframe
• Internal approval in TC
• European: optional national
adoption
• No revision required
Workshop
Agreement
IWA CWA Variable • Elaboration: free timeframe
(usually few months)
• Internal approval in the
Workshop
• European: optional national
adoption
• Revision: at 3 years (upgrading to
EN or deletion)
There is also an agreement established between European and International Organizations (e.g. CEN and
ISO) in order to avoid duplication of efforts and promote global relevance of standards, which allows to
adopt or develop in parallel each other’s standards with the same content and code. National standards
could also be proposed as a base for new European or International standards. The following Figure 1
shows the possible tracks of the standards.

SAMT D1.1
71
Figure 1 – Possible tracks of standards adoption
3 Methodology used for the report
This document presents the standardization activity found relevant for the SAMT project. In order to
structure the search, two kinds of searches have been made:
Search for key-words in the title and scope of the documents: in Table 2 the list of concepts
prepared by AENOR to act a starting point for the identification of standardization areas can be
found.
Table 2 – List of key-words acting as start point for the identification of standardization areas
Sustainability
Environment
Safety
Life-cycle
Footprint
Eco-design
Search by ICS (International Classification for Standards) which is “intended to serve as a structure
for catalogues of international, regional and national standards and other normative documents,
National Standard
(e.g. UNE-EN ISO 14001)
International Standard
(e.g. ISO 14001)
European Standard
(e.g. EN ISO 14001)
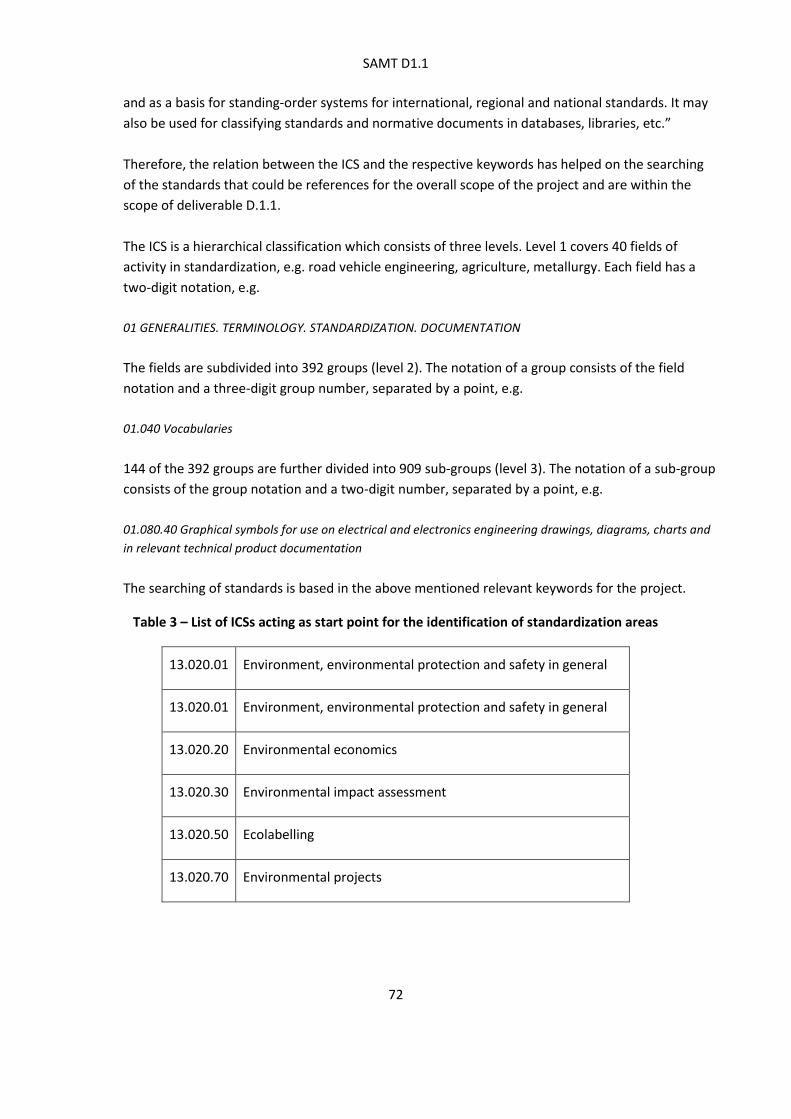
SAMT D1.1
72
and as a basis for standing-order systems for international, regional and national standards. It may
also be used for classifying standards and normative documents in databases, libraries, etc.”
Therefore, the relation between the ICS and the respective keywords has helped on the searching
of the standards that could be references for the overall scope of the project and are within the
scope of deliverable D.1.1.
The ICS is a hierarchical classification which consists of three levels. Level 1 covers 40 fields of
activity in standardization, e.g. road vehicle engineering, agriculture, metallurgy. Each field has a
two-digit notation, e.g.
01 GENERALITIES. TERMINOLOGY. STANDARDIZATION. DOCUMENTATION
The fields are subdivided into 392 groups (level 2). The notation of a group consists of the field
notation and a three-digit group number, separated by a point, e.g.
01.040 Vocabularies
144 of the 392 groups are further divided into 909 sub-groups (level 3). The notation of a sub-group
consists of the group notation and a two-digit number, separated by a point, e.g.
01.080.40 Graphical symbols for use on electrical and electronics engineering drawings, diagrams, charts and
in relevant technical product documentation
The searching of standards is based in the above mentioned relevant keywords for the project.
Table 3 – List of ICSs acting as start point for the identification of standardization areas
13.020.01 Environment, environmental protection and safety in general
13.020.01 Environment, environmental protection and safety in general
13.020.20 Environmental economics
13.020.30 Environmental impact assessment
13.020.50 Ecolabelling
13.020.70 Environmental projects

SAMT D1.1
73
4 Abbreviations and acronyms
The following abbreviations related to standardization are used:
AENOR Spanish Association for Standardization and Certification
CEN European Committee for Standardization
CENELEC (CLC) European Committee for Standardization in the Electrical field
EN European Standard
ISO International Organization for Standardization; International Standard
TR Technical Report
TS Technical Specification
prEN Project of European Standard
FprEN Final Project of European Standard
CD International Committee Draft
DIS International Draft Standard
FDIS International Final Draft Standard
5 List of standards and projects
As explained in chapter 2, some standards are developed in collaboration at European and International level, being the result one standard for both organizations CEN/ISO or CLC/IEC. Where this is the case, in order not to duplicate references, it is stated in the relevant reference in the list of European standards and it is not included in the list of International standards.
In Tables 4 and 5 the list of European standards and projects related with general horizontal sustainability aspect is included.
In Tables 6 and 7 the list of International standards and projects related with general horizontal sustainability aspect is included.
Table 4 – List of general European standards related to SAMT project
REFERENCE TITLE EQUIVALENCE
EN 16247-1 Energy audits - Part 1: General requirements
EN 16247-2 Energy audits - Part 2: Buildings

SAMT D1.1
74
REFERENCE TITLE EQUIVALENCE
EN 16247-3 Energy audits - Part 3: Processes
EN 16247-4 Energy audits - Part 4: Transport
EN ISO 14001 Environmental management systems - Requirements with guidance for use (ISO 14001:2004)
ISO 14001
EN ISO 14004 Environmental management systems - General guidelines on principles, systems and support techniques (ISO 14004:2004)
ISO 14004
EN ISO 14006 Environmental management systems - Guidelines for incorporating ecodesign (ISO 14006:2011)
ISO 14006
EN ISO 14015 Environmental management - Environmental assessment of sites and organizations (EASO) (ISO 14015:2001)
ISO 14015
EN ISO 14020 Environmental labels and declarations - General principles (ISO 14020:2000) ISO 14020
EN ISO 14021 Environmental labels and declarations - Self-declared environmental claims (Type II environmental labelling) (ISO 14021:1999)
ISO 14021
EN ISO 14024 Environmental labels and declarations - Type I environmental labelling - Principles and procedures (ISO 14024:1999)
ISO 14024
EN ISO 14025 Environmental labels and declarations - Type III environmental declarations - Principles and procedures (ISO 14025:2006)
ISO 14025
EN ISO 14031 Environmental management - Environmental performance evaluation - Guidelines (ISO 14031:2013)
ISO 14031
EN ISO 14040 Environmental management - Life cycle assessment - Principles and framework (ISO 14040:2006)
ISO 14040
EN ISO 14044 Environmental management - Life cycle assessment - Requirements and guidelines (ISO 14044:2006)
ISO 14044
EN ISO 14045 Environmental management - Eco-efficiency assessment of product systems - Principles, requirements and guidelines (ISO 14045:2012)
ISO 14045
EN ISO 14050 Environmental management - Vocabulary (ISO 14050:2009) ISO 14050
EN ISO 14051 Environmental management - Material flow cost accounting - General framework (ISO 14051:2011)
ISO 14051
EN ISO 14063 Environmental management - Environmental communication - Guidelines and examples (ISO 14063:2006)
ISO 14063
EN ISO 14064-1 Greenhouse gases - Part 1: Specification with guidance at the organization level for quantification and reporting of greenhouse gas emissions and removals (ISO 14064-1:2006)
ISO 14064-1
Table 5 – List of general European projects related to SAMT project
REFERENCE TITLE EQUIVALENCE
prEN 16247-5 Energy audits - Part 5: Competence of energy auditors
prEN ISO 14001 Environmental management systems - Requirements with guidance for use (ISO/DIS 14001:2014)
ISO DIS 14001

SAMT D1.1
75
Table 6 – List of general International standards related to SAMT project
REFERENCE TITLE EQUIVALENCE
ISO 14046 Environmental management - Water footprint - Principles, requirements and guidelines
ISO 26000 Guidance on social responsibility
ISO 50001 Energy management systems -- Requirements with guidance for use
ISO Guide 64 Guide for addressing environmental issues in product standards
ISO Guide 82 Guidelines for addressing sustainability in standards
ISO TR 14047 Environmental management - Life cycle assessment - Illustrative examples on how to apply ISO 14044 to impact assessment situations
ISO TR 14049 Environmental management - Life cycle assessment - Illustrative examples on how to apply ISO 14044 to goal and scope definition and inventory analysis
ISO TR 14062 Environmental management - Integrating environmental aspects into product design and development
ISO TS 14067 Greenhouse gases - Carbon footprint of products - Requirements and guidelines for quantification and communication
ISO TS 14071 Environmental management - Life cycle assessment - Critical review processes and reviewer competencies: Additional requirements and guidelines to ISO 14044:2006
ISO TS 14072 Environmental management - Life cycle assessment - Requirements and guidelines for organizational life cycle assessment
Table 7 – List of general International projects related to SAMT project
REFERENCE TITLE EQUIVALENCE
ISO AWI TR 14073 Environmental management systems – Water footprint – Illustrative examples on how to apply ISO 14046
ISO DIS 17741 General technical rules for measurement, calculation and verification of energy savings of projects
ISO AWI 50008 Building system energy data exchange -- a systemic approach to evaluating the energy use, energy consumption, energy efficiency and other factors used to manage the building energy.
In addition to general standards, there are standards linked to specific sectors.
In Tables 8 and 9 the list of European standards and projects related with specific sectors is included.
In Tables 10 and 11 the list of International standards and projects related with specific sectors is included.
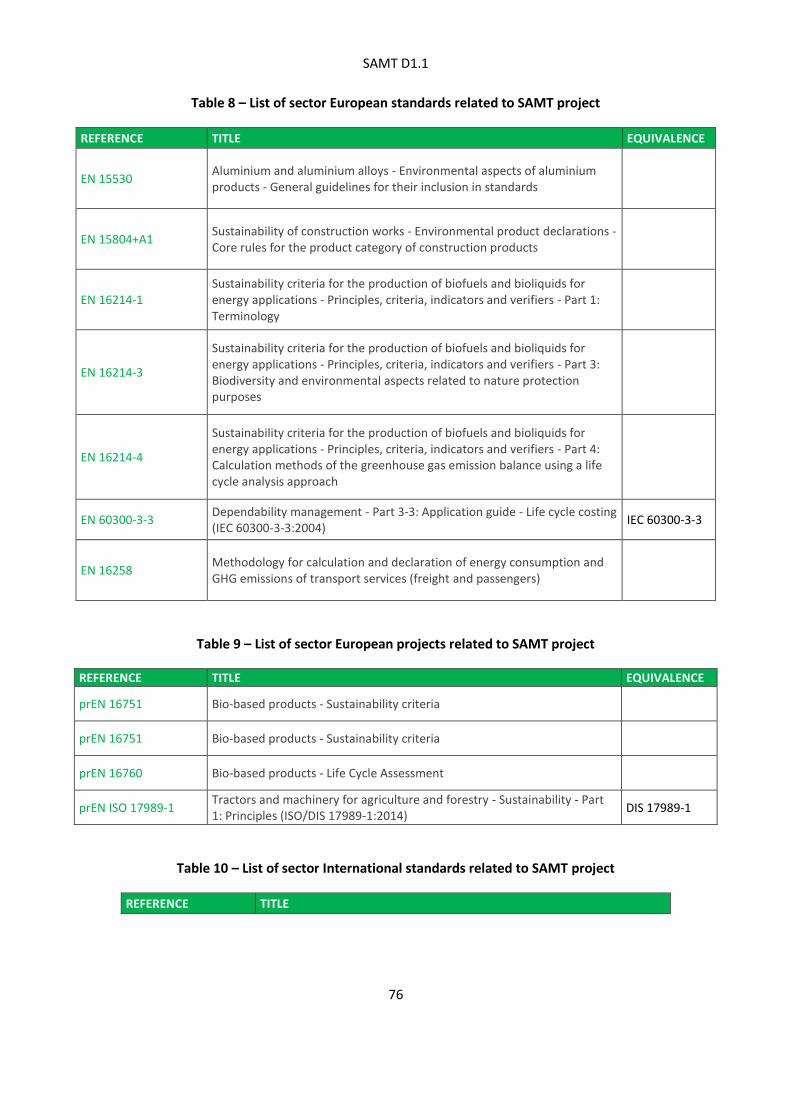
SAMT D1.1
76
Table 8 – List of sector European standards related to SAMT project
REFERENCE TITLE EQUIVALENCE
EN 15530 Aluminium and aluminium alloys - Environmental aspects of aluminium products - General guidelines for their inclusion in standards
EN 15804+A1 Sustainability of construction works - Environmental product declarations - Core rules for the product category of construction products
EN 16214-1 Sustainability criteria for the production of biofuels and bioliquids for energy applications - Principles, criteria, indicators and verifiers - Part 1: Terminology
EN 16214-3
Sustainability criteria for the production of biofuels and bioliquids for energy applications - Principles, criteria, indicators and verifiers - Part 3: Biodiversity and environmental aspects related to nature protection purposes
EN 16214-4
Sustainability criteria for the production of biofuels and bioliquids for energy applications - Principles, criteria, indicators and verifiers - Part 4: Calculation methods of the greenhouse gas emission balance using a life cycle analysis approach
EN 60300-3-3 Dependability management - Part 3-3: Application guide - Life cycle costing (IEC 60300-3-3:2004)
IEC 60300-3-3
EN 16258 Methodology for calculation and declaration of energy consumption and GHG emissions of transport services (freight and passengers)
Table 9 – List of sector European projects related to SAMT project
REFERENCE TITLE EQUIVALENCE
prEN 16751 Bio-based products - Sustainability criteria
prEN 16751 Bio-based products - Sustainability criteria
prEN 16760 Bio-based products - Life Cycle Assessment
prEN ISO 17989-1 Tractors and machinery for agriculture and forestry - Sustainability - Part 1: Principles (ISO/DIS 17989-1:2014)
DIS 17989-1
Table 10 – List of sector International standards related to SAMT project
REFERENCE TITLE

SAMT D1.1
77
REFERENCE TITLE
ISO 15926-1 Industrial automation systems and integration - Integration of life-cycle data for process plants including oil and gas production facilities - Part 1: Overview and fundamental principles
ISO 18601 Packaging and the environment - General requirements for the use of ISO standards in the field of packaging and the environment
ISO 15663-1 Petroleum and natural gas industries - Life cycle costing - Part 1: Methodology
Table 11 – List of sector International projects related to SAMT project
REFERENCE TITLE
ISO DIS 13065 Sustainability criteria for bioenergy
ISO DIS 17743 Energy savings - Definition of a methological framework applicable to calculation and reporting on energy savings
ISO FDIS 17742 Energy efficiency and savings calculation for countries, regions and cities
IEC CD 62890 IEC 62890: Life-cycle management for systems and products used in industrial-process measurement, control and automation
ISO/IEC CD 20140-5 ¡
ISO/IEC 20140-5, Ed. 1.0: Automation systems and integration - Evaluating energy efficiency and other factors of manufacturing systems that influence the environment - Part 5: Environmental influence evaluation data
ISO DIS 17989-1 Tractors and machinery for agriculture and forestry - Sustainability - Part 1: Principles
6 Conclusions
Studying the list of standards and project included in chapter 5, the following conclusions can be obtained:
There are general standards, not related to a specific sector, addressing some particular aspects of
sustainability, as eco-design, social responsibility, life-cycle or management.
The standards dealing with sustainability as a whole are sector related documents.
Sectors with major standardization activities related with sustainability are the electrotechnical and
construction sectors.
There exist a number of standards specifying software tools useful for the management and
implementation of sustainability aspects in the industry.

SAMT D1.1
78
There is a gap of horizontal standards, sector independent, addressing sustainability in general not
only focussing in a specific aspect.
There are no standards defining or specifying indicators linked to sustainability.