sustainability appraisal scoping report and initial ... · pdf file1.3 sustainability...
TRANSCRIPT
Sustainability Appraisal Scoping Report and initial
assessment of Spatial Strategy Options
June 2017

Mole Valley District Council Planning Services June 2017
[email protected], Planning Policy Mole Valley District Council Planning Policy Pippbrook Dorking Surrey RH4 1SJ Website: http://www.molevalley.gov.uk/
Mole Valley District Council Planning Services June 2017
Contents
1. Introduction ................................................................................ 2
1.1 Background ....................................................................................................... 2 1.2 The concept of sustainable development .......................................................... 3 1.3 Sustainability Appraisal ..................................................................................... 3
1.4 Relationship to the Strategic Environmental Assessment (SEA) Directive 2001/42/EC ....................................................................................................... 6
1.5 The Scoping Report ........................................................................................... 6 1.6 Joint working ..................................................................................................... 7
2. Stage A1 – Identifying other relevant plans, programmes and sustainability objectives ........................................................ 8
2.1 Introduction ........................................................................................................ 8
2.2 Plans Policies Programmes and Sustainability Objectives ................................ 8
3. Stage A2 – Collecting baseline information .......................... 11
3.1 Summary of significant issues identified .......................................................... 15
4. Stage A3 – Identifying sustainability issues ......................... 17
Summary of SA Baseline Data: .................................................................................. 17 Objective 1 – Housing to meet the needs of the population ....................................... 17
Objective 2 – Health and Wellbeing ........................................................................... 17 Objective 3 – Historic and Cultural Assets ................................................................. 18
Objective 4 – Travel and Sustainable Transport ........................................................ 18 Objective 5 – Make the best use of Previously Developed Land ................................ 18
Objective 6 – Economic Growth ................................................................................. 18 Objective 7 – Employment Opportunities ................................................................... 19
Objective 8 – Greenhouse Gas Emissions and Low Carbon Economy ...................... 19 Objective 9 – Using Natural Resources Prudently ..................................................... 19 Objective 10 – Climate Change .................................................................................. 19
Objective 11 – Flooding.............................................................................................. 20 Objective 12 – Water .................................................................................................. 20
Objective 13 – Land Contamination and Soil Quality ................................................. 20 Objective 14 – Air Quality and Noise and Light Pollution ........................................... 20 Objective 15 – Landscape Character ......................................................................... 20 Objective 16 – Biodiversity ......................................................................................... 20
5. Stage A4 – Developing the SA framework ............................ 21
5.1 Methodology .................................................................................................... 21
6. Stage A5 – Consulting on the scope ..................................... 29
7. Initial Scope of the Council’s options .................................... 30
8. Next steps ................................................................................. 33
8.1 Local Plan ........................................................................................................ 33
Appendix 1 – Plans, policies and programmes May 2017: full table with objectives .................................................................... 34
Appendix 2 – Baseline data ........................................................ 56
Mole Valley District Council Planning Services Page 2
1. Introduction The purpose of Sustainability Appraisal (SA) is to promote sustainable development through better integration of social, environmental and economic considerations into the preparation of planning documents. This SA Scoping Report forms the first stage in the SA process for documents forming part of the new Mole Valley Local Plan. The report sets the context for producing the documents by:
Identifying other plans, policies and programmes that may influence the content of the documents.
Gathering relevant baseline information to inform the documents.
Identifying social, environmental and economic issues and problems that need to be addressed.
Developing a framework for appraising the documents to identify the key sustainability effects.
Under the Planning and Compulsory Purchase Act 2004 and Localism Act 2011, the Council is required to prepare a Local Plan. The Local Plan will provide a number of strategic and detailed planning policies that collectively will deliver the vision for the District, guiding all future development for the period up to 2033. As a requirement of these Acts, the Local Plan will to be subject to Sustainability Appraisal (SA) and where relevant, must meet the requirements of the Strategic Environmental Assessment (SEA) Directive 2001/42/EC. This report sets out the scope for the SA of the Mole Valley Local Plan for consultation with the relevant environmental authorities and other interested stakeholders. It also takes account of the National Planning Policy Framework (NPPF) and the emphasis it places on achieving sustainable development.
1.1 Background In December 2014 it was decided that in order to fulfil its wider planning responsibilities, including the protection of the Green Belt, Mole Valley would take the preliminary steps necessary to prepare a new Local Plan in line with the National Planning Policy Framework. The programme for producing a new Mole Valley Local Plan is set out in the Mole Valley Local Development Scheme March 2016. The new Local Plan will provide the overall planning framework for Mole Valley including spatial strategy, housing and economic strategy, site allocations and detailed planning policies for the period 2018 - 2033.
As part of the planning process, Mole Valley will appraise the emerging Local Plan against defined economic, social and environmental criteria to demonstrate that the plan is sustainable. Mole Valley will use an established set of 16 sustainability objectives developed in partnership with other East Surrey planning authorities to appraise the new Local Plan. Strategic Environmental Assessment is a similar requirement to appraise emerging plans and programmes, focussing on environmental impacts. This requirement will be met as part of the sustainability appraisal work. The new Local Plan will also need to be subject to an appropriate assessment, which will appraise its impact on European Sites for Nature Conservation. The two sites nearest to Mole Valley are:
Mole Gap to Reigate Escarpment Special Area of Conservation
Mole Valley District Council Planning Services Page 3
Thames Basin Heaths Special Protection Area
1.2 The concept of sustainable development
The process of plan making has always relied on the choices between different options for the development and use of land through the planning system. The requirement to produce a SA Report for the emerging Local Plan is a legal requirement under the Planning and Compulsory Purchase Act (2004) which seeks to ensure that the decision-making process takes into account the key objectives of sustainable development. These are:
Social progress which recognises the needs of everyone;
Effective protection of the environment;
Prudent use of natural resources; and
Maintenance of high and stable levels of economic growth and employment.
SA is a process undertaken during the preparation of a plan, programme or strategy. The role of the SA is to assess the extent to which the emerging policies and proposals will help to achieve relevant environmental, social and economic objectives and aims to ensure that sustainable development is at the heart of the plan-making process. The Act stipulates that the SA must comply with the requirements of the SEA Directive which was transposed directly in to UK law through the SEA Regulations. The overall aim of the SA process is to help ensure that the Local Plan makes an effective contribution to the pursuit of sustainable development. The most widely used definition of sustainable development is set out in the Brundtland Commission Report - Our Common Future (World Commission on Environment and Development) 1987: “Development that meets the needs of the present without compromising the ability of future generations to meet their own needs”.
1.3 Sustainability Appraisal The aim of SA is to set out how sustainable development will be achieved through better integration of economic, environmental and social considerations into the preparation and adoption of Local Plan documents. To be effective, a SA must be fully integrated into the plan making process. The SA will be applied at each stage of document production and audit key decisions. SA will be used to monitor the effectiveness of the plan during its implementation in order to inform revisions of the plan that will be more conducive to achieving sustainable development. The fundamental tasks to be carried out to ensure a comprehensive and robust SA include:
Collecting and presenting baseline information
Predicting the significant effects of the plan and addressing them during its preparation
Identifying reasonable plan options and their effects
Involving the public and authorities with social, environmental and economic responsibilities as part of the assessment process
Monitoring the actual effects of the plan during its implementation To undertake the full SA process in relation to a Local Plan document, the Planning Advisory Service plan-making guide1 outlines the following five stages for SA:
Stage A - Setting the context and objectives, establishing the baseline and deciding the scope;
1 PAS Plan Making Guide – http://www.pas.gov.uk/web/pas1/local-planning/-
/journal_content/56/332612/6627529/ARTICLE
Mole Valley District Council Planning Services Page 4
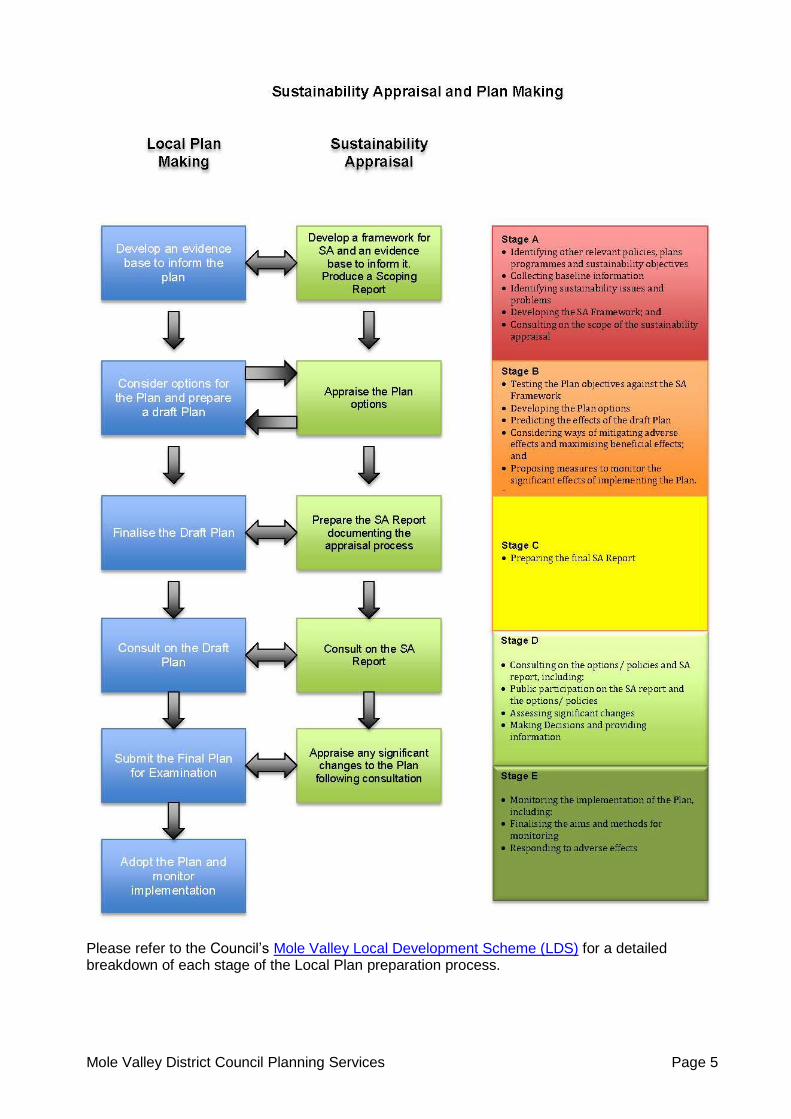
Stage B - Developing and refining plan options;
Stage C - Appraising the effects of the plan;
Stage D - Consulting on the preferred options and the SA report; and
Stage E - Monitoring implementation of the plan. The process is shown alongside the Local Plan preparation process as set out on the following page.
Mole Valley District Council Planning Services Page 5
Please refer to the Council’s Mole Valley Local Development Scheme (LDS) for a detailed breakdown of each stage of the Local Plan preparation process.
Mole Valley District Council Planning Services Page 6
1.4 Relationship to the Strategic Environmental Assessment (SEA) Directive 2001/42/EC
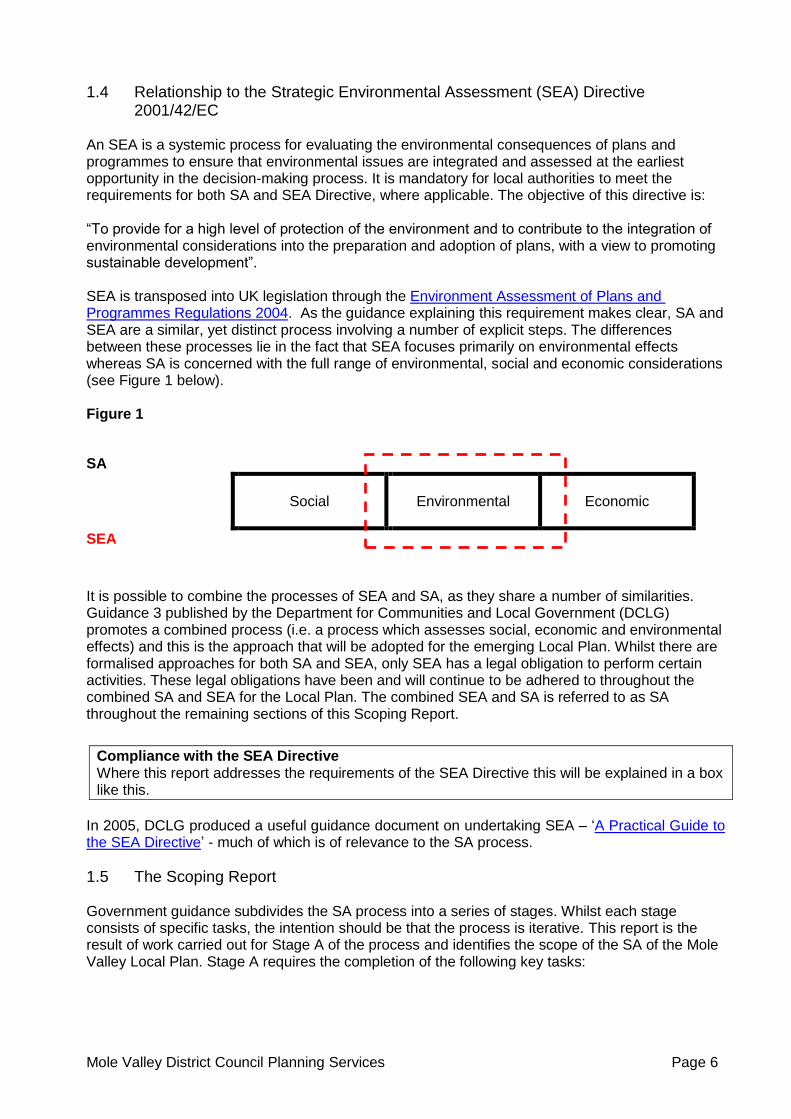
An SEA is a systemic process for evaluating the environmental consequences of plans and programmes to ensure that environmental issues are integrated and assessed at the earliest opportunity in the decision-making process. It is mandatory for local authorities to meet the requirements for both SA and SEA Directive, where applicable. The objective of this directive is: “To provide for a high level of protection of the environment and to contribute to the integration of environmental considerations into the preparation and adoption of plans, with a view to promoting sustainable development”. SEA is transposed into UK legislation through the Environment Assessment of Plans and Programmes Regulations 2004. As the guidance explaining this requirement makes clear, SA and SEA are a similar, yet distinct process involving a number of explicit steps. The differences between these processes lie in the fact that SEA focuses primarily on environmental effects whereas SA is concerned with the full range of environmental, social and economic considerations (see Figure 1 below). Figure 1
It is possible to combine the processes of SEA and SA, as they share a number of similarities. Guidance 3 published by the Department for Communities and Local Government (DCLG) promotes a combined process (i.e. a process which assesses social, economic and environmental effects) and this is the approach that will be adopted for the emerging Local Plan. Whilst there are formalised approaches for both SA and SEA, only SEA has a legal obligation to perform certain activities. These legal obligations have been and will continue to be adhered to throughout the combined SA and SEA for the Local Plan. The combined SEA and SA is referred to as SA throughout the remaining sections of this Scoping Report.
Compliance with the SEA Directive Where this report addresses the requirements of the SEA Directive this will be explained in a box like this.
In 2005, DCLG produced a useful guidance document on undertaking SEA – ‘A Practical Guide to the SEA Directive’ - much of which is of relevance to the SA process.
1.5 The Scoping Report
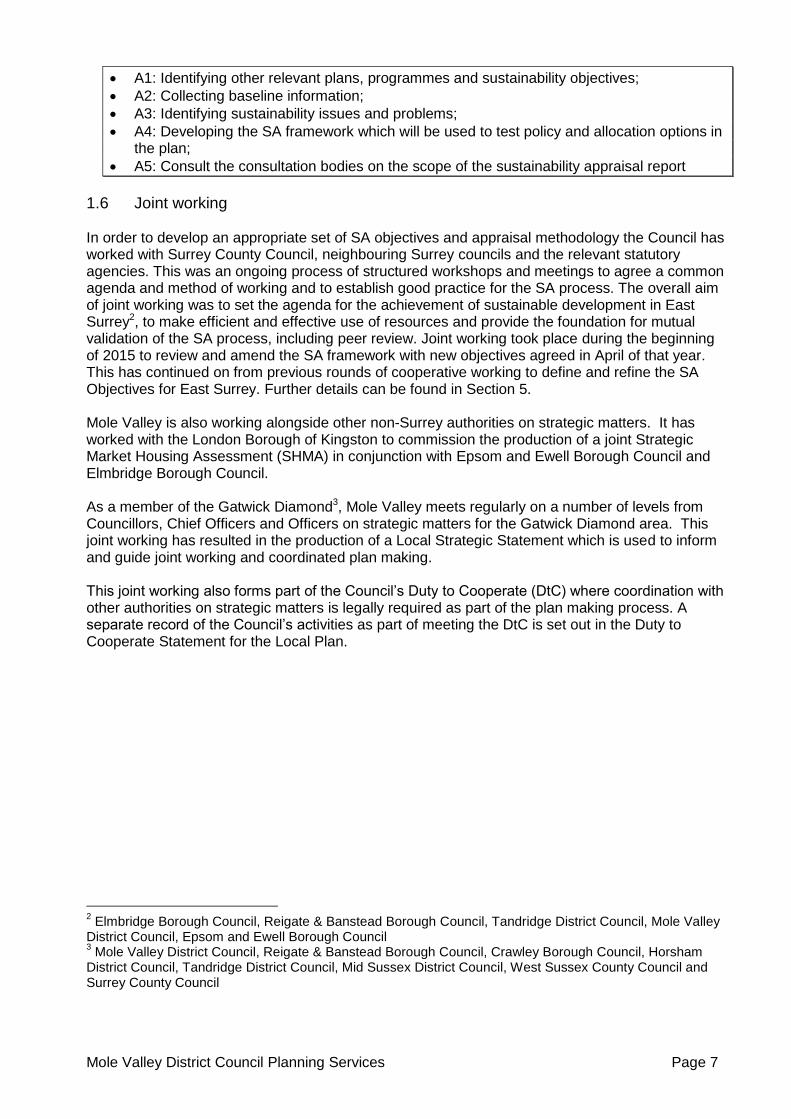
Government guidance subdivides the SA process into a series of stages. Whilst each stage consists of specific tasks, the intention should be that the process is iterative. This report is the result of work carried out for Stage A of the process and identifies the scope of the SA of the Mole Valley Local Plan. Stage A requires the completion of the following key tasks:
SA
Social
Environmental
Economic
SEA
Mole Valley District Council Planning Services Page 7
A1: Identifying other relevant plans, programmes and sustainability objectives;
A2: Collecting baseline information;
A3: Identifying sustainability issues and problems;
A4: Developing the SA framework which will be used to test policy and allocation options in the plan;
A5: Consult the consultation bodies on the scope of the sustainability appraisal report
1.6 Joint working
In order to develop an appropriate set of SA objectives and appraisal methodology the Council has worked with Surrey County Council, neighbouring Surrey councils and the relevant statutory agencies. This was an ongoing process of structured workshops and meetings to agree a common agenda and method of working and to establish good practice for the SA process. The overall aim of joint working was to set the agenda for the achievement of sustainable development in East Surrey2, to make efficient and effective use of resources and provide the foundation for mutual validation of the SA process, including peer review. Joint working took place during the beginning of 2015 to review and amend the SA framework with new objectives agreed in April of that year. This has continued on from previous rounds of cooperative working to define and refine the SA Objectives for East Surrey. Further details can be found in Section 5. Mole Valley is also working alongside other non-Surrey authorities on strategic matters. It has worked with the London Borough of Kingston to commission the production of a joint Strategic Market Housing Assessment (SHMA) in conjunction with Epsom and Ewell Borough Council and Elmbridge Borough Council. As a member of the Gatwick Diamond3, Mole Valley meets regularly on a number of levels from Councillors, Chief Officers and Officers on strategic matters for the Gatwick Diamond area. This joint working has resulted in the production of a Local Strategic Statement which is used to inform and guide joint working and coordinated plan making. This joint working also forms part of the Council’s Duty to Cooperate (DtC) where coordination with other authorities on strategic matters is legally required as part of the plan making process. A separate record of the Council’s activities as part of meeting the DtC is set out in the Duty to Cooperate Statement for the Local Plan.
2 Elmbridge Borough Council, Reigate & Banstead Borough Council, Tandridge District Council, Mole Valley
District Council, Epsom and Ewell Borough Council 3 Mole Valley District Council, Reigate & Banstead Borough Council, Crawley Borough Council, Horsham
District Council, Tandridge District Council, Mid Sussex District Council, West Sussex County Council and Surrey County Council
Mole Valley District Council Planning Services Page 8
2. Stage A1 – Identifying other relevant plans, programmes and sustainability objectives
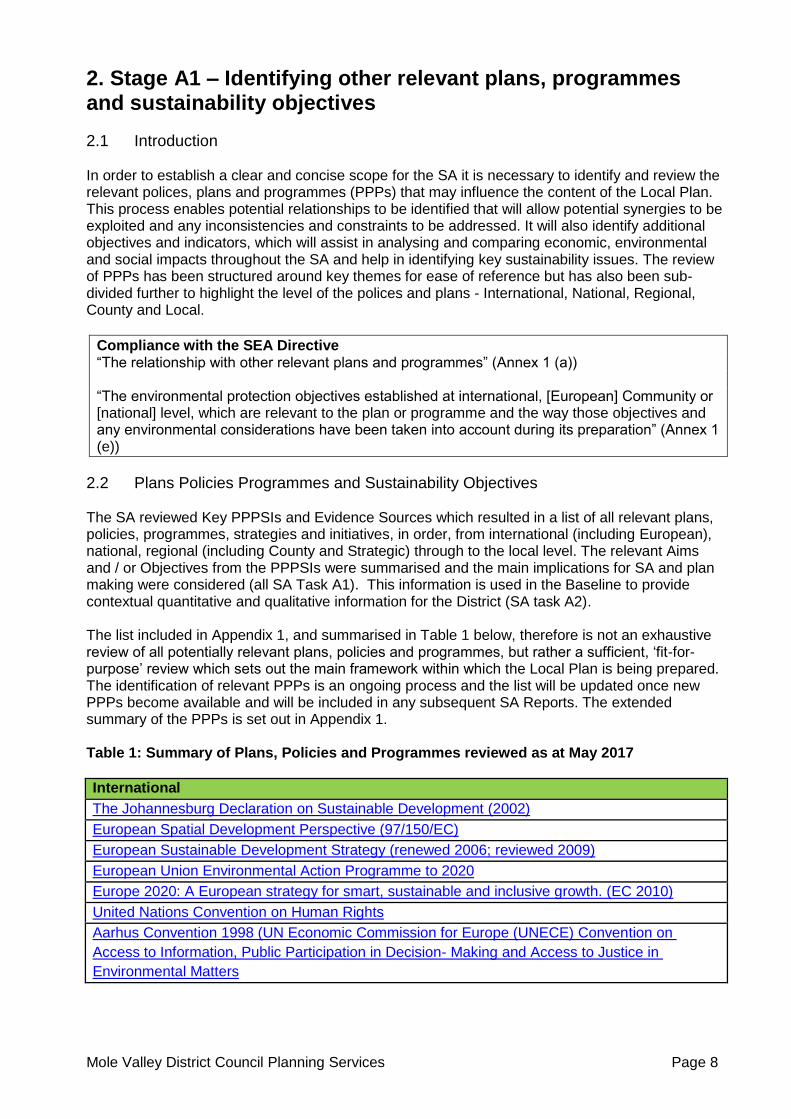
2.1 Introduction In order to establish a clear and concise scope for the SA it is necessary to identify and review the relevant polices, plans and programmes (PPPs) that may influence the content of the Local Plan. This process enables potential relationships to be identified that will allow potential synergies to be exploited and any inconsistencies and constraints to be addressed. It will also identify additional objectives and indicators, which will assist in analysing and comparing economic, environmental and social impacts throughout the SA and help in identifying key sustainability issues. The review of PPPs has been structured around key themes for ease of reference but has also been sub-divided further to highlight the level of the polices and plans - International, National, Regional, County and Local.
Compliance with the SEA Directive “The relationship with other relevant plans and programmes” (Annex 1 (a)) “The environmental protection objectives established at international, [European] Community or [national] level, which are relevant to the plan or programme and the way those objectives and any environmental considerations have been taken into account during its preparation” (Annex 1 (e))
2.2 Plans Policies Programmes and Sustainability Objectives The SA reviewed Key PPPSIs and Evidence Sources which resulted in a list of all relevant plans, policies, programmes, strategies and initiatives, in order, from international (including European), national, regional (including County and Strategic) through to the local level. The relevant Aims and / or Objectives from the PPPSIs were summarised and the main implications for SA and plan making were considered (all SA Task A1). This information is used in the Baseline to provide contextual quantitative and qualitative information for the District (SA task A2). The list included in Appendix 1, and summarised in Table 1 below, therefore is not an exhaustive review of all potentially relevant plans, policies and programmes, but rather a sufficient, ‘fit-for-purpose’ review which sets out the main framework within which the Local Plan is being prepared. The identification of relevant PPPs is an ongoing process and the list will be updated once new PPPs become available and will be included in any subsequent SA Reports. The extended summary of the PPPs is set out in Appendix 1. Table 1: Summary of Plans, Policies and Programmes reviewed as at May 2017
International
The Johannesburg Declaration on Sustainable Development (2002)
European Spatial Development Perspective (97/150/EC)
European Sustainable Development Strategy (renewed 2006; reviewed 2009)
European Union Environmental Action Programme to 2020
Europe 2020: A European strategy for smart, sustainable and inclusive growth. (EC 2010)
United Nations Convention on Human Rights
Aarhus Convention 1998 (UN Economic Commission for Europe (UNECE) Convention on
Access to Information, Public Participation in Decision- Making and Access to Justice in
Environmental Matters

Mole Valley District Council Planning Services Page 9
European Strategic Environmental Assessment Directive (2001/42/EC)
European Environmental Impact Assessment Directive (97/11/EC)
European Noise Directive (2002/49/EC)
European Air Quality Directive (2008/50/EC)
European Wastewater Treatment Directive (1991/271/EEC)
European Nitrates Directive (91/676/EEC)
European Water Framework Directive (2000/60/EC)
European Energy Performance of Buildings Directive (2002/91/EC)
European Waste Framework Directive (2008)/98/EC)
European Flood Risk Directive (2007/60/EC)
Convention on Climate Change and Biological Diversity: Earth Summit (1992)
Renewable Energy Directive (2009/28/EC)
Kyoto Protocol on Climate Change (2012)
United Nations Convention (Ramsar) on Wetlands of International Importance (1971)
European Birds Directive (79/409/EEC) (2009/147/EC)
European Habitats Directive (92/43/EEC)
The European Landscape Convention (2004)
Granada Convention/Convention for the Protection of Architectural Heritage of Europe (1985)
The European (Valletta) Convention on the Protection of the Archaeological Heritage (Revised)
(2000)
Florence Framework Convention on the Value of Cultural Heritage for Society (2005)
National
The Great Repeal Bill (2017)
Securing the future: delivering UK Sustainable Development Strategy (2005)
UK’s Shared Framework for Sustainable Development (2005)
Equality Act 2010
National Planning Policy Framework (2012) (and supporting guidance)
Ministerial Statement: Local Plans
UK Government Housing White Paper: fixing our broken housing market
Housing and Planning Act 2016
Planning Policy for traveller sites (2012; updated 2015)
Health and Social Care Act 2012
Self-build and Custom Housebuilding Act 2015
National Planning Policy for Waste (2014)
Natural Environment and Rural Communities Act (2006)
Flood and Water Management Act 2010
Future Water: The government’s water strategy for England (2011)
Climate Change Act (2008) (as amended)
UK Renewable Energy Action Plan (2010)
Infrastructure Act (2015)
Wildlife and Countryside Act
Biodiversity 2020: A strategy for England’s wildlife and ecosystem services (2011)
Natural Environment White Paper – The Natural Choice: securing the value of nature (2011)
Ancient Monuments and Archaeological Areas Act 1979
Mole Valley District Council Planning Services Page 10
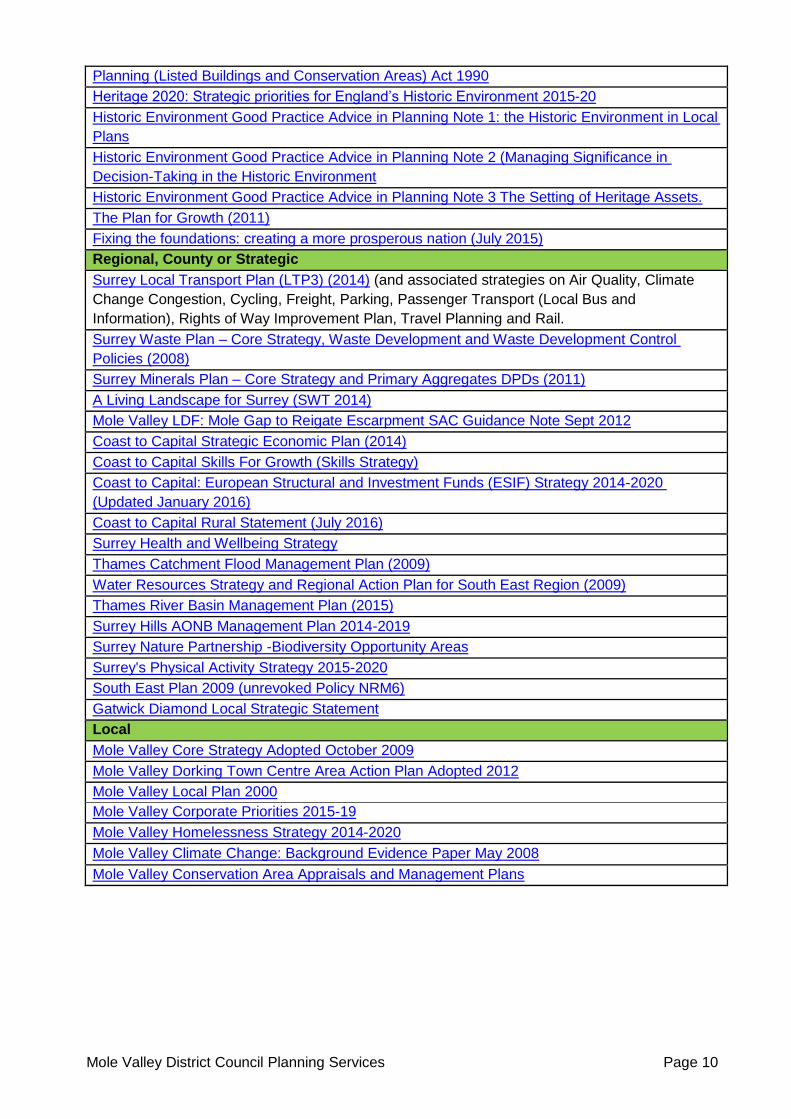
Planning (Listed Buildings and Conservation Areas) Act 1990
Heritage 2020: Strategic priorities for England’s Historic Environment 2015-20
Historic Environment Good Practice Advice in Planning Note 1: the Historic Environment in Local
Plans
Historic Environment Good Practice Advice in Planning Note 2 (Managing Significance in
Decision-Taking in the Historic Environment
Historic Environment Good Practice Advice in Planning Note 3 The Setting of Heritage Assets.
The Plan for Growth (2011)
Fixing the foundations: creating a more prosperous nation (July 2015)
Regional, County or Strategic
Surrey Local Transport Plan (LTP3) (2014) (and associated strategies on Air Quality, Climate
Change Congestion, Cycling, Freight, Parking, Passenger Transport (Local Bus and
Information), Rights of Way Improvement Plan, Travel Planning and Rail.
Surrey Waste Plan – Core Strategy, Waste Development and Waste Development Control
Policies (2008)
Surrey Minerals Plan – Core Strategy and Primary Aggregates DPDs (2011)
A Living Landscape for Surrey (SWT 2014)
Mole Valley LDF: Mole Gap to Reigate Escarpment SAC Guidance Note Sept 2012
Coast to Capital Strategic Economic Plan (2014)
Coast to Capital Skills For Growth (Skills Strategy)
Coast to Capital: European Structural and Investment Funds (ESIF) Strategy 2014-2020
(Updated January 2016)
Coast to Capital Rural Statement (July 2016)
Surrey Health and Wellbeing Strategy
Thames Catchment Flood Management Plan (2009)
Water Resources Strategy and Regional Action Plan for South East Region (2009)
Thames River Basin Management Plan (2015)
Surrey Hills AONB Management Plan 2014-2019
Surrey Nature Partnership -Biodiversity Opportunity Areas
Surrey's Physical Activity Strategy 2015-2020
South East Plan 2009 (unrevoked Policy NRM6)
Gatwick Diamond Local Strategic Statement
Local
Mole Valley Core Strategy Adopted October 2009
Mole Valley Dorking Town Centre Area Action Plan Adopted 2012
Mole Valley Local Plan 2000
Mole Valley Corporate Priorities 2015-19
Mole Valley Homelessness Strategy 2014-2020
Mole Valley Climate Change: Background Evidence Paper May 2008
Mole Valley Conservation Area Appraisals and Management Plans
Mole Valley District Council Planning Services Page 11
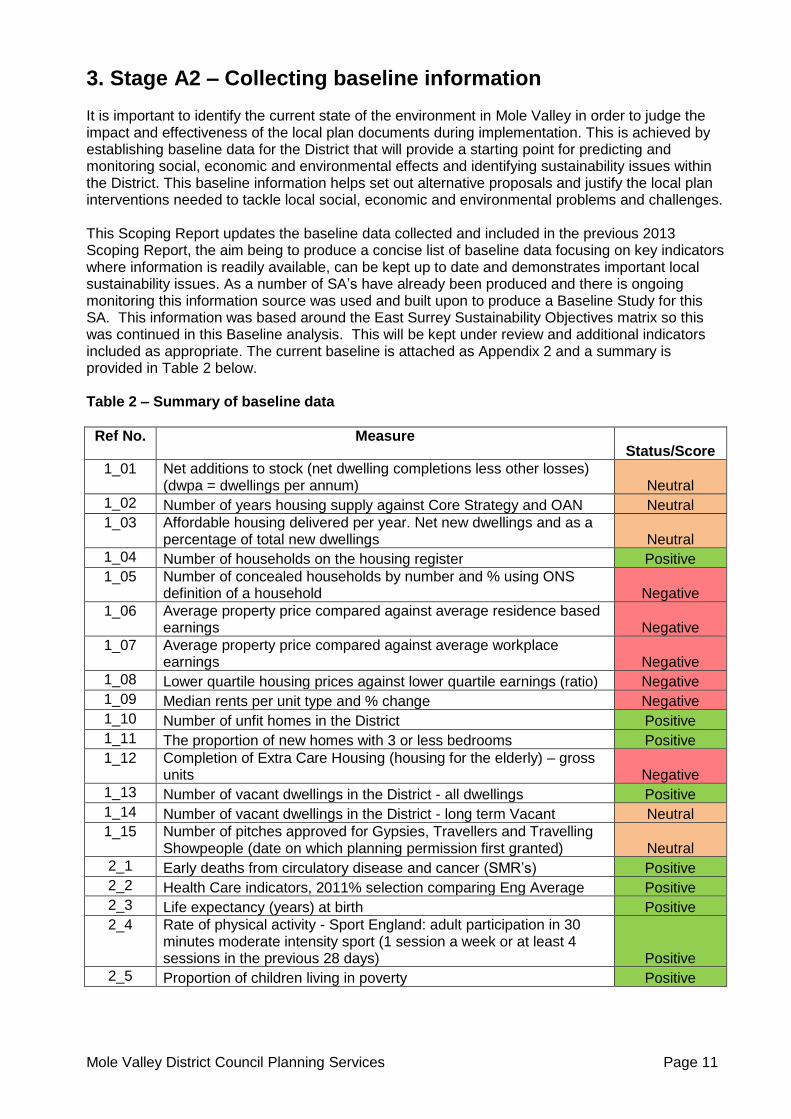
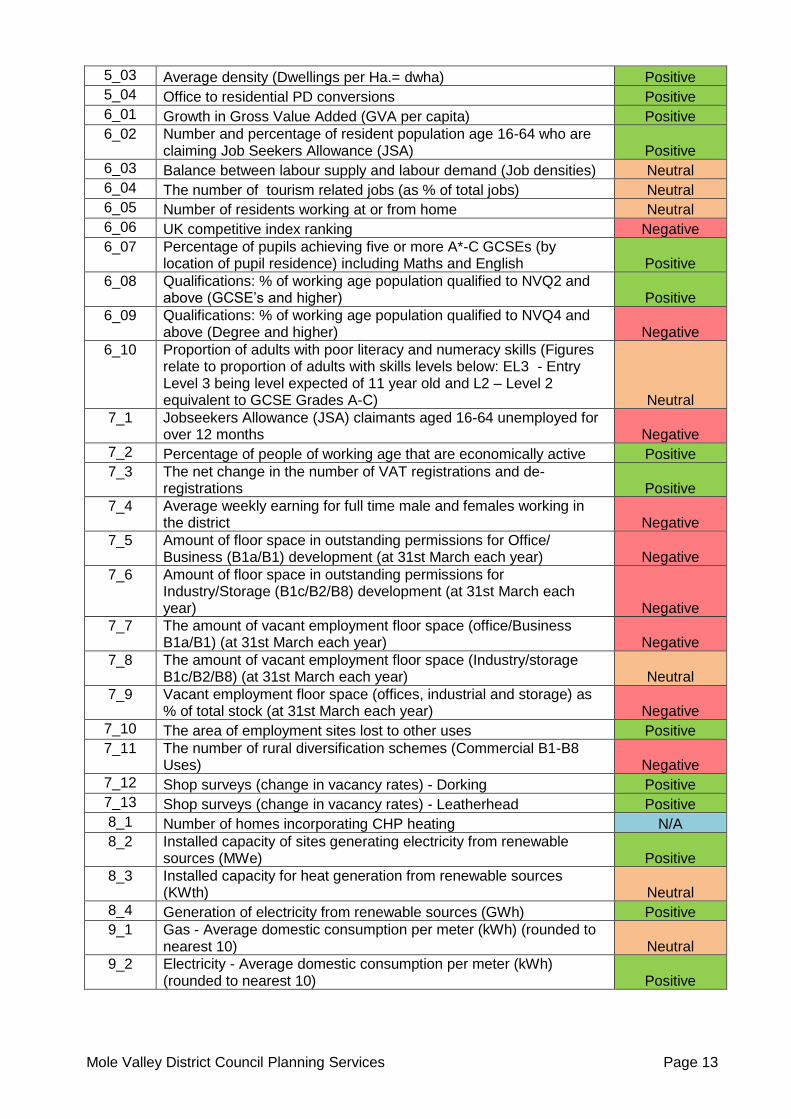
3. Stage A2 – Collecting baseline information It is important to identify the current state of the environment in Mole Valley in order to judge the impact and effectiveness of the local plan documents during implementation. This is achieved by establishing baseline data for the District that will provide a starting point for predicting and monitoring social, economic and environmental effects and identifying sustainability issues within the District. This baseline information helps set out alternative proposals and justify the local plan interventions needed to tackle local social, economic and environmental problems and challenges. This Scoping Report updates the baseline data collected and included in the previous 2013 Scoping Report, the aim being to produce a concise list of baseline data focusing on key indicators where information is readily available, can be kept up to date and demonstrates important local sustainability issues. As a number of SA’s have already been produced and there is ongoing monitoring this information source was used and built upon to produce a Baseline Study for this SA. This information was based around the East Surrey Sustainability Objectives matrix so this was continued in this Baseline analysis. This will be kept under review and additional indicators included as appropriate. The current baseline is attached as Appendix 2 and a summary is provided in Table 2 below. Table 2 – Summary of baseline data
Ref No. Measure Status/Score
1_01 Net additions to stock (net dwelling completions less other losses) (dwpa = dwellings per annum) Neutral
1_02 Number of years housing supply against Core Strategy and OAN Neutral
1_03 Affordable housing delivered per year. Net new dwellings and as a percentage of total new dwellings Neutral
1_04 Number of households on the housing register Positive
1_05 Number of concealed households by number and % using ONS definition of a household Negative
1_06 Average property price compared against average residence based earnings Negative
1_07 Average property price compared against average workplace earnings Negative
1_08 Lower quartile housing prices against lower quartile earnings (ratio) Negative
1_09 Median rents per unit type and % change Negative
1_10 Number of unfit homes in the District Positive
1_11 The proportion of new homes with 3 or less bedrooms Positive
1_12 Completion of Extra Care Housing (housing for the elderly) – gross units Negative
1_13 Number of vacant dwellings in the District - all dwellings Positive
1_14 Number of vacant dwellings in the District - long term Vacant Neutral
1_15 Number of pitches approved for Gypsies, Travellers and Travelling Showpeople (date on which planning permission first granted) Neutral
2_1 Early deaths from circulatory disease and cancer (SMR’s) Positive
2_2 Health Care indicators, 2011% selection comparing Eng Average Positive
2_3 Life expectancy (years) at birth Positive
2_4 Rate of physical activity - Sport England: adult participation in 30 minutes moderate intensity sport (1 session a week or at least 4 sessions in the previous 28 days) Positive
2_5 Proportion of children living in poverty Positive
Mole Valley District Council Planning Services Page 12
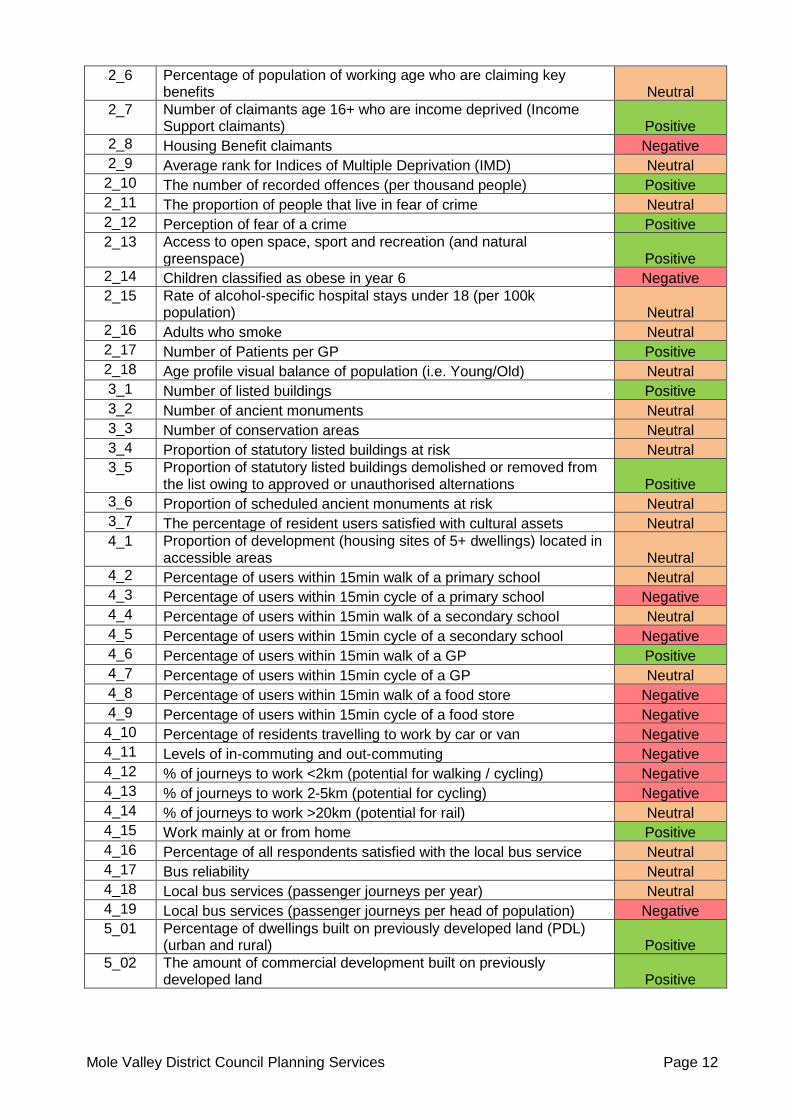
2_6 Percentage of population of working age who are claiming key benefits Neutral
2_7 Number of claimants age 16+ who are income deprived (Income Support claimants) Positive
2_8 Housing Benefit claimants Negative
2_9 Average rank for Indices of Multiple Deprivation (IMD) Neutral
2_10 The number of recorded offences (per thousand people) Positive
2_11 The proportion of people that live in fear of crime Neutral
2_12 Perception of fear of a crime Positive
2_13 Access to open space, sport and recreation (and natural greenspace) Positive
2_14 Children classified as obese in year 6 Negative
2_15 Rate of alcohol-specific hospital stays under 18 (per 100k population) Neutral
2_16 Adults who smoke Neutral
2_17 Number of Patients per GP Positive
2_18 Age profile visual balance of population (i.e. Young/Old) Neutral
3_1 Number of listed buildings Positive
3_2 Number of ancient monuments Neutral
3_3 Number of conservation areas Neutral
3_4 Proportion of statutory listed buildings at risk Neutral
3_5 Proportion of statutory listed buildings demolished or removed from the list owing to approved or unauthorised alternations Positive
3_6 Proportion of scheduled ancient monuments at risk Neutral
3_7 The percentage of resident users satisfied with cultural assets Neutral
4_1 Proportion of development (housing sites of 5+ dwellings) located in accessible areas Neutral
4_2 Percentage of users within 15min walk of a primary school Neutral
4_3 Percentage of users within 15min cycle of a primary school Negative
4_4 Percentage of users within 15min walk of a secondary school Neutral
4_5 Percentage of users within 15min cycle of a secondary school Negative
4_6 Percentage of users within 15min walk of a GP Positive
4_7 Percentage of users within 15min cycle of a GP Neutral
4_8 Percentage of users within 15min walk of a food store Negative
4_9 Percentage of users within 15min cycle of a food store Negative
4_10 Percentage of residents travelling to work by car or van Negative
4_11 Levels of in-commuting and out-commuting Negative
4_12 % of journeys to work <2km (potential for walking / cycling) Negative
4_13 % of journeys to work 2-5km (potential for cycling) Negative
4_14 % of journeys to work >20km (potential for rail) Neutral
4_15 Work mainly at or from home Positive
4_16 Percentage of all respondents satisfied with the local bus service Neutral
4_17 Bus reliability Neutral
4_18 Local bus services (passenger journeys per year) Neutral
4_19 Local bus services (passenger journeys per head of population) Negative
5_01 Percentage of dwellings built on previously developed land (PDL) (urban and rural) Positive
5_02 The amount of commercial development built on previously developed land Positive
Mole Valley District Council Planning Services Page 13
5_03 Average density (Dwellings per Ha.= dwha) Positive
5_04 Office to residential PD conversions Positive
6_01 Growth in Gross Value Added (GVA per capita) Positive
6_02 Number and percentage of resident population age 16-64 who are claiming Job Seekers Allowance (JSA) Positive
6_03 Balance between labour supply and labour demand (Job densities) Neutral
6_04 The number of tourism related jobs (as % of total jobs) Neutral
6_05 Number of residents working at or from home Neutral
6_06 UK competitive index ranking Negative
6_07 Percentage of pupils achieving five or more A*-C GCSEs (by location of pupil residence) including Maths and English Positive
6_08 Qualifications: % of working age population qualified to NVQ2 and above (GCSE’s and higher) Positive
6_09 Qualifications: % of working age population qualified to NVQ4 and above (Degree and higher) Negative
6_10 Proportion of adults with poor literacy and numeracy skills (Figures relate to proportion of adults with skills levels below: EL3 - Entry Level 3 being level expected of 11 year old and L2 – Level 2 equivalent to GCSE Grades A-C) Neutral
7_1 Jobseekers Allowance (JSA) claimants aged 16-64 unemployed for over 12 months Negative
7_2 Percentage of people of working age that are economically active Positive
7_3 The net change in the number of VAT registrations and de-registrations Positive
7_4 Average weekly earning for full time male and females working in the district Negative
7_5 Amount of floor space in outstanding permissions for Office/ Business (B1a/B1) development (at 31st March each year) Negative
7_6 Amount of floor space in outstanding permissions for Industry/Storage (B1c/B2/B8) development (at 31st March each year) Negative
7_7 The amount of vacant employment floor space (office/Business B1a/B1) (at 31st March each year) Negative
7_8 The amount of vacant employment floor space (Industry/storage B1c/B2/B8) (at 31st March each year) Neutral
7_9 Vacant employment floor space (offices, industrial and storage) as % of total stock (at 31st March each year) Negative
7_10 The area of employment sites lost to other uses Positive
7_11 The number of rural diversification schemes (Commercial B1-B8 Uses) Negative
7_12 Shop surveys (change in vacancy rates) - Dorking Positive
7_13 Shop surveys (change in vacancy rates) - Leatherhead Positive
8_1 Number of homes incorporating CHP heating N/A
8_2 Installed capacity of sites generating electricity from renewable sources (MWe) Positive
8_3 Installed capacity for heat generation from renewable sources (KWth) Neutral
8_4 Generation of electricity from renewable sources (GWh) Positive
9_1 Gas - Average domestic consumption per meter (kWh) (rounded to nearest 10) Neutral
9_2 Electricity - Average domestic consumption per meter (kWh) (rounded to nearest 10) Positive
Mole Valley District Council Planning Services Page 14
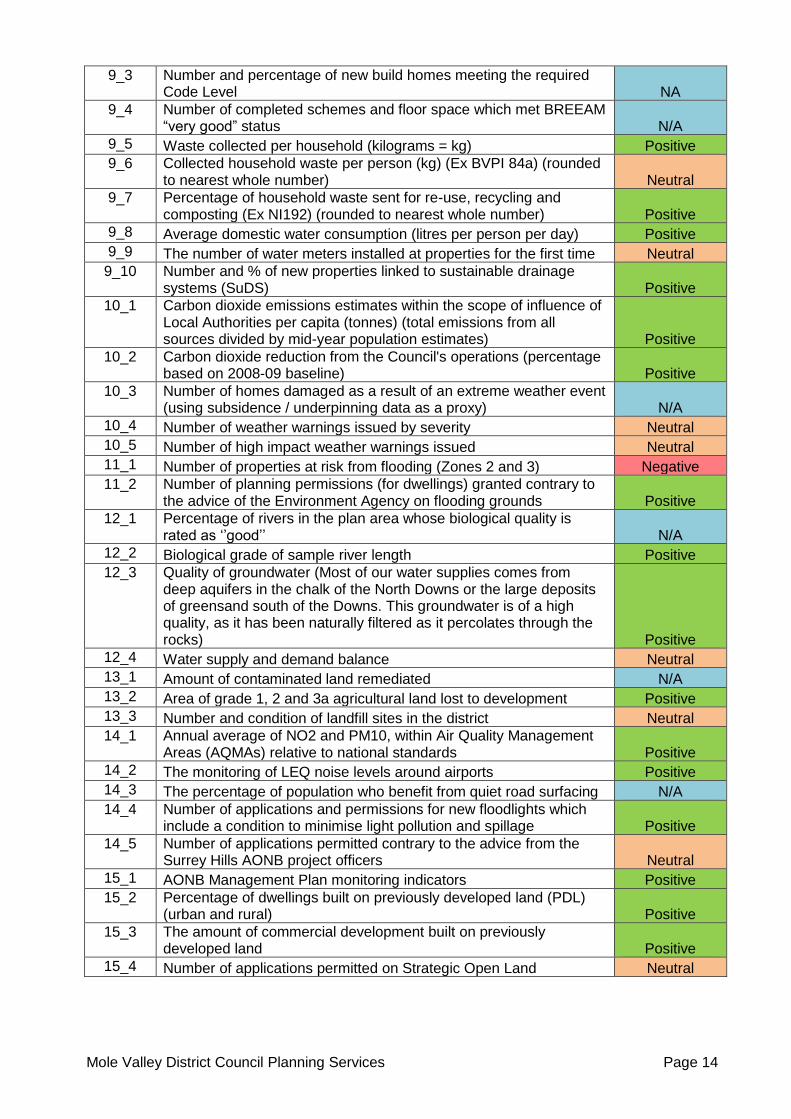
9_3 Number and percentage of new build homes meeting the required Code Level NA
9_4 Number of completed schemes and floor space which met BREEAM “very good” status N/A
9_5 Waste collected per household (kilograms = kg) Positive
9_6 Collected household waste per person (kg) (Ex BVPI 84a) (rounded to nearest whole number) Neutral
9_7 Percentage of household waste sent for re-use, recycling and composting (Ex NI192) (rounded to nearest whole number) Positive
9_8 Average domestic water consumption (litres per person per day) Positive
9_9 The number of water meters installed at properties for the first time Neutral
9_10 Number and % of new properties linked to sustainable drainage systems (SuDS) Positive
10_1 Carbon dioxide emissions estimates within the scope of influence of Local Authorities per capita (tonnes) (total emissions from all sources divided by mid-year population estimates) Positive
10_2 Carbon dioxide reduction from the Council's operations (percentage based on 2008-09 baseline) Positive
10_3 Number of homes damaged as a result of an extreme weather event (using subsidence / underpinning data as a proxy) N/A
10_4 Number of weather warnings issued by severity Neutral
10_5 Number of high impact weather warnings issued Neutral
11_1 Number of properties at risk from flooding (Zones 2 and 3) Negative
11_2 Number of planning permissions (for dwellings) granted contrary to the advice of the Environment Agency on flooding grounds Positive
12_1 Percentage of rivers in the plan area whose biological quality is rated as ‘’good’’ N/A
12_2 Biological grade of sample river length Positive
12_3 Quality of groundwater (Most of our water supplies comes from deep aquifers in the chalk of the North Downs or the large deposits of greensand south of the Downs. This groundwater is of a high quality, as it has been naturally filtered as it percolates through the rocks) Positive
12_4 Water supply and demand balance Neutral
13_1 Amount of contaminated land remediated N/A
13_2 Area of grade 1, 2 and 3a agricultural land lost to development Positive
13_3 Number and condition of landfill sites in the district Neutral
14_1 Annual average of NO2 and PM10, within Air Quality Management Areas (AQMAs) relative to national standards Positive
14_2 The monitoring of LEQ noise levels around airports Positive
14_3 The percentage of population who benefit from quiet road surfacing N/A
14_4 Number of applications and permissions for new floodlights which include a condition to minimise light pollution and spillage Positive
14_5 Number of applications permitted contrary to the advice from the Surrey Hills AONB project officers Neutral
15_1 AONB Management Plan monitoring indicators Positive
15_2 Percentage of dwellings built on previously developed land (PDL) (urban and rural) Positive
15_3 The amount of commercial development built on previously developed land Positive
15_4 Number of applications permitted on Strategic Open Land Neutral
Mole Valley District Council Planning Services Page 15
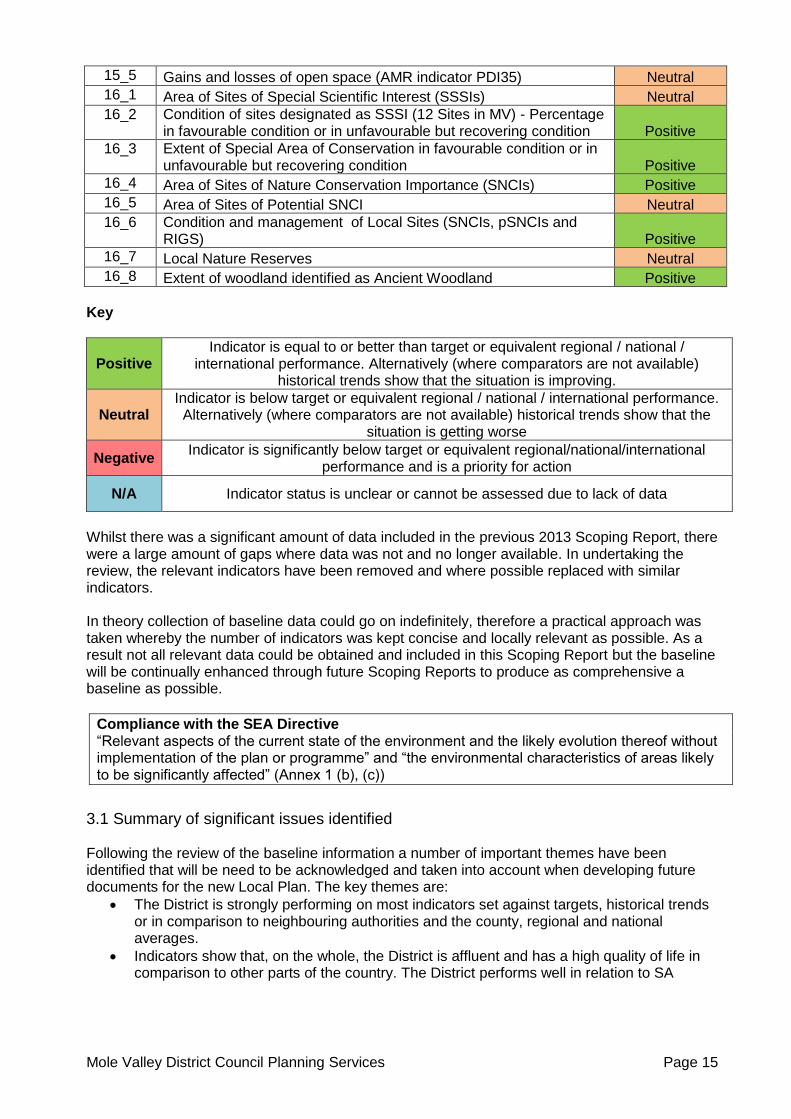
15_5 Gains and losses of open space (AMR indicator PDI35) Neutral
16_1 Area of Sites of Special Scientific Interest (SSSIs) Neutral
16_2 Condition of sites designated as SSSI (12 Sites in MV) - Percentage in favourable condition or in unfavourable but recovering condition Positive
16_3 Extent of Special Area of Conservation in favourable condition or in unfavourable but recovering condition Positive
16_4 Area of Sites of Nature Conservation Importance (SNCIs) Positive
16_5 Area of Sites of Potential SNCI Neutral
16_6 Condition and management of Local Sites (SNCIs, pSNCIs and RIGS) Positive
16_7 Local Nature Reserves Neutral
16_8 Extent of woodland identified as Ancient Woodland Positive
Key
Positive Indicator is equal to or better than target or equivalent regional / national /
international performance. Alternatively (where comparators are not available) historical trends show that the situation is improving.
Neutral Indicator is below target or equivalent regional / national / international performance. Alternatively (where comparators are not available) historical trends show that the
situation is getting worse
Negative Indicator is significantly below target or equivalent regional/national/international
performance and is a priority for action
N/A Indicator status is unclear or cannot be assessed due to lack of data
Whilst there was a significant amount of data included in the previous 2013 Scoping Report, there were a large amount of gaps where data was not and no longer available. In undertaking the review, the relevant indicators have been removed and where possible replaced with similar indicators. In theory collection of baseline data could go on indefinitely, therefore a practical approach was taken whereby the number of indicators was kept concise and locally relevant as possible. As a result not all relevant data could be obtained and included in this Scoping Report but the baseline will be continually enhanced through future Scoping Reports to produce as comprehensive a baseline as possible.
Compliance with the SEA Directive “Relevant aspects of the current state of the environment and the likely evolution thereof without implementation of the plan or programme” and “the environmental characteristics of areas likely to be significantly affected” (Annex 1 (b), (c))
3.1 Summary of significant issues identified Following the review of the baseline information a number of important themes have been identified that will be need to be acknowledged and taken into account when developing future documents for the new Local Plan. The key themes are:
The District is strongly performing on most indicators set against targets, historical trends or in comparison to neighbouring authorities and the county, regional and national averages.
Indicators show that, on the whole, the District is affluent and has a high quality of life in comparison to other parts of the country. The District performs well in relation to SA
Mole Valley District Council Planning Services Page 16
objectives on Biodiversity, flora and fauna; cultural heritage and the historic environment; the economy, and health and well-being.
The latest housing projections indicate that there is a housing requirement of 391 homes per annum required to meet accommodation needs which would not be met by the estimated current supply or the historical provision. There is a significant need for Gypsy and Traveller Sites.
Confidence and investment in the leisure, retail and employment sectors has been demonstrated and is ongoing. With low unemployment rates and high workplace earnings there is difficulty recruiting and retaining staff. A high proportion of the workforce are professionals; a small number of the workforce is low skilled; a high proportion of people are self employed. To serve the local market to fill lower skilled and paid jobs due to the high house and rental prices, employers have to attract workers from other areas.
Employment office floor space is being lost because under current economic conditions, it is preferable and more profitable to convert low quality office floor space, usually within town centres, into housing.
The amount of carbon dioxide produced per head of the district’s population is falling albeit not year by year. Despite the most recent figure being the lowest amount of CO2 per capita since 2005, it is still above the county, regional and national average.
Domestic gas and electricity consumption per meter in the district has fallen but gas and electricity consumption in the district is higher than the regional and national averages.
Affordability of housing is an issue. With high house prices and rents which are particularly high for lower income households. The number and delivery of new affordable housing is not keeping up with the need on a year by year basis.
Mole Valley District Council Planning Services Page 17
4. Stage A3 – Identifying sustainability issues
Based on the conclusions from the plans, programmes and policies and the baseline data detailed in the previous sections, table 3 below sets out the main characteristics of the District including a range of key facts covering issues such as population, transport and health. From this information the following key sustainability issues have been identified for Mole Valley:
Compliance with the SEA Directive “Any existing environmental problems which are relevant to the plan or programme including, in particular, those relating to any areas of particular environmental importance, such as areas designated pursuant to Directives 79/409/EEC and 92/43/EEC” (Annex 1 (d))
Summary of SA Baseline Data: Objective 1 – Housing to meet the needs of the population
The latest housing projections indicate that there is a housing requirement of 391 homes per annum required to meet accommodation needs which would not be met by the estimated current supply or the historical provision which over the last 10 years has been an average of 221 dwellings per annum, only 56% of the indicative housing need. There is a sharply rising increase in concealed households.
The number of households on the housing register is starting to rise. In 2015 there were 485 but this rose by an additional 40 households in 2016 and an additional 56 households in 2017 to take the number to 485. With an average of 41 affordable housing units being delivered per year, which is below the Core Strategy target, a backlog will continue to build up.
The cost of lower quartile properties against lower quartile earnings of the resident population is at a ratio of 10.70 (2014 figures) which is higher than England (8.2) and the South East (8.83). This indicates that affordability is and remains a key problem in the district as well as the housing market area. This is alongside the high private sector rental prices which make it difficult to save for a deposit for a home.
There is an increasing elderly population, particularly in the 85+ age group, that is predicted to grow by 71% by 2026.
The SHMA identifies a significant need for smaller dwellings, with over 90% of objectively assessed needs being for dwellings of three bedrooms or fewer.
Evidence about future accommodation needs for gypsies, travellers and travelling show-people is being updated at the time of writing, but the most recent published accommodation assessment indicated a significant need for additional sites.
Objective 2 – Health and Wellbeing
The population of Mole Valley is relatively healthy, with a higher than average life expectancy for females (85) and males (82) when compared to the England average of 82 for females and 79 for males. This trend is also rising. There are some specific health issues such as childhood obesity and the number of adults who smoke rising but still below the Surrey or England levels.
Although the district scores well in the Indices of Multiple deprivation there are pockets where there are low scores that stand out against the rest of the district.
Mole Valley District Council Planning Services Page 18
Objective 3 – Historic and Cultural Assets
Mole Valley contains a wide range of areas, buildings and monuments of historic value designated at both a statutory and local level. Many of these are well protected, looked after and maintained; however there are still some ongoing issues. These include the threat of development on and to heritage and cultural assets, including open spaces and views. The vast majority of listed buildings and structures in the District are in good condition, however they can become at risk, and there has been a negative trend in the number of buildings at risk within the District. Those that are at risk require funding, work and maintenance to ensure that they are not damaged or lost.
Objective 4 – Travel and Sustainable Transport
Car ownership is high and the percentage of people travelling to work by car or van appears to have increased substantially between 2001 and 2011. This is reflected in a trend of fewer short journeys to work being undertaken by walking and cycling in the same time period.
Public transport has a poor reliability rate compared to national averages with the recent Southern railway issues of strikes combined with cancelled and late trains a particularly poor indicator. Local bus reliability is significantly below county or national averages.
There has been an increase in the in-commuting into the district as well as out-commuting; if these are car based journeys as trends suggest, this would result in increased congestion.
Objective 5 – Make the best use of Previously Developed Land
Historically, most housing development in Mole Valley has taken place on previously developed land (PDL). In 2014-2015 the proportion of completions on PDL was 70%. In August 2015 the government’s Land Use Change Statistic indicated that 57% of new residential addresses created in 2014-2015 (not including conversions) were created on previously developed land. Therefore MVDC exceeds that national figure.
The DCLG Land Use Change Statistics for 2014-2015 indicates a national average of 37dwpa (however the DCLG method of calculation is based on the number of properties within 1ha of the new address rather than the number of new dwellings on the extent of the development site). MVDC currently has an average density of 38.5dwpa on sites of 10 or more dwellings, with an average density of 28.7dwpa for all sites.
In 2014-15 65% of commercial development was on PDL, although the amount of floor space was low (482m2). Commercial development may also occur through the conversion of agricultural buildings which are not defined as PDL.
One effective reuse of previously developed land has been the change of use of offices to residential since 2013 which has yielded 190 housing units and the loss of 17,550m2 of office floor space.
Objective 6 – Economic Growth
The local economy is healthy with the GVA increasing 14% compared to 6.4% across the South East Region.
The competitive index rating is falling with MVDC ranking 23rd of 379 local authorities in 2016, down from ranking 12th in 2010. In 2013, Mole Valley ranked 5th nationally in terms of Tech Clusters. By 2015 it had fallen out of the top 30.
Mole Valley District Council Planning Services Page 19
The population of Mole Valley is highly qualified compared to the regional and national averages however the gap between national and regional averages is lessening.
Objective 7 – Employment Opportunities
Unemployment levels are low but there is an increasing trend and pockets of higher unemployment in deprived areas. Compared to the South East (81%) and Great Britain (78%), there are a large and increasing rate of people who are economically active in Mole Valley at 88%.
There is an increasing trend of new businesses setting up but this rate is not as high as Surrey or England.
There is an increasing rate of vacant office and commercial floor space, but this remains lower than the national or regional averages.
Retail vacancies are low and are improving.
Objective 8 – Greenhouse Gas Emissions and Low Carbon Economy
The capacity of sites generating electricity from renewable resources has increased by nine times across South East England between 2007 and 2015, ahead of the rate of increase nationally (x8.29). The generation of electricity from renewable sources in the South East has also increased by x4.81 between 2007 and 2015, with the average nationwide increase at x5.57.
Objective 9 – Using Natural Resources Prudently
Domestic gas and electricity consumption per meter in the district has fallen between 2005 and 2015, though not year on year. Despite the overall trend decreasing, domestic gas and electricity consumption in the district is higher than the regional and national averages.
Household waste collected per person in the district varies year on year, averaging 390kg per annum between 2008 and 2016, though the high of 399kg in 2008-09 has not been exceeded in the following years. Despite the fluctuation in figures, the district remains below the Surrey average. When household waste was sent for re-use, recycling or composting, Mole Valley consistently exceeds targets with 59% of waste sent for re-use, recycling or composting in 2015-16 in comparison to the Surrey average of 55%. The percentage in the district has not fallen below 50% since 2008-09, when the Surrey average was 41%.
Average domestic water consumption in the SES Water area, of which Mole Valley is in, has fallen marginally at 160.9 litres per person per day in 2015-16 compared to 161.1 the year before. This is below the target of 161.2 litres per person per day but a faster progression is needed to meet the 2020 target of 156.9 litres per person per day. Installing water meters will help, with more than 32,000 water meters installed for the first time between 2010 and 2015, achieving SES Water’s target. SES Water has since set a target of 6,400 meter installations per annum with 2015-16 figures showing 6,333 meter installations, below the new target.
Objective 10 – Climate Change
The amount of carbon dioxide produced per head of the district’s population is falling albeit not year by year. Despite the most recent figure being the lowest amount of CO2 per capita since 2005, it is still above the county, regional and national average.
The number and severity of weather warnings issued annually since 2012 in Surrey and the South East region has decreased, albeit an increase in 2016 on 2015’s figures. The number of high impact weather warnings issued for Surrey and South East
Mole Valley District Council Planning Services Page 20
England follows an identical trend. While the number and impact of extreme weather events has decreased, further development of this indicator is needed to give a more accurate picture.
Objective 11 – Flooding
The River Mole and its tributaries are the main source of fluvial flooding in the District, although the west of the District is also within the catchment areas of the River Wey (Tillingbourne) and the River Arun. A number of areas in the District are also susceptible to surface water flooding, including a number of the rural villages and the built up areas of Bookham and Fetcham. The number of properties at risk from flooding (in Flood Zones 2 and 3) shows a negative trend, increasing from 2,047 in 2014 to 2,057 in 2015. However, all permitted / built sites require a Flood Risk Management Appraisal. The number of applications or dwellings per annum granted contrary to Environment Agency advice continues to be minimal (often zero).
Objective 12 – Water
The biological grades of sample river lengths within the District are consistently good when tested for chemicals, and poor to moderate when tested for ecology. Although this indicates that there is room for improvement, it should also be noted that in some instances the Environment Agency has acknowledged that there are no known technical solutions available for improving the ecological quality of the river.
Most of Mole Valley’s water supply comes from deep aquifers in the chalk of the North Downs or the large deposits of greensand south of the Downs. This groundwater is of a high quality, as it has been naturally filtered as it percolates through the rocks. In 2016 the overall water quality in the District was 99.95% (the set target is 100%) which shows an improving trend.
Objective 13 – Land Contamination and Soil Quality
There are no contaminated land sites requiring remediation and landfill sites are all in good condition.
There has been no significant loss of agricultural land.
Objective 14 – Air Quality and Noise and Light Pollution
There are no areas that require an Air Quality Management Area in the district and there is an improvement in air quality that has been observed since 2008.
Noise associated with Gatwick Airport has improved with the area of land affected by noise in the district decreasing.
Where there have been proposals to put in floodlighting or security lighting, those that have been approved have included conditions limiting its effect.
Objective 15 – Landscape Character
The landscape management plan for the AONB has been put into effect, protecting this landscape character resource. No indicators identify any issues contrary to the aim of landscape protection.
Objective 16 – Biodiversity
Protected sites continue to be preserved and enhanced. The extent of the Special Area of Conservation in favourable condition improves.
SAC and SPA will need to be protected to meet the HRA requirements.

Mole Valley District Council Planning Services Page 21
5. Stage A4 – Developing the SA framework Defining the SA framework is important as it sets out the structure and format for appraising and monitoring the implementation of the Local Plan. The SA framework outlined in this report takes account of guidance that recommends the development of objectives and indicators. Objectives are set at strategic level and expressed in the terms of targets achievable through defined indicators taken from the baseline data.
5.1 Methodology Good practice suggests that the number of SA objectives should be kept to the minimum amount required to carry out the appraisal effectively but not make it unmanageable. A joint exercise to review and update the framework was undertaken by the East Surrey authorities in April 2015. As a result, 16 SA objectives were agreed and these are set out in Table 4 below. This review followed on from previous iterations of the East Surrey Objectives agreed in the past, such as those agreed in 2012. The overall aim of the review was to provide a more streamlined assessment framework that is locally relevant, up-to-date and reflects the key sustainability issues East Surrey districts and boroughs are facing. In addition to a joint review of the objectives, the accompanying indicators and decision aiding questions were reviewed in order to provide a more concise, locally relevant framework for the assessment with clearer links to monitoring effects. As a result, a number of decision aiding questions were added or removed where it was considered appropriate. Locally within the East Surrey Group members change or add Indicators to reflect their local circumstances. There are a number of areas where it is considered that further information that is not currently available may be collected and added at a future date alongside appropriate decision aiding questions, these include:
Traffic Modelling of the Strategy and Strategic Allocations
Viability Appraisal of the Strategy including Affordable Housing and Strategic Site Options
Flooding Study - Sequential Tests of the Strategic Sites
Appropriate Assessment of Protected Areas and Species It should be noted that some indicators will be relevant for multiple SA objectives and together will form a framework to monitor the sustainability of plans in Mole Valley. The SA framework will be subject to review following consultation and further identification of baseline data and at this stage all of the objectives are of equal priority. The framework for the SA will be used to assess all future documents and policies forming part of the new Mole Valley Local Plan.
Mole Valley District Council Planning Services Page 22
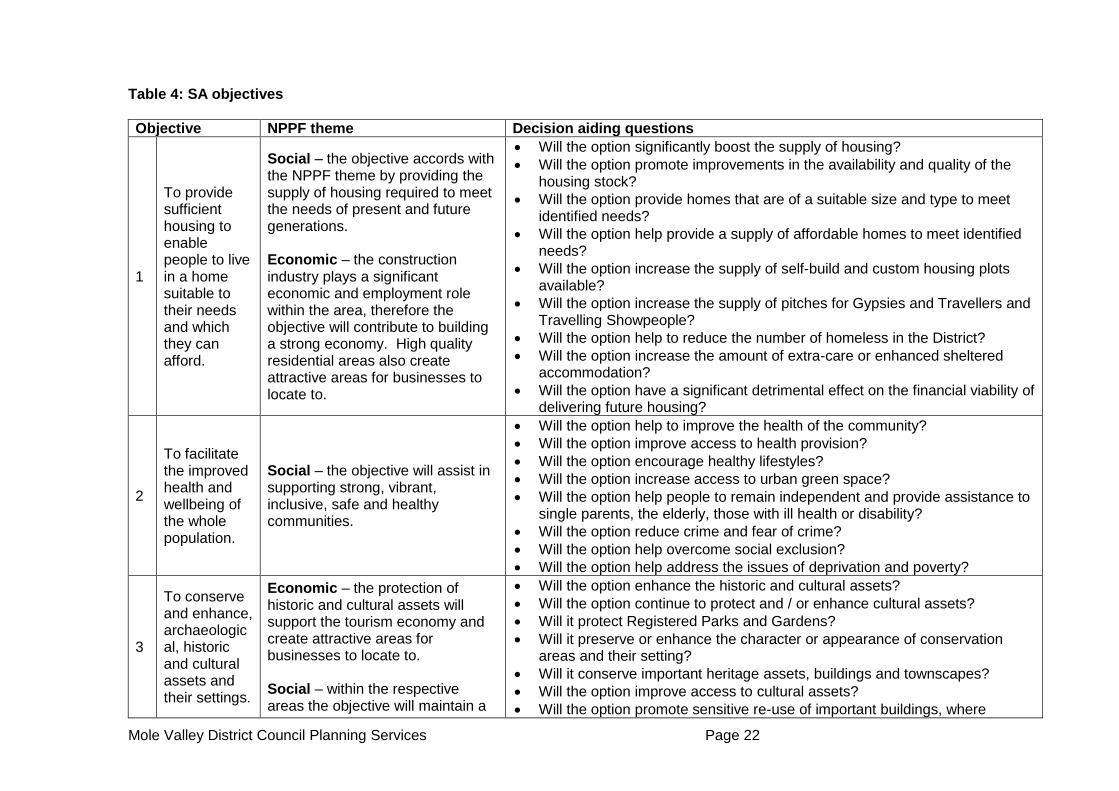
Table 4: SA objectives
Objective NPPF theme Decision aiding questions
1
To provide sufficient housing to enable people to live in a home suitable to their needs and which they can afford.
Social – the objective accords with the NPPF theme by providing the supply of housing required to meet the needs of present and future generations. Economic – the construction industry plays a significant economic and employment role within the area, therefore the objective will contribute to building a strong economy. High quality residential areas also create attractive areas for businesses to locate to.
Will the option significantly boost the supply of housing?
Will the option promote improvements in the availability and quality of the housing stock?
Will the option provide homes that are of a suitable size and type to meet identified needs?
Will the option help provide a supply of affordable homes to meet identified needs?
Will the option increase the supply of self-build and custom housing plots available?
Will the option increase the supply of pitches for Gypsies and Travellers and Travelling Showpeople?
Will the option help to reduce the number of homeless in the District?
Will the option increase the amount of extra-care or enhanced sheltered accommodation?
Will the option have a significant detrimental effect on the financial viability of delivering future housing?
2
To facilitate the improved health and wellbeing of the whole population.
Social – the objective will assist in supporting strong, vibrant, inclusive, safe and healthy communities.
Will the option help to improve the health of the community?
Will the option improve access to health provision?
Will the option encourage healthy lifestyles?
Will the option increase access to urban green space?
Will the option help people to remain independent and provide assistance to single parents, the elderly, those with ill health or disability?
Will the option reduce crime and fear of crime?
Will the option help overcome social exclusion?
Will the option help address the issues of deprivation and poverty?
3
To conserve and enhance, archaeological, historic and cultural assets and their settings.
Economic – the protection of historic and cultural assets will support the tourism economy and create attractive areas for businesses to locate to. Social – within the respective areas the objective will maintain a
Will the option enhance the historic and cultural assets?
Will the option continue to protect and / or enhance cultural assets?
Will it protect Registered Parks and Gardens?
Will it preserve or enhance the character or appearance of conservation areas and their setting?
Will it conserve important heritage assets, buildings and townscapes?
Will the option improve access to cultural assets?
Will the option promote sensitive re-use of important buildings, where
Mole Valley District Council Planning Services Page 23
Objective NPPF theme Decision aiding questions
high quality built environment. appropriate?
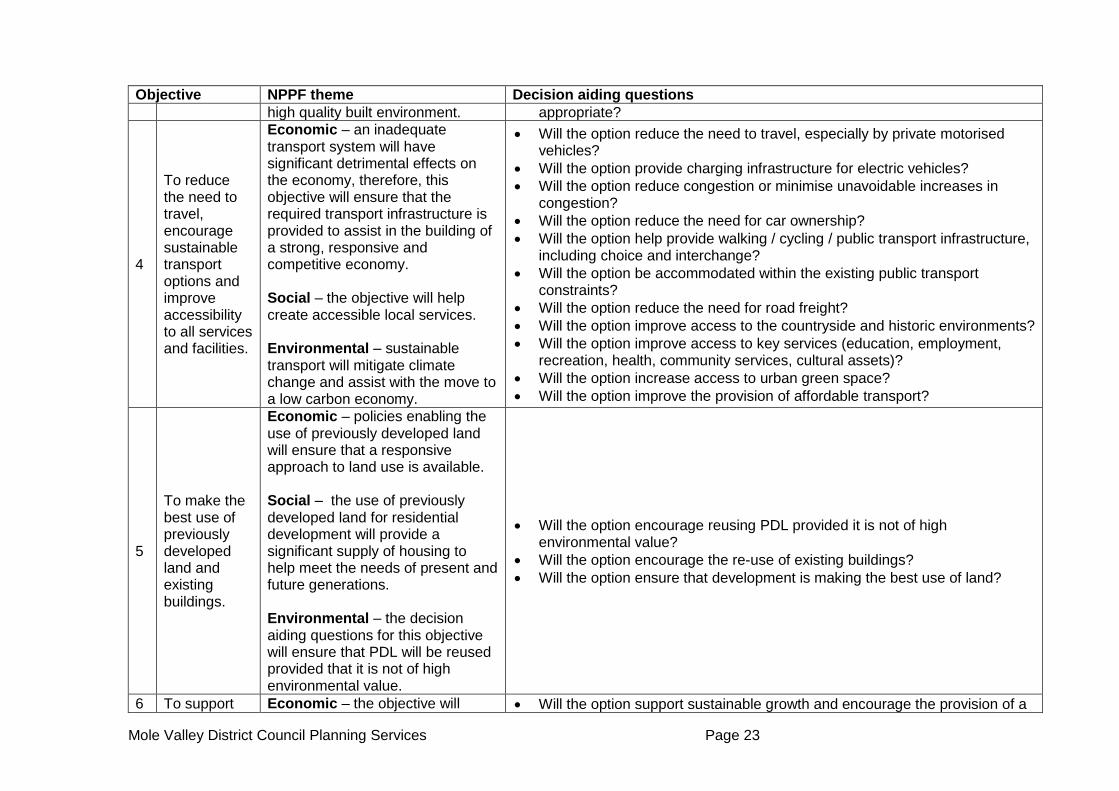
4
To reduce the need to travel, encourage sustainable transport options and improve accessibility to all services and facilities.
Economic – an inadequate transport system will have significant detrimental effects on the economy, therefore, this objective will ensure that the required transport infrastructure is provided to assist in the building of a strong, responsive and competitive economy. Social – the objective will help create accessible local services. Environmental – sustainable transport will mitigate climate change and assist with the move to a low carbon economy.
Will the option reduce the need to travel, especially by private motorised vehicles?
Will the option provide charging infrastructure for electric vehicles?
Will the option reduce congestion or minimise unavoidable increases in congestion?
Will the option reduce the need for car ownership?
Will the option help provide walking / cycling / public transport infrastructure, including choice and interchange?
Will the option be accommodated within the existing public transport constraints?
Will the option reduce the need for road freight?
Will the option improve access to the countryside and historic environments?
Will the option improve access to key services (education, employment, recreation, health, community services, cultural assets)?
Will the option increase access to urban green space?
Will the option improve the provision of affordable transport?
5
To make the best use of previously developed land and existing buildings.
Economic – policies enabling the use of previously developed land will ensure that a responsive approach to land use is available. Social – the use of previously developed land for residential development will provide a significant supply of housing to help meet the needs of present and future generations. Environmental – the decision aiding questions for this objective will ensure that PDL will be reused provided that it is not of high environmental value.
Will the option encourage reusing PDL provided it is not of high environmental value?
Will the option encourage the re-use of existing buildings?
Will the option ensure that development is making the best use of land?
6 To support Economic – the objective will Will the option support sustainable growth and encourage the provision of a

Mole Valley District Council Planning Services Page 24
Objective NPPF theme Decision aiding questions
economic growth which is inclusive, innovative and sustainable.
contribute to building a strong, responsive, innovative and competitive economy. Social – a strong economy that keeps unemployment levels low will help support strong, vibrant and healthy communities. Environmental – the support of innovative technologies will assist in the move to a low carbon economy.
range of jobs that are accessible to residents?
Will the option provide for the needs of businesses?
Will the option provide for new or emerging sectors?
Will the option facilitate flexible working practices?
Will the option support the clusters or network of knowledge driven, creative or high technology industries?
Will the option increase the likelihood of local jobs being filled by local people?
Will the option promote the viability, vitality and competitiveness of town centres and encourage their commercial renewal?
Will the option facilitate and encourage the building of a skilled local workforce?
Will the option encourage mixed-use development?
7
To provide for employment opportunities to meet the needs of the local economy.
Economic – the objective will contribute to building a strong, responsive and competitive local economy. Social – a local economy will support strong, vibrant and healthy communities. Environmental – promoting the local economy will reduce the need to travel and therefore mitigate against climate change.
Will the option provide for the needs of the economy, especially local business?
Will the option provide employment opportunities beyond the scope of the District?
Will the option encourage diversity and quality of employment?
Will the option encourage diversification in the countryside?
Will the option provide for the needs of business across the District (such as range of premises, land, infrastructure and services)?
Will the option have a significant detrimental effect on the financial viability of delivery of future employment development?
8
To reduce greenhouse gas emissions and move to a low carbon economy.
Economic – the objective will contribute to building an innovative economy. Social –support long term positive impacts on the overall quality of life for current and future generations. Environmental – the objective will have significant environmental
Will the option reduce emissions?
Will the option reduce the need for energy use?
Will the option support de-centralised energy generation?
Will the option facilitate the generation / use of renewable energy?

Mole Valley District Council Planning Services Page 25
Objective NPPF theme Decision aiding questions
benefits as it will mitigate climate change.
9
To use natural resources prudently.
Environmental – the prudent use of natural resources will greatly assist in the protection of the environment. Social - prudent use of natural resources supports long term positive impacts on the overall quality of life for current and future generations. Economic – the objective will also promote long term positive impacts for businesses in the future as it seeks to protect finite natural resources.
Will the option encourage the use and supply of sustainable local products or services?
Will the option help reduce the environmental impacts of products and services?
Will the option reduce the use of primary resources, or create markets for recycled materials?
Will the option encourage the efficient use of mineral resources?
Will the option positively impact on residents lifestyle choices to encourage their prudent use of natural resources?
Will the option promote reuse and recycling of materials?
Will the option allow the efficient storage and collection of waste and allows for this to be managed close to where it arises?
Will the option minimise the production of waste?
10
To adapt to the changing climate.
Economic – the provision of adequate climate change resilient infrastructure will help to protect and future proof businesses within the area. Social – adapting to climate change will help to maintain a healthy community. Environmental – protection of the environment plays a key role in the area adapting to climate change.
Will the option help in protecting the community from the increased extremes of weather, which are projected to occur more often with climate change (heat waves, drought and flooding)?
Will the option reduce the opportunity to adapt in the future?
11
To reduce flood risk.
Economic – the objective will promote the provision of flood defence infrastructure and help to make local businesses more resilient to flood events.
Will the option reduce the risk of flooding from all sources to existing and future development?
Will the option steer development away from areas at risk of flooding?
Will the option reduce the risk of flooding elsewhere?
Will the option help to reduce the rate of run-off?
Mole Valley District Council Planning Services Page 26
Objective NPPF theme Decision aiding questions
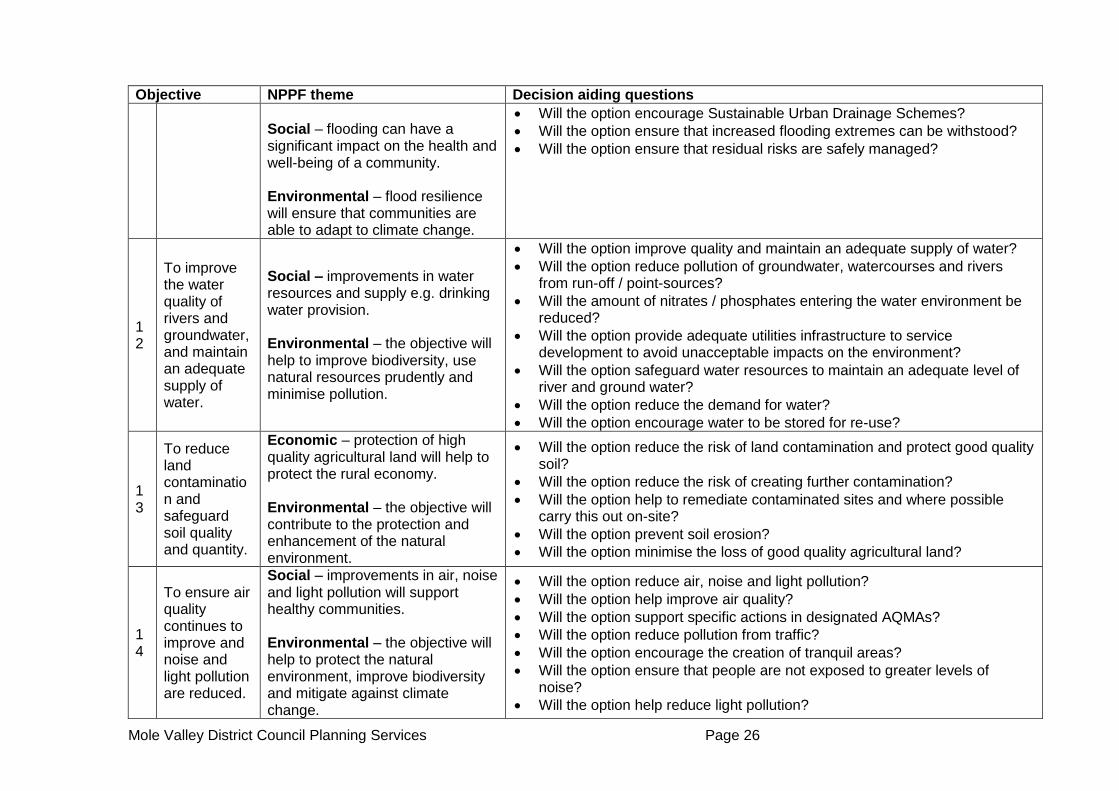
Social – flooding can have a significant impact on the health and well-being of a community. Environmental – flood resilience will ensure that communities are able to adapt to climate change.
Will the option encourage Sustainable Urban Drainage Schemes?
Will the option ensure that increased flooding extremes can be withstood?
Will the option ensure that residual risks are safely managed?
12
To improve the water quality of rivers and groundwater, and maintain an adequate supply of water.
Social – improvements in water resources and supply e.g. drinking water provision. Environmental – the objective will help to improve biodiversity, use natural resources prudently and minimise pollution.
Will the option improve quality and maintain an adequate supply of water?
Will the option reduce pollution of groundwater, watercourses and rivers from run-off / point-sources?
Will the amount of nitrates / phosphates entering the water environment be reduced?
Will the option provide adequate utilities infrastructure to service development to avoid unacceptable impacts on the environment?
Will the option safeguard water resources to maintain an adequate level of river and ground water?
Will the option reduce the demand for water?
Will the option encourage water to be stored for re-use?
13
To reduce land contamination and safeguard soil quality and quantity.
Economic – protection of high quality agricultural land will help to protect the rural economy. Environmental – the objective will contribute to the protection and enhancement of the natural environment.
Will the option reduce the risk of land contamination and protect good quality soil?
Will the option reduce the risk of creating further contamination?
Will the option help to remediate contaminated sites and where possible carry this out on-site?
Will the option prevent soil erosion?
Will the option minimise the loss of good quality agricultural land?
14
To ensure air quality continues to improve and noise and light pollution are reduced.
Social – improvements in air, noise and light pollution will support healthy communities. Environmental – the objective will help to protect the natural environment, improve biodiversity and mitigate against climate change.
Will the option reduce air, noise and light pollution?
Will the option help improve air quality?
Will the option support specific actions in designated AQMAs?
Will the option reduce pollution from traffic?
Will the option encourage the creation of tranquil areas?
Will the option ensure that people are not exposed to greater levels of noise?
Will the option help reduce light pollution?
Mole Valley District Council Planning Services Page 27
Objective NPPF theme Decision aiding questions
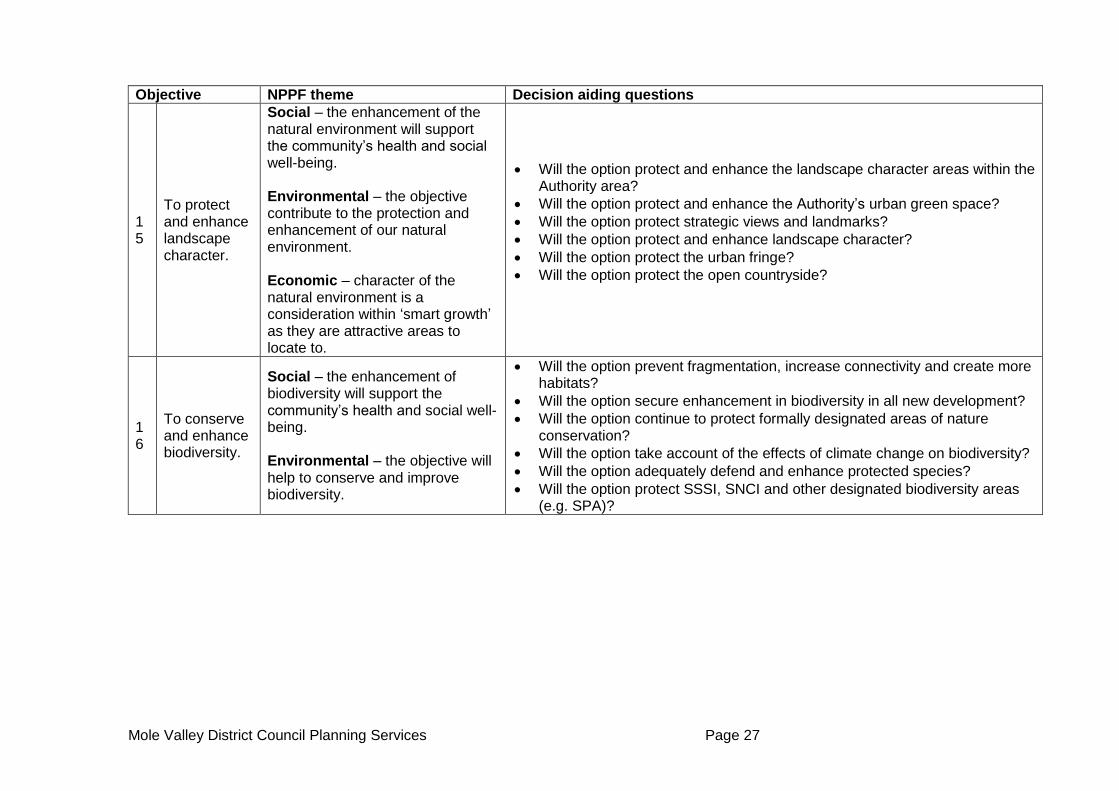
15
To protect and enhance landscape character.
Social – the enhancement of the natural environment will support the community’s health and social well-being. Environmental – the objective contribute to the protection and enhancement of our natural environment. Economic – character of the natural environment is a consideration within ‘smart growth’ as they are attractive areas to locate to.
Will the option protect and enhance the landscape character areas within the Authority area?
Will the option protect and enhance the Authority’s urban green space?
Will the option protect strategic views and landmarks?
Will the option protect and enhance landscape character?
Will the option protect the urban fringe?
Will the option protect the open countryside?
16
To conserve and enhance biodiversity.
Social – the enhancement of biodiversity will support the community’s health and social well-being. Environmental – the objective will help to conserve and improve biodiversity.
Will the option prevent fragmentation, increase connectivity and create more habitats?
Will the option secure enhancement in biodiversity in all new development?
Will the option continue to protect formally designated areas of nature conservation?
Will the option take account of the effects of climate change on biodiversity?
Will the option adequately defend and enhance protected species?
Will the option protect SSSI, SNCI and other designated biodiversity areas (e.g. SPA)?
Mole Valley District Council Planning Services Page 28
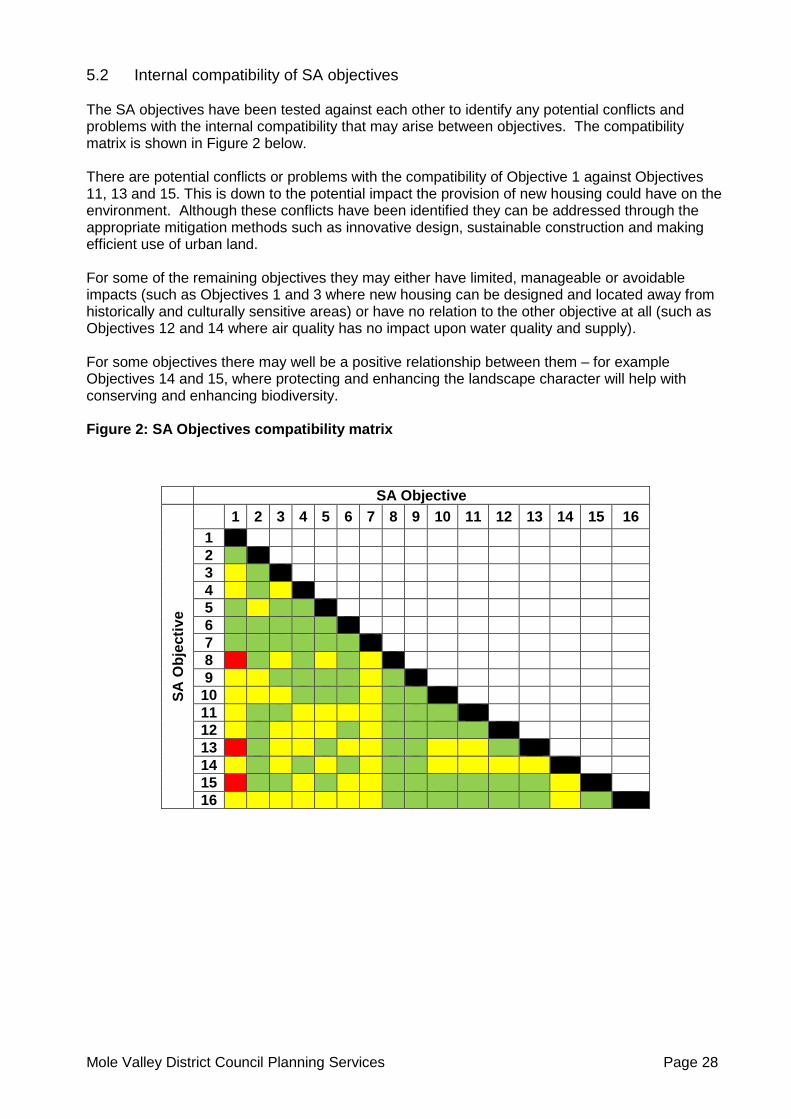
5.2 Internal compatibility of SA objectives The SA objectives have been tested against each other to identify any potential conflicts and problems with the internal compatibility that may arise between objectives. The compatibility matrix is shown in Figure 2 below. There are potential conflicts or problems with the compatibility of Objective 1 against Objectives 11, 13 and 15. This is down to the potential impact the provision of new housing could have on the environment. Although these conflicts have been identified they can be addressed through the appropriate mitigation methods such as innovative design, sustainable construction and making efficient use of urban land. For some of the remaining objectives they may either have limited, manageable or avoidable impacts (such as Objectives 1 and 3 where new housing can be designed and located away from historically and culturally sensitive areas) or have no relation to the other objective at all (such as Objectives 12 and 14 where air quality has no impact upon water quality and supply). For some objectives there may well be a positive relationship between them – for example Objectives 14 and 15, where protecting and enhancing the landscape character will help with conserving and enhancing biodiversity. Figure 2: SA Objectives compatibility matrix
SA Objective
SA
Ob
jecti
ve
1 2 3 4 5 6 7 8 9 10 11 12 13 14 15 16
1
2
3
4
5
6
7
8
9
10
11
12
13
14
15
16
Mole Valley District Council Planning Services Page 29
6. Stage A5 – Consulting on the scope It is a statutory requirement that the Scoping Report be sent to the three Environmental Consultation Bodies4 and to ensure the widest possible consultation takes place at this stage, relevant local stakeholders will be invited to take part as well. The document will also be made available on the Council’s website. Consultation at this stage is fundamental to ensure that the Scope of the SA is fully identified and the subsequent report comprehensive enough.
Compliance with the SEA Directive “The bodies identified by the UK Government as being likely to be concerned by the environmental effects of implementing the plan have been consulted in deciding” (Annex 1 (d))
The responses to the consultation will be included in an appendix once the consultation has taken place.
4 Environment Agency, Natural England and Historic England
Mole Valley District Council Planning Services Page 30
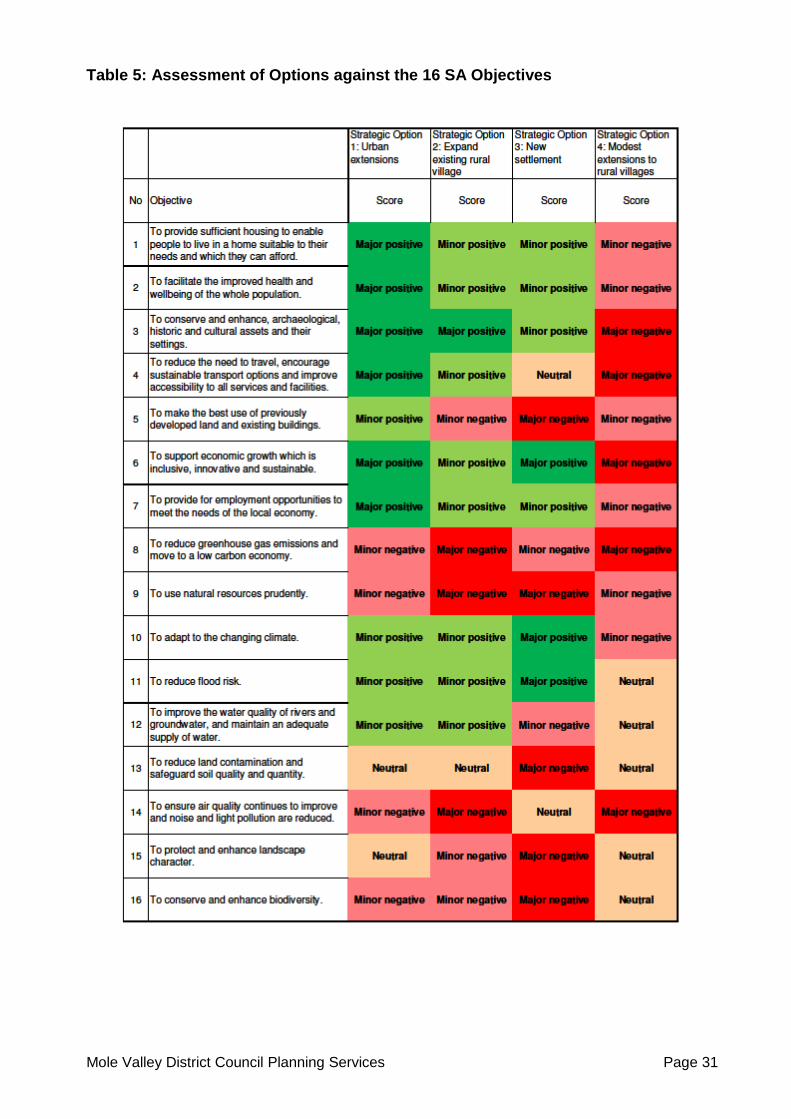
7. Initial Scope of the Council’s options The information presented by the Council in the Issues and Options consultation document sets out three potential options for the Council in directing future development in the District. It is important that the SA process is focused on where it can make a positive difference and add value to the decision making process (which at this stage is focused on choosing between alternatives). Therefore each potential options has been assessed against all of the 16 SA objectives (assisted by the use of decision aiding questions) to determine the most suitable approach. However, please note that all policies developed as part of the Draft Local Plan will be assessed as part of the next stage of the SA.
Option 1: Urban Extensions - Significant expansion of an existing built up area. The existing
built up areas are Dorking, Leatherhead, Fetcham, Ashtead or Bookham. Option 2: Expand existing rural village - Significant expansion of an existing rural village, to
take in greenfield land (this option relates to large scale expansion into greenfield land; it goes beyond loosening the existing boundary, which is considered in Option 4).
Option 3: New Settlement - A stand-alone settlement, providing a level of housing which
would support essential services - e.g. doctor's surgery, primary school. Not based on an existing village.
Option 4: Modest extensions to rural villages - increase the extent of villages. This option
relates to boundary changes around the existing village (to take in lower density areas which are currently excluded). It does not include significant expansion into the countryside around the village (which is considered in Option 2).
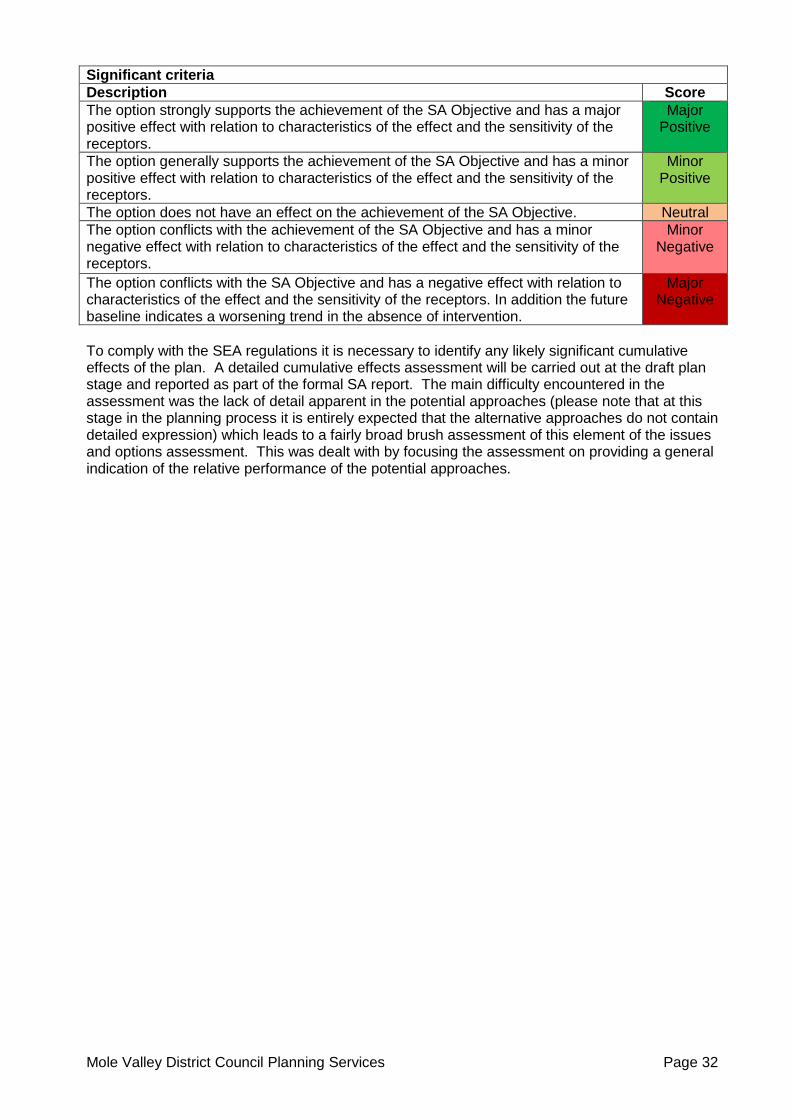
As part of the SA it is necessary to outline likely significant effects of an option. To do this in as clear and transparent way as possible, a set of objectives have been defined for the assessment and every impact has been scored accordingly. The assessment of options against a significance criteria are set out in the table below:
Mole Valley District Council Planning Services Page 31
Table 5: Assessment of Options against the 16 SA Objectives
Mole Valley District Council Planning Services Page 32
Significant criteria
Description Score
The option strongly supports the achievement of the SA Objective and has a major positive effect with relation to characteristics of the effect and the sensitivity of the receptors.
Major Positive
The option generally supports the achievement of the SA Objective and has a minor positive effect with relation to characteristics of the effect and the sensitivity of the receptors.
Minor Positive
The option does not have an effect on the achievement of the SA Objective. Neutral
The option conflicts with the achievement of the SA Objective and has a minor negative effect with relation to characteristics of the effect and the sensitivity of the receptors.
Minor Negative
The option conflicts with the SA Objective and has a negative effect with relation to characteristics of the effect and the sensitivity of the receptors. In addition the future baseline indicates a worsening trend in the absence of intervention.
Major Negative
To comply with the SEA regulations it is necessary to identify any likely significant cumulative effects of the plan. A detailed cumulative effects assessment will be carried out at the draft plan stage and reported as part of the formal SA report. The main difficulty encountered in the assessment was the lack of detail apparent in the potential approaches (please note that at this stage in the planning process it is entirely expected that the alternative approaches do not contain detailed expression) which leads to a fairly broad brush assessment of this element of the issues and options assessment. This was dealt with by focusing the assessment on providing a general indication of the relative performance of the potential approaches.
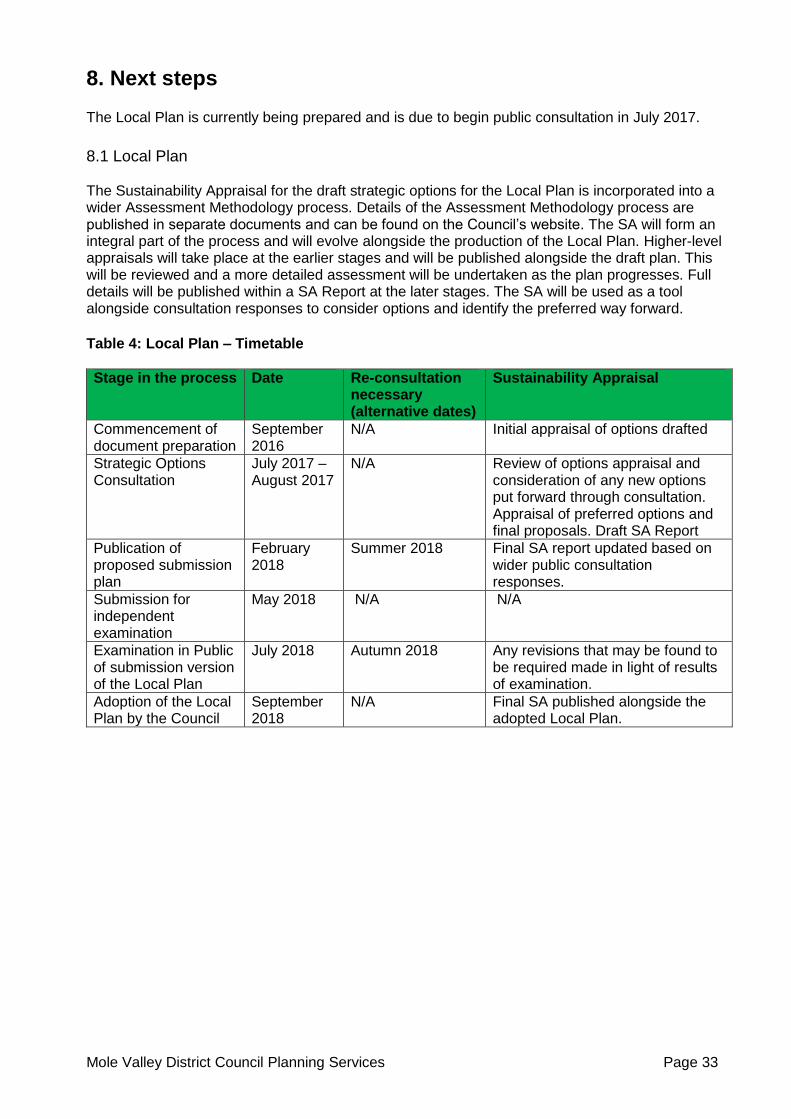
Mole Valley District Council Planning Services Page 33
8. Next steps The Local Plan is currently being prepared and is due to begin public consultation in July 2017.
8.1 Local Plan The Sustainability Appraisal for the draft strategic options for the Local Plan is incorporated into a wider Assessment Methodology process. Details of the Assessment Methodology process are published in separate documents and can be found on the Council’s website. The SA will form an integral part of the process and will evolve alongside the production of the Local Plan. Higher-level appraisals will take place at the earlier stages and will be published alongside the draft plan. This will be reviewed and a more detailed assessment will be undertaken as the plan progresses. Full details will be published within a SA Report at the later stages. The SA will be used as a tool alongside consultation responses to consider options and identify the preferred way forward.
Table 4: Local Plan – Timetable
Stage in the process Date Re-consultation necessary (alternative dates)
Sustainability Appraisal
Commencement of document preparation
September 2016
N/A Initial appraisal of options drafted
Strategic Options Consultation
July 2017 – August 2017
N/A Review of options appraisal and consideration of any new options put forward through consultation. Appraisal of preferred options and final proposals. Draft SA Report
Publication of proposed submission plan
February 2018
Summer 2018 Final SA report updated based on wider public consultation responses.
Submission for independent examination
May 2018 N/A N/A
Examination in Public of submission version of the Local Plan
July 2018 Autumn 2018 Any revisions that may be found to be required made in light of results of examination.
Adoption of the Local Plan by the Council
September 2018
N/A Final SA published alongside the adopted Local Plan.

Mole Valley District Council Planning Services Page 34
Appendix 1 – Plans, policies and programmes May 2017: full table with objectives
Key objectives or requirements of the plan or programme How objectives and requirements might be taken on board
International
The Johannesburg Declaration on Sustainable Development (2002)
http://www.un-documents.net/jburgdec.htm
States a commitment to building a humane, equitable and caring global society. The key commitments:
Sustainable production and consumption.
Renewable energy & energy efficiency.
Production of chemicals in ways that do not lead to significant adverse effects on human health and the environment.
Develop integrated water resources management and water efficiency plans by 2005.
Plan policies to support the overall objectives.
European Spatial Development Perspective (97/150/EC)
European Spatial Development Perspective (97/150/EC)
Based on the EU aim of achieving balanced and sustainable development:
Economic and social cohesion.
Conservation of natural resources and cultural heritage.
More balanced competitiveness of the European territory.
To achieve more spatially balanced development, these goals must be pursued simultaneously in all regions of the EU and their interactions taken into account.
Plan policies to support the overall objectives.
European Sustainable Development Strategy (2006; reviewed 2009)
European Sustainable Development Strategy (renewed 2006; reviewed 2009)
The overall aim of the Strategy is to identify and develop actions to enable the EU to achieve a continuous long-term improvement of quality of life through the creation of sustainable communities able to manage and use resources efficiently, able to tap the ecological and social innovation potential of the economy and in the end able to ensure prosperity, environmental protection and social cohesion. It aims to:
Limit climate change and increase the use of clean energy.
Address threats to public health.
Combat poverty and social exclusion.
Address the economic and social constraints of an ageing society.
Manage natural resources more responsibly.
Improve the transport system and land use management.
Informs national legislation, UK Sustainable Development Strategy and targets, presenting a global perspective.
European Union Environmental Action Programme to 2020
http://ec.europa.eu/environment/action-programme/
Key objectives:
to protect, conserve and enhance the Union’s natural capital.
The Local Plan should support the primary areas of the action plan.
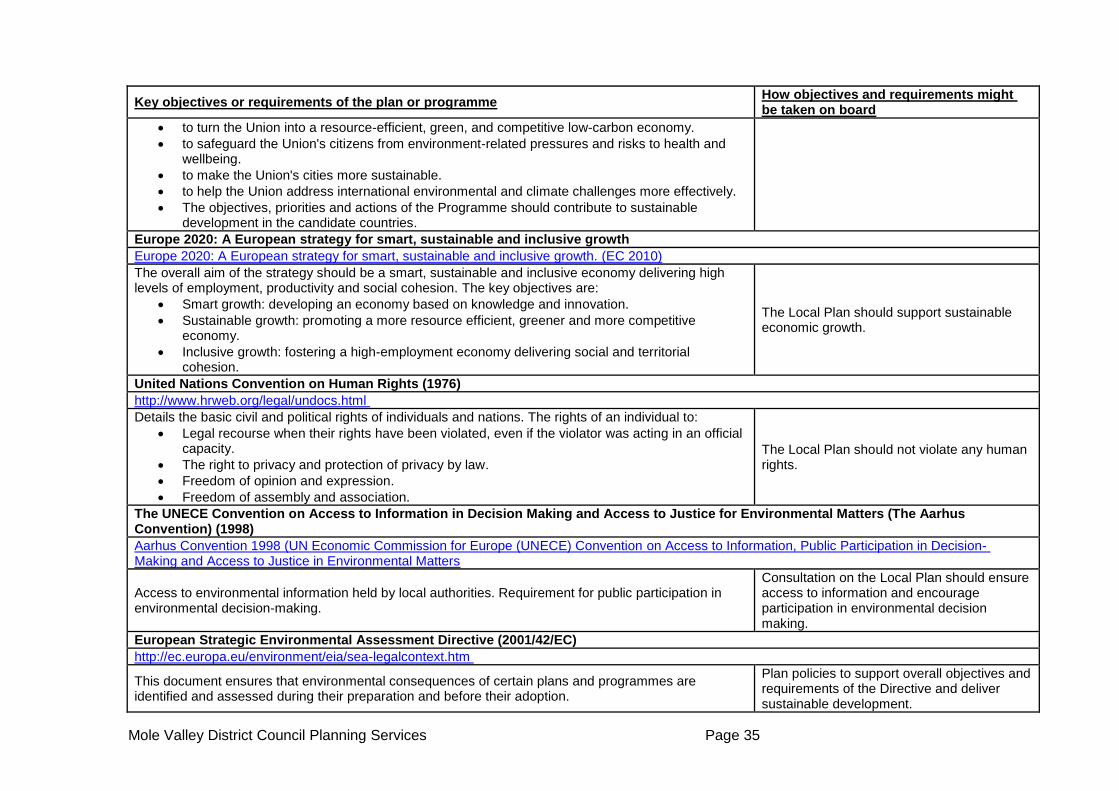
Mole Valley District Council Planning Services Page 35
Key objectives or requirements of the plan or programme How objectives and requirements might be taken on board
to turn the Union into a resource-efficient, green, and competitive low-carbon economy.
to safeguard the Union's citizens from environment-related pressures and risks to health and wellbeing.
to make the Union's cities more sustainable.
to help the Union address international environmental and climate challenges more effectively.
The objectives, priorities and actions of the Programme should contribute to sustainable development in the candidate countries.
Europe 2020: A European strategy for smart, sustainable and inclusive growth
Europe 2020: A European strategy for smart, sustainable and inclusive growth. (EC 2010)
The overall aim of the strategy should be a smart, sustainable and inclusive economy delivering high levels of employment, productivity and social cohesion. The key objectives are:
Smart growth: developing an economy based on knowledge and innovation.
Sustainable growth: promoting a more resource efficient, greener and more competitive economy.
Inclusive growth: fostering a high-employment economy delivering social and territorial cohesion.
The Local Plan should support sustainable economic growth.
United Nations Convention on Human Rights (1976)
http://www.hrweb.org/legal/undocs.html
Details the basic civil and political rights of individuals and nations. The rights of an individual to:
Legal recourse when their rights have been violated, even if the violator was acting in an official capacity.
The right to privacy and protection of privacy by law.
Freedom of opinion and expression.
Freedom of assembly and association.
The Local Plan should not violate any human rights.
The UNECE Convention on Access to Information in Decision Making and Access to Justice for Environmental Matters (The Aarhus Convention) (1998)
Aarhus Convention 1998 (UN Economic Commission for Europe (UNECE) Convention on Access to Information, Public Participation in Decision- Making and Access to Justice in Environmental Matters
Access to environmental information held by local authorities. Requirement for public participation in environmental decision-making.
Consultation on the Local Plan should ensure access to information and encourage participation in environmental decision making.
European Strategic Environmental Assessment Directive (2001/42/EC)
http://ec.europa.eu/environment/eia/sea-legalcontext.htm
This document ensures that environmental consequences of certain plans and programmes are identified and assessed during their preparation and before their adoption.
Plan policies to support overall objectives and requirements of the Directive and deliver sustainable development.

Mole Valley District Council Planning Services Page 36
Key objectives or requirements of the plan or programme How objectives and requirements might be taken on board
European Environmental Impact Assessment Directive (97/11/EC)
http://ec.europa.eu/environment/eia/eia-legalcontext.htm
Requires assessment of the effect of certain public and private projects on the environment.
Local Plan policies should support overall objectives and requirements of the Directive. Ensure that ‘appropriate assessments’ are carried out for sites in locations where development could adversely impact on the environment.
European Noise Directive (2002/49/EC)
http://ec.europa.eu/environment/noise/directive_en.htm
The Environmental Noise Directive focuses on three action areas:
the determination of exposure to environmental noise.
ensuring that information on environmental noise and its effects is made available to the public.
preventing and reducing environmental noise where necessary and preserving environmental noise quality where it is good.
The Directive requires Member States to prepare and publish (every 5 years) noise maps and noise management action plans for:
agglomerations with more than 100,000 inhabitants.
major roads (more than 3 million vehicles a year).
major railways (more than 30,000 trains a year).
major airports (more than 50,000 movements a year, including small aircrafts and helicopters).
Local Authorities should be aware that the location of development can have an impact the effect noise has on people.
European Air Quality Directive (2008/50/EC)
http://eur-lex.europa.eu/LexUriServ/LexUriServ.do?uri=OJ:L:2008:152:0001:0044:EN:PDF
Introduce a common strategy to:
Avoid, prevent or reduce harmful effects on human health and the environment.
Make information on ambient air quality available to the public.
Maintain air quality where good and improve it in other cases.
Sets limit values for various pollutants.
Local Authorities should be aware that the location of development can have a direct effect on improving air quality.
European Waste Water Treatment Directive (1991/271/EEC)
http://ec.europa.eu/environment/water/water-urbanwaste/index_en.html
Aims to protect the environment from the adverse effect of waste water. The Urban Waste Water Treatment Directive regulates the collection and treatment of waste water from our homes and from industry. It protects the environment from the negative effects of urban waste water and discharges from certain industrial sectors, such as food and drink processing plants. Some of these types of plants can produce waste that has a similar polluting effect as untreated sewage. It is implemented through the Urban Wastewater Treatment Regulations 1994.
Ensure that plan policies assist in protecting the environment from the adverse effects of waste water.
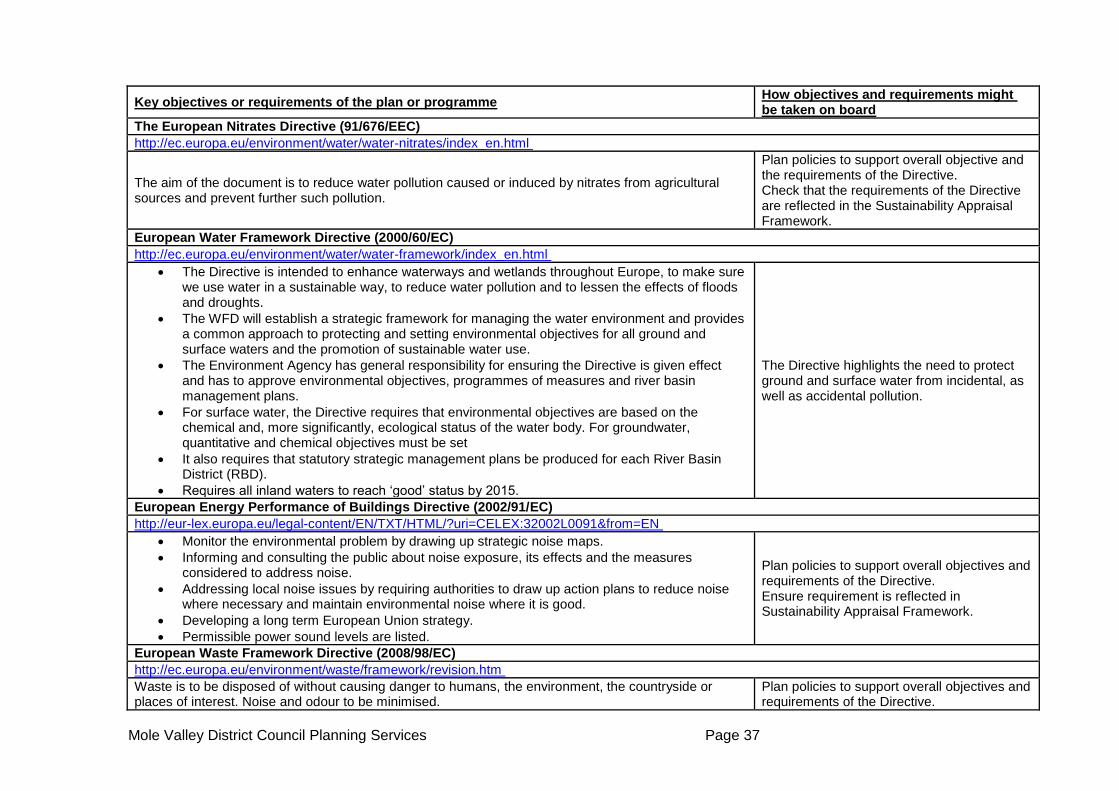
Mole Valley District Council Planning Services Page 37
Key objectives or requirements of the plan or programme How objectives and requirements might be taken on board
The European Nitrates Directive (91/676/EEC)
http://ec.europa.eu/environment/water/water-nitrates/index_en.html
The aim of the document is to reduce water pollution caused or induced by nitrates from agricultural sources and prevent further such pollution.
Plan policies to support overall objective and the requirements of the Directive. Check that the requirements of the Directive are reflected in the Sustainability Appraisal Framework.
European Water Framework Directive (2000/60/EC)
http://ec.europa.eu/environment/water/water-framework/index_en.html
The Directive is intended to enhance waterways and wetlands throughout Europe, to make sure we use water in a sustainable way, to reduce water pollution and to lessen the effects of floods and droughts.
The WFD will establish a strategic framework for managing the water environment and provides a common approach to protecting and setting environmental objectives for all ground and surface waters and the promotion of sustainable water use.
The Environment Agency has general responsibility for ensuring the Directive is given effect and has to approve environmental objectives, programmes of measures and river basin management plans.
For surface water, the Directive requires that environmental objectives are based on the chemical and, more significantly, ecological status of the water body. For groundwater, quantitative and chemical objectives must be set
It also requires that statutory strategic management plans be produced for each River Basin District (RBD).
Requires all inland waters to reach ‘good’ status by 2015.
The Directive highlights the need to protect ground and surface water from incidental, as well as accidental pollution.
European Energy Performance of Buildings Directive (2002/91/EC)
http://eur-lex.europa.eu/legal-content/EN/TXT/HTML/?uri=CELEX:32002L0091&from=EN
Monitor the environmental problem by drawing up strategic noise maps.
Informing and consulting the public about noise exposure, its effects and the measures considered to address noise.
Addressing local noise issues by requiring authorities to draw up action plans to reduce noise where necessary and maintain environmental noise where it is good.
Developing a long term European Union strategy.
Permissible power sound levels are listed.
Plan policies to support overall objectives and requirements of the Directive. Ensure requirement is reflected in Sustainability Appraisal Framework.
European Waste Framework Directive (2008/98/EC)
http://ec.europa.eu/environment/waste/framework/revision.htm
Waste is to be disposed of without causing danger to humans, the environment, the countryside or places of interest. Noise and odour to be minimised.
Plan policies to support overall objectives and requirements of the Directive.
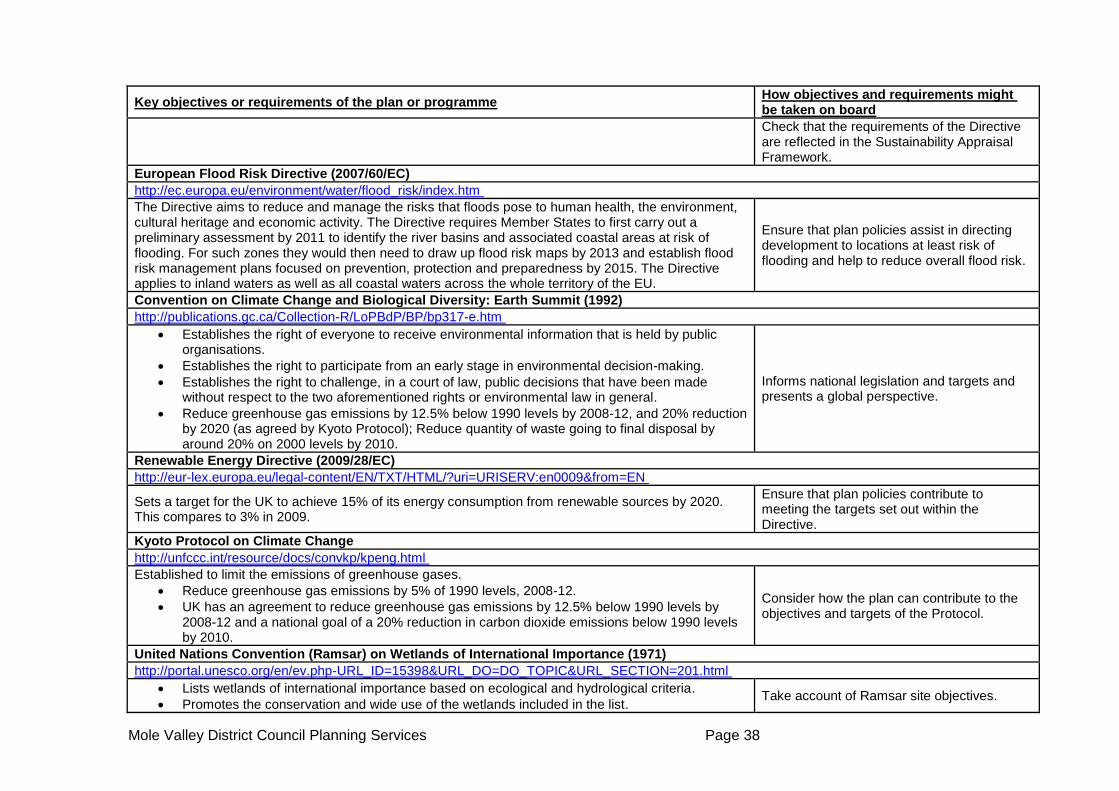
Mole Valley District Council Planning Services Page 38
Key objectives or requirements of the plan or programme How objectives and requirements might be taken on board
Check that the requirements of the Directive are reflected in the Sustainability Appraisal Framework.
European Flood Risk Directive (2007/60/EC)
http://ec.europa.eu/environment/water/flood_risk/index.htm
The Directive aims to reduce and manage the risks that floods pose to human health, the environment, cultural heritage and economic activity. The Directive requires Member States to first carry out a preliminary assessment by 2011 to identify the river basins and associated coastal areas at risk of flooding. For such zones they would then need to draw up flood risk maps by 2013 and establish flood risk management plans focused on prevention, protection and preparedness by 2015. The Directive applies to inland waters as well as all coastal waters across the whole territory of the EU.
Ensure that plan policies assist in directing development to locations at least risk of flooding and help to reduce overall flood risk.
Convention on Climate Change and Biological Diversity: Earth Summit (1992)
http://publications.gc.ca/Collection-R/LoPBdP/BP/bp317-e.htm
Establishes the right of everyone to receive environmental information that is held by public organisations.
Establishes the right to participate from an early stage in environmental decision-making.
Establishes the right to challenge, in a court of law, public decisions that have been made without respect to the two aforementioned rights or environmental law in general.
Reduce greenhouse gas emissions by 12.5% below 1990 levels by 2008-12, and 20% reduction by 2020 (as agreed by Kyoto Protocol); Reduce quantity of waste going to final disposal by around 20% on 2000 levels by 2010.
Informs national legislation and targets and presents a global perspective.
Renewable Energy Directive (2009/28/EC)
http://eur-lex.europa.eu/legal-content/EN/TXT/HTML/?uri=URISERV:en0009&from=EN
Sets a target for the UK to achieve 15% of its energy consumption from renewable sources by 2020. This compares to 3% in 2009.
Ensure that plan policies contribute to meeting the targets set out within the Directive.
Kyoto Protocol on Climate Change
http://unfccc.int/resource/docs/convkp/kpeng.html
Established to limit the emissions of greenhouse gases.
Reduce greenhouse gas emissions by 5% of 1990 levels, 2008-12.
UK has an agreement to reduce greenhouse gas emissions by 12.5% below 1990 levels by 2008-12 and a national goal of a 20% reduction in carbon dioxide emissions below 1990 levels by 2010.
Consider how the plan can contribute to the objectives and targets of the Protocol.
United Nations Convention (Ramsar) on Wetlands of International Importance (1971)
http://portal.unesco.org/en/ev.php-URL_ID=15398&URL_DO=DO_TOPIC&URL_SECTION=201.html
Lists wetlands of international importance based on ecological and hydrological criteria.
Promotes the conservation and wide use of the wetlands included in the list. Take account of Ramsar site objectives.
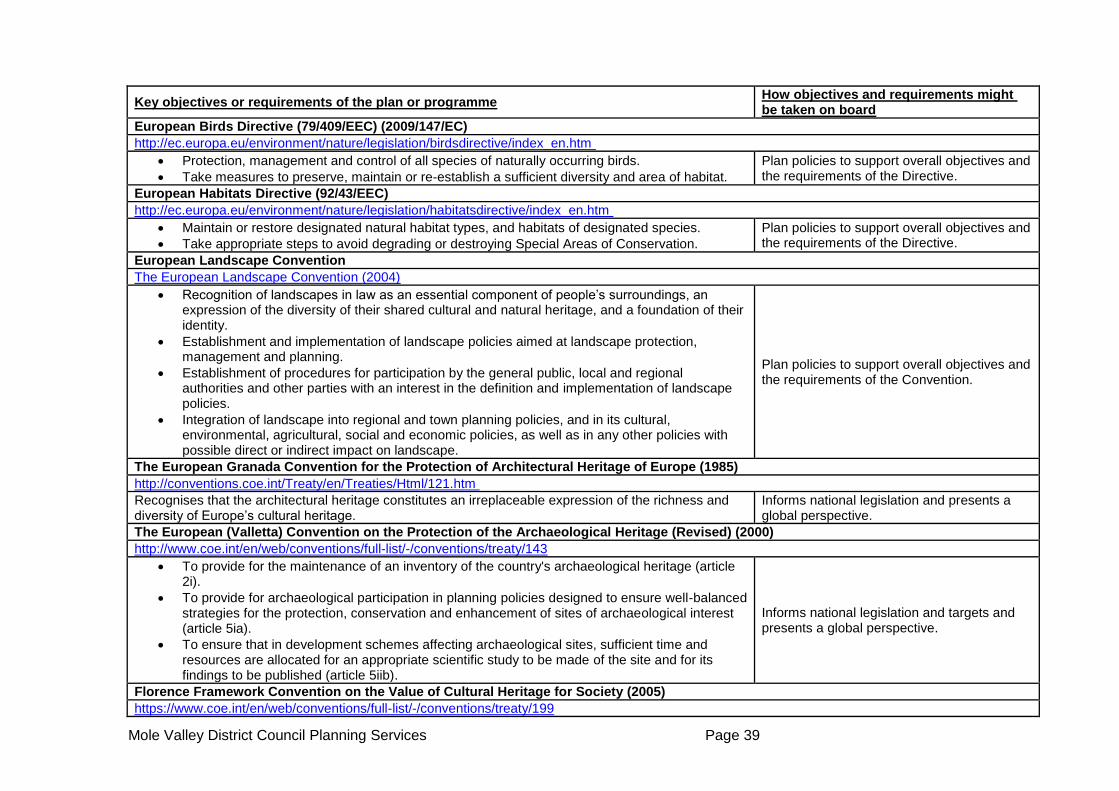
Mole Valley District Council Planning Services Page 39
Key objectives or requirements of the plan or programme How objectives and requirements might be taken on board
European Birds Directive (79/409/EEC) (2009/147/EC)
http://ec.europa.eu/environment/nature/legislation/birdsdirective/index_en.htm
Protection, management and control of all species of naturally occurring birds.
Take measures to preserve, maintain or re-establish a sufficient diversity and area of habitat.
Plan policies to support overall objectives and the requirements of the Directive.
European Habitats Directive (92/43/EEC)
http://ec.europa.eu/environment/nature/legislation/habitatsdirective/index_en.htm
Maintain or restore designated natural habitat types, and habitats of designated species.
Take appropriate steps to avoid degrading or destroying Special Areas of Conservation.
Plan policies to support overall objectives and the requirements of the Directive.
European Landscape Convention
The European Landscape Convention (2004)
Recognition of landscapes in law as an essential component of people’s surroundings, an expression of the diversity of their shared cultural and natural heritage, and a foundation of their identity.
Establishment and implementation of landscape policies aimed at landscape protection, management and planning.
Establishment of procedures for participation by the general public, local and regional authorities and other parties with an interest in the definition and implementation of landscape policies.
Integration of landscape into regional and town planning policies, and in its cultural, environmental, agricultural, social and economic policies, as well as in any other policies with possible direct or indirect impact on landscape.
Plan policies to support overall objectives and the requirements of the Convention.
The European Granada Convention for the Protection of Architectural Heritage of Europe (1985)
http://conventions.coe.int/Treaty/en/Treaties/Html/121.htm
Recognises that the architectural heritage constitutes an irreplaceable expression of the richness and diversity of Europe’s cultural heritage.
Informs national legislation and presents a global perspective.
The European (Valletta) Convention on the Protection of the Archaeological Heritage (Revised) (2000)
http://www.coe.int/en/web/conventions/full-list/-/conventions/treaty/143
To provide for the maintenance of an inventory of the country's archaeological heritage (article 2i).
To provide for archaeological participation in planning policies designed to ensure well-balanced strategies for the protection, conservation and enhancement of sites of archaeological interest (article 5ia).
To ensure that in development schemes affecting archaeological sites, sufficient time and resources are allocated for an appropriate scientific study to be made of the site and for its findings to be published (article 5iib).
Informs national legislation and targets and presents a global perspective.
Florence Framework Convention on the Value of Cultural Heritage for Society (2005)
https://www.coe.int/en/web/conventions/full-list/-/conventions/treaty/199
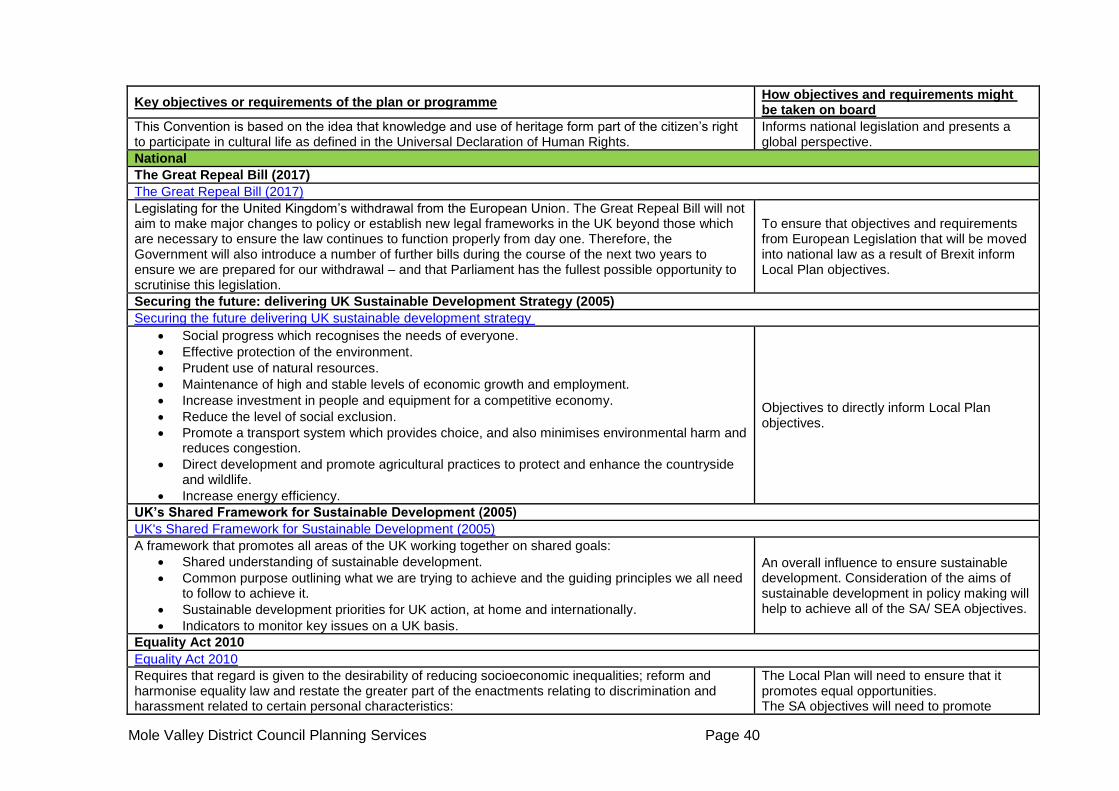
Mole Valley District Council Planning Services Page 40
Key objectives or requirements of the plan or programme How objectives and requirements might be taken on board
This Convention is based on the idea that knowledge and use of heritage form part of the citizen’s right to participate in cultural life as defined in the Universal Declaration of Human Rights.
Informs national legislation and presents a global perspective.
National
The Great Repeal Bill (2017)
The Great Repeal Bill (2017)
Legislating for the United Kingdom’s withdrawal from the European Union. The Great Repeal Bill will not aim to make major changes to policy or establish new legal frameworks in the UK beyond those which are necessary to ensure the law continues to function properly from day one. Therefore, the Government will also introduce a number of further bills during the course of the next two years to ensure we are prepared for our withdrawal – and that Parliament has the fullest possible opportunity to scrutinise this legislation.
To ensure that objectives and requirements from European Legislation that will be moved into national law as a result of Brexit inform Local Plan objectives.
Securing the future: delivering UK Sustainable Development Strategy (2005)
Securing the future delivering UK sustainable development strategy
Social progress which recognises the needs of everyone.
Effective protection of the environment.
Prudent use of natural resources.
Maintenance of high and stable levels of economic growth and employment.
Increase investment in people and equipment for a competitive economy.
Reduce the level of social exclusion.
Promote a transport system which provides choice, and also minimises environmental harm and reduces congestion.
Direct development and promote agricultural practices to protect and enhance the countryside and wildlife.
Increase energy efficiency.
Objectives to directly inform Local Plan objectives.
UK’s Shared Framework for Sustainable Development (2005)
UK's Shared Framework for Sustainable Development (2005)
A framework that promotes all areas of the UK working together on shared goals:
Shared understanding of sustainable development.
Common purpose outlining what we are trying to achieve and the guiding principles we all need to follow to achieve it.
Sustainable development priorities for UK action, at home and internationally.
Indicators to monitor key issues on a UK basis.
An overall influence to ensure sustainable development. Consideration of the aims of sustainable development in policy making will help to achieve all of the SA/ SEA objectives.
Equality Act 2010
Equality Act 2010
Requires that regard is given to the desirability of reducing socioeconomic inequalities; reform and harmonise equality law and restate the greater part of the enactments relating to discrimination and harassment related to certain personal characteristics:
The Local Plan will need to ensure that it promotes equal opportunities. The SA objectives will need to promote
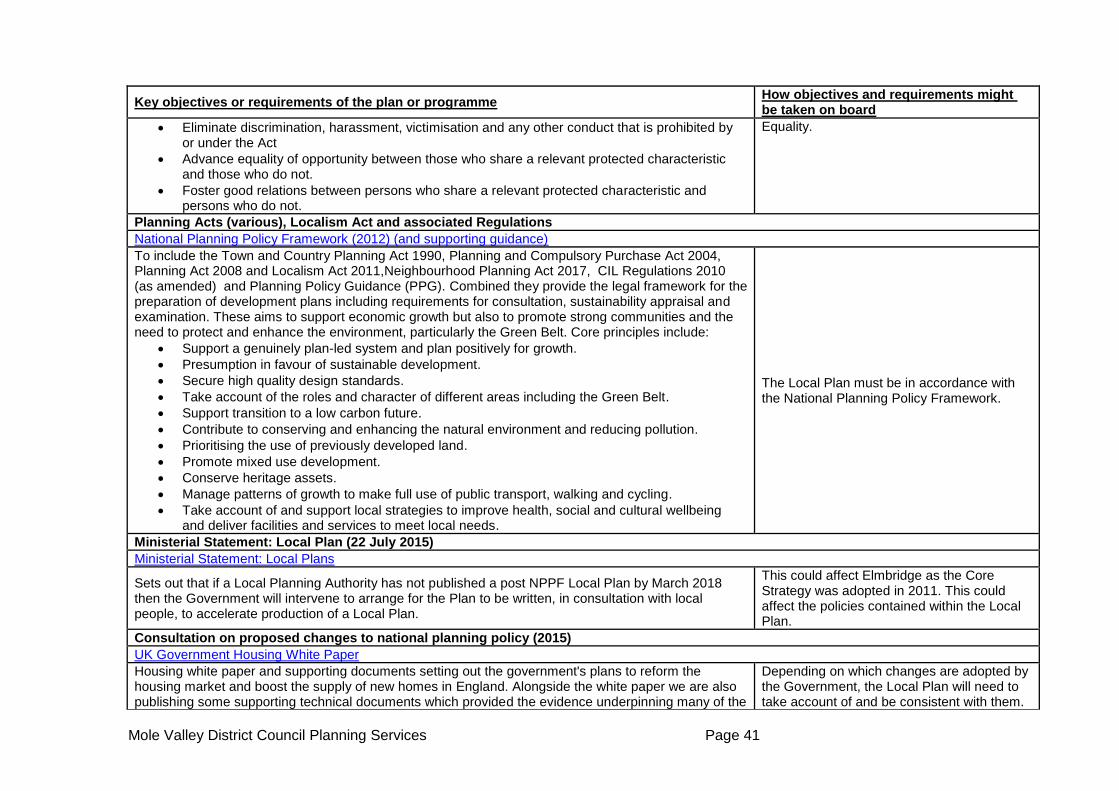
Mole Valley District Council Planning Services Page 41
Key objectives or requirements of the plan or programme How objectives and requirements might be taken on board
Eliminate discrimination, harassment, victimisation and any other conduct that is prohibited by or under the Act
Advance equality of opportunity between those who share a relevant protected characteristic and those who do not.
Foster good relations between persons who share a relevant protected characteristic and persons who do not.
Equality.
Planning Acts (various), Localism Act and associated Regulations
National Planning Policy Framework (2012) (and supporting guidance)
To include the Town and Country Planning Act 1990, Planning and Compulsory Purchase Act 2004, Planning Act 2008 and Localism Act 2011,Neighbourhood Planning Act 2017, CIL Regulations 2010 (as amended) and Planning Policy Guidance (PPG). Combined they provide the legal framework for the preparation of development plans including requirements for consultation, sustainability appraisal and examination. These aims to support economic growth but also to promote strong communities and the need to protect and enhance the environment, particularly the Green Belt. Core principles include:
Support a genuinely plan-led system and plan positively for growth.
Presumption in favour of sustainable development.
Secure high quality design standards.
Take account of the roles and character of different areas including the Green Belt.
Support transition to a low carbon future.
Contribute to conserving and enhancing the natural environment and reducing pollution.
Prioritising the use of previously developed land.
Promote mixed use development.
Conserve heritage assets.
Manage patterns of growth to make full use of public transport, walking and cycling.
Take account of and support local strategies to improve health, social and cultural wellbeing and deliver facilities and services to meet local needs.
The Local Plan must be in accordance with the National Planning Policy Framework.
Ministerial Statement: Local Plan (22 July 2015)
Ministerial Statement: Local Plans
Sets out that if a Local Planning Authority has not published a post NPPF Local Plan by March 2018 then the Government will intervene to arrange for the Plan to be written, in consultation with local people, to accelerate production of a Local Plan.
This could affect Elmbridge as the Core Strategy was adopted in 2011. This could affect the policies contained within the Local Plan.
Consultation on proposed changes to national planning policy (2015)
UK Government Housing White Paper
Housing white paper and supporting documents setting out the government's plans to reform the housing market and boost the supply of new homes in England. Alongside the white paper we are also publishing some supporting technical documents which provided the evidence underpinning many of the
Depending on which changes are adopted by the Government, the Local Plan will need to take account of and be consistent with them.
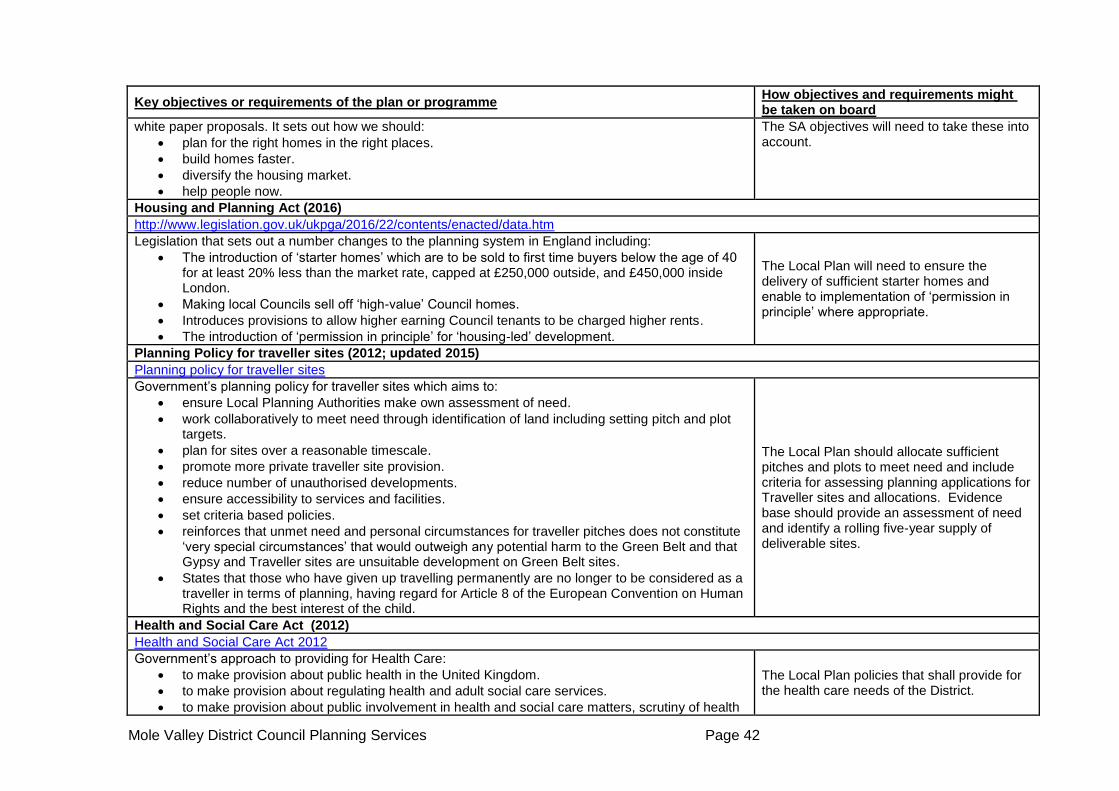
Mole Valley District Council Planning Services Page 42
Key objectives or requirements of the plan or programme How objectives and requirements might be taken on board
white paper proposals. It sets out how we should:
plan for the right homes in the right places.
build homes faster.
diversify the housing market.
help people now.
The SA objectives will need to take these into account.
Housing and Planning Act (2016)
http://www.legislation.gov.uk/ukpga/2016/22/contents/enacted/data.htm
Legislation that sets out a number changes to the planning system in England including:
The introduction of ‘starter homes’ which are to be sold to first time buyers below the age of 40 for at least 20% less than the market rate, capped at £250,000 outside, and £450,000 inside London.
Making local Councils sell off ‘high-value’ Council homes.
Introduces provisions to allow higher earning Council tenants to be charged higher rents.
The introduction of ‘permission in principle’ for ‘housing-led’ development.
The Local Plan will need to ensure the delivery of sufficient starter homes and enable to implementation of ‘permission in principle’ where appropriate.
Planning Policy for traveller sites (2012; updated 2015)
Planning policy for traveller sites
Government’s planning policy for traveller sites which aims to:
ensure Local Planning Authorities make own assessment of need.
work collaboratively to meet need through identification of land including setting pitch and plot targets.
plan for sites over a reasonable timescale.
promote more private traveller site provision.
reduce number of unauthorised developments.
ensure accessibility to services and facilities.
set criteria based policies.
reinforces that unmet need and personal circumstances for traveller pitches does not constitute ‘very special circumstances’ that would outweigh any potential harm to the Green Belt and that Gypsy and Traveller sites are unsuitable development on Green Belt sites.
States that those who have given up travelling permanently are no longer to be considered as a traveller in terms of planning, having regard for Article 8 of the European Convention on Human Rights and the best interest of the child.
The Local Plan should allocate sufficient pitches and plots to meet need and include criteria for assessing planning applications for Traveller sites and allocations. Evidence base should provide an assessment of need and identify a rolling five-year supply of deliverable sites.
Health and Social Care Act (2012)
Health and Social Care Act 2012
Government’s approach to providing for Health Care:
to make provision about public health in the United Kingdom.
to make provision about regulating health and adult social care services.
to make provision about public involvement in health and social care matters, scrutiny of health
The Local Plan policies that shall provide for the health care needs of the District.
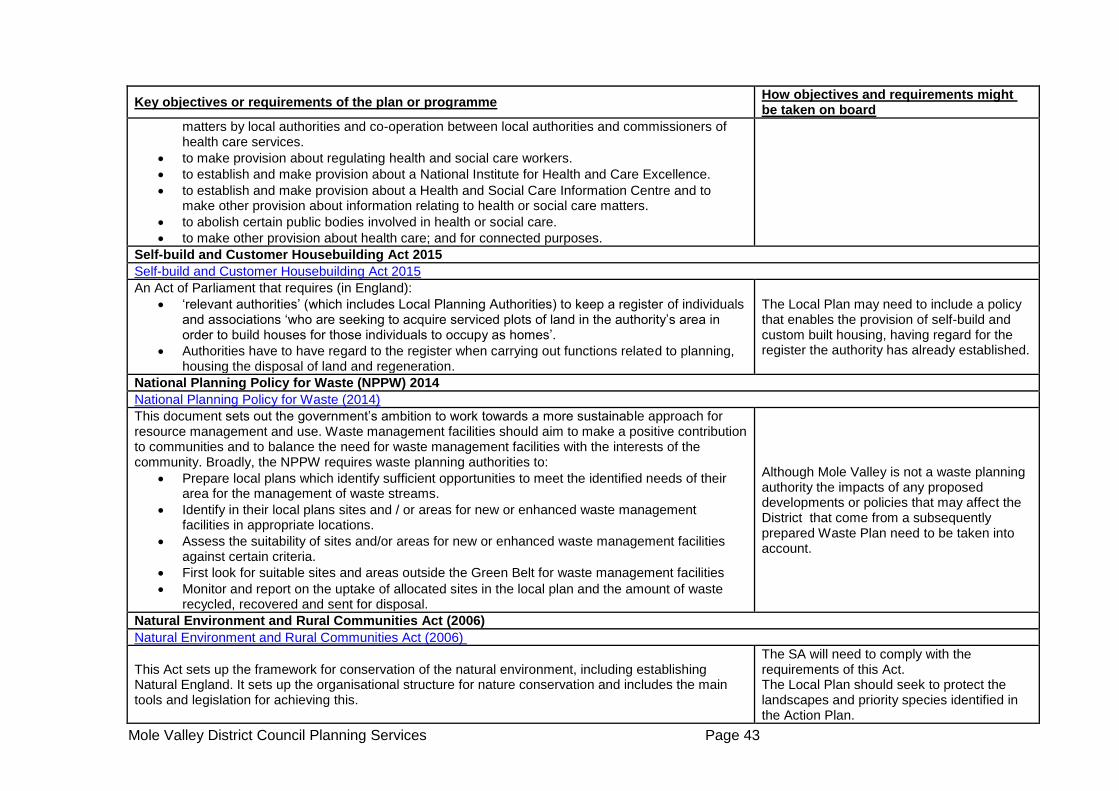
Mole Valley District Council Planning Services Page 43
Key objectives or requirements of the plan or programme How objectives and requirements might be taken on board
matters by local authorities and co-operation between local authorities and commissioners of health care services.
to make provision about regulating health and social care workers.
to establish and make provision about a National Institute for Health and Care Excellence.
to establish and make provision about a Health and Social Care Information Centre and to make other provision about information relating to health or social care matters.
to abolish certain public bodies involved in health or social care.
to make other provision about health care; and for connected purposes.
Self-build and Customer Housebuilding Act 2015
Self-build and Customer Housebuilding Act 2015
An Act of Parliament that requires (in England):
‘relevant authorities’ (which includes Local Planning Authorities) to keep a register of individuals and associations ‘who are seeking to acquire serviced plots of land in the authority’s area in order to build houses for those individuals to occupy as homes’.
Authorities have to have regard to the register when carrying out functions related to planning, housing the disposal of land and regeneration.
The Local Plan may need to include a policy that enables the provision of self-build and custom built housing, having regard for the register the authority has already established.
National Planning Policy for Waste (NPPW) 2014
National Planning Policy for Waste (2014)
This document sets out the government’s ambition to work towards a more sustainable approach for resource management and use. Waste management facilities should aim to make a positive contribution to communities and to balance the need for waste management facilities with the interests of the community. Broadly, the NPPW requires waste planning authorities to:
Prepare local plans which identify sufficient opportunities to meet the identified needs of their area for the management of waste streams.
Identify in their local plans sites and / or areas for new or enhanced waste management facilities in appropriate locations.
Assess the suitability of sites and/or areas for new or enhanced waste management facilities against certain criteria.
First look for suitable sites and areas outside the Green Belt for waste management facilities
Monitor and report on the uptake of allocated sites in the local plan and the amount of waste recycled, recovered and sent for disposal.
Although Mole Valley is not a waste planning authority the impacts of any proposed developments or policies that may affect the District that come from a subsequently prepared Waste Plan need to be taken into account.
Natural Environment and Rural Communities Act (2006)
Natural Environment and Rural Communities Act (2006)
This Act sets up the framework for conservation of the natural environment, including establishing Natural England. It sets up the organisational structure for nature conservation and includes the main tools and legislation for achieving this.
The SA will need to comply with the requirements of this Act. The Local Plan should seek to protect the landscapes and priority species identified in the Action Plan.
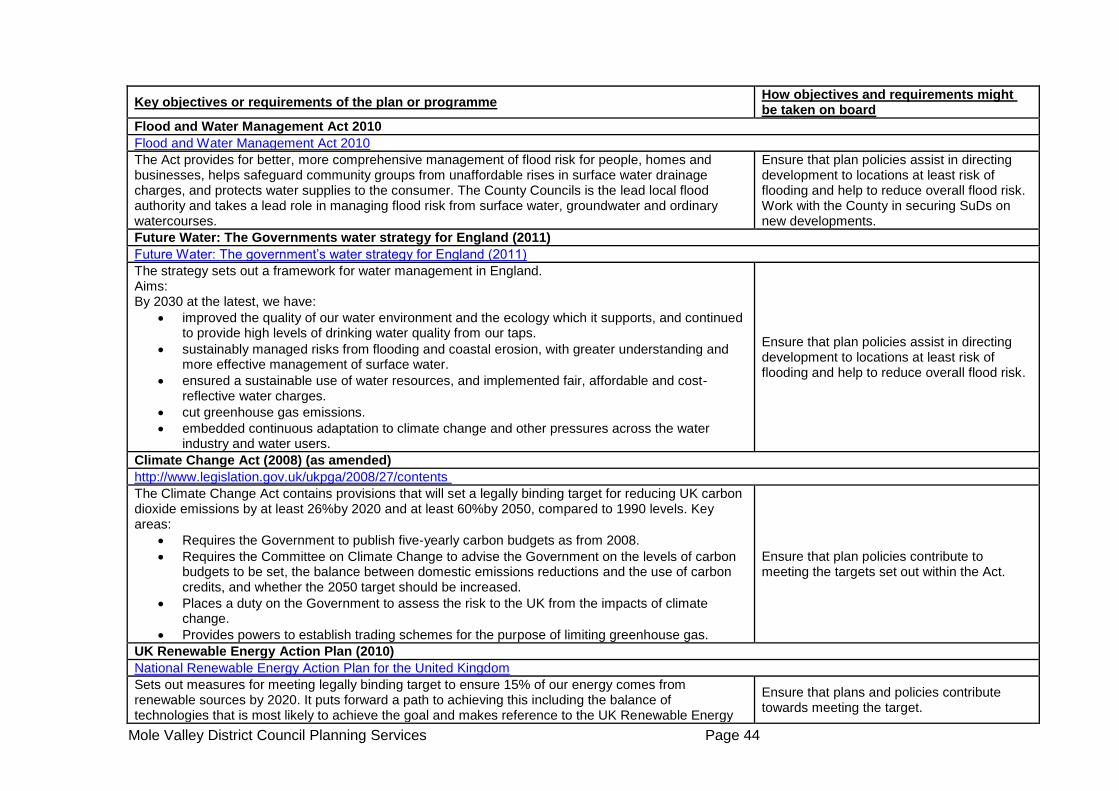
Mole Valley District Council Planning Services Page 44
Key objectives or requirements of the plan or programme How objectives and requirements might be taken on board
Flood and Water Management Act 2010
Flood and Water Management Act 2010
The Act provides for better, more comprehensive management of flood risk for people, homes and businesses, helps safeguard community groups from unaffordable rises in surface water drainage charges, and protects water supplies to the consumer. The County Councils is the lead local flood authority and takes a lead role in managing flood risk from surface water, groundwater and ordinary watercourses.
Ensure that plan policies assist in directing development to locations at least risk of flooding and help to reduce overall flood risk. Work with the County in securing SuDs on new developments.
Future Water: The Governments water strategy for England (2011)
Future Water: The government’s water strategy for England (2011)
The strategy sets out a framework for water management in England. Aims: By 2030 at the latest, we have:
improved the quality of our water environment and the ecology which it supports, and continued to provide high levels of drinking water quality from our taps.
sustainably managed risks from flooding and coastal erosion, with greater understanding and more effective management of surface water.
ensured a sustainable use of water resources, and implemented fair, affordable and cost-reflective water charges.
cut greenhouse gas emissions.
embedded continuous adaptation to climate change and other pressures across the water industry and water users.
Ensure that plan policies assist in directing development to locations at least risk of flooding and help to reduce overall flood risk.
Climate Change Act (2008) (as amended)
http://www.legislation.gov.uk/ukpga/2008/27/contents
The Climate Change Act contains provisions that will set a legally binding target for reducing UK carbon dioxide emissions by at least 26%by 2020 and at least 60%by 2050, compared to 1990 levels. Key areas:
Requires the Government to publish five-yearly carbon budgets as from 2008.
Requires the Committee on Climate Change to advise the Government on the levels of carbon budgets to be set, the balance between domestic emissions reductions and the use of carbon credits, and whether the 2050 target should be increased.
Places a duty on the Government to assess the risk to the UK from the impacts of climate change.
Provides powers to establish trading schemes for the purpose of limiting greenhouse gas.
Ensure that plan policies contribute to meeting the targets set out within the Act.
UK Renewable Energy Action Plan (2010)
National Renewable Energy Action Plan for the United Kingdom
Sets out measures for meeting legally binding target to ensure 15% of our energy comes from renewable sources by 2020. It puts forward a path to achieving this including the balance of technologies that is most likely to achieve the goal and makes reference to the UK Renewable Energy
Ensure that plans and policies contribute towards meeting the target.
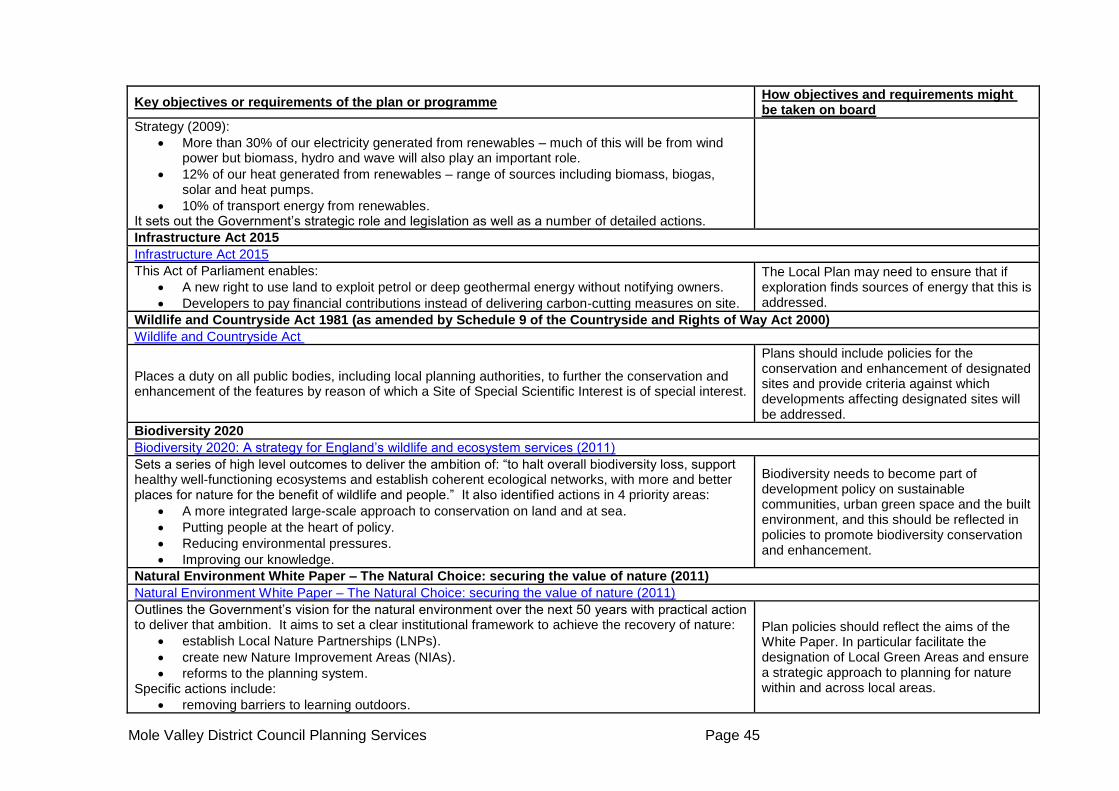
Mole Valley District Council Planning Services Page 45
Key objectives or requirements of the plan or programme How objectives and requirements might be taken on board
Strategy (2009):
More than 30% of our electricity generated from renewables – much of this will be from wind power but biomass, hydro and wave will also play an important role.
12% of our heat generated from renewables – range of sources including biomass, biogas, solar and heat pumps.
10% of transport energy from renewables. It sets out the Government’s strategic role and legislation as well as a number of detailed actions.
Infrastructure Act 2015
Infrastructure Act 2015
This Act of Parliament enables:
A new right to use land to exploit petrol or deep geothermal energy without notifying owners.
Developers to pay financial contributions instead of delivering carbon-cutting measures on site.
The Local Plan may need to ensure that if exploration finds sources of energy that this is addressed.
Wildlife and Countryside Act 1981 (as amended by Schedule 9 of the Countryside and Rights of Way Act 2000)
Wildlife and Countryside Act
Places a duty on all public bodies, including local planning authorities, to further the conservation and enhancement of the features by reason of which a Site of Special Scientific Interest is of special interest.
Plans should include policies for the conservation and enhancement of designated sites and provide criteria against which developments affecting designated sites will be addressed.
Biodiversity 2020
Biodiversity 2020: A strategy for England’s wildlife and ecosystem services (2011)
Sets a series of high level outcomes to deliver the ambition of: “to halt overall biodiversity loss, support healthy well-functioning ecosystems and establish coherent ecological networks, with more and better places for nature for the benefit of wildlife and people.” It also identified actions in 4 priority areas:
A more integrated large-scale approach to conservation on land and at sea.
Putting people at the heart of policy.
Reducing environmental pressures.
Improving our knowledge.
Biodiversity needs to become part of development policy on sustainable communities, urban green space and the built environment, and this should be reflected in policies to promote biodiversity conservation and enhancement.
Natural Environment White Paper – The Natural Choice: securing the value of nature (2011)
Natural Environment White Paper – The Natural Choice: securing the value of nature (2011)
Outlines the Government’s vision for the natural environment over the next 50 years with practical action to deliver that ambition. It aims to set a clear institutional framework to achieve the recovery of nature:
establish Local Nature Partnerships (LNPs).
create new Nature Improvement Areas (NIAs).
reforms to the planning system. Specific actions include:
removing barriers to learning outdoors.
Plan policies should reflect the aims of the White Paper. In particular facilitate the designation of Local Green Areas and ensure a strategic approach to planning for nature within and across local areas.
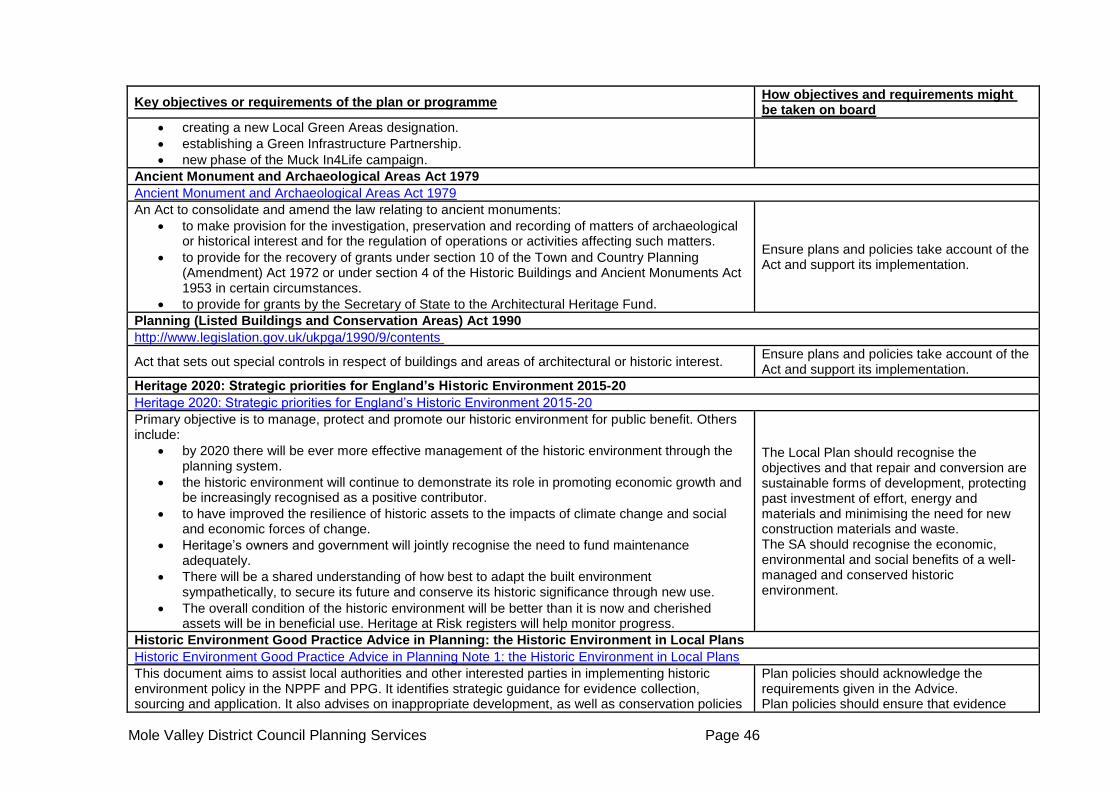
Mole Valley District Council Planning Services Page 46
Key objectives or requirements of the plan or programme How objectives and requirements might be taken on board
creating a new Local Green Areas designation.
establishing a Green Infrastructure Partnership.
new phase of the Muck In4Life campaign.
Ancient Monument and Archaeological Areas Act 1979
Ancient Monument and Archaeological Areas Act 1979
An Act to consolidate and amend the law relating to ancient monuments:
to make provision for the investigation, preservation and recording of matters of archaeological or historical interest and for the regulation of operations or activities affecting such matters.
to provide for the recovery of grants under section 10 of the Town and Country Planning (Amendment) Act 1972 or under section 4 of the Historic Buildings and Ancient Monuments Act 1953 in certain circumstances.
to provide for grants by the Secretary of State to the Architectural Heritage Fund.
Ensure plans and policies take account of the Act and support its implementation.
Planning (Listed Buildings and Conservation Areas) Act 1990
http://www.legislation.gov.uk/ukpga/1990/9/contents
Act that sets out special controls in respect of buildings and areas of architectural or historic interest. Ensure plans and policies take account of the Act and support its implementation.
Heritage 2020: Strategic priorities for England’s Historic Environment 2015-20
Heritage 2020: Strategic priorities for England’s Historic Environment 2015-20
Primary objective is to manage, protect and promote our historic environment for public benefit. Others include:
by 2020 there will be ever more effective management of the historic environment through the planning system.
the historic environment will continue to demonstrate its role in promoting economic growth and be increasingly recognised as a positive contributor.
to have improved the resilience of historic assets to the impacts of climate change and social and economic forces of change.
Heritage’s owners and government will jointly recognise the need to fund maintenance adequately.
There will be a shared understanding of how best to adapt the built environment sympathetically, to secure its future and conserve its historic significance through new use.
The overall condition of the historic environment will be better than it is now and cherished assets will be in beneficial use. Heritage at Risk registers will help monitor progress.
The Local Plan should recognise the objectives and that repair and conversion are sustainable forms of development, protecting past investment of effort, energy and materials and minimising the need for new construction materials and waste. The SA should recognise the economic, environmental and social benefits of a well-managed and conserved historic environment.
Historic Environment Good Practice Advice in Planning: the Historic Environment in Local Plans
Historic Environment Good Practice Advice in Planning Note 1: the Historic Environment in Local Plans
This document aims to assist local authorities and other interested parties in implementing historic environment policy in the NPPF and PPG. It identifies strategic guidance for evidence collection, sourcing and application. It also advises on inappropriate development, as well as conservation policies
Plan policies should acknowledge the requirements given in the Advice. Plan policies should ensure that evidence

Mole Valley District Council Planning Services Page 47
Key objectives or requirements of the plan or programme How objectives and requirements might be taken on board
and management policies. collection also involves determining the value to society (significance) of sites. Sustainability Appraisal should include evidence for the historic environment.
Historic Environment Good Practice Advice in planning: Managing Significance in Decision-Taking in the Historic Environment
Historic Environment Good Practice Advice in Planning Note 2 (Managing Significance in Decision-Taking in the Historic Environment
The purpose of this document is to assist local authorities and other interested parties in implementing historic environment policy in the NPPF and PPG. It highlights that development proposals affecting historic environment are more likely to gain permissions if they are designed with the understanding of the significance of the assets they may affect. The understanding of the nature, extent and level of significance are necessary. It also discusses decision-taking regarding assets, extraction, engagement and consent.
Plan policies should acknowledge the requirements given in the Advice. Plan policies need to identify the significance of heritage assets that may be affected by development. Local authorities need to have access to Historic Environment Records.
Historic Environment Good Practice Advice in Planning: The Setting of Heritage Assets
Historic Environment Good Practice Advice in Planning Note 3 The Setting of Heritage Assets
Purpose of document is to assist local authorities and other interested parties in implementing historic environment policy in the NPPF and PPG. It highlights the extent of the setting, curtilage, character and context of a historic place and recommends an approach for assessing the historic environment.
Plan policies should acknowledge the requirements given in the Advice. Plan policies should acknowledge the approach given for assessing the historic environment.
The Plan for Growth 2011
The Plan for Growth 2011
The Government’s economic policy objective is to achieve strong, sustainable and balanced growth that is more evenly shared across the country and between industries. The Plan for Growth contains four overarching ambitions that will ensure the progress is made towards achieving this economic objective. Key implications for planning are:
Radical changes to the planning system to support job creation by introducing a powerful presumption in favour of sustainable development.
Localise choice about the use of previously developed land, removing targets, while retaining existing controls on greenbelt land.
Produce shorter, more focused and inherently pro-growth NPPF to deliver more development is suitable and viable locations.
Clear expectations that decisions should prioritise growth and jobs.
Powers to bring forward neighbourhood plans and development orders.
Enterprise zones with lower levels of planning control.
Speed up planning system and decision making.
Extend permitted development rights.
Ensure plans positively promote growth, deliver sustainable development and reflect local views.
The Plan for Growth 2011
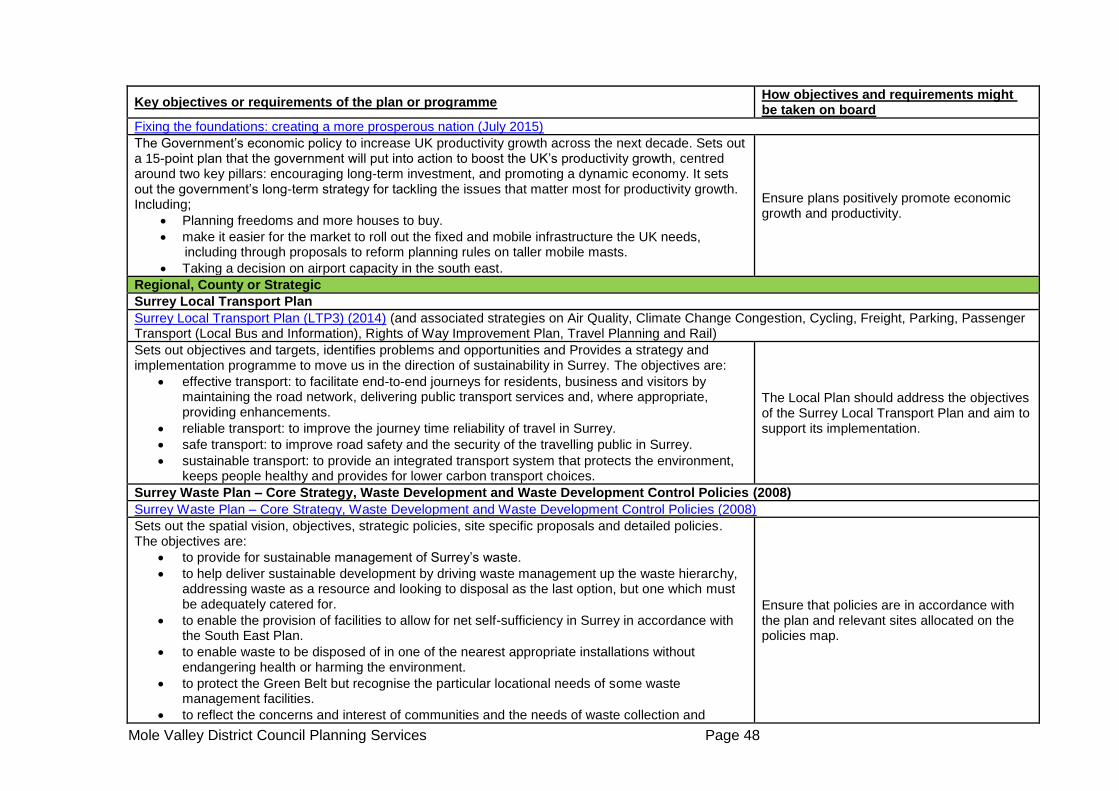
Mole Valley District Council Planning Services Page 48
Key objectives or requirements of the plan or programme How objectives and requirements might be taken on board
Fixing the foundations: creating a more prosperous nation (July 2015)
The Government’s economic policy to increase UK productivity growth across the next decade. Sets out a 15-point plan that the government will put into action to boost the UK’s productivity growth, centred around two key pillars: encouraging long-term investment, and promoting a dynamic economy. It sets out the government’s long-term strategy for tackling the issues that matter most for productivity growth. Including;
Planning freedoms and more houses to buy.
make it easier for the market to roll out the fixed and mobile infrastructure the UK needs, including through proposals to reform planning rules on taller mobile masts.
Taking a decision on airport capacity in the south east.
Ensure plans positively promote economic growth and productivity.
Regional, County or Strategic
Surrey Local Transport Plan
Surrey Local Transport Plan (LTP3) (2014) (and associated strategies on Air Quality, Climate Change Congestion, Cycling, Freight, Parking, Passenger Transport (Local Bus and Information), Rights of Way Improvement Plan, Travel Planning and Rail)
Sets out objectives and targets, identifies problems and opportunities and Provides a strategy and implementation programme to move us in the direction of sustainability in Surrey. The objectives are:
effective transport: to facilitate end-to-end journeys for residents, business and visitors by maintaining the road network, delivering public transport services and, where appropriate, providing enhancements.
reliable transport: to improve the journey time reliability of travel in Surrey.
safe transport: to improve road safety and the security of the travelling public in Surrey.
sustainable transport: to provide an integrated transport system that protects the environment, keeps people healthy and provides for lower carbon transport choices.
The Local Plan should address the objectives of the Surrey Local Transport Plan and aim to support its implementation.
Surrey Waste Plan – Core Strategy, Waste Development and Waste Development Control Policies (2008)
Surrey Waste Plan – Core Strategy, Waste Development and Waste Development Control Policies (2008)
Sets out the spatial vision, objectives, strategic policies, site specific proposals and detailed policies. The objectives are:
to provide for sustainable management of Surrey’s waste.
to help deliver sustainable development by driving waste management up the waste hierarchy, addressing waste as a resource and looking to disposal as the last option, but one which must be adequately catered for.
to enable the provision of facilities to allow for net self-sufficiency in Surrey in accordance with the South East Plan.
to enable waste to be disposed of in one of the nearest appropriate installations without endangering health or harming the environment.
to protect the Green Belt but recognise the particular locational needs of some waste management facilities.
to reflect the concerns and interest of communities and the needs of waste collection and
Ensure that policies are in accordance with the plan and relevant sites allocated on the policies map.
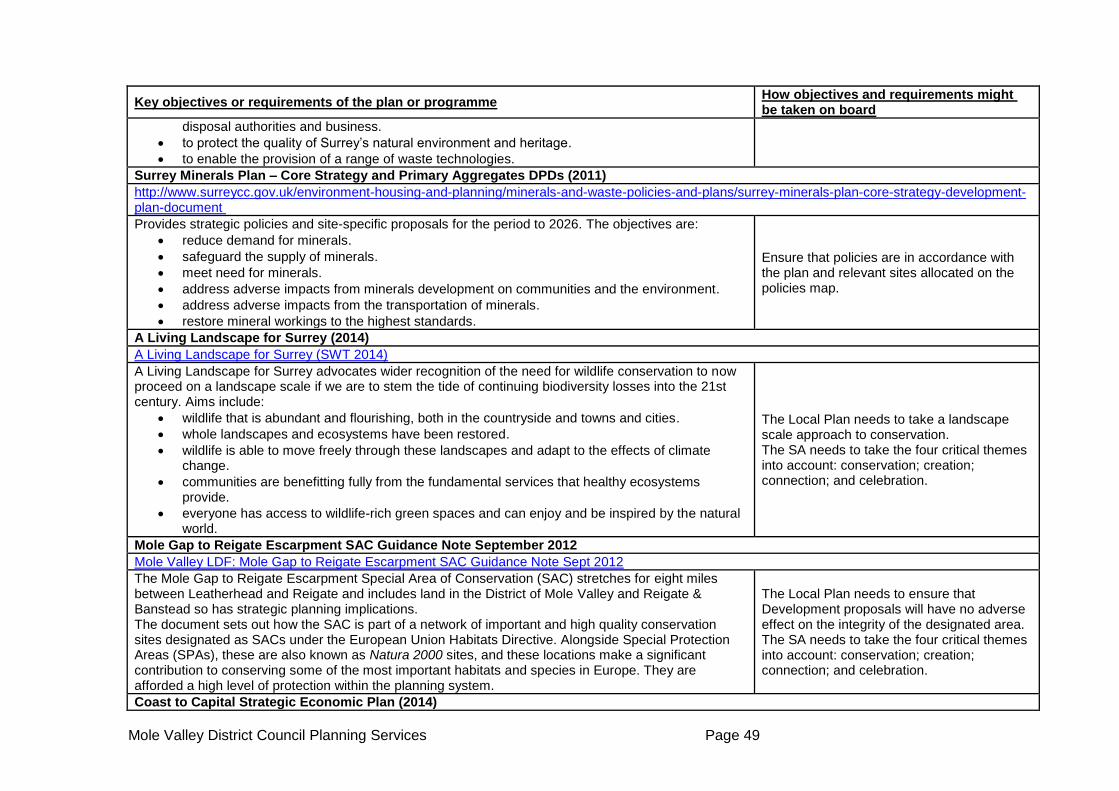
Mole Valley District Council Planning Services Page 49
Key objectives or requirements of the plan or programme How objectives and requirements might be taken on board
disposal authorities and business.
to protect the quality of Surrey’s natural environment and heritage.
to enable the provision of a range of waste technologies.
Surrey Minerals Plan – Core Strategy and Primary Aggregates DPDs (2011)
http://www.surreycc.gov.uk/environment-housing-and-planning/minerals-and-waste-policies-and-plans/surrey-minerals-plan-core-strategy-development-plan-document
Provides strategic policies and site-specific proposals for the period to 2026. The objectives are:
reduce demand for minerals.
safeguard the supply of minerals.
meet need for minerals.
address adverse impacts from minerals development on communities and the environment.
address adverse impacts from the transportation of minerals.
restore mineral workings to the highest standards.
Ensure that policies are in accordance with the plan and relevant sites allocated on the policies map.
A Living Landscape for Surrey (2014)
A Living Landscape for Surrey (SWT 2014)
A Living Landscape for Surrey advocates wider recognition of the need for wildlife conservation to now proceed on a landscape scale if we are to stem the tide of continuing biodiversity losses into the 21st century. Aims include:
wildlife that is abundant and flourishing, both in the countryside and towns and cities.
whole landscapes and ecosystems have been restored.
wildlife is able to move freely through these landscapes and adapt to the effects of climate change.
communities are benefitting fully from the fundamental services that healthy ecosystems provide.
everyone has access to wildlife-rich green spaces and can enjoy and be inspired by the natural world.
The Local Plan needs to take a landscape scale approach to conservation. The SA needs to take the four critical themes into account: conservation; creation; connection; and celebration.
Mole Gap to Reigate Escarpment SAC Guidance Note September 2012
Mole Valley LDF: Mole Gap to Reigate Escarpment SAC Guidance Note Sept 2012
The Mole Gap to Reigate Escarpment Special Area of Conservation (SAC) stretches for eight miles between Leatherhead and Reigate and includes land in the District of Mole Valley and Reigate & Banstead so has strategic planning implications. The document sets out how the SAC is part of a network of important and high quality conservation sites designated as SACs under the European Union Habitats Directive. Alongside Special Protection Areas (SPAs), these are also known as Natura 2000 sites, and these locations make a significant contribution to conserving some of the most important habitats and species in Europe. They are afforded a high level of protection within the planning system.
The Local Plan needs to ensure that Development proposals will have no adverse effect on the integrity of the designated area. The SA needs to take the four critical themes into account: conservation; creation; connection; and celebration.
Coast to Capital Strategic Economic Plan (2014)
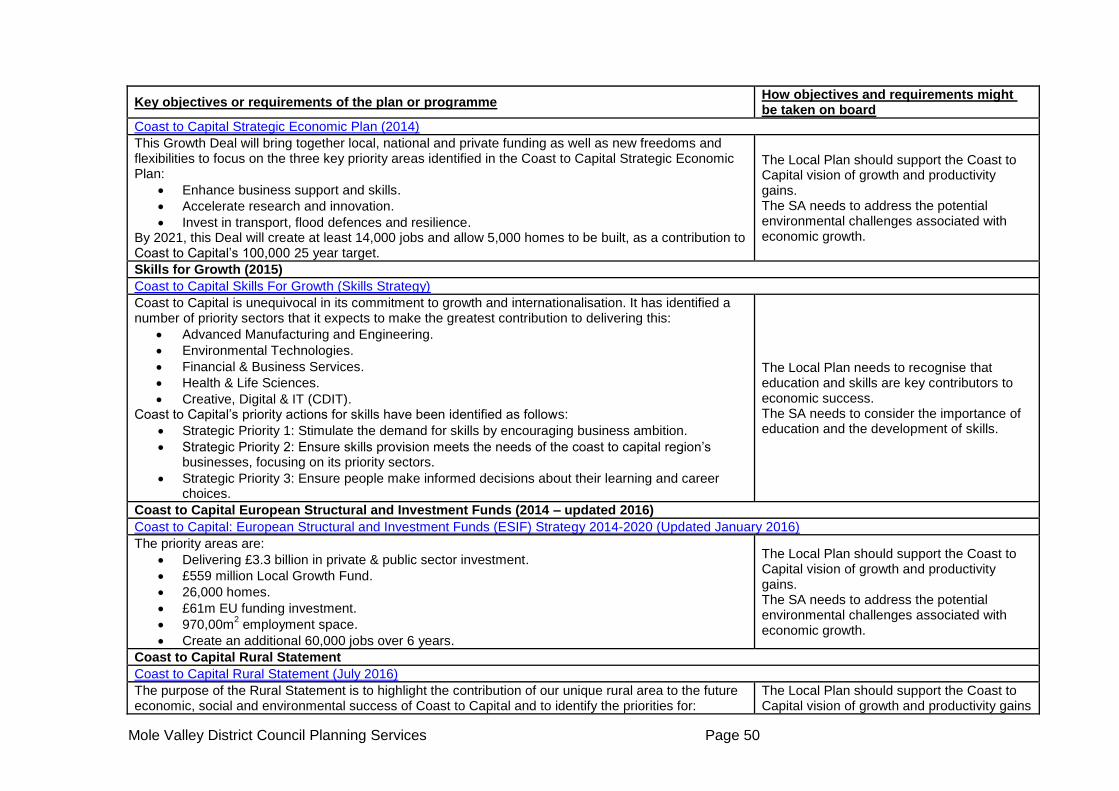
Mole Valley District Council Planning Services Page 50
Key objectives or requirements of the plan or programme How objectives and requirements might be taken on board
Coast to Capital Strategic Economic Plan (2014)
This Growth Deal will bring together local, national and private funding as well as new freedoms and flexibilities to focus on the three key priority areas identified in the Coast to Capital Strategic Economic Plan:
Enhance business support and skills.
Accelerate research and innovation.
Invest in transport, flood defences and resilience. By 2021, this Deal will create at least 14,000 jobs and allow 5,000 homes to be built, as a contribution to Coast to Capital’s 100,000 25 year target.
The Local Plan should support the Coast to Capital vision of growth and productivity gains. The SA needs to address the potential environmental challenges associated with economic growth.
Skills for Growth (2015)
Coast to Capital Skills For Growth (Skills Strategy)
Coast to Capital is unequivocal in its commitment to growth and internationalisation. It has identified a number of priority sectors that it expects to make the greatest contribution to delivering this:
Advanced Manufacturing and Engineering.
Environmental Technologies.
Financial & Business Services.
Health & Life Sciences.
Creative, Digital & IT (CDIT). Coast to Capital’s priority actions for skills have been identified as follows:
Strategic Priority 1: Stimulate the demand for skills by encouraging business ambition.
Strategic Priority 2: Ensure skills provision meets the needs of the coast to capital region’s businesses, focusing on its priority sectors.
Strategic Priority 3: Ensure people make informed decisions about their learning and career choices.
The Local Plan needs to recognise that education and skills are key contributors to economic success. The SA needs to consider the importance of education and the development of skills.
Coast to Capital European Structural and Investment Funds (2014 – updated 2016)
Coast to Capital: European Structural and Investment Funds (ESIF) Strategy 2014-2020 (Updated January 2016)
The priority areas are:
Delivering £3.3 billion in private & public sector investment.
£559 million Local Growth Fund.
26,000 homes.
£61m EU funding investment.
970,00m2 employment space.
Create an additional 60,000 jobs over 6 years.
The Local Plan should support the Coast to Capital vision of growth and productivity gains. The SA needs to address the potential environmental challenges associated with economic growth.
Coast to Capital Rural Statement
Coast to Capital Rural Statement (July 2016)
The purpose of the Rural Statement is to highlight the contribution of our unique rural area to the future economic, social and environmental success of Coast to Capital and to identify the priorities for:
The Local Plan should support the Coast to Capital vision of growth and productivity gains

Mole Valley District Council Planning Services Page 51
Key objectives or requirements of the plan or programme How objectives and requirements might be taken on board
Building knowledge and skills in rural areas
Funding new and developing non-agricultural, micro, small and medium sized rural businesses
Supporting tourism activities in rural areas
for the rural area. The SA needs to address the potential environmental challenges associated with economic growth.
Surrey Health and Wellbeing Strategy
Surrey's Joint Health and Wellbeing Strategy
Surrey's Health and Wellbeing Board is in place for NHS, Public Health, children's and adult's social care, local councillors and service user representatives to work together to improve the health and wellbeing of the people of Surrey. The five priorities it sets out are:
Improving children’s health and wellbeing.
Developing a preventative approach.
Promoting emotional wellbeing and mental health.
Improving older adults’ health and wellbeing.
Safeguarding the population.
Ensure that plan policies support the priorities contained within the plan.
Thames Catchment Flood Management Plan (Environment Agency, 2009)
Thames Catchment Flood Management Plan (2009)
Sets out the scale and extent of flooding now and in the future and sets policies for managing flood risk within the catchment. Mole Valley is listed as having between 250 and 500 properties at risk in a 1% annual probability of river flood.
Ensure that plan policies take account of policies within the plan to manage flood risk.
Water Resources Strategy and Regional Action Plan for South East Region (2009)
Water Resources Strategy and Regional Action Plan for South East Region (2009)
Set out a series of actions to deliver a secure water supply and safeguard the environment. The strategy has four aims:
adaptation to and mitigation of climate change.
a better water environment.
sustainable planning and management of water resources.
people valuing water and the water environment. The strategy is supported by regional action plans.
Ensure that the scale and location of development takes account of its impact on water resources.
Water Company Water Resources Management Plans (Various)
Thames Water Resources Management Plan Sutton and East Surrey Water Resources Management Plan
Thames Water and Sutton and East Surrey Water have produced Water Resources Management Plans that set out a package of measures to balance the demand and supply of water for 25 years.
Ensure that the scale and location of development takes account of its impact on water resources.
River Basin Management Plan Thames River Basin District River Basin Management Plan (2015)
Thames River Basin Management Plan (2015)
Focuses on the protection, improvement and sustainable use of the water environment. The Plan (which Ensure that the scale and location of
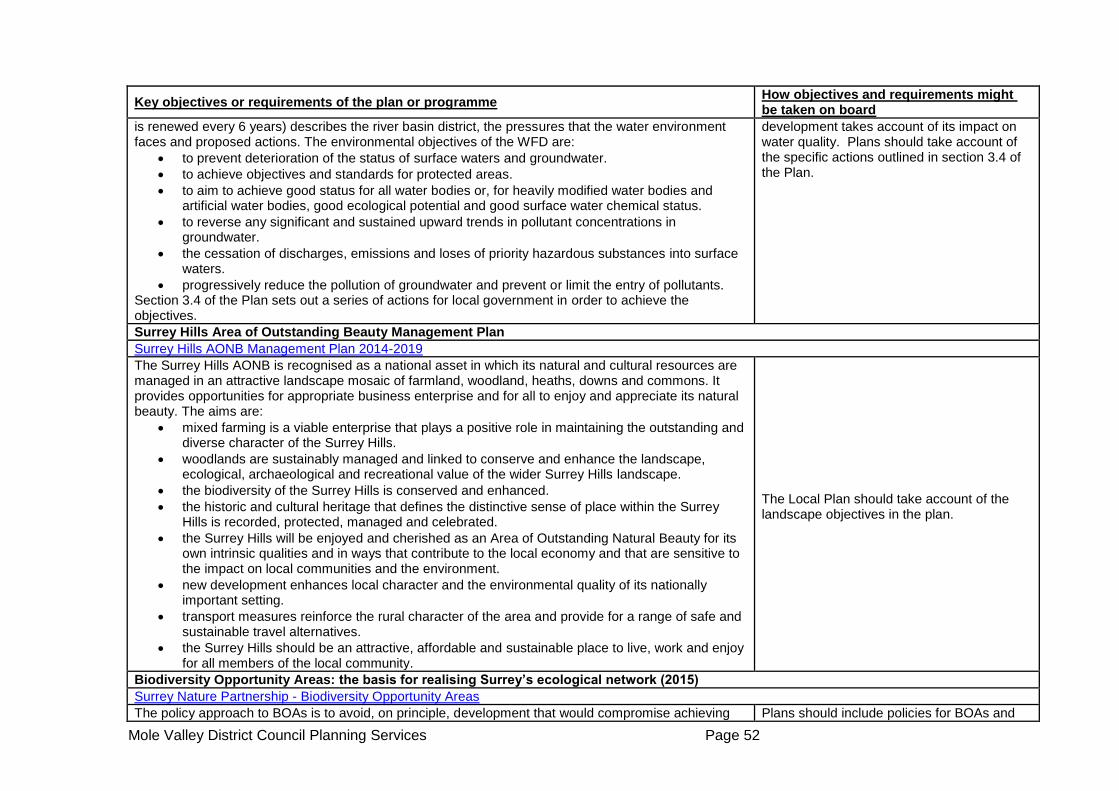
Mole Valley District Council Planning Services Page 52
Key objectives or requirements of the plan or programme How objectives and requirements might be taken on board
is renewed every 6 years) describes the river basin district, the pressures that the water environment faces and proposed actions. The environmental objectives of the WFD are:
to prevent deterioration of the status of surface waters and groundwater.
to achieve objectives and standards for protected areas.
to aim to achieve good status for all water bodies or, for heavily modified water bodies and artificial water bodies, good ecological potential and good surface water chemical status.
to reverse any significant and sustained upward trends in pollutant concentrations in groundwater.
the cessation of discharges, emissions and loses of priority hazardous substances into surface waters.
progressively reduce the pollution of groundwater and prevent or limit the entry of pollutants. Section 3.4 of the Plan sets out a series of actions for local government in order to achieve the objectives.
development takes account of its impact on water quality. Plans should take account of the specific actions outlined in section 3.4 of the Plan.
Surrey Hills Area of Outstanding Beauty Management Plan
Surrey Hills AONB Management Plan 2014-2019
The Surrey Hills AONB is recognised as a national asset in which its natural and cultural resources are managed in an attractive landscape mosaic of farmland, woodland, heaths, downs and commons. It provides opportunities for appropriate business enterprise and for all to enjoy and appreciate its natural beauty. The aims are:
mixed farming is a viable enterprise that plays a positive role in maintaining the outstanding and diverse character of the Surrey Hills.
woodlands are sustainably managed and linked to conserve and enhance the landscape, ecological, archaeological and recreational value of the wider Surrey Hills landscape.
the biodiversity of the Surrey Hills is conserved and enhanced.
the historic and cultural heritage that defines the distinctive sense of place within the Surrey Hills is recorded, protected, managed and celebrated.
the Surrey Hills will be enjoyed and cherished as an Area of Outstanding Natural Beauty for its own intrinsic qualities and in ways that contribute to the local economy and that are sensitive to the impact on local communities and the environment.
new development enhances local character and the environmental quality of its nationally important setting.
transport measures reinforce the rural character of the area and provide for a range of safe and sustainable travel alternatives.
the Surrey Hills should be an attractive, affordable and sustainable place to live, work and enjoy for all members of the local community.
The Local Plan should take account of the landscape objectives in the plan.
Biodiversity Opportunity Areas: the basis for realising Surrey’s ecological network (2015)
Surrey Nature Partnership - Biodiversity Opportunity Areas
The policy approach to BOAs is to avoid, on principle, development that would compromise achieving Plans should include policies for BOAs and
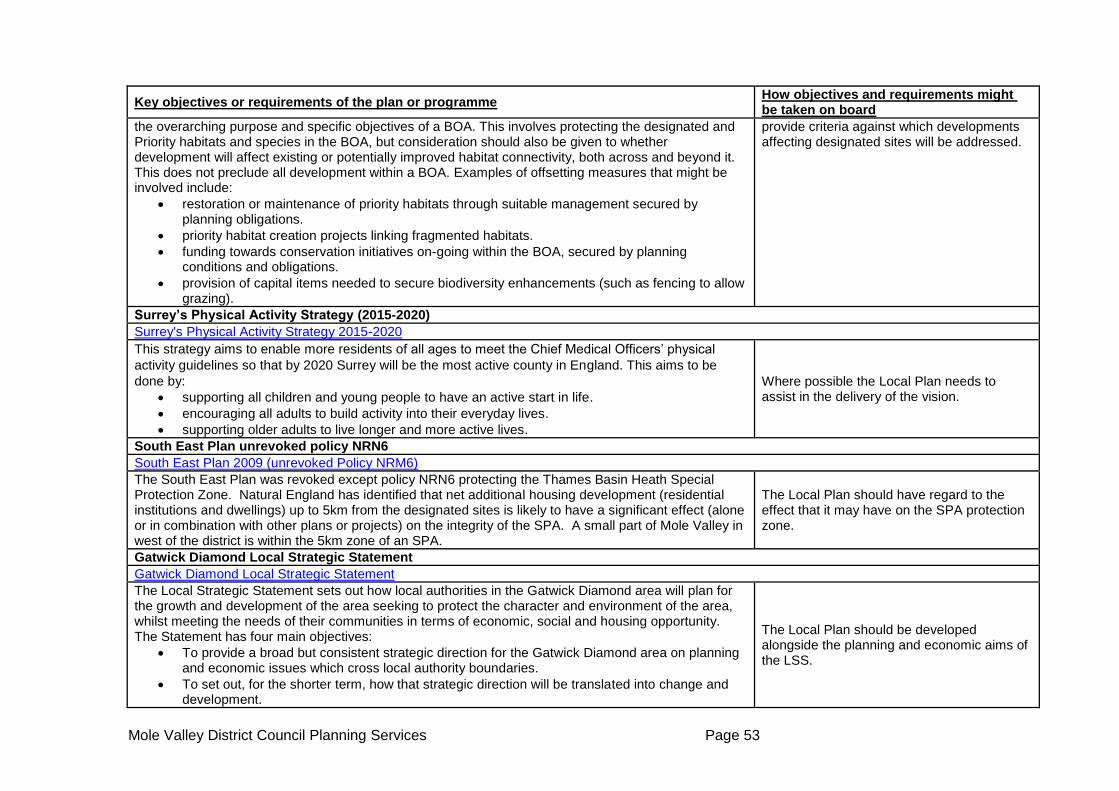
Mole Valley District Council Planning Services Page 53
Key objectives or requirements of the plan or programme How objectives and requirements might be taken on board
the overarching purpose and specific objectives of a BOA. This involves protecting the designated and Priority habitats and species in the BOA, but consideration should also be given to whether development will affect existing or potentially improved habitat connectivity, both across and beyond it. This does not preclude all development within a BOA. Examples of offsetting measures that might be involved include:
restoration or maintenance of priority habitats through suitable management secured by planning obligations.
priority habitat creation projects linking fragmented habitats.
funding towards conservation initiatives on-going within the BOA, secured by planning conditions and obligations.
provision of capital items needed to secure biodiversity enhancements (such as fencing to allow grazing).
provide criteria against which developments affecting designated sites will be addressed.
Surrey’s Physical Activity Strategy (2015-2020)
Surrey's Physical Activity Strategy 2015-2020
This strategy aims to enable more residents of all ages to meet the Chief Medical Officers’ physical
activity guidelines so that by 2020 Surrey will be the most active county in England. This aims to be
done by:
supporting all children and young people to have an active start in life.
encouraging all adults to build activity into their everyday lives.
supporting older adults to live longer and more active lives.
Where possible the Local Plan needs to assist in the delivery of the vision.
South East Plan unrevoked policy NRN6
South East Plan 2009 (unrevoked Policy NRM6)
The South East Plan was revoked except policy NRN6 protecting the Thames Basin Heath Special Protection Zone. Natural England has identified that net additional housing development (residential institutions and dwellings) up to 5km from the designated sites is likely to have a significant effect (alone or in combination with other plans or projects) on the integrity of the SPA. A small part of Mole Valley in west of the district is within the 5km zone of an SPA.
The Local Plan should have regard to the effect that it may have on the SPA protection zone.
Gatwick Diamond Local Strategic Statement
Gatwick Diamond Local Strategic Statement
The Local Strategic Statement sets out how local authorities in the Gatwick Diamond area will plan for the growth and development of the area seeking to protect the character and environment of the area, whilst meeting the needs of their communities in terms of economic, social and housing opportunity. The Statement has four main objectives:
To provide a broad but consistent strategic direction for the Gatwick Diamond area on planning and economic issues which cross local authority boundaries.
To set out, for the shorter term, how that strategic direction will be translated into change and development.
The Local Plan should be developed alongside the planning and economic aims of the LSS.
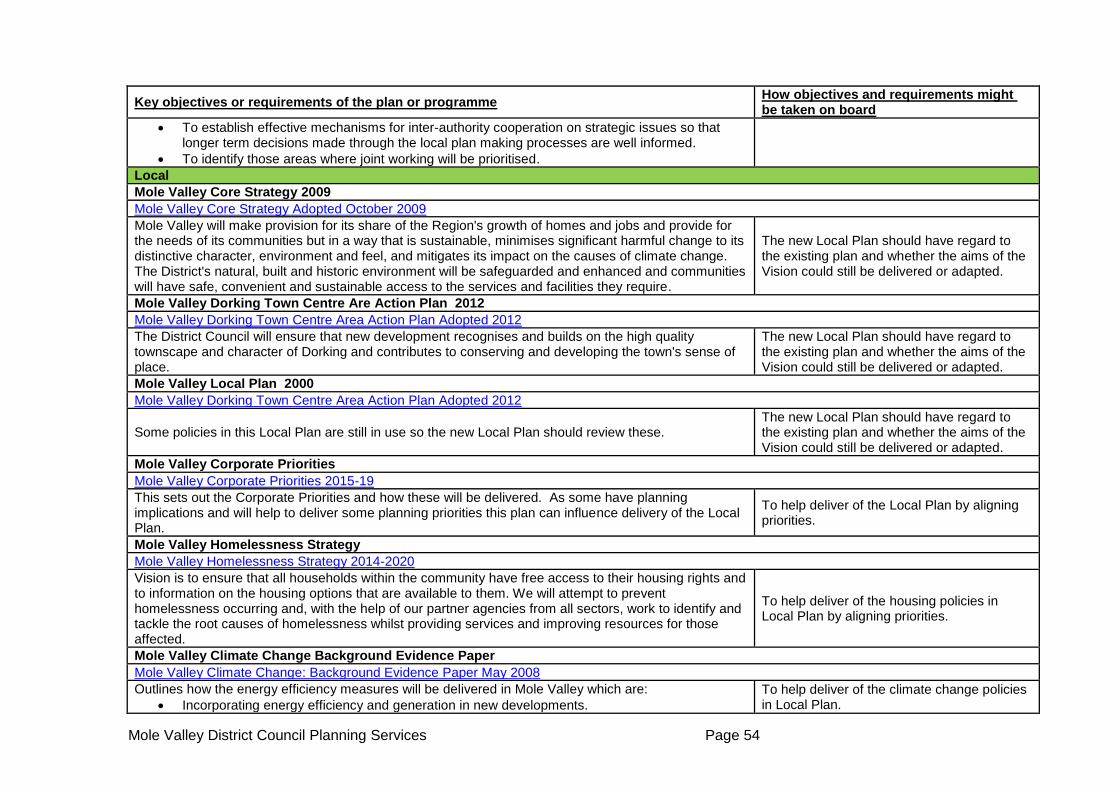
Mole Valley District Council Planning Services Page 54
Key objectives or requirements of the plan or programme How objectives and requirements might be taken on board
To establish effective mechanisms for inter-authority cooperation on strategic issues so that longer term decisions made through the local plan making processes are well informed.
To identify those areas where joint working will be prioritised.
Local
Mole Valley Core Strategy 2009
Mole Valley Core Strategy Adopted October 2009
Mole Valley will make provision for its share of the Region's growth of homes and jobs and provide for the needs of its communities but in a way that is sustainable, minimises significant harmful change to its distinctive character, environment and feel, and mitigates its impact on the causes of climate change. The District's natural, built and historic environment will be safeguarded and enhanced and communities will have safe, convenient and sustainable access to the services and facilities they require.
The new Local Plan should have regard to the existing plan and whether the aims of the Vision could still be delivered or adapted.
Mole Valley Dorking Town Centre Are Action Plan 2012
Mole Valley Dorking Town Centre Area Action Plan Adopted 2012
The District Council will ensure that new development recognises and builds on the high quality townscape and character of Dorking and contributes to conserving and developing the town's sense of place.
The new Local Plan should have regard to the existing plan and whether the aims of the Vision could still be delivered or adapted.
Mole Valley Local Plan 2000
Mole Valley Dorking Town Centre Area Action Plan Adopted 2012
Some policies in this Local Plan are still in use so the new Local Plan should review these. The new Local Plan should have regard to the existing plan and whether the aims of the Vision could still be delivered or adapted.
Mole Valley Corporate Priorities
Mole Valley Corporate Priorities 2015-19
This sets out the Corporate Priorities and how these will be delivered. As some have planning implications and will help to deliver some planning priorities this plan can influence delivery of the Local Plan.
To help deliver of the Local Plan by aligning priorities.
Mole Valley Homelessness Strategy
Mole Valley Homelessness Strategy 2014-2020
Vision is to ensure that all households within the community have free access to their housing rights and to information on the housing options that are available to them. We will attempt to prevent homelessness occurring and, with the help of our partner agencies from all sectors, work to identify and tackle the root causes of homelessness whilst providing services and improving resources for those affected.
To help deliver of the housing policies in Local Plan by aligning priorities.
Mole Valley Climate Change Background Evidence Paper
Mole Valley Climate Change: Background Evidence Paper May 2008
Outlines how the energy efficiency measures will be delivered in Mole Valley which are:
Incorporating energy efficiency and generation in new developments.
To help deliver of the climate change policies in Local Plan.
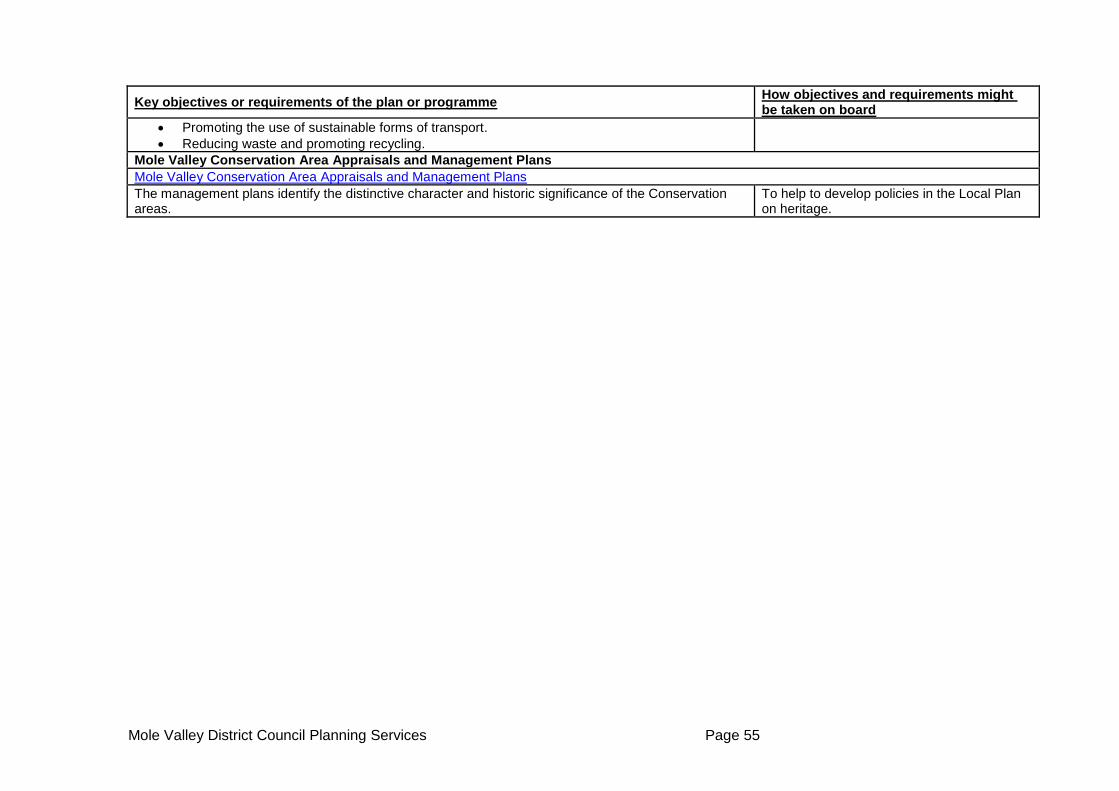
Mole Valley District Council Planning Services Page 55
Key objectives or requirements of the plan or programme How objectives and requirements might be taken on board
Promoting the use of sustainable forms of transport.
Reducing waste and promoting recycling.
Mole Valley Conservation Area Appraisals and Management Plans
Mole Valley Conservation Area Appraisals and Management Plans
The management plans identify the distinctive character and historic significance of the Conservation areas.
To help to develop policies in the Local Plan on heritage.
Mole Valley District Council Planning Services Page 56
Appendix 2 – Baseline data
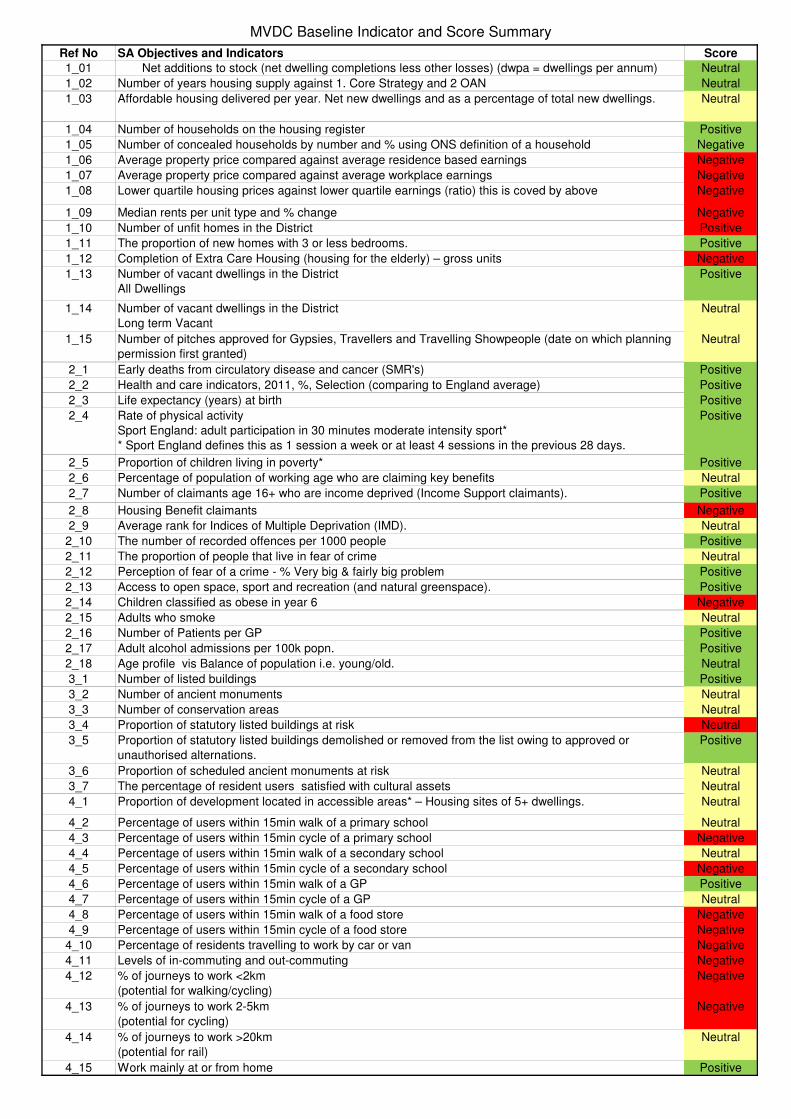
MVDC Baseline Indicator and Score Summary
Ref No SA Objectives and Indicators Score
1_01 Net additions to stock (net dwelling completions less other losses) (dwpa = dwellings per annum) Neutral
1_02 Number of years housing supply against 1. Core Strategy and 2 OAN Neutral
1_03 Affordable housing delivered per year. Net new dwellings and as a percentage of total new dwellings. Neutral
1_04 Number of households on the housing register Positive
1_05 Number of concealed households by number and % using ONS definition of a household Negative
1_06 Average property price compared against average residence based earnings Negative
1_07 Average property price compared against average workplace earnings Negative
1_08 Lower quartile housing prices against lower quartile earnings (ratio) this is coved by above Negative
1_09 Median rents per unit type and % change Negative
1_10 Number of unfit homes in the District Positive
1_11 The proportion of new homes with 3 or less bedrooms. Positive
1_12 Completion of Extra Care Housing (housing for the elderly) – gross units Negative
1_13 Number of vacant dwellings in the District
All Dwellings
Positive
1_14 Number of vacant dwellings in the District
Long term Vacant
Neutral
1_15 Number of pitches approved for Gypsies, Travellers and Travelling Showpeople (date on which planning
permission first granted)
Neutral
2_1 Early deaths from circulatory disease and cancer (SMR's) Positive
2_2 Health and care indicators, 2011, %, Selection (comparing to England average) Positive
2_3 Life expectancy (years) at birth Positive
2_4 Rate of physical activity
Sport England: adult participation in 30 minutes moderate intensity sport*
* Sport England defines this as 1 session a week or at least 4 sessions in the previous 28 days.
Positive
2_5 Proportion of children living in poverty* Positive
2_6 Percentage of population of working age who are claiming key benefits Neutral
2_7 Number of claimants age 16+ who are income deprived (Income Support claimants). Positive
2_8 Housing Benefit claimants Negative
2_9 Average rank for Indices of Multiple Deprivation (IMD). Neutral
2_10 The number of recorded offences per 1000 people Positive
2_11 The proportion of people that live in fear of crime Neutral
2_12 Perception of fear of a crime - % Very big & fairly big problem Positive
2_13 Access to open space, sport and recreation (and natural greenspace). Positive
2_14 Children classified as obese in year 6 Negative
2_15 Adults who smoke Neutral
2_16 Number of Patients per GP Positive
2_17 Adult alcohol admissions per 100k popn. Positive
2_18 Age profile vis Balance of population i.e. young/old. Neutral
3_1 Number of listed buildings Positive
3_2 Number of ancient monuments Neutral
3_3 Number of conservation areas Neutral
3_4 Proportion of statutory listed buildings at risk Neutral
3_5 Proportion of statutory listed buildings demolished or removed from the list owing to approved or
unauthorised alternations.
Positive
3_6 Proportion of scheduled ancient monuments at risk Neutral
3_7 The percentage of resident users satisfied with cultural assets Neutral
4_1 Proportion of development located in accessible areas* – Housing sites of 5+ dwellings. Neutral
4_2 Percentage of users within 15min walk of a primary school Neutral
4_3 Percentage of users within 15min cycle of a primary school Negative
4_4 Percentage of users within 15min walk of a secondary school Neutral
4_5 Percentage of users within 15min cycle of a secondary school Negative
4_6 Percentage of users within 15min walk of a GP Positive
4_7 Percentage of users within 15min cycle of a GP Neutral
4_8 Percentage of users within 15min walk of a food store Negative
4_9 Percentage of users within 15min cycle of a food store Negative
4_10 Percentage of residents travelling to work by car or van Negative
4_11 Levels of in-commuting and out-commuting Negative
4_12 % of journeys to work <2km
(potential for walking/cycling)
Negative
4_13 % of journeys to work 2-5km
(potential for cycling)
Negative
4_14 % of journeys to work >20km
(potential for rail)
Neutral
4_15 Work mainly at or from home Positive

MVDC Baseline Indicator and Score Summary
Ref No SA Objectives and Indicators Score
4_16 Percentage of all respondents satisfied with the local bus service Neutral
4_17 Bus reliability Neutral
4_18 Local bus services (passenger journeys per year) Neutral
4_19 Local bus services (passenger journeys per head of population) Negative
5_01 Percentage of dwellings built on previously developed land (PDL) (urban and rural). Positive
5_02 The amount of commercial development built on previously developed land Positive
5_03 Average density (Dwellings per Ha.=dwha) Positive
5_04 Office to residential PD conversions Positive
6_01 Growth in Gross Value Added (GVA per capita) Positive
6_02 Number and percentage of resident population age 16-64 who are claiming Job Seekers Allowance (JSA) Positive
6_03 Balance between labour supply and labour demand. (Job densities). Neutral
6_04 The number of tourism related jobs (as % of total jobs) Neutral
6_05 Number of residents working at, or from home Neutral
6_06 UK competitive index ranking Negative
6_07 Percentage of pupils achieving five or more A*-C GCSEs (by location of pupil residence) inc. Maths and
English
Positive
6_08 Qualifications: % of working age population qualified to NVQ2 and above (GCSE’s and higher) Positive
6_09 Qualifications: % of working age population qualified to NVQ4 and above (Degree and higher) Negative
6_10 Proportion of adults with poor literacy and numeracy skills (Figures relate to proportion of adults with skills
levels below: EL3 - Entry Level 3 being level expected of 11 year old L2 – Level 2 equivalent to GCSE
Grades A-C)
Neutral
7_1 Jobseekers Allowance (JSA) claimant counts aged 16 -64 unemployed for over 12 months. Negative
7_2 Percentage of people of working age* that are economically active Positive
7_3 The net change* in the number of VAT registrations and de-registrations Positive
7_4 Average weekly earning for full time male and females working in the district Negative
7_5 Amount of floorspace in outstanding permissions for Office/ Business (B1a/B1) development (at 31st
March each year)
Negative
7_6 Amount of floorspace in outstanding permissions for Industry/Storage (B1c/B2/B8) development (at 31st
March each year)
Negative
7_7 The amount of vacant employment floorspace (office/Business B1a/B1) (at 31st March each year) Negative
7_8 The amount of vacant employment floorspace (Industry/storage B1c/B2/B8) (at 31st March each year) Neutral
7_9 Vacant employment floorspace ( offices, industrial and storage) as % of total stock - at 31st March each
year
Negative
7_10 The area of employment sites lost to other uses Positive
7_11 The number of rural diversification schemes (Commercial B1-B8 Uses) Negative
7_12 Shop surveys (change in vacancy rates) - Dorking Positive
7_13 Shop surveys (change in vacancy rates) - Leatherhead Positive
8_1 Number of homes incorporating CHP heating N/A
8_2 Installed capacity of sites generating electricity from renewable sources (MWe) Positive
8_3 Installed capacity for heat generation from renewable sources (KWth) Neutral
8_4 Generation of electricity from renewable sources (GWh) Positive
9_1 Gas - Average domestic consumption per meter (kWh)(rounded to nearest 10) Neutral
9_2 Electricity - Average domestic consumption per meter (kWh)(rounded to nearest 10) Positive
9_3 Number and percentage of new build homes meeting the required Code Level NA
9_4 Number of completed schemes and floorspace which met BREEAM “ very good” N/A
9_5 Waste collected per household (kilograms = kg) Positive
9_6 Collected household waste per person (kg) (Ex BVPI 84a) (rounded to nearest whole number) Neutral
9_7 Percentage of household waste sent for re-use, recycling and composting (Ex NI192) (rounded to nearest
whole number)
Positive
9_8 Average domestic water consumption (litres per person per day) Positive
9_9 The number of water meters installed at properties for the first time Neutral
9_10 Number and % of new properties linked to sustainable drainage systems (SuDS) Positive
10_1 Carbon dioxide emissions estimates within the scope of influence of Local Authorities per capita
(tonnes)(total emissions from all sources divided by mid-year population estimates)
Positive
10_2 Carbon dioxide reduction from the Council's operations (percentage based on 2008-09 baseline) Positive
10_3 Number of homes damaged as a result of an extreme weather event (using subsidence / underpinning
data as a proxy)
N/A
10_4 Number of weather warnings issued by severity Neutral
10_5 Number of high impact weather warnings issued Neutral
11_1 Number of properties* at risk from flooding (Zones 2 and 3) Negative
11_2 Number of planning permissions (for dwellings) granted contrary to the advice of the Environment Agency
on flooding grounds
Positive
12_1 a. Percentage of rivers in the plan area whose biological quality is rated as ‘’good’’ N/A
12_2 a. Biological grade of sample river length Positive
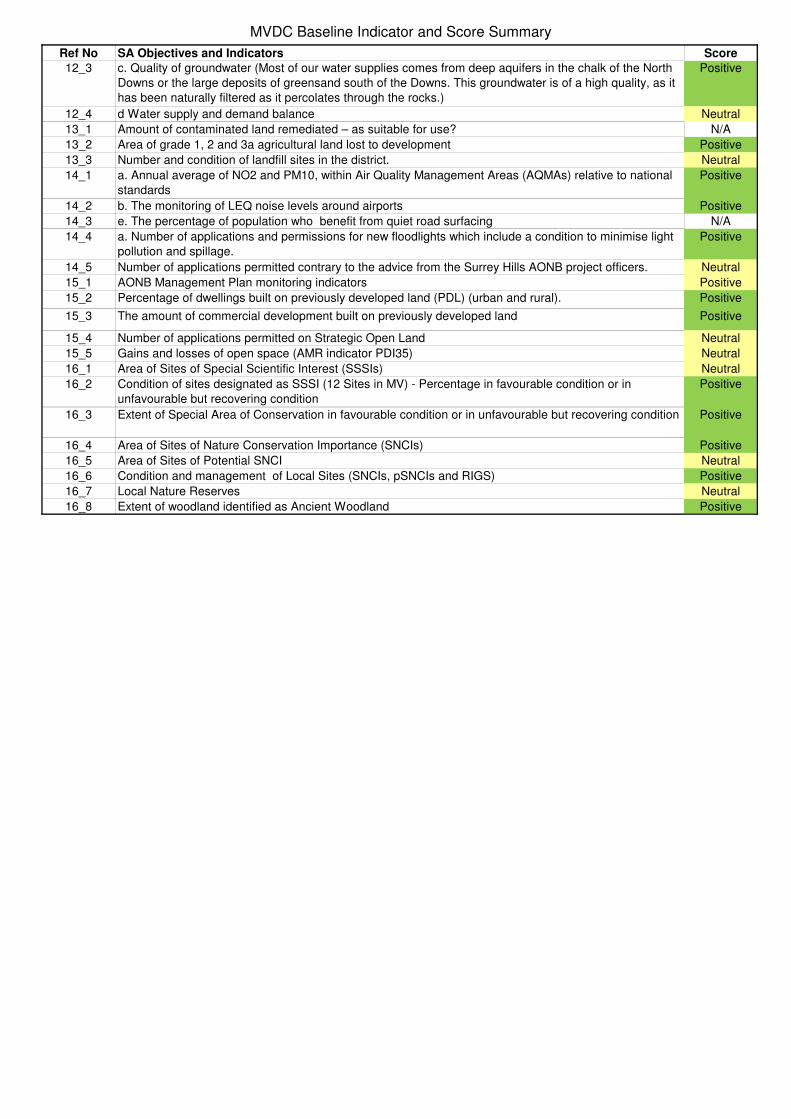
MVDC Baseline Indicator and Score Summary
Ref No SA Objectives and Indicators Score
12_3 c. Quality of groundwater (Most of our water supplies comes from deep aquifers in the chalk of the North
Downs or the large deposits of greensand south of the Downs. This groundwater is of a high quality, as it
has been naturally filtered as it percolates through the rocks.)
Positive
12_4 d Water supply and demand balance Neutral
13_1 Amount of contaminated land remediated – as suitable for use? N/A
13_2 Area of grade 1, 2 and 3a agricultural land lost to development Positive
13_3 Number and condition of landfill sites in the district. Neutral
14_1 a. Annual average of NO2 and PM10, within Air Quality Management Areas (AQMAs) relative to national
standards
Positive
14_2 b. The monitoring of LEQ noise levels around airports Positive
14_3 e. The percentage of population who benefit from quiet road surfacing N/A
14_4 a. Number of applications and permissions for new floodlights which include a condition to minimise light
pollution and spillage.
Positive
14_5 Number of applications permitted contrary to the advice from the Surrey Hills AONB project officers. Neutral
15_1 AONB Management Plan monitoring indicators Positive
15_2 Percentage of dwellings built on previously developed land (PDL) (urban and rural). Positive
15_3 The amount of commercial development built on previously developed land Positive
15_4 Number of applications permitted on Strategic Open Land Neutral
15_5 Gains and losses of open space (AMR indicator PDI35) Neutral
16_1 Area of Sites of Special Scientific Interest (SSSIs) Neutral
16_2 Condition of sites designated as SSSI (12 Sites in MV) - Percentage in favourable condition or in
unfavourable but recovering condition
Positive
16_3 Extent of Special Area of Conservation in favourable condition or in unfavourable but recovering condition Positive
16_4 Area of Sites of Nature Conservation Importance (SNCIs) Positive
16_5 Area of Sites of Potential SNCI Neutral
16_6 Condition and management of Local Sites (SNCIs, pSNCIs and RIGS) Positive
16_7 Local Nature Reserves Neutral
16_8 Extent of woodland identified as Ancient Woodland Positive

Objective 1 To provide sufficient houisng to enable people to live in a home suitable for their needs and in which they can afford.
Ref No SA Objectives and Indicators Mole Valley (MV) Data Comparators Targets Trend ScoreSource and Problems/
Constraints/Comments
1_01 Net additions to stock (net
dwelling completions less other
losses) (dwpa = dwellings per
annum)
2006-07 = 581
2007-08 = 269
2008-09 = 167
2009-10 = 115
2010-11 = 113
2011-12 = 235
2012-13 = 173
2013-14 = 127
2014-15 = 190
2015-16 = 158
2016-17 = 201
Total = 2,329
Average = 212 dwpa
None Mole Valley Core
Strategy set an
annual average
requirement of 188
dw/pa from 2006 to
2026. The average
has now exceeded
the target which is
good.
2016 SHMA
identifies an
objectively
assessed need of
391 dwellings per
annum between
2015 and 2035; a
level which has
only been met once
in the past ten
years.
Completions are above annual
target.
There has been a 2.43%
increase in the quantity of the
dwelling stock between 2009
which is slightly lower than
across the HMA but much lower
than the rate of increase in
London (3.62%), Surrey (2.51%)
and England (2.99%).
Neutral
Mole Valley housing completions
data and AMR (H1 and H2 – former
COIs).
1_02 Number of years housing supply
against 1. Core Strategy and 2
OAN
At 31 March 2017:
Deliverable supply =
1,228
105% requirement = 835
Adjusted annual
requirement = 167 (828/5)
Supply = 7.35 years
none 1 Requirement to
maintain a 5 year
supply against CS
2 Against OAN =
391pa plus 5%
buffer = 2,053
1. Good supply which has been
boosted by the Office residential
PD conversions.
2 Against OAN, there is a
residual need for 435 pa. but
only a 2.82 year supply.
Neutral
draft Five Year Housing Land Supply
Statement 2017 to 2022
1_03 Affordable housing delivered per
year. Net new dwellings and as
a percentage of total new
dwellings.
2006-07 = 10 = 28%
2007-08 = 56 = 21%
2008-09 = 39 = 22%
2009-10 = 47 = 41%
2010- 11 = 20 = 18%
2011-12 = 82 = 35%
2012-13 = 22 = 12%
2013-14 = 20 = 26%
2014-15 = 75 = 47%
Average = 41 dwpa
None The Core Strategy
indicates some net
950 dwellings
between 2006 -26
(i.e.; 47dw/pa).
Target met in only 4 of 9 years
and averages 41 dwellings per
annum. 579 dwellings to go,
increasing average requirement
to 52 dwellings per annum.
Developments of 10 dwellings or
less are no longer required to
make an affordable housing
contribution further constraining
delivery.
Neutral
Mole Valley housing completions
data and AMR. Policy CS4 requires
delivery of on-site affordable housing
on developments of 10 or more
dwellings in line with the Government
guidance.
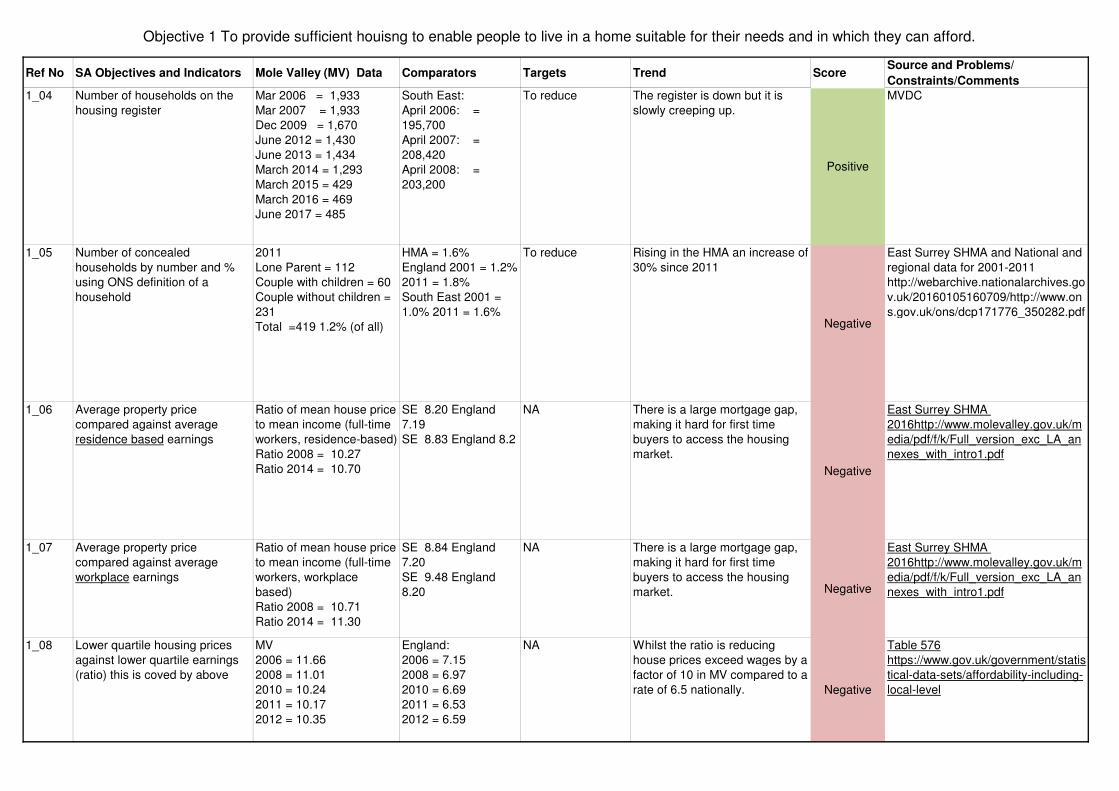
Objective 1 To provide sufficient houisng to enable people to live in a home suitable for their needs and in which they can afford.
Ref No SA Objectives and Indicators Mole Valley (MV) Data Comparators Targets Trend ScoreSource and Problems/
Constraints/Comments
1_04 Number of households on the
housing register
Mar 2006 = 1,933
Mar 2007 = 1,933
Dec 2009 = 1,670
June 2012 = 1,430
June 2013 = 1,434
March 2014 = 1,293
March 2015 = 429
March 2016 = 469
June 2017 = 485
South East:
April 2006: =
195,700
April 2007: =
208,420
April 2008: =
203,200
To reduce The register is down but it is
slowly creeping up.
Positive
MVDC
1_05 Number of concealed
households by number and %
using ONS definition of a
household
2011
Lone Parent = 112
Couple with children = 60
Couple without children =
231
Total =419 1.2% (of all)
HMA = 1.6%
England 2001 = 1.2%
2011 = 1.8%
South East 2001 =
1.0% 2011 = 1.6%
To reduce Rising in the HMA an increase of
30% since 2011
Negative
East Surrey SHMA and National and
regional data for 2001-2011
http://webarchive.nationalarchives.go
v.uk/20160105160709/http://www.on
s.gov.uk/ons/dcp171776_350282.pdf
1_06 Average property price
compared against average
residence based earnings
Ratio of mean house price
to mean income (full-time
workers, residence-based)
Ratio 2008 = 10.27
Ratio 2014 = 10.70
SE 8.20 England
7.19
SE 8.83 England 8.2
NA There is a large mortgage gap,
making it hard for first time
buyers to access the housing
market.
Negative
East Surrey SHMA
2016http://www.molevalley.gov.uk/m
edia/pdf/f/k/Full_version_exc_LA_an
nexes_with_intro1.pdf
1_07 Average property price
compared against average
workplace earnings
Ratio of mean house price
to mean income (full-time
workers, workplace
based)
Ratio 2008 = 10.71
Ratio 2014 = 11.30
SE 8.84 England
7.20
SE 9.48 England
8.20
NA There is a large mortgage gap,
making it hard for first time
buyers to access the housing
market. Negative
East Surrey SHMA
2016http://www.molevalley.gov.uk/m
edia/pdf/f/k/Full_version_exc_LA_an
nexes_with_intro1.pdf
1_08 Lower quartile housing prices
against lower quartile earnings
(ratio) this is coved by above
MV
2006 = 11.66
2008 = 11.01
2010 = 10.24
2011 = 10.17
2012 = 10.35
England:
2006 = 7.15
2008 = 6.97
2010 = 6.69
2011 = 6.53
2012 = 6.59
NA Whilst the ratio is reducing
house prices exceed wages by a
factor of 10 in MV compared to a
rate of 6.5 nationally. Negative
Table 576
https://www.gov.uk/government/statis
tical-data-sets/affordability-including-
local-level
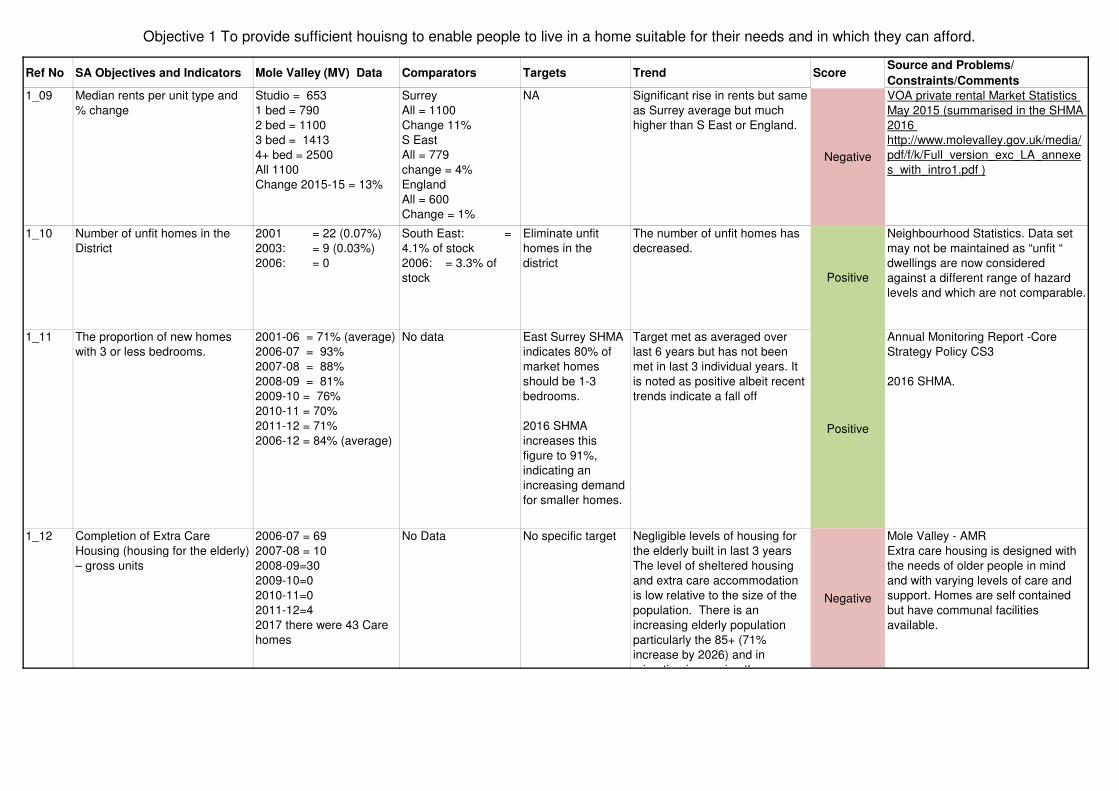
Objective 1 To provide sufficient houisng to enable people to live in a home suitable for their needs and in which they can afford.
Ref No SA Objectives and Indicators Mole Valley (MV) Data Comparators Targets Trend ScoreSource and Problems/
Constraints/Comments
1_09 Median rents per unit type and
% change
Studio = 653
1 bed = 790
2 bed = 1100
3 bed = 1413
4+ bed = 2500
All 1100
Change 2015-15 = 13%
Surrey
All = 1100
Change 11%
S East
All = 779
change = 4%
England
All = 600
Change = 1%
NA Significant rise in rents but same
as Surrey average but much
higher than S East or England.
Negative
VOA private rental Market Statistics
May 2015 (summarised in the SHMA
2016
http://www.molevalley.gov.uk/media/
pdf/f/k/Full_version_exc_LA_annexe
s_with_intro1.pdf )
1_10 Number of unfit homes in the
District
2001 = 22 (0.07%)
2003: = 9 (0.03%)
2006: = 0
South East: =
4.1% of stock
2006: = 3.3% of
stock
Eliminate unfit
homes in the
district
The number of unfit homes has
decreased.
Positive
Neighbourhood Statistics. Data set
may not be maintained as “unfit “
dwellings are now considered
against a different range of hazard
levels and which are not comparable.
1_11 The proportion of new homes
with 3 or less bedrooms.
2001-06 = 71% (average)
2006-07 = 93%
2007-08 = 88%
2008-09 = 81%
2009-10 = 76%
2010-11 = 70%
2011-12 = 71%
2006-12 = 84% (average)
No data East Surrey SHMA
indicates 80% of
market homes
should be 1-3
bedrooms.
2016 SHMA
increases this
figure to 91%,
indicating an
increasing demand
for smaller homes.
Target met as averaged over
last 6 years but has not been
met in last 3 individual years. It
is noted as positive albeit recent
trends indicate a fall off
Positive
Annual Monitoring Report -Core
Strategy Policy CS3
2016 SHMA.
1_12 Completion of Extra Care
Housing (housing for the elderly)
– gross units
2006-07 = 69
2007-08 = 10
2008-09=30
2009-10=0
2010-11=0
2011-12=4
2017 there were 43 Care
homes
No Data No specific target Negligible levels of housing for
the elderly built in last 3 years
The level of sheltered housing
and extra care accommodation
is low relative to the size of the
population. There is an
increasing elderly population
particularly the 85+ (71%
increase by 2026) and in
migration increasing the
Negative
Mole Valley - AMR
Extra care housing is designed with
the needs of older people in mind
and with varying levels of care and
support. Homes are self contained
but have communal facilities
available.
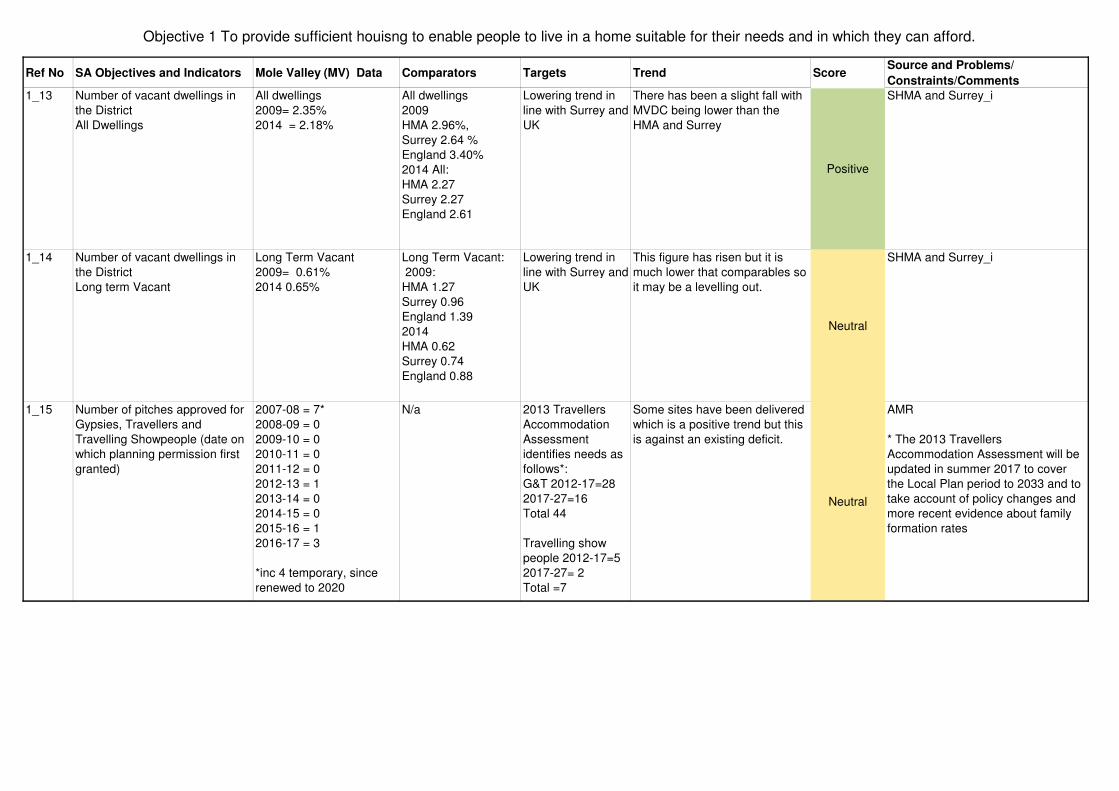
Objective 1 To provide sufficient houisng to enable people to live in a home suitable for their needs and in which they can afford.
Ref No SA Objectives and Indicators Mole Valley (MV) Data Comparators Targets Trend ScoreSource and Problems/
Constraints/Comments
1_13 Number of vacant dwellings in
the District
All Dwellings
All dwellings
2009= 2.35%
2014 = 2.18%
All dwellings
2009
HMA 2.96%,
Surrey 2.64 %
England 3.40%
2014 All:
HMA 2.27
Surrey 2.27
England 2.61
Lowering trend in
line with Surrey and
UK
There has been a slight fall with
MVDC being lower than the
HMA and Surrey
Positive
SHMA and Surrey_i
1_14 Number of vacant dwellings in
the District
Long term Vacant
Long Term Vacant
2009= 0.61%
2014 0.65%
Long Term Vacant:
2009:
HMA 1.27
Surrey 0.96
England 1.39
2014
HMA 0.62
Surrey 0.74
England 0.88
Lowering trend in
line with Surrey and
UK
This figure has risen but it is
much lower that comparables so
it may be a levelling out.
Neutral
SHMA and Surrey_i
1_15 Number of pitches approved for
Gypsies, Travellers and
Travelling Showpeople (date on
which planning permission first
granted)
2007-08 = 7*
2008-09 = 0
2009-10 = 0
2010-11 = 0
2011-12 = 0
2012-13 = 1
2013-14 = 0
2014-15 = 0
2015-16 = 1
2016-17 = 3
*inc 4 temporary, since
renewed to 2020
N/a 2013 Travellers
Accommodation
Assessment
identifies needs as
follows*:
G&T 2012-17=28
2017-27=16
Total 44
Travelling show
people 2012-17=5
2017-27= 2
Total =7
Some sites have been delivered
which is a positive trend but this
is against an existing deficit.
Neutral
AMR
* The 2013 Travellers
Accommodation Assessment will be
updated in summer 2017 to cover
the Local Plan period to 2033 and to
take account of policy changes and
more recent evidence about family
formation rates
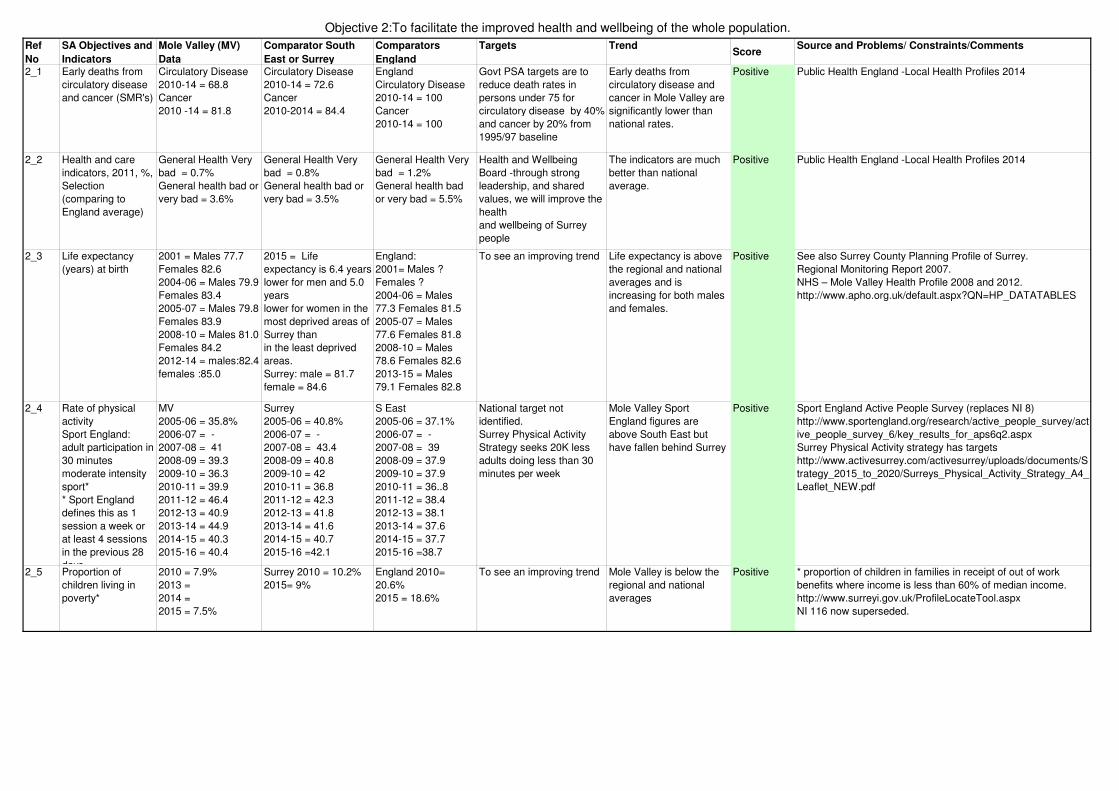
Objective 2:To facilitate the improved health and wellbeing of the whole population.
Ref
No
SA Objectives and
Indicators
Mole Valley (MV)
Data
Comparator South
East or Surrey
Comparators
England
Targets TrendScore
Source and Problems/ Constraints/Comments
2_1 Early deaths from
circulatory disease
and cancer (SMR's)
Circulatory Disease
2010-14 = 68.8
Cancer
2010 -14 = 81.8
Circulatory Disease
2010-14 = 72.6
Cancer
2010-2014 = 84.4
England
Circulatory Disease
2010-14 = 100
Cancer
2010-14 = 100
Govt PSA targets are to
reduce death rates in
persons under 75 for
circulatory disease by 40%
and cancer by 20% from
1995/97 baseline
Early deaths from
circulatory disease and
cancer in Mole Valley are
significantly lower than
national rates.
Positive Public Health England -Local Health Profiles 2014
2_2 Health and care
indicators, 2011, %,
Selection
(comparing to
England average)
General Health Very
bad = 0.7%
General health bad or
very bad = 3.6%
General Health Very
bad = 0.8%
General health bad or
very bad = 3.5%
General Health Very
bad = 1.2%
General health bad
or very bad = 5.5%
Health and Wellbeing
Board -through strong
leadership, and shared
values, we will improve the
health
and wellbeing of Surrey
people
The indicators are much
better than national
average.
Positive Public Health England -Local Health Profiles 2014
2_3 Life expectancy
(years) at birth
2001 = Males 77.7
Females 82.6
2004-06 = Males 79.9
Females 83.4
2005-07 = Males 79.8
Females 83.9
2008-10 = Males 81.0
Females 84.2
2012-14 = males:82.4
females :85.0
2015 = Life
expectancy is 6.4 years
lower for men and 5.0
years
lower for women in the
most deprived areas of
Surrey than
in the least deprived
areas.
Surrey: male = 81.7
female = 84.6
England:
2001= Males ?
Females ?
2004-06 = Males
77.3 Females 81.5
2005-07 = Males
77.6 Females 81.8
2008-10 = Males
78.6 Females 82.6
2013-15 = Males
79.1 Females 82.8
To see an improving trend Life expectancy is above
the regional and national
averages and is
increasing for both males
and females.
Positive See also Surrey County Planning Profile of Surrey.
Regional Monitoring Report 2007.
NHS – Mole Valley Health Profile 2008 and 2012.
http://www.apho.org.uk/default.aspx?QN=HP_DATATABLES
2_4 Rate of physical
activity
Sport England:
adult participation in
30 minutes
moderate intensity
sport*
* Sport England
defines this as 1
session a week or
at least 4 sessions
in the previous 28
days.
MV
2005-06 = 35.8%
2006-07 = -
2007-08 = 41
2008-09 = 39.3
2009-10 = 36.3
2010-11 = 39.9
2011-12 = 46.4
2012-13 = 40.9
2013-14 = 44.9
2014-15 = 40.3
2015-16 = 40.4
Surrey
2005-06 = 40.8%
2006-07 = -
2007-08 = 43.4
2008-09 = 40.8
2009-10 = 42
2010-11 = 36.8
2011-12 = 42.3
2012-13 = 41.8
2013-14 = 41.6
2014-15 = 40.7
2015-16 =42.1
S East
2005-06 = 37.1%
2006-07 = -
2007-08 = 39
2008-09 = 37.9
2009-10 = 37.9
2010-11 = 36..8
2011-12 = 38.4
2012-13 = 38.1
2013-14 = 37.6
2014-15 = 37.7
2015-16 =38.7
National target not
identified.
Surrey Physical Activity
Strategy seeks 20K less
adults doing less than 30
minutes per week
Mole Valley Sport
England figures are
above South East but
have fallen behind Surrey
Positive Sport England Active People Survey (replaces NI 8)
http://www.sportengland.org/research/active_people_survey/act
ive_people_survey_6/key_results_for_aps6q2.aspx
Surrey Physical Activity strategy has targets
http://www.activesurrey.com/activesurrey/uploads/documents/S
trategy_2015_to_2020/Surreys_Physical_Activity_Strategy_A4_
Leaflet_NEW.pdf
2_5 Proportion of
children living in
poverty*
2010 = 7.9%
2013 =
2014 =
2015 = 7.5%
Surrey 2010 = 10.2%
2015= 9%
England 2010=
20.6%
2015 = 18.6%
To see an improving trend Mole Valley is below the
regional and national
averages
Positive * proportion of children in families in receipt of out of work
benefits where income is less than 60% of median income.
http://www.surreyi.gov.uk/ProfileLocateTool.aspx
NI 116 now superseded.

Objective 2:To facilitate the improved health and wellbeing of the whole population.
Ref
No
SA Objectives and
Indicators
Mole Valley (MV)
Data
Comparator South
East or Surrey
Comparators
England
Targets TrendScore
Source and Problems/ Constraints/Comments
2_6 Percentage of
population of
working age who
are claiming key
benefits
2006* = 6.2%
2007 = 6.0
2008 = 6.0
2009 = 7.0
2010 = 7.5
2011= 7.1
2012 (Feb*) = 7.2
South East
2006 = 9.5
2007 = 9.4
2008 =9.1
2009 = 10.6
2010 = 10.9
2011 = 10.6
2011 = 10.6
2012 (Feb)* = 10.9
2012 Nov) =10.3
GB
2006 = 14
2007 = 9.13.74
2008 =13.3
2009 = 14.8
2010 = 15
2011 = 14.7
2012 (Feb) = 15
2012 (Nov) = 14.1
To see an improving trend Whilst MV figures are
rising they are only half
the national rate.
Neutral NOMIS: Total claimants data figures
*Data at Feb each year to reflect latest data was at Feb 2012 -
no longer available
2_7 Number of
claimants age 16+
who are income
deprived (Income
Support claimants).
2004 = 1,090
2006 = 1,010
2008 = 1,020
2010 = 930
2011 = 77.8
To see an improving trend A reducing number of
claimants. However
information is not up to
date. Refer to Housing
benefit claimants below
for comparison.
Positive Neighbourhood Statistics
* No certainty that the figures are comparing like with like.
2_8 Housing Benefit
claimants
2009 (Aug) = 3,220
2010 = 3,400
2011 = 3,470
2012 = 3,640
2013 = 3,694
2014 = 3,617
2015 = 3,595
2016 = 3,558
2017 = 3,443
To see an improving trend Increasing trend Negative http://83.244.183.193/hb_la/#view=hblaview8&selectedWafers=
0&selectedColumns=0,53
https://www.gov.uk/government/statistics/housing-benefit-
caseload-statistics
2_9 Average rank for
Indices of Multiple
Deprivation (IMD).
2004 = ranked 351
2007 = ranked 339
2010 = ranked 310
2015 = 305
MV 4th best in Surrey
local authority rankings
Epsom & Ewell: 313
Guildford: 304
Surrey county is in
20% least deprived in
England.
Districts in England are
ranked 1 to 354 with 1
being most deprived and
354 the least deprived.
Surreyi / JSNA paper
comments that MV’s
change in ranking is due
to improvements in other
local authority areas and
not due to an increase in
deprivation.
Neutral ONS: IMD Statistics & Surreyi
IMD 2007 and 2010 methodology is the same but 2004 may not
be directly comparable.
2_10 The number of
recorded offences
per 1000 people
2010/11
Violence against the
person = 11
Robbery = 0.3
Burglary = 4.9
Theft of a motor
vehicle = 1.8
Theft from a motor
vehicle = 4.0
2017 recorded
offences MV 4th in
Surrey. Surreys crime
rate is 24% less than
the England average
2010/11
Violence against the
person = 14.7
Robbery = 1.4
Burglary = 9.5
Theft of a motor
vehicle = 1.9
Theft from a motor
vehicle = 5.7
To see an improving trend Levels of crime are below
national rates
Positive 2010 MYE as base
http://www.neighbourhood.statistics.gov.uk/dissemination/Lead
KeyFigures.do?a=3&b=277121&c=RH4+1SJ&d=13&e=3&g=49
0747&i=1001x1003x1004&m=0&r=0&s=1264164483903&enc=
1
http://www.surreyi.gov.uk/Viewpage.aspx?C=basket&BasketID
=231

Objective 2:To facilitate the improved health and wellbeing of the whole population.
Ref
No
SA Objectives and
Indicators
Mole Valley (MV)
Data
Comparator South
East or Surrey
Comparators
England
Targets TrendScore
Source and Problems/ Constraints/Comments
2_11 The proportion of
people that live in
fear of crime
% very worried about
burglary = 9%
% high level of worry
about car crime = 11
% high level of worry
about violent crime =13
% high level of
perceived disorder =
15
% very worried about
burglary = 10%
% high level of worry
about car crime = 8
% high level of worry
about violent crime =
11
% high level of
perceived disorder =
13
To see an improving trend Levels similar to the
national perception.
Neutral https://www.ons.gov.uk/peoplepopulationandcommunity/crimea
ndjustice
2_12 Perception of fear
of a crime - % Very
big & fairly big
problem
Burglary = 10.5%
Drug Users = 10.7%
Physical Attacks =
3.5%
Speeding = 35.7%
Noisy neighbours =
3.3%
Drunk/rowdy people =
4.7%
Vandalism = 8.8%
Vehicle crime = 5.9%
Burglary = 18.2%
Drug Users = 13.4%
Physical Attacks =
5.2%
Speeding = 38.6%
Noisy neighbours =
6.3%
Drunk/rowdy people =
7.9%
Vandalism = 14.1%
Vehicle crime = 12.9%
To see an improving trend Levels of fear of crime are
lower than Surrey.
Speeding is the biggest
concern.
Positive https://www.ons.gov.uk/peoplepopulationandcommunity/crimea
ndjustice
2_13 Access to open
space, sport and
recreation (and
natural
greenspace).
2007 = 2,718 ha of
natural and semi
natural greenspace =
34ha per 1,000
population
2007 = Elmbridge =
10ha per 1,000
Epsom and Ewell =
11ha per 1,000
The PPG17 assessment
does not set a standard /
target for access to natural
/ semi natural greenspace.
The Natural England
ANGSt standards are at
para 5.19 of the PPG17
assessment. And the
access to these re shown
on maps in the document
Using population
forecasts at 2007 then
there will still be 32ha per
1,000 population in 2026
Positive Mole Valley Open Space, Sport and Recreation Study 2007
(PPG17 Assessment)
2_14 Children classified
as obese in year 6
2014/15 = 11.4%
2013/14 = 11.4%
2012/13 = 10.6%
2011/12 = 10.9%
2010/11 = 11.7%
2014/15 = 13.2%
2013/14 = 13.4%
2012/13 = 12.8%
2011/12 = 14.4%
2010/11 = 13.8%
2014/15 19.1% To see an improving trend More obesity but better
than the Surrey % and
almost 10% better than
national average.
Negative http://www.surreyi.gov.uk/Viewdata.aspx?P=Data&referer=%2f
BuildDataView.aspx%3fDataSetID%3d1043%26VariableID%3d
0
2_15 Adults who smoke 2011 = 13.5%
2012 = 12%
2013 = 13.9%
2014 = 14.4
2011 = 15.7%
2012 = 14.7%
2013 = 14.8%
2014 = 14.5%
2011 = 20.2%
2012 = 19.5%
2013 = 18.5%
2014 = 18.0%
Lowering % rate Trend is rising but still
remains lower than
Surrey or England
Neutral http://www.surreyi.gov.uk/Viewdata.aspx?P=Data&referer=%2f
Viewpage.aspx%3fC%3dbasket%26BasketID%3d340
2_16 Number of Patients
per GP
2014 = NHS Surrey
Downs 1501
2014 East Surrey =
1414
Horsham and Mid
Sussex 1721
England 1724
average
No recommended number The ratios for the MVDC
CCG are on the lower
side nationally and better
than adjoining areas.
Positive GP workforce census 2014
http://content.digital.nhs.uk
2_17 Adult alcohol
admissions per
100k popn.
2010/11 = 1378
2011/12 = 1403
Surrey
2010/11 = 1460
2011/12 = 1532
2010/11 = 1895
2011/12 = 1974
Should fall MV lower than Surrey or
England
Positive http://www.surreyi.gov.uk/Viewdata.aspx?P=Data&referer=%2f
Viewpage.aspx%3fC%3dbasket%26BasketID%3d340
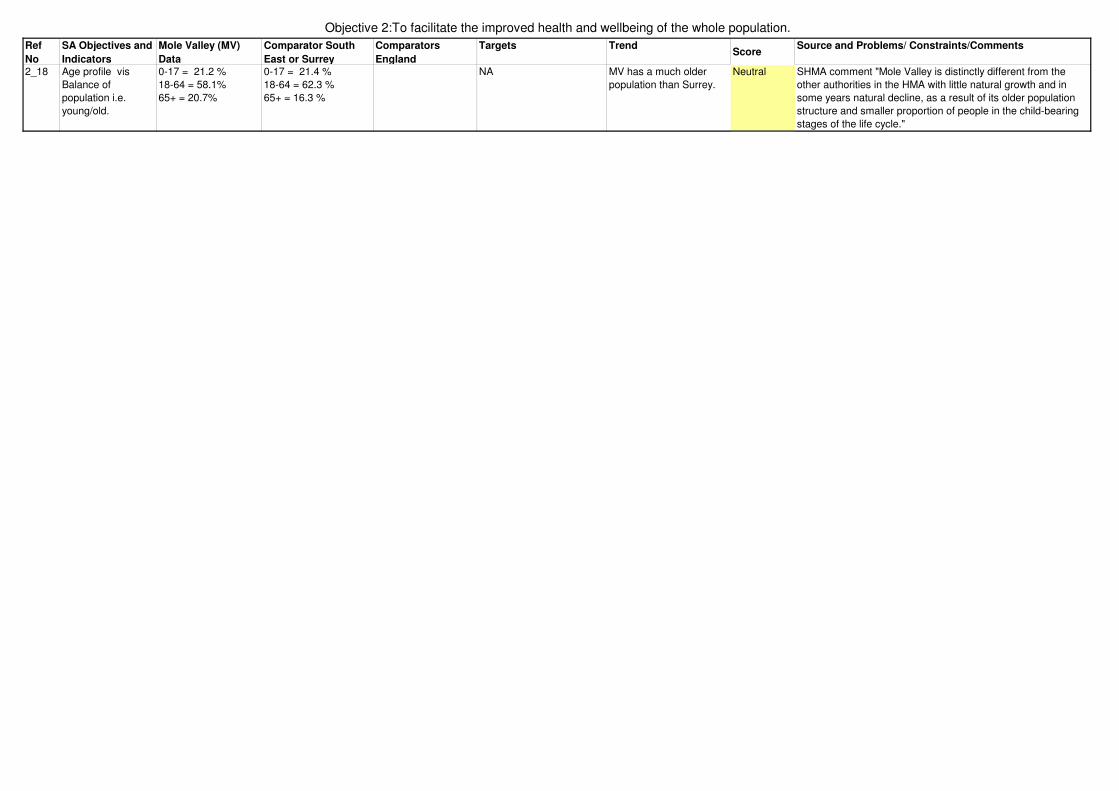
Objective 2:To facilitate the improved health and wellbeing of the whole population.
Ref
No
SA Objectives and
Indicators
Mole Valley (MV)
Data
Comparator South
East or Surrey
Comparators
England
Targets TrendScore
Source and Problems/ Constraints/Comments
2_18 Age profile vis
Balance of
population i.e.
young/old.
0-17 = 21.2 %
18-64 = 58.1%
65+ = 20.7%
0-17 = 21.4 %
18-64 = 62.3 %
65+ = 16.3 %
NA MV has a much older
population than Surrey.
Neutral SHMA comment "Mole Valley is distinctly different from the
other authorities in the HMA with little natural growth and in
some years natural decline, as a result of its older population
structure and smaller proportion of people in the child-bearing
stages of the life cycle."

Objective 3: To conserve and enhance, archaeological, historic and cultural assets and their settings.
Ref No. SA Objectives and Indicators Mole Valley (MV) Data Comparators Targets Trend ScoreSource and Problems/
Constraints/Comments
3_1
Number of listed buildings Listed Buildings:
2004 = 992
2006 = 1,003
2009 = 1,007
2012 = 1,010
2012 Grade 1= 6, Grade
2* = 45, Grade 2 = 959
2015 = 1,011
2016=1,011 Grade 1 = 6,
Grade 2* = 50, Grade 2
=955
Not to see a
reduction in
these
numbers
There are more listed
buildings now than at
any other time in the
past.
Positive
See AMR
3_2
Number of ancient monuments Ancient monuments date ?
27
2016 = 27
Not to see a
reduction in
these
numbers
No change
Neutral
See AMR
3_3
Number of conservation areas Conservation areas date =
26 wholly or partly within
the district (3 Ashtead CA
officially counted as one)
Not to see a
reduction in
these
numbers
Leatherhead and
Dorking Conservation
Areas have been
extended since 2009.
Increases total district
extents from 398.4ha to
approx. 415.6 ha.
Neutral
See AMR
3_4
Proportion of statutory listed
buildings at risk
2004 = 1 (Brockham Lime
Works)
2007 = 2
2012 = 2 (Ruins of
Betchworth Castle and
Brockham Lime Works)
2016 = 3 see list in
baseline folder (actually 9?
as also includes 5 sc.
Monuments and one
Historic Park should these
also be counted?)
Mole Valley = 0.2%
UK = 3.1%To see this
figure
reduced
One more building than
recent years.
Neutral
Buildings at Risk Register (EHBRR):
http://www.english-
heritage.org.uk/caring/heritage-at-
risk/
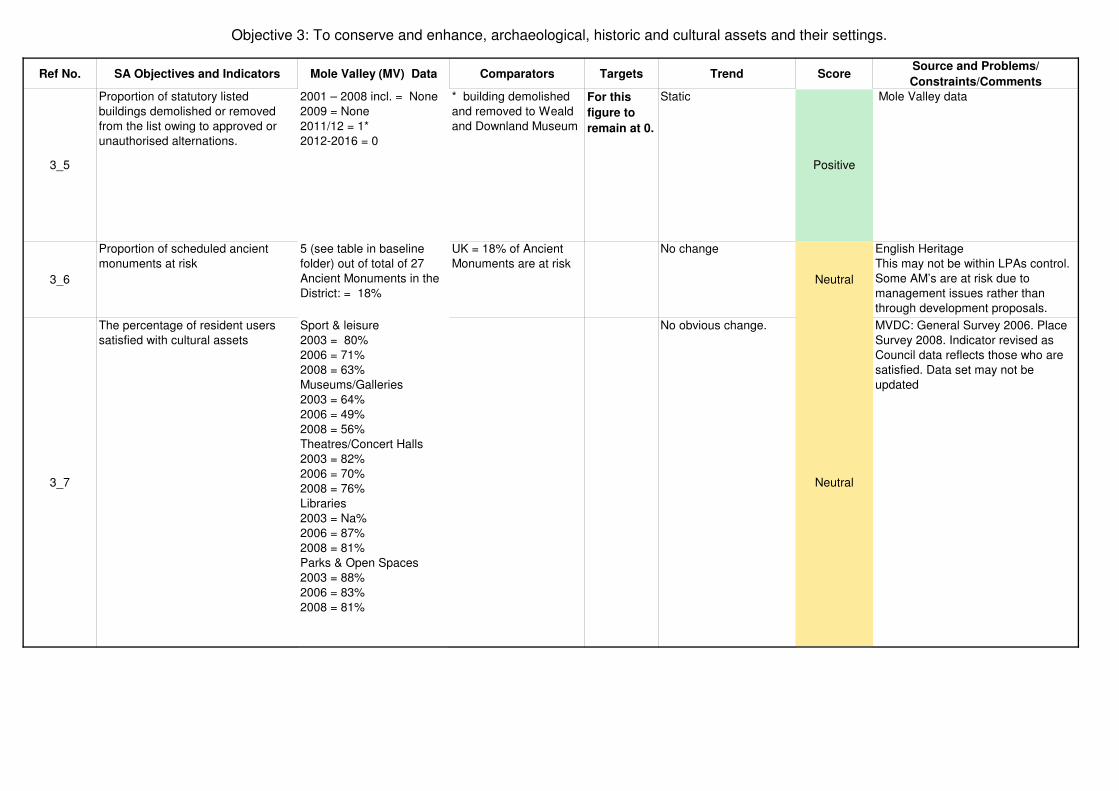
Objective 3: To conserve and enhance, archaeological, historic and cultural assets and their settings.
Ref No. SA Objectives and Indicators Mole Valley (MV) Data Comparators Targets Trend ScoreSource and Problems/
Constraints/Comments
3_5
Proportion of statutory listed
buildings demolished or removed
from the list owing to approved or
unauthorised alternations.
2001 – 2008 incl. = None
2009 = None
2011/12 = 1*
2012-2016 = 0
* building demolished
and removed to Weald
and Downland Museum
For this
figure to
remain at 0.
Static
Positive
Mole Valley data
3_6
Proportion of scheduled ancient
monuments at risk
5 (see table in baseline
folder) out of total of 27
Ancient Monuments in the
District: = 18%
UK = 18% of Ancient
Monuments are at risk
No change
Neutral
English Heritage
This may not be within LPAs control.
Some AM’s are at risk due to
management issues rather than
through development proposals.
3_7
The percentage of resident users
satisfied with cultural assets
Sport & leisure
2003 = 80%
2006 = 71%
2008 = 63%
Museums/Galleries
2003 = 64%
2006 = 49%
2008 = 56%
Theatres/Concert Halls
2003 = 82%
2006 = 70%
2008 = 76%
Libraries
2003 = Na%
2006 = 87%
2008 = 81%
Parks & Open Spaces
2003 = 88%
2006 = 83%
2008 = 81%
No obvious change.
Neutral
MVDC: General Survey 2006. Place
Survey 2008. Indicator revised as
Council data reflects those who are
satisfied. Data set may not be
updated

Objective 4: To reduce the need to travel, encourage sustainable transport options and improve accessibility to all services and facilities.
Ref No. SA Objectives and Indicators Mole Valley (MV)
Data
Comparators
South East/
Surrey
Comparators
England
Targets Trend
Score
Source and Problems/
Constraints/Comments
4_1 Proportion of development
located in accessible areas* –
Housing sites of 5+ dwellings.
2006-07 = 91%
2007-08 = 95%
2008-09 = 100%
2009 -10 = 72%
2010-11= 68%
2011-12 = 96%
2012-13 = 91%
2013-14 = 83%
2014-15 = 96%
To assess
trends
Generally
stable, with
some
fluctuations in
individual yearsNeutral
AMR's Annex 5 - Average accessibility to all
services within 30 min by public transport.
Core Strategy Policy CS18.
Indicator doesn’t state the actual amount of
development and therefore only gives a partial
picture.
4_2 Percentage of users within
15min walk of a primary school
77% Surrey: 80%
MV ranks 6th out
of 8, when
compared with
other East
Surrey/neighbourin
g Districts &
Boroughs.
N/A N/A No trend data.
Slightly below
Surrey figure
but comparable
to neighbouring
authorities
(RBBC,
Waverley and
Tandridge)
Neutral
DfT Journey Time Statistics December 2015
4_3 Percentage of users within
15min cycle of a primary school
88% Surrey: 96%
MV ranks 8th out
of 8 (i.e. lowest),
when compared
with other East
Surrey/neighbourin
g Districts &
Boroughs.
N/A N/A No trend data.
Below Surrey
figure. NB: MV
has the lowest
percentage of
all neighbouring
authorities.
Negative
DfT Journey Time Statistics December 2015
4_4 Percentage of users within
15min walk of a secondary
school
20% Surrey: 29%
MV ranks 6th out
of 8, when
compared with
other East
Surrey/neighbourin
g Districts &
Boroughs.
N/A N/A No trend data.
Below Surrey
figure.
Comparable to
Elmbridge and
Tandridge.
Neutral
DfT Journey Time Statistics December 2015
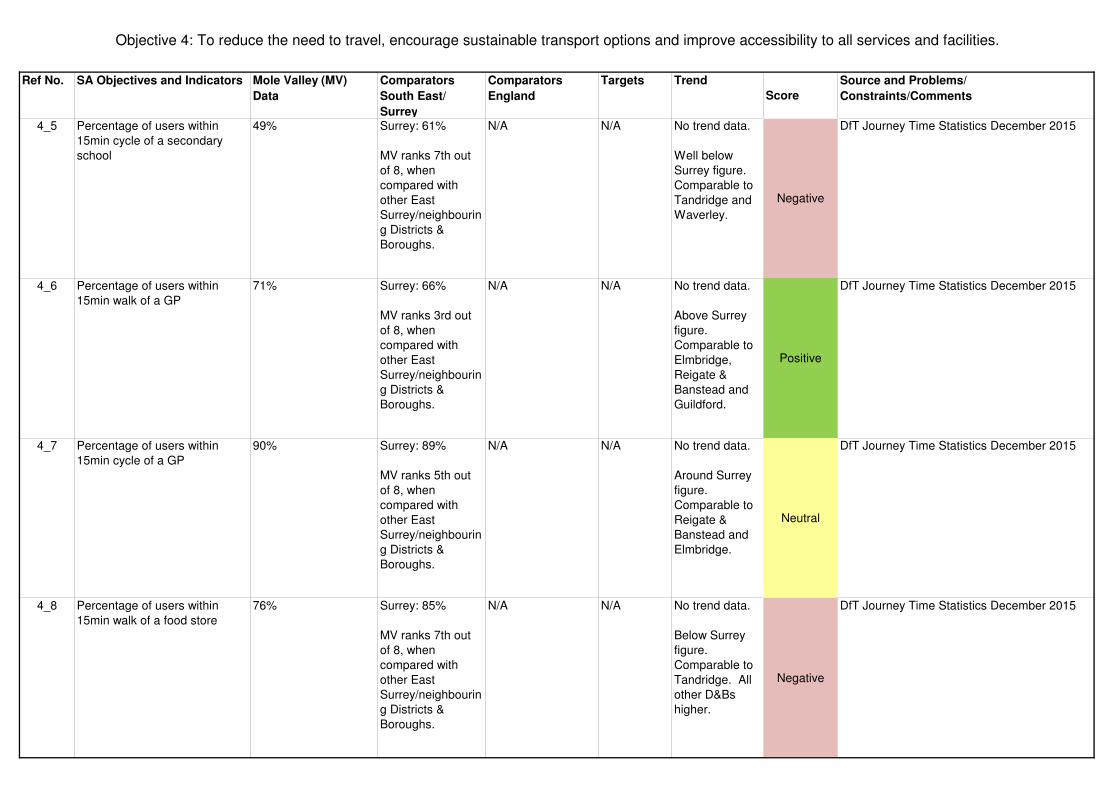
Objective 4: To reduce the need to travel, encourage sustainable transport options and improve accessibility to all services and facilities.
Ref No. SA Objectives and Indicators Mole Valley (MV)
Data
Comparators
South East/
Surrey
Comparators
England
Targets Trend
Score
Source and Problems/
Constraints/Comments
4_5 Percentage of users within
15min cycle of a secondary
school
49% Surrey: 61%
MV ranks 7th out
of 8, when
compared with
other East
Surrey/neighbourin
g Districts &
Boroughs.
N/A N/A No trend data.
Well below
Surrey figure.
Comparable to
Tandridge and
Waverley.
Negative
DfT Journey Time Statistics December 2015
4_6 Percentage of users within
15min walk of a GP
71% Surrey: 66%
MV ranks 3rd out
of 8, when
compared with
other East
Surrey/neighbourin
g Districts &
Boroughs.
N/A N/A No trend data.
Above Surrey
figure.
Comparable to
Elmbridge,
Reigate &
Banstead and
Guildford.
Positive
DfT Journey Time Statistics December 2015
4_7 Percentage of users within
15min cycle of a GP
90% Surrey: 89%
MV ranks 5th out
of 8, when
compared with
other East
Surrey/neighbourin
g Districts &
Boroughs.
N/A N/A No trend data.
Around Surrey
figure.
Comparable to
Reigate &
Banstead and
Elmbridge.
Neutral
DfT Journey Time Statistics December 2015
4_8 Percentage of users within
15min walk of a food store
76% Surrey: 85%
MV ranks 7th out
of 8, when
compared with
other East
Surrey/neighbourin
g Districts &
Boroughs.
N/A N/A No trend data.
Below Surrey
figure.
Comparable to
Tandridge. All
other D&Bs
higher.
Negative
DfT Journey Time Statistics December 2015

Objective 4: To reduce the need to travel, encourage sustainable transport options and improve accessibility to all services and facilities.
Ref No. SA Objectives and Indicators Mole Valley (MV)
Data
Comparators
South East/
Surrey
Comparators
England
Targets Trend
Score
Source and Problems/
Constraints/Comments
4_9 Percentage of users within
15min cycle of a food store
87% Surrey: 94%
MV ranks 7th out
of 8, when
compared with
other East
Surrey/neighbourin
g Districts &
Boroughs.
N/A N/A No trend data.
Below Surrey
figure.
Comparable to
Guildford. Negative
DfT Journey Time Statistics December 2015
4_10 Percentage of residents
travelling to work by car or van
2001: 47.7%
2011*: 58.2%
2011 figures are
adjusted for
compatibility with the
2001 treatment of
those who work from
home
Source: NOMIS
2001: 46%
2011*: 59%
2001: 38.6%
2011*: 58.8%
NA Percentage
travelling to
work by car or
van appears to
have increased
substantially
between 2001
and 2011.
However, MV
and Surrey
figures are now
closer to the
England
average than
was the case in
2001
Negative
Change in calculation method between 2001
and 2011 (with regard to those working from
home but using a car/van to visit clients.
Compatible tables have been used, but gaps
between 2001 and 2011 seem high, which
might indicate discrepancy in methodology?
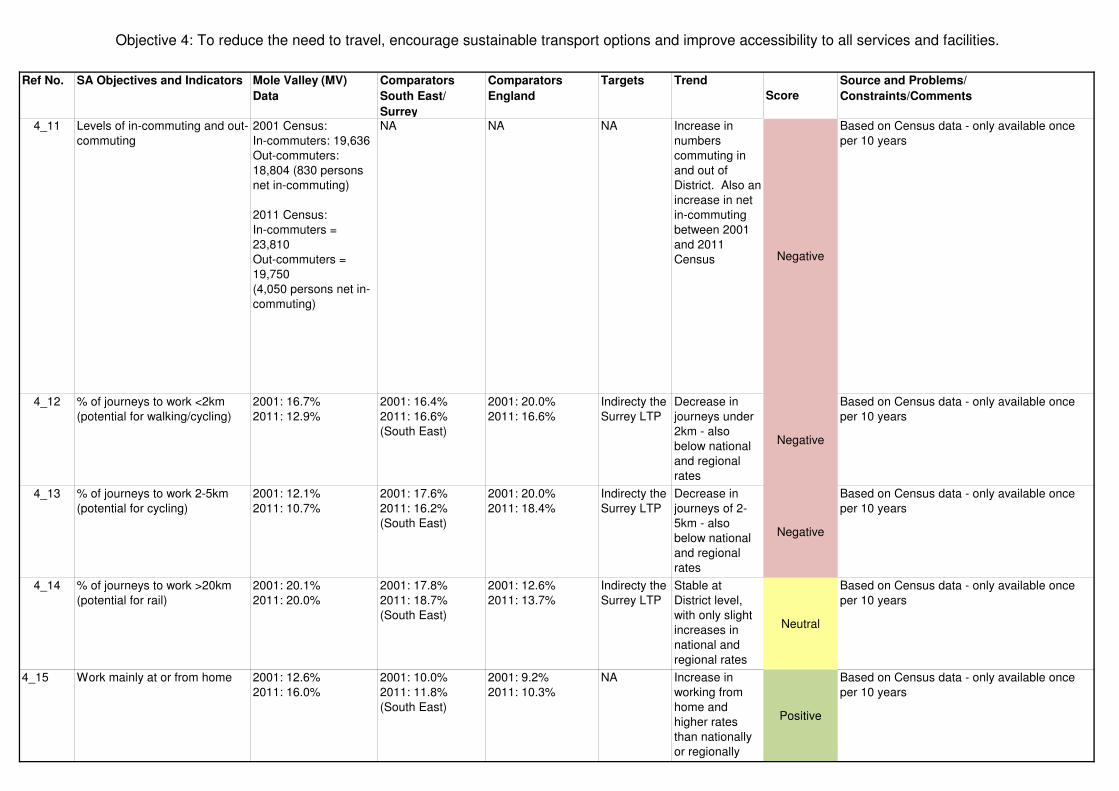
Objective 4: To reduce the need to travel, encourage sustainable transport options and improve accessibility to all services and facilities.
Ref No. SA Objectives and Indicators Mole Valley (MV)
Data
Comparators
South East/
Surrey
Comparators
England
Targets Trend
Score
Source and Problems/
Constraints/Comments
4_11 Levels of in-commuting and out-
commuting
2001 Census:
In-commuters: 19,636
Out-commuters:
18,804 (830 persons
net in-commuting)
2011 Census:
In-commuters =
23,810
Out-commuters =
19,750
(4,050 persons net in-
commuting)
NA NA NA Increase in
numbers
commuting in
and out of
District. Also an
increase in net
in-commuting
between 2001
and 2011
Census Negative
Based on Census data - only available once
per 10 years
4_12 % of journeys to work <2km
(potential for walking/cycling)
2001: 16.7%
2011: 12.9%
2001: 16.4%
2011: 16.6%
(South East)
2001: 20.0%
2011: 16.6%
Indirecty the
Surrey LTP
Decrease in
journeys under
2km - also
below national
and regional
rates
Negative
Based on Census data - only available once
per 10 years
4_13 % of journeys to work 2-5km
(potential for cycling)
2001: 12.1%
2011: 10.7%
2001: 17.6%
2011: 16.2%
(South East)
2001: 20.0%
2011: 18.4%
Indirecty the
Surrey LTP
Decrease in
journeys of 2-
5km - also
below national
and regional
rates
Negative
Based on Census data - only available once
per 10 years
4_14 % of journeys to work >20km
(potential for rail)
2001: 20.1%
2011: 20.0%
2001: 17.8%
2011: 18.7%
(South East)
2001: 12.6%
2011: 13.7%
Indirecty the
Surrey LTP
Stable at
District level,
with only slight
increases in
national and
regional rates
Neutral
Based on Census data - only available once
per 10 years
4_15 Work mainly at or from home 2001: 12.6%
2011: 16.0%
2001: 10.0%
2011: 11.8%
(South East)
2001: 9.2%
2011: 10.3%
NA Increase in
working from
home and
higher rates
than nationally
or regionally
Positive
Based on Census data - only available once
per 10 years

Objective 4: To reduce the need to travel, encourage sustainable transport options and improve accessibility to all services and facilities.
Ref No. SA Objectives and Indicators Mole Valley (MV)
Data
Comparators
South East/
Surrey
Comparators
England
Targets Trend
Score
Source and Problems/
Constraints/Comments
4_16 Percentage of all respondents
satisfied with the local bus
service
N/A 2011 Bus
Satisfaction
Survey: 47% Very
Satisfied plus 41%
Fairly Satisfied =
88%
2013 and 2014
Bus Satisfaction
Surveys only
covered one
Surrey bus
operator (Abellio)
at 86% overall
satisfaction.
2014 Bus
Satisfaction Survey:
Range 83% to 93%
across all areas.
No change
compared with
2013.
Indirecty the
Surrey LTP
Insufficient
trend data, but
Surrey
satisfaction
levels were at
mid-point of
range of
satisfaction
levels nationally
in 2014.
Neutral
4_17 Bus reliability SCC bus reliability
surveys; local on-site
survey of percentage
of services running to
schedule:
Leatherhead (North
Street):
2014-15: 37%
2015/16: 50%
Dorking (White
Horse):
2014/15: 62%
2015/16: 57%
Surrey:
2007/08: 78%
2008/09: 77%
2009/10: 80%
2010/11: 76%
2011/12: no data
2012/13: 78%
2013/14: 83%
2014/15: 75%
2015/16 = 77%
England (non-
metropolitan)
2007/08: 79%
2008/09: 80%
2009/10: 81%
2010/11: 76%
2011/12: 83%
2012/13: 84%
2013/14: 84%
2014/15: 83%
95% of
services
running to
schedule
No obvious
trend nationally
or county-wide.
But indications
that local
reliability is
significantly
below county or
national
averages.
Neutral

Objective 4: To reduce the need to travel, encourage sustainable transport options and improve accessibility to all services and facilities.
Ref No. SA Objectives and Indicators Mole Valley (MV)
Data
Comparators
South East/
Surrey
Comparators
England
Targets Trend
Score
Source and Problems/
Constraints/Comments
4_18 Local bus services (passenger
journeys per year)
N/A 2003/04 = 25.8
million
2006/07 = 26.2
million
2007/08 = 27.2
million
2009/10 = 27.9
million
2010/11 = 29.0
million
2011/12 = 28.8
million
2012/13 = 27.4
million
2013/14 = 27.1
million
2014/15 = 27.7
million
2015/16 = 27.9
million
England: non-
Metropolitan areas:
Rising trend from
2004-2008 but
relatively stable
from 2008 to 2015.
Source: DfT data:
https://www.gov.uk/
government/publicat
ions/bus-passenger-
journeys
Surrey
target:
Maintain bus
patronage at
2009/2010
level of
29.88 million
passenger
journeys
Source:
Surrey Local
Transport
Plan
Passenger
Transport
Strategy:
Local Buses
(2014)
Neutral
DfT data and Surrey Local Transport Plan
Passenger Transport Strategy: Local Buses
(2014)
4_19 Local bus services (passenger
journeys per head of
population)
N/A 2009/10: 25.0
2010/11: 25.8
2011/12: 25.4
2012/13: 24.0
2013/14: 23.6
2014/15: 23.8
2015/16: 23.0
2009/10: 88.8
2010/11: 88.2
2011/12: 87.8
2012/13: 85.8
2013/14: 86.7
2014/15: 85.6
2015/16: 82.7
Slight
downward trend
at county level
(but less
pronounced
than at national
level).
Negative
DfT data.
England figures include London and
Metropolitan areas, which is likely to explain
much higher level of journeys per head.
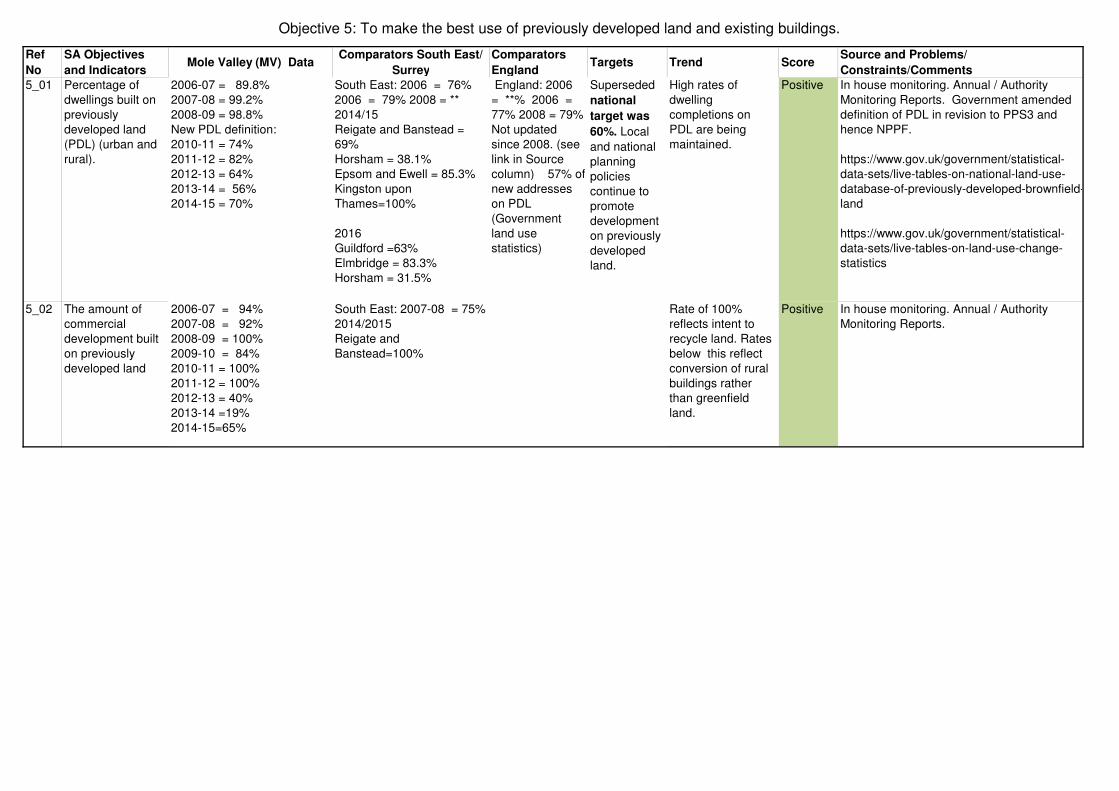
Objective 5: To make the best use of previously developed land and existing buildings.
Ref
No
SA Objectives
and IndicatorsMole Valley (MV) Data
Comparators South East/
Surrey
Comparators
EnglandTargets Trend Score
Source and Problems/
Constraints/Comments
5_01 Percentage of
dwellings built on
previously
developed land
(PDL) (urban and
rural).
2006-07 = 89.8%
2007-08 = 99.2%
2008-09 = 98.8%
New PDL definition:
2010-11 = 74%
2011-12 = 82%
2012-13 = 64%
2013-14 = 56%
2014-15 = 70%
South East: 2006 = 76%
2006 = 79% 2008 = **
2014/15
Reigate and Banstead =
69%
Horsham = 38.1%
Epsom and Ewell = 85.3%
Kingston upon
Thames=100%
2016
Guildford =63%
Elmbridge = 83.3%
Horsham = 31.5%
England: 2006
= **% 2006 =
77% 2008 = 79%
Not updated
since 2008. (see
link in Source
column) 57% of
new addresses
on PDL
(Government
land use
statistics)
Superseded
national
target was
60%. Local
and national
planning
policies
continue to
promote
development
on previously
developed
land.
High rates of
dwelling
completions on
PDL are being
maintained.
Positive In house monitoring. Annual / Authority
Monitoring Reports. Government amended
definition of PDL in revision to PPS3 and
hence NPPF.
https://www.gov.uk/government/statistical-
data-sets/live-tables-on-national-land-use-
database-of-previously-developed-brownfield-
land
https://www.gov.uk/government/statistical-
data-sets/live-tables-on-land-use-change-
statistics
5_02 The amount of
commercial
development built
on previously
developed land
2006-07 = 94%
2007-08 = 92%
2008-09 = 100%
2009-10 = 84%
2010-11 = 100%
2011-12 = 100%
2012-13 = 40%
2013-14 =19%
2014-15=65%
South East: 2007-08 = 75%
2014/2015
Reigate and
Banstead=100%
Rate of 100%
reflects intent to
recycle land. Rates
below this reflect
conversion of rural
buildings rather
than greenfield
land.
Positive In house monitoring. Annual / Authority
Monitoring Reports.
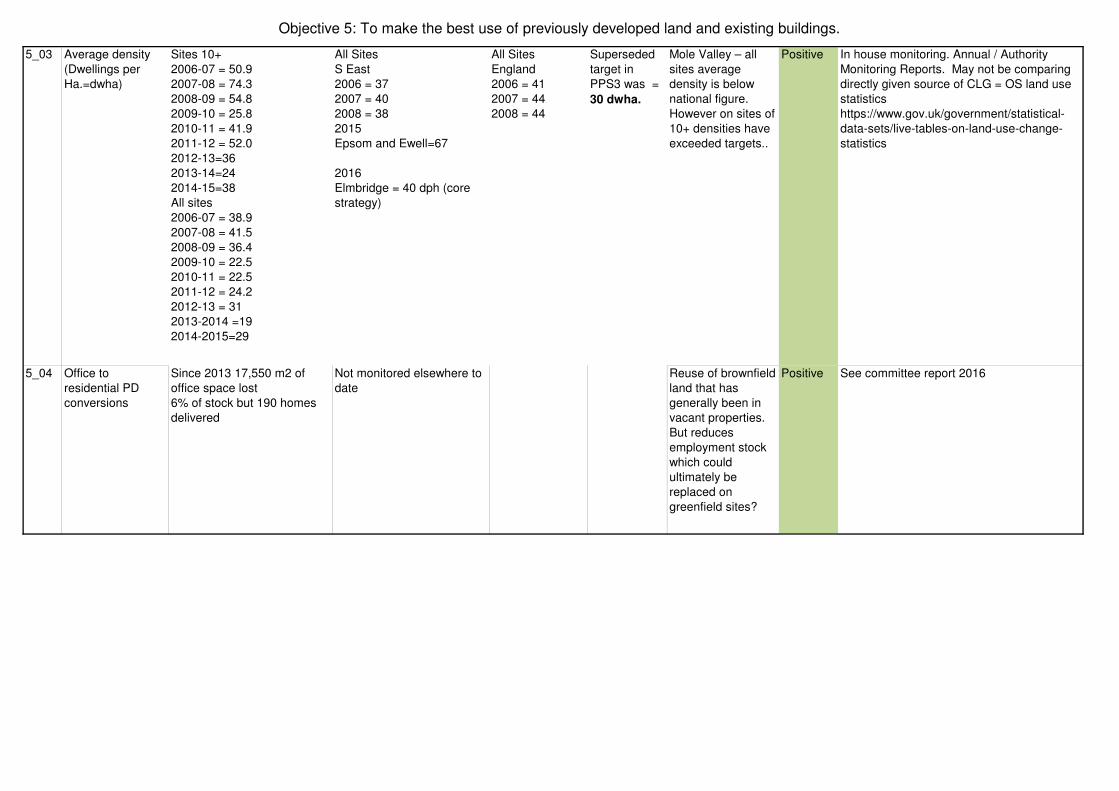
Objective 5: To make the best use of previously developed land and existing buildings.
5_03 Average density
(Dwellings per
Ha.=dwha)
Sites 10+
2006-07 = 50.9
2007-08 = 74.3
2008-09 = 54.8
2009-10 = 25.8
2010-11 = 41.9
2011-12 = 52.0
2012-13=36
2013-14=24
2014-15=38
All sites
2006-07 = 38.9
2007-08 = 41.5
2008-09 = 36.4
2009-10 = 22.5
2010-11 = 22.5
2011-12 = 24.2
2012-13 = 31
2013-2014 =19
2014-2015=29
All Sites
S East
2006 = 37
2007 = 40
2008 = 38
2015
Epsom and Ewell=67
2016
Elmbridge = 40 dph (core
strategy)
All Sites
England
2006 = 41
2007 = 44
2008 = 44
Superseded
target in
PPS3 was =
30 dwha.
Mole Valley – all
sites average
density is below
national figure.
However on sites of
10+ densities have
exceeded targets..
Positive In house monitoring. Annual / Authority
Monitoring Reports. May not be comparing
directly given source of CLG = OS land use
statistics
https://www.gov.uk/government/statistical-
data-sets/live-tables-on-land-use-change-
statistics
5_04 Office to
residential PD
conversions
Since 2013 17,550 m2 of
office space lost
6% of stock but 190 homes
delivered
Not monitored elsewhere to
date
Reuse of brownfield
land that has
generally been in
vacant properties.
But reduces
employment stock
which could
ultimately be
replaced on
greenfield sites?
Positive See committee report 2016
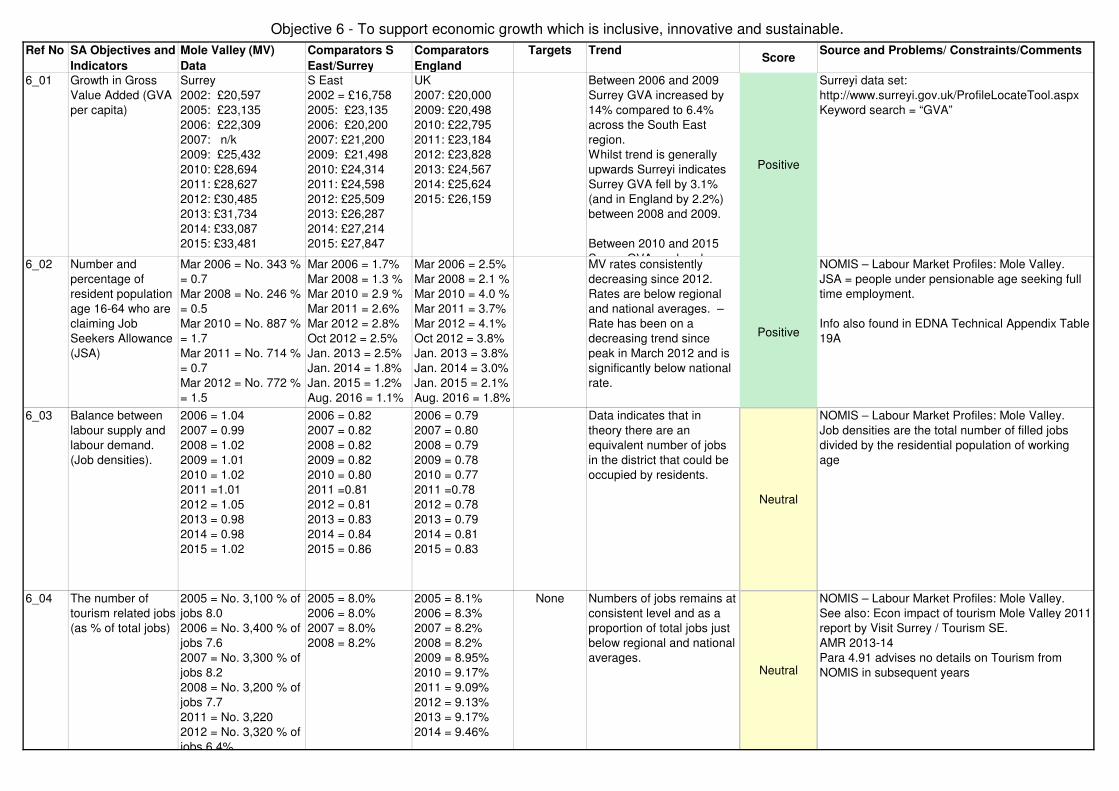
Objective 6 - To support economic growth which is inclusive, innovative and sustainable.
Ref No SA Objectives and
Indicators
Mole Valley (MV)
Data
Comparators S
East/Surrey
Comparators
England
Targets TrendScore
Source and Problems/ Constraints/Comments
6_01 Growth in Gross
Value Added (GVA
per capita)
Surrey
2002: £20,597
2005: £23,135
2006: £22,309
2007: n/k
2009: £25,432
2010: £28,694
2011: £28,627
2012: £30,485
2013: £31,734
2014: £33,087
2015: £33,481
S East
2002 = £16,758
2005: £23,135
2006: £20,200
2007: £21,200
2009: £21,498
2010: £24,314
2011: £24,598
2012: £25,509
2013: £26,287
2014: £27,214
2015: £27,847
UK
2007: £20,000
2009: £20,498
2010: £22,795
2011: £23,184
2012: £23,828
2013: £24,567
2014: £25,624
2015: £26,159
Between 2006 and 2009
Surrey GVA increased by
14% compared to 6.4%
across the South East
region.
Whilst trend is generally
upwards Surreyi indicates
Surrey GVA fell by 3.1%
(and in England by 2.2%)
between 2008 and 2009.
Between 2010 and 2015
Surrey GVA per head
Positive
Surreyi data set:
http://www.surreyi.gov.uk/ProfileLocateTool.aspx
Keyword search = “GVA”
6_02 Number and
percentage of
resident population
age 16-64 who are
claiming Job
Seekers Allowance
(JSA)
Mar 2006 = No. 343 %
= 0.7
Mar 2008 = No. 246 %
= 0.5
Mar 2010 = No. 887 %
= 1.7
Mar 2011 = No. 714 %
= 0.7
Mar 2012 = No. 772 %
= 1.5
Oct 2012 = No. 689 %
Mar 2006 = 1.7%
Mar 2008 = 1.3 %
Mar 2010 = 2.9 %
Mar 2011 = 2.6%
Mar 2012 = 2.8%
Oct 2012 = 2.5%
Jan. 2013 = 2.5%
Jan. 2014 = 1.8%
Jan. 2015 = 1.2%
Aug. 2016 = 1.1%
Mar 2006 = 2.5%
Mar 2008 = 2.1 %
Mar 2010 = 4.0 %
Mar 2011 = 3.7%
Mar 2012 = 4.1%
Oct 2012 = 3.8%
Jan. 2013 = 3.8%
Jan. 2014 = 3.0%
Jan. 2015 = 2.1%
Aug. 2016 = 1.8%
MV rates consistently
decreasing since 2012.
Rates are below regional
and national averages. –
Rate has been on a
decreasing trend since
peak in March 2012 and is
significantly below national
rate.
Positive
NOMIS – Labour Market Profiles: Mole Valley.
JSA = people under pensionable age seeking full
time employment.
Info also found in EDNA Technical Appendix Table
19A
6_03 Balance between
labour supply and
labour demand.
(Job densities).
2006 = 1.04
2007 = 0.99
2008 = 1.02
2009 = 1.01
2010 = 1.02
2011 =1.01
2012 = 1.05
2013 = 0.98
2014 = 0.98
2015 = 1.02
2006 = 0.82
2007 = 0.82
2008 = 0.82
2009 = 0.82
2010 = 0.80
2011 =0.81
2012 = 0.81
2013 = 0.83
2014 = 0.84
2015 = 0.86
2006 = 0.79
2007 = 0.80
2008 = 0.79
2009 = 0.78
2010 = 0.77
2011 =0.78
2012 = 0.78
2013 = 0.79
2014 = 0.81
2015 = 0.83
Data indicates that in
theory there are an
equivalent number of jobs
in the district that could be
occupied by residents.
Neutral
NOMIS – Labour Market Profiles: Mole Valley.
Job densities are the total number of filled jobs
divided by the residential population of working
age
6_04 The number of
tourism related jobs
(as % of total jobs)
2005 = No. 3,100 % of
jobs 8.0
2006 = No. 3,400 % of
jobs 7.6
2007 = No. 3,300 % of
jobs 8.2
2008 = No. 3,200 % of
jobs 7.7
2011 = No. 3,220
2012 = No. 3,320 % of
jobs 6.4%
2005 = 8.0%
2006 = 8.0%
2007 = 8.0%
2008 = 8.2%
2005 = 8.1%
2006 = 8.3%
2007 = 8.2%
2008 = 8.2%
2009 = 8.95%
2010 = 9.17%
2011 = 9.09%
2012 = 9.13%
2013 = 9.17%
2014 = 9.46%
None Numbers of jobs remains at
consistent level and as a
proportion of total jobs just
below regional and national
averages.Neutral
NOMIS – Labour Market Profiles: Mole Valley.
See also: Econ impact of tourism Mole Valley 2011
report by Visit Surrey / Tourism SE.
AMR 2013-14
Para 4.91 advises no details on Tourism from
NOMIS in subsequent years
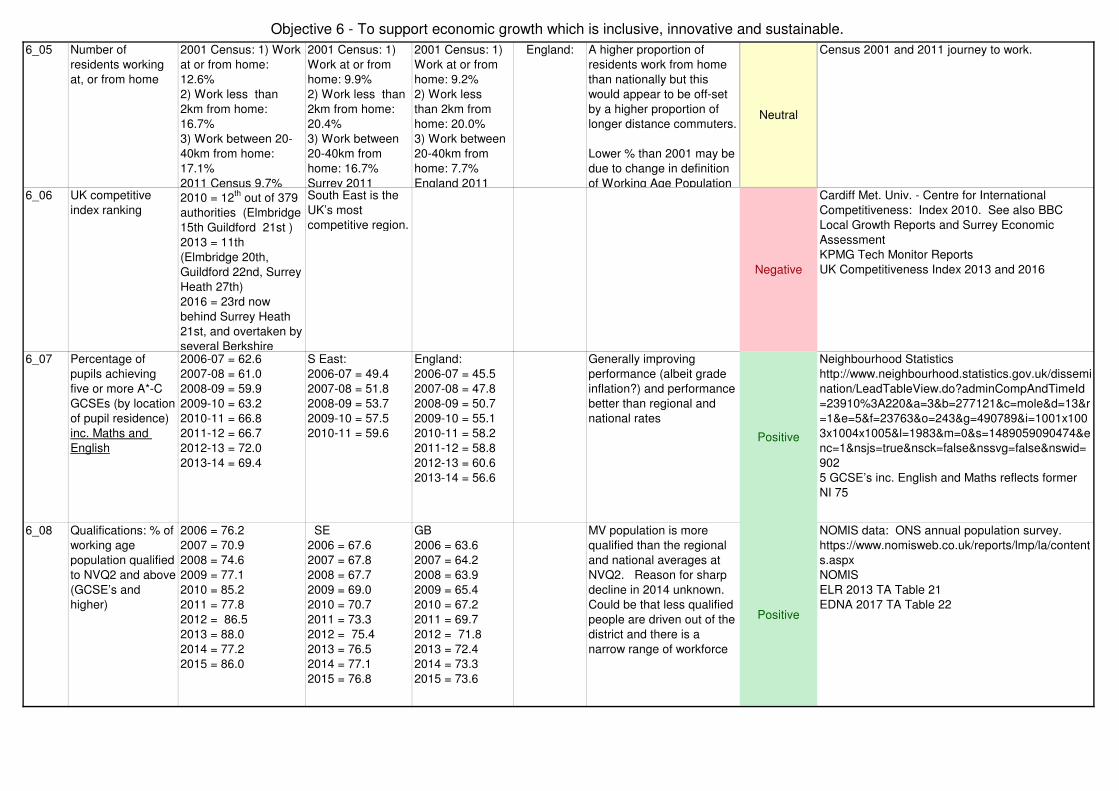
Objective 6 - To support economic growth which is inclusive, innovative and sustainable.
6_05 Number of
residents working
at, or from home
2001 Census: 1) Work
at or from home:
12.6%
2) Work less than
2km from home:
16.7%
3) Work between 20-
40km from home:
17.1%
2011 Census 9.7%
2001 Census: 1)
Work at or from
home: 9.9%
2) Work less than
2km from home:
20.4%
3) Work between
20-40km from
home: 16.7%
Surrey 2011
2001 Census: 1)
Work at or from
home: 9.2%
2) Work less
than 2km from
home: 20.0%
3) Work between
20-40km from
home: 7.7%
England 2011
England: A higher proportion of
residents work from home
than nationally but this
would appear to be off-set
by a higher proportion of
longer distance commuters.
Lower % than 2001 may be
due to change in definition
of Working Age Population
Neutral
Census 2001 and 2011 journey to work.
6_06 UK competitive
index ranking 2010 = 12
th out of 379
authorities (Elmbridge
15th Guildford 21st )
2013 = 11th
(Elmbridge 20th,
Guildford 22nd, Surrey
Heath 27th)
2016 = 23rd now
behind Surrey Heath
21st, and overtaken by
several Berkshire
South East is the
UK’s most
competitive region.
Negative
Cardiff Met. Univ. - Centre for International
Competitiveness: Index 2010. See also BBC
Local Growth Reports and Surrey Economic
Assessment
KPMG Tech Monitor Reports
UK Competitiveness Index 2013 and 2016
6_07 Percentage of
pupils achieving
five or more A*-C
GCSEs (by location
of pupil residence)
inc. Maths and
English
2006-07 = 62.6
2007-08 = 61.0
2008-09 = 59.9
2009-10 = 63.2
2010-11 = 66.8
2011-12 = 66.7
2012-13 = 72.0
2013-14 = 69.4
S East:
2006-07 = 49.4
2007-08 = 51.8
2008-09 = 53.7
2009-10 = 57.5
2010-11 = 59.6
England:
2006-07 = 45.5
2007-08 = 47.8
2008-09 = 50.7
2009-10 = 55.1
2010-11 = 58.2
2011-12 = 58.8
2012-13 = 60.6
2013-14 = 56.6
Generally improving
performance (albeit grade
inflation?) and performance
better than regional and
national rates
Positive
Neighbourhood Statistics
http://www.neighbourhood.statistics.gov.uk/dissemi
nation/LeadTableView.do?adminCompAndTimeId
=23910%3A220&a=3&b=277121&c=mole&d=13&r
=1&e=5&f=23763&o=243&g=490789&i=1001x100
3x1004x1005&l=1983&m=0&s=1489059090474&e
nc=1&nsjs=true&nsck=false&nssvg=false&nswid=
902
5 GCSE’s inc. English and Maths reflects former
NI 75
6_08 Qualifications: % of
working age
population qualified
to NVQ2 and above
(GCSE’s and
higher)
2006 = 76.2
2007 = 70.9
2008 = 74.6
2009 = 77.1
2010 = 85.2
2011 = 77.8
2012 = 86.5
2013 = 88.0
2014 = 77.2
2015 = 86.0
SE
2006 = 67.6
2007 = 67.8
2008 = 67.7
2009 = 69.0
2010 = 70.7
2011 = 73.3
2012 = 75.4
2013 = 76.5
2014 = 77.1
2015 = 76.8
GB
2006 = 63.6
2007 = 64.2
2008 = 63.9
2009 = 65.4
2010 = 67.2
2011 = 69.7
2012 = 71.8
2013 = 72.4
2014 = 73.3
2015 = 73.6
MV population is more
qualified than the regional
and national averages at
NVQ2. Reason for sharp
decline in 2014 unknown.
Could be that less qualified
people are driven out of the
district and there is a
narrow range of workforce
Positive
NOMIS data: ONS annual population survey.
https://www.nomisweb.co.uk/reports/lmp/la/content
s.aspx
NOMIS
ELR 2013 TA Table 21
EDNA 2017 TA Table 22
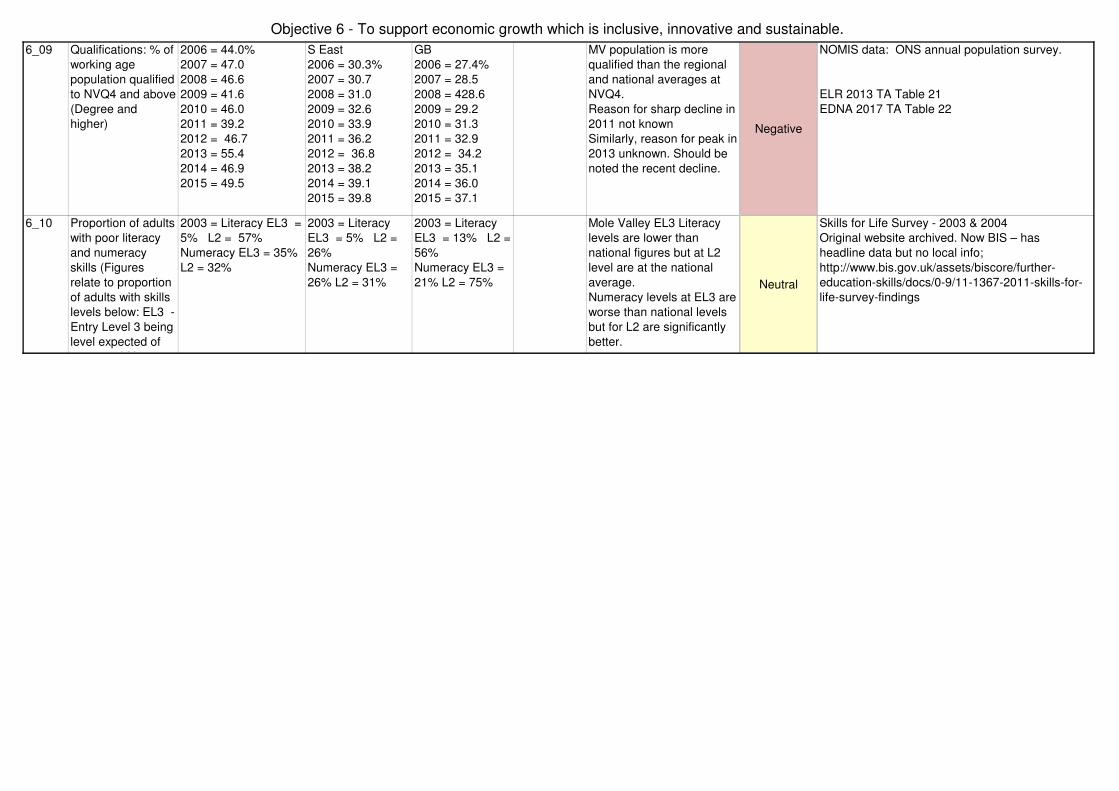
Objective 6 - To support economic growth which is inclusive, innovative and sustainable.
6_09 Qualifications: % of
working age
population qualified
to NVQ4 and above
(Degree and
higher)
2006 = 44.0%
2007 = 47.0
2008 = 46.6
2009 = 41.6
2010 = 46.0
2011 = 39.2
2012 = 46.7
2013 = 55.4
2014 = 46.9
2015 = 49.5
S East
2006 = 30.3%
2007 = 30.7
2008 = 31.0
2009 = 32.6
2010 = 33.9
2011 = 36.2
2012 = 36.8
2013 = 38.2
2014 = 39.1
2015 = 39.8
GB
2006 = 27.4%
2007 = 28.5
2008 = 428.6
2009 = 29.2
2010 = 31.3
2011 = 32.9
2012 = 34.2
2013 = 35.1
2014 = 36.0
2015 = 37.1
MV population is more
qualified than the regional
and national averages at
NVQ4.
Reason for sharp decline in
2011 not known
Similarly, reason for peak in
2013 unknown. Should be
noted the recent decline.
Negative
NOMIS data: ONS annual population survey.
ELR 2013 TA Table 21
EDNA 2017 TA Table 22
6_10 Proportion of adults
with poor literacy
and numeracy
skills (Figures
relate to proportion
of adults with skills
levels below: EL3 -
Entry Level 3 being
level expected of
11 year old L2 –
2003 = Literacy EL3 =
5% L2 = 57%
Numeracy EL3 = 35%
L2 = 32%
2003 = Literacy
EL3 = 5% L2 =
26%
Numeracy EL3 =
26% L2 = 31%
2003 = Literacy
EL3 = 13% L2 =
56%
Numeracy EL3 =
21% L2 = 75%
Mole Valley EL3 Literacy
levels are lower than
national figures but at L2
level are at the national
average.
Numeracy levels at EL3 are
worse than national levels
but for L2 are significantly
better.
Neutral
Skills for Life Survey - 2003 & 2004
Original website archived. Now BIS – has
headline data but no local info;
http://www.bis.gov.uk/assets/biscore/further-
education-skills/docs/0-9/11-1367-2011-skills-for-
life-survey-findings
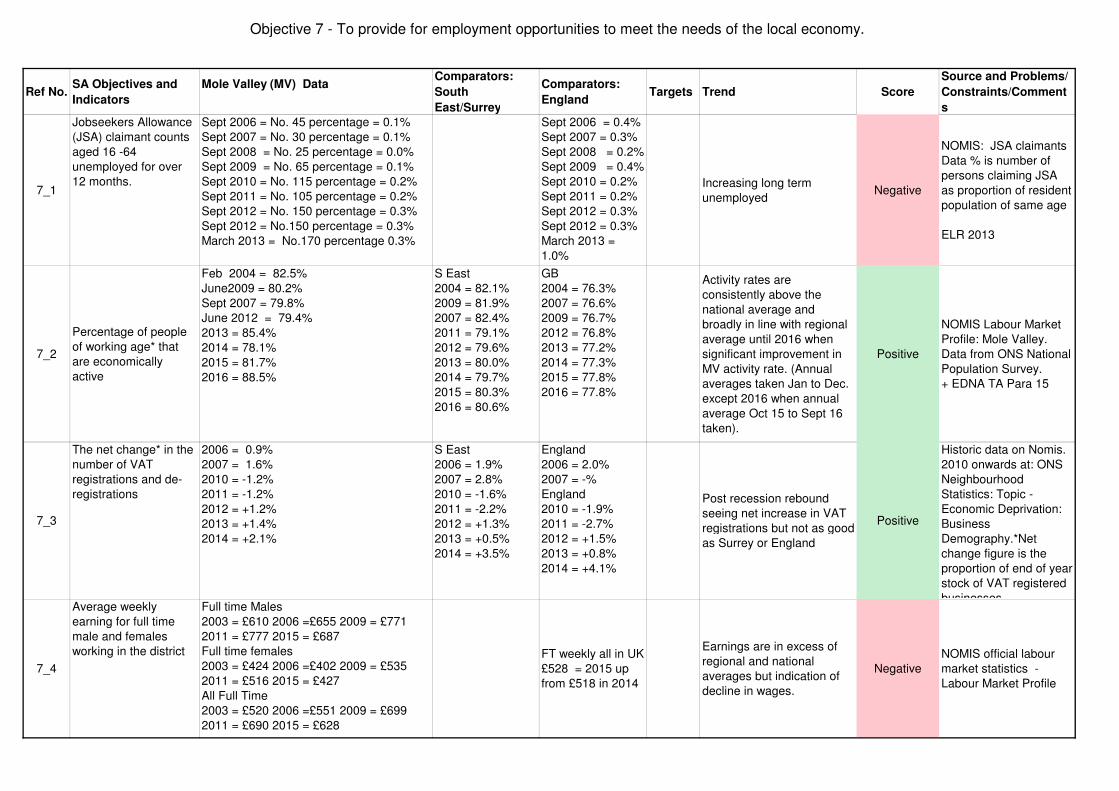
Objective 7 - To provide for employment opportunities to meet the needs of the local economy.
Ref No.SA Objectives and
Indicators
Mole Valley (MV) DataComparators:
South
East/Surrey
Comparators:
EnglandTargets Trend Score
Source and Problems/
Constraints/Comment
s
7_1
Jobseekers Allowance
(JSA) claimant counts
aged 16 -64
unemployed for over
12 months.
Sept 2006 = No. 45 percentage = 0.1%
Sept 2007 = No. 30 percentage = 0.1%
Sept 2008 = No. 25 percentage = 0.0%
Sept 2009 = No. 65 percentage = 0.1%
Sept 2010 = No. 115 percentage = 0.2%
Sept 2011 = No. 105 percentage = 0.2%
Sept 2012 = No. 150 percentage = 0.3%
Sept 2012 = No.150 percentage = 0.3%
March 2013 = No.170 percentage 0.3%
Sept 2006 = 0.4%
Sept 2007 = 0.3%
Sept 2008 = 0.2%
Sept 2009 = 0.4%
Sept 2010 = 0.2%
Sept 2011 = 0.2%
Sept 2012 = 0.3%
Sept 2012 = 0.3%
March 2013 =
1.0%
Increasing long term
unemployedNegative
NOMIS: JSA claimants
Data % is number of
persons claiming JSA
as proportion of resident
population of same age
ELR 2013
7_2
Percentage of people
of working age* that
are economically
active
Feb 2004 = 82.5%
June2009 = 80.2%
Sept 2007 = 79.8%
June 2012 = 79.4%
2013 = 85.4%
2014 = 78.1%
2015 = 81.7%
2016 = 88.5%
S East
2004 = 82.1%
2009 = 81.9%
2007 = 82.4%
2011 = 79.1%
2012 = 79.6%
2013 = 80.0%
2014 = 79.7%
2015 = 80.3%
2016 = 80.6%
GB
2004 = 76.3%
2007 = 76.6%
2009 = 76.7%
2012 = 76.8%
2013 = 77.2%
2014 = 77.3%
2015 = 77.8%
2016 = 77.8%
Activity rates are
consistently above the
national average and
broadly in line with regional
average until 2016 when
significant improvement in
MV activity rate. (Annual
averages taken Jan to Dec.
except 2016 when annual
average Oct 15 to Sept 16
taken).
Positive
NOMIS Labour Market
Profile: Mole Valley.
Data from ONS National
Population Survey.
+ EDNA TA Para 15
7_3
The net change* in the
number of VAT
registrations and de-
registrations
2006 = 0.9%
2007 = 1.6%
2010 = -1.2%
2011 = -1.2%
2012 = +1.2%
2013 = +1.4%
2014 = +2.1%
S East
2006 = 1.9%
2007 = 2.8%
2010 = -1.6%
2011 = -2.2%
2012 = +1.3%
2013 = +0.5%
2014 = +3.5%
England
2006 = 2.0%
2007 = -%
England
2010 = -1.9%
2011 = -2.7%
2012 = +1.5%
2013 = +0.8%
2014 = +4.1%
Post recession rebound
seeing net increase in VAT
registrations but not as good
as Surrey or England
Positive
Historic data on Nomis.
2010 onwards at: ONS
Neighbourhood
Statistics: Topic -
Economic Deprivation:
Business
Demography.*Net
change figure is the
proportion of end of year
stock of VAT registered
businesses
7_4
Average weekly
earning for full time
male and females
working in the district
Full time Males
2003 = £610 2006 =£655 2009 = £771
2011 = £777 2015 = £687
Full time females
2003 = £424 2006 =£402 2009 = £535
2011 = £516 2015 = £427
All Full Time
2003 = £520 2006 =£551 2009 = £699
2011 = £690 2015 = £628
FT weekly all in UK
£528 = 2015 up
from £518 in 2014
Earnings are in excess of
regional and national
averages but indication of
decline in wages.
Negative
NOMIS official labour
market statistics -
Labour Market Profile
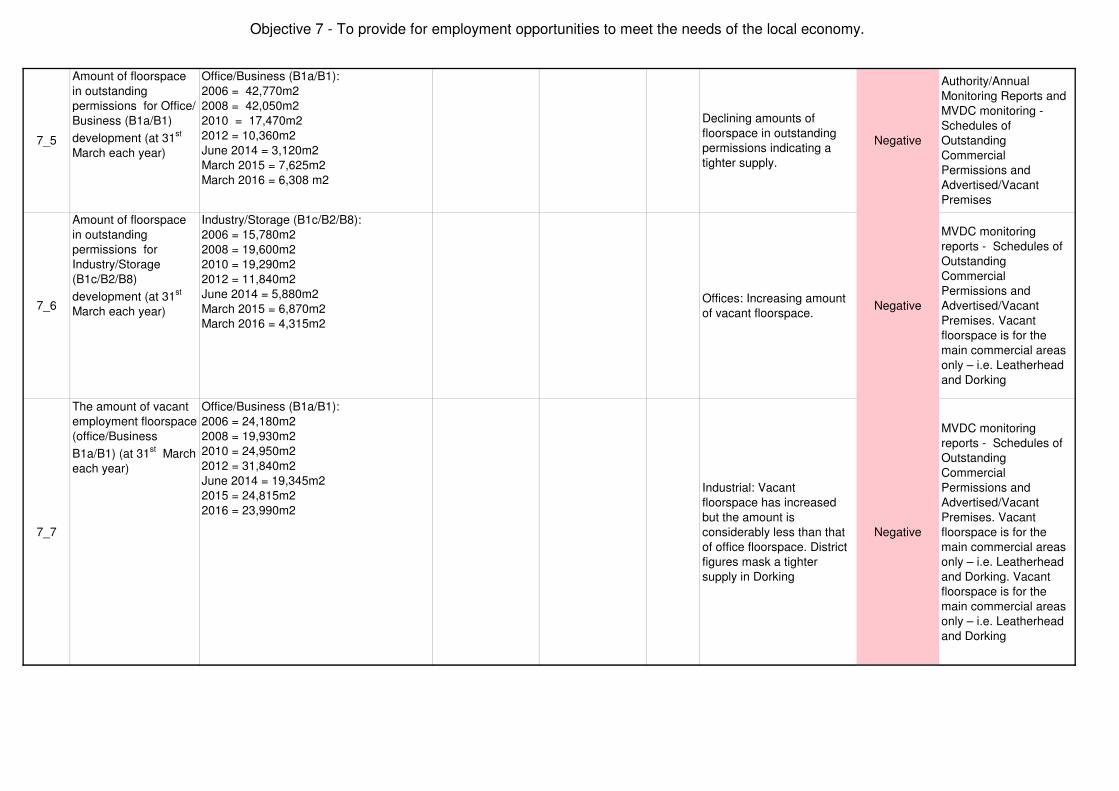
Objective 7 - To provide for employment opportunities to meet the needs of the local economy.
7_5
Amount of floorspace
in outstanding
permissions for Office/
Business (B1a/B1)
development (at 31st
March each year)
Office/Business (B1a/B1):
2006 = 42,770m2
2008 = 42,050m2
2010 = 17,470m2
2012 = 10,360m2
June 2014 = 3,120m2
March 2015 = 7,625m2
March 2016 = 6,308 m2
Declining amounts of
floorspace in outstanding
permissions indicating a
tighter supply.
Negative
Authority/Annual
Monitoring Reports and
MVDC monitoring -
Schedules of
Outstanding
Commercial
Permissions and
Advertised/Vacant
Premises
7_6
Amount of floorspace
in outstanding
permissions for
Industry/Storage
(B1c/B2/B8)
development (at 31st
March each year)
Industry/Storage (B1c/B2/B8):
2006 = 15,780m2
2008 = 19,600m2
2010 = 19,290m2
2012 = 11,840m2
June 2014 = 5,880m2
March 2015 = 6,870m2
March 2016 = 4,315m2
Offices: Increasing amount
of vacant floorspace.Negative
MVDC monitoring
reports - Schedules of
Outstanding
Commercial
Permissions and
Advertised/Vacant
Premises. Vacant
floorspace is for the
main commercial areas
only – i.e. Leatherhead
and Dorking
7_7
The amount of vacant
employment floorspace
(office/Business
B1a/B1) (at 31st March
each year)
Office/Business (B1a/B1):
2006 = 24,180m2
2008 = 19,930m2
2010 = 24,950m2
2012 = 31,840m2
June 2014 = 19,345m2
2015 = 24,815m2
2016 = 23,990m2
Industrial: Vacant
floorspace has increased
but the amount is
considerably less than that
of office floorspace. District
figures mask a tighter
supply in Dorking
Negative
MVDC monitoring
reports - Schedules of
Outstanding
Commercial
Permissions and
Advertised/Vacant
Premises. Vacant
floorspace is for the
main commercial areas
only – i.e. Leatherhead
and Dorking. Vacant
floorspace is for the
main commercial areas
only – i.e. Leatherhead
and Dorking
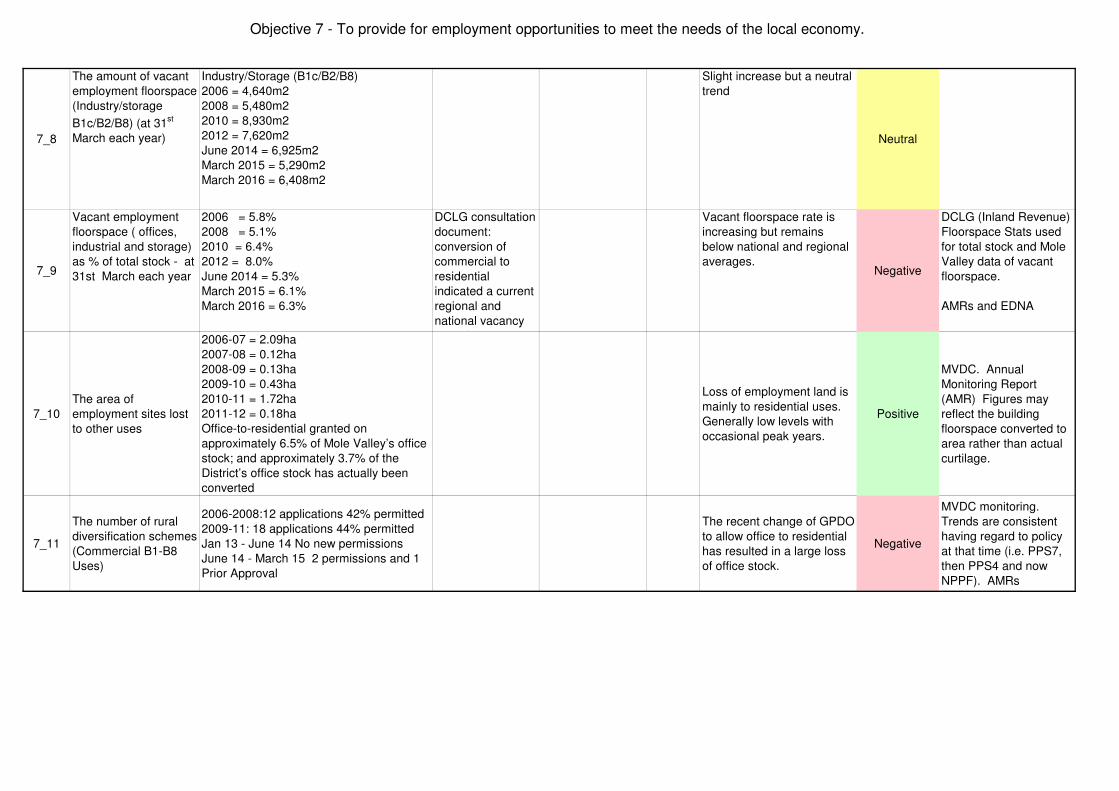
Objective 7 - To provide for employment opportunities to meet the needs of the local economy.
7_8
The amount of vacant
employment floorspace
(Industry/storage
B1c/B2/B8) (at 31st
March each year)
Industry/Storage (B1c/B2/B8)
2006 = 4,640m2
2008 = 5,480m2
2010 = 8,930m2
2012 = 7,620m2
June 2014 = 6,925m2
March 2015 = 5,290m2
March 2016 = 6,408m2
Slight increase but a neutral
trend
Neutral
7_9
Vacant employment
floorspace ( offices,
industrial and storage)
as % of total stock - at
31st March each year
2006 = 5.8%
2008 = 5.1%
2010 = 6.4%
2012 = 8.0%
June 2014 = 5.3%
March 2015 = 6.1%
March 2016 = 6.3%
DCLG consultation
document:
conversion of
commercial to
residential
indicated a current
regional and
national vacancy
rate of 9%
Vacant floorspace rate is
increasing but remains
below national and regional
averages.Negative
DCLG (Inland Revenue)
Floorspace Stats used
for total stock and Mole
Valley data of vacant
floorspace.
AMRs and EDNA
7_10
The area of
employment sites lost
to other uses
2006-07 = 2.09ha
2007-08 = 0.12ha
2008-09 = 0.13ha
2009-10 = 0.43ha
2010-11 = 1.72ha
2011-12 = 0.18ha
Office-to-residential granted on
approximately 6.5% of Mole Valley’s office
stock; and approximately 3.7% of the
District’s office stock has actually been
converted
Loss of employment land is
mainly to residential uses.
Generally low levels with
occasional peak years.
Positive
MVDC. Annual
Monitoring Report
(AMR) Figures may
reflect the building
floorspace converted to
area rather than actual
curtilage.
7_11
The number of rural
diversification schemes
(Commercial B1-B8
Uses)
2006-2008:12 applications 42% permitted
2009-11: 18 applications 44% permitted
Jan 13 - June 14 No new permissions
June 14 - March 15 2 permissions and 1
Prior Approval
The recent change of GPDO
to allow office to residential
has resulted in a large loss
of office stock.
Negative
MVDC monitoring.
Trends are consistent
having regard to policy
at that time (i.e. PPS7,
then PPS4 and now
NPPF). AMRs
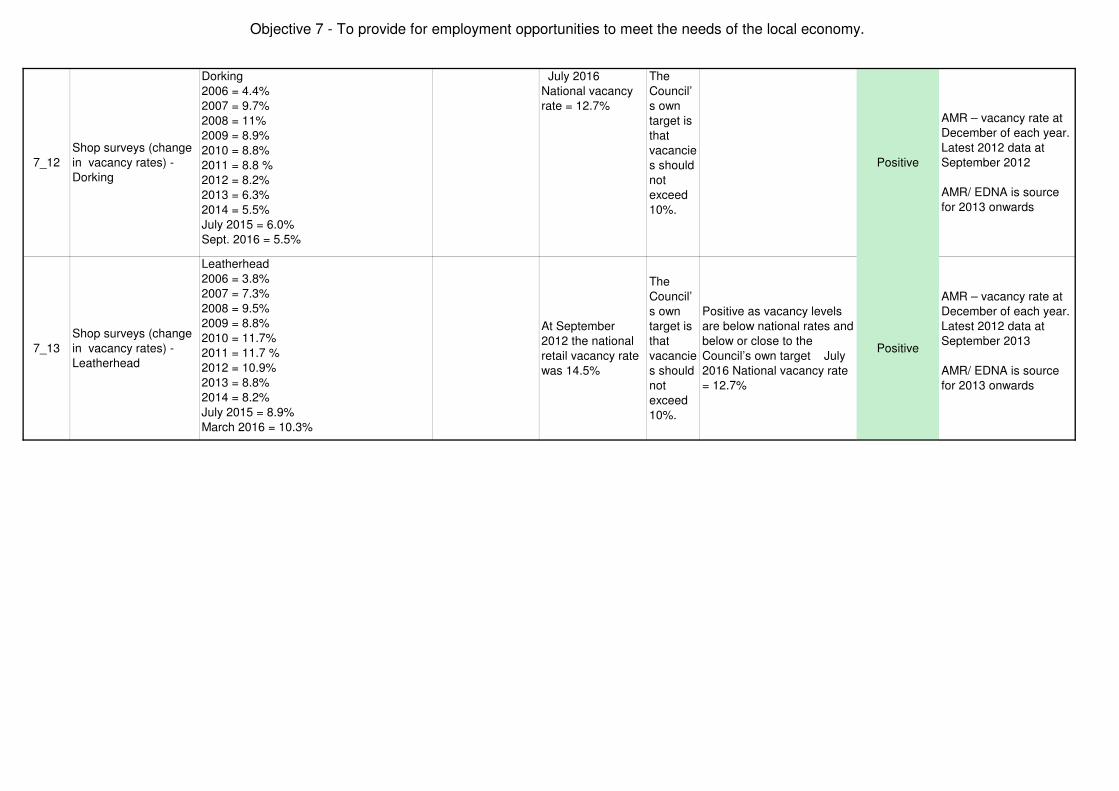
Objective 7 - To provide for employment opportunities to meet the needs of the local economy.
7_12
Shop surveys (change
in vacancy rates) -
Dorking
Dorking
2006 = 4.4%
2007 = 9.7%
2008 = 11%
2009 = 8.9%
2010 = 8.8%
2011 = 8.8 %
2012 = 8.2%
2013 = 6.3%
2014 = 5.5%
July 2015 = 6.0%
Sept. 2016 = 5.5%
July 2016
National vacancy
rate = 12.7%
The
Council’
s own
target is
that
vacancie
s should
not
exceed
10%.
Positive
AMR – vacancy rate at
December of each year.
Latest 2012 data at
September 2012
AMR/ EDNA is source
for 2013 onwards
7_13
Shop surveys (change
in vacancy rates) -
Leatherhead
Leatherhead
2006 = 3.8%
2007 = 7.3%
2008 = 9.5%
2009 = 8.8%
2010 = 11.7%
2011 = 11.7 %
2012 = 10.9%
2013 = 8.8%
2014 = 8.2%
July 2015 = 8.9%
March 2016 = 10.3%
At September
2012 the national
retail vacancy rate
was 14.5%
The
Council’
s own
target is
that
vacancie
s should
not
exceed
10%.
Positive as vacancy levels
are below national rates and
below or close to the
Council’s own target July
2016 National vacancy rate
= 12.7%
Positive
AMR – vacancy rate at
December of each year.
Latest 2012 data at
September 2013
AMR/ EDNA is source
for 2013 onwards
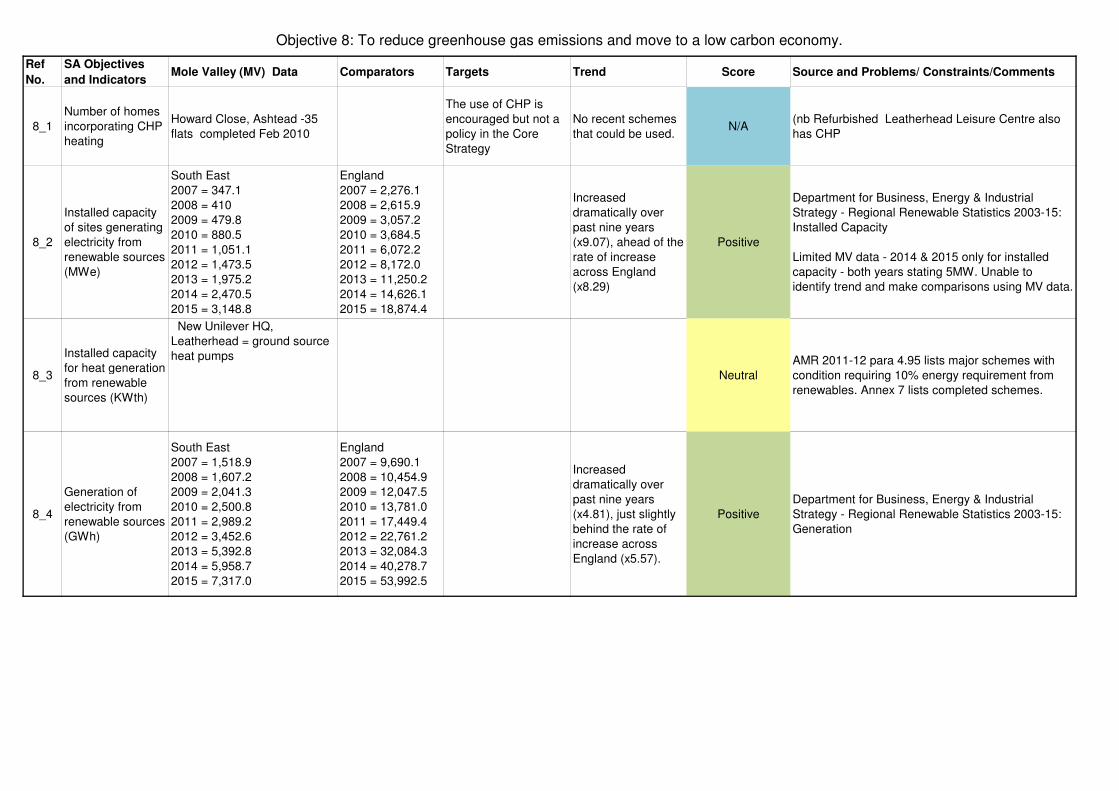
Objective 8: To reduce greenhouse gas emissions and move to a low carbon economy.
Ref
No.
SA Objectives
and IndicatorsMole Valley (MV) Data Comparators Targets Trend Score Source and Problems/ Constraints/Comments
8_1
Number of homes
incorporating CHP
heating
Howard Close, Ashtead -35
flats completed Feb 2010
The use of CHP is
encouraged but not a
policy in the Core
Strategy
No recent schemes
that could be used.N/A
(nb Refurbished Leatherhead Leisure Centre also
has CHP
8_2
Installed capacity
of sites generating
electricity from
renewable sources
(MWe)
South East
2007 = 347.1
2008 = 410
2009 = 479.8
2010 = 880.5
2011 = 1,051.1
2012 = 1,473.5
2013 = 1,975.2
2014 = 2,470.5
2015 = 3,148.8
England
2007 = 2,276.1
2008 = 2,615.9
2009 = 3,057.2
2010 = 3,684.5
2011 = 6,072.2
2012 = 8,172.0
2013 = 11,250.2
2014 = 14,626.1
2015 = 18,874.4
Increased
dramatically over
past nine years
(x9.07), ahead of the
rate of increase
across England
(x8.29)
Positive
Department for Business, Energy & Industrial
Strategy - Regional Renewable Statistics 2003-15:
Installed Capacity
Limited MV data - 2014 & 2015 only for installed
capacity - both years stating 5MW. Unable to
identify trend and make comparisons using MV data.
8_3
Installed capacity
for heat generation
from renewable
sources (KWth)
New Unilever HQ,
Leatherhead = ground source
heat pumps
Neutral
AMR 2011-12 para 4.95 lists major schemes with
condition requiring 10% energy requirement from
renewables. Annex 7 lists completed schemes.
8_4
Generation of
electricity from
renewable sources
(GWh)
South East
2007 = 1,518.9
2008 = 1,607.2
2009 = 2,041.3
2010 = 2,500.8
2011 = 2,989.2
2012 = 3,452.6
2013 = 5,392.8
2014 = 5,958.7
2015 = 7,317.0
England
2007 = 9,690.1
2008 = 10,454.9
2009 = 12,047.5
2010 = 13,781.0
2011 = 17,449.4
2012 = 22,761.2
2013 = 32,084.3
2014 = 40,278.7
2015 = 53,992.5
Increased
dramatically over
past nine years
(x4.81), just slightly
behind the rate of
increase across
England (x5.57).
Positive
Department for Business, Energy & Industrial
Strategy - Regional Renewable Statistics 2003-15:
Generation
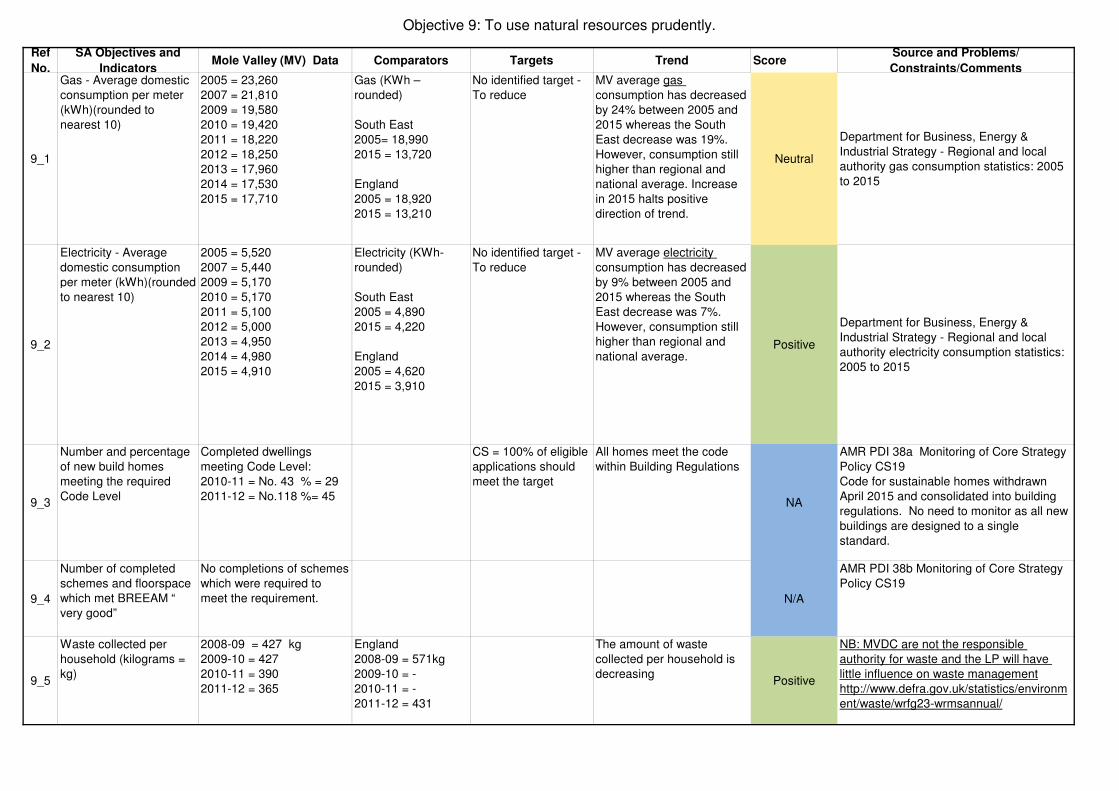
Objective 9: To use natural resources prudently.
Ref
No.
SA Objectives and
IndicatorsMole Valley (MV) Data Comparators Targets Trend Score
Source and Problems/
Constraints/Comments
9_1
Gas - Average domestic
consumption per meter
(kWh)(rounded to
nearest 10)
2005 = 23,260
2007 = 21,810
2009 = 19,580
2010 = 19,420
2011 = 18,220
2012 = 18,250
2013 = 17,960
2014 = 17,530
2015 = 17,710
Gas (KWh –
rounded)
South East
2005= 18,990
2015 = 13,720
England
2005 = 18,920
2015 = 13,210
No identified target -
To reduce
MV average gas
consumption has decreased
by 24% between 2005 and
2015 whereas the South
East decrease was 19%.
However, consumption still
higher than regional and
national average. Increase
in 2015 halts positive
direction of trend.
Neutral
Department for Business, Energy &
Industrial Strategy - Regional and local
authority gas consumption statistics: 2005
to 2015
9_2
Electricity - Average
domestic consumption
per meter (kWh)(rounded
to nearest 10)
2005 = 5,520
2007 = 5,440
2009 = 5,170
2010 = 5,170
2011 = 5,100
2012 = 5,000
2013 = 4,950
2014 = 4,980
2015 = 4,910
Electricity (KWh-
rounded)
South East
2005 = 4,890
2015 = 4,220
England
2005 = 4,620
2015 = 3,910
No identified target -
To reduce
MV average electricity
consumption has decreased
by 9% between 2005 and
2015 whereas the South
East decrease was 7%.
However, consumption still
higher than regional and
national average.Positive
Department for Business, Energy &
Industrial Strategy - Regional and local
authority electricity consumption statistics:
2005 to 2015
9_3
Number and percentage
of new build homes
meeting the required
Code Level
Completed dwellings
meeting Code Level:
2010-11 = No. 43 % = 29
2011-12 = No.118 %= 45
CS = 100% of eligible
applications should
meet the target
All homes meet the code
within Building Regulations
NA
AMR PDI 38a Monitoring of Core Strategy
Policy CS19
Code for sustainable homes withdrawn
April 2015 and consolidated into building
regulations. No need to monitor as all new
buildings are designed to a single
standard.
9_4
Number of completed
schemes and floorspace
which met BREEAM “
very good”
No completions of schemes
which were required to
meet the requirement. N/A
AMR PDI 38b Monitoring of Core Strategy
Policy CS19
9_5
Waste collected per
household (kilograms =
kg)
2008-09 = 427 kg
2009-10 = 427
2010-11 = 390
2011-12 = 365
England
2008-09 = 571kg
2009-10 = -
2010-11 = -
2011-12 = 431
The amount of waste
collected per household is
decreasingPositive
NB: MVDC are not the responsible
authority for waste and the LP will have
little influence on waste management
http://www.defra.gov.uk/statistics/environm
ent/waste/wrfg23-wrmsannual/
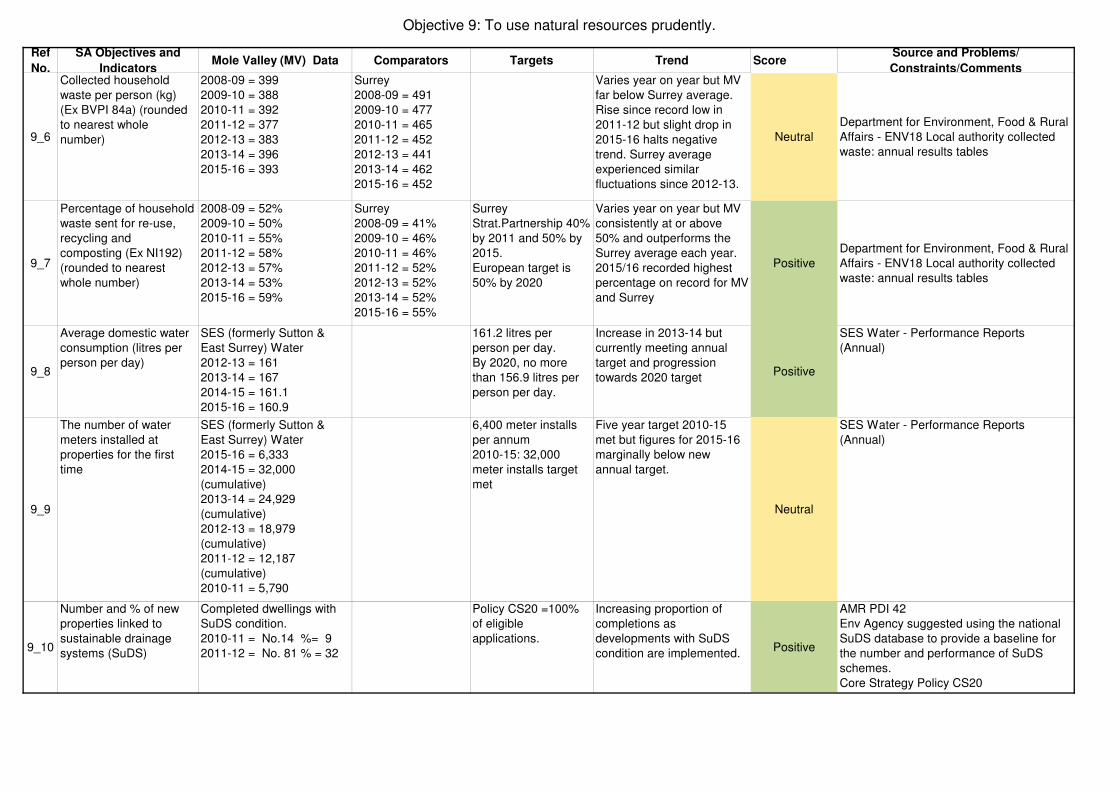
Objective 9: To use natural resources prudently.
Ref
No.
SA Objectives and
IndicatorsMole Valley (MV) Data Comparators Targets Trend Score
Source and Problems/
Constraints/Comments
9_6
Collected household
waste per person (kg)
(Ex BVPI 84a) (rounded
to nearest whole
number)
2008-09 = 399
2009-10 = 388
2010-11 = 392
2011-12 = 377
2012-13 = 383
2013-14 = 396
2015-16 = 393
Surrey
2008-09 = 491
2009-10 = 477
2010-11 = 465
2011-12 = 452
2012-13 = 441
2013-14 = 462
2015-16 = 452
Varies year on year but MV
far below Surrey average.
Rise since record low in
2011-12 but slight drop in
2015-16 halts negative
trend. Surrey average
experienced similar
fluctuations since 2012-13.
Neutral
Department for Environment, Food & Rural
Affairs - ENV18 Local authority collected
waste: annual results tables
9_7
Percentage of household
waste sent for re-use,
recycling and
composting (Ex NI192)
(rounded to nearest
whole number)
2008-09 = 52%
2009-10 = 50%
2010-11 = 55%
2011-12 = 58%
2012-13 = 57%
2013-14 = 53%
2015-16 = 59%
Surrey
2008-09 = 41%
2009-10 = 46%
2010-11 = 46%
2011-12 = 52%
2012-13 = 52%
2013-14 = 52%
2015-16 = 55%
Surrey
Strat.Partnership 40%
by 2011 and 50% by
2015.
European target is
50% by 2020
Varies year on year but MV
consistently at or above
50% and outperforms the
Surrey average each year.
2015/16 recorded highest
percentage on record for MV
and Surrey
Positive
Department for Environment, Food & Rural
Affairs - ENV18 Local authority collected
waste: annual results tables
9_8
Average domestic water
consumption (litres per
person per day)
SES (formerly Sutton &
East Surrey) Water
2012-13 = 161
2013-14 = 167
2014-15 = 161.1
2015-16 = 160.9
161.2 litres per
person per day.
By 2020, no more
than 156.9 litres per
person per day.
Increase in 2013-14 but
currently meeting annual
target and progression
towards 2020 targetPositive
SES Water - Performance Reports
(Annual)
9_9
The number of water
meters installed at
properties for the first
time
SES (formerly Sutton &
East Surrey) Water
2015-16 = 6,333
2014-15 = 32,000
(cumulative)
2013-14 = 24,929
(cumulative)
2012-13 = 18,979
(cumulative)
2011-12 = 12,187
(cumulative)
2010-11 = 5,790
6,400 meter installs
per annum
2010-15: 32,000
meter installs target
met
Five year target 2010-15
met but figures for 2015-16
marginally below new
annual target.
Neutral
SES Water - Performance Reports
(Annual)
9_10
Number and % of new
properties linked to
sustainable drainage
systems (SuDS)
Completed dwellings with
SuDS condition.
2010-11 = No.14 %= 9
2011-12 = No. 81 % = 32
Policy CS20 =100%
of eligible
applications.
Increasing proportion of
completions as
developments with SuDS
condition are implemented.Positive
AMR PDI 42
Env Agency suggested using the national
SuDS database to provide a baseline for
the number and performance of SuDS
schemes.
Core Strategy Policy CS20
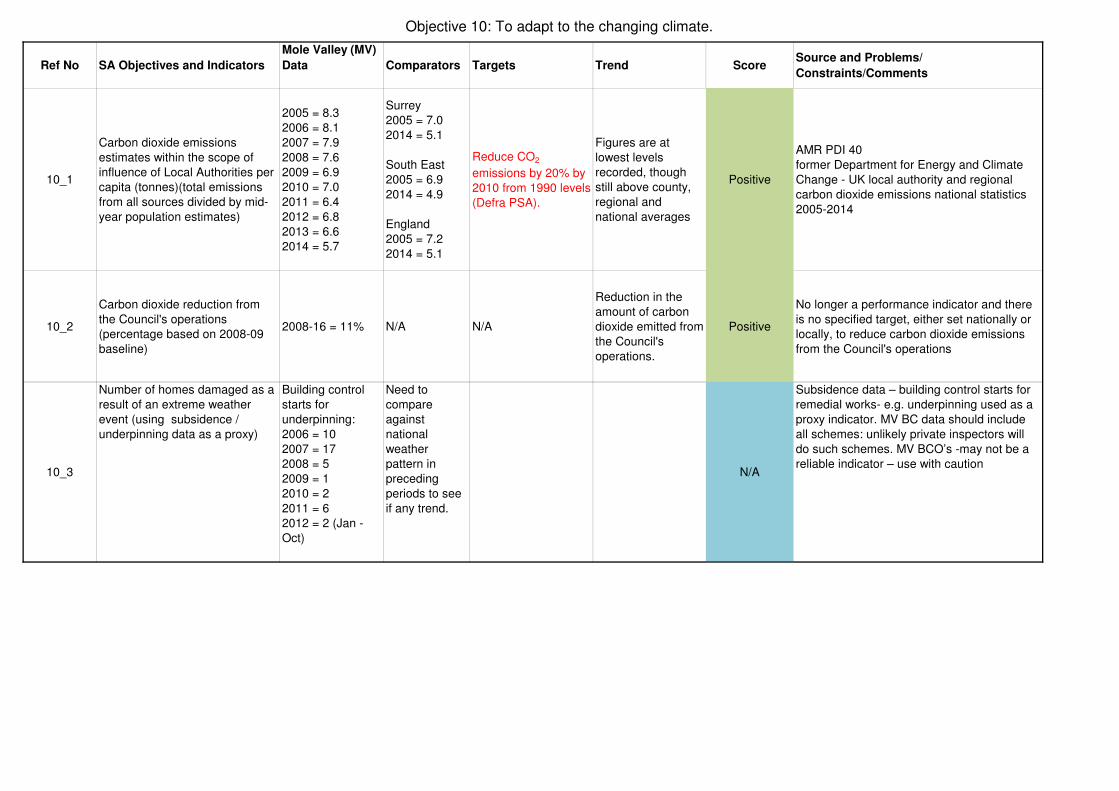
Objective 10: To adapt to the changing climate.
Ref No SA Objectives and Indicators
Mole Valley (MV)
Data Comparators Targets Trend ScoreSource and Problems/
Constraints/Comments
10_1
Carbon dioxide emissions
estimates within the scope of
influence of Local Authorities per
capita (tonnes)(total emissions
from all sources divided by mid-
year population estimates)
2005 = 8.3
2006 = 8.1
2007 = 7.9
2008 = 7.6
2009 = 6.9
2010 = 7.0
2011 = 6.4
2012 = 6.8
2013 = 6.6
2014 = 5.7
Surrey
2005 = 7.0
2014 = 5.1
South East
2005 = 6.9
2014 = 4.9
England
2005 = 7.2
2014 = 5.1
Reduce CO2
emissions by 20% by
2010 from 1990 levels
(Defra PSA).
Figures are at
lowest levels
recorded, though
still above county,
regional and
national averages
Positive
AMR PDI 40
former Department for Energy and Climate
Change - UK local authority and regional
carbon dioxide emissions national statistics
2005-2014
10_2
Carbon dioxide reduction from
the Council's operations
(percentage based on 2008-09
baseline)
2008-16 = 11% N/A N/A
Reduction in the
amount of carbon
dioxide emitted from
the Council's
operations.
Positive
No longer a performance indicator and there
is no specified target, either set nationally or
locally, to reduce carbon dioxide emissions
from the Council's operations
10_3
Number of homes damaged as a
result of an extreme weather
event (using subsidence /
underpinning data as a proxy)
Building control
starts for
underpinning:
2006 = 10
2007 = 17
2008 = 5
2009 = 1
2010 = 2
2011 = 6
2012 = 2 (Jan -
Oct)
Need to
compare
against
national
weather
pattern in
preceding
periods to see
if any trend.
N/A
Subsidence data – building control starts for
remedial works- e.g. underpinning used as a
proxy indicator. MV BC data should include
all schemes: unlikely private inspectors will
do such schemes. MV BCO’s -may not be a
reliable indicator – use with caution
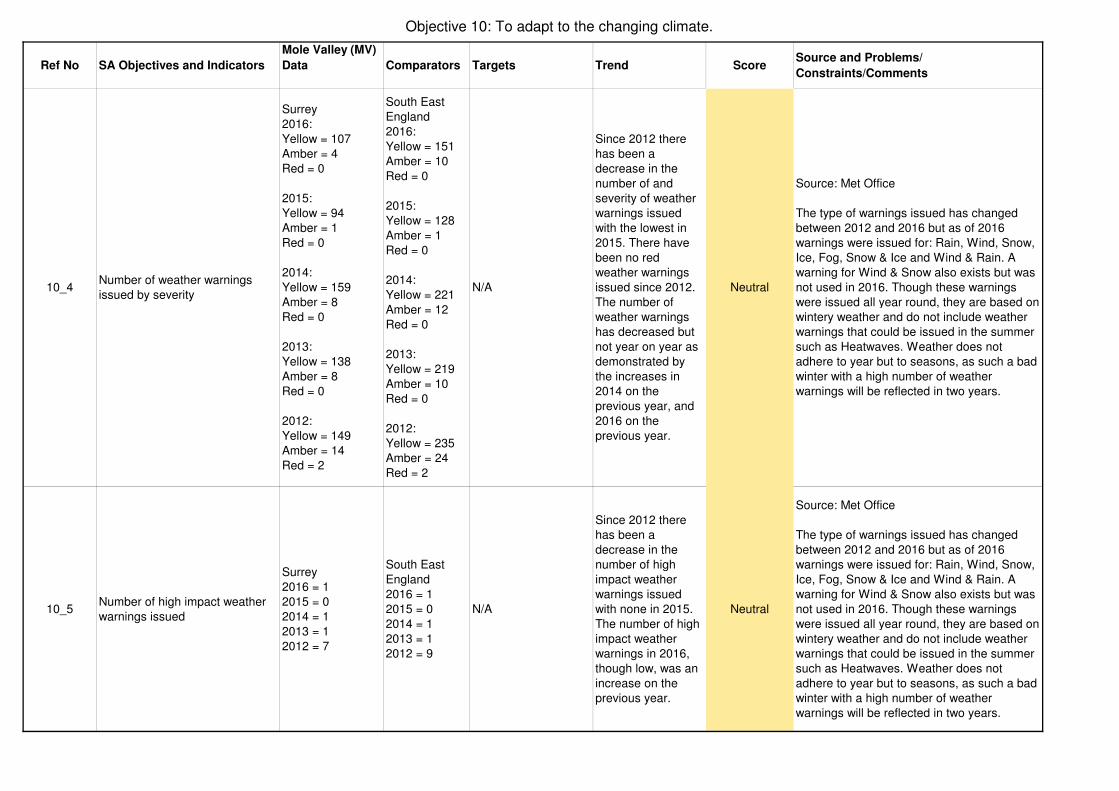
Objective 10: To adapt to the changing climate.
Ref No SA Objectives and Indicators
Mole Valley (MV)
Data Comparators Targets Trend ScoreSource and Problems/
Constraints/Comments
10_4Number of weather warnings
issued by severity
Surrey
2016:
Yellow = 107
Amber = 4
Red = 0
2015:
Yellow = 94
Amber = 1
Red = 0
2014:
Yellow = 159
Amber = 8
Red = 0
2013:
Yellow = 138
Amber = 8
Red = 0
2012:
Yellow = 149
Amber = 14
Red = 2
South East
England
2016:
Yellow = 151
Amber = 10
Red = 0
2015:
Yellow = 128
Amber = 1
Red = 0
2014:
Yellow = 221
Amber = 12
Red = 0
2013:
Yellow = 219
Amber = 10
Red = 0
2012:
Yellow = 235
Amber = 24
Red = 2
N/A
Since 2012 there
has been a
decrease in the
number of and
severity of weather
warnings issued
with the lowest in
2015. There have
been no red
weather warnings
issued since 2012.
The number of
weather warnings
has decreased but
not year on year as
demonstrated by
the increases in
2014 on the
previous year, and
2016 on the
previous year.
Neutral
Source: Met Office
The type of warnings issued has changed
between 2012 and 2016 but as of 2016
warnings were issued for: Rain, Wind, Snow,
Ice, Fog, Snow & Ice and Wind & Rain. A
warning for Wind & Snow also exists but was
not used in 2016. Though these warnings
were issued all year round, they are based on
wintery weather and do not include weather
warnings that could be issued in the summer
such as Heatwaves. Weather does not
adhere to year but to seasons, as such a bad
winter with a high number of weather
warnings will be reflected in two years.
10_5Number of high impact weather
warnings issued
Surrey
2016 = 1
2015 = 0
2014 = 1
2013 = 1
2012 = 7
South East
England
2016 = 1
2015 = 0
2014 = 1
2013 = 1
2012 = 9
N/A
Since 2012 there
has been a
decrease in the
number of high
impact weather
warnings issued
with none in 2015.
The number of high
impact weather
warnings in 2016,
though low, was an
increase on the
previous year.
Neutral
Source: Met Office
The type of warnings issued has changed
between 2012 and 2016 but as of 2016
warnings were issued for: Rain, Wind, Snow,
Ice, Fog, Snow & Ice and Wind & Rain. A
warning for Wind & Snow also exists but was
not used in 2016. Though these warnings
were issued all year round, they are based on
wintery weather and do not include weather
warnings that could be issued in the summer
such as Heatwaves. Weather does not
adhere to year but to seasons, as such a bad
winter with a high number of weather
warnings will be reflected in two years.
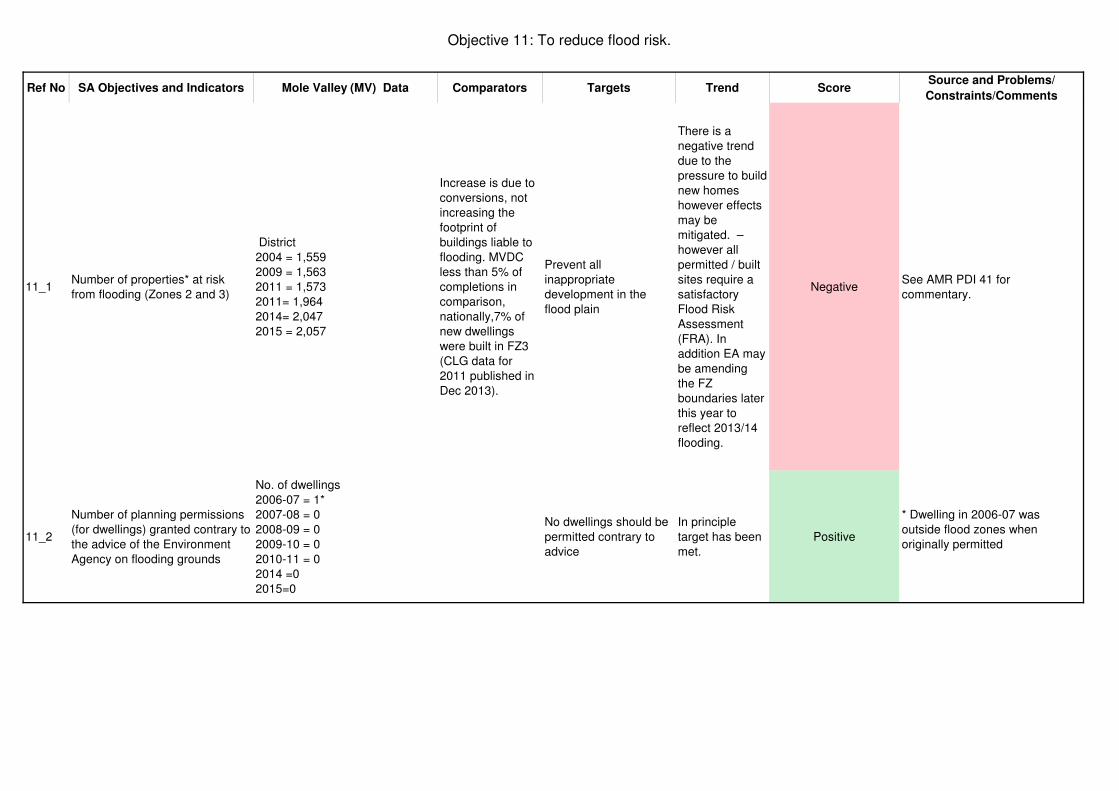
Objective 11: To reduce flood risk.
Ref No SA Objectives and Indicators Mole Valley (MV) Data Comparators Targets Trend ScoreSource and Problems/
Constraints/Comments
11_1Number of properties* at risk
from flooding (Zones 2 and 3)
District
2004 = 1,559
2009 = 1,563
2011 = 1,573
2011= 1,964
2014= 2,047
2015 = 2,057
Increase is due to
conversions, not
increasing the
footprint of
buildings liable to
flooding. MVDC
less than 5% of
completions in
comparison,
nationally,7% of
new dwellings
were built in FZ3
(CLG data for
2011 published in
Dec 2013).
Prevent all
inappropriate
development in the
flood plain
There is a
negative trend
due to the
pressure to build
new homes
however effects
may be
mitigated. –
however all
permitted / built
sites require a
satisfactory
Flood Risk
Assessment
(FRA). In
addition EA may
be amending
the FZ
boundaries later
this year to
reflect 2013/14
flooding.
NegativeSee AMR PDI 41 for
commentary.
11_2
Number of planning permissions
(for dwellings) granted contrary to
the advice of the Environment
Agency on flooding grounds
No. of dwellings
2006-07 = 1*
2007-08 = 0
2008-09 = 0
2009-10 = 0
2010-11 = 0
2014 =0
2015=0
No dwellings should be
permitted contrary to
advice
In principle
target has been
met.
Positive
* Dwelling in 2006-07 was
outside flood zones when
originally permitted
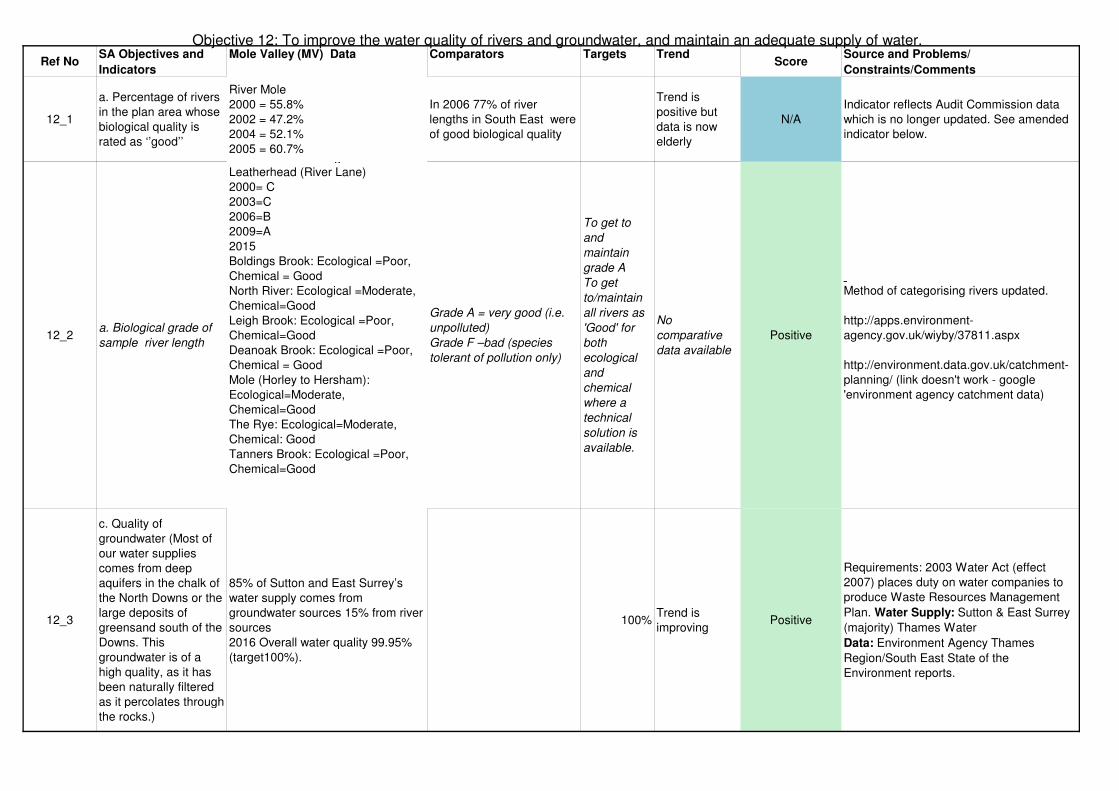
Objective 12: To improve the water quality of rivers and groundwater, and maintain an adequate supply of water.
Ref NoSA Objectives and
Indicators
Mole Valley (MV) Data Comparators Targets TrendScore
Source and Problems/
Constraints/Comments
12_1
a. Percentage of rivers
in the plan area whose
biological quality is
rated as ‘’good’’
River Mole
2000 = 55.8%
2002 = 47.2%
2004 = 52.1%
2005 = 60.7%
In 2006 77% of river
lengths in South East were
of good biological quality
Trend is
positive but
data is now
elderly
N/A
Indicator reflects Audit Commission data
which is no longer updated. See amended
indicator below.
12_2a. Biological grade of
sample river length
River Mole – Dorking STW –
Leatherhead (River Lane)
2000= C
2003=C
2006=B
2009=A
2015
Boldings Brook: Ecological =Poor,
Chemical = Good
North River: Ecological =Moderate,
Chemical=Good
Leigh Brook: Ecological =Poor,
Chemical=Good
Deanoak Brook: Ecological =Poor,
Chemical = Good
Mole (Horley to Hersham):
Ecological=Moderate,
Chemical=Good
The Rye: Ecological=Moderate,
Chemical: Good
Tanners Brook: Ecological =Poor,
Chemical=Good
Grade A = very good (i.e.
unpolluted)
Grade F –bad (species
tolerant of pollution only)
To get to
and
maintain
grade A
To get
to/maintain
all rivers as
'Good' for
both
ecological
and
chemical
where a
technical
solution is
available.
No
comparative
data available
Positive
Method of categorising rivers updated.
http://apps.environment-
agency.gov.uk/wiyby/37811.aspx
http://environment.data.gov.uk/catchment-
planning/ (link doesn't work - google
'environment agency catchment data)
12_3
c. Quality of
groundwater (Most of
our water supplies
comes from deep
aquifers in the chalk of
the North Downs or the
large deposits of
greensand south of the
Downs. This
groundwater is of a
high quality, as it has
been naturally filtered
as it percolates through
the rocks.)
85% of Sutton and East Surrey’s
water supply comes from
groundwater sources 15% from river
sources
2016 Overall water quality 99.95%
(target100%).
100%Trend is
improvingPositive
Requirements: 2003 Water Act (effect
2007) places duty on water companies to
produce Waste Resources Management
Plan. Water Supply: Sutton & East Surrey
(majority) Thames Water
Data: Environment Agency Thames
Region/South East State of the
Environment reports.
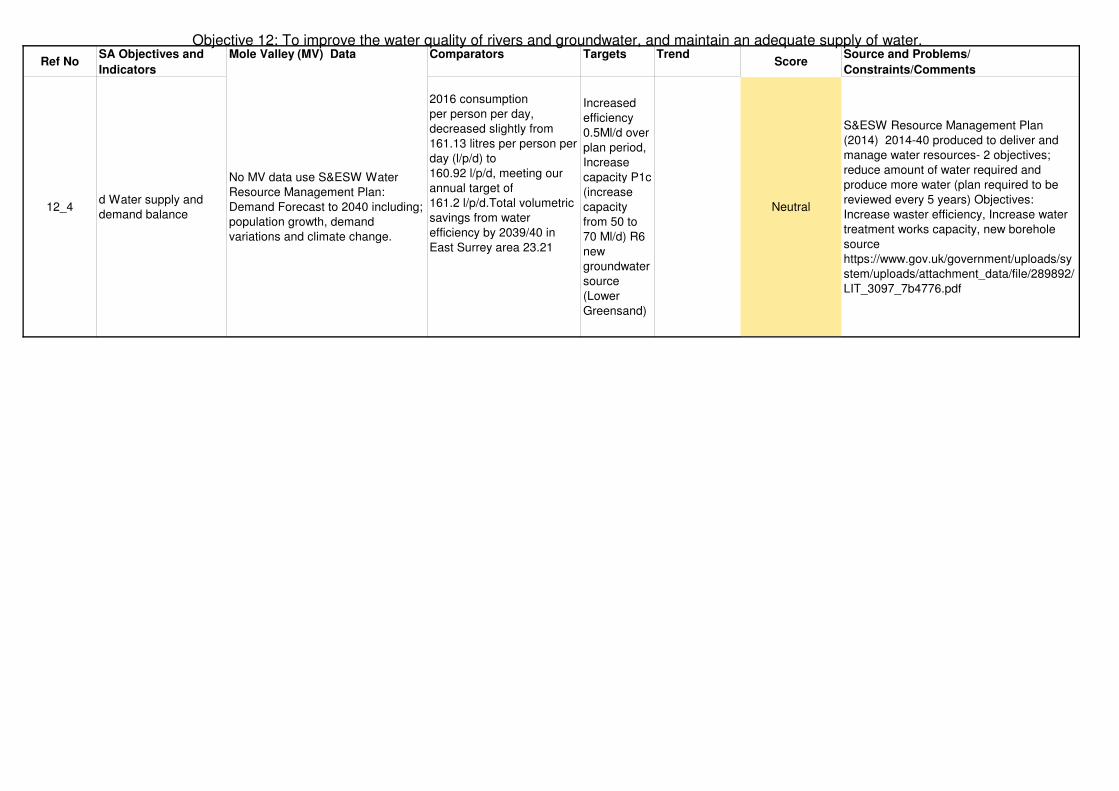
Objective 12: To improve the water quality of rivers and groundwater, and maintain an adequate supply of water.
Ref NoSA Objectives and
Indicators
Mole Valley (MV) Data Comparators Targets TrendScore
Source and Problems/
Constraints/Comments
12_4d Water supply and
demand balance
No MV data use S&ESW Water
Resource Management Plan:
Demand Forecast to 2040 including;
population growth, demand
variations and climate change.
2016 consumption
per person per day,
decreased slightly from
161.13 litres per person per
day (l/p/d) to
160.92 l/p/d, meeting our
annual target of
161.2 l/p/d.Total volumetric
savings from water
efficiency by 2039/40 in
East Surrey area 23.21
Increased
efficiency
0.5Ml/d over
plan period,
Increase
capacity P1c
(increase
capacity
from 50 to
70 Ml/d) R6
new
groundwater
source
(Lower
Greensand)
Neutral
S&ESW Resource Management Plan
(2014) 2014-40 produced to deliver and
manage water resources- 2 objectives;
reduce amount of water required and
produce more water (plan required to be
reviewed every 5 years) Objectives:
Increase waster efficiency, Increase water
treatment works capacity, new borehole
source
https://www.gov.uk/government/uploads/sy
stem/uploads/attachment_data/file/289892/
LIT_3097_7b4776.pdf
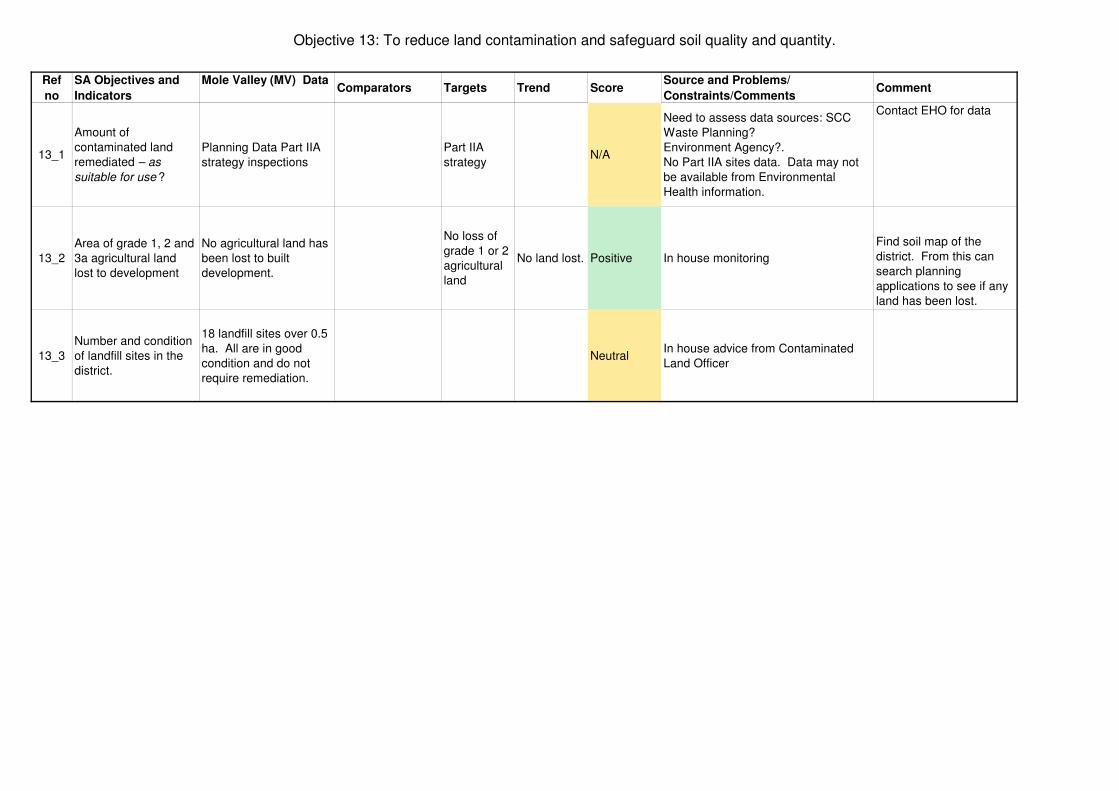
Objective 13: To reduce land contamination and safeguard soil quality and quantity.
Ref
no
SA Objectives and
Indicators
Mole Valley (MV) DataComparators Targets Trend Score
Source and Problems/
Constraints/CommentsComment
13_1
Amount of
contaminated land
remediated – as
suitable for use ?
Planning Data Part IIA
strategy inspections
Part IIA
strategyN/A
Need to assess data sources: SCC
Waste Planning?
Environment Agency?.
No Part IIA sites data. Data may not
be available from Environmental
Health information.
Contact EHO for data
13_2
Area of grade 1, 2 and
3a agricultural land
lost to development
No agricultural land has
been lost to built
development.
No loss of
grade 1 or 2
agricultural
land
No land lost. Positive In house monitoring
Find soil map of the
district. From this can
search planning
applications to see if any
land has been lost.
13_3
Number and condition
of landfill sites in the
district.
18 landfill sites over 0.5
ha. All are in good
condition and do not
require remediation.
NeutralIn house advice from Contaminated
Land Officer
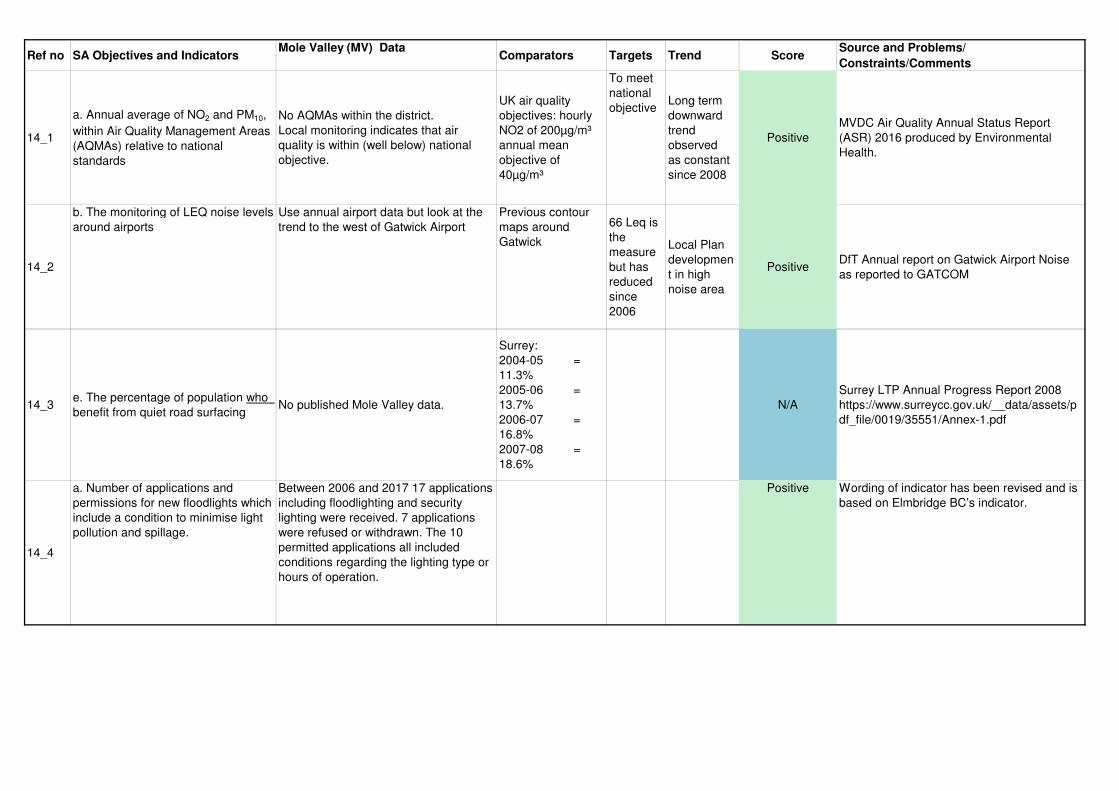
Ref no SA Objectives and IndicatorsMole Valley (MV) Data
Comparators Targets Trend ScoreSource and Problems/
Constraints/Comments
14_1
a. Annual average of NO2 and PM10,
within Air Quality Management Areas
(AQMAs) relative to national
standards
No AQMAs within the district.
Local monitoring indicates that air
quality is within (well below) national
objective.
UK air quality
objectives: hourly
NO2 of 200µg/m³
annual mean
objective of
40µg/m³
To meet
national
objectiveLong term
downward
trend
observed
as constant
since 2008
Positive
MVDC Air Quality Annual Status Report
(ASR) 2016 produced by Environmental
Health.
14_2
b. The monitoring of LEQ noise levels
around airports
Use annual airport data but look at the
trend to the west of Gatwick Airport
Previous contour
maps around
Gatwick
66 Leq is
the
measure
but has
reduced
since
2006
Local Plan
developmen
t in high
noise area
PositiveDfT Annual report on Gatwick Airport Noise
as reported to GATCOM
14_3e. The percentage of population who
benefit from quiet road surfacingNo published Mole Valley data.
Surrey:
2004-05 =
11.3%
2005-06 =
13.7%
2006-07 =
16.8%
2007-08 =
18.6%
N/A
Surrey LTP Annual Progress Report 2008
https://www.surreycc.gov.uk/__data/assets/p
df_file/0019/35551/Annex-1.pdf
14_4
a. Number of applications and
permissions for new floodlights which
include a condition to minimise light
pollution and spillage.
Between 2006 and 2017 17 applications
including floodlighting and security
lighting were received. 7 applications
were refused or withdrawn. The 10
permitted applications all included
conditions regarding the lighting type or
hours of operation.
Positive Wording of indicator has been revised and is
based on Elmbridge BC’s indicator.
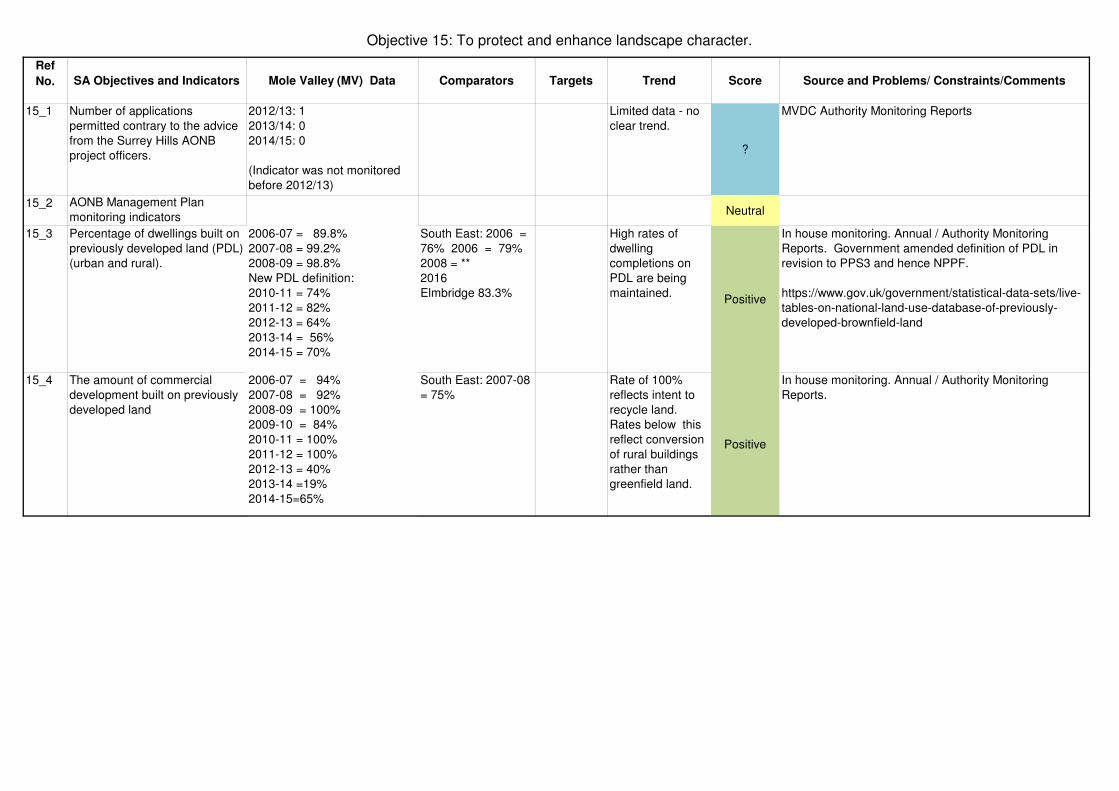
Objective 15: To protect and enhance landscape character.
Ref
No. SA Objectives and Indicators Mole Valley (MV) Data Comparators Targets Trend Score Source and Problems/ Constraints/Comments
15_1 Number of applications
permitted contrary to the advice
from the Surrey Hills AONB
project officers.
2012/13: 1
2013/14: 0
2014/15: 0
(Indicator was not monitored
before 2012/13)
Limited data - no
clear trend.
?
MVDC Authority Monitoring Reports
15_2 AONB Management Plan
monitoring indicatorsNeutral
15_3 Percentage of dwellings built on
previously developed land (PDL)
(urban and rural).
2006-07 = 89.8%
2007-08 = 99.2%
2008-09 = 98.8%
New PDL definition:
2010-11 = 74%
2011-12 = 82%
2012-13 = 64%
2013-14 = 56%
2014-15 = 70%
South East: 2006 =
76% 2006 = 79%
2008 = **
2016
Elmbridge 83.3%
High rates of
dwelling
completions on
PDL are being
maintained. Positive
In house monitoring. Annual / Authority Monitoring
Reports. Government amended definition of PDL in
revision to PPS3 and hence NPPF.
https://www.gov.uk/government/statistical-data-sets/live-
tables-on-national-land-use-database-of-previously-
developed-brownfield-land
15_4 The amount of commercial
development built on previously
developed land
2006-07 = 94%
2007-08 = 92%
2008-09 = 100%
2009-10 = 84%
2010-11 = 100%
2011-12 = 100%
2012-13 = 40%
2013-14 =19%
2014-15=65%
South East: 2007-08
= 75%
Rate of 100%
reflects intent to
recycle land.
Rates below this
reflect conversion
of rural buildings
rather than
greenfield land.
Positive
In house monitoring. Annual / Authority Monitoring
Reports.
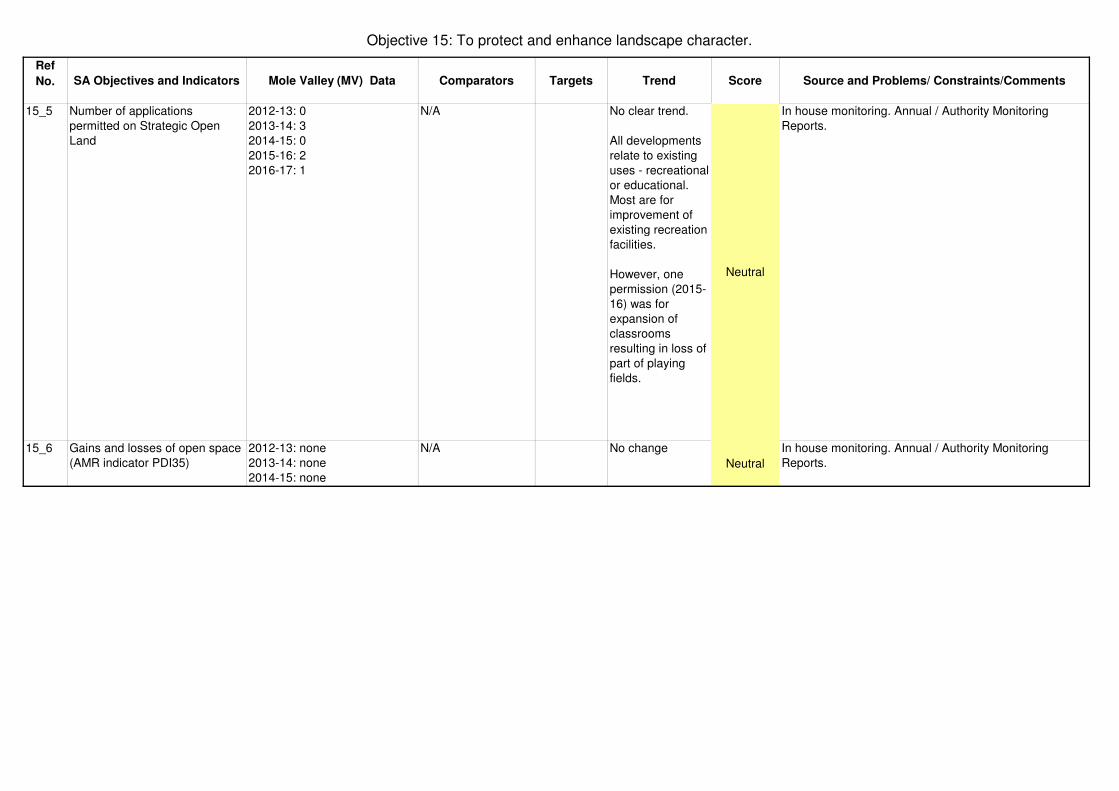
Objective 15: To protect and enhance landscape character.
Ref
No. SA Objectives and Indicators Mole Valley (MV) Data Comparators Targets Trend Score Source and Problems/ Constraints/Comments
15_5 Number of applications
permitted on Strategic Open
Land
2012-13: 0
2013-14: 3
2014-15: 0
2015-16: 2
2016-17: 1
N/A No clear trend.
All developments
relate to existing
uses - recreational
or educational.
Most are for
improvement of
existing recreation
facilities.
However, one
permission (2015-
16) was for
expansion of
classrooms
resulting in loss of
part of playing
fields.
Neutral
In house monitoring. Annual / Authority Monitoring
Reports.
15_6 Gains and losses of open space
(AMR indicator PDI35)
2012-13: none
2013-14: none
2014-15: none
N/A No change
Neutral
In house monitoring. Annual / Authority Monitoring
Reports.
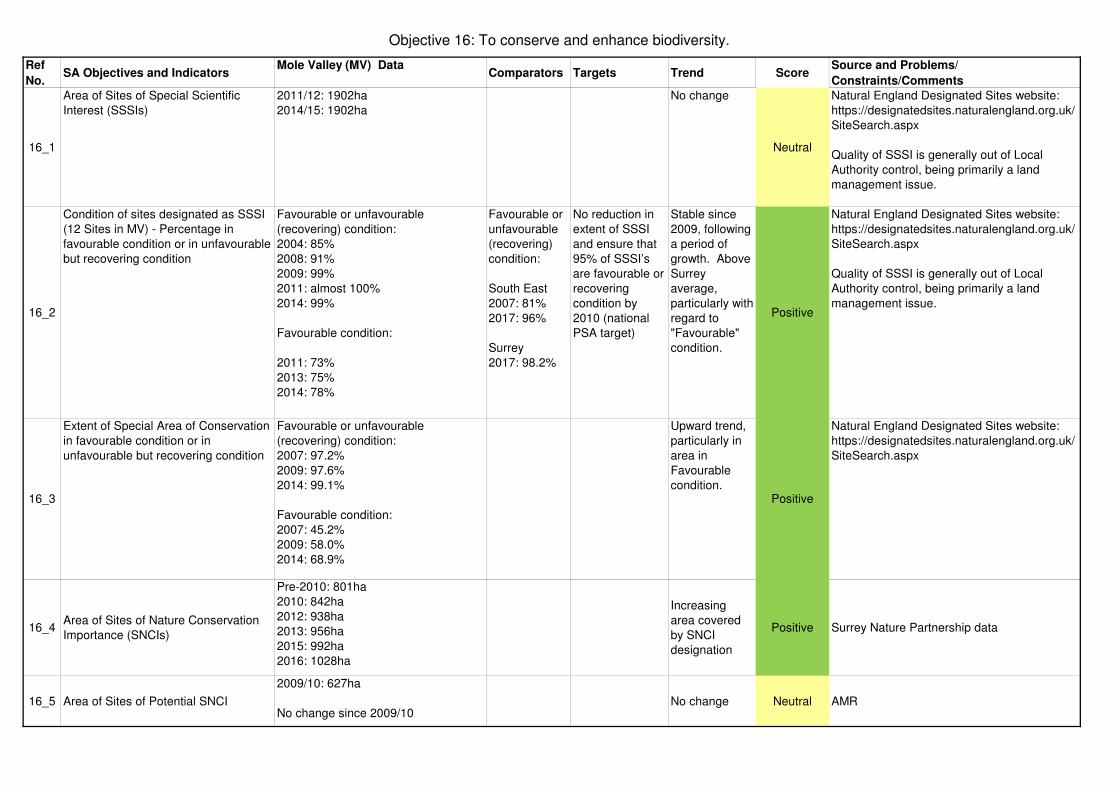
Objective 16: To conserve and enhance biodiversity.
Ref
No.SA Objectives and Indicators
Mole Valley (MV) DataComparators Targets Trend Score
Source and Problems/
Constraints/Comments
16_1
Area of Sites of Special Scientific
Interest (SSSIs)
2011/12: 1902ha
2014/15: 1902ha
No change
Neutral
Natural England Designated Sites website:
https://designatedsites.naturalengland.org.uk/
SiteSearch.aspx
Quality of SSSI is generally out of Local
Authority control, being primarily a land
management issue.
16_2
Condition of sites designated as SSSI
(12 Sites in MV) - Percentage in
favourable condition or in unfavourable
but recovering condition
Favourable or unfavourable
(recovering) condition:
2004: 85%
2008: 91%
2009: 99%
2011: almost 100%
2014: 99%
Favourable condition:
2011: 73%
2013: 75%
2014: 78%
Favourable or
unfavourable
(recovering)
condition:
South East
2007: 81%
2017: 96%
Surrey
2017: 98.2%
No reduction in
extent of SSSI
and ensure that
95% of SSSI’s
are favourable or
recovering
condition by
2010 (national
PSA target)
Stable since
2009, following
a period of
growth. Above
Surrey
average,
particularly with
regard to
"Favourable"
condition.
Positive
Natural England Designated Sites website:
https://designatedsites.naturalengland.org.uk/
SiteSearch.aspx
Quality of SSSI is generally out of Local
Authority control, being primarily a land
management issue.
16_3
Extent of Special Area of Conservation
in favourable condition or in
unfavourable but recovering condition
Favourable or unfavourable
(recovering) condition:
2007: 97.2%
2009: 97.6%
2014: 99.1%
Favourable condition:
2007: 45.2%
2009: 58.0%
2014: 68.9%
Upward trend,
particularly in
area in
Favourable
condition.Positive
Natural England Designated Sites website:
https://designatedsites.naturalengland.org.uk/
SiteSearch.aspx
16_4Area of Sites of Nature Conservation
Importance (SNCIs)
Pre-2010: 801ha
2010: 842ha
2012: 938ha
2013: 956ha
2015: 992ha
2016: 1028ha
Increasing
area covered
by SNCI
designation
Positive Surrey Nature Partnership data
16_5 Area of Sites of Potential SNCI
2009/10: 627ha
No change since 2009/10No change Neutral AMR
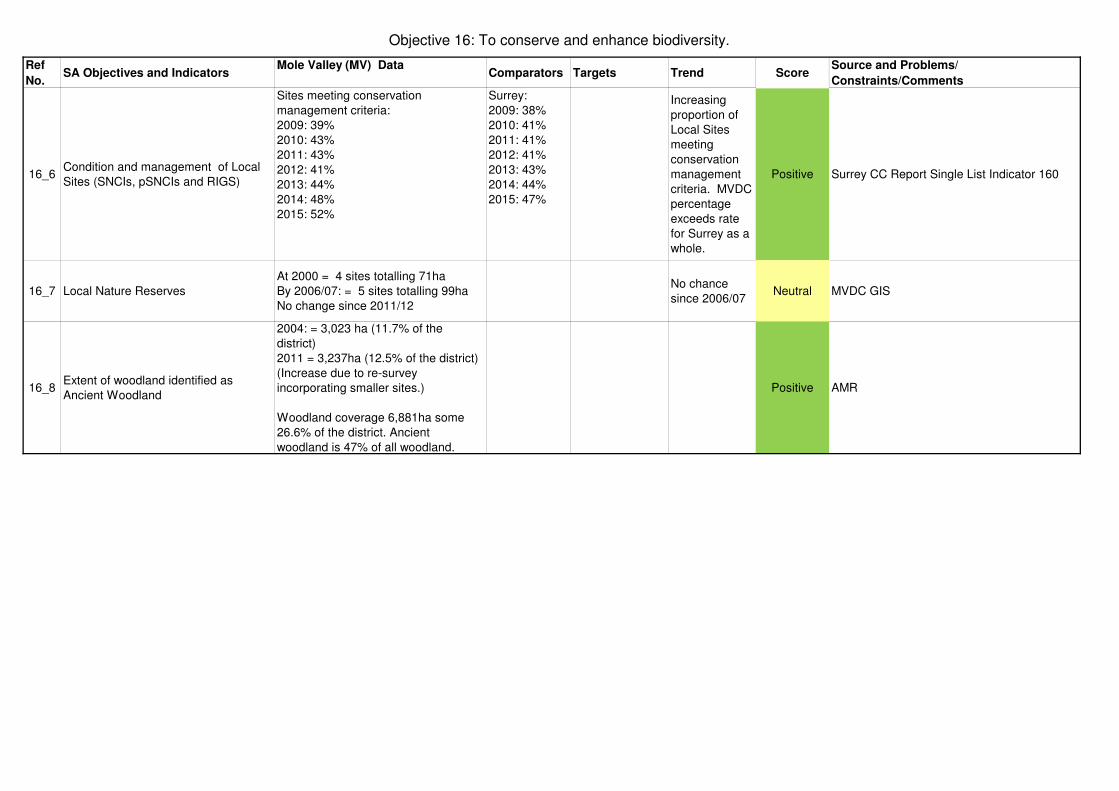
Objective 16: To conserve and enhance biodiversity.
Ref
No.SA Objectives and Indicators
Mole Valley (MV) DataComparators Targets Trend Score
Source and Problems/
Constraints/Comments
16_6Condition and management of Local
Sites (SNCIs, pSNCIs and RIGS)
Sites meeting conservation
management criteria:
2009: 39%
2010: 43%
2011: 43%
2012: 41%
2013: 44%
2014: 48%
2015: 52%
Surrey:
2009: 38%
2010: 41%
2011: 41%
2012: 41%
2013: 43%
2014: 44%
2015: 47%
Increasing
proportion of
Local Sites
meeting
conservation
management
criteria. MVDC
percentage
exceeds rate
for Surrey as a
whole.
Positive Surrey CC Report Single List Indicator 160
16_7 Local Nature Reserves
At 2000 = 4 sites totalling 71ha
By 2006/07: = 5 sites totalling 99ha
No change since 2011/12
No chance
since 2006/07Neutral MVDC GIS
16_8Extent of woodland identified as
Ancient Woodland
2004: = 3,023 ha (11.7% of the
district)
2011 = 3,237ha (12.5% of the district)
(Increase due to re-survey
incorporating smaller sites.)
Woodland coverage 6,881ha some
26.6% of the district. Ancient
woodland is 47% of all woodland.
Positive AMR
