sustainability appraisal final report - university of leeds
TRANSCRIPT

Appraisal of Sustainability in Transport Final Report Project Manager : Dr Greg Marsden (Institute for Transport Studies) Project team : Mary Kimble (Institute for Transport Studies)
John Nellthorp (Institute for Transport Studies) Charlotte Kelly (Institute for Transport Studies)
Title : Appraisal of Sustainability Author(s) : Marsden, G., Kimble, M. and Nellthorp, J. Reference Number : RG.TRAN.448750 Version : 1 Date : 15th January 2007 Distribution : Public Availability : Public File : C:Greg\research\projects\Rees Jeffreys\outputs\ Authorized By : Signature : © Institute for Transport Studies, University of Leeds
Institute for Transport Studies FACULTY OF ENVIRONMENT

2
Executive Summary In its 2004 Future of Transport White Paper, the Department for Transport identified the need, in the context of more sustainable development, to “ensure that the wider impacts of future developments are reflected in appropriate appraisal methodologies” (DfT, 2004, p14). In 2005 this project set out why a new approach to assessing sustainability is necessary, how it might work and why it differs from current procedures. This report summarises that approach, the framework developed and presents the results of our first attempts to operationalise the framework. In the first stage of the project the principles of sustainability were examined along with the lists of indicators in use in transport and planning today. Through an evidence-led process of elimination a suite of 17 indicators was produced covering, to the extent felt practicably possible, the full range of sustainability concerns cutting across transport and land-use planning. An appraisal framework within which decisions on the relative sustainability of different policy options can be made was also developed. The framework considers the absolute impacts of plans and schemes as well as their relative merits. The project aimed to test the implementation of the framework on real policy scenarios. Rather than developing any new modelling capabilities, the project sought to obtain access to existing state-of-art modelling packages. This ensures that the assessment of the sustainability impacts and the ability of current models to cover the range of impacts of interest would be grounded in current practice. This enables some commentary the current position on the assessment of the sustainability of transport strategies and policies to be made. The project was granted access to the results of three hypothetical strategies for a major metropolitan area in England. These three scenarios were used as the basis for testing the framework and comparing the results to the current English appraisal framework. The findings of the research have confirmed the merits of considering the absolute impacts of a strategy rather than principally its relative conditions. This approach shines a light on the real inherent conflicts between growth in travel, economic efficiency, social progress and potential environmental impacts in a manner that is less transparent through the current approach to appraisal. Although the UK is now in the second incarnation of a sustainability strategy and sustainability features as a buzz word in most documents there is no operational definition which helps in assessing the sustainability of transport interventions. Coupled with this, there are very few policy statements on what constitutes a sustainable level of, for example, resource consumption, access to services, distribution of benefits. This is further compounded by a

3
failure to translate many of those that do exist into sector specific aims for transport (e.g. climate change targets) and still further to indicate to different authorities what they might reasonably aim to contribute. There are therefore multiple inconsistent definitions of sustainability with weak and inconsistent definitions of progress. In such a flimsy policy environment it seems improbable that transport strategies and policies could be truly sustainable. Indeed, a combination of road user charging and public transport investment examined in this study still appears to conflict with some sustainability measures whilst this might be viewed by practitioners as a ‘sustainable package’. The main methodological innovations that have been achieved through the research relate to the development of a new approach to assessing the long-term economic sustainability of strategies and through efforts to assess the social sustainability of strategies. On economic benefits we feel that the approach to amortizing costs of the project and comparing benefits in the assessment years versus the yearly amortized cost provides a neat short-term solution to capturing the majority of economic benefits of interventions. The outcomes of the amortized approach appear more intuitively correct (providing greater benefits for a package of investment and charging) than the NATA framework. This is an area for further investigation with a range of more robust cost estimates. Our attempts to assess social progress were far more limited. The report details the technical and data difficulties faced. These impacts are critical to understanding the sustainability of transport and have hitherto lacked a coherent and well-resourced research effort from a modelling perspective, coming, as it has from a more qualitative social policy perspective. The estimation of environmental impacts was hampered by inadequate data sources on resource use for the construction and maintenance of infrastructure and vehicles. Despite excellent data sets on the emissions of the existing fleet at a level compatible with those of the model outputs there was little data to guide us on the impacts of different paths of technological development. We have made clear our assumptions in the Annex to this report. Technological change is important in defining in parallel the levels of behavioural change that are required to meet targets and the absence of good data for forecasting hampered our efforts in this regard. Difficulties were also encountered in the modelling of freight and walking and cycling. These have potentially significant impacts on the social and environmental outcomes of the strategies. The findings presented in this report represent our assessment of three different policy scenarios in one metropolitan area. We see there as being

4
great value in taking this forward and applying it to other similar case studies in different areas, to other policies (e.g. a sustainability assessment of different models for delivering free concessionary travel to older people) and to some major schemes. This should serve to highlight the broader transferability of our discussion surrounding the selection of sustainable transport interventions.

5
Contents CONTENTS ...........................................................................................................................................5 1 INTRODUCTION.......................................................................................................................7
1.1 DEFINITION OF SUSTAINABILITY...........................................................................................7 1.2 THE RATIONALE FOR A SUSTAINABILITY APPRAISAL ...........................................................7 1.3 REPORT STRUCTURE..............................................................................................................8
2 APPRAISAL FRAMEWORKS..................................................................................................9 2.1 NATIONAL DEFINITIONS ......................................................................................................9 2.2 APPRAISAL IN TRANSPORT ...................................................................................................9
2.2.1 Major Scheme Appraisal ..................................................................................................9 2.2.2 Strategic Environmental Assessment.............................................................................10 2.2.3 RSS Sustainability appraisal..........................................................................................12
2.3 THE CASE FOR AN APPRAISAL OF SUSTAINABILITY IN TRANSPORT....................................12 2.3.1 Measuring sustainability ...............................................................................................12 2.3.2 Comparison with transport appraisal.............................................................................12
2.4 THE NEW SUSTAINABILITY APPRAISAL FRAMEWORK .........................................................14 2.4.1 Policy targets ..................................................................................................................15 2.4.2 Appraisal framework ......................................................................................................16
3 METHODOLOGY ....................................................................................................................23 3.1 STRATEGIC LAND-USE TRANSPORT INTERACTION MODEL ..............................................23 IN ADDITION TO THE STRATEGIC MODEL OUTPUTS WE WERE ALSO PROVIDED WITH DATA ON THE COSTS AND PROFILE OF COSTS OF THE INTERVENTIONS FOR EACH OF THE SCENARIOS. .................24 3.2 ACCESSION..........................................................................................................................24 3.3 SCENARIOS ..........................................................................................................................24
3.3.1 Scenario A ......................................................................................................................25 3.3.2 Scenario B.......................................................................................................................25 3.3.3 Scenario C.......................................................................................................................25
3.4 INDICATORS ........................................................................................................................25 4 RESULTS ....................................................................................................................................28
4.1 TRANSPORT IMPACTS..........................................................................................................28 4.2 SUSTAINABILITY APPRAISAL RESULTS ...............................................................................31
4.2.1 Economic performance....................................................................................................31 4.2.2 Carbon Dioxide...............................................................................................................37 4.2.3 Safety ..............................................................................................................................38
4.3 NATA FRAMEWORK RESULTS ...........................................................................................38 5 DISCUSSION ............................................................................................................................42
5.1 OPTION SELECTION ............................................................................................................42 5.2 VALUE OF SUSTAINABILITY APPRAISAL ..............................................................................43
5.2.1 National Transport Policy ..............................................................................................44 5.2.2 Regional Transport Strategy ..........................................................................................44 5.2.3 Local Transport Plans ....................................................................................................45 5.2.4 Scheme appraisal ............................................................................................................45
5.3 LIMITATIONS .......................................................................................................................45 5.3.1 Modelling tools employed ...............................................................................................46 5.3.2 Data Sources...................................................................................................................47
6 CONCLUSIONS .......................................................................................................................50 6.1 POLICY AND APPRAISAL.....................................................................................................50 6.2 CAPABILITIES ......................................................................................................................51 6.3 FURTHER WORK ..................................................................................................................52

6
7 ACKNOWLEDGEMENTS ......................................................................................................53 8 REFERENCES ............................................................................................................................54
Tables Table 1: Comparison of NATA objectives and SEA topics .................................11 Table 2: Indicators suite for sustainability appraisal ...........................................19 Table 3: Comparison of NATA and Sustainability Framework Indicators ......22 Table 4: Assessment of ability to measure indicators ..........................................27 Table 5: Total kms/day by scenario by year .........................................................29 Table 6: Daily Trips by mode (000s) by scenario 2006-2021................................30 Table 7: Scenario A Sustainability Appraisal ........................................................32 Table 8: Scenario B Sustainability Appraisal.........................................................33 Table 9: Scenario C Sustainability Appraisal ........................................................34 Table 10: Economy indicator for Scenarios B & C compared with Scenario A 35 Table 11: Scenario B AST..........................................................................................40 Table 12: Scenario C AST .........................................................................................41 Table 13: Appraisal Procedures and Scope for framework application............44 Figures Figure 1: Do-minimum and intervention assessment .........................................13 Figure 2: Do-minimum assessment versus policy target ....................................14 Figure 3: Car kms/day by scenario 2006-2021......................................................28 Figure 4: Public transport kms/day by scenario 2006-2021................................29 Figure 5: Amortization of investment costs for Scenario B.................................37 Figure 6: CO2 emissions by test and technology scenario ...................................48 Figure 7: Energy use by test and technology scenario.........................................48

7
1 Introduction
1.1 Definition of sustainability Sustainability or Sustainable development has been commonly defined as “Economic and social development that meets the needs of the current generation without undermining the ability of future generations to meet their own needs" (WCED, 1987). This definition brought together what is now known as the three pillars of sustainable development; economic development, social development and ecological development under one societal goal of sustainability. In 2005 the Department of Environment Food and Rural Affairs (DEFRA) recognised that “although the 1999 strategy stressed that these objectives had to be pursued at the same time, in practice, different agencies focused on those one or two most relevant to them. So a new purpose is needed to show how government will integrate these aims and evolve sustainable development policy” (DEFRA, 2005, p15). The revised principles are:
• “Living within environmental limits • Ensuring a strong, healthy and just society • Achieving a sustainable economy (Ibid., p16)
Principles of good governance and the responsible use of sound science are also put forward.
1.2 The rationale for a sustainability appraisal As can be evidenced from the policy documents described above, there is great concern about the long-term ‘sustainability’ of the transport sector both nationally and globally. Non-renewable resource use, climate change and habitat destruction are at the forefront of environmental concerns. The tension between transport investment to improve economic growth and standard of living on the one hand and subsequent environmental degradation on the other has been at the forefront of debate for at least the past 20 years (Banister, 2002). Increasingly social sustainability, and the degree to which transport interventions permit the development of new social structures and behaviours, or destroy, damage or impair the continuity of existing ones, is at the forefront of the policy debate (SEU, 2003; Lucas, 2004). Our review work concluded that whilst a mass of indicators relevant to sustainability exist, emphasis needed to be given to operationalising a sub-section of these indicators in a decision-making framework if sustainability

8
concerns were going to form part of the planning rather than the mitigation process (Marsden et al., 2005a). A key aspect of providing information to support policy relevant sustainable development decision-making is the need to understand fully the position and direction of change of indicators relative to a current or forecast future benchmark position. This requires a different approach to that typically adopted in transport appraisal where a scheme or strategy is compared with a hypothetical ‘do-minimum’ scenario. In the first stage of the project the principles of sustainability were examined along with the lists of indicators in use in transport and planning today. Through an evidence-led process of elimination a suite of 17 indicators was produced covering, to the extent felt practicably possible, the full range of sustainability concerns cutting across transport and land-use planning. An appraisal framework within which decisions on the relative sustainability of different policy options can be made was also developed. The framework considers the absolute impacts of plans and schemes as well as their relative merits.
1.3 Report Structure This chapter has provided a brief introduction to the aims of the project. More details can be found in Marsden et al. (2005). Chapter two provides a more detailed description of the appraisal framework and compares the framework to current English practice of the New Approach to Appraisal, implemented through the WebTag guidance. Chapter three sets out the methodology employed to implement the framework and describes the nature of the tools available to us. It also discusses methodological and data limitations that prevented the framework from being fully implemented. Chapter four presents the results of the analysis of three scenarios under both the proposed and the existing appraisal frameworks (set out in Chapter two). Chapter five discusses the implications of the use of different assessment frameworks. Chapter six reviews the limitations in the tools used and the approach taken and Chapter seven draws conclusions about the value of a new approach to assessing sustainability, the framework proposed and implications for future appraisal development.

9
2 Appraisal Frameworks This chapter reviews the existing and proposed new appraisal frameworks. These form the basis for the subsequent assessment of three alternative strategies in a major metropolitan area.
2.1 National Definitions The Treasury Green Book states that appraisals should:
“provide an assessment of whether a proposal is worthwhile, and clearly communicate conclusions and recommendations”
(HM Treasury, 2006) This is further interpreted by the Department for Transport to suggest that:
“Appraisal is the process of checking that value for money is achieved in delivering Government aims” (DfT, 2005)
An appraisal therefore should provide an assessment of the extent to which a Government intervention (policy, project or package of projects) is achieving the aims of Government and also some measure of whether the intervention is worthwhile.
2.2 Appraisal in Transport Appraisal of transport policies and projects exists at two main levels in England. Transport policies and programmes such as Local Transport Plans are developed in accordance with Department for Transport guidance, including monitoring and evaluation criteria (DfT, 2004). Such policies and programmes are also required to be subject to a Strategic Environmental Assessment (Ferrary and Crowther, 2005). Major schemes (individual projects costing over £5 million) are required to go through an individual project appraisal. Both processes are conducted under the principles of the New Approach to Appraisal (NATA) framework (DfT, 2005). Regional planning in the UK also requires the Regional Spatial Strategy (RSS) and, as a sub-set of the RSS therefore, the Regional Transport Strategy to be subject to a “sustainability appraisal”. This section summarises the content of the NATA framework, SEA directive and the RSS sustainability appraisal.
2.2.1 Major Scheme Appraisal NATA represents a significant change from the traditional Cost-Benefit Analysis (CBA) approach to assessing the total costs and benefits from a project. CBA concentrated on certain monetised costs and benefits: in
10
particular, quantifiable user benefits, implementation and operating costs and external environmental and safety costs. NATA assesses impacts in five overarching objectives of Economy, Environment, Safety, Accessibility and Integration and in so doing includes but expands on the CBA approach. It also further divides the five objectives into sub-objectives (e.g. under environment it considers noise, air pollution, landscape, townscape, biodiversity, heritage, water and greenhouse gases). The fundamental approach to the application of the appraisal has remained unchanged since its introduction. It involves the comparison of a project or series of policy interventions against a baseline or ‘do-minimum’ scenario. The results that are presented are relative to that baseline scenario with the exception of the environmental impacts marked with an asterisk in Table 1 which are relative to current conditions. Typically, the baseline scenario is based on National Road Traffic Forecasts (assuming continuation of current policy) and – at a local level – the implementation of current committed projects (often referred to as a ‘do-minimum’ scenario).
2.2.2 Strategic Environmental Assessment The requirements of European Directive 2001/42/EC (also known as the Strategic Environmental Assessment (SEA) Directive) mandate the consideration of environmental issues as an integrated part of the planning process for all plans and programmes (including Local Transport Plans). The aim of Strategic Environmental Assessment is “to provide a high level of protection of the environment and to contribute to the integration of environmental considerations into the preparation and adoption of plans with a view to promoting sustainable development” (Article 1, SEA Directive). An SEA should cover issues such as biodiversity, population, human health, fauna, flora, soil, water, air, climatic change, material assets and cultural heritage. An SEA should include secondary, cumulative, synergistic, short, medium and long-term permanent and temporary, positive and negative effects. Much of the process required by the SEA Directive already existed within NATA. However, enhancements to NATA requires additional work on a range of issues (DfT, 2005, TAG Unit 2.11). A comparison of the SEA topics and NATA objectives is shown in Table 1.

11
Table 1: Comparison of NATA objectives and SEA topics NATA Objective
NATA Sub-Objective SEA topic (SEA Directive, Annex If)
Noise Human health, population[1], inter-relationships
Local air quality Air, human health, population Greenhouse Gases Climatic factors Landscape* Townscape*
Landscape
Heritage* Cultural heritage including architectural and archaeological heritage
Biodiversity* Biodiversity, fauna, flora, soil[4] Water environment* Water
Environment
Physical fitness Human health, population Accidents Safety Security
Human health, population
Community severance Accessibility Access to the transport system
Population
Public accounts Business users and providers
Economy
Consumer Users Material assets[5]
Transport interchange Land-use policy
Integration
Other government policies n/a
Source:: Modified from: DfT (2005) Section 3.2.6
Footnote: 1. Population is interpreted broadly, referring to effects on people and quality of life. Many NATA indicators incorporate population. 2. The NATA local air quality indicator does not cover regional air quality, though guidance is given on its assessment. Where regional air quality is likely to be an issue, a local objective may be formulated. 3. Biodiversity also covers geological interests. 4. Soil is not explicitly covered by NATA sub-objectives, but is an underlying factor affecting landscape, heritage, biodiversity and the water environment. Where effects on soil are likely to be important, a local objective should be formulated. 5. Material assets are not explicitly covered by NATA sub-objectives, but are reflected in the money costs incurred when they are consumed. Where effects on material assets such as infrastructure, property and sterilisation of mineral or other resources are expected to be of particular importance, a local objective should be formulated.
The SEA process therefore provides enhanced consideration of environmental issues and their mitigation during the appraisal process. It does not however ensure that the sustainability of proposals is assessed, simply the environmental consequences.
The integration objective is really a means to delivering the primary objectives above and as such is not considered further in the comparison of appraisal regimes. In practical terms this means that measures that involve integration

12
of transport modes, of transport systems and land-use decisions and between transport and the health or education sectors (for example) that lead to the achievement of improved efficiency and environment would still score positively.
2.2.3 RSS Sustainability appraisal In addition, sustainability appraisal features as part of the revised approach to regional planning. This includes a Regional Transport Strategy which sets the context for local transport plans and for bringing forward infrastructure schemes of regional importance. “Under the Planning and Compulsory Purchase Act 2004, Sustainability Appraisal is mandatory for Regional Spatial Strategies (RSS), Development Plan Documents (DPDs) and Supplementary Planning Documents (SPDs)” (ODPM, 2004, p9). Regional Transport Strategies, part of the Regional Spatial Strategy, are therefore subject to a sustainability appraisal. The approach to appraisal is for a qualitative assessment of a range of impacts to be presented to decision-makers. A recent review of how sustainability appraisal has been applied to the Regional Transport Strategy in Yorkshire and the Humber suggested that despite the guidance, “a regional approach to sustainability, particularly with respect to transport, needs to be produced” (Ferrary and Crowther, 2005, p8). It appears that the framework and process that is set out through planning legislation does not provide a practical route forward to assessing the sustainability of transport strategies at a regional level. The framework proposed here may assist in this task.
2.3 The case for an appraisal of sustainability in transport
2.3.1 Measuring sustainability The Government’s definition of sustainability, like many others, sets out a series of principles that can be used to assess ‘social progress’. These include factors such as a strong economy, equal opportunities and respect for environmental limits. The process adopted within the Sustainable Development strategy is to identify indicators that can be used to assess, over time, whether trends are heading in the right direction.
2.3.2 Comparison with transport appraisal An indicator-led approach can be contrasted with that adopted in transport appraisal. In the NATA approach, much of the information given to the decision maker reflects the impact of an intervention compared with a ‘do-minimum’ or ‘do-nothing’ scenario. There is no guarantee that a course charted by a ‘do-minimum’ approach would lead to a sustainable outcome and, therefore, there can be no guarantee that any intervention compared to this ‘do-minimum’ would be sustainable either. This concept is demonstrated

13
below in Figure 1 with a hypothetical example of a measure of emissions from transport. The diagram shows that, at the assessment year, the do-minimum levels of emissions are substantially higher than the current year. The grey dot at the assessment year shows the level of emissions with the assessed policy package. As can be seen, the intervention shows a reduction compared with do-minimum. As such, a transport appraisal would show the cumulative savings of emissions between current year and assessment year compared to ‘do-minimum’ as this part of the environmental impact. Such an approach captures the benefits of an intervention compared to this hypothetical scenario in a clear manner.
Figure 1: Do-minimum and intervention assessment It is also clear from the diagram that the performance in the assessment year is worse (emissions are higher) than in the current year. The current transport appraisal approach presents the decision-maker with a positive outcome when the actual outcome suggests deterioration in environmental quality. Parallel examples could be demonstrated for measures of social and economic progress. There is a fundamental difference between an approach which examines progress compared to today’s levels and that which examines progress compared to a ‘hypothetical future’. Of course, the assessment of sustainability is not as simple as comparing performance in the future with current performance. Alongside every indicator of sustainability there must be an indication of the direction of change from the current position that constitutes progress. In some cases there is a scientific basis on which a particular end goal can be quantified (e.g.

14
number of days of moderate or high air quality), for others (e.g. increasing community participation) an end goal is less clear but a direction of change relative to past trends can be stated. In the case of the former, not only is it possible to state an end goal but it is often the case that time periods over which the government wishes to move to achieve these goals are set (targets). The policy relevant information is, in such cases, the difference between the assessment year value and the policy trajectory value as shown in Figure 2. Continuing the previous example, Figure 2 indicates a significant excess of emissions in the assessment year compared with the policy trajectory.
Figure 2: Do-minimum assessment versus policy target Whilst the end year position and direction of change are important, it may also be desirable for some indicators to consider the cumulative totals for the indicators over the period of assessment (for example, climate change gases where their effects may be felt for periods of 50 years). It may also be relevant to ensure that certain thresholds are not exceeded on the pathway to the assessment year (to ensure intra as well as inter generational equity).
2.4 The new sustainability appraisal framework This section summarises the development of the new sustainability appraisal framework. There are of course multiple views of what sustainability is and how it should be represented ranging from ‘weak’ to ‘strong’ sustainability (Kelly, 2005). Rather than furthering this debate, we attempted to operationalise current agreed definitions and to employ available indicators where possible to ensure that the approach is consistent with government policy and practicable (the current UK sustainable development strategy and the 2001 European Council of Ministers definition of sustainable transport).

15
Full details explaining the rationale for the choices made are in Marsden et al. (2005a). The first element of the indicator selection was to take a first principles look at the relationships between transport and the environment, economy and society, ensuring that all of the aspects described by the UK sustainable development strategy and ECMT definition were covered. So, for example, definitions of economic growth were reviewed and the different ways in which transport might impact on this listed. This provided a comprehensive basis for a more structured examination of the evidence base on these interactions. A review of the published evidence was therefore necessary to determine which relationships appeared robust and which less so. Only where a robust relationship exists can a meaningful indicator of progress be determined as only when the relationship is clear will it be clear what the measure of success will be. So for example, days when air pollution exceeds safe guidelines would be a clear measure well linked back to the transport emissions that contribute to them. Where a relationship was expected to exist but was not well proven approaches that have been adopted to act as proxies for the relationships were also examined and adopted if appropriate. Where such relationships are applied this should be as an interim measure whilst further research establishes (or otherwise) the primary relationship. To avoid duplication of existing indicator sets, where possible the indicators selected were chosen to correspond to indicators already in use. The use of existing indicators is also consistent with the existence of well established baseline trends and, in many instances, policies and targets that provide a clear indication of the expected direction of change of the indicator. Where no suitable indicators were available to match the relationships identified, new indicators were derived. The derivation and selection of indicators is a notoriously controversial task. In selecting indicators we adhered to best practice developed through the DISTILLATE Sustainable Urban Environment project (Marsden et al., 2005b). Three separate reports available through the project website (Marsden, 2005, Lucas and Brookes, 2005 and Kelly and Nellthorp, 2005) provide an expanded justification for the selection of each of the indicators proposed.
2.4.1 Policy targets For a suite of indicators to be of use in ex-ante decision-making, it is essential to know in what direction and, preferably, how quickly the organisation would like the indicators to change. It is this comparison of expected performance against stated goals that provides the assessment of any

16
potential sustainability gap. Alongside each of the indicators, information is given about the expected direction of change and any targets that can be adopted. For this project we have adopted government targets for environmental improvement, social progress and economic growth as the basis for defining ‘sustainable’ levels. There is a spectrum of views as to whether governmental targets are sufficiently stringent to constitute ‘sustainability’. It would be possible to apply this methodology to any set of targets proposed. However, the rationale for the development of this tool is to improve the consideration of sustainability issues in transport appraisal. The priority is that it is consistent with stated governmental aims and is therefore consistent with other aspects of the transport decision-making process. As environmental, economic or social policy evolves, the targets (and potentially indicators) that form part of this appraisal should also evolve. Targets and policy commitments that represent sustainable development are, by their nature cross-cutting over many departments. Where it is possible, specific departmental targets should be adopted (e.g. road traffic accidents as part of an overall desire to reduce accidental loss of life). In some cases this activity has not yet been completed, such as climate change, where the extent to which the Department for Transport should seek to reduce emissions has not yet been adequately separated out from the overall governmental target. In such cases the cross governmental target has been adopted in the short-term although the need to re-examine these is strongly stressed. In other cases, particularly with issues of social progress no attempt has been made to specify basic minimum standards of provision or to determine what an acceptable gap in affordability, for example, between different income quintiles is. A framework approach such as this puts the spotlight on these issues. It is perhaps not surprising that the social aspects of transport policy are poorly represented within current appraisal approaches whilst the end goals remain so fuzzy.
2.4.2 Appraisal framework One of the main purposes of this approach to appraisal is to provide decision-makers with a manageable set of information about the core indicators that capture progress towards sustainable development. The ultimate objective of a sustainable transport policy is to bring forward interventions that improve all aspects of each of the three pillars of sustainable development – the triple bottom line. For integrated policy packages, such as national transport policy, Regional Transport Strategies or Local Transport Plans, this would appear to be a fundamental requirement to demonstrate consistency with the principles of sustainable development.

17
Individual policies and projects are likely to demonstrate conflicts between indicators. However, where the overall strategy has been considered at a higher level it should be possible to determine whether particular schemes or packages are consistent with the contribution anticipated at the higher level. So for example, it should be possible to determine what the total contribution of the Highways Agency’s programme of works is to the total national policy and for the Highways Agency to work to these constraints. Equally, different local authorities may contribute different amounts to each indicator at a regional level but the contributions should be identified as constraints within which their packages should be designed. Several approaches could be applied to the indicators to resolve the conflicts between indicators that are not consistent with sustainable trends. Multi-criteria analyses with weightings applied to each indicator have been adopted in some parts of Europe as a means of developing an overall index of sustainability that must be improved (e.g. Lautso et al., 2004). The approach proposed here is to identify whether each indicator is in line with a sustainable trend and to allow the decision-maker to make an informed choice based on the information in front of them. This provides a transparent account of the extent to which different factors have been considered but does not artificially constrain the decision-maker. A review of decisions taken during the 1998 Roads Review found that decision-makers used a wide range of the NATA criteria and that decisions were not dominated by sole use of the cost-benefit figures (Mackie and Nellthorp, 2000), which gives some scientific support to the view that decision makers working in the field of transport project/planning decisions with many options and limited budget, can make consistent decisions based on multi-objective data. Table 2 shows the summary list of indicators and Table 3 the comparison between this framework, NATA and SEA. There are two key areas of difference between the NATA indicators and those put forward within this project: 1. The sustainability framework covers the efficiency of environmental
resource use which is not reflected in NATA. Pearce (2000) suggests that the efficiency of resource use is a common goal across proponents of both weak and strong sustainability approaches.
2. The coverage of social issues is far more comprehensive within the framework than is currently the case within NATA. These indicators are only meaningful when used as direct measures of change (rather than comparators with do-minimum figures).
It is worth noting that NATA also includes the integration indicators which we have discounted (Section 2.2.2) and measures of journey ambience, increased option values and physical fitness. Journey ambience should be captured through actual (rather than theoretical) accessibility but current approaches are someway off from being able to achieve this. Option values are again partly covered by accessibility although the degree to which these

18
are really reflected warrants further research. The ability of current strategic models to adequately capture walking and cycling behaviour is discussed further in Section 5. We are not confident that these are currently forecastable with confidence. We also highlight in the table the role that wider economic impacts have in NATA in the form of Economic Impact Assessments. There is no well developed science for predicting the economic impacts of transport interventions as noted earlier. Stakeholders suggested to us that there may be many types of economic impacts that could not be captured through our proposed short-term approach. We believe that in most cases, the majority of the benefits would be well represented by our approach but cannot rule out the need for further assessments being required (e.g. there have been recent advances in estimating agglomeration benefits from transport).

19
Table 2: Indicators suite for sustainability appraisal Environment Area of Progress Indicator of Progress Disaggregation Direction of change
Total CO2 emissions - Down – 20% cut by 2010 compared to 2000 levels and 60% by 2050
Cumulative Total CO2 emissions - Down compared with existing annual rate played forward
Pollutant Absorption Capacity
Total NOx emissions
- Down – UK total to be 1,167 thousand tonnes by 2010 EU National Emissions Ceiling Directive
Total non-renewable energy by all transport
- Down
Energy use per person-trip Personal travel only Down
Resource Efficiency
Energy use per tonne-km Freight only Down Direct impacts on health
Exceedences of air quality objectives (NOx and/or PM10)
At risk groups (e.g. % of people suffering Chronic Heart Disease)
Down (standards set for 2005 and 2010)
Number of residences exposed to aircraft noise above 57 LAeq,T
Down Local quality of life
Number of residences exposed to noise above 55dBA
Down
Environmental Capital Qualitative environmental capital score (7 point scale)
Landscape Townscape Heritage of Historic resources Biodiversity Water Quality
Cumulative impact of policies neutral or beneficial

20
Economy Area of Progress Indicator of Progress Disaggregation Direction of change Standard of Living Real GDP per Capita based on:
• In the short term – proxied by net benefits measured in the transport sector using WebTAG methods
• Long term aspiration - Direct modelling of GDP using multi-sectoral models
Business User Benefits Consumer User Benefits Reliability Safety* Operator Gains Public Finance Balance
Increasing (strictly Non-decreasing)
Society Area of Progress Indicator of Progress Disaggregation Direction of change Poverty Average real cost of journey to key
destinations By car and public transport
Reduced ratio between car-based and public transport options
Accessibility Weighted journey times1 to: • key centres of employment; • primary, secondary & further
educational facilities; • primary health care provider2 &
general hospital3; • key food shops
By car and public transport4
Reduced ratio between car-based and public transport options
1 It may be advisable to also include cost of journey to these destinations with some indication of costs over e.g. £1 being non-affordable for low-income households and highlighting disparities in cost between car and public transport 2 Doctor’s surgery, health centre, NHS walk-in centre 3 Hospital offering A&E and other key services 4 Can also be disaggregated by particular relevant groups (e.g. health care facility by % of people suffering Chronic Heart Disease; primary school by % of children under 11 years; etc.) and also by housing tenure (the latter may be particularly in rural areas where low-income households are more likely to have higher levels of car ownership).

21
Killed and Seriously Injured Disaggregate by index of deprivation, teenage deaths by driving and child pedestrian deaths
Reduce number KSI by 40% (50% child KSI) by 2010 compared with the average for 1994-98 plus reduced disparity between social groups
Safety
Recorded incidences of crime on public transport
None Down overall and improved perceptions of safety
Walkability Percentage of residents living within 1000m or 15-minute ‘safe walk’5 to key destinations (e.g. health, educational, leisure and cultural facilities, food shops, post office, etc.)
Can be disaggregated by particular relevant groups (e.g. primary school by % of children under 11 years).
Up
Housing Real lowest 10% value of house prices within x minutes (based on average local journey times to employment) of:
a) The town centre and b) Key centres of employment
Disaggregated by public transport and car
Down
5 Determined by an official safe route. A safe cycle route to these destinations could also be included

22
Table 3: Comparison of NATA and Sustainability Framework Indicators NATA Objective NATA Sub-Objective Sustainability Framework SEA topic
Noise Noise exposure Human health, population, inter-relationships
Local air quality Air quality exceedences Air, human health, population Greenhouse Gases Annual and cumulative CO2 Climatic factors Landscape Landscape Townscape Townscape
Landscape
Heritage Heritage Cultural heritage.. Biodiversity Biodiversity Biodiversity, flora, fauna, soil Water environment Water environment Water Physical fitness Walkability Human health, population Total non-renewable energy by all transport Material assets Energy use per person-trip Material assets Energy use per tonne-km Material assets
Environment
Total NOx emissions Biodiversity, flora, fauna, soil, water Accidents Accidents Safety Security Public transport security
Human health, population
Community severance Access to the transport system
Weighted journey times (walk, wait, travel) to key destinations
Average cost of journeys Cost/km car:Cost/km public transport
Accessibility
Lowest 10% value of house prices within x minutes (based on average local journey times to employment) of:
The town centre and Key centres of employment
Population
Public accounts Business users and providers Consumer Users Improve reliability
Net benefits measured in the transport sector using WebTAG methods or (in future) by modelling GDP effects.
Economy
Wider economic impacts
Material assets

23
3 Methodology The project aimed to test the implementation of the framework on real policy scenarios. Rather than developing any new modelling capabilities, the project sought to obtain access to existing state-of-art modelling packages. This would ensure that the assessment of the sustainability impacts and the ability of current models to cover the range of impacts of interest would be grounded in current practice. This enables some commentary on our ability to assess the sustainability of transport strategies and policies to be made. The project was granted access to the results of three hypothetical strategies for a major metropolitan area in England. These three scenarios were used as the basis for testing the framework and comparing the results to NATA. This section explains the scenarios tested and how the data used in the assessment framework was captured.
3.1 Strategic Land-Use Transport Interaction Model The metropolitan area employs a strategy planning model that was commissioned in 1996. This model was designed to forecast the implication of various transport policies and is based on the DELTA-START modelling suite. The model allows for adjustments to choice of trip frequency, destination, mode and time of travel and location of business and residential activities. Actors in the model can choose to expand or contract their activities, change location (home and business) in response to changes in accessibility and environmental quality. Public transport operators can also respond to patronage changes via fare, frequency and vehicle size changes. The model is spatially aggregate with 47 zones covering the metropolitan area. It included a high degree of detail for trip purposes (10) and modes of travel (8). Freight trips, while included in this model remain at a constant growth rate from 1991 and are not dealt with in target interventions. This model output was given by the metropolitan area as a basis for calculating the sustainability indicators. Spreadsheets relating to the flow for each zone, average speed, trips by mode, trip length by mode and also KM by mode form the basis of our data analysis. The model has a 1991 base year and runs for each scenario provided data for years 1991, 1996, 2001, 2006, 2011, 2016, and 2021. Our chosen sustainability appraisal year is 2021. Other data such as accidents, environmental quality and accessibility is available for 2005 so 2006 was considered as the base year for the sustainability appraisal.

24
In addition to the strategic model outputs we were also provided with data on the costs and profile of costs of the interventions for each of the scenarios.
3.2 Accession The land-use transport interaction model provided the majority of outputs for us to employ. A number of the social indicators were calculated using the Accession™ software suite. This software combines an access database of all public transport stops, services and timetables with GIS mapping capabilities. This program was commissioned by DfT to provide a means of auditing accessibility by investigating the links between transport provision and participation in key activities by individuals or groups. Accession™ was borne out of the establishment of ‘accessibility planning’. “Accessibility planning is a process that aims to promote social inclusion by helping people from disadvantaged groups or areas access jobs and essential services. It was introduced by "Making the Connections", the February 2003 Social Exclusion Unit report on transport and social exclusion. 'Making the Connections' emphasised that accessibility is not just about transport and can be influenced by decisions on the location, design and delivery of other services and by people's perceptions of personal safety.” (DfT, 2003) Accession™ allows for location details to be assigned to a centre line road network of the area and accessibility via all modes to specified destinations or from a set of origins to be calculated. Geo-demographic data can be joined to origin points, thus giving a picture of what classes of the population are affected by poor accessibility to basic services such as food shops, schools, GPs and centres of employment. Results such as contour maps and average journey times to destinations give the user an overview of the scale of journey times. 2006 data on population characteristics, service locations and public transport provision were provided. Assumptions were made about changes to public transport on the basis of the data provided for each of the three scenarios.
3.3 Scenarios Three different model runs were provided as the basis for our analysis. The three runs contained differing degrees of public transport investment and demand management and, as such, provide a reasonably realistic panorama of policy futures. However, in selecting any three scenarios they cannot be fully representative nor do they reflect preferred policy paths.

25
3.3.1 Scenario A The first test, Scenario A represents a baseline scenario with the forecast of full implementation of the Local Transport Plan 2 programme and implementation of all committed major schemes. The main implementation of this was modal constant adjustments made to represent information and quality investment of -1.0 minutes for bus, -1.5 minutes for rail, -.25 minutes for walk and -0.5 for cycle. This test also included low assumptions on the effectiveness of behavioural change measures (such as car sharing and teleworking schemes on commuting trips and home shopping). These were implemented via direct adjustments to the highway travel demand matrices and vehicle occupancy to approximate impacts on car use.
3.3.2 Scenario B Scenario B represents all of the content of Scenario A plus major public transport investment from 2006 onwards. Major investments in bus and rail frequency and capacity were made in 2011 with additional increases in rail capacity in 2016. The modal constant adjustments implemented in the baseline at 2011 were increased by 50% at 2011 to reflect increased expenditure in Public Transport in four priority corridors. In 2016, these improvements were extended to the eleven other transport corridors. In addition an extension of current light rail was made, the addition of a tram-train and a core busway network were added from 2011 onwards.
3.3.3 Scenario C Scenario C includes all of the public transport investment plus behaviour change as Scenario B but also includes an area-based charging scheme. All vehicles within the intermediate Ring Road formed around the Regional Centre would be required to pay £4 per day in 2016, rising to £5 per day in 2021 (1991 prices). Households living within the charging area were exempt from paying the full charge and paid 10% of the full charge.
3.4 Indicators Full details of how each of the indicators was calculated can be found in Annex A to this report. This sets out the assumptions made and the supporting data sources (e.g. emissions inventories) used to calculate the indicators. The full suite of indicators (Table 2) was proposed based on a combination of rationale and practicality. Despite this, as the work progressed, it was found that the data to calculate and forecast many of the proposed social indicators and some environmental indicators was either not available in a suitable format or not included in current modelling tools. The table below outlines

26
which indicators we were able to make an estimate of from the original indicator suite. The implications of these difficulties for the framework are discussed further in Chapter 6.

27
Table 4: Assessment of ability to measure indicators Environment Indicator Success
= yes; = partial; =not possible with data set (see annex)
Total CO2 emissions
Cumulative Total CO2 emissions Pollutant Absorption Capacity
Total NOx emissions Total non-renewable energy by all transport
Energy use per person-trip
Resource Efficiency
Energy use per tonne-km
Direct Impacts on Health
Exceedences of air quality objective (NOx and/or PM10)
Number of residences exposed to aircraft noise above 57LAeq, T
Local Quality of life
Number of residences exposed to noise above 55dBA
Environmental Capital
Qualitative environmental capital score for: Landscape, Townscape, Heritage of Historic resources, Biodiversity and Water Quality.
Economy
Standard of Living
Real GDP per Capita based on net benefits measured in the transport sector.
Society
Poverty Average real cost of journey to key destinations
Accessibility Weighted journey times to: Key centres of employment; primary, secondary and further educational facilities, primary health care provider and the general hospital, key food shops
Killed and Seriously injured Safety
Recorded incidences of crime on public transport
Walkability
Percentage of residents living within 1000m or 15-minute ‘safe walk’ to key destinations.
Housing
Real lowest 10% value of house prices within x minutes (based on average local journey times to employment) of: a) the town centre b) Key centres of employment.

28
4 Results This Chapter presents the headline changes to traffic conditions produced by the strategic model for each of the three scenarios. The appraisal tables for the new framework and the NATA framework are then provided.
4.1 Transport Impacts The model produces results consistent with the expectations of changes in vehicle kilometre and trip levels. In all of the scenarios trips and vehicle kilometres are increasing in line with expected increases in economic prosperity. Figures 3 and 4 show the comparison of km by car and public transport modes respectively in the four model assessment periods from 2006 to 2021. Table 5 summarises the total vehicle kms and Table 6 trips made.
28.00
29.00
30.00
31.00
32.00
33.00
34.00
2006 2011 2016 2021Year
Car
Km
s (M
/day
)
A B C
Figure 3: Car kms/day by scenario 2006-2021 Scenario A has the highest number of motorised kms, largely as a result of having more car kilometres than the other two scenarios. Total trips are however lowest in this scenario, reflecting in particular the greater attraction of public transport in Scenarios B and C after the investments in 2011. Total trips from scenario C are only slightly above those from scenario A as a result of the introduction of road pricing. Total walk and cycle trips and walk and cycle trips as a percentage of total trips are higher under Scenario A, again reflecting some abstraction of walk and cycle journeys to public transport.

29
0
100
200
300
400
500
600
2006 2011 2016 2021Year
Vehi
cle
kms
(000
s)
Bus
Rail
LRT
A B C
Figure 4: Public transport kms/day by scenario 2006-2021 Table 5: Total kms/day by scenario by year Scenario Year Car kms
(M) Public
transport kms (000s)
Freight kms (M)
Total kms (M)
2006 30.28 487.68 13.67 44.44 2011 31.03 459.46 14.43 45.92 2016 32.11 466.69 15.11 47.68
A
2021 33.23 514.35 15.81 49.55 2006 30.28 487.68 13.66 44.44 2011 30.98 535.39 14.45 45.97 2016 30.70 589.03 15.32 46.61
B
2021 31.76 640.18 16.02 48.42 2006 30.28 487.68 13.66 44.44 2011 30.98 535.39 14.45 45.97 2016 29.98 589.83 15.30 45.86
C
2021 30.90 640.98 15.99 47.54

30
Table 6: Daily Trips by mode (000s) by scenario 2006-2021
Scenario Year Car trips
Rail trips
Walk Trips
Cycle trips
Bus trips
LRT Trips
Freight Trips
Total Trips
2006 8371 287 1457 118 2482 143 966 13824 2011 8573 320 1380 111 2505 150 1017 14055 2016 8870 343 1360 110 2492 172 1062 14408
A
2021 9172 359 1359 111 2494 188 1110 14794 2006 8371 287 1457 118 2482 143 966 13824 2011 8551 324 1362 109 2485 289 1017 14137 2016 8801 353 1329 107 2502 386 1062 14540
B
2021 9086 371 1327 107 2518 430 1110 14949 2006 8371 287 1457 118 2482 143 966 13824 2011 8551 324 1362 109 2485 289 1017 14137 2016 8533 382 1354 109 2642 409 1062 14491
C
2021 8781 397 1353 110 2676 445 1110 14872 The impact of the different interventions on the average speed across all zones is shown below in Figure 5. There is a decline in the average speed across the whole metropolitan area. The decline is more marked, as would be expected from the trip and vehicle km statistics, for the baseline scenario A than for the more proactive public transport scenario B. Scenario C with road user charging provides for only a small decline in overall average speed.
26.5
27.0
27.5
28.0
28.5
29.0
29.5
30.0
30.5
31.0
31.5
2006 2011 2016 2021Year
Ave
rage
Spe
ed (k
m/h
r) A
M P
eak
A B C
Figure 5: Average Speed changes for scenarios 2006-2021 At this stage it is worth acknowledging that the assumptions surrounding freight kilometres and surrounding walk and cycle trips are limited. No investments in walk and cycle are included and the trip totals therefore reflect changes in their attractiveness as a result of interventions in other modes. Nonetheless, a slight decline in walk and cycle without further intervention remains a possible policy outcome. The freight model does not include a

31
detailed set of assumptions about commodity flows and business development within the area and as such is a crude representation of freight changes in response to economic growth and other changes on the transport network. Given the comparatively high emission rates of HGVs relative to private cars this can substantially impact on the environmental outcomes.
4.2 Sustainability Appraisal Results As outlined in Section 2.3, the sustainability appraisal framework presents the results of each of the three scenarios relative to current year levels (2006) or, where available, future policy targets. A separate appraisal table is produced for each scenario and these are shown in Tables 7 to 9. The table lists the objective and indicator, provides a description of qualitative impacts and quantitative measures and summarises these impacts with an assessment as either positive, neutral or negative. This is broadly consistent in format with NATA although the NATA framework applies a seven point qualitative assessment scale for a number of indicators (see Section 4.3). The principle differences between the scenarios are those of economic performance, carbon dioxide emissions and safety impacts. Other differences between the scenario outcomes exist, but not to the extent where the qualitative score is affected. Air quality exceedences for example are reduced across all three scenarios for example such that the level of difference between the scenarios is of less importance. Energy use per trip does vary across the scenarios but by a relatively small amount (0.1MJ/trip) compared to the overall reduction (around 0.9MJ/trip) and all would therefore score positive as no target exists for energy efficiency of journeys.
4.2.1 Economic performance The economy indicator enables us to give a rough estimate of the impact on the economy in the year 2021. We find that the policy tests can be expected to have a positive effect on the economy in year 2021, roughly in the order of £110-150 million. Note that this is a proxy indicator, and we would advise revisiting it if and when more targeted models are developed for the municipality’s economy. Table 10 shows our findings.

32
Table 7: Scenario A Sustainability Appraisal OPTION DESCRIPTION Appraisal Year
Test A Proposed Baseline test for LTP2 with added behavioural change. Widening of the M?0 J? to J?. 33% increase in capacity on the B to A LRT line. Implementation of Quality Bus Corridors for 30% of buses leading to reliability and speeds improvements. Information and quality investment improvements for bus, cycle, walk and rail. Car sharing and teleworking schemes on commuting trips. Home shopping on shopping trips.
2021
OBJECTIVE QUALITATIVE IMPACTS QUANTITATIVE MEASURE ASSESSMENT
Total NOx Emissions NOx emissions falling in line with technological improvements 2006= 47 tonnes; 2021 = 25 tonnes positive
Total CO2 emissions Total traffic levels rising by 12% 2006=11651; 2021=12062 Levels taken from Webtag
negative
Cumulative Total CO2 emissions
Emissions falling 186215 Tonnes (calculated 5 year rates assumed for intermediate years between model runs) 186416 Tonnes (existing annual rate played forward)
neutral
Energy use per person-trip
levels slightly falling 2006=6.71; 2021= 5.78 in MJ/trip positive
Energy use per tonne-km levels slightly increasing 2006=136.54; 2021=137.41 in MJ/TonneKM negative
Noise High levels of traffic noise levels along the motorway network and certain sections of the trunk road network. No mention of noise reducing road materials in plan.
N/A N/A
Exceedences of Air quality objectives (NOx)
Air quality management plan calls for reductions in 2005 to be about 30% in town centres and central urban locations to meet guidelines.
2001=7days; 2006=4 days; 2021=0 days positive
Landscape No significant impact N/A neutralTownscape No significant impact N/A neutralHeritage of Historic Resources
No significant impact N/A neutral
Bio-diversity No significant impact N/A neutralWater Environment As road traffic increases the risk of larger amounts of pollutants entering watercourses also
increasesN/A neutral
ECO
NO
MY
Stan
dard
of
Liv
ing Net Benefits Greater Metropolitan area economy forecast to grow slightly faster than the UK mean over theis
perios (2006-2021)2.1% per annum over the next dacade (GVA per capita) and in total +34 to +44% by 2021
positive
Pove
rty Average real cost of
journey to key destinations
no data available
Acc
essi
bilit
y Weighted Journey times to Key destinations by Car and public transport.
Accessibility is already quite good for area. Conditions for car drivers deteriorate slightly with congestion. Public transport conditions slightly improved
average journey times PT/Car 2021:: 2006 Employment= 39/23: 39/19 Supermarket =40/24 : 40/20; GP= 40/23: 40/20;Primary= 40/24: 40/21; Secondary= 39/24 :42/21; FE= 41/24: 41/21
neutral
Slight Casualties Estimate of change in accident rate given increase in flows to keep casualties constant (Current rate =3.40e-08)
-16% change in accident rate to keep KSI constant to 2006
neutral
Killed and Seriously Injured
Estimate of change in accident rate given increase in flows to keep KSI constant (Current rate =.000369667)
-46% change in accident rate to keep KSI constant to 2006
neutral
SOC
IETY
Safe
tyPo
lluta
nt A
bsor
ptio
n C
apac
ityR
esou
rce
Effic
ienc
y
Dire
ct
impa
cts
on
Envi
ronm
enta
l C
apita
l
ENVI
RO
NM
ENT

33
Table 8: Scenario B Sustainability Appraisal OPTION DESCRIPTION Appraisal Year
Test B This test represents major PT investment from 2006 onwards with previous behaviour change measures. Bus and Rail service capacity and frequency improvements; extension of a LRT system, a tram train implementation as well as a bus way network.
2021
OBJECTIVE QUALITATIVE IMPACTS QUANTITATIVE MEASURE ASSESSMENT
Total NOx Emissions NOx emissions falling in line with technological improvements 2006= 47 tonnes; 2021 = 27 tonnes positive
Total CO2 emissions Total traffic levels rising by 9% 2006=11640; 2021=12208 Levels taken from Webtag
negative
Cumulative Total CO2 emissions
Emissions falling 188204 Tonnes (calculated 5 year rates assumed for intermediate years between model runs) 186240 Tonnes (existing annual rate played forward)
slightly negative
Energy use per person-trip
levels slightly falling 2006=6.68; 2021= 5.82 in MJ/trip positive
Energy use per tonne-km levels slightly increasing 2006=136.54; 2021=139.29 in MJ/TonneKM negative
Noise High levels of traffic noise levels along the motorway network and certain sections of the trunk road network. No mention of noise reducing road materials in plan.
N/A N/A
Exceedences of Air quality objectives (NOx)
Expansion of PT, tram lines especially have no street level pollutants. 2001=7days, 2006=4 days 2021=0 days positive
Landscape No significant impact N/A neutral Townscape No significant impact N/A neutralHeritage of Historic Resources
No significant impact N/A neutral
Bio-diversity No significant impact N/A neutralWater Environment As road traffic increases the risk of larger amounts of pollutants entering watercourses also
increasesN/A neutral
ECO
NO
MY
Stan
dard
of
Liv
ing Net Benefits Benefits to transport users (£186m) and operators (£39m) outweigh costs to government
(£111m)£114 Million benefit compared with baseline scenario (A)
positive
Pove
rty Average real cost of
journey to key destinations
No Data available
Acc
essi
bilit
y Weighted Journey times to Key destinations by Car and public transport.
Accessibility is already quite good for area. Conditions for car drivers deteriorate slightly with congestion. Public transport conditions slightly improved
Average journey times PT/Car 2021::2006 Employment= 39/22 :: 39/20 Supermarket =40/22::40/20; GP= 40/23::40/20 ;Primary= 40/23::40/21; Secondary= 39/23::42/21; FE= 41/23::41/21
neutral (slight improvement from baseline)
Slight Casualties Estimate of change in accident rate given increase in flows to keep casualties constant (Current rate =3.40e-08)
-12% change in accident rate to keep Slight casualties constant to 2006
neutral
Killed and Seriously Injured
Estimate of change in accident rate given increase in flows to keep KSI constant (Current rate =.000369667)
-43% change in accident rate to keep KSI constant to 2006
neutral
SOC
IETY
Safe
tyPo
lluta
nt A
bsor
ptio
n C
apac
ityR
esou
rce
Effic
ienc
y
Dire
ct
impa
cts
on
Envi
ronm
enta
l C
apita
l
ENVI
RO
NM
ENT

34
Table 9: Scenario C Sustainability Appraisal OPTION DESCRIPTION Appraisal Year
Test C This test is as B (PT investment plus behaviour change) but also includes an area-based charging scheme. All vehicles within the intermediate Ring Road formed around the Regional Centre would be required to pay £4 per day in 2016, rising to £5 per day in 2021 (1991 prices). Households living within the charging area were exempt from paying the full charge and paid 10% of the full charge.
2021
OBJECTIVE QUALITATIVE IMPACTS QUANTITATIVE MEASURE ASSESSMENT
Total NOx Emissions NOx emissions falling in line with technological improvements 2006= 47 tonnes; 2021 = 26.7 tonnes positive
Total CO2 emissions Total traffic levels rising by 7% 2006=11640; 2021=12075 Levels taken from Webtag
negative
Cumulative Total CO2 emissions
Emissions rising 187501 Tonnes (calculated 5 year rates assumed for intermediate years between model runs) 186242 Tonnes (existing annual rate played forward)
negative
Energy use per person-trip
Levels are slightly decreasing 2006=6.68; 2021= 5.72 in MJ/trip positive
Energy use per tonne-km Levels are slightly increasing (more than baseline) 2006=136.54; 2021=139.03 in MJ/tonne KM negative
Noise High levels of traffic noise levels along the motorway network and certain sections of the trunk road network. No mention of noise reducing road materials in plan.
N/A N/A
Exceedences of Air quality objectives (NOx)
Congestion charging can help to eliminate slow/idling traffic in built up areas thus improving traffic speeds and pollution emissions.
2001=7 days, 2006=4 days, 2021=0 days positive
Landscape No significant impact N/A neutral Townscape No significant impact N/A neutralHeritage of Historic Resources
No significant impact N/A neutral
Bio-diversity No significant impact N/A neutralWater Environment As road traffic increases the risk of larger amounts of pollutants entering watercourses also
increasesN/A neutral
ECO
NO
MY
Stan
dard
of
Liv
ing Net Benefits Toll revenue (£417m), user time savings (£344m) and gains to operators (£71m) outweigh toll
collection and other costs to gernment (£256m) and increased motoring costs (£441m)£151 million benefit compared with baseline scenario (A)
positive
Pove
rty Average real cost of
journey to key destinations
Charging scheme will increase cost of journey for users.
Acc
essi
bilit
y Weighted Journey times to Key destinations by Car and public transport.
Accessibility is already quite good for area. Charging scheme can improve journey times by reducing congestion on roads.
Average journey times PT/Car 2021::2006 Employment= 39/21:: 39/20 Supermarket =40/22::40/20; GP= 40/22::40/20 ;Primary= 40/22::40/21; Secondary= 39/22::42/21; FE= 41/22::41/21
neutral (slight improvement from baseline)
Slight Casualties Estimate of change in accident rate given increase in flows to keep casualties constant (Current rate =3.40e-08)
-9.6% change in accident rate to keep Slight casualties constant to 2006
slightly beneficial (requires the least change in rate)
Killed and Seriously Injured
Estimate of change in accident rate given increase in flows to keep KSI constant (Current rate =.000369667)
-42% change in accident rate to keep KSI constant to 2006
neutral
SOC
IETY
Safe
tyPo
lluta
nt A
bsor
ptio
n C
apac
ityR
esou
rce
Effic
ienc
y
Dire
ct
impa
cts
on
Envi
ronm
enta
l C
apita
l
ENVI
RO
NM
ENT
35
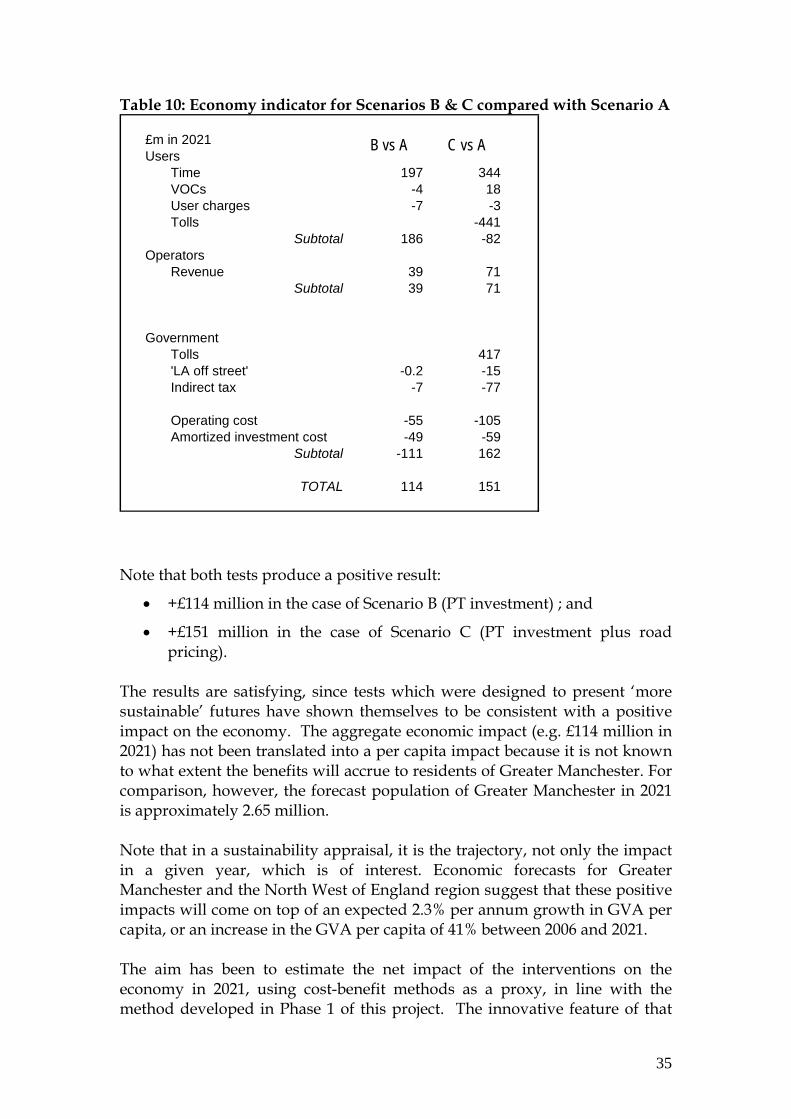
Table 10: Economy indicator for Scenarios B & C compared with Scenario A
£m in 2021 JF JHUsers vs Baseline vs Baseline
Time 197 344VOCs -4 18User charges -7 -3Tolls -441
Subtotal 186 -82Operators
Revenue 39 71Subtotal 39 71
GovernmentTolls 417'LA off street' -0.2 -15Indirect tax -7 -77
Operating cost -55 -105Amortized investment cost -49 -59
Subtotal -111 162
TOTAL 114 151
Note: JF = PT investment; JH = PT investment and road pricing Note that both tests produce a positive result:
• +£114 million in the case of Scenario B (PT investment) ; and
• +£151 million in the case of Scenario C (PT investment plus road pricing).
The results are satisfying, since tests which were designed to present ‘more sustainable’ futures have shown themselves to be consistent with a positive impact on the economy. The aggregate economic impact (e.g. £114 million in 2021) has not been translated into a per capita impact because it is not known to what extent the benefits will accrue to residents of Greater Manchester. For comparison, however, the forecast population of Greater Manchester in 2021 is approximately 2.65 million. Note that in a sustainability appraisal, it is the trajectory, not only the impact in a given year, which is of interest. Economic forecasts for Greater Manchester and the North West of England region suggest that these positive impacts will come on top of an expected 2.3% per annum growth in GVA per capita, or an increase in the GVA per capita of 41% between 2006 and 2021. The aim has been to estimate the net impact of the interventions on the economy in 2021, using cost-benefit methods as a proxy, in line with the method developed in Phase 1 of this project. The innovative feature of that
B vs A C vs A

36
method is the use of amortization to convert investment costs to an annual capital charge, so enabling a ‘snapshot’ test of economic impact in a particular year – e.g. 2021. Amortization of investment costs was undertaken as follows. The standard amortization formula was applied individually to each year’s investment costs, over the period 2008-2016 during which investment would occur.
( )( ) 11
1−+
+= n
n
A rrrCC
where C is the investment to be amortized; r is the interest rate; n is the time period in years; CA is the annual amortized amount. The interest rate chosen was the Bank of England repo (base) rate, currently 4.50%. This represents the minimum risk-free rate at which Government can borrow funds, although commercial borrowers would pay a higher rate. Amortization has something is common with discounting in conventional appraisal, however, note that in this case the total amortized amount will be larger than the initial amount, C, in the same way that the total repayments and interest on a mortgage are greater than the sum borrowed. The period n is set at 60 years, starting from the opening of the first main block of investment in 2011, matching the typical appraisal period for transport infrastructure assets. Some of the preliminary expenditures are, as a result, amortized over slightly longer than 60 years. The appraisal period is broadly consistent with the conventions in WebTAG, although the use of amortization differs from the WebTAG which uses discounting – in general, we would expect our approach to be slightly less generous to investment projects than the current WebTAG approach. Figure 5 shows the effects of amortization on the time profile and level of investment for scenario B. The key year is 2021, for which these calculations provide an indicative capital charge of £49 million. Having estimated a capital charge for the year 2021, it remains to calculate the other items of costs and benefits relevant to the economy indicator. Ballpark estimates of the additional operating costs were provided, and – like the investment costs – these come with the following caution: “These are only estimates of investment and operating costs. The sources are the metropolitan area transport executive and previous research on congestion charging. These estimates have not been verified, and as such should be interpreted as ‘ball-park’ estimates” (Personal Communication, 2006). The user benefits, operator revenues and tax effects have been the subject of modeling work using the

37
Amortization of investment costs for Scenario [email protected]% Bank of England repo rate
0
20
40
60
80
100
120
140
2000 2020 2040 2060 2080
Year
£mill
ion
Investment
Amortizedinvestment
metropolitan area sketch planning model and valuation using TUBA. We have made minor alterations to the way the results are presented, but have not changed the results. Figure 5: Amortization of investment costs for Scenario B
4.2.2 Carbon Dioxide For carbon dioxide emissions, none of the scenarios is able to provide a reduction in CO2 from 2006 levels. This reflects the increase in vehicle kilometres over the period and the relatively conservative assumptions about vehicle technology that WebTAG guidance provided.6 Of the three scenarios, Scenarios A and C perform broadly similarly whilst the high public transport investment scenario alone shows a more substantial increase in CO2 levels. The earlier comments on the influence of freight emissions on the total remain pertinent here. There is some evidence that the charging in Scenario C has a substantial impact on behaviour (evidenced by the reductions in traffic levels between 2011 and 2016). However, the small increase in charges between 2016 and 2021 (from £4 to £5) quickly led to trends reversing back to the direction before charging was introduced.
6 Webtag guidance has been updated since this analysis was conducted to provide a more realistic (in the view of the authors) forecast of changes to vehicle efficiency and therefore CO2 emissions over the period. Within this project we tested several technology assumptions as discussed in Section 5. Webtag is currently more akin to our ‘current trend’ assumptions as presented.

38
As none of the pathways show progress towards any of the domestic CO2 targets they must be scored as negative. Of course, there is as yet no target for the transport sector, much less for a metropolitan area. However, we feel confident in stating that the outcomes reported are not ones that represent progress.
4.2.3 Safety For safety, an assessment was made of the extent to which the accident rates would need to change (per km) to satisfy current and future safety targets. The different traffic levels that occur with each scenario lead to this difference. We were not able to incorporate a speed effect and accept that this is only the crudest measure of safety. Taking the above caveats however, the reduction in car kilometres brought about by Scenario C relative to B and A implies less investment required to keep casualty rates at a level consistent with targets for reducing casualty and killed and seriously injured accidents.
4.3 NATA Framework Results One of the principal aims of this project has been to demonstrate the differences in outcomes that might be seen as a result of applying a different approach to appraisal to NATA. This section therefore provides a NATA appraisal of the same three scenarios to enable this comparison to be made. To develop a NATA appraisal it is essential to specify a clear base case scenario against which the scenarios are to be compared. In this instance it was decided that Scenario A should act as the base case as it essentially comprised of already agreed projects and Local Transport Plan commitments with a relatively low level of behaviour change assumed. Two results are therefore presented for Scenario B vs. Scenario A and for Scenario C vs. Scenario A. The results are presented in Tables 10 and 11. Due to the large number of assumptions and great uncertainty involved in projecting the NATA Economy results forward to 2070, the quantitative results for PVC and PVB should also be treated with great caution and are ballpark figures only. Unlike with the new sustainability appraisal, the public transport without charging option (B) outperforms that with charging (C) in economic terms. This contrasts with the environmental performance of the scenarios where C comes out better than B. It is interesting to compare how the environmental reporting differs between the two scenarios. Scenario C scores as slightly negative for NOx under NATA whereas in the sustainability appraisal it is shown that the reductions are sufficient to mitigate air quality concerns and other obligations such as

39
nitrification. The relative differences between the two scenarios are then of less importance. In comparing CO2 emissions the performance is broadly neutral between the two scenarios. However, the actual outcome CO2 is negative in the context of reducing transport’s contribution to climate change and this is not well captured through the AST.

40
Table 11: Scenario B AST OPTION DESCRIPTION Assessment year
Scenario B This test represents major PT investment from 2006 onwards with previous behaviour change measures. Bus and Rail service capacity and frequency improvements; extension of a tram system, a tram train implementation as well as a bus way network.
2021
OBJECTIVE QUALITATIVE IMPACTS QUANTITATIVE MEASURE ASSESSMENT
Noise No Data availableLocal Air Quality NOx emissions increased slightly to baseline 2 tonnes additional emissions slightly negativeGreenhouse Gases Traffic levels increase slightly, with accompanying increase in CO2 emissions 1989 tonnes additional emissions NPV -£110,391
Landscape no significant impact N/A N/A
Townscape no significant impact N/A N/AHeritage of Historic Resources
no significant impact N/A N/A
Bio-diversity no significant impact N/A N/A
Water Environment no significant impact N/A N/APhysical Fitness from 2011 reduction in walk and cycle journeys from reference case Walk: 2011-1.27%, 2016, -2.24%
2021,-2.39% Cycle:: 2011 , -1.84%, 2016 -3.10% 2021 -3.76%
negative
Journey Ambience new public transport lines and upgrading of facilities moderately beneficialAccidents Estimate of change in accident rate given increase in flows to keep slight casualties and
KSI constantKSI 3% less change than reference needed. Slight 4% less change than reference needed
slightly beneficial
Security —
Public Accounts Investment and operating costs, loss of indirect tax revenue and p arking revenue Investment (£0.6bn) and operating costs (£0.9bn), loss of indirect tax revenue (£0.1bn) and a very small loss of parking revenue
PVC to Governemnt £1.6bn
Business Users & providers, Consumer Users
Users and operators gain substantially User berfits (4.1bn) and additional operator revenues (£0.7bn)
PVB to Users and Operators (£4.8bn)
Reliability No Data available
Wider Economic Impacts
Option Values increased choices w/ new tram, LRT and train lines beneficialSeverance —
Access to Transport System
Car journey times increase, PT remains constant to reference. slightly negative
Transport Interchange improvement of PT services beneficial
Land-Use Policy —
Other Government Policies
—
INTE
GR
ATI
ON
ENVI
RO
NM
ENT
SAFE
TYEC
ON
OM
YA
CC
ESSI
BIL
ITY
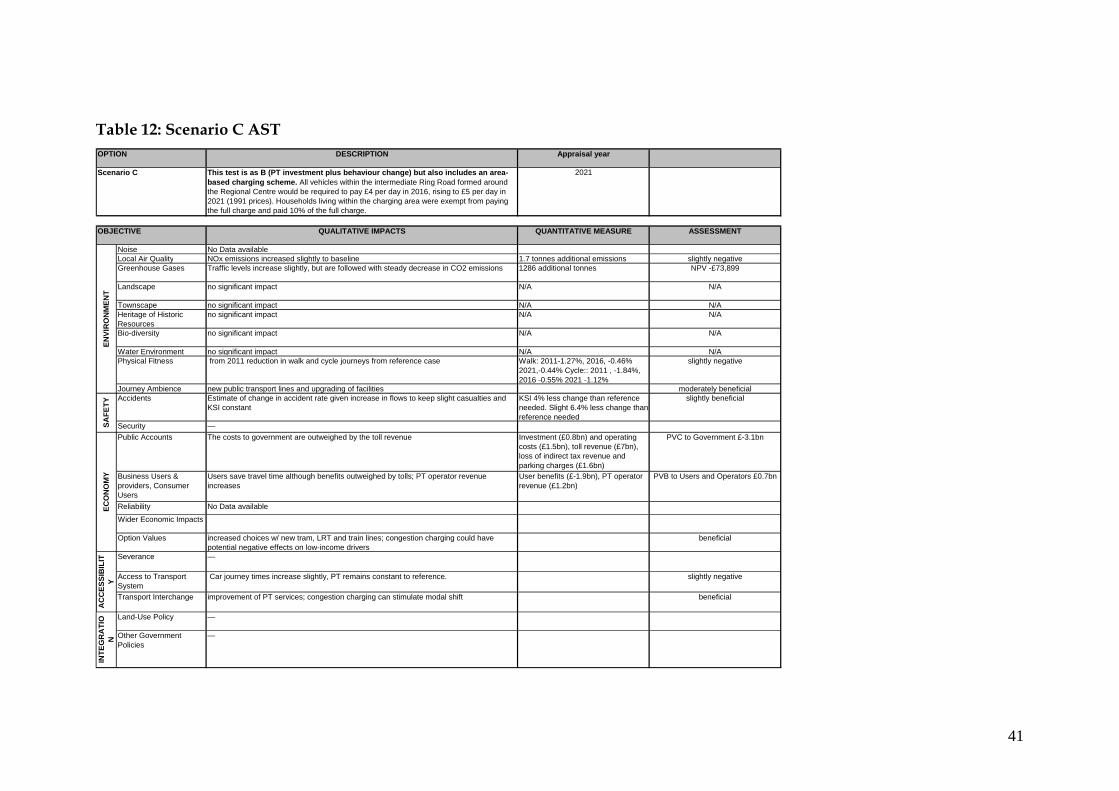
41
Table 12: Scenario C AST OPTION DESCRIPTION Appraisal year
Scenario C This test is as B (PT investment plus behaviour change) but also includes an area-based charging scheme. All vehicles within the intermediate Ring Road formed around the Regional Centre would be required to pay £4 per day in 2016, rising to £5 per day in 2021 (1991 prices). Households living within the charging area were exempt from paying the full charge and paid 10% of the full charge.
2021
OBJECTIVE QUALITATIVE IMPACTS QUANTITATIVE MEASURE ASSESSMENT
Noise No Data availableLocal Air Quality NOx emissions increased slightly to baseline 1.7 tonnes additional emissions slightly negativeGreenhouse Gases Traffic levels increase slightly, but are followed with steady decrease in CO2 emissions 1286 additional tonnes NPV -£73,899
Landscape no significant impact N/A N/A
Townscape no significant impact N/A N/AHeritage of Historic Resources
no significant impact N/A N/A
Bio-diversity no significant impact N/A N/A
Water Environment no significant impact N/A N/APhysical Fitness from 2011 reduction in walk and cycle journeys from reference case Walk: 2011-1.27%, 2016, -0.46%
2021,-0.44% Cycle:: 2011 , -1.84%, 2016 -0.55% 2021 -1.12%
slightly negative
Journey Ambience new public transport lines and upgrading of facilities moderately beneficialAccidents Estimate of change in accident rate given increase in flows to keep slight casualties and
KSI constantKSI 4% less change than reference needed. Slight 6.4% less change than reference needed
slightly beneficial
Security —Public Accounts The costs to government are outweighed by the toll revenue Investment (£0.8bn) and operating
costs (£1.5bn), toll revenue (£7bn), loss of indirect tax revenue and parking charges (£1.6bn)
PVC to Government £-3.1bn
Business Users & providers, Consumer Users
Users save travel time although benefits outweighed by tolls; PT operator revenue increases
User benefits (£-1.9bn), PT operator revenue (£1.2bn)
PVB to Users and Operators £0.7bn
Reliability No Data available
Wider Economic Impacts
Option Values increased choices w/ new tram, LRT and train lines; congestion charging could have potential negative effects on low-income drivers
beneficial
Severance —
Access to Transport System
Car journey times increase slightly, PT remains constant to reference. slightly negative
Transport Interchange improvement of PT services; congestion charging can stimulate modal shift beneficial
Land-Use Policy —
Other Government Policies
—
INTE
GR
ATI
ON
ENVI
RO
NM
ENT
SAFE
TYEC
ON
OM
YA
CC
ESSI
BIL
ITY
42
5 Discussion This section reviews the outcomes of the sustainability appraisal process from the case study presented above. It looks first at the likely impacts of the process on option selection and the added value that the proposed framework provides. Next it looks at the limitations of the approach adopted and finishes by looking at data limitations that have constrained the piloting of the method.
5.1 Option Selection From the point of view of considering the sustainability of current project decisions the different approaches to appraisal provided some different outcomes that might ultimately impact on strategy selection. In the sustainability appraisal there is an economic benefit to Scenarios B and C with some environmental downsides. Scenario C, with charging, appears to perform best overall although whether the package is yet sustainable is discussed further below. Under the NATA framework Scenario B performs best on economic measures but retains some of the environmental downsides. The findings suggest that using amortisation of economic costs and comparing this to benefits in a particular appraisal year may give a different ranking of alternatives from a NATA economy appraisal in some cases, however this is not surprising since the former method does not consider the time profile of or the effect of discounting on the user benefits. Having said that, in the context of a sustainability appraisal, where the focus is on the net impact of the strategy in a particular year, the former method does deliver the required information. Furthermore, the assumptions necessary in order to project benefits and costs forward far into the future, and the resulting uncertainty surrounding the user benefits and costs, does raise the question of what extra value and what level of robustness is provided by the NATA approach. Option appraisal only provides a ranking of the alternatives put before it. In this instance the poor performance of all three scenarios on CO2 emissions would suggest the need to develop and test altogether more radical policies if indeed the transport emissions of major metropolitan areas are to contribute towards our domestic and international commitments to CO2 emission reduction. It could be argued that economic and social progress mean that increases in trips, energy use and emissions are inevitable and part of a sustainable future. If this were to be so, it would certainly highlight the need for even greater savings from elsewhere in the energy, industrial or domestic sectors. This we see as unlikely. The NATA framework is not currently set up to highlight this sort of conflict.

43
5.2 Value of sustainability appraisal It is well understood that many practitioners treat the current approach to appraisal as a hurdle to be jumped at the end of the scheme development process (Page, 2006). It is also clear that NATA is not easily applied in its role of strategy comparison, developing as it has from a scheme based cost-benefit appraisal. At a strategy level the approach proposed here would appear to have advantages over that of a NATA led approach. One of the most important amongst these is the ability to incorporate local, regional or national targets within the framework as the basis for comparing whether the strategies being developed are actually consistent with the promoting authorities objectives and commitments. This would also appear to be consistent with the sorts of approaches being adopted to assessing regional priorities for investment where goal fulfilment is an important criteria. One other advantage of this approach is that it encourages decision-makers to consider the direction of change of indicators. Two examples are:
• Net Present Value is a useful but abstract concept. It involves considering all costs and benefits over an extended period and then rolling them back up into a current year figure. It may be that a scheme or strategy has a positive benefit:cost ratio over a 30 year assessment period. However, it may also be true that the benefits will be being eroded by the end of the 30 year period as a result of congestion or overcrowding for example. This sort of information is picked up by this framework which again appears to promote an approach to decision-making that looks at the longer term in context.
• Strategies are developed over long periods of time. It may be necessary to invest in public transport as a pre-cursor to road user charging. Assessing the direction of change of key environmental indicators such as energy use and CO2 over time as well as at the end year point gives an indication not only of the absolute merit of the strategy but also whether the strategy is holding constant or improving/deteriorating over time and therefore whether in the long-term it appears sustainable.
It would perhaps be seen as a retrograde step if all we were to propose was one further level of appraisal burden on the transport profession. However, we believe that the approach proposed can work with, refine and replace parts of the existing process. Table 13 shows the current different approaches that are currently adopted for assessing national, regional and local transport strategy.

44
Table 13: Appraisal Procedures and Scope for framework application Assessment Procedure Strategy Level NATA LTP7 SEA8 Sustainability
Appraisal9 Framework
National Transport Policy Yes
Regional Spatial Strategy (Regional Transport Strategy) Yes
Local Transport Plan Yes
Requirement Influences
5.2.1 National Transport Policy The sustainability of national transport policy is already assessed, in part, through the indicators used in the UK sustainable development strategy (DEFRA, 2005). The indicators monitored there are not the same as those that form the basis for the appraisal of major transport schemes or local transport plans and form a monitoring rather than a decision-making role. As described in Section 2, the framework proposed here does not exclude any of the factors considered in NATA but does suggest some important additional indicators to be considered. The indicators form the missing link between sustainability reporting and strategy appraisal. We would therefore suggest that the indicator framework is an easier and potentially more consistent way of both assessing and monitoring the progress towards key sustainability targets than NATA. As discussed in Section 2, it would also be desirable for national transport policy to determine broadly what is expected from the different regions and different national infrastructure providers for each of the indicators. From this perspective, adoption at a national level is highly desirable.
5.2.2 Regional Transport Strategy Regional Transport Strategies, as part of Regional Spatial Strategies are already required to be part of both a Sustainability Appraisal (through planning legislation) and SEA. The Sustainability Appraisal is supposed to draw on the indicators and appraisal processes from transport (i.e. NATA). As stated previously, there have been difficulties in establishing a meaningful framework and in conducting the assessments (Ferrary and Crowther, 2005). There therefore appears to be an opportunity for adoption of a framework based on sustainable development principles at a regional level, to fulfil
7 LTP = Local Transport Plan – LTPs are subject to a set of national assessment criteria which are different from but supposed to be consistent with the NATA framework 8 Strategic Environmental Assessment 9 The sustainability appraisal developed by the then Office of Deputy Prime Minister for application to Regional Spatial Strategies

45
existing legislative requirements and to clarify and standardise existing approaches. We think the framework developed in this study has some potential in that role.
5.2.3 Local Transport Plans The Local Transport Plans are developed in line with extensive guidance produced by the Department for Transport (2004). The LTPs are supposed to be consistent with the NATA framework. Any major scheme bids are subject to a full project appraisal using NATA. Interviews as part of another project (Marsden and Kelly, 2005) and responses from consultees suggest that NATA is unwieldy and consequently underused for strategy level assessments at the local level. Given the requirements for local transport plans to be subject to an SEA this framework could enable a large number of the SEA requirements to be fulfilled without increasing the appraisal workload. It also promises to be more intuitive and user-friendly in strategy development and assessment than NATA.
5.2.4 Scheme appraisal Sustainability needs to be considered first at a strategy level and then at a scheme level. We anticipate a staged approach to applying the framework with the contributions of different parts of the strategies identified at the strategy level. These may then be used as constraints within which a scheme design occurs. This would allow the NATA framework to be applied within the sustainable development policy, but without requiring any changes to NATA. An alternative approach might be to supplement the NATA framework with some of the missing indicators or some hybrid of these two possibilities. It has only proven possible to test the application of the framework at a strategy level and further work would be required to examine the usefulness of a more outcome oriented approach at a sub-strategy or scheme level.
5.3 Limitations Limitations to the approach we adopted can be considered from two perspectives. First, limitations of the tools we were able to employ are reviewed. It is worth noting that this is a state-of-art model of a level which few authorities in the UK would have access to and any limitations should be seen in that context. It should be possible to make qualitative assessments of many of the indicators proposed where more complex decision-support tools are not available although these run the risk of producing optimistic or bias conclusions as a result of a lack of connection between different strategy

46
elements. There are also limitations relating to the indicator system proposed and the data available to support these.
5.3.1 Modelling tools employed The sustainability framework has allowed a fuller picture of the policy implications to be developed but this has been limited largely by data availability from the strategic planning model. Outcomes are primarily concerned with zone level vehicle speed, flows and modal shift. There is little social data connected to the model and little connectivity between data held on local accessibility and that processed by the model. In this instance there are also concerns as to the treatment of cycle and walk trips with a strong emphasis on public transport outcomes at the expense of robust treatment of other modes. Freight model outputs were similarly constrained as they remained with a constant growth rate, being little affected by any of the policy interventions. The weak treatment of freight is not unusual of city planning but has significant implications when considering the total resource consumption of the city. Freight kms correspond to around one third to one half of car kms. Freight CO2 emission rates/km are over twice that of current car technologies and warrant a more even treatment if the right sort of policy decisions are to be made. The nature of a strategic model makes the calculation of noise and air quality impacts imprecise. A network level model is really needed to enable more accurate noise estimates to be made. An assessment of air quality was possible at an aggregate level by the setting of target levels of emission reductions for wards where an air quality management area had been declared. The calculation of social indicators was limited. These are discussed in more detail in Lucas et al. (2007) but the key practical issues with applying the Accession™ model are summarised below:
• “The GIS data representation of accessibility is a model of reality. In the model all buses run to time, all users are fully informed of the opportunities available to them and cost is not a barrier. This grossly oversimplifies many of the key barriers to social participation as they are understood today. If modelled accessibility in our case study area is so good then why is transport still a barrier to participation in key activities?
• The approach taken in this work was to keep the core activities that people travelled to the same in each scenario. This is also unlikely to be true in the real-world (e.g. changes in employment structure, school closures and openings). Some of the patterns of location will be directly affected by the policies considered. Lifestyles and activity patterns are also changing across social groups. Whilst advances are being made in

47
activity modelling the cost and complexity of such approaches renders it beyond the reach of most authorities.
• There is no practical connection between the strategic large zone land-use transport model and the tools available to process social data. Variations in house prices across a zone would be too coarse to be meaningful for example. There is inevitably a balance to be struck between size of metropolitan area to be modelled, the number of zones and the time to run and analyse outputs. We took the outputs from a well supported model which is in common use. It is clearly desirable from the perspective of distributional analysis for there to be more and smaller zones.
• It has proven extremely time-consuming to change the baseline public transport network within the model. Whilst comparatively simple to add a new route with a regular timetable within the model, it is difficult to modify the evening and early morning services of each route to mimic the slow but steady withdrawal of non-profit making services. Indeed, in this set of runs no such changes were made, which overestimates the accessibility of the future scenarios.” (p17)
Alternative approaches to modelling the social impacts of transport policies have been considered (Polak et al., 2006) but none appear to offer a solution that is within the resource constraints of most local authorities. This continues to act therefore as a substantial barrier to the selection of sustainable policies and strategies.
5.3.2 Data Sources The environmental data was all imputed from the aggregate zonal traffic flow data. Central to this was therefore a set of clear assumptions about the relationships between flow, speed and emissions. The National Atmospheric Emissions Inventory provides such an evidence base for most modes up to currently known technology levels (Euro II buses, Euro IV cars for example). WebTAG provides little guidance on how to develop robust scenarios for different vehicle fleet compositions. It has recently updated the assumptions from a set which assumed that improvements will be made in efficiency up to the end of the current voluntary agreements with manufacturers and then remaining constant over the period beyond 2011 to ones which broadly mirror a continuation of current trends. We ran four different emission scenarios. It is important to note that the emission factors were post processed on the flows and speeds and, as such, there was no feedback to the operating costs and flow levels which would be expected in a fuller investigation of these issues. The values reported are therefore top end expectations of emission savings. The importance of different technology assumptions is highlighted below in Figures 6 and 7.

48
The charts show that the differences in energy or CO2 performance per scenario are dwarfed by the differences that might exist as the result of different scenarios of investment in low emission technology by private car purchasers and public transport operators. We have recorded our assumptions in Annex A but found little guidance to suggest a common approach that might be adopted nationally.
2021 CO2
9500
10000
10500
11000
11500
12000
12500
1(Webtag) 2 (current trends) 3 (optimists) 4 (mid-values)
tota
l CO
2
A B C
Figure 6: CO2 emissions by test and technology scenario
Energy use/ pass trip
0
1
2
3
4
5
6
7
1(Webtag) 2 (current trends) 3 (optimists) 4 (mid-values)
mj/t
rip
A B C
Figure 7: Energy use by test and technology scenario Indicators on total energy use would have required more data on the projected and actual fleet mix for the area as well as the life cycle cost of the
49
fuels and raw materials, which is not standard practice within the UK and was not feasible within the budget of this work. A SEA was produced to give more of an overview of environmental costs of this LTP2 plan (however this would only equate to Scenario A) but was also lacking data from the metropolitan area on noise and the full impacts to local air quality. The economy indicators have provided a proxy for the costs and benefits of each scenario, but should be treated with caution as the underlying data used to calculate them is based on rough ‘ball park’ figures and does not include any data for reliability or safety. The results are also moderately sensitive to the interest rate used for amortization – for example, a 3.5% rate reduces the capital charge in 2021 to £40 million (B) or £49 million (C), so increasing the economy indicator to +£123 million and +£161 million respectively, conversely a rate of 16.5% is needed to turn the economy indicator negative for B or 17.5% for C. Indicators on accessibility have been helped by DfT regulations for accessibility planning; which provided data for the analysis on the different runs. However, it is not yet easy to determine actual out of pocket public transport costs for different social groups nor to accurately capture the quality and security of the local environment for walking and cycling in. One indicator also intended to examine the impacts of investment strategies on house prices and therefore the equity of access to the networks from affordable housing. Again, there is no current data source and integrated approach to modelling that was available to enable this data to be collected. This indicator appears a long way from being feasible.

50
6 Conclusions
6.1 Policy and Appraisal
The findings of the research have confirmed the merits of considering the absolute impacts of a strategy rather than principally its relative conditions. This approach shines a light on the real inherent conflicts between growth in travel, economic efficiency, social progress and potential environmental impacts in a manner that is less transparent through the current approach to appraisal. The research has also found a substantial diversity of appraisals that are required from a regional planning level, through local strategies to individual schemes. Some are more focussed on absolute changes in indicators and progress towards targets (e.g. Sustainability appraisal of Regional Spatial Strategy and Local Transport Plan assessment) whilst others (e.g. scheme appraisal) have a greater focus on cost-benefit analysis. We do not argue for the creation of yet another layer of appraisal. Rather, we suggest that the findings here offer an opportunity to ask again what it is we want from strategy, policy and scheme appraisal and to consider whether and how they differ. The current process of attempting to apply what is essentially a scheme appraisal derived system (NATA) does not wholly satisfy the requirements for strategy assessment. Although the UK is now in the second incarnation of a sustainability strategy and sustainability features as a buzz word in most documents there is no operational definition which helps in assessing the sustainability of transport interventions. Coupled with this, there are very few policy statements on what constitutes a sustainable level of, for example, resource consumption, access to services, distribution of benefits. This is further compounded by a failure to translate many of those that do exist into sector specific aims for transport (e.g. climate change targets) and still further to indicate to different authorities what they might reasonably aim to contribute. There are clearly issues surrounding the economic rationale behind such an approach but this is not insurmountable if the costs of interventions are considered at a cross-sectoral level. There are therefore multiple inconsistent definitions of sustainability with weak and inconsistent definitions of progress. In such a flimsy policy environment it seems improbable that transport strategies and policies could be truly sustainable. Indeed, a combination of road user charging and public transport investment in this study still appears to conflict with some sustainability measures whilst this might be viewed by practitioners as a ‘sustainable package’.

51
6.2 Capabilities The main methodological innovations that have been achieved through the research relate to the development of a new approach to assessing the long-term economic sustainability of strategies and through efforts to assess the social sustainability of strategies. On economic benefits we feel that the approach to amortizing costs of the project and comparing benefits in the assessment years versus the yearly amortized cost provides a neat short-term solution to capturing the majority of economic benefits of interventions. The outcomes of the amortized approach appear more intuitively correct (providing greater benefits for a package of investment and charging) than the NATA framework. This is an area for further investigation where more robust cost estimates are available. Our attempts to assess social progress were far more limited. Section 5 provides a detailed list of the issues faced. Initiatives such as the Transport Innovation Fund are now forcing greater emphasis on the study of the distributional impacts of policy. These impacts are critical to understanding the sustainability of transport and have hitherto lacked a coherent and well-resourced research effort from a modelling perspective, coming, as it has from a more qualitative social policy perspective. The estimation of environmental impacts was hampered by inadequate data sources on resource use for the construction and maintenance of infrastructure and vehicles. Despite excellent data sets on the emissions of the existing fleet at a level compatible with those of the model outputs there was little data to guide us on the impacts of different paths of technological development. We have made clear our assumptions in the Annex. We see technological change as important in defining what levels of behavioural change are required and the absence of good data for forecasting hampered our efforts. Emissions from freight form an important part of the emissions total. As local authorities in practice have little influence over changes in logistics practice, the modelling tools they employ pay little attention to changes in freight patterns and therefore emissions. Whilst perhaps this is of limited importance in a local authorities’ decision about how effective the interventions it does have control over are it is still critical to the overall sustainability outcomes. Further research effort would be welcome in bringing together the national freight models that do exist with the more strategic land-use transport models. Walking and cycling were also found to be poorly represented in the context we examined. This is not surprising given the scale of the model and the main focus of the different policy interventions. Nonetheless, the absence of good

52
data on the response of pedestrians and cyclist to quality interventions may underestimate the relative attractiveness of these zero emission modes.
6.3 Further work The findings presented in this report represent our assessment of three different policy scenarios in one metropolitan area. We see there as being great value in taking this forward and applying it to other similar case studies in different areas, to other policies (e.g. a sustainability assessment of different models for delivering free concessionary travel to older people) and to some major schemes. This should serve to highlight the broader transferability of our discussion surrounding the selection of sustainable transport interventions. One of the major achievements of the first stage of the project was to discuss our approach with a number of important stakeholders both within and outside government. We will seek to disseminate the findings and receive feedback on how this approach might influence the approach to appraisal across the UK and beyond. We have highlighted within Section 6.2 a list of technical issues to be overcome to improve our capabilities in assessing sustainability. The majority of these issues remain pertinent whether or not the framework presented within this research is adopted and this offers a substantive research agenda.

53
7 Acknowledgements This research has been made possible through a grant from the Rees Jeffreys Road Fund. The researchers are grateful for the generosity, support and interest shown by the trustees over the period of the research. We are also grateful to the anonymous organisation that supported us with the provision of data and access to model outputs and assumptions. We would like to acknowledge the important inputs of Charlotte Kelly (ITS) and Karen Lucas and Michael Brookes (Westminster) to the development of the framework on which this assessment was based.

54
8 References Bröcker, J., Meyer, R., Schneekloth, N., Schürmann, C., Spiekermann, K. and Wegener, M. (2004) Modelling the Socio-economic and Spatial Impacts of EU Transport Policy. IASON (Integrated Appraisal of Spatial economic and Network effects of transport investments and policies) Deliverable 6. Funded by 5th Framework RTD Programme. TNO Inro, Delft, Netherlands. DEFRA (2005) ‘Securing the Future: delivering the UK sustainable development strategy’, Department of Environment, Food and Rural Affairs, TSO, www.defra.gov.uk (DfT, 2003) ‘What is Accessibility Planning?’ http://www.dft.gov.uk/stellent/groups/dft_localtrans/documents/page/dft_localtrans_023937.hcsp DfT (2004) ‘Full Guidance on Local Transport Plans: Second Edition’, Department for Transport, London. DfT (2005) ‘Transport Analysis Guidance’, Department for Transport, www.webtag.org.uk Kelly, C. (2005) ‘Sustainability Indicators’, Appraisal of Sustainability Project Report, Institute for Transport Studies, www.its.leeds.ac.uk/projects/sustainability/project_outputs.htm Ferrary, C. and Crowther, H. (2005) ‘How realistic are sustainability appraisals? A review of research on the transport implications of regional policies for Yorkshire and Humber’, 3rd Transport Practitioners Annual Meeting Aston University, 6th July 2005 Gudmundsson, H. (2003) Making concepts matter: sustainable mobility and indicator systems in transport policy, International Social Sciences Journal 176 p199-217 HM Treasury (2006) ‘The Green Book’, HM Treasury, London, http://greenbook.treasury.gov.uk Kelly, C. and Nellthorp, J. (2005) ‘Economy Indicators’, Appraisal of Sustainability Project Report, Institute for Transport Studies, www.its.leeds.ac.uk/projects/sustainability/project_outputs.htm Lautso, K., Wegener, M., Spiekermann, K., Sheppard, I., Steadman, P., Martino, A., Domingo, R. and Gayda, S. (2004) ‘Planning and research of policy for land use and transport for increasing urban sustainability

55
(PROPOLIS)’, Final Report to the European Commission, Version 2.0, Contract No: EVK4-1999-00005 Lucas, K. (2004) ‘Running on Empty: Transport, social exclusion and environmental justice’, Policy Press, Bristol, ISBN 1 86134 570 4 Lucas, K., and Brooks, M. (2005) ‘Social Indicators’, Appraisal of Sustainability Project Report, Institute for Transport Studies, www.its.leeds.ac.uk/projects/sustainability/project_outputs.htm Lucas, K., Marsden, G., Brookes, M. and Kimble, M. (2007) An assessment and critique of capabilities for examining the long-term social sustainability of transport and land-use strategies, Proc. 86th Annual Transportation Research Board Meeting, Washington D.C., 21-25 Jan. Mackie, P.J. and Nellthorp, J. (2000) The UK Roads Review – A Hedonic Model of Decision Making, Transport Policy, 7, 127-138 Marsden, G. (2005) ‘Environment Indicators’, Appraisal of Sustainability Project Report. Institute for Transport Studies, www.its.leeds.ac.uk/projects/sustainability/project_outputs.htm Marsden, G. and Kelly, C. (2005) Do we count what really counts?, Proc. Transport Practitioners Annual Meeting, Aston, 5-6 July Marsden, G., Kelly, C., Nellthorp, J., Lucas, K, and Brooks M. (2005a) ‘A framework for the Appraisal of Sustainability in Transport’ Appraisal of Sustainability Project Report, Institute for Transport Studies, www.its.leeds.ac.uk/projects/sustainability/project_outputs.htm Marsden, G., Kelly, C., Snell, C. And Forrester, J. (2005b) ‘Improved Indicators for Sustainable Transport and Planning’, Deliverable C1, DISTILLATE project, Institute for Transport Studies and Stockholm Environment Institute - York, www.distillate.ac.uk ODPM (2004) ‘RSS Sustainability Appraisal of Regional Spatial Strategies and Local Development Frameworks’, ODPM, 2004 (Consultation Paper) ODPM (2005) ‘Planning Policy Statement 1: Delivering Sustainable Development’, www.communities.gov.uk Oosterhaven, J. and Elhorst, J.P. (2003) ‘Indirect Economic Benefits of Transport Infrastructure Investments’. In: Dullaert, W., Jourquin, B. and Polak, J.B. (eds) Across the border: Building upon a quarter century of transport research in the Benelux, De Boeck, Antwerpen.
56
Page, M. (2006) ‘Project G: Enhanced Appraisal Tools’, Distillate Project Summary, www.distillate.ac.uk/projects/projectg.php Personal Communication (2006) Costs estimates for Scenarios, MVA. Polak, J., Noland, R.B., Glaister, S., Morton, B. and Hodgson, F. (2006) ‘Modelling Social Exclusion in Transport’, Report to the Department for Transport (available from Centre for Transport Studies, Imperial College London). Social Exclusion Unit (2003) ‘Making the connections: final report on transport and social exclusion’, London, SEU. WCED (1987) Our Common Future, World Commission on Environment and Development, www.un.org